UNITED STATES
SECURITIES AND EXCHANGE COMMISSION
Washington, D.C. 20549
Form N-CSR
CERTIFIED SHAREHOLDER REPORT OF REGISTERED MANAGEMENT
INVESTMENT COMPANIES
Investment Company Act File Number 811-22321
MAINSTAY FUNDS TRUST
(Exact name of Registrant as specified in charter)
51 Madison Avenue, New York, NY 10010
(Address of principal executive offices) (Zip code)
J. Kevin Gao, Esq.
30 Hudson Street
Jersey City, New Jersey 07302
(Name and address of agent for service)
Registrant’s telephone number, including area code: (212) 576-7000
Date of fiscal year end: October 31
Date of reporting period: October 31, 2023 (excluding MainStay Fiera SMID Growth, MainStay PineStone Global Equity Fund, MainStay PineStone International Equity Fund, and MainStay PineStone U.S. Equity Fund
FORM N-CSR
Item 1. Reports to Stockholders.
MainStay Balanced Fund
Message from the President and Annual Report
October 31, 2023
Special Notice:
Beginning in July 2024, new regulations issued by the Securities and Exchange Commission (SEC) will take effect requiring open-end mutual fund companies and ETFs to (1) overhaul the content of their shareholder reports and (2) mail paper copies of the new tailored shareholder reports to shareholders who have not opted to receive these documents electronically.
If you have not yet elected to receive your shareholder reports electronically, please contact your financial intermediary or visit newyorklifeinvestments.com/accounts.
| Not FDIC/NCUA Insured | Not a Deposit | May Lose Value | No Bank Guarantee | Not Insured by Any Government Agency |
This page intentionally left blank
Message from the President
Volatile economic and geopolitical forces drove market behavior during the 12-month reporting period ended October 31, 2023. While equity markets generally gained ground, bond prices trended broadly lower.
Although the war in Ukraine, the outbreak of hostilities in the Middle East and several other notable events affected financial assets, inflation and interest rate trends stood at the forefront of market developments during most of the period. As the reporting period began, high levels of inflation already showed signs of easing in the face of aggressive rate hikes by the U.S. Federal Reserve (the “Fed”). From a peak of 9.1% in June 2022, the annualized U.S. inflation rate dropped to 7.1% in November 2022, and to 3.2% in October 2023. At the same time, the Fed increased the benchmark federal funds rate from 3.75%–4.00% at the beginning of the reporting period to 5.25%–5.50% as of October 31, 2023. As the pace of rate increases slowed during the period, investors hoped for an early shift to a looser monetary policy. However, comments from Fed members late in the period reinforced the central bank’s hawkish stance in response to surprisingly robust U.S. economic growth and rising wage pressures, thus increasing the likelihood that interest rates would stay higher for longer. International developed markets exhibited similar dynamics of elevated inflation and rising interest rates.
Despite the backdrop of high interest rates—along with political dysfunction in Washington D.C. and intensifying global geopolitical instability—equity markets managed to advance, supported by healthy consumer spending trends and persistent domestic economic growth. The S&P 500® Index, a widely regarded benchmark of large-cap U.S. market performance, gained ground, bolstered by the strong performance of energy stocks amid surging petroleum prices and mega-cap, growth-oriented, technology-related shares, which rose as investors flocked to companies creating the infrastructure for developments in artificial intelligence. Smaller-cap stocks and value-oriented shares produced milder returns. Among industry sectors, energy and
information technology posted the strongest gains. Real estate declined most sharply under pressure from rising mortgage rates and weak levels of office occupancy. Developed international markets outperformed U.S. markets, with Europe benefiting during the first half of the period from unexpected economic resilience in the face of rising energy prices and the ongoing war in Ukraine. Emerging markets posted positive results but lagged developed markets, largely due to slow economic growth in China despite the relaxation of pandemic-era lockdowns.
Bond prices were driven lower by rising yields and increasing expectations of high interest rates for an extended period of time. The U.S. yield curve steepened, with the 30-year Treasury yield exceeding 5% for the first time in more than a decade. The yield curve remained inverted, with the 10-year Treasury yield ending the period at 4.88%, compared with 5.07% for the 2-year Treasury yield. Corporate bonds outperformed long-term Treasury bonds, but still trended lower under pressure from rising yields and an uptick in default rates. Among corporates, lower-credit-quality instruments performed slightly better than their higher-credit-quality counterparts, while floating rate securities performed better still.
In the face of today’s uncertain market environment, New York Life Investments remains dedicated to providing the guidance, resources and investment solutions you need to pursue your financial goals.
Thank you for trusting us to help meet your investment needs.
Sincerely,
Kirk C. Lehneis
President
The opinions expressed are as of the date of this report and are subject to change. There is no guarantee that any forecast made will come to pass. This material does not constitute investment advice and is not intended as an endorsement of any specific investment. Past performance is no guarantee of future results.
Not part of the Annual Report
Investors should refer to the Fund’s Summary Prospectus and/or Prospectus and consider the Fund’s investment objectives, strategies, risks, charges and expenses carefully before investing. The Summary Prospectus and/or Prospectus contain this and other information about the Fund. You may obtain copies of the Fund’s Summary Prospectus, Prospectus and Statement of Additional Information, which includes information about the MainStay Funds Trust's Trustees, free of charge, upon request, by calling toll-free 800-624-6782, by writing to NYLIFE Distributors LLC, Attn: MainStay Marketing Department, 30 Hudson Street, Jersey City, NJ 07302 or by sending an e-mail to MainStayShareholderServices@nylim.com. These documents are also available via the MainStay Funds’ website at newyorklifeinvestments.com. Please read the Fund’s Summary Prospectus and/or Prospectus carefully before investing.
Investment and Performance Comparison (Unaudited)
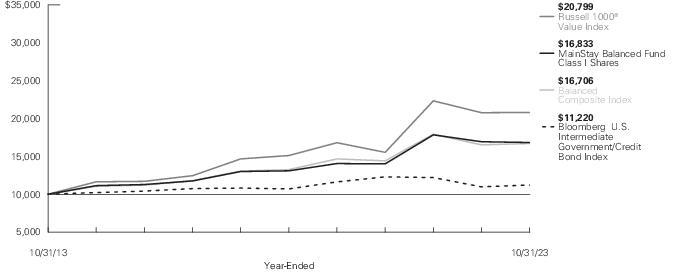
Performance data quoted represents past performance. Past performance is no guarantee of future results. Because of market volatility and other factors, current performance may be lower or higher than the figures shown. Investment return and principal value will fluctuate, and as a result, when shares are redeemed, they may be worth more or less than their original cost.The graph below depicts the historical performance of Class I shares of the Fund. Performance will vary from class to class based on differences in class-specific expenses and sales charges. For performance information current to the most recent month-end, please call 800-624-6782 or visit newyorklifeinvestments.com.
The performance table and graph do not reflect the deduction of taxes that a shareholder would pay on distributions or Fund share redemptions. Total returns reflect maximum applicable sales charges as indicated in the table below, if any, changes in share price, and reinvestment of dividend and capital gain distributions. The graph assumes the initial investment amount shown below and reflects the deduction of all sales charges that would have applied for the period of investment. Performance figures may reflect certain fee waivers and/or expense limitations, without which total returns may have been lower. For more information on share classes and current fee waivers and/or expense limitations (if any), please refer to the Notes to Financial Statements.
| Average Annual Total Returns for the Year-Ended October 31, 2023 |
| Class | Sales Charge | | Inception
Date1 | One
Year | Five
Years | Ten Years
or Since
Inception | Gross
Expense
Ratio2 |
| Class A Shares3 | Maximum 3.00% Initial Sales Charge | With sales charges | 1/2/2004 | -3.83% | 3.71% | 4.49% | 1.07% |
| | | Excluding sales charges | | -0.86 | 4.89 | 5.08 | 1.07 |
| Investor Class Shares4 | Maximum 2.50% Initial Sales Charge | With sales charges | 2/28/2008 | -3.55 | 3.45 | 4.27 | 1.35 |
| | | Excluding sales charges | | -1.08 | 4.62 | 4.86 | 1.35 |
| Class B Shares5 | Maximum 5.00% CDSC | With sales charges | 1/2/2004 | -6.68 | 3.54 | 4.08 | 2.10 |
| | if Redeemed Within the First Six Years of Purchase | Excluding sales charges | | -1.83 | 3.84 | 4.08 | 2.10 |
| Class C Shares | Maximum 1.00% CDSC | With sales charges | 12/30/2002 | -2.84 | 3.84 | 4.08 | 2.10 |
| | if Redeemed Within One Year of Purchase | Excluding sales charges | | -1.87 | 3.84 | 4.08 | 2.10 |
| Class I Shares | No Sales Charge | | 5/1/1989 | -0.61 | 5.15 | 5.35 | 0.82 |
| Class R1 Shares6 | No Sales Charge | | 1/2/2004 | -0.70 | 5.04 | 5.24 | 0.92 |
| Class R2 Shares6 | No Sales Charge | | 1/2/2004 | -0.94 | 4.79 | 4.99 | 1.17 |
| Class R3 Shares6 | No Sales Charge | | 4/28/2006 | -1.20 | 4.51 | 4.71 | 1.42 |
| Class R6 Shares | No Sales Charge | | 12/15/2017 | -0.51 | 5.24 | 4.17 | 0.74 |
| 1. | Effective March 5, 2021, the Fund replaced the subadvisor to the equity portion of the Fund and modified its principal investment strategies. The past performance in the graph and table prior to that date reflects the Fund’s prior subadvisor and principal investment strategies for the equity portion of the Fund. |
| 2. | The gross expense ratios presented reflect the Fund’s “Total Annual Fund Operating Expenses” from the most recent Prospectus, as supplemented, and may differ from other expense ratios disclosed in this report. |
| 3. | Prior to November 4, 2019, the maximum initial sales charge was 5.50%, which is reflected in the applicable average annual total return figures shown. |
| 4. | Prior to June 30, 2020, the maximum initial sales charge was 3.00%, which is reflected in the applicable average annual total return figures shown. |
| 5. | Class B shares are closed to all new purchases as well as additional investments by existing Class B shareholders. |
| 6. | As of October 31, 2023, Class R1, Class R2 and Class R3 shares are closed to new investors and, upon the close of business on December 29, 2023, Class R1, Class R2 and Class R3 shares are closed to additional investments by existing shareholders. Additionally, Class R1, Class R2 and Class R3 shares will be liquidated on or about February 28, 2024 (the "Liquidation Date"). It is expected that the Fund will distribute to remaining shareholders invested in Class R1, Class R2 or Class R3 shares, on or promptly after the Liquidation Date, a liquidating distribution in cash or cash equivalents equal to the net asset value of such shares.
|
The footnotes on the next page are an integral part of the table and graph and should be carefully read in conjunction with them.
| Benchmark Performance* | One
Year | Five
Years | Ten
Years |
| Russell 1000® Value Index1 | 0.13% | 6.60% | 7.60% |
| Bloomberg U.S. Intermediate Government/Credit Bond Index2 | 2.18 | 0.95 | 1.16 |
| Balanced Composite Index3 | 1.13 | 4.74 | 5.27 |
| Morningstar Moderate Allocation Category Average4 | 4.16 | 5.08 | 5.22 |
| * | Returns for indices reflect no deductions for fees, expenses or taxes, except for foreign withholding taxes where applicable. Results assume reinvestment of all dividends and capital gains. An investment cannot be made directly in an index. |
| 1. | The Fund has selected the Russell 1000® Value Index as its primary benchmark. The Russell 1000® Value Index measures the performance of the large-cap value segment of the U.S. equity universe. It includes those Russell 1000® Index companies with lower price-to-book ratios and lower expected growth values. |
| 2. | The Fund has selected the Bloomberg U.S. Intermediate Government/Credit Bond Index as a secondary benchmark. The Bloomberg U.S. Intermediate Government/Credit Bond Index measures the performance of U.S. dollar denominated U.S. treasuries, government related and investment grade U.S. corporate securities that have a remaining maturity of greater than one year and less than ten years. |
| 3. | The Fund has selected the Balanced Composite Index as an additional benchmark. The Balanced Composite Index consists of the Russell 1000® Value Index and the Bloomberg U.S. Intermediate Government/Credit Bond Index weighted 60%/40%, respectively. |
| 4. | The Morningstar Moderate Allocation Category Average is representative of funds in allocation categories that seek to provide both income and capital appreciation by primarily investing in multiple asset classes, including stocks, bonds, and cash. These moderate strategies seek to balance preservation of capital with appreciation. They typically expect volatility similar to a strategic equity exposure between 50% and 70%. Results are based on average total returns of similar funds with all dividends and capital gain distributions reinvested. |
The footnotes on the preceding page are an integral part of the table and graph and should be carefully read in conjunction with them.
Cost in Dollars of a $1,000 Investment in MainStay Balanced Fund (Unaudited)
The example below is intended to describe the fees and expenses borne by shareholders during the six-month period from May 1, 2023 to October 31, 2023, and the impact of those costs on your investment.
Example
As a shareholder of the Fund you incur two types of costs: (1) transaction costs, including exchange fees and sales charges (loads) on purchases (as applicable), and (2) ongoing costs, including management fees, distribution and/or service (12b-1) fees and other Fund expenses (as applicable). This example is intended to help you understand your ongoing costs (in dollars) of investing in the Fund and to compare these costs with the ongoing costs of investing in other mutual funds. The example is based on an investment of $1,000 made at the beginning of the six-month period and held for the entire period from May 1, 2023 to October 31, 2023.
This example illustrates your Fund’s ongoing costs in two ways:
Actual Expenses
The second and third data columns in the table below provide information about actual account values and actual expenses. You may use the information in these columns, together with the amount you invested, to estimate the expenses that you paid during the six months ended October 31, 2023. Simply divide your account value by $1,000 (for example, an
$8,600 account value divided by $1,000 = 8.6), then multiply the result by the number under the heading entitled “Expenses Paid During Period” to estimate the expenses you paid on your account during this period.
Hypothetical Example for Comparison Purposes
The fourth and fifth data columns in the table below provide information about hypothetical account values and hypothetical expenses based on the Fund’s actual expense ratio and an assumed rate of return of 5% per year before expenses, which is not the Fund’s actual return. The hypothetical account values and expenses may not be used to estimate the actual ending account balances or expenses you paid for the six-month period shown. You may use this information to compare the ongoing costs of investing in the Fund with the ongoing costs of investing in other mutual funds. To do so, compare this 5% hypothetical example with the 5% hypothetical examples that appear in the shareholder reports of the other mutual funds.
Please note that the expenses shown in the table are meant to highlight your ongoing costs only and do not reflect any transactional costs, such as exchange fees or sales charges (loads). Therefore, the fourth and fifth data columns of the table are useful in comparing ongoing costs only and will not help you determine the relative total costs of owning different funds. In addition, if these transactional costs were included, your costs would have been higher.
| Share Class | Beginning
Account
Value
5/1/23 | Ending Account
Value (Based
on Actual
Returns and
Expenses)
10/31/23 | Expenses
Paid
During
Period1 | Ending Account
Value (Based
on Hypothetical
5% Annualized
Return and
Actual Expenses)
10/31/23 | Expenses
Paid
During
Period1 | Net Expense
Ratio
During
Period2 |
| Class A Shares | $1,000.00 | $967.20 | $ 5.31 | $1,019.81 | $ 5.45 | 1.07% |
| Investor Class Shares | $1,000.00 | $965.90 | $ 6.49 | $1,018.60 | $ 6.67 | 1.31% |
| Class B Shares | $1,000.00 | $962.10 | $10.19 | $1,014.82 | $10.46 | 2.06% |
| Class C Shares | $1,000.00 | $961.80 | $10.19 | $1,014.82 | $10.46 | 2.06% |
| Class I Shares | $1,000.00 | $968.20 | $ 4.07 | $1,021.07 | $ 4.18 | 0.82% |
| Class R1 Shares | $1,000.00 | $967.70 | $ 4.56 | $1,020.57 | $ 4.69 | 0.92% |
| Class R2 Shares | $1,000.00 | $966.70 | $ 5.80 | $1,019.31 | $ 5.96 | 1.17% |
| Class R3 Shares | $1,000.00 | $965.10 | $ 7.03 | $1,018.05 | $ 7.22 | 1.42% |
| Class R6 Shares | $1,000.00 | $968.70 | $ 3.57 | $1,021.58 | $ 3.67 | 0.72% |
| 1. | Expenses are equal to the Fund’s annualized expense ratio of each class multiplied by the average account value over the period, divided by 365 and multiplied by 184 (to reflect the six-month period). The table above represents the actual expenses incurred during the six-month period. In addition to the fees and expenses which the Fund bears directly, it also indirectly bears a pro rata share of the fees and expenses of the underlying funds in which it invests. Such indirect expenses are not included in the above-reported expense figures. |
| 2. | Expenses are equal to the Fund's annualized expense ratio to reflect the six-month period. |
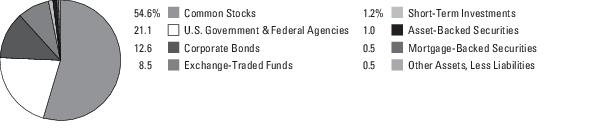
Portfolio Composition as of October 31, 2023 (Unaudited)
See Portfolio of Investments beginning on page 12 for specific holdings within these categories. The Fund's holdings are subject to change.
Top Ten Holdings and/or Issuers Held as of October 31, 2023 (excluding short-term investments) (Unaudited)
| 1. | U.S. Treasury Notes, 2.50%-5.00%, due 12/31/23–8/15/33 |
| 2. | iShares Russell 1000 Value ETF |
| 3. | JPMorgan Chase & Co. |
| 4. | Vanguard Russell 1000 Value |
| 5. | Cisco Systems, Inc. |
| 6. | iShares Intermediate Government/Credit Bond ETF |
| 7. | Merck & Co., Inc. |
| 8. | Pfizer, Inc. |
| 9. | ConocoPhillips |
| 10. | PNC Financial Services Group, Inc. (The) |
Portfolio Management Discussion and Analysis (Unaudited)
Questions answered by portfolio managers Jae S. Yoon, CFA, and Jonathan Swaney of New York Life Investment Management LLC, the Fund’s Manager; Kenneth Sommer and Matthew Downs of NYL Investors LLC, the Fund’s fixed-income Subadvisor; and portfolio manager Adam H. Illfelder, CFA, of Wellington Management Company LLP, the Fund’s equity Subadvisor.
How did MainStay Balanced Fund perform relative to its benchmarks and peer group during the 12 months ended October 31, 2023?
For the 12 months ended October 31, 2023, Class I shares of MainStay Balanced Fund returned −0.61%, underperforming the 0.13% return of the Fund’s primary benchmark, the Russell 1000® Value Index; the 2.18% return of the Bloomberg U.S. Intermediate Government/Credit Bond Index, which is the Fund’s secondary benchmark; and the 1.13% return of the Balanced Composite Index, which is an additional benchmark of the Fund. For the 12 months ended October 31, 2023, Class I shares of the Fund also underperformed the 4.16% return of the Morningstar Moderate Allocation Category Average.1
Were there any changes to the Fund during the reporting period?
Effective June 30, 2023, AJ Rzad was removed as a portfolio manager of the Fund. Please see the supplement dated March 3, 2023, for more information. Effective February 28, 2023, Matthew Downs was added as a portfolio manager of the Fund.
What factors affected relative performance in the equity portion of the Fund during the reporting period?
The equity portion of the Fund underperformed the Russell 1000® Value Index primarily due to security selection. Weak selection in the industrials, communication services and information technology sectors was partially offset by stronger selection in health care, real estate and consumer discretionary. Sector allocation, a result of our bottom-up stock selection process, also modestly weighed on relative results, primarily due to the Fund’s underweight exposure to communication services, although this was partially offset by the positive impact of the Fund’s overweight exposure to information technology.
During the reporting period, which sectors were the strongest positive contributors to the relative performance of the equity portion of the Fund and which sectors were particularly weak?
During the reporting period, the real estate and utilities sectors provided the strongest positive contributions to the Fund’s relative performance. (Contributions take weightings and total returns into account.) Over the same period, the industrials, communication services and materials sectors detracted most notably.
During the reporting period, which individual stocks made the strongest positive contributions to absolute performance in the equity portion of the Fund and which stocks detracted the most?
The individual stocks that made the strongest contributions to the equity portion of the Fund’s absolute performance included Google’s parent company, Alphabet, and pharmaceutical company Eli Lilly. Shares of Alphabet climbed as quarterly results exceeded consensus expectations due to revenue growth in the company’s Search and Google Cloud divisions and a return to growth in YouTube. Additional factors contributing to positive market sentiment included stabilizing advertising demand, potential upside driven by artificial intelligence (AI) and cost management. We trimmed the Fund’s position in Alphabet as the stock strengthened. Shares of Eli Lilly rose during the reporting period as revenues beat estimates. The company raised full-year guidance twice in 2023, driven by positive results for Alzheimer's drug Donanemab and weight loss drug Retatrutide, in addition to rapidly increasing demand for new diabetes drug Mounjaro. We exited the Fund’s position in Eli Lilly.
The holdings that detracted most significantly from absolute performance were pharmaceutical company Pfizer and utility and power generation company, AES. Pfizer shares declined when the company faced questions regarding the sustainability of revenue from its COVID-19 portfolio as the pandemic eased. The Fund continued to hold a position in Pfizer. Shares of AES declined as quarterly earnings failed to meet consensus expectations. Concerns over the potential impact of rising interest rates further weighed on the company’s share price. We exited the Fund’s position in AES.
What were some of the largest purchases and sales in the equity portion of the Fund during the reporting period?
During the reporting period, the equity portion of the Fund initiated positions in insurance company American International Group and pharmaceutical company Gilead. We believe AIG’s transformation over the past five years toward a pure-play property & casualty insurer has enhanced the quality of the underlying business. Improved pricing and risk controls are likely to drive higher earnings per share and return on equity, while the stock trades at an attractive valuation. We believe patent life extensions for Gilead’s key HIV drugs through early 2030s (versus the previous patent expiration dates in mid-2020s) are positive developments
| 1. | See "Investment and Performance Comparison" for other share class returns, which may be higher or lower than Class I share returns, and for more information on benchmark and peer group returns. |
for the business. Gilead’s HIV franchise drives the majority of the company’s revenue, supporting dividend sustainability. In addition, developments in the company’s oncology and cell therapy franchises could drive further growth.
During the same period, the equity portion of the Fund eliminated its positions in Eli Lilly, described above, and U.S.-based home improvement retailer Home Depot. As the share prices of both companies rose to premium levels, we chose to redeploy the Fund’s assets elsewhere.
How did sector weightings change in the equity portion of the Fund during the reporting period?
The equity portion of the Fund’s largest increases in sector exposures relative to the Russell 1000® Value Index were in financials, communication services and energy, while the most significant reductions in sector exposure were to industrials, consumer staples and information technology.
How was the equity portion of the Fund positioned at the end of the reporting period?
As of October 31, 2023, the equity portion of the Fund held its largest overweight exposures relative to the Russell 1000® Value Index to the health care, information technology and financials sectors. As of the same date, the equity portion of the Fund’s most significantly underweight exposures were to consumer staples, materials and industrials.
What factors affected the relative performance of the fixed-income portion of the Fund during the reporting period?
Relative to the Bloomberg U.S. Intermediate Government/Credit Bond Index, the fixed-income portion of the Fund held overweight positions in asset-backed securities (“ABS”) and commercial mortgage-backed securities (“CMBS”) throughout the reporting period. To facilitate these overweight positions, the Fund maintained slightly underweight exposure to the Treasury sector. Option-adjusted spreads2 (“OAS”) on the Index tightened 19 basis points during the reporting period. (A basis point is one one-hundredth of a percentage point.) Overweight exposure to ABS—particularly AAA and AA3 collateralized loan obligations (“CLOs”)—made the strongest contribution to the Fund’s relative performance, followed by positive contributions from the corporate
sector. An overweight position in CMBS was slightly accretive to relative performance. Underweight exposure to Treasury securities detracted from relative returns.
During the reporting period, how was the performance of the fixed-income portion of the Fund materially affected by investments in derivatives?
During the reporting period, the use of derivatives was limited to interest-rate derivatives employed to keep the duration4 of the fixed-income portion of the Fund in line with our target duration. These interest rate derivatives had a negative impact on performance.
What was the duration strategy of the fixed-income portion of the Fund during the reporting period?
During the reporting period, the fixed-income portion of the Fund generally maintained a duration shorter than that of the Bloomberg U.S. Intermediate Government/Credit Bond Index in the front end of the yield curve5 (0–2 years) and a duration longer than the Index in the 7–10 year part of the curve. This curve positioning detracted from the performance of the Fund. During the second half of the reporting period, the fund maintained a duration longer than the Index in the five-year part of the curve. This positioning detracted from performance as interest rates moved higher throughout the reporting period. As of October 31, 2023, the Fund’s duration was 3.87 years compared to a duration of 3.74 years for the Index.
During the reporting period, which sectors were the strongest positive contributors to the relative performance of the fixed-income portion of the Fund and which sectors were particularly weak?
During the reporting period, the fixed-income portion of the Fund maintained overweight exposure compared to the Bloomberg U.S. Intermediate Government/Credit Bond Index in the financials and utilities subsectors, both of which were accretive to relative performance. Among financials, overweight exposure to the finance company and banking subsectors had the most positive impact on relative performance, particularly holdings in UBS Group, JPMorgan Chase and Morgan Stanley. Among utilities, the Fund’s overweight exposure to the electric subcomponent had the most positive impact on relative performance, particularly holdings in PG&E and Enel. Within securitized products, ABS was the
| 2. | The terms “spread” and “yield spread” may refer to the difference in yield between a security or type of security and comparable U.S. Treasury issues. The terms may also refer to the difference in yield between two specific securities or types of securities at a given time. |
| 3. | An obligation rated ‘AAA’ has the highest rating assigned by Standard & Poor’s (“S&P”), and in the opinion of S&P, the obligor’s capacity to meet its financial commitment on the obligation is extremely strong. An obligation rated ‘AA’ by S&P is deemed by S&P to differ from the highest-rated obligations only to a small degree. In the opinion of S&P, the obligor's capacity to meet its financial commitment on the obligation is very strong. When applied to Fund holdings, ratings are based solely on the creditworthiness of the bonds in the portfolio and are not meant to represent the security or safety of the Fund. |
| 4. | Duration is a measure of the price sensitivity of a fixed-income investment to changes in interest rates. Duration is expressed as a number of years and is considered a more accurate sensitivity gauge than average maturity. |
| 5. | The yield curve is a line that plots the yields of various securities of similar quality—typically U.S. Treasury issues—across a range of maturities. The U.S. Treasury yield curve serves as a benchmark for other debt and is used in economic forecasting. |
best-performing sector. Within the floating-rate subcomponent of the ABS sector, CLOs rated AAA and AA were accretive to relative performance. Within the CMBS sector, overweight exposure to the AAA non-agency subcomponent was slightly accretive to performance. Underweight exposure to Treasury sector detracted from performance.
What were some of the largest purchases and sales in the fixed-income portion of the Fund during the reporting period?
The largest additions to the fixed-income portion of the Fund during the reporting period included bonds from Barclays plc, Bank of America, Credit Suisse AG (New York Branch), U.S. Bancorp and Danske Bank. The largest reductions during the reporting period included positions in Verizon Communications, Apple, Virginia Electric and Power, Nordea Bank and Antares Holdings.
How did the sector weightings of the fixed-income portion of the Fund change during the reporting period?
Throughout the reporting period, we increased the allocation of the fixed-income portion of the Fund to the non-agency subcomponent of the mortgage-backed sector. This sector offered a superior yield compared to other similar-duration asset classes. We also reduced U.S. government agency exposure, particularly in the callable agency subcomponent. In the expectation that interest rates would continue to rise, we reduced exposure to negatively convex6 assets that would underperform in a rising rate environment.
Toward the middle of the reporting period, we increased the allocation to AAA CLOs. The superior yield premium being offered on AAA CLOs, combined with the floating-rate nature of the asset, made this asset class attractive from a relative value perspective. Toward the end of the reporting period, we increased the allocation to U.S. regional banks. We concentrated specifically in the U.S. super and U.S. mid-tier subcomponents, as regional banks issued near OAS levels not seen since the regional banking crisis in March 2023.
How was the Fund positioned at the end of the reporting period?
As of October 31, 2023, the fixed-income portion of the Fund held its most significantly overweight exposure relative to the Bloomberg U.S. Intermediate Government/Credit Bond Index in ABS. Within the corporate sector, the Fund held overweight positions in financials and utilities. The Fund also held overweight positions in MBS and CMBS. As of that same date, the Fund held
relatively underweight positions in the sovereign, supranational, foreign agency and foreign local government sectors, as well as in U.S. Treasury securities.
| 6. | Convexity is a mathematical measure of the sensitivity of an interest-bearing bond to changes in interest rates. |
The opinions expressed are those of the portfolio managers as of the date of this report and are subject to change. There is no guarantee that any forecasts will come to pass. This material does not constitute investment advice and is not intended as an endorsement of any specific investment.
Portfolio of Investments October 31, 2023†^
| | Principal
Amount | Value |
| Long-Term Bonds 35.2% |
| Asset-Backed Securities 1.0% |
| Other Asset-Backed Securities 1.0% |
| Apidos CLO XXX | |
| Series XXXA, Class A2 | | |
| 7.257% (3 Month SOFR + 1.862%), due 10/18/31 (a)(b) | $ 600,000 | $ 591,451 |
| ARES XXXVIII CLO Ltd. | |
| Series 2015-38A, Class BR | | |
| 7.077% (3 Month SOFR + 1.662%), due 4/20/30 (a)(b) | 600,000 | 585,783 |
| Ballyrock CLO 23 Ltd. | |
| Series 2023-23A, Class A1 | | |
| 7.358% (3 Month SOFR + 1.98%), due 4/25/36 (a)(b) | 750,000 | 750,302 |
| Benefit Street Partners CLO XXX Ltd. | |
| Series 2023-30A, Class A | | |
| 7.478% (3 Month SOFR + 2.10%), due 4/25/36 (a)(b) | 700,000 | 702,464 |
| Carlyle Global Market Strategies CLO Ltd. | |
| Series 2013-3A, Class A2R | | |
| 7.055% (3 Month SOFR + 1.662%), due 10/15/30 (a)(b) | 1,100,000 | 1,081,210 |
| Palmer Square CLO Ltd. | |
| Series 2015-2A, Class A2R2 | | |
| 7.227% (3 Month SOFR + 1.812%), due 7/20/30 (a)(b) | 250,000 | 247,067 |
| STORE Master Funding I-VII XIV XIX XX | |
| Series 2021-1A, Class A1 | | |
| 2.12%, due 6/20/51 (a) | 305,148 | 250,023 |
Total Asset-Backed Securities
(Cost $4,299,029) | | 4,208,300 |
| Corporate Bonds 12.6% |
| Aerospace & Defense 0.1% |
| Boeing Co. (The) | | |
| 5.15%, due 5/1/30 | 290,000 | 271,716 |
| 5.805%, due 5/1/50 | 120,000 | 103,308 |
| HEICO Corp. | | |
| 5.35%, due 8/1/33 | 210,000 | 192,749 |
| | | 567,773 |
| Auto Manufacturers 0.4% |
| Ford Motor Co. | | |
| 3.25%, due 2/12/32 | 205,000 | 154,724 |
| Ford Motor Credit Co. LLC | | |
| 6.80%, due 5/12/28 | 400,000 | 398,857 |
| | Principal
Amount | Value |
| |
| Auto Manufacturers (continued) |
| General Motors Financial Co., Inc. | | |
| 6.05%, due 10/10/25 | $ 595,000 | $ 592,552 |
| Hyundai Capital America | | |
| 5.68%, due 6/26/28 (a) | 580,000 | 561,148 |
| | | 1,707,281 |
| Auto Parts & Equipment 0.1% |
| Aptiv plc | | |
| 3.25%, due 3/1/32 | 320,000 | 256,457 |
| Banks 5.2% |
| ABN AMRO Bank NV | | |
| 6.339% (1 Year Treasury Constant Maturity Rate + 1.65%), due 9/18/27 (a)(b) | 400,000 | 395,618 |
| Bank of America Corp. (c) | | |
| 1.734%, due 7/22/27 | 1,040,000 | 917,811 |
| 1.922%, due 10/24/31 | 153,000 | 112,827 |
| 2.087%, due 6/14/29 | 865,000 | 714,183 |
| 5.202%, due 4/25/29 | 660,000 | 627,505 |
| Bank of New York Mellon Corp. (The) | | |
| 6.474%, due 10/25/34 (c) | 175,000 | 175,585 |
| Barclays plc | | |
| 5.829%, due 5/9/27 (c) | 980,000 | 957,608 |
| 7.385% (1 Year Treasury Constant Maturity Rate + 3.30%), due 11/2/28 (b) | 405,000 | 409,437 |
| Citigroup, Inc. (c) | | |
| 2.014%, due 1/25/26 | 875,000 | 826,176 |
| 5.61%, due 9/29/26 | 1,050,000 | 1,036,517 |
| 6.174%, due 5/25/34 | 410,000 | 381,109 |
| Citizens Bank NA | | |
| 6.064%, due 10/24/25 (c) | 380,000 | 363,383 |
| Credit Suisse AG | | |
| 7.95%, due 1/9/25 | 1,000,000 | 1,014,263 |
| Danske Bank A/S | | |
| 6.466% (1 Year Treasury Constant Maturity Rate + 2.10%), due 1/9/26 (a)(b) | 850,000 | 846,497 |
| Deutsche Bank AG | | |
| 7.079%, due 2/10/34 (c) | 270,000 | 237,847 |
| Fifth Third Bancorp | | |
| 6.361%, due 10/27/28 (c) | 395,000 | 384,450 |
| Goldman Sachs Group, Inc. (The) | | |
| 5.70%, due 11/1/24 | 850,000 | 846,797 |
| HSBC Holdings plc (c) | | |
| 6.547%, due 6/20/34 | 330,000 | 306,685 |
| 7.39%, due 11/3/28 | 470,000 | 482,126 |
The notes to the financial statements are an integral part of, and should be read in conjunction with, the financial statements.
| | Principal
Amount | Value |
| Corporate Bonds (continued) |
| Banks (continued) |
| Huntington National Bank (The) | | |
| 5.65%, due 1/10/30 | $ 565,000 | $ 517,633 |
| JPMorgan Chase & Co. (c) | | |
| 1.578%, due 4/22/27 | 1,010,000 | 901,056 |
| 4.565%, due 6/14/30 | 500,000 | 458,883 |
| 5.546%, due 12/15/25 | 730,000 | 724,515 |
| KeyBank NA | | |
| 5.85%, due 11/15/27 | 790,000 | 731,623 |
| Manufacturers & Traders Trust Co. | | |
| 4.70%, due 1/27/28 | 430,000 | 389,656 |
| Mitsubishi UFJ Financial Group, Inc. | | |
| 5.406% (1 Year Treasury Constant Maturity Rate + 1.97%), due 4/19/34 (b) | 215,000 | 199,781 |
| Morgan Stanley (c) | | |
| 4.679%, due 7/17/26 | 1,314,000 | 1,276,760 |
| 5.123%, due 2/1/29 | 150,000 | 142,814 |
| 6.296%, due 10/18/28 | 160,000 | 159,712 |
| Morgan Stanley Bank NA | | |
| 4.754%, due 4/21/26 | 425,000 | 413,969 |
| National Securities Clearing Corp. | | |
| 5.00%, due 5/30/28 (a) | 375,000 | 364,067 |
| PNC Financial Services Group, Inc. (The) (c) | | |
| 5.582%, due 6/12/29 | 195,000 | 186,704 |
| 5.812%, due 6/12/26 | 415,000 | 409,497 |
| 6.615%, due 10/20/27 | 545,000 | 546,354 |
| Royal Bank of Canada | | |
| 5.66%, due 10/25/24 | 605,000 | 603,019 |
| Truist Financial Corp. (c) | | |
| 5.122%, due 1/26/34 | 160,000 | 137,283 |
| 7.161%, due 10/30/29 | 135,000 | 135,796 |
| U.S. Bancorp (c) | | |
| 2.677%, due 1/27/33 | 245,000 | 179,603 |
| 5.775%, due 6/12/29 | 495,000 | 475,973 |
| 5.836%, due 6/12/34 | 210,000 | 193,424 |
| 6.787%, due 10/26/27 | 385,000 | 387,880 |
| UBS Group AG (a) | | |
| 6.327% (1 Year Treasury Constant Maturity Rate + 1.60%), due 12/22/27 (b) | 560,000 | 554,358 |
| 6.442%, due 8/11/28 (c) | 550,000 | 544,272 |
| Wells Fargo & Co. (c) | | |
| 5.389%, due 4/24/34 | 425,000 | 384,733 |
| 6.303%, due 10/23/29 | 625,000 | 619,832 |
| | | 22,675,621 |
| | Principal
Amount | Value |
| |
| Beverages 0.1% |
| Constellation Brands, Inc. | | |
| 4.90%, due 5/1/33 | $ 345,000 | $ 311,495 |
| Keurig Dr Pepper, Inc. | | |
| 4.05%, due 4/15/32 | 105,000 | 90,324 |
| | | 401,819 |
| Biotechnology 0.2% |
| Amgen, Inc. | | |
| 4.05%, due 8/18/29 | 590,000 | 539,658 |
| 5.15%, due 3/2/28 | 300,000 | 292,794 |
| 5.25%, due 3/2/30 | 200,000 | 191,999 |
| | | 1,024,451 |
| Chemicals 0.3% |
| Celanese US Holdings LLC | | |
| 6.33%, due 7/15/29 | 420,000 | 404,853 |
| 6.55%, due 11/15/30 | 230,000 | 221,226 |
| RPM International, Inc. | | |
| 2.95%, due 1/15/32 | 575,000 | 436,985 |
| | | 1,063,064 |
| Commercial Services 0.1% |
| Global Payments, Inc. | | |
| 2.15%, due 1/15/27 | 400,000 | 351,510 |
| Computers 0.0% ‡ |
| Dell International LLC | | |
| 5.75%, due 2/1/33 | 155,000 | 146,563 |
| Diversified Financial Services 0.8% |
| AerCap Ireland Capital DAC | | |
| 3.00%, due 10/29/28 | 550,000 | 463,234 |
| Air Lease Corp. | | |
| 0.70%, due 2/15/24 | 1,425,000 | 1,401,741 |
| American Express Co. | | |
| 6.489%, due 10/30/31 (c) | 390,000 | 390,586 |
| Blackstone Holdings Finance Co. LLC | | |
| 5.90%, due 11/3/27 (a) | 605,000 | 599,220 |
| Intercontinental Exchange, Inc. | | |
| 4.35%, due 6/15/29 | 720,000 | 663,838 |
| | | 3,518,619 |
| Electric 1.5% |
| AEP Texas, Inc. | | |
| 4.70%, due 5/15/32 | 40,000 | 35,503 |
| American Electric Power Co., Inc. | | |
| 5.625%, due 3/1/33 | 220,000 | 206,497 |
The notes to the financial statements are an integral part of, and should be read in conjunction with, the financial statements.
13
Portfolio of Investments October 31, 2023†^ (continued)
| | Principal
Amount | Value |
| Corporate Bonds (continued) |
| Electric (continued) |
| Appalachian Power Co. | | |
| Series BB | | |
| 4.50%, due 8/1/32 | $ 45,000 | $ 39,281 |
| Arizona Public Service Co. | | |
| 5.55%, due 8/1/33 | 415,000 | 389,866 |
| Commonwealth Edison Co. | | |
| 3.10%, due 11/1/24 | 290,000 | 282,288 |
| Duke Energy Carolinas LLC | | |
| 4.95%, due 1/15/33 | 195,000 | 180,093 |
| Duke Energy Corp. | | |
| 2.45%, due 6/1/30 | 240,000 | 191,257 |
| 4.50%, due 8/15/32 | 140,000 | 122,285 |
| Duke Energy Ohio, Inc. | | |
| 5.25%, due 4/1/33 | 70,000 | 65,776 |
| Enel Finance America LLC | | |
| 7.10%, due 10/14/27 (a) | 420,000 | 429,460 |
| Entergy Arkansas LLC | | |
| 5.15%, due 1/15/33 | 220,000 | 204,778 |
| Florida Power & Light Co. | | |
| 5.05%, due 4/1/28 | 640,000 | 626,183 |
| Georgia Power Co. | | |
| 4.65%, due 5/16/28 | 755,000 | 721,263 |
| National Rural Utilities Cooperative Finance Corp. | | |
| 5.05%, due 9/15/28 | 330,000 | 320,515 |
| NextEra Energy Capital Holdings, Inc. | | |
| 6.051%, due 3/1/25 | 280,000 | 279,840 |
| Pacific Gas and Electric Co. | | |
| 5.45%, due 6/15/27 | 400,000 | 382,191 |
| 6.10%, due 1/15/29 | 240,000 | 230,914 |
| 6.15%, due 1/15/33 | 450,000 | 414,161 |
| 6.40%, due 6/15/33 | 110,000 | 103,229 |
| PECO Energy Co. | | |
| 4.90%, due 6/15/33 | 310,000 | 286,829 |
| Southern California Edison Co. | | |
| 5.30%, due 3/1/28 | 380,000 | 371,512 |
| 5.95%, due 11/1/32 | 175,000 | 170,905 |
| Southern Co. (The) | | |
| 5.15%, due 10/6/25 | 220,000 | 217,388 |
| 5.70%, due 10/15/32 | 100,000 | 95,806 |
| | | 6,367,820 |
| Entertainment 0.1% |
| Warnermedia Holdings, Inc. | | |
| 4.054%, due 3/15/29 | 224,000 | 198,211 |
| | Principal
Amount | Value |
| |
| Environmental Control 0.1% |
| Waste Connections, Inc. | | |
| 2.60%, due 2/1/30 | $ 445,000 | $ 368,297 |
| Food 0.0% ‡ |
| Kraft Heinz Foods Co. | | |
| 3.75%, due 4/1/30 | 130,000 | 113,829 |
| Gas 0.2% |
| CenterPoint Energy Resources Corp. | | |
| 1.75%, due 10/1/30 | 550,000 | 414,131 |
| Southwest Gas Corp. | | |
| 5.45%, due 3/23/28 | 220,000 | 214,814 |
| | | 628,945 |
| Healthcare-Products 0.1% |
| Baxter International, Inc. | | |
| 3.95%, due 4/1/30 | 610,000 | 530,160 |
| Healthcare-Services 0.1% |
| HCA, Inc. | | |
| 3.625%, due 3/15/32 | 115,000 | 92,376 |
| 5.50%, due 6/1/33 | 430,000 | 392,296 |
| | | 484,672 |
| Insurance 0.2% |
| Corebridge Financial, Inc. | | |
| 3.85%, due 4/5/29 | 325,000 | 287,226 |
| Reinsurance Group of America, Inc. | | |
| 6.00%, due 9/15/33 | 420,000 | 395,040 |
| | | 682,266 |
| Internet 0.2% |
| Amazon.com, Inc. | | |
| 2.10%, due 5/12/31 | 430,000 | 338,957 |
| Meta Platforms, Inc. | | |
| 3.85%, due 8/15/32 | 440,000 | 382,417 |
| | | 721,374 |
| Investment Companies 0.1% |
| Blackstone Private Credit Fund | | |
| 7.05%, due 9/29/25 | 420,000 | 418,396 |
| Media 0.1% |
| Charter Communications Operating LLC | | |
| 2.80%, due 4/1/31 | 210,000 | 160,594 |
The notes to the financial statements are an integral part of, and should be read in conjunction with, the financial statements.
| | Principal
Amount | Value |
| Corporate Bonds (continued) |
| Media (continued) |
| Paramount Global | | |
| 4.20%, due 5/19/32 | $ 605,000 | $ 467,115 |
| | | 627,709 |
| Miscellaneous—Manufacturing 0.0% ‡ |
| 3M Co. | | |
| 3.05%, due 4/15/30 | 209,000 | 176,492 |
| Oil & Gas 0.1% |
| Phillips 66 Co. | | |
| 3.15%, due 12/15/29 | 535,000 | 456,880 |
| Pharmaceuticals 0.2% |
| AbbVie, Inc. | | |
| 2.95%, due 11/21/26 | 240,000 | 222,279 |
| CVS Health Corp. | | |
| 3.75%, due 4/1/30 | 170,000 | 147,902 |
| 5.30%, due 6/1/33 | 65,000 | 60,030 |
| Merck & Co., Inc. | | |
| 2.15%, due 12/10/31 | 415,000 | 319,883 |
| Pfizer Investment Enterprises Pte. Ltd. | | |
| 4.75%, due 5/19/33 | 210,000 | 192,991 |
| | | 943,085 |
| Pipelines 0.4% |
| Columbia Pipelines Operating Co. LLC | | |
| 5.927%, due 8/15/30 (a) | 270,000 | 260,705 |
| Energy Transfer LP | | |
| 3.75%, due 5/15/30 | 185,000 | 158,116 |
| 5.75%, due 2/15/33 | 205,000 | 192,177 |
| Enterprise Products Operating LLC | | |
| 5.35%, due 1/31/33 | 430,000 | 409,855 |
| MPLX LP | | |
| 4.95%, due 9/1/32 | 178,000 | 158,021 |
| Targa Resources Partners LP | | |
| 5.50%, due 3/1/30 | 755,000 | 695,748 |
| | | 1,874,622 |
| Real Estate Investment Trusts 0.3% |
| American Tower Corp. | | |
| 2.10%, due 6/15/30 | 660,000 | 502,702 |
| CubeSmart LP | | |
| 2.25%, due 12/15/28 | 340,000 | 280,873 |
| Simon Property Group LP | | |
| 1.75%, due 2/1/28 | 425,000 | 356,771 |
| | Principal
Amount | Value |
| |
| Real Estate Investment Trusts (continued) |
| Sun Communities Operating LP | | |
| 2.70%, due 7/15/31 | $ 435,000 | $ 324,652 |
| | | 1,464,998 |
| Retail 0.3% |
| AutoZone, Inc. | | |
| 5.20%, due 8/1/33 | 415,000 | 376,405 |
| Home Depot, Inc. (The) | | |
| 1.875%, due 9/15/31 | 385,000 | 290,600 |
| Lowe's Cos., Inc. | | |
| 4.80%, due 4/1/26 | 310,000 | 303,629 |
| 5.00%, due 4/15/33 | 205,000 | 186,498 |
| 5.15%, due 7/1/33 | 105,000 | 96,098 |
| | | 1,253,230 |
| Semiconductors 0.4% |
| Broadcom, Inc. | | |
| 2.45%, due 2/15/31 (a) | 385,000 | 295,455 |
| Intel Corp. | | |
| 5.125%, due 2/10/30 | 290,000 | 280,619 |
| 5.20%, due 2/10/33 | 215,000 | 202,975 |
| Micron Technology, Inc. | | |
| 5.375%, due 4/15/28 | 380,000 | 364,765 |
| 5.875%, due 9/15/33 | 215,000 | 198,492 |
| QUALCOMM, Inc. | | |
| 2.15%, due 5/20/30 | 490,000 | 396,350 |
| | | 1,738,656 |
| Software 0.1% |
| Microsoft Corp. | | |
| 2.525%, due 6/1/50 | 220,000 | 125,933 |
| Oracle Corp. | | |
| 4.50%, due 5/6/28 | 220,000 | 208,159 |
| 6.15%, due 11/9/29 | 170,000 | 170,614 |
| | | 504,706 |
| Telecommunications 0.6% |
| AT&T, Inc. | | |
| 4.35%, due 3/1/29 | 955,000 | 879,160 |
| 5.40%, due 2/15/34 | 305,000 | 280,243 |
| T-Mobile USA, Inc. | | |
| 2.625%, due 4/15/26 | 675,000 | 623,853 |
| 2.625%, due 2/15/29 | 135,000 | 113,178 |
| 5.75%, due 1/15/34 | 405,000 | 384,242 |
| Verizon Communications, Inc. | | |
| 2.10%, due 3/22/28 | 340,000 | 290,020 |
| 3.376%, due 2/15/25 | 8,000 | 7,757 |
| | | 2,578,453 |
The notes to the financial statements are an integral part of, and should be read in conjunction with, the financial statements.
15
Portfolio of Investments October 31, 2023†^ (continued)
| | Principal
Amount | Value |
| Corporate Bonds (continued) |
| Transportation 0.1% |
| Norfolk Southern Corp. | | |
| 3.00%, due 3/15/32 | $ 250,000 | $ 200,951 |
| Union Pacific Corp. | | |
| 2.80%, due 2/14/32 | 245,000 | 196,142 |
| United Parcel Service, Inc. | | |
| 4.45%, due 4/1/30 | 220,000 | 206,364 |
| | | 603,457 |
| Trucking & Leasing 0.1% |
| Penske Truck Leasing Co. LP (a) | | |
| 5.75%, due 5/24/26 | 230,000 | 226,245 |
| 6.05%, due 8/1/28 | 165,000 | 161,879 |
| | | 388,124 |
Total Corporate Bonds
(Cost $57,608,288) | | 54,837,540 |
| Mortgage-Backed Securities 0.5% |
| Agency (Collateralized Mortgage Obligation) 0.1% |
| FNMA | |
| REMIC, Series 2021-3, Class TI | | |
| 2.50%, due 2/25/51 (d) | 2,586,258 | 414,521 |
| Commercial Mortgage Loans (Collateralized Mortgage Obligation) 0.2% |
| Citigroup Commercial Mortgage Trust | |
| Series 2020-GC46, Class A5 | | |
| 2.717%, due 2/15/53 | 1,000,000 | 807,742 |
| Whole Loan (Collateralized Mortgage Obligation) 0.2% |
| A&D Mortgage Trust | |
| Series 2023-NQM3, Class A1 | | |
| 6.733%, due 7/25/68 (a)(e) | 786,010 | 780,773 |
Total Mortgage-Backed Securities
(Cost $2,232,849) | | 2,003,036 |
| U.S. Government & Federal Agencies 21.1% |
| United States Treasury Bonds 0.1% |
| U.S. Treasury Bonds | | |
| 4.375%, due 8/15/43 | 450,000 | 401,343 |
| United States Treasury Notes 21.0% |
| U.S. Treasury Notes | | |
| 2.50%, due 5/15/24 | 8,725,000 | 8,586,286 |
| 2.625%, due 12/31/23 | 1,300,000 | 1,293,904 |
| 3.875%, due 8/15/33 | 5,837,000 | 5,372,776 |
| | Principal
Amount | Value |
| |
| United States Treasury Notes (continued) |
| U.S. Treasury Notes (continued) | | |
| 4.625%, due 10/15/26 | $ 18,525,000 | $ 18,387,510 |
| 4.875%, due 10/31/28 | 15,075,000 | 15,106,799 |
| 4.875%, due 10/31/30 | 16,250,000 | 16,216,992 |
| 5.00%, due 10/31/25 | 26,615,000 | 26,582,771 |
| | | 91,547,038 |
Total U.S. Government & Federal Agencies
(Cost $92,275,609) | | 91,948,381 |
Total Long-Term Bonds
(Cost $156,415,775) | | 152,997,257 |
| |
| | Shares | |
| |
| Common Stocks 54.6% |
| Aerospace & Defense 1.7% |
| General Dynamics Corp. | 17,251 | 4,162,839 |
| L3Harris Technologies, Inc. | 18,918 | 3,394,078 |
| | | 7,556,917 |
| Air Freight & Logistics 0.7% |
| United Parcel Service, Inc., Class B | 22,929 | 3,238,721 |
| Automobile Components 0.8% |
| Gentex Corp. | 124,508 | 3,570,889 |
| Banks 4.7% |
| JPMorgan Chase & Co. | 61,019 | 8,485,302 |
| M&T Bank Corp. | 37,304 | 4,206,026 |
| New York Community Bancorp, Inc. | 358,121 | 3,394,987 |
| PNC Financial Services Group, Inc. (The) | 36,719 | 4,203,224 |
| | | 20,289,539 |
| Beverages 1.4% |
| Keurig Dr Pepper, Inc. | 109,480 | 3,320,528 |
| Pernod Ricard SA, Sponsored ADR | 74,850 | 2,658,747 |
| | | 5,979,275 |
| Biotechnology 0.9% |
| Gilead Sciences, Inc. | 50,179 | 3,941,059 |
| Building Products 1.3% |
| Fortune Brands Innovations, Inc. | 40,762 | 2,274,520 |
| Johnson Controls International plc | 70,349 | 3,448,508 |
| | | 5,723,028 |
The notes to the financial statements are an integral part of, and should be read in conjunction with, the financial statements.
| | Shares | Value |
| Common Stocks (continued) |
| Capital Markets 4.1% |
| Ares Management Corp. | 32,073 | $ 3,162,077 |
| Blackstone, Inc. | 22,705 | 2,096,807 |
| Intercontinental Exchange, Inc. | 31,526 | 3,387,153 |
| LPL Financial Holdings, Inc. | 10,830 | 2,431,552 |
| Morgan Stanley | 46,160 | 3,269,051 |
| Raymond James Financial, Inc. | 38,296 | 3,654,970 |
| | | 18,001,610 |
| Chemicals 0.6% |
| Axalta Coating Systems Ltd. (f) | 99,958 | 2,621,898 |
| Communications Equipment 2.4% |
| Cisco Systems, Inc. | 135,276 | 7,051,938 |
| F5, Inc. (f) | 23,387 | 3,545,235 |
| | | 10,597,173 |
| Containers & Packaging 0.5% |
| Sealed Air Corp. | 63,976 | 1,969,821 |
| Distributors 0.7% |
| LKQ Corp. | 72,679 | 3,192,062 |
| Diversified Consumer Services 0.8% |
| H&R Block, Inc. | 85,235 | 3,498,897 |
| Electric Utilities 0.8% |
| Exelon Corp. | 83,785 | 3,262,588 |
| Electrical Equipment 0.9% |
| Emerson Electric Co. | 42,933 | 3,819,749 |
| Electronic Equipment, Instruments & Components 0.8% |
| Corning, Inc. | 123,948 | 3,316,849 |
| Entertainment 0.8% |
| Electronic Arts, Inc. | 28,513 | 3,529,624 |
| Financial Services 0.6% |
| Global Payments, Inc. | 26,092 | 2,771,492 |
| Food Products 0.8% |
| Archer-Daniels-Midland Co. | 49,891 | 3,570,699 |
| | Shares | Value |
| |
| Gas Utilities 0.8% |
| Atmos Energy Corp. | 31,185 | $ 3,357,377 |
| Ground Transportation 0.6% |
| Knight-Swift Transportation Holdings, Inc. | 56,070 | 2,741,262 |
| Health Care Equipment & Supplies 1.8% |
| Becton Dickinson & Co. | 16,037 | 4,053,833 |
| Boston Scientific Corp. (f) | 70,205 | 3,593,794 |
| | | 7,647,627 |
| Health Care Providers & Services 3.4% |
| Centene Corp. (f) | 67,344 | 4,645,389 |
| Elevance Health, Inc. | 11,352 | 5,109,422 |
| UnitedHealth Group, Inc. | 9,345 | 5,004,808 |
| | | 14,759,619 |
| Health Care REITs 0.9% |
| Welltower, Inc. | 47,692 | 3,987,528 |
| Hotel & Resort REITs 0.7% |
| Host Hotels & Resorts, Inc. | 190,324 | 2,946,216 |
| Household Durables 0.6% |
| Lennar Corp., Class A | 22,702 | 2,421,849 |
| Insurance 3.0% |
| American International Group, Inc. | 70,611 | 4,329,160 |
| Chubb Ltd. | 21,100 | 4,528,482 |
| MetLife, Inc. | 71,677 | 4,301,337 |
| | | 13,158,979 |
| Interactive Media & Services 0.7% |
| Alphabet, Inc., Class C (f) | 25,299 | 3,169,965 |
| IT Services 0.7% |
| Amdocs Ltd. | 35,154 | 2,817,945 |
| Machinery 0.6% |
| Middleby Corp. (The) (f) | 22,092 | 2,493,524 |
| Media 0.7% |
| Omnicom Group, Inc. | 40,744 | 3,052,133 |
| Multi-Utilities 0.8% |
| Sempra | 52,403 | 3,669,782 |
The notes to the financial statements are an integral part of, and should be read in conjunction with, the financial statements.
17
Portfolio of Investments October 31, 2023†^ (continued)
| | Shares | Value |
| Common Stocks (continued) |
| Oil, Gas & Consumable Fuels 5.1% |
| ConocoPhillips | 49,392 | $ 5,867,769 |
| Coterra Energy, Inc. | 139,666 | 3,840,815 |
| Diamondback Energy, Inc. | 24,622 | 3,947,399 |
| EOG Resources, Inc. | 30,823 | 3,891,404 |
| Phillips 66 | 40,043 | 4,567,705 |
| | | 22,115,092 |
| Personal Care Products 0.7% |
| Unilever plc, Sponsored ADR | 68,430 | 3,240,161 |
| Pharmaceuticals 4.1% |
| AstraZeneca plc, Sponsored ADR | 48,580 | 3,071,714 |
| Merck & Co., Inc. | 60,147 | 6,177,097 |
| Pfizer, Inc. | 201,950 | 6,171,592 |
| Roche Holding AG | 8,819 | 2,267,161 |
| | | 17,687,564 |
| Real Estate Management & Development 0.7% |
| CBRE Group, Inc., Class A (f) | 43,570 | 3,021,144 |
| Semiconductors & Semiconductor Equipment 2.2% |
| Analog Devices, Inc. | 19,741 | 3,105,852 |
| NXP Semiconductors NV | 17,891 | 3,084,945 |
| QUALCOMM, Inc. | 31,248 | 3,405,719 |
| | | 9,596,516 |
| Specialized REITs 0.9% |
| Gaming and Leisure Properties, Inc. | 81,482 | 3,698,467 |
| Specialty Retail 0.3% |
| Victoria's Secret & Co. (f) | 77,943 | 1,393,621 |
Total Common Stocks
(Cost $224,225,497) | | 237,428,261 |
| Exchange-Traded Funds 8.5% |
| iShares Intermediate Government/Credit Bond ETF | 69,118 | 6,949,124 |
| iShares Russell 1000 Value ETF | 136,706 | 20,016,492 |
| Vanguard Intermediate-Term Treasury ETF | 38,979 | 2,203,093 |
| Vanguard Russell 1000 Value (g) | 123,521 | 7,939,930 |
Total Exchange-Traded Funds
(Cost $37,983,850) | | 37,108,639 |
| | Shares | | Value |
| Short-Term Investments 1.2% |
| Affiliated Investment Company 0.5% |
| MainStay U.S. Government Liquidity Fund, 5.275% (h) | 2,082,692 | | $ 2,082,692 |
| Unaffiliated Investment Company 0.7% |
| Invesco Government & Agency Portfolio, 5.357% (h)(i) | 3,236,935 | | 3,236,935 |
Total Short-Term Investments
(Cost $5,319,627) | | | 5,319,627 |
Total Investments
(Cost $423,944,749) | 99.5% | | 432,853,784 |
| Other Assets, Less Liabilities | 0.5 | | 2,263,467 |
| Net Assets | 100.0% | | $ 435,117,251 |
| † | Percentages indicated are based on Fund net assets. |
| ^ | Industry classifications may be different than those used for compliance monitoring purposes. |
| ‡ | Less than one-tenth of a percent. |
| (a) | May be sold to institutional investors only under Rule 144A or securities offered pursuant to Section 4(a)(2) of the Securities Act of 1933, as amended. |
| (b) | Floating rate—Rate shown was the rate in effect as of October 31, 2023. |
| (c) | Fixed to floating rate—Rate shown was the rate in effect as of October 31, 2023. |
| (d) | Collateralized Mortgage Obligation Interest Only Strip—Pays a fixed or variable rate of interest based on mortgage loans or mortgage pass-through securities. The principal amount of the underlying pool represents the notional amount on which the current interest was calculated. The value of these stripped securities may be particularly sensitive to changes in prevailing interest rates and are typically more sensitive to changes in prepayment rates than traditional mortgage-backed securities. |
| (e) | Step coupon—Rate shown was the rate in effect as of October 31, 2023. |
| (f) | Non-income producing security. |
| (g) | All or a portion of this security was held on loan. As of October 31, 2023, the aggregate market value of securities on loan was $3,172,196. The Fund received cash collateral with a value of $3,236,935. (See Note 2(I)) |
| (h) | Current yield as of October 31, 2023. |
| (i) | Represents a security purchased with cash collateral received for securities on loan. |
The notes to the financial statements are an integral part of, and should be read in conjunction with, the financial statements.
Investments in Affiliates (in 000's)
Investments in issuers considered to be affiliate(s) of the Fund during the year ended October 31, 2023 for purposes of Section 2(a)(3) of the Investment Company Act of 1940, as amended, were as follows:
| Affiliated Investment Companies | Value,
Beginning
of Year | Purchases
at Cost | Proceeds
from
Sales | Net
Realized
Gain/(Loss)
on Sales | Change in
Unrealized
Appreciation/
(Depreciation) | Value,
End of
Year | Dividend
Income | Other
Distributions | Shares
End of
Year |
| MainStay U.S. Government Liquidity Fund | $ 10,985 | $ 39,525 | $ (48,427) | $ — | $ — | $ 2,083 | $ 156 | $ — | 2,083 |
Futures Contracts
As of October 31, 2023, the Fund held the following futures contracts1:
| Type | Number of
Contracts | Expiration
Date | Value at
Trade Date | Current
Notional
Amount | Unrealized
Appreciation
(Depreciation)2 |
| Long Contracts | | | | | |
| U.S. Treasury 5 Year Notes | 172 | December 2023 | $ 18,322,600 | $ 17,969,969 | $ (352,631) |
| U.S. Treasury 10 Year Notes | 2 | December 2023 | 222,098 | 212,344 | (9,754) |
| Total Long Contracts | | | | | (362,385) |
| Short Contracts | | | | | |
| U.S. Treasury 2 Year Notes | (9) | December 2023 | (1,832,540) | (1,821,797) | 10,743 |
| U.S. Treasury 10 Year Ultra Bonds | (18) | December 2023 | (2,071,656) | (1,958,907) | 112,749 |
| U.S. Treasury Long Bonds | (4) | December 2023 | (481,242) | (437,750) | 43,492 |
| U.S. Treasury Ultra Bonds | (2) | December 2023 | (255,246) | (225,125) | 30,121 |
| Total Short Contracts | | | | | 197,105 |
| Net Unrealized Depreciation | | | | | $ (165,280) |
| 1. | As of October 31, 2023, cash in the amount of $181,875 was on deposit with a broker or futures commission merchant for futures transactions. |
| 2. | Represents the difference between the value of the contracts at the time they were opened and the value as of October 31, 2023. |
| Abbreviation(s): |
| ADR—American Depositary Receipt |
| CLO—Collateralized Loan Obligation |
| ETF—Exchange-Traded Fund |
| FNMA—Federal National Mortgage Association |
| REIT—Real Estate Investment Trust |
| REMIC—Real Estate Mortgage Investment Conduit |
| SOFR—Secured Overnight Financing Rate |
The notes to the financial statements are an integral part of, and should be read in conjunction with, the financial statements.
19
Portfolio of Investments October 31, 2023†^ (continued)
The following is a summary of the fair valuations according to the inputs used as of October 31, 2023, for valuing the Fund’s assets and liabilities:
| Description | Quoted
Prices in
Active
Markets for
Identical
Assets
(Level 1) | | Significant
Other
Observable
Inputs
(Level 2) | | Significant
Unobservable
Inputs
(Level 3) | | Total |
| Asset Valuation Inputs | | | | | | | |
| Investments in Securities (a) | | | | | | | |
| Long-Term Bonds | | | | | | | |
| Asset-Backed Securities | $ — | | $ 4,208,300 | | $ — | | $ 4,208,300 |
| Corporate Bonds | — | | 54,837,540 | | — | | 54,837,540 |
| Mortgage-Backed Securities | — | | 2,003,036 | | — | | 2,003,036 |
| U.S. Government & Federal Agencies | — | | 91,948,381 | | — | | 91,948,381 |
| Total Long-Term Bonds | — | | 152,997,257 | | — | | 152,997,257 |
| Common Stocks | 237,428,261 | | — | | — | | 237,428,261 |
| Exchange-Traded Funds | 37,108,639 | | — | | — | | 37,108,639 |
| Short-Term Investments | | | | | | | |
| Affiliated Investment Company | 2,082,692 | | — | | — | | 2,082,692 |
| Unaffiliated Investment Company | 3,236,935 | | — | | — | | 3,236,935 |
| Total Short-Term Investments | 5,319,627 | | — | | — | | 5,319,627 |
| Total Investments in Securities | 279,856,527 | | 152,997,257 | | — | | 432,853,784 |
| Other Financial Instruments | | | | | | | |
| Futures Contracts (b) | 197,105 | | — | | — | | 197,105 |
| Total Investments in Securities and Other Financial Instruments | $ 280,053,632 | | $ 152,997,257 | | $ — | | $ 433,050,889 |
| Liability Valuation Inputs | | | | | | | |
| Other Financial Instruments | | | | | | | |
| Futures Contracts (b) | $ (362,385) | | $ — | | $ — | | $ (362,385) |
| (a) | For a complete listing of investments and their industries, see the Portfolio of Investments. |
| (b) | The value listed for these securities reflects unrealized appreciation (depreciation) as shown on the Portfolio of Investments. |
The notes to the financial statements are an integral part of, and should be read in conjunction with, the financial statements.
Statement of Assets and Liabilities as of October 31, 2023
| Assets |
Investment in unaffiliated securities, at value
(identified cost $421,862,057) including securities on loan of $3,172,196 | $430,771,092 |
Investment in affiliated investment companies, at value
(identified cost $2,082,692) | 2,082,692 |
| Cash | 6,060,517 |
| Cash collateral on deposit at broker for futures contracts | 181,875 |
| Receivables: | |
| Investment securities sold | 2,386,186 |
| Dividends and interest | 1,111,949 |
| Fund shares sold | 426,422 |
| Securities lending | 8,524 |
| Other assets | 42,399 |
| Total assets | 443,071,656 |
| Liabilities |
| Cash collateral received for securities on loan | 3,236,935 |
| Payables: | |
| Investment securities purchased | 3,559,271 |
| Fund shares redeemed | 656,090 |
| Manager (See Note 3) | 245,230 |
| Transfer agent (See Note 3) | 110,122 |
| NYLIFE Distributors (See Note 3) | 92,578 |
| Professional fees | 16,453 |
| Variation margin on futures contracts | 13,656 |
| Custodian | 11,724 |
| Shareholder communication | 11,425 |
| Accrued expenses | 921 |
| Total liabilities | 7,954,405 |
| Net assets | $435,117,251 |
| Composition of Net Assets |
| Shares of beneficial interest outstanding (par value of $.001 per share) unlimited number of shares authorized | $ 15,917 |
| Additional paid-in-capital | 428,964,510 |
| | 428,980,427 |
| Total distributable earnings (loss) | 6,136,824 |
| Net assets | $435,117,251 |
| Class A | |
| Net assets applicable to outstanding shares | $328,664,503 |
| Shares of beneficial interest outstanding | 12,022,814 |
| Net asset value per share outstanding | $ 27.34 |
| Maximum sales charge (3.00% of offering price) | 0.85 |
| Maximum offering price per share outstanding | $ 28.19 |
| Investor Class | |
| Net assets applicable to outstanding shares | $ 36,675,052 |
| Shares of beneficial interest outstanding | 1,341,683 |
| Net asset value per share outstanding | $ 27.34 |
| Maximum sales charge (2.50% of offering price) | 0.70 |
| Maximum offering price per share outstanding | $ 28.04 |
| Class B | |
| Net assets applicable to outstanding shares | $ 2,998,885 |
| Shares of beneficial interest outstanding | 111,214 |
| Net asset value and offering price per share outstanding(a) | $ 26.97 |
| Class C | |
| Net assets applicable to outstanding shares | $ 11,121,276 |
| Shares of beneficial interest outstanding | 412,603 |
| Net asset value and offering price per share outstanding | $ 26.95 |
| Class I | |
| Net assets applicable to outstanding shares | $ 53,112,876 |
| Shares of beneficial interest outstanding | 1,935,889 |
| Net asset value and offering price per share outstanding | $ 27.44 |
| Class R1 | |
| Net assets applicable to outstanding shares | $ 154,016 |
| Shares of beneficial interest outstanding | 5,624 |
| Net asset value and offering price per share outstanding(a) | $ 27.38 |
| Class R2 | |
| Net assets applicable to outstanding shares | $ 467,080 |
| Shares of beneficial interest outstanding | 17,049 |
| Net asset value and offering price per share outstanding | $ 27.40 |
| Class R3 | |
| Net assets applicable to outstanding shares | $ 1,871,361 |
| Shares of beneficial interest outstanding | 68,671 |
| Net asset value and offering price per share outstanding | $ 27.25 |
| Class R6 | |
| Net assets applicable to outstanding shares | $ 52,202 |
| Shares of beneficial interest outstanding | 1,900 |
| Net asset value and offering price per share outstanding | $ 27.47 |
| (a) | The difference between the calculated and stated NAV was caused by rounding. |
The notes to the financial statements are an integral part of, and should be read in conjunction with, the financial statements.
21
Statement of Operations for the year ended October 31, 2023
| Investment Income (Loss) |
| Income | |
| Interest | $ 7,288,047 |
| Dividends-unaffiliated (net of foreign tax withholding of $25,596) | 7,206,529 |
| Dividends-affiliated | 155,508 |
| Securities lending, net | 34,977 |
| Total income | 14,685,061 |
| Expenses | |
| Manager (See Note 3) | 3,061,694 |
| Distribution/Service—Class A (See Note 3) | 875,187 |
| Distribution/Service—Investor Class (See Note 3) | 99,238 |
| Distribution/Service—Class B (See Note 3) | 44,172 |
| Distribution/Service—Class C (See Note 3) | 141,614 |
| Distribution/Service—Class R2 (See Note 3) | 1,530 |
| Distribution/Service—Class R3 (See Note 3) | 9,852 |
| Transfer agent (See Note 3) | 665,382 |
| Registration | 122,399 |
| Professional fees | 105,376 |
| Custodian | 33,709 |
| Trustees | 12,127 |
| Shareholder communication | 11,068 |
| Shareholder service (See Note 3) | 2,774 |
| Miscellaneous | 18,790 |
| Total expenses before waiver/reimbursement | 5,204,912 |
| Expense waiver/reimbursement from Manager (See Note 3) | (57,114) |
| Reimbursement from prior custodian(a) | (955) |
| Net expenses | 5,146,843 |
| Net investment income (loss) | 9,538,218 |
| Realized and Unrealized Gain (Loss) |
| Net realized gain (loss) on: | |
| Unaffiliated investment transactions | 157,437 |
| Futures transactions | (642,945) |
| Foreign currency transactions | 411 |
| Net realized gain (loss) | (485,097) |
| Net change in unrealized appreciation (depreciation) on: | |
| Unaffiliated investments | (12,417,142) |
| Futures contracts | 66,362 |
| Translation of other assets and liabilities in foreign currencies | 2,183 |
| Net change in unrealized appreciation (depreciation) | (12,348,597) |
| Net realized and unrealized gain (loss) | (12,833,694) |
| Net increase (decrease) in net assets resulting from operations | $ (3,295,476) |
| (a) | Represents a refund for overbilling of custody fees. |
The notes to the financial statements are an integral part of, and should be read in conjunction with, the financial statements.
Statements of Changes in Net Assets
for the years ended October 31, 2023 and October 31, 2022
| | 2023 | 2022 |
| Increase (Decrease) in Net Assets |
| Operations: | | |
| Net investment income (loss) | $ 9,538,218 | $ 5,633,375 |
| Net realized gain (loss) | (485,097) | (1,157,514) |
| Net change in unrealized appreciation (depreciation) | (12,348,597) | (31,897,318) |
| Net increase (decrease) in net assets resulting from operations | (3,295,476) | (27,421,457) |
| Distributions to shareholders: | | |
| Class A | (7,916,075) | (68,171,865) |
| Investor Class | (791,702) | (9,028,686) |
| Class B | (50,948) | (1,805,691) |
| Class C | (167,807) | (4,789,167) |
| Class I | (1,495,744) | (12,813,121) |
| Class R1 | (4,769) | (22,059) |
| Class R2 | (12,812) | (194,564) |
| Class R3 | (38,396) | (443,499) |
| Class R6 | (1,952) | (12,112) |
| Total distributions to shareholders | (10,480,205) | (97,280,764) |
| Capital share transactions: | | |
| Net proceeds from sales of shares | 61,966,081 | 85,070,719 |
| Net asset value of shares issued to shareholders in reinvestment of distributions | 10,314,554 | 95,556,872 |
| Cost of shares redeemed | (92,500,140) | (88,508,384) |
| Increase (decrease) in net assets derived from capital share transactions | (20,219,505) | 92,119,207 |
| Net increase (decrease) in net assets | (33,995,186) | (32,583,014) |
| Net Assets |
| Beginning of year | 469,112,437 | 501,695,451 |
| End of year | $435,117,251 | $469,112,437 |
The notes to the financial statements are an integral part of, and should be read in conjunction with, the financial statements.
23
Financial Highlights selected per share data and ratios
| | Year Ended October 31, |
| Class A | 2023 | | 2022 | | 2021 | | 2020 | | 2019 |
| Net asset value at beginning of year | $ 28.21 | | $ 37.09 | | $ 29.72 | | $ 30.98 | | $ 31.49 |
| Net investment income (loss) (a) | 0.59 | | 0.36 | | 0.27 | | 0.36 | | 0.44 |
| Net realized and unrealized gain (loss) | (0.82) | | (2.03) | | 7.70 | | (0.54) | | 1.58 |
| Total from investment operations | (0.23) | | (1.67) | | 7.97 | | (0.18) | | 2.02 |
| Less distributions: | | | | | | | | | |
| From net investment income | (0.61) | | (0.33) | | (0.28) | | (0.41) | | (0.46) |
| From net realized gain on investments | (0.03) | | (6.88) | | (0.32) | | (0.67) | | (2.07) |
| Total distributions | (0.64) | | (7.21) | | (0.60) | | (1.08) | | (2.53) |
| Net asset value at end of year | $ 27.34 | | $ 28.21 | | $ 37.09 | | $ 29.72 | | $ 30.98 |
| Total investment return (b) | (0.86)% | | (5.35)% | | 27.03% | | (0.53)% | | 7.07% |
| Ratios (to average net assets)/Supplemental Data: | | | | | | | | | |
| Net investment income (loss) | 2.06% | | 1.22% | | 0.78% | | 1.21% | | 1.47% |
| Net expenses (c) | 1.06% | | 1.06% | | 1.08% | | 1.13% | | 1.12% |
| Portfolio turnover rate | 313% | | 290% | | 182% | | 217% | | 194% |
| Net assets at end of year (in 000’s) | $ 328,665 | | $ 345,376 | | $ 343,224 | | $ 252,574 | | $ 279,636 |
| (a) | Per share data based on average shares outstanding during the year. |
| (b) | Total investment return is calculated exclusive of sales charges and assumes the reinvestment of dividends and distributions. For periods of less than one year, total return is not annualized. |
| (c) | In addition to the fees and expenses which the Fund bears directly, it also indirectly bears a pro-rata share of the fees and expenses of the underlying funds in which it invests. Such indirect expenses are not included in the above expense ratios. |
| | Year Ended October 31, |
| Investor Class | 2023 | | 2022 | | 2021 | | 2020 | | 2019 |
| Net asset value at beginning of year | $ 28.20 | | $ 37.10 | | $ 29.75 | | $ 31.01 | | $ 31.51 |
| Net investment income (loss) (a) | 0.51 | | 0.28 | | 0.19 | | 0.29 | | 0.38 |
| Net realized and unrealized gain (loss) | (0.80) | | (2.03) | | 7.69 | | (0.55) | | 1.58 |
| Total from investment operations | (0.29) | | (1.75) | | 7.88 | | (0.26) | | 1.96 |
| Less distributions: | | | | | | | | | |
| From net investment income | (0.54) | | (0.27) | | (0.21) | | (0.33) | | (0.39) |
| From net realized gain on investments | (0.03) | | (6.88) | | (0.32) | | (0.67) | | (2.07) |
| Total distributions | (0.57) | | (7.15) | | (0.53) | | (1.00) | | (2.46) |
| Net asset value at end of year | $ 27.34 | | $ 28.20 | | $ 37.10 | | $ 29.75 | | $ 31.01 |
| Total investment return (b) | (1.08)% | | (5.62)% | | 26.68% | | (0.75)% | | 6.79% |
| Ratios (to average net assets)/Supplemental Data: | | | | | | | | | |
| Net investment income (loss) | 1.81% | | 0.95% | | 0.54% | | 0.97% | | 1.26% |
| Net expenses (c) | 1.31% | | 1.32% | | 1.35% | | 1.38% | | 1.33% |
| Expenses (before waiver/reimbursement) (c) | 1.41% | | 1.34% | | 1.37% | | 1.40% | | 1.35% |
| Portfolio turnover rate | 313% | | 290% | | 182% | | 217% | | 194% |
| Net assets at end of year (in 000's) | $ 36,675 | | $ 40,341 | | $ 46,706 | | $ 47,358 | | $ 53,006 |
| (a) | Per share data based on average shares outstanding during the year. |
| (b) | Total investment return is calculated exclusive of sales charges and assumes the reinvestment of dividends and distributions. For periods of less than one year, total return is not annualized. |
| (c) | In addition to the fees and expenses which the Fund bears directly, it also indirectly bears a pro-rata share of the fees and expenses of the underlying funds in which it invests. Such indirect expenses are not included in the above expense ratios. |
The notes to the financial statements are an integral part of, and should be read in conjunction with, the financial statements.
Financial Highlights selected per share data and ratios
| | Year Ended October 31, |
| Class B | 2023 | | 2022 | | 2021 | | 2020 | | 2019 |
| Net asset value at beginning of year | $ 27.81 | | $ 36.72 | | $ 29.56 | | $ 30.82 | | $ 31.35 |
| Net investment income (loss) (a) | 0.30 | | 0.05 | | (0.07) | | 0.07 | | 0.16 |
| Net realized and unrealized gain (loss) | (0.80) | | (1.99) | | 7.63 | | (0.54) | | 1.54 |
| Total from investment operations | (0.50) | | (1.94) | | 7.56 | | (0.47) | | 1.70 |
| Less distributions: | | | | | | | | | |
| From net investment income | (0.31) | | (0.09) | | (0.08) | | (0.12) | | (0.16) |
| From net realized gain on investments | (0.03) | | (6.88) | | (0.32) | | (0.67) | | (2.07) |
| Total distributions | (0.34) | | (6.97) | | (0.40) | | (0.79) | | (2.23) |
| Net asset value at end of year | $ 26.97 | | $ 27.81 | | $ 36.72 | | $ 29.56 | | $ 30.82 |
| Total investment return (b) | (1.83)% | | (6.30)% | | 25.74% | | (1.51)% | | 6.00% |
| Ratios (to average net assets)/Supplemental Data: | | | | | | | | | |
| Net investment income (loss) | 1.06% | | 0.18% | | (0.21)% | | 0.23% | | 0.54% |
| Net expenses (c) | 2.07% | | 2.07% | | 2.10% | | 2.13% | | 2.08% |
| Expenses (before waiver/reimbursement) (c) | 2.16% | | 2.09% | | 2.12% | | 2.15% | | 2.10% |
| Portfolio turnover rate | 313% | | 290% | | 182% | | 217% | | 194% |
| Net assets at end of year (in 000’s) | $ 2,999 | | $ 5,798 | | $ 9,645 | | $ 10,671 | | $ 15,049 |
| (a) | Per share data based on average shares outstanding during the year. |
| (b) | Total investment return is calculated exclusive of sales charges and assumes the reinvestment of dividends and distributions. For periods of less than one year, total return is not annualized. |
| (c) | In addition to the fees and expenses which the Fund bears directly, it also indirectly bears a pro-rata share of the fees and expenses of the underlying funds in which it invests. Such indirect expenses are not included in the above expense ratios. |
| | Year Ended October 31, |
| Class C | 2023 | | 2022 | | 2021 | | 2020 | | 2019 |
| Net asset value at beginning of year | $ 27.80 | | $ 36.71 | | $ 29.55 | | $ 30.81 | | $ 31.33 |
| Net investment income (loss) (a) | 0.30 | | 0.06 | | (0.07) | | 0.07 | | 0.18 |
| Net realized and unrealized gain (loss) | (0.81) | | (2.00) | | 7.63 | | (0.54) | | 1.53 |
| Total from investment operations | (0.51) | | (1.94) | | 7.56 | | (0.47) | | 1.71 |
| Less distributions: | | | | | | | | | |
| From net investment income | (0.31) | | (0.09) | | (0.08) | | (0.12) | | (0.16) |
| From net realized gain on investments | (0.03) | | (6.88) | | (0.32) | | (0.67) | | (2.07) |
| Total distributions | (0.34) | | (6.97) | | (0.40) | | (0.79) | | (2.23) |
| Net asset value at end of year | $ 26.95 | | $ 27.80 | | $ 36.71 | | $ 29.55 | | $ 30.81 |
| Total investment return (b) | (1.87)% | | (6.30)% | | 25.75% | | (1.51)% | | 6.03% |
| Ratios (to average net assets)/Supplemental Data: | | | | | | | | | |
| Net investment income (loss) | 1.06% | | 0.19% | | (0.20)% | | 0.23% | | 0.59% |
| Net expenses (c) | 2.07% | | 2.07% | | 2.10% | | 2.13% | | 2.08% |
| Expenses (before waiver/reimbursement) (c) | 2.16% | | 2.09% | | 2.12% | | 2.15% | | 2.10% |
| Portfolio turnover rate | 313% | | 290% | | 182% | | 217% | | 194% |
| Net assets at end of year (in 000’s) | $ 11,121 | | $ 17,020 | | $ 26,050 | | $ 30,769 | | $ 45,437 |
| (a) | Per share data based on average shares outstanding during the year. |
| (b) | Total investment return is calculated exclusive of sales charges and assumes the reinvestment of dividends and distributions. For periods of less than one year, total return is not annualized. |
| (c) | In addition to the fees and expenses which the Fund bears directly, it also indirectly bears a pro-rata share of the fees and expenses of the underlying funds in which it invests. Such indirect expenses are not included in the above expense ratios. |
The notes to the financial statements are an integral part of, and should be read in conjunction with, the financial statements.
25
Financial Highlights selected per share data and ratios
| | Year Ended October 31, |
| Class I | 2023 | | 2022 | | 2021 | | 2020 | | 2019 |
| Net asset value at beginning of year | $ 28.31 | | $ 37.19 | | $ 29.80 | | $ 31.06 | | $ 31.56 |
| Net investment income (loss) (a) | 0.66 | | 0.44 | | 0.37 | | 0.44 | | 0.53 |
| Net realized and unrealized gain (loss) | (0.81) | | (2.03) | | 7.70 | | (0.55) | | 1.57 |
| Total from investment operations | (0.15) | | (1.59) | | 8.07 | | (0.11) | | 2.10 |
| Less distributions: | | | | | | | | | |
| From net investment income | (0.69) | | (0.41) | | (0.36) | | (0.48) | | (0.53) |
| From net realized gain on investments | (0.03) | | (6.88) | | (0.32) | | (0.67) | | (2.07) |
| Total distributions | (0.72) | | (7.29) | | (0.68) | | (1.15) | | (2.60) |
| Net asset value at end of year | $ 27.44 | | $ 28.31 | | $ 37.19 | | $ 29.80 | | $ 31.06 |
| Total investment return (b) | (0.61)% | | (5.09)% | | 27.32% | | (0.27)% | | 7.32% |
| Ratios (to average net assets)/Supplemental Data: | | | | | | | | | |
| Net investment income (loss) | 2.30% | | 1.47% | | 1.08% | | 1.47% | | 1.75% |
| Net expenses (c) | 0.81% | | 0.81% | | 0.84% | | 0.88% | | 0.87% |
| Portfolio turnover rate | 313% | | 290% | | 182% | | 217% | | 194% |
| Net assets at end of year (in 000’s) | $ 53,113 | | $ 57,772 | | $ 72,481 | | $ 152,036 | | $ 177,076 |
| (a) | Per share data based on average shares outstanding during the year. |
| (b) | Total investment return is calculated exclusive of sales charges and assumes the reinvestment of dividends and distributions. Class I shares are not subject to sales charges. For periods of less than one year, total return is not annualized. |
| (c) | In addition to the fees and expenses which the Fund bears directly, it also indirectly bears a pro-rata share of the fees and expenses of the underlying funds in which it invests. Such indirect expenses are not included in the above expense ratios. |
| | Year Ended October 31, |
| Class R1 | 2023 | | 2022 | | 2021 | | 2020 | | 2019 |
| Net asset value at beginning of year | $ 28.26 | | $ 37.14 | | $ 29.76 | | $ 31.02 | | $ 31.52 |
| Net investment income (loss) (a) | 0.63 | | 0.41 | | 0.33 | | 0.49 | | 0.50 |
| Net realized and unrealized gain (loss) | (0.82) | | (2.03) | | 7.70 | | (0.63) | | 1.57 |
| Total from investment operations | (0.19) | | (1.62) | | 8.03 | | (0.14) | | 2.07 |
| Less distributions: | | | | | | | | | |
| From net investment income | (0.66) | | (0.38) | | (0.33) | | (0.45) | | (0.50) |
| From net realized gain on investments | (0.03) | | (6.88) | | (0.32) | | (0.67) | | (2.07) |
| Total distributions | (0.69) | | (7.26) | | (0.65) | | (1.12) | | (2.57) |
| Net asset value at end of year | $ 27.38 | | $ 28.26 | | $ 37.14 | | $ 29.76 | | $ 31.02 |
| Total investment return (b) | (0.70)% | | (5.23)% | | 27.20% | | (0.38)% | | 7.22% |
| Ratios (to average net assets)/Supplemental Data: | | | | | | | | | |
| Net investment income (loss) | 2.22% | | 1.37% | | 0.93% | | 1.60% | | 1.67% |
| Net expenses (c) | 0.91% | | 0.91% | | 0.94% | | 0.98% | | 0.97% |
| Portfolio turnover rate | 313% | | 290% | | 182% | | 217% | | 194% |
| Net assets at end of year (in 000’s) | $ 154 | | $ 176 | | $ 110 | | $ 78 | | $ 1,286 |
| (a) | Per share data based on average shares outstanding during the year. |
| (b) | Total investment return is calculated exclusive of sales charges and assumes the reinvestment of dividends and distributions. Class R1 shares are not subject to sales charges. For periods of less than one year, total return is not annualized. |
| (c) | In addition to the fees and expenses which the Fund bears directly, it also indirectly bears a pro-rata share of the fees and expenses of the underlying funds in which it invests. Such indirect expenses are not included in the above expense ratios. |
The notes to the financial statements are an integral part of, and should be read in conjunction with, the financial statements.
Financial Highlights selected per share data and ratios
| | Year Ended October 31, |
| Class R2 | 2023 | | 2022 | | 2021 | | 2020 | | 2019 |
| Net asset value at beginning of year | $ 28.26 | | $ 37.13 | | $ 29.77 | | $ 31.02 | | $ 31.53 |
| Net investment income (loss) (a) | 0.56 | | 0.33 | | 0.24 | | 0.34 | | 0.42 |
| Net realized and unrealized gain (loss) | (0.81) | | (2.02) | | 7.69 | | (0.55) | | 1.56 |
| Total from investment operations | (0.25) | | (1.69) | | 7.93 | | (0.21) | | 1.98 |
| Less distributions: | | | | | | | | | |
| From net investment income | (0.58) | | (0.30) | | (0.25) | | (0.37) | | (0.42) |
| From net realized gain on investments | (0.03) | | (6.88) | | (0.32) | | (0.67) | | (2.07) |
| Total distributions | (0.61) | | (7.18) | | (0.57) | | (1.04) | | (2.49) |
| Net asset value at end of year | $ 27.40 | | $ 28.26 | | $ 37.13 | | $ 29.77 | | $ 31.02 |
| Total investment return (b) | (0.94)% | | (5.45)% | | 26.89% | | (0.60)% | | 6.95% |
| Ratios (to average net assets)/Supplemental Data: | | | | | | | | | |
| Net investment income (loss) | 1.97% | | 1.09% | | 0.69% | | 1.14% | | 1.40% |
| Net expenses (c) | 1.16% | | 1.16% | | 1.19% | | 1.23% | | 1.22% |
| Portfolio turnover rate | 313% | | 290% | | 182% | | 217% | | 194% |
| Net assets at end of year (in 000’s) | $ 467 | | $ 651 | | $ 1,128 | | $ 1,693 | | $ 2,882 |
| (a) | Per share data based on average shares outstanding during the year. |
| (b) | Total investment return is calculated exclusive of sales charges and assumes the reinvestment of dividends and distributions. Class R2 shares are not subject to sales charges. For periods of less than one year, total return is not annualized. |
| (c) | In addition to the fees and expenses which the Fund bears directly, it also indirectly bears a pro-rata share of the fees and expenses of the underlying funds in which it invests. Such indirect expenses are not included in the above expense ratios. |
| | Year Ended October 31, |
| Class R3 | 2023 | | 2022 | | 2021 | | 2020 | | 2019 |
| Net asset value at beginning of year | $ 28.12 | | $ 37.03 | | $ 29.70 | | $ 30.95 | | $ 31.45 |
| Net investment income (loss) (a) | 0.48 | | 0.26 | | 0.16 | | 0.26 | | 0.35 |
| Net realized and unrealized gain (loss) | (0.80) | | (2.04) | | 7.68 | | (0.55) | | 1.56 |
| Total from investment operations | (0.32) | | (1.78) | | 7.84 | | (0.29) | | 1.91 |
| Less distributions: | | | | | | | | | |
| From net investment income | (0.52) | | (0.25) | | (0.19) | | (0.29) | | (0.34) |
| From net realized gain on investments | (0.03) | | (6.88) | | (0.32) | | (0.67) | | (2.07) |
| Total distributions | (0.55) | | (7.13) | | (0.51) | | (0.96) | | (2.41) |
| Net asset value at end of year | $ 27.25 | | $ 28.12 | | $ 37.03 | | $ 29.70 | | $ 30.95 |
| Total investment return (b) | (1.20)% | | (5.72)% | | 26.59% | | (0.88)% | | 6.68% |
| Ratios (to average net assets)/Supplemental Data: | | | | | | | | | |
| Net investment income (loss) | 1.71% | | 0.87% | | 0.45% | | 0.86% | | 1.15% |
| Net expenses (c) | 1.41% | | 1.41% | | 1.44% | | 1.48% | | 1.47% |
| Portfolio turnover rate | 313% | | 290% | | 182% | | 217% | | 194% |
| Net assets at end of year (in 000’s) | $ 1,871 | | $ 1,925 | | $ 2,290 | | $ 2,252 | | $ 3,048 |
| (a) | Per share data based on average shares outstanding during the year. |
| (b) | Total investment return is calculated exclusive of sales charges and assumes the reinvestment of dividends and distributions. Class R3 shares are not subject to sales charges. For periods of less than one year, total return is not annualized. |
| (c) | In addition to the fees and expenses which the Fund bears directly, it also indirectly bears a pro-rata share of the fees and expenses of the underlying funds in which it invests. Such indirect expenses are not included in the above expense ratios. |
The notes to the financial statements are an integral part of, and should be read in conjunction with, the financial statements.
27
Financial Highlights selected per share data and ratios
| | Year Ended October 31, |
| Class R6 | 2023 | | 2022 | | 2021 | | 2020 | | 2019 |
| Net asset value at beginning of year | $ 28.35 | | $ 37.23 | | $ 29.83 | | $ 31.06 | | $ 31.57 |
| Net investment income (loss) (a) | 0.69 | | 0.46 | | 0.39 | | 0.61 | | 0.53 |
| Net realized and unrealized gain (loss) | (0.83) | | (2.03) | | 7.73 | | (0.69) | | 1.59 |
| Total from investment operations | (0.14) | | (1.57) | | 8.12 | | (0.08) | | 2.12 |
| Less distributions: | | | | | | | | | |
| From net investment income | (0.71) | | (0.43) | | (0.40) | | (0.48) | | (0.56) |
| From net realized gain on investments | (0.03) | | (6.88) | | (0.32) | | (0.67) | | (2.07) |
| Total distributions | (0.74) | | (7.31) | | (0.72) | | (1.15) | | (2.63) |
| Net asset value at end of year | $ 27.47 | | $ 28.35 | | $ 37.23 | | $ 29.83 | | $ 31.06 |
| Total investment return (b) | (0.51)% | | (5.04)% | | 27.45% | | (0.17)% | | 7.40% |
| Ratios (to average net assets)/Supplemental Data: | | | | | | | | | |
| Net investment income (loss) | 2.40% | | 1.55% | | 1.12% | | 1.94% | | 1.75% |
| Net expenses (c) | 0.72% | | 0.73% | | 0.74% | | 0.78% | | 0.77% |
| Portfolio turnover rate | 313% | | 290% | | 182% | | 217% | | 194% |
| Net assets at end of year (in 000’s) | $ 52 | | $ 53 | | $ 61 | | $ 49 | | $ 14,697 |
| (a) | Per share data based on average shares outstanding during the year. |
| (b) | Total investment return is calculated exclusive of sales charges and assumes the reinvestment of dividends and distributions. Class R6 shares are not subject to sales charges. For periods of less than one year, total return is not annualized. |
| (c) | In addition to the fees and expenses which the Fund bears directly, it also indirectly bears a pro-rata share of the fees and expenses of the underlying funds in which it invests. Such indirect expenses are not included in the above expense ratios. |
The notes to the financial statements are an integral part of, and should be read in conjunction with, the financial statements.
Notes to Financial Statements
Note 1-Organization and Business
MainStay Funds Trust (the “Trust”) was organized as a Delaware statutory trust on April 28, 2009. The Trust is registered under the Investment Company Act of 1940, as amended (the “1940 Act”), as an open-end management investment company, and is comprised of thirty-seven funds (collectively referred to as the “Funds”). These financial statements and notes relate to the MainStay Balanced Fund (the "Fund"), a “diversified” fund, as that term is defined in the 1940 Act, as interpreted or modified by regulatory authorities having jurisdiction, from time to time.
The following table lists the Fund's share classes that have been registered and commenced operations:
| Class | Commenced Operations |
| Class A | January 2, 2004 |
| Investor Class | February 28, 2008 |
| Class B | January 2, 2004 |
| Class C | December 30, 2002 |
| Class I | May 1, 1989 |
| Class R1* | January 2, 2004 |
| Class R2* | January 2, 2004 |
| Class R3* | April 28, 2006 |
| Class R6 | December 15, 2017 |
| * | As of October 31, 2023, Class R1, Class R2 and Class R3 shares are closed to new investors and, upon the close of business on December 29, 2023, Class R1, Class R2 and Class R3 shares are closed to additional investments by existing shareholders. Additionally, Class R1, Class R2 and Class R3 shares will be liquidated on or about February 28, 2024 (the "Liquidation Date"). It is expected that the Fund will distribute to remaining shareholders invested in Class R1, Class R2 or Class R3 shares, on or promptly after the Liquidation Date, a liquidating distribution in cash or cash equivalents equal to the net asset value of such shares. |
Class B shares of the MainStay Group of Funds are closed to all new purchases as well as additional investments by existing Class B shareholders. Existing Class B shareholders may continue to reinvest dividends and capital gains distributions, as well as exchange their Class B shares for Class B shares of other funds in the MainStay Group of Funds as permitted by the current exchange privileges. Class B shareholders continue to be subject to any applicable contingent deferred sales charge ("CDSC") at the time of redemption. All other features of the Class B shares, including but not limited to the fees and expenses applicable to Class B shares, remain unchanged. Unless redeemed, Class B shareholders will remain in Class B shares of their respective fund until the Class B shares are converted to Class A or Investor Class shares pursuant to the applicable conversion schedule.
Class A and Investor Class shares are offered at net asset value (“NAV”) per share plus an initial sales charge. No initial sales charge applies to investments of $250,000 or more (and certain other qualified purchases) in Class A and Investor Class shares. However, a CDSC of 1.00% may be imposed on certain redemptions made within 18 months of the date of purchase on shares that were purchased without an initial sales charge. Class C shares are offered at NAV without an initial sales charge, although a 1.00% CDSC may be imposed on certain redemptions of such
shares made within one year of the date of purchase of Class C shares. When Class B shares were offered, they were offered at NAV without an initial sales charge, although a CDSC that declines depending on the number of years a shareholder held its Class B shares may be imposed on certain redemptions of such shares made within six years of the date of purchase of such shares. Class I, Class R1, Class R2, Class R3 and Class R6 shares are offered at NAV without a sales charge. Depending upon eligibility, Class B shares convert to either Class A or Investor Class shares at the end of the calendar quarter eight years after the date they were purchased. In addition, depending upon eligibility, Class C shares convert to either Class A or Investor Class shares at the end of the calendar quarter ten years after the date they were purchased. Additionally, Investor Class shares may convert automatically to Class A shares. Under certain circumstances and as may be permitted by the Trust’s multiple class plan pursuant to Rule 18f-3 under the 1940 Act, specified share classes of the Fund may be converted to one or more other share classes of the Fund as disclosed in the capital share transactions within these Notes. The classes of shares have the same voting (except for issues that relate solely to one class), dividend, liquidation and other rights, and the same terms and conditions, except that under distribution plans pursuant to Rule 12b-1 under the 1940 Act, Class B and Class C shares are subject to higher distribution and/or service fees than Class A, Investor Class, Class R2 and Class R3 shares. Class I, Class R1 and Class R6 shares are not subject to a distribution and/or service fees. Class R1, Class R2 and Class R3 shares are subject to a shareholder service fee, which is in addition to any fees paid under the distribution plans for Class R2 and Class R3 shares.
At a meeting held on September 25-26, 2023, the Board of Trustees (the “Board”) of the Trust, after careful consideration of a number of factors and upon the recommendation of the Fund’s investment adviser, New York Life Investment Management LLC (“New York Life Investments” or the "Manager"), approved a proposal to liquidate Class R1, Class R2 and Class R3 shares of the Fund on or about February 28, 2024, pursuant to the terms of a plan of liquidation.
The Fund's investment objective is to seek total return.
Note 2–Significant Accounting Policies
The Fund is an investment company and accordingly follows the investment company accounting and reporting guidance of the Financial Accounting Standards Board (“FASB”) Accounting Standards Codification Topic 946 Financial Services—Investment Companies. The Fund prepares its financial statements in accordance with generally accepted accounting principles (“GAAP”) in the United States of America and follows the significant accounting policies described below.
(A) Securities Valuation. Investments are usually valued as of the close of regular trading on the New York Stock Exchange (the "Exchange") (usually 4:00 p.m. Eastern time) on each day the Fund is open for business ("valuation date").
Notes to Financial Statements (continued)
Pursuant to Rule 2a-5 under the 1940 Act, the Board has designated New York Life Investments as its Valuation Designee (the "Valuation Designee"). The Valuation Designee is responsible for performing fair valuations relating to all investments in the Fund’s portfolio for which market quotations are not readily available; periodically assessing and managing material valuation risks; establishing and applying fair value methodologies; testing fair valuation methodologies; evaluating and overseeing pricing services; ensuring appropriate segregation of valuation and portfolio management functions; providing quarterly, annual and prompt reporting to the Board, as appropriate; identifying potential conflicts of interest; and maintaining appropriate records. The Valuation Designee has established a valuation committee ("Valuation Committee") to assist in carrying out the Valuation Designee’s responsibilities and establish prices of securities for which market quotations are not readily available. The Fund's and the Valuation Designee's policies and procedures ("Valuation Procedures") govern the Valuation Designee’s selection and application of methodologies for determining and calculating the fair value of Fund investments. The Valuation Designee may value the Fund's portfolio securities for which market quotations are not readily available and other Fund assets utilizing inputs from pricing services and other third-party sources. The Valuation Committee meets (in person, via electronic mail or via teleconference) on an ad-hoc basis to determine fair valuations and on a quarterly basis to review fair value events with respect to certain securities for which market quotations are not readily available, including valuation risks and back-testing results, and preview reports to the Board.
The Valuation Committee establishes prices of securities for which market quotations are not readily available based on such methodologies and measurements on a regular basis after considering information that is reasonably available and deemed relevant by the Valuation Committee. The Board shall oversee the Valuation Designee and review fair valuation materials on a prompt, quarterly and annual basis and approve proposed revisions to the Valuation Procedures.
Investments for which market quotations are not readily available are valued at fair value as determined in good faith pursuant to the Valuation Procedures. A market quotation is readily available only when that quotation is a quoted price (unadjusted) in active markets for identical investments that the Fund can access at the measurement date, provided that a quotation will not be readily available if it is not reliable. "Fair value" is defined as the price the Fund would reasonably expect to receive upon selling an asset or liability in an orderly transaction to an independent buyer in the principal or most advantageous market for the asset or liability. Fair value measurements are determined within a framework that establishes a three-tier hierarchy that maximizes the use of observable market data and minimizes the use of unobservable inputs to establish a classification of fair value measurements for disclosure purposes. "Inputs" refer broadly to the assumptions that market participants would use in pricing the asset or liability, including assumptions about risk, such as the risk inherent in a particular valuation technique used to measure fair value using a pricing model and/or the risk inherent in the inputs for the valuation technique. Inputs may be observable or unobservable.
Observable inputs reflect the assumptions market participants would use in pricing the asset or liability based on market data obtained from sources independent of the Fund. Unobservable inputs reflect the Fund’s own assumptions about the assumptions market participants would use in pricing the asset or liability based on the information available. The inputs or methodology used for valuing assets or liabilities may not be an indication of the risks associated with investing in those assets or liabilities. The three-tier hierarchy of inputs is summarized below.
| • | Level 1—quoted prices (unadjusted) in active markets for an identical asset or liability |
| • | Level 2—other significant observable inputs (including quoted prices for a similar asset or liability in active markets, interest rates and yield curves, prepayment speeds, credit risk, etc.) |
| • | Level 3—significant unobservable inputs (including the Fund's own assumptions about the assumptions that market participants would use in measuring fair value of an asset or liability) |
The level of an asset or liability within the fair value hierarchy is based on the lowest level of an input, both individually and in the aggregate, that is significant to the fair value measurement. The aggregate value by input level of the Fund’s assets and liabilities as of October 31, 2023, is included at the end of the Portfolio of Investments.
The Fund may use third-party vendor evaluations, whose prices may be derived from one or more of the following standard inputs, among others:
| • Benchmark yields | • Reported trades |
| • Broker/dealer quotes | • Issuer spreads |
| • Two-sided markets | • Benchmark securities |
| • Bids/offers | • Reference data (corporate actions or material event notices) |
| • Industry and economic events | • Comparable bonds |
| • Monthly payment information | |
An asset or liability for which a market quotation is not readily available is valued by methods deemed reasonable in good faith by the Valuation Committee, following the Valuation Procedures to represent fair value. Under these procedures, the Valuation Designee generally uses a market-based approach which may use related or comparable assets or liabilities, recent transactions, market multiples, book values and other relevant information. The Valuation Designee may also use an income-based valuation approach in which the anticipated future cash flows of the asset or liability are discounted to calculate fair value. Discounts may also be applied due to the nature and/or duration of any restrictions on the disposition of the asset or liability. Fair value represents a good faith approximation of the value of a security. Fair value determinations involve the consideration of a number of subjective factors, an analysis of applicable facts and circumstances and the exercise of judgment. As a result, it is possible that the fair value for a security determined in good faith in accordance with the Valuation Procedures may differ from valuations for the same security determined for other funds using their own valuation procedures. Although the
Valuation Procedures are designed to value a security at the price the Fund may reasonably expect to receive upon the security's sale in an orderly transaction, there can be no assurance that any fair value determination thereunder would, in fact, approximate the amount that the Fund would actually realize upon the sale of the security or the price at which the security would trade if a reliable market price were readily available. During the year ended October 31, 2023, there were no material changes to the fair value methodologies.
Securities which may be valued in this manner include, but are not limited to: (i) a security for which trading has been halted or suspended or otherwise does not have a readily available market quotation on a given day; (ii) a debt security that has recently gone into default and for which there is not a current market quotation; (iii) a security of an issuer that has entered into a restructuring; (iv) a security that has been delisted from a national exchange; (v) a security subject to trading collars for which no or limited trading takes place; and (vi) a security whose principal market has been temporarily closed at a time when, under normal conditions, it would be open. Securities valued in this manner are generally categorized as Level 2 or 3 in the hierarchy. No securities held by the Fund as of October 31, 2023, were fair valued in such a manner.
Equity securities, rights and warrants, if applicable, are valued at the last quoted sales prices as of the close of regular trading on the relevant exchange on each valuation date. Securities that are not traded on the valuation date are valued at the mean of the last quoted bid and ask prices. Prices are normally taken from the principal market in which each security trades. These securities are generally categorized as Level 1 in the hierarchy.
Exchange-traded funds (“ETFs”) are valued at the last quoted sales prices as of the close of regular trading on the relevant exchange on each valuation date. Securities that are not traded on the valuation date are valued at the mean of the last quoted bid and ask prices. Prices are normally taken from the principal market in which each security trades. These securities are generally categorized as Level 1 in the hierarchy.
Investments in mutual funds, including money market funds, are valued at their respective NAVs at the close of business each day on the valuation date. These securities are generally categorized as Level 1 in the hierarchy.
Futures contracts are valued at the last posted settlement price on the market where such futures are primarily traded. These securities are generally categorized as Level 1 in the hierarchy.
Debt securities (other than convertible and municipal bonds) are valued at the evaluated bid prices (evaluated mean prices in the case of convertible and municipal bonds) supplied by a pricing agent or broker selected by the Valuation Designee, in consultation with the Subadvisors. The evaluations are market-based measurements processed through a pricing application and represents the pricing agent’s good faith determination as to what a holder may receive in an orderly transaction under market conditions. The rules-based logic utilizes valuation techniques that reflect participants’ assumptions and vary by asset class and per methodology,
maximizing the use of relevant observable data including quoted prices for similar assets, benchmark yield curves and market corroborated inputs. The evaluated bid or mean prices are deemed by the Valuation Designee, in consultation with the Subadvisors, to be representative of market values at the regular close of trading of the Exchange on each valuation date. Debt securities purchased on a delayed delivery basis are marked to market daily until settlement at the forward settlement date. Debt securities, including corporate bonds, U.S. government and federal agency bonds, municipal bonds, foreign bonds, convertible bonds, asset-backed securities and mortgage-backed securities are generally categorized as Level 2 in the hierarchy.
Temporary cash investments acquired in excess of 60 days to maturity at the time of purchase are valued using the latest bid prices or using valuations based on a matrix system (which considers such factors as security prices, yields, maturities and ratings), both as furnished by independent pricing services. Temporary cash investments that mature in 60 days or less at the time of purchase ("Short-Term Investments") are valued using the amortized cost method of valuation, unless the use of such method would be inappropriate. The amortized cost method involves valuing a security at its cost on the date of purchase and thereafter assuming a constant amortization to maturity of the difference between such cost and the value on maturity date. Amortized cost approximates the current fair value of a security. Securities valued using the amortized cost method are not valued using quoted prices in an active market and are generally categorized as Level 2 in the hierarchy.
The information above is not intended to reflect an exhaustive list of the methodologies that may be used to value portfolio investments. The Valuation Procedures permit the use of a variety of valuation methodologies in connection with valuing portfolio investments. The methodology used for a specific type of investment may vary based on the market data available or other considerations. The methodologies summarized above may not represent the specific means by which portfolio investments are valued on any particular business day.
(B) Income Taxes. The Fund's policy is to comply with the requirements of the Internal Revenue Code of 1986, as amended (the “Internal Revenue Code”), applicable to regulated investment companies and to distribute all of its taxable income to the shareholders of the Fund within the allowable time limits.
The Manager evaluates the Fund’s tax positions to determine if the tax positions taken meet the minimum recognition threshold in connection with accounting for uncertainties in income tax positions taken or expected to be taken for the purposes of measuring and recognizing tax liabilities in the financial statements. Recognition of tax benefits of an uncertain tax position is permitted only to the extent the position is “more likely than not” to be sustained assuming examination by taxing authorities. The Manager analyzed the Fund's tax positions taken on federal, state and local income tax returns for all open tax years (for up to three tax years) and has concluded that no provisions for federal, state and local income tax are required in the Fund's financial statements. The Fund's federal, state and local income tax and federal excise tax returns
Notes to Financial Statements (continued)
for tax years for which the applicable statutes of limitations have not expired are subject to examination by the Internal Revenue Service and state and local departments of revenue.
(C) Dividends and Distributions to Shareholders. Dividends and distributions are recorded on the ex-dividend date. The Fund intends to declare and pay dividends from net investment income, if any, at least quarterly and distributions from net realized capital and currency gains, if any, at least annually. Unless a shareholder elects otherwise, all dividends and distributions are reinvested at NAV in the same class of shares of the Fund. Dividends and distributions to shareholders are determined in accordance with federal income tax regulations and may differ from determinations using GAAP.
(D) Security Transactions and Investment Income. The Fund records security transactions on the trade date. Realized gains and losses on security transactions are determined using the identified cost method. Dividend income is recognized on the ex-dividend date, net of any foreign tax withheld at the source, and interest income is accrued as earned using the effective interest rate method. Distributions received from real estate investment trusts may be classified as dividends, capital gains and/or return of capital. Discounts and premiums on securities purchased for the Fund are accreted and amortized, respectively, on the effective interest rate method.
Investment income and realized and unrealized gains and losses on investments of the Fund are allocated pro rata to the separate classes of shares based upon their relative net assets on the date the income is earned or realized and unrealized gains and losses are incurred.
The Fund may place a debt security on non-accrual status and reduce related interest income by ceasing current accruals and writing off all or a portion of any interest receivables when the collection of all or a portion of such interest has become doubtful. A debt security is removed from non-accrual status when the issuer resumes interest payments or when collectability of interest is reasonably assured.
(E) Expenses. Expenses of the Trust are allocated to the individual Funds in proportion to the net assets of the respective Funds when the expenses are incurred, except where direct allocations of expenses can be made. Expenses (other than transfer agent expenses and fees incurred under the shareholder services plans and/or the distribution plans further discussed in Note 3(B)) are allocated to separate classes of shares pro rata based upon their relative net assets on the date the expenses are incurred. The expenses borne by the Fund, including those of related parties to the Fund, are shown in the Statement of Operations.
Additionally, the Fund may invest in ETFs and mutual funds, which are subject to management fees and other fees that may cause the costs of investing in ETFs and mutual funds to be greater than the costs of owning the underlying securities directly. These indirect expenses of ETFs and mutual funds are not included in the amounts shown as expenses in the Statement of Operations or in the expense ratios included in the Financial Highlights.
(F) Use of Estimates. In preparing financial statements in conformity with GAAP, the Manager makes estimates and assumptions that affect the reported amounts and disclosures in the financial statements. Actual results could differ from those estimates and assumptions.
(G) Futures Contracts. A futures contract is an agreement to purchase or sell a specified quantity of an underlying instrument at a specified future date and price, or to make or receive a cash payment based on the value of a financial instrument (e.g., foreign currency, interest rate, security or securities index). The Fund is subject to risks such as market price risk, leverage risk, liquidity risk, counterparty risk, operational risk, legal risk and/or interest rate risk in the normal course of investing in these contracts. Upon entering into a futures contract, the Fund is required to pledge to the broker or futures commission merchant an amount of cash and/or U.S. government securities equal to a certain percentage of the collateral amount, known as the “initial margin.” During the period the futures contract is open, changes in the value of the contract are recognized as unrealized appreciation or depreciation by marking to market such contract on a daily basis to reflect the market value of the contract at the end of each day’s trading. The Fund agrees to receive from or pay to the broker or futures commission merchant an amount of cash equal to the daily fluctuation in the value of the contract. Such receipts or payments are known as “variation margin.” When the futures contract is closed, the Fund records a realized gain or loss equal to the difference between the proceeds from (or cost of) the closing transaction and the Fund's basis in the contract.
The use of futures contracts involves, to varying degrees, elements of market risk in excess of the amount recognized in the Statement of Assets and Liabilities. The contract or notional amounts and variation margin reflect the extent of the Fund's involvement in open futures positions. There are several risks associated with the use of futures contracts as hedging techniques. There can be no assurance that a liquid market will exist at the time when the Fund seeks to close out a futures contract. If no liquid market exists, the Fund would remain obligated to meet margin requirements until the position is closed. Futures contracts may involve a small initial investment relative to the risk assumed, which could result in losses greater than if the Fund did not invest in futures contracts. Futures contracts may be more volatile than direct investments in the instrument underlying the futures and may not correlate to the underlying instrument, causing a given hedge not to achieve its objectives. The Fund's activities in futures contracts have minimal counterparty risk as they are conducted through regulated exchanges that guarantee the futures against default by the counterparty. In the event of a bankruptcy or insolvency of a futures commission merchant that holds margin on behalf of the Fund, the Fund may not be entitled to the return of the entire margin owed to the Fund, potentially resulting in a loss. The Fund may invest in futures contracts to seek enhanced returns or to reduce the risk of loss by hedging certain of its holdings. The Fund's investment in futures contracts and other derivatives may increase the volatility of the Fund's NAVs and may result in a loss to the Fund. Open futures contracts as of October 31, 2023, are shown in the Portfolio of Investments.
(H) Foreign Currency Transactions. The Fund's books and records are maintained in U.S. dollars. Prices of securities denominated in foreign currency amounts are translated into U.S. dollars at the mean between the buying and selling rates last quoted by any major U.S. bank at the following dates:
(i) market value of investment securities, other assets and liabilities— at the valuation date; and
(ii) purchases and sales of investment securities, income and expenses—at the date of such transactions.
The assets and liabilities that are denominated in foreign currency amounts are presented at the exchange rates and market values at the close of the period. The realized and unrealized changes in net assets arising from fluctuations in exchange rates and market prices of securities are not separately presented.
Net realized gain (loss) on foreign currency transactions represents net currency gains or losses realized as a result of differences between the amounts of securities sale proceeds or purchase cost, dividends, interest and withholding taxes as recorded on the Fund's books, and the U.S. dollar equivalent amount actually received or paid. Net currency gains or losses from valuing such foreign currency denominated assets and liabilities, other than investments at valuation date exchange rates, are reflected in unrealized foreign exchange gains or losses.
(I) Securities Lending. In order to realize additional income, the Fund may engage in securities lending, subject to the limitations set forth in the 1940 Act and relevant guidance by the staff of the Securities and Exchange Commission (“SEC”). If the Fund engages in securities lending, the Fund will lend through its custodian, JPMorgan Chase Bank, N.A., ("JPMorgan"), acting as securities lending agent on behalf of the Fund. Under the current arrangement, JPMorgan will manage the Fund's collateral in accordance with the securities lending agency agreement between the Fund and JPMorgan, and indemnify the Fund against counterparty risk. The loans will be collateralized by cash (which may be invested in a money market fund) and/or non-cash collateral (which may include U.S. Treasury securities and/or U.S. government agency securities issued or guaranteed by the United States government or its agencies or instrumentalities) at least equal at all times to the market value of the securities loaned. Non-cash collateral held at year end is segregated and cannot be transferred by the Fund. The Fund bears the risk of delay in recovery of, or loss of rights in, the securities loaned. The Fund may also record a realized gain or loss on securities deemed sold due to a borrower’s inability to return securities on loan. The Fund bears the risk of any loss on investment of cash collateral. The Fund will receive compensation for lending its securities in the form of fees or it will retain a portion of interest earned on the investment of any cash collateral. The Fund will also continue to receive interest and dividends on the securities loaned and any gain or loss in the market price of the securities loaned that may occur during the term of the loan will be for the account of the Fund. Income earned from securities lending activities, if any, is reflected
in the Statement of Operations. Securities on loan as of October 31, 2023, are shown in the Portfolio of Investments.
(J) Debt Securities Risk. The ability of issuers of debt securities held by the Fund to meet their obligations may be affected by, among other things, economic or political developments in a specific country, industry or region. Debt securities are also subject to the risks associated with changes in interest rates.
Investments in the Fund are not guaranteed, even though some of the Fund’s underlying investments are guaranteed by the U.S. government or its agencies or instrumentalities. The principal risk of mortgage-related and asset-backed securities is that the underlying debt may be prepaid ahead of schedule, if interest rates fall, thereby reducing the value of the Fund’s investment. If interest rates rise, less of the debt may be prepaid and the Fund may lose money because the Fund may be unable to invest in higher yielding assets. The Fund is subject to interest-rate risk and can lose principal value when interest rates rise. Bonds are also subject to credit risk, in which the bond issuer may fail to pay interest and principal in a timely manner.
The Fund may invest in foreign debt securities, which carry certain risks that are in addition to the usual risks inherent in domestic instruments. Foreign regulatory regimes and securities markets can have less stringent investor protections and disclosure standards and less liquid trading markets than U.S. regulatory regimes and securities markets, and can experience political, social and economic developments that may affect the value of investments in foreign securities. These risks include those resulting from currency fluctuations, future adverse political or economic developments and possible imposition of currency exchange blockages or other foreign governmental laws or restrictions. Economic sanctions and other similar governmental actions or developments could, among other things, effectively restrict or eliminate the Fund’s ability to purchase or sell certain foreign securities or groups of foreign securities, and thus may make the Fund’s investments in such securities less liquid or more difficult to value. These risks are likely to be greater in emerging markets than in developed markets.
(K) Indemnifications. Under the Trust’s organizational documents, its officers and trustees are indemnified against certain liabilities that may arise out of performance of their duties to the Trust. Additionally, in the normal course of business, the Fund enters into contracts with third-party service providers that contain a variety of representations and warranties and that may provide general indemnifications. The Fund's maximum exposure under these arrangements is unknown, as this would involve future claims that may be made against the Fund that have not yet occurred. The Manager believes that the risk of loss in connection with these potential indemnification obligations is remote. However, there can be no assurance that material liabilities related to such obligations will not arise in the future, which could adversely impact the Fund.
Notes to Financial Statements (continued)
(L) Quantitative Disclosure of Derivative Holdings. The following tables show additional disclosures related to the Fund's derivative and hedging activities, including how such activities are accounted for and their effect on the Fund's financial positions, performance and cash flows.
The Fund entered into futures contracts to hedge against anticipated changes in interest rates that might otherwise have an adverse effect upon the value of the Fund’s securities as well as to help manage the duration and yield curve positioning of the portfolio.
Fair value of derivative instruments as of October 31, 2023:
| Asset Derivatives | Interest
Rate
Contracts
Risk | Total |
| Futures Contracts - Net Assets—Net unrealized appreciation on futures contracts (a) | $197,105 | $197,105 |
| Total Fair Value | $197,105 | $197,105 |
| (a) | Includes cumulative appreciation (depreciation) of futures contracts as reported in the Portfolio of Investments. Only current day’s variation margin is reported within the Statement of Assets and Liabilities. |
| Liability Derivatives | Interest
Rate
Contracts
Risk | Total |
| Futures Contracts - Net Assets—Net unrealized depreciation on futures contracts (a) | $(362,385) | $(362,385) |
| Total Fair Value | $(362,385) | $(362,385) |
| (a) | Includes cumulative appreciation (depreciation) of futures contracts as reported in the Portfolio of Investments. Only current day’s variation margin is reported within the Statement of Assets and Liabilities. |
The effect of derivative instruments on the Statement of Operations for the year ended October 31, 2023:
| Net Realized Gain (Loss) from: | Interest
Rate
Contracts
Risk | Total |
| Futures Transactions | $(642,945) | $(642,945) |
| Total Net Realized Gain (Loss) | $(642,945) | $(642,945) |
| Net Change in Unrealized Appreciation (Depreciation) | Interest
Rate
Contracts
Risk | Total |
| Futures Contracts | $66,362 | $66,362 |
| Total Net Change in Unrealized Appreciation (Depreciation) | $66,362 | $66,362 |
| Average Notional Amount | Total |
| Futures Contracts Long | $18,993,751 |
| Futures Contracts Short | $ (6,886,988) |
Note 3–Fees and Related Party Transactions
(A) Manager and Subadvisors. New York Life Investments, a registered investment adviser and an indirect, wholly-owned subsidiary of New York Life Insurance Company ("New York Life"), serves as the Fund’s Manager, pursuant to an Amended and Restated Management Agreement (“Management Agreement”). The Manager provides offices, conducts clerical, recordkeeping and bookkeeping services and keeps most of the financial and accounting records required to be maintained by the Fund. Except for the portion of salaries and expenses that are the responsibility of the Fund, the Manager pays the salaries and expenses of all personnel affiliated with the Fund and certain operational expenses of the Fund. The Fund reimburses New York Life Investments in an amount equal to the portion of the compensation of the Chief Compliance Officer attributable to the Fund. The Fund’s subadvisor changed effective March 5, 2021 due to the removal of MacKay Shields LLC ("MacKay Shields") as a subadvisor to the equity portion of the Fund and the appointment of Wellington Management Company LLP (“Wellington” or the “Subadvisor”) as a subadvisor to the equity portion of the Fund. Wellington, a registered investment adviser, is responsible for the day-to-day portfolio management of the equity portion of the Fund, pursuant to the terms of a Subadvisory Agreement (a “Subadvisory Agreement”) between New York Life Investments and Wellington. NYL Investors LLC (“NYL Investors” or the “Subadvisor,” and, together with Wellington, the “Subadvisors”), a registered investment adviser and a direct, wholly-owned subsidiary of New York Life, serves as the Subadvisor to the Fund and is responsible for the day-to-day portfolio management of the fixed-income portion of the Fund, pursuant to the terms of a Subadvisory Agreement between New York Life Investments and NYL Investors. New York Life Investments pays for the services of the Subadvisors.
Under the Management Agreement, the Fund pays the Manager a monthly fee for the services performed and the facilities furnished at an annual rate of the Fund’s average daily net assets as follows: 0.65% up to $1 billion; 0.625% from $1 billion to $2 billion; and 0.60% in excess of $2 billion. During the year ended October 31, 2023, the effective management fee rate was 0.65% of the Fund’s average daily net assets, exclusive of any applicable waivers/reimbursements.
New York Life Investments has contractually agreed to waive fees and/or reimburse expenses so that Total Annual Fund Operating Expenses (excluding taxes, interest, litigation, extraordinary expenses, brokerage and other transaction expenses relating to the purchase or sale of portfolio investments and acquired (underlying) fund fees and expenses) of Class R6 do not exceed those of Class I. This agreement will remain in effect until February 28, 2024, and shall renew automatically for one-year terms unless New York Life Investments provides written notice of termination prior to the start of the next term or upon approval of the Board.
During the year ended October 31, 2023, New York Life Investments earned fees from the Fund in the amount of $3,061,694 and waived fees and/or reimbursed expenses, including the voluntary waiver/reimbursement of certain class specific expenses in the amount of
$57,114 and paid Wellington and NYL Investors $726,215 and $535,963, respectively.
JPMorgan provides sub-administration and sub-accounting services to the Fund pursuant to an agreement with New York Life Investments. These services include calculating the daily NAVs of the Fund, maintaining the general ledger and sub-ledger accounts for the calculation of the Fund's NAVs, and assisting New York Life Investments in conducting various aspects of the Fund's administrative operations. For providing these services to the Fund, JPMorgan is compensated by New York Life Investments.
Pursuant to an agreement between the Trust and New York Life Investments, New York Life Investments is responsible for providing or procuring certain regulatory reporting services for the Fund. The Fund will reimburse New York Life Investments for the actual costs incurred by New York Life Investments in connection with providing or procuring these services for the Fund.
(B) Distribution and Service Fees. The Trust, on behalf of the Fund, has entered into a distribution agreement with NYLIFE Distributors LLC (the “Distributor”), an affiliate of New York Life Investments. The Fund has adopted distribution plans (the “Plans”) in accordance with the provisions of Rule 12b-1 under the 1940 Act.
Pursuant to the Class A, Investor Class and Class R2 Plans, the Distributor receives a monthly fee from the Class A, Investor Class and Class R2 shares at an annual rate of 0.25% of the average daily net assets of the Class A, Investor Class and Class R2 shares for distribution and/or service activities as designated by the Distributor. Pursuant to the Class B and Class C Plans, Class B and Class C shares pay the Distributor a monthly distribution fee at an annual rate of 0.75% of the average daily net assets of the Class B and Class C shares, along with a service fee at an annual rate of 0.25% of the average daily net assets of the Class B and Class C shares, for a total 12b-1 fee of 1.00%. Pursuant to the Class R3 Plan, Class R3 shares pay the Distributor a monthly distribution fee at an annual rate of 0.25% of the average daily net assets of the Class R3 shares, along with a service fee at an annual rate of 0.25% of the average daily net assets of the Class R3 shares, for a total 12b-1 fee of 0.50%. Class I, Class R1 and Class R6 shares are not subject to a distribution and/or service fee.
The Plans provide that the distribution and service fees are payable to the Distributor regardless of the amounts actually expended by the Distributor for distribution of the Fund's shares and service activities.
In accordance with the Shareholder Services Plans for the Class R1, Class R2 and Class R3 shares, the Manager has agreed to provide, through its affiliates or independent third parties, various shareholder and administrative support services to shareholders of the Class R1, Class R2 and Class R3 shares. For its services, the Manager, its affiliates or independent third-party service providers are entitled to a shareholder service fee accrued daily and paid monthly at an annual rate of 0.10% of the average daily net assets of the Class R1, Class R2 and Class R3
shares. This is in addition to any fees paid under the Class R2 and Class R3 Plans.
During the year ended October 31, 2023, shareholder service fees incurred by the Fund were as follows:
| |
| Class R1 | $ 192 |
| Class R2 | 612 |
| Class R3 | 1,970 |
(C) Sales Charges. The Fund was advised by the Distributor that the amount of initial sales charges retained on sales of Class A and Investor Class shares during the year ended October 31, 2023, were $22,483 and $3,082, respectively.
The Fund was also advised that the Distributor retained CDSCs on redemptions of Class A, Investor Class, Class B and Class C shares during the year ended October 31, 2023, of $23,057, $5, $27 and $1,233, respectively.
(D) Transfer, Dividend Disbursing and Shareholder Servicing Agent. NYLIM Service Company LLC, an affiliate of New York Life Investments, is the Fund's transfer, dividend disbursing and shareholder servicing agent pursuant to an agreement between NYLIM Service Company LLC and the Trust. NYLIM Service Company LLC has entered into an agreement with SS&C Global Investor & Distribution Solutions, Inc. ("SS&C"), pursuant to which SS&C performs certain transfer agent services on behalf of NYLIM Service Company LLC. New York Life Investments has contractually agreed to limit the transfer agency expenses charged to the Fund’s share classes to a maximum of 0.35% of that share class’s average daily net assets on an annual basis after deducting any applicable Fund or class-level expense reimbursement or small account fees. This agreement will remain in effect until February 28, 2024, and shall renew automatically for one-year terms unless New York Life Investments provides written notice of termination prior to the start of the next term or upon approval of the Board. During the year ended October 31, 2023, transfer agent expenses incurred by the Fund and any reimbursements, pursuant to the aforementioned Transfer Agency expense limitation agreement, were as follows:
| Class | Expense | Waived |
| Class A | $342,996 | $ — |
| Investor Class | 177,954 | (39,019) |
| Class B | 19,766 | (4,306) |
| Class C | 63,355 | (13,789) |
| Class I | 58,589 | — |
| Class R1 | 188 | — |
| Class R2 | 599 | — |
| Class R3 | 1,931 | — |
| Class R6 | 4 | — |
Notes to Financial Statements (continued)
(E) Small Account Fee. Shareholders with small accounts adversely impact the cost of providing transfer agency services. In an effort to reduce total transfer agency expenses, the Fund has implemented a small account fee on certain types of accounts. As described in the Fund's prospectus, certain shareholders with an account balance of less than $1,000 ($5,000 for Class A share accounts) are charged an annual per account fee of $20 (assessed semi-annually), the proceeds from which offset transfer agent fees as reflected in the Statement of Operations. This small account fee will not apply to certain types of accounts as described further in the Fund’s prospectus.
(F) Capital. As of October 31, 2023, New York Life and its affiliates beneficially held shares of the Fund with the values and percentages of net assets as follows:
Note 4-Federal Income Tax
As of October 31, 2023, the cost and unrealized appreciation (depreciation) of the Fund’s investment portfolio, including applicable derivative contracts and other financial instruments, as determined on a federal income tax basis, were as follows:
| | Federal Tax
Cost | Gross
Unrealized
Appreciation | Gross
Unrealized
(Depreciation) | Net
Unrealized
Appreciation/
(Depreciation) |
| Investments in Securities | $426,542,928 | $24,890,235 | $(18,579,379) | $6,310,856 |
As of October 31, 2023, the components of accumulated gain (loss) on a tax basis were as follows:
Ordinary
Income | Accumulated
Capital
and Other
Gain (Loss) | Other
Temporary
Differences | Unrealized
Appreciation
(Depreciation) | Total
Accumulated
Gain (Loss) |
| $490,844 | $(665,768) | $— | $6,311,748 | $6,136,824 |
The difference between book-basis and tax-basis unrealized appreciation (depreciation) is primarily due to wash sale adjustments.
As of October 31, 2023, for federal income tax purposes, capital loss carryforwards of $665,768, as shown in the table below, were available to the extent provided by the regulations to offset future realized gains of the Fund. Accordingly, no capital gains distributions are expected to be paid to shareholders until net gains have been realized in excess of such amounts.
Capital Loss
Available Through | Short-Term
Capital Loss
Amounts (000’s) | Long-Term
Capital Loss
Amounts (000’s) |
| Unlimited | $666 | $— |
During the years ended October 31, 2023 and October 31, 2022, the tax character of distributions paid as reflected in the Statements of Changes in Net Assets was as follows:
| | 2023 | 2022 |
| Distributions paid from: | | |
| Ordinary Income | $ 9,944,673 | $64,088,486 |
| Long-Term Capital Gains | 535,532 | 33,192,278 |
| Total | $10,480,205 | $97,280,764 |
Note 5–Custodian
JPMorgan is the custodian of cash and securities held by the Fund. Custodial fees are charged to the Fund based on the Fund's net assets and/or the market value of securities held by the Fund and the number of certain transactions incurred by the Fund.
Note 6–Line of Credit
The Fund and certain other funds managed by New York Life Investments maintain a line of credit with a syndicate of banks in order to secure a source of funds for temporary purposes to meet unanticipated or excessive redemption requests.
Effective July 25, 2023, under the credit agreement (the “Credit Agreement”), the aggregate commitment amount is $600,000,000 with an additional uncommitted amount of $100,000,000. The commitment fee is an annual rate of 0.15% of the average commitment amount payable quarterly, regardless of usage, to JPMorgan, who serves as the agent to the syndicate. The commitment fee is allocated among the Fund and certain other funds managed by New York Life Investments based upon their respective net assets and other factors. Interest on any revolving credit loan is charged based upon the Federal Funds Rate, Daily Simple Secured Overnight Financing Rate ("SOFR") + 0.10%, or the Overnight Bank Funding Rate, whichever is higher. The Credit Agreement expires on July 23, 2024, although the Fund, certain other funds managed by New York Life Investments and the syndicate of banks may renew the Credit Agreement for an additional year on the same or different terms or enter into a credit agreement with a different syndicate of banks. Prior to July 25, 2023, the aggregate commitment amount and the commitment fee were the same as those under the current Credit Agreement. During the year ended October 31, 2023, there were no borrowings made or outstanding with respect to the Fund under the Credit Agreement.
Note 7–Interfund Lending Program
Pursuant to an exemptive order issued by the SEC, the Fund, along with certain other funds managed by New York Life Investments, may participate in an interfund lending program. The interfund lending program provides an alternative credit facility that permits the Fund and certain other funds managed by New York Life Investments to lend or borrow money for temporary purposes directly to or from one another, subject to the conditions of the exemptive order. During the year ended
October 31, 2023, there were no interfund loans made or outstanding with respect to the Fund.
Note 8–Purchases and Sales of Securities (in 000’s)
During the year ended October 31, 2023, purchases and sales of U.S. government securities were $1,166,412 and $1,168,256, respectively. Purchases and sales of securities, other than U.S. government securities and short-term securities, were $238,383 and $255,343, respectively.
The Fund may purchase securities from or sell securities to other portfolios managed by the Subadvisor. These interportfolio transactions are primarily used for cash management purposes and are made pursuant to Rule 17a-7 under the 1940 Act. The Rule 17a-7 transactions during the year ended October 31, 2023, were as follows:
Sales
(000's) | Realized
Gain / (Loss)
(000's) |
| $375 | $69 |
Note 9–Capital Share Transactions
Transactions in capital shares for the years ended October 31, 2023 and October 31, 2022, were as follows:
| Class A | Shares | Amount |
| Year ended October 31, 2023: | | |
| Shares sold | 1,548,082 | $ 44,180,228 |
| Shares issued to shareholders in reinvestment of distributions | 274,607 | 7,784,603 |
| Shares redeemed | (2,164,362) | (61,622,715) |
| Net increase (decrease) in shares outstanding before conversion | (341,673) | (9,657,884) |
| Shares converted into Class A (See Note 1) | 133,110 | 3,781,693 |
| Shares converted from Class A (See Note 1) | (13,254) | (377,528) |
| Net increase (decrease) | (221,817) | $ (6,253,719) |
| Year ended October 31, 2022: | | |
| Shares sold | 2,360,165 | $ 70,853,579 |
| Shares issued to shareholders in reinvestment of distributions | 2,244,761 | 66,915,052 |
| Shares redeemed | (1,808,327) | (53,389,436) |
| Net increase (decrease) in shares outstanding before conversion | 2,796,599 | 84,379,195 |
| Shares converted into Class A (See Note 1) | 195,265 | 5,809,937 |
| Shares converted from Class A (See Note 1) | (2,017) | (57,537) |
| Net increase (decrease) | 2,989,847 | $ 90,131,595 |
| |
| Investor Class | Shares | Amount |
| Year ended October 31, 2023: | | |
| Shares sold | 64,061 | $ 1,827,161 |
| Shares issued to shareholders in reinvestment of distributions | 27,830 | 789,111 |
| Shares redeemed | (130,944) | (3,733,182) |
| Net increase (decrease) in shares outstanding before conversion | (39,053) | (1,116,910) |
| Shares converted into Investor Class (See Note 1) | 36,922 | 1,060,041 |
| Shares converted from Investor Class (See Note 1) | (86,523) | (2,454,105) |
| Net increase (decrease) | (88,654) | $ (2,510,974) |
| Year ended October 31, 2022: | | |
| Shares sold | 93,127 | $ 2,823,914 |
| Shares issued to shareholders in reinvestment of distributions | 302,372 | 9,025,295 |
| Shares redeemed | (120,603) | (3,615,118) |
| Net increase (decrease) in shares outstanding before conversion | 274,896 | 8,234,091 |
| Shares converted into Investor Class (See Note 1) | 30,476 | 895,730 |
| Shares converted from Investor Class (See Note 1) | (134,021) | (4,026,279) |
| Net increase (decrease) | 171,351 | $ 5,103,542 |
| |
| Class B | Shares | Amount |
| Year ended October 31, 2023: | | |
| Shares sold | 2,287 | $ 64,388 |
| Shares issued to shareholders in reinvestment of distributions | 1,744 | 48,820 |
| Shares redeemed | (47,813) | (1,340,758) |
| Net increase (decrease) in shares outstanding before conversion | (43,782) | (1,227,550) |
| Shares converted from Class B (See Note 1) | (53,489) | (1,507,157) |
| Net increase (decrease) | (97,271) | $ (2,734,707) |
| Year ended October 31, 2022: | | |
| Shares sold | 8,150 | $ 241,370 |
| Shares issued to shareholders in reinvestment of distributions | 56,056 | 1,653,945 |
| Shares redeemed | (64,900) | (1,895,859) |
| Net increase (decrease) in shares outstanding before conversion | (694) | (544) |
| Shares converted from Class B (See Note 1) | (53,480) | (1,538,713) |
| Net increase (decrease) | (54,174) | $ (1,539,257) |
| |
Notes to Financial Statements (continued)
| Class C | Shares | Amount |
| Year ended October 31, 2023: | | |
| Shares sold | 42,430 | $ 1,204,480 |
| Shares issued to shareholders in reinvestment of distributions | 5,996 | 167,716 |
| Shares redeemed | (218,174) | (6,111,194) |
| Net increase (decrease) in shares outstanding before conversion | (169,748) | (4,738,998) |
| Shares converted from Class C (See Note 1) | (29,912) | (841,362) |
| Net increase (decrease) | (199,660) | $ (5,580,360) |
| Year ended October 31, 2022: | | |
| Shares sold | 68,601 | $ 2,020,751 |
| Shares issued to shareholders in reinvestment of distributions | 162,107 | 4,781,182 |
| Shares redeemed | (288,775) | (8,590,050) |
| Net increase (decrease) in shares outstanding before conversion | (58,067) | (1,788,117) |
| Shares converted from Class C (See Note 1) | (39,389) | (1,131,929) |
| Net increase (decrease) | (97,456) | $ (2,920,046) |
| |
| Class I | Shares | Amount |
| Year ended October 31, 2023: | | |
| Shares sold | 491,436 | $ 14,118,732 |
| Shares issued to shareholders in reinvestment of distributions | 51,766 | 1,472,892 |
| Shares redeemed | (660,021) | (18,893,780) |
| Net increase (decrease) in shares outstanding before conversion | (116,819) | (3,302,156) |
| Shares converted into Class I (See Note 1) | 12,813 | 366,508 |
| Shares converted from Class I (See Note 1) | (969) | (28,090) |
| Net increase (decrease) | (104,975) | $ (2,963,738) |
| Year ended October 31, 2022: | | |
| Shares sold | 290,133 | $ 8,591,839 |
| Shares issued to shareholders in reinvestment of distributions | 421,036 | 12,591,346 |
| Shares redeemed | (620,781) | (19,940,257) |
| Net increase (decrease) in shares outstanding before conversion | 90,388 | 1,242,928 |
| Shares converted into Class I (See Note 1) | 1,718 | 48,791 |
| Net increase (decrease) | 92,106 | $ 1,291,719 |
| |
| Class R1 | Shares | Amount |
| Year ended October 31, 2023: | | |
| Shares sold | 1,365 | $ 38,947 |
| Shares issued to shareholders in reinvestment of distributions | 168 | 4,769 |
| Shares redeemed | (2,149) | (59,921) |
| Net increase (decrease) | (616) | $ (16,205) |
| Year ended October 31, 2022: | | |
| Shares sold | 2,606 | $ 72,308 |
| Shares issued to shareholders in reinvestment of distributions | 739 | 22,059 |
| Shares redeemed | (62) | (1,828) |
| Net increase (decrease) | 3,283 | $ 92,539 |
| |
| Class R2 | Shares | Amount |
| Year ended October 31, 2023: | | |
| Shares sold | 828 | $ 23,643 |
| Shares issued to shareholders in reinvestment of distributions | 296 | 8,404 |
| Shares redeemed | (7,102) | (198,535) |
| Net increase (decrease) | (5,978) | $ (166,488) |
| Year ended October 31, 2022: | | |
| Shares sold | 3,483 | $ 103,858 |
| Shares issued to shareholders in reinvestment of distributions | 4,437 | 132,743 |
| Shares redeemed | (15,258) | (476,966) |
| Net increase (decrease) | (7,338) | $ (240,365) |
| |
| Class R3 | Shares | Amount |
| Year ended October 31, 2023: | | |
| Shares sold | 16,350 | $ 466,567 |
| Shares issued to shareholders in reinvestment of distributions | 1,284 | 36,287 |
| Shares redeemed | (17,400) | (496,225) |
| Net increase (decrease) | 234 | $ 6,629 |
| Year ended October 31, 2022: | | |
| Shares sold | 12,338 | $ 363,100 |
| Shares issued to shareholders in reinvestment of distributions | 14,211 | 423,138 |
| Shares redeemed | (19,963) | (593,453) |
| Net increase (decrease) | 6,586 | $ 192,785 |
| |
| Class R6 | Shares | Amount |
| Year ended October 31, 2023: | | |
| Shares sold | 1,497 | $ 41,935 |
| Shares issued to shareholders in reinvestment of distributions | 69 | 1,952 |
| Shares redeemed | (1,534) | (43,830) |
| Net increase (decrease) | 32 | $ 57 |
| Year ended October 31, 2022: | | |
| Shares issued to shareholders in reinvestment of distributions | 405 | $ 12,112 |
| Shares redeemed | (182) | (5,417) |
| Net increase (decrease) | 223 | $ 6,695 |
Note 10–Other Matters
As of the date of this report, the Fund faces a heightened level of risk associated with current uncertainty, volatility and state of economies, financial markets, rising interest rates, and labor and health conditions around the world. Events such as war, acts of terrorism, recessions, rapid inflation, the imposition of international sanctions, earthquakes, hurricanes, epidemics and pandemics and other unforeseen natural or human disasters may have broad adverse social, political and economic effects on the global economy, which could negatively impact the value of the Fund's investments. Developments that disrupt global economies and financial markets may magnify factors that affect the Fund's performance.
Note 11–Subsequent Events
In connection with the preparation of the financial statements of the Fund as of and for the year ended October 31, 2023, events and transactions subsequent to October 31, 2023, through the date the financial statements were issued, have been evaluated by the Manager for possible adjustment and/or disclosure. No subsequent events requiring financial statement adjustment or disclosure have been identified.
Report of Independent Registered Public Accounting Firm
To the Shareholders of the Fund and Board of Trustees
MainStay Funds Trust:
Opinion on the Financial Statements
We have audited the accompanying statement of assets and liabilities of MainStay Balanced Fund (the Fund), one of the funds constituting MainStay Funds Trust, including the portfolio of investments, as of October 31, 2023, the related statement of operations for the year then ended, the statements of changes in net assets for each of the years in the two-year period then ended, and the related notes (collectively, the financial statements) and the financial highlights for each of the years in the five-year period then ended. In our opinion, the financial statements and financial highlights present fairly, in all material respects, the financial position of the Fund as of October 31, 2023, the results of its operations for the year then ended, the changes in its net assets for each of the years in the two-year period then ended, and the financial highlights for each of the years in the five-year period then ended, in conformity with U.S. generally accepted accounting principles.
Basis for Opinion
These financial statements and financial highlights are the responsibility of the Fund's management. Our responsibility is to express an opinion on these financial statements and financial highlights based on our audits. We are a public accounting firm registered with the Public Company Accounting Oversight Board (United States) (PCAOB) and are required to be independent with respect to the Fund in accordance with the U.S. federal securities laws and the applicable rules and regulations of the Securities and Exchange Commission and the PCAOB.
We conducted our audits in accordance with the standards of the PCAOB. Those standards require that we plan and perform the audit to obtain reasonable assurance about whether the financial statements and financial highlights are free of material misstatement, whether due to error or fraud. Our audits included performing procedures to assess the risks of material misstatement of the financial statements and financial highlights, whether due to error or fraud, and performing procedures that respond to those risks. Such procedures included examining, on a test basis, evidence regarding the amounts and disclosures in the financial statements and financial highlights. Such procedures also included confirmation of securities owned as of October 31, 2023, by correspondence with custodians, the transfer agent and brokers; when replies were not received from brokers, we performed other auditing procedures. Our audits also included evaluating the accounting principles used and significant estimates made by management, as well as evaluating the overall presentation of the financial statements and financial highlights. We believe that our audits provide a reasonable basis for our opinion.

We have served as the auditor of one or more New York Life Investment Management investment companies since 2003.
Philadelphia, Pennsylvania
December 22, 2023
Federal Income Tax Information
(Unaudited)
The Fund is required under the Internal Revenue Code to advise shareholders in a written statement as to the federal tax status of dividends paid by the Fund during such fiscal years. Accordingly, the Fund paid $535,532 as long term capital gain distributions.
For the fiscal year ended October 31, 2023, the Fund designated approximately $6,749,338 under the Internal Revenue Code as qualified dividend income eligible for reduced tax rates.
The dividends paid by the Fund during the fiscal year ended October 31, 2023 should be multiplied by 65.06% to arrive at the amount eligible for the corporate dividend-received deduction.
In February 2024, shareholders will receive an IRS Form 1099-DIV or substitute Form 1099, which will show the federal tax status of the distributions received by shareholders in calendar year 2023. The amounts that will be reported on such 1099-DIV or substitute Form 1099 will be the amounts you are to use on your federal income tax return and will differ from the amounts which we must report for the Fund's fiscal year ended October 31, 2023.
Proxy Voting Policies and Procedures and Proxy Voting Record
The Fund is required to file with the SEC its proxy voting record for the 12-month period ending June 30 on Form N-PX. A description of the policies and procedures that are used to vote proxies relating to portfolio securities of the Fund is available free of charge upon request by calling 800-624-6782 or visiting the SEC’s website at www.sec.gov. The most recent Form N-PX or proxy voting record is available free of charge upon request by calling 800-624-6782; visiting newyorklifeinvestments.com; or visiting the SEC’s website at www.sec.gov.
Shareholder Reports and Quarterly Portfolio Disclosure
The Fund is required to file its complete schedule of portfolio holdings with the SEC 60 days after its first and third fiscal quarter on Form N-PORT. The Fund's holdings report is available free of charge upon request by calling New York Life Investments at 800-624-6782.
Board of Trustees and Officers (Unaudited)
The Trustees and officers of the Fund are listed below. The Board oversees the MainStay Group of Funds (which consists of MainStay Funds and MainStay Funds Trust), MainStay VP Funds Trust, MainStay MacKay DefinedTerm Municipal Opportunities Fund, MainStay CBRE Global Infrastructure Megatrends Term Fund, the Manager and the Subadvisors, and elects the officers of the Funds who are responsible for the day-to-day operations of the Fund. Information pertaining to the Trustees and officers is set forth below. Each Trustee serves until his or her successor is elected and qualified or until his or her resignation, death or
removal. Under the Board’s retirement policy, unless an exception is made, a Trustee must tender his or her resignation by the end of the calendar year during which he or she reaches the age of 75. Officers are elected annually by the Board. The business address of each Trustee and officer listed below is 51 Madison Avenue, New York, New York 10010. A majority of the Trustees are not “interested persons” (as defined by the 1940 Act and rules adopted by the SEC thereunder) of the Fund (“Independent Trustees”).
| | Name and
Year of Birth | Term of Office,
Position(s) Held and
Length of Service | Principal Occupation(s)
During Past Five Years | Number of
Portfolios in
Fund Complex
Overseen by
Trustee | Other Directorships
Held by Trustee |
| | | | | | |
| | Naïm Abou-Jaoudé*
1966 | MainStay Funds: Trustee
since 2023
MainStay Funds Trust:
Trustee since 2023 | Chief Executive Officer of New York Life Investment Management LLC (since 2023). Chief Executive Officer of Candriam (an affiliate of New York Life Investment Management LLC) (2007 to 2023). | 81 | MainStay VP Funds Trust:
Trustee since 2023 (31 portfolios);
MainStay MacKay DefinedTerm Municipal Opportunities Fund: Trustee
since 2023;
MainStay CBRE Global Infrastructure Megatrends Term Fund: Trustee
since 2023; and
New York Life Investment Management International (Chair) since 2015 |
| * | This Trustee is considered to be an “interested person” of the MainStay Group of Funds, MainStay VP Funds Trust, MainStay CBRE Global Infrastructure Megatrends Term Fund and MainStay MacKay DefinedTerm Municipal Opportunities Fund, within the meaning of the 1940 Act because of his affiliation with New York Life Investment Management LLC and Candriam, as described in detail above in the column entitled “Principal Occupation(s) During Past Five Years.” |
| | |
| | Name and
Year of Birth | Term of Office,
Position(s) Held and
Length of Service | Principal Occupation(s)
During Past Five Years | Number of
Portfolios in
Fund Complex
Overseen by
Trustee | Other Directorships
Held by Trustee |
| | | | | | |
| | David H. Chow
1957 | MainStay Funds: Trustee since January 2016, Advisory Board Member (June 2015 to December 2015);MainStay Funds Trust:
Trustee since January 2016, Advisory Board Member (June 2015 to December 2015) | Founder and CEO, DanCourt Management, LLC (since 1999) | 81 | MainStay VP Funds Trust: Trustee since January 2016, Advisory Board Member (June 2015 to December 2015) (31 portfolios);
MainStay MacKay DefinedTerm Municipal Opportunities Fund: Trustee since January 2016, Advisory Board Member (June 2015 to December 2015);
MainStay CBRE Global Infrastructure Megatrends Term Fund: Trustee since 2021;
VanEck Vectors Group of Exchange-Traded Funds: Trustee since 2006 and Independent Chairman of the Board of Trustees from 2008 to 2022 (57 portfolios); and
Berea College of Kentucky: Trustee since 2009, Chair of the Investment Committee since 2018 |
| | Karen Hammond
1956 | MainStay Funds: Trustee since December 2021, Advisory Board Member (June 2021 to December 2021);MainStay Funds Trust:
Trustee since December 2021, Advisory Board Member (June 2021 to December 2021)
| Retired, Managing Director, Devonshire Investors (2007 to 2013); Senior Vice President, Fidelity Management & Research Co. (2005 to 2007); Senior Vice President and Corporate Treasurer, FMR Corp. (2003 to 2005); Chief Operating Officer, Fidelity Investments Japan (2001 to 2003) | 81 | MainStay VP Funds Trust: Trustee since December 2021, Advisory Board Member (June 2021 to December 2021) (31 portfolios);
MainStay MacKay DefinedTerm Municipal Opportunities Fund: Trustee since December 2021, Advisory Board Member (June 2021 to December 2021);
MainStay CBRE Global Infrastructure Megatrends Term Fund: Trustee since December 2021, Advisory Board Member (June 2021 to December 2021);
Two Harbors Investment Corp.: Director since 2018;
Rhode Island State Investment Commission: Member since 2017; and
Blue Cross Blue Shield of Rhode Island: Director since 2019 |
| | Susan B. Kerley
1951 | MainStay Funds: Chair since January 2017 and Trustee since 2007;MainStay Funds Trust:
Chair since January 2017 and Trustee since 1990*** | President, Strategic Management Advisors LLC (since 1990) | 81 | MainStay VP Funds Trust: Chair since January 2017 and Trustee since 2007 (31 portfolios)**;
MainStay MacKay DefinedTerm Municipal Opportunities Fund: Chair since January 2017 and Trustee since 2011;
MainStay CBRE Global Infrastructure Megatrends Term Fund: Trustee since June 2021; and
Legg Mason Partners Funds: Trustee since 1991 (45 portfolios) |
Board of Trustees and Officers (Unaudited) (continued)
| | Name and
Year of Birth | Term of Office,
Position(s) Held and
Length of Service | Principal Occupation(s)
During Past Five Years | Number of
Portfolios in
Fund Complex
Overseen by
Trustee | Other Directorships
Held by Trustee |
| | | | | | |
| | Alan R. Latshaw
1951 | MainStay Funds: Trusteesince 2006;MainStay Funds Trust:
Trustee since 2007*** | Retired; Partner, Ernst & Young LLP (2002 to 2003); Partner, Arthur Andersen LLP (1989 to 2002); Consultant to the MainStay Funds Audit and Compliance Committee (2004 to 2006) | 81 | MainStay VP Funds Trust: Trustee since 2007 (31 portfolios)**;
MainStay MacKay DefinedTerm Municipal Opportunities Fund: Trustee since 2011; and
MainStay CBRE Global Infrastructure Megatrends Term Fund: Trustee since June 2021 |
| | Jacques P. Perold
1958 | MainStay Funds: Trustee since January 2016, Advisory Board Member (June 2015to December 2015);MainStay Funds Trust:
Trustee since January 2016, Advisory Board Member (June 2015 to December 2015) | Founder and Chief Executive Officer, CapShift Advisors LLC (since 2018); President, Fidelity Management & Research Company (2009 to 2014); President and Chief Investment Officer, Geode Capital Management, LLC (2001 to 2009) | 81 | MainStay VP Funds Trust: Trustee since January 2016, Advisory Board Member (June 2015 to December 2015) (31 portfolios);
MainStay MacKay DefinedTerm Municipal Opportunities Fund: Trustee since January 2016, Advisory Board Member (June 2015 to December 2015);
MainStay CBRE Global Infrastructure Megatrends Term Fund: Trustee since June 2021;
Allstate Corporation: Director since 2015; and
MSCI Inc.: Director since 2017 |
| | Richard S. Trutanic
1952 | MainStay Funds: Trustee since 1994;MainStay Funds Trust:
Trustee since 2007*** | Chairman and Chief Executive Officer, Somerset & Company (financial advisory firm) (since 2004); Managing Director, The Carlyle Group (private investment firm) (2002 to 2004); Senior Managing Director, Partner and Board Member, Groupe Arnault S.A. (private investment firm) (1999 to 2002) | 81 | MainStay VP Funds Trust: Trustee since 2007 (31 portfolios)**;
MainStay MacKay DefinedTerm Municipal Opportunities Fund: Trustee since 2011; and
MainStay CBRE Global Infrastructure Megatrends Term Fund: Trustee since June 2021 |
| ** | Includes prior service as a Director of MainStay VP Series Fund, Inc., the predecessor to MainStay VP Funds Trust. |
| *** | Includes prior service as a Director/Trustee of certain predecessor entities to MainStay Funds Trust. |
| | Name and
Year of Birth | Position(s) Held and
Length of Service | Principal Occupation(s)
During Past Five Years | |
| | | | | |
| | Kirk C. Lehneis
1974 | President, MainStay Funds, MainStay Funds Trust (since 2017) | Chief Operating Officer and Senior Managing Director (since 2016), New York Life Investment Management LLC and New York Life Investment Management Holdings LLC; Member of the Board of Managers (since 2017) and Senior Managing Director (since 2018), NYLIFE Distributors LLC; Chairman of the Board and Senior Managing Director, NYLIM Service Company LLC (since 2017); Trustee, President and Principal Executive Officer of IndexIQ Trust, IndexIQ ETF Trust and IndexIQ Active ETF Trust (since 2018); President, MainStay CBRE Global Infrastructure Megatrends Term Fund (since 2021), MainStay MacKay DefinedTerm Municipal Opportunities Fund and MainStay VP Funds Trust (since 2017)**; Senior Managing Director, Global Product Development (2015 to 2016); Managing Director, Product Development (2010 to 2015), New York Life Investment Management LLC | |
| | Jack R. Benintende
1964 | Treasurer and Principal Financial and Accounting Officer, MainStay Funds (since 2007), MainStay Funds Trust (since 2009) | Managing Director, New York Life Investment Management LLC (since 2007); Treasurer and Principal Financial and Accounting Officer, MainStay CBRE Global Infrastructure Megatrends Term Fund (since 2021), MainStay MacKay DefinedTerm Municipal Opportunities Fund (since 2011) and MainStay VP Funds Trust (since 2007)**; and Assistant Treasurer, New York Life Investment Management Holdings LLC (2008 to 2012) | |
| | J. Kevin Gao
1967 | Secretary and Chief Legal Officer, MainStay Funds and MainStay Funds Trust (since 2010) | Managing Director and Associate General Counsel, New York Life Investment Management LLC (since 2010); Secretary and Chief Legal Officer, MainStay CBRE Global Infrastructure Megatrends Term Fund (since 2021), MainStay MacKay DefinedTerm Municipal Opportunities Fund (since 2011) and MainStay VP Funds Trust (since 2010)** | |
| | Kevin M. Gleason
1967 | Vice President and Chief Compliance Officer, MainStay Funds and MainStay Funds Trust (since June 2022) | Vice President and Chief Compliance Officer, IndexIQ Trust, IndexIQ ETF Trust and Index IQ Active ETF Trust (since June 2022); Vice President and Chief Compliance Officer, MainStay CBRE Global Infrastructure Megatrends Term Fund, MainStay VP Funds Trust and MainStay MacKay DefinedTerm Municipal Opportunities Fund (since June 2022); Senior Vice President, Voya Investment Management and Chief Compliance Officer, Voya Family of Funds (2012 to 2022) | |
| | Scott T. Harrington
1959 | Vice President— Administration, MainStay Funds (since 2005), MainStay Funds Trust (since 2009) | Managing Director, New York Life Investment Management LLC (including predecessor advisory organizations) (since 2000); Member of the Board of Directors, New York Life Trust Company (since 2009); Vice President—Administration, MainStay CBRE Global Infrastructure Megatrends Term Fund (since 2021), MainStay MacKay DefinedTerm Municipal Opportunities Fund (since 2011) and MainStay VP Funds Trust (since 2005)** | |
| * | The officers listed above are considered to be “interested persons” of the MainStay Group of Funds, MainStay VP Funds Trust, MainStay CBRE Global Infrastructure Megatrends Term Fund and MainStay MacKay DefinedTerm Municipal Opportunities Fund within the meaning of the 1940 Act because of their affiliation with the MainStay Group of Funds, New York Life Insurance Company and/or its affiliates, including New York Life Investment Management LLC, New York Life Insurance Company, NYLIM Service Company LLC, NYLIFE Securities LLC and/or NYLIFE Distributors LLC, as described in detail in the column captioned “Principal Occupation(s) During Past Five Years.” Officers are elected annually by the Board. |
| ** | Includes prior service as an Officer of MainStay VP Series Fund, Inc., the predecessor to MainStay VP Funds Trust. |
Officers of the Trust (Who are not Trustees)*
This page intentionally left blank.
Equity
U.S. Equity
MainStay Epoch U.S. Equity Yield Fund
MainStay Fiera SMID Growth Fund
MainStay PineStone U.S. Equity Fund
MainStay S&P 500 Index Fund
MainStay Winslow Large Cap Growth Fund
MainStay WMC Enduring Capital Fund
MainStay WMC Growth Fund
MainStay WMC Small Companies Fund
MainStay WMC Value Fund
International Equity
MainStay Epoch International Choice Fund
MainStay PineStone International Equity Fund
MainStay WMC International Research Equity Fund
Emerging Markets Equity
MainStay Candriam Emerging Markets Equity Fund
Global Equity
MainStay Epoch Capital Growth Fund
MainStay Epoch Global Equity Yield Fund
MainStay PineStone Global Equity Fund
Fixed Income
Taxable Income
MainStay Candriam Emerging Markets Debt Fund
MainStay Floating Rate Fund
MainStay MacKay High Yield Corporate Bond Fund
MainStay MacKay Short Duration High Yield Fund
MainStay MacKay Strategic Bond Fund
MainStay MacKay Total Return Bond Fund
MainStay MacKay U.S. Infrastructure Bond Fund
MainStay Short Term Bond Fund
Tax-Exempt Income
MainStay MacKay California Tax Free Opportunities Fund1
MainStay MacKay High Yield Municipal Bond Fund
MainStay MacKay New York Tax Free Opportunities Fund2
MainStay MacKay Short Term Municipal Fund
MainStay MacKay Strategic Municipal Allocation Fund
MainStay MacKay Tax Free Bond Fund
Money Market
MainStay Money Market Fund
Mixed Asset
MainStay Balanced Fund
MainStay Income Builder Fund
MainStay MacKay Convertible Fund
Speciality
MainStay CBRE Global Infrastructure Fund
MainStay CBRE Real Estate Fund
MainStay Cushing MLP Premier Fund
Asset Allocation
MainStay Conservative Allocation Fund
MainStay Conservative ETF Allocation Fund
MainStay Defensive ETF Allocation Fund
MainStay Equity Allocation Fund
MainStay Equity ETF Allocation Fund
MainStay ESG Multi-Asset Allocation Fund
MainStay Growth Allocation Fund
MainStay Growth ETF Allocation Fund
MainStay Moderate Allocation Fund
MainStay Moderate ETF Allocation Fund
Manager
New York Life Investment Management LLC
New York, New York
Subadvisors
Candriam3
Strassen, Luxembourg
CBRE Investment Management Listed Real Assets LLC
Radnor, Pennsylvania
Cushing Asset Management, LP
Dallas, Texas
Epoch Investment Partners, Inc.
New York, New York
Fiera Capital Inc.
New York, New York
IndexIQ Advisors LLC3
New York, New York
MacKay Shields LLC3
New York, New York
NYL Investors LLC3
New York, New York
PineStone Asset Management Inc.
Montreal, Québec
Wellington Management Company LLP
Boston, Massachusetts
Winslow Capital Management, LLC
Minneapolis, Minnesota
Legal Counsel
Dechert LLP
Washington, District of Columbia
Independent Registered Public Accounting Firm
KPMG LLP
Philadelphia, Pennsylvania
Distributor
NYLIFE Distributors LLC3
Jersey City, New Jersey
Custodian
JPMorgan Chase Bank, N.A.
New York, New York
1.
This Fund is registered for sale in AZ, CA, NV, OR, TX, UT, WA and MI (Class A and Class I shares only), and CO, FL, GA, HI, ID, MA, MD, NH, NJ and NY (Class I shares only).
| 2. | This Fund is registered for sale in CA, CT, DE, FL, MA, NJ, NY and VT. |
| 3. | An affiliate of New York Life Investment Management LLC. |
Not part of the Annual Report
For more information
800-624-6782
newyorklifeinvestments.com
“New York Life Investments” is both a service mark, and the common trade name, of certain investment advisors affiliated with New York Life Insurance Company. The MainStay Funds® are managed by New York Life Investment Management LLC and distributed by NYLIFE Distributors LLC, 30 Hudson Street, Jersey City, NJ 07302, a wholly owned subsidiary of New York Life Insurance Company. NYLIFE Distributors LLC is a Member FINRA/SIPC.
©2023 NYLIFE Distributors LLC. All rights reserved.
| 5013770MS139-23 | MSBL11-12/23 |
(NYLIM) NL231
MainStay Candriam Emerging Markets Equity Fund
Message from the President and Annual Report
October 31, 2023
Special Notice:
Beginning in July 2024, new regulations issued by the Securities and Exchange Commission (SEC) will take effect requiring open-end mutual fund companies and ETFs to (1) overhaul the content of their shareholder reports and (2) mail paper copies of the new tailored shareholder reports to shareholders who have not opted to receive these documents electronically.
If you have not yet elected to receive your shareholder reports electronically, please contact your financial intermediary or visit newyorklifeinvestments.com/accounts.
| Not FDIC/NCUA Insured | Not a Deposit | May Lose Value | No Bank Guarantee | Not Insured by Any Government Agency |
This page intentionally left blank
Message from the President
Volatile economic and geopolitical forces drove market behavior during the 12-month reporting period ended October 31, 2023. While equity markets generally gained ground, bond prices trended broadly lower.
Although the war in Ukraine, the outbreak of hostilities in the Middle East and several other notable events affected financial assets, inflation and interest rate trends stood at the forefront of market developments during most of the period. As the reporting period began, high levels of inflation already showed signs of easing in the face of aggressive rate hikes by the U.S. Federal Reserve (the “Fed”). From a peak of 9.1% in June 2022, the annualized U.S. inflation rate dropped to 7.1% in November 2022, and to 3.2% in October 2023. At the same time, the Fed increased the benchmark federal funds rate from 3.75%–4.00% at the beginning of the reporting period to 5.25%–5.50% as of October 31, 2023. As the pace of rate increases slowed during the period, investors hoped for an early shift to a looser monetary policy. However, comments from Fed members late in the period reinforced the central bank’s hawkish stance in response to surprisingly robust U.S. economic growth and rising wage pressures, thus increasing the likelihood that interest rates would stay higher for longer. International developed markets exhibited similar dynamics of elevated inflation and rising interest rates.
Despite the backdrop of high interest rates—along with political dysfunction in Washington D.C. and intensifying global geopolitical instability—equity markets managed to advance, supported by healthy consumer spending trends and persistent domestic economic growth. The S&P 500® Index, a widely regarded benchmark of large-cap U.S. market performance, gained ground, bolstered by the strong performance of energy stocks amid surging petroleum prices and mega-cap, growth-oriented, technology-related shares, which rose as investors flocked to companies creating the infrastructure for developments in artificial intelligence. Smaller-cap stocks and value-oriented shares produced milder returns. Among industry sectors, energy and
information technology posted the strongest gains. Real estate declined most sharply under pressure from rising mortgage rates and weak levels of office occupancy. Developed international markets outperformed U.S. markets, with Europe benefiting during the first half of the period from unexpected economic resilience in the face of rising energy prices and the ongoing war in Ukraine. Emerging markets posted positive results but lagged developed markets, largely due to slow economic growth in China despite the relaxation of pandemic-era lockdowns.
Bond prices were driven lower by rising yields and increasing expectations of high interest rates for an extended period of time. The U.S. yield curve steepened, with the 30-year Treasury yield exceeding 5% for the first time in more than a decade. The yield curve remained inverted, with the 10-year Treasury yield ending the period at 4.88%, compared with 5.07% for the 2-year Treasury yield. Corporate bonds outperformed long-term Treasury bonds, but still trended lower under pressure from rising yields and an uptick in default rates. Among corporates, lower-credit-quality instruments performed slightly better than their higher-credit-quality counterparts, while floating rate securities performed better still.
In the face of today’s uncertain market environment, New York Life Investments remains dedicated to providing the guidance, resources and investment solutions you need to pursue your financial goals.
Thank you for trusting us to help meet your investment needs.
Sincerely,
Kirk C. Lehneis
President
The opinions expressed are as of the date of this report and are subject to change. There is no guarantee that any forecast made will come to pass. This material does not constitute investment advice and is not intended as an endorsement of any specific investment. Past performance is no guarantee of future results.
Not part of the Annual Report
Investors should refer to the Fund’s Summary Prospectus and/or Prospectus and consider the Fund’s investment objectives, strategies, risks, charges and expenses carefully before investing. The Summary Prospectus and/or Prospectus contain this and other information about the Fund. You may obtain copies of the Fund’s Summary Prospectus, Prospectus and Statement of Additional Information, which includes information about the MainStay Funds Trust's Trustees, free of charge, upon request, by calling toll-free 800-624-6782, by writing to NYLIFE Distributors LLC, Attn: MainStay Marketing Department, 30 Hudson Street, Jersey City, NJ 07302 or by sending an e-mail to MainStayShareholderServices@nylim.com. These documents are also available via the MainStay Funds’ website at newyorklifeinvestments.com. Please read the Fund’s Summary Prospectus and/or Prospectus carefully before investing.
Investment and Performance Comparison (Unaudited)
Performance data quoted represents past performance. Past performance is no guarantee of future results. Because of market volatility and other factors, current performance may be lower or higher than the figures shown. Investment return and principal value will fluctuate, and as a result, when shares are redeemed, they may be worth more or less than their original cost. The graph below depicts the historical performance of Class I shares of the Fund. Performance will vary from class to class based on differences in class-specific expenses and sales charges. For performance information current to the most recent month-end, please call 800-624-6782 or visit newyorklifeinvestments.com.
The performance table and graph do not reflect the deduction of taxes that a shareholder would pay on distributions or Fund share redemptions. Total returns reflect maximum applicable sales charges as indicated in the table below, if any, changes in share price, and reinvestment of dividend and capital gain distributions. The graph assumes the initial investment amount shown below and reflects the deduction of all sales charges that would have applied for the period of investment. Performance figures may reflect certain fee waivers and/or expense limitations, without which total returns may have been lower. For more information on share classes and current fee waivers and/or expense limitations (if any), please refer to the Notes to Financial Statements.
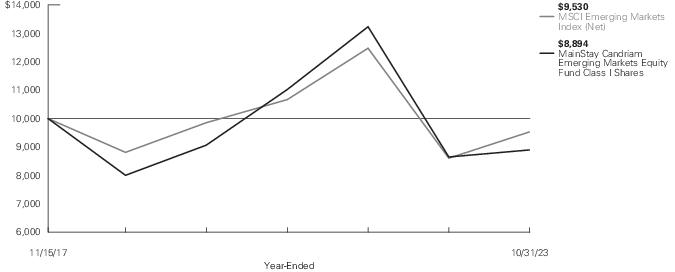
| Average Annual Total Returns for the Year-Ended October 31, 2023 |
| Class | Sales Charge | | Inception
Date | One
Year | Five
Years | Since
Inception | Gross
Expense
Ratio1 |
| Class A Shares | Maximum 5.50% Initial Sales Charge | With sales charges | 11/15/2017 | -3.04% | 0.65% | -3.19% | 1.77% |
| | | Excluding sales charges | | 2.60 | 1.80 | -2.27 | 1.77 |
| Investor Class Shares2 | Maximum 5.00% Initial Sales Charge | With sales charges | 11/15/2017 | -2.79 | 0.53 | -3.33 | 1.88 |
| | | Excluding sales charges | | 2.33 | 1.67 | -2.41 | 1.88 |
| Class C Shares | Maximum 1.00% CDSC | With sales charges | 11/15/2017 | 0.61 | 0.92 | -3.11 | 2.64 |
| | if Redeemed Within One Year of Purchase | Excluding sales charges | | 1.61 | 0.92 | -3.11 | 2.64 |
| Class I Shares | No Sales Charge | | 11/15/2017 | 2.87 | 2.14 | -1.95 | 1.54 |
| Class R6 Shares | No Sales Charge | | 11/15/2017 | 2.82 | 2.13 | -1.93 | 1.40 |
| 1. | The gross expense ratios presented reflect the Fund’s “Total Annual Fund Operating Expenses” from the most recent Prospectus, as supplemented, and may differ from other expense ratios disclosed in this report. |
| 2. | Prior to June 30, 2020, the maximum initial sales charge was 5.50%, which is reflected in the applicable average annual total return figures shown. |
The footnotes on the next page are an integral part of the table and graph and should be carefully read in conjunction with them.
| Benchmark Performance* | One
Year | Five
Years | Since
Inception |
| MSCI Emerging Markets Index (Net)1 | 10.80% | 1.59% | -0.80% |
| Morningstar Diversified Emerging Markets Category Average2 | 11.15 | 2.52 | -0.57 |
| * | Returns for indices reflect no deductions for fees, expenses or taxes, except for foreign withholding taxes where applicable. Results assume reinvestment of all dividends and capital gains. An investment cannot be made directly in an index. |
| 1. | The MSCI Emerging Markets Index (Net) is the Fund's primary benchmark. The MSCI Emerging Markets Index (Net) is a free float-adjusted market capitalization index that is designed to measure equity market performance in the global emerging markets. |
| 2. | The Morningstar Diversified Emerging Markets Category Average is representative of funds that tend to divide their assets among 20 or more nations, although they tend to focus on the emerging markets of Asia and Latin America rather than on those of the Middle East, Africa, or Europe. These funds invest predominantly in emerging market equities, but some funds also invest in both equities and fixed income investments from emerging markets. Results are based on average total returns of similar funds with all dividends and capital gain distributions reinvested. |
The footnotes on the preceding page are an integral part of the table and graph and should be carefully read in conjunction with them.
| 6 | MainStay Candriam Emerging Markets Equity Fund |
Cost in Dollars of a $1,000 Investment in MainStay Candriam Emerging Markets Equity Fund (Unaudited)
The example below is intended to describe the fees and expenses borne by shareholders during the six-month period from May 1, 2023 to October 31, 2023, and the impact of those costs on your investment.
Example
As a shareholder of the Fund you incur two types of costs: (1) transaction costs, including exchange fees and sales charges (loads) on purchases (as applicable), and (2) ongoing costs, including management fees, distribution and/or service (12b-1) fees and other Fund expenses (as applicable). This example is intended to help you understand your ongoing costs (in dollars) of investing in the Fund and to compare these costs with the ongoing costs of investing in other mutual funds. The example is based on an investment of $1,000 made at the beginning of the six-month period and held for the entire period from May 1, 2023 to October 31, 2023.
This example illustrates your Fund’s ongoing costs in two ways:
Actual Expenses
The second and third data columns in the table below provide information about actual account values and actual expenses. You may use the information in these columns, together with the amount you invested, to estimate the expenses that you paid during the six months ended October 31, 2023. Simply divide your account value by $1,000 (for example, an
$8,600 account value divided by $1,000 = 8.6), then multiply the result by the number under the heading entitled “Expenses Paid During Period” to estimate the expenses you paid on your account during this period.
Hypothetical Example for Comparison Purposes
The fourth and fifth data columns in the table below provide information about hypothetical account values and hypothetical expenses based on the Fund’s actual expense ratio and an assumed rate of return of 5% per year before expenses, which is not the Fund’s actual return. The hypothetical account values and expenses may not be used to estimate the actual ending account balances or expenses you paid for the six-month period shown. You may use this information to compare the ongoing costs of investing in the Fund with the ongoing costs of investing in other mutual funds. To do so, compare this 5% hypothetical example with the 5% hypothetical examples that appear in the shareholder reports of the other mutual funds.
Please note that the expenses shown in the table are meant to highlight your ongoing costs only and do not reflect any transactional costs, such as exchange fees or sales charges (loads). Therefore, the fourth and fifth data columns of the table are useful in comparing ongoing costs only and will not help you determine the relative total costs of owning different funds. In addition, if these transactional costs were included, your costs would have been higher.
| Share Class | Beginning
Account
Value
5/1/23 | Ending Account
Value (Based
on Actual
Returns and
Expenses)
10/31/23 | Expenses
Paid
During
Period1 | Ending Account
Value (Based
on Hypothetical
5% Annualized
Return and
Actual Expenses)
10/31/23 | Expenses
Paid
During
Period1 | Net Expense
Ratio
During
Period2 |
| Class A Shares | $1,000.00 | $949.10 | $ 6.44 | $1,018.60 | $ 6.67 | 1.31% |
| Investor Class Shares | $1,000.00 | $947.80 | $ 7.27 | $1,017.74 | $ 7.53 | 1.48% |
| Class C Shares | $1,000.00 | $944.60 | $10.93 | $1,013.96 | $11.32 | 2.23% |
| Class I Shares | $1,000.00 | $949.60 | $ 4.96 | $1,020.11 | $ 5.14 | 1.01% |
| Class R6 Shares | $1,000.00 | $950.30 | $ 4.96 | $1,020.11 | $ 5.14 | 1.01% |
| 1. | Expenses are equal to the Fund’s annualized expense ratio of each class multiplied by the average account value over the period, divided by 365 and multiplied by 184 (to reflect the six-month period). The table above represents the actual expenses incurred during the six-month period. In addition to the fees and expenses which the Fund bears directly, it also indirectly bears a pro rata share of the fees and expenses of the underlying funds in which it invests. Such indirect expenses are not included in the above-reported expense figures. |
| 2. | Expenses are equal to the Fund's annualized expense ratio to reflect the six-month period. |
Country Composition as of October 31, 2023 (Unaudited)
| China | 30.7% |
| India | 17.4 |
| Taiwan | 15.8 |
| Republic of Korea | 12.1 |
| Brazil | 6.9 |
| South Africa | 4.3 |
| Mexico | 4.2 |
| Indonesia | 3.3 |
| Thailand | 2.3 |
| Turkey | 1.6% |
| Poland | 0.8 |
| Malaysia | 0.8 |
| Peru | 0.3 |
| Russia | 0.0‡ |
| Other Assets, Less Liabilities | –0.5 |
| | 100.0% |
| ‡ | Less than one–tenth of a percent. |
See Portfolio of Investments beginning on page 11 for specific holdings within these categories. The Fund's holdings are subject to change.
Top Ten Holdings and/or Issuers Held as of October 31, 2023 (excluding short-term investments) (Unaudited)
| 1. | Taiwan Semiconductor Manufacturing Co. Ltd. |
| 2. | Alibaba Group Holding Ltd. |
| 3. | Tencent Holdings Ltd. |
| 4. | SK Hynix, Inc. |
| 5. | Reliance Industries Ltd. |
| 6. | Bharti Airtel Ltd. |
| 7. | Samsung Electronics Co. Ltd. |
| 8. | Ping An Insurance Group Co. of China Ltd., Class H |
| 9. | KB Financial Group, Inc. |
| 10. | Axis Bank Ltd. |
| 8 | MainStay Candriam Emerging Markets Equity Fund |
Portfolio Management Discussion and Analysis (Unaudited)
Questions answered by Paulo Salazar, Philip Screve and Lamine Saidi of Candriam, the Fund’s Subadvisor.
How did MainStay Candriam Emerging Markets Equity Fund perform relative to its benchmark and peer group during the 12 months ended October 31, 2023?
For the 12 months ended October 31, 2023, Class I shares of MainStay Candriam Emerging Markets Equity Fund returned 2.87%, underperforming the 10.80% return of the Fund’s benchmark, the MSCI Emerging Markets Index (Net) (the “Index”). Over the same period, Class I shares also underperformed the 11.15% return of the Morningstar Diversified Emerging Markets Category Average.1
What factors affected the Fund’s relative performance during the reporting period?
The Fund underperformed the Index, largely due to disappointments related to China’s reopening and re-escalating U.S.-China tensions, which clouded emerging markets with significant uncertainties.
In November 2022, U.S. Consumer Price Index numbers came in softer than expected, raising hopes that monetary policies would soon loosen. That same month, U.S. President Biden and Chinese Premier Xi signaled a willingness to mend relations during the G20 summit. Led by China, emerging markets saw a temporary rebound in response to this encouraging news. Although the U.S. Federal Reserve (the “Fed”) maintained its hawkish stance on interest rate hikes, undermining optimism regarding monetary loosening, China completely reversed its long-standing “zero-COVID-19” policy to make way for an economic reopening. China’s move prompted a sharp rebound in Chinese equities, led mainly by higher beta2 and speculative market segments, including Chinese real estate and U.S.-listed China ADRs (American depository receipts). Due to the Fund’s largely defensive Chinese position, with a focus on higher quality companies and a lack of exposure to higher-beta and speculative segments, relative performance was negatively affected by this rebound.
Later in the reporting period, the initial optimism around China’s reopening and recovery lessened, as geopolitical risk returned to the table, and trade data out of China indicated that the recovery might not be as strong as expected. Despite news of improving corporate governance for some Chinese e-commerce names—including Alibaba and JD.com announcing the listing of underlying businesses—Chinese consumer discretionary companies remained under pressure as e-commerce competition increased and consumer spending in China remained below expectations. As a result, the Fund’s exposure to Chinese consumer discretionary stocks further detracted from relative performance. Despite Chinese policy support, optimism soon
faded as headwinds from rising rates and a stronger dollar dampened investors’ appetite for risk assets.
Elsewhere, American short sellers raised questions regarding financial dealing by Adani Group, a leading Indian conglomerate, which weighed on the market sentiment for Indian equities. Still, the Indian market gained ground as inflationary headwinds receded and expectations of peak tightening materialized. India remained the region’s defensive market, outperforming its regional counterparts as corporate growth soared in response to high levels of government spending, and consumer spending rose heading into festive season. The technology-heavy South Korean and Taiwanese markets also produced strong returns, riding the artificial intelligence (“AI”) tailwind, and driving gains in the semiconductor industry. Despite initial investor excitement about the potential positive impact of the U.S. Inflation Reduction Act on Korea’s electric vehicle (“EV”) supply chain, the market saw a fierce correction among EV-related names, as slowing demand and excessive capacity concerns raised questions. In Latin America, although there were some initial worries regarding the government spending plan of Lula da Silva, Brazil’s new president, markets steadily recovered as inflation came under better control. Mexico also remained a bright spot, as those markets benefited from increasing investments associated with U.S. reshoring efforts and resilient domestic demand. In emerging Europe, Polish and Greek election results restored political stability, despite concerns that regional weakness could spread. Turkey performed strongly as its central bank took steps to control inflation.
Within the commodities complex, gold prices recovered somewhat due to lingering uncertainty regarding U.S. financials, advancing expectations of a possible pivot from the Fed. Oil saw a sharp recovery, as the OPEC+ group of petroleum exporting nations announced a series of production cuts to support prices, while the unfortunate break out of conflict in the Middle East added to supply concerns. Industrial metals prices remained largely flat due to demand weakness in China and unease regarding a global economic slowdown.
During the reporting period, which sectors and/or countries were the strongest positive contributors to the Fund’s relative performance and which sectors and/or countries were particularly weak?
At a country level, Taiwan and, to a lesser extent, Turkey made the strongest positive contributions to the Fund’s returns relative to the Index. (Contributions take weightings and total returns into account.) In both countries, positive selection effect drove the Fund’s relative returns. Conversely, positions in China, Brazil and Indonesia detracted most from relative performance. Adverse stock selection was the main driver of the negative returns from
| 1. | See "Investment and Performance Comparison" for other share class returns, which may be higher or lower than Class I share returns, and for more information on benchmark and peer group returns. |
| 2. | Beta is a measure of volatility in relation to the market as a whole. A beta higher than 1 indicates that a security or portfolio will tend to exhibit higher volatility than the market. A beta lower than 1 indicates that a security or portfolio will tend to exhibit lower volatility than the market. |
China. Brazil and Indonesia produced negative returns and underperformed due to a combination of weak stock selection and overweight allocation.
At the sector level, the Fund saw positive relative contributions from consumer staples and, to a lesser extent, utilities and information technology. Selection effect produced the positive relative contributions in consumer staples and information technology. In the lagging utilities sector, the Fund’s underweight allocation bolstered relative returns. Conversely, industrials, consumer discretionary and financials detracted most from relative performance, driven primarily by adverse stock selection. Industrials also detracted from relative returns.
During the reporting period, which individual stocks made the strongest positive contributions to the Fund’s absolute performance and which stocks detracted the most?
Positions in Alchip Technologies, Accton Technology and Varun Beverages made the strongest positive contributions to the Fund’s absolute returns during the reporting period. Shares in Alchip, a Taiwanese semiconductor design company with extensive experience in advanced nodes, rose as a result of the company’s significant exposure to AI projects. Accton, a Taiwanese manufacturer of networking and communications equipment, also benefited from increased demand for AI-related products. Shares in Varun Beverages, a key player in the Indian beverages industry and second largest PepsiCo franchisee, performed well in response to the company’s market share gains and new product launches against a backdrop of increased electrification in India that allowed for better refrigeration.
The main detractors to absolute returns during the reporting period included LG Chem and Merdeka Copper Gold. Shares in LG Chem, a Korean petrochemical and advanced materials manufacturer with major exposure to the EV battery and cathode industries, corrected strongly due to increasing margin pressure and investor concerns regarding EV demand. Shares in Merdeka Copper Gold, a leading Indonesian miner with ambitious development plans in copper, gold and nickel related to EV battery manufacturing, also suffered as investors increasingly questioned the company’s capital expenditure needs in an environment of weaker basic metal prices, higher yields and end demand concerns. Both companies remained in the Fund at decreased weightings as of the end of the reporting period.
What were some of the Fund’s largest purchases and sales during the reporting period?
The largest purchases during the reporting period involved positions in Korean memory chip manufacturer SK Hynix and
Taiwanese semiconductor and foundry giant Taiwan Semiconductor Manufacturing Company (TSMC). The Fund gradually added to its position in SK Hynix in response to a progressive turnaround in the company’s DRAM and NAND businesses, and in recognition of the company’s leading position in developing HBM (High Bandwidth Memory), likely to benefit from increased AI demand. Similarly, the Fund added to its position in TSMC in response to a gradual semiconductor sector recovery driven by increased AI demand.
During the same period, we exited the Fund’s position in Eicher Motor, a leading Indian motorcycle manufacturer, and reduced holdings in Samsung SDI, a leading Korean EV battery manufacturer. We sold the position in Eicher Motor as a consequence of seasonal demand concerns and the potential for investors to lock in profits, reallocating the assets among better opportunities elsewhere in the Indian automotive industry. We reduced the position in Samsung SDI on margin pressure amid fierce competition in the EV battery market in an environment of increased battery commoditization.
How did the Fund’s sector and/or country weightings change during the reporting period?
We increased the Fund’s materials and financials exposure, partly to bring these underweight positions more closely in line with the Index, and partly to take advantage of the potential impact on cyclical sectors of China’s reopening. Conversely, we reduced the Fund’s exposure to industrials and health care to bring these overweight positions more closely in line with the Index.
How was the Fund positioned at the end of the reporting period?
As of October 31, 2023, the Fund held overweight positions relative to the Index in the consumer staples and information technology sectors. Conversely, the Fund held underweight positions in the utilities and the materials sectors.
The opinions expressed are those of the portfolio managers as of the date of this report and are subject to change. There is no guarantee that any forecasts will come to pass. This material does not constitute investment advice and is not intended as an endorsement of any specific investment.
| 10 | MainStay Candriam Emerging Markets Equity Fund |
Portfolio of Investments October 31, 2023†^
| | Shares | Value |
| Common Stocks 99.3% |
| Brazil 5.7% |
| Banco do Brasil SA (Banks) | 168,000 | $ 1,611,107 |
| Localiza Rent a Car SA (Ground Transportation) | 108,000 | 1,089,693 |
| MercadoLibre, Inc. (Broadline Retail) (a) | 860 | 1,067,037 |
| NU Holdings Ltd., Class A (Banks) (a) | 128,000 | 1,049,600 |
| PRIO SA (Oil, Gas & Consumable Fuels) (a) | 184,000 | 1,740,824 |
| Raia Drogasil SA (Consumer Staples Distribution & Retail) | 220,000 | 1,125,800 |
| WEG SA (Electrical Equipment) | 116,000 | 759,490 |
| | | 8,443,551 |
| China 30.7% |
| Aier Eye Hospital Group Co. Ltd., Class A (Health Care Providers & Services) | 250,756 | 627,395 |
| Airtac International Group (Machinery) | 23,000 | 751,657 |
| Alibaba Group Holding Ltd. (Broadline Retail) (a) | 486,000 | 4,971,637 |
| Anhui Huaheng Biotechnology Co. Ltd., Class A (Chemicals) | 55,044 | 763,445 |
| ANTA Sports Products Ltd. (Textiles, Apparel & Luxury Goods) | 52,000 | 587,099 |
| Baidu, Inc., Class A (Interactive Media & Services) (a) | 78,000 | 1,023,686 |
| Bank of Jiangsu Co. Ltd., Class A (Banks) | 2,099,960 | 1,979,984 |
| Beijing Compass Technology Development Co. Ltd., Class A (Capital Markets) (a) | 84,990 | 683,581 |
| BYD Co. Ltd., Class H (Automobiles) | 46,981 | 1,425,295 |
| BYD Electronic International Co. Ltd. (Communications Equipment) | 310,000 | 1,291,460 |
| China Merchants Bank Co. Ltd., Class H (Banks) | 310,000 | 1,180,537 |
| China Resources Land Ltd. (Real Estate Management & Development) | 357,902 | 1,340,089 |
| CMOC Group Ltd., Class H (Metals & Mining) | 2,189,239 | 1,303,710 |
| Contemporary Amperex Technology Co. Ltd., Class A (Electrical Equipment) | 21,082 | 534,677 |
| Flat Glass Group Co. Ltd., Class H (Semiconductors & Semiconductor Equipment) (a) | 180,000 | 322,495 |
| JD.com, Inc., Class A (Broadline Retail) | 46,000 | 586,665 |
| Kanzhun Ltd., ADR (Interactive Media & Services) (a) | 20,000 | 296,000 |
| Kingsoft Corp. Ltd. (Entertainment) | 44,000 | 153,503 |
| Kuaishou Technology (Interactive Media & Services) (a)(b) | 148,000 | 952,276 |
| Li Auto, Inc., Class A (Automobiles) (a) | 58,000 | 990,972 |
| | Shares | Value |
| |
| China (continued) |
| Longshine Technology Group Co. Ltd., Class A (Software) | 162,971 | $ 415,996 |
| Luzhou Laojiao Co. Ltd., Class A (Beverages) | 26,000 | 762,474 |
| Meituan (Hotels, Restaurants & Leisure) (a)(b) | 164,000 | 2,317,932 |
| NARI Technology Co. Ltd., Class A (Electrical Equipment) | 224,394 | 691,448 |
| NetEase, Inc. (Entertainment) | 80,000 | 1,720,584 |
| Ningbo Deye Technology Co. Ltd., Class A (Machinery) | 33,164 | 313,236 |
| Nongfu Spring Co. Ltd., Class H (Beverages) (b) | 250,000 | 1,423,277 |
| PDD Holdings, Inc., ADR (Broadline Retail) (a) | 23,000 | 2,332,660 |
| PetroChina Co. Ltd., Class H (Oil, Gas & Consumable Fuels) | 3,180,000 | 2,072,522 |
| Ping An Insurance Group Co. of China Ltd., Class H (Insurance) | 478,000 | 2,449,481 |
| Proya Cosmetics Co. Ltd., Class A (Personal Care Products) | 55,076 | 781,650 |
| Shandong Gold Mining Co. Ltd., Class H (Metals & Mining) (b) | 540,000 | 1,017,169 |
| Shanghai Baosight Software Co. Ltd., Class A (Software) | 108,081 | 630,193 |
| Shenzhen Inovance Technology Co. Ltd., Class A (Machinery) | 79,926 | 660,107 |
| Shenzhen Transsion Holdings Co. Ltd., Class A (Technology Hardware, Storage & Peripherals) | 40,000 | 733,305 |
| Tencent Holdings Ltd. (Interactive Media & Services) | 132,000 | 4,878,362 |
| Yadea Group Holdings Ltd. (Automobiles) (b) | 350,000 | 639,596 |
| | | 45,606,155 |
| India 17.4% |
| ABB India Ltd. (Electrical Equipment) | 29,000 | 1,431,317 |
| APL Apollo Tubes Ltd. (Metals & Mining) | 70,000 | 1,316,030 |
| Apollo Hospitals Enterprise Ltd. (Health Care Providers & Services) | 19,000 | 1,099,922 |
| Axis Bank Ltd. (Banks) | 204,000 | 2,405,722 |
| Bajaj Finance Ltd. (Consumer Finance) | 20,000 | 1,799,847 |
| Bharti Airtel Ltd. (Wireless Telecommunication Services) | 244,000 | 2,679,762 |
| HDFC Bank Ltd. (Banks) | 72,000 | 1,276,839 |
| ICICI Bank Ltd. (Banks) | 132,000 | 1,451,213 |
| Indraprastha Gas Ltd. (Gas Utilities) | 210,000 | 964,385 |
The notes to the financial statements are an integral part of, and should be read in conjunction with, the financial statements.
11
Portfolio of Investments October 31, 2023†^ (continued)
| | Shares | Value |
| Common Stocks (continued) |
| India (continued) |
| KPIT Technologies Ltd. (Software) | 62,000 | $ 906,669 |
| Mahindra & Mahindra Ltd. (Automobiles) | 70,000 | 1,226,322 |
| Reliance Industries Ltd. (Oil, Gas & Consumable Fuels) | 120,000 | 3,297,527 |
| SBI Cards & Payment Services Ltd. (Consumer Finance) | 110,000 | 985,800 |
| Tata Elxsi Ltd. (Software) | 8,000 | 732,675 |
| Tata Motors Ltd. (Automobiles) | 156,000 | 1,177,887 |
| Torrent Pharmaceuticals Ltd. (Pharmaceuticals) | 56,000 | 1,294,254 |
| Varun Beverages Ltd. (Beverages) | 169,000 | 1,844,697 |
| | | 25,890,868 |
| Indonesia 3.3% |
| Aneka Tambang Tbk. (Metals & Mining) | 5,000,000 | 536,670 |
| Bank Central Asia Tbk. PT (Banks) | 3,100,000 | 1,707,586 |
| Bank Mandiri Persero Tbk. PT (Banks) | 3,400,000 | 1,214,668 |
| Merdeka Copper Gold Tbk. PT (Metals & Mining) (a) | 3,800,000 | 533,459 |
| Sumber Alfaria Trijaya Tbk. PT (Consumer Staples Distribution & Retail) | 5,300,000 | 964,243 |
| | | 4,956,626 |
| Malaysia 0.8% |
| Press Metal Aluminium Holdings Bhd. (Metals & Mining) | 1,140,000 | 1,177,206 |
| Mexico 4.2% |
| America Movil SAB de CV (Wireless Telecommunication Services) | 2,200,000 | 1,816,961 |
| Cemex SAB de CV (Construction Materials) (a) | 1,200,000 | 720,839 |
| Gruma SAB de CV, Class B (Food Products) | 81,000 | 1,409,514 |
| Grupo Aeroportuario del Pacifico SAB de CV, Class B (Transportation Infrastructure) | 30,000 | 349,953 |
| Grupo Financiero Banorte SAB de CV, Class O (Banks) | 244,000 | 1,980,258 |
| | | 6,277,525 |
| Peru 0.3% |
| Credicorp Ltd. (Banks) | 3,200 | 399,872 |
| Poland 0.8% |
| Dino Polska SA (Consumer Staples Distribution & Retail) (a)(b) | 13,200 | 1,248,845 |
| | Shares | Value |
| |
| Republic of Korea 12.1% |
| Coupang, Inc. (Broadline Retail) (a) | 44,000 | $ 748,000 |
| Daejoo Electronic Materials Co. Ltd. (Electronic Equipment, Instruments & Components) | 7,800 | 398,504 |
| DB Insurance Co. Ltd. (Insurance) | 31,000 | 2,017,622 |
| JYP Entertainment Corp. (Entertainment) | 12,400 | 942,016 |
| KB Financial Group, Inc. (Banks) | 64,000 | 2,440,487 |
| LG Chem Ltd. (Chemicals) | 3,800 | 1,238,014 |
| Samsung Biologics Co. Ltd. (Life Sciences Tools & Services) (a)(b) | 2,000 | 1,049,943 |
| Samsung Electronics Co. Ltd. (Technology Hardware, Storage & Peripherals) | 53,000 | 2,625,375 |
| Samsung Engineering Co. Ltd. (Construction & Engineering) (a) | 82,000 | 1,442,005 |
| Samsung SDI Co. Ltd. (Electronic Equipment, Instruments & Components) | 800 | 252,046 |
| SK Hynix, Inc. (Semiconductors & Semiconductor Equipment) | 56,000 | 4,822,332 |
| | | 17,976,344 |
| Russia 0.0% ‡ |
| Magnit PJSC (Consumer Staples Distribution & Retail) (c)(d) | 6,769 | — |
| South Africa 4.3% |
| Capitec Bank Holdings Ltd. (Banks) | 13,800 | 1,225,351 |
| FirstRand Ltd. (Financial Services) | 500,000 | 1,648,290 |
| Gold Fields Ltd. (Metals & Mining) | 124,000 | 1,653,134 |
| Naspers Ltd., Class N (Broadline Retail) (a) | 11,600 | 1,810,770 |
| | | 6,337,545 |
| Taiwan 15.8% |
| Accton Technology Corp. (Communications Equipment) | 152,000 | 2,336,118 |
| Alchip Technologies Ltd. (Semiconductors & Semiconductor Equipment) | 19,000 | 1,537,691 |
| Chailease Holding Co. Ltd. (Financial Services) | 256,000 | 1,385,170 |
| CTBC Financial Holding Co. Ltd. (Banks) | 2,380,000 | 1,786,743 |
| Delta Electronics, Inc. (Electronic Equipment, Instruments & Components) | 194,000 | 1,737,537 |
| E Ink Holdings, Inc. (Electronic Equipment, Instruments & Components) | 92,000 | 476,522 |
| Quanta Computer, Inc. (Technology Hardware, Storage & Peripherals) | 136,000 | 792,477 |
| Realtek Semiconductor Corp. (Semiconductors & Semiconductor Equipment) | 54,000 | 668,445 |
The notes to the financial statements are an integral part of, and should be read in conjunction with, the financial statements.
| 12 | MainStay Candriam Emerging Markets Equity Fund |
| | Shares | | Value |
| Common Stocks (continued) |
| Taiwan (continued) |
| Taiwan Semiconductor Manufacturing Co. Ltd. (Semiconductors & Semiconductor Equipment) | 750,000 | | $ 12,232,157 |
| Voltronic Power Technology Corp. (Electrical Equipment) | 15,000 | | 598,890 |
| | | | 23,551,750 |
| Thailand 2.3% |
| Airports of Thailand PCL, NVDR (Transportation Infrastructure) (a) | 860,000 | | 1,597,134 |
| Bangkok Dusit Medical Services PCL, NVDR (Health Care Providers & Services) | 1,000,000 | | 737,289 |
| CP ALL PCL, NVDR (Consumer Staples Distribution & Retail) | 320,000 | | 491,897 |
| Kasikornbank PCL, NVDR (Banks) | 180,000 | | 658,552 |
| | | | 3,484,872 |
| Turkey 1.6% |
| BIM Birlesik Magazalar A/S (Consumer Staples Distribution & Retail) | 194,000 | | 1,863,326 |
| Turkiye Garanti Bankasi A/S (Banks) | 270,000 | | 448,105 |
| | | | 2,311,431 |
Total Common Stocks
(Cost $150,532,227) | | | 147,662,590 |
| Preferred Stock 1.2% |
| Brazil 1.2% |
| Itau Unibanco Holding SA (Banks) | 338,000 | | 1,798,019 |
Total Preferred Stock
(Cost $1,619,265) | | | 1,798,019 |
Total Investments
(Cost $152,151,492) | 100.5% | | 149,460,609 |
| Other Assets, Less Liabilities | (0.5) | | (722,469) |
| Net Assets | 100.0% | | $ 148,738,140 |
| † | Percentages indicated are based on Fund net assets. |
| ^ | Industry and country classifications may be different than those used for compliance monitoring purposes. |
| ‡ | Less than one-tenth of a percent. |
| (a) | Non-income producing security. |
| (b) | May be sold to institutional investors only under Rule 144A or securities offered pursuant to Section 4(a)(2) of the Securities Act of 1933, as amended. |
| (c) | Illiquid security—As of October 31, 2023, the total market value deemed illiquid under procedures approved by the Board of Trustees was $0, which represented less than one-tenth of a percent of the Fund’s net assets. (Unaudited) |
| (d) | Security in which significant unobservable inputs (Level 3) were used in determining fair value. |
| Abbreviation(s): |
| ADR—American Depositary Receipt |
| NVDR—Non-Voting Depositary Receipt |
| PCL—Provision for Credit Losses |
The notes to the financial statements are an integral part of, and should be read in conjunction with, the financial statements.
13
Portfolio of Investments October 31, 2023†^ (continued)
The following is a summary of the fair valuations according to the inputs used as of October 31, 2023, for valuing the Fund’s assets:
| Description | Quoted
Prices in
Active
Markets for
Identical
Assets
(Level 1) | | Significant
Other
Observable
Inputs
(Level 2) | | Significant
Unobservable
Inputs
(Level 3) | | Total |
| Asset Valuation Inputs | | | | | | | |
| Investments in Securities (a) | | | | | | | |
| Common Stocks | $ 147,662,590 | | $ — | | $ — | | $ 147,662,590 |
| Preferred Stock | 1,798,019 | | — | | — | | 1,798,019 |
| Total Investments in Securities | $ 149,460,609 | | $ — | | $ — | | $ 149,460,609 |
| (a) | For a complete listing of investments and their industries, see the Portfolio of Investments. |
The notes to the financial statements are an integral part of, and should be read in conjunction with, the financial statements.
| 14 | MainStay Candriam Emerging Markets Equity Fund |
The table below sets forth the diversification of the Fund’s investments by industry.
Industry Diversification
| | Value | | Percent †^ |
| Automobiles | $ 5,460,072 | | 3.7% |
| Banks | 24,614,643 | | 16.6 |
| Beverages | 4,030,448 | | 2.7 |
| Broadline Retail | 11,516,769 | | 7.7 |
| Capital Markets | 683,581 | | 0.5 |
| Chemicals | 2,001,459 | | 1.3 |
| Communications Equipment | 3,627,578 | | 2.4 |
| Construction & Engineering | 1,442,005 | | 1.0 |
| Construction Materials | 720,839 | | 0.5 |
| Consumer Finance | 2,785,647 | | 1.9 |
| Consumer Staples Distribution & Retail | 5,694,111 | | 3.8 |
| Electrical Equipment | 4,015,822 | | 2.7 |
| Electronic Equipment, Instruments & Components | 2,864,609 | | 1.9 |
| Entertainment | 2,816,103 | | 1.9 |
| Financial Services | 3,033,460 | | 2.0 |
| Food Products | 1,409,514 | | 0.9 |
| Gas Utilities | 964,385 | | 0.6 |
| Ground Transportation | 1,089,693 | | 0.7 |
| Health Care Providers & Services | 2,464,606 | | 1.7 |
| Hotels, Restaurants & Leisure | 2,317,932 | | 1.6 |
| Insurance | 4,467,103 | | 3.0 |
| Interactive Media & Services | 7,150,324 | | 4.8 |
| Life Sciences Tools & Services | 1,049,943 | | 0.7 |
| Machinery | 1,725,000 | | 1.2 |
| Metals & Mining | 7,537,378 | | 5.1 |
| Oil, Gas & Consumable Fuels | 7,110,873 | | 4.8 |
| Personal Care Products | 781,650 | | 0.5 |
| Pharmaceuticals | 1,294,254 | | 0.9 |
| Real Estate Management & Development | 1,340,089 | | 0.9 |
| Semiconductors & Semiconductor Equipment | 19,583,120 | | 13.2 |
| Software | 2,685,533 | | 1.8 |
| Technology Hardware, Storage & Peripherals | 4,151,157 | | 2.8 |
| Textiles, Apparel & Luxury Goods | 587,099 | | 0.4 |
| Transportation Infrastructure | 1,947,087 | | 1.3 |
| Wireless Telecommunication Services | 4,496,723 | | 3.0 |
| | 149,460,609 | | 100.5 |
| Other Assets, Less Liabilities | (722,469) | | (0.5) |
| Net Assets | $148,738,140 | | 100.0% |
| † | Percentages indicated are based on Fund net assets. |
| ^ | Industry classifications may be different than those used for compliance monitoring purposes. |
The notes to the financial statements are an integral part of, and should be read in conjunction with, the financial statements.
15
Statement of Assets and Liabilities as of October 31, 2023
| Assets |
Investment in securities, at value
(identified cost $152,151,492) | $149,460,609 |
| Cash | 2,014,896 |
Cash denominated in foreign currencies
(identified cost $210,944) | 211,081 |
| Receivables: | |
| Investment securities sold | 682,758 |
| Fund shares sold | 217,611 |
| Dividends | 73,369 |
| Securities lending | 1,580 |
| Other assets | 60,671 |
| Total assets | 152,722,575 |
| Liabilities |
| Payables: | |
| Fund shares redeemed | 3,387,265 |
| Foreign capital gains tax (See Note 2) | 295,269 |
| Investment securities purchased | 123,875 |
| Manager (See Note 3) | 118,710 |
| Custodian | 47,154 |
| Professional fees | 6,529 |
| Transfer agent (See Note 3) | 3,816 |
| Shareholder communication | 628 |
| NYLIFE Distributors (See Note 3) | 521 |
| Trustees | 5 |
| Accrued expenses | 663 |
| Total liabilities | 3,984,435 |
| Net assets | $148,738,140 |
| Composition of Net Assets |
| Shares of beneficial interest outstanding (par value of $.001 per share) unlimited number of shares authorized | $ 17,646 |
| Additional paid-in-capital | 180,370,602 |
| | 180,388,248 |
| Total distributable earnings (loss) | (31,650,108) |
| Net assets | $148,738,140 |
| Class A | |
| Net assets applicable to outstanding shares | $ 1,909,527 |
| Shares of beneficial interest outstanding | 227,703 |
| Net asset value per share outstanding | $ 8.39 |
| Maximum sales charge (5.50% of offering price) | 0.49 |
| Maximum offering price per share outstanding | $ 8.88 |
| Investor Class | |
| Net assets applicable to outstanding shares | $ 197,589 |
| Shares of beneficial interest outstanding | 23,629 |
| Net asset value per share outstanding | $ 8.36 |
| Maximum sales charge (5.00% of offering price) | 0.44 |
| Maximum offering price per share outstanding | $ 8.80 |
| Class C | |
| Net assets applicable to outstanding shares | $ 70,575 |
| Shares of beneficial interest outstanding | 8,629 |
| Net asset value and offering price per share outstanding | $ 8.18 |
| Class I | |
| Net assets applicable to outstanding shares | $ 20,400,695 |
| Shares of beneficial interest outstanding | 2,404,811 |
| Net asset value and offering price per share outstanding | $ 8.48 |
| Class R6 | |
| Net assets applicable to outstanding shares | $126,159,754 |
| Shares of beneficial interest outstanding | 14,981,596 |
| Net asset value and offering price per share outstanding | $ 8.42 |
The notes to the financial statements are an integral part of, and should be read in conjunction with, the financial statements.
| 16 | MainStay Candriam Emerging Markets Equity Fund |
Statement of Operations for the year ended October 31, 2023
| Investment Income (Loss) |
| Income | |
| Dividends (net of foreign tax withholding of $365,403) | $ 3,344,740 |
| Securities lending, net | 4,511 |
| Other | 43,526 |
| Total income | 3,392,777 |
| Expenses | |
| Manager (See Note 3) | 1,504,198 |
| Custodian | 144,330 |
| Professional fees | 102,829 |
| Registration | 71,791 |
| Transfer agent (See Note 3) | 22,677 |
| Shareholder communication | 9,922 |
| Distribution/Service—Class A (See Note 3) | 5,511 |
| Distribution/Service—Investor Class (See Note 3) | 631 |
| Distribution/Service—Class C (See Note 3) | 978 |
| Trustees | 3,881 |
| Miscellaneous | 8,314 |
| Total expenses before waiver/reimbursement | 1,875,062 |
| Expense waiver/reimbursement from Manager (See Note 3) | (346,253) |
| Reimbursement from prior custodian(a) | (266) |
| Net expenses | 1,528,543 |
| Net investment income (loss) | 1,864,234 |
| Realized and Unrealized Gain (Loss) |
| Net realized gain (loss) on: | |
| Unaffiliated investment transactions(b) | (12,058,313) |
| Foreign currency transactions | (192,760) |
| Net realized gain (loss) | (12,251,073) |
| Net change in unrealized appreciation (depreciation) on: | |
| Unaffiliated investments(c) | 9,332,687 |
| Translation of other assets and liabilities in foreign currencies | 330 |
| Net change in unrealized appreciation (depreciation) | 9,333,017 |
| Net realized and unrealized gain (loss) | (2,918,056) |
| Net increase (decrease) in net assets resulting from operations | $ (1,053,822) |
| (a) | Represents a refund for overbilling of custody fees. |
| (b) | Realized gain (loss) on security transactions recorded net of foreign capital gains tax in the amount of $(70,937). |
| (c) | Net change in unrealized appreciation (depreciation) on investments recorded net of foreign capital gains tax in the amount of $(142,871). |
The notes to the financial statements are an integral part of, and should be read in conjunction with, the financial statements.
17
Statements of Changes in Net Assets
for the years ended October 31, 2023 and October 31, 2022
| | 2023 | 2022 |
| Increase (Decrease) in Net Assets |
| Operations: | | |
| Net investment income (loss) | $ 1,864,234 | $ 1,623,183 |
| Net realized gain (loss) | (12,251,073) | (17,148,783) |
| Net change in unrealized appreciation (depreciation) | 9,333,017 | (28,313,998) |
| Net increase (decrease) in net assets resulting from operations | (1,053,822) | (43,839,598) |
| Distributions to shareholders: | | |
| Class A | (17,148) | (13,154) |
| Investor Class | (1,668) | (2,228) |
| Class I | (145,979) | (35,091) |
| Class R6 | (1,134,919) | (751,850) |
| Total distributions to shareholders | (1,299,714) | (802,323) |
| Capital share transactions: | | |
| Net proceeds from sales of shares | 60,890,791 | 69,723,839 |
| Net asset value of shares issued to shareholders in reinvestment of distributions | 1,018,121 | 792,715 |
| Cost of shares redeemed | (19,933,822) | (8,846,223) |
| Increase (decrease) in net assets derived from capital share transactions | 41,975,090 | 61,670,331 |
| Net increase (decrease) in net assets | 39,621,554 | 17,028,410 |
| Net Assets |
| Beginning of year | 109,116,586 | 92,088,176 |
| End of year | $148,738,140 | $109,116,586 |
The notes to the financial statements are an integral part of, and should be read in conjunction with, the financial statements.
| 18 | MainStay Candriam Emerging Markets Equity Fund |
Financial Highlights selected per share data and ratios
| | Year Ended October 31, |
| Class A | 2023 | | 2022 | | 2021 | | 2020 | | 2019 |
| Net asset value at beginning of year | $ 8.24 | | $ 12.73 | | $ 10.66 | | $ 8.97 | | $ 7.98 |
| Net investment income (loss) (a) | 0.08 | | 0.13 | | 0.04 | | 0.02 | | 0.10 |
| Net realized and unrealized gain (loss) | 0.14 | | (4.56) | | 2.06 | | 1.85 | | 0.93 |
| Total from investment operations | 0.22 | | (4.43) | | 2.10 | | 1.87 | | 1.03 |
| Less distributions: | | | | | | | | | |
| From net investment income | (0.07) | | (0.06) | | (0.03) | | (0.18) | | (0.04) |
| Net asset value at end of year | $ 8.39 | | $ 8.24 | | $ 12.73 | | $ 10.66 | | $ 8.97 |
| Total investment return (b) | 2.60% | | (34.95)% | | 19.68% | | 21.14% | | 12.96% |
| Ratios (to average net assets)/Supplemental Data: | | | | | | | | | |
| Net investment income (loss) | 0.84% | | 1.25% | | 0.30% | | 0.22% | | 1.18% |
| Net expenses (c) | 1.33% | | 1.44% | | 1.47% | | 1.50% | | 1.50% |
| Expenses (before waiver/reimbursement) (c) | 1.55% | | 1.77% | | 1.75% | | 2.00% | | 1.77% |
| Portfolio turnover rate | 60% | | 105% | | 74% | | 122% | | 107% |
| Net assets at end of year (in 000’s) | $ 1,910 | | $ 2,144 | | $ 2,921 | | $ 1,111 | | $ 77 |
| (a) | Per share data based on average shares outstanding during the year. |
| (b) | Total investment return is calculated exclusive of sales charges and assumes the reinvestment of dividends and distributions. For periods of less than one year, total return is not annualized. |
| (c) | In addition to the fees and expenses which the Fund bears directly, it also indirectly bears a pro-rata share of the fees and expenses of the underlying funds in which it invests. Such indirect expenses are not included in the above expense ratios. |
| | Year Ended October 31, |
| Investor Class | 2023 | | 2022 | | 2021 | | 2020 | | 2019 |
| Net asset value at beginning of year | $ 8.22 | | $ 12.70 | | $ 10.65 | | $ 8.95 | | $ 7.97 |
| Net investment income (loss) (a) | 0.06 | | 0.12 | | 0.02 | | 0.02 | | 0.07 |
| Net realized and unrealized gain (loss) | 0.13 | | (4.55) | | 2.05 | | 1.84 | | 0.94 |
| Total from investment operations | 0.19 | | (4.43) | | 2.07 | | 1.86 | | 1.01 |
| Less distributions: | | | | | | | | | |
| From net investment income | (0.05) | | (0.05) | | (0.02) | | (0.16) | | (0.03) |
| Net asset value at end of year | $ 8.36 | | $ 8.22 | | $ 12.70 | | $ 10.65 | | $ 8.95 |
| Total investment return (b) | 2.33% | | (34.99)% | | 19.49% | | 21.11%(c) | | 12.71%(c) |
| Ratios (to average net assets)/Supplemental Data: | | | | | | | | | |
| Net investment income (loss) | 0.68% | | 1.09% | | 0.15% | | 0.17% | | 0.76% |
| Net expenses (d) | 1.50% | | 1.57% | | 1.52% | | 1.52% | | 1.66% |
| Expenses (before waiver/reimbursement) (d) | 1.72% | | 1.88% | | 1.81% | | 2.03% | | 1.92% |
| Portfolio turnover rate | 60% | | 105% | | 74% | | 122% | | 107% |
| Net assets at end of year (in 000's) | $ 198 | | $ 256 | | $ 507 | | $ 360 | | $ 121 |
| (a) | Per share data based on average shares outstanding during the year. |
| (b) | Total investment return is calculated exclusive of sales charges and assumes the reinvestment of dividends and distributions. For periods of less than one year, total return is not annualized. |
| (c) | Total investment return may reflect adjustments to conform to generally accepted accounting principles. |
| (d) | In addition to the fees and expenses which the Fund bears directly, it also indirectly bears a pro-rata share of the fees and expenses of the underlying funds in which it invests. Such indirect expenses are not included in the above expense ratios. |
The notes to the financial statements are an integral part of, and should be read in conjunction with, the financial statements.
19
Financial Highlights selected per share data and ratios
| | Year Ended October 31, |
| Class C | 2023 | | 2022 | | 2021 | | 2020 | | 2019 |
| Net asset value at beginning of year | $ 8.05 | | $ 12.48 | | $ 10.52 | | $ 8.85 | | $ 7.91 |
| Net investment income (loss) (a) | (0.02) | | 0.04 | | (0.08) | | (0.05) | | (0.01) |
| Net realized and unrealized gain (loss) | 0.15 | | (4.47) | | 2.04 | | 1.83 | | 0.95 |
| Total from investment operations | 0.13 | | (4.43) | | 1.96 | | 1.78 | | 0.94 |
| Less distributions: | | | | | | | | | |
| From net investment income | — | | — | | — | | (0.11) | | — |
| Net asset value at end of year | $ 8.18 | | $ 8.05 | | $ 12.48 | | $ 10.52 | | $ 8.85 |
| Total investment return (b) | 1.61% | | (35.50)% | | 18.63%(c) | | 20.23% | | 11.88% |
| Ratios (to average net assets)/Supplemental Data: | | | | | | | | | |
| Net investment income (loss) | (0.18)% | | 0.36% | | (0.63)% | | (0.52)% | | (0.13)% |
| Net expenses (d) | 2.25% | | 2.31% | | 2.27% | | 2.27% | | 2.40% |
| Expenses (before waiver/reimbursement) (d) | 2.48% | | 2.64% | | 2.57% | | 2.78% | | 2.67% |
| Portfolio turnover rate | 60% | | 105% | | 74% | | 122% | | 107% |
| Net assets at end of year (in 000’s) | $ 71 | | $ 141 | | $ 212 | | $ 217 | | $ 56 |
| (a) | Per share data based on average shares outstanding during the year. |
| (b) | Total investment return is calculated exclusive of sales charges and assumes the reinvestment of dividends and distributions. For periods of less than one year, total return is not annualized. |
| (c) | Total investment return may reflect adjustments to conform to generally accepted accounting principles. |
| (d) | In addition to the fees and expenses which the Fund bears directly, it also indirectly bears a pro-rata share of the fees and expenses of the underlying funds in which it invests. Such indirect expenses are not included in the above expense ratios. |
| | Year Ended October 31, |
| Class I | 2023 | | 2022 | | 2021 | | 2020 | | 2019 |
| Net asset value at beginning of year | $ 8.33 | | $ 12.85 | | $ 10.77 | | $ 8.99 | | $ 8.00 |
| Net investment income (loss) (a) | 0.12 | | 0.16 | | 0.05 | | 0.05 | | (0.02) |
| Net realized and unrealized gain (loss) | 0.12 | | (4.58) | | 2.11 | | 1.87 | | 1.07 |
| Total from investment operations | 0.24 | | (4.42) | | 2.16 | | 1.92 | | 1.05 |
| Less distributions: | | | | | | | | | |
| From net investment income | (0.09) | | (0.10) | | (0.08) | | (0.14) | | (0.06) |
| Net asset value at end of year | $ 8.48 | | $ 8.33 | | $ 12.85 | | $ 10.77 | | $ 8.99 |
| Total investment return (b) | 2.87% | | (34.65)% | | 20.05% | | 21.60% | | 13.28% |
| Ratios (to average net assets)/Supplemental Data: | | | | | | | | | |
| Net investment income (loss) | 1.28% | | 1.65% | | 0.38% | | 0.55% | | (0.26)% |
| Net expenses (c) | 1.01% | | 1.06% | | 1.07% | | 1.15% | | 1.15% |
| Expenses (before waiver/reimbursement) (c) | 1.29% | | 1.54% | | 1.52% | | 1.79% | | 1.52% |
| Portfolio turnover rate | 60% | | 105% | | 74% | | 122% | | 107% |
| Net assets at end of year (in 000’s) | $ 20,401 | | $ 12,977 | | $ 4,532 | | $ 30 | | $ 40 |
| (a) | Per share data based on average shares outstanding during the year. |
| (b) | Total investment return is calculated exclusive of sales charges and assumes the reinvestment of dividends and distributions. Class I shares are not subject to sales charges. For periods of less than one year, total return is not annualized. |
| (c) | In addition to the fees and expenses which the Fund bears directly, it also indirectly bears a pro-rata share of the fees and expenses of the underlying funds in which it invests. Such indirect expenses are not included in the above expense ratios. |
The notes to the financial statements are an integral part of, and should be read in conjunction with, the financial statements.
| 20 | MainStay Candriam Emerging Markets Equity Fund |
Financial Highlights selected per share data and ratios
| | Year Ended October 31, |
| Class R6 | 2023 | | 2022 | | 2021 | | 2020 | | 2019 |
| Net asset value at beginning of year | $ 8.28 | | $ 12.79 | | $ 10.71 | | $ 9.00 | | $ 8.01 |
| Net investment income (loss) (a) | 0.11 | | 0.17 | | 0.08 | | 0.05 | | 0.10 |
| Net realized and unrealized gain (loss) | 0.13 | | (4.57) | | 2.06 | | 1.86 | | 0.95 |
| Total from investment operations | 0.24 | | (4.40) | | 2.14 | | 1.91 | | 1.05 |
| Less distributions: | | | | | | | | | |
| From net investment income | (0.10) | | (0.11) | | (0.06) | | (0.20) | | (0.06) |
| Net asset value at end of year | $ 8.42 | | $ 8.28 | | $ 12.79 | | $ 10.71 | | $ 9.00 |
| Total investment return (b) | 2.82% | | (34.65)% | | 20.05% | | 21.61% | | 13.29% |
| Ratios (to average net assets)/Supplemental Data: | | | | | | | | | |
| Net investment income (loss) | 1.24% | | 1.63% | | 0.58% | | 0.51% | | 1.11% |
| Net expenses (c) | 1.01% | | 1.06% | | 1.07% | | 1.15% | | 1.15% |
| Expenses (before waiver/reimbursement) (c) | 1.23% | | 1.40% | | 1.32% | | 1.53% | | 1.42% |
| Portfolio turnover rate | 60% | | 105% | | 74% | | 122% | | 107% |
| Net assets at end of year (in 000’s) | $ 126,160 | | $ 93,598 | | $ 83,916 | | $ 83,230 | | $ 49,111 |
| (a) | Per share data based on average shares outstanding during the year. |
| (b) | Total investment return is calculated exclusive of sales charges and assumes the reinvestment of dividends and distributions. Class R6 shares are not subject to sales charges. For periods of less than one year, total return is not annualized. |
| (c) | In addition to the fees and expenses which the Fund bears directly, it also indirectly bears a pro-rata share of the fees and expenses of the underlying funds in which it invests. Such indirect expenses are not included in the above expense ratios. |
The notes to the financial statements are an integral part of, and should be read in conjunction with, the financial statements.
21
Notes to Financial Statements
Note 1-Organization and Business
MainStay Funds Trust (the “Trust”) was organized as a Delaware statutory trust on April 28, 2009. The Trust is registered under the Investment Company Act of 1940, as amended (the “1940 Act”), as an open-end management investment company, and is comprised of thirty-seven funds (collectively referred to as the “Funds”). These financial statements and notes relate to the MainStay Candriam Emerging Markets Equity Fund (the "Fund"), a “diversified” fund, as that term is defined in the 1940 Act, as interpreted or modified by regulatory authorities having jurisdiction, from time to time.
The following table lists the Fund's share classes that have been registered and commenced operations:
| Class | Commenced Operations |
| Class A | November 15, 2017 |
| Investor Class | November 15, 2017 |
| Class C | November 15, 2017 |
| Class I | November 15, 2017 |
| Class R6 | November 15, 2017 |
Class A and Investor Class shares are offered at net asset value (“NAV”) per share plus an initial sales charge. No initial sales charge applies to investments of $1 million or more (and certain other qualified purchases) in Class A and Investor Class shares. A contingent deferred sales charge (“CDSC”) of 1.00% may be imposed on certain redemptions of Class A and Investor Class shares made within 18 months of the date of purchase on shares that were purchased without an initial sales charge. Class C shares are offered at NAV without an initial sales charge, although a 1.00% CDSC may be imposed on certain redemptions of such shares made within one year of the date of purchase of Class C shares. Class I and Class R6 shares are offered at NAV without a sales charge. Depending upon eligibility, Class C shares convert to either Class A or Investor Class shares at the end of the calendar quarter eight years after the date they were purchased. Additionally, Investor Class shares may convert automatically to Class A shares. Under certain circumstances and as may be permitted by the Trust’s multiple class plan pursuant to Rule 18f-3 under the 1940 Act, specified share classes of the Fund may be converted to one or more other share classes of the Fund as disclosed in the capital share transactions within these Notes. The classes of shares have the same voting (except for issues that relate solely to one class), dividend, liquidation and other rights, and the same terms and conditions, except that under distribution plans pursuant to Rule 12b-1 under the 1940 Act, Class C shares are subject to higher distribution and/or service fees than Class A and Investor Class shares. Class I and Class R6 shares are not subject to a distribution and/or service fee.
The Fund's investment objective is to seek long-term capital appreciation.
Note 2–Significant Accounting Policies
The Fund is an investment company and accordingly follows the investment company accounting and reporting guidance of the Financial Accounting Standards Board (“FASB”) Accounting Standards Codification
Topic 946 Financial Services—Investment Companies. The Fund prepares its financial statements in accordance with generally accepted accounting principles (“GAAP”) in the United States of America and follows the significant accounting policies described below.
(A) Securities Valuation. Investments are usually valued as of the close of regular trading on the New York Stock Exchange (the "Exchange") (usually 4:00 p.m. Eastern time) on each day the Fund is open for business ("valuation date").
Pursuant to Rule 2a-5 under the 1940 Act, the Board of Trustees of the Trust (the "Board") has designated New York Life Investment Management LLC (“New York Life Investments” or the "Manager") as its Valuation Designee (the "Valuation Designee"). The Valuation Designee is responsible for performing fair valuations relating to all investments in the Fund’s portfolio for which market quotations are not readily available; periodically assessing and managing material valuation risks; establishing and applying fair value methodologies; testing fair valuation methodologies; evaluating and overseeing pricing services; ensuring appropriate segregation of valuation and portfolio management functions; providing quarterly, annual and prompt reporting to the Board, as appropriate; identifying potential conflicts of interest; and maintaining appropriate records. The Valuation Designee has established a valuation committee ("Valuation Committee") to assist in carrying out the Valuation Designee’s responsibilities and establish prices of securities for which market quotations are not readily available. The Fund's and the Valuation Designee's policies and procedures ("Valuation Procedures") govern the Valuation Designee’s selection and application of methodologies for determining and calculating the fair value of Fund investments. The Valuation Designee may value the Fund's portfolio securities for which market quotations are not readily available and other Fund assets utilizing inputs from pricing services and other third-party sources. The Valuation Committee meets (in person, via electronic mail or via teleconference) on an ad-hoc basis to determine fair valuations and on a quarterly basis to review fair value events with respect to certain securities for which market quotations are not readily available, including valuation risks and back-testing results, and preview reports to the Board.
The Valuation Committee establishes prices of securities for which market quotations are not readily available based on such methodologies and measurements on a regular basis after considering information that is reasonably available and deemed relevant by the Valuation Committee. The Board shall oversee the Valuation Designee and review fair valuation materials on a prompt, quarterly and annual basis and approve proposed revisions to the Valuation Procedures.
Investments for which market quotations are not readily available are valued at fair value as determined in good faith pursuant to the Valuation Procedures. A market quotation is readily available only when that quotation is a quoted price (unadjusted) in active markets for identical investments that the Fund can access at the measurement date, provided that a quotation will not be readily available if it is not reliable. "Fair value" is defined as the price the Fund would reasonably expect to receive upon selling an asset or liability in an orderly transaction to an independent
| 22 | MainStay Candriam Emerging Markets Equity Fund |
buyer in the principal or most advantageous market for the asset or liability. Fair value measurements are determined within a framework that establishes a three-tier hierarchy that maximizes the use of observable market data and minimizes the use of unobservable inputs to establish a classification of fair value measurements for disclosure purposes. "Inputs" refer broadly to the assumptions that market participants would use in pricing the asset or liability, including assumptions about risk, such as the risk inherent in a particular valuation technique used to measure fair value using a pricing model and/or the risk inherent in the inputs for the valuation technique. Inputs may be observable or unobservable. Observable inputs reflect the assumptions market participants would use in pricing the asset or liability based on market data obtained from sources independent of the Fund. Unobservable inputs reflect the Fund’s own assumptions about the assumptions market participants would use in pricing the asset or liability based on the information available. The inputs or methodology used for valuing assets or liabilities may not be an indication of the risks associated with investing in those assets or liabilities. The three-tier hierarchy of inputs is summarized below.
| • | Level 1—quoted prices (unadjusted) in active markets for an identical asset or liability |
| • | Level 2—other significant observable inputs (including quoted prices for a similar asset or liability in active markets, interest rates and yield curves, prepayment speeds, credit risk, etc.) |
| • | Level 3—significant unobservable inputs (including the Fund's own assumptions about the assumptions that market participants would use in measuring fair value of an asset or liability) |
The level of an asset or liability within the fair value hierarchy is based on the lowest level of an input, both individually and in the aggregate, that is significant to the fair value measurement. The aggregate value by input level of the Fund’s assets and liabilities as of October 31, 2023, is included at the end of the Portfolio of Investments.
The Fund may use third-party vendor evaluations, whose prices may be derived from one or more of the following standard inputs, among others:
| • Broker/dealer quotes | • Benchmark securities |
| • Two-sided markets | • Reference data (corporate actions or material event notices) |
| • Bids/offers | • Monthly payment information |
| • Industry and economic events | • Reported trades |
An asset or liability for which a market quotation is not readily available is valued by methods deemed reasonable in good faith by the Valuation Committee, following the Valuation Procedures to represent fair value. Under these procedures, the Valuation Designee generally uses a market-based approach which may use related or comparable assets or liabilities, recent transactions, market multiples, book values and other relevant information. The Valuation Designee may also use an income-based valuation approach in which the anticipated future cash flows of the asset or liability are discounted to calculate fair value. Discounts may also be applied due to the nature and/or duration of any
restrictions on the disposition of the asset or liability. Fair value represents a good faith approximation of the value of a security. Fair value determinations involve the consideration of a number of subjective factors, an analysis of applicable facts and circumstances and the exercise of judgment. As a result, it is possible that the fair value for a security determined in good faith in accordance with the Valuation Procedures may differ from valuations for the same security determined for other funds using their own valuation procedures. Although the Valuation Procedures are designed to value a security at the price the Fund may reasonably expect to receive upon the security's sale in an orderly transaction, there can be no assurance that any fair value determination thereunder would, in fact, approximate the amount that the Fund would actually realize upon the sale of the security or the price at which the security would trade if a reliable market price were readily available. During the year ended October 31, 2023, there were no material changes to the fair value methodologies.
Securities which may be valued in this manner include, but are not limited to: (i) a security for which trading has been halted or suspended or otherwise does not have a readily available market quotation on a given day; (ii) a debt security that has recently gone into default and for which there is not a current market quotation; (iii) a security of an issuer that has entered into a restructuring; (iv) a security that has been delisted from a national exchange; (v) a security subject to trading collars for which no or limited trading takes place; and (vi) a security whose principal market has been temporarily closed at a time when, under normal conditions, it would be open. Securities valued in this manner are generally categorized as Level 2 or 3 in the hierarchy. As of October 31, 2023, securities that were fair valued in such a manner are shown in the Portfolio of Investments.
Certain securities held by the Fund may principally trade in foreign markets. Events may occur between the time the foreign markets close and the time at which the Fund's NAVs are calculated. These events may include, but are not limited to, situations relating to a single issuer in a market sector, significant fluctuations in U.S. or foreign markets, natural disasters, armed conflicts, governmental actions or other developments not tied directly to the securities markets. Should the Valuation Designee conclude that such events may have affected the accuracy of the last price of such securities reported on the local foreign market, the Valuation Designee may, pursuant to the Valuation Procedures, adjust the value of the local price to reflect the estimated impact on the price of such securities as a result of such events. In this instance, securities are generally categorized as Level 3 in the hierarchy. Additionally, certain foreign equity securities are also fair valued whenever the movement of a particular index exceeds certain thresholds. In such cases, the securities are fair valued by applying factors provided by a third-party vendor in accordance with the Valuation Procedures and are generally categorized as Level 2 in the hierarchy. No foreign equity securities held by the Fund as of October 31, 2023 were fair valued in such a manner.
If the principal market of certain foreign equity securities is closed in observance of a local foreign holiday, these securities are valued using the last closing price of regular trading on the relevant exchange and fair
Notes to Financial Statements (continued)
valued by applying factors provided by a third-party vendor in accordance with the Valuation Procedures. These securities are generally categorized as Level 2 in the hierarchy. No securities held by the Fund as of October 31, 2023, were fair valued in such a manner.
Equity securities, rights and warrants, if applicable, are valued at the last quoted sales prices as of the close of regular trading on the relevant exchange on each valuation date. Securities that are not traded on the valuation date are valued at the mean of the last quoted bid and ask prices. Prices are normally taken from the principal market in which each security trades. These securities are generally categorized as Level 1 in the hierarchy.
Temporary cash investments acquired in excess of 60 days to maturity at the time of purchase are valued using the latest bid prices or using valuations based on a matrix system (which considers such factors as security prices, yields, maturities and ratings), both as furnished by independent pricing services. Temporary cash investments that mature in 60 days or less at the time of purchase ("Short-Term Investments") are valued using the amortized cost method of valuation, unless the use of such method would be inappropriate. The amortized cost method involves valuing a security at its cost on the date of purchase and thereafter assuming a constant amortization to maturity of the difference between such cost and the value on maturity date. Amortized cost approximates the current fair value of a security. Securities valued using the amortized cost method are not valued using quoted prices in an active market and are generally categorized as Level 2 in the hierarchy.
The information above is not intended to reflect an exhaustive list of the methodologies that may be used to value portfolio investments. The Valuation Procedures permit the use of a variety of valuation methodologies in connection with valuing portfolio investments. The methodology used for a specific type of investment may vary based on the market data available or other considerations. The methodologies summarized above may not represent the specific means by which portfolio investments are valued on any particular business day.
(B) Income Taxes. The Fund's policy is to comply with the requirements of the Internal Revenue Code of 1986, as amended (the “Internal Revenue Code”), applicable to regulated investment companies and to distribute all of its taxable income to the shareholders of the Fund within the allowable time limits.
The Manager evaluates the Fund’s tax positions to determine if the tax positions taken meet the minimum recognition threshold in connection with accounting for uncertainties in income tax positions taken or expected to be taken for the purposes of measuring and recognizing tax liabilities in the financial statements. Recognition of tax benefits of an uncertain tax position is permitted only to the extent the position is “more likely than not” to be sustained assuming examination by taxing authorities. The Manager analyzed the Fund's tax positions taken on federal, state and local income tax returns for all open tax years (for up to three tax years) and has concluded that no provisions for federal, state and local income tax are required in the Fund's financial statements. The
Fund's federal, state and local income tax and federal excise tax returns for tax years for which the applicable statutes of limitations have not expired are subject to examination by the Internal Revenue Service and state and local departments of revenue.
(C) Foreign Taxes. The Fund may be subject to foreign taxes on income and other transaction-based taxes imposed by certain countries in which it invests. A portion of the taxes on gains on investments or currency purchases/repatriation may be reclaimable. The Fund will accrue such taxes and reclaims as applicable, based upon its current interpretation of tax rules and regulations that exist in the markets in which it invests.
The Fund may be subject to taxation on realized capital gains, repatriation proceeds and other transaction-based taxes imposed by certain countries in which it invests. The Fund will accrue such taxes as applicable based upon its current interpretation of tax rules and regulations that exist in the market in which it invests. Capital gains taxes relating to positions still held are reflected as a liability in the Statement of Assets and Liabilities, as well as an adjustment to the Fund's net unrealized appreciation (depreciation). Taxes related to capital gains realized, if any, are reflected as part of net realized gain (loss) in the Statement of Operations. Changes in tax liabilities related to capital gains taxes on unrealized investment gains, if any, are reflected as part of the change in net unrealized appreciation (depreciation) on investments in the Statement of Operations. Transaction-based charges are generally assessed as a percentage of the transaction amount.
(D) Dividends and Distributions to Shareholders. Dividends and distributions are recorded on the ex-dividend date. The Fund intends to declare and pay dividends from net investment income and distributions from net realized capital and currency gains, if any, at least annually. Unless a shareholder elects otherwise, all dividends and distributions are reinvested at NAV in the same class of shares of the Fund. Dividends and distributions to shareholders are determined in accordance with federal income tax regulations and may differ from determinations using GAAP.
(E) Security Transactions and Investment Income. The Fund records security transactions on the trade date. Realized gains and losses on security transactions are determined using the identified cost method. Dividend income is recognized on the ex-dividend date, net of any foreign tax withheld at the source, and interest income is accrued as earned using the effective interest rate method. Distributions received from real estate investment trusts may be classified as dividends, capital gains and/or return of capital.
Investment income and realized and unrealized gains and losses on investments of the Fund are allocated pro rata to the separate classes of shares based upon their relative net assets on the date the income is earned or realized and unrealized gains and losses are incurred.
(F) Expenses. Expenses of the Trust are allocated to the individual Funds in proportion to the net assets of the respective Funds when the expenses are incurred, except where direct allocations of expenses can be made. Expenses (other than transfer agent expenses and fees incurred
| 24 | MainStay Candriam Emerging Markets Equity Fund |
under the shareholder services plans and/or the distribution plans further discussed in Note 3(B)) are allocated to separate classes of shares pro rata based upon their relative net assets on the date the expenses are incurred. The expenses borne by the Fund, including those of related parties to the Fund, are shown in the Statement of Operations.
(G) Use of Estimates. In preparing financial statements in conformity with GAAP, the Manager makes estimates and assumptions that affect the reported amounts and disclosures in the financial statements. Actual results could differ from those estimates and assumptions.
(H) Foreign Currency Transactions. The Fund's books and records are maintained in U.S. dollars. Prices of securities denominated in foreign currency amounts are translated into U.S. dollars at the mean between the buying and selling rates last quoted by any major U.S. bank at the following dates:
(i) market value of investment securities, other assets and liabilities— at the valuation date; and
(ii) purchases and sales of investment securities, income and expenses—at the date of such transactions.
The assets and liabilities that are denominated in foreign currency amounts are presented at the exchange rates and market values at the close of the period. The realized and unrealized changes in net assets arising from fluctuations in exchange rates and market prices of securities are not separately presented.
Net realized gain (loss) on foreign currency transactions represents net currency gains or losses realized as a result of differences between the amounts of securities sale proceeds or purchase cost, dividends, interest and withholding taxes as recorded on the Fund's books, and the U.S. dollar equivalent amount actually received or paid. Net currency gains or losses from valuing such foreign currency denominated assets and liabilities, other than investments at valuation date exchange rates, are reflected in unrealized foreign exchange gains or losses.
(I) Securities Lending. In order to realize additional income, the Fund may engage in securities lending, subject to the limitations set forth in the 1940 Act and relevant guidance by the staff of the Securities and Exchange Commission (“SEC”). If the Fund engages in securities lending, the Fund will lend through its custodian, JPMorgan Chase Bank, N.A., ("JPMorgan"), acting as securities lending agent on behalf of the Fund. Under the current arrangement, JPMorgan will manage the Fund's collateral in accordance with the securities lending agency agreement between the Fund and JPMorgan, and indemnify the Fund against counterparty risk. The loans will be collateralized by cash (which may be invested in a money market fund) and/or non-cash collateral (which may include U.S. Treasury securities and/or U.S. government agency securities issued or guaranteed by the United States government or its agencies or instrumentalities) at least equal at all times to the market value of the securities loaned. Non-cash collateral held at year end is segregated and cannot be transferred by the Fund. The Fund bears the risk of delay in recovery of, or loss of rights in, the securities loaned. The Fund may also
record a realized gain or loss on securities deemed sold due to a borrower’s inability to return securities on loan. The Fund bears the risk of any loss on investment of cash collateral. The Fund will receive compensation for lending its securities in the form of fees or it will retain a portion of interest earned on the investment of any cash collateral. The Fund will also continue to receive interest and dividends on the securities loaned and any gain or loss in the market price of the securities loaned that may occur during the term of the loan will be for the account of the Fund. Income earned from securities lending activities, if any, is reflected in the Statement of Operations. As of October 31, 2023, the Fund did not have any portfolio securities on loan.
(J) Foreign Securities Risk. The Fund may invest in foreign securities, which carry certain risks that are in addition to the usual risks inherent in domestic securities. Foreign regulatory regimes and securities markets can have less stringent investor protections and disclosure standards and less liquid trading markets than U.S. regulatory regimes and securities markets, and can experience political, social and economic developments that may affect the value of investments in foreign securities. These risks include those resulting from currency fluctuations, future adverse political or economic developments and possible imposition of currency exchange blockages or other foreign governmental laws or restrictions. Economic sanctions and other similar governmental actions or developments could, among other things, effectively restrict or eliminate the Fund's ability to purchase or sell certain foreign securities or groups of foreign securities, and thus may make the Fund's investments in such securities less liquid or more difficult to value. These risks are likely to be greater in emerging markets than in developed markets. The ability of issuers of debt securities held by the Fund to meet their obligations may be affected by, among other things, economic or political developments in a specific country, industry or region. For example, the Fund's portfolio has significant investments in the Asia-Pacific region. The development and stability of the Asia-Pacific region can be adversely affected by, among other regional and global developments, trade barriers, exchange controls and other measures imposed or negotiated by the countries with which they trade. Some Asia-Pacific countries can be characterized as emerging markets or newly industrialized and may experience more volatile economic cycles and less liquid markets than developed countries.
(K) Indemnifications. Under the Trust’s organizational documents, its officers and trustees are indemnified against certain liabilities that may arise out of performance of their duties to the Trust. Additionally, in the normal course of business, the Fund enters into contracts with third-party service providers that contain a variety of representations and warranties and that may provide general indemnifications. The Fund's maximum exposure under these arrangements is unknown, as this would involve future claims that may be made against the Fund that have not yet occurred. The Manager believes that the risk of loss in connection with these potential indemnification obligations is remote. However, there can be no assurance that material liabilities related to such obligations will not arise in the future, which could adversely impact the Fund.
Notes to Financial Statements (continued)
Note 3–Fees and Related Party Transactions
(A) Manager and Subadvisor. New York Life Investments, a registered investment adviser and an indirect, wholly-owned subsidiary of New York Life Insurance Company ("New York Life"), serves as the Fund's Manager, pursuant to an Amended and Restated Management Agreement (“Management Agreement”). The Manager provides offices, conducts clerical, recordkeeping and bookkeeping services and keeps most of the financial and accounting records required to be maintained by the Fund. Except for the portion of salaries and expenses that are the responsibility of the Fund, the Manager pays the salaries and expenses of all personnel affiliated with the Fund and certain operational expenses of the Fund. The Fund reimburses New York Life Investments in an amount equal to the portion of the compensation of the Chief Compliance Officer attributable to the Fund. Candriam (the "Subadvisor"), a registered investment adviser and an indirect, wholly-owned subsidiary of New York Life, serves as the Subadvisor to the Fund and is responsible for the day-to-day portfolio management of the Fund. Pursuant to the terms of a Subadvisory Agreement ("Subadvisory Agreement") between New York Life Investments and Candriam, New York Life Investments pays for the services of the Subadvisor.
Pursuant to the Management Agreement, the Fund pays the Manager a monthly fee for the services performed and the facilities furnished at an annual rate of the Fund’s average daily net assets as follows: 1.00% up to $1 billion and 0.975% in excess of $1 billion. During the year ended October 31, 2023, the effective management fee rate was 1.00% of the Fund’s average daily net assets, exclusive of any applicable waivers/reimbursements.
New York Life Investments has contractually agreed to waive fees and/or reimburse expenses so that Total Annual Fund Operating Expenses (excluding taxes, interest, litigation, extraordinary expenses, brokerage and other transaction expenses relating to the purchase or sale of portfolio investments and acquired (underlying) fund fees and expenses) for Class A and Class I shares do not exceed 1.50% and 1.01%, respectively, of the Fund's average daily net assets. New York Life Investments will apply an equivalent waiver or reimbursement, in an equal number of basis points of the Class A shares waiver/reimbursement, to Investor Class and Class C. In addition, New York Life Investments has also contractually agreed to waive fees and/or reimburse expenses so that Total Annual Fund Operating Expenses (excluding taxes, interest, litigation, extraordinary expenses, brokerage and other transaction expenses relating to the purchase or sale of portfolio investments, and acquired (underlying) fund fees and expenses) for Class R6 shares do not exceed those of Class I. These agreements will remain in effect until February 28, 2024, and shall renew automatically for one-year terms unless New York Life Investments provides written notice of termination prior to the start of the next term or upon approval of the Board.
During the year ended October 31, 2023, New York Life Investments earned fees from the Fund in the amount of $1,504,198 and waived fees and/or reimbursed expenses in the amount of $346,253 and paid the Subadvisor fees of $578,973.
JPMorgan provides sub-administration and sub-accounting services to the Fund pursuant to an agreement with New York Life Investments. These services include calculating the daily NAVs of the Fund, maintaining the general ledger and sub-ledger accounts for the calculation of the Fund's NAVs, and assisting New York Life Investments in conducting various aspects of the Fund's administrative operations. For providing these services to the Fund, JPMorgan is compensated by New York Life Investments.
Pursuant to an agreement between the Trust and New York Life Investments, New York Life Investments is responsible for providing or procuring certain regulatory reporting services for the Fund. The Fund will reimburse New York Life Investments for the actual costs incurred by New York Life Investments in connection with providing or procuring these services for the Fund.
(B) Distribution and Service Fees. The Trust, on behalf of the Fund, has entered into a distribution agreement with NYLIFE Distributors LLC (the “Distributor”), an affiliate of New York Life Investments. The Fund has adopted distribution plans (the “Plans”) in accordance with the provisions of Rule 12b-1 under the 1940 Act.
Pursuant to the Class A and Investor Class Plans, the Distributor receives a monthly fee from the Class A and Investor Class shares at an annual rate of 0.25% of the average daily net assets of the Class A and Investor Class shares for distribution and/or service activities as designated by the Distributor. Pursuant to the Class C Plan, Class C shares pay the Distributor a monthly distribution fee at an annual rate of 0.75% of the average daily net assets of the Class C shares, along with a service fee at an annual rate of 0.25% of the average daily net assets of the Class C shares, for a total 12b-1 fee of 1.00%. Class I and Class R6 shares are not subject to a distribution and/or service fee.
The Plans provide that the distribution and service fees are payable to the Distributor regardless of the amounts actually expended by the Distributor for distribution of the Fund's shares and service activities.
(C) Sales Charges. The Fund was advised by the Distributor that the amount of initial sales charges retained on sales of Class A and Investor Class shares during the year ended October 31, 2023, were $140 and $71, respectively.
(D) Transfer, Dividend Disbursing and Shareholder Servicing Agent. NYLIM Service Company LLC, an affiliate of New York Life Investments, is the Fund's transfer, dividend disbursing and shareholder servicing agent pursuant to an agreement between NYLIM Service Company LLC and the Trust. NYLIM Service Company LLC has entered into an agreement with SS&C Global Investor & Distribution Solutions, Inc. ("SS&C"), pursuant to which SS&C performs certain transfer agent services on behalf of NYLIM Service Company LLC. New York Life Investments has contractually agreed to limit the transfer agency expenses charged to the Fund’s share classes to a maximum of 0.35% of that share class’s average daily net assets on an annual basis after deducting any applicable Fund or class-level expense reimbursement or small account fees. This agreement will remain in effect until February
| 26 | MainStay Candriam Emerging Markets Equity Fund |
28, 2024, and shall renew automatically for one-year terms unless New York Life Investments provides written notice of termination prior to the start of the next term or upon approval of the Board. During the year ended October 31, 2023, transfer agent expenses incurred by the Fund and any reimbursements, pursuant to the aforementioned Transfer Agency expense limitation agreement, were as follows:
| Class | Expense | Waived |
| Class A | $ 1,535 | $— |
| Investor Class | 599 | — |
| Class C | 233 | — |
| Class I | 15,363 | — |
| Class R6 | 4,947 | — |
(E) Small Account Fee. Shareholders with small accounts adversely impact the cost of providing transfer agency services. In an effort to reduce total transfer agency expenses, the Fund has implemented a small account fee on certain types of accounts. As described in the Fund's prospectus, certain shareholders with an account balance of less than $1,000 ($5,000 for Class A share accounts) are charged an annual per account fee of $20 (assessed semi-annually), the proceeds from which offset transfer agent fees as reflected in the Statement of Operations. This small account fee will not apply to certain types of accounts as described further in the Fund’s prospectus.
(F) Capital. As of October 31, 2023, New York Life and its affiliates beneficially held shares of the Fund with the values and percentages of net assets as follows:
| Class I | $24,345 | 0.1% |
| Class R6 | 24,334 | 0.0‡ |
| ‡ | Less than one-tenth of a percent. |
Note 4-Federal Income Tax
As of October 31, 2023, the cost and unrealized appreciation (depreciation) of the Fund’s investment portfolio, including applicable derivative contracts and other financial instruments, as determined on a federal income tax basis, were as follows:
| | Federal Tax
Cost | Gross
Unrealized
Appreciation | Gross
Unrealized
(Depreciation) | Net
Unrealized
Appreciation/
(Depreciation) |
| Investments in Securities | $157,681,526 | $11,841,742 | $(20,062,482) | $(8,220,740) |
As of October 31, 2023, the components of accumulated gain (loss) on a tax basis were as follows:
Ordinary
Income | Accumulated
Capital
and Other
Gain (Loss) | Other
Temporary
Differences | Unrealized
Appreciation
(Depreciation) | Total
Accumulated
Gain (Loss) |
| $1,815,873 | $(24,908,932) | $— | $(8,557,049) | $(31,650,108) |
The difference between book-basis and tax-basis unrealized appreciation (depreciation) is primarily due to wash sale adjustments and Passive Foreign Investment Company ("PFIC") adjustments.
The following table discloses the current year reclassifications between total distributable earnings (loss) and additional paid-in capital arising from permanent differences; net assets as of October 31, 2023 were not affected.
| | Total
Distributable
Earnings (Loss) | Additional
Paid-In
Capital |
| | $3,065 | $(3,065) |
The reclassifications for the Fund are primarily due to excise taxes paid.
As of October 31, 2023, for federal income tax purposes, capital loss carryforwards of $24,908,932, as shown in the table below, were available to the extent provided by the regulations to offset future realized gains of the Fund. Accordingly, no capital gains distributions are expected to be paid to shareholders until net gains have been realized in excess of such amounts.
Capital Loss
Available Through | Short-Term
Capital Loss
Amounts (000’s) | Long-Term
Capital Loss
Amounts (000’s) |
| Unlimited | $22,758 | $2,151 |
During the years ended October 31, 2023 and October 31, 2022, the tax character of distributions paid as reflected in the Statements of Changes in Net Assets was as follows:
| | 2023 | 2022 |
| Distributions paid from: | | |
| Ordinary Income | $1,299,714 | $802,323 |
Note 5–Custodian
JPMorgan is the custodian of cash and securities held by the Fund. Custodial fees are charged to the Fund based on the Fund's net assets and/or the market value of securities held by the Fund and the number of certain transactions incurred by the Fund.
Note 6–Line of Credit
The Fund and certain other funds managed by New York Life Investments maintain a line of credit with a syndicate of banks in order to secure a source of funds for temporary purposes to meet unanticipated or excessive redemption requests.
Notes to Financial Statements (continued)
Effective July 25, 2023, under the credit agreement (the “Credit Agreement”), the aggregate commitment amount is $600,000,000 with an additional uncommitted amount of $100,000,000. The commitment fee is an annual rate of 0.15% of the average commitment amount payable quarterly, regardless of usage, to JPMorgan, who serves as the agent to the syndicate. The commitment fee is allocated among the Fund and certain other funds managed by New York Life Investments based upon their respective net assets and other factors. Interest on any revolving credit loan is charged based upon the Federal Funds Rate, Daily Simple Secured Overnight Financing Rate ("SOFR") + 0.10%, or the Overnight Bank Funding Rate, whichever is higher. The Credit Agreement expires on July 23, 2024, although the Fund, certain other funds managed by New York Life Investments and the syndicate of banks may renew the Credit Agreement for an additional year on the same or different terms or enter into a credit agreement with a different syndicate of banks. Prior to July 25, 2023, the aggregate commitment amount and the commitment fee were the same as those under the current Credit Agreement. During the year ended October 31, 2023, there were no borrowings made or outstanding with respect to the Fund under the Credit Agreement.
Note 7–Interfund Lending Program
Pursuant to an exemptive order issued by the SEC, the Fund, along with certain other funds managed by New York Life Investments, may participate in an interfund lending program. The interfund lending program provides an alternative credit facility that permits the Fund and certain other funds managed by New York Life Investments to lend or borrow money for temporary purposes directly to or from one another, subject to the conditions of the exemptive order. During the year ended October 31, 2023, there were no interfund loans made or outstanding with respect to the Fund.
Note 8–Purchases and Sales of Securities (in 000’s)
During the year ended October 31, 2023, purchases and sales of securities, other than short-term securities, were $132,895 and $86,061, respectively.
The Fund may purchase securities from or sell securities to other portfolios managed by the Subadvisor. These interportfolio transactions are primarily used for cash management purposes and are made pursuant to Rule 17a-7 under the 1940 Act. During the year ended October 31, 2023, such purchases were $22,996.
Note 9–Capital Share Transactions
Transactions in capital shares for the years ended October 31, 2023 and October 31, 2022, were as follows:
| Class A | Shares | Amount |
| Year ended October 31, 2023: | | |
| Shares sold | 16,378 | $ 149,198 |
| Shares issued to shareholders in reinvestment of distributions | 1,938 | 17,148 |
| Shares redeemed | (57,528) | (516,759) |
| Net increase (decrease) in shares outstanding before conversion | (39,212) | (350,413) |
| Shares converted into Class A (See Note 1) | 6,792 | 60,925 |
| Net increase (decrease) | (32,420) | $ (289,488) |
| Year ended October 31, 2022: | | |
| Shares sold | 103,556 | $ 1,141,430 |
| Shares issued to shareholders in reinvestment of distributions | 1,080 | 13,154 |
| Shares redeemed | (78,458) | (865,939) |
| Net increase (decrease) in shares outstanding before conversion | 26,178 | 288,645 |
| Shares converted into Class A (See Note 1) | 4,437 | 49,329 |
| Net increase (decrease) | 30,615 | $ 337,974 |
| |
| Investor Class | Shares | Amount |
| Year ended October 31, 2023: | | |
| Shares sold | 4,509 | $ 40,548 |
| Shares issued to shareholders in reinvestment of distributions | 189 | 1,668 |
| Shares redeemed | (11,260) | (101,809) |
| Net increase (decrease) in shares outstanding before conversion | (6,562) | (59,593) |
| Shares converted into Investor Class (See Note 1) | 1,179 | 10,594 |
| Shares converted from Investor Class (See Note 1) | (2,161) | (19,757) |
| Net increase (decrease) | (7,544) | $ (68,756) |
| Year ended October 31, 2022: | | |
| Shares sold | 5,012 | $ 55,702 |
| Shares issued to shareholders in reinvestment of distributions | 183 | 2,228 |
| Shares redeemed | (10,689) | (111,295) |
| Net increase (decrease) in shares outstanding before conversion | (5,494) | (53,365) |
| Shares converted into Investor Class (See Note 1) | 182 | 1,857 |
| Shares converted from Investor Class (See Note 1) | (3,454) | (40,618) |
| Net increase (decrease) | (8,766) | $ (92,126) |
| |
| 28 | MainStay Candriam Emerging Markets Equity Fund |
| Class C | Shares | Amount |
| Year ended October 31, 2023: | | |
| Shares sold | 703 | $ 6,000 |
| Shares redeemed | (7,078) | (61,830) |
| Net increase (decrease) in shares outstanding before conversion | (6,375) | (55,830) |
| Shares converted from Class C (See Note 1) | (2,527) | (22,213) |
| Net increase (decrease) | (8,902) | $ (78,043) |
| Year ended October 31, 2022: | | |
| Shares sold | 2,570 | $ 28,268 |
| Shares redeemed | (1,811) | (18,804) |
| Net increase (decrease) in shares outstanding before conversion | 759 | 9,464 |
| Shares converted from Class C (See Note 1) | (186) | (1,857) |
| Net increase (decrease) | 573 | $ 7,607 |
| |
| Class I | Shares | Amount |
| Year ended October 31, 2023: | | |
| Shares sold | 1,673,240 | $ 15,800,238 |
| Shares issued to shareholders in reinvestment of distributions | 14,494 | 129,432 |
| Shares redeemed | (840,143) | (7,263,043) |
| Net increase (decrease) | 847,591 | $ 8,666,627 |
| Year ended October 31, 2022: | | |
| Shares sold | 1,475,630 | $ 15,043,035 |
| Shares issued to shareholders in reinvestment of distributions | 2,077 | 25,483 |
| Shares redeemed | (273,007) | (2,590,693) |
| Net increase (decrease) | 1,204,700 | $ 12,477,825 |
| |
| Class R6 | Shares | Amount |
| Year ended October 31, 2023: | | |
| Shares sold | 4,914,202 | $ 44,894,807 |
| Shares issued to shareholders in reinvestment of distributions | 98,069 | 869,873 |
| Shares redeemed | (1,334,945) | (11,990,381) |
| Net increase (decrease) in shares outstanding before conversion | 3,677,326 | 33,774,299 |
| Shares converted from Class R6 (See Note 1) | (3,328) | (29,549) |
| Net increase (decrease) | 3,673,998 | $ 33,744,750 |
| Year ended October 31, 2022: | | |
| Shares sold | 5,207,580 | $ 53,455,404 |
| Shares issued to shareholders in reinvestment of distributions | 61,678 | 751,850 |
| Shares redeemed | (521,083) | (5,259,492) |
| Net increase (decrease) in shares outstanding before conversion | 4,748,175 | 48,947,762 |
| Shares converted from Class R6 (See Note 1) | (988) | (8,711) |
| Net increase (decrease) | 4,747,187 | $ 48,939,051 |
Note 10–Other Matters
As of the date of this report, the Fund faces a heightened level of risk associated with current uncertainty, volatility and state of economies, financial markets, rising interest rates, and labor and health conditions around the world. Events such as war, acts of terrorism, recessions, rapid inflation, the imposition of international sanctions, earthquakes, hurricanes, epidemics and pandemics and other unforeseen natural or human disasters may have broad adverse social, political and economic effects on the global economy, which could negatively impact the value of the Fund's investments. Developments that disrupt global economies and financial markets may magnify factors that affect the Fund's performance.
Note 11–Subsequent Events
In connection with the preparation of the financial statements of the Fund as of and for the year ended October 31, 2023, events and transactions subsequent to October 31, 2023, through the date the financial statements were issued, have been evaluated by the Manager for possible adjustment and/or disclosure. No subsequent events requiring financial statement adjustment or disclosure have been identified.
Report of Independent Registered Public Accounting Firm
To the Shareholders of the Fund and Board of Trustees
MainStay Funds Trust:
Opinion on the Financial Statements
We have audited the accompanying statement of assets and liabilities of MainStay Candriam Emerging Markets Equity Fund (the Fund), one of the funds constituting MainStay Funds Trust, including the portfolio of investments, as of October 31, 2023, the related statement of operations for the year then ended, the statements of changes in net assets for each of the years in the two-year period then ended, and the related notes (collectively, the financial statements) and the financial highlights for each of the years in the five-year period then ended. In our opinion, the financial statements and financial highlights present fairly, in all material respects, the financial position of the Fund as of October 31, 2023, the results of its operations for the year then ended, the changes in its net assets for each of the years in the two-year period then ended, and the financial highlights for each of the years in the five-year period then ended, in conformity with U.S. generally accepted accounting principles.
Basis for Opinion
These financial statements and financial highlights are the responsibility of the Fund's management. Our responsibility is to express an opinion on these financial statements and financial highlights based on our audits. We are a public accounting firm registered with the Public Company Accounting Oversight Board (United States) (PCAOB) and are required to be independent with respect to the Fund in accordance with the U.S. federal securities laws and the applicable rules and regulations of the Securities and Exchange Commission and the PCAOB.
We conducted our audits in accordance with the standards of the PCAOB. Those standards require that we plan and perform the audit to obtain reasonable assurance about whether the financial statements and financial highlights are free of material misstatement, whether due to error or fraud. Our audits included performing procedures to assess the risks of material misstatement of the financial statements and financial highlights, whether due to error or fraud, and performing procedures that respond to those risks. Such procedures included examining, on a test basis, evidence regarding the amounts and disclosures in the financial statements and financial highlights. Such procedures also included confirmation of securities owned as of October 31, 2023, by correspondence with the custodian and brokers; when replies were not received from brokers, we performed other auditing procedures. Our audits also included evaluating the accounting principles used and significant estimates made by management, as well as evaluating the overall presentation of the financial statements and financial highlights. We believe that our audits provide a reasonable basis for our opinion.

We have served as the auditor of one or more New York Life Investment Management investment companies since 2003.
Philadelphia, Pennsylvania
December 22, 2023
| 30 | MainStay Candriam Emerging Markets Equity Fund |
Federal Income Tax Information
(Unaudited)
The Fund is required under the Internal Revenue Code to advise shareholders in a written statement as to the federal tax status of dividends paid by the Fund during such fiscal years.
For the fiscal year ended October 31, 2023, the Fund designated approximately $1,570,494 under the Internal Revenue Code as qualified dividend income eligible for reduced tax rates.
The dividends paid by the Fund during the fiscal year ended October 31, 2023 should be multiplied by 1.70% to arrive at the amount eligible for the corporate dividend-received deduction.
In accordance with federal tax law, the Fund elected to provide each shareholder with their portion of the Fund’s foreign taxes paid and the income sourced from foreign countries. Accordingly, the Fund made the following designations regarding its fiscal year ended October 31, 2023:
• the total amount of taxes credited to foreign countries was $436,340.
• the total amount of income sourced from foreign countries was $3,710,141.
In February 2024, shareholders will receive an IRS Form 1099-DIV or substitute Form 1099, which will show the federal tax status of the distributions received by shareholders in calendar year 2023. The amounts that will be reported on such 1099-DIV or substitute Form 1099 will be the amounts you are to use on your federal income tax return and will differ from the amounts which we must report for the Fund's fiscal year ended October 31, 2023.
Proxy Voting Policies and Procedures and Proxy Voting Record
The Fund is required to file with the SEC its proxy voting record for the 12-month period ending June 30 on Form N-PX. A description of the policies and procedures that are used to vote proxies relating to portfolio securities of the Fund is available free of charge upon request by calling 800-624-6782 or visiting the SEC’s website at www.sec.gov. The most recent Form N-PX or proxy voting record is available free of charge upon request by calling 800-624-6782; visiting newyorklifeinvestments.com; or visiting the SEC’s website at www.sec.gov.
Shareholder Reports and Quarterly Portfolio Disclosure
The Fund is required to file its complete schedule of portfolio holdings with the SEC 60 days after its first and third fiscal quarter on Form N-PORT. The Fund's holdings report is available free of charge upon request by calling New York Life Investments at 800-624-6782.
Board of Trustees and Officers (Unaudited)
The Trustees and officers of the Fund are listed below. The Board oversees the MainStay Group of Funds (which consists of MainStay Funds and MainStay Funds Trust), MainStay VP Funds Trust, MainStay MacKay DefinedTerm Municipal Opportunities Fund, MainStay CBRE Global Infrastructure Megatrends Term Fund, the Manager and the Subadvisors, and elects the officers of the Funds who are responsible for the day-to-day operations of the Fund. Information pertaining to the Trustees and officers is set forth below. Each Trustee serves until his or her successor is elected and qualified or until his or her resignation, death or
removal. Under the Board’s retirement policy, unless an exception is made, a Trustee must tender his or her resignation by the end of the calendar year during which he or she reaches the age of 75. Officers are elected annually by the Board. The business address of each Trustee and officer listed below is 51 Madison Avenue, New York, New York 10010. A majority of the Trustees are not “interested persons” (as defined by the 1940 Act and rules adopted by the SEC thereunder) of the Fund (“Independent Trustees”).
| | Name and
Year of Birth | Term of Office,
Position(s) Held and
Length of Service | Principal Occupation(s)
During Past Five Years | Number of
Portfolios in
Fund Complex
Overseen by
Trustee | Other Directorships
Held by Trustee |
| | | | | | |
| | Naïm Abou-Jaoudé*
1966 | MainStay Funds: Trustee
since 2023
MainStay Funds Trust:
Trustee since 2023 | Chief Executive Officer of New York Life Investment Management LLC (since 2023). Chief Executive Officer of Candriam (an affiliate of New York Life Investment Management LLC) (2007 to 2023). | 81 | MainStay VP Funds Trust:
Trustee since 2023 (31 portfolios);
MainStay MacKay DefinedTerm Municipal Opportunities Fund: Trustee
since 2023;
MainStay CBRE Global Infrastructure Megatrends Term Fund: Trustee
since 2023; and
New York Life Investment Management International (Chair) since 2015 |
| * | This Trustee is considered to be an “interested person” of the MainStay Group of Funds, MainStay VP Funds Trust, MainStay CBRE Global Infrastructure Megatrends Term Fund and MainStay MacKay DefinedTerm Municipal Opportunities Fund, within the meaning of the 1940 Act because of his affiliation with New York Life Investment Management LLC and Candriam, as described in detail above in the column entitled “Principal Occupation(s) During Past Five Years.” |
| | |
| 32 | MainStay Candriam Emerging Markets Equity Fund |
| | Name and
Year of Birth | Term of Office,
Position(s) Held and
Length of Service | Principal Occupation(s)
During Past Five Years | Number of
Portfolios in
Fund Complex
Overseen by
Trustee | Other Directorships
Held by Trustee |
| | | | | | |
| | David H. Chow
1957 | MainStay Funds: Trustee since January 2016, Advisory Board Member (June 2015 to December 2015);MainStay Funds Trust:
Trustee since January 2016, Advisory Board Member (June 2015 to December 2015) | Founder and CEO, DanCourt Management, LLC (since 1999) | 81 | MainStay VP Funds Trust: Trustee since January 2016, Advisory Board Member (June 2015 to December 2015) (31 portfolios);
MainStay MacKay DefinedTerm Municipal Opportunities Fund: Trustee since January 2016, Advisory Board Member (June 2015 to December 2015);
MainStay CBRE Global Infrastructure Megatrends Term Fund: Trustee since 2021;
VanEck Vectors Group of Exchange-Traded Funds: Trustee since 2006 and Independent Chairman of the Board of Trustees from 2008 to 2022 (57 portfolios); and
Berea College of Kentucky: Trustee since 2009, Chair of the Investment Committee since 2018 |
| | Karen Hammond
1956 | MainStay Funds: Trustee since December 2021, Advisory Board Member (June 2021 to December 2021);MainStay Funds Trust:
Trustee since December 2021, Advisory Board Member (June 2021 to December 2021)
| Retired, Managing Director, Devonshire Investors (2007 to 2013); Senior Vice President, Fidelity Management & Research Co. (2005 to 2007); Senior Vice President and Corporate Treasurer, FMR Corp. (2003 to 2005); Chief Operating Officer, Fidelity Investments Japan (2001 to 2003) | 81 | MainStay VP Funds Trust: Trustee since December 2021, Advisory Board Member (June 2021 to December 2021) (31 portfolios);
MainStay MacKay DefinedTerm Municipal Opportunities Fund: Trustee since December 2021, Advisory Board Member (June 2021 to December 2021);
MainStay CBRE Global Infrastructure Megatrends Term Fund: Trustee since December 2021, Advisory Board Member (June 2021 to December 2021);
Two Harbors Investment Corp.: Director since 2018;
Rhode Island State Investment Commission: Member since 2017; and
Blue Cross Blue Shield of Rhode Island: Director since 2019 |
| | Susan B. Kerley
1951 | MainStay Funds: Chair since January 2017 and Trustee since 2007;MainStay Funds Trust:
Chair since January 2017 and Trustee since 1990*** | President, Strategic Management Advisors LLC (since 1990) | 81 | MainStay VP Funds Trust: Chair since January 2017 and Trustee since 2007 (31 portfolios)**;
MainStay MacKay DefinedTerm Municipal Opportunities Fund: Chair since January 2017 and Trustee since 2011;
MainStay CBRE Global Infrastructure Megatrends Term Fund: Trustee since June 2021; and
Legg Mason Partners Funds: Trustee since 1991 (45 portfolios) |
Board of Trustees and Officers (Unaudited) (continued)
| | Name and
Year of Birth | Term of Office,
Position(s) Held and
Length of Service | Principal Occupation(s)
During Past Five Years | Number of
Portfolios in
Fund Complex
Overseen by
Trustee | Other Directorships
Held by Trustee |
| | | | | | |
| | Alan R. Latshaw
1951 | MainStay Funds: Trusteesince 2006;MainStay Funds Trust:
Trustee since 2007*** | Retired; Partner, Ernst & Young LLP (2002 to 2003); Partner, Arthur Andersen LLP (1989 to 2002); Consultant to the MainStay Funds Audit and Compliance Committee (2004 to 2006) | 81 | MainStay VP Funds Trust: Trustee since 2007 (31 portfolios)**;
MainStay MacKay DefinedTerm Municipal Opportunities Fund: Trustee since 2011; and
MainStay CBRE Global Infrastructure Megatrends Term Fund: Trustee since June 2021 |
| | Jacques P. Perold
1958 | MainStay Funds: Trustee since January 2016, Advisory Board Member (June 2015to December 2015);MainStay Funds Trust:
Trustee since January 2016, Advisory Board Member (June 2015 to December 2015) | Founder and Chief Executive Officer, CapShift Advisors LLC (since 2018); President, Fidelity Management & Research Company (2009 to 2014); President and Chief Investment Officer, Geode Capital Management, LLC (2001 to 2009) | 81 | MainStay VP Funds Trust: Trustee since January 2016, Advisory Board Member (June 2015 to December 2015) (31 portfolios);
MainStay MacKay DefinedTerm Municipal Opportunities Fund: Trustee since January 2016, Advisory Board Member (June 2015 to December 2015);
MainStay CBRE Global Infrastructure Megatrends Term Fund: Trustee since June 2021;
Allstate Corporation: Director since 2015; and
MSCI Inc.: Director since 2017 |
| | Richard S. Trutanic
1952 | MainStay Funds: Trustee since 1994;MainStay Funds Trust:
Trustee since 2007*** | Chairman and Chief Executive Officer, Somerset & Company (financial advisory firm) (since 2004); Managing Director, The Carlyle Group (private investment firm) (2002 to 2004); Senior Managing Director, Partner and Board Member, Groupe Arnault S.A. (private investment firm) (1999 to 2002) | 81 | MainStay VP Funds Trust: Trustee since 2007 (31 portfolios)**;
MainStay MacKay DefinedTerm Municipal Opportunities Fund: Trustee since 2011; and
MainStay CBRE Global Infrastructure Megatrends Term Fund: Trustee since June 2021 |
| ** | Includes prior service as a Director of MainStay VP Series Fund, Inc., the predecessor to MainStay VP Funds Trust. |
| *** | Includes prior service as a Director/Trustee of certain predecessor entities to MainStay Funds Trust. |
| 34 | MainStay Candriam Emerging Markets Equity Fund |
| | Name and
Year of Birth | Position(s) Held and
Length of Service | Principal Occupation(s)
During Past Five Years | |
| | | | | |
| | Kirk C. Lehneis
1974 | President, MainStay Funds, MainStay Funds Trust (since 2017) | Chief Operating Officer and Senior Managing Director (since 2016), New York Life Investment Management LLC and New York Life Investment Management Holdings LLC; Member of the Board of Managers (since 2017) and Senior Managing Director (since 2018), NYLIFE Distributors LLC; Chairman of the Board and Senior Managing Director, NYLIM Service Company LLC (since 2017); Trustee, President and Principal Executive Officer of IndexIQ Trust, IndexIQ ETF Trust and IndexIQ Active ETF Trust (since 2018); President, MainStay CBRE Global Infrastructure Megatrends Term Fund (since 2021), MainStay MacKay DefinedTerm Municipal Opportunities Fund and MainStay VP Funds Trust (since 2017)**; Senior Managing Director, Global Product Development (2015 to 2016); Managing Director, Product Development (2010 to 2015), New York Life Investment Management LLC | |
| | Jack R. Benintende
1964 | Treasurer and Principal Financial and Accounting Officer, MainStay Funds (since 2007), MainStay Funds Trust (since 2009) | Managing Director, New York Life Investment Management LLC (since 2007); Treasurer and Principal Financial and Accounting Officer, MainStay CBRE Global Infrastructure Megatrends Term Fund (since 2021), MainStay MacKay DefinedTerm Municipal Opportunities Fund (since 2011) and MainStay VP Funds Trust (since 2007)**; and Assistant Treasurer, New York Life Investment Management Holdings LLC (2008 to 2012) | |
| | J. Kevin Gao
1967 | Secretary and Chief Legal Officer, MainStay Funds and MainStay Funds Trust (since 2010) | Managing Director and Associate General Counsel, New York Life Investment Management LLC (since 2010); Secretary and Chief Legal Officer, MainStay CBRE Global Infrastructure Megatrends Term Fund (since 2021), MainStay MacKay DefinedTerm Municipal Opportunities Fund (since 2011) and MainStay VP Funds Trust (since 2010)** | |
| | Kevin M. Gleason
1967 | Vice President and Chief Compliance Officer, MainStay Funds and MainStay Funds Trust (since June 2022) | Vice President and Chief Compliance Officer, IndexIQ Trust, IndexIQ ETF Trust and Index IQ Active ETF Trust (since June 2022); Vice President and Chief Compliance Officer, MainStay CBRE Global Infrastructure Megatrends Term Fund, MainStay VP Funds Trust and MainStay MacKay DefinedTerm Municipal Opportunities Fund (since June 2022); Senior Vice President, Voya Investment Management and Chief Compliance Officer, Voya Family of Funds (2012 to 2022) | |
| | Scott T. Harrington
1959 | Vice President— Administration, MainStay Funds (since 2005), MainStay Funds Trust (since 2009) | Managing Director, New York Life Investment Management LLC (including predecessor advisory organizations) (since 2000); Member of the Board of Directors, New York Life Trust Company (since 2009); Vice President—Administration, MainStay CBRE Global Infrastructure Megatrends Term Fund (since 2021), MainStay MacKay DefinedTerm Municipal Opportunities Fund (since 2011) and MainStay VP Funds Trust (since 2005)** | |
| * | The officers listed above are considered to be “interested persons” of the MainStay Group of Funds, MainStay VP Funds Trust, MainStay CBRE Global Infrastructure Megatrends Term Fund and MainStay MacKay DefinedTerm Municipal Opportunities Fund within the meaning of the 1940 Act because of their affiliation with the MainStay Group of Funds, New York Life Insurance Company and/or its affiliates, including New York Life Investment Management LLC, New York Life Insurance Company, NYLIM Service Company LLC, NYLIFE Securities LLC and/or NYLIFE Distributors LLC, as described in detail in the column captioned “Principal Occupation(s) During Past Five Years.” Officers are elected annually by the Board. |
| ** | Includes prior service as an Officer of MainStay VP Series Fund, Inc., the predecessor to MainStay VP Funds Trust. |
Officers of the Trust (Who are not Trustees)*
This page intentionally left blank.
This page intentionally left blank.
This page intentionally left blank.
Equity
U.S. Equity
MainStay Epoch U.S. Equity Yield Fund
MainStay Fiera SMID Growth Fund
MainStay PineStone U.S. Equity Fund
MainStay S&P 500 Index Fund
MainStay Winslow Large Cap Growth Fund
MainStay WMC Enduring Capital Fund
MainStay WMC Growth Fund
MainStay WMC Small Companies Fund
MainStay WMC Value Fund
International Equity
MainStay Epoch International Choice Fund
MainStay PineStone International Equity Fund
MainStay WMC International Research Equity Fund
Emerging Markets Equity
MainStay Candriam Emerging Markets Equity Fund
Global Equity
MainStay Epoch Capital Growth Fund
MainStay Epoch Global Equity Yield Fund
MainStay PineStone Global Equity Fund
Fixed Income
Taxable Income
MainStay Candriam Emerging Markets Debt Fund
MainStay Floating Rate Fund
MainStay MacKay High Yield Corporate Bond Fund
MainStay MacKay Short Duration High Yield Fund
MainStay MacKay Strategic Bond Fund
MainStay MacKay Total Return Bond Fund
MainStay MacKay U.S. Infrastructure Bond Fund
MainStay Short Term Bond Fund
Tax-Exempt Income
MainStay MacKay California Tax Free Opportunities Fund1
MainStay MacKay High Yield Municipal Bond Fund
MainStay MacKay New York Tax Free Opportunities Fund2
MainStay MacKay Short Term Municipal Fund
MainStay MacKay Strategic Municipal Allocation Fund
MainStay MacKay Tax Free Bond Fund
Money Market
MainStay Money Market Fund
Mixed Asset
MainStay Balanced Fund
MainStay Income Builder Fund
MainStay MacKay Convertible Fund
Speciality
MainStay CBRE Global Infrastructure Fund
MainStay CBRE Real Estate Fund
MainStay Cushing MLP Premier Fund
Asset Allocation
MainStay Conservative Allocation Fund
MainStay Conservative ETF Allocation Fund
MainStay Defensive ETF Allocation Fund
MainStay Equity Allocation Fund
MainStay Equity ETF Allocation Fund
MainStay ESG Multi-Asset Allocation Fund
MainStay Growth Allocation Fund
MainStay Growth ETF Allocation Fund
MainStay Moderate Allocation Fund
MainStay Moderate ETF Allocation Fund
Manager
New York Life Investment Management LLC
New York, New York
Subadvisors
Candriam3
Strassen, Luxembourg
CBRE Investment Management Listed Real Assets LLC
Radnor, Pennsylvania
Cushing Asset Management, LP
Dallas, Texas
Epoch Investment Partners, Inc.
New York, New York
Fiera Capital Inc.
New York, New York
IndexIQ Advisors LLC3
New York, New York
MacKay Shields LLC3
New York, New York
NYL Investors LLC3
New York, New York
PineStone Asset Management Inc.
Montreal, Québec
Wellington Management Company LLP
Boston, Massachusetts
Winslow Capital Management, LLC
Minneapolis, Minnesota
Legal Counsel
Dechert LLP
Washington, District of Columbia
Independent Registered Public Accounting Firm
KPMG LLP
Philadelphia, Pennsylvania
Distributor
NYLIFE Distributors LLC3
Jersey City, New Jersey
Custodian
JPMorgan Chase Bank, N.A.
New York, New York
1.
This Fund is registered for sale in AZ, CA, NV, OR, TX, UT, WA and MI (Class A and Class I shares only), and CO, FL, GA, HI, ID, MA, MD, NH, NJ and NY (Class I shares only).
| 2. | This Fund is registered for sale in CA, CT, DE, FL, MA, NJ, NY and VT. |
| 3. | An affiliate of New York Life Investment Management LLC. |
Not part of the Annual Report
For more information
800-624-6782
newyorklifeinvestments.com
“New York Life Investments” is both a service mark, and the common trade name, of certain investment advisors affiliated with New York Life Insurance Company. The MainStay Funds® are managed by New York Life Investment Management LLC and distributed by NYLIFE Distributors LLC, 30 Hudson Street, Jersey City, NJ 07302, a wholly owned subsidiary of New York Life Insurance Company. NYLIFE Distributors LLC is a Member FINRA/SIPC.
©2023 NYLIFE Distributors LLC. All rights reserved.
| 5013883MS139-23 | MSCEME11-12/23 |
(NYLIM) NL440
MainStay Asset Allocation Funds
Message from the President and Annual Report
October 31, 2023
| MainStay Conservative Allocation Fund |
| MainStay Moderate Allocation Fund |
| MainStay Growth Allocation Fund |
| MainStay Equity Allocation Fund |
Special Notice:
Beginning in July 2024, new regulations issued by the Securities and Exchange Commission (SEC) will take effect requiring open-end mutual fund companies and ETFs to (1) overhaul the content of their shareholder reports and (2) mail paper copies of the new tailored shareholder reports to shareholders who have not opted to receive these documents electronically.
If you have not yet elected to receive your shareholder reports electronically, please contact your financial intermediary or visit newyorklifeinvestments.com/accounts.
| Not FDIC/NCUA Insured | Not a Deposit | May Lose Value | No Bank Guarantee | Not Insured by Any Government Agency |
This page intentionally left blank
Message from the President
Volatile economic and geopolitical forces drove market behavior during the 12-month reporting period ended October 31, 2023. While equity markets generally gained ground, bond prices trended broadly lower.
Although the war in Ukraine, the outbreak of hostilities in the Middle East and several other notable events affected financial assets, inflation and interest rate trends stood at the forefront of market developments during most of the period. As the reporting period began, high levels of inflation already showed signs of easing in the face of aggressive rate hikes by the U.S. Federal Reserve (the “Fed”). From a peak of 9.1% in June 2022, the annualized U.S. inflation rate dropped to 7.1% in November 2022, and to 3.2% in October 2023. At the same time, the Fed increased the benchmark federal funds rate from 3.75%–4.00% at the beginning of the reporting period to 5.25%–5.50% as of October 31, 2023. As the pace of rate increases slowed during the period, investors hoped for an early shift to a looser monetary policy. However, comments from Fed members late in the period reinforced the central bank’s hawkish stance in response to surprisingly robust U.S. economic growth and rising wage pressures, thus increasing the likelihood that interest rates would stay higher for longer. International developed markets exhibited similar dynamics of elevated inflation and rising interest rates.
Despite the backdrop of high interest rates—along with political dysfunction in Washington D.C. and intensifying global geopolitical instability—equity markets managed to advance, supported by healthy consumer spending trends and persistent domestic economic growth. The S&P 500® Index, a widely regarded benchmark of large-cap U.S. market performance, gained ground, bolstered by the strong performance of energy stocks amid surging petroleum prices and mega-cap, growth-oriented, technology-related shares, which rose as investors flocked to companies creating the infrastructure for developments in artificial intelligence. Smaller-cap stocks and value-oriented shares produced milder returns. Among industry sectors, energy and
information technology posted the strongest gains. Real estate declined most sharply under pressure from rising mortgage rates and weak levels of office occupancy. Developed international markets outperformed U.S. markets, with Europe benefiting during the first half of the period from unexpected economic resilience in the face of rising energy prices and the ongoing war in Ukraine. Emerging markets posted positive results but lagged developed markets, largely due to slow economic growth in China despite the relaxation of pandemic-era lockdowns.
Bond prices were driven lower by rising yields and increasing expectations of high interest rates for an extended period of time. The U.S. yield curve steepened, with the 30-year Treasury yield exceeding 5% for the first time in more than a decade. The yield curve remained inverted, with the 10-year Treasury yield ending the period at 4.88%, compared with 5.07% for the 2-year Treasury yield. Corporate bonds outperformed long-term Treasury bonds, but still trended lower under pressure from rising yields and an uptick in default rates. Among corporates, lower-credit-quality instruments performed slightly better than their higher-credit-quality counterparts, while floating rate securities performed better still.
In the face of today’s uncertain market environment, New York Life Investments remains dedicated to providing the guidance, resources and investment solutions you need to pursue your financial goals.
Thank you for trusting us to help meet your investment needs.
Sincerely,
Kirk C. Lehneis
President
The opinions expressed are as of the date of this report and are subject to change. There is no guarantee that any forecast made will come to pass. This material does not constitute investment advice and is not intended as an endorsement of any specific investment. Past performance is no guarantee of future results.
Not part of the Annual Report
Investors should refer to each Fund’s Summary Prospectus and/or Prospectus and consider each Fund’s investment objectives, strategies, risks, charges and expenses carefully before investing. The Summary Prospectus and/or Prospectus contain this and other information about each Fund. You may obtain copies of each Fund’s Summary Prospectus, Prospectus and Statement of Additional Information, which includes information about the MainStay Funds Trust's Trustees, free of charge, upon request, by calling toll-free 800-624-6782, by writing to NYLIFE Distributors LLC, Attn: MainStay Marketing Department, 30 Hudson Street, Jersey City, NJ 07302 or by sending an e-mail to MainStayShareholderServices@nylim.com. These documents are also available via the MainStay Funds’ website at newyorklifeinvestments.com. Please read each Fund’s Summary Prospectus and/or Prospectus carefully before investing.
MainStay Conservative Allocation Fund
Investment and Performance Comparison (Unaudited)
Performance data quoted represents past performance. Past performance is no guarantee of future results. Because of market volatility and other factors, current performance may be lower or higher than the figures shown. Investment return and principal value will fluctuate, and as a result, when shares are redeemed, they may be worth more or less than their original cost. The graph below depicts the historical performance of Class I shares of the Fund. Performance will vary from class to class based on differences in class-specific expenses and sales charges. For performance information current to the most recent month-end, please call 800-624-6782 or visit newyorklifeinvestments.com.
The performance table and graph do not reflect the deduction of taxes that a shareholder would pay on distributions or Fund share redemptions. Total returns reflect maximum applicable sales charges as indicated in the table below, if any, changes in share price, and reinvestment of dividend and capital gain distributions. The graph assumes the initial investment amount shown below and reflects the deduction of all sales charges that would have applied for the period of investment. Performance figures may reflect certain fee waivers and/or expense limitations, without which total returns may have been lower. For more information on share classes and current fee waivers and/or expense limitations (if any), please refer to the Notes to Financial Statements.
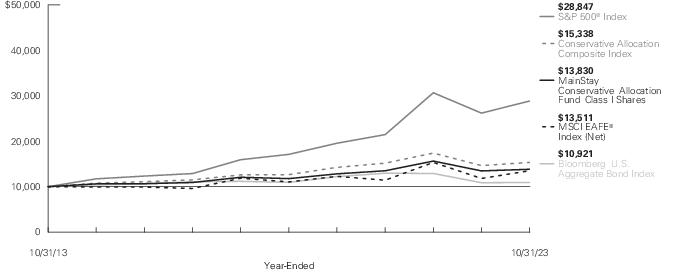
| Average Annual Total Returns for the Year-Ended October 31, 2023 |
| Class | Sales Charge | | Inception
Date | One
Year | Five
Years | Ten Years
or Since
Inception | Gross
Expense
Ratio1 |
| Class A Shares2 | Maximum 3.00% Initial Sales Charge | With sales charges | 4/4/2005 | -0.66% | 1.83% | 2.44% | 0.86% |
| | | Excluding sales charges | | 2.41 | 2.99 | 3.02 | 0.86 |
| Investor Class Shares2, 3 | Maximum 2.50% Initial Sales Charge | With sales charges | 2/28/2008 | -0.33 | 1.66 | 2.28 | 1.08 |
| | | Excluding sales charges | | 2.22 | 2.82 | 2.86 | 1.08 |
| Class B Shares4 | Maximum 5.00% CDSC | With sales charges | 4/4/2005 | -3.53 | 1.70 | 2.09 | 1.83 |
| | if Redeemed Within the First Six Years of Purchase | Excluding sales charges | | 1.36 | 2.03 | 2.09 | 1.83 |
| Class C Shares | Maximum 1.00% CDSC | With sales charges | 4/4/2005 | 0.48 | 2.03 | 2.09 | 1.83 |
| | if Redeemed Within One Year of Purchase | Excluding sales charges | | 1.45 | 2.03 | 2.09 | 1.83 |
| Class I Shares | No Sales Charge | | 4/4/2005 | 2.63 | 3.27 | 3.30 | 0.61 |
| Class R2 Shares5 | No Sales Charge | | 6/14/2019 | 2.31 | N/A | 2.20 | 0.96 |
| Class R3 Shares5 | No Sales Charge | | 2/29/2016 | 1.99 | 2.62 | 3.54 | 1.21 |
| SIMPLE Class Shares | No Sales Charge | | 8/31/2020 | 2.04 | N/A | -0.77 | 1.26 |
| 1. | The gross expense ratios presented reflect the Fund’s “Total Annual Fund Operating Expenses” from the most recent Prospectus, as supplemented, and may differ from other expense ratios disclosed in this report. |
| 2. | Prior to July 22, 2019, the maximum initial sales charge applicable was 5.50%, which is reflected in the applicable average annual total return figures shown. |
| 3. | Prior to June 30, 2020, the maximum initial sales charge was 3.00%, which is reflected in the applicable average annual total return figures shown. |
| 4. | Class B shares are closed to all new purchases as well as additional investments by existing Class B shareholders. |
| 5. | As of October 31, 2023, Class R2 and Class R3 shares are closed to new investors and, upon the close of business on December 29, 2023, Class R2 and Class R3 shares are closed to additional investments by existing shareholders. Additionally, Class R2 and Class R3 shares will be liquidated on or about February 28, 2024 (the "Liquidation Date"). It is expected that the Fund will distribute to remaining shareholders invested in Class R2 or Class R3 shares, on or promptly after the Liquidation Date, a liquidating distribution in cash or cash equivalents equal to the net asset value of such shares. |
The footnotes on the next page are an integral part of the table and graph and should be carefully read in conjunction with them.
| Benchmark Performance* | One
Year | Five
Years | Ten
Years |
| Bloomberg U.S. Aggregate Bond Index1 | 0.36% | -0.06% | 0.88% |
| S&P 500® Index2 | 10.14 | 11.01 | 11.18 |
| MSCI EAFE® Index (Net)3 | 14.40 | 4.10 | 3.05 |
| Conservative Allocation Composite Index4 | 4.72 | 3.93 | 4.37 |
| Morningstar Moderately Conservative Allocation Category Average5 | 2.73 | 2.95 | 3.30 |
| * | Returns for indices reflect no deductions for fees, expenses or taxes, except for foreign withholding taxes where applicable. Results assume reinvestment of all dividends and capital gains. An investment cannot be made directly in an index. |
| 1. | The Bloomberg U.S. Aggregate Bond Index is the Fund's primary benchmark. The Bloomberg U.S. Aggregate Bond Index is a broad-based benchmark that measures the performance of the investment grade, U.S. dollar-denominated, fixed-rate taxable bond market, including Treasuries, government-related and corporate securities, mortgage-backed securities (agency fixed-rate and hybrid adjustable rate mortgage pass-throughs), asset-backed securities, and commercial mortgage-backed securities. |
| 2. | The S&P 500® Index is the Fund's secondary benchmark. S&P 500® is a trademark of The McGraw-Hill Companies, Inc. The S&P 500® Index is widely regarded as the standard index for measuring large-cap U.S. stock market performance. |
| 3. | The Fund has selected the MSCI EAFE® Index (Net) as an additional benchmark. The MSCI EAFE® Index (Net) consists of international stocks representing the developed world outside of North America. |
| 4. | The Fund has selected the Conservative Allocation Composite Index as an additional benchmark. Effective February 28, 2014, the Conservative Allocation Composite Index consists of the S&P 500® Index, the MSCI EAFE® Index and the Bloomberg U.S. Aggregate Bond Index weighted 30%, 10% and 60%, respectively. Prior to February 28, 2014, the Conservative Allocation Composite Index consisted of S&P 500® Index, the MSCI EAFE® Index and the Bloomberg U.S. Aggregate Bond Index weighted 35%, 5%, and 60%, respectively. |
| 5. | The Morningstar Moderately Conservative Allocation Category Average is a representative of funds in allocation categories that seek to provide both income and capital appreciation by primarily investing in multiple asset classes, including stocks, bonds, and cash. These moderately conservative strategies prioritize preservation of capital over appreciation. They typically expect volatility similar to a strategic equity exposure between 30% and 50%. Results are based on average total returns of similar funds with all dividends and capital gain distributions reinvested. |
The footnotes on the preceding page are an integral part of the table and graph and should be carefully read in conjunction with them.
| 6 | MainStay Conservative Allocation Fund |
Cost in Dollars of a $1,000 Investment in MainStay Conservative Allocation Fund (Unaudited)
The example below is intended to describe the fees and expenses borne by shareholders during the six-month period from May 1, 2023 to October 31, 2023, and the impact of those costs on your investment.
Example
As a shareholder of the Fund you incur two types of costs: (1) transaction costs, including exchange fees and sales charges (loads) on purchases (as applicable), and (2) ongoing costs, including management fees, distribution and/or service (12b-1) fees and other Fund expenses (as applicable). This example is intended to help you understand your ongoing costs (in dollars) of investing in the Fund and to compare these costs with the ongoing costs of investing in other mutual funds. The example is based on an investment of $1,000 made at the beginning of the six-month period and held for the entire period from May 1, 2023 to October 31, 2023.
This example illustrates your Fund’s ongoing costs in two ways:
Actual Expenses
The second and third data columns in the table below provide information about actual account values and actual expenses. You may use the information in these columns, together with the amount you invested, to estimate the expenses that you paid during the six months ended October 31, 2023. Simply divide your account value by $1,000 (for example, an
$8,600 account value divided by $1,000 = 8.6), then multiply the result by the number under the heading entitled “Expenses Paid During Period” to estimate the expenses you paid on your account during this period.
Hypothetical Example for Comparison Purposes
The fourth and fifth data columns in the table below provide information about hypothetical account values and hypothetical expenses based on the Fund’s actual expense ratio and an assumed rate of return of 5% per year before expenses, which is not the Fund’s actual return. The hypothetical account values and expenses may not be used to estimate the actual ending account balances or expenses you paid for the six-month period shown. You may use this information to compare the ongoing costs of investing in the Fund with the ongoing costs of investing in other mutual funds. To do so, compare this 5% hypothetical example with the 5% hypothetical examples that appear in the shareholder reports of the other mutual funds.
Please note that the expenses shown in the table are meant to highlight your ongoing costs only and do not reflect any transactional costs, such as exchange fees or sales charges (loads). Therefore, the fourth and fifth data columns of the table are useful in comparing ongoing costs only and will not help you determine the relative total costs of owning different funds. In addition, if these transactional costs were included, your costs would have been higher.
| Share Class | Beginning
Account
Value
5/1/23 | Ending Account
Value (Based
on Actual
Returns and
Expenses)
10/31/23 | Expenses
Paid
During
Period1 | Ending Account
Value (Based
on Hypothetical
5% Annualized
Return and
Actual Expenses)
10/31/23 | Expenses
Paid
During
Period1 | Net Expense
Ratio
During
Period2 |
| Class A Shares | $1,000.00 | $965.80 | $1.88 | $1,023.29 | $1.94 | 0.38% |
| Investor Class Shares | $1,000.00 | $964.90 | $2.72 | $1,022.43 | $2.80 | 0.55% |
| Class B Shares | $1,000.00 | $960.30 | $6.42 | $1,018.65 | $6.61 | 1.30% |
| Class C Shares | $1,000.00 | $961.20 | $6.43 | $1,018.65 | $6.61 | 1.30% |
| Class I Shares | $1,000.00 | $966.60 | $0.64 | $1,024.55 | $0.66 | 0.13% |
| Class R2 Shares | $1,000.00 | $965.40 | $2.38 | $1,022.79 | $2.45 | 0.48% |
| Class R3 Shares | $1,000.00 | $963.20 | $3.61 | $1,021.53 | $3.72 | 0.73% |
| SIMPLE Class Shares | $1,000.00 | $964.20 | $3.37 | $1,021.78 | $3.47 | 0.68% |
| 1. | Expenses are equal to the Fund’s annualized expense ratio of each class multiplied by the average account value over the period, divided by 365 and multiplied by 184 (to reflect the six-month period). The table above represents the actual expenses incurred during the six-month period. In addition to the fees and expenses which the Fund bears directly, it also indirectly bears a pro rata share of the fees and expenses of the underlying funds in which it invests. Such indirect expenses are not included in the above-reported expense figures. |
| 2. | Expenses are equal to the Fund's annualized expense ratio to reflect the six-month period. |
Asset Diversification as of October 31, 2023 (Unaudited)
| Equity Funds | 35.3% |
| Fixed Income Funds | 53.5 |
| Short-Term Investment | 10.9 |
| Other Assets, Less Liabilities | 0.3 |
See Portfolio of Investments beginning on page 13 for specific holdings within these categories. The Fund’s holdings are subject to change.
| 8 | MainStay Conservative Allocation Fund |
Portfolio Management Discussion and Analysis (Unaudited)
Questions answered by portfolio managers Jae S. Yoon, CFA, Jonathan Swaney, Poul Kristensen, CFA, and Amit Soni, CFA, of New York Life Investment Management LLC, the Fund’s Manager.
How did MainStay Conservative Allocation Fund perform relative to its benchmarks and peer group during the 12 months ended October 31, 2023?
For the 12 months ended October 31, 2023, Class I shares of MainStay Conservative Allocation Fund returned 2.63%, outperforming the 0.36% return of the Fund’s primary benchmark, the Bloomberg U.S. Aggregate Bond Index, and underperforming the 10.14% return of the S&P 500® Index, which is the Fund’s secondary benchmark. Over the same period, Class I shares of the Fund underperformed the 14.40% return of the MSCI EAFE® Index (Net), and the 4.72% return of the Conservative Allocation Composite Index, which are additional benchmarks of the Fund. For the 12 months ended October 31, 2023, Class I shares of the Fund also underperformed the 2.73% return of the Morningstar Moderately Conservative Allocation Category Average.1
Were there any changes to the Fund during the reporting period?
Effective February 28, 2023, the Fund has selected the Bloomberg U.S. Aggregate Bond Index as its primary benchmark and the S&P 500® Index as its secondary benchmark.
What factors affected the Fund’s relative performance during the reporting period?
The Fund is a “fund of funds,” meaning that it seeks to achieve its investment objective by investing primarily in mutual funds and exchange-traded funds (“ETFs”) managed by New York Life Investments or its affiliates (the “Underlying Funds”). The Underlying Funds may invest in U.S. equities, international equities and fixed-income instruments, making comparisons to any single index generally less suitable than a weighted combination of indices, which is a more useful yardstick by which to measure performance. The most influential factor affecting returns for the Fund during the reporting period (versus the performance of a weighted combination of indices) is the net performance of the Underlying Funds themselves, relative to their respective benchmarks. During the reporting period, asset class policy was the primary determinant of the Fund’s relative performance.
Fund management internally maintains a blend of indices that are taken into consideration when managing the Fund. During the reporting period, the Fund substantially underperformed this internally maintained blend of indices, primarily due to active positioning at the asset class level.
Management of the Fund’s stock/bond blend itself was not the primary issue affecting the Fund’s relative performance, as returns generated in the process of controlling that mix were only marginally negative. We held the Fund’s stock/bond allocation near neutral for much of the reporting period, but with a small bias toward holding underweight exposure to equities. That posture proved a liability through the spring and early summer of 2023, as a handful of mega-cap technology-related equities drove the market higher. We gradually removed the Fund’s underweight exposure to equities near the end of the reporting period. As a result, the Fund did not benefit materially when the market softened in late summer and into the fall.
Rather, the most significant factor undermining relative performance related to positioning within asset classes, primarily equities, was the Fund’s exposure to small-cap stocks, which detracted substantially from returns. Throughout the reporting period, relative valuations in the small-cap asset class were much more attractive than has been the historical norm, but small companies are significantly more sensitive to changes in bank financing conditions than large companies that can issue bonds. Fast-rising costs on bank loans, coupled with concerns about future credit availability in the wake of the bank crisis in the early spring of 2023, weighed heavily on the smaller end of the capitalization spectrum. We promptly restored the Fund’s small-cap allocation to neutral as the nature and scope of the crisis became clear.
Relative performance also suffered from efforts to avoid undue exposure to a small group of market-leading, mega-cap, technology-related companies. Recently dubbed ‘the Magnificent 7’ (Alphabet, Amazon, Apple, Meta Platforms, Microsoft, NVIDIA, and Tesla), these firms are richly valued, implying rapid earnings growth in the coming years. We remain skeptical that such growth is likely to be achieved by these companies, which are already among the largest enterprises in the world, with dominant positions in their respective industries. Accordingly, we shifted Fund assets out of capitalization-weighted large-cap index products, favoring other options—most notably, an equally weighted version of the S&P 500® Index. During the reporting period, however, ongoing enthusiasm for the commercial potential of artificial intelligence (“AI”), and the degree to which the Magnificent 7 are expected to benefit from these developments, helped them maintain their leadership positions. During the
| 1. | See "Investment and Performance Comparison" for other share class returns, which may be higher or lower than Class I share returns, and for more information on benchmark and peer group returns. |
reporting period, the Bloomberg Magnificent 7 Total Return Index2 returned approximately 65%, compared to a slightly negative return for the equally weighted S&P 500® Equal Weight Index.3
Tilts favoring defensive sectors, particularly health care, and low volatility stocks further detracted from the Fund’s relative performance. Basically, any skew in the Fund away from the sole winners of the reporting period—mega-cap tech-oriented companies—was a drag on relative results.
The Fund realized some positive results within equities. Tactical trading in gold miners, for example, proved helpful. The Fund also benefited from some swap positions, in which we pay the return (so are effectively “short”) on a set of highly leveraged companies that look especially vulnerable to higher borrowing costs and more restrictive lending standards. Exposure to uranium miners provided a small, but noticeable, positive contribution to returns as well. (Contributions take weightings and total returns into account.)
The fixed-income portion of the Fund also weighed on results, although to a lesser extent. Fixed income underperformance mainly resulted from the Fund’s duration4 management. The Fund held too little exposure to long-term bonds in the first half of the reporting period when yields were falling, and too much exposure late in the reporting period as yields were rising rapidly. The Fund also gave up a little ground due to underweight exposure to bank loans. We expected that defaults would rise considerably in that space as economic activity slowed, although the anticipated slowdown failed to materialize during the reporting period.
During the reporting period, how was the Fund’s performance materially affected by investments in derivatives?
Total return swaps were used to express most of the Fund’s asset class policy views. Therefore, the swaps can be seen as detracting from the Fund’s relative performance over the course of the reporting period.
How did you allocate the Fund’s assets during the reporting period and why?
Stock/bond blend: We held equity exposure within the Fund relatively close to neutral during the reporting period. We are generally reluctant to position the Fund with underweight equity exposure, since stocks tend to perform well over time and anticipating drawdowns is challenging. The opposite is less true;
we are happy to lean into equities when we believe they are well-supported fundamentally or when a correction has run further than we believe appropriate. Nevertheless, we shifted the Fund’s equity position to slightly underweight following a sharp rally in January 2023, and enlarged the underweight posture a little further late in the spring when banking sector turmoil appeared to increase the likelihood of a recession. As the recession failed to materialize, we gradually removed the underweight equity exposure over the course of the summer and into the fall.
Duration: After an extended period of holding a short duration position, in the spring of 2023, we shifted the Fund to a neutral position in expectation of an impending recession. We extended the Fund’s duration further in the summer and fall as yields rose, presumably in response to heavy new Treasury issuance, “higher for longer” monetary policy prospects, stubborn inflationary pressures, and rising yields abroad. As of the end of the reporting period, the Fund’s duration was slightly more than a half year long, reflecting our view that a combination of waning consumption, normalized supply chains and improving productivity will curb inflation in the quarters ahead, and yields will drop sharply.
Equity style: Growth stocks, by definition, exhibit richer valuations than value stocks. As a consequence, growth stock prices are relatively reliant on distant profits, and are often more sensitive to elevated inflation and higher interest rates than their value-oriented counterparts. Accordingly, given the high-rate environment that prevailed during the reporting period, we persistently tilted the Fund to emphasize value stocks that offered more substantial near-term cash flows. In particular, we focused on defensive, lower-volatility sectors, including utilities, consumer staples and—most of all—health care. This position undermined performance in 2023, as market performance was dominated by the aforementioned Magnificent 7—growth-oriented technology-related stocks swept by a wave of excitement over the prospects for generative AI.
Equity size: The Fund held overweight exposure to small-cap stocks during the first half of the reporting period. We based our thesis on several prevailing characteristics of the asset class: attractive valuations, insulation from economic weakness abroad, less sensitivity to dollar strength and disproportionate exposure to domestic demand, which thus far remains robust. That position proved unconstructive during the spring of 2023, as
| 2. | The Bloomberg Magnificent 7 Total Return Index is an equal-dollar weighted equity benchmark consisting of a fixed basket of 7 widely-traded companies classified in the United States and representing the Communications, Consumer Discretionary and Technology sectors as defined by Bloomberg Industry Classification System (BICS). An investment cannot be made directly in an index. |
| 3. | The S&P 500® Equal Weight Index (“EWI”) is the equal-weight version of the widely-used S&P 500® Index. The S&P 500® EWI includes the same constituents as the capitalization weighted S&P 500® Index, but each company in the S&P 500® EWI is allocated a fixed weight, or 0.2% of the Index total at each quarterly rebalance. An investment cannot be made directly in an index. |
| 4. | Duration is a measure of the price sensitivity of a fixed-income investment to changes in interest rates. Duration is expressed as a number of years and is considered a more accurate sensitivity gauge than average maturity. |
| 10 | MainStay Conservative Allocation Fund |
small companies tend to be heavily dependent on bank financing, and banks aggressively tightened lending standards in the wake of the banking crisis that occurred in March and April. Accordingly, we unwound the Fund’s small-cap bias. However, it is important to note that the proceeds did not flow to large blend index exposure, where the Magnificent 7 dominate. Rather, the redirected assets went into the S&P 500® Equal Weight Index, where those seven names comprise less than 2% of that Index.
Geographic exposure: During the latter part of the reporting period, European equities appeared vulnerable. We expected that persistently high wage growth would compel the European Central Bank to maintain its restrictive monetary policies for an extended period of time while European export-heavy economies wrestled with declining global trade volumes. In addition, Europe appeared particularly exposed to potential energy price spikes amid elevated geopolitical tensions. On the other hand, the Bank of Japan remained engaged in accommodative policy, Japanese exports benefited from a weak yen, and Japanese companies increasingly prioritized shareholder governance, largely in the form of share buybacks. Given these divergent conditions, we tilted the Fund away from European markets in favor of Japanese stocks, while holding net exposure to non-US stocks close to neutral.
Energy: The Fund maintained exposure to upstream energy producers and oilfield/gas field service providers as a commodity play to provide an additional inflation hedge. These holdings also positioned the Fund to take advantage of opportunities for domestic producers to benefit as Western nations revisit energy policy to source supplies from stable and friendly jurisdictions rather than autocratic petrostates that present national security risks. The Fund’s small, but volatile, energy position detracted significantly from performance during the first half of the reporting period but fully recovered in the second half.
How did the Fund’s allocations change over the course of the reporting period?
In one of the more substantial changes in allocations undertaken during the reporting period, we reduced the Fund’s exposure to small-cap stocks, expressed via total return swaps. We took this action in response to the banking crisis that unfolded in the spring of 2023. Other changes included a reduction in the Fund’s holdings of MainStay Floating Rate Fund, thereby decreasing exposure to lower-credit-quality fixed-income instruments ahead of an expected recession. We unwound the Fund’s swap exposure to VanEck Gold Miners ETF, taking profits and exiting a profitable trade on a high note. Lastly, we used swaps to tilt the Fund away
from baskets of specific stocks that were either heavily dependent on floating-rate loans (such as Uber, United Airlines and Carnival) or that generated insufficient operating income to retire debt as it came due (so-called ‘zombie’ companies, such as Royal Caribbean, Wynn Resorts and Rivian Automotive). We believed these firms were especially vulnerable in an environment of fast-rising interest rates and tightening lending standards.
New or increased allocations included, first and foremost, exposure to iShares 20+ Year Treasury Bond ETF, which we used to extend the Fund’s duration as bond yields rose. Another consequential change involved the establishment and growth of an allocation to Invesco S&P 500® Equal Weight ETF, funded in part from cash. We adopted this position to remove the Fund’s underweight exposure to equities without significantly increasing its exposure to the Magnificent 7 mega-cap technology-related names. We also initiated a new Fund position in iShares MSCI Japan ETF (via a swap), as we saw valuations as attractive, export conditions as favorable and the Japanese yen likely to appreciate should the Bank of Japan abandon its existing yield curve5 control policy. Another notable addition involved the establishment of exposure to Global X Uranium ETF, which invests primarily in uranium mining firms. Climate change concerns, net-zero commitments and the limitations of renewable energy are driving a reconsideration of nuclear energy, for which fuel supply is rather limited. We foresee a supply/demand imbalance developing that is likely to support businesses involved with extracting and processing uranium.
At the Underlying Fund level, we took advantage of a few new investment options, adopting a position in IQ MacKay ESG High Income ETF, with proceeds from MainStay MacKay High Yield Corporate Bond Fund. Other holdings in newly available Underlying Equity Funds included MainStay PineStone U.S. Equity Fund, IQ Candriam U.S. Mid Cap Equity ETF and MainStay Fiera SMID Growth Fund.
During the reporting period, which Underlying Equity Funds had the highest total returns and which had the lowest total returns?
The Fund’s top-performing Underlying Equity Funds that were held for the entire reporting period included MainStay Winslow Large Cap Growth Fund (and its sister product, IQ Winslow Large Cap Growth ETF), IQ 500 International ETF and MainStay Epoch Capital Growth Fund. The worst-performing positions included MainStay WMC Small Companies Fund, IQ U.S. Small Cap ETF and swap exposure to the S&P Small Cap 600® Index.6
| 5. | The yield curve is a line that plots the yields of various securities of similar quality—typically U.S. Treasury issues—across a range of maturities. The U.S. Treasury yield curve serves as a benchmark for other debt and is used in economic forecasting. |
| 6. | The S&P Small Cap 600™ Index covers roughly the small-cap range of American stocks, using a capitalization-weighted index. Capitalization range is from $850 million to $3.7 billion. An investment cannot be made directly in an index. |
Which Underlying Equity Funds were the strongest positive contributors to the Fund’s performance and which Underlying Equity Funds were particularly weak?
The strongest positive contributions to performance came from MainStay Winslow Large Cap Growth Fund, MainStay WMC Growth Fund and IQ Candriam U.S. Large Cap Equity ETF. The direct fund holdings detracting most significantly from returns included IQ Candriam U.S. Mid Cap Equity ETF, MainStay WMC Small Companies Fund and MainStay Fiera SMID Growth Fund. Losses were greater in some swap positions in which we paid the return to iShares MSCI EAFE Index, the Russell 1000® Growth Index and the S&P 500® Equal Weight Index.
During the reporting period, which Underlying Fixed-Income Funds had the highest total returns and which Underlying Fixed-Income Funds had the lowest total returns?
The Fund held only five fixed-income positions for the entire reporting period, all of which generated positive returns. The three best performers included MainStay Floating Rate Fund, MainStay MacKay Short Duration High Yield Fund and MainStay MacKay High Yield Corporate Bond Fund. The lowest total returns came from IQ MacKay ESG Core Plus Bond ETF, MainStay MacKay Total Return Bond Fund and cash holdings.
Which Underlying Fixed-Income Funds were the strongest positive contributors to the Fund’s performance and which Underlying Fixed-Income Funds were particularly weak?
The largest contributors to the Fund’s absolute returns came from cash holdings and positions in MainStay Floating Rate Fund and MainStay MacKay Total Return Bond Fund. The only fixed-income position that detracted from performance was swap exposure to iShares 20+ Year Treasury Bond ETF. The smallest positive contributions to Fund performance came from MainStay Short Term Bond Fund and MainStay MacKay High Yield Corporate Bond Fund.
How was the Fund positioned at the end of the reporting period?
For some time now, we have held the view that a recession in response to dramatic monetary policy tightening and the expiration of pandemic-era support programs is all but inevitable. This remains the case today, and indications of the onset of said recession are beginning to accumulate. We firmly expect corporate profits to decline over the next several quarters, eventually taking stock prices down with them, while also driving down Treasury yields and pushing credit spreads7 out.
Accordingly, as of October 31, 2023, the Fund maintains a relatively defensive posture.
Given the difficulty in predicting a market top, we are resistant to holding an underweight position in equities. As such, we are maintaining a neutral position for the Fund at this time, although we intend to exploit any significant pullbacks - should they arise - by building an oversight position.
The Fund’s defensive positioning is more evident within asset classes. Most notably, we have extended the Fund’s duration considerably through purchases of a long-dated Treasury bond ETF, with the expectation that it will benefit from the trend of investors to shift out of risky assets as economic and market conditions deteriorate. Additionally, we are maintaining exposure to bank loans at a below-benchmark weight, and skewing holdings of high yield bonds to favor shorter maturity instruments, which tend to exhibit less volatility and smaller losses than do longer-maturity bonds.
On the equity side, the Fund favors sectors that have generally exhibited lower volatility and retained their value better during drawdowns. Prominent among these are utilities and health care. We have also skewed the Fund away from a set of highly leveraged companies deemed to be especially vulnerable to a tightening credit environment.
| 7. | The terms “spread” and “yield spread” may refer to the difference in yield between a security or type of security and comparable U.S. Treasury issues. The terms may also refer to the difference in yield between two specific securities or types of securities at a given time. The term “credit spread” typically refers to the difference in yield between corporate or municipal bonds (or a specific category of these bonds) comparable to U.S. Treasury issues. |
The opinions expressed are those of the portfolio managers as of the date of this report and are subject to change. There is no guarantee that any forecasts will come to pass. This material does not constitute investment advice and is not intended as an endorsement of any specific investment.
| 12 | MainStay Conservative Allocation Fund |
Portfolio of Investments October 31, 2023†^
| | Shares | Value |
| Affiliated Investment Companies 88.8% |
| Equity Funds 35.3% |
| IQ 500 International ETF | 208,359 | $ 6,173,490 |
| IQ Candriam International Equity ETF | 244,100 | 6,085,071 |
| IQ Candriam U.S. Large Cap Equity ETF | 278,280 | 10,201,801 |
| IQ Candriam U.S. Mid Cap Equity ETF | 245,130 | 6,125,848 |
| IQ FTSE International Equity Currency Neutral ETF | 326,633 | 7,362,308 |
| IQ U.S. Large Cap ETF | 240,817 | 7,594,188 |
| IQ U.S. Small Cap ETF | 131,349 | 3,873,456 |
| IQ Winslow Large Cap Growth ETF (a) | 41,013 | 1,256,745 |
| MainStay Candriam Emerging Markets Equity Fund Class R6 | 644,127 | 5,424,132 |
| MainStay Epoch Capital Growth Fund Class I | 106,039 | 1,276,728 |
| MainStay Epoch International Choice Fund Class I | 102,921 | 3,621,407 |
| MainStay Epoch U.S. Equity Yield Fund Class R6 (a) | 419,447 | 7,755,697 |
| MainStay Fiera SMID Growth Fund Class R6 | 429,083 | 6,061,136 |
| MainStay PineStone International Equity Fund Class R6 | 267,483 | 3,634,689 |
| MainStay PineStone U.S. Equity Fund Class R6 (a) | 469,881 | 7,316,895 |
| MainStay S&P 500 Index Fund Class I | 113,229 | 5,599,451 |
| MainStay Winslow Large Cap Growth Fund Class R6 | 973,046 | 9,729,872 |
| MainStay WMC Enduring Capital Fund Class R6 | 232,848 | 7,008,754 |
| MainStay WMC Growth Fund Class R6 (a) | 283,870 | 10,236,768 |
| MainStay WMC International Research Equity Fund Class I | 554,016 | 3,641,159 |
| MainStay WMC Small Companies Fund Class I | 220,372 | 4,133,416 |
| MainStay WMC Value Fund Class R6 | 248,772 | 6,971,485 |
Total Equity Funds
(Cost $115,876,934) | | 131,084,496 |
| Fixed Income Funds 53.5% |
| IQ MacKay ESG Core Plus Bond ETF (a) | 3,627,377 | 71,017,512 |
| IQ Mackay ESG High Income ETF (a) | 247,832 | 6,204,474 |
| MainStay Floating Rate Fund Class R6 (a) | 2,365,396 | 20,709,511 |
| MainStay MacKay High Yield Corporate Bond Fund Class R6 | 1,271,887 | 6,223,723 |
| MainStay MacKay Short Duration High Yield Fund Class I | 1,727,100 | 15,854,436 |
| MainStay MacKay Total Return Bond Fund Class R6 (a) | 8,521,338 | 71,122,495 |
| | Shares | | Value |
| |
| Fixed Income Funds (continued) |
| MainStay Short Term Bond Fund Class I (a) | 840,491 | | $ 7,525,591 |
Total Fixed Income Funds
(Cost $226,299,234) | | | 198,657,742 |
Total Affiliated Investment Companies
(Cost $342,176,168) | | | 329,742,238 |
| Short-Term Investment 10.9% |
| Affiliated Investment Company 10.9% |
| MainStay U.S. Government Liquidity Fund, 5.275% (b) | 40,309,308 | | 40,309,308 |
Total Short-Term Investment
(Cost $40,309,308) | 10.9% | | 40,309,308 |
Total Investments
(Cost $382,485,476) | 99.7% | | 370,051,546 |
| Other Assets, Less Liabilities | 0.3 | | 1,063,491 |
| Net Assets | 100.0% | | $ 371,115,037 |
| † | Percentages indicated are based on Fund net assets. |
| ^ | Industry classifications may be different than those used for compliance monitoring purposes. |
| (a) | As of October 31, 2023, the Fund's ownership exceeds 5% of the outstanding shares of the Underlying Fund's share class. |
| (b) | Current yield as of October 31, 2023. |
The notes to the financial statements are an integral part of, and should be read in conjunction with, the financial statements.
13
Portfolio of Investments October 31, 2023†^ (continued)
Investments in Affiliates (in 000's)
Investments in issuers considered to be affiliate(s) of the Fund during the year ended October 31, 2023 for purposes of Section 2(a)(3) of the Investment Company Act of 1940, as amended, were as follows:
| Affiliated Investment Companies | Value,
Beginning
of Year | Purchases
at Cost | Proceeds
from
Sales | Net
Realized
Gain/(Loss)
on Sales | Change in
Unrealized
Appreciation/
(Depreciation) | Value,
End of
Year | Dividend
Income | Other
Distributions | Shares
End of
Year |
| IQ 500 International ETF | $ 6,936 | $ 204 | $ (1,952) | $ 73 | $ 912 | $ 6,173 | $ 248 | $ — | 208 |
| IQ Candriam International Equity ETF | 6,872 | 196 | (1,801) | 255 | 563 | 6,085 | 202 | — | 244 |
| IQ Candriam U.S. Large Cap Equity ETF | 13,661 | 293 | (5,448) | 1,190 | 506 | 10,202 | 180 | — | 278 |
| IQ Candriam U.S. Mid Cap Equity ETF | — | 7,775 | (840) | (26) | (783) | 6,126 | 22 | — | 245 |
| IQ FTSE International Equity Currency Neutral ETF | 8,250 | 84 | (1,856) | 202 | 683 | 7,363 | 178 | 151 | 327 |
| IQ MacKay ESG Core Plus Bond ETF | 70,570 | 9,676 | (6,815) | (1,012) | (1,401) | 71,018 | 3,438 | — | 3,627 |
| IQ Mackay ESG High Income ETF | — | 6,577 | (194) | (1) | (177) | 6,205 | 185 | — | 248 |
| IQ U.S. Large Cap ETF | 11,039 | 63 | (3,778) | 149 | 121 | 7,594 | 164 | — | 241 |
| IQ U.S. Small Cap ETF | 8,332 | 1,480 | (5,544) | 847 | (1,242) | 3,873 | 106 | — | 131 |
| IQ Winslow Large Cap Growth ETF | 727 | 338 | (13) | — | 205 | 1,257 | —(a) | — | 41 |
| MainStay Candriam Emerging Markets Equity Fund Class R6 | 5,739 | 175 | (636) | (239) | 385 | 5,424 | 68 | — | 644 |
| MainStay Epoch Capital Growth Fund Class I | 1,458 | 21 | (418) | (53) | 269 | 1,277 | 6 | 14 | 106 |
| MainStay Epoch International Choice Fund Class I | 4,148 | 104 | (1,176) | 218 | 327 | 3,621 | 54 | — | 103 |
| MainStay Epoch U.S. Equity Yield Fund Class R6 | 11,410 | 471 | (4,015) | 679 | (789) | 7,756 | 243 | 164 | 419 |
| MainStay Fiera SMID Growth Fund Class R6 | — | 6,702 | (35) | (1) | (605) | 6,061 | — | — | 429 |
| MainStay Floating Rate Fund Class R6 | 30,201 | 2,693 | (12,865) | (606) | 1,287 | 20,710 | 2,124 | — | 2,365 |
| MainStay MacKay High Yield Corporate Bond Fund Class R6 | 13,338 | 764 | (8,106) | (467) | 695 | 6,224 | 585 | — | 1,272 |
| MainStay MacKay International Equity Fund Class R6 | 3,985 | 143 | (4,280) | (990) | 1,142 | — | 36 | — | — |
| MainStay MacKay Short Duration High Yield Fund Class I | 16,996 | 1,395 | (2,719) | (150) | 332 | 15,854 | 972 | — | 1,727 |
| MainStay MacKay Total Return Bond Fund Class R6 | 79,386 | 5,013 | (11,674) | (2,517) | 914 | 71,122 | 3,412 | — | 8,521 |
| MainStay PineStone International Equity Fund Class R6 (b) | — | 3,886 | — | — | (251) | 3,635 | — | — | 267 |
| MainStay PineStone U.S. Equity Fund Class R6 | — | 7,662 | — | — | (345) | 7,317 | — | — | 470 |
| MainStay S&P 500 Index Fund Class I | 6,225 | 656 | (1,332) | 260 | (210) | 5,599 | 86 | 487 | 113 |
| MainStay Short Term Bond Fund Class I | — | 8,186 | (513) | (7) | (140) | 7,526 | 196 | — | 840 |
| MainStay U.S. Government Liquidity Fund | 41,566 | 71,676 | (72,933) | — | — | 40,309 | 1,869 | — | 40,309 |
| MainStay Winslow Large Cap Growth Fund Class R6 | 12,631 | 1,438 | (5,354) | 256 | 759 | 9,730 | 29 | 1,391 | 973 |
| MainStay WMC Enduring Capital Fund Class R6 | 10,570 | 709 | (4,417) | (634) | 781 | 7,009 | 61 | 376 | 233 |
| MainStay WMC Growth Fund Class R6 | 13,337 | 646 | (5,959) | (2,068) | 4,281 | 10,237 | — | — | 284 |
| MainStay WMC International Research Equity Fund Class I | 4,070 | 144 | (1,030) | (101) | 558 | 3,641 | 84 | — | 554 |
| MainStay WMC Small Companies Fund Class I | 8,623 | 1,580 | (5,156) | (539) | (375) | 4,133 | 185 | — | 220 |
| MainStay WMC Value Fund Class R6 | 11,002 | 785 | (4,244) | (71) | (501) | 6,971 | 178 | 403 | 249 |
| | $401,072 | $141,535 | $(175,103) | $(5,353) | $ 7,901 | $370,052 | $14,911 | $2,986 | |
| | |
| (a) | Less than $500. |
| (b) | As of September 8, 2023, the Fund exchanged in a nontaxable transfer of all shares of the MainStay MacKay International Equity Fund Class R6 into the newly launched MainStay PineStone International Equity Fund Class R6. |
The notes to the financial statements are an integral part of, and should be read in conjunction with, the financial statements.
| 14 | MainStay Conservative Allocation Fund |
Swap Contracts
Open OTC total return equity swap contracts as of October 31, 2023 were as follows1:
Swap
Counterparty | Reference Obligation | Floating Rate2 | Termination
Date(s) | Payment
Frequency
Paid/
Received | Notional
Amount
Long/
(Short)
(000)3 | Unrealized
Appreciation/
(Depreciation)4 |
| Citibank NA | Citi Leveraged Loan Basket | 1 day FEDF minus 0.20% | 12/4/23 | Daily | (3,920) | $ — |
| Citibank NA | Citi Zombie Company Basket | 1 day FEDF minus 0.50% | 12/4/23 | Daily | (3,527) | — |
| JPMorgan Chase Bank NA | Global X Uranium ETF | 1 day FEDF plus 0.50% | 10/8/24 - 10/15/24 | Daily | 4,003 | — |
| Citibank NA | Invesco S&P 500 Low Volatility ETF | 1 day FEDF plus 0.45% | 12/4/23 | Daily | 3,736 | — |
| Citibank NA | iShares 20+ Year Treasury Bond ETF | 1 day FEDF plus 0.38% | 12/4/23 | Daily | 20,336 | — |
| Citibank NA | iShares MSCI EAFE ETF | 1 day FEDF minus 1.25% | 12/4/23 | Daily | (9,298) | — |
| Citibank NA | iShares MSCI Emerging Markets ETF | 1 day FEDF minus 0.54% | 12/4/23 | Daily | (2,010) | — |
| JPMorgan Chase Bank NA | iShares MSCI Japan ETF | 1 day FEDF plus 0.15% | 4/24/24 - 5/7/24 | Daily | 11,127 | — |
| JPMorgan Chase Bank NA | Materials Select Sector SPDR Fund | 1 day FEDF plus 0.18% | 2/5/24 | Daily | 3,664 | — |
| Citibank NA | Russell 1000 Growth Total Return Index | 1 day FEDF minus 0.20% | 12/4/23 | Daily | (5,442) | — |
| JPMorgan Chase Bank NA | Russell 2000 Total Return Index | 1 day FEDF minus 0.15% - plus 0.02% | 4/9/24 - 5/7/24 | Daily | (15,498) | — |
| JPMorgan Chase Bank NA | S&P 500 Equal Weight | 1 day FEDF plus 0.30% - 0.51% | 5/7/24 | Daily | 16,324 | — |
| Citibank NA | S&P 500 Health Care Sector | 1 day FEDF plus 0.45% | 12/4/23 | Daily | 3,817 | — |
| Citibank NA | S&P 500 Total Return Index | 1 day FEDF plus 0.05% | 12/4/23 | Daily | (10,184) | — |
| Citibank NA | S&P 500 Utilities Total Return | 1 day FEDF plus 0.50% | 12/4/23 | Daily | 3,840 | — |
| Citibank NA | S&P 600 Total Return | 1 day FEDF plus 0.41% | 12/4/23 | Daily | 17,880 | — |
| Citibank NA | S&P Midcap 400 Total Return Index | 1 day FEDF plus 0.31% | 12/4/23 | Daily | 9,435 | — |
| Citibank NA | Vanguard FTSE Europe ETF | 1 day FEDF minus 5.00% | 12/4/23 | Daily | (3,692) | — |
| | | | | | | $ — |
The following table represents the basket holdings underlying the total return swap with Citi Leveraged Loan Basket as of October 31, 2023.
| Security Description | Shares | Notional Value | Unrealized Appreciation/
Depreciation | Percent of
Basket Net Assets |
| AerCap Holdings NV | (1,907) | (184,451) | — | 4.71 |
| Apollo Commercial Real Estate Finance, Inc. | (358) | (34,637) | — | 0.88 |
| Atlantica Sustainable Infrastructure plc | (225) | (21,793) | — | 0.56 |
| Brandywine Realty Trust | (324) | (31,311) | — | 0.80 |
| Carnival Corp. | (4,784) | (462,659) | — | 11.80 |
| Chart Industries, Inc. | (1,839) | (177,838) | — | 4.54 |
| Coherent Corp. | (765) | (73,977) | — | 1.89 |
| CommScope Holding Co, Inc. | (71) | (6,856) | — | 0.17 |
| Crane NXT Co | (1,414) | (136,702) | — | 3.49 |
| Cushman & Wakefield plc | (359) | (34,751) | — | 0.89 |
| Delta Air Lines, Inc. | (3,807) | (368,095) | — | 9.39 |
| Designer Brands, Inc. | (398) | (38,455) | — | 0.98 |
| DigitalBridge Group, Inc. | (627) | (60,588) | — | 1.55 |
| Elanco Animal Health, Inc. | (1,566) | (151,410) | — | 3.86 |
| Entegris, Inc. | (2,488) | (240,614) | — | 6.14 |
| Fidelity National Information Services, Inc. | (3,746) | (362,255) | — | 9.24 |
| Hanesbrands, Inc. | (1,015) | (98,137) | — | 2.50 |
| JetBlue Airways Corp. | (535) | (51,763) | — | 1.32 |
| Lumen Technologies, Inc. | (1,102) | (106,569) | — | 2.72 |
| MKS Instruments, Inc. | (734) | (70,965) | — | 1.81 |
| Oatly Group AB | (44) | (4,295) | — | 0.11 |
| Opendoor Technologies, Inc. | (762) | (73,708) | — | 1.88 |
The notes to the financial statements are an integral part of, and should be read in conjunction with, the financial statements.
15
Portfolio of Investments October 31, 2023†^ (continued)
| Security Description | Shares | Notional Value | Unrealized Appreciation/
Depreciation | Percent of
Basket Net Assets |
| Par Pacific Holdings, Inc. | (583) | (56,352) | — | 1.44 |
| PureCycle Technologies, Inc. | (231) | (22,312) | — | 0.57 |
| Scorpio Tankers, Inc. | (1,322) | (127,867) | — | 3.26 |
| Topgolf Callaway Brands Corp. | (386) | (37,317) | — | 0.95 |
| Uber Technologies, Inc. | (5,829) | (563,713) | — | 14.38 |
| United Airlines Holdings, Inc. | (3,311) | (320,186) | — | 8.17 |
| 1. | As of October 31, 2023, cash in the amount $2,200,000 was pledged to brokers for OTC swap contracts. |
| 2. | Fund pays the floating rate and receives the total return of the reference entity. |
| 3. | Notional amounts reflected as a positive value indicate a long position held by the Fund or Index and a negative value indicates a short position. |
| 4. | Reflects the value at reset date as of October 31, 2023. |
| Abbreviation(s): |
| EAFE—Europe, Australasia and Far East |
| ETF—Exchange-Traded Fund |
| FEDF—Federal Funds Rate |
| FTSE—Financial Times Stock Exchange |
| MSCI—Morgan Stanley Capital International |
| SPDR—Standard & Poor’s Depositary Receipt |
The following is a summary of the fair valuations according to the inputs used as of October 31, 2023, for valuing the Fund’s assets:
| Description | Quoted
Prices in
Active
Markets for
Identical
Assets
(Level 1) | | Significant
Other
Observable
Inputs
(Level 2) | | Significant
Unobservable
Inputs
(Level 3) | | Total |
| Asset Valuation Inputs | | | | | | | |
| Investments in Securities (a) | | | | | | | |
| Affiliated Investment Companies | | | | | | | |
| Equity Funds | $ 131,084,496 | | $ — | | $ — | | $ 131,084,496 |
| Fixed Income Funds | 198,657,742 | | — | | — | | 198,657,742 |
| Total Affiliated Investment Companies | 329,742,238 | | — | | — | | 329,742,238 |
| Short-Term Investment | | | | | | | |
| Affiliated Investment Company | 40,309,308 | | — | | — | | 40,309,308 |
| Total Investments in Securities | $ 370,051,546 | | $ — | | $ — | | $ 370,051,546 |
| (a) | For a complete listing of investments, see the Portfolio of Investments. |
The notes to the financial statements are an integral part of, and should be read in conjunction with, the financial statements.
| 16 | MainStay Conservative Allocation Fund |
Statement of Assets and Liabilities as of October 31, 2023
| Assets |
Investment in affiliated investment companies, at value
(identified cost $382,485,476) | $370,051,546 |
| Cash | 90,890 |
| Cash collateral on deposit at broker for swap contracts | 2,200,000 |
| Receivables: | |
| Dividends and interest | 173,722 |
| Fund shares sold | 52,889 |
| Prepaid expenses | 16 |
| Other assets | 43,726 |
| Total assets | 372,612,789 |
| Liabilities |
| Payables: | |
| Dividends and interest on OTC swaps contracts | 1,009,109 |
| Fund shares redeemed | 264,433 |
| NYLIFE Distributors (See Note 3) | 89,451 |
| Transfer agent (See Note 3) | 74,382 |
| Shareholder communication | 34,486 |
| Custodian | 12,603 |
| Professional fees | 12,043 |
| Manager (See Note 3) | 331 |
| Trustees | 24 |
| Accrued expenses | 890 |
| Total liabilities | 1,497,752 |
| Net assets | $371,115,037 |
| Composition of Net Assets |
| Shares of beneficial interest outstanding (par value of $.001 per share) unlimited number of shares authorized | $ 35,298 |
| Additional paid-in-capital | 389,644,614 |
| | 389,679,912 |
| Total distributable earnings (loss) | (18,564,875) |
| Net assets | $371,115,037 |
| Class A | |
| Net assets applicable to outstanding shares | $312,385,347 |
| Shares of beneficial interest outstanding | 29,693,101 |
| Net asset value per share outstanding | $ 10.52 |
| Maximum sales charge (3.00% of offering price) | 0.33 |
| Maximum offering price per share outstanding | $ 10.85 |
| Investor Class | |
| Net assets applicable to outstanding shares | $ 31,064,760 |
| Shares of beneficial interest outstanding | 2,953,661 |
| Net asset value per share outstanding | $ 10.52 |
| Maximum sales charge (2.50% of offering price) | 0.27 |
| Maximum offering price per share outstanding | $ 10.79 |
| Class B | |
| Net assets applicable to outstanding shares | $ 3,153,220 |
| Shares of beneficial interest outstanding | 305,427 |
| Net asset value and offering price per share outstanding | $ 10.32 |
| Class C | |
| Net assets applicable to outstanding shares | $ 12,276,330 |
| Shares of beneficial interest outstanding | 1,189,314 |
| Net asset value and offering price per share outstanding | $ 10.32 |
| Class I | |
| Net assets applicable to outstanding shares | $ 7,384,689 |
| Shares of beneficial interest outstanding | 693,414 |
| Net asset value and offering price per share outstanding | $ 10.65 |
| Class R2 | |
| Net assets applicable to outstanding shares | $ 156,577 |
| Shares of beneficial interest outstanding | 14,889 |
| Net asset value and offering price per share outstanding | $ 10.52 |
| Class R3 | |
| Net assets applicable to outstanding shares | $ 2,577,270 |
| Shares of beneficial interest outstanding | 246,306 |
| Net asset value and offering price per share outstanding | $ 10.46 |
| SIMPLE Class | |
| Net assets applicable to outstanding shares | $ 2,116,844 |
| Shares of beneficial interest outstanding | 201,758 |
| Net asset value and offering price per share outstanding | $ 10.49 |
The notes to the financial statements are an integral part of, and should be read in conjunction with, the financial statements.
17
Statement of Operations for the year ended October 31, 2023
| Investment Income (Loss) |
| Income | |
| Dividend distributions from affiliated investment companies | $ 14,910,973 |
| Expenses | |
| Distribution/Service—Class A (See Note 3) | 839,049 |
| Distribution/Service—Investor Class (See Note 3) | 84,183 |
| Distribution/Service—Class B (See Note 3) | 45,545 |
| Distribution/Service—Class C (See Note 3) | 156,611 |
| Distribution/Service—Class R2 (See Note 3) | 381 |
| Distribution/Service—Class R3 (See Note 3) | 12,395 |
| Distribution/Service—SIMPLE Class (See Note 3) | 9,065 |
| Transfer agent (See Note 3) | 405,611 |
| Registration | 109,902 |
| Professional fees | 74,133 |
| Custodian | 37,386 |
| Trustees | 10,307 |
| Shareholder service (See Note 3) | 2,631 |
| Miscellaneous | 13,121 |
| Total expenses before waiver/reimbursement | 1,800,320 |
| Expense waiver/reimbursement from Manager (See Note 3) | (67,060) |
| Reimbursement from prior custodian(a) | (811) |
| Net expenses | 1,732,449 |
| Net investment income (loss) | 13,178,524 |
| Realized and Unrealized Gain (Loss) |
| Net realized gain (loss) on: | |
| Affiliated investment company transactions | (5,353,226) |
| Realized capital gain distributions from affiliated investment companies | 2,986,337 |
| Swap transactions | (8,222,111) |
| Net realized gain (loss) | (10,589,000) |
Net change in unrealized appreciation (depreciation) on:
Affiliated investments companies | 7,901,408 |
| Net realized and unrealized gain (loss) | (2,687,592) |
| Net increase (decrease) in net assets resulting from operations | $ 10,490,932 |
| (a) | Represents a refund for overbilling of custody fees. |
The notes to the financial statements are an integral part of, and should be read in conjunction with, the financial statements.
| 18 | MainStay Conservative Allocation Fund |
Statements of Changes in Net Assets
for the years ended October 31, 2023 and October 31, 2022
| | 2023 | 2022 |
| Increase (Decrease) in Net Assets |
| Operations: | | |
| Net investment income (loss) | $ 13,178,524 | $ 9,307,734 |
| Net realized gain (loss) | (10,589,000) | 7,852,353 |
| Net change in unrealized appreciation (depreciation) | 7,901,408 | (88,020,370) |
| Net increase (decrease) in net assets resulting from operations | 10,490,932 | (70,860,283) |
| Distributions to shareholders: | | |
| Class A | (9,330,355) | (32,054,607) |
| Investor Class | (887,959) | (2,979,304) |
| Class B | (103,952) | (720,688) |
| Class C | (354,812) | (1,918,125) |
| Class I | (221,882) | (665,424) |
| Class R2 | (4,078) | (10,998) |
| Class R3 | (62,481) | (140,771) |
| SIMPLE Class | (43,011) | (41,601) |
| | (11,008,530) | (38,531,518) |
| Distributions to shareholders from return of capital: | | |
| Class A | (5,483,513) | — |
| Investor Class | (521,859) | — |
| Class B | (61,094) | — |
| Class C | (208,526) | — |
| Class I | (130,401) | — |
| Class R2 | (2,396) | — |
| Class R3 | (36,720) | — |
| SIMPLE Class | (25,278) | — |
| | (6,469,787) | — |
| Total distributions to shareholders | (17,478,317) | (38,531,518) |
| Capital share transactions: | | |
| Net proceeds from sales of shares | 28,523,895 | 48,044,098 |
| Net asset value of shares issued to shareholders in reinvestment of distributions | 17,304,759 | 38,086,216 |
| Cost of shares redeemed | (71,998,268) | (85,734,187) |
| Increase (decrease) in net assets derived from capital share transactions | (26,169,614) | 396,127 |
| Net increase (decrease) in net assets | (33,156,999) | (108,995,674) |
| Net Assets |
| Beginning of year | 404,272,036 | 513,267,710 |
| End of year | $371,115,037 | $ 404,272,036 |
The notes to the financial statements are an integral part of, and should be read in conjunction with, the financial statements.
19
Financial Highlights selected per share data and ratios
| | Year Ended October 31, |
| Class A | 2023 | | 2022 | | 2021 | | 2020 | | 2019 |
| Net asset value at beginning of year | $ 10.74 | | $ 13.53 | | $ 12.23 | | $ 11.96 | | $ 11.69 |
| Net investment income (loss) (a) | 0.37 | | 0.25 | | 0.22 | | 0.25 | | 0.24 |
| Net realized and unrealized gain (loss) | (0.10) | | (2.02) | | 1.64 | | 0.33 | | 0.69 |
| Total from investment operations | 0.27 | | (1.77) | | 1.86 | | 0.58 | | 0.93 |
| Less distributions: | | | | | | | | | |
| From net investment income | (0.12) | | (0.44) | | (0.19) | | (0.26) | | (0.28) |
| From net realized gain on investments | (0.19) | | (0.58) | | (0.37) | | (0.05) | | (0.38) |
| Return of capital | (0.18) | | — | | — | | — | | — |
| Total distributions | (0.49) | | (1.02) | | (0.56) | | (0.31) | | (0.66) |
| Net asset value at end of year | $ 10.52 | | $ 10.74 | | $ 13.53 | | $ 12.23 | | $ 11.96 |
| Total investment return (b) | 2.41% | | (14.05)% | | 15.51% | | 5.00% | | 8.54% |
| Ratios (to average net assets)/Supplemental Data: | | | | | | | | | |
| Net investment income (loss) | 3.34% | | 2.09% | | 1.67% | | 2.10% | | 2.11% |
| Net expenses (c) | 0.37% | | 0.35% | | 0.37% | | 0.37% | | 0.38% |
| Portfolio turnover rate | 19% | | 38% | | 25% | | 70% | | 46% |
| Net assets at end of year (in 000’s) | $ 312,385 | | $ 336,711 | | $ 419,554 | | $ 355,167 | | $ 334,242 |
| (a) | Per share data based on average shares outstanding during the year. |
| (b) | Total investment return is calculated exclusive of sales charges and assumes the reinvestment of dividends and distributions. For periods of less than one year, total return is not annualized. |
| (c) | In addition to the fees and expenses which the Fund bears directly, it also indirectly bears a pro-rata share of the fees and expenses of the underlying funds in which it invests. Such indirect expenses are not included in the above expense ratios. |
| | Year Ended October 31, |
| Investor Class | 2023 | | 2022 | | 2021 | | 2020 | | 2019 |
| Net asset value at beginning of year | $ 10.74 | | $ 13.53 | | $ 12.23 | | $ 11.97 | | $ 11.69 |
| Net investment income (loss) (a) | 0.35 | | 0.22 | | 0.20 | | 0.23 | | 0.22 |
| Net realized and unrealized gain (loss) | (0.11) | | (2.01) | | 1.64 | | 0.33 | | 0.70 |
| Total from investment operations | 0.24 | | (1.79) | | 1.84 | | 0.56 | | 0.92 |
| Less distributions: | | | | | | | | | |
| From net investment income | (0.10) | | (0.42) | | (0.17) | | (0.25) | | (0.26) |
| From net realized gain on investments | (0.19) | | (0.58) | | (0.37) | | (0.05) | | (0.38) |
| Return of capital | (0.17) | | — | | — | | — | | — |
| Total distributions | (0.46) | | (1.00) | | (0.54) | | (0.30) | | (0.64) |
| Net asset value at end of year | $ 10.52 | | $ 10.74 | | $ 13.53 | | $ 12.23 | | $ 11.97 |
| Total investment return (b) | 2.22% | | (14.22)% | | 15.33% | | 4.80% | | 8.43% |
| Ratios (to average net assets)/Supplemental Data: | | | | | | | | | |
| Net investment income (loss) | 3.16% | | 1.90% | | 1.49% | | 1.93% | | 1.92% |
| Net expenses (c) | 0.55% | | 0.55% | | 0.55% | | 0.55% | | 0.55% |
| Expenses (before waiver/reimbursement) (c) | 0.67% | | 0.57% | | 0.64% | | 0.61% | | 0.59% |
| Portfolio turnover rate | 19% | | 38% | | 25% | | 70% | | 46% |
| Net assets at end of year (in 000's) | $ 31,065 | | $ 33,625 | | $ 41,154 | | $ 41,762 | | $ 44,934 |
| (a) | Per share data based on average shares outstanding during the year. |
| (b) | Total investment return is calculated exclusive of sales charges and assumes the reinvestment of dividends and distributions. For periods of less than one year, total return is not annualized. |
| (c) | In addition to the fees and expenses which the Fund bears directly, it also indirectly bears a pro-rata share of the fees and expenses of the underlying funds in which it invests. Such indirect expenses are not included in the above expense ratios. |
The notes to the financial statements are an integral part of, and should be read in conjunction with, the financial statements.
| 20 | MainStay Conservative Allocation Fund |
Financial Highlights selected per share data and ratios
| | Year Ended October 31, |
| Class B | 2023 | | 2022 | | 2021 | | 2020 | | 2019 |
| Net asset value at beginning of year | $ 10.55 | | $ 13.30 | | $ 12.07 | | $ 11.84 | | $ 11.64 |
| Net investment income (loss) (a) | 0.26 | | 0.13 | | 0.09 | | 0.15 | | 0.14 |
| Net realized and unrealized gain (loss) | (0.11) | | (1.97) | | 1.63 | | 0.31 | | 0.69 |
| Total from investment operations | 0.15 | | (1.84) | | 1.72 | | 0.46 | | 0.83 |
| Less distributions: | | | | | | | | | |
| From net investment income | (0.05) | | (0.33) | | (0.12) | | (0.18) | | (0.25) |
| From net realized gain on investments | (0.19) | | (0.58) | | (0.37) | | (0.05) | | (0.38) |
| Return of capital | (0.14) | | — | | — | | — | | — |
| Total distributions | (0.38) | | (0.91) | | (0.49) | | (0.23) | | (0.63) |
| Net asset value at end of year | $ 10.32 | | $ 10.55 | | $ 13.30 | | $ 12.07 | | $ 11.84 |
| Total investment return (b) | 1.36% | | (14.86)% | | 14.49% | | 3.99% | | 7.61% |
| Ratios (to average net assets)/Supplemental Data: | | | | | | | | | |
| Net investment income (loss) | 2.41% | | 1.13% | | 0.72% | | 1.23% | | 1.22% |
| Net expenses (c) | 1.30% | | 1.30% | | 1.30% | | 1.30% | | 1.30% |
| Expenses (before waiver/reimbursement) (c) | 1.43% | | 1.32% | | 1.39% | | 1.36% | | 1.34% |
| Portfolio turnover rate | 19% | | 38% | | 25% | | 70% | | 46% |
| Net assets at end of year (in 000’s) | $ 3,153 | | $ 5,787 | | $ 11,550 | | $ 13,236 | | $ 17,273 |
| (a) | Per share data based on average shares outstanding during the year. |
| (b) | Total investment return is calculated exclusive of sales charges and assumes the reinvestment of dividends and distributions. For periods of less than one year, total return is not annualized. |
| (c) | In addition to the fees and expenses which the Fund bears directly, it also indirectly bears a pro-rata share of the fees and expenses of the underlying funds in which it invests. Such indirect expenses are not included in the above expense ratios. |
| | Year Ended October 31, |
| Class C | 2023 | | 2022 | | 2021 | | 2020 | | 2019 |
| Net asset value at beginning of year | $ 10.54 | | $ 13.29 | | $ 12.07 | | $ 11.84 | | $ 11.64 |
| Net investment income (loss) (a) | 0.26 | | 0.13 | | 0.09 | | 0.14 | | 0.14 |
| Net realized and unrealized gain (loss) | (0.10) | | (1.97) | | 1.62 | | 0.32 | | 0.69 |
| Total from investment operations | 0.16 | | (1.84) | | 1.71 | | 0.46 | | 0.83 |
| Less distributions: | | | | | | | | | |
| From net investment income | (0.05) | | (0.33) | | (0.12) | | (0.18) | | (0.25) |
| From net realized gain on investments | (0.19) | | (0.58) | | (0.37) | | (0.05) | | (0.38) |
| Return of capital | (0.14) | | — | | — | | — | | — |
| Total distributions | (0.38) | | (0.91) | | (0.49) | | (0.23) | | (0.63) |
| Net asset value at end of year | $ 10.32 | | $ 10.54 | | $ 13.29 | | $ 12.07 | | $ 11.84 |
| Total investment return (b) | 1.45% | | (14.87)% | | 14.41% | | 3.99% | | 7.61% |
| Ratios (to average net assets)/Supplemental Data: | | | | | | | | | |
| Net investment income (loss) | 2.41% | | 1.13% | | 0.73% | | 1.21% | | 1.24% |
| Net expenses (c) | 1.30% | | 1.30% | | 1.30% | | 1.30% | | 1.30% |
| Expenses (before waiver/reimbursement) (c) | 1.43% | | 1.32% | | 1.39% | | 1.36% | | 1.34% |
| Portfolio turnover rate | 19% | | 38% | | 25% | | 70% | | 46% |
| Net assets at end of year (in 000’s) | $ 12,276 | | $ 18,099 | | $ 29,825 | | $ 36,802 | | $ 44,222 |
| (a) | Per share data based on average shares outstanding during the year. |
| (b) | Total investment return is calculated exclusive of sales charges and assumes the reinvestment of dividends and distributions. For periods of less than one year, total return is not annualized. |
| (c) | In addition to the fees and expenses which the Fund bears directly, it also indirectly bears a pro-rata share of the fees and expenses of the underlying funds in which it invests. Such indirect expenses are not included in the above expense ratios. |
The notes to the financial statements are an integral part of, and should be read in conjunction with, the financial statements.
21
Financial Highlights selected per share data and ratios
| | Year Ended October 31, |
| Class I | 2023 | | 2022 | | 2021 | | 2020 | | 2019 |
| Net asset value at beginning of year | $ 10.87 | | $ 13.68 | | $ 12.36 | | $ 12.08 | | $ 11.80 |
| Net investment income (loss) (a) | 0.40 | | 0.28 | | 0.25 | | 0.29 | | 0.28 |
| Net realized and unrealized gain (loss) | (0.11) | | (2.04) | | 1.66 | | 0.33 | | 0.69 |
| Total from investment operations | 0.29 | | (1.76) | | 1.91 | | 0.62 | | 0.97 |
| Less distributions: | | | | | | | | | |
| From net investment income | (0.14) | | (0.47) | | (0.22) | | (0.29) | | (0.31) |
| From net realized gain on investments | (0.19) | | (0.58) | | (0.37) | | (0.05) | | (0.38) |
| Return of capital | (0.18) | | — | | — | | — | | — |
| Total distributions | (0.51) | | (1.05) | | (0.59) | | (0.34) | | (0.69) |
| Net asset value at end of year | $ 10.65 | | $ 10.87 | | $ 13.68 | | $ 12.36 | | $ 12.08 |
| Total investment return (b) | 2.63% | | (13.82)% | | 15.79% | | 5.30% | | 8.91% |
| Ratios (to average net assets)/Supplemental Data: | | | | | | | | | |
| Net investment income (loss) | 3.58% | | 2.33% | | 1.91% | | 2.40% | | 2.38% |
| Net expenses (c) | 0.12% | | 0.10% | | 0.12% | | 0.12% | | 0.13% |
| Portfolio turnover rate | 19% | | 38% | | 25% | | 70% | | 46% |
| Net assets at end of year (in 000’s) | $ 7,385 | | $ 6,412 | | $ 8,909 | | $ 7,878 | | $ 9,272 |
| (a) | Per share data based on average shares outstanding during the year. |
| (b) | Total investment return is calculated exclusive of sales charges and assumes the reinvestment of dividends and distributions. Class I shares are not subject to sales charges. For periods of less than one year, total return is not annualized. |
| (c) | In addition to the fees and expenses which the Fund bears directly, it also indirectly bears a pro-rata share of the fees and expenses of the underlying funds in which it invests. Such indirect expenses are not included in the above expense ratios. |
| | Year Ended October 31, | | June 14, 2019^ through
October 31,
2019 |
| Class R2 | 2023 | | 2022 | | 2021 | | 2020 | |
| Net asset value at beginning of period | $ 10.74 | | $ 13.53 | | $ 12.23 | | $ 11.96 | | $ 11.61 |
| Net investment income (loss) (a) | 0.36 | | 0.24 | | 0.21 | | 0.24 | | 0.08 |
| Net realized and unrealized gain (loss) | (0.11) | | (2.02) | | 1.64 | | 0.34 | | 0.32 |
| Total from investment operations | 0.25 | | (1.78) | | 1.85 | | 0.58 | | 0.40 |
| Less distributions: | | | | | | | | | |
| From net investment income | (0.11) | | (0.43) | | (0.18) | | (0.26) | | (0.05) |
| From net realized gain on investments | (0.19) | | (0.58) | | (0.37) | | (0.05) | | — |
| Return of capital | (0.17) | | — | | — | | — | | — |
| Total distributions | (0.47) | | (1.01) | | (0.55) | | (0.31) | | (0.05) |
| Net asset value at end of period | $ 10.52 | | $ 10.74 | | $ 13.53 | | $ 12.23 | | $ 11.96 |
| Total investment return (b) | 2.31% | | (14.14)% | | 15.40% | | 4.93% | | 3.44% |
| Ratios (to average net assets)/Supplemental Data: | | | | | | | | | |
| Net investment income (loss) | 3.24% | | 2.01% | | 1.56% | | 2.00% | | 1.83%†† |
| Net expenses (c) | 0.47% | | 0.45% | | 0.47% | | 0.47% | | 0.49%†† |
| Portfolio turnover rate | 19% | | 38% | | 25% | | 70% | | 46% |
| Net assets at end of period (in 000’s) | $ 157 | | $ 142 | | $ 141 | | $ 109 | | $ 100 |
| ^ | Inception date. |
| †† | Annualized. |
| (a) | Per share data based on average shares outstanding during the period. |
| (b) | Total investment return is calculated exclusive of sales charges and assumes the reinvestment of dividends and distributions. Class R2 shares are not subject to sales charges. For periods of less than one year, total return is not annualized. |
| (c) | In addition to the fees and expenses which the Fund bears directly, it also indirectly bears a pro-rata share of the fees and expenses of the underlying funds in which it invests. Such indirect expenses are not included in the above expense ratios. |
The notes to the financial statements are an integral part of, and should be read in conjunction with, the financial statements.
| 22 | MainStay Conservative Allocation Fund |
Financial Highlights selected per share data and ratios
| | Year Ended October 31, |
| Class R3 | 2023 | | 2022 | | 2021 | | 2020 | | 2019 |
| Net asset value at beginning of year | $ 10.69 | | $ 13.47 | | $ 12.19 | | $ 11.94 | | $ 11.67 |
| Net investment income (loss) (a) | 0.33 | | 0.21 | | 0.17 | | 0.20 | | 0.19 |
| Net realized and unrealized gain (loss) | (0.11) | | (2.01) | | 1.64 | | 0.34 | | 0.70 |
| Total from investment operations | 0.22 | | (1.80) | | 1.81 | | 0.54 | | 0.89 |
| Less distributions: | | | | | | | | | |
| From net investment income | (0.10) | | (0.40) | | (0.16) | | (0.24) | | (0.24) |
| From net realized gain on investments | (0.19) | | (0.58) | | (0.37) | | (0.05) | | (0.38) |
| Return of capital | (0.16) | | — | | — | | — | | — |
| Total distributions | (0.45) | | (0.98) | | (0.53) | | (0.29) | | (0.62) |
| Net asset value at end of year | $ 10.46 | | $ 10.69 | | $ 13.47 | | $ 12.19 | | $ 11.94 |
| Total investment return (b) | 1.99% | | (14.34)% | | 15.12% | | 4.59% | | 8.20% |
| Ratios (to average net assets)/Supplemental Data: | | | | | | | | | |
| Net investment income (loss) | 3.01% | | 1.80% | | 1.32% | | 1.66% | | 1.68% |
| Net expenses (c) | 0.72% | | 0.70% | | 0.72% | | 0.73% | | 0.73% |
| Portfolio turnover rate | 19% | | 38% | | 25% | | 70% | | 46% |
| Net assets at end of year (in 000’s) | $ 2,577 | | $ 2,196 | | $ 1,831 | | $ 1,249 | | $ 739 |
| (a) | Per share data based on average shares outstanding during the year. |
| (b) | Total investment return is calculated exclusive of sales charges and assumes the reinvestment of dividends and distributions. Class R3 shares are not subject to sales charges. For periods of less than one year, total return is not annualized. |
| (c) | In addition to the fees and expenses which the Fund bears directly, it also indirectly bears a pro-rata share of the fees and expenses of the underlying funds in which it invests. Such indirect expenses are not included in the above expense ratios. |
| | Year Ended October 31, | | August 31, 2020^ through
October 31, |
| SIMPLE Class | 2023 | | 2022 | | 2021 | | 2020 |
| Net asset value at beginning of period | $ 10.71 | | $ 13.50 | | $ 12.23 | | $ 12.58* |
| Net investment income (loss) (a) | 0.33 | | 0.20 | | 0.17 | | 0.03 |
| Net realized and unrealized gain (loss) | (0.11) | | (2.02) | | 1.63 | | (0.38) |
| Total from investment operations | 0.22 | | (1.82) | | 1.80 | | (0.35) |
| Less distributions: | | | | | | | |
| From net investment income | (0.10) | | (0.39) | | (0.16) | | — |
| From net realized gain on investments | (0.19) | | (0.58) | | (0.37) | | — |
| Return of capital | (0.15) | | — | | — | | — |
| Total distributions | (0.44) | | (0.97) | | (0.53) | | — |
| Net asset value at end of period | $ 10.49 | | $ 10.71 | | $ 13.50 | | $ 12.23 |
| Total investment return (b) | 2.04% | | (14.45)% | | 14.98% | | (2.78)% |
| Ratios (to average net assets)/Supplemental Data: | | | | | | | |
| Net investment income (loss) | 2.97% | | 1.74% | | 1.27% | | 1.25%†† |
| Net expenses (c) | 0.72% | | 0.80% | | 0.80% | | 0.80%†† |
| Expenses (before waiver/reimbursement) (c) | 0.72% | | 0.80% | | 0.89% | | 0.88%†† |
| Portfolio turnover rate | 19% | | 38% | | 25% | | 70% |
| Net assets at end of period (in 000’s) | $ 2,117 | | $ 1,301 | | $ 304 | | $ 27 |
| ^ | Inception date. |
| * | Based on the net asset value of Investor Class as of August 31, 2020. |
| †† | Annualized. |
| (a) | Per share data based on average shares outstanding during the period. |
| (b) | Total investment return is calculated exclusive of sales charges and assumes the reinvestment of dividends and distributions. SIMPLE Class shares are not subject to sales charges. For periods of less than one year, total return is not annualized. |
| (c) | In addition to the fees and expenses which the Fund bears directly, it also indirectly bears a pro-rata share of the fees and expenses of the underlying funds in which it invests. Such indirect expenses are not included in the above expense ratios. |
The notes to the financial statements are an integral part of, and should be read in conjunction with, the financial statements.
23
MainStay Moderate Allocation Fund
Investment and Performance Comparison (Unaudited)
Performance data quoted represents past performance. Past performance is no guarantee of future results. Because of market volatility and other factors, current performance may be lower or higher than the figures shown. Investment return and principal value will fluctuate, and as a result, when shares are redeemed, they may be worth more or less than their original cost. The graph below depicts the historical performance of Class I shares of the Fund. Performance will vary from class to class based on differences in class-specific expenses and sales charges. For performance information current to the most recent month-end, please call 800-624-6782 or visit newyorklifeinvestments.com.
The performance table and graph do not reflect the deduction of taxes that a shareholder would pay on distributions or Fund share redemptions. Total returns reflect maximum applicable sales charges as indicated in the table below, if any, changes in share price, and reinvestment of dividend and capital gain distributions. The graph assumes the initial investment amount shown below and reflects the deduction of all sales charges that would have applied for the period of investment. Performance figures may reflect certain fee waivers and/or expense limitations, without which total returns may have been lower. For more information on share classes and current fee waivers and/or expense limitations (if any), please refer to the Notes to Financial Statements.
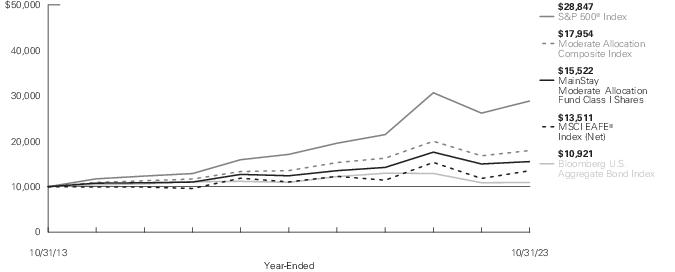
| Average Annual Total Returns for the Year-Ended October 31, 2023 |
| Class | Sales Charge | | Inception
Date | One
Year | Five
Years | Ten Years
or Since
Inception | Gross
Expense
Ratio1 |
| Class A Shares2 | Maximum 3.00% Initial Sales Charge | With sales charges | 4/4/2005 | 0.14% | 3.17% | 3.65% | 0.85% |
| | | Excluding sales charges | | 3.24 | 4.34 | 4.24 | 0.85 |
| Investor Class Shares2, 3 | Maximum 2.50% Initial Sales Charge | With sales charges | 2/28/2008 | 0.34 | 2.95 | 3.46 | 1.12 |
| | | Excluding sales charges | | 2.92 | 4.12 | 4.04 | 1.12 |
| Class B Shares4 | Maximum 5.00% CDSC | With sales charges | 4/4/2005 | -2.68 | 3.02 | 3.27 | 1.87 |
| | if Redeemed Within the First Six Years of Purchase | Excluding sales charges | | 2.21 | 3.34 | 3.27 | 1.87 |
| Class C Shares | Maximum 1.00% CDSC | With sales charges | 4/4/2005 | 1.23 | 3.36 | 3.27 | 1.87 |
| | if Redeemed Within One Year of Purchase | Excluding sales charges | | 2.21 | 3.36 | 3.27 | 1.87 |
| Class I Shares | No Sales Charge | | 4/4/2005 | 3.49 | 4.59 | 4.49 | 0.60 |
| Class R2 Shares5 | No Sales Charge | | 6/14/2019 | 3.04 | N/A | 3.73 | 0.95 |
| Class R3 Shares5 | No Sales Charge | | 2/29/2016 | 2.86 | 3.98 | 5.16 | 1.20 |
| SIMPLE Class Shares | No Sales Charge | | 8/31/2020 | 2.81 | N/A | 0.84 | 1.25 |
| 1. | The gross expense ratios presented reflect the Fund’s “Total Annual Fund Operating Expenses” from the most recent Prospectus, as supplemented, and may differ from other expense ratios disclosed in this report. |
| 2. | Prior to July 22, 2019, the maximum initial sales charge applicable was 5.50%, which is reflected in the applicable average annual total return figures shown. |
| 3. | Prior to June 30, 2020, the maximum initial sales charge was 3.00%, which is reflected in the applicable average annual total return figures shown. |
| 4. | Class B shares are closed to all new purchases as well as additional investments by existing Class B shareholders. |
| 5. | As of October 31, 2023, Class R2 and Class R3 shares are closed to new investors and, upon the close of business on December 29, 2023, Class R2 and Class R3 shares are closed to additional investments by existing shareholders. Additionally, Class R2 and Class R3 shares will be liquidated on or about February 28, 2024 (the "Liquidation Date"). It is expected that the Fund will distribute to remaining shareholders invested in Class R2 or Class R3 shares, on or promptly after the Liquidation Date, a liquidating distribution in cash or cash equivalents equal to the net asset value of such shares. |
The footnotes on the next page are an integral part of the table and graph and should be carefully read in conjunction with them.
| 24 | MainStay Moderate Allocation Fund |
| Benchmark Performance* | One
Year | Five
Years | Ten
Years |
| S&P 500® Index1 | 10.14% | 11.01% | 11.18% |
| MSCI EAFE® Index (Net)2 | 14.40 | 4.10 | 3.05 |
| Bloomberg U.S. Aggregate Bond Index3 | 0.36 | -0.06 | 0.88 |
| Moderate Allocation Composite Index4 | 6.91 | 5.81 | 6.03 |
| Morningstar Moderate Allocation Category Average5 | 4.16 | 5.08 | 5.22 |
| * | Returns for indices reflect no deductions for fees, expenses or taxes, except for foreign withholding taxes where applicable. Results assume reinvestment of all dividends and capital gains. An investment cannot be made directly in an index. |
| 1. | The S&P 500® Index is the Fund's primary benchmark. S&P 500® is a trademark of The McGraw-Hill Companies, Inc. The S&P 500® Index is widely regarded as the standard index for measuring large-cap U.S. stock market performance. |
| 2. | The MSCI EAFE® Index (Net) is the Fund's secondary benchmark. The MSCI EAFE® Index (Net) consists of international stocks representing the developed world outside
of North America. |
| 3. | The Fund has selected the Bloomberg U.S. Aggregate Bond Index as an additional benchmark. The Bloomberg U.S. Aggregate Bond Index is a broad-based benchmark that measures the performance of the investment grade, U.S. dollar-denominated, fixed-rate taxable bond market, including Treasuries, government-related and corporate securities, mortgage-backed securities (agency fixed-rate and hybrid adjustable rate mortgage pass-throughs), asset-backed securities, and commercial mortgage-backed securities. |
| 4. | The Fund has selected the Moderate Allocation Composite Index as an additional benchmark. The Moderate Allocation Composite Index consists of the S&P 500® Index, the MSCI EAFE® Index (Net) and the Bloomberg U.S. Aggregate Bond Index weighted 45%, 15% and 40%, respectively. Prior to February 28, 2014, the Moderate Allocation Composite Index consisted of the S&P 500® Index, the MSCI EAFE® Index and the Bloomberg U.S. Aggregate Bond Index weighted 50%, 10%, and 40%, respectively. |
| 5. | The Morningstar Moderate Allocation Category Average is representative of funds in allocation categories that seek to provide both income and capital appreciation by primarily investing in multiple asset classes, including stocks, bonds, and cash. These moderate strategies seek to balance preservation of capital with appreciation. They typically expect volatility similar to a strategic equity exposure between 50% and 70%. Results are based on average total returns of similar funds with all dividends and capital gain distributions reinvested. |
The footnotes on the preceding page are an integral part of the table and graph and should be carefully read in conjunction with them.
Cost in Dollars of a $1,000 Investment in MainStay Moderate Allocation Fund (Unaudited)
The example below is intended to describe the fees and expenses borne by shareholders during the six-month period from May 1, 2023 to October 31, 2023, and the impact of those costs on your investment.
Example
As a shareholder of the Fund you incur two types of costs: (1) transaction costs, including exchange fees and sales charges (loads) on purchases (as applicable), and (2) ongoing costs, including management fees, distribution and/or service (12b-1) fees and other Fund expenses (as applicable). This example is intended to help you understand your ongoing costs (in dollars) of investing in the Fund and to compare these costs with the ongoing costs of investing in other mutual funds. The example is based on an investment of $1,000 made at the beginning of the six-month period and held for the entire period from May 1, 2023 to October 31, 2023.
This example illustrates your Fund’s ongoing costs in two ways:
Actual Expenses
The second and third data columns in the table below provide information about actual account values and actual expenses. You may use the information in these columns, together with the amount you invested, to estimate the expenses that you paid during the six months ended October 31, 2023. Simply divide your account value by $1,000 (for example, an
$8,600 account value divided by $1,000 = 8.6), then multiply the result by the number under the heading entitled “Expenses Paid During Period” to estimate the expenses you paid on your account during this period.
Hypothetical Example for Comparison Purposes
The fourth and fifth data columns in the table below provide information about hypothetical account values and hypothetical expenses based on the Fund’s actual expense ratio and an assumed rate of return of 5% per year before expenses, which is not the Fund’s actual return. The hypothetical account values and expenses may not be used to estimate the actual ending account balances or expenses you paid for the six-month period shown. You may use this information to compare the ongoing costs of investing in the Fund with the ongoing costs of investing in other mutual funds. To do so, compare this 5% hypothetical example with the 5% hypothetical examples that appear in the shareholder reports of the other mutual funds.
Please note that the expenses shown in the table are meant to highlight your ongoing costs only and do not reflect any transactional costs, such as exchange fees or sales charges (loads). Therefore, the fourth and fifth data columns of the table are useful in comparing ongoing costs only and will not help you determine the relative total costs of owning different funds. In addition, if these transactional costs were included, your costs would have been higher.
| Share Class | Beginning
Account
Value
5/1/23 | Ending Account
Value (Based
on Actual
Returns and
Expenses)
10/31/23 | Expenses
Paid
During
Period1 | Ending Account
Value (Based
on Hypothetical
5% Annualized
Return and
Actual Expenses)
10/31/23 | Expenses
Paid
During
Period1 | Net Expense
Ratio
During
Period2 |
| Class A Shares | $1,000.00 | $969.70 | $1.74 | $1,023.44 | $1.79 | 0.35% |
| Investor Class Shares | $1,000.00 | $967.40 | $2.73 | $1,022.43 | $2.80 | 0.55% |
| Class B Shares | $1,000.00 | $964.50 | $6.44 | $1,018.65 | $6.61 | 1.30% |
| Class C Shares | $1,000.00 | $964.50 | $6.44 | $1,018.65 | $6.61 | 1.30% |
| Class I Shares | $1,000.00 | $970.00 | $0.50 | $1,024.70 | $0.51 | 0.10% |
| Class R2 Shares | $1,000.00 | $968.10 | $2.23 | $1,022.94 | $2.29 | 0.45% |
| Class R3 Shares | $1,000.00 | $967.20 | $3.47 | $1,021.68 | $3.57 | 0.70% |
| SIMPLE Class Shares | $1,000.00 | $967.40 | $3.37 | $1,021.78 | $3.47 | 0.68% |
| 1. | Expenses are equal to the Fund’s annualized expense ratio of each class multiplied by the average account value over the period, divided by 365 and multiplied by 184 (to reflect the six-month period). The table above represents the actual expenses incurred during the six-month period. In addition to the fees and expenses which the Fund bears directly, it also indirectly bears a pro rata share of the fees and expenses of the underlying funds in which it invests. Such indirect expenses are not included in the above-reported expense figures. |
| 2. | Expenses are equal to the Fund's annualized expense ratio to reflect the six-month period. |
| 26 | MainStay Moderate Allocation Fund |
Asset Diversification as of October 31, 2023 (Unaudited)
| Equity Funds | 55.3% |
| Fixed Income Funds | 33.4 |
| Short-Term Investment | 11.1 |
| Other Assets, Less Liabilities | 0.2 |
See Portfolio of Investments beginning on page 32 for specific holdings within these categories. The Fund’s holdings are subject to change.
Portfolio Management Discussion and Analysis (Unaudited)
Questions answered by portfolio managers Jae S. Yoon, CFA, Jonathan Swaney, Poul Kristensen, CFA, and Amit Soni, CFA, of New York Life Investment Management LLC, the Fund’s Manager.
How did MainStay Moderate Allocation Fund perform relative to its benchmarks and peer group during the 12 months ended October 31, 2023?
For the 12 months ended October 31, 2023, Class I shares of MainStay Moderate Allocation Fund returned 3.49%, underperforming the 10.14% return of the Fund’s primary benchmark, the S&P 500® Index, and the 14.40% return of the MSCI EAFE® Index (Net), which is the Fund’s secondary benchmark. Over the same period, Class I shares of the Fund outperformed the 0.36% return of the Bloomberg U.S. Aggregate Bond Index, and underperformed the 6.91% return of the Moderate Allocation Composite Index, both of which are additional benchmarks of the Fund. For the 12 months ended October 31, 2023, Class I shares of the Fund underperformed the 4.16% return of the Morningstar Moderate Allocation Category Average.1
What factors affected the Fund’s relative performance during the reporting period?
The Fund is a “fund of funds,” meaning that it seeks to achieve its investment objective by investing primarily in mutual funds and exchange-traded funds (“ETFs”) managed by New York Life Investments or its affiliates (the “Underlying Funds”). The Underlying Funds may invest in U.S. equities, international equities and fixed-income instruments, making comparisons to any single index generally less suitable than a weighted combination of indices, which is a more useful yardstick by which to measure performance. The most influential factor affecting returns for the Fund during the reporting period (versus the performance of a weighted combination of indices) is the net performance of the Underlying Funds themselves, relative to their respective benchmarks. During the reporting period, asset class policy was the primary determinant of the Fund’s relative performance.
Fund management internally maintains a blend of indices that are taken into consideration when managing the Fund. During the reporting period, the Fund substantially underperformed this internally maintained blend of indices, primarily due to active positioning at the asset class level.
Management of the Fund’s stock/bond blend itself was not the primary issue affecting the Fund’s relative performance, as returns generated in the process of controlling that mix were only marginally negative. We held the Fund’s stock/bond allocation near neutral for much of the reporting period, but with a small bias toward holding underweight exposure to equities. That posture proved a liability through the spring and early summer of
2023, as a handful of mega-cap technology-related equities drove the market higher. We gradually removed the Fund’s underweight exposure to equities near the end of the reporting period. As a result, the Fund did not benefit materially when the market softened in late summer and into the fall.
Rather, the most significant factor undermining relative performance related to positioning within asset classes, primarily equities, was the Fund’s exposure to small-cap stocks, which detracted substantially from returns. Throughout the reporting period, relative valuations in the small-cap asset class were much more attractive than has been the historical norm, but small companies are significantly more sensitive to changes in bank financing conditions than large companies that can issue bonds. Fast-rising costs on bank loans, coupled with concerns about future credit availability in the wake of the bank crisis in the early spring of 2023, weighed heavily on the smaller end of the capitalization spectrum. We promptly restored the Fund’s small-cap allocation to neutral as the nature and scope of the crisis became clear.
Relative performance also suffered from efforts to avoid undue exposure to a small group of market-leading, mega-cap, technology-related companies. Recently dubbed ‘the Magnificent 7’ (Alphabet, Amazon, Apple, Meta Platforms, Microsoft, NVIDIA, and Tesla), these firms are richly valued, implying rapid earnings growth in the coming years. We remain skeptical that such growth is likely to be achieved by these companies, which are already among the largest enterprises in the world, with dominant positions in their respective industries. Accordingly, we shifted Fund assets out of capitalization-weighted large-cap index products, favoring other options—most notably, an equally weighted version of the S&P 500® Index. During the reporting period, however, ongoing enthusiasm for the commercial potential of artificial intelligence (“AI”), and the degree to which the Magnificent 7 are expected to benefit from these developments, helped them maintain their leadership positions. During the reporting period, the Bloomberg Magnificent 7 Total Return Index2 returned approximately 65%, compared to a slightly negative return for the equally weighted S&P 500® Equal Weight Index.3
Tilts favoring defensive sectors, particularly health care, and low volatility stocks further detracted from the Fund’s relative performance. Basically, any skew in the Fund away from the sole winners of the reporting period—mega-cap tech-oriented companies—was a drag on relative results.
| 1. | See "Investment and Performance Comparison" for other share class returns, which may be higher or lower than Class I share returns, and for more information on benchmark and peer group returns. |
| 2. | The Bloomberg Magnificent 7 Total Return Index is an equal-dollar weighted equity benchmark consisting of a fixed basket of 7 widely-traded companies classified in the United States and representing the Communications, Consumer Discretionary and Technology sectors as defined by Bloomberg Industry Classification System (BICS). An investment cannot be made directly in an index. |
| 3. | The S&P 500® Equal Weight Index (“EWI”) is the equal-weight version of the widely-used S&P 500® Index. The S&P 500® EWI includes the same constituents as the capitalization weighted S&P 500® Index, but each company in the S&P 500® EWI is allocated a fixed weight, or 0.2% of the Index total at each quarterly rebalance. An investment cannot be made directly in an index. |
| 28 | MainStay Moderate Allocation Fund |
The Fund realized some positive results within equities. Tactical trading in gold miners, for example, proved helpful. The Fund also benefited from some swap positions, in which we pay the return (so are effectively “short”) on a set of highly leveraged companies that look especially vulnerable to higher borrowing costs and more restrictive lending standards. Exposure to uranium miners provided a small, but noticeable, positive contribution to returns as well. (Contributions take weightings and total returns into account.)
The fixed-income portion of the Fund also weighed on results, although to a lesser extent. Fixed income underperformance mainly resulted from the Fund’s duration4 management. The Fund held too little exposure to long-term bonds in the first half of the reporting period when yields were falling, and too much exposure late in the reporting period as yields were rising rapidly. The Fund also gave up a little ground due to underweight exposure to bank loans. We expected that defaults would rise considerably in that space as economic activity slowed, although the anticipated slowdown failed to materialize during the reporting period.
During the reporting period, how was the Fund’s performance materially affected by investments in derivatives?
Total return swaps were used to express most of the Fund’s asset class policy views. Therefore, the swaps can be seen as detracting from the Fund’s relative performance over the course of the reporting period.
How did you allocate the Fund’s assets during the reporting period and why?
Stock/bond blend: We held equity exposure within the Fund relatively close to neutral during the reporting period. We are generally reluctant to position the Fund with underweight equity exposure, since stocks tend to perform well over time and anticipating drawdowns is challenging. The opposite is less true; we are happy to lean into equities when we believe they are well-supported fundamentally or when a correction has run further than we believe appropriate. Nevertheless, we shifted the Fund’s equity position to slightly underweight following a sharp rally in January 2023, and enlarged the underweight posture a little further late in the spring when banking sector turmoil appeared to increase the likelihood of a recession. As the recession failed to materialize, we gradually removed the underweight equity exposure over the course of the summer and into the fall.
Duration: After an extended period of holding a short duration position, in the spring of 2023, we shifted the Fund to a neutral position in expectation of an impending recession. We extended
the Fund’s duration further in the summer and fall as yields rose, presumably in response to heavy new Treasury issuance, “higher for longer” monetary policy prospects, stubborn inflationary pressures, and rising yields abroad. As of the end of the reporting period, the Fund’s duration was slightly more than a half year long, reflecting our view that a combination of waning consumption, normalized supply chains and improving productivity will curb inflation in the quarters ahead, and yields will drop sharply.
Equity style: Growth stocks, by definition, exhibit richer valuations than value stocks. As a consequence, growth stock prices are relatively reliant on distant profits, and are often more sensitive to elevated inflation and higher interest rates than their value-oriented counterparts. Accordingly, given the high-rate environment that prevailed during the reporting period, we persistently tilted the Fund to emphasize value stocks that offered more substantial near-term cash flows. In particular, we focused on defensive, lower-volatility sectors, including utilities, consumer staples and—most of all—health care. This position undermined performance in 2023, as market performance was dominated by the aforementioned Magnificent 7—growth-oriented technology-related stocks swept by a wave of excitement over the prospects for generative AI.
Equity size: The Fund held overweight exposure to small-cap stocks during the first half of the reporting period. We based our thesis on several prevailing characteristics of the asset class: attractive valuations, insulation from economic weakness abroad, less sensitivity to dollar strength and disproportionate exposure to domestic demand, which thus far remains robust. That position proved unconstructive during the spring of 2023, as small companies tend to be heavily dependent on bank financing, and banks aggressively tightened lending standards in the wake of the banking crisis that occurred in March and April. Accordingly, we unwound the Fund’s small-cap bias. However, it is important to note that the proceeds did not flow to large blend index exposure, where the Magnificent 7 dominate. Rather, the redirected assets went into the S&P 500® Equal Weight Index, where those seven names comprise less than 2% of that Index.
Geographic exposure: During the latter part of the reporting period, European equities appeared vulnerable. We expected that persistently high wage growth would compel the European Central Bank to maintain its restrictive monetary policies for an extended period of time while European export-heavy economies wrestled with declining global trade volumes. In addition, Europe appeared particularly exposed to potential energy price spikes amid elevated geopolitical tensions. On the other hand, the Bank of Japan remained engaged in accommodative policy, Japanese exports benefited from a weak yen, and Japanese companies increasingly
| 4. | Duration is a measure of the price sensitivity of a fixed-income investment to changes in interest rates. Duration is expressed as a number of years and is considered a more accurate sensitivity gauge than average maturity. |
prioritized shareholder governance, largely in the form of share buybacks. Given these divergent conditions, we tilted the Fund away from European markets in favor of Japanese stocks, while holding net exposure to non-US stocks close to neutral.
Energy: The Fund maintained exposure to upstream energy producers and oilfield/gas field service providers as a commodity play to provide an additional inflation hedge. These holdings also positioned the Fund to take advantage of opportunities for domestic producers to benefit as Western nations revisit energy policy to source supplies from stable and friendly jurisdictions rather than autocratic petrostates that present national security risks. The Fund’s small, but volatile, energy position detracted significantly from performance during the first half of the reporting period but fully recovered in the second half.
How did the Fund’s allocations change over the course of the reporting period?
In one of the more substantial changes in allocations undertaken during the reporting period, we reduced the Fund’s exposure to small-cap stocks, expressed via total return swaps. We took this action in response to the banking crisis that unfolded in the spring of 2023. Other changes included a reduction in the Fund’s holdings of MainStay Floating Rate Fund, thereby decreasing exposure to lower-credit-quality fixed-income instruments ahead of an expected recession. We unwound the Fund’s swap exposure to VanEck Gold Miners ETF, taking profits and exiting a profitable trade on a high note. Lastly, we used swaps to tilt the Fund away from baskets of specific stocks that were either heavily dependent on floating-rate loans (such as Uber, United Airlines and Carnival) or that generated insufficient operating income to retire debt as it came due (so-called ‘zombie’ companies, such as Royal Caribbean, Wynn Resorts and Rivian Automotive). We believed these firms were especially vulnerable in an environment of fast-rising interest rates and tightening lending standards.
New or increased allocations included, first and foremost, exposure to iShares 20+ Year Treasury Bond ETF, which we used to extend the Fund’s duration as bond yields rose. Another consequential change involved the establishment and growth of an allocation to Invesco S&P 500® Equal Weight ETF, funded in part from cash. We adopted this position to remove the Fund’s underweight exposure to equities without significantly increasing its exposure to the Magnificent 7 mega-cap technology-related names. We also initiated a new Fund position in iShares MSCI Japan ETF (via a swap), as we saw valuations as attractive, export conditions as favorable and the Japanese yen likely to appreciate should the Bank of Japan abandon its existing yield curve5 control policy. Another notable addition involved the establishment of
exposure to Global X Uranium ETF, which invests primarily in uranium mining firms. Climate change concerns, net-zero commitments and the limitations of renewable energy are driving a reconsideration of nuclear energy, for which fuel supply is rather limited. We foresee a supply/demand imbalance developing that is likely to support businesses involved with extracting and processing uranium.
At the Underlying Fund level, we took advantage of a few new investment options, adopting a position in IQ MacKay ESG High Income ETF, with proceeds from MainStay MacKay High Yield Corporate Bond Fund. Other holdings in newly available Underlying Equity Funds included MainStay PineStone U.S. Equity Fund, IQ Candriam U.S. Mid Cap Equity ETF and MainStay Fiera SMID Growth Fund.
During the reporting period, which Underlying Equity Funds had the highest total returns and which had the lowest total returns?
The Fund’s top-performing Underlying Equity Funds that were held for the entire reporting period included MainStay Winslow Large Cap Growth Fund (and its sister product, IQ Winslow Large Cap Growth ETF), IQ 500 International ETF and MainStay Epoch Capital Growth Fund. The worst-performing positions included MainStay WMC Small Companies Fund, IQ U.S. Small Cap ETF and swap exposure to the S&P Small Cap 600® Index.6
Which Underlying Equity Funds were the strongest positive contributors to the Fund’s performance and which Underlying Equity Funds were particularly weak?
The strongest positive contributions to performance came from MainStay Winslow Large Cap Growth Fund, MainStay WMC Growth Fund and IQ Candriam U.S. Large Cap Equity ETF. The direct fund holdings detracting most significantly from returns included IQ Candriam U.S. Mid Cap Equity ETF, MainStay WMC Small Companies Fund and MainStay Fiera SMID Growth Fund. Losses were greater in some swap positions in which we paid the return to iShares MSCI EAFE Index, the Russell 1000® Growth Index and the S&P 500® Equal Weight Index.
During the reporting period, which Underlying Fixed-Income Funds had the highest total returns and which Underlying Fixed-Income Funds had the lowest total returns?
The Fund held only six fixed-income positions for the entire reporting period, all of which generated positive returns. The three best performers included MainStay Floating Rate Fund, MainStay MacKay Short Duration High Yield Fund and MainStay MacKay
| 5. | The yield curve is a line that plots the yields of various securities of similar quality—typically U.S. Treasury issues—across a range of maturities. The U.S. Treasury yield curve serves as a benchmark for other debt and is used in economic forecasting. |
| 6. | The S&P Small Cap 600™ Index covers roughly the small-cap range of American stocks, using a capitalization-weighted index. Capitalization range is from $850 million to $3.7 billion. An investment cannot be made directly in an index. |
| 30 | MainStay Moderate Allocation Fund |
High Yield Corporate Bond Fund. The lowest total returns came from IQ MacKay ESG Core Plus Bond ETF, MainStay MacKay Total Return Bond Fund and cash holdings.
Which Underlying Fixed-Income Funds were the strongest positive contributors to the Fund’s performance and which Underlying Fixed-Income Funds were particularly weak?
The largest contributors to the Fund’s absolute returns came from cash holdings and positions in MainStay Floating Rate Fund and MainStay MacKay Total Return Bond Fund. The only fixed-income position that detracted from performance was swap exposure to iShares 20+ Year Treasury Bond ETF. The smallest positive contributions to Fund performance came from IQ MacKay ESG High Income ETF and MainStay Short Term Bond Fund.
How was the Fund positioned at the end of the reporting period?
For some time now, we have held the view that a recession in response to dramatic monetary policy tightening and the expiration of pandemic-era support programs is all but inevitable. This remains the case today, and indications of the onset of said recession are beginning to accumulate. We firmly expect corporate profits to decline over the next several quarters, eventually taking stock prices down with them, while also driving down Treasury yields and pushing credit spreads7 out. Accordingly, as of October 31, 2023, the Fund maintains a relatively defensive posture.
Given the difficulty in predicting a market top, we are resistant to holding an underweight position in equities. As such, we are maintaining a neutral position for the Fund at this time, although we intend to exploit any significant pullbacks - should they arise - by building an oversight position.
The Fund’s defensive positioning is more evident within asset classes. Most notably, we have extended the Fund’s duration considerably through purchases of a long-dated Treasury bond ETF, with the expectation that it will benefit from the trend of investors to shift out of risky assets as economic and market conditions deteriorate. Additionally, we are maintaining exposure to bank loans at a below-benchmark weight, and skewing holdings of high yield bonds to favor shorter maturity instruments, which tend to exhibit less volatility and smaller losses than do longer-maturity bonds.
On the equity side, the Fund favors sectors that have generally exhibited lower volatility and retained their value better during
drawdowns. Prominent among these are utilities and health care. We have also skewed the Fund away from a set of highly leveraged companies deemed to be especially vulnerable to a tightening credit environment.
| 7. | The terms “spread” and “yield spread” may refer to the difference in yield between a security or type of security and comparable U.S. Treasury issues. The terms may also refer to the difference in yield between two specific securities or types of securities at a given time. The term “credit spread” typically refers to the difference in yield between corporate or municipal bonds (or a specific category of these bonds) comparable to U.S. Treasury issues. |
The opinions expressed are those of the portfolio managers as of the date of this report and are subject to change. There is no guarantee that any forecasts will come to pass. This material does not constitute investment advice and is not intended as an endorsement of any specific investment.
Portfolio of Investments October 31, 2023†^
| | Shares | Value |
| Affiliated Investment Companies 88.7% |
| Equity Funds 55.3% |
| IQ 500 International ETF (a) | 597,263 | $ 17,696,365 |
| IQ Candriam International Equity ETF (a) | 699,722 | 17,443,090 |
| IQ Candriam U.S. Large Cap Equity ETF (a) | 915,285 | 33,554,531 |
| IQ Candriam U.S. Mid Cap Equity ETF (a) | 687,032 | 17,169,067 |
| IQ FTSE International Equity Currency Neutral ETF | 632,543 | 14,257,519 |
| IQ U.S. Large Cap ETF (a) | 856,735 | 27,017,224 |
| IQ U.S. Small Cap ETF (a) | 301,913 | 8,903,354 |
| IQ Winslow Large Cap Growth ETF (a) | 127,854 | 3,917,779 |
| MainStay Candriam Emerging Markets Equity Fund Class R6 (a) | 2,078,548 | 17,503,244 |
| MainStay Epoch Capital Growth Fund Class I | 205,506 | 2,474,335 |
| MainStay Epoch International Choice Fund Class I (a) | 358,892 | 12,628,101 |
| MainStay Epoch U.S. Equity Yield Fund Class R6 (a) | 1,496,592 | 27,672,434 |
| MainStay Fiera SMID Growth Fund Class R6 (a) | 1,197,732 | 16,918,929 |
| MainStay PineStone International Equity Fund Class R6 (a) | 935,839 | 12,716,650 |
| MainStay PineStone U.S. Equity Fund Class R6 (a) | 909,698 | 14,165,630 |
| MainStay S&P 500 Index Fund Class I | 223,941 | 11,074,380 |
| MainStay Winslow Large Cap Growth Fund Class R6 | 3,386,605 | 33,864,016 |
| MainStay WMC Enduring Capital Fund Class R6 (a) | 819,493 | 24,666,816 |
| MainStay WMC Growth Fund Class R6 (a) | 965,745 | 34,826,200 |
| MainStay WMC International Research Equity Fund Class I (a) | 1,932,015 | 12,697,781 |
| MainStay WMC Small Companies Fund Class I (a) | 553,489 | 10,381,519 |
| MainStay WMC Value Fund Class R6 (a) | 876,011 | 24,548,978 |
Total Equity Funds
(Cost $354,161,902) | | 396,097,942 |
| Fixed Income Funds 33.4% |
| IQ MacKay ESG Core Plus Bond ETF (a) | 4,251,901 | 83,244,568 |
| IQ Mackay ESG High Income ETF (a) | 334,516 | 8,374,608 |
| MainStay Floating Rate Fund Class R6 (a) | 2,498,669 | 21,876,347 |
| MainStay MacKay High Yield Corporate Bond Fund Class R6 | 1,716,751 | 8,400,579 |
| MainStay MacKay Short Duration High Yield Fund Class I | 2,150,194 | 19,738,349 |
| | Shares | | Value |
| |
| Fixed Income Funds (continued) |
| MainStay MacKay Total Return Bond Fund Class R6 (a) | 9,988,379 | | $ 83,367,006 |
| MainStay Short Term Bond Fund Class I (a) | 1,627,720 | | 14,574,279 |
Total Fixed Income Funds
(Cost $269,356,324) | | | 239,575,736 |
Total Affiliated Investment Companies
(Cost $623,518,226) | | | 635,673,678 |
| Short-Term Investment 11.1% |
| Affiliated Investment Company 11.1% |
| MainStay U.S. Government Liquidity Fund, 5.275% (a)(b) | 79,196,903 | | 79,196,903 |
Total Short-Term Investment
(Cost $79,196,903) | 11.1% | | 79,196,903 |
Total Investments
(Cost $702,715,129) | 99.8% | | 714,870,581 |
| Other Assets, Less Liabilities | 0.2 | | 1,341,891 |
| Net Assets | 100.0% | | $ 716,212,472 |
| † | Percentages indicated are based on Fund net assets. |
| ^ | Industry classifications may be different than those used for compliance monitoring purposes. |
| (a) | As of October 31, 2023, the Fund's ownership exceeds 5% of the outstanding shares of the Underlying Fund's share class. |
| (b) | Current yield as of October 31, 2023. |
The notes to the financial statements are an integral part of, and should be read in conjunction with, the financial statements.
| 32 | MainStay Moderate Allocation Fund |
Investments in Affiliates (in 000's)
Investments in issuers considered to be affiliate(s) of the Fund during the year ended October 31, 2023 for purposes of Section 2(a)(3) of the Investment Company Act of 1940, as amended, were as follows:
| Affiliated Investment Companies | Value,
Beginning
of Year | Purchases
at Cost | Proceeds
from
Sales | Net
Realized
Gain/(Loss)
on Sales | Change in
Unrealized
Appreciation/
(Depreciation) | Value,
End of
Year | Dividend
Income | Other
Distributions | Shares
End of
Year |
| IQ 500 International ETF | $ 18,459 | $ 778 | $ (4,137) | $ 130 | $ 2,466 | $ 17,696 | $ 693 | $ — | 597 |
| IQ Candriam International Equity ETF | 18,290 | 758 | (3,719) | (135) | 2,249 | 17,443 | 563 | — | 700 |
| IQ Candriam U.S. Large Cap Equity ETF | 40,833 | 1,079 | (13,520) | 1,743 | 3,420 | 33,555 | 565 | — | 915 |
| IQ Candriam U.S. Mid Cap Equity ETF | — | 19,469 | (178) | (11) | (2,111) | 17,169 | 64 | — | 687 |
| IQ FTSE International Equity Currency Neutral ETF | 14,831 | 270 | (2,414) | 208 | 1,363 | 14,258 | 335 | 276 | 633 |
| IQ MacKay ESG Core Plus Bond ETF | 81,518 | 11,987 | (7,347) | (1,090) | (1,823) | 83,245 | 3,918 | — | 4,252 |
| IQ Mackay ESG High Income ETF | — | 8,823 | (206) | (3) | (239) | 8,375 | 247 | — | 335 |
| IQ U.S. Large Cap ETF | 33,636 | 166 | (7,448) | 1,163 | (500) | 27,017 | 537 | — | 857 |
| IQ U.S. Small Cap ETF | 19,364 | 3,731 | (13,290) | 1,602 | (2,504) | 8,903 | 248 | — | 302 |
| IQ Winslow Large Cap Growth ETF | 2,048 | 1,236 | — | — | 634 | 3,918 | 1 | — | 128 |
| MainStay Candriam Emerging Markets Equity Fund Class R6 | 17,194 | 1,136 | (1,167) | (508) | 848 | 17,503 | 208 | — | 2,079 |
| MainStay Epoch Capital Growth Fund Class I | 2,620 | 38 | (571) | (74) | 461 | 2,474 | 12 | 27 | 206 |
| MainStay Epoch International Choice Fund Class I | 13,434 | 625 | (3,151) | 405 | 1,315 | 12,628 | 178 | — | 359 |
| MainStay Epoch U.S. Equity Yield Fund Class R6 | 34,910 | 2,145 | (8,816) | (104) | (463) | 27,672 | 794 | 513 | 1,497 |
| MainStay Fiera SMID Growth Fund Class R6 | — | 18,500 | — | — | (1,581) | 16,919 | — | — | 1,198 |
| MainStay Floating Rate Fund Class R6 | 36,092 | 4,420 | (19,423) | (946) | 1,733 | 21,876 | 2,443 | — | 2,499 |
| MainStay MacKay High Yield Corporate Bond Fund Class R6 | 16,707 | 1,705 | (10,330) | (666) | 985 | 8,401 | 722 | — | 1,717 |
| MainStay MacKay International Equity Fund Class R6 | 12,908 | 872 | (14,197) | (2,561) | 2,978 | — | 123 | — | — |
| MainStay MacKay Short Duration High Yield Fund Class I | 19,637 | 2,564 | (2,674) | (132) | 343 | 19,738 | 1,166 | — | 2,150 |
| MainStay MacKay Total Return Bond Fund Class R6 | 81,542 | 12,891 | (8,980) | (1,768) | (318) | 83,367 | 3,794 | — | 9,988 |
| MainStay PineStone International Equity Fund Class R6 (a) | — | 13,597 | — | — | (880) | 12,717 | — | — | 936 |
| MainStay PineStone U.S. Equity Fund Class R6 | — | 14,834 | — | — | (668) | 14,166 | — | — | 910 |
| MainStay S&P 500 Index Fund Class I | 11,189 | 1,219 | (1,403) | 68 | 1 | 11,074 | 157 | 890 | 224 |
| MainStay Short Term Bond Fund Class I | — | 15,738 | (881) | (13) | (270) | 14,574 | 375 | — | 1,628 |
| MainStay U.S. Government Liquidity Fund | 78,208 | 97,640 | (96,651) | — | — | 79,197 | 3,599 | — | 79,197 |
| MainStay Winslow Large Cap Growth Fund Class R6 | 37,582 | 4,332 | (11,112) | (1,353) | 4,415 | 33,864 | 88 | 4,202 | 3,387 |
| MainStay WMC Enduring Capital Fund Class R6 | 31,970 | 2,385 | (9,973) | (518) | 803 | 24,667 | 188 | 1,158 | 819 |
| MainStay WMC Growth Fund Class R6 | 39,737 | 2,045 | (13,563) | (5,443) | 12,050 | 34,826 | — | — | 966 |
| MainStay WMC International Research Equity Fund Class I | 13,180 | 651 | (2,563) | (214) | 1,644 | 12,698 | 278 | — | 1,932 |
| MainStay WMC Small Companies Fund Class I | 20,587 | 4,967 | (12,924) | (234) | (2,014) | 10,382 | 450 | — | 553 |
| MainStay WMC Value Fund Class R6 | 33,414 | 2,407 | (9,319) | (173) | (1,780) | 24,549 | 551 | 1,247 | 876 |
| | $ 729,890 | $253,008 | $(279,957) | $(10,627) | $ 22,557 | $ 714,871 | $22,297 | $8,313 | |
| | |
| (a) | As of September 8, 2023, the Fund exchanged in a nontaxable transfer of all shares of the MainStay MacKay International Equity Fund Class R6 into the newly launched MainStay PineStone International Equity Fund Class R6. |
The notes to the financial statements are an integral part of, and should be read in conjunction with, the financial statements.
33
Portfolio of Investments October 31, 2023†^ (continued)
Swap Contracts
Open OTC total return equity swap contracts as of October 31, 2023 were as follows1:
Swap
Counterparty | Reference Obligation | Floating Rate2 | Termination
Date(s) | Payment
Frequency
Paid/
Received | Notional
Amount
Long/
(Short)
(000)3 | Unrealized
Appreciation/
(Depreciation)4 |
| Citibank NA | Citi Leveraged Loan Basket | 1 day FEDF minus 0.20% | 12/4/23 | Daily | (7,386) | $ — |
| Citibank NA | Citi Zombie Company Basket | 1 day FEDF minus 0.50% | 12/4/23 | Daily | (6,736) | — |
| JPMorgan Chase Bank NA | Global X Uranium ETF | 1 day FEDF plus 0.50% | 10/8/24- 10/15/24 | Daily | 7,733 | — |
| Citibank NA | Invesco S&P 500 Low Volatility ETF | 1 day FEDF plus 0.45% | 12/4/23 | Daily | 6,985 | — |
| Citibank NA | iShares 20+ Year Treasury Bond ETF | 1 day FEDF plus 0.38% | 12/4/23 | Daily | 39,381 | — |
| Citibank NA | iShares MSCI EAFE ETF | 1 day FEDF minus 1.25% | 12/4/23 | Daily | (17,796) | — |
| Citibank NA | iShares MSCI Emerging Markets ETF | 1 day FEDF minus 0.54% | 12/4/23 | Daily | (3,577) | — |
| JPMorgan Chase Bank NA | iShares MSCI Japan ETF | 1 day FEDF plus 0.15% | 4/24/24- 5/7/24 | Daily | 21,536 | — |
| JPMorgan Chase Bank NA | Materials Select Sector SPDR Fund | 1 day FEDF plus 0.18% | 2/5/24 | Daily | 7,092 | — |
| Citibank NA | Russell 1000 Growth Total Return Index | 1 day FEDF minus 0.20% | 12/4/23 | Daily | (10,542) | — |
| JPMorgan Chase Bank NA | Russell 2000 Total Return Index | 1 day FEDF minus 0.15% - plus 0.02% | 4/9/24- 5/7/24 | Daily | (31,552) | — |
| JPMorgan Chase Bank NA | S&P 500 Equal Weight | 1 day FEDF plus 0.30% - 0.51% | 5/7/24 | Daily | 31,370 | — |
| Citibank NA | S&P 500 Health Care Sector | 1 day FEDF plus 0.45% | 12/4/23 | Daily | 7,140 | — |
| Citibank NA | S&P 500 Total Return Index | 1 day FEDF plus 0.05% | 12/4/23 | Daily | (19,453) | — |
| Citibank NA | S&P 500 Utilities Total Return | 1 day FEDF plus 0.50% | 12/4/23 | Daily | 7,437 | — |
| Citibank NA | S&P 600 Total Return | 1 day FEDF plus 0.41% | 12/4/23 | Daily | 34,606 | — |
| Citibank NA | S&P Midcap 400 Total Return Index | 1 day FEDF plus 0.31% | 12/4/23 | Daily | 19,754 | — |
| Citibank NA | Vanguard FTSE Europe ETF | 1 day FEDF minus 5.00% | 12/4/23 | Daily | (7,144) | — |
| | | | | | | $ — |
The following table represents the basket holdings underlying the total return swap with Citi Leveraged Loan Basket as of October 31, 2023.
| Security Description | Shares | Notional Value | Unrealized Appreciation/
Depreciation | Percent of
Basket Net Assets |
| AerCap Holdings NV | (3,594) | (347,574) | — | 4.71 |
| Apollo Commercial Real Estate Finance, Inc. | (675) | (65,269) | — | 0.88 |
| Atlantica Sustainable Infrastructure plc | (425) | (41,066) | — | 0.56 |
| Brandywine Realty Trust | (610) | (59,001) | — | 0.80 |
| Carnival Corp. | (9,016) | (871,819) | — | 11.80 |
| Chart Industries, Inc. | (3,465) | (335,112) | — | 4.54 |
| Coherent Corp. | (1,442) | (139,399) | — | 1.89 |
| CommScope Holding Co, Inc. | (134) | (12,918) | — | 0.17 |
| Crane NXT Co | (2,664) | (257,596) | — | 3.49 |
| Cushman & Wakefield plc | (677) | (65,484) | — | 0.89 |
| Delta Air Lines, Inc. | (7,173) | (693,626) | — | 9.39 |
| Designer Brands, Inc. | (749) | (72,463) | — | 0.98 |
| DigitalBridge Group, Inc. | (1,181) | (114,170) | — | 1.55 |
| Elanco Animal Health, Inc. | (2,950) | (285,311) | — | 3.86 |
| Entegris, Inc. | (4,689) | (453,404) | — | 6.14 |
| Fidelity National Information Services, Inc. | (7,059) | (682,622) | — | 9.24 |
| Hanesbrands, Inc. | (1,912) | (184,927) | — | 2.50 |
| JetBlue Airways Corp. | (1,009) | (97,540) | — | 1.32 |
| Lumen Technologies, Inc. | (2,077) | (200,816) | — | 2.72 |
| MKS Instruments, Inc. | (1,383) | (133,724) | — | 1.81 |
| Oatly Group AB | (84) | (8,093) | — | 0.11 |
| Opendoor Technologies, Inc. | (1,436) | (138,893) | — | 1.88 |
| Par Pacific Holdings, Inc. | (1,098) | (106,188) | — | 1.44 |
| PureCycle Technologies, Inc. | (435) | (42,044) | — | 0.57 |
| Scorpio Tankers, Inc. | (2,492) | (240,949) | — | 3.26 |
| Topgolf Callaway Brands Corp. | (727) | (70,319) | — | 0.95 |
| Uber Technologies, Inc. | (10,985) | (1,062,241) | — | 14.38 |
The notes to the financial statements are an integral part of, and should be read in conjunction with, the financial statements.
| 34 | MainStay Moderate Allocation Fund |
| Security Description | Shares | Notional Value | Unrealized Appreciation/
Depreciation | Percent of
Basket Net Assets |
| United Airlines Holdings, Inc. | (6,239) | (603,347) | — | 8.17 |
| 1. | As of October 31, 2023, cash in the amount $3,450,000 was pledged to brokers for OTC swap contracts. |
| 2. | Fund pays the floating rate and receives the total return of the reference entity. |
| 3. | Notional amounts reflected as a positive value indicate a long position held by the Fund or Index and a negative value indicates a short position. |
| 4. | Reflects the value at reset date as of October 31, 2023. |
| Abbreviation(s): |
| EAFE—Europe, Australasia and Far East |
| ETF—Exchange-Traded Fund |
| FEDF—Federal Funds Rate |
| FTSE—Financial Times Stock Exchange |
| MSCI—Morgan Stanley Capital International |
| SPDR—Standard & Poor’s Depositary Receipt |
The following is a summary of the fair valuations according to the inputs used as of October 31, 2023, for valuing the Fund’s assets:
| Description | Quoted
Prices in
Active
Markets for
Identical
Assets
(Level 1) | | Significant
Other
Observable
Inputs
(Level 2) | | Significant
Unobservable
Inputs
(Level 3) | | Total |
| Asset Valuation Inputs | | | | | | | |
| Investments in Securities (a) | | | | | | | |
| Affiliated Investment Companies | | | | | | | |
| Equity Funds | $ 396,097,942 | | $ — | | $ — | | $ 396,097,942 |
| Fixed Income Funds | 239,575,736 | | — | | — | | 239,575,736 |
| Total Affiliated Investment Companies | 635,673,678 | | — | | — | | 635,673,678 |
| Short-Term Investment | | | | | | | |
| Affiliated Investment Company | 79,196,903 | | — | | — | | 79,196,903 |
| Total Investments in Securities | $ 714,870,581 | | $ — | | $ — | | $ 714,870,581 |
| (a) | For a complete listing of investments, see the Portfolio of Investments. |
The notes to the financial statements are an integral part of, and should be read in conjunction with, the financial statements.
35
Statement of Assets and Liabilities as of October 31, 2023
| Assets |
Investment in affiliated investment companies, at value
(identified cost $702,715,129) | $714,870,581 |
| Cash | 174,361 |
| Cash collateral on deposit at broker for swap contracts | 3,450,000 |
| Receivables: | |
| Dividends and interest | 340,711 |
| Fund shares sold | 328,024 |
| Other assets | 47,518 |
| Total assets | 719,211,195 |
| Liabilities |
| Payables: | |
| Dividends and interest on OTC swaps contracts | 2,025,462 |
| Fund shares redeemed | 573,384 |
| NYLIFE Distributors (See Note 3) | 169,140 |
| Transfer agent (See Note 3) | 153,651 |
| Shareholder communication | 39,717 |
| Professional fees | 16,219 |
| Custodian | 15,798 |
| Manager (See Note 3) | 4,482 |
| Accrued expenses | 870 |
| Total liabilities | 2,998,723 |
| Net assets | $716,212,472 |
| Composition of Net Assets |
| Shares of beneficial interest outstanding (par value of $.001 per share) unlimited number of shares authorized | $ 60,422 |
| Additional paid-in-capital | 715,777,612 |
| | 715,838,034 |
| Total distributable earnings (loss) | 374,438 |
| Net assets | $716,212,472 |
| Class A | |
| Net assets applicable to outstanding shares | $599,018,876 |
| Shares of beneficial interest outstanding | 50,525,626 |
| Net asset value per share outstanding | $ 11.86 |
| Maximum sales charge (3.00% of offering price) | 0.37 |
| Maximum offering price per share outstanding | $ 12.23 |
| Investor Class | |
| Net assets applicable to outstanding shares | $ 78,971,777 |
| Shares of beneficial interest outstanding | 6,650,326 |
| Net asset value per share outstanding | $ 11.87 |
| Maximum sales charge (2.50% of offering price) | 0.30 |
| Maximum offering price per share outstanding | $ 12.17 |
| Class B | |
| Net assets applicable to outstanding shares | $ 7,875,392 |
| Shares of beneficial interest outstanding | 674,132 |
| Net asset value and offering price per share outstanding | $ 11.68 |
| Class C | |
| Net assets applicable to outstanding shares | $ 14,104,503 |
| Shares of beneficial interest outstanding | 1,207,863 |
| Net asset value and offering price per share outstanding | $ 11.68 |
| Class I | |
| Net assets applicable to outstanding shares | $ 7,595,374 |
| Shares of beneficial interest outstanding | 634,491 |
| Net asset value and offering price per share outstanding | $ 11.97 |
| Class R2 | |
| Net assets applicable to outstanding shares | $ 160,010 |
| Shares of beneficial interest outstanding | 13,509 |
| Net asset value and offering price per share outstanding | $ 11.84 |
| Class R3 | |
| Net assets applicable to outstanding shares | $ 1,752,328 |
| Shares of beneficial interest outstanding | 148,400 |
| Net asset value and offering price per share outstanding | $ 11.81 |
| SIMPLE Class | |
| Net assets applicable to outstanding shares | $ 6,734,212 |
| Shares of beneficial interest outstanding | 567,827 |
| Net asset value and offering price per share outstanding | $ 11.86 |
The notes to the financial statements are an integral part of, and should be read in conjunction with, the financial statements.
| 36 | MainStay Moderate Allocation Fund |
Statement of Operations for the year ended October 31, 2023
| Investment Income (Loss) |
| Income | |
| Dividend distributions from affiliated investment companies | $ 22,297,192 |
| Expenses | |
| Distribution/Service—Class A (See Note 3) | 1,570,457 |
| Distribution/Service—Investor Class (See Note 3) | 212,953 |
| Distribution/Service—Class B (See Note 3) | 117,449 |
| Distribution/Service—Class C (See Note 3) | 174,885 |
| Distribution/Service—Class R2 (See Note 3) | 409 |
| Distribution/Service—Class R3 (See Note 3) | 8,852 |
| Distribution/Service—SIMPLE Class (See Note 3) | 25,500 |
| Transfer agent (See Note 3) | 832,538 |
| Registration | 115,087 |
| Professional fees | 96,248 |
| Custodian | 48,400 |
| Trustees | 19,464 |
| Shareholder service (See Note 3) | 1,934 |
| Shareholder communication | 1,548 |
| Miscellaneous | 20,672 |
| Total expenses before waiver/reimbursement | 3,246,396 |
| Expense waiver/reimbursement from Manager (See Note 3) | (158,001) |
| Reimbursement from prior custodian(a) | (1,503) |
| Net expenses | 3,086,892 |
| Net investment income (loss) | 19,210,300 |
| Realized and Unrealized Gain (Loss) |
| Net realized gain (loss) on: | |
| Affiliated investment company transactions | (10,626,781) |
| Realized capital gain distributions from affiliated investment companies | 8,313,419 |
| Swap transactions | (15,171,783) |
| Net realized gain (loss) | (17,485,145) |
Net change in unrealized appreciation (depreciation) on:
Affiliated investments companies | 22,557,022 |
| Net realized and unrealized gain (loss) | 5,071,877 |
| Net increase (decrease) in net assets resulting from operations | $ 24,282,177 |
| (a) | Represents a refund for overbilling of custody fees. |
The notes to the financial statements are an integral part of, and should be read in conjunction with, the financial statements.
37
Statements of Changes in Net Assets
for the years ended October 31, 2023 and October 31, 2022
| | 2023 | 2022 |
| Increase (Decrease) in Net Assets |
| Operations: | | |
| Net investment income (loss) | $ 19,210,300 | $ 12,867,285 |
| Net realized gain (loss) | (17,485,145) | 34,686,243 |
| Net change in unrealized appreciation (depreciation) | 22,557,022 | (181,325,599) |
| Net increase (decrease) in net assets resulting from operations | 24,282,177 | (133,772,071) |
| Distributions to shareholders: | | |
| Class A | (33,143,840) | (64,034,427) |
| Investor Class | (4,344,071) | (8,433,971) |
| Class B | (609,120) | (1,976,049) |
| Class C | (828,328) | (2,293,600) |
| Class I | (476,779) | (1,040,013) |
| Class R2 | (8,356) | (15,531) |
| Class R3 | (80,138) | (139,179) |
| SIMPLE Class | (179,559) | (100,741) |
| Total distributions to shareholders | (39,670,191) | (78,033,511) |
| Capital share transactions: | | |
| Net proceeds from sales of shares | 56,971,120 | 79,637,492 |
| Net asset value of shares issued to shareholders in reinvestment of distributions | 39,401,094 | 77,450,338 |
| Cost of shares redeemed | (102,134,619) | (101,599,989) |
| Increase (decrease) in net assets derived from capital share transactions | (5,762,405) | 55,487,841 |
| Net increase (decrease) in net assets | (21,150,419) | (156,317,741) |
| Net Assets |
| Beginning of year | 737,362,891 | 893,680,632 |
| End of year | $ 716,212,472 | $ 737,362,891 |
The notes to the financial statements are an integral part of, and should be read in conjunction with, the financial statements.
| 38 | MainStay Moderate Allocation Fund |
Financial Highlights selected per share data and ratios
| | Year Ended October 31, |
| Class A | 2023 | | 2022 | | 2021 | | 2020 | | 2019 |
| Net asset value at beginning of year | $ 12.14 | | $ 15.64 | | $ 13.41 | | $ 13.28 | | $ 13.14 |
| Net investment income (loss) (a) | 0.32 | | 0.22 | | 0.20 | | 0.24 | | 0.23 |
| Net realized and unrealized gain (loss) | 0.07 | | (2.35) | | 2.83 | | 0.41 | | 0.81 |
| Total from investment operations | 0.39 | | (2.13) | | 3.03 | | 0.65 | | 1.04 |
| Less distributions: | | | | | | | | | |
| From net investment income | (0.13) | | (0.53) | | (0.23) | | (0.26) | | (0.27) |
| From net realized gain on investments | (0.54) | | (0.84) | | (0.57) | | (0.26) | | (0.63) |
| Total distributions | (0.67) | | (1.37) | | (0.80) | | (0.52) | | (0.90) |
| Net asset value at end of year | $ 11.86 | | $ 12.14 | | $ 15.64 | | $ 13.41 | | $ 13.28 |
| Total investment return (b) | 3.24% | | (14.97)% | | 23.28% | | 4.96% | | 8.88% |
| Ratios (to average net assets)/Supplemental Data: | | | | | | | | | |
| Net investment income (loss) | 2.59% | | 1.65% | | 1.32% | | 1.87% | | 1.82% |
| Net expenses (c) | 0.35% | | 0.34% | | 0.35% | | 0.36% | | 0.36% |
| Portfolio turnover rate | 23% | | 32% | | 29% | | 59% | | 45% |
| Net assets at end of year (in 000’s) | $ 599,019 | | $ 605,511 | | $ 721,363 | | $ 568,079 | | $ 553,530 |
| (a) | Per share data based on average shares outstanding during the year. |
| (b) | Total investment return is calculated exclusive of sales charges and assumes the reinvestment of dividends and distributions. For periods of less than one year, total return is not annualized. |
| (c) | In addition to the fees and expenses which the Fund bears directly, it also indirectly bears a pro-rata share of the fees and expenses of the underlying funds in which it invests. Such indirect expenses are not included in the above expense ratios. |
| | Year Ended October 31, |
| Investor Class | 2023 | | 2022 | | 2021 | | 2020 | | 2019 |
| Net asset value at beginning of year | $ 12.16 | | $ 15.65 | | $ 13.42 | | $ 13.28 | | $ 13.14 |
| Net investment income (loss) (a) | 0.29 | | 0.19 | | 0.17 | | 0.22 | | 0.21 |
| Net realized and unrealized gain (loss) | 0.06 | | (2.34) | | 2.82 | | 0.41 | | 0.81 |
| Total from investment operations | 0.35 | | (2.15) | | 2.99 | | 0.63 | | 1.02 |
| Less distributions: | | | | | | | | | |
| From net investment income | (0.10) | | (0.50) | | (0.19) | | (0.23) | | (0.25) |
| From net realized gain on investments | (0.54) | | (0.84) | | (0.57) | | (0.26) | | (0.63) |
| Total distributions | (0.64) | | (1.34) | | (0.76) | | (0.49) | | (0.88) |
| Net asset value at end of year | $ 11.87 | | $ 12.16 | | $ 15.65 | | $ 13.42 | | $ 13.28 |
| Total investment return (b) | 2.92% | | (15.08)% | | 22.97% | | 4.83% | | 8.64% |
| Ratios (to average net assets)/Supplemental Data: | | | | | | | | | |
| Net investment income (loss) | 2.40% | | 1.45% | | 1.12% | | 1.68% | | 1.60% |
| Net expenses (c) | 0.55% | | 0.55% | | 0.55% | | 0.55% | | 0.55% |
| Expenses (before waiver/reimbursement) (c) | 0.69% | | 0.61% | | 0.67% | | 0.66% | | 0.64% |
| Portfolio turnover rate | 23% | | 32% | | 29% | | 59% | | 45% |
| Net assets at end of year (in 000's) | $ 78,972 | | $ 84,180 | | $ 101,233 | | $ 101,831 | | $ 104,946 |
| (a) | Per share data based on average shares outstanding during the year. |
| (b) | Total investment return is calculated exclusive of sales charges and assumes the reinvestment of dividends and distributions. For periods of less than one year, total return is not annualized. |
| (c) | In addition to the fees and expenses which the Fund bears directly, it also indirectly bears a pro-rata share of the fees and expenses of the underlying funds in which it invests. Such indirect expenses are not included in the above expense ratios. |
The notes to the financial statements are an integral part of, and should be read in conjunction with, the financial statements.
39
Financial Highlights selected per share data and ratios
| | Year Ended October 31, |
| Class B | 2023 | | 2022 | | 2021 | | 2020 | | 2019 |
| Net asset value at beginning of year | $ 11.96 | | $ 15.42 | | $ 13.23 | | $ 13.09 | | $ 12.94 |
| Net investment income (loss) (a) | 0.20 | | 0.09 | | 0.06 | | 0.13 | | 0.12 |
| Net realized and unrealized gain (loss) | 0.07 | | (2.32) | | 2.79 | | 0.39 | | 0.79 |
| Total from investment operations | 0.27 | | (2.23) | | 2.85 | | 0.52 | | 0.91 |
| Less distributions: | | | | | | | | | |
| From net investment income | (0.01) | | (0.39) | | (0.09) | | (0.12) | | (0.13) |
| From net realized gain on investments | (0.54) | | (0.84) | | (0.57) | | (0.26) | | (0.63) |
| Total distributions | (0.55) | | (1.23) | | (0.66) | | (0.38) | | (0.76) |
| Net asset value at end of year | $ 11.68 | | $ 11.96 | | $ 15.42 | | $ 13.23 | | $ 13.09 |
| Total investment return (b) | 2.21% | | (15.77)% | | 22.04% | | 4.03% | | 7.82% |
| Ratios (to average net assets)/Supplemental Data: | | | | | | | | | |
| Net investment income (loss) | 1.67% | | 0.70% | | 0.43% | | 1.00% | | 0.96% |
| Net expenses (c) | 1.30% | | 1.30% | | 1.30% | | 1.30% | | 1.30% |
| Expenses (before waiver/reimbursement) (c) | 1.44% | | 1.36% | | 1.42% | | 1.40% | | 1.38% |
| Portfolio turnover rate | 23% | | 32% | | 29% | | 59% | | 45% |
| Net assets at end of year (in 000’s) | $ 7,875 | | $ 14,890 | | $ 27,037 | | $ 31,682 | | $ 40,817 |
| (a) | Per share data based on average shares outstanding during the year. |
| (b) | Total investment return is calculated exclusive of sales charges and assumes the reinvestment of dividends and distributions. For periods of less than one year, total return is not annualized. |
| (c) | In addition to the fees and expenses which the Fund bears directly, it also indirectly bears a pro-rata share of the fees and expenses of the underlying funds in which it invests. Such indirect expenses are not included in the above expense ratios. |
| | Year Ended October 31, |
| Class C | 2023 | | 2022 | | 2021 | | 2020 | | 2019 |
| Net asset value at beginning of year | $ 11.96 | | $ 15.42 | | $ 13.23 | | $ 13.08 | | $ 12.93 |
| Net investment income (loss) (a) | 0.20 | | 0.09 | | 0.06 | | 0.13 | | 0.13 |
| Net realized and unrealized gain (loss) | 0.07 | | (2.32) | | 2.79 | | 0.40 | | 0.78 |
| Total from investment operations | 0.27 | | (2.23) | | 2.85 | | 0.53 | | 0.91 |
| Less distributions: | | | | | | | | | |
| From net investment income | (0.01) | | (0.39) | | (0.09) | | (0.12) | | (0.13) |
| From net realized gain on investments | (0.54) | | (0.84) | | (0.57) | | (0.26) | | (0.63) |
| Total distributions | (0.55) | | (1.23) | | (0.66) | | (0.38) | | (0.76) |
| Net asset value at end of year | $ 11.68 | | $ 11.96 | | $ 15.42 | | $ 13.23 | | $ 13.08 |
| Total investment return (b) | 2.21% | | (15.76)% | | 22.05% | | 4.11% | | 7.83% |
| Ratios (to average net assets)/Supplemental Data: | | | | | | | | | |
| Net investment income (loss) | 1.66% | | 0.70% | | 0.40% | | 0.99% | | 1.00% |
| Net expenses (c) | 1.30% | | 1.30% | | 1.30% | | 1.30% | | 1.30% |
| Expenses (before waiver/reimbursement) (c) | 1.44% | | 1.36% | | 1.42% | | 1.40% | | 1.38% |
| Portfolio turnover rate | 23% | | 32% | | 29% | | 59% | | 45% |
| Net assets at end of year (in 000’s) | $ 14,105 | | $ 19,531 | | $ 30,309 | | $ 35,483 | | $ 43,681 |
| (a) | Per share data based on average shares outstanding during the year. |
| (b) | Total investment return is calculated exclusive of sales charges and assumes the reinvestment of dividends and distributions. For periods of less than one year, total return is not annualized. |
| (c) | In addition to the fees and expenses which the Fund bears directly, it also indirectly bears a pro-rata share of the fees and expenses of the underlying funds in which it invests. Such indirect expenses are not included in the above expense ratios. |
The notes to the financial statements are an integral part of, and should be read in conjunction with, the financial statements.
| 40 | MainStay Moderate Allocation Fund |
Financial Highlights selected per share data and ratios
| | Year Ended October 31, |
| Class I | 2023 | | 2022 | | 2021 | | 2020 | | 2019 |
| Net asset value at beginning of year | $ 12.25 | | $ 15.77 | | $ 13.52 | | $ 13.37 | | $ 13.24 |
| Net investment income (loss) (a) | 0.35 | | 0.26 | | 0.23 | | 0.30 | | 0.28 |
| Net realized and unrealized gain (loss) | 0.07 | | (2.37) | | 2.85 | | 0.40 | | 0.79 |
| Total from investment operations | 0.42 | | (2.11) | | 3.08 | | 0.70 | | 1.07 |
| Less distributions: | | | | | | | | | |
| From net investment income | (0.16) | | (0.57) | | (0.26) | | (0.29) | | (0.31) |
| From net realized gain on investments | (0.54) | | (0.84) | | (0.57) | | (0.26) | | (0.63) |
| Total distributions | (0.70) | | (1.41) | | (0.83) | | (0.55) | | (0.94) |
| Net asset value at end of year | $ 11.97 | | $ 12.25 | | $ 15.77 | | $ 13.52 | | $ 13.37 |
| Total investment return (b) | 3.49% | | (14.76)% | | 23.52% | | 5.33% | | 9.04% |
| Ratios (to average net assets)/Supplemental Data: | | | | | | | | | |
| Net investment income (loss) | 2.85% | | 1.91% | | 1.55% | | 2.31% | | 2.15% |
| Net expenses (c) | 0.10% | | 0.09% | | 0.10% | | 0.11% | | 0.11% |
| Portfolio turnover rate | 23% | | 32% | | 29% | | 59% | | 45% |
| Net assets at end of year (in 000’s) | $ 7,595 | | $ 8,483 | | $ 11,150 | | $ 8,586 | | $ 11,687 |
| (a) | Per share data based on average shares outstanding during the year. |
| (b) | Total investment return is calculated exclusive of sales charges and assumes the reinvestment of dividends and distributions. Class I shares are not subject to sales charges. For periods of less than one year, total return is not annualized. |
| (c) | In addition to the fees and expenses which the Fund bears directly, it also indirectly bears a pro-rata share of the fees and expenses of the underlying funds in which it invests. Such indirect expenses are not included in the above expense ratios. |
| | Year Ended October 31, | | June 14, 2019^ through
October 31,
2019 |
| Class R2 | 2023 | | 2022 | | 2021 | | 2020 | |
| Net asset value at beginning of period | $ 12.13 | | $ 15.62 | | $ 13.40 | | $ 13.27 | | $ 12.78 |
| Net investment income (loss) (a) | 0.31 | | 0.21 | | 0.18 | | 0.24 | | 0.06 |
| Net realized and unrealized gain (loss) | 0.06 | | (2.34) | | 2.82 | | 0.40 | | 0.43 |
| Total from investment operations | 0.37 | | (2.13) | | 3.00 | | 0.64 | | 0.49 |
| Less distributions: | | | | | | | | | |
| From net investment income | (0.12) | | (0.52) | | (0.21) | | (0.25) | | — |
| From net realized gain on investments | (0.54) | | (0.84) | | (0.57) | | (0.26) | | — |
| Total distributions | (0.66) | | (1.36) | | (0.78) | | (0.51) | | — |
| Net asset value at end of period | $ 11.84 | | $ 12.13 | | $ 15.62 | | $ 13.40 | | $ 13.27 |
| Total investment return (b) | 3.04% | | (15.01)% | | 23.10% | | 4.89% | | 3.83% |
| Ratios (to average net assets)/Supplemental Data: | | | | | | | | | |
| Net investment income (loss) | 2.49% | | 1.56% | | 1.22% | | 1.81% | | 1.13%†† |
| Net expenses (c) | 0.45% | | 0.44% | | 0.45% | | 0.46% | | 0.47%†† |
| Portfolio turnover rate | 23% | | 32% | | 29% | | 59% | | 45% |
| Net assets at end of period (in 000’s) | $ 160 | | $ 155 | | $ 177 | | $ 141 | | $ 147 |
| ^ | Inception date. |
| †† | Annualized. |
| (a) | Per share data based on average shares outstanding during the period. |
| (b) | Total investment return is calculated exclusive of sales charges and assumes the reinvestment of dividends and distributions. Class R2 shares are not subject to sales charges. For periods of less than one year, total return is not annualized. |
| (c) | In addition to the fees and expenses which the Fund bears directly, it also indirectly bears a pro-rata share of the fees and expenses of the underlying funds in which it invests. Such indirect expenses are not included in the above expense ratios. |
The notes to the financial statements are an integral part of, and should be read in conjunction with, the financial statements.
41
Financial Highlights selected per share data and ratios
| | Year Ended October 31, |
| Class R3 | 2023 | | 2022 | | 2021 | | 2020 | | 2019 |
| Net asset value at beginning of year | $ 12.09 | | $ 15.58 | | $ 13.37 | | $ 13.24 | | $ 13.09 |
| Net investment income (loss) (a) | 0.27 | | 0.17 | | 0.14 | | 0.20 | | 0.17 |
| Net realized and unrealized gain (loss) | 0.07 | | (2.34) | | 2.82 | | 0.42 | | 0.82 |
| Total from investment operations | 0.34 | | (2.17) | | 2.96 | | 0.62 | | 0.99 |
| Less distributions: | | | | | | | | | |
| From net investment income | (0.08) | | (0.48) | | (0.18) | | (0.23) | | (0.21) |
| From net realized gain on investments | (0.54) | | (0.84) | | (0.57) | | (0.26) | | (0.63) |
| Total distributions | (0.62) | | (1.32) | | (0.75) | | (0.49) | | (0.84) |
| Net asset value at end of year | $ 11.81 | | $ 12.09 | | $ 15.58 | | $ 13.37 | | $ 13.24 |
| Total investment return (b) | 2.86% | | (15.27)% | | 22.79% | | 4.70% | | 8.46% |
| Ratios (to average net assets)/Supplemental Data: | | | | | | | | | |
| Net investment income (loss) | 2.21% | | 1.30% | | 0.96% | | 1.54% | | 1.32% |
| Net expenses (c) | 0.70% | | 0.69% | | 0.70% | | 0.71% | | 0.71% |
| Portfolio turnover rate | 23% | | 32% | | 29% | | 59% | | 45% |
| Net assets at end of year (in 000’s) | $ 1,752 | | $ 1,601 | | $ 1,557 | | $ 964 | | $ 1,004 |
| (a) | Per share data based on average shares outstanding during the year. |
| (b) | Total investment return is calculated exclusive of sales charges and assumes the reinvestment of dividends and distributions. Class R3 shares are not subject to sales charges. For periods of less than one year, total return is not annualized. |
| (c) | In addition to the fees and expenses which the Fund bears directly, it also indirectly bears a pro-rata share of the fees and expenses of the underlying funds in which it invests. Such indirect expenses are not included in the above expense ratios. |
| | Year Ended October 31, | | August 31, 2020^ through
October 31, |
| SIMPLE Class | 2023 | | 2022 | | 2021 | | 2020 |
| Net asset value at beginning of period | $ 12.13 | | $ 15.62 | | $ 13.42 | | $ 13.95* |
| Net investment income (loss) (a) | 0.27 | | 0.15 | | 0.11 | | 0.02 |
| Net realized and unrealized gain (loss) | 0.07 | | (2.34) | | 2.84 | | (0.55) |
| Total from investment operations | 0.34 | | (2.19) | | 2.95 | | (0.53) |
| Less distributions: | | | | | | | |
| From net investment income | (0.07) | | (0.46) | | (0.18) | | — |
| From net realized gain on investments | (0.54) | | (0.84) | | (0.57) | | — |
| Total distributions | (0.61) | | (1.30) | | (0.75) | | — |
| Net asset value at end of period | $ 11.86 | | $ 12.13 | | $ 15.62 | | $ 13.42 |
| Total investment return (b) | 2.81% | | (15.33)% | | 22.61% | | (3.80)% |
| Ratios (to average net assets)/Supplemental Data: | | | | | | | |
| Net investment income (loss) | 2.16% | | 1.19% | | 0.75% | | 0.95%†† |
| Net expenses (c) | 0.72% | | 0.80% | | 0.80% | | 0.80%†† |
| Expenses (before waiver/reimbursement) (c) | 0.72% | | 0.86% | | 0.92% | | 0.93%†† |
| Portfolio turnover rate | 23% | | 32% | | 29% | | 59% |
| Net assets at end of period (in 000’s) | $ 6,734 | | $ 3,013 | | $ 853 | | $ 38 |
| ^ | Inception date. |
| * | Based on the net asset value of Investor Class as of August 31, 2020. |
| †† | Annualized. |
| (a) | Per share data based on average shares outstanding during the period. |
| (b) | Total investment return is calculated exclusive of sales charges and assumes the reinvestment of dividends and distributions. SIMPLE Class shares are not subject to sales charges. For periods of less than one year, total return is not annualized. |
| (c) | In addition to the fees and expenses which the Fund bears directly, it also indirectly bears a pro-rata share of the fees and expenses of the underlying funds in which it invests. Such indirect expenses are not included in the above expense ratios. |
The notes to the financial statements are an integral part of, and should be read in conjunction with, the financial statements.
| 42 | MainStay Moderate Allocation Fund |
MainStay Growth Allocation Fund
Investment and Performance Comparison (Unaudited)
Performance data quoted represents past performance. Past performance is no guarantee of future results. Because of market volatility and other factors, current performance may be lower or higher than the figures shown. Investment return and principal value will fluctuate, and as a result, when shares are redeemed, they may be worth more or less than their original cost. The graph below depicts the historical performance of Class I shares of the Fund. Performance will vary from class to class based on differences in class-specific expenses and sales charges. For performance information current to the most recent month-end, please call 800-624-6782 or visit newyorklifeinvestments.com.
The performance table and graph do not reflect the deduction of taxes that a shareholder would pay on distributions or Fund share redemptions. Total returns reflect maximum applicable sales charges as indicated in the table below, if any, changes in share price, and reinvestment of dividend and capital gain distributions. The graph assumes the initial investment amount shown below and reflects the deduction of all sales charges that would have applied for the period of investment. Performance figures may reflect certain fee waivers and/or expense limitations, without which total returns may have been lower. For more information on share classes and current fee waivers and/or expense limitations (if any), please refer to the Notes to Financial Statements.
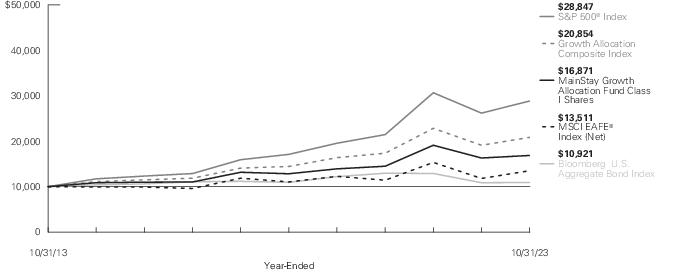
| Average Annual Total Returns for the Year-Ended October 31, 2023 |
| Class | Sales Charge | | Inception
Date | One
Year | Five
Years | Ten Years
or Since
Inception | Gross
Expense
Ratio1 |
| Class A Shares2 | Maximum 3.00% Initial Sales Charge | With sales charges | 4/4/2005 | 0.10% | 4.16% | 4.51% | 0.88% |
| | | Excluding sales charges | | 3.20 | 5.34 | 5.10 | 0.88 |
| Investor Class Shares2, 3 | Maximum 2.50% Initial Sales Charge | With sales charges | 2/28/2008 | 0.40 | 3.97 | 4.33 | 1.13 |
| | | Excluding sales charges | | 2.97 | 5.15 | 4.92 | 1.13 |
| Class B Shares4 | Maximum 5.00% CDSC | With sales charges | 4/4/2005 | -2.60 | 4.06 | 4.13 | 1.88 |
| | if Redeemed Within the First Six Years of Purchase | Excluding sales charges | | 2.20 | 4.36 | 4.13 | 1.88 |
| Class C Shares | Maximum 1.00% CDSC | With sales charges | 4/4/2005 | 1.23 | 4.36 | 4.13 | 1.88 |
| | if Redeemed Within One Year of Purchase | Excluding sales charges | | 2.19 | 4.36 | 4.13 | 1.88 |
| Class I Shares | No Sales Charge | | 4/4/2005 | 3.42 | 5.60 | 5.37 | 0.63 |
| Class R2 Shares5 | No Sales Charge | | 6/14/2019 | 3.08 | N/A | 5.11 | 0.98 |
| Class R3 Shares5 | No Sales Charge | | 2/29/2016 | 2.82 | 4.98 | 6.46 | 1.23 |
| SIMPLE Class Shares | No Sales Charge | | 8/31/2020 | 2.84 | N/A | 2.68 | 1.27 |
| 1. | The gross expense ratios presented reflect the Fund’s “Total Annual Fund Operating Expenses” from the most recent Prospectus, as supplemented, and may differ from other expense ratios disclosed in this report. |
| 2. | Prior to July 22, 2019, the maximum initial sales charge applicable was 5.50%, which is reflected in the applicable average annual total return figures shown. |
| 3. | Prior to June 30, 2020, the maximum initial sales charge was 3.00%, which is reflected in the applicable average annual total return figures shown. |
| 4. | Class B shares are closed to all new purchases as well as additional investments by existing Class B shareholders. |
| 5. | As of October 31, 2023, Class R2 and Class R3 shares are closed to new investors and, upon the close of business on December 29, 2023, Class R2 and Class R3 shares are closed to additional investments by existing shareholders. Additionally, Class R2 and Class R3 shares will be liquidated on or about February 28, 2024 (the "Liquidation Date"). It is expected that the Fund will distribute to remaining shareholders invested in Class R2 or Class R3 shares, on or promptly after the Liquidation Date, a liquidating distribution in cash or cash equivalents equal to the net asset value of such shares. |
The footnotes on the next page are an integral part of the table and graph and should be carefully read in conjunction with them.
| Benchmark Performance* | One
Year | Five
Years | Ten
Years |
| S&P 500® Index1 | 10.14% | 11.01% | 11.18% |
| MSCI EAFE® Index (Net)2 | 14.40 | 4.10 | 3.05 |
| Bloomberg U.S. Aggregate Bond Index3 | 0.36 | -0.06 | 0.88 |
| Growth Allocation Composite Index4 | 9.11 | 7.61 | 7.63 |
| Morningstar Moderately Aggressive Allocation Category Average5 | 4.49 | 5.40 | 5.58 |
| * | Returns for indices reflect no deductions for fees, expenses or taxes, except for foreign withholding taxes where applicable. Results assume reinvestment of all dividends and capital gains. An investment cannot be made directly in an index. |
| 1. | The S&P 500® Index is the Fund's primary benchmark. S&P 500® is a trademark of The McGraw-Hill Companies, Inc. The S&P 500® Index is widely regarded as the standard index for measuring large-cap U.S. stock market performance. |
| 2. | The MSCI EAFE® Index (Net) is the Fund's secondary benchmark. The MSCI EAFE® Index (Net) consists of international stocks representing the developed world outside
of North America. |
| 3. | The Fund has selected the Bloomberg U.S. Aggregate Bond Index as an additional benchmark. The Bloomberg U.S. Aggregate Bond Index is a broad-based benchmark that measures the performance of the investment grade, U.S. dollar-denominated, fixed-rate taxable bond market, including Treasuries, government-related and corporate securities, mortgage-backed securities (agency fixed-rate and hybrid adjustable rate mortgage pass-throughs), asset-backed securities, and commercial mortgage-backed securities. |
| 4. | The Fund has selected the Growth Allocation Composite Index as an additional benchmark. The Growth Allocation Composite Index consists of the S&P 500® Index, the MSCI EAFE® Index and the Bloomberg U.S. Aggregate Bond Index weighted 60%, 20% and 20%, respectively. Prior to February 28, 2014, the Growth Allocation Composite Index consisted of the S&P 500® Index, the MSCI EAFE® Index and the Bloomberg U.S. Aggregate Bond Index weighted 65%, 15%, and 20%, respectively. |
| 5. | The Morningstar Moderately Aggressive Allocation Category Average is representative of funds in allocation categories that seek to provide both income and capital appreciation by primarily investing in multiple asset classes, including stocks, bonds, and cash. These moderately aggressive strategies prioritize capital appreciation over preservation. They typically expect volatility similar to a strategic equity exposure between 70% and 85%. Results are based on average total returns of similar funds with all dividends and capital gain distributions reinvested. |
The footnotes on the preceding page are an integral part of the table and graph and should be carefully read in conjunction with them.
| 44 | MainStay Growth Allocation Fund |
Cost in Dollars of a $1,000 Investment in MainStay Growth Allocation Fund (Unaudited)
The example below is intended to describe the fees and expenses borne by shareholders during the six-month period from May 1, 2023 to October 31, 2023, and the impact of those costs on your investment.
Example
As a shareholder of the Fund you incur two types of costs: (1) transaction costs, including exchange fees and sales charges (loads) on purchases (as applicable), and (2) ongoing costs, including management fees, distribution and/or service (12b-1) fees and other Fund expenses (as applicable). This example is intended to help you understand your ongoing costs (in dollars) of investing in the Fund and to compare these costs with the ongoing costs of investing in other mutual funds. The example is based on an investment of $1,000 made at the beginning of the six-month period and held for the entire period from May 1, 2023 to October 31, 2023.
This example illustrates your Fund’s ongoing costs in two ways:
Actual Expenses
The second and third data columns in the table below provide information about actual account values and actual expenses. You may use the information in these columns, together with the amount you invested, to estimate the expenses that you paid during the six months ended October 31, 2023. Simply divide your account value by $1,000 (for example, an
$8,600 account value divided by $1,000 = 8.6), then multiply the result by the number under the heading entitled “Expenses Paid During Period” to estimate the expenses you paid on your account during this period.
Hypothetical Example for Comparison Purposes
The fourth and fifth data columns in the table below provide information about hypothetical account values and hypothetical expenses based on the Fund’s actual expense ratio and an assumed rate of return of 5% per year before expenses, which is not the Fund’s actual return. The hypothetical account values and expenses may not be used to estimate the actual ending account balances or expenses you paid for the six-month period shown. You may use this information to compare the ongoing costs of investing in the Fund with the ongoing costs of investing in other mutual funds. To do so, compare this 5% hypothetical example with the 5% hypothetical examples that appear in the shareholder reports of the other mutual funds.
Please note that the expenses shown in the table are meant to highlight your ongoing costs only and do not reflect any transactional costs, such as exchange fees or sales charges (loads). Therefore, the fourth and fifth data columns of the table are useful in comparing ongoing costs only and will not help you determine the relative total costs of owning different funds. In addition, if these transactional costs were included, your costs would have been higher.
| Share Class | Beginning
Account
Value
5/1/23 | Ending Account
Value (Based
on Actual
Returns and
Expenses)
10/31/23 | Expenses
Paid
During
Period1 | Ending Account
Value (Based
on Hypothetical
5% Annualized
Return and
Actual Expenses)
10/31/23 | Expenses
Paid
During
Period1 | Net Expense
Ratio
During
Period2 |
| Class A Shares | $1,000.00 | $972.70 | $1.74 | $1,023.44 | $1.79 | 0.35% |
| Investor Class Shares | $1,000.00 | $972.00 | $2.73 | $1,022.43 | $2.80 | 0.55% |
| Class B Shares | $1,000.00 | $968.50 | $6.45 | $1,018.65 | $6.61 | 1.30% |
| Class C Shares | $1,000.00 | $967.80 | $6.45 | $1,018.65 | $6.61 | 1.30% |
| Class I Shares | $1,000.00 | $973.80 | $0.50 | $1,024.70 | $0.51 | 0.10% |
| Class R2 Shares | $1,000.00 | $971.90 | $2.24 | $1,022.94 | $2.29 | 0.45% |
| Class R3 Shares | $1,000.00 | $971.00 | $3.48 | $1,021.68 | $3.57 | 0.70% |
| SIMPLE Class Shares | $1,000.00 | $971.30 | $3.08 | $1,022.08 | $3.16 | 0.62% |
| 1. | Expenses are equal to the Fund’s annualized expense ratio of each class multiplied by the average account value over the period, divided by 365 and multiplied by 184 (to reflect the six-month period). The table above represents the actual expenses incurred during the six-month period. In addition to the fees and expenses which the Fund bears directly, it also indirectly bears a pro rata share of the fees and expenses of the underlying funds in which it invests. Such indirect expenses are not included in the above-reported expense figures. |
| 2. | Expenses are equal to the Fund's annualized expense ratio to reflect the six-month period. |
Asset Diversification as of October 31, 2023 (Unaudited)
| Equity Funds | 75.3% |
| Fixed Income Funds | 13.3 |
| Short-Term Investment | 11.2 |
| Other Assets, Less Liabilities | 0.2 |
See Portfolio of Investments beginning on page 51 for specific holdings within these categories. The Fund’s holdings are subject to change.
| 46 | MainStay Growth Allocation Fund |
Portfolio Management Discussion and Analysis (Unaudited)
Questions answered by portfolio managers Jae S. Yoon, CFA, Jonathan Swaney, Poul Kristensen, CFA, and Amit Soni, CFA, of New York Life Investment Management LLC, the Fund’s Manager.
How did MainStay Growth Allocation Fund perform relative to its benchmarks and peer group during the 12 months ended October 31, 2023?
For the 12 months ended October 31, 2023, Class I shares of MainStay Growth Allocation Fund returned 3.42%, underperforming the 10.14% return of the Fund’s primary benchmark, the S&P 500® Index, and the 14.40% return of the MSCI EAFE® Index (Net), which is the Fund’s secondary benchmark. Over the same period, Class I shares of the Fund outperformed the 0.36% return of the Bloomberg U.S. Aggregate Bond Index, and underperformed the 9.11% return of the Growth Allocation Composite Index, both of which are additional benchmarks of the Fund. For the 12 months ended October 31, 2023, Class I shares of the Fund underperformed the 4.49% return of the Morningstar Moderately Aggressive Allocation Category Average.1
What factors affected the Fund’s relative performance during the reporting period?
The Fund is a “fund of funds,” meaning that it seeks to achieve its investment objective by investing primarily in mutual funds and exchange-traded funds (“ETFs”) managed by New York Life Investments or its affiliates (the “Underlying Funds”). The Underlying Funds may invest in U.S. equities, international equities and fixed-income instruments, making comparisons to any single index generally less suitable than a weighted combination of indices, which is a more useful yardstick by which to measure performance. The most influential factor affecting returns for the Fund during the reporting period (versus the performance of a weighted combination of indices) is the net performance of the Underlying Funds themselves, relative to their respective benchmarks. During the reporting period, asset class policy was the primary determinant of the Fund’s relative performance.
Fund management internally maintains a blend of indices that are taken into consideration when managing the Fund. During the reporting period, the Fund substantially underperformed this internally maintained blend of indices, primarily due to active positioning at the asset class level.
Management of the Fund’s stock/bond blend itself was not the primary issue affecting the Fund’s relative performance, as returns generated in the process of controlling that mix were only marginally negative. We held the Fund’s stock/bond allocation near neutral for much of the reporting period, but with a small bias toward holding underweight exposure to equities. That
posture proved a liability through the spring and early summer of 2023, as a handful of mega-cap technology-related equities drove the market higher. We gradually removed the Fund’s underweight exposure to equities near the end of the reporting period. As a result, the Fund did not benefit materially when the market softened in late summer and into the fall.
Rather, the most significant factor undermining relative performance related to positioning within asset classes, primarily equities, was the Fund’s exposure to small-cap stocks, which detracted substantially from returns. Throughout the reporting period, relative valuations in the small-cap asset class were much more attractive than has been the historical norm, but small companies are significantly more sensitive to changes in bank financing conditions than large companies that can issue bonds. Fast-rising costs on bank loans, coupled with concerns about future credit availability in the wake of the bank crisis in the early spring of 2023, weighed heavily on smaller end of the capitalization spectrum. We promptly restored the Fund’s small-cap allocation to neutral as the nature and scope of the crisis became clear.
Relative performance also suffered from efforts to avoid undue exposure to a small group of market-leading, mega-cap, technology-related companies. Recently dubbed ‘the Magnificent 7’ (Alphabet, Amazon, Apple, Meta Platforms, Microsoft, NVIDIA, and Tesla), these firms are richly valued, implying rapid earnings growth in the coming years. We remain skeptical that such growth is likely to be achieved by these companies, which are already among the largest enterprises in the world, with dominant positions in their respective industries. Accordingly, we shifted Fund assets out of capitalization-weighted large-cap index products, favoring other options—most notably, an equally weighted version of the S&P 500® Index. During the reporting period, however, ongoing enthusiasm for the commercial potential of artificial intelligence (“AI”), and the degree to which the Magnificent 7 are expected to benefit from these developments, helped them maintain their leadership positions. During the reporting period, the Bloomberg Magnificent 7 Total Return Index2 returned approximately 65%, compared to a slightly negative return for the equally weighted S&P 500® Equal Weight Index.3
Tilts favoring defensive sectors, particularly health care, and low volatility stocks further detracted from the Fund’s relative performance. Basically, any skew in the Fund away from the sole winners of the reporting period—mega-cap tech-oriented companies—was a drag on relative results.
| 1. | See "Investment and Performance Comparison" for other share class returns, which may be higher or lower than Class I share returns, and for more information on benchmark and peer group returns. |
| 2. | The Bloomberg Magnificent 7 Total Return Index is an equal-dollar weighted equity benchmark consisting of a fixed basket of 7 widely-traded companies classified in the United States and representing the Communications, Consumer Discretionary and Technology sectors as defined by Bloomberg Industry Classification System (BICS). An investment cannot be made directly in an index. |
| 3. | The S&P 500® Equal Weight Index (“EWI”) is the equal-weight version of the widely-used S&P 500® Index. The S&P 500® EWI includes the same constituents as the capitalization weighted S&P 500® Index, but each company in the S&P 500® EWI is allocated a fixed weight, or 0.2% of the Index total at each quarterly rebalance. An investment cannot be made directly in an index. |
The Fund realized some positive results within equities. Tactical trading in gold miners, for example, proved helpful. The Fund also benefited from some swap positions, in which we pay the return (so are effectively “short”) on a set of highly leveraged companies that look especially vulnerable to higher borrowing costs and more restrictive lending standards. Exposure to uranium miners provided a small, but noticeable, positive contribution to returns as well. (Contributions take weightings and total returns into account.)
The fixed-income portion of the Fund also weighed on results, although to a lesser extent. Fixed income underperformance mainly resulted from the Fund’s duration4 management. The Fund held too little exposure to long-term bonds in the first half of the reporting period when yields were falling, and too much exposure late in the reporting period as yields were rising rapidly. The Fund also gave up a little ground due to underweight exposure to bank loans. We expected that defaults would rise considerably in that space as economic activity slowed, although the anticipated slowdown failed to materialize during the reporting period.
During the reporting period, how was the Fund’s performance materially affected by investments in derivatives?
Total return swaps were used to express most of the Fund’s asset class policy views. Therefore, the swaps can be seen as detracting from the Fund’s relative performance over the course of the reporting period.
How did you allocate the Fund’s assets during the reporting period and why?
Stock/bond blend: We held equity exposure within the Fund relatively close to neutral during the reporting period. We are generally reluctant to position the Fund with underweight equity exposure, since stocks tend to perform well over time and anticipating drawdowns is challenging. The opposite is less true; we are happy to lean into equities when we believe they are well-supported fundamentally or when a correction has run further than we believe appropriate. Nevertheless, we shifted the Fund’s equity position to slightly underweight following a sharp rally in January 2023, and enlarged the underweight posture a little further late in the spring when banking sector turmoil appeared to increase the likelihood of a recession. As the recession failed to materialize, we gradually removed the underweight equity exposure over the course of the summer and into the fall.
Duration: After an extended period of holding a short duration position, in the spring of 2023, we shifted the Fund to a neutral position in expectation of an impending recession. We extended
the Fund’s duration further in the summer and fall as yields rose, presumably in response to heavy new Treasury issuance, “higher for longer” monetary policy prospects, stubborn inflationary pressures, and rising yields abroad. As of the end of the reporting period, the Fund’s duration was slightly more than a half year long, reflecting our view that a combination of waning consumption, normalized supply chains and improving productivity will curb inflation in the quarters ahead, and yields will drop sharply.
Equity style: Growth stocks, by definition, exhibit richer valuations than value stocks. As a consequence, growth stock prices are relatively reliant on distant profits, and are often more sensitive to elevated inflation and higher interest rates than their value-oriented counterparts. Accordingly, given the high-rate environment that prevailed during the reporting period, we persistently tilted the Fund to emphasize value stocks that offered more substantial near-term cash flows. In particular, we focused on defensive, lower-volatility sectors, including utilities, consumer staples and—most of all—health care. This position undermined performance in 2023, as market performance was dominated by the aforementioned Magnificent 7—growth-oriented technology-related stocks swept by a wave of excitement over the prospects for generative AI.
Equity size: The Fund held overweight exposure to small-cap stocks during the first half of the reporting period. We based our thesis on several prevailing characteristics of the asset class: attractive valuations, insulation from economic weakness abroad, less sensitivity to dollar strength and disproportionate exposure to domestic demand, which thus far remains robust. That position proved unconstructive during the spring of 2023, as small companies tend to be heavily dependent on bank financing, and banks aggressively tightened lending standards in the wake of the banking crisis that occurred in March and April. Accordingly, we unwound the Fund’s small-cap bias. However, it is important to note that the proceeds did not flow to large blend index exposure, where the Magnificent 7 dominate. Rather, the redirected assets went into the S&P 500® Equal Weight Index, where those seven names comprise less than 2% of that Index.
Geographic exposure: During the latter part of the reporting period, European equities appeared vulnerable. We expected that persistently high wage growth would compel the European Central Bank to maintain its restrictive monetary policies for an extended period of time while European export-heavy economies wrestled with declining global trade volumes. In addition, Europe appeared particularly exposed to potential energy price spikes amid elevated geopolitical tensions. On the other hand, the Bank of Japan remained engaged in accommodative policy, Japanese exports benefited from a weak yen, and Japanese companies increasingly
| 4. | Duration is a measure of the price sensitivity of a fixed-income investment to changes in interest rates. Duration is expressed as a number of years and is considered a more accurate sensitivity gauge than average maturity. |
| 48 | MainStay Growth Allocation Fund |
prioritized shareholder governance, largely in the form of share buybacks. Given these divergent conditions, we tilted the Fund away from European markets in favor of Japanese stocks, while holding net exposure to non-US stocks close to neutral.
Energy: The Fund maintained exposure to upstream energy producers and oilfield/gas field service providers as a commodity play to provide an additional inflation hedge. These holdings also positioned the Fund to take advantage of opportunities for domestic producers to benefit as Western nations revisit energy policy to source supplies from stable and friendly jurisdictions rather than autocratic petrostates that present national security risks. The Fund’s small, but volatile, energy position detracted significantly from performance during the first half of the reporting period but fully recovered in the second half.
How did the Fund’s allocations change over the course of the reporting period?
In one of the more substantial changes in allocations undertaken during the reporting period, we reduced the Fund’s exposure to small-cap stocks, expressed via total return swaps. We took this action in response to the banking crisis that unfolded in the spring of 2023. Other changes included a reduction in the Fund’s holdings of MainStay Floating Rate Fund, thereby decreasing exposure to lower-credit-quality fixed-income instruments ahead of an expected recession. We unwound the Fund’s swap exposure to VanEck Gold Miners ETF, taking profits and exiting a profitable trade on a high note. Lastly, we used swaps to tilt the Fund away from baskets of specific stocks that were either heavily dependent on floating-rate loans (such as Uber, United Airlines and Carnival) or that generated insufficient operating income to retire debt as it came due (so-called ‘zombie’ companies, such as Royal Caribbean, Wynn Resorts and Rivian Automotive). We believed these firms were especially vulnerable in an environment of fast-rising interest rates and tightening lending standards.
New or increased allocations included, first and foremost, exposure to iShares 20+ Year Treasury Bond ETF, which we used to extend the Fund’s duration as bond yields rose. Another consequential change involved the establishment and growth of an allocation to Invesco S&P 500® Equal Weight ETF, funded in part from cash. We adopted this position to remove the Fund’s underweight exposure to equities without significantly increasing its exposure to the Magnificent 7 mega-cap technology-related names. We also initiated a new Fund position in iShares MSCI Japan ETF (via a swap), as we saw valuations as attractive, export conditions as favorable and the Japanese yen likely to appreciate should the Bank of Japan abandon its existing yield curve5 control policy. Another notable addition involved the establishment of
exposure to Global X Uranium ETF, which invests primarily in uranium mining firms. Climate change concerns, net-zero commitments and the limitations of renewable energy are driving a reconsideration of nuclear energy, for which fuel supply is rather limited. We foresee a supply/demand imbalance developing that is likely to support businesses involved with extracting and processing uranium.
At the Underlying Fund level, we took advantage of a few new investment options, adopting a position in IQ MacKay ESG High Income ETF, with proceeds from MainStay MacKay High Yield Corporate Bond Fund. Other holdings in newly available Underlying Equity Funds included MainStay PineStone U.S. Equity Fund, IQ Candriam U.S. Mid Cap Equity ETF and MainStay Fiera SMID Growth Fund.
During the reporting period, which Underlying Equity Funds had the highest total returns and which had the lowest total returns?
The Fund’s top-performing Underlying Equity Funds that were held for the entire reporting period included MainStay Winslow Large Cap Growth Fund (and its sister product, IQ Winslow Large Cap Growth ETF), IQ 500 International ETF and MainStay Epoch Capital Growth Fund. The worst-performing positions included MainStay WMC Small Companies Fund, IQ U.S. Small Cap ETF and swap exposure to the S&P Small Cap 600® Index.6
Which Underlying Equity Funds were the strongest positive contributors to the Fund’s performance and which Underlying Equity Funds were particularly weak?
The strongest positive contributions to performance came from MainStay Winslow Large Cap Growth Fund, MainStay WMC Growth Fund and IQ Candriam U.S. Large Cap Equity ETF. The direct fund holdings detracting most significantly from returns included IQ Candriam U.S. Mid Cap Equity ETF, MainStay WMC Small Companies Fund and MainStay Fiera SMID Growth Fund. Losses were greater in some swap positions in which we paid the return to iShares MSCI EAFE Index, the Russell 1000® Growth Index and the S&P 500® Equal Weight Index.
During the reporting period, which Underlying Fixed-Income Funds had the highest total returns and which Underlying Fixed-Income Funds had the lowest total returns?
The Fund held only six fixed-income positions for the entire reporting period, all of which generated positive returns. The three best performers included MainStay Floating Rate Fund, MainStay MacKay Short Duration High Yield Fund and MainStay MacKay
| 5. | The yield curve is a line that plots the yields of various securities of similar quality—typically U.S. Treasury issues—across a range of maturities. The U.S. Treasury yield curve serves as a benchmark for other debt and is used in economic forecasting. |
| 6. | The S&P Small Cap 600™ Index covers roughly the small-cap range of American stocks, using a capitalization-weighted index. Capitalization range is from $850 million to $3.7 billion. An investment cannot be made directly in an index. |
High Yield Corporate Bond Fund. The lowest total returns came from IQ MacKay ESG Core Plus Bond ETF, MainStay MacKay Total Return Bond Fund and cash holdings.
Which Underlying Fixed-Income Funds were the strongest positive contributors to the Fund’s performance and which Underlying Fixed-Income Funds were particularly weak?
The largest contributors to the Fund’s absolute returns came from cash holdings and positions in MainStay Floating Rate Fund and MainStay MacKay Short Duration High Yield Fund. The only fixed-income position that detracted from performance was swap exposure to iShares 20+ Year Treasury Bond ETF. The contributions from positions in IQ MacKay ESG High Income ETF and MainStay Short Term Bond Fund were effectively zero.
How was the Fund positioned at the end of the reporting period?
For some time now, we have held the view that a recession in response to dramatic monetary policy tightening and the expiration of pandemic-era support programs is all but inevitable. This remains the case today, and indications of the onset of said recession are beginning to accumulate. We firmly expect corporate profits to decline over the next several quarters, eventually taking stock prices down with them, while also driving down Treasury yields and pushing credit spreads7 out. Accordingly, as of October 31, 2023, the Fund maintains a relatively defensive posture.
Given the difficulty in predicting a market top, we are resistant to holding an underweight position in equities. As such, we are maintaining a neutral position for the Fund at this time, although we intend to exploit any significant pullbacks - should they arise - by building an oversight position.
The Fund’s defensive positioning is more evident within asset classes. Most notably, we have extended the Fund’s duration considerably through purchases of a long-dated Treasury bond ETF, with the expectation that it will benefit from the trend of investors to shift out of risky assets as economic and market conditions deteriorate. Additionally, we are maintaining exposure to bank loans at a below-benchmark weight, and skewing holdings of high yield bonds to favor shorter maturity instruments, which tend to exhibit less volatility and smaller losses than do longer-maturity bonds.
On the equity side, the Fund favors sectors that have generally exhibited lower volatility and retained their value better during
drawdowns. Prominent among these are utilities and health care. We have also skewed the Fund away from a set of highly leveraged companies deemed to be especially vulnerable to a tightening credit environment.
| 7. | The terms “spread” and “yield spread” may refer to the difference in yield between a security or type of security and comparable U.S. Treasury issues. The terms may also refer to the difference in yield between two specific securities or types of securities at a given time. The term “credit spread” typically refers to the difference in yield between corporate or municipal bonds (or a specific category of these bonds) comparable to U.S. Treasury issues. |
The opinions expressed are those of the portfolio managers as of the date of this report and are subject to change. There is no guarantee that any forecasts will come to pass. This material does not constitute investment advice and is not intended as an endorsement of any specific investment.
| 50 | MainStay Growth Allocation Fund |
Portfolio of Investments October 31, 2023†^
| | Shares | Value |
| Affiliated Investment Companies 88.6% |
| Equity Funds 75.3% |
| IQ 500 International ETF (a) | 815,836 | $ 24,172,486 |
| IQ Candriam International Equity ETF (a) | 955,742 | 23,825,310 |
| IQ Candriam U.S. Large Cap Equity ETF (a) | 1,097,744 | 40,243,515 |
| IQ Candriam U.S. Mid Cap Equity ETF (a) | 1,148,028 | 28,689,449 |
| IQ FTSE International Equity Currency Neutral ETF | 652,372 | 14,704,465 |
| IQ U.S. Large Cap ETF (a) | 1,198,878 | 37,806,738 |
| IQ U.S. Small Cap ETF (a) | 885,526 | 26,113,985 |
| IQ Winslow Large Cap Growth ETF (a) | 169,801 | 5,203,144 |
| MainStay Candriam Emerging Markets Equity Fund Class R6 (a) | 3,000,728 | 25,268,828 |
| MainStay Epoch Capital Growth Fund Class I | 212,293 | 2,556,055 |
| MainStay Epoch International Choice Fund Class I (a) | 534,706 | 18,814,369 |
| MainStay Epoch U.S. Equity Yield Fund Class R6 (a) | 2,067,840 | 38,234,988 |
| MainStay Fiera SMID Growth Fund Class R6 (a) | 1,510,159 | 21,332,201 |
| MainStay PineStone International Equity Fund Class R6 (a) | 1,395,070 | 18,956,913 |
| MainStay PineStone U.S. Equity Fund Class R6 (a) | 938,669 | 14,616,765 |
| MainStay S&P 500 Index Fund Class I | 234,616 | 11,602,296 |
| MainStay Winslow Large Cap Growth Fund Class R6 | 4,066,414 | 40,661,699 |
| MainStay WMC Enduring Capital Fund Class R6 (a) | 1,194,987 | 35,969,232 |
| MainStay WMC Growth Fund Class R6 (a) | 1,197,545 | 43,185,259 |
| MainStay WMC International Research Equity Fund Class I (a) | 2,878,459 | 18,918,097 |
| MainStay WMC Small Companies Fund Class I (a) | 1,404,712 | 26,347,474 |
| MainStay WMC Value Fund Class R6 (a) | 1,282,674 | 35,945,137 |
Total Equity Funds
(Cost $499,551,358) | | 553,168,405 |
| Fixed Income Funds 13.3% |
| IQ MacKay ESG Core Plus Bond ETF | 571,913 | 11,197,027 |
| IQ Mackay ESG High Income ETF (a) | 389,959 | 9,762,624 |
| MainStay Floating Rate Fund Class R6 (a) | 2,576,684 | 22,559,386 |
| MainStay MacKay High Yield Corporate Bond Fund Class R6 | 2,001,286 | 9,792,894 |
| MainStay MacKay Short Duration High Yield Fund Class I | 1,970,970 | 18,093,110 |
| | Shares | | Value |
| |
| Fixed Income Funds (continued) |
| MainStay MacKay Total Return Bond Fund Class R6 | 1,343,540 | | $ 11,213,724 |
| MainStay Short Term Bond Fund Class I (a) | 1,678,541 | | 15,029,320 |
Total Fixed Income Funds
(Cost $99,156,193) | | | 97,648,085 |
Total Affiliated Investment Companies
(Cost $598,707,551) | | | 650,816,490 |
| Short-Term Investment 11.2% |
| Affiliated Investment Company 11.2% |
| MainStay U.S. Government Liquidity Fund, 5.275% (a)(b) | 82,408,556 | | 82,408,556 |
Total Short-Term Investment
(Cost $82,408,556) | 11.2% | | 82,408,556 |
Total Investments
(Cost $681,116,107) | 99.8% | | 733,225,046 |
| Other Assets, Less Liabilities | 0.2 | | 1,400,204 |
| Net Assets | 100.0% | | $ 734,625,250 |
| † | Percentages indicated are based on Fund net assets. |
| ^ | Industry classifications may be different than those used for compliance monitoring purposes. |
| (a) | As of October 31, 2023, the Fund's ownership exceeds 5% of the outstanding shares of the Underlying Fund's share class. |
| (b) | Current yield as of October 31, 2023. |
The notes to the financial statements are an integral part of, and should be read in conjunction with, the financial statements.
51
Portfolio of Investments October 31, 2023†^ (continued)
Investments in Affiliates (in 000's)
Investments in issuers considered to be affiliate(s) of the Fund during the year ended October 31, 2023 for purposes of Section 2(a)(3) of the Investment Company Act of 1940, as amended, were as follows:
| Affiliated Investment Companies | Value,
Beginning
of Year | Purchases
at Cost | Proceeds
from
Sales | Net
Realized
Gain/(Loss)
on Sales | Change in
Unrealized
Appreciation/
(Depreciation) | Value,
End of
Year | Dividend
Income | Other
Distributions | Shares
End of
Year |
| IQ 500 International ETF | $ 24,570 | $ 1,306 | $ (5,165) | $ 186 | $ 3,275 | $ 24,172 | $ 940 | $ — | 816 |
| IQ Candriam International Equity ETF | 24,441 | 1,269 | (4,698) | (675) | 3,488 | 23,825 | 765 | — | 956 |
| IQ Candriam U.S. Large Cap Equity ETF | 48,849 | 1,944 | (16,832) | 2,431 | 3,852 | 40,244 | 687 | — | 1,098 |
| IQ Candriam U.S. Mid Cap Equity ETF | — | 32,312 | — | — | (3,622) | 28,690 | 89 | — | 1,148 |
| IQ FTSE International Equity Currency Neutral ETF | 14,911 | 414 | (2,199) | 182 | 1,396 | 14,704 | 344 | 281 | 652 |
| IQ MacKay ESG Core Plus Bond ETF | 12,493 | 1,437 | (2,362) | (215) | (156) | 11,197 | 530 | — | 572 |
| IQ Mackay ESG High Income ETF | — | 10,322 | (276) | (4) | (279) | 9,763 | 287 | — | 390 |
| IQ U.S. Large Cap ETF | 44,996 | 413 | (8,404) | 1,800 | (998) | 37,807 | 738 | — | 1,199 |
| IQ U.S. Small Cap ETF | 42,744 | 6,237 | (20,333) | 2,430 | (4,964) | 26,114 | 600 | — | 886 |
| IQ Winslow Large Cap Growth ETF | 2,679 | 1,694 | — | — | 830 | 5,203 | 2 | — | 170 |
| MainStay Candriam Emerging Markets Equity Fund Class R6 | 24,289 | 2,323 | (1,783) | (631) | 1,071 | 25,269 | 298 | — | 3,001 |
| MainStay Epoch Capital Growth Fund Class I | 2,643 | 39 | (516) | (68) | 458 | 2,556 | 12 | 27 | 212 |
| MainStay Epoch International Choice Fund Class I | 19,587 | 1,096 | (4,365) | 750 | 1,746 | 18,814 | 263 | — | 535 |
| MainStay Epoch U.S. Equity Yield Fund Class R6 | 46,071 | 3,643 | (10,628) | (88) | (763) | 38,235 | 1,079 | 685 | 2,068 |
| MainStay Fiera SMID Growth Fund Class R6 | — | 23,225 | — | — | (1,893) | 21,332 | — | — | 1,510 |
| MainStay Floating Rate Fund Class R6 | 36,031 | 6,218 | (20,484) | (988) | 1,782 | 22,559 | 2,502 | — | 2,577 |
| MainStay MacKay High Yield Corporate Bond Fund Class R6 | 15,292 | 6,446 | (12,239) | (772) | 1,066 | 9,793 | 886 | — | 2,001 |
| MainStay MacKay International Equity Fund Class R6 | 18,824 | 1,648 | (21,042) | (308) | 878 | — | 182 | — | — |
| MainStay MacKay Short Duration High Yield Fund Class I | 17,427 | 3,238 | (2,750) | (103) | 281 | 18,093 | 1,076 | — | 1,971 |
| MainStay MacKay Total Return Bond Fund Class R6 | 12,539 | 1,627 | (2,687) | (413) | 148 | 11,214 | 522 | — | 1,344 |
| MainStay PineStone International Equity Fund Class R6 (a) | — | 20,268 | — | — | (1,311) | 18,957 | — | — | 1,395 |
| MainStay PineStone U.S. Equity Fund Class R6 | — | 15,306 | — | — | (689) | 14,617 | — | — | 939 |
| MainStay S&P 500 Index Fund Class I | 11,250 | 1,325 | (1,038) | 44 | 21 | 11,602 | 159 | 904 | 235 |
| MainStay Short Term Bond Fund Class I | — | 16,287 | (966) | (14) | (277) | 15,030 | 386 | — | 1,679 |
| MainStay U.S. Government Liquidity Fund | 81,000 | 96,817 | (95,408) | — | — | 82,409 | 3,694 | — | 82,409 |
| MainStay Winslow Large Cap Growth Fund Class R6 | 45,738 | 5,271 | (14,136) | (303) | 4,092 | 40,662 | 107 | 5,114 | 4,066 |
| MainStay WMC Enduring Capital Fund Class R6 | 43,829 | 3,256 | (11,442) | (580) | 906 | 35,969 | 260 | 1,604 | 1,195 |
| MainStay WMC Growth Fund Class R6 | 47,923 | 3,235 | (16,014) | (5,906) | 13,947 | 43,185 | — | — | 1,198 |
| MainStay WMC International Research Equity Fund Class I | 19,198 | 1,118 | (3,459) | (28) | 2,089 | 18,918 | 410 | — | 2,878 |
| MainStay WMC Small Companies Fund Class I | 42,955 | 8,743 | (20,083) | (1,441) | (3,827) | 26,347 | 941 | — | 1,405 |
| MainStay WMC Value Fund Class R6 | 45,228 | 3,713 | (10,186) | (200) | (2,610) | 35,945 | 757 | 1,713 | 1,283 |
| | $ 745,507 | $282,190 | $(309,495) | $(4,914) | $ 19,937 | $ 733,225 | $18,516 | $10,328 | |
| | |
| (a) | As of September 8, 2023, the Fund exchanged in a nontaxable transfer of all shares of the MainStay MacKay International Equity Fund Class R6 into the newly launched MainStay PineStone International Equity Fund Class R6. |
The notes to the financial statements are an integral part of, and should be read in conjunction with, the financial statements.
| 52 | MainStay Growth Allocation Fund |
Swap Contracts
Open OTC total return equity swap contracts as of October 31, 2023 were as follows1:
Swap
Counterparty | Reference Obligation | Floating Rate2 | Termination
Date(s) | Payment
Frequency
Paid/
Received | Notional
Amount
Long/
(Short)
(000)3 | Unrealized
Appreciation/
(Depreciation)4 |
| Citibank NA | Citi Leveraged Loan Basket | 1 day FEDF minus 0.20% | 12/4/23 | Daily | (7,547) | $ — |
| Citibank NA | Citi Zombie Company Basket | 1 day FEDF minus 0.50% | 12/4/23 | Daily | (6,916) | — |
| JPMorgan Chase Bank NA | Global X Uranium ETF | 1 day FEDF plus 0.50% | 10/8/24- 10/15/24 | Daily | 7,957 | — |
| Citibank NA | Invesco S&P 500 Low Volatility ETF | 1 day FEDF plus 0.45% | 12/4/23 | Daily | 7,128 | — |
| Citibank NA | iShares 20+ Year Treasury Bond ETF | 1 day FEDF plus 0.38% | 12/4/23 | Daily | 40,612 | — |
| Citibank NA | iShares MSCI EAFE ETF | 1 day FEDF minus 1.25% | 12/4/23 | Daily | (18,306) | — |
| Citibank NA | iShares MSCI Emerging Markets ETF | 1 day FEDF minus 0.54% | 12/4/23 | Daily | (3,563) | — |
| JPMorgan Chase Bank NA | iShares MSCI Japan ETF | 1 day FEDF plus 0.15% | 4/24/24- 5/7/24 | Daily | 22,247 | — |
| JPMorgan Chase Bank NA | J.P. Morgan IDEX Pure Size Short | 1 day FEDF plus 0.02% | 6/20/24 | Daily | (3,282) | — |
| JPMorgan Chase Bank NA | Materials Select Sector SPDR Fund | 1 day FEDF plus 0.18% | 2/5/24 | Daily | 7,313 | — |
| Citibank NA | Russell 1000 Growth Total Return Index | 1 day FEDF minus 0.20% | 12/4/23 | Daily | (10,869) | — |
| JPMorgan Chase Bank NA | Russell 2000 Total Return Index | 1 day FEDF minus 0.15% - plus 0.02% | 4/9/24- 5/7/24 | Daily | (30,951) | — |
| JPMorgan Chase Bank NA | S&P 500 Equal Weight | 1 day FEDF plus 0.30% - 0.51% | 5/7/24 | Daily | 32,389 | — |
| Citibank NA | S&P 500 Financials Index | 1 day FEDF plus 0.10% | 12/4/23 | Daily | (1,072) | — |
| Citibank NA | S&P 500 Health Care Sector | 1 day FEDF plus 0.45% | 12/4/23 | Daily | 7,284 | — |
| Citibank NA | S&P 500 Total Return Index | 1 day FEDF plus 0.05% | 12/4/23 | Daily | (22,305) | — |
| Citibank NA | S&P 500 Utilities Total Return | 1 day FEDF plus 0.50% | 12/4/23 | Daily | 7,690 | — |
| Citibank NA | S&P 600 Total Return | 1 day FEDF plus 0.41% | 12/4/23 | Daily | 35,748 | — |
| Citibank NA | S&P Midcap 400 Total Return Index | 1 day FEDF plus 0.31% | 12/4/23 | Daily | 21,228 | — |
| Citibank NA | Vanguard FTSE Europe ETF | 1 day FEDF minus 5.00% | 12/4/23 | Daily | (7,379) | — |
| | | | | | | $ — |
The following table represents the basket holdings underlying the total return swap with Citi Leveraged Loan Basket as of October 31, 2023.
| Security Description | Shares | Notional Value | Unrealized Appreciation/
Depreciation | Percent of
Basket Net Assets |
| AerCap Holdings NV | (3,673) | (355,173) | — | 4.71 |
| Apollo Commercial Real Estate Finance, Inc. | (690) | (66,697) | — | 0.88 |
| Atlantica Sustainable Infrastructure plc | (434) | (41,964) | — | 0.56 |
| Brandywine Realty Trust | (623) | (60,291) | — | 0.80 |
| Carnival Corp. | (9,213) | (890,881) | — | 11.80 |
| Chart Industries, Inc. | (3,541) | (342,439) | — | 4.54 |
| Coherent Corp. | (1,473) | (142,447) | — | 1.89 |
| CommScope Holding Co, Inc. | (137) | (13,201) | — | 0.17 |
| Crane NXT Co | (2,722) | (263,228) | — | 3.49 |
| Cushman & Wakefield plc | (692) | (66,916) | — | 0.89 |
| Delta Air Lines, Inc. | (7,330) | (708,792) | — | 9.39 |
| Designer Brands, Inc. | (766) | (74,048) | — | 0.98 |
| DigitalBridge Group, Inc. | (1,206) | (116,666) | — | 1.55 |
| Elanco Animal Health, Inc. | (3,015) | (291,550) | — | 3.86 |
| Entegris, Inc. | (4,791) | (463,318) | — | 6.14 |
| Fidelity National Information Services, Inc. | (7,213) | (697,547) | — | 9.24 |
| Hanesbrands, Inc. | (1,954) | (188,970) | — | 2.50 |
| JetBlue Airways Corp. | (1,031) | (99,672) | — | 1.32 |
| Lumen Technologies, Inc. | (2,122) | (205,207) | — | 2.72 |
| MKS Instruments, Inc. | (1,413) | (136,648) | — | 1.81 |
| Oatly Group AB | (86) | (8,270) | — | 0.11 |
| Opendoor Technologies, Inc. | (1,468) | (141,930) | — | 1.88 |
| Par Pacific Holdings, Inc. | (1,122) | (108,509) | — | 1.44 |
| PureCycle Technologies, Inc. | (444) | (42,963) | — | 0.57 |
| Scorpio Tankers, Inc. | (2,546) | (246,217) | — | 3.26 |
The notes to the financial statements are an integral part of, and should be read in conjunction with, the financial statements.
53
Portfolio of Investments October 31, 2023†^ (continued)
| Security Description | Shares | Notional Value | Unrealized Appreciation/
Depreciation | Percent of
Basket Net Assets |
| Topgolf Callaway Brands Corp. | (743) | (71,856) | — | 0.95 |
| Uber Technologies, Inc. | (11,225) | (1,085,466) | — | 14.38 |
| United Airlines Holdings, Inc. | (6,376) | (616,539) | — | 8.17 |
| 1. | As of October 31, 2023, cash in the amount $3,450,000 was pledged to brokers for OTC swap contracts. |
| 2. | Fund pays the floating rate and receives the total return of the reference entity. |
| 3. | Notional amounts reflected as a positive value indicate a long position held by the Fund or Index and a negative value indicates a short position. |
| 4. | Reflects the value at reset date as of October 31, 2023. |
| Abbreviation(s): |
| EAFE—Europe, Australasia and Far East |
| ETF—Exchange-Traded Fund |
| FEDF—Federal Funds Rate |
| FTSE—Financial Times Stock Exchange |
| MSCI—Morgan Stanley Capital International |
| SPDR—Standard & Poor’s Depositary Receipt |
The following is a summary of the fair valuations according to the inputs used as of October 31, 2023, for valuing the Fund’s assets:
| Description | Quoted
Prices in
Active
Markets for
Identical
Assets
(Level 1) | | Significant
Other
Observable
Inputs
(Level 2) | | Significant
Unobservable
Inputs
(Level 3) | | Total |
| Asset Valuation Inputs | | | | | | | |
| Investments in Securities (a) | | | | | | | |
| Affiliated Investment Companies | | | | | | | |
| Equity Funds | $ 553,168,405 | | $ — | | $ — | | $ 553,168,405 |
| Fixed Income Funds | 97,648,085 | | — | | — | | 97,648,085 |
| Total Affiliated Investment Companies | 650,816,490 | | — | | — | | 650,816,490 |
| Short-Term Investment | | | | | | | |
| Affiliated Investment Company | 82,408,556 | | — | | — | | 82,408,556 |
| Total Investments in Securities | $ 733,225,046 | | $ — | | $ — | | $ 733,225,046 |
| (a) | For a complete listing of investments, see the Portfolio of Investments. |
The notes to the financial statements are an integral part of, and should be read in conjunction with, the financial statements.
| 54 | MainStay Growth Allocation Fund |
Statement of Assets and Liabilities as of October 31, 2023
| Assets |
Investment in affiliated investment companies, at value
(identified cost $681,116,107) | $733,225,046 |
| Cash collateral on deposit at broker for swap contracts | 3,450,000 |
| Receivables: | |
| Dividends and interest | 516,301 |
| Fund shares sold | 190,233 |
| Other assets | 50,065 |
| Total assets | 737,431,645 |
| Liabilities |
| Payables: | |
| Dividends and interest on OTC swaps contracts | 2,085,229 |
| Fund shares redeemed | 276,258 |
| Transfer agent (See Note 3) | 174,963 |
| NYLIFE Distributors (See Note 3) | 173,989 |
| Shareholder communication | 61,454 |
| Custodian | 16,102 |
| Professional fees | 15,113 |
| Manager (See Note 3) | 3,262 |
| Accrued expenses | 25 |
| Total liabilities | 2,806,395 |
| Net assets | $734,625,250 |
| Composition of Net Assets |
| Shares of beneficial interest outstanding (par value of $.001 per share) unlimited number of shares authorized | $ 55,783 |
| Additional paid-in-capital | 695,753,124 |
| | 695,808,907 |
| Total distributable earnings (loss) | 38,816,343 |
| Net assets | $734,625,250 |
| Class A | |
| Net assets applicable to outstanding shares | $603,145,952 |
| Shares of beneficial interest outstanding | 45,785,577 |
| Net asset value per share outstanding | $ 13.17 |
| Maximum sales charge (3.00% of offering price) | 0.41 |
| Maximum offering price per share outstanding | $ 13.58 |
| Investor Class | |
| Net assets applicable to outstanding shares | $ 92,320,915 |
| Shares of beneficial interest outstanding | 6,999,850 |
| Net asset value per share outstanding | $ 13.19 |
| Maximum sales charge (2.50% of offering price) | 0.34 |
| Maximum offering price per share outstanding | $ 13.53 |
| Class B | |
| Net assets applicable to outstanding shares | $ 9,586,894 |
| Shares of beneficial interest outstanding | 742,145 |
| Net asset value and offering price per share outstanding | $ 12.92 |
| Class C | |
| Net assets applicable to outstanding shares | $ 14,669,454 |
| Shares of beneficial interest outstanding | 1,135,244 |
| Net asset value and offering price per share outstanding | $ 12.92 |
| Class I | |
| Net assets applicable to outstanding shares | $ 9,104,440 |
| Shares of beneficial interest outstanding | 679,812 |
| Net asset value and offering price per share outstanding | $ 13.39 |
| Class R2 | |
| Net assets applicable to outstanding shares | $ 61,002 |
| Shares of beneficial interest outstanding | 4,634 |
| Net asset value and offering price per share outstanding | $ 13.16 |
| Class R3 | |
| Net assets applicable to outstanding shares | $ 914,338 |
| Shares of beneficial interest outstanding | 69,917 |
| Net asset value and offering price per share outstanding | $ 13.08 |
| SIMPLE Class | |
| Net assets applicable to outstanding shares | $ 4,822,255 |
| Shares of beneficial interest outstanding | 365,665 |
| Net asset value and offering price per share outstanding | $ 13.19 |
The notes to the financial statements are an integral part of, and should be read in conjunction with, the financial statements.
55
Statement of Operations for the year ended October 31, 2023
| Investment Income (Loss) |
| Income | |
| Dividend distributions from affiliated investment companies | $ 18,516,039 |
| Expenses | |
| Distribution/Service—Class A (See Note 3) | 1,578,306 |
| Distribution/Service—Investor Class (See Note 3) | 251,791 |
| Distribution/Service—Class B (See Note 3) | 136,024 |
| Distribution/Service—Class C (See Note 3) | 183,038 |
| Distribution/Service—Class R2 (See Note 3) | 177 |
| Distribution/Service—Class R3 (See Note 3) | 5,171 |
| Distribution/Service—SIMPLE Class (See Note 3) | 20,550 |
| Transfer agent (See Note 3) | 953,159 |
| Registration | 115,775 |
| Professional fees | 94,922 |
| Custodian | 44,828 |
| Trustees | 19,954 |
| Shareholder communication | 1,875 |
| Shareholder service (See Note 3) | 1,105 |
| Miscellaneous | 20,666 |
| Total expenses before waiver/reimbursement | 3,427,341 |
| Expense waiver/reimbursement from Manager (See Note 3) | (184,110) |
| Reimbursement from prior custodian(a) | (1,548) |
| Net expenses | 3,241,683 |
| Net investment income (loss) | 15,274,356 |
| Realized and Unrealized Gain (Loss) |
| Net realized gain (loss) on: | |
| Affiliated investment company transactions | (4,913,732) |
| Realized capital gain distributions from affiliated investment companies | 10,327,809 |
| Swap transactions | (15,924,167) |
| Net realized gain (loss) | (10,510,090) |
Net change in unrealized appreciation (depreciation) on:
Affiliated investments companies | 19,937,039 |
| Net realized and unrealized gain (loss) | 9,426,949 |
| Net increase (decrease) in net assets resulting from operations | $ 24,701,305 |
| (a) | Represents a refund for overbilling of custody fees. |
The notes to the financial statements are an integral part of, and should be read in conjunction with, the financial statements.
| 56 | MainStay Growth Allocation Fund |
Statements of Changes in Net Assets
for the years ended October 31, 2023 and October 31, 2022
| | 2023 | 2022 |
| Increase (Decrease) in Net Assets |
| Operations: | | |
| Net investment income (loss) | $ 15,274,356 | $ 10,104,458 |
| Net realized gain (loss) | (10,510,090) | 60,089,271 |
| Net change in unrealized appreciation (depreciation) | 19,937,039 | (205,823,448) |
| Net increase (decrease) in net assets resulting from operations | 24,701,305 | (135,629,719) |
| Distributions to shareholders: | | |
| Class A | (42,482,199) | (73,904,222) |
| Investor Class | (6,720,364) | (11,530,594) |
| Class B | (930,924) | (2,637,375) |
| Class C | (1,187,696) | (2,609,494) |
| Class I | (631,052) | (800,931) |
| Class R1 | — | (6,054) |
| Class R2 | (5,399) | (9,226) |
| Class R3 | (68,391) | (167,463) |
| SIMPLE Class | (223,140) | (191,425) |
| Total distributions to shareholders | (52,249,165) | (91,856,784) |
| Capital share transactions: | | |
| Net proceeds from sales of shares | 58,830,977 | 65,486,668 |
| Net asset value of shares issued to shareholders in reinvestment of distributions | 52,068,829 | 91,464,910 |
| Cost of shares redeemed | (101,020,230) | (102,221,841) |
| Increase (decrease) in net assets derived from capital share transactions | 9,879,576 | 54,729,737 |
| Net increase (decrease) in net assets | (17,668,284) | (172,756,766) |
| Net Assets |
| Beginning of year | 752,293,534 | 925,050,300 |
| End of year | $ 734,625,250 | $ 752,293,534 |
The notes to the financial statements are an integral part of, and should be read in conjunction with, the financial statements.
57
Financial Highlights selected per share data and ratios
| | Year Ended October 31, |
| Class A | 2023 | | 2022 | | 2021 | | 2020 | | 2019 |
| Net asset value at beginning of year | $ 13.71 | | $ 17.89 | | $ 14.33 | | $ 14.40 | | $ 14.76 |
| Net investment income (loss) (a) | 0.28 | | 0.19 | | 0.16 | | 0.24 | | 0.22 |
| Net realized and unrealized gain (loss) | 0.14 | | (2.56) | | 4.22 | | 0.32 | | 0.77 |
| Total from investment operations | 0.42 | | (2.37) | | 4.38 | | 0.56 | | 0.99 |
| Less distributions: | | | | | | | | | |
| From net investment income | (0.13) | | (0.66) | | (0.17) | | (0.26) | | (0.28) |
| From net realized gain on investments | (0.83) | | (1.15) | | (0.65) | | (0.37) | | (1.07) |
| Total distributions | (0.96) | | (1.81) | | (0.82) | | (0.63) | | (1.35) |
| Net asset value at end of year | $ 13.17 | | $ 13.71 | | $ 17.89 | | $ 14.33 | | $ 14.40 |
| Total investment return (b) | 3.20% | | (14.90)% | | 31.45% | | 3.89% | | 8.17% |
| Ratios (to average net assets)/Supplemental Data: | | | | | | | | | |
| Net investment income (loss) | 2.02% | | 1.30% | | 0.98% | | 1.69% | | 1.55% |
| Net expenses (c) | 0.35% | | 0.35% | | 0.35% | | 0.37% | | 0.37% |
| Portfolio turnover rate | 27% | | 25% | | 29% | | 47% | | 42% |
| Net assets at end of year (in 000’s) | $ 603,146 | | $ 603,691 | | $ 728,402 | | $ 542,938 | | $ 545,586 |
| (a) | Per share data based on average shares outstanding during the year. |
| (b) | Total investment return is calculated exclusive of sales charges and assumes the reinvestment of dividends and distributions. For periods of less than one year, total return is not annualized. |
| (c) | In addition to the fees and expenses which the Fund bears directly, it also indirectly bears a pro-rata share of the fees and expenses of the underlying funds in which it invests. Such indirect expenses are not included in the above expense ratios. |
| | Year Ended October 31, |
| Investor Class | 2023 | | 2022 | | 2021 | | 2020 | | 2019 |
| Net asset value at beginning of year | $ 13.73 | | $ 17.91 | | $ 14.33 | | $ 14.40 | | $ 14.76 |
| Net investment income (loss) (a) | 0.25 | | 0.17 | | 0.14 | | 0.21 | | 0.18 |
| Net realized and unrealized gain (loss) | 0.15 | | (2.58) | | 4.22 | | 0.32 | | 0.79 |
| Total from investment operations | 0.40 | | (2.41) | | 4.36 | | 0.53 | | 0.97 |
| Less distributions: | | | | | | | | | |
| From net investment income | (0.11) | | (0.62) | | (0.13) | | (0.23) | | (0.26) |
| From net realized gain on investments | (0.83) | | (1.15) | | (0.65) | | (0.37) | | (1.07) |
| Total distributions | (0.94) | | (1.77) | | (0.78) | | (0.60) | | (1.33) |
| Net asset value at end of year | $ 13.19 | | $ 13.73 | | $ 17.91 | | $ 14.33 | | $ 14.40 |
| Total investment return (b) | 2.97% | | (15.05)% | | 31.27% | | 3.70% | | 7.94% |
| Ratios (to average net assets)/Supplemental Data: | | | | | | | | | |
| Net investment income (loss) | 1.84% | | 1.11% | | 0.82% | | 1.54% | | 1.32% |
| Net expenses (c) | 0.55% | | 0.55% | | 0.55% | | 0.55% | | 0.55% |
| Expenses (before waiver/reimbursement) (c) | 0.69% | | 0.60% | | 0.68% | | 0.67% | | 0.68% |
| Portfolio turnover rate | 27% | | 25% | | 29% | | 47% | | 42% |
| Net assets at end of year (in 000's) | $ 92,321 | | $ 99,449 | | $ 122,265 | | $ 126,514 | | $ 139,892 |
| (a) | Per share data based on average shares outstanding during the year. |
| (b) | Total investment return is calculated exclusive of sales charges and assumes the reinvestment of dividends and distributions. For periods of less than one year, total return is not annualized. |
| (c) | In addition to the fees and expenses which the Fund bears directly, it also indirectly bears a pro-rata share of the fees and expenses of the underlying funds in which it invests. Such indirect expenses are not included in the above expense ratios. |
The notes to the financial statements are an integral part of, and should be read in conjunction with, the financial statements.
| 58 | MainStay Growth Allocation Fund |
Financial Highlights selected per share data and ratios
| | Year Ended October 31, |
| Class B | 2023 | | 2022 | | 2021 | | 2020 | | 2019 |
| Net asset value at beginning of year | $ 13.46 | | $ 17.59 | | $ 14.10 | | $ 14.16 | | $ 14.50 |
| Net investment income (loss) (a) | 0.15 | | 0.06 | | 0.02 | | 0.12 | | 0.10 |
| Net realized and unrealized gain (loss) | 0.14 | | (2.54) | | 4.14 | | 0.30 | | 0.76 |
| Total from investment operations | 0.29 | | (2.48) | | 4.16 | | 0.42 | | 0.86 |
| Less distributions: | | | | | | | | | |
| From net investment income | — | | (0.50) | | (0.02) | | (0.11) | | (0.13) |
| From net realized gain on investments | (0.83) | | (1.15) | | (0.65) | | (0.37) | | (1.07) |
| Total distributions | (0.83) | | (1.65) | | (0.67) | | (0.48) | | (1.20) |
| Net asset value at end of year | $ 12.92 | | $ 13.46 | | $ 17.59 | | $ 14.10 | | $ 14.16 |
| Total investment return (b) | 2.20% | | (15.70)% | | 30.24% | | 2.97% | | 7.14% |
| Ratios (to average net assets)/Supplemental Data: | | | | | | | | | |
| Net investment income (loss) | 1.13% | | 0.37% | | 0.11% | | 0.87% | | 0.73% |
| Net expenses (c) | 1.30% | | 1.30% | | 1.30% | | 1.30% | | 1.30% |
| Expenses (before waiver/reimbursement) (c) | 1.44% | | 1.35% | | 1.43% | | 1.42% | | 1.42% |
| Portfolio turnover rate | 27% | | 25% | | 29% | | 47% | | 42% |
| Net assets at end of year (in 000’s) | $ 9,587 | | $ 16,753 | | $ 30,461 | | $ 32,739 | | $ 43,800 |
| (a) | Per share data based on average shares outstanding during the year. |
| (b) | Total investment return is calculated exclusive of sales charges and assumes the reinvestment of dividends and distributions. For periods of less than one year, total return is not annualized. |
| (c) | In addition to the fees and expenses which the Fund bears directly, it also indirectly bears a pro-rata share of the fees and expenses of the underlying funds in which it invests. Such indirect expenses are not included in the above expense ratios. |
| | Year Ended October 31, |
| Class C | 2023 | | 2022 | | 2021 | | 2020 | | 2019 |
| Net asset value at beginning of year | $ 13.46 | | $ 17.59 | | $ 14.10 | | $ 14.16 | | $ 14.50 |
| Net investment income (loss) (a) | 0.15 | | 0.05 | | 0.02 | | 0.11 | | 0.10 |
| Net realized and unrealized gain (loss) | 0.14 | | (2.53) | | 4.14 | | 0.31 | | 0.76 |
| Total from investment operations | 0.29 | | (2.48) | | 4.16 | | 0.42 | | 0.86 |
| Less distributions: | | | | | | | | | |
| From net investment income | — | | (0.50) | | (0.02) | | (0.11) | | (0.13) |
| From net realized gain on investments | (0.83) | | (1.15) | | (0.65) | | (0.37) | | (1.07) |
| Total distributions | (0.83) | | (1.65) | | (0.67) | | (0.48) | | (1.20) |
| Net asset value at end of year | $ 12.92 | | $ 13.46 | | $ 17.59 | | $ 14.10 | | $ 14.16 |
| Total investment return (b) | 2.19% | | (15.70)% | | 30.23% | | 2.97% | | 7.14% |
| Ratios (to average net assets)/Supplemental Data: | | | | | | | | | |
| Net investment income (loss) | 1.11% | | 0.36% | | 0.09% | | 0.81% | | 0.76% |
| Net expenses (c) | 1.30% | | 1.30% | | 1.30% | | 1.30% | | 1.30% |
| Expenses (before waiver/reimbursement) (c) | 1.44% | | 1.35% | | 1.43% | | 1.42% | | 1.42% |
| Portfolio turnover rate | 27% | | 25% | | 29% | | 47% | | 42% |
| Net assets at end of year (in 000’s) | $ 14,669 | | $ 20,272 | | $ 29,440 | | $ 31,564 | | $ 36,721 |
| (a) | Per share data based on average shares outstanding during the year. |
| (b) | Total investment return is calculated exclusive of sales charges and assumes the reinvestment of dividends and distributions. For periods of less than one year, total return is not annualized. |
| (c) | In addition to the fees and expenses which the Fund bears directly, it also indirectly bears a pro-rata share of the fees and expenses of the underlying funds in which it invests. Such indirect expenses are not included in the above expense ratios. |
The notes to the financial statements are an integral part of, and should be read in conjunction with, the financial statements.
59
Financial Highlights selected per share data and ratios
| | Year Ended October 31, |
| Class I | 2023 | | 2022 | | 2021 | | 2020 | | 2019 |
| Net asset value at beginning of year | $ 13.93 | | $ 18.15 | | $ 14.52 | | $ 14.58 | | $ 14.94 |
| Net investment income (loss) (a) | 0.32 | | 0.23 | | 0.21 | | 0.31 | | 0.25 |
| Net realized and unrealized gain (loss) | 0.14 | | (2.60) | | 4.27 | | 0.30 | | 0.78 |
| Total from investment operations | 0.46 | | (2.37) | | 4.48 | | 0.61 | | 1.03 |
| Less distributions: | | | | | | | | | |
| From net investment income | (0.17) | | (0.70) | | (0.20) | | (0.30) | | (0.32) |
| From net realized gain on investments | (0.83) | | (1.15) | | (0.65) | | (0.37) | | (1.07) |
| Total distributions | (1.00) | | (1.85) | | (0.85) | | (0.67) | | (1.39) |
| Net asset value at end of year | $ 13.39 | | $ 13.93 | | $ 18.15 | | $ 14.52 | | $ 14.58 |
| Total investment return (b) | 3.42% | | (14.68)% | | 31.82% | | 4.16% | | 8.40% |
| Ratios (to average net assets)/Supplemental Data: | | | | | | | | | |
| Net investment income (loss) | 2.33% | | 1.51% | | 1.23% | | 2.18% | | 1.74% |
| Net expenses (c) | 0.10% | | 0.10% | | 0.10% | | 0.11% | | 0.13% |
| Portfolio turnover rate | 27% | | 25% | | 29% | | 47% | | 42% |
| Net assets at end of year (in 000’s) | $ 9,104 | | $ 7,974 | | $ 11,142 | | $ 8,063 | | $ 11,037 |
| (a) | Per share data based on average shares outstanding during the year. |
| (b) | Total investment return is calculated exclusive of sales charges and assumes the reinvestment of dividends and distributions. Class I shares are not subject to sales charges. For periods of less than one year, total return is not annualized. |
| (c) | In addition to the fees and expenses which the Fund bears directly, it also indirectly bears a pro-rata share of the fees and expenses of the underlying funds in which it invests. Such indirect expenses are not included in the above expense ratios. |
| | Year Ended October 31, | | June 14, 2019^ through
October 31,
2019 |
| Class R2 | 2023 | | 2022 | | 2021 | | 2020 | |
| Net asset value at beginning of period | $ 13.70 | | $ 17.88 | | $ 14.32 | | $ 14.40 | | $ 13.82 |
| Net investment income (loss) (a) | 0.27 | | 0.18 | | 0.15 | | 0.25 | | 0.04 |
| Net realized and unrealized gain (loss) | 0.14 | | (2.57) | | 4.21 | | 0.29 | | 0.54 |
| Total from investment operations | 0.41 | | (2.39) | | 4.36 | | 0.54 | | 0.58 |
| Less distributions: | | | | | | | | | |
| From net investment income | (0.12) | | (0.64) | | (0.15) | | (0.25) | | — |
| From net realized gain on investments | (0.83) | | (1.15) | | (0.65) | | (0.37) | | — |
| Total distributions | (0.95) | | (1.79) | | (0.80) | | (0.62) | | — |
| Net asset value at end of period | $ 13.16 | | $ 13.70 | | $ 17.88 | | $ 14.32 | | $ 14.40 |
| Total investment return (b) | 3.08% | | (14.99)% | | 31.34% | | 3.75% | | 4.20% |
| Ratios (to average net assets)/Supplemental Data: | | | | | | | | | |
| Net investment income (loss) | 1.96% | | 1.20% | | 0.90% | | 1.79% | | 0.68%†† |
| Net expenses (c) | 0.45% | | 0.45% | | 0.45% | | 0.47% | | 0.49%†† |
| Portfolio turnover rate | 27% | | 25% | | 29% | | 47% | | 42% |
| Net assets at end of period (in 000’s) | $ 61 | | $ 78 | | $ 92 | | $ 89 | | $ 130 |
| ^ | Inception date. |
| †† | Annualized. |
| (a) | Per share data based on average shares outstanding during the period. |
| (b) | Total investment return is calculated exclusive of sales charges and assumes the reinvestment of dividends and distributions. Class R2 shares are not subject to sales charges. For periods of less than one year, total return is not annualized. |
| (c) | In addition to the fees and expenses which the Fund bears directly, it also indirectly bears a pro-rata share of the fees and expenses of the underlying funds in which it invests. Such indirect expenses are not included in the above expense ratios. |
The notes to the financial statements are an integral part of, and should be read in conjunction with, the financial statements.
| 60 | MainStay Growth Allocation Fund |
Financial Highlights selected per share data and ratios
| | Year Ended October 31, |
| Class R3 | 2023 | | 2022 | | 2021 | | 2020 | | 2019 |
| Net asset value at beginning of year | $ 13.62 | | $ 17.78 | | $ 14.24 | | $ 14.33 | | $ 14.68 |
| Net investment income (loss) (a) | 0.23 | | 0.15 | | 0.10 | | 0.20 | | 0.12 |
| Net realized and unrealized gain (loss) | 0.14 | | (2.56) | | 4.20 | | 0.31 | | 0.83 |
| Total from investment operations | 0.37 | | (2.41) | | 4.30 | | 0.51 | | 0.95 |
| Less distributions: | | | | | | | | | |
| From net investment income | (0.08) | | (0.60) | | (0.11) | | (0.23) | | (0.23) |
| From net realized gain on investments | (0.83) | | (1.15) | | (0.65) | | (0.37) | | (1.07) |
| Total distributions | (0.91) | | (1.75) | | (0.76) | | (0.60) | | (1.30) |
| Net asset value at end of year | $ 13.08 | | $ 13.62 | | $ 17.78 | | $ 14.24 | | $ 14.33 |
| Total investment return (b) | 2.82% | | (15.18)% | | 30.99% | | 3.53% | | 7.81% |
| Ratios (to average net assets)/Supplemental Data: | | | | | | | | | |
| Net investment income (loss) | 1.68% | | 1.00% | | 0.60% | | 1.43% | | 0.90% |
| Net expenses (c) | 0.70% | | 0.70% | | 0.70% | | 0.72% | | 0.73% |
| Portfolio turnover rate | 27% | | 25% | | 29% | | 47% | | 42% |
| Net assets at end of year (in 000’s) | $ 914 | | $ 1,004 | | $ 1,622 | | $ 1,084 | | $ 1,262 |
| (a) | Per share data based on average shares outstanding during the year. |
| (b) | Total investment return is calculated exclusive of sales charges and assumes the reinvestment of dividends and distributions. Class R3 shares are not subject to sales charges. For periods of less than one year, total return is not annualized. |
| (c) | In addition to the fees and expenses which the Fund bears directly, it also indirectly bears a pro-rata share of the fees and expenses of the underlying funds in which it invests. Such indirect expenses are not included in the above expense ratios. |
| | Year Ended October 31, | | August 31, 2020^ through
October 31, |
| SIMPLE Class | 2023 | | 2022 | | 2021 | | 2020 |
| Net asset value at beginning of period | $ 13.71 | | $ 17.89 | | $ 14.33 | | $ 15.03* |
| Net investment income (loss) (a) | 0.22 | | 0.12 | | 0.06 | | 0.02 |
| Net realized and unrealized gain (loss) | 0.16 | | (2.57) | | 4.25 | | (0.72) |
| Total from investment operations | 0.38 | | (2.45) | | 4.31 | | (0.70) |
| Less distributions: | | | | | | | |
| From net investment income | (0.07) | | (0.58) | | (0.10) | | — |
| From net realized gain on investments | (0.83) | | (1.15) | | (0.65) | | — |
| Total distributions | (0.90) | | (1.73) | | (0.75) | | — |
| Net asset value at end of period | $ 13.19 | | $ 13.71 | | $ 17.89 | | $ 14.33 |
| Total investment return (b) | 2.84% | | (15.29)% | | 30.89% | | (4.66)% |
| Ratios (to average net assets)/Supplemental Data: | | | | | | | |
| Net investment income (loss) | 1.62% | | 0.79% | | 0.37% | | 0.80%†† |
| Net expenses (c) | 0.70% | | 0.80% | | 0.80% | | 0.80%†† |
| Expenses (before waiver/reimbursement) (c) | 0.70% | | 0.85% | | 0.93% | | 0.95%†† |
| Portfolio turnover rate | 27% | | 25% | | 29% | | 47% |
| Net assets at end of period (in 000’s) | $ 4,822 | | $ 3,072 | | $ 1,567 | | $ 180 |
| ^ | Inception date. |
| * | Based on the net asset value of Investor Class as of August 31, 2020. |
| †† | Annualized. |
| (a) | Per share data based on average shares outstanding during the period. |
| (b) | Total investment return is calculated exclusive of sales charges and assumes the reinvestment of dividends and distributions. SIMPLE Class shares are not subject to sales charges. For periods of less than one year, total return is not annualized. |
| (c) | In addition to the fees and expenses which the Fund bears directly, it also indirectly bears a pro-rata share of the fees and expenses of the underlying funds in which it invests. Such indirect expenses are not included in the above expense ratios. |
The notes to the financial statements are an integral part of, and should be read in conjunction with, the financial statements.
61
MainStay Equity Allocation Fund
Investment and Performance Comparison (Unaudited)
Performance data quoted represents past performance. Past performance is no guarantee of future results. Because of market volatility and other factors, current performance may be lower or higher than the figures shown. Investment return and principal value will fluctuate, and as a result, when shares are redeemed, they may be worth more or less than their original cost. The graph below depicts the historical performance of Class I shares of the Fund. Performance will vary from class to class based on differences in class-specific expenses and sales charges. For performance information current to the most recent month-end, please call 800-624-6782 or visit newyorklifeinvestments.com.
The performance table and graph do not reflect the deduction of taxes that a shareholder would pay on distributions or Fund share redemptions. Total returns reflect maximum applicable sales charges as indicated in the table below, if any, changes in share price, and reinvestment of dividend and capital gain distributions. The graph assumes the initial investment amount shown below and reflects the deduction of all sales charges that would have applied for the period of investment. Performance figures may reflect certain fee waivers and/or expense limitations, without which total returns may have been lower. For more information on share classes and current fee waivers and/or expense limitations (if any), please refer to the Notes to Financial Statements.
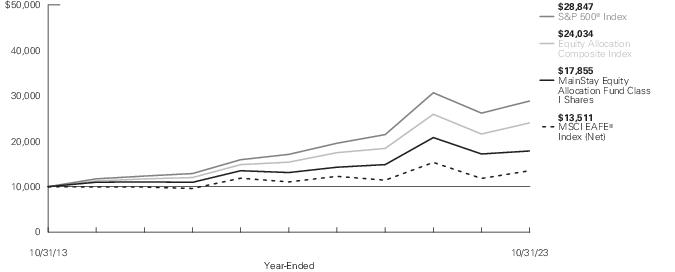
| Average Annual Total Returns for the Year-Ended October 31, 2023 |
| Class | Sales Charge | | Inception
Date | One
Year | Five
Years | Ten Years
or Since
Inception | Gross
Expense
Ratio1 |
| Class A Shares2 | Maximum 3.00% Initial Sales Charge | With sales charges | 4/4/2005 | 0.49% | 4.92% | 5.11% | 0.92% |
| | | Excluding sales charges | | 3.60 | 6.11 | 5.71 | 0.92 |
| Investor Class Shares2, 3 | Maximum 2.50% Initial Sales Charge | With sales charges | 2/28/2008 | 0.82 | 4.74 | 4.93 | 1.18 |
| | | Excluding sales charges | | 3.41 | 5.93 | 5.53 | 1.18 |
| Class B Shares4 | Maximum 5.00% CDSC | With sales charges | 4/4/2005 | -2.01 | 4.86 | 4.75 | 1.93 |
| | if Redeemed Within the First Six Years of Purchase | Excluding sales charges | | 2.65 | 5.14 | 4.75 | 1.93 |
| Class C Shares | Maximum 1.00% CDSC | With sales charges | 4/4/2005 | 1.71 | 5.15 | 4.75 | 1.93 |
| | if Redeemed Within One Year of Purchase | Excluding sales charges | | 2.64 | 5.15 | 4.75 | 1.93 |
| Class I Shares | No Sales Charge | | 4/4/2005 | 3.80 | 6.37 | 5.97 | 0.67 |
| Class R3 Shares5 | No Sales Charge | | 2/29/2016 | 3.30 | 5.74 | 7.41 | 1.27 |
| SIMPLE Class Shares | No Sales Charge | | 8/31/2020 | 3.19 | N/A | 3.47 | 1.31 |
| 1. | The gross expense ratios presented reflect the Fund’s “Total Annual Fund Operating Expenses” from the most recent Prospectus, as supplemented, and may differ from other expense ratios disclosed in this report. |
| 2. | Prior to July 22, 2019, the maximum initial sales charge applicable was 5.50%, which is reflected in the applicable average annual total return figures shown. |
| 3. | Prior to June 30, 2020, the maximum initial sales charge was 3.00%, which is reflected in the applicable average annual total return figures shown. |
| 4. | Class B shares are closed to all new purchases as well as additional investments by existing Class B shareholders. |
| 5. | As of October 31, 2023, Class R3 shares are closed to new investors and, upon the close of business on December 29, 2023, Class R3 shares are closed to additional investments by existing shareholders. Additionally, Class R3 shares will be liquidated on or about February 28, 2024 (the "Liquidation Date"). It is expected that the Fund will distribute to remaining shareholders invested in Class R3 shares, on or promptly after the Liquidation Date, a liquidating distribution in cash or cash equivalents equal to the net asset value of such shares. |
The footnotes on the next page are an integral part of the table and graph and should be carefully read in conjunction with them.
| 62 | MainStay Equity Allocation Fund |
| Benchmark Performance* | One
Year | Five
Years | Ten
Years |
| S&P 500® Index1 | 10.14% | 11.01% | 11.18% |
| MSCI EAFE® Index (Net)2 | 14.40 | 4.10 | 3.05 |
| Equity Allocation Composite Index3 | 11.30 | 9.31 | 9.16 |
| Morningstar Aggressive Allocation Category Average4 | 4.49 | 5.93 | 6.20 |
| * | Returns for indices reflect no deductions for fees, expenses or taxes, except for foreign withholding taxes where applicable. Results assume reinvestment of all dividends and capital gains. An investment cannot be made directly in an index. |
| 1. | The S&P 500® Index is the Fund's primary benchmark. S&P 500® is a trademark of The McGraw-Hill Companies, Inc. The S&P 500® Index is widely regarded as the standard index for measuring large-cap U.S. stock market performance. |
| 2. | The MSCI EAFE® Index (Net) is the Fund's secondary benchmark. The MSCI EAFE® Index (Net) consists of international stocks representing the developed world outside
of North America. |
| 3. | The Fund has selected the Equity Allocation Composite Index as an additional benchmark. Effective February 28, 2014, the Equity Allocation Composite Index consists of the S&P 500®Index and the MSCI EAFE® Index weighted 75% and 25%, respectively. Prior to February 28, 2014, the Equity Allocation Composite Index consisted of the S&P 500® Index and the MSCI EAFE® Index weighted 80% and 20%, respectively. |
| 4. | The Morningstar Aggressive Allocation Category Average is representative of funds in allocation categories that seek to provide both income and capital appreciation by primarily investing in multiple asset classes, including stocks, bonds, and cash. These aggressive strategies typically allocate at least 10% to equities of foreign companies and prioritize capital appreciation over preservation. They typically expect volatility similar to a strategic equity exposure of more than 85%. Results are based on average total returns of similar funds with all dividends and capital gain distributions reinvested. |
The footnotes on the preceding page are an integral part of the table and graph and should be carefully read in conjunction with them.
Cost in Dollars of a $1,000 Investment in MainStay Equity Allocation Fund (Unaudited)
The example below is intended to describe the fees and expenses borne by shareholders during the six-month period from May 1, 2023 to October 31, 2023, and the impact of those costs on your investment.
Example
As a shareholder of the Fund you incur two types of costs: (1) transaction costs, including exchange fees and sales charges (loads) on purchases (as applicable), and (2) ongoing costs, including management fees, distribution and/or service (12b-1) fees and other Fund expenses (as applicable). This example is intended to help you understand your ongoing costs (in dollars) of investing in the Fund and to compare these costs with the ongoing costs of investing in other mutual funds. The example is based on an investment of $1,000 made at the beginning of the six-month period and held for the entire period from May 1, 2023 to October 31, 2023.
This example illustrates your Fund’s ongoing costs in two ways:
Actual Expenses
The second and third data columns in the table below provide information about actual account values and actual expenses. You may use the information in these columns, together with the amount you invested, to estimate the expenses that you paid during the six months ended October 31, 2023. Simply divide your account value by $1,000 (for example, an
$8,600 account value divided by $1,000 = 8.6), then multiply the result by the number under the heading entitled “Expenses Paid During Period” to estimate the expenses you paid on your account during this period.
Hypothetical Example for Comparison Purposes
The fourth and fifth data columns in the table below provide information about hypothetical account values and hypothetical expenses based on the Fund’s actual expense ratio and an assumed rate of return of 5% per year before expenses, which is not the Fund’s actual return. The hypothetical account values and expenses may not be used to estimate the actual ending account balances or expenses you paid for the six-month period shown. You may use this information to compare the ongoing costs of investing in the Fund with the ongoing costs of investing in other mutual funds. To do so, compare this 5% hypothetical example with the 5% hypothetical examples that appear in the shareholder reports of the other mutual funds.
Please note that the expenses shown in the table are meant to highlight your ongoing costs only and do not reflect any transactional costs, such as exchange fees or sales charges (loads). Therefore, the fourth and fifth data columns of the table are useful in comparing ongoing costs only and will not help you determine the relative total costs of owning different funds. In addition, if these transactional costs were included, your costs would have been higher.
| Share Class | Beginning
Account
Value
5/1/23 | Ending Account
Value (Based
on Actual
Returns and
Expenses)
10/31/23 | Expenses
Paid
During
Period1 | Ending Account
Value (Based
on Hypothetical
5% Annualized
Return and
Actual Expenses)
10/31/23 | Expenses
Paid
During
Period1 | Net Expense
Ratio
During
Period2 |
| Class A Shares | $1,000.00 | $974.80 | $1.94 | $1,023.24 | $1.99 | 0.39% |
| Investor Class Shares | $1,000.00 | $973.40 | $2.74 | $1,022.43 | $2.80 | 0.55% |
| Class B Shares | $1,000.00 | $970.00 | $6.46 | $1,018.65 | $6.61 | 1.30% |
| Class C Shares | $1,000.00 | $969.40 | $6.45 | $1,018.65 | $6.61 | 1.30% |
| Class I Shares | $1,000.00 | $975.40 | $0.70 | $1,024.50 | $0.71 | 0.14% |
| Class R3 Shares | $1,000.00 | $973.10 | $3.68 | $1,021.47 | $3.77 | 0.74% |
| SIMPLE Class Shares | $1,000.00 | $971.90 | $3.88 | $1,021.27 | $3.97 | 0.78% |
| 1. | Expenses are equal to the Fund’s annualized expense ratio of each class multiplied by the average account value over the period, divided by 365 and multiplied by 184 (to reflect the six-month period). The table above represents the actual expenses incurred during the six-month period. In addition to the fees and expenses which the Fund bears directly, it also indirectly bears a pro rata share of the fees and expenses of the underlying funds in which it invests. Such indirect expenses are not included in the above-reported expense figures. |
| 2. | Expenses are equal to the Fund's annualized expense ratio to reflect the six-month period. |
| 64 | MainStay Equity Allocation Fund |
Asset Diversification as of October 31, 2023 (Unaudited)
| Equity Funds | 95.9% |
| Short-Term Investment | 3.8 |
| Other Assets, Less Liabilities | 0.3 |
See Portfolio of Investments beginning on page 69 for specific holdings within these categories. The Fund’s holdings are subject to change.
Portfolio Management Discussion and Analysis (Unaudited)
Questions answered by portfolio managers Jae S. Yoon, CFA, Jonathan Swaney, Poul Kristensen, CFA, and Amit Soni, CFA, of New York Life Investment Management LLC, the Fund’s Manager.
How did MainStay Equity Allocation Fund perform relative to its benchmarks and peer group during the 12 months ended October 31, 2023?
For the 12 months ended October 31, 2023, Class I shares of MainStay Equity Allocation Fund returned 3.80%, underperforming the 10.14% return of the Fund’s primary benchmark, the S&P 500® Index, and the 14.40% return of the MSCI EAFE® Index (Net), which is the Fund’s secondary benchmark. Over the same period, Class I shares of the Fund underperformed the 11.30% return of the Equity Allocation Composite Index, which is an additional benchmark of the Fund, and the 4.49% return of the Morningstar Aggressive Allocation Category Average.1
What factors affected the Fund’s relative performance during the reporting period?
The Fund is a “fund of funds,” meaning that it seeks to achieve its investment objective by investing primarily in mutual funds and exchange-traded funds (“ETFs”) managed by New York Life Investments or its affiliates (the “Underlying Funds”). The Underlying Funds may invest in U.S. equities, international equities and fixed-income instruments, making comparisons to any single index generally less suitable than a weighted combination of indices, which is a more useful yardstick by which to measure performance. The most influential factor affecting returns for the Fund during the reporting period (versus the performance of a weighted combination of indices) is the net performance of the Underlying Funds themselves, relative to their respective benchmarks. During the reporting period, asset class policy was the primary determinant of the Fund’s relative performance.
Fund management internally maintains a blend of indices that are taken into consideration when managing the Fund. During the reporting period, the Fund substantially underperformed this internally maintained blend of indices, primarily due to active positioning at the asset class level.
Management of the Fund’s aggregate equity exposure itself was not the primary issue affecting relative performance, as returns generated in the process of controlling that exposure were only marginally negative. We held the Fund’s equity allocation near neutral for much of the reporting period, but with a small bias toward holding underweight exposure to equities (meaning that the Fund was not fully invested, whereas the Index is a pure equity play). That posture proved a liability through the spring and early summer of 2023, as a handful of mega-cap technology-related equities drove the market higher. We gradually
removed the Fund’s underweight exposure to equities near the end of the reporting period. As a result, the Fund did not benefit materially when the market softened in late summer and into the fall.
Rather, the most significant factor undermining relative performance related to the Fund’s exposure to small-cap stocks, which detracted substantially from returns. Throughout the reporting period, relative valuations in the small-cap asset class were much more attractive than has been the historical norm, but small companies are significantly more sensitive to changes in bank financing conditions than are large companies that can issue bonds. Fast-rising costs on bank loans, coupled with concerns about future credit availability in the wake of the bank crisis in the early spring of 2023, weighed heavily on the smaller end of the capitalization spectrum. We promptly restored the Fund’s small-cap allocation to neutral as the nature and scope of the crisis became clear.
Relative performance also suffered from efforts to avoid undue exposure to a small group of market-leading, mega-cap, technology-related companies. Recently dubbed ‘the Magnificent 7’ (Alphabet, Amazon, Apple, Meta Platforms, Microsoft, NVIDIA, and Tesla), these firms are richly valued, implying rapid earnings growth in the coming years. We remain skeptical that such growth is likely to be achieved by these companies, which are already among the largest enterprises in the world, with dominant positions in their respective industries. Accordingly, we shifted Fund assets out of capitalization-weighted large-cap index products, favoring other options—most notably, an equally weighted version of the S&P 500® Index. During the reporting period, however, ongoing enthusiasm for the commercial potential of artificial intelligence (“AI”), and the degree to which the Magnificent 7 are expected to benefit from these developments, helped them maintain their leadership positions. During the reporting period, the Bloomberg Magnificent 7 Total Return Index2 returned approximately 65%, compared to a slightly negative return for the equally weighted S&P 500® Equal Weight Index.3
Tilts favoring defensive sectors, particularly health care, and low volatility stocks further detracted from the Fund’s relative performance. Basically, any skew in the Fund away from the sole winners of the reporting period—mega-cap tech-oriented companies—was a drag on relative results.
The Fund realized some positive results within equities. Tactical trading in gold miners, for example, proved helpful. The Fund also
| 1. | See "Investment and Performance Comparison" for other share class returns, which may be higher or lower than Class I share returns, and for more information on benchmark and peer group returns. |
| 2. | The Bloomberg Magnificent 7 Total Return Index is an equal-dollar weighted equity benchmark consisting of a fixed basket of 7 widely-traded companies classified in the United States and representing the Communications, Consumer Discretionary and Technology sectors as defined by Bloomberg Industry Classification System (BICS). An investment cannot be made directly in an index. |
| 3. | The S&P 500® Equal Weight Index (“EWI”) is the equal-weight version of the widely-used S&P 500® Index. The S&P 500® EWI includes the same constituents as the capitalization weighted S&P 500® Index, but each company in the S&P 500® EWI is allocated a fixed weight, or 0.2% of the Index total at each quarterly rebalance. An investment cannot be made directly in an index. |
| 66 | MainStay Equity Allocation Fund |
benefited from some swap positions, in which we pay the return (so are effectively “short”) on a set of highly leveraged companies that look especially vulnerable to higher borrowing costs and more restrictive lending standards. Exposure to uranium miners provided a small, but noticeable, positive contribution to returns as well. (Contributions take weightings and total returns into account.)
During the reporting period, how was the Fund’s performance materially affected by investments in derivatives?
Total return swaps were used to express most of the Fund’s asset class policy views. Therefore, the swaps can be seen as detracting from the Fund’s relative performance over the course of the reporting period.
How did you allocate the Fund’s assets during the reporting period and why?
Overall stock exposure: We held equity exposure within the Fund relatively close to neutral during the reporting period. We are generally reluctant to position the Fund with underweight equity exposure, as stocks tend to perform well over time and anticipating drawdowns is challenging. Nevertheless, we shifted the Fund’s equity position to slightly underweight following a sharp rally in January 2023, and enlarged the underweight posture a little further late in the spring when banking sector turmoil appeared to increase the likelihood of a recession. (The Fund has an underweight equity position when we build a cash balance rather than being fully invested, as is the Index.) As the recession failed to materialize, we gradually removed the underweight equity exposure over the course of the summer and into the fall.
Equity style: Growth stocks, by definition, exhibit richer valuations than value stocks. As a consequence, growth stock prices are relatively reliant on distant profits, and are often more sensitive to elevated inflation and higher interest rates than their value-oriented counterparts. Accordingly, given the high-rate environment that prevailed during the reporting period, we persistently tilted the Fund to emphasize value stocks that offered more substantial near-term cash flows. In particular, we focused on defensive, lower-volatility sectors, including utilities, consumer staples and—most of all—health care. This position undermined performance in 2023, as market performance was dominated by the aforementioned Magnificent 7—growth-oriented technology-related stocks swept by a wave of excitement over the prospects for generative AI.
Equity size: The Fund held overweight exposure to small-cap stocks during the first half of the reporting period. We based our thesis on several prevailing characteristics of the asset class: attractive valuations, insulation from economic weakness abroad, less sensitivity to dollar strength and disproportionate exposure to domestic demand, which thus far remains robust.
That position proved unconstructive during the spring of 2023, as small companies tend to be heavily dependent on bank financing, and banks aggressively tightened lending standards in the wake of the banking crisis that occurred in March and April. Accordingly, we unwound the Fund’s small-cap bias. However, it is important to note that the proceeds did not flow to large blend index exposure, where the Magnificent 7 dominate. Rather, the redirected assets went into the S&P 500® Equal Weight Index, where those seven names comprise less than 2% of that Index.
Geographic exposure: During the latter part of the reporting period, European equities appeared vulnerable. We expected that persistently high wage growth would compel the European Central Bank to maintain its restrictive monetary policies for an extended period of time while European export-heavy economies wrestled with declining global trade volumes. In addition, Europe appeared particularly exposed to potential energy price spikes amid elevated geopolitical tensions. On the other hand, the Bank of Japan remained engaged in accommodative policy, Japanese exports benefited from a weak yen, and Japanese companies increasingly prioritized shareholder governance, largely in the form of share buybacks. Given these divergent conditions, we tilted the Fund away from European markets in favor of Japanese stocks, while holding net exposure to non-US stocks close to neutral.
Energy: The Fund maintained exposure to upstream energy producers and oilfield/gas field service providers as a commodity play to provide an additional inflation hedge. These holdings also positioned the Fund to take advantage of opportunities for domestic producers to benefit as Western nations revisit energy policy to source supplies from stable and friendly jurisdictions rather than autocratic petrostates that present national security risks. The Fund’s small, but volatile, energy position detracted significantly from performance during the first half of the reporting period but fully recovered in the second half.
How did the Fund’s allocations change over the course of the reporting period?
In one of the more substantial changes in allocations undertaken during the reporting period, we reduced the Fund’s exposure to small-cap stocks, expressed via total return swaps. We took this action in response to the banking crisis that unfolded in the spring of 2023. We unwound the Fund’s swap exposure to VanEck Gold Miners ETF, taking profits and exiting a profitable trade on a high note. Lastly, we used swaps to tilt the Fund away from baskets of specific stocks that were either heavily dependent on floating-rate loans (such as Uber, United Airlines and Carnival) or that generated insufficient operating income to retire debt as it came due (so-called ‘zombie’ companies, such as Royal Caribbean, Wynn Resorts and Rivian Automotive). We believed these firms were especially vulnerable in an environment of fast-rising interest rates and tightening lending standards.
New or increased allocations included the establishment and growth of an allocation to Invesco S&P 500® Equal Weight ETF. We adopted this position to remove the Fund’s underweight exposure to equities without significantly increasing its exposure to the Magnificent 7 mega-cap technology-related names. We also initiated a new Fund position in iShares MSCI Japan ETF (via a swap), as we saw valuations as attractive, export conditions as favorable and the Japanese yen likely to appreciate should the Bank of Japan abandon its existing yield curve4 control policy. Another notable addition involved the establishment of exposure to Global X Uranium ETF, which invests primarily in uranium mining firms. Climate change concerns, net-zero commitments and the limitations of renewable energy are driving a reconsideration of nuclear energy, for which fuel supply is rather limited. We foresee a supply/demand imbalance developing that is likely to support businesses involved with extracting and processing uranium.
At the Underlying Fund level, we took advantage of a few new investment options, adopting positions in MainStay PineStone U.S. Equity Fund, IQ Candriam U.S. Mid Cap Equity ETF and MainStay Fiera SMID Growth Fund.
During the reporting period, which Underlying Equity Funds had the highest total returns and which had the lowest total returns?
The Fund’s top-performing Underlying Equity Funds that were held for the entire reporting period included MainStay Winslow Large Cap Growth Fund (and its sister product, IQ Winslow Large Cap Growth ETF), IQ 500 International ETF and MainStay Epoch Capital Growth Fund. The worst-performing positions included MainStay WMC Small Companies Fund, IQ U.S. Small Cap ETF and swap exposure to the S&P Small Cap 600® Index.5
Which Underlying Equity Funds were the strongest positive contributors to the Fund’s performance and which Underlying Equity Funds were particularly weak?
The strongest positive contributions to performance came from MainStay Winslow Large Cap Growth Fund, MainStay WMC Growth Fund and IQ Candriam U.S. Large Cap Equity ETF. The direct fund holdings detracting most significantly from returns included IQ Candriam U.S. Mid Cap Equity ETF, MainStay WMC Small Companies Fund and IQ U.S. Small Cap ETF. Losses were greater in some swap positions in which we paid the return to
iShares MSCI EAFE Index, the Russell 1000® Growth Index and the S&P 500® Equal Weight Index.
How was the Fund positioned at the end of the reporting period?
For some time now, we have held the view that a recession in response to dramatic monetary policy tightening and the expiration of pandemic-era support programs is all but inevitable. This remains the case today, and indications of the onset of said recession are beginning to accumulate. We firmly expect corporate profits to decline over the next several quarters, eventually taking stock prices down with them, while also driving down Treasury yields and pushing credit spreads6 out. Accordingly, as of October 31, 2023, the Fund maintains a relatively defensive posture.
Given the difficulty in predicting a market top, we are resistant to holding an underweight position in equities. As such, we are maintaining a neutral position for the Fund at this time, although we intend to exploit any significant pullbacks - should they arise - by building an oversight position.
The Fund’s defensive positioning is more evident within equities. The Fund favors sectors that have generally exhibited lower volatility and retained their value better during drawdowns. Prominent among these are utilities and health care. We have also skewed the Fund away from a set of highly leveraged companies deemed to be especially vulnerable to a tightening credit environment.
| 4. | The yield curve is a line that plots the yields of various securities of similar quality—typically U.S. Treasury issues—across a range of maturities. The U.S. Treasury yield curve serves as a benchmark for other debt and is used in economic forecasting. |
| 5. | The S&P Small Cap 600™ Index covers roughly the small-cap range of American stocks, using a capitalization-weighted index. Capitalization range is from $850 million to $3.7 billion. An investment cannot be made directly in an index. |
| 6. | The terms “spread” and “yield spread” may refer to the difference in yield between a security or type of security and comparable U.S. Treasury issues. The terms may also refer to the difference in yield between two specific securities or types of securities at a given time. The term “credit spread” typically refers to the difference in yield between corporate or municipal bonds (or a specific category of these bonds) comparable to U.S. Treasury issues. |
The opinions expressed are those of the portfolio managers as of the date of this report and are subject to change. There is no guarantee that any forecasts will come to pass. This material does not constitute investment advice and is not intended as an endorsement of any specific investment.
| 68 | MainStay Equity Allocation Fund |
Portfolio of Investments October 31, 2023†^
| | Shares | Value |
| Affiliated Investment Companies 95.9% |
| Equity Funds 95.9% |
| IQ 500 International ETF (a) | 529,632 | $ 15,692,519 |
| IQ Candriam International Equity ETF (a) | 620,407 | 15,465,878 |
| IQ Candriam U.S. Large Cap Equity ETF (a) | 732,720 | 26,861,662 |
| IQ Candriam U.S. Mid Cap Equity ETF (a) | 788,229 | 19,698,000 |
| IQ FTSE International Equity Currency Neutral ETF | 349,015 | 7,866,798 |
| IQ U.S. Large Cap ETF (a) | 841,689 | 26,542,747 |
| IQ U.S. Small Cap ETF (a) | 650,831 | 19,192,876 |
| IQ Winslow Large Cap Growth ETF (a) | 98,661 | 3,023,230 |
| MainStay Candriam Emerging Markets Equity Fund Class R6 (a) | 2,291,100 | 19,293,121 |
| MainStay Epoch Capital Growth Fund Class I | 116,916 | 1,407,693 |
| MainStay Epoch International Choice Fund Class I (a) | 362,836 | 12,766,908 |
| MainStay Epoch U.S. Equity Yield Fund Class R6 (a) | 1,450,590 | 26,821,852 |
| MainStay Fiera SMID Growth Fund Class R6 (a) | 807,645 | 11,408,627 |
| MainStay PineStone International Equity Fund Class R6 (a) | 941,040 | 12,787,321 |
| MainStay PineStone U.S. Equity Fund Class R6 (a) | 500,821 | 7,798,679 |
| MainStay S&P 500 Index Fund Class I | 126,673 | 6,264,278 |
| MainStay Winslow Large Cap Growth Fund Class R6 | 2,802,172 | 28,020,035 |
| MainStay WMC Enduring Capital Fund Class R6 (a) | 840,474 | 25,298,363 |
| | Shares | | Value |
| |
| Equity Funds (continued) |
| MainStay WMC Growth Fund Class R6 (a) | 819,443 | | $ 29,550,346 |
| MainStay WMC International Research Equity Fund Class I (a) | 1,953,031 | | 12,835,905 |
| MainStay WMC Small Companies Fund Class I (a) | 1,022,233 | | 19,173,518 |
| MainStay WMC Value Fund Class R6 (a) | 903,996 | | 25,333,220 |
Total Affiliated Investment Companies
(Cost $345,261,240) | | | 373,103,576 |
| Short-Term Investment 3.8% |
| Affiliated Investment Company 3.8% |
| MainStay U.S. Government Liquidity Fund, 5.275% (b) | 14,633,575 | | 14,633,575 |
Total Short-Term Investment
(Cost $14,633,575) | 3.8% | | 14,633,575 |
Total Investments
(Cost $359,894,815) | 99.7% | | 387,737,151 |
| Other Assets, Less Liabilities | 0.3 | | 1,133,107 |
| Net Assets | 100.0% | | $ 388,870,258 |
| † | Percentages indicated are based on Fund net assets. |
| ^ | Industry classifications may be different than those used for compliance monitoring purposes. |
| (a) | As of October 31, 2023, the Fund's ownership exceeds 5% of the outstanding shares of the Underlying Fund's share class. |
| (b) | Current yield as of October 31, 2023. |
The notes to the financial statements are an integral part of, and should be read in conjunction with, the financial statements.
69
Portfolio of Investments October 31, 2023†^ (continued)
Investments in Affiliates (in 000's)
Investments in issuers considered to be affiliate(s) of the Fund during the year ended October 31, 2023 for purposes of Section 2(a)(3) of the Investment Company Act of 1940, as amended, were as follows:
| Affiliated Investment Companies | Value,
Beginning
of Year | Purchases
at Cost | Proceeds
from
Sales | Net
Realized
Gain/(Loss)
on Sales | Change in
Unrealized
Appreciation/
(Depreciation) | Value,
End of
Year | Dividend
Income | Other
Distributions | Shares
End of
Year |
| IQ 500 International ETF | $ 15,454 | $ 1,171 | $ (3,086) | $ 185 | $ 1,969 | $ 15,693 | $ 601 | $ — | 530 |
| IQ Candriam International Equity ETF | 15,410 | 1,135 | (2,818) | (327) | 2,066 | 15,466 | 487 | — | 620 |
| IQ Candriam U.S. Large Cap Equity ETF | 31,827 | 1,665 | (10,735) | 1,805 | 2,299 | 26,861 | 450 | — | 733 |
| IQ Candriam U.S. Mid Cap Equity ETF | — | 21,923 | — | — | (2,225) | 19,698 | 67 | — | 788 |
| IQ FTSE International Equity Currency Neutral ETF | 7,751 | 416 | (1,110) | 61 | 749 | 7,867 | 181 | 147 | 349 |
| IQ U.S. Large Cap ETF | 29,891 | 794 | (4,613) | (187) | 658 | 26,543 | 499 | — | 842 |
| IQ U.S. Small Cap ETF | 28,988 | 3,766 | (11,508) | (664) | (1,389) | 19,193 | 411 | — | 651 |
| IQ Winslow Large Cap Growth ETF | 1,389 | 1,163 | — | — | 471 | 3,023 | 1 | — | 99 |
| MainStay Candriam Emerging Markets Equity Fund Class R6 | 18,022 | 2,122 | (1,122) | (420) | 691 | 19,293 | 219 | — | 2,291 |
| MainStay Epoch Capital Growth Fund Class I | 1,366 | 25 | (182) | (27) | 226 | 1,408 | 6 | 14 | 117 |
| MainStay Epoch International Choice Fund Class I | 12,913 | 983 | (2,744) | 406 | 1,209 | 12,767 | 173 | — | 363 |
| MainStay Epoch U.S. Equity Yield Fund Class R6 | 30,622 | 3,104 | (6,269) | 172 | (807) | 26,822 | 728 | 455 | 1,451 |
| MainStay Fiera SMID Growth Fund Class R6 | — | 12,421 | — | — | (1,012) | 11,409 | — | — | 808 |
| MainStay MacKay International Equity Fund Class R6 | 12,410 | 1,343 | (14,087) | (1,133) | 1,467 | — | 121 | — | — |
| MainStay PineStone International Equity Fund Class R6 (a) | — | 13,671 | — | — | (884) | 12,787 | — | — | 941 |
| MainStay PineStone U.S. Equity Fund Class R6 | — | 8,167 | — | — | (368) | 7,799 | — | — | 501 |
| MainStay S&P 500 Index Fund Class I | 5,864 | 694 | (324) | 13 | 17 | 6,264 | 82 | 467 | 127 |
| MainStay U.S. Government Liquidity Fund | 14,588 | 43,480 | (43,435) | — | — | 14,633 | 664 | — | 14,634 |
| MainStay Winslow Large Cap Growth Fund Class R6 | 30,182 | 3,533 | (8,150) | (253) | 2,708 | 28,020 | 70 | 3,372 | 2,802 |
| MainStay WMC Enduring Capital Fund Class R6 | 29,202 | 1,836 | (5,886) | (642) | 788 | 25,298 | 172 | 1,063 | 840 |
| MainStay WMC Growth Fund Class R6 | 31,218 | 2,638 | (9,502) | (4,140) | 9,336 | 29,550 | — | — | 819 |
| MainStay WMC International Research Equity Fund Class I | 12,657 | 1,100 | (2,250) | (194) | 1,523 | 12,836 | 271 | — | 1,953 |
| MainStay WMC Small Companies Fund Class I | 29,059 | 5,077 | (11,012) | (2,585) | (1,365) | 19,174 | 635 | — | 1,022 |
| MainStay WMC Value Fund Class R6 | 30,075 | 2,842 | (5,632) | (121) | (1,831) | 25,333 | 504 | 1,142 | 904 |
| | $ 388,888 | $135,069 | $(144,465) | $(8,051) | $ 16,296 | $ 387,737 | $6,342 | $6,660 | |
| | |
| (a) | As of September 8, 2023, the Fund exchanged in a nontaxable transfer of all shares of the MainStay MacKay International Equity Fund Class R6 into the newly launched MainStay PineStone International Equity Fund Class R6. |
The notes to the financial statements are an integral part of, and should be read in conjunction with, the financial statements.
| 70 | MainStay Equity Allocation Fund |
Swap Contracts
Open OTC total return equity swap contracts as of October 31, 2023 were as follows1:
Swap
Counterparty | Reference Obligation | Floating Rate2 | Termination
Date(s) | Payment
Frequency
Paid/
Received | Notional
Amount
Long/
(Short)
(000)3 | Unrealized
Appreciation/
(Depreciation)4 |
| Citibank NA | Citi Leveraged Loan Basket | 1 day FEDF minus 0.20% | 12/4/23 | Daily | (3,948) | $ — |
| Citibank NA | Citi Zombie Company Basket | 1 day FEDF minus 0.50% | 12/4/23 | Daily | (3,646) | — |
| JPMorgan Chase Bank NA | Global X Uranium ETF | 1 day FEDF plus 0.50% | 10/8/24- 10/15/24 | Daily | 4,225 | — |
| Citibank NA | Invesco S&P 500 Low Volatility ETF | 1 day FEDF plus 0.45% | 12/4/23 | Daily | 3,724 | — |
| Citibank NA | iShares MSCI EAFE ETF | 1 day FEDF minus 1.25% | 12/4/23 | Daily | (9,682) | — |
| Citibank NA | iShares MSCI Emerging Markets ETF | 1 day FEDF minus 0.54% | 12/4/23 | Daily | (1,802) | — |
| JPMorgan Chase Bank NA | iShares MSCI Japan ETF | 1 day FEDF plus 0.15% | 4/24/24- 5/7/24 | Daily | 11,830 | — |
| JPMorgan Chase Bank NA | J.P. Morgan IDEX Pure Size Short | 1 day FEDF plus 0.02% | 6/20/24 | Daily | (2,941) | — |
| JPMorgan Chase Bank NA | Materials Select Sector SPDR Fund | 1 day FEDF plus 0.18% | 2/5/24 | Daily | 3,906 | — |
| Citibank NA | Russell 1000 Growth Total Return Index | 1 day FEDF minus 0.20% | 12/4/23 | Daily | (5,807) | — |
| JPMorgan Chase Bank NA | Russell 2000 Total Return Index | 1 day FEDF minus 0.15% - plus 0.02% | 4/9/24- 5/7/24 | Daily | (16,028) | — |
| JPMorgan Chase Bank NA | S&P 500 Equal Weight | 1 day FEDF plus 0.30% - 0.51% | 5/7/24 | Daily | 17,171 | — |
| Citibank NA | S&P 500 Financials Index | 1 day FEDF plus 0.10% | 12/4/23 | Daily | (1,024) | — |
| Citibank NA | S&P 500 Health Care Sector | 1 day FEDF plus 0.45% | 12/4/23 | Daily | 3,805 | — |
| Citibank NA | S&P 500 Industrial Sector | 1 day FEDF plus 0.10% | 12/4/23 | Daily | (1,029) | — |
| Citibank NA | S&P 500 Total Return Index | 1 day FEDF plus 0.05% | 12/4/23 | Daily | (12,854) | — |
| Citibank NA | S&P 500 Utilities Total Return | 1 day FEDF plus 0.50% | 12/4/23 | Daily | 4,091 | — |
| Citibank NA | S&P 600 Total Return | 1 day FEDF plus 0.40% | 12/4/23 | Daily | 19,010 | — |
| Citibank NA | S&P Midcap 400 Total Return Index | 1 day FEDF plus 0.31% | 12/4/23 | Daily | 10,560 | — |
| Citibank NA | Vanguard FTSE Europe ETF | 1 day FEDF minus 5.00% | 12/4/23 | Daily | (3,923) | — |
| | | | | | | $ — |
The following table represents the basket holdings underlying the total return swap with Citi Leveraged Loan Basket as of October 31, 2023.
| Security Description | Shares | Notional Value | Unrealized Appreciation/
Depreciation | Percent of
Basket Net Assets |
| AerCap Holdings NV | (1,921) | (185,798) | — | 4.71 |
| Apollo Commercial Real Estate Finance, Inc. | (361) | (34,890) | — | 0.88 |
| Atlantica Sustainable Infrastructure plc | (227) | (21,952) | — | 0.56 |
| Brandywine Realty Trust | (326) | (31,540) | — | 0.80 |
| Carnival Corp. | (4,819) | (466,038) | — | 11.80 |
| Chart Industries, Inc. | (1,852) | (179,137) | — | 4.54 |
| Coherent Corp. | (771) | (74,517) | — | 1.89 |
| CommScope Holding Co, Inc. | (71) | (6,906) | — | 0.17 |
| Crane NXT Co | (1,424) | (137,700) | — | 3.49 |
| Cushman & Wakefield plc | (362) | (35,005) | — | 0.89 |
| Delta Air Lines, Inc. | (3,834) | (370,783) | — | 9.39 |
| Designer Brands, Inc. | (401) | (38,736) | — | 0.98 |
| DigitalBridge Group, Inc. | (631) | (61,030) | — | 1.55 |
| Elanco Animal Health, Inc. | (1,577) | (152,516) | — | 3.86 |
| Entegris, Inc. | (2,506) | (242,371) | — | 6.14 |
| Fidelity National Information Services, Inc. | (3,774) | (364,901) | — | 9.24 |
| Hanesbrands, Inc. | (1,022) | (98,854) | — | 2.50 |
| JetBlue Airways Corp. | (539) | (52,141) | — | 1.32 |
| Lumen Technologies, Inc. | (1,110) | (107,348) | — | 2.72 |
| MKS Instruments, Inc. | (739) | (71,483) | — | 1.81 |
| Oatly Group AB | (45) | (4,326) | — | 0.11 |
| Opendoor Technologies, Inc. | (768) | (74,246) | — | 1.88 |
| Par Pacific Holdings, Inc. | (587) | (56,763) | — | 1.44 |
| PureCycle Technologies, Inc. | (232) | (22,475) | — | 0.57 |
| Scorpio Tankers, Inc. | (1,332) | (128,801) | — | 3.26 |
The notes to the financial statements are an integral part of, and should be read in conjunction with, the financial statements.
71
Portfolio of Investments October 31, 2023†^ (continued)
| Security Description | Shares | Notional Value | Unrealized Appreciation/
Depreciation | Percent of
Basket Net Assets |
| Topgolf Callaway Brands Corp. | (389) | (37,589) | — | 0.95 |
| Uber Technologies, Inc. | (5,872) | (567,829) | — | 14.38 |
| United Airlines Holdings, Inc. | (3,335) | (322,524) | — | 8.17 |
| 1. | As of October 31, 2023, cash in the amount $800,000 was pledged to brokers for OTC swap contracts. |
| 2. | Fund pays the floating rate and receives the total return of the reference entity. |
| 3. | Notional amounts reflected as a positive value indicate a long position held by the Fund or Index and a negative value indicates a short position. |
| 4. | Reflects the value at reset date as of October 31, 2023. |
| Abbreviation(s): |
| EAFE—Europe, Australasia and Far East |
| ETF—Exchange-Traded Fund |
| FEDF—Federal Funds Rate |
| FTSE—Financial Times Stock Exchange |
| MSCI—Morgan Stanley Capital International |
| SPDR—Standard & Poor’s Depositary Receipt |
The following is a summary of the fair valuations according to the inputs used as of October 31, 2023, for valuing the Fund’s assets:
| Description | Quoted
Prices in
Active
Markets for
Identical
Assets
(Level 1) | | Significant
Other
Observable
Inputs
(Level 2) | | Significant
Unobservable
Inputs
(Level 3) | | Total |
| Asset Valuation Inputs | | | | | | | |
| Investments in Securities (a) | | | | | | | |
| Affiliated Investment Companies | | | | | | | |
| Equity Funds | $ 373,103,576 | | $ — | | $ — | | $ 373,103,576 |
| Short-Term Investment | | | | | | | |
| Affiliated Investment Company | 14,633,575 | | — | | — | | 14,633,575 |
| Total Investments in Securities | $ 387,737,151 | | $ — | | $ — | | $ 387,737,151 |
| (a) | For a complete listing of investments, see the Portfolio of Investments. |
The notes to the financial statements are an integral part of, and should be read in conjunction with, the financial statements.
| 72 | MainStay Equity Allocation Fund |
Statement of Assets and Liabilities as of October 31, 2023
| Assets |
Investment in affiliated investment companies, at value
(identified cost $359,894,815) | $387,737,151 |
| Cash collateral on deposit at broker for swap contracts | 800,000 |
| Receivables: | |
| Dividends and interest on OTC swaps contracts | 488,662 |
| Fund shares sold | 90,718 |
| Interest | 63,124 |
| Manager (See Note 3) | 404 |
| Other assets | 43,028 |
| Total assets | 389,223,087 |
| Liabilities |
| Payables: | |
| Fund shares redeemed | 108,433 |
| Transfer agent (See Note 3) | 102,346 |
| NYLIFE Distributors (See Note 3) | 93,197 |
| Shareholder communication | 23,562 |
| Custodian | 12,376 |
| Professional fees | 10,396 |
| Accrued expenses | 2,519 |
| Total liabilities | 352,829 |
| Net assets | $388,870,258 |
| Composition of Net Assets |
| Shares of beneficial interest outstanding (par value of $.001 per share) unlimited number of shares authorized | $ 28,769 |
| Additional paid-in-capital | 369,653,160 |
| | 369,681,929 |
| Total distributable earnings (loss) | 19,188,329 |
| Net assets | $388,870,258 |
| Class A | |
| Net assets applicable to outstanding shares | $311,491,179 |
| Shares of beneficial interest outstanding | 23,011,653 |
| Net asset value per share outstanding | $ 13.54 |
| Maximum sales charge (3.00% of offering price) | 0.42 |
| Maximum offering price per share outstanding | $ 13.96 |
| Investor Class | |
| Net assets applicable to outstanding shares | $ 54,090,599 |
| Shares of beneficial interest outstanding | 3,999,568 |
| Net asset value per share outstanding | $ 13.52 |
| Maximum sales charge (2.50% of offering price) | 0.35 |
| Maximum offering price per share outstanding | $ 13.87 |
| Class B | |
| Net assets applicable to outstanding shares | $ 5,789,823 |
| Shares of beneficial interest outstanding | 447,356 |
| Net asset value and offering price per share outstanding | $ 12.94 |
| Class C | |
| Net assets applicable to outstanding shares | $ 7,960,962 |
| Shares of beneficial interest outstanding | 613,706 |
| Net asset value and offering price per share outstanding | $ 12.97 |
| Class I | |
| Net assets applicable to outstanding shares | $ 4,967,677 |
| Shares of beneficial interest outstanding | 357,799 |
| Net asset value and offering price per share outstanding | $ 13.88 |
| Class R3 | |
| Net assets applicable to outstanding shares | $ 1,827,635 |
| Shares of beneficial interest outstanding | 136,437 |
| Net asset value and offering price per share outstanding | $ 13.40 |
| SIMPLE Class | |
| Net assets applicable to outstanding shares | $ 2,742,383 |
| Shares of beneficial interest outstanding | 202,928 |
| Net asset value and offering price per share outstanding | $ 13.51 |
The notes to the financial statements are an integral part of, and should be read in conjunction with, the financial statements.
73
Statement of Operations for the year ended October 31, 2023
| Investment Income (Loss) |
| Income | |
| Dividend distributions from affiliated investment companies | $ 6,341,575 |
| Expenses | |
| Distribution/Service—Class A (See Note 3) | 804,646 |
| Distribution/Service—Investor Class (See Note 3) | 148,516 |
| Distribution/Service—Class B (See Note 3) | 84,434 |
| Distribution/Service—Class C (See Note 3) | 97,755 |
| Distribution/Service—Class R3 (See Note 3) | 9,841 |
| Distribution/Service—SIMPLE Class (See Note 3) | 10,792 |
| Transfer agent (See Note 3) | 556,957 |
| Registration | 109,059 |
| Professional fees | 73,778 |
| Custodian | 35,289 |
| Shareholder communication | 24,767 |
| Trustees | 10,463 |
| Shareholder service (See Note 3) | 1,968 |
| Miscellaneous | 8,985 |
| Total expenses before waiver/reimbursement | 1,977,250 |
| Expense waiver/reimbursement from Manager (See Note 3) | (132,318) |
| Reimbursement from prior custodian(a) | (812) |
| Net expenses | 1,844,120 |
| Net investment income (loss) | 4,497,455 |
| Realized and Unrealized Gain (Loss) |
| Net realized gain (loss) on: | |
| Affiliated investment company transactions | (8,050,561) |
| Realized capital gain distributions from affiliated investment companies | 6,660,277 |
| Swap transactions | (5,101,478) |
| Net realized gain (loss) | (6,491,762) |
Net change in unrealized appreciation (depreciation) on:
Affiliated investments companies | 16,295,583 |
| Net realized and unrealized gain (loss) | 9,803,821 |
| Net increase (decrease) in net assets resulting from operations | $14,301,276 |
| (a) | Represents a refund for overbilling of custody fees. |
The notes to the financial statements are an integral part of, and should be read in conjunction with, the financial statements.
| 74 | MainStay Equity Allocation Fund |
Statements of Changes in Net Assets
for the years ended October 31, 2023 and October 31, 2022
| | 2023 | 2022 |
| Increase (Decrease) in Net Assets |
| Operations: | | |
| Net investment income (loss) | $ 4,497,455 | $ 3,525,120 |
| Net realized gain (loss) | (6,491,762) | 46,649,617 |
| Net change in unrealized appreciation (depreciation) | 16,295,583 | (135,519,813) |
| Net increase (decrease) in net assets resulting from operations | 14,301,276 | (85,345,076) |
| Distributions to shareholders: | | |
| Class A | (30,476,962) | (42,722,083) |
| Investor Class | (5,716,602) | (7,837,705) |
| Class B | (890,193) | (1,882,929) |
| Class C | (968,429) | (1,657,436) |
| Class I | (534,380) | (777,037) |
| Class R3 | (192,570) | (237,105) |
| SIMPLE Class | (153,058) | (69,622) |
| Total distributions to shareholders | (38,932,194) | (55,183,917) |
| Capital share transactions: | | |
| Net proceeds from sales of shares | 34,925,137 | 39,138,627 |
| Net asset value of shares issued to shareholders in reinvestment of distributions | 38,698,435 | 54,836,059 |
| Cost of shares redeemed | (51,020,915) | (52,534,541) |
| Increase (decrease) in net assets derived from capital share transactions | 22,602,657 | 41,440,145 |
| Net increase (decrease) in net assets | (2,028,261) | (99,088,848) |
| Net Assets |
| Beginning of year | 390,898,519 | 489,987,367 |
| End of year | $388,870,258 | $ 390,898,519 |
The notes to the financial statements are an integral part of, and should be read in conjunction with, the financial statements.
75
Financial Highlights selected per share data and ratios
| | Year Ended October 31, |
| Class A | 2023 | | 2022 | | 2021 | | 2020 | | 2019 |
| Net asset value at beginning of year | $ 14.50 | | $ 19.80 | | $ 14.86 | | $ 15.10 | | $ 15.60 |
| Net investment income (loss) (a) | 0.16 | | 0.14 | | 0.11 | | 0.19 | | 0.15 |
| Net realized and unrealized gain (loss) | 0.34 | | (3.19) | | 5.64 | | 0.38 | | 0.93 |
| Total from investment operations | 0.50 | | (3.05) | | 5.75 | | 0.57 | | 1.08 |
| Less distributions: | | | | | | | | | |
| From net investment income | (0.18) | | (0.86) | | (0.08) | | (0.28) | | (0.18) |
| From net realized gain on investments | (1.28) | | (1.39) | | (0.73) | | (0.53) | | (1.40) |
| Total distributions | (1.46) | | (2.25) | | (0.81) | | (0.81) | | (1.58) |
| Net asset value at end of year | $ 13.54 | | $ 14.50 | | $ 19.80 | | $ 14.86 | | $ 15.10 |
| Total investment return (b) | 3.60% | | (17.56)% | | 39.73% | | 3.70% | | 8.72% |
| Ratios (to average net assets)/Supplemental Data: | | | | | | | | | |
| Net investment income (loss) | 1.16% | | 0.89% | | 0.60% | | 1.29% | | 1.06% |
| Net expenses (c) | 0.39% | | 0.37% | | 0.38% | | 0.41% | | 0.43% |
| Portfolio turnover rate | 23% | | 17% | | 27% | | 36% | | 35% |
| Net assets at end of year (in 000’s) | $ 311,491 | | $ 302,559 | | $ 372,926 | | $ 258,743 | | $ 248,068 |
| (a) | Per share data based on average shares outstanding during the year. |
| (b) | Total investment return is calculated exclusive of sales charges and assumes the reinvestment of dividends and distributions. For periods of less than one year, total return is not annualized. |
| (c) | In addition to the fees and expenses which the Fund bears directly, it also indirectly bears a pro-rata share of the fees and expenses of the underlying funds in which it invests. Such indirect expenses are not included in the above expense ratios. |
| | Year Ended October 31, |
| Investor Class | 2023 | | 2022 | | 2021 | | 2020 | | 2019 |
| Net asset value at beginning of year | $ 14.48 | | $ 19.78 | | $ 14.84 | | $ 15.08 | | $ 15.58 |
| Net investment income (loss) (a) | 0.14 | | 0.12 | | 0.09 | | 0.17 | | 0.13 |
| Net realized and unrealized gain (loss) | 0.33 | | (3.20) | | 5.62 | | 0.38 | | 0.93 |
| Total from investment operations | 0.47 | | (3.08) | | 5.71 | | 0.55 | | 1.06 |
| Less distributions: | | | | | | | | | |
| From net investment income | (0.15) | | (0.83) | | (0.04) | | (0.26) | | (0.16) |
| From net realized gain on investments | (1.28) | | (1.39) | | (0.73) | | (0.53) | | (1.40) |
| Total distributions | (1.43) | | (2.22) | | (0.77) | | (0.79) | | (1.56) |
| Net asset value at end of year | $ 13.52 | | $ 14.48 | | $ 19.78 | | $ 14.84 | | $ 15.08 |
| Total investment return (b) | 3.41% | | (17.72)% | | 39.50% | | 3.55% | | 8.52% |
| Ratios (to average net assets)/Supplemental Data: | | | | | | | | | |
| Net investment income (loss) | 1.02% | | 0.73% | | 0.48% | | 1.18% | | 0.89% |
| Net expenses (c) | 0.55% | | 0.55% | | 0.55% | | 0.55% | | 0.55% |
| Expenses (before waiver/reimbursement) (c) | 0.72% | | 0.63% | | 0.71% | | 0.72% | | 0.72% |
| Portfolio turnover rate | 23% | | 17% | | 27% | | 36% | | 35% |
| Net assets at end of year (in 000's) | $ 54,091 | | $ 58,318 | | $ 73,138 | | $ 73,492 | | $ 75,913 |
| (a) | Per share data based on average shares outstanding during the year. |
| (b) | Total investment return is calculated exclusive of sales charges and assumes the reinvestment of dividends and distributions. For periods of less than one year, total return is not annualized. |
| (c) | In addition to the fees and expenses which the Fund bears directly, it also indirectly bears a pro-rata share of the fees and expenses of the underlying funds in which it invests. Such indirect expenses are not included in the above expense ratios. |
The notes to the financial statements are an integral part of, and should be read in conjunction with, the financial statements.
| 76 | MainStay Equity Allocation Fund |
Financial Highlights selected per share data and ratios
| | Year Ended October 31, |
| Class B | 2023 | | 2022 | | 2021 | | 2020 | | 2019 |
| Net asset value at beginning of year | $ 13.90 | | $ 19.07 | | $ 14.40 | | $ 14.64 | | $ 15.13 |
| Net investment income (loss) (a) | 0.05 | | 0.00‡ | | (0.03) | | 0.08 | | 0.04 |
| Net realized and unrealized gain (loss) | 0.30 | | (3.09) | | 5.43 | | 0.34 | | 0.89 |
| Total from investment operations | 0.35 | | (3.09) | | 5.40 | | 0.42 | | 0.93 |
| Less distributions: | | | | | | | | | |
| From net investment income | (0.03) | | (0.69) | | — | | (0.13) | | (0.02) |
| From net realized gain on investments | (1.28) | | (1.39) | | (0.73) | | (0.53) | | (1.40) |
| Total distributions | (1.31) | | (2.08) | | (0.73) | | (0.66) | | (1.42) |
| Net asset value at end of year | $ 12.94 | | $ 13.90 | | $ 19.07 | | $ 14.40 | | $ 14.64 |
| Total investment return (b) | 2.65% | | (18.36)% | | 38.44% | | 2.80% | | 7.73% |
| Ratios (to average net assets)/Supplemental Data: | | | | | | | | | |
| Net investment income (loss) | 0.34% | | 0.02% | | (0.19)% | | 0.55% | | 0.28% |
| Net expenses (c) | 1.30% | | 1.30% | | 1.30% | | 1.30% | | 1.30% |
| Expenses (before waiver/reimbursement) (c) | 1.48% | | 1.38% | | 1.46% | | 1.47% | | 1.47% |
| Portfolio turnover rate | 23% | | 17% | | 27% | | 36% | | 35% |
| Net assets at end of year (in 000’s) | $ 5,790 | | $ 10,468 | | $ 18,670 | | $ 19,651 | | $ 25,905 |
| ‡ | Less than one cent per share. |
| (a) | Per share data based on average shares outstanding during the year. |
| (b) | Total investment return is calculated exclusive of sales charges and assumes the reinvestment of dividends and distributions. For periods of less than one year, total return is not annualized. |
| (c) | In addition to the fees and expenses which the Fund bears directly, it also indirectly bears a pro-rata share of the fees and expenses of the underlying funds in which it invests. Such indirect expenses are not included in the above expense ratios. |
| | Year Ended October 31, |
| Class C | 2023 | | 2022 | | 2021 | | 2020 | | 2019 |
| Net asset value at beginning of year | $ 13.93 | | $ 19.11 | | $ 14.42 | | $ 14.66 | | $ 15.15 |
| Net investment income (loss) (a) | 0.04 | | (0.00)‡ | | (0.04) | | 0.07 | | 0.05 |
| Net realized and unrealized gain (loss) | 0.31 | | (3.10) | | 5.46 | | 0.35 | | 0.88 |
| Total from investment operations | 0.35 | | (3.10) | | 5.42 | | 0.42 | | 0.93 |
| Less distributions: | | | | | | | | | |
| From net investment income | (0.03) | | (0.69) | | — | | (0.13) | | (0.02) |
| From net realized gain on investments | (1.28) | | (1.39) | | (0.73) | | (0.53) | | (1.40) |
| Total distributions | (1.31) | | (2.08) | | (0.73) | | (0.66) | | (1.42) |
| Net asset value at end of year | $ 12.97 | | $ 13.93 | | $ 19.11 | | $ 14.42 | | $ 14.66 |
| Total investment return (b) | 2.64% | | (18.37)% | | 38.53% | | 2.79% | | 7.72% |
| Ratios (to average net assets)/Supplemental Data: | | | | | | | | | |
| Net investment income (loss) | 0.30% | | (0.00)%‡ | | (0.25)% | | 0.49% | | 0.33% |
| Net expenses (c) | 1.30% | | 1.30% | | 1.30% | | 1.30% | | 1.30% |
| Expenses (before waiver/reimbursement) (c) | 1.47% | | 1.38% | | 1.46% | | 1.47% | | 1.47% |
| Portfolio turnover rate | 23% | | 17% | | 27% | | 36% | | 35% |
| Net assets at end of year (in 000’s) | $ 7,961 | | $ 10,763 | | $ 16,001 | | $ 15,805 | | $ 18,411 |
| ‡ | Less than one cent per share. |
| ‡ | Less than one-tenth of a percent. |
| (a) | Per share data based on average shares outstanding during the year. |
| (b) | Total investment return is calculated exclusive of sales charges and assumes the reinvestment of dividends and distributions. For periods of less than one year, total return is not annualized. |
| (c) | In addition to the fees and expenses which the Fund bears directly, it also indirectly bears a pro-rata share of the fees and expenses of the underlying funds in which it invests. Such indirect expenses are not included in the above expense ratios. |
The notes to the financial statements are an integral part of, and should be read in conjunction with, the financial statements.
77
Financial Highlights selected per share data and ratios
| | Year Ended October 31, |
| Class I | 2023 | | 2022 | | 2021 | | 2020 | | 2019 |
| Net asset value at beginning of year | $ 14.84 | | $ 20.21 | | $ 15.15 | | $ 15.37 | | $ 15.86 |
| Net investment income (loss) (a) | 0.21 | | 0.19 | | 0.16 | | 0.24 | | 0.21 |
| Net realized and unrealized gain (loss) | 0.32 | | (3.27) | | 5.74 | | 0.39 | | 0.93 |
| Total from investment operations | 0.53 | | (3.08) | | 5.90 | | 0.63 | | 1.14 |
| Less distributions: | | | | | | | | | |
| From net investment income | (0.21) | | (0.90) | | (0.11) | | (0.32) | | (0.23) |
| From net realized gain on investments | (1.28) | | (1.39) | | (0.73) | | (0.53) | | (1.40) |
| Total distributions | (1.49) | | (2.29) | | (0.84) | | (0.85) | | (1.63) |
| Net asset value at end of year | $ 13.88 | | $ 14.84 | | $ 20.21 | | $ 15.15 | | $ 15.37 |
| Total investment return (b) | 3.80% | | (17.35)% | | 40.05% | | 4.02% | | 8.97% |
| Ratios (to average net assets)/Supplemental Data: | | | | | | | | | |
| Net investment income (loss) | 1.43% | | 1.16% | | 0.86% | | 1.60% | | 1.40% |
| Net expenses (c) | 0.14% | | 0.12% | | 0.13% | | 0.16% | | 0.16% |
| Portfolio turnover rate | 23% | | 17% | | 27% | | 36% | | 35% |
| Net assets at end of year (in 000’s) | $ 4,968 | | $ 5,463 | | $ 6,649 | | $ 4,727 | | $ 4,894 |
| (a) | Per share data based on average shares outstanding during the year. |
| (b) | Total investment return is calculated exclusive of sales charges and assumes the reinvestment of dividends and distributions. Class I shares are not subject to sales charges. For periods of less than one year, total return is not annualized. |
| (c) | In addition to the fees and expenses which the Fund bears directly, it also indirectly bears a pro-rata share of the fees and expenses of the underlying funds in which it invests. Such indirect expenses are not included in the above expense ratios. |
| | Year Ended October 31, |
| Class R3 | 2023 | | 2022 | | 2021 | | 2020 | | 2019 |
| Net asset value at beginning of year | $ 14.35 | | $ 19.63 | | $ 14.74 | | $ 15.00 | | $ 15.51 |
| Net investment income (loss) (a) | 0.12 | | 0.08 | | 0.04 | | 0.11 | | 0.06 |
| Net realized and unrealized gain (loss) | 0.33 | | (3.18) | | 5.61 | | 0.40 | | 0.97 |
| Total from investment operations | 0.45 | | (3.10) | | 5.65 | | 0.51 | | 1.03 |
| Less distributions: | | | | | | | | | |
| From net investment income | (0.12) | | (0.79) | | (0.03) | | (0.24) | | (0.14) |
| From net realized gain on investments | (1.28) | | (1.39) | | (0.73) | | (0.53) | | (1.40) |
| Total distributions | (1.40) | | (2.18) | | (0.76) | | (0.77) | | (1.54) |
| Net asset value at end of year | $ 13.40 | | $ 14.35 | | $ 19.63 | | $ 14.74 | | $ 15.00 |
| Total investment return (b) | 3.30% | | (17.91)% | | 39.29% | | 3.30% | | 8.34% |
| Ratios (to average net assets)/Supplemental Data: | | | | | | | | | |
| Net investment income (loss) | 0.85% | | 0.52% | | 0.23% | | 0.78% | | 0.40% |
| Net expenses (c) | 0.74% | | 0.72% | | 0.73% | | 0.76% | | 0.77% |
| Portfolio turnover rate | 23% | | 17% | | 27% | | 36% | | 35% |
| Net assets at end of year (in 000’s) | $ 1,828 | | $ 1,945 | | $ 2,140 | | $ 1,375 | | $ 1,060 |
| (a) | Per share data based on average shares outstanding during the year. |
| (b) | Total investment return is calculated exclusive of sales charges and assumes the reinvestment of dividends and distributions. Class R3 shares are not subject to sales charges. For periods of less than one year, total return is not annualized. |
| (c) | In addition to the fees and expenses which the Fund bears directly, it also indirectly bears a pro-rata share of the fees and expenses of the underlying funds in which it invests. Such indirect expenses are not included in the above expense ratios. |
The notes to the financial statements are an integral part of, and should be read in conjunction with, the financial statements.
| 78 | MainStay Equity Allocation Fund |
Financial Highlights selected per share data and ratios
| | Year Ended October 31, | | August 31, 2020^ through
October 31, |
| SIMPLE Class | 2023 | | 2022 | | 2021 | | 2020 |
| Net asset value at beginning of period | $ 14.46 | | $ 19.75 | | $ 14.84 | | $ 15.70* |
| Net investment income (loss) (a) | 0.09 | | 0.05 | | (0.01) | | (0.01) |
| Net realized and unrealized gain (loss) | 0.35 | | (3.17) | | 5.68 | | (0.85) |
| Total from investment operations | 0.44 | | (3.12) | | 5.67 | | (0.86) |
| Less distributions: | | | | | | | |
| From net investment income | (0.11) | | (0.78) | | (0.03) | | — |
| From net realized gain on investments | (1.28) | | (1.39) | | (0.73) | | — |
| Total distributions | (1.39) | | (2.17) | | (0.76) | | — |
| Net asset value at end of period | $ 13.51 | | $ 14.46 | | $ 19.75 | | $ 14.84 |
| Total investment return (b) | 3.19% | | (17.91)% | | 39.15% | | (5.48)% |
| Ratios (to average net assets)/Supplemental Data: | | | | | | | |
| Net investment income (loss) | 0.62% | | 0.30% | | (0.07)% | | (0.27)%†† |
| Net expenses (c) | 0.79% | | 0.80% | | 0.80% | | 0.80%†† |
| Expenses (before waiver/reimbursement) (c) | 0.79% | | 0.88% | | 0.96% | | 0.97%†† |
| Portfolio turnover rate | 23% | | 17% | | 27% | | 36% |
| Net assets at end of period (in 000’s) | $ 2,742 | | $ 1,383 | | $ 463 | | $ 24 |
| ^ | Inception date. |
| * | Based on the net asset value of Investor Class as of August 31, 2020. |
| †† | Annualized. |
| (a) | Per share data based on average shares outstanding during the period. |
| (b) | Total investment return is calculated exclusive of sales charges and assumes the reinvestment of dividends and distributions. SIMPLE Class shares are not subject to sales charges. For periods of less than one year, total return is not annualized. |
| (c) | In addition to the fees and expenses which the Fund bears directly, it also indirectly bears a pro-rata share of the fees and expenses of the underlying funds in which it invests. Such indirect expenses are not included in the above expense ratios. |
The notes to the financial statements are an integral part of, and should be read in conjunction with, the financial statements.
79
Notes to Financial Statements
Note 1-Organization and Business
MainStay Funds Trust (the “Trust”) was organized as a Delaware statutory trust on April 28, 2009. The Trust is registered under the Investment Company Act of 1940, as amended (the “1940 Act”), as an open-end management investment company, and is comprised of thirty-three funds (collectively referred to as the “Funds” and each individually, referred to as a “Fund"). These financial statements and notes relate to the MainStay Conservative Allocation Fund, MainStay Moderate Allocation Fund, MainStay Growth Allocation Fund (formerly known as MainStay Moderate Growth Allocation Fund) and MainStay Equity Allocation Fund (formerly known as MainStay Growth Allocation Fund) (collectively referred to as the "Allocation Funds" and each individually referred to as an "Allocation Fund"). Each is a “diversified” fund, as that term is defined in the 1940 Act, as interpreted or modified by regulatory authorities having jurisdiction, from time to time.
The following table lists each Allocation Fund's share classes that have been registered and commenced operations:
| Fund | Share Classes Commenced Operations |
| MainStay Conservative Allocation Fund | Class A, Investor Class, Class B, Class C, Class I, Class R2*, Class R3* and SIMPLE Class |
| MainStay Moderate Allocation Fund | Class A, Investor Class, Class B, Class C, Class I, Class R2*, Class R3* and SIMPLE Class |
MainStay Growth
Allocation Fund | Class A, Investor Class, Class B, Class C, Class I, Class R2*, Class R3* and SIMPLE Class |
MainStay Equity
Allocation Fund | Class A, Investor Class, Class B, Class C, Class I, Class R3** and SIMPLE Class |
* As of October 31, 2023, Class R2 and Class R3 shares are closed to new investors and, upon the close of business on December 29, 2023, Class R2 and Class R3 shares are closed to additional investments by existing shareholders. Additionally, Class R2 and Class R3 shares will be liquidated on or about February 28, 2024 (the "Liquidation Date"). It is expected that the Fund will distribute to remaining shareholders invested in Class R2 or Class R3 shares, on or promptly after the Liquidation Date, a liquidating distribution in cash or cash equivalents equal to the net asset value of such shares.
** As of October 31, 2023, Class R3 shares are closed to new investors and, upon the close of business on December 29, 2023, Class R3 shares are closed to additional investments by existing shareholders. Additionally, Class R3 shares will be liquidated on or about February 28, 2024 (the "Liquidation Date"). It is expected that the Fund will distribute to remaining shareholders invested in Class R3 shares, on or promptly after the Liquidation Date, a liquidating distribution in cash or cash equivalents equal to the net asset value of such shares.
Class B shares of the MainStay Group of Funds are closed to all new purchases as well as additional investments by existing Class B shareholders. Existing Class B shareholders may continue to reinvest dividends and capital gains distributions, as well as exchange their Class B shares for Class B shares of other funds in the MainStay Group of Funds as permitted by the current exchange privileges. Class B shareholders continue to be subject to any applicable contingent deferred
sales charge ("CDSC") at the time of redemption. All other features of the Class B shares, including but not limited to the fees and expenses applicable to Class B shares, remain unchanged. Unless redeemed, Class B shareholders will remain in Class B shares of their respective fund until the Class B shares are converted to Class A or Investor Class shares pursuant to the applicable conversion schedule.
Class A and Investor Class shares are offered at net asset value (“NAV”) per share plus an initial sales charge. No initial sales charge applies to investments of $250,000 or more (and certain other qualified purchases) in Class A and Investor Class shares. However, a CDSC of 1.00% may be imposed on certain redemptions made within 18 months of the date of purchase on shares that were purchased without an initial sales charge. Class C shares are offered at NAV without an initial sales charge, although a CDSC of 1.00% may be imposed on certain redemptions of such shares made within one year of the date of purchase of Class C shares. When Class B shares were offered, they were offered at NAV without an initial sales charge, although a CDSC that declines depending on the number of years a shareholder held its Class B shares may be imposed on certain redemptions of such shares made within six years of the date of purchase of such shares. Class I, Class R2, Class R3 and SIMPLE Class shares are offered at NAV without a sales charge. Depending upon eligibility, Class B shares convert to either Class A or Investor Class shares at the end of the calendar quarter eight years after the date they were purchased. In addition, depending upon eligibility, Class C shares convert to either Class A or Investor Class shares at the end of the calendar quarter ten years after the date they were purchased. Additionally, Investor Class shares may convert automatically to Class A shares. SIMPLE Class shares convert to Class A shares, or Investor Class shares if you are not eligible to hold Class A shares, at the end of the calendar quarter, ten years after the date they were purchased. Share class conversions are based on the relevant NAVs of the two classes at the time of the conversion, and no sales load or other charge is imposed. Under certain circumstances and as may be permitted by the Trust’s multiple class plan pursuant to Rule 18f-3 under the 1940 Act, specified share classes of an Allocation Fund may be converted to one or more other share classes of the Allocation Funds as disclosed in the capital share transactions within these Notes. The classes of shares have the same voting (except for issues that relate solely to one class), dividend, liquidation and other rights, and the same terms and conditions, except that under distribution plans pursuant to Rule 12b-1 under the 1940 Act, Class B and Class C shares are subject to higher distribution and/or service fees than Class A, Investor Class, Class R2, Class R3 and SIMPLE Class shares. Class I shares are not subject to a distribution and/or service fee. Class R2 and Class R3 shares are subject to a shareholder service fee, which is in addition to fees paid under the distribution plans for Class R2 and Class R3 shares.
At a meeting held on September 25-26, 2023, the Board of Trustees (the “Board”) of the Trust, after careful consideration of a number of factors and upon the recommendation of the Funds' investment adviser, New York Life Investment Management LLC (“New York Life Investments” or the "Manager"), approved a proposal to liquidate Class R3 shares of
| 80 | MainStay Asset Allocation Funds |
MainStay Equity Allocation Fund and Class R2 and Class R3 shares of MainStay Conservative Allocation Fund, MainStay Growth Allocation Fund and MainStay Moderate Allocation Fund on or about February 28, 2024, pursuant to the terms of a plan of liquidation.
The investment objective for each of the Allocation Funds is as follows:
The MainStay Conservative Allocation Fund seeks current income and, secondarily, long-term growth of capital.
The MainStay Moderate Allocation Fund seeks long-term growth of capital and, secondarily, current income.
The MainStay Growth Allocation Fund seeks long-term growth of capital and, secondarily, current income.
The MainStay Equity Allocation Fund seeks long-term growth of capital.
The Allocation Funds are "funds-of-funds" that seek to achieve their investment objectives by investing in mutual funds and exchange-traded funds (“ETFs”) managed by New York Life Investments (“Manager”) or its affiliates (the “Underlying Funds”). The MainStay Equity Allocation Fund invests, under normal circumstances, at least 80% of its assets (net assets plus any borrowings for investment purposes) in Underlying Equity Funds.
Note 2–Significant Accounting Policies
The Allocation Funds are investment companies and accordingly follow the investment company accounting and reporting guidance of the Financial Accounting Standards Board (“FASB”) Accounting Standards Codification Topic 946 Financial Services—Investment Companies. The Allocation Funds prepare their financial statements in accordance with generally accepted accounting principles (“GAAP”) in the United States of America and follow the significant accounting policies described below.
(A) Securities Valuation. Investments are usually valued as of the close of regular trading on the New York Stock Exchange (the "Exchange") (usually 4:00 p.m. Eastern time) on each day the Allocation Funds are open for business ("valuation date").
Pursuant to Rule 2a-5 under the 1940 Act, the Board has designated New York Life Investments as its Valuation Designee (the "Valuation Designee"). The Valuation Designee is responsible for performing fair valuations relating to all investments in each Allocation Fund’s portfolio for which market quotations are not readily available; periodically assessing and managing material valuation risks; establishing and applying fair value methodologies; testing fair valuation methodologies; evaluating and overseeing pricing services; ensuring appropriate segregation of valuation and portfolio management functions; providing quarterly, annual and prompt reporting to the Board, as appropriate; identifying potential conflicts of interest; and maintaining appropriate records. The Valuation Designee has established a valuation committee ("Valuation Committee") to assist in carrying out the Valuation Designee’s responsibilities and establish prices of securities for which market quotations are not readily
available. The Allocation Funds' and the Valuation Designee's policies and procedures ("Valuation Procedures") govern the Valuation Designee’s selection and application of methodologies for determining and calculating the fair value of Allocation Fund investments. The Valuation Designee may value the Allocation Funds' portfolio securities for which market quotations are not readily available and other Allocation Fund assets utilizing inputs from pricing services and other third-party sources. The Valuation Committee meets (in person, via electronic mail or via teleconference) on an ad-hoc basis to determine fair valuations and on a quarterly basis to review fair value events with respect to certain securities for which market quotations are not readily available, including valuation risks and back-testing results, and preview reports to the Board.
The Valuation Committee establishes prices of securities for which market quotations are not readily available based on such methodologies and measurements on a regular basis after considering information that is reasonably available and deemed relevant by the Valuation Committee. The Board shall oversee the Valuation Designee and review fair valuation materials on a prompt, quarterly and annual basis and approve proposed revisions to the Valuation Procedures.
Investments for which market quotations are not readily available are valued at fair value as determined in good faith pursuant to the Valuation Procedures. A market quotation is readily available only when that quotation is a quoted price (unadjusted) in active markets for identical investments that each Allocation Fund can access at the measurement date, provided that a quotation will not be readily available if it is not reliable. "Fair value" is defined as the price the Allocation Fund would reasonably expect to receive upon selling an asset or liability in an orderly transaction to an independent buyer in the principal or most advantageous market for the asset or liability. Fair value measurements are determined within a framework that establishes a three-tier hierarchy that maximizes the use of observable market data and minimizes the use of unobservable inputs to establish a classification of fair value measurements for disclosure purposes. "Inputs" refer broadly to the assumptions that market participants would use in pricing the asset or liability, including assumptions about risk, such as the risk inherent in a particular valuation technique used to measure fair value using a pricing model and/or the risk inherent in the inputs for the valuation technique. Inputs may be observable or unobservable. Observable inputs reflect the assumptions market participants would use in pricing the asset or liability based on market data obtained from sources independent of each Allocation Fund. Unobservable inputs reflect each Allocation Fund’s own assumptions about the assumptions market participants would use in pricing the asset or liability based on the information available. The inputs or methodology used for valuing assets or liabilities may not be an indication of the risks associated with investing in those assets or liabilities. The three-tier hierarchy of inputs is summarized below.
| • | Level 1—quoted prices (unadjusted) in active markets for an identical asset or liability |
Notes to Financial Statements (continued)
| • | Level 2—other significant observable inputs (including quoted prices for a similar asset or liability in active markets, interest rates and yield curves, prepayment speeds, credit risk, etc.) |
| • | Level 3—significant unobservable inputs (including each Allocation Fund's own assumptions about the assumptions that market participants would use in measuring fair value of an asset or liability) |
The level of an asset or liability within the fair value hierarchy is based on the lowest level of an input, both individually and in the aggregate, that is significant to the fair value measurement. The aggregate value by input level of each Allocation Fund’s assets and liabilities as of October 31, 2023, is included at the end of each Allocation Fund’s Portfolio of Investments.
Exchange-traded funds (“ETFs”) are valued at the last quoted sales prices as of the close of regular trading on the relevant exchange on each valuation date. Securities that are not traded on the valuation date are valued at the mean of the last quoted bid and ask prices. Prices are normally taken from the principal market in which each security trades. These securities are generally categorized as Level 1 in the hierarchy.
Investments in mutual funds, including money market funds, are valued at their respective NAVs at the close of business each day on the valuation date. These securities are generally categorized as Level 1 in the hierarchy.
Swaps are marked to market daily based upon quotations from pricing agents, brokers or market makers. These securities are generally categorized as Level 2 in the hierarchy.
Total return swap contracts, which are arrangements to exchange a market-linked return for a periodic payment, are based on a notional principal amount. To the extent that the total return of the security, index or other financial measure underlying the transaction exceeds or falls short of the offsetting interest rate obligation, the Allocation Funds will receive a payment from or make a payment to the counterparty. Total return swap contracts are marked to market daily based upon quotations from market makers and these securities are generally categorized as Level 2 in the hierarchy.
Temporary cash investments acquired in excess of 60 days to maturity at the time of purchase are valued using the latest bid prices or using valuations based on a matrix system (which considers such factors as security prices, yields, maturities and ratings), both as furnished by independent pricing services. Temporary cash investments that mature in 60 days or less at the time of purchase ("Short-Term Investments") are valued using the amortized cost method of valuation, unless the use of such method would be inappropriate. The amortized cost method involves valuing a security at its cost on the date of purchase and thereafter assuming a constant amortization to maturity of the difference between such cost and the value on maturity date. Amortized cost approximates the current fair value of a security. Securities valued using the amortized cost method are not valued using quoted prices in an active market and are generally categorized as Level 2 in the hierarchy.
The information above is not intended to reflect an exhaustive list of the methodologies that may be used to value portfolio investments. The Valuation Procedures permit the use of a variety of valuation methodologies in connection with valuing portfolio investments. The methodology used for a specific type of investment may vary based on the market data available or other considerations. The methodologies summarized above may not represent the specific means by which portfolio investments are valued on any particular business day.
(B) Income Taxes. Each Allocation Fund is treated as a separate entity for federal income tax purposes. The Allocation Funds' policy is to comply with the requirements of the Internal Revenue Code of 1986, as amended (the “Internal Revenue Code”), applicable to regulated investment companies and to distribute all of its taxable income to the shareholders of each Allocation Fund within the allowable time limits.
The Manager evaluates each Allocation Fund’s tax positions to determine if the tax positions taken meet the minimum recognition threshold in connection with accounting for uncertainties in income tax positions taken or expected to be taken for the purposes of measuring and recognizing tax liabilities in the financial statements. Recognition of tax benefits of an uncertain tax position is permitted only to the extent the position is “more likely than not” to be sustained assuming examination by taxing authorities. The Manager analyzed the Allocation Funds' tax positions taken on federal, state and local income tax returns for all open tax years (for up to three tax years) and has concluded that no provisions for federal, state and local income tax are required in the Allocation Funds' financial statements. The Allocation Funds' federal, state and local income tax and federal excise tax returns for tax years for which the applicable statutes of limitations have not expired are subject to examination by the Internal Revenue Service and state and local departments of revenue.
(C) Dividends and Distributions to Shareholders. Dividends and distributions are recorded on the ex-dividend date. The MainStay Moderate Allocation Fund, MainStay Growth Allocation Fund and MainStay Equity Allocation Fund each intend to declare and pay dividends from net investment income and distributions from net realized capital and currency gains, if any, at least annually. The MainStay Conservative Allocation Fund intends to declare and dividends from net investment income, if any, at least quarterly and distributions from net realized capital and currency gains, if any, at least annually. Unless a shareholder elects otherwise, all dividends and distributions are reinvested at NAV in the same class of shares of the respective Allocation Fund. Dividends and distributions to shareholders are determined in accordance with federal income tax regulations and may differ from determinations using GAAP.
(D) Security Transactions and Investment Income. The Allocation Funds record security transactions on the trade date. Realized gains and losses on security transactions are determined using the identified cost method. Dividends and distributions received by the Allocation Funds from the Underlying Funds are recorded on the ex-dividend date.
| 82 | MainStay Asset Allocation Funds |
Investment income and realized and unrealized gains and losses on investments of the Allocation Funds are allocated pro rata to the separate classes of shares based upon their relative net assets on the date the income is earned or realized and unrealized gains and losses are incurred.
(E) Expenses. Expenses of the Trust are allocated to the individual Funds in proportion to the net assets of the respective Funds when the expenses are incurred, except where direct allocations of expenses can be made. Expenses (other than transfer agent expenses and fees incurred under the shareholder services plans and/or the distribution plans further discussed in Note 3(B)) are allocated to separate classes of shares pro rata based upon their relative net assets on the date the expenses are incurred. The expenses borne by the Allocation Funds, including those of related parties to the Allocation Funds, are shown in the Statement of Operations.
Additionally, the Allocation Funds may invest in mutual funds, which are subject to management fees and other fees that may cause the costs of investing in mutual funds to be greater than the costs of owning the underlying securities directly. These indirect expenses of mutual funds are not included in the amounts shown as expenses in the Statement of Operations or in the expense ratios included in the Financial Highlights.
(F) Use of Estimates. In preparing financial statements in conformity with GAAP, the Manager makes estimates and assumptions that affect the reported amounts and disclosures in the financial statements. Actual results could differ from those estimates and assumptions.
(G) Swap Contracts. The Allocation Funds may enter into credit default, interest rate, equity, index and currency exchange rate swap contracts (“swaps”). In a typical swap transaction, two parties agree to exchange the future returns (or differentials in rates of future returns) earned or realized at periodic intervals on a particular investment or instrument based on a notional principal amount. Generally, the Allocation Funds will enter into a swap on a net basis, which means that the two payment streams under the swap are netted, with the Allocation Funds receiving or paying (as the case may be) only the net amount of the two payment streams. Therefore, the Allocation Funds' current obligation under a swap generally will be equal to the net amount to be paid or received under the swap, based on the relative value of notional positions attributable to each counterparty to the swap. The payments may be adjusted for transaction costs, interest payments, the amount of interest paid on the investment or instrument or other factors. Collateral, in the form of cash or securities, may be required to be held in segregated accounts with the custodian bank or broker in accordance with the terms of the swap. Swap agreements are privately negotiated in the over the counter (“OTC”) market and may be executed in a multilateral or other trade facilities platform, such as a registered commodities exchange (“centrally cleared swaps”).
Certain standardized swaps, including certain credit default and interest rate swaps, are subject to mandatory clearing and exchange-trading, and more types of standardized swaps are expected to be subject to
mandatory clearing and exchange-trading in the future. The counterparty risk for exchange-traded and cleared derivatives is expected to be generally lower than for uncleared derivatives, but cleared contracts are not risk-free. In a cleared derivative transaction, the Allocation Funds typically enters into the transaction with a financial institution counterparty, and performance of the transaction is effectively guaranteed by a central clearinghouse, thereby reducing or eliminating the Allocation Funds' exposure to the credit risk of its original counterparty. The Allocation Funds will be required to post specified levels of margin with the clearinghouse or at the instruction of the clearinghouse; the margin required by a clearinghouse may be greater than the margin the Allocation Funds would be required to post in an uncleared transaction. As of October 31, 2023, the Fund did not hold any swap positions.
Swaps are marked to market daily based upon quotations from pricing agents, brokers, or market makers and the change in value, if any, is recorded as unrealized appreciation or depreciation. Any payments made or received upon entering into a swap would be amortized or accreted over the life of the swap and recorded as a realized gain or loss. Early termination of a swap is recorded as a realized gain or loss. Daily changes in valuation of centrally cleared swaps, if any, are recorded as a receivable or payable for the change in value as appropriate on the Statement of Assets and Liabilities.
The Allocation Funds bears the risk of loss of the amount expected to be received under a swap in the event of the default or bankruptcy of the swap counterparty. The Allocation Funds may be able to eliminate its exposure under a swap either by assignment or other disposition, or by entering into an offsetting swap with the same party or a similar credit-worthy party. Swaps are not actively traded on financial markets. Entering into swaps involves elements of credit, market, leverage, liquidity, operational, counterparty and legal/documentation risk in excess of the amounts recognized on the Statement of Assets and Liabilities. Such risks involve the possibilities that there will be no liquid market for these swaps, that the counterparty to the swaps may default on its obligation to perform or disagree as to the meaning of the contractual terms in the swaps and that there may be unfavorable changes in interest rates, the price of the index or the security underlying these transactions, among other risks.
Equity Swaps (Total Return Swaps). Total return swap contracts are agreements between counterparties to exchange cash flow, one based on a market-linked return of an individual asset or group of assets (such as an index), and the other on a fixed or floating rate. As a total return swap, an equity swap may be structured in different ways. For example, when the Allocation Funds enters into a “long” equity swap, the counterparty may agree to pay the Allocation Funds the amount, if any, by which the notional amount of the equity swap would have increased in value had it been invested in a particular referenced security or securities, plus the dividends that would have been received on those securities. In return, the Allocation Funds will generally agree to pay the counterparty interest on the notional amount of the equity swap plus the amount, if any, by which that notional amount would have decreased in value had it been invested in such referenced security or securities, plus, in certain
Notes to Financial Statements (continued)
instances, commissions or trading spreads on the notional amounts. Therefore, the Allocation Funds' return on the equity swap generally should equal the gain or loss on the notional amount, plus dividends on the referenced security or securities less the interest paid by the Allocation Funds on the notional amount. Alternatively, when the Allocation Funds enters into a “short” equity swap, the counterparty will generally agree to pay the Allocation Funds the amount, if any, by which the notional amount of the equity swap would have decreased in value had the Allocation Funds sold a particular referenced security or securities short, less the dividend expense that the Allocation Funds would have incurred on the referenced security or securities, as adjusted for interest payments or other economic factors. In this situation, the Allocation Funds will generally be obligated to pay the amount, if any, by which the notional amount of the swap would have increased in value had it been invested directly in the referenced security or securities.
Equity swaps generally do not involve the delivery of securities or other referenced assets. Accordingly, the risk of loss with respect to equity swaps is normally limited to the net amount of payments that the Allocation Funds is contractually obligated to make. If the other party to an equity swap defaults, the Allocation Funds' risk of loss consists of the net amount of payments that the Allocation Funds is contractually entitled to receive, if any. The Allocation Funds will segregate cash or liquid assets, enter into offsetting transactions or use other measures permitted by applicable law to “cover” the Allocation Funds' current obligations. The Allocation Funds and New York Life Investments, however, believe these transactions do not constitute senior securities under the 1940 Act and, accordingly, will not treat them as being subject to the Allocation Funds' borrowing restrictions.
Equity swaps are derivatives and their value can be very volatile. The Allocation Funds may engage in total return swaps to gain exposure to emerging markets securities, along with offsetting long total return swap positions to maintain appropriate currency balances and risk exposures across all swap positions. To the extent that the Manager, or the Subadvisor do not accurately analyze and predict future market trends, the values or assets or economic factors, the Allocation Funds may suffer a loss, which may be substantial. As of October 31, 2023, open swap agreements are shown in the Portfolio of Investments.
(H) LIBOR Replacement Risk. The Allocation Funds may invest in certain debt securities, derivatives or other financial instruments that have relied or continue to rely on the London Interbank Offered Rate ("LIBOR"), as a “benchmark” or “reference rate” for various interest rate calculations. As of January 1, 2022, the United Kingdom Financial Conduct Authority ("FCA"), which regulates LIBOR, ceased its active encouragement of banks to provide the quotations needed to sustain most LIBOR rates due to the absence of an active market for interbank unsecured lending and other reasons. In connection with supervisory guidance from U.S. regulators, certain U.S. regulated entities have generally ceased to enter into certain new LIBOR contracts after January 1, 2022. On March 15, 2022, the Adjustable Interest Rate (LIBOR) Act was signed into law. This law provides a statutory fallback mechanism on
a nationwide basis to replace LIBOR with a benchmark rate that is selected by the Board of Governors of the Federal Reserve System and based on Secured Overnight Financing Rate ("SOFR") (which measures the cost of overnight borrowings through repurchase agreement transactions collateralized with U.S. Treasury securities) for tough legacy contracts. On February 27, 2023, the Federal Reserve System’s final rule in connection with this law became effective, establishing benchmark replacements based on SOFR and Term SOFR (a forward-looking measurement of market expectations of SOFR implied from certain derivatives markets) for applicable tough legacy contracts governed by U.S. law. In addition, the FCA has announced that it will require the publication of synthetic LIBOR for the one-month, three-month and six-month U.S. Dollar LIBOR settings after June 30, 2023 through at least September 30, 2024. Certain of the Allocation Funds' investments may involve individual tough legacy contracts which may be subject to the Adjustable Interest Rate (LIBOR) Act or synthetic LIBOR and no assurances can be given that these measures will have had the intended effects. Although the transition process away from LIBOR for many instruments has been completed, some LIBOR use is continuing and there are potential effects related to the transition away from LIBOR or continued use of LIBOR on the Allocation Funds.
The elimination of LIBOR or changes to other reference rates or any other changes or reforms to the determination or supervision of reference rates could have an adverse impact on the market for, or value of, any securities or payments linked to those reference rates, which may adversely affect the Allocation Funds' performance and/or net asset value. It could also lead to a reduction in the interest rates on, and the value of, some LIBOR-based investments and reduce the effectiveness of hedges mitigating risk in connection with LIBOR-based investments. Uncertainty and risk also remain regarding the willingness and ability of issuers and lenders to include enhanced provisions in new and existing contracts or instruments. Consequently, the transition away from LIBOR to other reference rates may lead to increased volatility and illiquidity in markets that are tied to LIBOR, fluctuations in values of LIBOR-related investments or investments in issuers that utilize LIBOR, increased difficulty in borrowing or refinancing and diminished effectiveness of hedging strategies, adversely affecting the Allocation Funds' performance. Furthermore, the risks associated with the expected discontinuation of LIBOR and transition may be exacerbated if the work necessary to effect an orderly transition to an alternative reference rate is not completed in a timely manner. The usefulness of LIBOR as a benchmark could deteriorate anytime during this transition period. Any such effects of the transition process, including unforeseen effects, could result in losses to the Allocation Funds.
(I) Indemnifications. Under the Trust’s organizational documents, its officers and trustees are indemnified against certain liabilities that may arise out of performance of their duties to the Trust. Additionally, in the normal course of business, the Allocation Funds enter into contracts with third-party service providers that contain a variety of representations and warranties and that may provide general indemnifications. The Allocation Funds' maximum exposure under these arrangements is unknown, as
| 84 | MainStay Asset Allocation Funds |
this would involve future claims that may be made against the Allocation Funds that have not yet occurred. The Manager believes that the risk of loss in connection with these potential indemnification obligations is remote. However, there can be no assurance that material liabilities related to such obligations will not arise in the future, which could adversely impact the Allocation Funds.
(J) Quantitative Disclosure of Derivative Holdings. The following tables show additional disclosures related to the Allocation Funds' derivative and hedging activities, including how such activities are accounted for and their effect on the Allocation Funds' financial positions, performance and cash flows.
The Allocation Funds entered into total return swap contracts to seek to enhance returns or reduce the risk of loss by hedging certain of the Allocation Funds' holdings. These derivatives are not accounted for as hedging instruments.
MainStay Conservative Allocation Fund
The effect of derivative instruments on the Statement of Operations for the year ended October 31, 2023:
| Net Realized Gain (Loss) from: | Equity
Contracts
Risk | Total |
| Swap Transactions | $(8,222,111) | $(8,222,111) |
| Total Net Realized Gain (Loss) | $(8,222,111) | $(8,222,111) |
| Average Notional Amount | Total |
| Swap Contracts Long | $ 72,046,294 |
| Swap Contracts Short | $(51,902,947) |
MainStay Moderate Allocation Fund
The effect of derivative instruments on the Statement of Operations for the year ended October 31, 2023:
| Net Realized Gain (Loss) from: | Equity
Contracts
Risk | Total |
| Swap Transactions | $(15,171,783) | $(15,171,783) |
| Total Net Realized Gain (Loss) | $(15,171,783) | $(15,171,783) |
| Average Notional Amount | Total |
| Swap Contracts Long | $134,486,279 |
| Swap Contracts Short | $ (96,470,083) |
MainStay Growth Allocation Fund
The effect of derivative instruments on the Statement of Operations for the year ended October 31, 2023:
| Net Realized Gain (Loss) from: | Equity
Contracts
Risk | Total |
| Swap Transactions | $(15,924,167) | $(15,924,167) |
| Total Net Realized Gain (Loss) | $(15,924,167) | $(15,924,167) |
| Average Notional Amount | Total |
| Swap Contracts Long | $138,520,198 |
| Swap Contracts Short | $ (99,753,429) |
MainStay Equity Allocation Fund
The effect of derivative instruments on the Statement of Operations for the year ended October 31, 2023:
| Net Realized Gain (Loss) from: | Equity
Contracts
Risk | Total |
| Swap Transactions | $(5,101,478) | $(5,101,478) |
| Total Net Realized Gain (Loss) | $(5,101,478) | $(5,101,478) |
| Average Notional Amount | Total |
| Swap Contracts Long | $ 64,115,139 |
| Swap Contracts Short | $(52,405,544) |
Note 3–Fees and Related Party Transactions
(A) Manager. New York Life Investments, a registered investment adviser and an indirect, wholly-owned subsidiary of New York Life Insurance Company (“New York Life”), serves as the Allocation Funds' Manager, pursuant to an Amended and Restated Management Agreement (“Management Agreement”) and is responsible for the day-to-day portfolio management of the Allocation Funds. The Manager provides offices, conducts clerical, recordkeeping and bookkeeping services, and keeps most of the financial and accounting records required to be maintained by the Allocation Funds. Except for the portion of salaries and expenses that are the responsibility of the Allocation Funds, the Manager pays the salaries and expenses of all personnel affiliated with the Allocation Funds and certain operational expenses of the Allocation Funds. The Allocation Funds reimburse New York Life Investments in an amount equal to a portion of the compensation of the Chief Compliance Officer attributable to the Allocation Funds.
The Allocation Funds do not pay any fees to the Manager in return for the services performed under the Management Agreement. The Allocation Funds do, however, indirectly pay a proportionate share of the management fees paid to the managers of the Underlying Portfolios/Funds in which the Allocation Funds invest.
Notes to Financial Statements (continued)
New York Life Investments has contractually agreed to waive fees and/or reimburse expenses so that Total Annual Fund Operating Expenses (excluding taxes, interest, litigation, extraordinary expenses, brokerage and other transaction expenses relating to the purchase and sale of portfolio investments, and acquired (underlying) fund fees and expenses) of a class do not exceed the following percentages of average daily net assets for each class:
| Fund | Class A | Investor Class | Class B | Class C | Class I | Class R2 | Class R3 | SIMPLE Class |
| MainStay Conservative Allocation Fund | 0.50% | 0.55% | 1.30% | 1.30% | 0.25% | 0.60% | 0.85% | 0.80% |
| MainStay Moderate Allocation Fund | 0.50 | 0.55 | 1.30 | 1.30 | 0.25 | 0.60 | 0.85 | 0.80 |
| MainStay Growth Allocation Fund | 0.50 | 0.55 | 1.30 | 1.30 | 0.25 | 0.60 | 0.85 | 0.80 |
| MainStay Equity Allocation Fund | 0.50 | 0.55 | 1.30 | 1.30 | 0.25 | N/A | 0.85 | 0.80 |
This agreement will remain in effect until February 28, 2024, and shall renew automatically for one-year terms unless New York Life Investments provides written notice of termination prior to the start of the next term or upon approval of the Board.
During the year ended October 31, 2023, New York Life Investments waived its fees and/or reimbursed expenses of the Allocation Funds as follows:
| Fund | Total |
| MainStay Conservative Allocation Fund | $ 67,060 |
| MainStay Moderate Allocation Fund | 158,001 |
| MainStay Growth Allocation Fund | 184,110 |
| MainStay Equity Allocation Fund | 132,318 |
JPMorgan provides sub-administration and sub-accounting services to the Allocation Funds pursuant to an agreement with New York Life Investments. These services include calculating the daily NAVs of the Allocation Funds, maintaining the general ledger and sub-ledger accounts for the calculation of the Allocation Funds' respective NAVs, and assisting New York Life Investments in conducting various aspects of the Allocation Funds' administrative operations. For providing these services to the Allocation Funds, JPMorgan is compensated by New York Life Investments.
Pursuant to an agreement between the Trust and New York Life Investments, New York Life Investments is responsible for providing or procuring certain regulatory reporting services for the Allocation Funds. The Allocation Funds will reimburse New York Life Investments for the actual costs incurred by New York Life Investments in connection with providing or procuring these services for the Allocation Funds.
(B) Distribution, Service and Shareholder Service Fees. The Trust, on behalf of the Allocation Funds, has entered into a distribution agreement with NYLIFE Distributors LLC (the “Distributor”), an affiliate of New York Life Investments. The Allocation Funds have adopted distribution plans (the “Plans”) in accordance with the provisions of Rule 12b-1 under the 1940 Act.
Pursuant to the Class A, Investor Class and Class R2 Plans, the Distributor receives a monthly fee from the Class A, Investor Class and Class R2 shares at an annual rate of 0.25% of the average daily net assets of the Class A, Investor Class and Class R2 shares for distribution and/or service activities as designated by the Distributor. Pursuant to the Class B and Class C Plans, Class B and Class C shares pay the
Distributor a monthly distribution fee at an annual rate of 0.75% of the average daily net assets of the Class B and Class C shares, along with a service fee at an annual rate of 0.25% of the average daily net assets of the Class B and Class C shares, for a total 12b-1 fee of 1.00%. Pursuant to the Class R3 and SIMPLE Class Plans, Class R3 and SIMPLE Class shares pay the Distributor a monthly distribution fee at an annual rate of 0.25% of the average daily net assets of the Class R3 and SIMPLE Class shares, along with a service fee at an annual rate of 0.25% of the average daily net assets of the Class R3 and SIMPLE Class shares, for a total 12b-1 fee of 0.50%. Class I shares are not subject to a distribution and/or service fee.
The Plans provide that the distribution and service fees are payable to the Distributor regardless of the amounts actually expended by the Distributor for distribution of the Allocation Funds' shares and service activities.
In accordance with the Shareholder Services Plans for the Class R1, Class R2 and Class R3 shares, the Manager has agreed to provide, through its affiliates or independent third parties, various shareholder and administrative support services to shareholders of the Class R1, Class R2 and Class R3 shares. For its services, the Manager, its affiliates or independent third-party service providers are entitled to a shareholder service fee accrued daily and paid monthly at an annual rate of 0.10% of the average daily net assets of the Class R1, Class R2 and Class R3 shares. This is in addition to any fees paid under the Class R2 and Class R3 Plans.
During the year ended October 31, 2023, shareholder service fees incurred by the Fund were as follows:
| MainStay Conservative Allocation Fund |
| Class R2 | $ 152 |
| Class R3 | 2,479 |
| |
| MainStay Moderate Allocation Fund |
| Class R2 | $ 164 |
| Class R3 | 1,770 |
| |
| MainStay Growth Allocation Fund |
| Class R2 | $ 71 |
| Class R3 | 1,034 |
| |
| 86 | MainStay Asset Allocation Funds |
| MainStay Equity Allocation Fund |
| Class R3 | $1,968 |
(C) Sales Charges. The Allocation Funds were advised by the Distributor that the amount of initial sales charges retained on sales of each class of shares during the year ended October 31, 2023, was as follows:
| MainStay Conservative Allocation Fund | |
| Class A | $ 23,888 |
| Investor Class | 7,421 |
| |
| MainStay Moderate Allocation Fund | |
| Class A | $ 57,835 |
| Investor Class | 24,614 |
| |
| MainStay Growth Allocation Fund | |
| Class A | $ 69,583 |
| Investor Class | 25,011 |
| |
| MainStay Equity Allocation Fund | |
| Class A | $ 38,762 |
| Investor Class | 14,794 |
The Allocation Funds were also advised that the Distributor retained CDSCs on redemptions of Class A, Investor Class, Class B and Class C shares during the year ended October 31, 2023, as follows:
| MainStay Conservative Allocation Fund | |
| Class A | $ 15,281 |
| Class B | 34 |
| Class C | 878 |
| |
| MainStay Moderate Allocation Fund | |
| Class A | $ 7,353 |
| Investor Class | 32 |
| Class B | 95 |
| Class C | 1,918 |
| |
| MainStay Growth Allocation Fund | |
| Class A | $ 3,719 |
| Investor Class | 63 |
| Class B | 77 |
| Class C | 1,544 |
| |
| MainStay Equity Allocation Fund | |
| Class A | $ 2,790 |
| Class B | 112 |
| Class C | 677 |
(D) Transfer, Dividend Disbursing and Shareholder Servicing Agent. NYLIM Service Company LLC, an affiliate of New York Life Investments, is the Allocation Funds’ transfer, dividend disbursing and shareholder servicing agent pursuant to an agreement between NYLIM Service Company LLC and the Trust. NYLIM Service Company LLC has entered into an agreement with SS&C Global Investor and Distribution Solutions, Inc. ("SS&C"), pursuant to which SS&C performs certain transfer agent services on behalf of NYLIM Service Company LLC. New York Life Investments has contractually agreed to limit the transfer agency expenses charged to each of the Fund’s share classes to a maximum of 0.35% of that share class’s average daily net assets on an annual basis after deducting any applicable Fund or class-level expense reimbursement or small account fees. This agreement will remain in effect until February 28, 2024 and shall renew automatically for one-year terms unless New York Life Investments provides written notice of termination prior to the start of the next term or upon approval of the Board. During the year ended October 31, 2023, transfer agent expenses incurred by the Allocation Funds and any reimbursements, pursuant to the aforementioned Transfer Agency expense limitation agreement, were as follows:
| MainStay Conservative Allocation Fund | Expense | Waived |
| Class A | $ 200,430 | $ — |
| Investor Class | 122,050 | — |
| Class B | 16,719 | — |
| Class C | 57,197 | — |
| Class I | 4,715 | — |
| Class R2 | 91 | — |
| Class R3 | 1,487 | — |
| SIMPLE Class | 2,922 | — |
| MainStay Moderate Allocation Fund | Expense | Waived |
| Class A | $ 361,697 | $ — |
| Investor Class | 338,279 | — |
| Class B | 47,479 | — |
| Class C | 69,986 | — |
| Class I | 4,770 | — |
| Class R2 | 95 | — |
| Class R3 | 1,022 | — |
| SIMPLE Class | 9,210 | — |
Notes to Financial Statements (continued)
| MainStay Growth Allocation Fund | Expense | Waived |
| Class A | $ 408,724 | $ — |
| Investor Class | 402,418 | — |
| Class B | 55,112 | — |
| Class C | 73,660 | — |
| Class I | 5,969 | — |
| Class R2 | 46 | — |
| Class R3 | 670 | — |
| SIMPLE Class | 6,560 | — |
| MainStay Equity Allocation Fund | Expense | Waived |
| Class A | $ 231,230 | $ — |
| Investor Class | 240,795 | — |
| Class B | 34,813 | — |
| Class C | 39,918 | — |
| Class I | 4,000 | — |
| Class R3 | 1,417 | — |
| SIMPLE Class | 4,784 | — |
(E) Small Account Fee. Shareholders with small accounts adversely impact the cost of providing transfer agency services. In an effort to reduce total transfer agency expenses, the Fund has implemented a small account fee on certain types of accounts. As described in the Fund's prospectus, certain shareholders with an account balance of less than $1,000 ($5,000 for Class A share accounts) are charged an annual per account fee of $20 (assessed semi-annually), the proceeds from which offset transfer agent fees as reflected in the Statement of Operations. This small account fee will not apply to certain types of accounts as described further in the Fund’s prospectus.
(F) Capital. As of October 31, 2023, New York Life and its affiliates beneficially held shares of the Allocation Funds with the values and percentages of net assets as follows:
| MainStay Conservative Allocation Fund | | |
| SIMPLE Class | $24,393 | 1.2% |
| |
| MainStay Moderate Allocation Fund | | |
| SIMPLE Class | $25,672 | 0.4% |
| |
| MainStay Growth Allocation Fund | | |
| SIMPLE Class | $27,180 | 0.6% |
| |
| MainStay Equity Allocation Fund | | |
| SIMPLE Class | $27,853 | 1.0% |
Note 4-Federal Income Tax
As of October 31, 2023, the cost and unrealized appreciation (depreciation) of each Allocation Fund’s investment portfolio, including applicable derivative contracts and other financial instruments, as determined on a federal income tax basis, were as follows:
| MainStay Conservative Allocation Fund |
| | Federal Tax
Cost | Gross
Unrealized
Appreciation | Gross
Unrealized
(Depreciation) | Net
Unrealized
Appreciation/
(Depreciation) |
| Investments in Securities | $386,777,953 | $12,266,375 | $(30,511,775) | $(18,245,400) |
| MainStay Moderate Allocation Fund |
| | Federal Tax
Cost | Gross
Unrealized
Appreciation | Gross
Unrealized
(Depreciation) | Net
Unrealized
Appreciation/
(Depreciation) |
| Investments in Securities | $712,000,010 | $39,811,844 | $(39,437,406) | $374,438 |
| MainStay Growth Allocation Fund |
| | Federal Tax
Cost | Gross
Unrealized
Appreciation | Gross
Unrealized
(Depreciation) | Net
Unrealized
Appreciation/
(Depreciation) |
| Investments in Securities | $692,710,725 | $52,239,980 | $(14,596,562) | $37,643,418 |
| MainStay Equity Allocation Fund |
| | Federal Tax
Cost | Gross
Unrealized
Appreciation | Gross
Unrealized
(Depreciation) | Net
Unrealized
Appreciation/
(Depreciation) |
| Investments in Securities | $365,175,698 | $35,025,208 | $(13,644,040) | $21,381,168 |
| 88 | MainStay Asset Allocation Funds |
As of October 31, 2023, the components of accumulated gain (loss) on a tax basis were as follows:
| Fund | Ordinary
Income | Accumulated
Capital
and Other
Gain (Loss) | Other
Temporary
Differences | Unrealized
Appreciation
(Depreciation) | Total
Accumulated
Gain (Loss) |
| MainStay Conservative Allocation Fund | $ — | $(1,838,248) | $— | $(16,726,627) | $(18,564,875) |
| MainStay Moderate Allocation Fund | — | (2,495,745) | — | 2,870,183 | 374,438 |
| MainStay Growth Allocation Fund | 1,172,925 | (2,872,537) | — | 40,515,955 | 38,816,343 |
| MainStay Equity Allocation Fund | — | (3,374,805) | — | 22,563,134 | 19,188,329 |
The difference between book-basis and tax-basis unrealized appreciation (depreciation) is primarily due to wash sale and straddle loss deferral adjustments.
The following table discloses the current year reclassifications between total distributable earnings (loss) and additional paid-in capital arising from permanent differences; net assets as of October 31, 2023 were not affected.
| Fund | Total
Distributable
Earnings (Loss) | Additional
Paid-In
Capital |
| MainStay Conservative Allocation Fund | $ — | $ — |
| MainStay Moderate Allocation Fund | 3,111,632 | (3,111,632) |
| MainStay Growth Allocation Fund | — | — |
| MainStay Equity Allocation Fund | 2,965,073 | (2,965,073) |
The reclassifications for the Funds are primarily due to distribution in excess of income.
As of October 31, 2023, for federal income tax purposes, capital loss carryforwards of $319,475, as shown in the table below, were available to the extent provided by the regulations to offset future realized gains of MainStay Conservative Allocation Fund. Accordingly, no capital gains
distributions are expected to be paid to shareholders until net gains have been realized in excess of such amounts.
Capital Loss
Available Through | Short-Term
Capital Loss
Amounts (000’s) | Long-Term
Capital Loss
Amounts (000’s) |
| Unlimited | $— | $319 |
As of October 31, 2023, for federal income tax purposes, capital loss carryforwards of $2,192,839, as shown in the table below, were available to the extent provided by the regulations to offset future realized gains of MainStay Equity Allocation Fund. Accordingly, no capital gains distributions are expected to be paid to shareholders until net gains have been realized in excess of such amounts.
Capital Loss
Available Through | Short-Term
Capital Loss
Amounts (000’s) | Long-Term
Capital Loss
Amounts (000’s) |
| Unlimited | $14 | $2,179 |
During the years ended October 31, 2023 and October 31, 2022, the tax character of distributions paid as reflected in the Statements of Changes in Net Assets was as follows:
| | 2023 | | 2022 |
| Fund | Ordinary
Income | Long-Term
Capital Gains | Return of Capital | Total | | Ordinary
Income | Long-Term
Capital Gains | Total |
| MainStay Conservative Allocation Fund | $ 4,038,761 | $ 6,969,769 | $6,469,787 | $17,478,317 | | $19,955,173 | $18,576,345 | $38,531,518 |
| MainStay Moderate Allocation Fund | 10,715,476 | 28,954,715 | — | 39,670,191 | | 35,112,571 | 42,920,940 | 78,033,511 |
| MainStay Growth Allocation Fund | 9,642,885 | 42,606,280 | — | 52,249,165 | | 34,790,239 | 57,066,545 | 91,856,784 |
| MainStay Equity Allocation Fund | 7,684,587 | 31,247,607 | — | 38,932,194 | | 24,711,549 | 30,472,368 | 55,183,917 |
Note 5–Custodian
JPMorgan is the custodian of cash and securities held by the Allocation Funds. Custodial fees are charged to each Allocation Fund based on each Allocation Fund's net assets and/or the market value of securities held by each Allocation Fund and the number of certain transactions incurred by each Allocation Fund.
Note 6–Line of Credit
The Allocation Funds and certain other funds managed by New York Life Investments maintain a line of credit with a syndicate of banks in order to secure a source of funds for temporary purposes to meet unanticipated or excessive redemption requests.
Notes to Financial Statements (continued)
Effective July 25, 2023, under the credit agreement (the “Credit Agreement”), the aggregate commitment amount is $600,000,000 with an additional uncommitted amount of $100,000,000. The commitment fee is an annual rate of 0.15% of the average commitment amount payable quarterly, regardless of usage, to JPMorgan, who serves as the agent to the syndicate. The commitment fee is allocated among the Allocation Funds and certain other funds managed by New York Life Investments based upon their respective net assets and other factors. Interest on any revolving credit loan is charged based upon the Federal Funds Rate, Daily Simple Secured Overnight Financing Rate ("SOFR") + 0.10%, or the Overnight Bank Funding Rate, whichever is higher. The Credit Agreement expires on July 23, 2024, although the Allocation Funds, certain other funds managed by New York Life Investments and the syndicate of banks may renew the Credit Agreement for an additional year on the same or different terms or enter into a credit agreement with a different syndicate of banks. Prior to July 25, 2023, the aggregate commitment amount and the commitment fee were the same as those under the current Credit Agreement. During the year ended October 31, 2023, there were no borrowings made or outstanding with respect to the Allocation Funds under the Credit Agreement.
Note 7–Interfund Lending Program
Pursuant to an exemptive order issued by the SEC, the Allocation Funds, along with certain other funds managed by New York Life Investments, may participate in an interfund lending program. The interfund lending program provides an alternative credit facility that permits the Allocation Funds and certain other funds managed by New York Life Investments to lend or borrow money for temporary purposes directly to or from one another, subject to the conditions of the exemptive order. During the year ended October 31, 2023, there were no interfund loans made or outstanding with respect to the Allocation Funds.
Note 8–Purchases and Sales of Securities (in 000’s)
During the year ended October 31, 2023, purchases and sales of securities were as follows:
| Fund | Purchases | Sales |
| MainStay Conservative Allocation Fund | $ 69,860 | $102,173 |
| MainStay Moderate Allocation Fund | 155,394 | 183,179 |
| MainStay Growth Allocation Fund | 185,370 | 214,086 |
| MainStay Equity Allocation Fund | 91,591 | 101,032 |
Note 9–Capital Share Transactions
Transactions in capital shares for the years ended October 31, 2023 and October 31, 2022, were as follows:
MainStay Conservative Allocation Fund
| Class A | Shares | Amount |
| Year ended October 31, 2023: | | |
| Shares sold | 1,825,511 | $ 20,067,573 |
| Shares issued to shareholders in reinvestment of distributions | 1,355,130 | 14,650,400 |
| Shares redeemed | (5,502,780) | (60,483,372) |
| Net increase (decrease) in shares outstanding before conversion | (2,322,139) | (25,765,399) |
| Shares converted into Class A (See Note 1) | 675,316 | 7,437,427 |
| Shares converted from Class A (See Note 1) | (1,028) | (11,375) |
| Net increase (decrease) | (1,647,851) | $(18,339,347) |
| Year ended October 31, 2022: | | |
| Shares sold | 3,241,218 | $ 39,327,539 |
| Shares issued to shareholders in reinvestment of distributions | 2,539,638 | 31,663,367 |
| Shares redeemed | (6,009,934) | (70,234,602) |
| Net increase (decrease) in shares outstanding before conversion | (229,078) | 756,304 |
| Shares converted into Class A (See Note 1) | 565,960 | 6,874,220 |
| Net increase (decrease) | 336,882 | $ 7,630,524 |
| |
| Investor Class | Shares | Amount |
| Year ended October 31, 2023: | | |
| Shares sold | 303,166 | $ 3,331,191 |
| Shares issued to shareholders in reinvestment of distributions | 130,090 | 1,405,692 |
| Shares redeemed | (383,584) | (4,216,738) |
| Net increase (decrease) in shares outstanding before conversion | 49,672 | 520,145 |
| Shares converted into Investor Class (See Note 1) | 150,061 | 1,663,424 |
| Shares converted from Investor Class (See Note 1) | (376,864) | (4,137,768) |
| Net increase (decrease) | (177,131) | $ (1,954,199) |
| Year ended October 31, 2022: | | |
| Shares sold | 372,325 | $ 4,417,522 |
| Shares issued to shareholders in reinvestment of distributions | 237,886 | 2,970,897 |
| Shares redeemed | (405,256) | (4,754,108) |
| Net increase (decrease) in shares outstanding before conversion | 204,955 | 2,634,311 |
| Shares converted into Investor Class (See Note 1) | 136,945 | 1,618,308 |
| Shares converted from Investor Class (See Note 1) | (253,600) | (3,165,856) |
| Net increase (decrease) | 88,300 | $ 1,086,763 |
| |
| 90 | MainStay Asset Allocation Funds |
| Class B | Shares | Amount |
| Year ended October 31, 2023: | | |
| Shares sold | 6,867 | $ 74,042 |
| Shares issued to shareholders in reinvestment of distributions | 15,529 | 164,406 |
| Shares redeemed | (78,848) | (851,118) |
| Net increase (decrease) in shares outstanding before conversion | (56,452) | (612,670) |
| Shares converted from Class B (See Note 1) | (186,807) | (2,026,564) |
| Net increase (decrease) | (243,259) | $ (2,639,234) |
| Year ended October 31, 2022: | | |
| Shares sold | 14,547 | $ 166,793 |
| Shares issued to shareholders in reinvestment of distributions | 56,288 | 699,015 |
| Shares redeemed | (177,255) | (2,097,364) |
| Net increase (decrease) in shares outstanding before conversion | (106,420) | (1,231,556) |
| Shares converted from Class B (See Note 1) | (213,538) | (2,488,526) |
| Net increase (decrease) | (319,958) | $ (3,720,082) |
| |
| Class C | Shares | Amount |
| Year ended October 31, 2023: | | |
| Shares sold | 75,687 | $ 818,520 |
| Shares issued to shareholders in reinvestment of distributions | 53,130 | 562,670 |
| Shares redeemed | (386,212) | (4,156,690) |
| Net increase (decrease) in shares outstanding before conversion | (257,395) | (2,775,500) |
| Shares converted from Class C (See Note 1) | (269,755) | (2,925,144) |
| Net increase (decrease) | (527,150) | $ (5,700,644) |
| Year ended October 31, 2022: | | |
| Shares sold | 129,326 | $ 1,517,177 |
| Shares issued to shareholders in reinvestment of distributions | 153,626 | 1,904,640 |
| Shares redeemed | (565,296) | (6,511,415) |
| Net increase (decrease) in shares outstanding before conversion | (282,344) | (3,089,598) |
| Shares converted from Class C (See Note 1) | (244,856) | (2,838,146) |
| Net increase (decrease) | (527,200) | $ (5,927,744) |
| |
| Class I | Shares | Amount |
| Year ended October 31, 2023: | | |
| Shares sold | 230,488 | $ 2,544,900 |
| Shares issued to shareholders in reinvestment of distributions | 32,042 | 350,884 |
| Shares redeemed | (159,046) | (1,769,430) |
| Net increase (decrease) | 103,484 | $ 1,126,354 |
| Year ended October 31, 2022: | | |
| Shares sold | 53,975 | $ 650,165 |
| Shares issued to shareholders in reinvestment of distributions | 52,596 | 662,856 |
| Shares redeemed | (167,870) | (2,011,174) |
| Net increase (decrease) | (61,299) | $ (698,153) |
| |
| Class R2 | Shares | Amount |
| Year ended October 31, 2023: | | |
| Shares sold | 1,194 | $ 13,165 |
| Shares issued to shareholders in reinvestment of distributions | 599 | 6,474 |
| Shares redeemed | (92) | (997) |
| Net increase (decrease) | 1,701 | $ 18,642 |
| Year ended October 31, 2022: | | |
| Shares sold | 1,981 | $ 22,863 |
| Shares issued to shareholders in reinvestment of distributions | 883 | 10,998 |
| Shares redeemed | (85) | (960) |
| Net increase (decrease) | 2,779 | $ 32,901 |
| |
| Class R3 | Shares | Amount |
| Year ended October 31, 2023: | | |
| Shares sold | 46,586 | $ 506,417 |
| Shares issued to shareholders in reinvestment of distributions | 8,920 | 95,982 |
| Shares redeemed | (14,617) | (160,100) |
| Net increase (decrease) | 40,889 | $ 442,299 |
| Year ended October 31, 2022: | | |
| Shares sold | 59,563 | $ 695,614 |
| Shares issued to shareholders in reinvestment of distributions | 10,741 | 132,994 |
| Shares redeemed | (782) | (10,227) |
| Net increase (decrease) | 69,522 | $ 818,381 |
| |
| SIMPLE Class | Shares | Amount |
| Year ended October 31, 2023: | | |
| Shares sold | 106,697 | $ 1,168,087 |
| Shares issued to shareholders in reinvestment of distributions | 6,326 | 68,251 |
| Shares redeemed | (32,717) | (359,823) |
| Net increase (decrease) | 80,306 | $ 876,515 |
| Year ended October 31, 2022: | | |
| Shares sold | 105,252 | $ 1,246,425 |
| Shares issued to shareholders in reinvestment of distributions | 3,382 | 41,449 |
| Shares redeemed | (9,713) | (114,337) |
| Net increase (decrease) | 98,921 | $ 1,173,537 |
Notes to Financial Statements (continued)
MainStay Moderate Allocation Fund
| Class A | Shares | Amount |
| Year ended October 31, 2023: | | |
| Shares sold | 3,202,261 | $ 39,321,541 |
| Shares issued to shareholders in reinvestment of distributions | 2,799,172 | 32,890,277 |
| Shares redeemed | (6,828,277) | (83,781,863) |
| Net increase (decrease) in shares outstanding before conversion | (826,844) | (11,570,045) |
| Shares converted into Class A (See Note 1) | 1,476,474 | 18,127,191 |
| Net increase (decrease) | 649,630 | $ 6,557,146 |
| Year ended October 31, 2022: | | |
| Shares sold | 4,310,609 | $ 58,632,973 |
| Shares issued to shareholders in reinvestment of distributions | 4,409,392 | 63,495,168 |
| Shares redeemed | (6,087,255) | (80,493,181) |
| Net increase (decrease) in shares outstanding before conversion | 2,632,746 | 41,634,960 |
| Shares converted into Class A (See Note 1) | 1,138,271 | 15,841,670 |
| Shares converted from Class A (See Note 1) | (25,139) | (377,349) |
| Net increase (decrease) | 3,745,878 | $ 57,099,281 |
| |
| Investor Class | Shares | Amount |
| Year ended October 31, 2023: | | |
| Shares sold | 827,461 | $ 10,171,397 |
| Shares issued to shareholders in reinvestment of distributions | 368,313 | 4,338,731 |
| Shares redeemed | (776,785) | (9,543,046) |
| Net increase (decrease) in shares outstanding before conversion | 418,989 | 4,967,082 |
| Shares converted into Investor Class (See Note 1) | 274,894 | 3,416,373 |
| Shares converted from Investor Class (See Note 1) | (968,458) | (11,897,082) |
| Net increase (decrease) | (274,575) | $ (3,513,627) |
| Year ended October 31, 2022: | | |
| Shares sold | 1,047,643 | $ 14,035,989 |
| Shares issued to shareholders in reinvestment of distributions | 583,028 | 8,424,747 |
| Shares redeemed | (762,705) | (10,139,771) |
| Net increase (decrease) in shares outstanding before conversion | 867,966 | 12,320,965 |
| Shares converted into Investor Class (See Note 1) | 233,726 | 3,120,077 |
| Shares converted from Investor Class (See Note 1) | (644,002) | (9,178,421) |
| Net increase (decrease) | 457,690 | $ 6,262,621 |
| |
| Class B | Shares | Amount |
| Year ended October 31, 2023: | | |
| Shares sold | 3,497 | $ 42,158 |
| Shares issued to shareholders in reinvestment of distributions | 51,681 | 603,118 |
| Shares redeemed | (133,386) | (1,615,872) |
| Net increase (decrease) in shares outstanding before conversion | (78,208) | (970,596) |
| Shares converted from Class B (See Note 1) | (492,641) | (6,001,797) |
| Net increase (decrease) | (570,849) | $ (6,972,393) |
| Year ended October 31, 2022: | | |
| Shares sold | 17,417 | $ 223,363 |
| Shares issued to shareholders in reinvestment of distributions | 137,033 | 1,960,943 |
| Shares redeemed | (191,411) | (2,531,471) |
| Net increase (decrease) in shares outstanding before conversion | (36,961) | (347,165) |
| Shares converted from Class B (See Note 1) | (471,190) | (6,252,362) |
| Net increase (decrease) | (508,151) | $ (6,599,527) |
| |
| Class C | Shares | Amount |
| Year ended October 31, 2023: | | |
| Shares sold | 125,907 | $ 1,523,284 |
| Shares issued to shareholders in reinvestment of distributions | 71,032 | 828,236 |
| Shares redeemed | (324,580) | (3,922,879) |
| Net increase (decrease) in shares outstanding before conversion | (127,641) | (1,571,359) |
| Shares converted from Class C (See Note 1) | (298,033) | (3,640,901) |
| Net increase (decrease) | (425,674) | $ (5,212,260) |
| Year ended October 31, 2022: | | |
| Shares sold | 151,925 | $ 2,001,192 |
| Shares issued to shareholders in reinvestment of distributions | 160,147 | 2,290,108 |
| Shares redeemed | (379,909) | (5,012,594) |
| Net increase (decrease) in shares outstanding before conversion | (67,837) | (721,294) |
| Shares converted from Class C (See Note 1) | (264,665) | (3,523,021) |
| Net increase (decrease) | (332,502) | $ (4,244,315) |
| |
| 92 | MainStay Asset Allocation Funds |
| Class I | Shares | Amount |
| Year ended October 31, 2023: | | |
| Shares sold | 89,272 | $ 1,090,784 |
| Shares issued to shareholders in reinvestment of distributions | 39,985 | 473,021 |
| Shares redeemed | (187,074) | (2,289,886) |
| Net increase (decrease) | (57,817) | $ (726,081) |
| Year ended October 31, 2022: | | |
| Shares sold | 129,798 | $ 1,768,839 |
| Shares issued to shareholders in reinvestment of distributions | 70,570 | 1,023,972 |
| Shares redeemed | (239,452) | (3,218,447) |
| Net increase (decrease) in shares outstanding before conversion | (39,084) | (425,636) |
| Shares converted into Class I (See Note 1) | 24,366 | 369,406 |
| Net increase (decrease) | (14,718) | $ (56,230) |
| |
| Class R2 | Shares | Amount |
| Year ended October 31, 2023: | | |
| Shares sold | 279 | $ 3,452 |
| Shares issued to shareholders in reinvestment of distributions | 712 | 8,356 |
| Shares redeemed | (256) | (3,139) |
| Net increase (decrease) | 735 | $ 8,669 |
| Year ended October 31, 2022: | | |
| Shares sold | 559 | $ 7,338 |
| Shares issued to shareholders in reinvestment of distributions | 1,079 | 15,531 |
| Shares redeemed | (186) | (2,189) |
| Net increase (decrease) | 1,452 | $ 20,680 |
| |
| Class R3 | Shares | Amount |
| Year ended October 31, 2023: | | |
| Shares sold | 61,228 | $ 754,197 |
| Shares issued to shareholders in reinvestment of distributions | 6,808 | 79,853 |
| Shares redeemed | (52,021) | (645,674) |
| Net increase (decrease) | 16,015 | $ 188,376 |
| Year ended October 31, 2022: | | |
| Shares sold | 27,980 | $ 376,716 |
| Shares issued to shareholders in reinvestment of distributions | 9,668 | 139,128 |
| Shares redeemed | (5,243) | (71,327) |
| Net increase (decrease) | 32,405 | $ 444,517 |
| |
| SIMPLE Class | Shares | Amount |
| Year ended October 31, 2023: | | |
| Shares sold | 331,562 | $ 4,064,307 |
| Shares issued to shareholders in reinvestment of distributions | 15,225 | 179,502 |
| Shares redeemed | (26,988) | (332,260) |
| Net increase (decrease) in shares outstanding before conversion | 319,799 | 3,911,549 |
| Shares converted from SIMPLE Class (See Note 1) | (311) | (3,784) |
| Net increase (decrease) | 319,488 | $ 3,907,765 |
| Year ended October 31, 2022: | | |
| Shares sold | 196,586 | $ 2,591,082 |
| Shares issued to shareholders in reinvestment of distributions | 6,972 | 100,741 |
| Shares redeemed | (9,826) | (131,009) |
| Net increase (decrease) | 193,732 | $ 2,560,814 |
MainStay Growth Allocation Fund
| Class A | Shares | Amount |
| Year ended October 31, 2023: | | |
| Shares sold | 3,011,551 | $ 41,173,419 |
| Shares issued to shareholders in reinvestment of distributions | 3,252,977 | 42,321,240 |
| Shares redeemed | (5,905,220) | (80,731,428) |
| Net increase (decrease) in shares outstanding before conversion | 359,308 | 2,763,231 |
| Shares converted into Class A (See Note 1) | 1,417,769 | 19,378,397 |
| Shares converted from Class A (See Note 1) | (9,590) | (134,191) |
| Net increase (decrease) | 1,767,487 | $ 22,007,437 |
| Year ended October 31, 2022: | | |
| Shares sold | 2,998,767 | $ 45,352,741 |
| Shares issued to shareholders in reinvestment of distributions | 4,508,464 | 73,578,134 |
| Shares redeemed | (5,294,349) | (79,259,848) |
| Net increase (decrease) in shares outstanding before conversion | 2,212,882 | 39,671,027 |
| Shares converted into Class A (See Note 1) | 1,097,499 | 17,558,142 |
| Shares converted from Class A (See Note 1) | (699) | (10,390) |
| Net increase (decrease) | 3,309,682 | $ 57,218,779 |
| |
Notes to Financial Statements (continued)
| Investor Class | Shares | Amount |
| Year ended October 31, 2023: | | |
| Shares sold | 734,117 | $ 10,055,235 |
| Shares issued to shareholders in reinvestment of distributions | 514,529 | 6,714,607 |
| Shares redeemed | (751,519) | (10,314,971) |
| Net increase (decrease) in shares outstanding before conversion | 497,127 | 6,454,871 |
| Shares converted into Investor Class (See Note 1) | 254,922 | 3,542,500 |
| Shares converted from Investor Class (See Note 1) | (997,180) | (13,604,376) |
| Net increase (decrease) | (245,131) | $ (3,607,005) |
| Year ended October 31, 2022: | | |
| Shares sold | 853,832 | $ 12,862,862 |
| Shares issued to shareholders in reinvestment of distributions | 704,025 | 11,517,853 |
| Shares redeemed | (677,404) | (10,185,045) |
| Net increase (decrease) in shares outstanding before conversion | 880,453 | 14,195,670 |
| Shares converted into Investor Class (See Note 1) | 226,568 | 3,404,061 |
| Shares converted from Investor Class (See Note 1) | (690,453) | (11,396,445) |
| Net increase (decrease) | 416,568 | $ 6,203,286 |
| |
| Class B | Shares | Amount |
| Year ended October 31, 2023: | | |
| Shares sold | 2,367 | $ 31,717 |
| Shares issued to shareholders in reinvestment of distributions | 72,241 | 929,021 |
| Shares redeemed | (113,744) | (1,529,107) |
| Net increase (decrease) in shares outstanding before conversion | (39,136) | (568,369) |
| Shares converted from Class B (See Note 1) | (463,828) | (6,298,856) |
| Net increase (decrease) | (502,964) | $ (6,867,225) |
| Year ended October 31, 2022: | | |
| Shares sold | 4,043 | $ 58,430 |
| Shares issued to shareholders in reinvestment of distributions | 163,164 | 2,633,473 |
| Shares redeemed | (177,997) | (2,635,721) |
| Net increase (decrease) in shares outstanding before conversion | (10,790) | 56,182 |
| Shares converted from Class B (See Note 1) | (476,327) | (7,059,122) |
| Net increase (decrease) | (487,117) | $ (7,002,940) |
| |
| Class C | Shares | Amount |
| Year ended October 31, 2023: | | |
| Shares sold | 94,402 | $ 1,271,273 |
| Shares issued to shareholders in reinvestment of distributions | 92,277 | 1,187,605 |
| Shares redeemed | (336,393) | (4,514,659) |
| Net increase (decrease) in shares outstanding before conversion | (149,714) | (2,055,781) |
| Shares converted from Class C (See Note 1) | (221,194) | (3,009,905) |
| Net increase (decrease) | (370,908) | $ (5,065,686) |
| Year ended October 31, 2022: | | |
| Shares sold | 125,156 | $ 1,855,227 |
| Shares issued to shareholders in reinvestment of distributions | 161,426 | 2,607,023 |
| Shares redeemed | (289,182) | (4,330,282) |
| Net increase (decrease) in shares outstanding before conversion | (2,600) | 131,968 |
| Shares converted from Class C (See Note 1) | (165,079) | (2,480,095) |
| Net increase (decrease) | (167,679) | $ (2,348,127) |
| |
| Class I | Shares | Amount |
| Year ended October 31, 2023: | | |
| Shares sold | 250,066 | $ 3,535,573 |
| Shares issued to shareholders in reinvestment of distributions | 46,977 | 620,096 |
| Shares redeemed | (198,492) | (2,738,948) |
| Net increase (decrease) in shares outstanding before conversion | 98,551 | 1,416,721 |
| Shares converted into Class I (See Note 1) | 8,866 | 126,431 |
| Net increase (decrease) | 107,417 | $ 1,543,152 |
| Year ended October 31, 2022: | | |
| Shares sold | 205,566 | $ 2,969,610 |
| Shares issued to shareholders in reinvestment of distributions | 46,454 | 768,348 |
| Shares redeemed | (293,545) | (4,850,249) |
| Net increase (decrease) | (41,525) | $ (1,112,291) |
| |
| Class R1 | Shares | Amount |
| Year ended October 31, 2022:(a) | | |
| Shares sold | 217 | $ 3,599 |
| Shares issued to shareholders in reinvestment of distributions | 366 | 6,054 |
| Shares redeemed | (3,812) | (57,535) |
| Net increase (decrease) | (3,229) | $ (47,882) |
| |
| 94 | MainStay Asset Allocation Funds |
| Class R2 | Shares | Amount |
| Year ended October 31, 2023: | | |
| Shares issued to shareholders in reinvestment of distributions | 415 | $ 5,399 |
| Shares redeemed | (1,451) | (19,532) |
| Net increase (decrease) | (1,036) | $ (14,133) |
| Year ended October 31, 2022: | | |
| Shares issued to shareholders in reinvestment of distributions | 565 | $ 9,226 |
| Shares redeemed | (60) | (814) |
| Net increase (decrease) | 505 | $ 8,412 |
| |
| Class R3 | Shares | Amount |
| Year ended October 31, 2023: | | |
| Shares sold | 13,691 | $ 185,219 |
| Shares issued to shareholders in reinvestment of distributions | 5,226 | 67,736 |
| Shares redeemed | (22,726) | (303,999) |
| Net increase (decrease) | (3,809) | $ (51,044) |
| Year ended October 31, 2022: | | |
| Shares sold | 20,556 | $ 321,992 |
| Shares issued to shareholders in reinvestment of distributions | 9,438 | 153,374 |
| Shares redeemed | (46,301) | (705,174) |
| Net increase (decrease) in shares outstanding before conversion | (16,307) | (229,808) |
| Shares converted from Class R3 (See Note 1) | (1,210) | (16,151) |
| Net increase (decrease) | (17,517) | $ (245,959) |
| |
| SIMPLE Class | Shares | Amount |
| Year ended October 31, 2023: | | |
| Shares sold | 188,294 | $ 2,578,541 |
| Shares issued to shareholders in reinvestment of distributions | 17,071 | 223,125 |
| Shares redeemed | (63,741) | (867,586) |
| Net increase (decrease) | 141,624 | $ 1,934,080 |
| Year ended October 31, 2022: | | |
| Shares sold | 137,751 | $ 2,062,207 |
| Shares issued to shareholders in reinvestment of distributions | 11,687 | 191,425 |
| Shares redeemed | (13,003) | (197,173) |
| Net increase (decrease) | 136,435 | $ 2,056,459 |
| (a) | Class R1 liquidated and no longer offered for sale as of April 28, 2022. |
MainStay Equity Allocation Fund
| Class A | Shares | Amount |
| Year ended October 31, 2023: | | |
| Shares sold | 1,778,515 | $ 25,173,338 |
| Shares issued to shareholders in reinvestment of distributions | 2,272,820 | 30,273,962 |
| Shares redeemed | (2,748,476) | (38,870,329) |
| Net increase (decrease) in shares outstanding before conversion | 1,302,859 | 16,576,971 |
| Shares converted into Class A (See Note 1) | 837,211 | 11,822,136 |
| Shares converted from Class A (See Note 1) | (87) | (1,202) |
| Net increase (decrease) | 2,139,983 | $ 28,397,905 |
| Year ended October 31, 2022: | | |
| Shares sold | 1,692,419 | $ 27,586,671 |
| Shares issued to shareholders in reinvestment of distributions | 2,377,051 | 42,430,363 |
| Shares redeemed | (2,572,629) | (41,487,935) |
| Net increase (decrease) in shares outstanding before conversion | 1,496,841 | 28,529,099 |
| Shares converted into Class A (See Note 1) | 540,027 | 9,463,094 |
| Shares converted from Class A (See Note 1) | (34) | (569) |
| Net increase (decrease) | 2,036,834 | $ 37,991,624 |
| |
| Investor Class | Shares | Amount |
| Year ended October 31, 2023: | | |
| Shares sold | 474,160 | $ 6,710,903 |
| Shares issued to shareholders in reinvestment of distributions | 428,984 | 5,714,066 |
| Shares redeemed | (476,362) | (6,732,595) |
| Net increase (decrease) in shares outstanding before conversion | 426,782 | 5,692,374 |
| Shares converted into Investor Class (See Note 1) | 129,559 | 1,864,152 |
| Shares converted from Investor Class (See Note 1) | (583,935) | (8,226,270) |
| Net increase (decrease) | (27,594) | $ (669,744) |
| Year ended October 31, 2022: | | |
| Shares sold | 502,859 | $ 8,114,965 |
| Shares issued to shareholders in reinvestment of distributions | 438,877 | 7,833,960 |
| Shares redeemed | (374,514) | (6,052,697) |
| Net increase (decrease) in shares outstanding before conversion | 567,222 | 9,896,228 |
| Shares converted into Investor Class (See Note 1) | 108,545 | 1,770,436 |
| Shares converted from Investor Class (See Note 1) | (345,839) | (6,278,887) |
| Net increase (decrease) | 329,928 | $ 5,387,777 |
| |
Notes to Financial Statements (continued)
| Class B | Shares | Amount |
| Year ended October 31, 2023: | | |
| Shares sold | 389 | $ 5,230 |
| Shares issued to shareholders in reinvestment of distributions | 69,384 | 890,193 |
| Shares redeemed | (92,560) | (1,262,149) |
| Net increase (decrease) in shares outstanding before conversion | (22,787) | (366,726) |
| Shares converted from Class B (See Note 1) | (282,868) | (3,873,248) |
| Net increase (decrease) | (305,655) | $ (4,239,974) |
| Year ended October 31, 2022: | | |
| Shares sold | 2,093 | $ 35,116 |
| Shares issued to shareholders in reinvestment of distributions | 108,219 | 1,866,768 |
| Shares redeemed | (100,442) | (1,573,542) |
| Net increase (decrease) in shares outstanding before conversion | 9,870 | 328,342 |
| Shares converted from Class B (See Note 1) | (235,669) | (3,698,337) |
| Net increase (decrease) | (225,799) | $ (3,369,995) |
| |
| Class C | Shares | Amount |
| Year ended October 31, 2023: | | |
| Shares sold | 50,468 | $ 683,433 |
| Shares issued to shareholders in reinvestment of distributions | 75,273 | 968,019 |
| Shares redeemed | (168,666) | (2,278,811) |
| Net increase (decrease) in shares outstanding before conversion | (42,925) | (627,359) |
| Shares converted from Class C (See Note 1) | (116,014) | (1,585,568) |
| Net increase (decrease) | (158,939) | $ (2,212,927) |
| Year ended October 31, 2022: | | |
| Shares sold | 59,338 | $ 910,154 |
| Shares issued to shareholders in reinvestment of distributions | 95,825 | 1,656,787 |
| Shares redeemed | (142,326) | (2,243,135) |
| Net increase (decrease) in shares outstanding before conversion | 12,837 | 323,806 |
| Shares converted from Class C (See Note 1) | (77,670) | (1,239,389) |
| Net increase (decrease) | (64,833) | $ (915,583) |
| |
| Class I | Shares | Amount |
| Year ended October 31, 2023: | | |
| Shares sold | 26,561 | $ 377,541 |
| Shares issued to shareholders in reinvestment of distributions | 38,925 | 530,552 |
| Shares redeemed | (75,901) | (1,100,828) |
| Net increase (decrease) | (10,415) | $ (192,735) |
| Year ended October 31, 2022: | | |
| Shares sold | 60,046 | $ 1,056,549 |
| Shares issued to shareholders in reinvestment of distributions | 42,339 | 771,834 |
| Shares redeemed | (63,110) | (1,064,905) |
| Net increase (decrease) | 39,275 | $ 763,478 |
| |
| Class R3 | Shares | Amount |
| Year ended October 31, 2023: | | |
| Shares sold | 20,292 | $ 284,024 |
| Shares issued to shareholders in reinvestment of distributions | 12,754 | 168,606 |
| Shares redeemed | (32,098) | (442,365) |
| Net increase (decrease) | 948 | $ 10,265 |
| Year ended October 31, 2022: | | |
| Shares sold | 19,970 | $ 324,343 |
| Shares issued to shareholders in reinvestment of distributions | 11,666 | 206,725 |
| Shares redeemed | (4,037) | (71,215) |
| Net increase (decrease) in shares outstanding before conversion | 27,599 | 459,853 |
| Shares converted from Class R3 (See Note 1) | (1,163) | (16,348) |
| Net increase (decrease) | 26,436 | $ 443,505 |
| |
| SIMPLE Class | Shares | Amount |
| Year ended October 31, 2023: | | |
| Shares sold | 119,470 | $ 1,690,668 |
| Shares issued to shareholders in reinvestment of distributions | 11,472 | 153,037 |
| Shares redeemed | (23,660) | (333,838) |
| Net increase (decrease) | 107,282 | $ 1,509,867 |
| Year ended October 31, 2022: | | |
| Shares sold | 70,829 | $ 1,110,829 |
| Shares issued to shareholders in reinvestment of distributions | 3,896 | 69,622 |
| Shares redeemed | (2,539) | (41,112) |
| Net increase (decrease) | 72,186 | $ 1,139,339 |
| 96 | MainStay Asset Allocation Funds |
Note 10–Other Matters
As of the date of this report, the Funds face a heightened level of risk associated with current uncertainty, volatility and state of economies, financial markets, rising interest rates, and labor and health conditions around the world. Events such as war, acts of terrorism, recessions, rapid inflation, the imposition of international sanctions, earthquakes, hurricanes, epidemics and pandemics and other unforeseen natural or human disasters may have broad adverse social, political and economic effects on the global economy, which could negatively impact the value of the Funds' investments. Developments that disrupt global economies and financial markets may magnify factors that affect the Funds' performance.
Note 11–Subsequent Events
In connection with the preparation of the financial statements of the Allocation Funds as of and for the year ended October 31, 2023, events and transactions subsequent to October 31, 2023, through the date the financial statements were issued, have been evaluated by the Manager for possible adjustment and/or disclosure. No subsequent events requiring financial statement adjustment or disclosure have been identified.
Report of Independent Registered Public Accounting Firm
To the Shareholders of the Funds and Board of Trustees
MainStay Funds Trust:
Opinion on the Financial Statements
We have audited the accompanying statements of assets and liabilities of MainStay Conservative Allocation Fund, MainStay Moderate Allocation Fund, MainStay Growth Allocation Fund, and MainStay Equity Allocation Fund (each a Fund and collectively, the Funds), four of the funds constituting MainStay Funds Trust, including the portfolios of investments, as of October 31, 2023, the related statements of operations for the year then ended, the statements of changes in net assets for each of the years in the two-year period then ended, and the related notes (collectively, the financial statements) and the financial highlights for each of the years or periods in the five-year period then ended. In our opinion, the financial statements and financial highlights present fairly, in all material respects, the financial position of the Funds as of October 31, 2023, the results of their operations for the year then ended, the changes in their net assets for each of the years in the two-year period then ended, and the financial highlights for each of the years or periods in the five-year period then ended, in conformity with U.S. generally accepted accounting principles.
Basis for Opinion
These financial statements and financial highlights are the responsibility of the Funds' management. Our responsibility is to express an opinion on these financial statements and financial highlights based on our audits. We are a public accounting firm registered with the Public Company Accounting Oversight Board (United States) (PCAOB) and are required to be independent with respect to the Funds in accordance with the U.S. federal securities laws and the applicable rules and regulations of the Securities and Exchange Commission and the PCAOB.
We conducted our audits in accordance with the standards of the PCAOB. Those standards require that we plan and perform the audit to obtain reasonable assurance about whether the financial statements and financial highlights are free of material misstatement, whether due to error or fraud. Our audits included performing procedures to assess the risks of material misstatement of the financial statements and financial highlights, whether due to error or fraud, and performing procedures that respond to those risks. Such procedures included examining, on a test basis, evidence regarding the amounts and disclosures in the financial statements and financial highlights. Such procedures also included confirmation of securities owned as of October 31, 2023, by correspondence with the custodian and the transfer agent. Our audits also included evaluating the accounting principles used and significant estimates made by management, as well as evaluating the overall presentation of the financial statements and financial highlights. We believe that our audits provide a reasonable basis for our opinion.

We have served as the auditor of one or more New York Life Investment Management investment companies since 2003.
Philadelphia, Pennsylvania
December 22, 2023
| 98 | MainStay Asset Allocation Funds |
Federal Income Tax Information
(Unaudited)
The Allocation Funds are required under the Internal Revenue Code to advise shareholders in a written statement as to the federal tax status of dividends paid by the Allocation Funds during such fiscal years.
Accordingly, the Allocation Funds paid the following as long term capital gain distributions.
| MainStay Conservative Allocation Fund | $ 7,034,395 |
| MainStay Moderate Allocation Fund | 28,954,715 |
| MainStay Growth Allocation Fund | 42,606,280 |
| MainStay Equity Allocation Fund | 31,247,607 |
For the fiscal year ended October 31, 2023, the Allocation Funds designated approximately the following amounts under the Internal Revenue Code as qualified dividend income eligible for reduced tax rates.
| | QDI$ |
| MainStay Conservative Allocation Fund | $5,339,065 |
| MainStay Moderate Allocation Fund | 7,461,682 |
| MainStay Growth Allocation Fund | 4,433,988 |
| MainStay Equity Allocation Fund | 4,603,642 |
The dividends paid by the following Allocation Funds during the fiscal year ended October 31, 2023 which are not designated as capital gain distributions should be multiplied by the following percentages to arrive at the amount eligible for the corporate dividend received deduction.
| | DRD% |
| MainStay Conservative Allocation Fund | 30.72% |
| MainStay Moderate Allocation Fund | 63.25% |
| MainStay Growth Allocation Fund | 34.64% |
| MainStay Equity Allocation Fund | 50.64% |
The list of qualified Fund of Funds passing through foreign tax credits for the tax year ended October 31, 2023 is listed below.
| | FTC$ |
| MainStay Conservative Allocation Fund | $ 70,601 |
| MainStay Moderate Allocation Fund | 207,843 |
| MainStay Growth Allocation Fund | 287,753 |
| MainStay Equity Allocation Fund | 202,728 |
In February 2024, shareholders will receive an IRS Form 1099-DIV or substitute Form 1099, which will show the federal tax status of the distributions received by shareholders in calendar year 2023. The amounts that will be reported on such 1099-DIV or substitute Form 1099 will be the amounts you are to use on your federal income tax return and will differ from the amounts which we must report for the Allocation Funds' fiscal year ended October 31, 2023.
Proxy Voting Policies and Procedures and Proxy Voting Record
Each Allocation Fund is required to file with the SEC its proxy voting record for the 12-month period ending June 30 on Form N-PX. A description of the policies and procedures that are used to vote proxies relating to portfolio securities of the Fund is available free of charge upon request by calling 800-624-6782 or visiting the SEC’s website at www.sec.gov. The most recent Form N-PX or proxy voting record is available free of charge upon request by calling 800-624-6782; visiting newyorklifeinvestments.com; or visiting the SEC’s website at www.sec.gov.
Shareholder Reports and Quarterly Portfolio Disclosure
Each Allocation Fund is required to file its complete schedule of portfolio holdings with the SEC 60 days after its first and third fiscal quarter on Form N-PORT. The Allocation Funds' holdings report is available free of charge upon request by calling New York Life Investments at 800-624-6782.
Board of Trustees and Officers (Unaudited)
The Trustees and officers of the Fund are listed below. The Board oversees the MainStay Group of Funds (which consists of MainStay Funds and MainStay Funds Trust), MainStay VP Funds Trust, MainStay MacKay DefinedTerm Municipal Opportunities Fund, MainStay CBRE Global Infrastructure Megatrends Term Fund, the Manager and the Subadvisors, and elects the officers of the Funds who are responsible for the day-to-day operations of the Fund. Information pertaining to the Trustees and officers is set forth below. Each Trustee serves until his or her successor is elected and qualified or until his or her resignation, death or
removal. Under the Board’s retirement policy, unless an exception is made, a Trustee must tender his or her resignation by the end of the calendar year during which he or she reaches the age of 75. Officers are elected annually by the Board. The business address of each Trustee and officer listed below is 51 Madison Avenue, New York, New York 10010. A majority of the Trustees are not “interested persons” (as defined by the 1940 Act and rules adopted by the SEC thereunder) of the Fund (“Independent Trustees”).
| | Name and
Year of Birth | Term of Office,
Position(s) Held and
Length of Service | Principal Occupation(s)
During Past Five Years | Number of
Portfolios in
Fund Complex
Overseen by
Trustee | Other Directorships
Held by Trustee |
| | | | | | |
| | Naïm Abou-Jaoudé*
1966 | MainStay Funds: Trustee
since 2023
MainStay Funds Trust:
Trustee since 2023 | Chief Executive Officer of New York Life Investment Management LLC (since 2023). Chief Executive Officer of Candriam (an affiliate of New York Life Investment Management LLC) (2007 to 2023). | 81 | MainStay VP Funds Trust:
Trustee since 2023 (31 portfolios);
MainStay MacKay DefinedTerm Municipal Opportunities Fund: Trustee
since 2023;
MainStay CBRE Global Infrastructure Megatrends Term Fund: Trustee
since 2023; and
New York Life Investment Management International (Chair) since 2015 |
| * | This Trustee is considered to be an “interested person” of the MainStay Group of Funds, MainStay VP Funds Trust, MainStay CBRE Global Infrastructure Megatrends Term Fund and MainStay MacKay DefinedTerm Municipal Opportunities Fund, within the meaning of the 1940 Act because of his affiliation with New York Life Investment Management LLC and Candriam, as described in detail above in the column entitled “Principal Occupation(s) During Past Five Years.” |
| | |
| 100 | MainStay Asset Allocation Funds |
| | Name and
Year of Birth | Term of Office,
Position(s) Held and
Length of Service | Principal Occupation(s)
During Past Five Years | Number of
Portfolios in
Fund Complex
Overseen by
Trustee | Other Directorships
Held by Trustee |
| | | | | | |
| | David H. Chow
1957 | MainStay Funds: Trustee since January 2016, Advisory Board Member (June 2015 to December 2015);MainStay Funds Trust:
Trustee since January 2016, Advisory Board Member (June 2015 to December 2015) | Founder and CEO, DanCourt Management, LLC (since 1999) | 81 | MainStay VP Funds Trust: Trustee since January 2016, Advisory Board Member (June 2015 to December 2015) (31 portfolios);
MainStay MacKay DefinedTerm Municipal Opportunities Fund: Trustee since January 2016, Advisory Board Member (June 2015 to December 2015);
MainStay CBRE Global Infrastructure Megatrends Term Fund: Trustee since 2021;
VanEck Vectors Group of Exchange-Traded Funds: Trustee since 2006 and Independent Chairman of the Board of Trustees from 2008 to 2022 (57 portfolios); and
Berea College of Kentucky: Trustee since 2009, Chair of the Investment Committee since 2018 |
| | Karen Hammond
1956 | MainStay Funds: Trustee since December 2021, Advisory Board Member (June 2021 to December 2021);MainStay Funds Trust:
Trustee since December 2021, Advisory Board Member (June 2021 to December 2021)
| Retired, Managing Director, Devonshire Investors (2007 to 2013); Senior Vice President, Fidelity Management & Research Co. (2005 to 2007); Senior Vice President and Corporate Treasurer, FMR Corp. (2003 to 2005); Chief Operating Officer, Fidelity Investments Japan (2001 to 2003) | 81 | MainStay VP Funds Trust: Trustee since December 2021, Advisory Board Member (June 2021 to December 2021) (31 portfolios);
MainStay MacKay DefinedTerm Municipal Opportunities Fund: Trustee since December 2021, Advisory Board Member (June 2021 to December 2021);
MainStay CBRE Global Infrastructure Megatrends Term Fund: Trustee since December 2021, Advisory Board Member (June 2021 to December 2021);
Two Harbors Investment Corp.: Director since 2018;
Rhode Island State Investment Commission: Member since 2017; and
Blue Cross Blue Shield of Rhode Island: Director since 2019 |
| | Susan B. Kerley
1951 | MainStay Funds: Chair since January 2017 and Trustee since 2007;MainStay Funds Trust:
Chair since January 2017 and Trustee since 1990*** | President, Strategic Management Advisors LLC (since 1990) | 81 | MainStay VP Funds Trust: Chair since January 2017 and Trustee since 2007 (31 portfolios)**;
MainStay MacKay DefinedTerm Municipal Opportunities Fund: Chair since January 2017 and Trustee since 2011;
MainStay CBRE Global Infrastructure Megatrends Term Fund: Trustee since June 2021; and
Legg Mason Partners Funds: Trustee since 1991 (45 portfolios) |
Board of Trustees and Officers (Unaudited) (continued)
| | Name and
Year of Birth | Term of Office,
Position(s) Held and
Length of Service | Principal Occupation(s)
During Past Five Years | Number of
Portfolios in
Fund Complex
Overseen by
Trustee | Other Directorships
Held by Trustee |
| | | | | | |
| | Alan R. Latshaw
1951 | MainStay Funds: Trusteesince 2006;MainStay Funds Trust:
Trustee since 2007*** | Retired; Partner, Ernst & Young LLP (2002 to 2003); Partner, Arthur Andersen LLP (1989 to 2002); Consultant to the MainStay Funds Audit and Compliance Committee (2004 to 2006) | 81 | MainStay VP Funds Trust: Trustee since 2007 (31 portfolios)**;
MainStay MacKay DefinedTerm Municipal Opportunities Fund: Trustee since 2011; and
MainStay CBRE Global Infrastructure Megatrends Term Fund: Trustee since June 2021 |
| | Jacques P. Perold
1958 | MainStay Funds: Trustee since January 2016, Advisory Board Member (June 2015to December 2015);MainStay Funds Trust:
Trustee since January 2016, Advisory Board Member (June 2015 to December 2015) | Founder and Chief Executive Officer, CapShift Advisors LLC (since 2018); President, Fidelity Management & Research Company (2009 to 2014); President and Chief Investment Officer, Geode Capital Management, LLC (2001 to 2009) | 81 | MainStay VP Funds Trust: Trustee since January 2016, Advisory Board Member (June 2015 to December 2015) (31 portfolios);
MainStay MacKay DefinedTerm Municipal Opportunities Fund: Trustee since January 2016, Advisory Board Member (June 2015 to December 2015);
MainStay CBRE Global Infrastructure Megatrends Term Fund: Trustee since June 2021;
Allstate Corporation: Director since 2015; and
MSCI Inc.: Director since 2017 |
| | Richard S. Trutanic
1952 | MainStay Funds: Trustee since 1994;MainStay Funds Trust:
Trustee since 2007*** | Chairman and Chief Executive Officer, Somerset & Company (financial advisory firm) (since 2004); Managing Director, The Carlyle Group (private investment firm) (2002 to 2004); Senior Managing Director, Partner and Board Member, Groupe Arnault S.A. (private investment firm) (1999 to 2002) | 81 | MainStay VP Funds Trust: Trustee since 2007 (31 portfolios)**;
MainStay MacKay DefinedTerm Municipal Opportunities Fund: Trustee since 2011; and
MainStay CBRE Global Infrastructure Megatrends Term Fund: Trustee since June 2021 |
| ** | Includes prior service as a Director of MainStay VP Series Fund, Inc., the predecessor to MainStay VP Funds Trust. |
| *** | Includes prior service as a Director/Trustee of certain predecessor entities to MainStay Funds Trust. |
| 102 | MainStay Asset Allocation Funds |
| | Name and
Year of Birth | Position(s) Held and
Length of Service | Principal Occupation(s)
During Past Five Years | |
| | | | | |
| | Kirk C. Lehneis
1974 | President, MainStay Funds, MainStay Funds Trust (since 2017) | Chief Operating Officer and Senior Managing Director (since 2016), New York Life Investment Management LLC and New York Life Investment Management Holdings LLC; Member of the Board of Managers (since 2017) and Senior Managing Director (since 2018), NYLIFE Distributors LLC; Chairman of the Board and Senior Managing Director, NYLIM Service Company LLC (since 2017); Trustee, President and Principal Executive Officer of IndexIQ Trust, IndexIQ ETF Trust and IndexIQ Active ETF Trust (since 2018); President, MainStay CBRE Global Infrastructure Megatrends Term Fund (since 2021), MainStay MacKay DefinedTerm Municipal Opportunities Fund and MainStay VP Funds Trust (since 2017)**; Senior Managing Director, Global Product Development (2015 to 2016); Managing Director, Product Development (2010 to 2015), New York Life Investment Management LLC | |
| | Jack R. Benintende
1964 | Treasurer and Principal Financial and Accounting Officer, MainStay Funds (since 2007), MainStay Funds Trust (since 2009) | Managing Director, New York Life Investment Management LLC (since 2007); Treasurer and Principal Financial and Accounting Officer, MainStay CBRE Global Infrastructure Megatrends Term Fund (since 2021), MainStay MacKay DefinedTerm Municipal Opportunities Fund (since 2011) and MainStay VP Funds Trust (since 2007)**; and Assistant Treasurer, New York Life Investment Management Holdings LLC (2008 to 2012) | |
| | J. Kevin Gao
1967 | Secretary and Chief Legal Officer, MainStay Funds and MainStay Funds Trust (since 2010) | Managing Director and Associate General Counsel, New York Life Investment Management LLC (since 2010); Secretary and Chief Legal Officer, MainStay CBRE Global Infrastructure Megatrends Term Fund (since 2021), MainStay MacKay DefinedTerm Municipal Opportunities Fund (since 2011) and MainStay VP Funds Trust (since 2010)** | |
| | Kevin M. Gleason
1967 | Vice President and Chief Compliance Officer, MainStay Funds and MainStay Funds Trust (since June 2022) | Vice President and Chief Compliance Officer, IndexIQ Trust, IndexIQ ETF Trust and Index IQ Active ETF Trust (since June 2022); Vice President and Chief Compliance Officer, MainStay CBRE Global Infrastructure Megatrends Term Fund, MainStay VP Funds Trust and MainStay MacKay DefinedTerm Municipal Opportunities Fund (since June 2022); Senior Vice President, Voya Investment Management and Chief Compliance Officer, Voya Family of Funds (2012 to 2022) | |
| | Scott T. Harrington
1959 | Vice President— Administration, MainStay Funds (since 2005), MainStay Funds Trust (since 2009) | Managing Director, New York Life Investment Management LLC (including predecessor advisory organizations) (since 2000); Member of the Board of Directors, New York Life Trust Company (since 2009); Vice President—Administration, MainStay CBRE Global Infrastructure Megatrends Term Fund (since 2021), MainStay MacKay DefinedTerm Municipal Opportunities Fund (since 2011) and MainStay VP Funds Trust (since 2005)** | |
| * | The officers listed above are considered to be “interested persons” of the MainStay Group of Funds, MainStay VP Funds Trust, MainStay CBRE Global Infrastructure Megatrends Term Fund and MainStay MacKay DefinedTerm Municipal Opportunities Fund within the meaning of the 1940 Act because of their affiliation with the MainStay Group of Funds, New York Life Insurance Company and/or its affiliates, including New York Life Investment Management LLC, New York Life Insurance Company, NYLIM Service Company LLC, NYLIFE Securities LLC and/or NYLIFE Distributors LLC, as described in detail in the column captioned “Principal Occupation(s) During Past Five Years.” Officers are elected annually by the Board. |
| ** | Includes prior service as an Officer of MainStay VP Series Fund, Inc., the predecessor to MainStay VP Funds Trust. |
Officers of the Trust (Who are not Trustees)*
This page intentionally left blank.
This page intentionally left blank.
This page intentionally left blank.
Equity
U.S. Equity
MainStay Epoch U.S. Equity Yield Fund
MainStay Fiera SMID Growth Fund
MainStay PineStone U.S. Equity Fund
MainStay S&P 500 Index Fund
MainStay Winslow Large Cap Growth Fund
MainStay WMC Enduring Capital Fund
MainStay WMC Growth Fund
MainStay WMC Small Companies Fund
MainStay WMC Value Fund
International Equity
MainStay Epoch International Choice Fund
MainStay PineStone International Equity Fund
MainStay WMC International Research Equity Fund
Emerging Markets Equity
MainStay Candriam Emerging Markets Equity Fund
Global Equity
MainStay Epoch Capital Growth Fund
MainStay Epoch Global Equity Yield Fund
MainStay PineStone Global Equity Fund
Fixed Income
Taxable Income
MainStay Candriam Emerging Markets Debt Fund
MainStay Floating Rate Fund
MainStay MacKay High Yield Corporate Bond Fund
MainStay MacKay Short Duration High Yield Fund
MainStay MacKay Strategic Bond Fund
MainStay MacKay Total Return Bond Fund
MainStay MacKay U.S. Infrastructure Bond Fund
MainStay Short Term Bond Fund
Tax-Exempt Income
MainStay MacKay California Tax Free Opportunities Fund1
MainStay MacKay High Yield Municipal Bond Fund
MainStay MacKay New York Tax Free Opportunities Fund2
MainStay MacKay Short Term Municipal Fund
MainStay MacKay Strategic Municipal Allocation Fund
MainStay MacKay Tax Free Bond Fund
Money Market
MainStay Money Market Fund
Mixed Asset
MainStay Balanced Fund
MainStay Income Builder Fund
MainStay MacKay Convertible Fund
Speciality
MainStay CBRE Global Infrastructure Fund
MainStay CBRE Real Estate Fund
MainStay Cushing MLP Premier Fund
Asset Allocation
MainStay Conservative Allocation Fund
MainStay Conservative ETF Allocation Fund
MainStay Defensive ETF Allocation Fund
MainStay Equity Allocation Fund
MainStay Equity ETF Allocation Fund
MainStay ESG Multi-Asset Allocation Fund
MainStay Growth Allocation Fund
MainStay Growth ETF Allocation Fund
MainStay Moderate Allocation Fund
MainStay Moderate ETF Allocation Fund
Manager
New York Life Investment Management LLC
New York, New York
Subadvisors
Candriam3
Strassen, Luxembourg
CBRE Investment Management Listed Real Assets LLC
Radnor, Pennsylvania
Cushing Asset Management, LP
Dallas, Texas
Epoch Investment Partners, Inc.
New York, New York
Fiera Capital Inc.
New York, New York
IndexIQ Advisors LLC3
New York, New York
MacKay Shields LLC3
New York, New York
NYL Investors LLC3
New York, New York
PineStone Asset Management Inc.
Montreal, Québec
Wellington Management Company LLP
Boston, Massachusetts
Winslow Capital Management, LLC
Minneapolis, Minnesota
Legal Counsel
Dechert LLP
Washington, District of Columbia
Independent Registered Public Accounting Firm
KPMG LLP
Philadelphia, Pennsylvania
Distributor
NYLIFE Distributors LLC3
Jersey City, New Jersey
Custodian
JPMorgan Chase Bank, N.A.
New York, New York
1.
This Fund is registered for sale in AZ, CA, NV, OR, TX, UT, WA and MI (Class A and Class I shares only), and CO, FL, GA, HI, ID, MA, MD, NH, NJ and NY (Class I shares only).
| 2. | This Fund is registered for sale in CA, CT, DE, FL, MA, NJ, NY and VT. |
| 3. | An affiliate of New York Life Investment Management LLC. |
Not part of the Annual Report
For more information
800-624-6782
newyorklifeinvestments.com
“New York Life Investments” is both a service mark, and the common trade name, of certain investment advisors affiliated with New York Life Insurance Company. The MainStay Funds® are managed by New York Life Investment Management LLC and distributed by NYLIFE Distributors LLC, 30 Hudson Street, Jersey City, NJ 07302, a wholly owned subsidiary of New York Life Insurance Company. NYLIFE Distributors LLC is a Member FINRA/SIPC.
©2023 NYLIFE Distributors LLC. All rights reserved.
| 5013729MS139-23 | MSAA11-12/23 |
(NYLIM) NL224
MainStay Epoch Capital Growth Fund
Message from the President and Annual Report
October 31, 2023
Special Notice:
Beginning in July 2024, new regulations issued by the Securities and Exchange Commission (SEC) will take effect requiring open-end mutual fund companies and ETFs to (1) overhaul the content of their shareholder reports and (2) mail paper copies of the new tailored shareholder reports to shareholders who have not opted to receive these documents electronically.
If you have not yet elected to receive your shareholder reports electronically, please contact your financial intermediary or visit newyorklifeinvestments.com/accounts.
| Not FDIC/NCUA Insured | Not a Deposit | May Lose Value | No Bank Guarantee | Not Insured by Any Government Agency |
This page intentionally left blank
Message from the President
Volatile economic and geopolitical forces drove market behavior during the 12-month reporting period ended October 31, 2023. While equity markets generally gained ground, bond prices trended broadly lower.
Although the war in Ukraine, the outbreak of hostilities in the Middle East and several other notable events affected financial assets, inflation and interest rate trends stood at the forefront of market developments during most of the period. As the reporting period began, high levels of inflation already showed signs of easing in the face of aggressive rate hikes by the U.S. Federal Reserve (the “Fed”). From a peak of 9.1% in June 2022, the annualized U.S. inflation rate dropped to 7.1% in November 2022, and to 3.2% in October 2023. At the same time, the Fed increased the benchmark federal funds rate from 3.75%–4.00% at the beginning of the reporting period to 5.25%–5.50% as of October 31, 2023. As the pace of rate increases slowed during the period, investors hoped for an early shift to a looser monetary policy. However, comments from Fed members late in the period reinforced the central bank’s hawkish stance in response to surprisingly robust U.S. economic growth and rising wage pressures, thus increasing the likelihood that interest rates would stay higher for longer. International developed markets exhibited similar dynamics of elevated inflation and rising interest rates.
Despite the backdrop of high interest rates—along with political dysfunction in Washington D.C. and intensifying global geopolitical instability—equity markets managed to advance, supported by healthy consumer spending trends and persistent domestic economic growth. The S&P 500® Index, a widely regarded benchmark of large-cap U.S. market performance, gained ground, bolstered by the strong performance of energy stocks amid surging petroleum prices and mega-cap, growth-oriented, technology-related shares, which rose as investors flocked to companies creating the infrastructure for developments in artificial intelligence. Smaller-cap stocks and value-oriented shares produced milder returns. Among industry sectors, energy and
information technology posted the strongest gains. Real estate declined most sharply under pressure from rising mortgage rates and weak levels of office occupancy. Developed international markets outperformed U.S. markets, with Europe benefiting during the first half of the period from unexpected economic resilience in the face of rising energy prices and the ongoing war in Ukraine. Emerging markets posted positive results but lagged developed markets, largely due to slow economic growth in China despite the relaxation of pandemic-era lockdowns.
Bond prices were driven lower by rising yields and increasing expectations of high interest rates for an extended period of time. The U.S. yield curve steepened, with the 30-year Treasury yield exceeding 5% for the first time in more than a decade. The yield curve remained inverted, with the 10-year Treasury yield ending the period at 4.88%, compared with 5.07% for the 2-year Treasury yield. Corporate bonds outperformed long-term Treasury bonds, but still trended lower under pressure from rising yields and an uptick in default rates. Among corporates, lower-credit-quality instruments performed slightly better than their higher-credit-quality counterparts, while floating rate securities performed better still.
In the face of today’s uncertain market environment, New York Life Investments remains dedicated to providing the guidance, resources and investment solutions you need to pursue your financial goals.
Thank you for trusting us to help meet your investment needs.
Sincerely,
Kirk C. Lehneis
President
The opinions expressed are as of the date of this report and are subject to change. There is no guarantee that any forecast made will come to pass. This material does not constitute investment advice and is not intended as an endorsement of any specific investment. Past performance is no guarantee of future results.
Not part of the Annual Report
Investors should refer to the Fund’s Summary Prospectus and/or Prospectus and consider the Fund’s investment objectives, strategies, risks, charges and expenses carefully before investing. The Summary Prospectus and/or Prospectus contain this and other information about the Fund. You may obtain copies of the Fund’s Summary Prospectus, Prospectus and Statement of Additional Information, which includes information about the MainStay Funds Trust's Trustees, free of charge, upon request, by calling toll-free 800-624-6782, by writing to NYLIFE Distributors LLC, Attn: MainStay Marketing Department, 30 Hudson Street, Jersey City, NJ 07302 or by sending an e-mail to MainStayShareholderServices@nylim.com. These documents are also available via the MainStay Funds’ website at newyorklifeinvestments.com. Please read the Fund’s Summary Prospectus and/or Prospectus carefully before investing.
Investment and Performance Comparison (Unaudited)
Performance data quoted represents past performance. Past performance is no guarantee of future results. Because of market volatility and other factors, current performance may be lower or higher than the figures shown. Investment return and principal value will fluctuate, and as a result, when shares are redeemed, they may be worth more or less than their original cost. The graph below depicts the historical performance of Class I shares of the Fund. Performance will vary from class to class based on differences in class-specific expenses and sales charges. For performance information current to the most recent month-end, please call 800-624-6782 or visit newyorklifeinvestments.com.
The performance table and graph do not reflect the deduction of taxes that a shareholder would pay on distributions or Fund share redemptions. Total returns reflect maximum applicable sales charges as indicated in the table below, if any, changes in share price, and reinvestment of dividend and capital gain distributions. The graph assumes the initial investment amount shown below and reflects the deduction of all sales charges that would have applied for the period of investment. Performance figures may reflect certain fee waivers and/or expense limitations, without which total returns may have been lower. For more information on share classes and current fee waivers and/or expense limitations (if any), please refer to the Notes to Financial Statements.
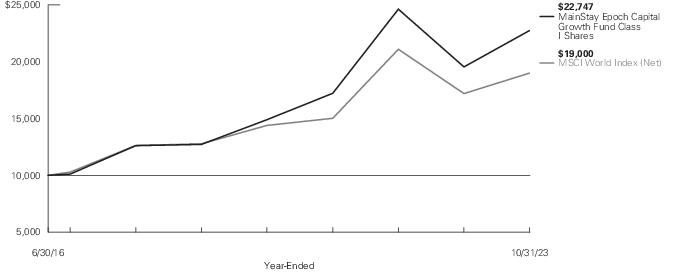
| Average Annual Total Returns for the Year-Ended October 31, 2023 |
| Class | Sales Charge | | Inception
Date | One
Year | Five
Years | Since
Inception | Gross
Expense
Ratio1 |
| Class A Shares | Maximum 5.50% Initial Sales Charge | With sales charges | 6/30/2016 | 9.70% | 10.79% | 10.73% | 1.25% |
| | | Excluding sales charges | | 16.09 | 12.05 | 11.59 | 1.25 |
| Investor Class Shares2 | Maximum 5.00% Initial Sales Charge | With sales charges | 6/30/2016 | 10.02 | 10.47 | 10.47 | 1.44 |
| | | Excluding sales charges | | 15.81 | 11.73 | 11.32 | 1.44 |
| Class C Shares | Maximum 1.00% CDSC | With sales charges | 6/30/2016 | 13.97 | 10.94 | 10.51 | 2.20 |
| | if Redeemed Within One Year of Purchase | Excluding sales charges | | 14.97 | 10.94 | 10.51 | 2.20 |
| Class I Shares | No Sales Charge | | 6/30/2016 | 16.39 | 12.32 | 11.85 | 1.00 |
| 1. | The gross expense ratios presented reflect the Fund’s “Total Annual Fund Operating Expenses” from the most recent Prospectus, as supplemented, and may differ from other expense ratios disclosed in this report. |
| 2. | Prior to June 30, 2020, the maximum initial sales charge was 5.50%, which is reflected in the applicable average annual total return figures shown. |
The footnotes on the next page are an integral part of the table and graph and should be carefully read in conjunction with them.
| Benchmark Performance* | One
Year | Five
Years | Since
Inception |
| MSCI World Index (Net)1 | 10.48% | 8.27% | 9.15% |
| Morningstar Global Large Stock Growth Category Average2 | 9.54 | 7.61 | 8.53 |
| * | Returns for indices reflect no deductions for fees, expenses or taxes, except for foreign withholding taxes where applicable. Results assume reinvestment of all dividends and capital gains. An investment cannot be made directly in an index. |
| 1. | The MSCI World Index (Net) is the Fund's primary broad-based securities market index for comparison purposes. The MSCI World Index (Net) is a free float-adjusted market capitalization weighted index that is designed to measure the equity market performance of developed markets. |
| 2. | The Morningstar Global Large Stock Growth Category Average is a representative of funds that invest in a variety of international stocks and typically skew towards large caps that are more expensive or projected to grow faster than other global large-cap stocks. World large stock growth portfolios have few geographical limitations. It is common for these portfolios to invest the majority of their assets in developed markets, with the remainder divided among the globe's emerging markets. These funds are not significantly overweight U.S. equity exposure relative to the Morningstar Global Market Index and maintain at least a 20% absolute U.S. exposure. Results are based on average total returns of similar funds with all dividends and capital gain distributions reinvested. |
The footnotes on the preceding page are an integral part of the table and graph and should be carefully read in conjunction with them.
| 6 | MainStay Epoch Capital Growth Fund |
Cost in Dollars of a $1,000 Investment in MainStay Epoch Capital Growth Fund (Unaudited)
The example below is intended to describe the fees and expenses borne by shareholders during the six-month period from May 1, 2023 to October 31, 2023, and the impact of those costs on your investment.
Example
As a shareholder of the Fund you incur two types of costs: (1) transaction costs, including exchange fees and sales charges (loads) on purchases (as applicable), and (2) ongoing costs, including management fees, distribution and/or service (12b-1) fees and other Fund expenses (as applicable). This example is intended to help you understand your ongoing costs (in dollars) of investing in the Fund and to compare these costs with the ongoing costs of investing in other mutual funds. The example is based on an investment of $1,000 made at the beginning of the six-month period and held for the entire period from May 1, 2023 to October 31, 2023.
This example illustrates your Fund’s ongoing costs in two ways:
Actual Expenses
The second and third data columns in the table below provide information about actual account values and actual expenses. You may use the information in these columns, together with the amount you invested, to estimate the expenses that you paid during the six months ended October 31, 2023. Simply divide your account value by $1,000 (for example, an
$8,600 account value divided by $1,000 = 8.6), then multiply the result by the number under the heading entitled “Expenses Paid During Period” to estimate the expenses you paid on your account during this period.
Hypothetical Example for Comparison Purposes
The fourth and fifth data columns in the table below provide information about hypothetical account values and hypothetical expenses based on the Fund’s actual expense ratio and an assumed rate of return of 5% per year before expenses, which is not the Fund’s actual return. The hypothetical account values and expenses may not be used to estimate the actual ending account balances or expenses you paid for the six-month period shown. You may use this information to compare the ongoing costs of investing in the Fund with the ongoing costs of investing in other mutual funds. To do so, compare this 5% hypothetical example with the 5% hypothetical examples that appear in the shareholder reports of the other mutual funds.
Please note that the expenses shown in the table are meant to highlight your ongoing costs only and do not reflect any transactional costs, such as exchange fees or sales charges (loads). Therefore, the fourth and fifth data columns of the table are useful in comparing ongoing costs only and will not help you determine the relative total costs of owning different funds. In addition, if these transactional costs were included, your costs would have been higher.
| Share Class | Beginning
Account
Value
5/1/23 | Ending Account
Value (Based
on Actual
Returns and
Expenses)
10/31/23 | Expenses
Paid
During
Period1 | Ending Account
Value (Based
on Hypothetical
5% Annualized
Return and
Actual Expenses)
10/31/23 | Expenses
Paid
During
Period1 | Net Expense
Ratio
During
Period2 |
| Class A Shares | $1,000.00 | $986.80 | $ 5.76 | $1,019.41 | $ 5.85 | 1.15% |
| Investor Class Shares | $1,000.00 | $985.10 | $ 7.16 | $1,018.00 | $ 7.27 | 1.43% |
| Class C Shares | $1,000.00 | $981.60 | $10.84 | $1,014.27 | $11.02 | 2.17% |
| Class I Shares | $1,000.00 | $987.70 | $ 4.51 | $1,020.67 | $ 4.58 | 0.90% |
| 1. | Expenses are equal to the Fund’s annualized expense ratio of each class multiplied by the average account value over the period, divided by 365 and multiplied by 184 (to reflect the six-month period). The table above represents the actual expenses incurred during the six-month period. In addition to the fees and expenses which the Fund bears directly, it also indirectly bears a pro rata share of the fees and expenses of the underlying funds in which it invests. Such indirect expenses are not included in the above-reported expense figures. |
| 2. | Expenses are equal to the Fund's annualized expense ratio to reflect the six-month period. |
Country Composition as of October 31, 2023 (Unaudited)
| United States | 67.4% |
| Switzerland | 4.0 |
| United Kingdom | 3.1 |
| China | 2.8 |
| Canada | 2.4 |
| Netherlands | 2.3 |
| Spain | 2.1 |
| France | 1.9 |
| Japan | 1.8 |
| Sweden | 1.7 |
| Denmark | 1.6 |
| Taiwan | 1.3 |
| Germany | 1.2% |
| Australia | 1.1 |
| Jordan | 1.1 |
| Malta | 0.8 |
| Singapore | 0.8 |
| Italy | 0.7 |
| South Africa | 0.7 |
| Indonesia | 0.5 |
| Mexico | 0.4 |
| Other Assets, Less Liabilities | 0.3 |
| | 100.0% |
See Portfolio of Investments beginning on page 11 for specific holdings within these categories. The Fund's holdings are subject to change.
Top Ten Holdings and/or Issuers Held as of October 31, 2023 (excluding short-term investments) (Unaudited)
| 1. | UnitedHealth Group, Inc. |
| 2. | Alimentation Couche-Tard, Inc. |
| 3. | Deckers Outdoor Corp. |
| 4. | Costco Wholesale Corp. |
| 5. | Ameriprise Financial, Inc. |
| 6. | Eli Lilly & Co. |
| 7. | Alphabet, Inc., Class A |
| 8. | Industria de Diseno Textil SA |
| 9. | BE Semiconductor Industries NV |
| 10. | Fastenal Co. |
| 8 | MainStay Epoch Capital Growth Fund |
Portfolio Management Discussion and Analysis (Unaudited)
Questions answered by portfolio managers William W. Priest,1 CFA, Steven D. Bleiberg, Michael A. Welhoelter, CFA, and David J. Siino, CFA, CAIA, of Epoch Investment Partners, Inc., the Fund’s Subadvisor.
How did MainStay Epoch Capital Growth Fund perform relative to its benchmark and peer group during the 12 months ended October 31, 2023?
For the 12 months ended October 31, 2023, Class I shares of MainStay Epoch Capital Growth Fund returned 16.39%, outperforming the 10.48% return of the Fund’s benchmark, the MSCI World Index (Net) (the “Index”). Over the same period, Class I shares also outperformed the 9.54% return of the Morningstar Global Large Stock Growth Category Average.2
What factors affected the Fund’s relative performance during the reporting period?
The Fund outperformed the Index primarily due to favorable stock selection, particularly in the health care sector. Stock selection within industrials and information technology also made positive contributions to relative returns. (Contributions take weightings and total returns into account.) Sector allocations enhanced relative performance as well, primarily through underweight positions in energy and financials, and an overweight position in information technology for much of the reporting period. An overweight position in health care was the only significant detractor.
During the reporting period, which sectors and/or countries were the strongest positive contributors to the Fund’s relative performance and which sectors and/or countries were particularly weak?
Stock selection within the health care, industrials and information technology sectors were the strongest positive contributors to relative performance, followed by the Fund’s overweight position in the information technology sector and underweight positions in both energy and financials. The Fund’s overweight position in the health care sector was the biggest detractor, followed by stock selection in the financials sector.
During the reporting period, which individual stocks made the strongest positive contributions to the Fund’s absolute performance and which stocks detracted the most?
The largest positive contributors to the Fund’s absolute performance included Netherlands-based semiconductor equipment manufacturer BE Semiconductor, U.S.-based social media company Meta Platforms and U.S.-based active apparel company Deckers Outdoor. BE Semiconductor shares outperformed in response to a wave of excitement related to artificial intelligence (“AI”), which drove incremental demand for semiconductor equipment of all types. Additionally, BE Semiconductor reported strong demand for its next generation technology, hybrid bonding, as large customers placed sizeable
initial orders. Meta Platforms shares advanced as the company returned to growth and generated strong user engagement across its ecosystem. The company largely moved past challenges from Apple's App Tracking Transparency policy and saw solid traction for Advantage+, its AI-driven advertiser platform. At Deckers, demand for its two core footwear brands, UGG and HOKA ONE ONE, remained very strong, and the resolution of some supply-chain issues led to improving gross margins.
The most significant detractors from the Fund’s absolute performance during the reporting period were U.S.-based online crafts retailer Etsy and France-based biopharmaceutical supplies maker Sartorius Stedim Biotech. Etsy experienced disappointing sales figures as consumers reined in discretionary expenditures in the face of higher prices on necessities like food and energy. The Fund continued to hold the stock as of the end of the reporting period, while re-evaluating our view on the company. Sartorius Stedium Biotech underperformed after having to lower its guidance for 2023. Bookings were soft as manufacturers worked down inventories accumulated during the pandemic. Additionally, sales to China were softer than management anticipated. The Fund continued to own Sartorius as of the end of the reporting period, due to the company’s imposing competitive and regulatory barriers, its high return on invested capital, and its potential for exceptional growth in the future given the underlying demand for its products.
What were some of the Fund’s largest purchases and sales during the reporting period?
The Fund’s largest purchases during the reporting period included positions in U.S.-based communications technology company Qualcomm, U.S.-based oil & gas exploration & production firm Pioneer Natural Resources and China-based electric vehicle manufacturer BYD.
Qualcomm, a long-time leader in the development of digital telecommunications technology, has built its real core competence in research and development, having accumulated over 140,000 patents since its founding in 1985. We believe Qualcomm's technology portfolio is so broad and dominant, and the company has earned revenue on every mobile handset sold globally beginning with 2G, both through royalties and semiconductor sales. Qualcomm has successfully extended its brand beyond its handset modem business to include additional Rf (radio frequency) content on handsets, as well as automotive, industrial and other non-handset applications (i.e., the Internet of Things). These new revenue streams leverage existing intellectual property and further embed Qualcomm in the businesses of its key customers, specifically Apple and Samsung. Between outsourcing the manufacturing of its chips and the fact that the
| 1. | Effective on or about March 31, 2024, William W. Priest will no longer serve as a portfolio manager for the Fund. |
| 2. | See "Investment and Performance Comparison" for other share class returns, which may be higher or lower than Class I share returns, and for more information on benchmark and peer group returns. |
royalties Qualcomm collects on the licensing of its patents carry a 100% gross margin, Qualcomm generates industry-leading capital efficiency metrics (revenue/invested capital). Qualcomm also spends over 23% of revenue on research and development (compared to a peer median of 18.5%) to maintain its dominance from each generation of mobile technology to the next.
Pioneer Natural Resources operates in the Permian Basin in the southwestern United States. The company enjoys a cost advantage over many of its peers due to the fact that its acreage is largely contiguous, creating operational efficiencies in areas such as water usage and materials logistics. Shale-based energy companies have become more disciplined following the boom/bust days of the early 2010s. For Pioneer, this discipline is clearly demonstrated in its capital allocation priorities, whereby oil production growth is capped at 5% in any given year, and the majority of free cash flow is returned to shareholders. In addition, the company has changed its management incentive plan over time; previously the company rewarded management for increased production, while today the incentives focus on free cash flow generation and return on capital employed.
BYD is the largest manufacturer of electric cars in China, and if you include hybrids, which BYD also makes, BYD is the largest manufacturer of "new energy vehicles" in the world, surpassing Tesla, since Tesla does not make hybrids. BYD started life as a rechargeable battery manufacturer for consumer electronics in 1995. Over the next dozen years, the company developed the expertise and intellectual property to enable it to produce the first viable electric vehicle (“EV”) in China in 2008. BYD has leveraged this first-mover advantage and enjoys manufacturing economies of scale that give the company a sustainable competitive cost advantage powering its industry-leading margins and returns. BYD is the only EV manufacturer in the world that builds its own batteries for the majority of its fleet. The battery represents up to 30% of the cost of an EV, and the largest EV battery manufacturer has an operating margin of about 10%. Not only is BYD able to capture this margin in its economics, but it is also able to innovate and differentiate its product offerings. We believe battery technology is still a differentiator, and BYD is the only EV manufacturer to have battery technology, at scale, in house. With its 72.3% ownership stake in privately held BYD Semiconductor, BYD makes more of its own semiconductors than any other neighborhood electric vehicle manufacturer in the world. In our view, this is advantageous from both a cost and a supply-chain management standpoint.
During the same period, the Fund exited its positions in U.S.-based restaurant chain Wingstop, Denmark-based biotechnology company Genmab, and Sweden-based tobacco company Swedish Match.
Wingstop enjoys some of the highest store-level returns in the quick-service restaurant industry and has been hitting its targets for new store openings. The parent entity's franchisor model also generates high returns on capital. That said, the stock's valuation, at current interest rates, implied a higher level of growth than we thought reasonable, so we sold the Fund’s position.
While Genmab’s main drug, Darzalex, does not go off patent until 2029, Genmab has not allayed concerns that it will be unable to replace Darzalex through its own pipeline, or in a way that will sustain its returns (e.g., via acquisitions). Those returns are currently inflated by royalties Genmab earns from Johnson & Johnson, which distributes Darzalex. Going forward, Genmab will incur more expenses as it assumes more distribution responsibilities on new drugs. Given these realities, we sold the Fund’s position.
Swedish Match was acquired by Philip Morris International.
How did the Fund’s sector and/or country weightings change during the reporting period?
The Fund's weightings in the consumer discretionary, financials and energy sectors increased during the reporting period. Conversely, the Fund's weightings decreased in the information technology and consumer staples sectors. The biggest increases in country weights were in the United States, Germany, Japan and China, while the largest decreases were in Sweden, Denmark and the U.K.
How was the Fund positioned at the end of the reporting period?
As of October 31, 2023, the Fund held its most overweight exposures relative to the Index to the health care, consumer discretionary and industrials sectors. As of the same date, the Fund’s most underweight positions were in the energy, financials and information technology sectors. From a country perspective, the largest overweight positions were in China, Sweden and Switzerland, while the most significant underweights were in the United States and Japan.
The opinions expressed are those of the portfolio managers as of the date of this report and are subject to change. There is no guarantee that any forecasts will come to pass. This material does not constitute investment advice and is not intended as an endorsement of any specific investment.
| 10 | MainStay Epoch Capital Growth Fund |
Portfolio of Investments October 31, 2023†^
| | Shares | Value |
| Common Stocks 98.8% |
| Australia 1.1% |
| Aristocrat Leisure Ltd. (Hotels, Restaurants & Leisure) | 59,234 | $ 1,447,768 |
| Canada 2.4% |
| Alimentation Couche-Tard, Inc. (Consumer Staples Distribution & Retail) | 40,405 | 2,199,512 |
| Constellation Software, Inc. (Software) | 459 | 920,155 |
| | | 3,119,667 |
| China 2.8% |
| BYD Co. Ltd., Class H (Automobiles) | 34,500 | 1,046,650 |
| Chongqing Brewery Co. Ltd., Class A (Beverages) | 82,974 | 890,048 |
| SITC International Holdings Co. Ltd. (Marine Transportation) | 527,000 | 810,847 |
| Yadea Group Holdings Ltd. (Automobiles) (a) | 446,000 | 815,028 |
| | | 3,562,573 |
| Denmark 1.6% |
| Coloplast A/S, Class B (Health Care Equipment & Supplies) | 6,188 | 644,789 |
| Novo Nordisk A/S, Class B (Pharmaceuticals) | 14,065 | 1,349,921 |
| | | 1,994,710 |
| France 1.9% |
| Edenred SE (Financial Services) | 19,850 | 1,055,205 |
| Hermes International SCA (Textiles, Apparel & Luxury Goods) | 216 | 402,156 |
| Sartorius Stedim Biotech (Life Sciences Tools & Services) | 5,274 | 985,223 |
| | | 2,442,584 |
| Germany 1.2% |
| Merck KGaA (Pharmaceuticals) | 10,087 | 1,519,309 |
| Indonesia 0.5% |
| Bank Central Asia Tbk. PT (Banks) | 1,064,900 | 586,583 |
| Italy 0.7% |
| Recordati Industria Chimica e Farmaceutica SpA (Pharmaceuticals) | 19,457 | 897,613 |
| | Shares | Value |
| |
| Japan 1.8% |
| Goldwin, Inc. (Textiles, Apparel & Luxury Goods) | 8,900 | $ 555,109 |
| Hoya Corp. (Health Care Equipment & Supplies) | 8,200 | 775,504 |
| ZOZO, Inc. (Specialty Retail) (b) | 54,500 | 1,027,077 |
| | | 2,357,690 |
| Jordan 1.1% |
| Hikma Pharmaceuticals plc (Pharmaceuticals) | 58,330 | 1,348,110 |
| Malta 0.8% |
| Kindred Group plc, SDR (Hotels, Restaurants & Leisure) | 121,248 | 991,278 |
| Mexico 0.4% |
| Grupo Aeroportuario del Pacifico SAB de CV, Class B (Transportation Infrastructure) | 47,880 | 558,525 |
| Netherlands 2.3% |
| ASML Holding NV (Semiconductors & Semiconductor Equipment) | 1,483 | 887,047 |
| BE Semiconductor Industries NV (Semiconductors & Semiconductor Equipment) | 19,555 | 2,013,249 |
| | | 2,900,296 |
| Singapore 0.8% |
| Singapore Exchange Ltd. (Capital Markets) | 139,700 | 966,263 |
| South Africa 0.7% |
| FirstRand Ltd. (Financial Services) | 260,539 | 858,888 |
| Spain 2.1% |
| Amadeus IT Group SA (Hotels, Restaurants & Leisure) | 11,187 | 637,065 |
| Industria de Diseno Textil SA (Specialty Retail) (b) | 58,527 | 2,015,738 |
| | | 2,652,803 |
| Sweden 1.7% |
| Atlas Copco AB, Class B (Machinery) | 58,046 | 650,274 |
| Epiroc AB, Class B (Machinery) | 43,854 | 607,771 |
| Evolution AB (Hotels, Restaurants & Leisure) (a) | 10,165 | 903,266 |
| | | 2,161,311 |
Portfolio of Investments October 31, 2023†^ (continued)
| | Shares | Value |
| Common Stocks (continued) |
| Switzerland 4.0% |
| EMS-Chemie Holding AG (Registered) (Chemicals) | 1,208 | $ 823,350 |
| Kuehne + Nagel International AG (Registered) (Marine Transportation) | 5,530 | 1,486,379 |
| Logitech International SA (Registered) (Technology Hardware, Storage & Peripherals) | 16,206 | 1,267,761 |
| Partners Group Holding AG (Capital Markets) | 1,513 | 1,591,424 |
| | | 5,168,914 |
| Taiwan 1.3% |
| Eclat Textile Co. Ltd. (Textiles, Apparel & Luxury Goods) | 79,000 | 1,251,919 |
| Taiwan Semiconductor Manufacturing Co. Ltd. (Semiconductors & Semiconductor Equipment) | 25,000 | 407,739 |
| | | 1,659,658 |
| United Kingdom 3.1% |
| Auto Trader Group plc (Interactive Media & Services) (a) | 170,465 | 1,287,075 |
| Diageo plc (Beverages) | 25,566 | 965,475 |
| Games Workshop Group plc (Leisure Products) | 5,366 | 644,058 |
| Howden Joinery Group plc (Trading Companies & Distributors) | 144,879 | 1,122,770 |
| | | 4,019,378 |
| United States 66.5% |
| Accenture plc, Class A (IT Services) | 3,811 | 1,132,210 |
| Adobe, Inc. (Software) (c) | 2,475 | 1,316,848 |
| Alphabet, Inc., Class A (Interactive Media & Services) (c) | 16,779 | 2,081,938 |
| Ameriprise Financial, Inc. (Capital Markets) | 6,777 | 2,131,840 |
| Apple, Inc. (Technology Hardware, Storage & Peripherals) | 7,359 | 1,256,696 |
| Applied Materials, Inc. (Semiconductors & Semiconductor Equipment) | 9,423 | 1,247,134 |
| Arista Networks, Inc. (Communications Equipment) (c) | 9,056 | 1,814,551 |
| Automatic Data Processing, Inc. (Professional Services) | 5,284 | 1,153,074 |
| Chemed Corp. (Health Care Providers & Services) | 3,123 | 1,757,156 |
| Costco Wholesale Corp. (Consumer Staples Distribution & Retail) | 3,889 | 2,148,439 |
| CSL Ltd. (Biotechnology) | 9,164 | 1,350,693 |
| | Shares | Value |
| |
| United States (continued) |
| Deckers Outdoor Corp. (Textiles, Apparel & Luxury Goods) (c) | 3,634 | $ 2,169,716 |
| Domino's Pizza, Inc. (Hotels, Restaurants & Leisure) | 5,088 | 1,724,781 |
| Donaldson Co., Inc. (Machinery) | 18,995 | 1,095,252 |
| Eagle Materials, Inc. (Construction Materials) | 9,782 | 1,505,548 |
| Edwards Lifesciences Corp. (Health Care Equipment & Supplies) (c) | 10,873 | 692,828 |
| Electronic Arts, Inc. (Entertainment) | 6,207 | 768,365 |
| Eli Lilly & Co. (Pharmaceuticals) | 3,816 | 2,113,797 |
| Encompass Health Corp. (Health Care Providers & Services) | 20,547 | 1,285,420 |
| Etsy, Inc. (Broadline Retail) (c) | 10,460 | 651,658 |
| Expeditors International of Washington, Inc. (Air Freight & Logistics) | 8,348 | 912,019 |
| Fastenal Co. (Trading Companies & Distributors) | 33,168 | 1,935,021 |
| Ferguson plc (Trading Companies & Distributors) | 8,368 | 1,254,070 |
| Fortinet, Inc. (Software) (c) | 19,133 | 1,093,834 |
| Gentex Corp. (Automobile Components) | 40,897 | 1,172,926 |
| Graco, Inc. (Machinery) | 11,865 | 882,163 |
| Hamilton Lane, Inc., Class A (Capital Markets) | 11,167 | 939,368 |
| HCA Healthcare, Inc. (Health Care Providers & Services) | 3,891 | 879,911 |
| Hess Midstream LP, Class A (Oil, Gas & Consumable Fuels) | 34,631 | 1,038,930 |
| Home Depot, Inc. (The) (Specialty Retail) | 4,145 | 1,180,040 |
| IDEXX Laboratories, Inc. (Health Care Equipment & Supplies) (c) | 2,063 | 824,107 |
| KLA Corp. (Semiconductors & Semiconductor Equipment) | 2,735 | 1,284,629 |
| Lam Research Corp. (Semiconductors & Semiconductor Equipment) | 2,629 | 1,546,430 |
| LPL Financial Holdings, Inc. (Capital Markets) | 7,867 | 1,766,299 |
| Manhattan Associates, Inc. (Software) (c) | 4,980 | 971,000 |
| Mastercard, Inc., Class A (Financial Services) | 4,911 | 1,848,255 |
| Medpace Holdings, Inc. (Life Sciences Tools & Services) (c) | 6,502 | 1,577,840 |
| Meta Platforms, Inc., Class A (Interactive Media & Services) (c) | 6,092 | 1,835,337 |
| Mettler-Toledo International, Inc. (Life Sciences Tools & Services) (c) | 992 | 977,318 |
| Microsoft Corp. (Software) | 5,578 | 1,885,978 |
| 12 | MainStay Epoch Capital Growth Fund |
| | Shares | Value |
| Common Stocks (continued) |
| United States (continued) |
| Monster Beverage Corp. (Beverages) (c) | 37,794 | $ 1,931,273 |
| NetApp, Inc. (Technology Hardware, Storage & Peripherals) | 14,074 | 1,024,306 |
| Paychex, Inc. (Professional Services) | 15,990 | 1,775,689 |
| Pioneer Natural Resources Co. (Oil, Gas & Consumable Fuels) | 4,508 | 1,077,412 |
| Pool Corp. (Distributors) | 1,974 | 623,330 |
| QUALCOMM, Inc. (Semiconductors & Semiconductor Equipment) | 10,116 | 1,102,543 |
| Rollins, Inc. (Commercial Services & Supplies) | 24,770 | 931,600 |
| Starbucks Corp. (Hotels, Restaurants & Leisure) | 12,179 | 1,123,391 |
| Texas Instruments, Inc. (Semiconductors & Semiconductor Equipment) | 7,759 | 1,101,856 |
| Thermo Fisher Scientific, Inc. (Life Sciences Tools & Services) | 1,778 | 790,801 |
| TJX Cos., Inc. (The) (Specialty Retail) | 16,441 | 1,447,959 |
| TKO Group Holdings, Inc. (Entertainment) | 13,092 | 1,073,282 |
| Ulta Beauty, Inc. (Specialty Retail) (c) | 3,428 | 1,307,131 |
| Union Pacific Corp. (Ground Transportation) | 5,107 | 1,060,264 |
| UnitedHealth Group, Inc. (Health Care Providers & Services) | 4,351 | 2,330,222 |
| Veeva Systems, Inc., Class A (Health Care Technology) (c) | 6,590 | 1,269,959 |
| Vertex Pharmaceuticals, Inc. (Biotechnology) (c) | 2,740 | 992,181 |
| Visa, Inc., Class A (Financial Services) | 7,906 | 1,858,701 |
| VMware, Inc., Class A (Software) (c) | 9,531 | 1,388,190 |
| Waters Corp. (Life Sciences Tools & Services) (c) | 3,310 | 789,534 |
| West Pharmaceutical Services, Inc. (Life Sciences Tools & Services) | 4,007 | 1,275,388 |
| Yum! Brands, Inc. (Hotels, Restaurants & Leisure) | 13,279 | 1,604,900 |
| Zoetis, Inc. (Pharmaceuticals) | 11,079 | 1,739,403 |
| | | 84,822,734 |
Total Common Stocks
(Cost $111,851,086) | | 126,036,655 |
| |
| | Number of
Warrants | | Value |
| |
| Warrants 0.0% ‡ |
| Canada 0.0% ‡ |
| Constellation Software, Inc. (Software) | | | |
| Expires 3/31/40 (c)(d)(e) | 721 | | $ — |
Total Warrants
(Cost $0) | | | — |
| |
| | Shares | | |
| |
| Short-Term Investment 0.9% |
| Affiliated Investment Company 0.9% |
| United States 0.9% |
| MainStay U.S. Government Liquidity Fund, 5.275% (f) | 1,118,956 | | 1,118,956 |
Total Short-Term Investment
(Cost $1,118,956) | | | 1,118,956 |
Total Investments
(Cost $112,970,042) | 99.7% | | 127,155,611 |
| Other Assets, Less Liabilities | 0.3 | | 329,368 |
| Net Assets | 100.0% | | $ 127,484,979 |
| † | Percentages indicated are based on Fund net assets. |
| ^ | Industry and country classifications may be different than those used for compliance monitoring purposes. |
| ‡ | Less than one-tenth of a percent. |
| (a) | May be sold to institutional investors only under Rule 144A or securities offered pursuant to Section 4(a)(2) of the Securities Act of 1933, as amended. |
| (b) | All or a portion of this security was held on loan. As of October 31, 2023, the aggregate market value of securities on loan was $2,078,810. The market value of the collateral held included non-cash collateral in the form of U.S. Treasury securities with a value of $2,255,437. (See Note 2(I)) |
| (c) | Non-income producing security. |
| (d) | Illiquid security—As of October 31, 2023, the total market value deemed illiquid under procedures approved by the Board of Trustees was $0, which represented less than one-tenth of a percent of the Fund’s net assets. (Unaudited) |
| (e) | Security in which significant unobservable inputs (Level 3) were used in determining fair value. |
| (f) | Current yield as of October 31, 2023. |
Portfolio of Investments October 31, 2023†^ (continued)
Investments in Affiliates (in 000's)
Investments in issuers considered to be affiliate(s) of the Fund during the year ended October 31, 2023 for purposes of Section 2(a)(3) of the Investment Company Act of 1940, as amended, were as follows:
| Affiliated Investment Companies | Value,
Beginning
of Year | Purchases
at Cost | Proceeds
from
Sales | Net
Realized
Gain/(Loss)
on Sales | Change in
Unrealized
Appreciation/
(Depreciation) | Value,
End of
Year | Dividend
Income | Other
Distributions | Shares
End of
Year |
| MainStay U.S. Government Liquidity Fund | $ 644 | $ 55,779 | $ (55,304) | $ — | $ — | $ 1,119 | $ 83 | $ — | 1,119 |
| Abbreviation(s): |
| SDR—Special Drawing Right |
The following is a summary of the fair valuations according to the inputs used as of October 31, 2023, for valuing the Fund’s assets:
| Description | Quoted
Prices in
Active
Markets for
Identical
Assets
(Level 1) | | Significant
Other
Observable
Inputs
(Level 2) | | Significant
Unobservable
Inputs
(Level 3) | | Total |
| Asset Valuation Inputs | | | | | | | |
| Investments in Securities (a) | | | | | | | |
| Common Stocks | $ 126,036,655 | | $ — | | $ — | | $ 126,036,655 |
| Warrants | — | | — | | — | | — |
| Short-Term Investment | | | | | | | |
| Affiliated Investment Company | 1,118,956 | | — | | — | | 1,118,956 |
| Total Investments in Securities | $ 127,155,611 | | $ — | | $ — | | $ 127,155,611 |
| (a) | For a complete listing of investments and their industries, see the Portfolio of Investments. |
| 14 | MainStay Epoch Capital Growth Fund |
The table below sets forth the diversification of the Fund’s investments by industry.
Industry Diversification
| | Value | | Percent †^ |
| Air Freight & Logistics | $ 912,019 | | 0.7% |
| Automobile Components | 1,172,926 | | 0.9 |
| Automobiles | 1,861,678 | | 1.5 |
| Banks | 586,583 | | 0.5 |
| Beverages | 3,786,796 | | 3.0 |
| Biotechnology | 2,342,874 | | 1.8 |
| Broadline Retail | 651,658 | | 0.5 |
| Capital Markets | 7,395,194 | | 5.8 |
| Chemicals | 823,350 | | 0.7 |
| Commercial Services & Supplies | 931,600 | | 0.7 |
| Communications Equipment | 1,814,551 | | 1.4 |
| Construction Materials | 1,505,548 | | 1.2 |
| Consumer Staples Distribution & Retail | 4,347,951 | | 3.4 |
| Distributors | 623,330 | | 0.5 |
| Entertainment | 1,841,647 | | 1.5 |
| Financial Services | 5,621,049 | | 4.4 |
| Ground Transportation | 1,060,264 | | 0.8 |
| Health Care Equipment & Supplies | 2,937,228 | | 2.3 |
| Health Care Providers & Services | 6,252,709 | | 4.9 |
| Health Care Technology | 1,269,959 | | 1.0 |
| Hotels, Restaurants & Leisure | 8,432,449 | | 6.6 |
| Interactive Media & Services | 5,204,350 | | 4.1 |
| IT Services | 1,132,210 | | 0.9 |
| Leisure Products | 644,058 | | 0.5 |
| Life Sciences Tools & Services | 6,396,104 | | 5.0 |
| Machinery | 3,235,460 | | 2.5 |
| Marine Transportation | 2,297,226 | | 1.8 |
| Oil, Gas & Consumable Fuels | 2,116,342 | | 1.7 |
| Pharmaceuticals | 8,968,153 | | 7.0 |
| Professional Services | 2,928,763 | | 2.3 |
| Semiconductors & Semiconductor Equipment | 9,590,627 | | 7.5 |
| Software | 7,576,005 | | 5.9 |
| Specialty Retail | 6,977,945 | | 5.5 |
| Technology Hardware, Storage & Peripherals | 3,548,763 | | 2.8 |
| Textiles, Apparel & Luxury Goods | 4,378,900 | | 3.4 |
| Trading Companies & Distributors | 4,311,861 | | 3.4 |
| Transportation Infrastructure | 558,525 | | 0.4 |
| | 126,036,655 | | 98.8 |
| Short-Term Investment | 1,118,956 | | 0.9 |
| Other Assets, Less Liabilities | 329,368 | | 0.3 |
| Net Assets | $127,484,979 | | 100.0% |
| † | Percentages indicated are based on Fund net assets. |
| ^ | Industry and country classifications may be different than those used for compliance monitoring purposes. |
Statement of Assets and Liabilities as of October 31, 2023
| Assets |
Investment in unaffiliated securities, at value
(identified cost $111,851,086) including securities on loan of $2,078,810 | $126,036,655 |
Investment in affiliated investment companies, at value
(identified cost $1,118,956) | 1,118,956 |
Cash denominated in foreign currencies
(identified cost $106) | 106 |
| Receivables: | |
| Investment securities sold | 971,396 |
| Fund shares sold | 300,268 |
| Dividends | 185,057 |
| Securities lending | 862 |
| Other assets | 148,364 |
| Total assets | 128,761,664 |
| Liabilities |
| Due to custodian | 1,280 |
| Payables: | |
| Investment securities purchased | 1,071,334 |
| Fund shares redeemed | 98,187 |
| Manager (See Note 3) | 57,559 |
| Custodian | 21,335 |
| Transfer agent (See Note 3) | 9,907 |
| NYLIFE Distributors (See Note 3) | 9,894 |
| Professional fees | 6,587 |
| Shareholder communication | 190 |
| Accrued expenses | 412 |
| Total liabilities | 1,276,685 |
| Net assets | $127,484,979 |
| Composition of Net Assets |
| Shares of beneficial interest outstanding (par value of $.001 per share) unlimited number of shares authorized | $ 10,616 |
| Additional paid-in-capital | 113,609,453 |
| | 113,620,069 |
| Total distributable earnings (loss) | 13,864,910 |
| Net assets | $127,484,979 |
| Class A | |
| Net assets applicable to outstanding shares | $38,827,529 |
| Shares of beneficial interest outstanding | 3,241,760 |
| Net asset value per share outstanding | $ 11.98 |
| Maximum sales charge (5.50% of offering price) | 0.70 |
| Maximum offering price per share outstanding | $ 12.68 |
| Investor Class | |
| Net assets applicable to outstanding shares | $ 3,194,568 |
| Shares of beneficial interest outstanding | 269,133 |
| Net asset value per share outstanding | $ 11.87 |
| Maximum sales charge (5.00% of offering price) | 0.62 |
| Maximum offering price per share outstanding | $ 12.49 |
| Class C | |
| Net assets applicable to outstanding shares | $ 1,091,457 |
| Shares of beneficial interest outstanding | 97,279 |
| Net asset value and offering price per share outstanding | $ 11.22 |
| Class I | |
| Net assets applicable to outstanding shares | $84,371,425 |
| Shares of beneficial interest outstanding | 7,007,414 |
| Net asset value and offering price per share outstanding | $ 12.04 |
The notes to the financial statements are an integral part of, and should be read in conjunction with, the financial statements.
| 16 | MainStay Epoch Capital Growth Fund |
Statement of Operations for the year ended October 31, 2023
| Investment Income (Loss) |
| Income | |
| Dividends-unaffiliated (net of foreign tax withholding of $83,600) | $1,460,966 |
| Dividends-affiliated | 83,019 |
| Securities lending, net | 3,633 |
| Total income | 1,547,618 |
| Expenses | |
| Manager (See Note 3) | 700,294 |
| Distribution/Service—Class A (See Note 3) | 74,609 |
| Distribution/Service—Investor Class (See Note 3) | 3,744 |
| Distribution/Service—Class C (See Note 3) | 10,761 |
| Transfer agent (See Note 3) | 61,912 |
| Professional fees | 61,912 |
| Registration | 58,780 |
| Custodian | 55,174 |
| Trustees | 2,294 |
| Shareholder communication | 1,582 |
| Miscellaneous | 2,929 |
| Total expenses before waiver/reimbursement | 1,033,991 |
| Expense waiver/reimbursement from Manager (See Note 3) | (97,243) |
| Reimbursement from prior custodian(a) | (141) |
| Net expenses | 936,607 |
| Net investment income (loss) | 611,011 |
| Realized and Unrealized Gain (Loss) |
| Net realized gain (loss) on: | |
| Unaffiliated investment transactions | (366,536) |
| Foreign currency transactions | (24,762) |
| Net realized gain (loss) | (391,298) |
| Net change in unrealized appreciation (depreciation) on: | |
| Unaffiliated investments | 8,702,566 |
| Translation of other assets and liabilities in foreign currencies | 2,970 |
| Net change in unrealized appreciation (depreciation) | 8,705,536 |
| Net realized and unrealized gain (loss) | 8,314,238 |
| Net increase (decrease) in net assets resulting from operations | $8,925,249 |
| (a) | Represents a refund for overbilling of custody fees. |
The notes to the financial statements are an integral part of, and should be read in conjunction with, the financial statements.
17
Statements of Changes in Net Assets
for the years ended October 31, 2023 and October 31, 2022
| | 2023 | 2022 |
| Increase (Decrease) in Net Assets |
| Operations: | | |
| Net investment income (loss) | $ 611,011 | $ 303,802 |
| Net realized gain (loss) | (391,298) | 315,127 |
| Net change in unrealized appreciation (depreciation) | 8,705,536 | (16,922,312) |
| Net increase (decrease) in net assets resulting from operations | 8,925,249 | (16,303,383) |
| Distributions to shareholders: | | |
| Class A | (257,794) | (4,992,940) |
| Investor Class | (11,851) | (363,357) |
| Class C | (8,497) | (298,992) |
| Class I | (609,460) | (12,067,689) |
| Total distributions to shareholders | (887,602) | (17,722,978) |
| Capital share transactions: | | |
| Net proceeds from sales of shares | 78,496,435 | 14,278,356 |
| Net asset value of shares issued to shareholders in reinvestment of distributions | 880,683 | 17,496,640 |
| Cost of shares redeemed | (24,019,094) | (12,307,173) |
| Increase (decrease) in net assets derived from capital share transactions | 55,358,024 | 19,467,823 |
| Net increase (decrease) in net assets | 63,395,671 | (14,558,538) |
| Net Assets |
| Beginning of year | 64,089,308 | 78,647,846 |
| End of year | $127,484,979 | $ 64,089,308 |
The notes to the financial statements are an integral part of, and should be read in conjunction with, the financial statements.
| 18 | MainStay Epoch Capital Growth Fund |
Financial Highlights selected per share data and ratios
| | Year Ended October 31, |
| Class A | 2023 | | 2022 | | 2021 | | 2020 | | 2019 |
| Net asset value at beginning of year | $ 10.44 | | $ 17.09 | | $ 14.43 | | $ 13.20 | | $ 12.21 |
| Net investment income (loss) (a) | 0.06 | | 0.03 | | (0.01) | | 0.00‡ | | 0.07 |
| Net realized and unrealized gain (loss) | 1.61 | | (2.86) | | 5.43 | | 1.92 | | 1.81 |
| Total from investment operations | 1.67 | | (2.83) | | 5.42 | | 1.92 | | 1.88 |
| Less distributions: | | | | | | | | | |
| From net investment income | (0.02) | | — | | (0.03) | | (0.07) | | (0.08) |
| From net realized gain on investments | (0.11) | | (3.82) | | (2.73) | | (0.62) | | (0.81) |
| Total distributions | (0.13) | | (3.82) | | (2.76) | | (0.69) | | (0.89) |
| Net asset value at end of year | $ 11.98 | | $ 10.44 | | $ 17.09 | | $ 14.43 | | $ 13.20 |
| Total investment return (b) | 16.09% | | (20.79)% | | 42.61% | | 15.31% | | 16.82% |
| Ratios (to average net assets)/Supplemental Data: | | | | | | | | | |
| Net investment income (loss) | 0.51% | | 0.30% | | (0.08)% | | 0.01% | | 0.58% |
| Net expenses (c) | 1.15% | | 1.15% | | 1.15% | | 1.13% | | 1.15% |
| Expenses (before waiver/reimbursement) (c) | 1.26% | | 1.25% | | 1.36% | | 1.16% | | 1.27% |
| Portfolio turnover rate | 30% | | 31% | | 80% | | 43% | | 46% |
| Net assets at end of year (in 000’s) | $ 38,828 | | $ 20,880 | | $ 21,767 | | $ 6,733 | | $ 4,041 |
| ‡ | Less than one cent per share. |
| (a) | Per share data based on average shares outstanding during the year. |
| (b) | Total investment return is calculated exclusive of sales charges and assumes the reinvestment of dividends and distributions. For periods of less than one year, total return is not annualized. |
| (c) | In addition to the fees and expenses which the Fund bears directly, it also indirectly bears a pro-rata share of the fees and expenses of the underlying funds in which it invests. Such indirect expenses are not included in the above expense ratios. |
| | Year Ended October 31, |
| Investor Class | 2023 | | 2022 | | 2021 | | 2020 | | 2019 |
| Net asset value at beginning of year | $ 10.35 | | $ 17.02 | | $ 14.40 | | $ 13.16 | | $ 12.18 |
| Net investment income (loss) (a) | 0.03 | | 0.01 | | (0.05) | | (0.02) | | 0.04 |
| Net realized and unrealized gain (loss) | 1.60 | | (2.86) | | 5.40 | | 1.92 | | 1.80 |
| Total from investment operations | 1.63 | | (2.85) | | 5.35 | | 1.90 | | 1.84 |
| Less distributions: | | | | | | | | | |
| From net investment income | — | | — | | (0.00)‡ | | (0.04) | | (0.05) |
| From net realized gain on investments | (0.11) | | (3.82) | | (2.73) | | (0.62) | | (0.81) |
| Total distributions | (0.11) | | (3.82) | | (2.73) | | (0.66) | | (0.86) |
| Net asset value at end of year | $ 11.87 | | $ 10.35 | | $ 17.02 | | $ 14.40 | | $ 13.16 |
| Total investment return (b) | 15.81% | | (21.04)% | | 42.05% | | 15.14% | | 16.42% |
| Ratios (to average net assets)/Supplemental Data: | | | | | | | | | |
| Net investment income (loss) | 0.26% | | 0.05% | | (0.31)% | | (0.17)% | | 0.30% |
| Net expenses (c) | 1.41% | | 1.39% | | 1.42% | | 1.34% | | 1.43% |
| Expenses (before waiver/reimbursement) (c) | 1.46% | | 1.44% | | 1.59% | | 1.36% | | 1.54% |
| Portfolio turnover rate | 30% | | 31% | | 80% | | 43% | | 46% |
| Net assets at end of year (in 000's) | $ 3,195 | | $ 1,134 | | $ 1,648 | | $ 1,416 | | $ 1,177 |
| ‡ | Less than one cent per share. |
| (a) | Per share data based on average shares outstanding during the year. |
| (b) | Total investment return is calculated exclusive of sales charges and assumes the reinvestment of dividends and distributions. For periods of less than one year, total return is not annualized. |
| (c) | In addition to the fees and expenses which the Fund bears directly, it also indirectly bears a pro-rata share of the fees and expenses of the underlying funds in which it invests. Such indirect expenses are not included in the above expense ratios. |
The notes to the financial statements are an integral part of, and should be read in conjunction with, the financial statements.
19
Financial Highlights selected per share data and ratios
| | Year Ended October 31, |
| Class C | 2023 | | 2022 | | 2021 | | 2020 | | 2019 |
| Net asset value at beginning of year | $ 9.86 | | $ 16.49 | | $ 14.10 | | $ 12.97 | | $ 12.04 |
| Net investment income (loss) (a) | (0.05) | | (0.08) | | (0.16) | | (0.12) | | (0.06) |
| Net realized and unrealized gain (loss) | 1.52 | | (2.73) | | 5.28 | | 1.87 | | 1.80 |
| Total from investment operations | 1.47 | | (2.81) | | 5.12 | | 1.75 | | 1.74 |
| Less distributions: | | | | | | | | | |
| From net investment income | — | | — | | — | | (0.62) | | (0.81) |
| From net realized gain on investments | (0.11) | | (3.82) | | (2.73) | | — | | — |
| Total distributions | (0.11) | | (3.82) | | (2.73) | | (0.62) | | (0.81) |
| Net asset value at end of year | $ 11.22 | | $ 9.86 | | $ 16.49 | | $ 14.10 | | $ 12.97 |
| Total investment return (b) | 14.97% | | (21.60)% | | 41.17% | | 14.24% | | 15.59% |
| Ratios (to average net assets)/Supplemental Data: | | | | | | | | | |
| Net investment income (loss) | (0.43)% | | (0.71)% | | (1.09)% | | (0.92)% | | (0.46)% |
| Net expenses (c) | 2.15% | | 2.14% | | 2.17% | | 2.09% | | 2.17% |
| Expenses (before waiver/reimbursement) (c) | 2.20% | | 2.20% | | 2.34% | | 2.11% | | 2.27% |
| Portfolio turnover rate | 30% | | 31% | | 80% | | 43% | | 46% |
| Net assets at end of year (in 000’s) | $ 1,091 | | $ 794 | | $ 1,288 | | $ 1,152 | | $ 1,236 |
| (a) | Per share data based on average shares outstanding during the year. |
| (b) | Total investment return is calculated exclusive of sales charges and assumes the reinvestment of dividends and distributions. For periods of less than one year, total return is not annualized. |
| (c) | In addition to the fees and expenses which the Fund bears directly, it also indirectly bears a pro-rata share of the fees and expenses of the underlying funds in which it invests. Such indirect expenses are not included in the above expense ratios. |
| | Year Ended October 31, |
| Class I | 2023 | | 2022 | | 2021 | | 2020 | | 2019 |
| Net asset value at beginning of year | $ 10.49 | | $ 17.15 | | $ 14.47 | | $ 13.23 | | $ 12.24 |
| Net investment income (loss) (a) | 0.09 | | 0.06 | | 0.03 | | 0.04 | | 0.08 |
| Net realized and unrealized gain (loss) | 1.62 | | (2.88) | | 5.45 | | 1.92 | | 1.83 |
| Total from investment operations | 1.71 | | (2.82) | | 5.48 | | 1.96 | | 1.91 |
| Less distributions: | | | | | | | | | |
| From net investment income | (0.05) | | (0.02) | | (0.07) | | (0.10) | | (0.11) |
| From net realized gain on investments | (0.11) | | (3.82) | | (2.73) | | (0.62) | | (0.81) |
| Total distributions | (0.16) | | (3.84) | | (2.80) | | (0.72) | | (0.92) |
| Net asset value at end of year | $ 12.04 | | $ 10.49 | | $ 17.15 | | $ 14.47 | | $ 13.23 |
| Total investment return (b) | 16.39% | | (20.63)% | | 42.99% | | 15.58% | | 17.11% |
| Ratios (to average net assets)/Supplemental Data: | | | | | | | | | |
| Net investment income (loss) | 0.75% | | 0.54% | | 0.21% | | 0.29% | | 0.66% |
| Net expenses (c) | 0.90% | | 0.90% | | 0.90% | | 0.90% | | 0.90% |
| Expenses (before waiver/reimbursement) (c) | 1.01% | | 1.00% | | 1.10% | | 0.93% | | 1.00% |
| Portfolio turnover rate | 30% | | 31% | | 80% | | 43% | | 46% |
| Net assets at end of year (in 000’s) | $ 84,371 | | $ 41,282 | | $ 53,944 | | $ 56,502 | | $ 119,464 |
| (a) | Per share data based on average shares outstanding during the year. |
| (b) | Total investment return is calculated exclusive of sales charges and assumes the reinvestment of dividends and distributions. Class I shares are not subject to sales charges. For periods of less than one year, total return is not annualized. |
| (c) | In addition to the fees and expenses which the Fund bears directly, it also indirectly bears a pro-rata share of the fees and expenses of the underlying funds in which it invests. Such indirect expenses are not included in the above expense ratios. |
The notes to the financial statements are an integral part of, and should be read in conjunction with, the financial statements.
| 20 | MainStay Epoch Capital Growth Fund |
Notes to Financial Statements
Note 1-Organization and Business
MainStay Funds Trust (the “Trust”) was organized as a Delaware statutory trust on April 28, 2009. The Trust is registered under the Investment Company Act of 1940, as amended (the “1940 Act”), as an open-end management investment company, and is comprised of thirty-seven funds (collectively referred to as the “Funds”). These financial statements and notes relate to the MainStay Epoch Capital Growth Fund (the "Fund"), a “diversified” fund, as that term is defined in the 1940 Act, as interpreted or modified by regulatory authorities having jurisdiction, from time to time.
The following table lists the Fund's share classes that have been registered and commenced operations:
| Class | Commenced Operations |
| Class A | June 30, 2016 |
| Investor Class | June 30, 2016 |
| Class C | June 30, 2016 |
| Class I | June 30, 2016 |
Class A and Investor Class shares are offered at net asset value (“NAV”) per share plus an initial sales charge. No initial sales charge applies to investments of $1 million or more (and certain other qualified purchases) in Class A and Investor Class shares. However, a contingent deferred sales charge (“CDSC”) of 1.00% may be imposed on certain redemptions made within 18 months of the date of purchase on shares that were purchased without an initial sales charge. Class C shares are offered at NAV without an initial sales charge, although a 1.00% CDSC may be imposed on certain redemptions of such shares made within one year of the date of purchase of Class C shares. Class I shares are offered at NAV without a sales charge. Depending upon eligibility, Class C shares convert to either Class A or Investor Class shares at the end of the calendar quarter eight years after the date they were purchased. Additionally, Investor Class shares may convert automatically to Class A shares. Under certain circumstances and as may be permitted by the Trust’s multiple class plan pursuant to Rule 18f-3 under the 1940 Act, specified share classes of the Fund may be converted to one or more other share classes of the Fund as disclosed in the capital share transactions within these Notes. The classes of shares have the same voting (except for issues that relate solely to one class), dividend, liquidation and other rights, and the same terms and conditions, except that under distribution plans pursuant to Rule 12b-1 under the 1940 Act, Class C shares are subject to higher distribution and/or service fees than Class A and Investor Class shares. Class I shares are not subject to a distribution and/or service fee.
The Fund's investment objective is to seek long-term capital appreciation.
Note 2–Significant Accounting Policies
The Fund is an investment company and accordingly follows the investment company accounting and reporting guidance of the Financial Accounting Standards Board (“FASB”) Accounting Standards Codification Topic 946 Financial Services—Investment Companies. The Fund prepares its financial statements in accordance with generally accepted
accounting principles (“GAAP”) in the United States of America and follows the significant accounting policies described below.
(A) Securities Valuation. Investments are usually valued as of the close of regular trading on the New York Stock Exchange (the "Exchange") (usually 4:00 p.m. Eastern time) on each day the Fund is open for business ("valuation date").
Pursuant to Rule 2a-5 under the 1940 Act, the Board of Trustees of the Trust (the "Board") has designated New York Life Investment Management LLC (“New York Life Investments” or the "Manager") as its Valuation Designee (the "Valuation Designee"). The Valuation Designee is responsible for performing fair valuations relating to all investments in the Fund’s portfolio for which market quotations are not readily available; periodically assessing and managing material valuation risks; establishing and applying fair value methodologies; testing fair valuation methodologies; evaluating and overseeing pricing services; ensuring appropriate segregation of valuation and portfolio management functions; providing quarterly, annual and prompt reporting to the Board, as appropriate; identifying potential conflicts of interest; and maintaining appropriate records. The Valuation Designee has established a valuation committee ("Valuation Committee") to assist in carrying out the Valuation Designee’s responsibilities and establish prices of securities for which market quotations are not readily available. The Fund's and the Valuation Designee's policies and procedures ("Valuation Procedures") govern the Valuation Designee’s selection and application of methodologies for determining and calculating the fair value of Fund investments. The Valuation Designee may value the Fund's portfolio securities for which market quotations are not readily available and other Fund assets utilizing inputs from pricing services and other third-party sources. The Valuation Committee meets (in person, via electronic mail or via teleconference) on an ad-hoc basis to determine fair valuations and on a quarterly basis to review fair value events with respect to certain securities for which market quotations are not readily available, including valuation risks and back-testing results, and preview reports to the Board.
The Valuation Committee establishes prices of securities for which market quotations are not readily available based on such methodologies and measurements on a regular basis after considering information that is reasonably available and deemed relevant by the Valuation Committee. The Board shall oversee the Valuation Designee and review fair valuation materials on a prompt, quarterly and annual basis and approve proposed revisions to the Valuation Procedures.
Investments for which market quotations are not readily available are valued at fair value as determined in good faith pursuant to the Valuation Procedures. A market quotation is readily available only when that quotation is a quoted price (unadjusted) in active markets for identical investments that the Fund can access at the measurement date, provided that a quotation will not be readily available if it is not reliable. "Fair value" is defined as the price the Fund would reasonably expect to receive upon selling an asset or liability in an orderly transaction to an independent buyer in the principal or most advantageous market for the asset or liability. Fair value measurements are determined within a framework that
Notes to Financial Statements (continued)
establishes a three-tier hierarchy that maximizes the use of observable market data and minimizes the use of unobservable inputs to establish a classification of fair value measurements for disclosure purposes. "Inputs" refer broadly to the assumptions that market participants would use in pricing the asset or liability, including assumptions about risk, such as the risk inherent in a particular valuation technique used to measure fair value using a pricing model and/or the risk inherent in the inputs for the valuation technique. Inputs may be observable or unobservable. Observable inputs reflect the assumptions market participants would use in pricing the asset or liability based on market data obtained from sources independent of the Fund. Unobservable inputs reflect the Fund’s own assumptions about the assumptions market participants would use in pricing the asset or liability based on the information available. The inputs or methodology used for valuing assets or liabilities may not be an indication of the risks associated with investing in those assets or liabilities. The three-tier hierarchy of inputs is summarized below.
| • | Level 1—quoted prices (unadjusted) in active markets for an identical asset or liability |
| • | Level 2—other significant observable inputs (including quoted prices for a similar asset or liability in active markets, interest rates and yield curves, prepayment speeds, credit risk, etc.) |
| • | Level 3—significant unobservable inputs (including the Fund's own assumptions about the assumptions that market participants would use in measuring fair value of an asset or liability) |
The level of an asset or liability within the fair value hierarchy is based on the lowest level of an input, both individually and in the aggregate, that is significant to the fair value measurement. The aggregate value by input level of the Fund’s assets and liabilities as of October 31, 2023, is included at the end of the Portfolio of Investments.
The Fund may use third-party vendor evaluations, whose prices may be derived from one or more of the following standard inputs, among others:
| • Broker/dealer quotes | • Benchmark securities |
| • Two-sided markets | • Reference data (corporate actions or material event notices) |
| • Bids/offers | • Monthly payment information |
| • Industry and economic events | • Reported trades |
An asset or liability for which a market quotation is not readily available is valued by methods deemed reasonable in good faith by the Valuation Committee, following the Valuation Procedures to represent fair value. Under these procedures, the Valuation Designee generally uses a market-based approach which may use related or comparable assets or liabilities, recent transactions, market multiples, book values and other relevant information. The Valuation Designee may also use an income-based valuation approach in which the anticipated future cash flows of the asset or liability are discounted to calculate fair value. Discounts may also be applied due to the nature and/or duration of any restrictions on the disposition of the asset or liability. Fair value represents a good faith approximation of the value of a security. Fair value
determinations involve the consideration of a number of subjective factors, an analysis of applicable facts and circumstances and the exercise of judgment. As a result, it is possible that the fair value for a security determined in good faith in accordance with the Valuation Procedures may differ from valuations for the same security determined for other funds using their own valuation procedures. Although the Valuation Procedures are designed to value a security at the price the Fund may reasonably expect to receive upon the security's sale in an orderly transaction, there can be no assurance that any fair value determination thereunder would, in fact, approximate the amount that the Fund would actually realize upon the sale of the security or the price at which the security would trade if a reliable market price were readily available. During the year ended October 31, 2023, there were no material changes to the fair value methodologies.
Securities which may be valued in this manner include, but are not limited to: (i) a security for which trading has been halted or suspended or otherwise does not have a readily available market quotation on a given day; (ii) a debt security that has recently gone into default and for which there is not a current market quotation; (iii) a security of an issuer that has entered into a restructuring; (iv) a security that has been delisted from a national exchange; (v) a security subject to trading collars for which no or limited trading takes place; and (vi) a security whose principal market has been temporarily closed at a time when, under normal conditions, it would be open. Securities valued in this manner are generally categorized as Level 2 or 3 in the hierarchy. As of October 31, 2023, securities that were fair valued in such a manner are shown in the Portfolio of Investments.
Certain securities held by the Fund may principally trade in foreign markets. Events may occur between the time the foreign markets close and the time at which the Fund's NAVs are calculated. These events may include, but are not limited to, situations relating to a single issuer in a market sector, significant fluctuations in U.S. or foreign markets, natural disasters, armed conflicts, governmental actions or other developments not tied directly to the securities markets. Should the Valuation Designee conclude that such events may have affected the accuracy of the last price of such securities reported on the local foreign market, the Valuation Designee may, pursuant to the Valuation Procedures, adjust the value of the local price to reflect the estimated impact on the price of such securities as a result of such events. In this instance, securities are generally categorized as Level 3 in the hierarchy. Additionally, certain foreign equity securities are also fair valued whenever the movement of a particular index exceeds certain thresholds. In such cases, the securities are fair valued by applying factors provided by a third-party vendor in accordance with the Valuation Procedures and are generally categorized as Level 2 in the hierarchy. No foreign equity securities held by the Fund as of October 31, 2023 were fair valued in such a manner.
If the principal market of certain foreign equity securities is closed in observance of a local foreign holiday, these securities are valued using the last closing price of regular trading on the relevant exchange and fair valued by applying factors provided by a third-party vendor in accordance with the Valuation Procedures. These securities are generally categorized
| 22 | MainStay Epoch Capital Growth Fund |
as Level 2 in the hierarchy. No securities held by the Fund as of October 31, 2023, were fair valued in such a manner.
Equity securities, rights and warrants, if applicable, are valued at the last quoted sales prices as of the close of regular trading on the relevant exchange on each valuation date. Securities that are not traded on the valuation date are valued at the mean of the last quoted bid and ask prices. Prices are normally taken from the principal market in which each security trades. These securities are generally categorized as Level 1 in the hierarchy.
Investments in mutual funds, including money market funds, are valued at their respective NAVs at the close of business each day on the valuation date. These securities are generally categorized as Level 1 in the hierarchy.
Temporary cash investments acquired in excess of 60 days to maturity at the time of purchase are valued using the latest bid prices or using valuations based on a matrix system (which considers such factors as security prices, yields, maturities and ratings), both as furnished by independent pricing services. Temporary cash investments that mature in 60 days or less at the time of purchase ("Short-Term Investments") are valued using the amortized cost method of valuation, unless the use of such method would be inappropriate. The amortized cost method involves valuing a security at its cost on the date of purchase and thereafter assuming a constant amortization to maturity of the difference between such cost and the value on maturity date. Amortized cost approximates the current fair value of a security. Securities valued using the amortized cost method are not valued using quoted prices in an active market and are generally categorized as Level 2 in the hierarchy.
The information above is not intended to reflect an exhaustive list of the methodologies that may be used to value portfolio investments. The Valuation Procedures permit the use of a variety of valuation methodologies in connection with valuing portfolio investments. The methodology used for a specific type of investment may vary based on the market data available or other considerations. The methodologies summarized above may not represent the specific means by which portfolio investments are valued on any particular business day.
(B) Income Taxes. The Fund's policy is to comply with the requirements of the Internal Revenue Code of 1986, as amended (the “Internal Revenue Code”), applicable to regulated investment companies and to distribute all of its taxable income to the shareholders of the Fund within the allowable time limits.
The Manager evaluates the Fund’s tax positions to determine if the tax positions taken meet the minimum recognition threshold in connection with accounting for uncertainties in income tax positions taken or expected to be taken for the purposes of measuring and recognizing tax liabilities in the financial statements. Recognition of tax benefits of an uncertain tax position is permitted only to the extent the position is “more likely than not” to be sustained assuming examination by taxing authorities. The Manager analyzed the Fund's tax positions taken on federal, state and local income tax returns for all open tax years (for up to
three tax years) and has concluded that no provisions for federal, state and local income tax are required in the Fund's financial statements. The Fund's federal, state and local income tax and federal excise tax returns for tax years for which the applicable statutes of limitations have not expired are subject to examination by the Internal Revenue Service and state and local departments of revenue.
(C) Foreign Taxes. The Fund may be subject to foreign taxes on income and other transaction-based taxes imposed by certain countries in which it invests. A portion of the taxes on gains on investments or currency purchases/repatriation may be reclaimable. The Fund will accrue such taxes and reclaims as applicable, based upon its current interpretation of tax rules and regulations that exist in the markets in which it invests.
The Fund may be subject to taxation on realized capital gains, repatriation proceeds and other transaction-based taxes imposed by certain countries in which it invests. The Fund will accrue such taxes as applicable based upon its current interpretation of tax rules and regulations that exist in the market in which it invests. Capital gains taxes relating to positions still held are reflected as a liability in the Statement of Assets and Liabilities, as well as an adjustment to the Fund's net unrealized appreciation (depreciation). Taxes related to capital gains realized, if any, are reflected as part of net realized gain (loss) in the Statement of Operations. Changes in tax liabilities related to capital gains taxes on unrealized investment gains, if any, are reflected as part of the change in net unrealized appreciation (depreciation) on investments in the Statement of Operations. Transaction-based charges are generally assessed as a percentage of the transaction amount.
(D) Dividends and Distributions to Shareholders. Dividends and distributions are recorded on the ex-dividend date. The Fund intends to declare and pay dividends from net investment income and distributions from net realized capital and currency gains, if any, at least annually. Unless a shareholder elects otherwise, all dividends and distributions are reinvested at NAV in the same class of shares of the Fund. Dividends and distributions to shareholders are determined in accordance with federal income tax regulations and may differ from determinations using GAAP.
(E) Security Transactions and Investment Income. The Fund records security transactions on the trade date. Realized gains and losses on security transactions are determined using the identified cost method. Dividend income is recognized on the ex-dividend date, net of any foreign tax withheld at the source, and interest income is accrued as earned using the effective interest rate method. Distributions received from real estate investment trusts may be classified as dividends, capital gains and/or return of capital.
Investment income and realized and unrealized gains and losses on investments of the Fund are allocated pro rata to the separate classes of shares based upon their relative net assets on the date the income is earned or realized and unrealized gains and losses are incurred.
Notes to Financial Statements (continued)
(F) Expenses. Expenses of the Trust are allocated to the individual Funds in proportion to the net assets of the respective Funds when the expenses are incurred, except where direct allocations of expenses can be made. Expenses (other than transfer agent expenses and fees incurred under the shareholder services plans and/or the distribution plans further discussed in Note 3(B)) are allocated to separate classes of shares pro rata based upon their relative net assets on the date the expenses are incurred. The expenses borne by the Fund, including those of related parties to the Fund, are shown in the Statement of Operations.
Additionally, the Fund may invest in mutual funds, which are subject to management fees and other fees that may cause the costs of investing in mutual funds to be greater than the costs of owning the underlying securities directly. These indirect expenses of mutual funds are not included in the amounts shown as expenses in the Statement of Operations or in the expense ratios included in the Financial Highlights.
(G) Use of Estimates. In preparing financial statements in conformity with GAAP, the Manager makes estimates and assumptions that affect the reported amounts and disclosures in the financial statements. Actual results could differ from those estimates and assumptions.
(H) Foreign Currency Transactions. The Fund's books and records are maintained in U.S. dollars. Prices of securities denominated in foreign currency amounts are translated into U.S. dollars at the mean between the buying and selling rates last quoted by any major U.S. bank at the following dates:
(i) market value of investment securities, other assets and liabilities— at the valuation date; and
(ii) purchases and sales of investment securities, income and expenses—at the date of such transactions.
The assets and liabilities that are denominated in foreign currency amounts are presented at the exchange rates and market values at the close of the period. The realized and unrealized changes in net assets arising from fluctuations in exchange rates and market prices of securities are not separately presented.
Net realized gain (loss) on foreign currency transactions represents net currency gains or losses realized as a result of differences between the amounts of securities sale proceeds or purchase cost, dividends, interest and withholding taxes as recorded on the Fund's books, and the U.S. dollar equivalent amount actually received or paid. Net currency gains or losses from valuing such foreign currency denominated assets and liabilities, other than investments at valuation date exchange rates, are reflected in unrealized foreign exchange gains or losses.
(I) Securities Lending. In order to realize additional income, the Fund may engage in securities lending, subject to the limitations set forth in the 1940 Act and relevant guidance by the staff of the Securities and Exchange Commission (“SEC”). If the Fund engages in securities lending, the Fund will lend through its custodian, JPMorgan Chase Bank, N.A., ("JPMorgan"), acting as securities lending agent on behalf of the Fund. Under the current arrangement, JPMorgan will manage the Fund's
collateral in accordance with the securities lending agency agreement between the Fund and JPMorgan, and indemnify the Fund against counterparty risk. The loans will be collateralized by cash (which may be invested in a money market fund) and/or non-cash collateral (which may include U.S. Treasury securities and/or U.S. government agency securities issued or guaranteed by the United States government or its agencies or instrumentalities) at least equal at all times to the market value of the securities loaned. Non-cash collateral held at year end is segregated and cannot be transferred by the Fund. The Fund bears the risk of delay in recovery of, or loss of rights in, the securities loaned. The Fund may also record a realized gain or loss on securities deemed sold due to a borrower’s inability to return securities on loan. The Fund bears the risk of any loss on investment of cash collateral. The Fund will receive compensation for lending its securities in the form of fees or it will retain a portion of interest earned on the investment of any cash collateral. The Fund will also continue to receive interest and dividends on the securities loaned and any gain or loss in the market price of the securities loaned that may occur during the term of the loan will be for the account of the Fund. Income earned from securities lending activities, if any, is reflected in the Statement of Operations. Securities on loan as of October 31, 2023, are shown in the Portfolio of Investments.
(J) Rights and Warrants. Rights are certificates that permit the holder to purchase a certain number of shares, or a fractional share, of a new stock from the issuer at a specific price. Warrants are instruments that entitle the holder to buy an equity security at a specific price for a specific period of time. These investments can provide a greater potential for profit or loss than an equivalent investment in the underlying security. Prices of these investments do not necessarily move in tandem with the prices of the underlying securities.
There is risk involved in the purchase of rights and warrants in that these investments are speculative investments. The Fund could also lose the entire value of its investment in warrants if such warrants are not exercised by the date of its expiration. The Fund is exposed to risk until the sale or exercise of each right or warrant is completed. Rights and Warrants as of October 31, 2023 are shown in the Portfolio of Investments.
(K) Foreign Securities Risk. The Fund may invest in foreign securities, which carry certain risks that are in addition to the usual risks inherent in domestic securities. Foreign regulatory regimes and securities markets can have less stringent investor protections and disclosure standards and less liquid trading markets than U.S. regulatory regimes and securities markets, and can experience political, social and economic developments that may affect the value of investments in foreign securities. These risks include those resulting from currency fluctuations, future adverse political or economic developments and possible imposition of currency exchange blockages or other foreign governmental laws or restrictions. Economic sanctions and other similar governmental actions or developments could, among other things, effectively restrict or eliminate the Fund's ability to purchase or sell certain foreign securities or groups of foreign securities, and thus may make the Fund's investments
| 24 | MainStay Epoch Capital Growth Fund |
in such securities less liquid or more difficult to value. These risks are likely to be greater in emerging markets than in developed markets. The ability of issuers of debt securities held by the Fund to meet their obligations may be affected by, among other things, economic or political developments in a specific country, industry or region.
(L) Indemnifications. Under the Trust’s organizational documents, its officers and trustees are indemnified against certain liabilities that may arise out of performance of their duties to the Trust. Additionally, in the normal course of business, the Fund enters into contracts with third-party service providers that contain a variety of representations and warranties and that may provide general indemnifications. The Fund's maximum exposure under these arrangements is unknown, as this would involve future claims that may be made against the Fund that have not yet occurred. The Manager believes that the risk of loss in connection with these potential indemnification obligations is remote. However, there can be no assurance that material liabilities related to such obligations will not arise in the future, which could adversely impact the Fund.
Note 3–Fees and Related Party Transactions
(A) Manager and Subadvisor. New York Life Investments, a registered investment adviser and an indirect, wholly-owned subsidiary of New York Life Insurance Company ("New York Life"), serves as the Fund's Manager, pursuant to an Amended and Restated Management Agreement (“Management Agreement”). The Manager provides offices, conducts clerical, recordkeeping and bookkeeping services and keeps most of the financial and accounting records required to be maintained by the Fund. Except for the portion of salaries and expenses that are the responsibility of the Fund, the Manager pays the salaries and expenses of all personnel affiliated with the Fund and certain operational expenses of the Fund. The Fund reimburses New York Life Investments in an amount equal to the portion of the compensation of the Chief Compliance Officer attributable to the Fund. Epoch Investment Partners, Inc. (“Epoch” or the “Subadvisor”), a registered investment adviser, serves as the Subadvisor to the Fund and is responsible for the day-to-day portfolio management of the Fund. Pursuant to the terms of an Amended and Restated Subadvisory Agreement ("Subadvisory Agreement") between New York Life Investments and Epoch, New York Life Investments pays for the services of the Subadvisor.
Pursuant to the Management Agreement, the Fund pays the Manager a monthly fee for the services performed and the facilities furnished at an annual rate of 0.75% of the Fund's average daily net assets.
New York Life Investments has contractually agreed to waive fees and/or reimburse expenses so that Total Annual Fund Operating Expenses (excluding taxes, interest, litigation, extraordinary expenses, brokerage and other transaction expenses relating to the purchase or sale of portfolio investments and acquired (underlying) fund fees and expenses) do not exceed the following percentages of average daily net assets: Class A, 1.15% and Class I, 0.90%. This agreement will remain in effect until February 28, 2024, and shall renew automatically for one-year
terms unless New York Life Investments provides written notice of termination prior to the start of the next term or upon approval of the Board.
During the year ended October 31, 2023, New York Life Investments earned fees from the Fund in the amount of $700,294 and waived fees and/or reimbursed expenses in the amount of $97,243 and paid the Subadvisor fees in the amount of $301,525.
JPMorgan provides sub-administration and sub-accounting services to the Fund pursuant to an agreement with New York Life Investments. These services include calculating the daily NAVs of the Fund, maintaining the general ledger and sub-ledger accounts for the calculation of the Fund's NAVs, and assisting New York Life Investments in conducting various aspects of the Fund's administrative operations. For providing these services to the Fund, JPMorgan is compensated by New York Life Investments.
Pursuant to an agreement between the Trust and New York Life Investments, New York Life Investments is responsible for providing or procuring certain regulatory reporting services for the Fund. The Fund will reimburse New York Life Investments for the actual costs incurred by New York Life Investments in connection with providing or procuring these services for the Fund.
(B) Distribution and Service Fees. The Trust, on behalf of the Fund, has entered into a distribution agreement with NYLIFE Distributors LLC (the “Distributor”), an affiliate of New York Life Investments. The Fund has adopted distribution plans (the “Plans”) in accordance with the provisions of Rule 12b-1 under the 1940 Act.
Pursuant to the Class A and Investor Class Plans, the Distributor receives a monthly fee from the Class A and Investor Class shares at an annual rate of 0.25% of the average daily net assets of the Class A and Investor Class shares for distribution and/or service activities as designated by the Distributor. Pursuant to the Class C Plan, Class C shares pay the Distributor a monthly distribution fee at an annual rate of 0.75% of the average daily net assets of the Class C shares, along with a service fee at an annual rate of 0.25% of the average daily net assets of the Class C shares, for a total 12b-1 fee of 1.00%. Class I shares are not subject to a distribution and/or service fee.
The Plans provide that the distribution and service fees are payable to the Distributor regardless of the amounts actually expended by the Distributor for distribution of the Fund's shares and service activities.
(C) Sales Charges. The Fund was advised by the Distributor that the amount of initial sales charges retained on sales of Class A and Investor Class shares during the year ended October 31, 2023, were $22,051 and $249, respectively.
The Fund was also advised that the Distributor retained CDSCs on redemptions of Class C shares during the year ended October 31, 2023, of $140.
Notes to Financial Statements (continued)
(D) Transfer, Dividend Disbursing and Shareholder Servicing Agent. NYLIM Service Company LLC, an affiliate of New York Life Investments, is the Fund's transfer, dividend disbursing and shareholder servicing agent pursuant to an agreement between NYLIM Service Company LLC and the Trust. NYLIM Service Company LLC has entered into an agreement with SS&C Global Investor & Distribution Solutions, Inc. ("SS&C"), pursuant to which SS&C performs certain transfer agent services on behalf of NYLIM Service Company LLC. New York Life Investments has contractually agreed to limit the transfer agency expenses charged to the Fund’s share classes to a maximum of 0.35% of that share class’s average daily net assets on an annual basis after deducting any applicable Fund or class-level expense reimbursement or small account fees. This agreement will remain in effect until February 28, 2024, and shall renew automatically for one-year terms unless New York Life Investments provides written notice of termination prior to the start of the next term or upon approval of the Board. During the year ended October 31, 2023, transfer agent expenses incurred by the Fund and any reimbursements, pursuant to the aforementioned Transfer Agency expense limitation agreement, were as follows:
| Class | Expense | Waived |
| Class A | $18,095 | $— |
| Investor Class | 3,803 | — |
| Class C | 2,679 | — |
| Class I | 37,335 | — |
(E) Small Account Fee. Shareholders with small accounts adversely impact the cost of providing transfer agency services. In an effort to reduce total transfer agency expenses, the Fund has implemented a small account fee on certain types of accounts. As described in the Fund's prospectus, certain shareholders with an account balance of less than $1,000 ($5,000 for Class A share accounts) are charged an annual per account fee of $20 (assessed semi-annually), the proceeds from which offset transfer agent fees as reflected in the Statement of Operations. This small account fee will not apply to certain types of accounts as described further in the Fund’s prospectus.
Note 4-Federal Income Tax
As of October 31, 2023, the cost and unrealized appreciation (depreciation) of the Fund’s investment portfolio, including applicable derivative contracts and other financial instruments, as determined on a federal income tax basis, were as follows:
| | Federal Tax
Cost | Gross
Unrealized
Appreciation | Gross
Unrealized
(Depreciation) | Net
Unrealized
Appreciation/
(Depreciation) |
| Investments in Securities | $113,965,366 | $18,029,853 | $(4,839,608) | $13,190,245 |
As of October 31, 2023, the components of accumulated gain (loss) on a tax basis were as follows:
Ordinary
Income | Accumulated
Capital
and Other
Gain (Loss) | Other
Temporary
Differences | Unrealized
Appreciation
(Depreciation) | Total
Accumulated
Gain (Loss) |
| $675,868 | $38,631 | $(35,996) | $13,186,407 | $13,864,910 |
The difference between book-basis and tax-basis unrealized appreciation (depreciation) is primarily due to wash sale adjustments.
During the years ended October 31, 2023 and October 31, 2022, the tax character of distributions paid as reflected in the Statements of Changes in Net Assets was as follows:
| | 2023 | 2022 |
| Distributions paid from: | | |
| Ordinary Income | $223,315 | $ 3,330,996 |
| Long-Term Capital Gains | 664,287 | 14,391,982 |
| Total | $887,602 | $17,722,978 |
Note 5–Custodian
JPMorgan is the custodian of cash and securities held by the Fund. Custodial fees are charged to the Fund based on the Fund's net assets and/or the market value of securities held by the Fund and the number of certain transactions incurred by the Fund.
Note 6–Line of Credit
The Fund and certain other funds managed by New York Life Investments maintain a line of credit with a syndicate of banks in order to secure a source of funds for temporary purposes to meet unanticipated or excessive redemption requests.
Effective July 25, 2023, under the credit agreement (the “Credit Agreement”), the aggregate commitment amount is $600,000,000 with an additional uncommitted amount of $100,000,000. The commitment fee is an annual rate of 0.15% of the average commitment amount payable quarterly, regardless of usage, to JPMorgan, who serves as the agent to the syndicate. The commitment fee is allocated among the Fund and certain other funds managed by New York Life Investments based upon their respective net assets and other factors. Interest on any revolving credit loan is charged based upon the Federal Funds Rate, Daily Simple Secured Overnight Financing Rate ("SOFR") + 0.10%, or the Overnight Bank Funding Rate, whichever is higher. The Credit Agreement expires on July 23, 2024, although the Fund, certain other funds managed by New York Life Investments and the syndicate of banks may renew the Credit Agreement for an additional year on the same or different terms or enter into a credit agreement with a different syndicate of banks. Prior to July 25, 2023, the aggregate commitment amount and the commitment fee were the same as those under the current Credit Agreement. During the year ended October 31, 2023, there were no
| 26 | MainStay Epoch Capital Growth Fund |
borrowings made or outstanding with respect to the Fund under the Credit Agreement.
Note 7–Interfund Lending Program
Pursuant to an exemptive order issued by the SEC, the Fund, along with certain other funds managed by New York Life Investments, may participate in an interfund lending program. The interfund lending program provides an alternative credit facility that permits the Fund and certain other funds managed by New York Life Investments to lend or borrow money for temporary purposes directly to or from one another, subject to the conditions of the exemptive order. During the year ended October 31, 2023, there were no interfund loans made or outstanding with respect to the Fund.
Note 8–Purchases and Sales of Securities (in 000’s)
During the year ended October 31, 2023, purchases and sales of securities, other than short-term securities, were $82,150 and $27,507, respectively.
Note 9–Capital Share Transactions
Transactions in capital shares for the years ended October 31, 2023 and October 31, 2022, were as follows:
| Class A | Shares | Amount |
| Year ended October 31, 2023: | | |
| Shares sold | 1,628,163 | $ 19,874,450 |
| Shares issued to shareholders in reinvestment of distributions | 23,071 | 256,316 |
| Shares redeemed | (430,284) | (5,125,878) |
| Net increase (decrease) in shares outstanding before conversion | 1,220,950 | 15,004,888 |
| Shares converted into Class A (See Note 1) | 19,946 | 241,280 |
| Net increase (decrease) | 1,240,896 | $ 15,246,168 |
| Year ended October 31, 2022: | | |
| Shares sold | 709,982 | $ 8,625,981 |
| Shares issued to shareholders in reinvestment of distributions | 384,632 | 4,954,057 |
| Shares redeemed | (391,322) | (4,603,433) |
| Net increase (decrease) in shares outstanding before conversion | 703,292 | 8,976,605 |
| Shares converted into Class A (See Note 1) | 23,937 | 303,739 |
| Net increase (decrease) | 727,229 | $ 9,280,344 |
| |
| Investor Class | Shares | Amount |
| Year ended October 31, 2023: | | |
| Shares sold | 182,305 | $ 2,235,615 |
| Shares issued to shareholders in reinvestment of distributions | 1,067 | 11,776 |
| Shares redeemed | (9,749) | (116,399) |
| Net increase (decrease) in shares outstanding before conversion | 173,623 | 2,130,992 |
| Shares converted into Investor Class (See Note 1) | 1,556 | 19,187 |
| Shares converted from Investor Class (See Note 1) | (15,543) | (186,386) |
| Net increase (decrease) | 159,636 | $ 1,963,793 |
| Year ended October 31, 2022: | | |
| Shares sold | 14,650 | $ 181,933 |
| Shares issued to shareholders in reinvestment of distributions | 28,387 | 363,357 |
| Shares redeemed | (14,009) | (161,742) |
| Net increase (decrease) in shares outstanding before conversion | 29,028 | 383,548 |
| Shares converted into Investor Class (See Note 1) | 1,563 | 17,080 |
| Shares converted from Investor Class (See Note 1) | (17,935) | (235,284) |
| Net increase (decrease) | 12,656 | $ 165,344 |
| |
| Class C | Shares | Amount |
| Year ended October 31, 2023: | | |
| Shares sold | 175,065 | $ 1,997,848 |
| Shares issued to shareholders in reinvestment of distributions | 809 | 8,497 |
| Shares redeemed | (152,718) | (1,745,171) |
| Net increase (decrease) in shares outstanding before conversion | 23,156 | 261,174 |
| Shares converted from Class C (See Note 1) | (6,440) | (74,081) |
| Net increase (decrease) | 16,716 | $ 187,093 |
| Year ended October 31, 2022: | | |
| Shares sold | 28,990 | $ 303,526 |
| Shares issued to shareholders in reinvestment of distributions | 23,870 | 293,121 |
| Shares redeemed | (42,311) | (462,532) |
| Net increase (decrease) in shares outstanding before conversion | 10,549 | 134,115 |
| Shares converted from Class C (See Note 1) | (8,094) | (85,535) |
| Net increase (decrease) | 2,455 | $ 48,580 |
| |
Notes to Financial Statements (continued)
| Class I | Shares | Amount |
| Year ended October 31, 2023: | | |
| Shares sold | 4,429,760 | $ 54,388,522 |
| Shares issued to shareholders in reinvestment of distributions | 54,227 | 604,094 |
| Shares redeemed | (1,412,291) | (17,031,646) |
| Net increase (decrease) | 3,071,696 | $ 37,960,970 |
| Year ended October 31, 2022: | | |
| Shares sold | 461,566 | $ 5,166,916 |
| Shares issued to shareholders in reinvestment of distributions | 920,690 | 11,886,105 |
| Shares redeemed | (591,942) | (7,079,466) |
| Net increase (decrease) | 790,314 | $ 9,973,555 |
Note 10–Other Matters
As of the date of this report, the Fund faces a heightened level of risk associated with current uncertainty, volatility and state of economies, financial markets, rising interest rates, and labor and health conditions around the world. Events such as war, acts of terrorism, recessions, rapid inflation, the imposition of international sanctions, earthquakes, hurricanes, epidemics and pandemics and other unforeseen natural or human disasters may have broad adverse social, political and economic effects on the global economy, which could negatively impact the value of the Fund's investments. Developments that disrupt global economies and financial markets may magnify factors that affect the Fund's performance.
Note 11–Subsequent Events
In connection with the preparation of the financial statements of the Fund as of and for the year ended October 31, 2023, events and transactions subsequent to October 31, 2023, through the date the financial statements were issued, have been evaluated by the Manager for possible adjustment and/or disclosure. No subsequent events requiring financial statement adjustment or disclosure have been identified.
| 28 | MainStay Epoch Capital Growth Fund |
Report of Independent Registered Public Accounting Firm
To the Shareholders of the Fund and Board of Trustees
MainStay Funds Trust:
Opinion on the Financial Statements
We have audited the accompanying statement of assets and liabilities of MainStay Epoch Capital Growth Fund (the Fund), one of the funds constituting MainStay Funds Trust, including the portfolio of investments, as of October 31, 2023, the related statement of operations for the year then ended, the statements of changes in net assets for each of the years in the two-year period then ended, and the related notes (collectively, the financial statements) and the financial highlights for each of the years in the five-year period then ended. In our opinion, the financial statements and financial highlights present fairly, in all material respects, the financial position of the Fund as of October 31, 2023, the results of its operations for the year then ended, the changes in its net assets for each of the years in the two-year period then ended, and the financial highlights for each of the years in the five-year period then ended, in conformity with U.S. generally accepted accounting principles.
Basis for Opinion
These financial statements and financial highlights are the responsibility of the Fund's management. Our responsibility is to express an opinion on these financial statements and financial highlights based on our audits. We are a public accounting firm registered with the Public Company Accounting Oversight Board (United States) (PCAOB) and are required to be independent with respect to the Fund in accordance with the U.S. federal securities laws and the applicable rules and regulations of the Securities and Exchange Commission and the PCAOB.
We conducted our audits in accordance with the standards of the PCAOB. Those standards require that we plan and perform the audit to obtain reasonable assurance about whether the financial statements and financial highlights are free of material misstatement, whether due to error or fraud. Our audits included performing procedures to assess the risks of material misstatement of the financial statements and financial highlights, whether due to error or fraud, and performing procedures that respond to those risks. Such procedures included examining, on a test basis, evidence regarding the amounts and disclosures in the financial statements and financial highlights. Such procedures also included confirmation of securities owned as of October 31, 2023, by correspondence with the custodian, the transfer agent and brokers; when replies were not received from brokers, we performed other auditing procedures. Our audits also included evaluating the accounting principles used and significant estimates made by management, as well as evaluating the overall presentation of the financial statements and financial highlights. We believe that our audits provide a reasonable basis for our opinion.

We have served as the auditor of one or more New York Life Investment Management investment companies since 2003.
Philadelphia, Pennsylvania
December 22, 2023
Federal Income Tax Information
(Unaudited)
The Fund is required under the Internal Revenue Code to advise shareholders in a written statement as to the federal tax status of dividends paid by the Fund during such fiscal years. Accordingly, the Fund paid $659,210 as long term capital gain distributions.
For the fiscal year ended October 31, 2023, the Fund designated approximately $223,315 under the Internal Revenue Code as qualified dividend income eligible for reduced tax rates.
The dividends paid by the Fund during the fiscal year ended October 31, 2023 should be multiplied by 91.59% to arrive at the amount eligible for the corporate dividend-received deduction.
In February 2024, shareholders will receive an IRS Form 1099-DIV or substitute Form 1099, which will show the federal tax status of the distributions received by shareholders in calendar year 2023. The amounts that will be reported on such 1099-DIV or substitute Form 1099 will be the amounts you are to use on your federal income tax return and will differ from the amounts which we must report for the Fund's fiscal year ended October 31, 2023.
Proxy Voting Policies and Procedures and Proxy Voting Record
The Fund is required to file with the SEC its proxy voting record for the 12-month period ending June 30 on Form N-PX. A description of the policies and procedures that are used to vote proxies relating to portfolio securities of the Fund is available free of charge upon request by calling 800-624-6782 or visiting the SEC’s website at www.sec.gov. The most recent Form N-PX or proxy voting record is available free of charge upon request by calling 800-624-6782; visiting newyorklifeinvestments.com; or visiting the SEC’s website at www.sec.gov.
Shareholder Reports and Quarterly Portfolio Disclosure
The Fund is required to file its complete schedule of portfolio holdings with the SEC 60 days after its first and third fiscal quarter on Form N-PORT. The Fund's holdings report is available free of charge upon request by calling New York Life Investments at 800-624-6782.
| 30 | MainStay Epoch Capital Growth Fund |
Board of Trustees and Officers (Unaudited)
The Trustees and officers of the Fund are listed below. The Board oversees the MainStay Group of Funds (which consists of MainStay Funds and MainStay Funds Trust), MainStay VP Funds Trust, MainStay MacKay DefinedTerm Municipal Opportunities Fund, MainStay CBRE Global Infrastructure Megatrends Term Fund, the Manager and the Subadvisors, and elects the officers of the Funds who are responsible for the day-to-day operations of the Fund. Information pertaining to the Trustees and officers is set forth below. Each Trustee serves until his or her successor is elected and qualified or until his or her resignation, death or
removal. Under the Board’s retirement policy, unless an exception is made, a Trustee must tender his or her resignation by the end of the calendar year during which he or she reaches the age of 75. Officers are elected annually by the Board. The business address of each Trustee and officer listed below is 51 Madison Avenue, New York, New York 10010. A majority of the Trustees are not “interested persons” (as defined by the 1940 Act and rules adopted by the SEC thereunder) of the Fund (“Independent Trustees”).
| | Name and
Year of Birth | Term of Office,
Position(s) Held and
Length of Service | Principal Occupation(s)
During Past Five Years | Number of
Portfolios in
Fund Complex
Overseen by
Trustee | Other Directorships
Held by Trustee |
| | | | | | |
| | Naïm Abou-Jaoudé*
1966 | MainStay Funds: Trustee
since 2023
MainStay Funds Trust:
Trustee since 2023 | Chief Executive Officer of New York Life Investment Management LLC (since 2023). Chief Executive Officer of Candriam (an affiliate of New York Life Investment Management LLC) (2007 to 2023). | 81 | MainStay VP Funds Trust:
Trustee since 2023 (31 portfolios);
MainStay MacKay DefinedTerm Municipal Opportunities Fund: Trustee
since 2023;
MainStay CBRE Global Infrastructure Megatrends Term Fund: Trustee
since 2023; and
New York Life Investment Management International (Chair) since 2015 |
| * | This Trustee is considered to be an “interested person” of the MainStay Group of Funds, MainStay VP Funds Trust, MainStay CBRE Global Infrastructure Megatrends Term Fund and MainStay MacKay DefinedTerm Municipal Opportunities Fund, within the meaning of the 1940 Act because of his affiliation with New York Life Investment Management LLC and Candriam, as described in detail above in the column entitled “Principal Occupation(s) During Past Five Years.” |
| | |
Board of Trustees and Officers (Unaudited) (continued)
| | Name and
Year of Birth | Term of Office,
Position(s) Held and
Length of Service | Principal Occupation(s)
During Past Five Years | Number of
Portfolios in
Fund Complex
Overseen by
Trustee | Other Directorships
Held by Trustee |
| | | | | | |
| | David H. Chow
1957 | MainStay Funds: Trustee since January 2016, Advisory Board Member (June 2015 to December 2015);MainStay Funds Trust:
Trustee since January 2016, Advisory Board Member (June 2015 to December 2015) | Founder and CEO, DanCourt Management, LLC (since 1999) | 81 | MainStay VP Funds Trust: Trustee since January 2016, Advisory Board Member (June 2015 to December 2015) (31 portfolios);
MainStay MacKay DefinedTerm Municipal Opportunities Fund: Trustee since January 2016, Advisory Board Member (June 2015 to December 2015);
MainStay CBRE Global Infrastructure Megatrends Term Fund: Trustee since 2021;
VanEck Vectors Group of Exchange-Traded Funds: Trustee since 2006 and Independent Chairman of the Board of Trustees from 2008 to 2022 (57 portfolios); and
Berea College of Kentucky: Trustee since 2009, Chair of the Investment Committee since 2018 |
| | Karen Hammond
1956 | MainStay Funds: Trustee since December 2021, Advisory Board Member (June 2021 to December 2021);MainStay Funds Trust:
Trustee since December 2021, Advisory Board Member (June 2021 to December 2021)
| Retired, Managing Director, Devonshire Investors (2007 to 2013); Senior Vice President, Fidelity Management & Research Co. (2005 to 2007); Senior Vice President and Corporate Treasurer, FMR Corp. (2003 to 2005); Chief Operating Officer, Fidelity Investments Japan (2001 to 2003) | 81 | MainStay VP Funds Trust: Trustee since December 2021, Advisory Board Member (June 2021 to December 2021) (31 portfolios);
MainStay MacKay DefinedTerm Municipal Opportunities Fund: Trustee since December 2021, Advisory Board Member (June 2021 to December 2021);
MainStay CBRE Global Infrastructure Megatrends Term Fund: Trustee since December 2021, Advisory Board Member (June 2021 to December 2021);
Two Harbors Investment Corp.: Director since 2018;
Rhode Island State Investment Commission: Member since 2017; and
Blue Cross Blue Shield of Rhode Island: Director since 2019 |
| | Susan B. Kerley
1951 | MainStay Funds: Chair since January 2017 and Trustee since 2007;MainStay Funds Trust:
Chair since January 2017 and Trustee since 1990*** | President, Strategic Management Advisors LLC (since 1990) | 81 | MainStay VP Funds Trust: Chair since January 2017 and Trustee since 2007 (31 portfolios)**;
MainStay MacKay DefinedTerm Municipal Opportunities Fund: Chair since January 2017 and Trustee since 2011;
MainStay CBRE Global Infrastructure Megatrends Term Fund: Trustee since June 2021; and
Legg Mason Partners Funds: Trustee since 1991 (45 portfolios) |
| 32 | MainStay Epoch Capital Growth Fund |
| | Name and
Year of Birth | Term of Office,
Position(s) Held and
Length of Service | Principal Occupation(s)
During Past Five Years | Number of
Portfolios in
Fund Complex
Overseen by
Trustee | Other Directorships
Held by Trustee |
| | | | | | |
| | Alan R. Latshaw
1951 | MainStay Funds: Trusteesince 2006;MainStay Funds Trust:
Trustee since 2007*** | Retired; Partner, Ernst & Young LLP (2002 to 2003); Partner, Arthur Andersen LLP (1989 to 2002); Consultant to the MainStay Funds Audit and Compliance Committee (2004 to 2006) | 81 | MainStay VP Funds Trust: Trustee since 2007 (31 portfolios)**;
MainStay MacKay DefinedTerm Municipal Opportunities Fund: Trustee since 2011; and
MainStay CBRE Global Infrastructure Megatrends Term Fund: Trustee since June 2021 |
| | Jacques P. Perold
1958 | MainStay Funds: Trustee since January 2016, Advisory Board Member (June 2015to December 2015);MainStay Funds Trust:
Trustee since January 2016, Advisory Board Member (June 2015 to December 2015) | Founder and Chief Executive Officer, CapShift Advisors LLC (since 2018); President, Fidelity Management & Research Company (2009 to 2014); President and Chief Investment Officer, Geode Capital Management, LLC (2001 to 2009) | 81 | MainStay VP Funds Trust: Trustee since January 2016, Advisory Board Member (June 2015 to December 2015) (31 portfolios);
MainStay MacKay DefinedTerm Municipal Opportunities Fund: Trustee since January 2016, Advisory Board Member (June 2015 to December 2015);
MainStay CBRE Global Infrastructure Megatrends Term Fund: Trustee since June 2021;
Allstate Corporation: Director since 2015; and
MSCI Inc.: Director since 2017 |
| | Richard S. Trutanic
1952 | MainStay Funds: Trustee since 1994;MainStay Funds Trust:
Trustee since 2007*** | Chairman and Chief Executive Officer, Somerset & Company (financial advisory firm) (since 2004); Managing Director, The Carlyle Group (private investment firm) (2002 to 2004); Senior Managing Director, Partner and Board Member, Groupe Arnault S.A. (private investment firm) (1999 to 2002) | 81 | MainStay VP Funds Trust: Trustee since 2007 (31 portfolios)**;
MainStay MacKay DefinedTerm Municipal Opportunities Fund: Trustee since 2011; and
MainStay CBRE Global Infrastructure Megatrends Term Fund: Trustee since June 2021 |
| ** | Includes prior service as a Director of MainStay VP Series Fund, Inc., the predecessor to MainStay VP Funds Trust. |
| *** | Includes prior service as a Director/Trustee of certain predecessor entities to MainStay Funds Trust. |
Board of Trustees and Officers (Unaudited) (continued)
| | Name and
Year of Birth | Position(s) Held and
Length of Service | Principal Occupation(s)
During Past Five Years | |
| | | | | |
| | Kirk C. Lehneis
1974 | President, MainStay Funds, MainStay Funds Trust (since 2017) | Chief Operating Officer and Senior Managing Director (since 2016), New York Life Investment Management LLC and New York Life Investment Management Holdings LLC; Member of the Board of Managers (since 2017) and Senior Managing Director (since 2018), NYLIFE Distributors LLC; Chairman of the Board and Senior Managing Director, NYLIM Service Company LLC (since 2017); Trustee, President and Principal Executive Officer of IndexIQ Trust, IndexIQ ETF Trust and IndexIQ Active ETF Trust (since 2018); President, MainStay CBRE Global Infrastructure Megatrends Term Fund (since 2021), MainStay MacKay DefinedTerm Municipal Opportunities Fund and MainStay VP Funds Trust (since 2017)**; Senior Managing Director, Global Product Development (2015 to 2016); Managing Director, Product Development (2010 to 2015), New York Life Investment Management LLC | |
| | Jack R. Benintende
1964 | Treasurer and Principal Financial and Accounting Officer, MainStay Funds (since 2007), MainStay Funds Trust (since 2009) | Managing Director, New York Life Investment Management LLC (since 2007); Treasurer and Principal Financial and Accounting Officer, MainStay CBRE Global Infrastructure Megatrends Term Fund (since 2021), MainStay MacKay DefinedTerm Municipal Opportunities Fund (since 2011) and MainStay VP Funds Trust (since 2007)**; and Assistant Treasurer, New York Life Investment Management Holdings LLC (2008 to 2012) | |
| | J. Kevin Gao
1967 | Secretary and Chief Legal Officer, MainStay Funds and MainStay Funds Trust (since 2010) | Managing Director and Associate General Counsel, New York Life Investment Management LLC (since 2010); Secretary and Chief Legal Officer, MainStay CBRE Global Infrastructure Megatrends Term Fund (since 2021), MainStay MacKay DefinedTerm Municipal Opportunities Fund (since 2011) and MainStay VP Funds Trust (since 2010)** | |
| | Kevin M. Gleason
1967 | Vice President and Chief Compliance Officer, MainStay Funds and MainStay Funds Trust (since June 2022) | Vice President and Chief Compliance Officer, IndexIQ Trust, IndexIQ ETF Trust and Index IQ Active ETF Trust (since June 2022); Vice President and Chief Compliance Officer, MainStay CBRE Global Infrastructure Megatrends Term Fund, MainStay VP Funds Trust and MainStay MacKay DefinedTerm Municipal Opportunities Fund (since June 2022); Senior Vice President, Voya Investment Management and Chief Compliance Officer, Voya Family of Funds (2012 to 2022) | |
| | Scott T. Harrington
1959 | Vice President— Administration, MainStay Funds (since 2005), MainStay Funds Trust (since 2009) | Managing Director, New York Life Investment Management LLC (including predecessor advisory organizations) (since 2000); Member of the Board of Directors, New York Life Trust Company (since 2009); Vice President—Administration, MainStay CBRE Global Infrastructure Megatrends Term Fund (since 2021), MainStay MacKay DefinedTerm Municipal Opportunities Fund (since 2011) and MainStay VP Funds Trust (since 2005)** | |
| * | The officers listed above are considered to be “interested persons” of the MainStay Group of Funds, MainStay VP Funds Trust, MainStay CBRE Global Infrastructure Megatrends Term Fund and MainStay MacKay DefinedTerm Municipal Opportunities Fund within the meaning of the 1940 Act because of their affiliation with the MainStay Group of Funds, New York Life Insurance Company and/or its affiliates, including New York Life Investment Management LLC, New York Life Insurance Company, NYLIM Service Company LLC, NYLIFE Securities LLC and/or NYLIFE Distributors LLC, as described in detail in the column captioned “Principal Occupation(s) During Past Five Years.” Officers are elected annually by the Board. |
| ** | Includes prior service as an Officer of MainStay VP Series Fund, Inc., the predecessor to MainStay VP Funds Trust. |
Officers of the Trust (Who are not Trustees)*
| 34 | MainStay Epoch Capital Growth Fund |
Equity
U.S. Equity
MainStay Epoch U.S. Equity Yield Fund
MainStay Fiera SMID Growth Fund
MainStay PineStone U.S. Equity Fund
MainStay S&P 500 Index Fund
MainStay Winslow Large Cap Growth Fund
MainStay WMC Enduring Capital Fund
MainStay WMC Growth Fund
MainStay WMC Small Companies Fund
MainStay WMC Value Fund
International Equity
MainStay Epoch International Choice Fund
MainStay PineStone International Equity Fund
MainStay WMC International Research Equity Fund
Emerging Markets Equity
MainStay Candriam Emerging Markets Equity Fund
Global Equity
MainStay Epoch Capital Growth Fund
MainStay Epoch Global Equity Yield Fund
MainStay PineStone Global Equity Fund
Fixed Income
Taxable Income
MainStay Candriam Emerging Markets Debt Fund
MainStay Floating Rate Fund
MainStay MacKay High Yield Corporate Bond Fund
MainStay MacKay Short Duration High Yield Fund
MainStay MacKay Strategic Bond Fund
MainStay MacKay Total Return Bond Fund
MainStay MacKay U.S. Infrastructure Bond Fund
MainStay Short Term Bond Fund
Tax-Exempt Income
MainStay MacKay California Tax Free Opportunities Fund1
MainStay MacKay High Yield Municipal Bond Fund
MainStay MacKay New York Tax Free Opportunities Fund2
MainStay MacKay Short Term Municipal Fund
MainStay MacKay Strategic Municipal Allocation Fund
MainStay MacKay Tax Free Bond Fund
Money Market
MainStay Money Market Fund
Mixed Asset
MainStay Balanced Fund
MainStay Income Builder Fund
MainStay MacKay Convertible Fund
Speciality
MainStay CBRE Global Infrastructure Fund
MainStay CBRE Real Estate Fund
MainStay Cushing MLP Premier Fund
Asset Allocation
MainStay Conservative Allocation Fund
MainStay Conservative ETF Allocation Fund
MainStay Defensive ETF Allocation Fund
MainStay Equity Allocation Fund
MainStay Equity ETF Allocation Fund
MainStay ESG Multi-Asset Allocation Fund
MainStay Growth Allocation Fund
MainStay Growth ETF Allocation Fund
MainStay Moderate Allocation Fund
MainStay Moderate ETF Allocation Fund
Manager
New York Life Investment Management LLC
New York, New York
Subadvisors
Candriam3
Strassen, Luxembourg
CBRE Investment Management Listed Real Assets LLC
Radnor, Pennsylvania
Cushing Asset Management, LP
Dallas, Texas
Epoch Investment Partners, Inc.
New York, New York
Fiera Capital Inc.
New York, New York
IndexIQ Advisors LLC3
New York, New York
MacKay Shields LLC3
New York, New York
NYL Investors LLC3
New York, New York
PineStone Asset Management Inc.
Montreal, Québec
Wellington Management Company LLP
Boston, Massachusetts
Winslow Capital Management, LLC
Minneapolis, Minnesota
Legal Counsel
Dechert LLP
Washington, District of Columbia
Independent Registered Public Accounting Firm
KPMG LLP
Philadelphia, Pennsylvania
Distributor
NYLIFE Distributors LLC3
Jersey City, New Jersey
Custodian
JPMorgan Chase Bank, N.A.
New York, New York
1.
This Fund is registered for sale in AZ, CA, NV, OR, TX, UT, WA and MI (Class A and Class I shares only), and CO, FL, GA, HI, ID, MA, MD, NH, NJ and NY (Class I shares only).
| 2. | This Fund is registered for sale in CA, CT, DE, FL, MA, NJ, NY and VT. |
| 3. | An affiliate of New York Life Investment Management LLC. |
Not part of the Annual Report
For more information
800-624-6782
newyorklifeinvestments.com
“New York Life Investments” is both a service mark, and the common trade name, of certain investment advisors affiliated with New York Life Insurance Company. The MainStay Funds® are managed by New York Life Investment Management LLC and distributed by NYLIFE Distributors LLC, 30 Hudson Street, Jersey City, NJ 07302, a wholly owned subsidiary of New York Life Insurance Company. NYLIFE Distributors LLC is a Member FINRA/SIPC.
©2023 NYLIFE Distributors LLC. All rights reserved.
| 5013738MS139-23 | MSECG11-12/23 |
(NYLIM) NL284
MainStay Epoch Global Equity Yield Fund
Message from the President and Annual Report
October 31, 2023
Special Notice:
Beginning in July 2024, new regulations issued by the Securities and Exchange Commission (SEC) will take effect requiring open-end mutual fund companies and ETFs to (1) overhaul the content of their shareholder reports and (2) mail paper copies of the new tailored shareholder reports to shareholders who have not opted to receive these documents electronically.
If you have not yet elected to receive your shareholder reports electronically, please contact your financial intermediary or visit newyorklifeinvestments.com/accounts.
| Not FDIC/NCUA Insured | Not a Deposit | May Lose Value | No Bank Guarantee | Not Insured by Any Government Agency |
This page intentionally left blank
Message from the President
Volatile economic and geopolitical forces drove market behavior during the 12-month reporting period ended October 31, 2023. While equity markets generally gained ground, bond prices trended broadly lower.
Although the war in Ukraine, the outbreak of hostilities in the Middle East and several other notable events affected financial assets, inflation and interest rate trends stood at the forefront of market developments during most of the period. As the reporting period began, high levels of inflation already showed signs of easing in the face of aggressive rate hikes by the U.S. Federal Reserve (the “Fed”). From a peak of 9.1% in June 2022, the annualized U.S. inflation rate dropped to 7.1% in November 2022, and to 3.2% in October 2023. At the same time, the Fed increased the benchmark federal funds rate from 3.75%–4.00% at the beginning of the reporting period to 5.25%–5.50% as of October 31, 2023. As the pace of rate increases slowed during the period, investors hoped for an early shift to a looser monetary policy. However, comments from Fed members late in the period reinforced the central bank’s hawkish stance in response to surprisingly robust U.S. economic growth and rising wage pressures, thus increasing the likelihood that interest rates would stay higher for longer. International developed markets exhibited similar dynamics of elevated inflation and rising interest rates.
Despite the backdrop of high interest rates—along with political dysfunction in Washington D.C. and intensifying global geopolitical instability—equity markets managed to advance, supported by healthy consumer spending trends and persistent domestic economic growth. The S&P 500® Index, a widely regarded benchmark of large-cap U.S. market performance, gained ground, bolstered by the strong performance of energy stocks amid surging petroleum prices and mega-cap, growth-oriented, technology-related shares, which rose as investors flocked to companies creating the infrastructure for developments in artificial intelligence. Smaller-cap stocks and value-oriented shares produced milder returns. Among industry sectors, energy and
information technology posted the strongest gains. Real estate declined most sharply under pressure from rising mortgage rates and weak levels of office occupancy. Developed international markets outperformed U.S. markets, with Europe benefiting during the first half of the period from unexpected economic resilience in the face of rising energy prices and the ongoing war in Ukraine. Emerging markets posted positive results but lagged developed markets, largely due to slow economic growth in China despite the relaxation of pandemic-era lockdowns.
Bond prices were driven lower by rising yields and increasing expectations of high interest rates for an extended period of time. The U.S. yield curve steepened, with the 30-year Treasury yield exceeding 5% for the first time in more than a decade. The yield curve remained inverted, with the 10-year Treasury yield ending the period at 4.88%, compared with 5.07% for the 2-year Treasury yield. Corporate bonds outperformed long-term Treasury bonds, but still trended lower under pressure from rising yields and an uptick in default rates. Among corporates, lower-credit-quality instruments performed slightly better than their higher-credit-quality counterparts, while floating rate securities performed better still.
In the face of today’s uncertain market environment, New York Life Investments remains dedicated to providing the guidance, resources and investment solutions you need to pursue your financial goals.
Thank you for trusting us to help meet your investment needs.
Sincerely,
Kirk C. Lehneis
President
The opinions expressed are as of the date of this report and are subject to change. There is no guarantee that any forecast made will come to pass. This material does not constitute investment advice and is not intended as an endorsement of any specific investment. Past performance is no guarantee of future results.
Not part of the Annual Report
Investors should refer to the Fund’s Summary Prospectus and/or Prospectus and consider the Fund’s investment objectives, strategies, risks, charges and expenses carefully before investing. The Summary Prospectus and/or Prospectus contain this and other information about the Fund. You may obtain copies of the Fund’s Summary Prospectus, Prospectus and Statement of Additional Information, which includes information about the MainStay Funds Trust's Trustees, free of charge, upon request, by calling toll-free 800-624-6782, by writing to NYLIFE Distributors LLC, Attn: MainStay Marketing Department, 30 Hudson Street, Jersey City, NJ 07302 or by sending an e-mail to MainStayShareholderServices@nylim.com. These documents are also available via the MainStay Funds’ website at newyorklifeinvestments.com. Please read the Fund’s Summary Prospectus and/or Prospectus carefully before investing.
Investment and Performance Comparison (Unaudited)
Performance data quoted represents past performance. Past performance is no guarantee of future results. Because of market volatility and other factors, current performance may be lower or higher than the figures shown. Investment return and principal value will fluctuate, and as a result, when shares are redeemed, they may be worth more or less than their original cost. The graph below depicts the historical performance of Class I shares of the Fund. Performance will vary from class to class based on differences in class-specific expenses and sales charges. For performance information current to the most recent month-end, please call 800-624-6782 or visit newyorklifeinvestments.com.
The performance table and graph do not reflect the deduction of taxes that a shareholder would pay on distributions or Fund share redemptions. Total returns reflect maximum applicable sales charges as indicated in the table below, if any, changes in share price, and reinvestment of dividend and capital gain distributions. The graph assumes the initial investment amount shown below and reflects the deduction of all sales charges that would have applied for the period of investment. Performance figures may reflect certain fee waivers and/or expense limitations, without which total returns may have been lower. For more information on share classes and current fee waivers and/or expense limitations (if any), please refer to the Notes to Financial Statements.

| Average Annual Total Returns for the Year-Ended October 31, 2023 |
| Class | Sales Charge | | Inception
Date | One
Year | Five
Years | Ten Years
or Since
Inception | Gross
Expense
Ratio1 |
| Class A Shares | Maximum 5.50% Initial Sales Charge | With sales charges | 8/2/2006 | -0.35% | 3.63% | 3.71% | 1.16% |
| | | Excluding sales charges | | 5.45 | 4.81 | 4.30 | 1.16 |
| Investor Class Shares2 | Maximum 5.00% Initial Sales Charge | With sales charges | 11/16/2009 | 0.12 | 3.58 | 3.69 | 1.16 |
| | | Excluding sales charges | | 5.39 | 4.76 | 4.28 | 1.16 |
| Class C Shares | Maximum 1.00% CDSC | With sales charges | 11/16/2009 | 3.67 | 4.03 | 3.52 | 1.91 |
| | if Redeemed Within One Year of Purchase | Excluding sales charges | | 4.67 | 4.03 | 3.52 | 1.91 |
| Class I Shares | No Sales Charge | | 12/27/2005 | 5.73 | 5.09 | 4.56 | 0.91 |
| Class R2 Shares3 | No Sales Charge | | 2/28/2014 | 5.28 | 4.65 | 3.95 | 1.26 |
| Class R3 Shares3 | No Sales Charge | | 2/29/2016 | 5.03 | 4.39 | 5.00 | 1.51 |
| Class R6 Shares | No Sales Charge | | 6/17/2013 | 5.82 | 4.92 | 4.55 | 0.75 |
| 1. | The gross expense ratios presented reflect the Fund’s “Total Annual Fund Operating Expenses” from the most recent Prospectus, as supplemented, and may differ from other expense ratios disclosed in this report. |
| 2. | Prior to June 30, 2020, the maximum initial sales charge was 5.50%, which is reflected in the applicable average annual total return figures shown. |
| 3. | As of October 31, 2023, Class R2 and Class R3 shares are closed to new investors and, upon the close of business on December 29, 2023, Class R2 and Class R3 shares are closed to additional investments by existing shareholders. Additionally, Class R2 and Class R3 shares will be liquidated on or about February 28, 2024 (the "Liquidation Date"). It is expected that the Fund will distribute to remaining shareholders invested in Class R2 or Class R3 shares, on or promptly after the Liquidation Date, a liquidating distribution in cash or cash equivalents equal to the net asset value of such shares. |
The footnotes on the next page are an integral part of the table and graph and should be carefully read in conjunction with them.
| Benchmark Performance* | One
Year | Five
Years | Ten
Years |
| MSCI World Index (Net)1 | 10.48% | 8.27% | 7.53% |
| Global Equity Yield Composite Index2 | 4.05 | 4.92 | 5.58 |
| Morningstar Global Large Stock Value Category Average3 | 8.57 | 5.67 | 5.13 |
| * | Returns for indices reflect no deductions for fees, expenses or taxes, except for foreign withholding taxes where applicable. Results assume reinvestment of all dividends and capital gains. An investment cannot be made directly in an index. |
| 1. | The MSCI World Index (Net) is the Fund's primary broad-based securities market index for comparison purposes. The MSCI World Index (Net) is a free float-adjusted market capitalization weighted index that is designed to measure the equity market performance of developed markets. |
| 2. | The Fund has selected the Global Equity Yield Composite Index as its secondary benchmark. The Global Equity Yield Composite Index consists of the MSCI World High Dividend Yield Index and the MSCI World Minimum Volatility (USD) Index weighted at 60% and 40%, respectively. The MSCI World High Dividend Yield Index is based on the MSCI World Index and is designed to reflect the performance of equities in the MSCI World Index (excluding real estate investment trusts) with higher dividend income and quality characteristics than average dividend yields that are both sustainable and persistent. The MSCI World Minimum Volatility (USD) Index aims to reflect the performance characteristics of a minimum variance strategy applied to the MSCI large and mid-cap equity universe across 23 developed markets countries. The MSCI World Minimum Volatility (USD) Index is calculated by optimizing the MSCI World Index for the lowest absolute risk (within a given set of constraints). |
| 3. | Morningstar Global Large Stock Value Category Average portfolios invest in a variety of international stocks and typically skew towards large caps that are less expensive or growing more slowly than other global large-cap stocks. Global large stock value portfolios have few geographical limitations. It is common for these funds to invest the majority of their assets in developed markets, with the remainder divided among the globe’s emerging markets. These funds are not significantly overweight U.S. equity exposure relative to the Morningstar Global Market Index and maintain at least a 20% absolute U.S. exposure. |
The footnotes on the preceding page are an integral part of the table and graph and should be carefully read in conjunction with them.
| 6 | MainStay Epoch Global Equity Yield Fund |
Cost in Dollars of a $1,000 Investment in MainStay Epoch Global Equity Yield Fund (Unaudited)
The example below is intended to describe the fees and expenses borne by shareholders during the six-month period from May 1, 2023 to October 31, 2023, and the impact of those costs on your investment.
Example
As a shareholder of the Fund you incur two types of costs: (1) transaction costs, including exchange fees and sales charges (loads) on purchases (as applicable), and (2) ongoing costs, including management fees, distribution and/or service (12b-1) fees and other Fund expenses (as applicable). This example is intended to help you understand your ongoing costs (in dollars) of investing in the Fund and to compare these costs with the ongoing costs of investing in other mutual funds. The example is based on an investment of $1,000 made at the beginning of the six-month period and held for the entire period from May 1, 2023 to October 31, 2023.
This example illustrates your Fund’s ongoing costs in two ways:
Actual Expenses
The second and third data columns in the table below provide information about actual account values and actual expenses. You may use the information in these columns, together with the amount you invested, to estimate the expenses that you paid during the six months ended October 31, 2023. Simply divide your account value by $1,000 (for example, an
$8,600 account value divided by $1,000 = 8.6), then multiply the result by the number under the heading entitled “Expenses Paid During Period” to estimate the expenses you paid on your account during this period.
Hypothetical Example for Comparison Purposes
The fourth and fifth data columns in the table below provide information about hypothetical account values and hypothetical expenses based on the Fund’s actual expense ratio and an assumed rate of return of 5% per year before expenses, which is not the Fund’s actual return. The hypothetical account values and expenses may not be used to estimate the actual ending account balances or expenses you paid for the six-month period shown. You may use this information to compare the ongoing costs of investing in the Fund with the ongoing costs of investing in other mutual funds. To do so, compare this 5% hypothetical example with the 5% hypothetical examples that appear in the shareholder reports of the other mutual funds.
Please note that the expenses shown in the table are meant to highlight your ongoing costs only and do not reflect any transactional costs, such as exchange fees or sales charges (loads). Therefore, the fourth and fifth data columns of the table are useful in comparing ongoing costs only and will not help you determine the relative total costs of owning different funds. In addition, if these transactional costs were included, your costs would have been higher.
| Share Class | Beginning
Account
Value
5/1/23 | Ending Account
Value (Based
on Actual
Returns and
Expenses)
10/31/23 | Expenses
Paid
During
Period1 | Ending Account
Value (Based
on Hypothetical
5% Annualized
Return and
Actual Expenses)
10/31/23 | Expenses
Paid
During
Period1 | Net Expense
Ratio
During
Period2 |
| Class A Shares | $1,000.00 | $955.60 | $5.37 | $1,019.71 | $5.55 | 1.09% |
| Investor Class Shares | $1,000.00 | $955.00 | $5.81 | $1,019.26 | $6.01 | 1.18% |
| Class C Shares | $1,000.00 | $951.80 | $9.05 | $1,015.93 | $9.35 | 1.84% |
| Class I Shares | $1,000.00 | $957.20 | $4.14 | $1,020.97 | $4.28 | 0.84% |
| Class R2 Shares | $1,000.00 | $954.80 | $6.01 | $1,019.05 | $6.21 | 1.22% |
| Class R3 Shares | $1,000.00 | $953.90 | $7.24 | $1,017.79 | $7.48 | 1.47% |
| Class R6 Shares | $1,000.00 | $957.10 | $3.65 | $1,021.47 | $3.77 | 0.74% |
| 1. | Expenses are equal to the Fund’s annualized expense ratio of each class multiplied by the average account value over the period, divided by 365 and multiplied by 184 (to reflect the six-month period). The table above represents the actual expenses incurred during the six-month period. In addition to the fees and expenses which the Fund bears directly, it also indirectly bears a pro rata share of the fees and expenses of the underlying funds in which it invests. Such indirect expenses are not included in the above-reported expense figures. |
| 2. | Expenses are equal to the Fund's annualized expense ratio to reflect the six-month period. |
Country Composition as of October 31, 2023 (Unaudited)
| United States | 70.2% |
| United Kingdom | 6.5 |
| Canada | 5.2 |
| Germany | 5.2 |
| France | 4.4 |
| Republic of Korea | 2.3 |
| Japan | 2.0 |
| Switzerland | 1.5 |
| Taiwan | 1.2% |
| Norway | 0.6 |
| Italy | 0.6 |
| Austria | 0.5 |
| Other Assets, Less Liabilities | –0.2 |
| | 100.0% |
See Portfolio of Investments beginning on page 11 for specific holdings within these categories. The Fund's holdings are subject to change.
Top Ten Holdings and/or Issuers Held as of October 31, 2023 (excluding short-term investments) (Unaudited)
| 1. | Microsoft Corp. |
| 2. | Broadcom, Inc. |
| 3. | Analog Devices, Inc. |
| 4. | International Business Machines Corp. |
| 5. | Cisco Systems, Inc. |
| 6. | Apple, Inc. |
| 7. | Coca-Cola Europacific Partners plc |
| 8. | TotalEnergies SE |
| 9. | Walmart, Inc. |
| 10. | KLA Corp. |
| 8 | MainStay Epoch Global Equity Yield Fund |
Portfolio Management Discussion and Analysis (Unaudited)
Questions answered by portfolio managers Michael A. Welhoelter, CFA, William W. Priest,1 CFA, Kera Van Valen, CFA, and John Tobin, PhD, CFA, of Epoch Investment Partners, Inc., the Fund’s Subadvisor.
How did MainStay Epoch Global Equity Yield Fund perform relative to its benchmarks and peer group during the 12 months ended October 31, 2023?
For the 12 months ended October 31, 2023, Class I shares of MainStay Epoch Global Equity Yield Fund returned 5.73%, underperforming the 10.48% return of the Fund’s primary benchmark, the MSCI World Index (Net). Over the same period, Class I shares outperformed the 4.05% return of the Global Equity Yield Composite Index, which is the Fund’s secondary benchmark, and underperformed the 8.57% return of the Morningstar Global Large Stock Value Category Average.2
What factors affected the Fund’s relative performance during the reporting period?
The reporting period saw sentiment swing several times as investors grappled with the trajectory of interest rates and global growth. While risk appetites trended downward through the end of 2022, the first quarter of 2023 saw a stark reversal in sentiment, as broad market indices rose sharply in response to hopes of a soft-landing and disinflation traction. Most of the reporting period saw a sustained rally in equities, fueled by gains in a handful of mega-cap tech stocks dubbed, "The Magnificent 7,” riding a wave of enthusiasm for advances in artificial intelligence (“AI”). However, the third quarter saw sentiment reverse due to persisting macro headwinds.
Most of the Fund’s underperformance relative to the MSCI World Index (Net) occurred in the first half of 2023, largely due to the above-mentioned run in mega-cap tech stocks, many of which were outside of the Fund’s investable universe, as they do not pay a dividend. From a factor perspective, exposure to dividend yield and low beta3 were headwinds to relative return.
During the reporting period, which sectors and/or countries were the strongest positive contributors to the Fund’s relative performance and which sectors and/or countries were particularly weak?
During the reporting period, the sectors that detracted most significantly from the Fund’s relative performance included financials and communications services. Banks were responsible for the underperformance in financials, due to the Fund’s exposure to regional U.S. bank holdings during the banking turmoil that occurred in the first quarter of 2023. Underperformance in communication services resulted from the Fund’s lack of exposure to two mega-cap interactive media and services companies with outsized returns.
On the positive side, energy and health care provided the strongest contributions to the Fund’s relative returns, based on stock selection in both sectors. (Contributions take weightings and total returns into account.) By country, positions in the United States and U.K. detracted most, whereas positions in France and Germany bolstered relative returns.
During the reporting period, which individual stocks made the strongest positive contributions to the Fund’s absolute performance and which stocks detracted the most?
Top contributors to the Fund’s absolute performance during the reporting period included U.S.-based semiconductor company Broadcom and France-based global energy company TotalEnergies.
Broadcom designs and manufactures digital and analog semiconductors focused on connectivity. It also develops and maintains software for mainframe applications. Shares outperformed on solid earnings and excitement around the company’s networking products, which help in the process of generative AI. Broadcom’s AI-focused sales doubled compared to a year ago, supporting improved medium-term forward growth guidance. The company returns cash to shareholders via an attractive dividend, with a target of paying out 50% of free cash flow. The balance of cash generation is used to fund debt reduction, share repurchases and/or accretive mergers and acquisitions.
TotalEnergies explores and produces oil & gas, refines petroleum products, manufactures petrochemicals and operates gas stations. The company is also growing its presence in generating electricity from renewable sources. Shares outperformed despite falling oil & gas prices as the company paid a special dividend in December 2022, announced new projects and partnerships that helped offset Russian impairments, and benefited from elevated refining margins. Management remains focused on driving cash flow growth from liquified natural gas (LNG) and integrated power, which includes renewables. TotalEnergies' global scale, strong balance sheet, integrated business model, capital flexibility and cost discipline allow it to pay a sustainable dividend through commodity price cycles, and reward shareholders with buybacks using excess free cash flow.
Among the most significant detractors from the Fund’s absolute performance during the same period were U.S.-based regional bank Columbia Banking System and Canada-based crop nutrient producer and distributor Nutrien.
Columbia Banking System operates in Washington, Oregon, and Northern California. The company’s local low-cost deposit franchise, diversified loan portfolio and well-capitalized balance sheet generally position it to earn mid-teens returns on equity on a mid-cycle basis. Shares declined, along with banking industry peers, as the failures of Silicon Valley Bank and Signature Bank in March 2023 caused a crisis of confidence that reverberated through the entire sector during the remainder of the reporting period. Although the crisis may result in higher near-term funding costs and increased retained capital levels for the industry, we believe Columbia's low-cost deposit franchise, coupled with expense synergies from its recent merger with Umpqua Holdings,
| 1. | Effective on or about March 31, 2024, William W. Priest will no longer serve as a portfolio manager for the Fund. |
| 2. | See "Investment and Performance Comparison" for other share class returns, which may be higher or lower than Class I share returns, and for more information on benchmark and peer group returns. |
| 3. | Beta is a measure of volatility in relation to the market as a whole. A beta higher than 1 indicates that a security or portfolio will tend to exhibit higher volatility than the market. A beta lower than 1 indicates that a security or portfolio will tend to exhibit lower volatility than the market. |
should generate continued strong earnings power and support attractive, growing dividends. We also expect the company to direct excess capital toward share buybacks during periods of normal economic conditions.
A major producer of crop nutrients, including potash, nitrogen, and phosphate, Nutrien also operates an extensive retail network for the distribution of nutrients to growers in the United States, Canada, Australia and Brazil, while providing an expanding suite of value-enhancing services. Shares underperformed after the company reported weaker-than-expected quarterly results, and subsequently lowered its full-year guidance, mainly due to falling potash and ammonia prices. Fundamentals remain solid for the agriculture industry, as crop prices are expected to remain elevated, incentivizing farmers to spend on crop nutrients such as potash to maximize yield. The company has a transparent shareholder distribution policy that includes an attractive and growing dividend, along with regular share repurchases.
What were some of the Fund’s largest purchases and sales during the reporting period?
New positions initiated during the reporting period included digital services and hardware provider Dell Technologies and midstream energy firm The Williams Companies, both based in the United States.
Dell serves the infrastructure marketplace by providing servers and data storage, as well as the consumer and commercial space with personal computing hardware and peripherals. Growth is driven by increasing data storage, processing and computing needs, and by share capture through attractive technology and pricing. The company targets a return of 40-60% cash generation back to shareholders, which is done through a combination of a growing dividend and periodic share repurchases. Additional cash generation is directed to slight debt reduction and tuck-in mergers and acquisitions to broaden its addressable market.
Williams provides natural gas gathering, processing, transportation and storage services, natural gas liquid (NGL) fractionation, transportation and storage, and marketing services to customers in North America. The company generates stable and strong cash flow from mostly fee-based contracts. Cash flow growth is driven by a pipeline of attractive new projects and could be boosted by bolt-on acquisitions. Williams rewards its shareholders with an attractive and growing dividend.
The Fund’s most significant sales during the same period included closing its entire positions in regional bank KeyCorp and engineering and manufacturing firm Hubbell, both based in the United States.
KeyCorp operates branches in 15 states in the Northeast, Midwest and Northwest United States. Although the company has a valuable, low-cost deposit franchise, we believe the slower repricing of KeyCorp’s securities portfolio relative to peers limits the near-term ability for earnings to inflect higher with interest rates. As higher capital standards for the industry are expected to
be imposed by regulators, we anticipate that KeyCorp will need to build equity by retaining a greater proportion of earnings, holding dividends flat, and deferring share repurchases for several years. We exited the Fund’s position in order to reallocate funds toward other companies in the sector that offer stronger potential for capital returns over the medium term.
Hubbell provides highly engineered utility solutions and electrical products for a broad range of applications, enabling utility, as well as commercial and industrial customers to operate critical infrastructure safely, reliably, and efficiently. The company has continued to generate robust cash flow in recent periods. However, we believe share price appreciation has constrained the company's shareholder yield potential. We exited the Fund’s position to reallocate capital toward more attractive investment opportunities.
How did the Fund’s sector and country weightings change during the reporting period?
During the reporting period, the Fund’s most significant sector allocation changes included decreases in financials and energy, and increases in information technology and industrials. The Fund's most significant country allocation changes during the reporting period were increases in South Korea and France, and reductions in Canada and Denmark. The Fund’s sector and country allocations are a result of our bottom-up, fundamental investment process, and reflect the companies and securities that we confidently believe can collect and distribute sustainable, growing shareholder yield.
How was the Fund positioned at the end of the reporting period?
As of October 31, 2023, the Fund’s largest sector positions on an absolute basis included information technology, health care and industrials, while the smallest sector positions were real estate, energy and materials. Compared to the MSCI World Index (Net), the Fund’s most overweight sector allocation was to utilities, a defensive sector that is typically well-represented in the Fund. The Fund’s most significantly underweight allocations were to the information technology and consumer discretionary sectors.
The opinions expressed are those of the portfolio managers as of the date of this report and are subject to change. There is no guarantee that any forecasts will come to pass. This material does not constitute investment advice and is not intended as an endorsement of any specific investment.
| 10 | MainStay Epoch Global Equity Yield Fund |
Portfolio of Investments October 31, 2023†^
| | Shares | Value |
| Common Stocks 99.1% |
| Austria 0.5% |
| BAWAG Group AG (Banks) (a) | 85,929 | $ 3,813,247 |
| Canada 5.2% |
| BCE, Inc. (Diversified Telecommunication Services) | 108,439 | 4,025,556 |
| Manulife Financial Corp. (Insurance) | 341,759 | 5,949,207 |
| Nutrien Ltd. (Chemicals) | 87,543 | 4,701,059 |
| Restaurant Brands International, Inc. (Hotels, Restaurants & Leisure) (b) | 160,984 | 10,818,125 |
| Rogers Communications, Inc., Class B (Wireless Telecommunication Services) | 105,700 | 3,916,255 |
| Royal Bank of Canada (Banks) | 43,726 | 3,492,404 |
| TELUS Corp. (Diversified Telecommunication Services) | 237,290 | 3,826,071 |
| | | 36,728,677 |
| France 4.4% |
| AXA SA (Insurance) | 180,031 | 5,325,170 |
| Cie Generale des Etablissements Michelin SCA (Automobile Components) | 134,291 | 3,981,455 |
| Orange SA (Diversified Telecommunication Services) | 477,674 | 5,615,292 |
| TotalEnergies SE (Oil, Gas & Consumable Fuels) | 181,272 | 12,122,007 |
| Vinci SA (Construction & Engineering) | 37,355 | 4,129,606 |
| | | 31,173,530 |
| Germany 5.2% |
| Allianz SE (Registered) (Insurance) | 18,512 | 4,326,889 |
| Bayer AG (Registered) (Pharmaceuticals) | 81,320 | 3,498,577 |
| Deutsche Post AG (Air Freight & Logistics) | 179,341 | 6,975,604 |
| Deutsche Telekom AG (Registered) (Diversified Telecommunication Services) | 500,337 | 10,839,600 |
| Muenchener Rueckversicherungs-Gesellschaft AG (Registered) (Insurance) | 12,699 | 5,085,833 |
| Siemens AG (Registered) (Industrial Conglomerates) | 44,458 | 5,878,245 |
| | | 36,604,748 |
| Italy 0.6% |
| Snam SpA (Gas Utilities) | 840,086 | 3,848,915 |
| Japan 2.0% |
| Astellas Pharma, Inc. (Pharmaceuticals) | 431,900 | 5,413,887 |
| NET One Systems Co. Ltd. (IT Services) | 245,800 | 3,723,284 |
| | Shares | Value |
| |
| Japan (continued) |
| Toyota Motor Corp. (Automobiles) | 296,600 | $ 5,068,079 |
| | | 14,205,250 |
| Norway 0.6% |
| Orkla ASA (Food Products) | 622,699 | 4,288,844 |
| Republic of Korea 2.3% |
| Hyundai Glovis Co. Ltd. (Air Freight & Logistics) | 34,938 | 4,426,265 |
| Samsung Electronics Co. Ltd., GDR (Technology Hardware, Storage & Peripherals) | 5,973 | 7,442,358 |
| SK Telecom Co. Ltd. (Wireless Telecommunication Services) | 125,433 | 4,564,830 |
| | | 16,433,453 |
| Switzerland 1.5% |
| Novartis AG (Registered) (Pharmaceuticals) | 109,966 | 10,219,893 |
| Taiwan 1.2% |
| Taiwan Semiconductor Manufacturing Co. Ltd., Sponsored ADR (Semiconductors & Semiconductor Equipment) | 99,858 | 8,618,744 |
| United Kingdom 6.5% |
| AstraZeneca plc, Sponsored ADR (Pharmaceuticals) | 176,023 | 11,129,934 |
| BAE Systems plc (Aerospace & Defense) | 516,647 | 6,932,663 |
| British American Tobacco plc (Tobacco) | 127,899 | 3,814,862 |
| Coca-Cola Europacific Partners plc (Beverages) | 214,730 | 12,563,852 |
| Imperial Brands plc (Tobacco) | 180,747 | 3,846,753 |
| Schroders plc (Capital Markets) | 802,610 | 3,602,641 |
| Unilever plc (Personal Care Products) | 80,073 | 3,784,959 |
| | | 45,675,664 |
| United States 69.1% |
| AbbVie, Inc. (Biotechnology) | 66,999 | 9,458,919 |
| Air Products and Chemicals, Inc. (Chemicals) | 17,751 | 5,013,592 |
| American Electric Power Co., Inc. (Electric Utilities) | 100,619 | 7,600,759 |
| Analog Devices, Inc. (Semiconductors & Semiconductor Equipment) | 89,121 | 14,021,407 |
| Apple, Inc. (Technology Hardware, Storage & Peripherals) | 76,783 | 13,112,233 |
| Bank of America Corp. (Banks) | 250,105 | 6,587,766 |
| Best Buy Co., Inc. (Specialty Retail) | 58,134 | 3,884,514 |
The notes to the financial statements are an integral part of, and should be read in conjunction with, the financial statements.
11
Portfolio of Investments October 31, 2023†^ (continued)
| | Shares | Value |
| Common Stocks (continued) |
| United States (continued) |
| BlackRock, Inc. (Capital Markets) | 6,047 | $ 3,702,457 |
| Bristol-Myers Squibb Co. (Pharmaceuticals) | 62,738 | 3,232,889 |
| Broadcom, Inc. (Semiconductors & Semiconductor Equipment) | 19,605 | 16,495,059 |
| Chevron Corp. (Oil, Gas & Consumable Fuels) | 30,388 | 4,428,443 |
| Cisco Systems, Inc. (Communications Equipment) | 261,578 | 13,636,061 |
| Coca-Cola Co. (The) (Beverages) | 96,013 | 5,423,774 |
| Columbia Banking System, Inc. (Banks) | 202,764 | 3,988,368 |
| Comcast Corp., Class A (Media) | 157,243 | 6,492,563 |
| Cummins, Inc. (Machinery) | 35,600 | 7,700,280 |
| CVS Health Corp. (Health Care Providers & Services) | 58,869 | 4,062,550 |
| Dell Technologies, Inc., Class C (Technology Hardware, Storage & Peripherals) | 83,554 | 5,590,598 |
| Dow, Inc. (Chemicals) | 98,343 | 4,753,901 |
| Duke Energy Corp. (Electric Utilities) | 44,367 | 3,943,783 |
| Eaton Corp. plc (Electrical Equipment) | 35,474 | 7,375,399 |
| Eli Lilly & Co. (Pharmaceuticals) | 18,688 | 10,351,844 |
| Emerson Electric Co. (Electrical Equipment) | 77,796 | 6,921,510 |
| Entergy Corp. (Electric Utilities) | 44,620 | 4,265,226 |
| Enterprise Products Partners LP (Oil, Gas & Consumable Fuels) | 143,278 | 3,730,959 |
| Evergy, Inc. (Electric Utilities) | 79,023 | 3,883,190 |
| Garmin Ltd. (Household Durables) | 37,771 | 3,872,661 |
| General Dynamics Corp. (Aerospace & Defense) | 19,012 | 4,587,786 |
| GSK plc (Pharmaceuticals) | 221,177 | 3,917,922 |
| Hasbro, Inc. (Leisure Products) | 88,141 | 3,979,566 |
| Home Depot, Inc. (The) (Specialty Retail) | 17,751 | 5,053,532 |
| Honeywell International, Inc. (Industrial Conglomerates) | 20,608 | 3,776,622 |
| International Business Machines Corp. (IT Services) | 96,330 | 13,933,171 |
| Iron Mountain, Inc. (Specialized REITs) | 162,035 | 9,571,407 |
| Johnson & Johnson (Pharmaceuticals) | 33,571 | 4,979,922 |
| JPMorgan Chase & Co. (Banks) | 71,103 | 9,887,583 |
| KLA Corp. (Semiconductors & Semiconductor Equipment) | 24,051 | 11,296,755 |
| Lazard Ltd., Class A (Capital Markets) | 146,135 | 4,058,169 |
| Linde plc (Chemicals) | 25,718 | 9,828,391 |
| Lockheed Martin Corp. (Aerospace & Defense) | 12,629 | 5,741,649 |
| | Shares | Value |
| |
| United States (continued) |
| LyondellBasell Industries NV, Class A (Chemicals) | 60,095 | $ 5,422,973 |
| McDonald's Corp. (Hotels, Restaurants & Leisure) | 21,110 | 5,534,409 |
| Medtronic plc (Health Care Equipment & Supplies) | 97,387 | 6,871,627 |
| Merck & Co., Inc. (Pharmaceuticals) | 72,515 | 7,447,290 |
| MetLife, Inc. (Insurance) | 132,368 | 7,943,404 |
| Microsoft Corp. (Software) | 50,075 | 16,930,857 |
| MPLX LP (Oil, Gas & Consumable Fuels) | 106,071 | 3,822,799 |
| MSC Industrial Direct Co., Inc., Class A (Trading Companies & Distributors) | 99,005 | 9,380,724 |
| Nestle SA (Registered) (Food Products) | 46,347 | 4,996,193 |
| NetApp, Inc. (Technology Hardware, Storage & Peripherals) | 76,599 | 5,574,875 |
| NextEra Energy, Inc. (Electric Utilities) | 114,108 | 6,652,496 |
| NiSource, Inc. (Multi-Utilities) | 153,434 | 3,860,399 |
| Omnicom Group, Inc. (Media) | 53,409 | 4,000,868 |
| Paychex, Inc. (Professional Services) | 42,854 | 4,758,937 |
| PepsiCo, Inc. (Beverages) | 33,425 | 5,457,634 |
| Pfizer, Inc. (Pharmaceuticals) | 132,114 | 4,037,404 |
| Philip Morris International, Inc. (Tobacco) | 100,731 | 8,981,176 |
| Pinnacle West Capital Corp. (Electric Utilities) | 50,131 | 3,718,718 |
| PNC Financial Services Group, Inc. (The) (Banks) | 32,316 | 3,699,212 |
| Realty Income Corp. (Retail REITs) | 88,721 | 4,203,601 |
| Regions Financial Corp. (Banks) | 226,773 | 3,295,012 |
| Roche Holding AG (Pharmaceuticals) | 14,398 | 3,701,393 |
| RTX Corp. (Aerospace & Defense) | 70,693 | 5,753,703 |
| Sanofi SA (Pharmaceuticals) | 105,639 | 9,579,257 |
| Texas Instruments, Inc. (Semiconductors & Semiconductor Equipment) | 47,975 | 6,812,930 |
| Travelers Cos., Inc. (The) (Insurance) | 21,775 | 3,646,006 |
| Truist Financial Corp. (Banks) | 128,315 | 3,639,013 |
| U.S. Bancorp (Banks) | 120,945 | 3,855,727 |
| United Parcel Service, Inc., Class B (Air Freight & Logistics) | 23,691 | 3,346,354 |
| UnitedHealth Group, Inc. (Health Care Providers & Services) | 20,669 | 11,069,490 |
| Vail Resorts, Inc. (Hotels, Restaurants & Leisure) | 30,999 | 6,579,538 |
| Verizon Communications, Inc. (Diversified Telecommunication Services) | 111,121 | 3,903,681 |
| VICI Properties, Inc. (Specialized REITs) | 151,822 | 4,235,834 |
| Walmart, Inc. (Consumer Staples Distribution & Retail) | 69,827 | 11,410,430 |
| WEC Energy Group, Inc. (Multi-Utilities) | 47,998 | 3,906,557 |
The notes to the financial statements are an integral part of, and should be read in conjunction with, the financial statements.
| 12 | MainStay Epoch Global Equity Yield Fund |
| | Shares | | Value |
| Common Stocks (continued) |
| United States (continued) |
| Williams Cos., Inc. (The) (Oil, Gas & Consumable Fuels) | 118,176 | | $ 4,065,254 |
| | | | 486,238,955 |
Total Common Stocks
(Cost $573,705,102) | | | 697,849,920 |
| Short-Term Investments 1.1% |
| Affiliated Investment Company 0.6% |
| United States 0.6% |
| MainStay U.S. Government Liquidity Fund, 5.275% (c) | 3,959,709 | | 3,959,709 |
| Unaffiliated Investment Company 0.5% |
| United States 0.5% |
| Invesco Government & Agency Portfolio, 5.357% (c)(d) | 3,516,225 | | 3,516,225 |
Total Short-Term Investments
(Cost $7,475,934) | | | 7,475,934 |
Total Investments
(Cost $581,181,036) | 100.2% | | 705,325,854 |
| Other Assets, Less Liabilities | (0.2) | | (1,466,493) |
| Net Assets | 100.0% | | $ 703,859,361 |
| † | Percentages indicated are based on Fund net assets. |
| ^ | Industry and country classifications may be different than those used for compliance monitoring purposes. |
| (a) | May be sold to institutional investors only under Rule 144A or securities offered pursuant to Section 4(a)(2) of the Securities Act of 1933, as amended. |
| (b) | All or a portion of this security was held on loan. As of October 31, 2023, the aggregate market value of securities on loan was $3,447,198. The Fund received cash collateral with a value of $3,516,225. (See Note 2(I)) |
| (c) | Current yield as of October 31, 2023. |
| (d) | Represents a security purchased with cash collateral received for securities on loan. |
The notes to the financial statements are an integral part of, and should be read in conjunction with, the financial statements.
13
Portfolio of Investments October 31, 2023†^ (continued)
Investments in Affiliates (in 000's)
Investments in issuers considered to be affiliate(s) of the Fund during the year ended October 31, 2023 for purposes of Section 2(a)(3) of the Investment Company Act of 1940, as amended, were as follows:
| Affiliated Investment Companies | Value,
Beginning
of Year | Purchases
at Cost | Proceeds
from
Sales | Net
Realized
Gain/(Loss)
on Sales | Change in
Unrealized
Appreciation/
(Depreciation) | Value,
End of
Year | Dividend
Income | Other
Distributions | Shares
End of
Year |
| MainStay U.S. Government Liquidity Fund | $ 18,620 | $ 211,528 | $ (226,188) | $ — | $ — | $ 3,960 | $ 347 | $ — | 3,960 |
| Abbreviation(s): |
| ADR—American Depositary Receipt |
| GDR—Global Depositary Receipt |
| REIT—Real Estate Investment Trust |
The following is a summary of the fair valuations according to the inputs used as of October 31, 2023, for valuing the Fund’s assets:
| Description | Quoted
Prices in
Active
Markets for
Identical
Assets
(Level 1) | | Significant
Other
Observable
Inputs
(Level 2) | | Significant
Unobservable
Inputs
(Level 3) | | Total |
| Asset Valuation Inputs | | | | | | | |
| Investments in Securities (a) | | | | | | | |
| Common Stocks | $ 697,849,920 | | $ — | | $ — | | $ 697,849,920 |
| Short-Term Investments | | | | | | | |
| Affiliated Investment Company | 3,959,709 | | — | | — | | 3,959,709 |
| Unaffiliated Investment Company | 3,516,225 | | — | | — | | 3,516,225 |
| Total Short-Term Investments | 7,475,934 | | — | | — | | 7,475,934 |
| Total Investments in Securities | $ 705,325,854 | | $ — | | $ — | | $ 705,325,854 |
| (a) | For a complete listing of investments and their industries, see the Portfolio of Investments. |
The notes to the financial statements are an integral part of, and should be read in conjunction with, the financial statements.
| 14 | MainStay Epoch Global Equity Yield Fund |
The table below sets forth the diversification of the Fund’s investments by industry.
Industry Diversification
| | Value | | Percent †^ |
| Aerospace & Defense | $ 23,015,801 | | 3.3% |
| Air Freight & Logistics | 14,748,223 | | 2.1 |
| Automobile Components | 3,981,455 | | 0.6 |
| Automobiles | 5,068,079 | | 0.7 |
| Banks | 42,258,332 | | 6.0 |
| Beverages | 23,445,260 | | 3.3 |
| Biotechnology | 9,458,919 | | 1.3 |
| Capital Markets | 11,363,267 | | 1.6 |
| Chemicals | 29,719,916 | | 4.2 |
| Communications Equipment | 13,636,061 | | 1.9 |
| Construction & Engineering | 4,129,606 | | 0.6 |
| Consumer Staples Distribution & Retail | 11,410,430 | | 1.6 |
| Diversified Telecommunication Services | 28,210,200 | | 4.0 |
| Electric Utilities | 30,064,172 | | 4.3 |
| Electrical Equipment | 14,296,909 | | 2.0 |
| Food Products | 9,285,037 | | 1.3 |
| Gas Utilities | 3,848,915 | | 0.5 |
| Health Care Equipment & Supplies | 6,871,627 | | 1.0 |
| Health Care Providers & Services | 15,132,040 | | 2.1 |
| Hotels, Restaurants & Leisure | 22,932,072 | | 3.3 |
| Household Durables | 3,872,661 | | 0.6 |
| Industrial Conglomerates | 9,654,867 | | 1.4 |
| Insurance | 32,276,509 | | 4.6 |
| IT Services | 17,656,455 | | 2.5 |
| Leisure Products | 3,979,566 | | 0.6 |
| Machinery | 7,700,280 | | 1.1 |
| Media | 10,493,431 | | 1.5 |
| Multi-Utilities | 7,766,956 | | 1.1 |
| Oil, Gas & Consumable Fuels | 28,169,462 | | 4.0 |
| Personal Care Products | 3,784,959 | | 0.5 |
| Pharmaceuticals | 77,510,212 | | 11.0 |
| Professional Services | 4,758,937 | | 0.7 |
| Retail REITs | 4,203,601 | | 0.6 |
| Semiconductors & Semiconductor Equipment | 57,244,895 | | 8.1 |
| Software | 16,930,857 | | 2.4 |
| Specialized REITs | 13,807,241 | | 2.0 |
| Specialty Retail | 8,938,046 | | 1.3 |
| Technology Hardware, Storage & Peripherals | 31,720,064 | | 4.5 |
| Tobacco | 16,642,791 | | 2.4 |
| Trading Companies & Distributors | 9,380,724 | | 1.3 |
| Wireless Telecommunication Services | 8,481,085 | | 1.2 |
| | 697,849,920 | | 99.1 |
| | Value | | Percent †^ |
| Short-Term Investments | $ 7,475,934 | | 1.1% |
| Other Assets, Less Liabilities | (1,466,493) | | (0.2) |
| Net Assets | $703,859,361 | | 100.0% |
| † | Percentages indicated are based on Fund net assets. |
| ^ | Industry and country classifications may be different than those used for compliance monitoring purposes. |
The notes to the financial statements are an integral part of, and should be read in conjunction with, the financial statements.
15
Statement of Assets and Liabilities as of October 31, 2023
| Assets |
Investment in unaffiliated securities, at value
(identified cost $577,221,327) including securities on loan of $3,447,198 | $701,366,145 |
Investment in affiliated investment companies, at value
(identified cost $3,959,709) | 3,959,709 |
Cash denominated in foreign currencies
(identified cost $1,406,182) | 1,408,404 |
| Receivables: | |
| Dividends | 3,755,519 |
| Fund shares sold | 368,762 |
| Securities lending | 923 |
| Other assets | 67,225 |
| Total assets | 710,926,687 |
| Liabilities |
| Cash collateral received for securities on loan | 3,516,225 |
| Due to custodian | 8,859 |
| Payables: | |
| Fund shares redeemed | 2,725,902 |
| Manager (See Note 3) | 470,132 |
| Transfer agent (See Note 3) | 212,281 |
| Shareholder communication | 53,795 |
| NYLIFE Distributors (See Note 3) | 34,724 |
| Custodian | 22,538 |
| Professional fees | 21,854 |
| Trustees | 142 |
| Accrued expenses | 874 |
| Total liabilities | 7,067,326 |
| Net assets | $703,859,361 |
| Composition of Net Assets |
| Shares of beneficial interest outstanding (par value of $.001 per share) unlimited number of shares authorized | $ 37,614 |
| Additional paid-in-capital | 613,675,036 |
| | 613,712,650 |
| Total distributable earnings (loss) | 90,146,711 |
| Net assets | $703,859,361 |
| Class A | |
| Net assets applicable to outstanding shares | $111,149,238 |
| Shares of beneficial interest outstanding | 5,926,578 |
| Net asset value per share outstanding | $ 18.75 |
| Maximum sales charge (5.50% of offering price) | 1.09 |
| Maximum offering price per share outstanding | $ 19.84 |
| Investor Class | |
| Net assets applicable to outstanding shares | $ 7,787,548 |
| Shares of beneficial interest outstanding | 416,194 |
| Net asset value per share outstanding | $ 18.71 |
| Maximum sales charge (5.00% of offering price) | 0.98 |
| Maximum offering price per share outstanding | $ 19.69 |
| Class C | |
| Net assets applicable to outstanding shares | $ 9,215,468 |
| Shares of beneficial interest outstanding | 493,514 |
| Net asset value and offering price per share outstanding | $ 18.67 |
| Class I | |
| Net assets applicable to outstanding shares | $573,786,172 |
| Shares of beneficial interest outstanding | 30,674,776 |
| Net asset value and offering price per share outstanding | $ 18.71 |
| Class R2 | |
| Net assets applicable to outstanding shares | $ 205,609 |
| Shares of beneficial interest outstanding | 10,951 |
| Net asset value and offering price per share outstanding(a) | $ 18.77 |
| Class R3 | |
| Net assets applicable to outstanding shares | $ 720,601 |
| Shares of beneficial interest outstanding | 38,449 |
| Net asset value and offering price per share outstanding | $ 18.74 |
| Class R6 | |
| Net assets applicable to outstanding shares | $ 994,725 |
| Shares of beneficial interest outstanding | 53,901 |
| Net asset value and offering price per share outstanding | $ 18.45 |
| (a) | The difference between the calculated and stated NAV was caused by rounding. |
The notes to the financial statements are an integral part of, and should be read in conjunction with, the financial statements.
| 16 | MainStay Epoch Global Equity Yield Fund |
Statement of Operations for the year ended October 31, 2023
| Investment Income (Loss) |
| Income | |
| Dividends-unaffiliated (net of foreign tax withholding of $1,435,284) | $30,793,563 |
| Dividends-affiliated | 346,836 |
| Securities lending, net | 87,634 |
| Total income | 31,228,033 |
| Expenses | |
| Manager (See Note 3) | 6,351,357 |
| Transfer agent (See Note 3) | 1,492,406 |
| Distribution/Service—Class A (See Note 3) | 305,097 |
| Distribution/Service—Investor Class (See Note 3) | 21,454 |
| Distribution/Service—Class C (See Note 3) | 132,722 |
| Distribution/Service—Class R2 (See Note 3) | 570 |
| Distribution/Service—Class R3 (See Note 3) | 3,515 |
| Professional fees | 160,662 |
| Registration | 118,497 |
| Custodian | 65,703 |
| Interest expense | 52,765 |
| Trustees | 23,100 |
| Shareholder communication | 5,809 |
| Shareholder service (See Note 3) | 931 |
| Miscellaneous | 41,198 |
| Total expenses before waiver/reimbursement | 8,775,786 |
| Expense waiver/reimbursement from Manager (See Note 3) | (639,408) |
| Reimbursement from prior custodian(a) | (2,205) |
| Net expenses | 8,134,173 |
| Net investment income (loss) | 23,093,860 |
| Realized and Unrealized Gain (Loss) |
| Net realized gain (loss) on: | |
| Unaffiliated investment transactions | 27,124,256 |
| Foreign currency transactions | (86,645) |
| Net realized gain (loss) | 27,037,611 |
| Net change in unrealized appreciation (depreciation) on: | |
| Unaffiliated investments | 25,437,567 |
| Translation of other assets and liabilities in foreign currencies | 205,725 |
| Net change in unrealized appreciation (depreciation) | 25,643,292 |
| Net realized and unrealized gain (loss) | 52,680,903 |
| Net increase (decrease) in net assets resulting from operations | $75,774,763 |
| (a) | Represents a refund for overbilling of custody fees. |
The notes to the financial statements are an integral part of, and should be read in conjunction with, the financial statements.
17
Statements of Changes in Net Assets
for the years ended October 31, 2023 and October 31, 2022
| | 2023 | 2022 |
| Increase (Decrease) in Net Assets |
| Operations: | | |
| Net investment income (loss) | $ 23,093,860 | $ 25,786,976 |
| Net realized gain (loss) | 27,037,611 | 30,541,553 |
| Net change in unrealized appreciation (depreciation) | 25,643,292 | (138,936,348) |
| Net increase (decrease) in net assets resulting from operations | 75,774,763 | (82,607,819) |
| Distributions to shareholders: | | |
| Class A | (3,322,177) | (2,921,191) |
| Investor Class | (228,072) | (188,229) |
| Class C | (244,643) | (296,524) |
| Class I | (21,686,277) | (24,118,312) |
| Class R2 | (5,881) | (4,681) |
| Class R3 | (16,055) | (11,174) |
| Class R6 | (168,086) | (73,763) |
| Total distributions to shareholders | (25,671,191) | (27,613,874) |
| Capital share transactions: | | |
| Net proceeds from sales of shares | 110,349,315 | 199,939,434 |
| Net asset value of shares issued to shareholders in reinvestment of distributions | 22,237,098 | 24,854,003 |
| Cost of shares redeemed | (540,645,216) | (229,910,828) |
| Increase (decrease) in net assets derived from capital share transactions | (408,058,803) | (5,117,391) |
| Net increase (decrease) in net assets | (357,955,231) | (115,339,084) |
| Net Assets |
| Beginning of year | 1,061,814,592 | 1,177,153,676 |
| End of year | $ 703,859,361 | $1,061,814,592 |
The notes to the financial statements are an integral part of, and should be read in conjunction with, the financial statements.
| 18 | MainStay Epoch Global Equity Yield Fund |
Financial Highlights selected per share data and ratios
| | Year Ended October 31, |
| Class A | 2023 | | 2022 | | 2021 | | 2020 | | 2019 |
| Net asset value at beginning of year | $ 18.28 | | $ 20.18 | | $ 15.83 | | $ 18.75 | | $ 18.38 |
| Net investment income (loss) (a) | 0.46 | | 0.41 | | 0.45 | | 0.46 | | 0.57 |
| Net realized and unrealized gain (loss) | 0.55 | | (1.87) | | 4.43 | | (2.59) | | 1.42 |
| Total from investment operations | 1.01 | | (1.46) | | 4.88 | | (2.13) | | 1.99 |
| Less distributions: | | | | | | | | | |
| From net investment income | (0.54) | | (0.44) | | (0.53) | | (0.45) | | (0.59) |
| From net realized gain on investments | — | | — | | — | | (0.34) | | (1.03) |
| Total distributions | (0.54) | | (0.44) | | (0.53) | | (0.79) | | (1.62) |
| Net asset value at end of year | $ 18.75 | | $ 18.28 | | $ 20.18 | | $ 15.83 | | $ 18.75 |
| Total investment return (b) | 5.45% | | (7.36)% | | 30.98% | | (11.48)% | | 11.66% |
| Ratios (to average net assets)/Supplemental Data: | | | | | | | | | |
| Net investment income (loss) | 2.36% | | 2.08% | | 2.32% | | 2.74% | | 3.17% |
| Net expenses (c) | 1.09%(d) | | 1.09% | | 1.09%(e) | | 1.09%(e) | | 1.10%(e) |
| Expenses (before waiver/reimbursement) (c) | 1.16%(d) | | 1.16% | | 1.16%(e) | | 1.14%(e) | | 1.14%(e) |
| Portfolio turnover rate | 30% | | 50% | | 27% | | 40% | | 24% |
| Net assets at end of year (in 000’s) | $ 111,149 | | $ 120,648 | | $ 134,982 | | $ 103,166 | | $ 125,791 |
| (a) | Per share data based on average shares outstanding during the year. |
| (b) | Total investment return is calculated exclusive of sales charges and assumes the reinvestment of dividends and distributions. For periods of less than one year, total return is not annualized. |
| (c) | In addition to the fees and expenses which the Fund bears directly, it also indirectly bears a pro-rata share of the fees and expenses of the underlying funds in which it invests. Such indirect expenses are not included in the above expense ratios. |
| (d) | Net of interest expense of 0.01%. (See Note 6) |
| (e) | Net of interest expense of less than 0.01%. (See Note 6) |
| | Year Ended October 31, |
| Investor Class | 2023 | | 2022 | | 2021 | | 2020 | | 2019 |
| Net asset value at beginning of year | $ 18.24 | | $ 20.14 | | $ 15.80 | | $ 18.72 | | $ 18.35 |
| Net investment income (loss) (a) | 0.45 | | 0.39 | | 0.44 | | 0.46 | | 0.57 |
| Net realized and unrealized gain (loss) | 0.54 | | (1.86) | | 4.42 | | (2.59) | | 1.42 |
| Total from investment operations | 0.99 | | (1.47) | | 4.86 | | (2.13) | | 1.99 |
| Less distributions: | | | | | | | | | |
| From net investment income | (0.52) | | (0.43) | | (0.52) | | (0.45) | | (0.59) |
| From net realized gain on investments | — | | — | | — | | (0.34) | | (1.03) |
| Total distributions | (0.52) | | (0.43) | | (0.52) | | (0.79) | | (1.62) |
| Net asset value at end of year | $ 18.71 | | $ 18.24 | | $ 20.14 | | $ 15.80 | | $ 18.72 |
| Total investment return (b) | 5.39% | | (7.42)% | | 30.91% | | (11.53)% | | 11.67% |
| Ratios (to average net assets)/Supplemental Data: | | | | | | | | | |
| Net investment income (loss) | 2.28% | | 2.02% | | 2.29% | | 2.70% | | 3.15% |
| Net expenses (c) | 1.18%(d) | | 1.15% | | 1.15%(e) | | 1.13%(e) | | 1.11%(e) |
| Expenses (before waiver/reimbursement) (c) | 1.19%(d) | | 1.16% | | 1.16%(e) | | 1.13%(e) | | 1.11%(e) |
| Portfolio turnover rate | 30% | | 50% | | 27% | | 40% | | 24% |
| Net assets at end of year (in 000's) | $ 7,788 | | $ 7,976 | | $ 9,081 | | $ 7,897 | | $ 10,067 |
| (a) | Per share data based on average shares outstanding during the year. |
| (b) | Total investment return is calculated exclusive of sales charges and assumes the reinvestment of dividends and distributions. For periods of less than one year, total return is not annualized. |
| (c) | In addition to the fees and expenses which the Fund bears directly, it also indirectly bears a pro-rata share of the fees and expenses of the underlying funds in which it invests. Such indirect expenses are not included in the above expense ratios. |
| (d) | Net of interest expense of 0.01%. (See Note 6) |
| (e) | Net of interest expense of less than 0.01%. (See Note 6) |
The notes to the financial statements are an integral part of, and should be read in conjunction with, the financial statements.
19
Financial Highlights selected per share data and ratios
| | Year Ended October 31, |
| Class C | 2023 | | 2022 | | 2021 | | 2020 | | 2019 |
| Net asset value at beginning of year | $ 18.19 | | $ 20.07 | | $ 15.73 | | $ 18.62 | | $ 18.25 |
| Net investment income (loss) (a) | 0.32 | | 0.26 | | 0.30 | | 0.34 | | 0.44 |
| Net realized and unrealized gain (loss) | 0.53 | | (1.86) | | 4.40 | | (2.57) | | 1.41 |
| Total from investment operations | 0.85 | | (1.60) | | 4.70 | | (2.23) | | 1.85 |
| Less distributions: | | | | | | | | | |
| From net investment income | (0.37) | | (0.28) | | (0.36) | | (0.32) | | (0.45) |
| From net realized gain on investments | — | | — | | — | | (0.34) | | (1.03) |
| Total distributions | (0.37) | | (0.28) | | (0.36) | | (0.66) | | (1.48) |
| Net asset value at end of year | $ 18.67 | | $ 18.19 | | $ 20.07 | | $ 15.73 | | $ 18.62 |
| Total investment return (b) | 4.67% | | (8.07)% | | 30.00% | | (12.14)% | | 10.88% |
| Ratios (to average net assets)/Supplemental Data: | | | | | | | | | |
| Net investment income (loss) | 1.65% | | 1.34% | | 1.59% | | 2.00% | | 2.47% |
| Net expenses (c) | 1.84%(d) | | 1.84% | | 1.84%(e) | | 1.84%(e) | | 1.85%(e) |
| Expenses (before waiver/reimbursement) (c) | 1.94%(d) | | 1.91% | | 1.91%(e) | | 1.88%(e) | | 1.87%(e) |
| Portfolio turnover rate | 30% | | 50% | | 27% | | 40% | | 24% |
| Net assets at end of year (in 000’s) | $ 9,215 | | $ 15,801 | | $ 27,874 | | $ 42,298 | | $ 97,872 |
| (a) | Per share data based on average shares outstanding during the year. |
| (b) | Total investment return is calculated exclusive of sales charges and assumes the reinvestment of dividends and distributions. For periods of less than one year, total return is not annualized. |
| (c) | In addition to the fees and expenses which the Fund bears directly, it also indirectly bears a pro-rata share of the fees and expenses of the underlying funds in which it invests. Such indirect expenses are not included in the above expense ratios. |
| (d) | Net of interest expense of 0.01%. (See Note 6) |
| (e) | Net of interest expense of less than 0.01%. (See Note 6) |
| | Year Ended October 31, |
| Class I | 2023 | | 2022 | | 2021 | | 2020 | | 2019 |
| Net asset value at beginning of year | $ 18.23 | | $ 20.13 | | $ 15.79 | | $ 18.72 | | $ 18.34 |
| Net investment income (loss) (a) | 0.51 | | 0.45 | | 0.50 | | 0.50 | | 0.62 |
| Net realized and unrealized gain (loss) | 0.55 | | (1.86) | | 4.42 | | (2.59) | | 1.43 |
| Total from investment operations | 1.06 | | (1.41) | | 4.92 | | (2.09) | | 2.05 |
| Less distributions: | | | | | | | | | |
| From net investment income | (0.58) | | (0.49) | | (0.58) | | (0.50) | | (0.64) |
| From net realized gain on investments | — | | — | | — | | (0.34) | | (1.03) |
| Total distributions | (0.58) | | (0.49) | | (0.58) | | (0.84) | | (1.67) |
| Net asset value at end of year | $ 18.71 | | $ 18.23 | | $ 20.13 | | $ 15.79 | | $ 18.72 |
| Total investment return (b) | 5.73% | | (7.08)% | | 31.32% | | (11.31)% | | 12.03% |
| Ratios (to average net assets)/Supplemental Data: | | | | | | | | | |
| Net investment income (loss) | 2.59% | | 2.33% | | 2.59% | | 2.98% | | 3.44% |
| Net expenses (c) | 0.84%(d) | | 0.84% | | 0.84%(e) | | 0.84%(e) | | 0.85%(e) |
| Expenses (before waiver/reimbursement) (c) | 0.91%(d) | | 0.91% | | 0.91%(e) | | 0.89%(e) | | 0.89%(e) |
| Portfolio turnover rate | 30% | | 50% | | 27% | | 40% | | 24% |
| Net assets at end of year (in 000’s) | $ 573,786 | | $ 910,693 | | $ 1,003,575 | | $ 1,106,793 | | $ 1,657,341 |
| (a) | Per share data based on average shares outstanding during the year. |
| (b) | Total investment return is calculated exclusive of sales charges and assumes the reinvestment of dividends and distributions. Class I shares are not subject to sales charges. For periods of less than one year, total return is not annualized. |
| (c) | In addition to the fees and expenses which the Fund bears directly, it also indirectly bears a pro-rata share of the fees and expenses of the underlying funds in which it invests. Such indirect expenses are not included in the above expense ratios. |
| (d) | Net of interest expense of 0.01%. (See Note 6) |
| (e) | Net of interest expense of less than 0.01%. (See Note 6) |
The notes to the financial statements are an integral part of, and should be read in conjunction with, the financial statements.
| 20 | MainStay Epoch Global Equity Yield Fund |
Financial Highlights selected per share data and ratios
| | Year Ended October 31, |
| Class R2 | 2023 | | 2022 | | 2021 | | 2020 | | 2019 |
| Net asset value at beginning of year | $ 18.30 | | $ 20.20 | | $ 15.84 | | $ 18.77 | | $ 18.39 |
| Net investment income (loss) (a) | 0.43 | | 0.38 | | 0.45 | | 0.44 | | 0.55 |
| Net realized and unrealized gain (loss) | 0.54 | | (1.87) | | 4.40 | | (2.60) | | 1.42 |
| Total from investment operations | 0.97 | | (1.49) | | 4.85 | | (2.16) | | 1.97 |
| Less distributions: | | | | | | | | | |
| From net investment income | (0.50) | | (0.41) | | (0.49) | | (0.43) | | (0.56) |
| From net realized gain on investments | — | | — | | — | | (0.34) | | (1.03) |
| Total distributions | (0.50) | | (0.41) | | (0.49) | | (0.77) | | (1.59) |
| Net asset value at end of year | $ 18.77 | | $ 18.30 | | $ 20.20 | | $ 15.84 | | $ 18.77 |
| Total investment return (b) | 5.28% | | (7.49)% | | 30.76% | | (11.66)% | | 11.55% |
| Ratios (to average net assets)/Supplemental Data: | | | | | | | | | |
| Net investment income (loss) | 2.20% | | 1.92% | | 2.35% | | 2.59% | | 3.02% |
| Net expenses (c) | 1.25%(d) | | 1.25% | | 1.26%(e) | | 1.24%(e) | | 1.24%(e) |
| Expenses (before waiver/reimbursement) (c) | 1.26%(d) | | 1.26% | | 1.28%(e) | | 1.24%(e) | | 1.24%(e) |
| Portfolio turnover rate | 30% | | 50% | | 27% | | 40% | | 24% |
| Net assets at end of year (in 000’s) | $ 206 | | $ 211 | | $ 228 | | $ 459 | | $ 632 |
| (a) | Per share data based on average shares outstanding during the year. |
| (b) | Total investment return is calculated exclusive of sales charges and assumes the reinvestment of dividends and distributions. Class R2 shares are not subject to sales charges. For periods of less than one year, total return is not annualized. |
| (c) | In addition to the fees and expenses which the Fund bears directly, it also indirectly bears a pro-rata share of the fees and expenses of the underlying funds in which it invests. Such indirect expenses are not included in the above expense ratios. |
| (d) | Net of interest expense of 0.01%. (See Note 6) |
| (e) | Net of interest expense of less than 0.01%. (See Note 6) |
| | Year Ended October 31, |
| Class R3 | 2023 | | 2022 | | 2021 | | 2020 | | 2019 |
| Net asset value at beginning of year | $ 18.26 | | $ 20.16 | | $ 15.82 | | $ 18.74 | | $ 18.36 |
| Net investment income (loss) (a) | 0.38 | | 0.32 | | 0.37 | | 0.40 | | 0.53 |
| Net realized and unrealized gain (loss) | 0.56 | | (1.86) | | 4.42 | | (2.60) | | 1.40 |
| Total from investment operations | 0.94 | | (1.54) | | 4.79 | | (2.20) | | 1.93 |
| Less distributions: | | | | | | | | | |
| From net investment income | (0.46) | | (0.36) | | (0.45) | | (0.38) | | (0.52) |
| From net realized gain on investments | — | | — | | — | | (0.34) | | (1.03) |
| Total distributions | (0.46) | | (0.36) | | (0.45) | | (0.72) | | (1.55) |
| Net asset value at end of year | $ 18.74 | | $ 18.26 | | $ 20.16 | | $ 15.82 | | $ 18.74 |
| Total investment return (b) | 5.03% | | (7.70)% | | 30.42% | | (11.87)% | | 11.28% |
| Ratios (to average net assets)/Supplemental Data: | | | | | | | | | |
| Net investment income (loss) | 1.96% | | 1.66% | | 1.90% | | 2.33% | | 2.92% |
| Net expenses (c) | 1.50%(d) | | 1.50% | | 1.50%(e) | | 1.49%(e) | | 1.49%(e) |
| Expenses (before waiver/reimbursement) (c) | 1.51%(d) | | 1.51% | | 1.51%(e) | | 1.49%(e) | | 1.49%(e) |
| Portfolio turnover rate | 30% | | 50% | | 27% | | 40% | | 24% |
| Net assets at end of year (in 000’s) | $ 721 | | $ 634 | | $ 643 | | $ 446 | | $ 568 |
| (a) | Per share data based on average shares outstanding during the year. |
| (b) | Total investment return is calculated exclusive of sales charges and assumes the reinvestment of dividends and distributions. Class R3 shares are not subject to sales charges. For periods of less than one year, total return is not annualized. |
| (c) | In addition to the fees and expenses which the Fund bears directly, it also indirectly bears a pro-rata share of the fees and expenses of the underlying funds in which it invests. Such indirect expenses are not included in the above expense ratios. |
| (d) | Net of interest expense of 0.01%. (See Note 6) |
| (e) | Net of interest expense of less than 0.01%. (See Note 6) |
The notes to the financial statements are an integral part of, and should be read in conjunction with, the financial statements.
21
Financial Highlights selected per share data and ratios
| | Year Ended October 31, |
| Class R6 | 2023 | | 2022 | | 2021 | | 2020 | | 2019 |
| Net asset value at beginning of year | $ 18.00 | | $ 19.88 | | $ 15.60 | | $ 18.73 | | $ 18.35 |
| Net investment income (loss) (a) | 0.55 | | 0.44 | | 0.54 | | 0.54 | | 0.63 |
| Net realized and unrealized gain (loss) | 0.51 | | (1.81) | | 4.34 | | (2.81) | | 1.43 |
| Total from investment operations | 1.06 | | (1.37) | | 4.88 | | (2.27) | | 2.06 |
| Less distributions: | | | | | | | | | |
| From net investment income | (0.61) | | (0.51) | | (0.60) | | (0.52) | | (0.65) |
| From net realized gain on investments | — | | — | | — | | (0.34) | | (1.03) |
| Total distributions | (0.61) | | (0.51) | | (0.60) | | (0.86) | | (1.68) |
| Net asset value at end of year | $ 18.45 | | $ 18.00 | | $ 19.88 | | $ 15.60 | | $ 18.73 |
| Total investment return (b) | 5.82% | | (7.02)% | | 31.45% | | (12.32)% | | 12.14% |
| Ratios (to average net assets)/Supplemental Data: | | | | | | | | | |
| Net investment income (loss) | 2.85% | | 2.33% | | 2.81% | | 3.18% | | 3.50% |
| Net expenses (c) | 0.74%(d) | | 0.74% | | 0.74%(e) | | 0.74%(e) | | 0.75%(e) |
| Expenses (before waiver/reimbursement) (c) | 0.75%(d) | | 0.75% | | 0.75%(e) | | 0.76%(e) | | 0.75%(e) |
| Portfolio turnover rate | 30% | | 50% | | 27% | | 40% | | 24% |
| Net assets at end of year (in 000’s) | $ 995 | | $ 5,851 | | $ 769 | | $ 325 | | $ 67,054 |
| (a) | Per share data based on average shares outstanding during the year. |
| (b) | Total investment return is calculated exclusive of sales charges and assumes the reinvestment of dividends and distributions. Class R6 shares are not subject to sales charges. For periods of less than one year, total return is not annualized. |
| (c) | In addition to the fees and expenses which the Fund bears directly, it also indirectly bears a pro-rata share of the fees and expenses of the underlying funds in which it invests. Such indirect expenses are not included in the above expense ratios. |
| (d) | Net of interest expense of 0.01%. (See Note 6) |
| (e) | Net of interest expense of less than 0.01%. (See Note 6) |
The notes to the financial statements are an integral part of, and should be read in conjunction with, the financial statements.
| 22 | MainStay Epoch Global Equity Yield Fund |
Notes to Financial Statements
Note 1-Organization and Business
MainStay Funds Trust (the “Trust”) was organized as a Delaware statutory trust on April 28, 2009. The Trust is registered under the Investment Company Act of 1940, as amended (the “1940 Act”), as an open-end management investment company, and is comprised of thirty-seven funds (collectively referred to as the “Funds”). These financial statements and notes relate to the MainStay Epoch Global Equity Yield Fund (the "Fund"), a “diversified” fund, as that term is defined in the 1940 Act, as interpreted or modified by regulatory authorities having jurisdiction, from time to time.
The following table lists the Fund's share classes that have been registered and commenced operations:
| Class | Commenced Operations |
| Class A | August 2, 2006 |
| Investor Class | November 16, 2009 |
| Class C | November 16, 2009 |
| Class I | December 27, 2005 |
| Class R2* | February 28, 2014 |
| Class R3* | February 29, 2016 |
| Class R6 | June 17, 2013 |
| * | As of October 31, 2023, Class R2 and Class R3 shares are closed to new investors and, upon the close of business on December 29, 2023, Class R2 and Class R3 shares are closed to additional investments by existing shareholders. Additionally, Class R2 and Class R3 shares will be liquidated on or about February 28, 2024 (the "Liquidation Date"). It is expected that the Fund will distribute to remaining shareholders invested in Class R2 or Class R3 shares, on or promptly after the Liquidation Date, a liquidating distribution in cash or cash equivalents equal to the net asset value of such shares. |
Class A and Investor Class shares are offered at net asset value (“NAV”) per share plus an initial sales charge. No initial sales charge applies to investments of $1 million or more (and certain other qualified purchases) in Class A and Investor Class shares. However, a contingent deferred sales charge (“CDSC”) of 1.00% may be imposed on certain redemptions made within 18 months of the date of purchase on shares that were purchased without an initial sales charge. Class C shares are offered at NAV without an initial sales charge, although a 1.00% CDSC may be imposed on certain redemptions of such shares made within one year of the date of purchase of Class C shares. Class I, Class R2, Class R3 and Class R6 shares are offered at NAV without a sales charge. In addition, depending upon eligibility, Class C shares convert to either Class A or Investor Class shares at the end of the calendar quarter eight years after the date they were purchased. Additionally, Investor Class shares may convert automatically to Class A shares. Under certain circumstances and as may be permitted by the Trust’s multiple class plan pursuant to Rule 18f-3 under the 1940 Act, specified share classes of the Fund may be converted to one or more other share classes of the Fund as disclosed in the capital share transactions within these Notes. The classes of shares have the same voting (except for issues that relate solely to one class), dividend, liquidation and other rights, and the same terms and conditions, except that Class C shares are subject to higher distribution and/or service fees than Class A, Investor Class, Class R2 and Class R3 shares
under distribution plans pursuant to Rule 12b-1 under the 1940 Act. Class I and Class R6 shares are not subject to a distribution and/or service fee. Class R2 and Class R3 shares are subject to a shareholder service fee, which is in addition to fees paid under the distribution plans for Class R2 and Class R3 shares.
At a meeting held on September 25-26, 2023, the Board of Trustees (the “Board”) of the Trust, after careful consideration of a number of factors and upon the recommendation of the Fund's investment adviser, New York Life Investment Management LLC (“New York Life Investments” or the "Manager"), approved a proposal to liquidate Class R2 and Class R3 shares of the Fund on or about February 28, 2024, pursuant to the terms of a plan of liquidation.
The Fund's investment objective is to seek a high level of income. Capital appreciation is a secondary investment objective.
Note 2–Significant Accounting Policies
The Fund is an investment company and accordingly follows the investment company accounting and reporting guidance of the Financial Accounting Standards Board (“FASB”) Accounting Standards Codification Topic 946 Financial Services—Investment Companies. The Fund prepares its financial statements in accordance with generally accepted accounting principles (“GAAP”) in the United States of America and follows the significant accounting policies described below.
(A) Securities Valuation. Investments are usually valued as of the close of regular trading on the New York Stock Exchange (the "Exchange") (usually 4:00 p.m. Eastern time) on each day the Fund is open for business ("valuation date").
Pursuant to Rule 2a-5 under the 1940 Act, the Board has designated New York Life Investments as its Valuation Designee (the "Valuation Designee"). The Valuation Designee is responsible for performing fair valuations relating to all investments in the Fund’s portfolio for which market quotations are not readily available; periodically assessing and managing material valuation risks; establishing and applying fair value methodologies; testing fair valuation methodologies; evaluating and overseeing pricing services; ensuring appropriate segregation of valuation and portfolio management functions; providing quarterly, annual and prompt reporting to the Board, as appropriate; identifying potential conflicts of interest; and maintaining appropriate records. The Valuation Designee has established a valuation committee ("Valuation Committee") to assist in carrying out the Valuation Designee’s responsibilities and establish prices of securities for which market quotations are not readily available. The Fund's and the Valuation Designee's policies and procedures ("Valuation Procedures") govern the Valuation Designee’s selection and application of methodologies for determining and calculating the fair value of Fund investments. The Valuation Designee may value the Fund's portfolio securities for which market quotations are not readily available and other Fund assets utilizing inputs from pricing services and other third-party sources. The Valuation Committee meets (in person, via electronic mail or via teleconference) on an ad-hoc basis to
Notes to Financial Statements (continued)
determine fair valuations and on a quarterly basis to review fair value events with respect to certain securities for which market quotations are not readily available, including valuation risks and back-testing results, and preview reports to the Board.
The Valuation Committee establishes prices of securities for which market quotations are not readily available based on such methodologies and measurements on a regular basis after considering information that is reasonably available and deemed relevant by the Valuation Committee. The Board shall oversee the Valuation Designee and review fair valuation materials on a prompt, quarterly and annual basis and approve proposed revisions to the Valuation Procedures.
Investments for which market quotations are not readily available are valued at fair value as determined in good faith pursuant to the Valuation Procedures. A market quotation is readily available only when that quotation is a quoted price (unadjusted) in active markets for identical investments that the Fund can access at the measurement date, provided that a quotation will not be readily available if it is not reliable. "Fair value" is defined as the price the Fund would reasonably expect to receive upon selling an asset or liability in an orderly transaction to an independent buyer in the principal or most advantageous market for the asset or liability. Fair value measurements are determined within a framework that establishes a three-tier hierarchy that maximizes the use of observable market data and minimizes the use of unobservable inputs to establish a classification of fair value measurements for disclosure purposes. "Inputs" refer broadly to the assumptions that market participants would use in pricing the asset or liability, including assumptions about risk, such as the risk inherent in a particular valuation technique used to measure fair value using a pricing model and/or the risk inherent in the inputs for the valuation technique. Inputs may be observable or unobservable. Observable inputs reflect the assumptions market participants would use in pricing the asset or liability based on market data obtained from sources independent of the Fund. Unobservable inputs reflect the Fund’s own assumptions about the assumptions market participants would use in pricing the asset or liability based on the information available. The inputs or methodology used for valuing assets or liabilities may not be an indication of the risks associated with investing in those assets or liabilities. The three-tier hierarchy of inputs is summarized below.
| • | Level 1—quoted prices (unadjusted) in active markets for an identical asset or liability |
| • | Level 2—other significant observable inputs (including quoted prices for a similar asset or liability in active markets, interest rates and yield curves, prepayment speeds, credit risk, etc.) |
| • | Level 3—significant unobservable inputs (including the Fund's own assumptions about the assumptions that market participants would use in measuring fair value of an asset or liability) |
The level of an asset or liability within the fair value hierarchy is based on the lowest level of an input, both individually and in the aggregate, that is significant to the fair value measurement. The aggregate value by input
level of the Fund’s assets and liabilities as of October 31, 2023, is included at the end of the Portfolio of Investments.
The Fund may use third-party vendor evaluations, whose prices may be derived from one or more of the following standard inputs, among others:
| • Broker/dealer quotes | • Benchmark securities |
| • Two-sided markets | • Reference data (corporate actions or material event notices) |
| • Bids/offers | • Monthly payment information |
| • Industry and economic events | • Reported trades |
An asset or liability for which a market quotation is not readily available is valued by methods deemed reasonable in good faith by the Valuation Committee, following the Valuation Procedures to represent fair value. Under these procedures, the Valuation Designee generally uses a market-based approach which may use related or comparable assets or liabilities, recent transactions, market multiples, book values and other relevant information. The Valuation Designee may also use an income-based valuation approach in which the anticipated future cash flows of the asset or liability are discounted to calculate fair value. Discounts may also be applied due to the nature and/or duration of any restrictions on the disposition of the asset or liability. Fair value represents a good faith approximation of the value of a security. Fair value determinations involve the consideration of a number of subjective factors, an analysis of applicable facts and circumstances and the exercise of judgment. As a result, it is possible that the fair value for a security determined in good faith in accordance with the Valuation Procedures may differ from valuations for the same security determined for other funds using their own valuation procedures. Although the Valuation Procedures are designed to value a security at the price the Fund may reasonably expect to receive upon the security's sale in an orderly transaction, there can be no assurance that any fair value determination thereunder would, in fact, approximate the amount that the Fund would actually realize upon the sale of the security or the price at which the security would trade if a reliable market price were readily available. During the year ended October 31, 2023, there were no material changes to the fair value methodologies.
Securities which may be valued in this manner include, but are not limited to: (i) a security for which trading has been halted or suspended or otherwise does not have a readily available market quotation on a given day; (ii) a debt security that has recently gone into default and for which there is not a current market quotation; (iii) a security of an issuer that has entered into a restructuring; (iv) a security that has been delisted from a national exchange; (v) a security subject to trading collars for which no or limited trading takes place; and (vi) a security whose principal market has been temporarily closed at a time when, under normal conditions, it would be open. Securities valued in this manner are generally categorized as Level 2 or 3 in the hierarchy. No securities held by the Fund as of October 31, 2023, were fair valued in such a manner.
Certain securities held by the Fund may principally trade in foreign markets. Events may occur between the time the foreign markets close
| 24 | MainStay Epoch Global Equity Yield Fund |
and the time at which the Fund's NAVs are calculated. These events may include, but are not limited to, situations relating to a single issuer in a market sector, significant fluctuations in U.S. or foreign markets, natural disasters, armed conflicts, governmental actions or other developments not tied directly to the securities markets. Should the Valuation Designee conclude that such events may have affected the accuracy of the last price of such securities reported on the local foreign market, the Valuation Designee may, pursuant to the Valuation Procedures, adjust the value of the local price to reflect the estimated impact on the price of such securities as a result of such events. In this instance, securities are generally categorized as Level 3 in the hierarchy. Additionally, certain foreign equity securities are also fair valued whenever the movement of a particular index exceeds certain thresholds. In such cases, the securities are fair valued by applying factors provided by a third-party vendor in accordance with the Valuation Procedures and are generally categorized as Level 2 in the hierarchy. No foreign equity securities held by the Fund as of October 31, 2023 were fair valued in such a manner.
If the principal market of certain foreign equity securities is closed in observance of a local foreign holiday, these securities are valued using the last closing price of regular trading on the relevant exchange and fair valued by applying factors provided by a third-party vendor in accordance with the Valuation Procedures. These securities are generally categorized as Level 2 in the hierarchy. No securities held by the Fund as of October 31, 2023, were fair valued in such a manner.
Equity securities, rights and warrants, if applicable, are valued at the last quoted sales prices as of the close of regular trading on the relevant exchange on each valuation date. Securities that are not traded on the valuation date are valued at the mean of the last quoted bid and ask prices. Prices are normally taken from the principal market in which each security trades. These securities are generally categorized as Level 1 in the hierarchy.
Investments in mutual funds, including money market funds, are valued at their respective NAVs at the close of business each day on the valuation date. These securities are generally categorized as Level 1 in the hierarchy.
Temporary cash investments acquired in excess of 60 days to maturity at the time of purchase are valued using the latest bid prices or using valuations based on a matrix system (which considers such factors as security prices, yields, maturities and ratings), both as furnished by independent pricing services. Temporary cash investments that mature in 60 days or less at the time of purchase ("Short-Term Investments") are valued using the amortized cost method of valuation, unless the use of such method would be inappropriate. The amortized cost method involves valuing a security at its cost on the date of purchase and thereafter assuming a constant amortization to maturity of the difference between such cost and the value on maturity date. Amortized cost approximates the current fair value of a security. Securities valued using the amortized cost method are not valued using quoted prices in an active market and are generally categorized as Level 2 in the hierarchy.
The information above is not intended to reflect an exhaustive list of the methodologies that may be used to value portfolio investments. The Valuation Procedures permit the use of a variety of valuation methodologies in connection with valuing portfolio investments. The methodology used for a specific type of investment may vary based on the market data available or other considerations. The methodologies summarized above may not represent the specific means by which portfolio investments are valued on any particular business day.
(B) Income Taxes. The Fund's policy is to comply with the requirements of the Internal Revenue Code of 1986, as amended (the “Internal Revenue Code”), applicable to regulated investment companies and to distribute all of its taxable income to the shareholders of the Fund within the allowable time limits.
The Manager evaluates the Fund’s tax positions to determine if the tax positions taken meet the minimum recognition threshold in connection with accounting for uncertainties in income tax positions taken or expected to be taken for the purposes of measuring and recognizing tax liabilities in the financial statements. Recognition of tax benefits of an uncertain tax position is permitted only to the extent the position is “more likely than not” to be sustained assuming examination by taxing authorities. The Manager analyzed the Fund's tax positions taken on federal, state and local income tax returns for all open tax years (for up to three tax years) and has concluded that no provisions for federal, state and local income tax are required in the Fund's financial statements. The Fund's federal, state and local income tax and federal excise tax returns for tax years for which the applicable statutes of limitations have not expired are subject to examination by the Internal Revenue Service and state and local departments of revenue.
(C) Foreign Taxes. The Fund may be subject to foreign taxes on income and other transaction-based taxes imposed by certain countries in which it invests. A portion of the taxes on gains on investments or currency purchases/repatriation may be reclaimable. The Fund will accrue such taxes and reclaims as applicable, based upon its current interpretation of tax rules and regulations that exist in the markets in which it invests.
The Fund may be subject to taxation on realized capital gains, repatriation proceeds and other transaction-based taxes imposed by certain countries in which it invests. The Fund will accrue such taxes as applicable based upon its current interpretation of tax rules and regulations that exist in the market in which it invests. Capital gains taxes relating to positions still held are reflected as a liability in the Statement of Assets and Liabilities, as well as an adjustment to the Fund's net unrealized appreciation (depreciation). Taxes related to capital gains realized, if any, are reflected as part of net realized gain (loss) in the Statement of Operations. Changes in tax liabilities related to capital gains taxes on unrealized investment gains, if any, are reflected as part of the change in net unrealized appreciation (depreciation) on investments in the Statement of Operations. Transaction-based charges are generally assessed as a percentage of the transaction amount.
Notes to Financial Statements (continued)
(D) Dividends and Distributions to Shareholders. Dividends and distributions are recorded on the ex-dividend date. The Fund intends to declare and pay dividends from net investment income, if any, at least quarterly and distributions from net realized capital and currency gains, if any, at least annually. Unless a shareholder elects otherwise, all dividends and distributions are reinvested at NAV in the same class of shares of the Fund. Dividends and distributions to shareholders are determined in accordance with federal income tax regulations and may differ from determinations using GAAP.
(E) Security Transactions and Investment Income. The Fund records security transactions on the trade date. Realized gains and losses on security transactions are determined using the identified cost method. Dividend income is recognized on the ex-dividend date, net of any foreign tax withheld at the source, and interest income is accrued as earned using the effective interest rate method. Distributions received from real estate investment trusts may be classified as dividends, capital gains and/or return of capital.
Investment income and realized and unrealized gains and losses on investments of the Fund are allocated pro rata to the separate classes of shares based upon their relative net assets on the date the income is earned or realized and unrealized gains and losses are incurred.
(F) Expenses. Expenses of the Trust are allocated to the individual Funds in proportion to the net assets of the respective Funds when the expenses are incurred, except where direct allocations of expenses can be made. Expenses (other than transfer agent expenses and fees incurred under the shareholder services plans and/or the distribution plans further discussed in Note 3(B)) are allocated to separate classes of shares pro rata based upon their relative net assets on the date the expenses are incurred. The expenses borne by the Fund, including those of related parties to the Fund, are shown in the Statement of Operations.
Additionally, the Fund may invest in mutual funds, which are subject to management fees and other fees that may cause the costs of investing in mutual funds to be greater than the costs of owning the underlying securities directly. These indirect expenses of mutual funds are not included in the amounts shown as expenses in the Statement of Operations or in the expense ratios included in the Financial Highlights.
(G) Use of Estimates. In preparing financial statements in conformity with GAAP, the Manager makes estimates and assumptions that affect the reported amounts and disclosures in the financial statements. Actual results could differ from those estimates and assumptions.
(H) Foreign Currency Transactions. The Fund's books and records are maintained in U.S. dollars. Prices of securities denominated in foreign currency amounts are translated into U.S. dollars at the mean between the buying and selling rates last quoted by any major U.S. bank at the following dates:
(i) market value of investment securities, other assets and liabilities— at the valuation date; and
(ii) purchases and sales of investment securities, income and expenses—at the date of such transactions.
The assets and liabilities that are denominated in foreign currency amounts are presented at the exchange rates and market values at the close of the period. The realized and unrealized changes in net assets arising from fluctuations in exchange rates and market prices of securities are not separately presented.
Net realized gain (loss) on foreign currency transactions represents net currency gains or losses realized as a result of differences between the amounts of securities sale proceeds or purchase cost, dividends, interest and withholding taxes as recorded on the Fund's books, and the U.S. dollar equivalent amount actually received or paid. Net currency gains or losses from valuing such foreign currency denominated assets and liabilities, other than investments at valuation date exchange rates, are reflected in unrealized foreign exchange gains or losses.
(I) Securities Lending. In order to realize additional income, the Fund may engage in securities lending, subject to the limitations set forth in the 1940 Act and relevant guidance by the staff of the Securities and Exchange Commission (“SEC”). If the Fund engages in securities lending, the Fund will lend through its custodian, JPMorgan Chase Bank, N.A., ("JPMorgan"), acting as securities lending agent on behalf of the Fund. Under the current arrangement, JPMorgan will manage the Fund's collateral in accordance with the securities lending agency agreement between the Fund and JPMorgan, and indemnify the Fund against counterparty risk. The loans will be collateralized by cash (which may be invested in a money market fund) and/or non-cash collateral (which may include U.S. Treasury securities and/or U.S. government agency securities issued or guaranteed by the United States government or its agencies or instrumentalities) at least equal at all times to the market value of the securities loaned. Non-cash collateral held at year end is segregated and cannot be transferred by the Fund. The Fund bears the risk of delay in recovery of, or loss of rights in, the securities loaned. The Fund may also record a realized gain or loss on securities deemed sold due to a borrower’s inability to return securities on loan. The Fund bears the risk of any loss on investment of cash collateral. The Fund will receive compensation for lending its securities in the form of fees or it will retain a portion of interest earned on the investment of any cash collateral. The Fund will also continue to receive interest and dividends on the securities loaned and any gain or loss in the market price of the securities loaned that may occur during the term of the loan will be for the account of the Fund. Income earned from securities lending activities, if any, is reflected in the Statement of Operations. Securities on loan as of October 31, 2023, are shown in the Portfolio of Investments.
(J) Foreign Securities Risk. The Fund may invest in foreign securities, which carry certain risks that are in addition to the usual risks inherent in domestic securities. Foreign regulatory regimes and securities markets can have less stringent investor protections and disclosure standards and less liquid trading markets than U.S. regulatory regimes and securities markets, and can experience political, social and economic developments that may affect the value of investments in foreign
| 26 | MainStay Epoch Global Equity Yield Fund |
securities. These risks include those resulting from currency fluctuations, future adverse political or economic developments and possible imposition of currency exchange blockages or other foreign governmental laws or restrictions. Economic sanctions and other similar governmental actions or developments could, among other things, effectively restrict or eliminate the Fund's ability to purchase or sell certain foreign securities or groups of foreign securities, and thus may make the Fund's investments in such securities less liquid or more difficult to value. These risks are likely to be greater in emerging markets than in developed markets. The ability of issuers of debt securities held by the Fund to meet their obligations may be affected by, among other things, economic or political developments in a specific country, industry or region.
(K) Large Transaction Risks. From time to time, the Fund may receive large purchase or redemption orders from affiliated or unaffiliated mutual funds or other investors. Such large transactions could have adverse effects on the Fund’s performance if the Fund were required to sell securities or invest cash at times when it otherwise would not do so. This activity could also accelerate the realization of capital gains and increase the Fund’s transaction costs. The Fund has adopted procedures designed to mitigate the negative impacts of such large transactions, but there can be no assurance that these procedures will be effective.
(L) Indemnifications. Under the Trust’s organizational documents, its officers and trustees are indemnified against certain liabilities that may arise out of performance of their duties to the Trust. Additionally, in the normal course of business, the Fund enters into contracts with third-party service providers that contain a variety of representations and warranties and that may provide general indemnifications. The Fund's maximum exposure under these arrangements is unknown, as this would involve future claims that may be made against the Fund that have not yet occurred. The Manager believes that the risk of loss in connection with these potential indemnification obligations is remote. However, there can be no assurance that material liabilities related to such obligations will not arise in the future, which could adversely impact the Fund.
Note 3–Fees and Related Party Transactions
(A) Manager and Subadvisor. New York Life Investments, a registered investment adviser and an indirect, wholly-owned subsidiary of New York Life Insurance Company ("New York Life"), serves as the Fund's Manager, pursuant to an Amended and Restated Management Agreement (“Management Agreement”). The Manager provides offices, conducts clerical, recordkeeping and bookkeeping services and keeps most of the financial and accounting records required to be maintained by the Fund. Except for the portion of salaries and expenses that are the responsibility of the Fund, the Manager pays the salaries and expenses of all personnel affiliated with the Fund and certain operational expenses of the Fund. The Fund reimburses New York Life Investments in an amount equal to the portion of the compensation of the Chief Compliance Officer attributable to the Fund. Epoch Investment Partners, Inc. (“Epoch” or the “Subadvisor”), a registered investment adviser, serves as the Subadvisor to the Fund and is responsible for the day-to-day portfolio management
of the Fund. Pursuant to the terms of an Amended and Restated Subadvisory Agreement ("Subadvisory Agreement") between New York Life Investments and Epoch, New York Life Investments pays for the services of the Subadvisor.
Pursuant to the Management Agreement, the Fund pays the Manager a monthly fee for the services performed and the facilities furnished at an annual rate of 0.70% of the Fund's average daily net assets.
New York Life Investments has contractually agreed to waive fees and/or reimburse expenses so that Total Annual Fund Operating Expenses (excluding taxes, interest, litigation, extraordinary expenses, brokerage and other transaction expenses relating to the purchase or sale of portfolio investments and acquired (underlying) fund fees and expenses) do not exceed the following percentages of average daily net assets: Class A, 1.09%; Class C, 1.84%; Class I, 0.84%; and Class R6, 0.74%. This agreement will remain in effect until February 28, 2024, and shall renew automatically for one-year terms unless New York Life Investments provides written notice of termination prior to the start of the next term or upon approval of the Board.
During the year ended October 31, 2023, New York Life Investments earned fees from the Fund in the amount of $6,351,357 and waived fees and/or reimbursed certain class specific expenses in the amount of $639,408 and paid the Subadvisor fees in the amount of $3,175,678.
JPMorgan provides sub-administration and sub-accounting services to the Fund pursuant to an agreement with New York Life Investments. These services include calculating the daily NAVs of the Fund, maintaining the general ledger and sub-ledger accounts for the calculation of the Fund's NAVs, and assisting New York Life Investments in conducting various aspects of the Fund's administrative operations. For providing these services to the Fund, JPMorgan is compensated by New York Life Investments.
Pursuant to an agreement between the Trust and New York Life Investments, New York Life Investments is responsible for providing or procuring certain regulatory reporting services for the Fund. The Fund will reimburse New York Life Investments for the actual costs incurred by New York Life Investments in connection with providing or procuring these services for the Fund.
(B) Distribution and Service Fees. The Trust, on behalf of the Fund, has entered into a distribution agreement with NYLIFE Distributors LLC (the “Distributor”), an affiliate of New York Life Investments. The Fund has adopted distribution plans (the “Plans”) in accordance with the provisions of Rule 12b-1 under the 1940 Act.
Pursuant to the Class A, Investor Class and Class R2 Plans, the Distributor receives a monthly fee from the Class A, Investor Class and Class R2 shares at an annual rate of 0.25% of the average daily net assets of the Class A, Investor Class and Class R2 shares for distribution and/or service activities as designated by the Distributor. Pursuant to the Class C Plan, Class C shares pay the Distributor a monthly distribution fee at an annual rate of 0.75% of the average daily net assets of the Class C
Notes to Financial Statements (continued)
shares, along with a service fee at an annual rate of 0.25% of the average daily net assets of the Class C shares, for a total 12b-1 fee of 1.00%. Pursuant to the Class R3 Plan, Class R3 shares pay the Distributor a monthly distribution fee at an annual rate of 0.25% of the average daily net assets of the Class R3 shares, along with a service fee at an annual rate of 0.25% of the average daily net assets of the Class R3 shares, for a total 12b-1 fee of 0.50%. Class I and Class R6 shares are not subject to a distribution and/or service fee.
The Plans provide that the distribution and service fees are payable to the Distributor regardless of the amounts actually expended by the Distributor for distribution of the Fund's shares and service activities.
In accordance with the Shareholder Services Plans for the Class R2 and Class R3 shares, the Manager has agreed to provide, through its affiliates or independent third parties, various shareholder and administrative support services to shareholders of the Class R2 and Class R3 shares. For its services, the Manager, its affiliates or independent third-party service providers are entitled to a shareholder service fee accrued daily and paid monthly at an annual rate of 0.10% of the average daily net assets of the Class R2 and Class R3 shares. This is in addition to any fees paid under the Class R2 and Class R3 Plans.
During the year ended October 31, 2023, shareholder service fees incurred by the Fund were as follows:
(C) Sales Charges. The Fund was advised by the Distributor that the amount of initial sales charges retained on sales of Class A and Investor Class shares during the year ended October 31, 2023, were $5,336 and $505, respectively.
The Fund was also advised that the Distributor retained CDSCs on redemptions of Class A and Class C shares during the year ended October 31, 2023, of $3,263 and $261, respectively.
(D) Transfer, Dividend Disbursing and Shareholder Servicing Agent. NYLIM Service Company LLC, an affiliate of New York Life Investments, is the Fund's transfer, dividend disbursing and shareholder servicing agent pursuant to an agreement between NYLIM Service Company LLC and the Trust. NYLIM Service Company LLC has entered into an agreement with SS&C Global Investor & Distribution Solutions, Inc. ("SS&C"), pursuant to which SS&C performs certain transfer agent services on behalf of NYLIM Service Company LLC. New York Life Investments has contractually agreed to limit the transfer agency expenses charged to the Fund’s share classes to a maximum of 0.35% of that share class’s average daily net assets on an annual basis after deducting any applicable Fund or class-level expense reimbursement or small account fees. This agreement will remain in effect until February 28, 2024, and shall renew automatically for one-year terms unless New York Life Investments provides written notice of termination prior to the start of the next term or upon approval of the Board. During the year
ended October 31, 2023, transfer agent expenses incurred by the Fund and any reimbursements, pursuant to the aforementioned Transfer Agency expense limitation agreement, were as follows:
| Class | Expense | Waived |
| Class A | $ 197,486 | $— |
| Investor Class | 16,376 | — |
| Class C | 25,410 | — |
| Class I | 1,251,423 | — |
| Class R2 | 368 | — |
| Class R3 | 1,128 | — |
| Class R6 | 215 | — |
(E) Small Account Fee. Shareholders with small accounts adversely impact the cost of providing transfer agency services. In an effort to reduce total transfer agency expenses, the Fund has implemented a small account fee on certain types of accounts. As described in the Fund's prospectus, certain shareholders with an account balance of less than $1,000 ($5,000 for Class A share accounts) are charged an annual per account fee of $20 (assessed semi-annually), the proceeds from which offset transfer agent fees as reflected in the Statement of Operations. This small account fee will not apply to certain types of accounts as described further in the Fund’s prospectus.
(F) Capital. As of October 31, 2023, New York Life and its affiliates beneficially held shares of the Fund with the values and percentages of net assets as follows:
| Class R2 | $36,374 | 17.7% |
| Class R3 | 36,350 | 5.0 |
Note 4-Federal Income Tax
As of October 31, 2023, the cost and unrealized appreciation (depreciation) of the Fund’s investment portfolio, including applicable derivative contracts and other financial instruments, as determined on a federal income tax basis, were as follows:
| | Federal Tax
Cost | Gross
Unrealized
Appreciation | Gross
Unrealized
(Depreciation) | Net
Unrealized
Appreciation/
(Depreciation) |
| Investments in Securities | $612,656,429 | $127,351,863 | $(34,682,438) | $92,669,425 |
As of October 31, 2023, the components of accumulated gain (loss) on a tax basis were as follows:
Ordinary
Income | Accumulated
Capital
and Other
Gain (Loss) | Other
Temporary
Differences | Unrealized
Appreciation
(Depreciation) | Total
Accumulated
Gain (Loss) |
| $2,183,257 | $(4,494,086) | $— | $92,457,540 | $90,146,711 |
| 28 | MainStay Epoch Global Equity Yield Fund |
The difference between book-basis and tax-basis unrealized appreciation (depreciation) is primarily due to wash sale adjustments and partnership adjustment.
As of October 31, 2023, for federal income tax purposes, capital loss carryforwards of $4,494,086, as shown in the table below, were available to the extent provided by the regulations to offset future realized gains of the Fund. Accordingly, no capital gains distributions are expected to be paid to shareholders until net gains have been realized in excess of such amounts.
Capital Loss
Available Through | Short-Term
Capital Loss
Amounts (000’s) | Long-Term
Capital Loss
Amounts (000’s) |
| Unlimited | $4,494 | $— |
The Fund utilized $27,168,289 of capital loss carryforwards during the year ended October 31, 2023.
During the years ended October 31, 2023 and October 31, 2022, the tax character of distributions paid as reflected in the Statements of Changes in Net Assets was as follows:
| | 2023 | 2022 |
| Distributions paid from: | | |
| Ordinary Income | $25,671,191 | $27,613,874 |
Note 5–Custodian
JPMorgan is the custodian of cash and securities held by the Fund. Custodial fees are charged to the Fund based on the Fund's net assets and/or the market value of securities held by the Fund and the number of certain transactions incurred by the Fund.
Note 6–Line of Credit
The Fund and certain other funds managed by New York Life Investments maintain a line of credit with a syndicate of banks in order to secure a source of funds for temporary purposes to meet unanticipated or excessive redemption requests.
Effective July 26, 2022, under the credit agreement (the “Credit Agreement”), the aggregate commitment amount is $600,000,000 with an additional uncommitted amount of $100,000,000. The commitment fee is an annual rate of 0.15% of the average commitment amount payable quarterly, regardless of usage, to JPMorgan, who serves as the agent to the syndicate. The commitment fee is allocated among the Fund and certain other funds managed by New York Life Investments based upon their respective net assets and other factors. Interest on any revolving credit loan is charged based upon the Federal Funds Rate, Daily Simple Secured Overnight Financing Rate ("SOFR") + 0.10%, or the Overnight Bank Funding Rate, whichever is higher. The Credit Agreement expires on July 25, 2023, although the Fund, certain other funds managed by New York Life Investments and the syndicate of banks may renew the Credit Agreement for an additional year on the same or different terms or enter into a credit agreement with a different syndicate
of banks. Prior to July 26, 2022, the aggregate commitment amount and the commitment fee were the same as those under the current Credit Agreement. During the year ended October 31, 2023, the Fund utilized the line of credit for 2 days, maintained an average daily balance of $168,100,000, at a weighted average interest rate of 5.65% and incurred interest expense in the amount of $52,765. As of October 31, 2023, there were no borrowings outstanding with respect to the Fund under the Credit Agreement.
Note 7–Interfund Lending Program
Pursuant to an exemptive order issued by the SEC, the Fund, along with certain other funds managed by New York Life Investments, may participate in an interfund lending program. The interfund lending program provides an alternative credit facility that permits the Fund and certain other funds managed by New York Life Investments to lend or borrow money for temporary purposes directly to or from one another, subject to the conditions of the exemptive order. During the year ended October 31, 2023, there were no interfund loans made or outstanding with respect to the Fund.
Note 8–Purchases and Sales of Securities (in 000’s)
During the year ended October 31, 2023, purchases and sales of securities, other than short-term securities, were $268,590 and $662,776, respectively.
Note 9–Capital Share Transactions
Transactions in capital shares for the years ended October 31, 2023 and October 31, 2022, were as follows:
Notes to Financial Statements (continued)
| Class A | Shares | Amount |
| Year ended October 31, 2023: | | |
| Shares sold | 751,565 | $ 14,677,121 |
| Shares issued to shareholders in reinvestment of distributions | 135,691 | 2,666,106 |
| Shares redeemed | (1,536,885) | (30,173,346) |
| Net increase (decrease) in shares outstanding before conversion | (649,629) | (12,830,119) |
| Shares converted into Class A (See Note 1) | 24,709 | 482,972 |
| Shares converted from Class A (See Note 1) | (49,895) | (971,102) |
| Net increase (decrease) | (674,815) | $ (13,318,249) |
| Year ended October 31, 2022: | | |
| Shares sold | 859,251 | $ 16,801,816 |
| Shares issued to shareholders in reinvestment of distributions | 125,489 | 2,385,618 |
| Shares redeemed | (1,090,606) | (21,146,458) |
| Net increase (decrease) in shares outstanding before conversion | (105,866) | (1,959,024) |
| Shares converted into Class A (See Note 1) | 29,554 | 588,529 |
| Shares converted from Class A (See Note 1) | (11,185) | (221,782) |
| Net increase (decrease) | (87,497) | $ (1,592,277) |
| |
| Investor Class | Shares | Amount |
| Year ended October 31, 2023: | | |
| Shares sold | 31,310 | $ 606,554 |
| Shares issued to shareholders in reinvestment of distributions | 11,539 | 226,195 |
| Shares redeemed | (56,797) | (1,110,126) |
| Net increase (decrease) in shares outstanding before conversion | (13,948) | (277,377) |
| Shares converted into Investor Class (See Note 1) | 7,968 | 157,444 |
| Shares converted from Investor Class (See Note 1) | (15,164) | (296,241) |
| Net increase (decrease) | (21,144) | $ (416,174) |
| Year ended October 31, 2022: | | |
| Shares sold | 38,014 | $ 744,939 |
| Shares issued to shareholders in reinvestment of distributions | 9,889 | 187,826 |
| Shares redeemed | (48,380) | (945,633) |
| Net increase (decrease) in shares outstanding before conversion | (477) | (12,868) |
| Shares converted into Investor Class (See Note 1) | 8,890 | 173,952 |
| Shares converted from Investor Class (See Note 1) | (21,960) | (440,271) |
| Net increase (decrease) | (13,547) | $ (279,187) |
| |
| Class C | Shares | Amount |
| Year ended October 31, 2023: | | |
| Shares sold | 34,518 | $ 670,163 |
| Shares issued to shareholders in reinvestment of distributions | 11,357 | 222,244 |
| Shares redeemed | (405,654) | (7,904,116) |
| Net increase (decrease) in shares outstanding before conversion | (359,779) | (7,011,709) |
| Shares converted from Class C (See Note 1) | (15,575) | (305,574) |
| Net increase (decrease) | (375,354) | $ (7,317,283) |
| Year ended October 31, 2022: | | |
| Shares sold | 39,389 | $ 772,835 |
| Shares issued to shareholders in reinvestment of distributions | 14,494 | 276,826 |
| Shares redeemed | (556,835) | (10,852,716) |
| Net increase (decrease) in shares outstanding before conversion | (502,952) | (9,803,055) |
| Shares converted from Class C (See Note 1) | (17,249) | (334,287) |
| Net increase (decrease) | (520,201) | $ (10,137,342) |
| |
| Class I | Shares | Amount |
| Year ended October 31, 2023: | | |
| Shares sold | 4,785,433 | $ 93,311,010 |
| Shares issued to shareholders in reinvestment of distributions | 967,417 | 18,937,586 |
| Shares redeemed | (25,084,792) | (494,922,086) |
| Net increase (decrease) in shares outstanding before conversion | (19,331,942) | (382,673,490) |
| Shares converted into Class I (See Note 1) | 51,300 | 996,452 |
| Shares converted from Class I (See Note 1) | (3,327) | (63,951) |
| Net increase (decrease) | (19,283,969) | $(381,740,989) |
| Year ended October 31, 2022: | | |
| Shares sold | 9,092,022 | $ 175,816,550 |
| Shares issued to shareholders in reinvestment of distributions | 1,156,561 | 21,916,216 |
| Shares redeemed | (10,151,265) | (196,585,259) |
| Net increase (decrease) in shares outstanding before conversion | 97,318 | 1,147,507 |
| Shares converted into Class I (See Note 1) | 11,840 | 233,859 |
| Net increase (decrease) | 109,158 | $ 1,381,366 |
| |
| 30 | MainStay Epoch Global Equity Yield Fund |
| Class R2 | Shares | Amount |
| Year ended October 31, 2023: | | |
| Shares issued to shareholders in reinvestment of distributions | 299 | $ 5,881 |
| Shares redeemed | (896) | (17,100) |
| Net increase (decrease) | (597) | $ (11,219) |
| Year ended October 31, 2022: | | |
| Shares issued to shareholders in reinvestment of distributions | 245 | $ 4,681 |
| Shares redeemed | (5) | (100) |
| Net increase (decrease) | 240 | $ 4,581 |
| |
| Class R3 | Shares | Amount |
| Year ended October 31, 2023: | | |
| Shares sold | 10,400 | $ 205,116 |
| Shares issued to shareholders in reinvestment of distributions | 790 | 15,494 |
| Shares redeemed | (7,480) | (146,993) |
| Net increase (decrease) | 3,710 | $ 73,617 |
| Year ended October 31, 2022: | | |
| Shares sold | 7,812 | $ 153,343 |
| Shares issued to shareholders in reinvestment of distributions | 584 | 11,074 |
| Shares redeemed | (5,566) | (107,411) |
| Net increase (decrease) | 2,830 | $ 57,006 |
| |
| Class R6 | Shares | Amount |
| Year ended October 31, 2023: | | |
| Shares sold | 45,710 | $ 879,351 |
| Shares issued to shareholders in reinvestment of distributions | 8,444 | 163,592 |
| Shares redeemed | (325,406) | (6,371,449) |
| Net increase (decrease) | (271,252) | $ (5,328,506) |
| Year ended October 31, 2022: | | |
| Shares sold | 296,515 | $ 5,649,951 |
| Shares issued to shareholders in reinvestment of distributions | 3,985 | 71,762 |
| Shares redeemed | (14,048) | (273,251) |
| Net increase (decrease) | 286,452 | $ 5,448,462 |
Note 10–Other Matters
As of the date of this report, the Fund faces a heightened level of risk associated with current uncertainty, volatility and state of economies, financial markets, rising interest rates, and labor and health conditions around the world. Events such as war, acts of terrorism, recessions, rapid inflation, the imposition of international sanctions, earthquakes, hurricanes, epidemics and pandemics and other unforeseen natural or human disasters may have broad adverse social, political and economic effects on the global economy, which could negatively impact the value of the Fund's investments. Developments that disrupt global economies and financial markets may magnify factors that affect the Fund's performance.
Note 11–Subsequent Events
In connection with the preparation of the financial statements of the Fund as of and for the year ended October 31, 2023, events and transactions subsequent to October 31, 2023, through the date the financial statements were issued, have been evaluated by the Manager for possible adjustment and/or disclosure. No subsequent events requiring financial statement adjustment or disclosure have been identified.
Report of Independent Registered Public Accounting Firm
To the Shareholders of the Fund and Board of Trustees
MainStay Funds Trust:
Opinion on the Financial Statements
We have audited the accompanying statement of assets and liabilities of MainStay Epoch Global Equity Yield Fund (the Fund), one of the funds constituting MainStay Funds Trust, including the portfolio of investments, as of October 31, 2023, the related statement of operations for the year then ended, the statements of changes in net assets for each of the years in the two-year period then ended, and the related notes (collectively, the financial statements) and the financial highlights for each of the years in the five-year period then ended. In our opinion, the financial statements and financial highlights present fairly, in all material respects, the financial position of the Fund as of October 31, 2023, the results of its operations for the year then ended, the changes in its net assets for each of the years in the two-year period then ended, and the financial highlights for each of the years in the five-year period then ended, in conformity with U.S. generally accepted accounting principles.
Basis for Opinion
These financial statements and financial highlights are the responsibility of the Fund's management. Our responsibility is to express an opinion on these financial statements and financial highlights based on our audits. We are a public accounting firm registered with the Public Company Accounting Oversight Board (United States) (PCAOB) and are required to be independent with respect to the Fund in accordance with the U.S. federal securities laws and the applicable rules and regulations of the Securities and Exchange Commission and the PCAOB.
We conducted our audits in accordance with the standards of the PCAOB. Those standards require that we plan and perform the audit to obtain reasonable assurance about whether the financial statements and financial highlights are free of material misstatement, whether due to error or fraud. Our audits included performing procedures to assess the risks of material misstatement of the financial statements and financial highlights, whether due to error or fraud, and performing procedures that respond to those risks. Such procedures included examining, on a test basis, evidence regarding the amounts and disclosures in the financial statements and financial highlights. Such procedures also included confirmation of securities owned as of October 31, 2023, by correspondence with the custodians and the transfer agent. Our audits also included evaluating the accounting principles used and significant estimates made by management, as well as evaluating the overall presentation of the financial statements and financial highlights. We believe that our audits provide a reasonable basis for our opinion.

We have served as the auditor of one or more New York Life Investment Management investment companies since 2003.
Philadelphia, Pennsylvania
December 22, 2023
| 32 | MainStay Epoch Global Equity Yield Fund |
Federal Income Tax Information
(Unaudited)
The Fund is required under the Internal Revenue Code to advise shareholders in a written statement as to the federal tax status of dividends paid by the Fund during such fiscal years.
For the fiscal year ended October 31, 2023, the Fund designated approximately $25,671,191 under the Internal Revenue Code as qualified dividend income eligible for reduced tax rates.
The dividends paid by the Fund during the fiscal year ended October 31, 2023 should be multiplied by 63.32% to arrive at the amount eligible for the corporate dividend-received deduction.
In February 2024, shareholders will receive an IRS Form 1099-DIV or substitute Form 1099, which will show the federal tax status of the distributions received by shareholders in calendar year 2023. The amounts that will be reported on such 1099-DIV or substitute Form 1099 will be the amounts you are to use on your federal income tax return and will differ from the amounts which we must report for the Fund's fiscal year ended October 31, 2023.
Proxy Voting Policies and Procedures and Proxy Voting Record
The Fund is required to file with the SEC its proxy voting record for the 12-month period ending June 30 on Form N-PX. A description of the policies and procedures that are used to vote proxies relating to portfolio securities of the Fund is available free of charge upon request by calling 800-624-6782 or visiting the SEC’s website at www.sec.gov. The most recent Form N-PX or proxy voting record is available free of charge upon request by calling 800-624-6782; visiting newyorklifeinvestments.com; or visiting the SEC’s website at www.sec.gov.
Shareholder Reports and Quarterly Portfolio Disclosure
The Fund is required to file its complete schedule of portfolio holdings with the SEC 60 days after its first and third fiscal quarter on Form N-PORT. The Fund's holdings report is available free of charge upon request by calling New York Life Investments at 800-624-6782.
Board of Trustees and Officers (Unaudited)
The Trustees and officers of the Fund are listed below. The Board oversees the MainStay Group of Funds (which consists of MainStay Funds and MainStay Funds Trust), MainStay VP Funds Trust, MainStay MacKay DefinedTerm Municipal Opportunities Fund, MainStay CBRE Global Infrastructure Megatrends Term Fund, the Manager and the Subadvisors, and elects the officers of the Funds who are responsible for the day-to-day operations of the Fund. Information pertaining to the Trustees and officers is set forth below. Each Trustee serves until his or her successor is elected and qualified or until his or her resignation, death or
removal. Under the Board’s retirement policy, unless an exception is made, a Trustee must tender his or her resignation by the end of the calendar year during which he or she reaches the age of 75. Officers are elected annually by the Board. The business address of each Trustee and officer listed below is 51 Madison Avenue, New York, New York 10010. A majority of the Trustees are not “interested persons” (as defined by the 1940 Act and rules adopted by the SEC thereunder) of the Fund (“Independent Trustees”).
| | Name and
Year of Birth | Term of Office,
Position(s) Held and
Length of Service | Principal Occupation(s)
During Past Five Years | Number of
Portfolios in
Fund Complex
Overseen by
Trustee | Other Directorships
Held by Trustee |
| | | | | | |
| | Naïm Abou-Jaoudé*
1966 | MainStay Funds: Trustee
since 2023
MainStay Funds Trust:
Trustee since 2023 | Chief Executive Officer of New York Life Investment Management LLC (since 2023). Chief Executive Officer of Candriam (an affiliate of New York Life Investment Management LLC) (2007 to 2023). | 81 | MainStay VP Funds Trust:
Trustee since 2023 (31 portfolios);
MainStay MacKay DefinedTerm Municipal Opportunities Fund: Trustee
since 2023;
MainStay CBRE Global Infrastructure Megatrends Term Fund: Trustee
since 2023; and
New York Life Investment Management International (Chair) since 2015 |
| * | This Trustee is considered to be an “interested person” of the MainStay Group of Funds, MainStay VP Funds Trust, MainStay CBRE Global Infrastructure Megatrends Term Fund and MainStay MacKay DefinedTerm Municipal Opportunities Fund, within the meaning of the 1940 Act because of his affiliation with New York Life Investment Management LLC and Candriam, as described in detail above in the column entitled “Principal Occupation(s) During Past Five Years.” |
| | |
| 34 | MainStay Epoch Global Equity Yield Fund |
| | Name and
Year of Birth | Term of Office,
Position(s) Held and
Length of Service | Principal Occupation(s)
During Past Five Years | Number of
Portfolios in
Fund Complex
Overseen by
Trustee | Other Directorships
Held by Trustee |
| | | | | | |
| | David H. Chow
1957 | MainStay Funds: Trustee since January 2016, Advisory Board Member (June 2015 to December 2015);MainStay Funds Trust:
Trustee since January 2016, Advisory Board Member (June 2015 to December 2015) | Founder and CEO, DanCourt Management, LLC (since 1999) | 81 | MainStay VP Funds Trust: Trustee since January 2016, Advisory Board Member (June 2015 to December 2015) (31 portfolios);
MainStay MacKay DefinedTerm Municipal Opportunities Fund: Trustee since January 2016, Advisory Board Member (June 2015 to December 2015);
MainStay CBRE Global Infrastructure Megatrends Term Fund: Trustee since 2021;
VanEck Vectors Group of Exchange-Traded Funds: Trustee since 2006 and Independent Chairman of the Board of Trustees from 2008 to 2022 (57 portfolios); and
Berea College of Kentucky: Trustee since 2009, Chair of the Investment Committee since 2018 |
| | Karen Hammond
1956 | MainStay Funds: Trustee since December 2021, Advisory Board Member (June 2021 to December 2021);MainStay Funds Trust:
Trustee since December 2021, Advisory Board Member (June 2021 to December 2021)
| Retired, Managing Director, Devonshire Investors (2007 to 2013); Senior Vice President, Fidelity Management & Research Co. (2005 to 2007); Senior Vice President and Corporate Treasurer, FMR Corp. (2003 to 2005); Chief Operating Officer, Fidelity Investments Japan (2001 to 2003) | 81 | MainStay VP Funds Trust: Trustee since December 2021, Advisory Board Member (June 2021 to December 2021) (31 portfolios);
MainStay MacKay DefinedTerm Municipal Opportunities Fund: Trustee since December 2021, Advisory Board Member (June 2021 to December 2021);
MainStay CBRE Global Infrastructure Megatrends Term Fund: Trustee since December 2021, Advisory Board Member (June 2021 to December 2021);
Two Harbors Investment Corp.: Director since 2018;
Rhode Island State Investment Commission: Member since 2017; and
Blue Cross Blue Shield of Rhode Island: Director since 2019 |
| | Susan B. Kerley
1951 | MainStay Funds: Chair since January 2017 and Trustee since 2007;MainStay Funds Trust:
Chair since January 2017 and Trustee since 1990*** | President, Strategic Management Advisors LLC (since 1990) | 81 | MainStay VP Funds Trust: Chair since January 2017 and Trustee since 2007 (31 portfolios)**;
MainStay MacKay DefinedTerm Municipal Opportunities Fund: Chair since January 2017 and Trustee since 2011;
MainStay CBRE Global Infrastructure Megatrends Term Fund: Trustee since June 2021; and
Legg Mason Partners Funds: Trustee since 1991 (45 portfolios) |
Board of Trustees and Officers (Unaudited) (continued)
| | Name and
Year of Birth | Term of Office,
Position(s) Held and
Length of Service | Principal Occupation(s)
During Past Five Years | Number of
Portfolios in
Fund Complex
Overseen by
Trustee | Other Directorships
Held by Trustee |
| | | | | | |
| | Alan R. Latshaw
1951 | MainStay Funds: Trusteesince 2006;MainStay Funds Trust:
Trustee since 2007*** | Retired; Partner, Ernst & Young LLP (2002 to 2003); Partner, Arthur Andersen LLP (1989 to 2002); Consultant to the MainStay Funds Audit and Compliance Committee (2004 to 2006) | 81 | MainStay VP Funds Trust: Trustee since 2007 (31 portfolios)**;
MainStay MacKay DefinedTerm Municipal Opportunities Fund: Trustee since 2011; and
MainStay CBRE Global Infrastructure Megatrends Term Fund: Trustee since June 2021 |
| | Jacques P. Perold
1958 | MainStay Funds: Trustee since January 2016, Advisory Board Member (June 2015to December 2015);MainStay Funds Trust:
Trustee since January 2016, Advisory Board Member (June 2015 to December 2015) | Founder and Chief Executive Officer, CapShift Advisors LLC (since 2018); President, Fidelity Management & Research Company (2009 to 2014); President and Chief Investment Officer, Geode Capital Management, LLC (2001 to 2009) | 81 | MainStay VP Funds Trust: Trustee since January 2016, Advisory Board Member (June 2015 to December 2015) (31 portfolios);
MainStay MacKay DefinedTerm Municipal Opportunities Fund: Trustee since January 2016, Advisory Board Member (June 2015 to December 2015);
MainStay CBRE Global Infrastructure Megatrends Term Fund: Trustee since June 2021;
Allstate Corporation: Director since 2015; and
MSCI Inc.: Director since 2017 |
| | Richard S. Trutanic
1952 | MainStay Funds: Trustee since 1994;MainStay Funds Trust:
Trustee since 2007*** | Chairman and Chief Executive Officer, Somerset & Company (financial advisory firm) (since 2004); Managing Director, The Carlyle Group (private investment firm) (2002 to 2004); Senior Managing Director, Partner and Board Member, Groupe Arnault S.A. (private investment firm) (1999 to 2002) | 81 | MainStay VP Funds Trust: Trustee since 2007 (31 portfolios)**;
MainStay MacKay DefinedTerm Municipal Opportunities Fund: Trustee since 2011; and
MainStay CBRE Global Infrastructure Megatrends Term Fund: Trustee since June 2021 |
| ** | Includes prior service as a Director of MainStay VP Series Fund, Inc., the predecessor to MainStay VP Funds Trust. |
| *** | Includes prior service as a Director/Trustee of certain predecessor entities to MainStay Funds Trust. |
| 36 | MainStay Epoch Global Equity Yield Fund |
| | Name and
Year of Birth | Position(s) Held and
Length of Service | Principal Occupation(s)
During Past Five Years | |
| | | | | |
| | Kirk C. Lehneis
1974 | President, MainStay Funds, MainStay Funds Trust (since 2017) | Chief Operating Officer and Senior Managing Director (since 2016), New York Life Investment Management LLC and New York Life Investment Management Holdings LLC; Member of the Board of Managers (since 2017) and Senior Managing Director (since 2018), NYLIFE Distributors LLC; Chairman of the Board and Senior Managing Director, NYLIM Service Company LLC (since 2017); Trustee, President and Principal Executive Officer of IndexIQ Trust, IndexIQ ETF Trust and IndexIQ Active ETF Trust (since 2018); President, MainStay CBRE Global Infrastructure Megatrends Term Fund (since 2021), MainStay MacKay DefinedTerm Municipal Opportunities Fund and MainStay VP Funds Trust (since 2017)**; Senior Managing Director, Global Product Development (2015 to 2016); Managing Director, Product Development (2010 to 2015), New York Life Investment Management LLC | |
| | Jack R. Benintende
1964 | Treasurer and Principal Financial and Accounting Officer, MainStay Funds (since 2007), MainStay Funds Trust (since 2009) | Managing Director, New York Life Investment Management LLC (since 2007); Treasurer and Principal Financial and Accounting Officer, MainStay CBRE Global Infrastructure Megatrends Term Fund (since 2021), MainStay MacKay DefinedTerm Municipal Opportunities Fund (since 2011) and MainStay VP Funds Trust (since 2007)**; and Assistant Treasurer, New York Life Investment Management Holdings LLC (2008 to 2012) | |
| | J. Kevin Gao
1967 | Secretary and Chief Legal Officer, MainStay Funds and MainStay Funds Trust (since 2010) | Managing Director and Associate General Counsel, New York Life Investment Management LLC (since 2010); Secretary and Chief Legal Officer, MainStay CBRE Global Infrastructure Megatrends Term Fund (since 2021), MainStay MacKay DefinedTerm Municipal Opportunities Fund (since 2011) and MainStay VP Funds Trust (since 2010)** | |
| | Kevin M. Gleason
1967 | Vice President and Chief Compliance Officer, MainStay Funds and MainStay Funds Trust (since June 2022) | Vice President and Chief Compliance Officer, IndexIQ Trust, IndexIQ ETF Trust and Index IQ Active ETF Trust (since June 2022); Vice President and Chief Compliance Officer, MainStay CBRE Global Infrastructure Megatrends Term Fund, MainStay VP Funds Trust and MainStay MacKay DefinedTerm Municipal Opportunities Fund (since June 2022); Senior Vice President, Voya Investment Management and Chief Compliance Officer, Voya Family of Funds (2012 to 2022) | |
| | Scott T. Harrington
1959 | Vice President— Administration, MainStay Funds (since 2005), MainStay Funds Trust (since 2009) | Managing Director, New York Life Investment Management LLC (including predecessor advisory organizations) (since 2000); Member of the Board of Directors, New York Life Trust Company (since 2009); Vice President—Administration, MainStay CBRE Global Infrastructure Megatrends Term Fund (since 2021), MainStay MacKay DefinedTerm Municipal Opportunities Fund (since 2011) and MainStay VP Funds Trust (since 2005)** | |
| * | The officers listed above are considered to be “interested persons” of the MainStay Group of Funds, MainStay VP Funds Trust, MainStay CBRE Global Infrastructure Megatrends Term Fund and MainStay MacKay DefinedTerm Municipal Opportunities Fund within the meaning of the 1940 Act because of their affiliation with the MainStay Group of Funds, New York Life Insurance Company and/or its affiliates, including New York Life Investment Management LLC, New York Life Insurance Company, NYLIM Service Company LLC, NYLIFE Securities LLC and/or NYLIFE Distributors LLC, as described in detail in the column captioned “Principal Occupation(s) During Past Five Years.” Officers are elected annually by the Board. |
| ** | Includes prior service as an Officer of MainStay VP Series Fund, Inc., the predecessor to MainStay VP Funds Trust. |
Officers of the Trust (Who are not Trustees)*
This page intentionally left blank.
Equity
U.S. Equity
MainStay Epoch U.S. Equity Yield Fund
MainStay Fiera SMID Growth Fund
MainStay PineStone U.S. Equity Fund
MainStay S&P 500 Index Fund
MainStay Winslow Large Cap Growth Fund
MainStay WMC Enduring Capital Fund
MainStay WMC Growth Fund
MainStay WMC Small Companies Fund
MainStay WMC Value Fund
International Equity
MainStay Epoch International Choice Fund
MainStay PineStone International Equity Fund
MainStay WMC International Research Equity Fund
Emerging Markets Equity
MainStay Candriam Emerging Markets Equity Fund
Global Equity
MainStay Epoch Capital Growth Fund
MainStay Epoch Global Equity Yield Fund
MainStay PineStone Global Equity Fund
Fixed Income
Taxable Income
MainStay Candriam Emerging Markets Debt Fund
MainStay Floating Rate Fund
MainStay MacKay High Yield Corporate Bond Fund
MainStay MacKay Short Duration High Yield Fund
MainStay MacKay Strategic Bond Fund
MainStay MacKay Total Return Bond Fund
MainStay MacKay U.S. Infrastructure Bond Fund
MainStay Short Term Bond Fund
Tax-Exempt Income
MainStay MacKay California Tax Free Opportunities Fund1
MainStay MacKay High Yield Municipal Bond Fund
MainStay MacKay New York Tax Free Opportunities Fund2
MainStay MacKay Short Term Municipal Fund
MainStay MacKay Strategic Municipal Allocation Fund
MainStay MacKay Tax Free Bond Fund
Money Market
MainStay Money Market Fund
Mixed Asset
MainStay Balanced Fund
MainStay Income Builder Fund
MainStay MacKay Convertible Fund
Speciality
MainStay CBRE Global Infrastructure Fund
MainStay CBRE Real Estate Fund
MainStay Cushing MLP Premier Fund
Asset Allocation
MainStay Conservative Allocation Fund
MainStay Conservative ETF Allocation Fund
MainStay Defensive ETF Allocation Fund
MainStay Equity Allocation Fund
MainStay Equity ETF Allocation Fund
MainStay ESG Multi-Asset Allocation Fund
MainStay Growth Allocation Fund
MainStay Growth ETF Allocation Fund
MainStay Moderate Allocation Fund
MainStay Moderate ETF Allocation Fund
Manager
New York Life Investment Management LLC
New York, New York
Subadvisors
Candriam3
Strassen, Luxembourg
CBRE Investment Management Listed Real Assets LLC
Radnor, Pennsylvania
Cushing Asset Management, LP
Dallas, Texas
Epoch Investment Partners, Inc.
New York, New York
Fiera Capital Inc.
New York, New York
IndexIQ Advisors LLC3
New York, New York
MacKay Shields LLC3
New York, New York
NYL Investors LLC3
New York, New York
PineStone Asset Management Inc.
Montreal, Québec
Wellington Management Company LLP
Boston, Massachusetts
Winslow Capital Management, LLC
Minneapolis, Minnesota
Legal Counsel
Dechert LLP
Washington, District of Columbia
Independent Registered Public Accounting Firm
KPMG LLP
Philadelphia, Pennsylvania
Distributor
NYLIFE Distributors LLC3
Jersey City, New Jersey
Custodian
JPMorgan Chase Bank, N.A.
New York, New York
1.
This Fund is registered for sale in AZ, CA, NV, OR, TX, UT, WA and MI (Class A and Class I shares only), and CO, FL, GA, HI, ID, MA, MD, NH, NJ and NY (Class I shares only).
| 2. | This Fund is registered for sale in CA, CT, DE, FL, MA, NJ, NY and VT. |
| 3. | An affiliate of New York Life Investment Management LLC. |
Not part of the Annual Report
For more information
800-624-6782
newyorklifeinvestments.com
“New York Life Investments” is both a service mark, and the common trade name, of certain investment advisors affiliated with New York Life Insurance Company. The MainStay Funds® are managed by New York Life Investment Management LLC and distributed by NYLIFE Distributors LLC, 30 Hudson Street, Jersey City, NJ 07302, a wholly owned subsidiary of New York Life Insurance Company. NYLIFE Distributors LLC is a Member FINRA/SIPC.
©2023 NYLIFE Distributors LLC. All rights reserved.
| 5013736MS139-23 | MSEGE11-12/23 |
(NYLIM) NL241
MainStay Epoch International Choice Fund
Message from the President and Annual Report
October 31, 2023
Special Notice:
Beginning in July 2024, new regulations issued by the Securities and Exchange Commission (SEC) will take effect requiring open-end mutual fund companies and ETFs to (1) overhaul the content of their shareholder reports and (2) mail paper copies of the new tailored shareholder reports to shareholders who have not opted to receive these documents electronically.
If you have not yet elected to receive your shareholder reports electronically, please contact your financial intermediary or visit newyorklifeinvestments.com/accounts.
| Not FDIC/NCUA Insured | Not a Deposit | May Lose Value | No Bank Guarantee | Not Insured by Any Government Agency |
This page intentionally left blank
Message from the President
Volatile economic and geopolitical forces drove market behavior during the 12-month reporting period ended October 31, 2023. While equity markets generally gained ground, bond prices trended broadly lower.
Although the war in Ukraine, the outbreak of hostilities in the Middle East and several other notable events affected financial assets, inflation and interest rate trends stood at the forefront of market developments during most of the period. As the reporting period began, high levels of inflation already showed signs of easing in the face of aggressive rate hikes by the U.S. Federal Reserve (the “Fed”). From a peak of 9.1% in June 2022, the annualized U.S. inflation rate dropped to 7.1% in November 2022, and to 3.2% in October 2023. At the same time, the Fed increased the benchmark federal funds rate from 3.75%–4.00% at the beginning of the reporting period to 5.25%–5.50% as of October 31, 2023. As the pace of rate increases slowed during the period, investors hoped for an early shift to a looser monetary policy. However, comments from Fed members late in the period reinforced the central bank’s hawkish stance in response to surprisingly robust U.S. economic growth and rising wage pressures, thus increasing the likelihood that interest rates would stay higher for longer. International developed markets exhibited similar dynamics of elevated inflation and rising interest rates.
Despite the backdrop of high interest rates—along with political dysfunction in Washington D.C. and intensifying global geopolitical instability—equity markets managed to advance, supported by healthy consumer spending trends and persistent domestic economic growth. The S&P 500® Index, a widely regarded benchmark of large-cap U.S. market performance, gained ground, bolstered by the strong performance of energy stocks amid surging petroleum prices and mega-cap, growth-oriented, technology-related shares, which rose as investors flocked to companies creating the infrastructure for developments in artificial intelligence. Smaller-cap stocks and value-oriented shares produced milder returns. Among industry sectors, energy and
information technology posted the strongest gains. Real estate declined most sharply under pressure from rising mortgage rates and weak levels of office occupancy. Developed international markets outperformed U.S. markets, with Europe benefiting during the first half of the period from unexpected economic resilience in the face of rising energy prices and the ongoing war in Ukraine. Emerging markets posted positive results but lagged developed markets, largely due to slow economic growth in China despite the relaxation of pandemic-era lockdowns.
Bond prices were driven lower by rising yields and increasing expectations of high interest rates for an extended period of time. The U.S. yield curve steepened, with the 30-year Treasury yield exceeding 5% for the first time in more than a decade. The yield curve remained inverted, with the 10-year Treasury yield ending the period at 4.88%, compared with 5.07% for the 2-year Treasury yield. Corporate bonds outperformed long-term Treasury bonds, but still trended lower under pressure from rising yields and an uptick in default rates. Among corporates, lower-credit-quality instruments performed slightly better than their higher-credit-quality counterparts, while floating rate securities performed better still.
In the face of today’s uncertain market environment, New York Life Investments remains dedicated to providing the guidance, resources and investment solutions you need to pursue your financial goals.
Thank you for trusting us to help meet your investment needs.
Sincerely,
Kirk C. Lehneis
President
The opinions expressed are as of the date of this report and are subject to change. There is no guarantee that any forecast made will come to pass. This material does not constitute investment advice and is not intended as an endorsement of any specific investment. Past performance is no guarantee of future results.
Not part of the Annual Report
Investors should refer to the Fund’s Summary Prospectus and/or Prospectus and consider the Fund’s investment objectives, strategies, risks, charges and expenses carefully before investing. The Summary Prospectus and/or Prospectus contain this and other information about the Fund. You may obtain copies of the Fund’s Summary Prospectus, Prospectus and Statement of Additional Information, which includes information about the MainStay Funds Trust's Trustees, free of charge, upon request, by calling toll-free 800-624-6782, by writing to NYLIFE Distributors LLC, Attn: MainStay Marketing Department, 30 Hudson Street, Jersey City, NJ 07302 or by sending an e-mail to MainStayShareholderServices@nylim.com. These documents are also available via the MainStay Funds’ website at newyorklifeinvestments.com. Please read the Fund’s Summary Prospectus and/or Prospectus carefully before investing.
Investment and Performance Comparison (Unaudited)
Performance data quoted represents past performance. Past performance is no guarantee of future results. Because of market volatility and other factors, current performance may be lower or higher than the figures shown. Investment return and principal value will fluctuate, and as a result, when shares are redeemed, they may be worth more or less than their original cost. The graph below depicts the historical performance of Class I shares of the Fund. Performance will vary from class to class based on differences in class-specific expenses and sales charges. For performance information current to the most recent month-end, please call 800-624-6782 or visit newyorklifeinvestments.com.
The performance table and graph do not reflect the deduction of taxes that a shareholder would pay on distributions or Fund share redemptions. Total returns reflect maximum applicable sales charges as indicated in the table below, if any, changes in share price, and reinvestment of dividend and capital gain distributions. The graph assumes the initial investment amount shown below and reflects the deduction of all sales charges that would have applied for the period of investment. Performance figures may reflect certain fee waivers and/or expense limitations, without which total returns may have been lower. For more information on share classes and current fee waivers and/or expense limitations (if any), please refer to the Notes to Financial Statements.
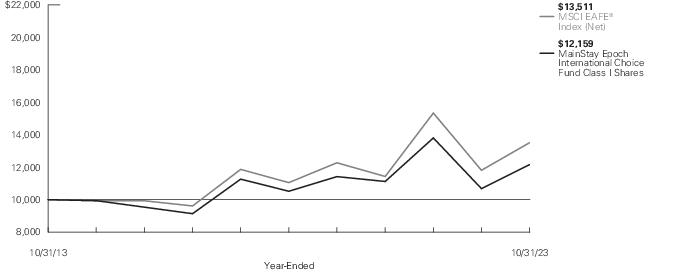
| Average Annual Total Returns for the Year-Ended October 31, 2023 |
| Class | Sales Charge | | Inception
Date | One
Year | Five
Years | Ten Years
or Since
Inception | Gross
Expense
Ratio1 |
| Class A Shares | Maximum 5.50% Initial Sales Charge | With sales charges | 9/1/2006 | 7.28% | 1.51% | 1.13% | 1.23% |
| | | Excluding sales charges | | 13.52 | 2.67 | 1.70 | 1.23 |
| Investor Class Shares2 | Maximum 5.00% Initial Sales Charge | With sales charges | 4/29/2008 | 7.53 | 1.24 | 0.91 | 1.63 |
| | | Excluding sales charges | | 13.19 | 2.39 | 1.49 | 1.63 |
| Class C Shares | Maximum 1.00% CDSC | With sales charges | 9/1/2006 | 11.33 | 1.63 | 0.70 | 2.38 |
| | if Redeemed Within One Year of Purchase | Excluding sales charges | | 12.33 | 1.63 | 0.70 | 2.38 |
| Class I Shares | No Sales Charge | | 12/31/1997 | 13.84 | 2.94 | 1.97 | 0.98 |
| Class R1 Shares3 | No Sales Charge | | 9/1/2006 | 13.73 | 2.83 | 1.87 | 1.08 |
| Class R2 Shares3 | No Sales Charge | | 9/1/2006 | 13.41 | 2.58 | 1.62 | 1.33 |
| Class R3 Shares3 | No Sales Charge | | 9/1/2006 | 13.13 | 2.30 | 1.35 | 1.58 |
| SIMPLE Class Shares | No Sales Charge | | 8/31/2020 | 13.10 | N/A | 0.01 | 1.62 |
| 1. | The gross expense ratios presented reflect the Fund’s “Total Annual Fund Operating Expenses” from the most recent Prospectus, as supplemented, and may differ from other expense ratios disclosed in this report. |
| 2. | Prior to June 30, 2020, the maximum initial sales charge was 5.50%, which is reflected in the applicable average annual total return figures shown. |
| 3. | As of October 31, 2023, Class R1, Class R2 and Class R3 shares are closed to new investors and, upon the close of business on December 29, 2023, Class R1, Class R2 and Class R3 shares are closed to additional investments by existing shareholders. Additionally, Class R1, Class R2 and Class R3 shares will be liquidated on or about February 28, 2024 (the "Liquidation Date"). It is expected that the Fund will distribute to remaining shareholders invested in Class R1, Class R2 or Class R3 shares, on or promptly after the Liquidation Date, a liquidating distribution in cash or cash equivalents equal to the net asset value of such shares.
|
The footnotes on the next page are an integral part of the table and graph and should be carefully read in conjunction with them.
| Benchmark Performance* | One
Year | Five
Years | Ten
Years |
| MSCI EAFE® Index (Net)1 | 14.40% | 4.10% | 3.05% |
| Morningstar Foreign Large Blend Category Average2 | 13.03 | 3.87 | 2.92 |
| * | Returns for indices reflect no deductions for fees, expenses or taxes, except for foreign withholding taxes where applicable. Results assume reinvestment of all dividends and capital gains. An investment cannot be made directly in an index. |
| 1. | The MSCI EAFE® Index (Net) is the Fund's primary broad-based securities market index for comparison purposes. The MSCI EAFE® Index (Net) consists of international stocks representing the developed world outside of North America. |
| 2. | The Morningstar Foreign Large Blend Category Average is representative of funds that invest in a variety of big international stocks. Most of these funds divide their assets among a dozen or more developed markets, including Japan, Britain, France, and Germany. These funds primarily invest in stocks that have market caps in the top 70% of each economically integrated market (such as Europe or Asia ex-Japan). The blend style is assigned to funds where neither growth nor value characteristics predominate. These funds typically will have less than 20% of assets invested in U.S. stocks. Results are based on average total returns of similar funds with all dividends and capital gain distributions reinvested. |
The footnotes on the preceding page are an integral part of the table and graph and should be carefully read in conjunction with them.
| 6 | MainStay Epoch International Choice Fund |
Cost in Dollars of a $1,000 Investment in MainStay Epoch International Choice Fund (Unaudited)
The example below is intended to describe the fees and expenses borne by shareholders during the six-month period from May 1, 2023 to October 31, 2023, and the impact of those costs on your investment.
Example
As a shareholder of the Fund you incur two types of costs: (1) transaction costs, including exchange fees and sales charges (loads) on purchases (as applicable), and (2) ongoing costs, including management fees, distribution and/or service (12b-1) fees and other Fund expenses (as applicable). This example is intended to help you understand your ongoing costs (in dollars) of investing in the Fund and to compare these costs with the ongoing costs of investing in other mutual funds. The example is based on an investment of $1,000 made at the beginning of the six-month period and held for the entire period from May 1, 2023 to October 31, 2023.
This example illustrates your Fund’s ongoing costs in two ways:
Actual Expenses
The second and third data columns in the table below provide information about actual account values and actual expenses. You may use the information in these columns, together with the amount you invested, to estimate the expenses that you paid during the six months ended October 31, 2023. Simply divide your account value by $1,000 (for example, an
$8,600 account value divided by $1,000 = 8.6), then multiply the result by the number under the heading entitled “Expenses Paid During Period” to estimate the expenses you paid on your account during this period.
Hypothetical Example for Comparison Purposes
The fourth and fifth data columns in the table below provide information about hypothetical account values and hypothetical expenses based on the Fund’s actual expense ratio and an assumed rate of return of 5% per year before expenses, which is not the Fund’s actual return. The hypothetical account values and expenses may not be used to estimate the actual ending account balances or expenses you paid for the six-month period shown. You may use this information to compare the ongoing costs of investing in the Fund with the ongoing costs of investing in other mutual funds. To do so, compare this 5% hypothetical example with the 5% hypothetical examples that appear in the shareholder reports of the other mutual funds.
Please note that the expenses shown in the table are meant to highlight your ongoing costs only and do not reflect any transactional costs, such as exchange fees or sales charges (loads). Therefore, the fourth and fifth data columns of the table are useful in comparing ongoing costs only and will not help you determine the relative total costs of owning different funds. In addition, if these transactional costs were included, your costs would have been higher.
| Share Class | Beginning
Account
Value
5/1/23 | Ending Account
Value (Based
on Actual
Returns and
Expenses)
10/31/23 | Expenses
Paid
During
Period1 | Ending Account
Value (Based
on Hypothetical
5% Annualized
Return and
Actual Expenses)
10/31/23 | Expenses
Paid
During
Period1 | Net Expense
Ratio
During
Period2 |
| Class A Shares | $1,000.00 | $904.30 | $ 5.86 | $1,019.05 | $ 6.21 | 1.22% |
| Investor Class Shares | $1,000.00 | $903.00 | $ 7.24 | $1,017.59 | $ 7.68 | 1.51% |
| Class C Shares | $1,000.00 | $899.50 | $10.82 | $1,013.81 | $11.47 | 2.26% |
| Class I Shares | $1,000.00 | $905.60 | $ 4.56 | $1,020.42 | $ 4.84 | 0.95% |
| Class R1 Shares | $1,000.00 | $905.20 | $ 5.04 | $1,019.91 | $ 5.35 | 1.05% |
| Class R2 Shares | $1,000.00 | $903.90 | $ 6.24 | $1,018.65 | $ 6.61 | 1.30% |
| Class R3 Shares | $1,000.00 | $902.80 | $ 7.53 | $1,017.29 | $ 7.98 | 1.57% |
| SIMPLE Class Shares | $1,000.00 | $903.20 | $ 7.05 | $1,017.79 | $ 7.48 | 1.47% |
| 1. | Expenses are equal to the Fund’s annualized expense ratio of each class multiplied by the average account value over the period, divided by 365 and multiplied by 184 (to reflect the six-month period). The table above represents the actual expenses incurred during the six-month period. In addition to the fees and expenses which the Fund bears directly, it also indirectly bears a pro rata share of the fees and expenses of the underlying funds in which it invests. Such indirect expenses are not included in the above-reported expense figures. |
| 2. | Expenses are equal to the Fund's annualized expense ratio to reflect the six-month period. |
Country Composition as of October 31, 2023 (Unaudited)
| United Kingdom | 23.6% |
| France | 18.5 |
| United States | 16.1 |
| Japan | 15.8 |
| Germany | 6.1 |
| Netherlands | 4.5 |
| Republic of Korea | 3.7 |
| Spain | 3.5% |
| Finland | 3.0 |
| Singapore | 2.0 |
| Sweden | 1.5 |
| Other Assets, Less Liabilities | 1.7 |
| | 100.0% |
See Portfolio of Investments beginning on page 11 for specific holdings within these categories. The Fund's holdings are subject to change.
Top Ten Holdings and/or Issuers Held as of October 31, 2023 (excluding short-term investments) (Unaudited)
| 1. | Keyence Corp. |
| 2. | Sony Group Corp. |
| 3. | Coca-Cola Europacific Partners plc |
| 4. | AstraZeneca plc, Sponsored ADR |
| 5. | Compass Group plc |
| 6. | Linde plc |
| 7. | Asahi Group Holdings Ltd. |
| 8. | Roche Holding AG |
| 9. | Samsung Electronics Co. Ltd. |
| 10. | TotalEnergies SE |
| 8 | MainStay Epoch International Choice Fund |
Portfolio Management Discussion and Analysis (Unaudited)
Questions answered by portfolio managers Michael A. Welhoelter, CFA, William J. Booth, CFA, and Glen Petraglia, CFA, of Epoch Investment Partners, Inc., the Fund’s Subadvisor.
How did MainStay Epoch International Choice Fund perform relative to its benchmark and peer group during the 12 months ended October 31, 2023?
For the 12 months ended October 31, 2023, Class I shares of MainStay Epoch International Choice Fund returned 13.84%, underperforming the 14.40% return of the Fund’s benchmark, the MSCI EAFE® Index (Net) (the “Index”). Over the same period, Class I shares outperformed the 13.03% return of the Morningstar Foreign Large Blend Category Average.1
What factors affected the Fund’s relative performance during the reporting period?
Equity markets produced relatively strong returns over the reporting period despite global economic and geopolitical challenges. All sectors delivered positive results, with seven sectors posting double-digit returns. China's great reopening proved a disappointment, with weak GDP growth and a rather fragile Chinese real estate market negatively affecting broader market sentiment and spending patterns. The ongoing war between Russia and Ukraine, along with the escalation of the conflict in the Middle East, impacted supply chains, energy markets and food supplies and, most importantly, imposed unmeasurable humanitarian costs. Central banks remained hawkish in an effort to tame inflation with elevated interest rates and much higher bond yields. The long and variable lags of monetary policy took a toll on growth rates in most countries.
The Fund underperformed the Index primarily due to unfavorable security selection in the health care sector.
During the reporting period, which sectors and/or countries were the strongest positive contributors to the Fund’s relative performance and which sectors and/or countries were particularly weak?
The sectors making the strongest positive contributions to the Fund’s performance relative to the Index included information technology, consumer staples, communication services and materials. (Contributions take weightings and total returns into account.) The strongest country contributions to relative performance came from holdings in the Netherlands, Spain and Sweden. As mentioned above, the health care sector detracted most significantly from relative returns. From a country perspective, the weakest contributions came from holdings in Japan, France, and the U.K.
During the reporting period, which individual stocks made the strongest positive contributions to the Fund’s absolute performance and which stocks detracted the most?
The Fund’s top contributors to absolute performance included shares in Switzerland-based reinsurer Swiss Re, Netherlands-based semiconductor equipment maker ASML and France-based energy provider TotalEnergies.
The Fund’s holdings in Swiss Re appreciated significantly during the reporting period, as the company reported better-than-expected earnings and revenues. We sold the Fund’s position on strength.
ASML shares recovered after weak performance in 2022, despite an industry-wide downturn in semiconductor equipment capital expenditures. As the dominant photolithography equipment supplier to the semiconductor chip industry (and the only manufacturer of the extreme ultraviolet equipment necessary to produce the most advanced semiconductors), ASML benefited from strong demand for high-end chips used in 5G communications and artificial intelligence (“AI”) hardware. ASML's technology has a near-insurmountable competitive advantage, thereby protecting the company's high margins and free cash flow.
TotalEnergies benefited from rising energy prices during the reporting period. The company explores and produces oil and gas, refines petroleum products, manufactures petrochemicals and operates gas stations. We believe TotalEnergies offers a balanced energy transition strategy that provides a good compromise between reducing its carbon footprint and delivering cash flow growth, while maintaining leverage to commodity upside. The company is committed to providing a stable and well-covered dividend with further benefits to shareholders through share buybacks.
During the same period, the three most significant detractors from the Fund’s absolute performance, all in the health care sector, included Switzerland-based pharmaceutical and diagnostics equipment company Roche, Australia-based biopharmaceutical developer CSL and France-based biotechnology equipment maker Sartorius Stedim Biotech.
Roche shares traded lower during the reporting period based on the unfavorable clinical trial results for an Alzheimer drug. In addition, management guided for a decline in top-line sales for fiscal year 2023. A diversified global manufacturer of branded pharmaceuticals and diagnostic equipment, Roche’s key therapeutic areas include oncology, immunology and neuroscience. The company also operates a very attractive diagnostics business. The business model provides earnings stability, and as of the end of the reporting period, shares trade at a reasonable valuation relative to our estimate of intrinsic value.
CSL focuses on rare diseases and influenza vaccines, and has a market-leading position in plasma-derived therapies, where products do not face patent cliffs. The share price proved relatively weak after the company provided disappointing guidance for 2024, and we reduced the Fund’s position size.
The Fund exited its position in Sartorius Stedim Biotech given the company’s soft business results and weaker guidance. Management lowered sales guidance and margins for fiscal 2023
| 1. | See "Investment and Performance Comparison" for other share class returns, which may be higher or lower than Class I share returns, and for more information on benchmark and peer group returns. |
due to the fadeout of pandemic-related sales and destocking trends, which lasted much longer than expected. We closed the position in favor of higher conviction investment opportunities.
What were some of the Fund’s largest purchases and sales during the reporting period?
The Fund’s most notable purchases during the reporting period included new positions in U.K.-based pharmaceutical company AstraZeneca, France-based regional bank BNP Paribas ("BNPP") and Germany-based residential real estate firm Vonovia.
AstraZeneca focuses on five primary areas: oncology, cardiovascular, renal and metabolism, respiratory and immunology, and rare disease. The key to the company’s superior research and development productivity is better target selection and target validation because of a strong focus on pharmacokinetics and pharmacodynamics. The company's pipeline is packed with many novel molecular entities and next-generation platform therapies with targeted drugs, along with other new modalities, such as antibody-drug conjugates, that position it to disrupt the biopharma industry. In our opinion, AstraZeneca’s prevailing share price does not reflect the risk-adjusted value of the company’s pipeline over the next several years. AstraZeneca generates high returns on invested capital, with a free cash flow yield of approximately 5%.
We took advantage of weakness in the financial services sector the spring of 2023 to build the Fund’s position in BNPP. The company conducts operations in approximately 74 countries, including all major international financial markets, and holds a leadership position in Europe. We expect BNPP to generate stable returns and grow organically, with further prospects for capital to be returned to shareholders through dividends and share buybacks. Management began to execute a €5 billion share buyback in 2023, in addition to the company’s regular, substantial cash dividend. BNPP’s capital position was improved by the timely sale of U.S. retail bank, Bank of the West, for $16.3 billion, giving BNPP a war chest for future investments and potential acquisitions at a time when the bank expects to benefit from rising interest rates. BNPP generates a respectable, high-single-digit return on equity. In our opinion, the current share price represents compelling value on various multiples, with a dividend yield greater than 6%.
Vonovia owns more than 550,000 residential units in Germany, Austria and Sweden, with a business model involving rent collection, property development, sales and value-added services to tenants. While the company’s stock declined in the first half of 2023 in response to rising interest rates and other financial pressures, performance improved in the third quarter of 2023, reflecting better-than-expected rental growth and management's focus on increasing balance sheet flexibility. We remain confident
in the company's ability to manage the business through the current, higher-rate environment.
During the same period, the Fund’s most significant sales included its full positions in chip maker Taiwan Semiconductor Manufacturing Company ("TSMC"), U.K.-based hospitality company InterContinental Hotels and Sartorius Stedim Biotech, the latter of which is described above. We sold the Fund’s position in TSMC on strength, after the share price appreciated substantially, and in recognition of the impact that U.S. sanctions on China could have on TSMC's future sales. We sold the Fund’s position in InterContinental Hotels on the heels of strong share-price appreciation following the post-pandemic surge in travel demand and hotel bookings.
How did the Fund’s sector and/or country weightings change during the reporting period?
The Fund’s largest increases in sector weight during the reporting period were in financials, health care and energy. Conversely, the Fund saw reductions in exposure to the information technology and communication services sectors. From a country perspective, the Fund experienced its largest increases in exposure to Japan, Sweden and South Korea, and its most significant reductions in exposure to France and Switzerland.
How was the Fund positioned at the end of the reporting period?
As of October 31, 2023, the Fund held its most overweight exposure relative to the Index in the information technology, consumer staples and consumer discretionary sectors. As of the same date, the Fund’s most underweight positions were in the financials, utilities and materials sectors. On a country basis, the Fund’s most notable overweight position was in France, while its most significantly underweight positions were in Japan and Australia.
The opinions expressed are those of the portfolio managers as of the date of this report and are subject to change. There is no guarantee that any forecasts will come to pass. This material does not constitute investment advice and is not intended as an endorsement of any specific investment.
| 10 | MainStay Epoch International Choice Fund |
Portfolio of Investments October 31, 2023†^
| | Shares | Value |
| Common Stocks 97.1% |
| Finland 3.0% |
| Nordea Bank Abp (Banks) | 551,884 | $ 5,799,443 |
| France 18.5% |
| Airbus SE (Aerospace & Defense) | 49,824 | 6,657,327 |
| AXA SA (Insurance) | 179,355 | 5,305,175 |
| BNP Paribas SA (Banks) | 96,345 | 5,534,466 |
| Edenred SE (Financial Services) | 59,407 | 3,158,013 |
| LVMH Moet Hennessy Louis Vuitton SE (Textiles, Apparel & Luxury Goods) | 6,203 | 4,427,009 |
| Pernod Ricard SA (Beverages) | 22,751 | 4,032,200 |
| TotalEnergies SE (Oil, Gas & Consumable Fuels) | 108,182 | 7,234,338 |
| | | 36,348,528 |
| Germany 6.1% |
| Deutsche Telekom AG (Registered) (Diversified Telecommunication Services) | 312,808 | 6,776,859 |
| Vonovia SE (Real Estate Management & Development) | 225,806 | 5,184,680 |
| | | 11,961,539 |
| Japan 15.8% |
| Asahi Group Holdings Ltd. (Beverages) | 216,600 | 7,768,020 |
| Hoya Corp. (Health Care Equipment & Supplies) | 55,000 | 5,201,550 |
| Keyence Corp. (Electronic Equipment, Instruments & Components) | 24,000 | 9,207,323 |
| Sony Group Corp. (Household Durables) | 108,000 | 8,853,043 |
| | | 31,029,936 |
| Netherlands 4.5% |
| ASML Holding NV (Semiconductors & Semiconductor Equipment) | 8,636 | 5,165,571 |
| NN Group NV (Insurance) | 115,653 | 3,702,990 |
| | | 8,868,561 |
| Republic of Korea 3.7% |
| Samsung Electronics Co. Ltd., GDR (Technology Hardware, Storage & Peripherals) | 5,900 | 7,351,400 |
| Singapore 2.0% |
| STMicroelectronics NV (Semiconductors & Semiconductor Equipment) | 100,829 | 3,838,604 |
| | Shares | | Value |
| |
| Spain 3.5% |
| Amadeus IT Group SA (Hotels, Restaurants & Leisure) | 74,063 | | $ 4,217,661 |
| Industria de Diseno Textil SA (Specialty Retail) (a) | 74,171 | | 2,554,535 |
| | | | 6,772,196 |
| Sweden 1.5% |
| Epiroc AB, Class A (Machinery) | 174,577 | | 2,869,879 |
| United Kingdom 23.6% |
| AstraZeneca plc, Sponsored ADR (Pharmaceuticals) | 136,900 | | 8,656,187 |
| BP plc (Oil, Gas & Consumable Fuels) | 828,885 | | 5,063,536 |
| Coca-Cola Europacific Partners plc (Beverages) | 148,387 | | 8,682,123 |
| Compass Group plc (Hotels, Restaurants & Leisure) | 328,542 | | 8,278,036 |
| Lloyds Banking Group plc (Banks) | 13,666,826 | | 6,634,571 |
| Rentokil Initial plc (Commercial Services & Supplies) | 582,194 | | 2,949,392 |
| Unilever plc (Personal Care Products) | 124,672 | | 5,893,102 |
| | | | 46,156,947 |
| United States 14.9% |
| CSL Ltd. (Biotechnology) | 29,761 | | 4,386,510 |
| Ferguson plc (Trading Companies & Distributors) | 30,262 | | 4,535,214 |
| Linde plc (Chemicals) | 21,607 | | 8,257,331 |
| Roche Holding AG (Pharmaceuticals) | 29,758 | | 7,650,096 |
| Schneider Electric SE (Electrical Equipment) | 28,998 | | 4,448,390 |
| | | | 29,277,541 |
Total Common Stocks
(Cost $193,024,886) | | | 190,274,574 |
| Short-Term Investment 1.2% |
| Affiliated Investment Company 1.2% |
| United States 1.2% |
| MainStay U.S. Government Liquidity Fund, 5.275% (b) | 2,331,774 | | 2,331,774 |
Total Short-Term Investment
(Cost $2,331,774) | | | 2,331,774 |
Total Investments
(Cost $195,356,660) | 98.3% | | 192,606,348 |
| Other Assets, Less Liabilities | 1.7 | | 3,362,233 |
| Net Assets | 100.0% | | $ 195,968,581 |
The notes to the financial statements are an integral part of, and should be read in conjunction with, the financial statements.
11
Portfolio of Investments October 31, 2023†^ (continued)
| † | Percentages indicated are based on Fund net assets. |
| ^ | Industry and country classifications may be different than those used for compliance monitoring purposes. |
| (a) | All or a portion of this security was held on loan. As of October 31, 2023, the aggregate market value of securities on loan was $2,554,500. The market value of the collateral held included non-cash collateral in the form of U.S. Treasury securities with a value of $2,771,324. (See Note 2(I)) |
| (b) | Current yield as of October 31, 2023. |
Investments in Affiliates (in 000's)
Investments in issuers considered to be affiliate(s) of the Fund during the year ended October 31, 2023 for purposes of Section 2(a)(3) of the Investment Company Act of 1940, as amended, were as follows:
| Affiliated Investment Companies | Value,
Beginning
of Year | Purchases
at Cost | Proceeds
from
Sales | Net
Realized
Gain/(Loss)
on Sales | Change in
Unrealized
Appreciation/
(Depreciation) | Value,
End of
Year | Dividend
Income | Other
Distributions | Shares
End of
Year |
| MainStay U.S. Government Liquidity Fund | $ 4,246 | $ 66,568 | $ (68,482) | $ — | $ — | $ 2,332 | $ 156 | $ — | 2,332 |
| Abbreviation(s): |
| ADR—American Depositary Receipt |
| GDR—Global Depositary Receipt |
The following is a summary of the fair valuations according to the inputs used as of October 31, 2023, for valuing the Fund’s assets:
| Description | Quoted
Prices in
Active
Markets for
Identical
Assets
(Level 1) | | Significant
Other
Observable
Inputs
(Level 2) | | Significant
Unobservable
Inputs
(Level 3) | | Total |
| Asset Valuation Inputs | | | | | | | |
| Investments in Securities (a) | | | | | | | |
| Common Stocks | $ 190,274,574 | | $ — | | $ — | | $ 190,274,574 |
| Short-Term Investment | | | | | | | |
| Affiliated Investment Company | 2,331,774 | | — | | — | | 2,331,774 |
| Total Investments in Securities | $ 192,606,348 | | $ — | | $ — | | $ 192,606,348 |
| (a) | For a complete listing of investments and their industries, see the Portfolio of Investments. |
The notes to the financial statements are an integral part of, and should be read in conjunction with, the financial statements.
| 12 | MainStay Epoch International Choice Fund |
The table below sets forth the diversification of the Fund’s investments by industry.
Industry Diversification
| | Value | | Percent †^ |
| Aerospace & Defense | $ 6,657,327 | | 3.4% |
| Banks | 17,968,480 | | 9.2 |
| Beverages | 20,482,343 | | 10.4 |
| Biotechnology | 4,386,510 | | 2.2 |
| Chemicals | 8,257,331 | | 4.2 |
| Commercial Services & Supplies | 2,949,392 | | 1.5 |
| Diversified Telecommunication Services | 6,776,859 | | 3.5 |
| Electrical Equipment | 4,448,390 | | 2.3 |
| Electronic Equipment, Instruments & Components | 9,207,323 | | 4.7 |
| Financial Services | 3,158,013 | | 1.6 |
| Health Care Equipment & Supplies | 5,201,550 | | 2.7 |
| Hotels, Restaurants & Leisure | 12,495,697 | | 6.4 |
| Household Durables | 8,853,043 | | 4.5 |
| Insurance | 9,008,165 | | 4.6 |
| Machinery | 2,869,879 | | 1.5 |
| Oil, Gas & Consumable Fuels | 12,297,874 | | 6.3 |
| Personal Care Products | 5,893,102 | | 3.0 |
| Pharmaceuticals | 16,306,283 | | 8.3 |
| Real Estate Management & Development | 5,184,680 | | 2.6 |
| Semiconductors & Semiconductor Equipment | 9,004,175 | | 4.6 |
| Specialty Retail | 2,554,535 | | 1.3 |
| Technology Hardware, Storage & Peripherals | 7,351,400 | | 3.7 |
| Textiles, Apparel & Luxury Goods | 4,427,009 | | 2.3 |
| Trading Companies & Distributors | 4,535,214 | | 2.3 |
| | 190,274,574 | | 97.1 |
| Short-Term Investment | 2,331,774 | | 1.2 |
| Other Assets, Less Liabilities | 3,362,233 | | 1.7 |
| Net Assets | $195,968,581 | | 100.0% |
| † | Percentages indicated are based on Fund net assets. |
| ^ | Industry classifications may be different than those used for compliance monitoring purposes. |
The notes to the financial statements are an integral part of, and should be read in conjunction with, the financial statements.
13
Statement of Assets and Liabilities as of October 31, 2023
| Assets |
Investment in unaffiliated securities, at value
(identified cost $193,024,886) including securities on loan of $2,554,500 | $190,274,574 |
Investment in affiliated investment companies, at value
(identified cost $2,331,774) | 2,331,774 |
Cash denominated in foreign currencies
(identified cost $1,055,496) | 1,055,701 |
| Receivables: | |
| Dividends | 2,515,123 |
| Fund shares sold | 6,991 |
| Securities lending | 149 |
| Other assets | 47,072 |
| Total assets | 196,231,384 |
| Liabilities |
| Due to custodian | 2,645 |
| Payables: | |
| Manager (See Note 3) | 133,374 |
| Fund shares redeemed | 58,982 |
| Transfer agent (See Note 3) | 25,389 |
| Custodian | 13,777 |
| Professional fees | 11,142 |
| NYLIFE Distributors (See Note 3) | 9,673 |
| Shareholder communication | 6,965 |
| Trustees | 24 |
| Accrued expenses | 832 |
| Total liabilities | 262,803 |
| Net assets | $195,968,581 |
| Composition of Net Assets |
| Shares of beneficial interest outstanding (par value of $.001 per share) unlimited number of shares authorized | $ 5,571 |
| Additional paid-in-capital | 262,292,945 |
| | 262,298,516 |
| Total distributable earnings (loss) | (66,329,935) |
| Net assets | $195,968,581 |
| Class A | |
| Net assets applicable to outstanding shares | $ 26,164,402 |
| Shares of beneficial interest outstanding | 744,019 |
| Net asset value per share outstanding | $ 35.17 |
| Maximum sales charge (5.50% of offering price) | 2.05 |
| Maximum offering price per share outstanding | $ 37.22 |
| Investor Class | |
| Net assets applicable to outstanding shares | $ 3,892,369 |
| Shares of beneficial interest outstanding | 110,951 |
| Net asset value per share outstanding | $ 35.08 |
| Maximum sales charge (5.00% of offering price) | 1.85 |
| Maximum offering price per share outstanding | $ 36.93 |
| Class C | |
| Net assets applicable to outstanding shares | $ 206,826 |
| Shares of beneficial interest outstanding | 6,005 |
| Net asset value and offering price per share outstanding | $ 34.44 |
| Class I | |
| Net assets applicable to outstanding shares | $157,911,063 |
| Shares of beneficial interest outstanding | 4,487,830 |
| Net asset value and offering price per share outstanding | $ 35.19 |
| Class R1 | |
| Net assets applicable to outstanding shares | $ 130,539 |
| Shares of beneficial interest outstanding | 3,716 |
| Net asset value and offering price per share outstanding | $ 35.13 |
| Class R2 | |
| Net assets applicable to outstanding shares | $ 5,205,778 |
| Shares of beneficial interest outstanding | 148,054 |
| Net asset value and offering price per share outstanding | $ 35.16 |
| Class R3 | |
| Net assets applicable to outstanding shares | $ 2,420,761 |
| Shares of beneficial interest outstanding | 69,306 |
| Net asset value and offering price per share outstanding | $ 34.93 |
| SIMPLE Class | |
| Net assets applicable to outstanding shares | $ 36,843 |
| Shares of beneficial interest outstanding | 1,050 |
| Net asset value and offering price per share outstanding(a) | $ 35.07 |
| (a) | The difference between the calculated and stated NAV was caused by rounding. |
The notes to the financial statements are an integral part of, and should be read in conjunction with, the financial statements.
| 14 | MainStay Epoch International Choice Fund |
Statement of Operations for the year ended October 31, 2023
| Investment Income (Loss) |
| Income | |
| Dividends-unaffiliated (net of foreign tax withholding of $586,509) | $ 5,576,200 |
| Dividends-affiliated | 156,129 |
| Securities lending, net | 3,157 |
| Total income | 5,735,486 |
| Expenses | |
| Manager (See Note 3) | 1,748,223 |
| Transfer agent (See Note 3) | 150,755 |
| Distribution/Service—Class A (See Note 3) | 68,518 |
| Distribution/Service—Investor Class (See Note 3) | 10,807 |
| Distribution/Service—Class C (See Note 3) | 3,065 |
| Distribution/Service—Class R2 (See Note 3) | 15,191 |
| Distribution/Service—Class R3 (See Note 3) | 13,985 |
| Distribution/Service—SIMPLE Class (See Note 3) | 179 |
| Registration | 103,855 |
| Professional fees | 86,664 |
| Custodian | 40,384 |
| Shareholder service (See Note 3) | 8,974 |
| Trustees | 5,534 |
| Shareholder communication | 4,934 |
| Miscellaneous | 7,449 |
| Total expenses before waiver/reimbursement | 2,268,517 |
| Expense waiver/reimbursement from Manager (See Note 3) | (50,666) |
| Reimbursement from prior custodian(a) | (444) |
| Net expenses | 2,217,407 |
| Net investment income (loss) | 3,518,079 |
| Realized and Unrealized Gain (Loss) |
| Net realized gain (loss) on: | |
| Unaffiliated investment transactions | 11,290,611 |
| Foreign currency transactions | (58,009) |
| Net realized gain (loss) | 11,232,602 |
| Net change in unrealized appreciation (depreciation) on: | |
| Unaffiliated investments | 14,485,472 |
| Translation of other assets and liabilities in foreign currencies | 278,652 |
| Net change in unrealized appreciation (depreciation) | 14,764,124 |
| Net realized and unrealized gain (loss) | 25,996,726 |
| Net increase (decrease) in net assets resulting from operations | $29,514,805 |
| (a) | Represents a refund for overbilling of custody fees. |
The notes to the financial statements are an integral part of, and should be read in conjunction with, the financial statements.
15
Statements of Changes in Net Assets
for the years ended October 31, 2023 and October 31, 2022
| | 2023 | 2022 |
| Increase (Decrease) in Net Assets |
| Operations: | | |
| Net investment income (loss) | $ 3,518,079 | $ 2,920,802 |
| Net realized gain (loss) | 11,232,602 | 1,022,038 |
| Net change in unrealized appreciation (depreciation) | 14,764,124 | (65,685,573) |
| Net increase (decrease) in net assets resulting from operations | 29,514,805 | (61,742,733) |
| Distributions to shareholders: | | |
| Class A | (204,408) | (609,561) |
| Investor Class | (28,190) | (106,243) |
| Class C | — | (4,372) |
| Class I | (2,313,006) | (6,137,693) |
| Class R1 | (374) | (3,987) |
| Class R2 | (52,601) | (192,553) |
| Class R3 | (14,715) | (78,119) |
| SIMPLE Class | (155) | (630) |
| Total distributions to shareholders | (2,613,449) | (7,133,158) |
| Capital share transactions: | | |
| Net proceeds from sales of shares | 14,480,791 | 16,723,170 |
| Net asset value of shares issued to shareholders in reinvestment of distributions | 2,592,955 | 7,075,921 |
| Cost of shares redeemed | (52,917,475) | (37,319,851) |
| Increase (decrease) in net assets derived from capital share transactions | (35,843,729) | (13,520,760) |
| Net increase (decrease) in net assets | (8,942,373) | (82,396,651) |
| Net Assets |
| Beginning of year | 204,910,954 | 287,307,605 |
| End of year | $195,968,581 | $204,910,954 |
The notes to the financial statements are an integral part of, and should be read in conjunction with, the financial statements.
| 16 | MainStay Epoch International Choice Fund |
Financial Highlights selected per share data and ratios
| | Year Ended October 31, |
| Class A | 2023 | | 2022 | | 2021 | | 2020 | | 2019 |
| Net asset value at beginning of year | $ 31.28 | | $ 41.50 | | $ 33.68 | | $ 35.57 | | $ 33.37 |
| Net investment income (loss) (a) | 0.54 | | 0.35 | | 0.34 | | 0.17 | | 0.74 |
| Net realized and unrealized gain (loss) | 3.68 | | (9.61) | | 7.66 | | (1.14) | | 1.96 |
| Total from investment operations | 4.22 | | (9.26) | | 8.00 | | (0.97) | | 2.70 |
| Less distributions: | | | | | | | | | |
| From net investment income | (0.33) | | (0.96) | | (0.18) | | (0.92) | | (0.50) |
| Net asset value at end of year | $ 35.17 | | $ 31.28 | | $ 41.50 | | $ 33.68 | | $ 35.57 |
| Total investment return (b) | 13.52% | | (22.84)%(c) | | 23.80% | | (2.87)% | | 8.30% |
| Ratios (to average net assets)/Supplemental Data: | | | | | | | | | |
| Net investment income (loss) | 1.44% | | 0.97% | | 0.83% | | 0.48% | | 2.19% |
| Net expenses (d) | 1.22% | | 1.23% | | 1.21% | | 1.20%(e) | | 1.19%(e) |
| Portfolio turnover rate | 34% | | 49% | | 43% | | 52% | | 47% |
| Net assets at end of year (in 000’s) | $ 26,164 | | $ 19,445 | | $ 26,613 | | $ 20,108 | | $ 23,114 |
| (a) | Per share data based on average shares outstanding during the year. |
| (b) | Total investment return is calculated exclusive of sales charges and assumes the reinvestment of dividends and distributions. For periods of less than one year, total return is not annualized. |
| (c) | In 2022, the Fund’s total investment return includes impact of payments from affiliates due to a trade communications error. Excluding these items, total return would have been (22.89)%. |
| (d) | In addition to the fees and expenses which the Fund bears directly, it also indirectly bears a pro-rata share of the fees and expenses of the underlying funds in which it invests. Such indirect expenses are not included in the above expense ratios. |
| (e) | Net of interest expense of less than 0.01%. |
| | Year Ended October 31, |
| Investor Class | 2023 | | 2022 | | 2021 | | 2020 | | 2019 |
| Net asset value at beginning of year | $ 31.20 | | $ 41.39 | | $ 33.60 | | $ 35.49 | | $ 33.30 |
| Net investment income (loss) (a) | 0.42 | | 0.24 | | 0.20 | | 0.08 | | 0.66 |
| Net realized and unrealized gain (loss) | 3.69 | | (9.60) | | 7.68 | | (1.13) | | 1.95 |
| Total from investment operations | 4.11 | | (9.36) | | 7.88 | | (1.05) | | 2.61 |
| Less distributions: | | | | | | | | | |
| From net investment income | (0.23) | | (0.83) | | (0.09) | | (0.84) | | (0.42) |
| Net asset value at end of year | $ 35.08 | | $ 31.20 | | $ 41.39 | | $ 33.60 | | $ 35.49 |
| Total investment return (b) | 13.19% | | (23.07)%(c) | | 23.48% | | (3.10)% | | 8.02% |
| Ratios (to average net assets)/Supplemental Data: | | | | | | | | | |
| Net investment income (loss) | 1.13% | | 0.67% | | 0.50% | | 0.23% | | 1.97% |
| Net expenses (d) | 1.51% | | 1.52% | | 1.50% | | 1.46%(e) | | 1.41%(e) |
| Expenses (before waiver/reimbursement) (d) | 1.68% | | 1.63% | | 1.59% | | 1.46%(e) | | 1.42%(e) |
| Portfolio turnover rate | 34% | | 49% | | 43% | | 52% | | 47% |
| Net assets at end of year (in 000's) | $ 3,892 | | $ 3,795 | | $ 5,341 | | $ 5,308 | | $ 6,306 |
| (a) | Per share data based on average shares outstanding during the year. |
| (b) | Total investment return is calculated exclusive of sales charges and assumes the reinvestment of dividends and distributions. For periods of less than one year, total return is not annualized. |
| (c) | In 2022, the Fund’s total investment return includes impact of payments from affiliates due to a trade communications error. Excluding these items, total return would have been (23.12)%. |
| (d) | In addition to the fees and expenses which the Fund bears directly, it also indirectly bears a pro-rata share of the fees and expenses of the underlying funds in which it invests. Such indirect expenses are not included in the above expense ratios. |
| (e) | Net of interest expense of less than 0.01%. |
The notes to the financial statements are an integral part of, and should be read in conjunction with, the financial statements.
17
Financial Highlights selected per share data and ratios
| | Year Ended October 31, |
| Class C | 2023 | | 2022 | | 2021 | | 2020 | | 2019 |
| Net asset value at beginning of year | $ 30.66 | | $ 40.33 | | $ 32.90 | | $ 34.73 | | $ 32.54 |
| Net investment income (loss) (a) | 0.14 | | (0.01) | | (0.28) | | (0.17) | | 0.42 |
| Net realized and unrealized gain (loss) | 3.64 | | (9.49) | | 7.71 | | (1.13) | | 1.92 |
| Total from investment operations | 3.78 | | (9.50) | | 7.43 | | (1.30) | | 2.34 |
| Less distributions: | | | | | | | | | |
| From net investment income | — | | (0.17) | | — | | (0.53) | | (0.15) |
| Net asset value at end of year | $ 34.44 | | $ 30.66 | | $ 40.33 | | $ 32.90 | | $ 34.73 |
| Total investment return (b) | 12.33% | | (23.66)%(c) | | 22.55% | | (3.81)% | | 7.25% |
| Ratios (to average net assets)/Supplemental Data: | | | | | | | | | |
| Net investment income (loss) | 0.38% | | (0.02)% | | (0.71)% | | (0.51)% | | 1.27% |
| Net expenses (d) | 2.26% | | 2.27% | | 2.25% | | 2.21%(e) | | 2.16%(e) |
| Expenses (before waiver/reimbursement) (d) | 2.43% | | 2.38% | | 2.28% | | 2.21%(e) | | 2.17%(e) |
| Portfolio turnover rate | 34% | | 49% | | 43% | | 52% | | 47% |
| Net assets at end of year (in 000’s) | $ 207 | | $ 339 | | $ 1,081 | | $ 4,740 | | $ 6,416 |
| (a) | Per share data based on average shares outstanding during the year. |
| (b) | Total investment return is calculated exclusive of sales charges and assumes the reinvestment of dividends and distributions. For periods of less than one year, total return is not annualized. |
| (c) | In 2022, the Fund’s total investment return includes impact of payments from affiliates due to a trade communications error. Excluding these items, total return would have been (23.71)%. |
| (d) | In addition to the fees and expenses which the Fund bears directly, it also indirectly bears a pro-rata share of the fees and expenses of the underlying funds in which it invests. Such indirect expenses are not included in the above expense ratios. |
| (e) | Net of interest expense of less than 0.01%. |
| | Year Ended October 31, |
| Class I | 2023 | | 2022 | | 2021 | | 2020 | | 2019 |
| Net asset value at beginning of year | $ 31.30 | | $ 41.52 | | $ 33.69 | | $ 35.58 | | $ 33.40 |
| Net investment income (loss) (a) | 0.62 | | 0.45 | | 0.40 | | 0.26 | | 0.80 |
| Net realized and unrealized gain (loss) | 3.71 | | (9.61) | | 7.70 | | (1.14) | | 1.98 |
| Total from investment operations | 4.33 | | (9.16) | | 8.10 | | (0.88) | | 2.78 |
| Less distributions: | | | | | | | | | |
| From net investment income | (0.44) | | (1.06) | | (0.27) | | (1.01) | | (0.60) |
| Net asset value at end of year | $ 35.19 | | $ 31.30 | | $ 41.52 | | $ 33.69 | | $ 35.58 |
| Total investment return (b) | 13.84% | | (22.63)%(c) | | 24.11% | | (2.61)% | | 8.57% |
| Ratios (to average net assets)/Supplemental Data: | | | | | | | | | |
| Net investment income (loss) | 1.67% | | 1.27% | | 0.99% | | 0.76% | | 2.40% |
| Net expenses (d) | 0.95% | | 0.95% | | 0.95% | | 0.95%(e) | | 0.94%(e) |
| Expenses (before waiver/reimbursement) (d) | 0.97% | | 0.98% | | 0.96% | | 0.96%(e) | | 0.94%(e) |
| Portfolio turnover rate | 34% | | 49% | | 43% | | 52% | | 47% |
| Net assets at end of year (in 000’s) | $ 157,911 | | $ 173,142 | | $ 241,084 | | $ 252,974 | | $ 355,348 |
| (a) | Per share data based on average shares outstanding during the year. |
| (b) | Total investment return is calculated exclusive of sales charges and assumes the reinvestment of dividends and distributions. Class I shares are not subject to sales charges. For periods of less than one year, total return is not annualized. |
| (c) | In 2022, the Fund’s total investment return includes impact of payments from affiliates due to a trade communications error. Excluding these items, total return would have been (22.68)%. |
| (d) | In addition to the fees and expenses which the Fund bears directly, it also indirectly bears a pro-rata share of the fees and expenses of the underlying funds in which it invests. Such indirect expenses are not included in the above expense ratios. |
| (e) | Net of interest expense of less than 0.01%. |
The notes to the financial statements are an integral part of, and should be read in conjunction with, the financial statements.
| 18 | MainStay Epoch International Choice Fund |
Financial Highlights selected per share data and ratios
| | Year Ended October 31, |
| Class R1 | 2023 | | 2022 | | 2021 | | 2020 | | 2019 |
| Net asset value at beginning of year | $ 31.20 | | $ 41.39 | | $ 33.60 | | $ 35.48 | | $ 33.30 |
| Net investment income (loss) (a) | 0.74 | | 0.48 | | 0.36 | | 0.21 | | 0.81 |
| Net realized and unrealized gain (loss) | 3.55 | | (9.67) | | 7.68 | | (1.12) | | 1.93 |
| Total from investment operations | 4.29 | | (9.19) | | 8.04 | | (0.91) | | 2.74 |
| Less distributions: | | | | | | | | | |
| From net investment income | (0.36) | | (1.00) | | (0.25) | | (0.97) | | (0.56) |
| Net asset value at end of year | $ 35.13 | | $ 31.20 | | $ 41.39 | | $ 33.60 | | $ 35.48 |
| Total investment return (b) | 13.73% | | (22.73)%(c) | | 24.00% | | (2.69)% | | 8.45% |
| Ratios (to average net assets)/Supplemental Data: | | | | | | | | | |
| Net investment income (loss) | 1.95% | | 1.29% | | 0.88% | | 0.63% | | 2.43% |
| Net expenses (d) | 1.05% | | 1.05% | | 1.05% | | 1.05%(e) | | 1.04%(e) |
| Expenses (before waiver/reimbursement) (d) | 1.07% | | 1.08% | | 1.06% | | 1.06%(e) | | 1.04%(e) |
| Portfolio turnover rate | 34% | | 49% | | 43% | | 52% | | 47% |
| Net assets at end of year (in 000’s) | $ 131 | | $ 32 | | $ 164 | | $ 201 | | $ 230 |
| (a) | Per share data based on average shares outstanding during the year. |
| (b) | Total investment return is calculated exclusive of sales charges and assumes the reinvestment of dividends and distributions. Class R1 shares are not subject to sales charges. For periods of less than one year, total return is not annualized. |
| (c) | In 2022, the Fund’s total investment return includes impact of payments from affiliates due to a trade communications error. Excluding these items, total return would have been (22.78)%. |
| (d) | In addition to the fees and expenses which the Fund bears directly, it also indirectly bears a pro-rata share of the fees and expenses of the underlying funds in which it invests. Such indirect expenses are not included in the above expense ratios. |
| (e) | Net of interest expense of less than 0.01%. |
| | Year Ended October 31, |
| Class R2 | 2023 | | 2022 | | 2021 | | 2020 | | 2019 |
| Net asset value at beginning of year | $ 31.26 | | $ 41.47 | | $ 33.65 | | $ 35.54 | | $ 33.33 |
| Net investment income (loss) (a) | 0.48 | | 0.33 | | 0.27 | | 0.13 | | 0.71 |
| Net realized and unrealized gain (loss) | 3.72 | | (9.63) | | 7.69 | | (1.14) | | 1.96 |
| Total from investment operations | 4.20 | | (9.30) | | 7.96 | | (1.01) | | 2.67 |
| Less distributions: | | | | | | | | | |
| From net investment income | (0.30) | | (0.91) | | (0.14) | | (0.88) | | (0.46) |
| Net asset value at end of year | $ 35.16 | | $ 31.26 | | $ 41.47 | | $ 33.65 | | $ 35.54 |
| Total investment return (b) | 13.41% | | (22.89)%(c) | | 23.69% | | (2.94)% | | 8.17% |
| Ratios (to average net assets)/Supplemental Data: | | | | | | | | | |
| Net investment income (loss) | 1.30% | | 0.93% | | 0.67% | | 0.39% | | 2.12% |
| Net expenses (d) | 1.30% | | 1.30% | | 1.30% | | 1.30%(e) | | 1.29%(e) |
| Expenses (before waiver/reimbursement) (d) | 1.32% | | 1.33% | | 1.31% | | 1.31%(e) | | 1.29%(e) |
| Portfolio turnover rate | 34% | | 49% | | 43% | | 52% | | 47% |
| Net assets at end of year (in 000’s) | $ 5,206 | | $ 5,657 | | $ 8,886 | | $ 7,827 | | $ 10,884 |
| (a) | Per share data based on average shares outstanding during the year. |
| (b) | Total investment return is calculated exclusive of sales charges and assumes the reinvestment of dividends and distributions. Class R2 shares are not subject to sales charges. For periods of less than one year, total return is not annualized. |
| (c) | In 2022, the Fund’s total investment return includes impact of payments from affiliates due to a trade communications error. Excluding these items, total return would have been (22.94)%. |
| (d) | In addition to the fees and expenses which the Fund bears directly, it also indirectly bears a pro-rata share of the fees and expenses of the underlying funds in which it invests. Such indirect expenses are not included in the above expense ratios. |
| (e) | Net of interest expense of less than 0.01%. |
The notes to the financial statements are an integral part of, and should be read in conjunction with, the financial statements.
19
Financial Highlights selected per share data and ratios
| | Year Ended October 31, |
| Class R3 | 2023 | | 2022 | | 2021 | | 2020 | | 2019 |
| Net asset value at beginning of year | $ 31.04 | | $ 41.18 | | $ 33.43 | | $ 35.31 | | $ 33.10 |
| Net investment income (loss) (a) | 0.39 | | 0.24 | | 0.17 | | 0.04 | | 0.62 |
| Net realized and unrealized gain (loss) | 3.69 | | (9.58) | | 7.64 | | (1.13) | | 1.95 |
| Total from investment operations | 4.08 | | (9.34) | | 7.81 | | (1.09) | | 2.57 |
| Less distributions: | | | | | | | | | |
| From net investment income | (0.19) | | (0.80) | | (0.06) | | (0.79) | | (0.36) |
| Net asset value at end of year | $ 34.93 | | $ 31.04 | | $ 41.18 | | $ 33.43 | | $ 35.31 |
| Total investment return (b) | 13.13% | | (23.13)%(c) | | 23.37% | | (3.21)% | | 7.90% |
| Ratios (to average net assets)/Supplemental Data: | | | | | | | | | |
| Net investment income (loss) | 1.07% | | 0.67% | | 0.41% | | 0.12% | | 1.85% |
| Net expenses (d) | 1.57% | | 1.58% | | 1.55% | | 1.55%(e) | | 1.54%(e) |
| Portfolio turnover rate | 34% | | 49% | | 43% | | 52% | | 47% |
| Net assets at end of year (in 000’s) | $ 2,421 | | $ 2,473 | | $ 4,104 | | $ 4,447 | | $ 5,134 |
| (a) | Per share data based on average shares outstanding during the year. |
| (b) | Total investment return is calculated exclusive of sales charges and assumes the reinvestment of dividends and distributions. Class R3 shares are not subject to sales charges. For periods of less than one year, total return is not annualized. |
| (c) | In 2022, the Fund’s total investment return includes impact of payments from affiliates due to a trade communications error. Excluding these items, total return would have been (23.18)%. |
| (d) | In addition to the fees and expenses which the Fund bears directly, it also indirectly bears a pro-rata share of the fees and expenses of the underlying funds in which it invests. Such indirect expenses are not included in the above expense ratios. |
| (e) | Net of interest expense of less than 0.01%. |
| | Year Ended October 31, | | August 31, 2020^ through
October 31, |
| SIMPLE Class | 2023 | | 2022 | | 2021 | | 2020 |
| Net asset value at beginning of period | $ 31.16 | | $ 41.39 | | $ 33.59 | | $ 35.90* |
| Net investment income (loss) (a) | 0.38 | | 0.14 | | 0.11 | | (0.02) |
| Net realized and unrealized gain (loss) | 3.70 | | (9.60) | | 7.69 | | (2.29) |
| Total from investment operations | 4.08 | | (9.46) | | 7.80 | | (2.31) |
| Less distributions: | | | | | | | |
| From net investment income | (0.17) | | (0.77) | | — | | — |
| Net asset value at end of period | $ 35.07 | | $ 31.16 | | $ 41.39 | | $ 33.59 |
| Total investment return (b) | 13.10% | | (23.26)%(c) | | 23.19% | | (6.43)% |
| Ratios (to average net assets)/Supplemental Data: | | | | | | | |
| Net investment income (loss) | 1.03% | | 0.40% | | 0.27% | | (0.29)% |
| Net expenses (d) | 1.58% | | 1.77% | | 1.74% | | 1.69%(e) |
| Expenses (before waiver/reimbursement) (d) | 1.58% | | 1.88% | | 1.86% | | 1.69%(e) |
| Portfolio turnover rate | 34% | | 49% | | 43% | | 52% |
| Net assets at end of period (in 000’s) | $ 37 | | $ 28 | | $ 34 | | $ 23 |
| ^ | Inception date. |
| * | Based on the net asset value of Investor Class as of August 31, 2020. |
| (a) | Per share data based on average shares outstanding during the period. |
| (b) | Total investment return is calculated exclusive of sales charges and assumes the reinvestment of dividends and distributions. SIMPLE Class shares are not subject to sales charges. For periods of less than one year, total return is not annualized. |
| (c) | In 2022, the Fund’s total investment return includes impact of payments from affiliates due to a trade communications error. Excluding these items, total return would have been (23.31)%. |
| (d) | In addition to the fees and expenses which the Fund bears directly, it also indirectly bears a pro-rata share of the fees and expenses of the underlying funds in which it invests. Such indirect expenses are not included in the above expense ratios. |
| (e) | Net of interest expense of less than 0.01%. |
The notes to the financial statements are an integral part of, and should be read in conjunction with, the financial statements.
| 20 | MainStay Epoch International Choice Fund |
Notes to Financial Statements
Note 1-Organization and Business
MainStay Funds Trust (the “Trust”) was organized as a Delaware statutory trust on April 28, 2009. The Trust is registered under the Investment Company Act of 1940, as amended (the “1940 Act”), as an open-end management investment company, and is comprised of thirty-seven funds (collectively referred to as the “Funds”). These financial statements and notes relate to the MainStay Epoch International Choice Fund (the "Fund"), a “diversified” fund, as that term is defined in the 1940 Act, as interpreted or modified by regulatory authorities having jurisdiction, from time to time.
The following table lists the Fund's share classes that have been registered and commenced operations:
| Class | Commenced Operations |
| Class A | September 1, 2006 |
| Investor Class | April 29, 2008 |
| Class C | September 1, 2006 |
| Class I | December 31, 1997 |
| Class R1* | September 1, 2006 |
| Class R2* | September 1, 2006 |
| Class R3* | September 1, 2006 |
| SIMPLE Class | August 31, 2020 |
| * | As of October 31, 2023, Class R1, Class R2 and Class R3 shares are closed to new investors and, upon the close of business on December 29, 2023, Class R1, Class R2 and Class R3 shares are closed to additional investments by existing shareholders. Additionally, Class R1, Class R2 and Class R3 shares will be liquidated on or about February 28, 2024 (the "Liquidation Date"). It is expected that the Fund will distribute to remaining shareholders invested in Class R1, Class R2 or Class R3 shares, on or promptly after the Liquidation Date, a liquidating distribution in cash or cash equivalents equal to the net asset value of such shares. |
Class A and Investor Class shares are offered at net asset value (“NAV”) per share plus an initial sales charge. No initial sales charge applies to investments of $1 million or more (and certain other qualified purchases) in Class A and Investor Class shares. However, a contingent deferred sales charge (“CDSC”) of 1.00% may be imposed on certain redemptions made within 18 months of the date of purchase on shares that were purchased without an initial sales charge. Class C shares are offered at NAV without an initial sales charge, although a 1.00% CDSC may be imposed on certain redemptions of such shares made within one year of the date of purchase of Class C shares. Class I, Class R1, Class R2, Class R3 and SIMPLE Class shares are offered at NAV without a sales charge. In addition, depending upon eligibility, Class C shares convert to either Class A or Investor Class shares at the end of the calendar quarter eight years after the date they were purchased. Additionally, Investor Class shares may convert automatically to Class A shares. SIMPLE Class shares convert to Class A shares, or Investor Class shares if you are not eligible to hold Class A shares, at the end of the calendar quarter, ten years after the date they were purchased. Share class conversions are based on the relevant NAVs of the two classes at the time of the conversion, and no sales load or other charge is imposed. Under certain circumstances and as may be permitted by the Trust’s multiple class plan
pursuant to Rule 18f-3 under the 1940 Act, specified share classes of the Fund may be converted to one or more other share classes of the Fund as disclosed in the capital share transactions within these Notes. The classes of shares have the same voting (except for issues that relate solely to one class), dividend, liquidation and other rights, and the same terms and conditions, except that under distribution plans pursuant to Rule 12b-1 under the 1940 Act, Class C shares are subject to higher distribution and/or service fees than Class A, Investor Class, Class R2, Class R3 and SIMPLE Class shares. Class I and Class R1 shares are not subject to a distribution and/or service fee. Class R1, Class R2 and Class R3 shares are subject to a shareholder service fee, which is in addition to fees paid under the distribution plans for Class R2 and Class R3 shares.
At a meeting held on September 25-26, 2023, the Board of Trustees (the “Board”) of the Trust, after careful consideration of a number of factors and upon the recommendation of the Fund’s investment adviser, New York Life Investment Management LLC (“New York Life Investments” or the "Manager"), approved a proposal to liquidate Class R1, Class R2 and Class R3 shares of the Fund on or about February 28, 2024, pursuant to the terms of a plan of liquidation.
The Fund's investment objective is to seek total return.
Note 2–Significant Accounting Policies
The Fund is an investment company and accordingly follows the investment company accounting and reporting guidance of the Financial Accounting Standards Board (“FASB”) Accounting Standards Codification Topic 946 Financial Services—Investment Companies. The Fund prepares its financial statements in accordance with generally accepted accounting principles (“GAAP”) in the United States of America and follows the significant accounting policies described below.
(A) Securities Valuation. Investments are usually valued as of the close of regular trading on the New York Stock Exchange (the "Exchange") (usually 4:00 p.m. Eastern time) on each day the Fund is open for business ("valuation date").
Pursuant to Rule 2a-5 under the 1940 Act, the Board has designated New York Life Investments as its Valuation Designee (the "Valuation Designee"). The Valuation Designee is responsible for performing fair valuations relating to all investments in the Fund’s portfolio for which market quotations are not readily available; periodically assessing and managing material valuation risks; establishing and applying fair value methodologies; testing fair valuation methodologies; evaluating and overseeing pricing services; ensuring appropriate segregation of valuation and portfolio management functions; providing quarterly, annual and prompt reporting to the Board, as appropriate; identifying potential conflicts of interest; and maintaining appropriate records. The Valuation Designee has established a valuation committee ("Valuation Committee") to assist in carrying out the Valuation Designee’s responsibilities and establish prices of securities for which market quotations are not readily available. The Fund's and the Valuation Designee's policies and
Notes to Financial Statements (continued)
procedures ("Valuation Procedures") govern the Valuation Designee’s selection and application of methodologies for determining and calculating the fair value of Fund investments. The Valuation Designee may value the Fund's portfolio securities for which market quotations are not readily available and other Fund assets utilizing inputs from pricing services and other third-party sources. The Valuation Committee meets (in person, via electronic mail or via teleconference) on an ad-hoc basis to determine fair valuations and on a quarterly basis to review fair value events with respect to certain securities for which market quotations are not readily available, including valuation risks and back-testing results, and preview reports to the Board.
The Valuation Committee establishes prices of securities for which market quotations are not readily available based on such methodologies and measurements on a regular basis after considering information that is reasonably available and deemed relevant by the Valuation Committee. The Board shall oversee the Valuation Designee and review fair valuation materials on a prompt, quarterly and annual basis and approve proposed revisions to the Valuation Procedures.
Investments for which market quotations are not readily available are valued at fair value as determined in good faith pursuant to the Valuation Procedures. A market quotation is readily available only when that quotation is a quoted price (unadjusted) in active markets for identical investments that the Fund can access at the measurement date, provided that a quotation will not be readily available if it is not reliable. "Fair value" is defined as the price the Fund would reasonably expect to receive upon selling an asset or liability in an orderly transaction to an independent buyer in the principal or most advantageous market for the asset or liability. Fair value measurements are determined within a framework that establishes a three-tier hierarchy that maximizes the use of observable market data and minimizes the use of unobservable inputs to establish a classification of fair value measurements for disclosure purposes. "Inputs" refer broadly to the assumptions that market participants would use in pricing the asset or liability, including assumptions about risk, such as the risk inherent in a particular valuation technique used to measure fair value using a pricing model and/or the risk inherent in the inputs for the valuation technique. Inputs may be observable or unobservable. Observable inputs reflect the assumptions market participants would use in pricing the asset or liability based on market data obtained from sources independent of the Fund. Unobservable inputs reflect the Fund’s own assumptions about the assumptions market participants would use in pricing the asset or liability based on the information available. The inputs or methodology used for valuing assets or liabilities may not be an indication of the risks associated with investing in those assets or liabilities. The three-tier hierarchy of inputs is summarized below.
| • | Level 1—quoted prices (unadjusted) in active markets for an identical asset or liability |
| • | Level 2—other significant observable inputs (including quoted prices for a similar asset or liability in active markets, interest rates and yield curves, prepayment speeds, credit risk, etc.) |
| • | Level 3—significant unobservable inputs (including the Fund's own assumptions about the assumptions that market participants would use in measuring fair value of an asset or liability) |
The level of an asset or liability within the fair value hierarchy is based on the lowest level of an input, both individually and in the aggregate, that is significant to the fair value measurement. The aggregate value by input level of the Fund’s assets and liabilities as of October 31, 2023, is included at the end of the Portfolio of Investments.
The Fund may use third-party vendor evaluations, whose prices may be derived from one or more of the following standard inputs, among others:
| • Broker/dealer quotes | • Benchmark securities |
| • Two-sided markets | • Reference data (corporate actions or material event notices) |
| • Bids/offers | • Monthly payment information |
| • Industry and economic events | • Reported trades |
An asset or liability for which a market quotation is not readily available is valued by methods deemed reasonable in good faith by the Valuation Committee, following the Valuation Procedures to represent fair value. Under these procedures, the Valuation Designee generally uses a market-based approach which may use related or comparable assets or liabilities, recent transactions, market multiples, book values and other relevant information. The Valuation Designee may also use an income-based valuation approach in which the anticipated future cash flows of the asset or liability are discounted to calculate fair value. Discounts may also be applied due to the nature and/or duration of any restrictions on the disposition of the asset or liability. Fair value represents a good faith approximation of the value of a security. Fair value determinations involve the consideration of a number of subjective factors, an analysis of applicable facts and circumstances and the exercise of judgment. As a result, it is possible that the fair value for a security determined in good faith in accordance with the Valuation Procedures may differ from valuations for the same security determined for other funds using their own valuation procedures. Although the Valuation Procedures are designed to value a security at the price the Fund may reasonably expect to receive upon the security's sale in an orderly transaction, there can be no assurance that any fair value determination thereunder would, in fact, approximate the amount that the Fund would actually realize upon the sale of the security or the price at which the security would trade if a reliable market price were readily available. During the year ended October 31, 2023, there were no material changes to the fair value methodologies.
Securities which may be valued in this manner include, but are not limited to: (i) a security for which trading has been halted or suspended or otherwise does not have a readily available market quotation on a given day; (ii) a debt security that has recently gone into default and for which there is not a current market quotation; (iii) a security of an issuer that has entered into a restructuring; (iv) a security that has been delisted from a national exchange; (v) a security subject to trading collars for which no or limited trading takes place; and (vi) a security whose principal
| 22 | MainStay Epoch International Choice Fund |
market has been temporarily closed at a time when, under normal conditions, it would be open. Securities valued in this manner are generally categorized as Level 2 or 3 in the hierarchy. No securities held by the Fund as of October 31, 2023, were fair valued in such a manner.
Certain securities held by the Fund may principally trade in foreign markets. Events may occur between the time the foreign markets close and the time at which the Fund's NAVs are calculated. These events may include, but are not limited to, situations relating to a single issuer in a market sector, significant fluctuations in U.S. or foreign markets, natural disasters, armed conflicts, governmental actions or other developments not tied directly to the securities markets. Should the Valuation Designee conclude that such events may have affected the accuracy of the last price of such securities reported on the local foreign market, the Valuation Designee may, pursuant to the Valuation Procedures, adjust the value of the local price to reflect the estimated impact on the price of such securities as a result of such events. In this instance, securities are generally categorized as Level 3 in the hierarchy. Additionally, certain foreign equity securities are also fair valued whenever the movement of a particular index exceeds certain thresholds. In such cases, the securities are fair valued by applying factors provided by a third-party vendor in accordance with the Valuation Procedures and are generally categorized as Level 2 in the hierarchy. No foreign equity securities held by the Fund as of October 31, 2023 were fair valued in such a manner.
If the principal market of certain foreign equity securities is closed in observance of a local foreign holiday, these securities are valued using the last closing price of regular trading on the relevant exchange and fair valued by applying factors provided by a third-party vendor in accordance with the Valuation Procedures. These securities are generally categorized as Level 2 in the hierarchy. No securities held by the Fund as of October 31, 2023, were fair valued in such a manner.
Equity securities, rights and warrants, if applicable, are valued at the last quoted sales prices as of the close of regular trading on the relevant exchange on each valuation date. Securities that are not traded on the valuation date are valued at the mean of the last quoted bid and ask prices. Prices are normally taken from the principal market in which each security trades. These securities are generally categorized as Level 1 in the hierarchy.
Investments in mutual funds, including money market funds, are valued at their respective NAVs at the close of business each day on the valuation date. These securities are generally categorized as Level 1 in the hierarchy.
Temporary cash investments acquired in excess of 60 days to maturity at the time of purchase are valued using the latest bid prices or using valuations based on a matrix system (which considers such factors as security prices, yields, maturities and ratings), both as furnished by independent pricing services. Temporary cash investments that mature in 60 days or less at the time of purchase ("Short-Term Investments") are valued using the amortized cost method of valuation, unless the use of such method would be inappropriate. The amortized cost method involves valuing a security at its cost on the date of purchase and thereafter
assuming a constant amortization to maturity of the difference between such cost and the value on maturity date. Amortized cost approximates the current fair value of a security. Securities valued using the amortized cost method are not valued using quoted prices in an active market and are generally categorized as Level 2 in the hierarchy.
The information above is not intended to reflect an exhaustive list of the methodologies that may be used to value portfolio investments. The Valuation Procedures permit the use of a variety of valuation methodologies in connection with valuing portfolio investments. The methodology used for a specific type of investment may vary based on the market data available or other considerations. The methodologies summarized above may not represent the specific means by which portfolio investments are valued on any particular business day.
(B) Income Taxes. The Fund's policy is to comply with the requirements of the Internal Revenue Code of 1986, as amended (the “Internal Revenue Code”), applicable to regulated investment companies and to distribute all of its taxable income to the shareholders of the Fund within the allowable time limits.
The Manager evaluates the Fund’s tax positions to determine if the tax positions taken meet the minimum recognition threshold in connection with accounting for uncertainties in income tax positions taken or expected to be taken for the purposes of measuring and recognizing tax liabilities in the financial statements. Recognition of tax benefits of an uncertain tax position is permitted only to the extent the position is “more likely than not” to be sustained assuming examination by taxing authorities. The Manager analyzed the Fund's tax positions taken on federal, state and local income tax returns for all open tax years (for up to three tax years) and has concluded that no provisions for federal, state and local income tax are required in the Fund's financial statements. The Fund's federal, state and local income tax and federal excise tax returns for tax years for which the applicable statutes of limitations have not expired are subject to examination by the Internal Revenue Service and state and local departments of revenue.
(C) Foreign Taxes. The Fund may be subject to foreign taxes on income and other transaction-based taxes imposed by certain countries in which it invests. A portion of the taxes on gains on investments or currency purchases/repatriation may be reclaimable. The Fund will accrue such taxes and reclaims as applicable, based upon its current interpretation of tax rules and regulations that exist in the markets in which it invests.
The Fund may be subject to taxation on realized capital gains, repatriation proceeds and other transaction-based taxes imposed by certain countries in which it invests. The Fund will accrue such taxes as applicable based upon its current interpretation of tax rules and regulations that exist in the market in which it invests. Capital gains taxes relating to positions still held are reflected as a liability in the Statement of Assets and Liabilities, as well as an adjustment to the Fund's net unrealized appreciation (depreciation). Taxes related to capital gains realized, if any, are reflected as part of net realized gain (loss) in the Statement of Operations. Changes
Notes to Financial Statements (continued)
in tax liabilities related to capital gains taxes on unrealized investment gains, if any, are reflected as part of the change in net unrealized appreciation (depreciation) on investments in the Statement of Operations. Transaction-based charges are generally assessed as a percentage of the transaction amount.
(D) Dividends and Distributions to Shareholders. Dividends and distributions are recorded on the ex-dividend date. The Fund intends to declare and pay dividends from net investment income and distributions from net realized capital and currency gains, if any, at least annually. Unless a shareholder elects otherwise, all dividends and distributions are reinvested at NAV in the same class of shares of the Fund. Dividends and distributions to shareholders are determined in accordance with federal income tax regulations and may differ from determinations using GAAP.
(E) Security Transactions and Investment Income. The Fund records security transactions on the trade date. Realized gains and losses on security transactions are determined using the identified cost method. Dividend income is recognized on the ex-dividend date, net of any foreign tax withheld at the source, and interest income is accrued as earned using the effective interest rate method. Distributions received from real estate investment trusts may be classified as dividends, capital gains and/or return of capital. Discounts and premiums on securities purchased for the Fund are accreted and amortized, respectively, on the effective interest rate method over the life of the respective securities.
Investment income and realized and unrealized gains and losses on investments of the Fund are allocated pro rata to the separate classes of shares based upon their relative net assets on the date the income is earned or realized and unrealized gains and losses are incurred.
(F) Expenses. Expenses of the Trust are allocated to the individual Funds in proportion to the net assets of the respective Funds when the expenses are incurred, except where direct allocations of expenses can be made. Expenses (other than transfer agent expenses and fees incurred under the shareholder services plans and/or the distribution plans further discussed in Note 3(B)) are allocated to separate classes of shares pro rata based upon their relative net assets on the date the expenses are incurred. The expenses borne by the Fund, including those of related parties to the Fund, are shown in the Statement of Operations.
Additionally, the Fund may invest in mutual funds, which are subject to management fees and other fees that may cause the costs of investing in mutual funds to be greater than the costs of owning the underlying securities directly. These indirect expenses of mutual funds are not included in the amounts shown as expenses in the Statement of Operations or in the expense ratios included in the Financial Highlights.
(G) Use of Estimates. In preparing financial statements in conformity with GAAP, the Manager makes estimates and assumptions that affect the reported amounts and disclosures in the financial statements. Actual results could differ from those estimates and assumptions.
(H) Foreign Currency Transactions. The Fund's books and records are maintained in U.S. dollars. Prices of securities denominated in foreign currency amounts are translated into U.S. dollars at the mean between the buying and selling rates last quoted by any major U.S. bank at the following dates:
(i) market value of investment securities, other assets and liabilities— at the valuation date; and
(ii) purchases and sales of investment securities, income and expenses—at the date of such transactions.
The assets and liabilities that are denominated in foreign currency amounts are presented at the exchange rates and market values at the close of the period. The realized and unrealized changes in net assets arising from fluctuations in exchange rates and market prices of securities are not separately presented.
Net realized gain (loss) on foreign currency transactions represents net currency gains or losses realized as a result of differences between the amounts of securities sale proceeds or purchase cost, dividends, interest and withholding taxes as recorded on the Fund's books, and the U.S. dollar equivalent amount actually received or paid. Net currency gains or losses from valuing such foreign currency denominated assets and liabilities, other than investments at valuation date exchange rates, are reflected in unrealized foreign exchange gains or losses.
(I) Securities Lending. In order to realize additional income, the Fund may engage in securities lending, subject to the limitations set forth in the 1940 Act and relevant guidance by the staff of the Securities and Exchange Commission (“SEC”). If the Fund engages in securities lending, the Fund will lend through its custodian, JPMorgan Chase Bank, N.A., ("JPMorgan"), acting as securities lending agent on behalf of the Fund. Under the current arrangement, JPMorgan will manage the Fund's collateral in accordance with the securities lending agency agreement between the Fund and JPMorgan, and indemnify the Fund against counterparty risk. The loans will be collateralized by cash (which may be invested in a money market fund) and/or non-cash collateral (which may include U.S. Treasury securities and/or U.S. government agency securities issued or guaranteed by the United States government or its agencies or instrumentalities) at least equal at all times to the market value of the securities loaned. Non-cash collateral held at year end is segregated and cannot be transferred by the Fund. The Fund bears the risk of delay in recovery of, or loss of rights in, the securities loaned. The Fund may also record a realized gain or loss on securities deemed sold due to a borrower’s inability to return securities on loan. The Fund bears the risk of any loss on investment of cash collateral. The Fund will receive compensation for lending its securities in the form of fees or it will retain a portion of interest earned on the investment of any cash collateral. The Fund will also continue to receive interest and dividends on the securities loaned and any gain or loss in the market price of the securities loaned that may occur during the term of the loan will be for the account of the Fund. Income earned from securities lending activities, if any, is reflected
| 24 | MainStay Epoch International Choice Fund |
in the Statement of Operations. Securities on loan as of October 31, 2023, are shown in the Portfolio of Investments.
(J) Foreign Securities Risk. The Fund may invest in foreign securities, which carry certain risks that are in addition to the usual risks inherent in domestic securities. Foreign regulatory regimes and securities markets can have less stringent investor protections and disclosure standards and less liquid trading markets than U.S. regulatory regimes and securities markets, and can experience political, social and economic developments that may affect the value of investments in foreign securities. These risks include those resulting from currency fluctuations, future adverse political or economic developments and possible imposition of currency exchange blockages or other foreign governmental laws or restrictions. Economic sanctions and other similar governmental actions or developments could, among other things, effectively restrict or eliminate the Fund's ability to purchase or sell certain foreign securities or groups of foreign securities, and thus may make the Fund's investments in such securities less liquid or more difficult to value. These risks are likely to be greater in emerging markets than in developed markets. The ability of issuers of debt securities held by the Fund to meet their obligations may be affected by, among other things, economic or political developments in a specific country, industry or region.
(K) Indemnifications. Under the Trust’s organizational documents, its officers and trustees are indemnified against certain liabilities that may arise out of performance of their duties to the Trust. Additionally, in the normal course of business, the Fund enters into contracts with third-party service providers that contain a variety of representations and warranties and that may provide general indemnifications. The Fund's maximum exposure under these arrangements is unknown, as this would involve future claims that may be made against the Fund that have not yet occurred. The Manager believes that the risk of loss in connection with these potential indemnification obligations is remote. However, there can be no assurance that material liabilities related to such obligations will not arise in the future, which could adversely impact the Fund.
Note 3–Fees and Related Party Transactions
(A) Manager and Subadvisor. New York Life Investments, a registered investment adviser and an indirect, wholly-owned subsidiary of New York Life Insurance Company ("New York Life"), serves as the Fund's Manager, pursuant to an Amended and Restated Management Agreement (“Management Agreement”). The Manager provides offices, conducts clerical, recordkeeping and bookkeeping services and keeps most of the financial and accounting records required to be maintained by the Fund. Except for the portion of salaries and expenses that are the responsibility of the Fund, the Manager pays the salaries and expenses of all personnel affiliated with the Fund and certain operational expenses of the Fund. The Fund reimburses New York Life Investments in an amount equal to the portion of the compensation of the Chief Compliance Officer attributable to the Fund. Epoch Investment Partners, Inc. (“Epoch” or the “Subadvisor”), a registered investment adviser, serves as the Subadvisor to the Fund and is responsible for the day-to-day portfolio management
of the Fund. Pursuant to the terms of an Amended and Restated Subadvisory Agreement ("Subadvisory Agreement") between New York Life Investments and Epoch, New York Life Investments pays for the services of the Subadvisor.
Pursuant to the Management Agreement, the Fund pays the Manager a monthly fee for the services performed and the facilities furnished at an annual rate of the Fund’s average daily net assets as follows: 0.80% up to $5 billion; 0.775% from $5 billion to $7.5 billion; and 0.75% in excess of $7.5 billion. During the year ended October 31, 2023, the effective management fee rate was 0.80% of the Fund’s average daily net assets, exclusive of any applicable waivers/reimbursements.
New York Life Investments has contractually agreed to waive fees and/or reimburse expenses so that Total Annual Fund Operating Expenses (excluding taxes, interest, litigation, extraordinary expenses, brokerage and other transaction expenses relating to the purchase or sale of portfolio investments, and acquired (underlying) fund fees and expenses) for Class I shares do not exceed 0.95% of its average daily net assets. This agreement will remain in effect until February 28, 2024, and shall renew automatically for one-year terms unless New York Life Investments provides written notice of termination prior to the start of the next term or upon approval of the Board.
Additionally, New York Life Investments has agreed to further voluntarily waive fees and/or reimburse expenses of the appropriate class of the Fund so that Total Annual Fund Operating Expenses (excluding taxes, interest, litigation, extraordinary expenses, brokerage and other transaction expenses relating to the purchase and sale of portfolio investments, and acquired (underlying) fund fees and expenses) do not exceed the following percentages of average daily net assets: Class R1, 1.05%; and Class R2, 1.30%. These voluntary waivers or reimbursements may be discontinued at any time without notice.
During the year ended October 31, 2023, New York Life Investments earned fees from the Fund in the amount of $1,748,223 and waived fees and/or reimbursed expenses, including the waiver/reimbursement of certain class specific expenses in the amount of $50,666 and paid the Subadvisor fees in the amount of $852,771.
JPMorgan provides sub-administration and sub-accounting services to the Fund pursuant to an agreement with New York Life Investments. These services include calculating the daily NAVs of the Fund, maintaining the general ledger and sub-ledger accounts for the calculation of the Fund's NAVs, and assisting New York Life Investments in conducting various aspects of the Fund's administrative operations. For providing these services to the Fund, JPMorgan is compensated by New York Life Investments.
Pursuant to an agreement between the Trust and New York Life Investments, New York Life Investments is responsible for providing or procuring certain regulatory reporting services for the Fund. The Fund will reimburse New York Life Investments for the actual costs incurred by New York Life Investments in connection with providing or procuring these services for the Fund.
Notes to Financial Statements (continued)
(B) Distribution and Service Fees. The Trust, on behalf of the Fund, has entered into a distribution agreement with NYLIFE Distributors LLC (the “Distributor”), an affiliate of New York Life Investments. The Fund has adopted distribution plans (the “Plans”) in accordance with the provisions of Rule 12b-1 under the 1940 Act.
Pursuant to the Class A, Investor Class and Class R2 Plans, the Distributor receives a monthly fee from the Class A, Investor Class and Class R2 shares at an annual rate of 0.25% of the average daily net assets of the Class A, Investor Class and Class R2 shares for distribution and/or service activities as designated by the Distributor. Pursuant to the Class C Plan, Class C shares pay the Distributor a monthly distribution fee at an annual rate of 0.75% of the average daily net assets of the Class C shares, along with a service fee at an annual rate of 0.25% of the average daily net assets of the Class C shares, for a total 12b-1 fee of 1.00%. Pursuant to the Class R3 and SIMPLE Class Plan, Class R3 and SIMPLE Class shares pay the Distributor a monthly distribution fee at an annual rate of 0.25% of the average daily net assets of the Class R3 and SIMPLE Class shares, along with a service fee at an annual rate of 0.25% of the average daily net assets of the Class R3 and SIMPLE Class shares, for a total 12b-1 fee of 0.50%. Class I and Class R1 shares are not subject to a distribution and/or service fee.
The Plans provide that the distribution and service fees are payable to the Distributor regardless of the amounts actually expended by the Distributor for distribution of the Fund's shares and service activities.
In accordance with the Shareholder Services Plans for the Class R1, Class R2 and Class R3 shares, the Manager has agreed to provide, through its affiliates or independent third parties, various shareholder and administrative support services to shareholders of the Class R1, Class R2 and Class R3 shares. For its services, the Manager, its affiliates or independent third-party service providers are entitled to a shareholder service fee accrued daily and paid monthly at an annual rate of 0.10% of the average daily net assets of the Class R1, Class R2 and Class R3 shares. This is in addition to any fees paid under the Class R2 and Class R3 Plans.
During the year ended October 31, 2023, shareholder service fees incurred by the Fund were as follows:
| |
| Class R1 | $ 101 |
| Class R2 | 6,076 |
| Class R3 | 2,797 |
(C) Sales Charges. The Fund was advised by the Distributor that the amount of initial sales charges retained on sales of Class A and Investor Class shares during the year ended October 31, 2023, were $749 and $465, respectively.
The Fund was also advised that the Distributor retained CDSCs on redemptions of Class A shares during the year ended October 31, 2023, of $35.
(D) Transfer, Dividend Disbursing and Shareholder Servicing Agent. NYLIM Service Company LLC, an affiliate of New York Life Investments, is the Fund's transfer, dividend disbursing and shareholder servicing agent pursuant to an agreement between NYLIM Service Company LLC and the Trust. NYLIM Service Company LLC has entered into an agreement with SS&C Global Investor & Distribution Solutions, Inc. ("SS&C"), pursuant to which SS&C performs certain transfer agent services on behalf of NYLIM Service Company LLC. New York Life Investments has contractually agreed to limit the transfer agency expenses charged to the Fund’s share classes to a maximum of 0.35% of that share class’s average daily net assets on an annual basis after deducting any applicable Fund or class-level expense reimbursement or small account fees. This agreement will remain in effect until February 28, 2024, and shall renew automatically for one-year terms unless New York Life Investments provides written notice of termination prior to the start of the next term or upon approval of the Board. During the year ended October 31, 2023, transfer agent expenses incurred by the Fund and any reimbursements, pursuant to the aforementioned Transfer Agency expense limitation agreement, were as follows:
| Class | Expense | Waived |
| Class A | $ 16,137 | $ — |
| Investor Class | 22,404 | (7,453) |
| Class C | 1,595 | (532) |
| Class I | 105,242 | — |
| Class R1 | 58 | — |
| Class R2 | 3,603 | — |
| Class R3 | 1,656 | — |
| SIMPLE Class | 60 | — |
(E) Small Account Fee. Shareholders with small accounts adversely impact the cost of providing transfer agency services. In an effort to reduce total transfer agency expenses, the Fund has implemented a small account fee on certain types of accounts. As described in the Fund's prospectus, certain shareholders with an account balance of less than $1,000 ($5,000 for Class A share accounts) are charged an annual per account fee of $20 (assessed semi-annually), the proceeds from which offset transfer agent fees as reflected in the Statement of Operations. This small account fee will not apply to certain types of accounts as described further in the Fund’s prospectus.
(F) Capital. As of October 31, 2023, New York Life and its affiliates beneficially held shares of the Fund with the values and percentages of net assets as follows:
| 26 | MainStay Epoch International Choice Fund |
Note 4-Federal Income Tax
As of October 31, 2023, the cost and unrealized appreciation (depreciation) of the Fund’s investment portfolio, including applicable derivative contracts and other financial instruments, as determined on a federal income tax basis, were as follows:
| | Federal Tax
Cost | Gross
Unrealized
Appreciation | Gross
Unrealized
(Depreciation) | Net
Unrealized
Appreciation/
(Depreciation) |
| Investments in Securities | $195,390,677 | $16,616,826 | $(19,401,155) | $(2,784,329) |
As of October 31, 2023, the components of accumulated gain (loss) on a tax basis were as follows:
Ordinary
Income | Accumulated
Capital
and Other
Gain (Loss) | Other
Temporary
Differences | Unrealized
Appreciation
(Depreciation) | Total
Accumulated
Gain (Loss) |
| $3,553,295 | $(67,223,910) | $— | $(2,659,320) | $(66,329,935) |
The difference between book-basis and tax-basis unrealized appreciation (depreciation) is primarily due to wash sale adjustments.
As of October 31, 2023, for federal income tax purposes, capital loss carryforwards of $67,223,910, as shown in the table below, were available to the extent provided by the regulations to offset future realized gains of the Fund. Accordingly, no capital gains distributions are expected to be paid to shareholders until net gains have been realized in excess of such amounts.
Capital Loss
Available Through | Short-Term
Capital Loss
Amounts (000’s) | Long-Term
Capital Loss
Amounts (000’s) |
| Unlimited | $67,224 | $— |
The Fund utilized $11,170,399 of capital loss carryforwards during the year ended October 31, 2023.
During the years ended October 31, 2023 and October 31, 2022, the tax character of distributions paid as reflected in the Statements of Changes in Net Assets was as follows:
| | 2023 | 2022 |
| Distributions paid from: | | |
| Ordinary Income | $2,613,449 | $7,133,158 |
Note 5–Custodian
JPMorgan is the custodian of cash and securities held by the Fund. Custodial fees are charged to the Fund based on the Fund's net assets and/or the market value of securities held by the Fund and the number of certain transactions incurred by the Fund.
Note 6–Line of Credit
The Fund and certain other funds managed by New York Life Investments maintain a line of credit with a syndicate of banks in order to secure a source of funds for temporary purposes to meet unanticipated or excessive redemption requests.
Effective July 25, 2023, under the credit agreement (the “Credit Agreement”), the aggregate commitment amount is $600,000,000 with an additional uncommitted amount of $100,000,000. The commitment fee is an annual rate of 0.15% of the average commitment amount payable quarterly, regardless of usage, to JPMorgan, who serves as the agent to the syndicate. The commitment fee is allocated among the Fund and certain other funds managed by New York Life Investments based upon their respective net assets and other factors. Interest on any revolving credit loan is charged based upon the Federal Funds Rate, Daily Simple Secured Overnight Financing Rate ("SOFR") + 0.10%, or the Overnight Bank Funding Rate, whichever is higher. The Credit Agreement expires on July 23, 2024, although the Fund, certain other funds managed by New York Life Investments and the syndicate of banks may renew the Credit Agreement for an additional year on the same or different terms or enter into a credit agreement with a different syndicate of banks. Prior to July 25, 2023, the aggregate commitment amount and the commitment fee were the same as those under the current Credit Agreement. During the year ended October 31, 2023, there were no borrowings made or outstanding with respect to the Fund under the Credit Agreement.
Note 7–Interfund Lending Program
Pursuant to an exemptive order issued by the SEC, the Fund, along with certain other funds managed by New York Life Investments, may participate in an interfund lending program. The interfund lending program provides an alternative credit facility that permits the Fund and certain other funds managed by New York Life Investments to lend or borrow money for temporary purposes directly to or from one another, subject to the conditions of the exemptive order. During the year ended October 31, 2023, there were no interfund loans made or outstanding with respect to the Fund.
Note 8–Purchases and Sales of Securities (in 000’s)
During the year ended October 31, 2023, purchases and sales of securities, other than short-term securities, were $70,435 and $104,687, respectively.
Note 9–Capital Share Transactions
Transactions in capital shares for the years ended October 31, 2023 and October 31, 2022, were as follows:
Notes to Financial Statements (continued)
| Class A | Shares | Amount |
| Year ended October 31, 2023: | | |
| Shares sold | 216,462 | $ 7,624,665 |
| Shares issued to shareholders in reinvestment of distributions | 5,801 | 201,594 |
| Shares redeemed | (104,849) | (3,898,138) |
| Net increase (decrease) in shares outstanding before conversion | 117,414 | 3,928,121 |
| Shares converted into Class A (See Note 1) | 4,881 | 185,534 |
| Net increase (decrease) | 122,295 | $ 4,113,655 |
| Year ended October 31, 2022: | | |
| Shares sold | 38,134 | $ 1,358,832 |
| Shares issued to shareholders in reinvestment of distributions | 14,871 | 600,059 |
| Shares redeemed | (74,618) | (2,638,760) |
| Net increase (decrease) in shares outstanding before conversion | (21,613) | (679,869) |
| Shares converted into Class A (See Note 1) | 2,019 | 72,879 |
| Net increase (decrease) | (19,594) | $ (606,990) |
| |
| Investor Class | Shares | Amount |
| Year ended October 31, 2023: | | |
| Shares sold | 3,972 | $ 149,834 |
| Shares issued to shareholders in reinvestment of distributions | 810 | 28,159 |
| Shares redeemed | (11,345) | (420,451) |
| Net increase (decrease) in shares outstanding before conversion | (6,563) | (242,458) |
| Shares converted into Investor Class (See Note 1) | 450 | 16,840 |
| Shares converted from Investor Class (See Note 1) | (4,577) | (174,139) |
| Net increase (decrease) | (10,690) | $ (399,757) |
| Year ended October 31, 2022: | | |
| Shares sold | 7,166 | $ 247,942 |
| Shares issued to shareholders in reinvestment of distributions | 2,628 | 106,090 |
| Shares redeemed | (16,541) | (586,739) |
| Net increase (decrease) in shares outstanding before conversion | (6,747) | (232,707) |
| Shares converted into Investor Class (See Note 1) | 964 | 36,562 |
| Shares converted from Investor Class (See Note 1) | (1,616) | (58,562) |
| Net increase (decrease) | (7,399) | $ (254,707) |
| |
| Class C | Shares | Amount |
| Year ended October 31, 2023: | | |
| Shares sold | 3,748 | $ 136,472 |
| Shares redeemed | (8,028) | (296,006) |
| Net increase (decrease) in shares outstanding before conversion | (4,280) | (159,534) |
| Shares converted from Class C (See Note 1) | (770) | (28,235) |
| Net increase (decrease) | (5,050) | $ (187,769) |
| Year ended October 31, 2022: | | |
| Shares sold | 111 | $ 3,989 |
| Shares issued to shareholders in reinvestment of distributions | 109 | 4,352 |
| Shares redeemed | (14,594) | (484,423) |
| Net increase (decrease) in shares outstanding before conversion | (14,374) | (476,082) |
| Shares converted from Class C (See Note 1) | (1,386) | (50,879) |
| Net increase (decrease) | (15,760) | $ (526,961) |
| |
| Class I | Shares | Amount |
| Year ended October 31, 2023: | | |
| Shares sold | 131,195 | $ 5,036,280 |
| Shares issued to shareholders in reinvestment of distributions | 66,235 | 2,297,693 |
| Shares redeemed | (1,241,537) | (45,229,500) |
| Net increase (decrease) | (1,044,107) | $(37,895,527) |
| Year ended October 31, 2022: | | |
| Shares sold | 403,328 | $ 13,510,548 |
| Shares issued to shareholders in reinvestment of distributions | 151,372 | 6,097,248 |
| Shares redeemed | (829,534) | (29,840,473) |
| Net increase (decrease) | (274,834) | $(10,232,677) |
| |
| Class R1 | Shares | Amount |
| Year ended October 31, 2023: | | |
| Shares sold | 2,833 | $ 102,178 |
| Shares issued to shareholders in reinvestment of distributions | 11 | 374 |
| Shares redeemed | (167) | (6,248) |
| Net increase (decrease) | 2,677 | $ 96,304 |
| Year ended October 31, 2022: | | |
| Shares sold | 600 | $ 23,070 |
| Shares issued to shareholders in reinvestment of distributions | 99 | 3,987 |
| Shares redeemed | (3,623) | (131,374) |
| Net increase (decrease) | (2,924) | $ (104,317) |
| |
| 28 | MainStay Epoch International Choice Fund |
| Class R2 | Shares | Amount |
| Year ended October 31, 2023: | | |
| Shares sold | 26,339 | $ 991,406 |
| Shares issued to shareholders in reinvestment of distributions | 1,454 | 50,560 |
| Shares redeemed | (60,673) | (2,239,388) |
| Net increase (decrease) | (32,880) | $ (1,197,422) |
| Year ended October 31, 2022: | | |
| Shares sold | 28,186 | $ 1,009,844 |
| Shares issued to shareholders in reinvestment of distributions | 4,626 | 186,691 |
| Shares redeemed | (66,159) | (2,329,954) |
| Net increase (decrease) | (33,347) | $ (1,133,419) |
| |
| Class R3 | Shares | Amount |
| Year ended October 31, 2023: | | |
| Shares sold | 11,642 | $ 434,488 |
| Shares issued to shareholders in reinvestment of distributions | 417 | 14,420 |
| Shares redeemed | (22,419) | (827,724) |
| Net increase (decrease) | (10,360) | $ (378,816) |
| Year ended October 31, 2022: | | |
| Shares sold | 15,362 | $ 566,824 |
| Shares issued to shareholders in reinvestment of distributions | 1,913 | 76,864 |
| Shares redeemed | (37,287) | (1,308,128) |
| Net increase (decrease) | (20,012) | $ (664,440) |
| |
| SIMPLE Class | Shares | Amount |
| Year ended October 31, 2023: | | |
| Shares sold | 146 | $ 5,468 |
| Shares issued to shareholders in reinvestment of distributions | 5 | 155 |
| Shares redeemed | (1) | (20) |
| Net increase (decrease) | 150 | $ 5,603 |
| Year ended October 31, 2022: | | |
| Shares sold | 65 | $ 2,121 |
| Shares issued to shareholders in reinvestment of distributions | 16 | 630 |
| Net increase (decrease) | 81 | $ 2,751 |
Note 10–Other Matters
As of the date of this report, the Fund faces a heightened level of risk associated with current uncertainty, volatility and state of economies, financial markets, rising interest rates, and labor and health conditions around the world. Events such as war, acts of terrorism, recessions, rapid inflation, the imposition of international sanctions, earthquakes, hurricanes, epidemics and pandemics and other unforeseen natural or human disasters may have broad adverse social, political and economic effects on the global economy, which could negatively impact the value of the Fund's investments. Developments that disrupt global economies and
financial markets may magnify factors that affect the Fund's performance.
Note 11–Subsequent Events
In connection with the preparation of the financial statements of the Fund as of and for the year ended October 31, 2023, events and transactions subsequent to October 31, 2023, through the date the financial statements were issued, have been evaluated by the Manager for possible adjustment and/or disclosure. No subsequent events requiring financial statement adjustment or disclosure have been identified.
Report of Independent Registered Public Accounting Firm
To the Shareholders of the Fund and Board of Trustees
MainStay Funds Trust:
Opinion on the Financial Statements
We have audited the accompanying statement of assets and liabilities of MainStay Epoch International Choice Fund (the Fund), one of the funds constituting MainStay Funds Trust, including the portfolio of investments, as of October 31, 2023, the related statement of operations for the year then ended, the statements of changes in net assets for each of the years in the two-year period then ended, and the related notes (collectively, the financial statements) and the financial highlights for each of the years or periods in the five-year period then ended. In our opinion, the financial statements and financial highlights present fairly, in all material respects, the financial position of the Fund as of October 31, 2023, the results of its operations for the year then ended, the changes in its net assets for each of the years in the two-year period then ended, and the financial highlights for each of the years or periods in the five-year period then ended, in conformity with U.S. generally accepted accounting principles.
Basis for Opinion
These financial statements and financial highlights are the responsibility of the Fund's management. Our responsibility is to express an opinion on these financial statements and financial highlights based on our audits. We are a public accounting firm registered with the Public Company Accounting Oversight Board (United States) (PCAOB) and are required to be independent with respect to the Fund in accordance with the U.S. federal securities laws and the applicable rules and regulations of the Securities and Exchange Commission and the PCAOB.
We conducted our audits in accordance with the standards of the PCAOB. Those standards require that we plan and perform the audit to obtain reasonable assurance about whether the financial statements and financial highlights are free of material misstatement, whether due to error or fraud. Our audits included performing procedures to assess the risks of material misstatement of the financial statements and financial highlights, whether due to error or fraud, and performing procedures that respond to those risks. Such procedures included examining, on a test basis, evidence regarding the amounts and disclosures in the financial statements and financial highlights. Such procedures also included confirmation of securities owned as of October 31, 2023, by correspondence with the custodian and the transfer agent. Our audits also included evaluating the accounting principles used and significant estimates made by management, as well as evaluating the overall presentation of the financial statements and financial highlights. We believe that our audits provide a reasonable basis for our opinion.

We have served as the auditor of one or more New York Life Investment Management investment companies since 2003.
Philadelphia, Pennsylvania
December 22, 2023
| 30 | MainStay Epoch International Choice Fund |
Federal Income Tax Information
(Unaudited)
The Fund is required under the Internal Revenue Code to advise shareholders in a written statement as to the federal tax status of dividends paid by the Fund during such fiscal years.
For the fiscal year ended October 31, 2023, the Fund designated approximately $3,199,958 under the Internal Revenue Code as qualified dividend income eligible for reduced tax rates.
In accordance with federal tax law, the Fund elected to provide each shareholder with their portion of the Fund’s foreign taxes paid and the income sourced from foreign countries. Accordingly, the Fund made the following designations regarding its fiscal year ended October 31, 2023:
• the total amount of taxes credited to foreign countries was $586,509.
• the total amount of income sourced from foreign countries was $3,944,054.
In February 2024, shareholders will receive an IRS Form 1099-DIV or substitute Form 1099, which will show the federal tax status of the distributions received by shareholders in calendar year 2023. The amounts that will be reported on such 1099-DIV or substitute Form 1099 will be the amounts you are to use on your federal income tax return and will differ from the amounts which we must report for the Fund's fiscal year ended October 31, 2023.
Proxy Voting Policies and Procedures and Proxy Voting Record
The Fund is required to file with the SEC its proxy voting record for the 12-month period ending June 30 on Form N-PX. A description of the policies and procedures that are used to vote proxies relating to portfolio securities of the Fund is available free of charge upon request by calling 800-624-6782 or visiting the SEC’s website at www.sec.gov. The most recent Form N-PX or proxy voting record is available free of charge upon request by calling 800-624-6782; visiting newyorklifeinvestments.com; or visiting the SEC’s website at www.sec.gov.
Shareholder Reports and Quarterly Portfolio Disclosure
The Fund is required to file its complete schedule of portfolio holdings with the SEC 60 days after its first and third fiscal quarter on Form N-PORT. The Fund's holdings report is available free of charge upon request by calling New York Life Investments at 800-624-6782.
Board of Trustees and Officers (Unaudited)
The Trustees and officers of the Fund are listed below. The Board oversees the MainStay Group of Funds (which consists of MainStay Funds and MainStay Funds Trust), MainStay VP Funds Trust, MainStay MacKay DefinedTerm Municipal Opportunities Fund, MainStay CBRE Global Infrastructure Megatrends Term Fund, the Manager and the Subadvisors, and elects the officers of the Funds who are responsible for the day-to-day operations of the Fund. Information pertaining to the Trustees and officers is set forth below. Each Trustee serves until his or her successor is elected and qualified or until his or her resignation, death or
removal. Under the Board’s retirement policy, unless an exception is made, a Trustee must tender his or her resignation by the end of the calendar year during which he or she reaches the age of 75. Officers are elected annually by the Board. The business address of each Trustee and officer listed below is 51 Madison Avenue, New York, New York 10010. A majority of the Trustees are not “interested persons” (as defined by the 1940 Act and rules adopted by the SEC thereunder) of the Fund (“Independent Trustees”).
| | Name and
Year of Birth | Term of Office,
Position(s) Held and
Length of Service | Principal Occupation(s)
During Past Five Years | Number of
Portfolios in
Fund Complex
Overseen by
Trustee | Other Directorships
Held by Trustee |
| | | | | | |
| | Naïm Abou-Jaoudé*
1966 | MainStay Funds: Trustee
since 2023
MainStay Funds Trust:
Trustee since 2023 | Chief Executive Officer of New York Life Investment Management LLC (since 2023). Chief Executive Officer of Candriam (an affiliate of New York Life Investment Management LLC) (2007 to 2023). | 81 | MainStay VP Funds Trust:
Trustee since 2023 (31 portfolios);
MainStay MacKay DefinedTerm Municipal Opportunities Fund: Trustee
since 2023;
MainStay CBRE Global Infrastructure Megatrends Term Fund: Trustee
since 2023; and
New York Life Investment Management International (Chair) since 2015 |
| * | This Trustee is considered to be an “interested person” of the MainStay Group of Funds, MainStay VP Funds Trust, MainStay CBRE Global Infrastructure Megatrends Term Fund and MainStay MacKay DefinedTerm Municipal Opportunities Fund, within the meaning of the 1940 Act because of his affiliation with New York Life Investment Management LLC and Candriam, as described in detail above in the column entitled “Principal Occupation(s) During Past Five Years.” |
| | |
| 32 | MainStay Epoch International Choice Fund |
| | Name and
Year of Birth | Term of Office,
Position(s) Held and
Length of Service | Principal Occupation(s)
During Past Five Years | Number of
Portfolios in
Fund Complex
Overseen by
Trustee | Other Directorships
Held by Trustee |
| | | | | | |
| | David H. Chow
1957 | MainStay Funds: Trustee since January 2016, Advisory Board Member (June 2015 to December 2015);MainStay Funds Trust:
Trustee since January 2016, Advisory Board Member (June 2015 to December 2015) | Founder and CEO, DanCourt Management, LLC (since 1999) | 81 | MainStay VP Funds Trust: Trustee since January 2016, Advisory Board Member (June 2015 to December 2015) (31 portfolios);
MainStay MacKay DefinedTerm Municipal Opportunities Fund: Trustee since January 2016, Advisory Board Member (June 2015 to December 2015);
MainStay CBRE Global Infrastructure Megatrends Term Fund: Trustee since 2021;
VanEck Vectors Group of Exchange-Traded Funds: Trustee since 2006 and Independent Chairman of the Board of Trustees from 2008 to 2022 (57 portfolios); and
Berea College of Kentucky: Trustee since 2009, Chair of the Investment Committee since 2018 |
| | Karen Hammond
1956 | MainStay Funds: Trustee since December 2021, Advisory Board Member (June 2021 to December 2021);MainStay Funds Trust:
Trustee since December 2021, Advisory Board Member (June 2021 to December 2021)
| Retired, Managing Director, Devonshire Investors (2007 to 2013); Senior Vice President, Fidelity Management & Research Co. (2005 to 2007); Senior Vice President and Corporate Treasurer, FMR Corp. (2003 to 2005); Chief Operating Officer, Fidelity Investments Japan (2001 to 2003) | 81 | MainStay VP Funds Trust: Trustee since December 2021, Advisory Board Member (June 2021 to December 2021) (31 portfolios);
MainStay MacKay DefinedTerm Municipal Opportunities Fund: Trustee since December 2021, Advisory Board Member (June 2021 to December 2021);
MainStay CBRE Global Infrastructure Megatrends Term Fund: Trustee since December 2021, Advisory Board Member (June 2021 to December 2021);
Two Harbors Investment Corp.: Director since 2018;
Rhode Island State Investment Commission: Member since 2017; and
Blue Cross Blue Shield of Rhode Island: Director since 2019 |
| | Susan B. Kerley
1951 | MainStay Funds: Chair since January 2017 and Trustee since 2007;MainStay Funds Trust:
Chair since January 2017 and Trustee since 1990*** | President, Strategic Management Advisors LLC (since 1990) | 81 | MainStay VP Funds Trust: Chair since January 2017 and Trustee since 2007 (31 portfolios)**;
MainStay MacKay DefinedTerm Municipal Opportunities Fund: Chair since January 2017 and Trustee since 2011;
MainStay CBRE Global Infrastructure Megatrends Term Fund: Trustee since June 2021; and
Legg Mason Partners Funds: Trustee since 1991 (45 portfolios) |
Board of Trustees and Officers (Unaudited) (continued)
| | Name and
Year of Birth | Term of Office,
Position(s) Held and
Length of Service | Principal Occupation(s)
During Past Five Years | Number of
Portfolios in
Fund Complex
Overseen by
Trustee | Other Directorships
Held by Trustee |
| | | | | | |
| | Alan R. Latshaw
1951 | MainStay Funds: Trusteesince 2006;MainStay Funds Trust:
Trustee since 2007*** | Retired; Partner, Ernst & Young LLP (2002 to 2003); Partner, Arthur Andersen LLP (1989 to 2002); Consultant to the MainStay Funds Audit and Compliance Committee (2004 to 2006) | 81 | MainStay VP Funds Trust: Trustee since 2007 (31 portfolios)**;
MainStay MacKay DefinedTerm Municipal Opportunities Fund: Trustee since 2011; and
MainStay CBRE Global Infrastructure Megatrends Term Fund: Trustee since June 2021 |
| | Jacques P. Perold
1958 | MainStay Funds: Trustee since January 2016, Advisory Board Member (June 2015to December 2015);MainStay Funds Trust:
Trustee since January 2016, Advisory Board Member (June 2015 to December 2015) | Founder and Chief Executive Officer, CapShift Advisors LLC (since 2018); President, Fidelity Management & Research Company (2009 to 2014); President and Chief Investment Officer, Geode Capital Management, LLC (2001 to 2009) | 81 | MainStay VP Funds Trust: Trustee since January 2016, Advisory Board Member (June 2015 to December 2015) (31 portfolios);
MainStay MacKay DefinedTerm Municipal Opportunities Fund: Trustee since January 2016, Advisory Board Member (June 2015 to December 2015);
MainStay CBRE Global Infrastructure Megatrends Term Fund: Trustee since June 2021;
Allstate Corporation: Director since 2015; and
MSCI Inc.: Director since 2017 |
| | Richard S. Trutanic
1952 | MainStay Funds: Trustee since 1994;MainStay Funds Trust:
Trustee since 2007*** | Chairman and Chief Executive Officer, Somerset & Company (financial advisory firm) (since 2004); Managing Director, The Carlyle Group (private investment firm) (2002 to 2004); Senior Managing Director, Partner and Board Member, Groupe Arnault S.A. (private investment firm) (1999 to 2002) | 81 | MainStay VP Funds Trust: Trustee since 2007 (31 portfolios)**;
MainStay MacKay DefinedTerm Municipal Opportunities Fund: Trustee since 2011; and
MainStay CBRE Global Infrastructure Megatrends Term Fund: Trustee since June 2021 |
| ** | Includes prior service as a Director of MainStay VP Series Fund, Inc., the predecessor to MainStay VP Funds Trust. |
| *** | Includes prior service as a Director/Trustee of certain predecessor entities to MainStay Funds Trust. |
| 34 | MainStay Epoch International Choice Fund |
| | Name and
Year of Birth | Position(s) Held and
Length of Service | Principal Occupation(s)
During Past Five Years | |
| | | | | |
| | Kirk C. Lehneis
1974 | President, MainStay Funds, MainStay Funds Trust (since 2017) | Chief Operating Officer and Senior Managing Director (since 2016), New York Life Investment Management LLC and New York Life Investment Management Holdings LLC; Member of the Board of Managers (since 2017) and Senior Managing Director (since 2018), NYLIFE Distributors LLC; Chairman of the Board and Senior Managing Director, NYLIM Service Company LLC (since 2017); Trustee, President and Principal Executive Officer of IndexIQ Trust, IndexIQ ETF Trust and IndexIQ Active ETF Trust (since 2018); President, MainStay CBRE Global Infrastructure Megatrends Term Fund (since 2021), MainStay MacKay DefinedTerm Municipal Opportunities Fund and MainStay VP Funds Trust (since 2017)**; Senior Managing Director, Global Product Development (2015 to 2016); Managing Director, Product Development (2010 to 2015), New York Life Investment Management LLC | |
| | Jack R. Benintende
1964 | Treasurer and Principal Financial and Accounting Officer, MainStay Funds (since 2007), MainStay Funds Trust (since 2009) | Managing Director, New York Life Investment Management LLC (since 2007); Treasurer and Principal Financial and Accounting Officer, MainStay CBRE Global Infrastructure Megatrends Term Fund (since 2021), MainStay MacKay DefinedTerm Municipal Opportunities Fund (since 2011) and MainStay VP Funds Trust (since 2007)**; and Assistant Treasurer, New York Life Investment Management Holdings LLC (2008 to 2012) | |
| | J. Kevin Gao
1967 | Secretary and Chief Legal Officer, MainStay Funds and MainStay Funds Trust (since 2010) | Managing Director and Associate General Counsel, New York Life Investment Management LLC (since 2010); Secretary and Chief Legal Officer, MainStay CBRE Global Infrastructure Megatrends Term Fund (since 2021), MainStay MacKay DefinedTerm Municipal Opportunities Fund (since 2011) and MainStay VP Funds Trust (since 2010)** | |
| | Kevin M. Gleason
1967 | Vice President and Chief Compliance Officer, MainStay Funds and MainStay Funds Trust (since June 2022) | Vice President and Chief Compliance Officer, IndexIQ Trust, IndexIQ ETF Trust and Index IQ Active ETF Trust (since June 2022); Vice President and Chief Compliance Officer, MainStay CBRE Global Infrastructure Megatrends Term Fund, MainStay VP Funds Trust and MainStay MacKay DefinedTerm Municipal Opportunities Fund (since June 2022); Senior Vice President, Voya Investment Management and Chief Compliance Officer, Voya Family of Funds (2012 to 2022) | |
| | Scott T. Harrington
1959 | Vice President— Administration, MainStay Funds (since 2005), MainStay Funds Trust (since 2009) | Managing Director, New York Life Investment Management LLC (including predecessor advisory organizations) (since 2000); Member of the Board of Directors, New York Life Trust Company (since 2009); Vice President—Administration, MainStay CBRE Global Infrastructure Megatrends Term Fund (since 2021), MainStay MacKay DefinedTerm Municipal Opportunities Fund (since 2011) and MainStay VP Funds Trust (since 2005)** | |
| * | The officers listed above are considered to be “interested persons” of the MainStay Group of Funds, MainStay VP Funds Trust, MainStay CBRE Global Infrastructure Megatrends Term Fund and MainStay MacKay DefinedTerm Municipal Opportunities Fund within the meaning of the 1940 Act because of their affiliation with the MainStay Group of Funds, New York Life Insurance Company and/or its affiliates, including New York Life Investment Management LLC, New York Life Insurance Company, NYLIM Service Company LLC, NYLIFE Securities LLC and/or NYLIFE Distributors LLC, as described in detail in the column captioned “Principal Occupation(s) During Past Five Years.” Officers are elected annually by the Board. |
| ** | Includes prior service as an Officer of MainStay VP Series Fund, Inc., the predecessor to MainStay VP Funds Trust. |
Officers of the Trust (Who are not Trustees)*
This page intentionally left blank.
This page intentionally left blank.
This page intentionally left blank.
Equity
U.S. Equity
MainStay Epoch U.S. Equity Yield Fund
MainStay Fiera SMID Growth Fund
MainStay PineStone U.S. Equity Fund
MainStay S&P 500 Index Fund
MainStay Winslow Large Cap Growth Fund
MainStay WMC Enduring Capital Fund
MainStay WMC Growth Fund
MainStay WMC Small Companies Fund
MainStay WMC Value Fund
International Equity
MainStay Epoch International Choice Fund
MainStay PineStone International Equity Fund
MainStay WMC International Research Equity Fund
Emerging Markets Equity
MainStay Candriam Emerging Markets Equity Fund
Global Equity
MainStay Epoch Capital Growth Fund
MainStay Epoch Global Equity Yield Fund
MainStay PineStone Global Equity Fund
Fixed Income
Taxable Income
MainStay Candriam Emerging Markets Debt Fund
MainStay Floating Rate Fund
MainStay MacKay High Yield Corporate Bond Fund
MainStay MacKay Short Duration High Yield Fund
MainStay MacKay Strategic Bond Fund
MainStay MacKay Total Return Bond Fund
MainStay MacKay U.S. Infrastructure Bond Fund
MainStay Short Term Bond Fund
Tax-Exempt Income
MainStay MacKay California Tax Free Opportunities Fund1
MainStay MacKay High Yield Municipal Bond Fund
MainStay MacKay New York Tax Free Opportunities Fund2
MainStay MacKay Short Term Municipal Fund
MainStay MacKay Strategic Municipal Allocation Fund
MainStay MacKay Tax Free Bond Fund
Money Market
MainStay Money Market Fund
Mixed Asset
MainStay Balanced Fund
MainStay Income Builder Fund
MainStay MacKay Convertible Fund
Speciality
MainStay CBRE Global Infrastructure Fund
MainStay CBRE Real Estate Fund
MainStay Cushing MLP Premier Fund
Asset Allocation
MainStay Conservative Allocation Fund
MainStay Conservative ETF Allocation Fund
MainStay Defensive ETF Allocation Fund
MainStay Equity Allocation Fund
MainStay Equity ETF Allocation Fund
MainStay ESG Multi-Asset Allocation Fund
MainStay Growth Allocation Fund
MainStay Growth ETF Allocation Fund
MainStay Moderate Allocation Fund
MainStay Moderate ETF Allocation Fund
Manager
New York Life Investment Management LLC
New York, New York
Subadvisors
Candriam3
Strassen, Luxembourg
CBRE Investment Management Listed Real Assets LLC
Radnor, Pennsylvania
Cushing Asset Management, LP
Dallas, Texas
Epoch Investment Partners, Inc.
New York, New York
Fiera Capital Inc.
New York, New York
IndexIQ Advisors LLC3
New York, New York
MacKay Shields LLC3
New York, New York
NYL Investors LLC3
New York, New York
PineStone Asset Management Inc.
Montreal, Québec
Wellington Management Company LLP
Boston, Massachusetts
Winslow Capital Management, LLC
Minneapolis, Minnesota
Legal Counsel
Dechert LLP
Washington, District of Columbia
Independent Registered Public Accounting Firm
KPMG LLP
Philadelphia, Pennsylvania
Distributor
NYLIFE Distributors LLC3
Jersey City, New Jersey
Custodian
JPMorgan Chase Bank, N.A.
New York, New York
1.
This Fund is registered for sale in AZ, CA, NV, OR, TX, UT, WA and MI (Class A and Class I shares only), and CO, FL, GA, HI, ID, MA, MD, NH, NJ and NY (Class I shares only).
| 2. | This Fund is registered for sale in CA, CT, DE, FL, MA, NJ, NY and VT. |
| 3. | An affiliate of New York Life Investment Management LLC. |
Not part of the Annual Report
For more information
800-624-6782
newyorklifeinvestments.com
“New York Life Investments” is both a service mark, and the common trade name, of certain investment advisors affiliated with New York Life Insurance Company. The MainStay Funds® are managed by New York Life Investment Management LLC and distributed by NYLIFE Distributors LLC, 30 Hudson Street, Jersey City, NJ 07302, a wholly owned subsidiary of New York Life Insurance Company. NYLIFE Distributors LLC is a Member FINRA/SIPC.
©2023 NYLIFE Distributors LLC. All rights reserved.
| 5013734MS139-23 | MSEIC11-12/23 |
(NYLIM) NL319
MainStay Epoch U.S. Equity
Yield Fund
Message from the President and Annual Report
October 31, 2023
Special Notice:
Beginning in July 2024, new regulations issued by the Securities and Exchange Commission (SEC) will take effect requiring open-end mutual fund companies and ETFs to (1) overhaul the content of their shareholder reports and (2) mail paper copies of the new tailored shareholder reports to shareholders who have not opted to receive these documents electronically.
If you have not yet elected to receive your shareholder reports electronically, please contact your financial intermediary or visit newyorklifeinvestments.com/accounts.
| Not FDIC/NCUA Insured | Not a Deposit | May Lose Value | No Bank Guarantee | Not Insured by Any Government Agency |
This page intentionally left blank
Message from the President
Volatile economic and geopolitical forces drove market behavior during the 12-month reporting period ended October 31, 2023. While equity markets generally gained ground, bond prices trended broadly lower.
Although the war in Ukraine, the outbreak of hostilities in the Middle East and several other notable events affected financial assets, inflation and interest rate trends stood at the forefront of market developments during most of the period. As the reporting period began, high levels of inflation already showed signs of easing in the face of aggressive rate hikes by the U.S. Federal Reserve (the “Fed”). From a peak of 9.1% in June 2022, the annualized U.S. inflation rate dropped to 7.1% in November 2022, and to 3.2% in October 2023. At the same time, the Fed increased the benchmark federal funds rate from 3.75%–4.00% at the beginning of the reporting period to 5.25%–5.50% as of October 31, 2023. As the pace of rate increases slowed during the period, investors hoped for an early shift to a looser monetary policy. However, comments from Fed members late in the period reinforced the central bank’s hawkish stance in response to surprisingly robust U.S. economic growth and rising wage pressures, thus increasing the likelihood that interest rates would stay higher for longer. International developed markets exhibited similar dynamics of elevated inflation and rising interest rates.
Despite the backdrop of high interest rates—along with political dysfunction in Washington D.C. and intensifying global geopolitical instability—equity markets managed to advance, supported by healthy consumer spending trends and persistent domestic economic growth. The S&P 500® Index, a widely regarded benchmark of large-cap U.S. market performance, gained ground, bolstered by the strong performance of energy stocks amid surging petroleum prices and mega-cap, growth-oriented, technology-related shares, which rose as investors flocked to companies creating the infrastructure for developments in artificial intelligence. Smaller-cap stocks and value-oriented shares produced milder returns. Among industry sectors, energy and
information technology posted the strongest gains. Real estate declined most sharply under pressure from rising mortgage rates and weak levels of office occupancy. Developed international markets outperformed U.S. markets, with Europe benefiting during the first half of the period from unexpected economic resilience in the face of rising energy prices and the ongoing war in Ukraine. Emerging markets posted positive results but lagged developed markets, largely due to slow economic growth in China despite the relaxation of pandemic-era lockdowns.
Bond prices were driven lower by rising yields and increasing expectations of high interest rates for an extended period of time. The U.S. yield curve steepened, with the 30-year Treasury yield exceeding 5% for the first time in more than a decade. The yield curve remained inverted, with the 10-year Treasury yield ending the period at 4.88%, compared with 5.07% for the 2-year Treasury yield. Corporate bonds outperformed long-term Treasury bonds, but still trended lower under pressure from rising yields and an uptick in default rates. Among corporates, lower-credit-quality instruments performed slightly better than their higher-credit-quality counterparts, while floating rate securities performed better still.
In the face of today’s uncertain market environment, New York Life Investments remains dedicated to providing the guidance, resources and investment solutions you need to pursue your financial goals.
Thank you for trusting us to help meet your investment needs.
Sincerely,
Kirk C. Lehneis
President
The opinions expressed are as of the date of this report and are subject to change. There is no guarantee that any forecast made will come to pass. This material does not constitute investment advice and is not intended as an endorsement of any specific investment. Past performance is no guarantee of future results.
Not part of the Annual Report
Investors should refer to the Fund’s Summary Prospectus and/or Prospectus and consider the Fund’s investment objectives, strategies, risks, charges and expenses carefully before investing. The Summary Prospectus and/or Prospectus contain this and other information about the Fund. You may obtain copies of the Fund’s Summary Prospectus, Prospectus and Statement of Additional Information, which includes information about the MainStay Funds Trust's Trustees, free of charge, upon request, by calling toll-free 800-624-6782, by writing to NYLIFE Distributors LLC, Attn: MainStay Marketing Department, 30 Hudson Street, Jersey City, NJ 07302 or by sending an e-mail to MainStayShareholderServices@nylim.com. These documents are also available via the MainStay Funds’ website at newyorklifeinvestments.com. Please read the Fund’s Summary Prospectus and/or Prospectus carefully before investing.
Investment and Performance Comparison (Unaudited)
Performance data quoted represents past performance. Past performance is no guarantee of future results. Because of market volatility and other factors, current performance may be lower or higher than the figures shown. Investment return and principal value will fluctuate, and as a result, when shares are redeemed, they may be worth more or less than their original cost. The graph below depicts the historical performance of Class I shares of the Fund. Performance will vary from class to class based on differences in class-specific expenses and sales charges. For performance information current to the most recent month-end, please call 800-624-6782 or visit newyorklifeinvestments.com.
The performance table and graph do not reflect the deduction of taxes that a shareholder would pay on distributions or Fund share redemptions. Total returns reflect maximum applicable sales charges as indicated in the table below, if any, changes in share price, and reinvestment of dividend and capital gain distributions. The graph assumes the initial investment amount shown below and reflects the deduction of all sales charges that would have applied for the period of investment. Performance figures may reflect certain fee waivers and/or expense limitations, without which total returns may have been lower. For more information on share classes and current fee waivers and/or expense limitations (if any), please refer to the Notes to Financial Statements.
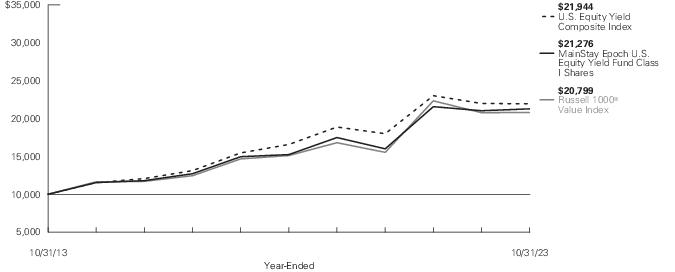
| Average Annual Total Returns for the Year-Ended October 31, 2023 |
| Class | Sales Charge | | Inception
Date | One
Year | Five
Years | Ten Years
or Since
Inception | Gross
Expense
Ratio1 |
| Class A Shares | Maximum 5.50% Initial Sales Charge | With sales charges | 2/3/2009 | -4.68% | 5.37% | 6.94% | 1.05% |
| | | Excluding sales charges | | 0.87 | 6.57 | 7.54 | 1.05 |
| Investor Class Shares2 | Maximum 5.00% Initial Sales Charge | With sales charges | 11/16/2009 | -4.43 | 5.11 | 6.71 | 1.30 |
| | | Excluding sales charges | | 0.60 | 6.31 | 7.31 | 1.30 |
| Class B Shares3 | Maximum 5.00% CDSC | With sales charges | 5/8/2017 | -5.02 | 5.18 | 5.28 | 2.06 |
| | if Redeemed Within the First Six Years of Purchase | Excluding sales charges | | -0.16 | 5.51 | 5.28 | 2.06 |
| Class C Shares | Maximum 1.00% CDSC | With sales charges | 11/16/2009 | -1.13 | 5.52 | 6.52 | 2.06 |
| | if Redeemed Within One Year of Purchase | Excluding sales charges | | -0.16 | 5.52 | 6.52 | 2.06 |
| Class I Shares | No Sales Charge | | 12/3/2008 | 1.18 | 6.90 | 7.84 | 0.80 |
| Class R1 Shares4 | No Sales Charge | | 5/8/2017 | 1.01 | 6.74 | 6.48 | 0.90 |
| Class R2 Shares4 | No Sales Charge | | 5/8/2017 | 0.77 | 6.48 | 6.21 | 1.15 |
| Class R3 Shares4 | No Sales Charge | | 5/8/2017 | 0.46 | 6.20 | 5.94 | 1.40 |
| Class R6 Shares | No Sales Charge | | 5/8/2017 | 1.19 | 6.94 | 6.69 | 0.73 |
| SIMPLE Class Shares | No Sales Charge | | 8/31/2020 | 0.55 | N/A | 7.15 | 1.42 |
| 1. | The gross expense ratios presented reflect the Fund’s “Total Annual Fund Operating Expenses” from the most recent Prospectus, as supplemented, and may differ from other expense ratios disclosed in this report. |
| 2. | Prior to June 30, 2020, the maximum initial sales charge was 5.50%, which is reflected in the applicable average annual total return figures shown. |
| 3. | Class B shares are closed to all new purchases as well as additional investments by existing Class B shareholders. |
| 4. | As of October 31, 2023, Class R1, Class R2 and Class R3 shares are closed to new investors and, upon the close of business on December 29, 2023, Class R1, Class R2 and Class R3 shares are closed to additional investments by existing shareholders. Additionally, Class R1, Class R2 and Class R3 shares will be liquidated on or about February 28, 2024 (the "Liquidation Date"). It is expected that the Fund will distribute to remaining shareholders invested in Class R1, Class R2 or Class R3 shares, on or promptly after the Liquidation Date, a liquidating distribution in cash or cash equivalents equal to the net asset value of such shares. |
The footnotes on the next page are an integral part of the table and graph and should be carefully read in conjunction with them.
| Benchmark Performance* | One
Year | Five
Years | Ten
Years |
| Russell 1000® Value Index1 | 0.13% | 6.60% | 7.60% |
| U.S. Equity Yield Composite Index2 | -0.20 | 5.78 | 8.18 |
| Morningstar Large Value Category Average3 | 0.68 | 7.10 | 7.62 |
| * | Returns for indices reflect no deductions for fees, expenses or taxes, except for foreign withholding taxes where applicable. Results assume reinvestment of all dividends and capital gains. An investment cannot be made directly in an index. |
| 1. | The Fund has selected the Russell 1000® Value Index as its primary benchmark. The Russell 1000® Value Index measures the performance of the large-cap value segment of the U.S. equity universe. It includes those Russell 1000® Index companies with lower price-to-book ratios and lower expected growth values. |
| 2. | The Fund has selected the U.S. Equity Yield Composite Index as its secondary benchmark. The U.S. Equity Yield Composite Index consists of the MSCI USA High Dividend Yield Index and the MSCI USA Minimum Volatility (USD) Index weighted at 60% and 40%, respectively. The MSCI USA High Dividend Yield Index is based on the MSCI USA Index and includes large- and mid-cap stocks. The MSCI USA High Dividend Yield Index is designed to reflect the performance of equities in the MSCI USA Index (excluding real estate investment trusts) with higher dividend income and quality characteristics than average dividend yields that are both sustainable and persistent. The MSCI USA Minimum Volatility (USD) Index aims to reflect the performance characteristics of a minimum variance strategy applied to the large- and mid-cap U.S. equity universe. The MSCI USA Minimum Volatility (USD) Index is calculated by optimizing the MSCI USA Index in U.S. dollars for the lowest absolute risk (within a given set of constraints). |
| 3. | The Morningstar Large Value Category Average is representative of funds that invest primarily in big U.S. companies that are less expensive or growing more slowly than other large-cap stocks. Results are based on average total returns of similar funds with all dividends and capital gain distributions reinvested. |
The footnotes on the preceding page are an integral part of the table and graph and should be carefully read in conjunction with them.
| 6 | MainStay Epoch U.S. Equity Yield Fund |
Cost in Dollars of a $1,000 Investment in MainStay Epoch U.S. Equity Yield Fund (Unaudited)
The example below is intended to describe the fees and expenses borne by shareholders during the six-month period from May 1, 2023 to October 31, 2023, and the impact of those costs on your investment.
Example
As a shareholder of the Fund you incur two types of costs: (1) transaction costs, including exchange fees and sales charges (loads) on purchases (as applicable), and (2) ongoing costs, including management fees, distribution and/or service (12b-1) fees and other Fund expenses (as applicable). This example is intended to help you understand your ongoing costs (in dollars) of investing in the Fund and to compare these costs with the ongoing costs of investing in other mutual funds. The example is based on an investment of $1,000 made at the beginning of the six-month period and held for the entire period from May 1, 2023 to October 31, 2023.
This example illustrates your Fund’s ongoing costs in two ways:
Actual Expenses
The second and third data columns in the table below provide information about actual account values and actual expenses. You may use the information in these columns, together with the amount you invested, to estimate the expenses that you paid during the six months ended October 31, 2023. Simply divide your account value by $1,000 (for example, an
$8,600 account value divided by $1,000 = 8.6), then multiply the result by the number under the heading entitled “Expenses Paid During Period” to estimate the expenses you paid on your account during this period.
Hypothetical Example for Comparison Purposes
The fourth and fifth data columns in the table below provide information about hypothetical account values and hypothetical expenses based on the Fund’s actual expense ratio and an assumed rate of return of 5% per year before expenses, which is not the Fund’s actual return. The hypothetical account values and expenses may not be used to estimate the actual ending account balances or expenses you paid for the six-month period shown. You may use this information to compare the ongoing costs of investing in the Fund with the ongoing costs of investing in other mutual funds. To do so, compare this 5% hypothetical example with the 5% hypothetical examples that appear in the shareholder reports of the other mutual funds.
Please note that the expenses shown in the table are meant to highlight your ongoing costs only and do not reflect any transactional costs, such as exchange fees or sales charges (loads). Therefore, the fourth and fifth data columns of the table are useful in comparing ongoing costs only and will not help you determine the relative total costs of owning different funds. In addition, if these transactional costs were included, your costs would have been higher.
| Share Class | Beginning
Account
Value
5/1/23 | Ending Account
Value (Based
on Actual
Returns and
Expenses)
10/31/23 | Expenses
Paid
During
Period1 | Ending Account
Value (Based
on Hypothetical
5% Annualized
Return and
Actual Expenses)
10/31/23 | Expenses
Paid
During
Period1 | Net Expense
Ratio
During
Period2 |
| Class A Shares | $1,000.00 | $969.70 | $ 5.31 | $1,019.81 | $ 5.45 | 1.07% |
| Investor Class Shares | $1,000.00 | $968.80 | $ 6.60 | $1,018.50 | $ 6.77 | 1.33% |
| Class B Shares | $1,000.00 | $965.00 | $10.30 | $1,014.72 | $10.56 | 2.08% |
| Class C Shares | $1,000.00 | $965.00 | $10.30 | $1,014.72 | $10.56 | 2.08% |
| Class I Shares | $1,000.00 | $971.70 | $ 3.63 | $1,021.53 | $ 3.72 | 0.73% |
| Class R1 Shares | $1,000.00 | $970.80 | $ 4.57 | $1,020.57 | $ 4.69 | 0.92% |
| Class R2 Shares | $1,000.00 | $969.80 | $ 5.81 | $1,019.31 | $ 5.96 | 1.17% |
| Class R3 Shares | $1,000.00 | $968.00 | $ 7.04 | $1,018.05 | $ 7.22 | 1.42% |
| Class R6 Shares | $1,000.00 | $971.70 | $ 3.63 | $1,021.53 | $ 3.72 | 0.73% |
| SIMPLE Class Shares | $1,000.00 | $968.30 | $ 6.45 | $1,018.65 | $ 6.61 | 1.30% |
| 1. | Expenses are equal to the Fund’s annualized expense ratio of each class multiplied by the average account value over the period, divided by 365 and multiplied by 184 (to reflect the six-month period). The table above represents the actual expenses incurred during the six-month period. In addition to the fees and expenses which the Fund bears directly, it also indirectly bears a pro rata share of the fees and expenses of the underlying funds in which it invests. Such indirect expenses are not included in the above-reported expense figures. |
| 2. | Expenses are equal to the Fund's annualized expense ratio to reflect the six-month period. |
Industry Composition as of October 31, 2023 (Unaudited)
| Banks | 7.7% |
| Pharmaceuticals | 7.4 |
| Oil, Gas & Consumable Fuels | 6.2 |
| Semiconductors & Semiconductor Equipment | 5.9 |
| Electric Utilities | 5.7 |
| Insurance | 5.7 |
| Chemicals | 5.1 |
| Electrical Equipment | 3.5 |
| Health Care Providers & Services | 3.4 |
| Aerospace & Defense | 3.0 |
| Biotechnology | 2.7 |
| Specialized REITs | 2.7 |
| Capital Markets | 2.6 |
| Beverages | 2.5 |
| Multi–Utilities | 2.5 |
| Technology Hardware, Storage & Peripherals | 2.4 |
| Household Products | 2.4 |
| Media | 2.3 |
| Hotels, Restaurants & Leisure | 1.9 |
| Consumer Staples Distribution & Retail | 1.8 |
| Tobacco | 1.8 |
| Diversified Telecommunication Services | 1.8% |
| Software | 1.8 |
| Machinery | 1.7 |
| Specialty Retail | 1.5 |
| Communications Equipment | 1.5 |
| Health Care Equipment & Supplies | 1.4 |
| IT Services | 1.4 |
| Trading Companies & Distributors | 1.3 |
| Commercial Services & Supplies | 1.2 |
| Professional Services | 1.2 |
| Industrial Conglomerates | 1.0 |
| Air Freight & Logistics | 0.9 |
| Leisure Products | 0.8 |
| Health Care REITs | 0.6 |
| Household Durables | 0.5 |
| Containers & Packaging | 0.5 |
| Industrial REITs | 0.5 |
| Retail REITs | 0.5 |
| Other Assets, Less Liabilities | 0.7 |
| | 100.0% |
See Portfolio of Investments beginning on page 11 for specific holdings within these categories. The Fund's holdings are subject to change.
Top Ten Holdings and/or Issuers Held as of October 31, 2023 (excluding short-term investments) (Unaudited)
| 1. | Broadcom, Inc. |
| 2. | JPMorgan Chase & Co. |
| 3. | Eli Lilly & Co. |
| 4. | UnitedHealth Group, Inc. |
| 5. | MetLife, Inc. |
| 6. | AbbVie, Inc. |
| 7. | Chevron Corp. |
| 8. | Merck & Co., Inc. |
| 9. | Walmart, Inc. |
| 10. | Microsoft Corp. |
| 8 | MainStay Epoch U.S. Equity Yield Fund |
Portfolio Management Discussion and Analysis (Unaudited)
Questions answered by portfolio managers Michael A. Welhoelter, CFA, William W. Priest,1 CFA, John Tobin, PhD, CFA, and Kera Van Valen, CFA, of Epoch Investment Partners, Inc., the Fund’s Subadvisor.
How did MainStay Epoch U.S. Equity Yield Fund perform relative to its benchmarks and peer group during the 12 months ended October 31, 2023?
For the 12 months ended October 31, 2023, Class I shares of MainStay Epoch U.S. Equity Yield Fund returned 1.18%, outperforming the 0.13% return of the Fund’s primary benchmark, the Russell 1000® Value Index. Over the same period, Class I shares also outperformed the −0.20% return of the U.S. Equity Yield Composite Index, which is the Fund’s secondary benchmark, and the 0.68% return of the Morningstar Large Value Category Average.2
What factors affected the Fund’s relative performance during the reporting period?
The last twelve months saw sentiment swing several times as investors grappled with the trajectory of interest rates and global growth. While risk appetites trended downward in late 2022, the first quarter of 2023 marked a stark reversal in sentiment as broad market indices rose sharply on hopes of a soft-landing and disinflation traction. The first half of 2023 saw a sustained rally in U.S. equities fueled by a handful of mega-cap technology-related stocks riding a wave of enthusiasm for developments in artificial intelligence (“AI”), however the third quarter saw sentiment reverse due to persisting macro headwinds.
The Fund outperformed the Russell 1000® Value Index largely due to positive contributions from information technology and health care. (Contributions take weightings and total returns into account.) Overweight allocation and stock selection drove the Fund’s relatively strong returns in information technology. Exposure to select semiconductor stocks provided a tailwind, with one out-of-Index holding, in particular, significantly aiding relative returns. In health care, stock selection in pharmaceuticals bolstered relative returns, largely due to overweight exposure to the top-performing industry name in the Index.
During the reporting period, which sectors were the strongest positive contributors to the Fund’s relative performance and which sectors were particularly weak?
During the reporting period, the strongest positive contributions to the Fund’s performance relative to the Russell 1000® Value Index came from the information technology sector. Stock selection in health care further strengthened relative results. Conversely, underweight exposure to communication services detracted most significantly from relative returns, as it was the best-performing sector in the Index. Stock selection in communication services detracted from relative returns as well.
During the reporting period, which individual stocks made the strongest positive contributions to the Fund’s absolute performance and which stocks detracted the most?
Top contributors to the Fund’s absolute performance during the reporting period included U.S.-based pharmaceutical company Eli Lilly and Ireland-based power management firm Eaton.
Eli Lilly discovers, develops and commercializes medicines in large, growing and defensive therapeutic areas with high unmet needs. Shares trended steadily higher during the reporting period on continued enthusiasm for so-called "GLP-1" drugs, initially introduced to treat diabetes and subsequently applied to the obesity therapeutic area. Estimates of the potential size of the GLP-1 market are quite large, and Eli Lilly is one of two currently dominant players expected to roughly split the market between them. Eli Lilly shares also benefited from strong Phase 3 clinical study results for the company’s Alzheimer's drug candidate, which may be approved for marketing in the U.S. by the end of 2023. Eli Lilly returns cash to owners through a growing dividend and regular share repurchases. We believe the dividend is targeted to grow in line with earnings and is well covered by free cash flow.
Eaton manufactures engineered products for the industrial, vehicle, construction, commercial and aerospace markets. The share price responded positively to continued demand growth for Eaton's power management products, which drove an improved backlog in the company's electrical and aerospace business segments. As pandemic-related supply-chain constraints eased and orders were fulfilled, Eaton experienced accelerated organic sales growth and improved operating margins. We believe that Eaton is committed to paying an attractive, growing dividend and repurchasing shares, with both programs comfortably covered by free cash flow.
The most significant detractors from the Fund’s absolute performance during the same period included regional U.S. banks KeyCorp and U.S. Bancorp.
KeyCorp maintains branches in 15 states in the Northeast, Midwest, and Northwest United States. The company has a valuable, low-cost deposit franchise, a diversified loan portfolio and a well-capitalized balance sheet, which we believe should allow Keycorp to earn mid-teens returns on equity on a mid-cycle basis. Shares declined along with those of banking industry peers as the failures of Silicon Valley Bank and Signature Bank caused a crisis of confidence that reverberated through the entire sector. We believe KeyCorp will continue to generate strong earnings power. However, with higher capital standards for the industry expected to be imposed by regulators, we anticipate that KeyCorp will need to build equity by retaining a greater proportion of
| 1. | Effective on or about March 31, 2024, William W. Priest will no longer serve as a portfolio manager for the Fund. |
| 2. | See "Investment and Performance Comparison" for other share class returns, which may be higher or lower than Class I share returns, and for more information on benchmark and peer group returns. |
earnings, holding dividends flat and deferring share repurchases for several years. We exited the Fund’s position in favor of other investment opportunities in the sector that offer stronger potential for capital returns over the medium term.
U.S. Bancorp serves retail and commercial customers throughout the Midwest and Western United States. Shares traded down as the regional bank crisis noted above reverberated through the financial services sector. Although the crisis may result in higher near-term funding costs and increased retained capital levels for the industry, we believe U.S. Bancorp's low-cost deposit franchise, coupled with expense synergies from the company’s recent merger with Union Bank, will generate continued strong earnings power and support attractive, growing dividends. We also expect the company to direct excess capital toward share buybacks during normal economic conditions.
What were some of the Fund’s largest purchases and sales during the reporting period?
Notable positions initiated during the reporting period included global pharmaceutical company Bristol-Myers Squibb, and technology hardware and gaming-focused real estate investment trust (“REIT”) VICI Properties, both located in the United States.
Bristol-Myers holds a broad portfolio of patent-protected drugs across multiple therapeutic areas, with several in-market blockbuster drugs, including oral anti-coagulant Eliquis, cancer drugs Opdivo and Yervoy, and immunology drug Orencia. In addition, the company's "new products portfolio" includes a number of recently approved drugs experiencing rapid growth. Bristol-Myers pays an attractive, well-covered and growing dividend, and has historically supplemented dividend payments with regular share repurchases. Following the company’s 2019 acquisition of Celgene, debt reduction took precedence over share buybacks however, with debt now substantially reduced, the company is expected to resume share repurchase activity.
VICI Properties owns a number of properties on the Las Vegas Strip (including Caesars Palace Las Vegas, MGM Grand Las Vegas, and the Venetian Resort Las Vegas) that it leases to top-tier operators. The company also holds a number of well-placed regional gaming assets, including the Hard Rock Casino Cincinnati, MGM National Harbor in Maryland, Century City Cape Girardeau in Missouri, the Borgata in Atlantic City and Harrah's Lake Tahoe, also with leading operators. All the properties are operated under long-term, triple net lease agreements. VICI pays a steadily growing dividend that yields approximately 5% and is expected to grow with Adjusted Funds From Operation per share in the mid-single digit range.
We closed a few of the Fund’s positions during the reporting period, including commercial REIT W.P. Carey and midstream energy company Magellan Midstream Partners, both based in the United States.
W.P. Carey owns a portfolio of commercial real estate leased to a broadly diverse group of tenants spanning multiple geographic regions. Shares fell on the announcement in September 2023 that the company would soon completely divest its office property portfolio. The announcement took the market by surprise and was met with some skepticism that the move would achieve management's goal of a material rerating of the company's cost of equity. Given the prospects of a smaller property portfolio, a challenging growth outlook near-term, and an expectation that the dividend would be re-based to reflect the company's somewhat smaller scale, we chose to close the position.
Magellan Midstream Partners transports, distributes and stores refined petroleum products and crude oil. The company has an attractive asset footprint, a strong balance sheet and the absence of burdensome Incentive Distribution Rights. Shares outperformed after the company’s midstream peer ONEOK announced the acquisition of Magellan Midstream Partners at an attractive valuation. We exited the Fund’s position in favor of other shareholder yield investments.
How did the Fund’s sector weightings change during the reporting period?
The Fund’s most significant sector weighting changes during the reporting period included decreases in financials and health care, and increases in information technology and industrials. The Fund’s sector allocations are a result of our bottom-up, fundamental investment process and reflect the companies and securities that we confidently believe can collect and distribute sustainable, growing shareholder yield.
How was the Fund positioned at the end of the reporting period?
As of October 31, 2023, the Fund’s largest sector allocations, on an absolute basis, were to financials and health care, while its smallest total sector allocations were to communication services and real estate. As of the same date, relative to the Russell 1000® Value Index, the Fund held its most overweight exposure to utilities, a defensive sector that is typically more heavily represented in the Fund, as well as information technology. The Fund’s most significantly underweight exposures were to financials and energy.
The opinions expressed are those of the portfolio managers as of the date of this report and are subject to change. There is no guarantee that any forecasts will come to pass. This material does not constitute investment advice and is not intended as an endorsement of any specific investment.
| 10 | MainStay Epoch U.S. Equity Yield Fund |
Portfolio of Investments October 31, 2023†^
| | Shares | Value |
| Common Stocks 99.3% |
| Aerospace & Defense 3.0% |
| General Dynamics Corp. | 41,234 | $ 9,950,176 |
| Lockheed Martin Corp. | 19,739 | 8,974,139 |
| RTX Corp. | 100,097 | 8,146,895 |
| | | 27,071,210 |
| Air Freight & Logistics 0.9% |
| United Parcel Service, Inc., Class B | 54,088 | 7,639,930 |
| Banks 7.7% |
| Bank of America Corp. | 573,495 | 15,105,858 |
| Columbia Banking System, Inc. | 342,965 | 6,746,122 |
| JPMorgan Chase & Co. | 150,933 | 20,988,743 |
| PNC Financial Services Group, Inc. (The) | 50,275 | 5,754,979 |
| Regions Financial Corp. | 368,542 | 5,354,915 |
| Truist Financial Corp. | 160,019 | 4,538,139 |
| U.S. Bancorp | 331,551 | 10,569,846 |
| | | 69,058,602 |
| Beverages 2.5% |
| Coca-Cola Co. (The) | 129,084 | 7,291,955 |
| Coca-Cola Europacific Partners plc | 149,674 | 8,757,426 |
| PepsiCo, Inc. | 39,676 | 6,478,297 |
| | | 22,527,678 |
| Biotechnology 2.7% |
| AbbVie, Inc. | 124,736 | 17,610,228 |
| Amgen, Inc. | 27,067 | 6,921,032 |
| | | 24,531,260 |
| Capital Markets 2.6% |
| BlackRock, Inc. | 16,088 | 9,850,360 |
| CME Group, Inc. | 33,737 | 7,201,500 |
| Lazard Ltd., Class A | 222,532 | 6,179,714 |
| | | 23,231,574 |
| Chemicals 5.1% |
| Air Products and Chemicals, Inc. | 27,157 | 7,670,223 |
| Dow, Inc. | 147,672 | 7,138,464 |
| Linde plc | 31,669 | 12,102,625 |
| LyondellBasell Industries NV, Class A | 79,407 | 7,165,688 |
| Nutrien Ltd. | 108,856 | 5,845,567 |
| PPG Industries, Inc. | 47,675 | 5,853,060 |
| | | 45,775,627 |
| Commercial Services & Supplies 1.2% |
| Republic Services, Inc. | 34,613 | 5,139,684 |
| Waste Management, Inc. | 33,272 | 5,467,588 |
| | | 10,607,272 |
| | Shares | Value |
| |
| Communications Equipment 1.5% |
| Cisco Systems, Inc. | 257,688 | $ 13,433,276 |
| Consumer Staples Distribution & Retail 1.8% |
| Walmart, Inc. | 100,731 | 16,460,453 |
| Containers & Packaging 0.5% |
| Amcor plc | 550,287 | 4,892,051 |
| Diversified Telecommunication Services 1.8% |
| AT&T, Inc. | 439,402 | 6,766,791 |
| Verizon Communications, Inc. | 261,683 | 9,192,924 |
| | | 15,959,715 |
| Electric Utilities 5.7% |
| Alliant Energy Corp. | 126,765 | 6,184,864 |
| American Electric Power Co., Inc. | 166,088 | 12,546,288 |
| Duke Energy Corp. | 51,679 | 4,593,746 |
| Entergy Corp. | 81,083 | 7,750,724 |
| Evergy, Inc. | 118,286 | 5,812,574 |
| NextEra Energy, Inc. | 157,827 | 9,201,314 |
| Pinnacle West Capital Corp. | 69,289 | 5,139,858 |
| | | 51,229,368 |
| Electrical Equipment 3.5% |
| Eaton Corp. plc | 56,353 | 11,716,352 |
| Emerson Electric Co. | 139,139 | 12,379,197 |
| Hubbell, Inc. | 25,708 | 6,943,731 |
| | | 31,039,280 |
| Health Care Equipment & Supplies 1.4% |
| Medtronic plc | 182,574 | 12,882,420 |
| Health Care Providers & Services 3.4% |
| CVS Health Corp. | 161,849 | 11,169,200 |
| UnitedHealth Group, Inc. | 37,031 | 19,832,322 |
| | | 31,001,522 |
| Health Care REITs 0.6% |
| Welltower, Inc. | 62,477 | 5,223,702 |
| Hotels, Restaurants & Leisure 1.9% |
| McDonald's Corp. | 38,272 | 10,033,770 |
| Vail Resorts, Inc. | 32,946 | 6,992,789 |
| | | 17,026,559 |
| Household Durables 0.5% |
| Garmin Ltd. | 47,800 | 4,900,934 |
The notes to the financial statements are an integral part of, and should be read in conjunction with, the financial statements.
11
Portfolio of Investments October 31, 2023†^ (continued)
| | Shares | Value |
| Common Stocks (continued) |
| Household Products 2.4% |
| Colgate-Palmolive Co. | 80,748 | $ 6,065,790 |
| Kimberly-Clark Corp. | 39,323 | 4,704,604 |
| Procter & Gamble Co. (The) | 71,381 | 10,709,291 |
| | | 21,479,685 |
| Industrial Conglomerates 1.0% |
| Honeywell International, Inc. | 50,746 | 9,299,712 |
| Industrial REITs 0.5% |
| Prologis, Inc. | 47,829 | 4,818,772 |
| Insurance 5.7% |
| Arthur J. Gallagher & Co. | 44,178 | 10,403,477 |
| Marsh & McLennan Cos., Inc. | 52,856 | 10,024,141 |
| MetLife, Inc. | 313,833 | 18,833,118 |
| Travelers Cos., Inc. (The) | 69,886 | 11,701,712 |
| | | 50,962,448 |
| IT Services 1.4% |
| International Business Machines Corp. | 84,126 | 12,167,985 |
| Leisure Products 0.8% |
| Hasbro, Inc. | 166,287 | 7,507,858 |
| Machinery 1.7% |
| Cummins, Inc. | 72,604 | 15,704,245 |
| Media 2.3% |
| Comcast Corp., Class A | 351,643 | 14,519,340 |
| Omnicom Group, Inc. | 84,896 | 6,359,559 |
| | | 20,878,899 |
| Multi-Utilities 2.5% |
| Ameren Corp. | 65,602 | 4,966,727 |
| CMS Energy Corp. | 123,794 | 6,726,966 |
| NiSource, Inc. | 232,260 | 5,843,662 |
| WEC Energy Group, Inc. | 56,652 | 4,610,906 |
| | | 22,148,261 |
| Oil, Gas & Consumable Fuels 6.2% |
| Chevron Corp. | 113,648 | 16,561,923 |
| Enterprise Products Partners LP | 482,022 | 12,551,853 |
| MPLX LP | 293,179 | 10,566,171 |
| TotalEnergies SE, Sponsored ADR | 108,177 | 7,204,588 |
| Williams Cos., Inc. (The) | 260,831 | 8,972,587 |
| | | 55,857,122 |
| | Shares | Value |
| |
| Pharmaceuticals 7.4% |
| Bristol-Myers Squibb Co. | 106,003 | $ 5,462,334 |
| Eli Lilly & Co. | 37,231 | 20,623,368 |
| Johnson & Johnson | 105,704 | 15,680,131 |
| Merck & Co., Inc. | 160,354 | 16,468,356 |
| Pfizer, Inc. | 266,964 | 8,158,420 |
| | | 66,392,609 |
| Professional Services 1.2% |
| Automatic Data Processing, Inc. | 24,114 | 5,262,157 |
| Paychex, Inc. | 46,253 | 5,136,396 |
| | | 10,398,553 |
| Retail REITs 0.5% |
| Realty Income Corp. | 85,974 | 4,073,448 |
| Semiconductors & Semiconductor Equipment 5.9% |
| Analog Devices, Inc. | 89,362 | 14,059,324 |
| Broadcom, Inc. | 25,500 | 21,454,935 |
| KLA Corp. | 25,300 | 11,883,410 |
| Texas Instruments, Inc. | 42,811 | 6,079,590 |
| | | 53,477,259 |
| Software 1.8% |
| Microsoft Corp. | 47,041 | 15,905,033 |
| Specialized REITs 2.7% |
| American Tower Corp. | 30,582 | 5,449,407 |
| Iron Mountain, Inc. | 226,988 | 13,408,181 |
| VICI Properties, Inc. | 200,827 | 5,603,073 |
| | | 24,460,661 |
| Specialty Retail 1.5% |
| Best Buy Co., Inc. | 73,570 | 4,915,947 |
| Home Depot, Inc. (The) | 30,029 | 8,548,956 |
| | | 13,464,903 |
| Technology Hardware, Storage & Peripherals 2.4% |
| Apple, Inc. | 43,417 | 7,414,321 |
| Dell Technologies, Inc., Class C | 108,748 | 7,276,329 |
| NetApp, Inc. | 100,332 | 7,302,163 |
| | | 21,992,813 |
| Tobacco 1.8% |
| British American Tobacco plc, Sponsored ADR | 148,578 | 4,436,539 |
| Philip Morris International, Inc. | 130,977 | 11,677,909 |
| | | 16,114,448 |
The notes to the financial statements are an integral part of, and should be read in conjunction with, the financial statements.
| 12 | MainStay Epoch U.S. Equity Yield Fund |
| | Shares | | Value |
| Common Stocks (continued) |
| Trading Companies & Distributors 1.3% |
| MSC Industrial Direct Co., Inc., Class A | 119,708 | | $ 11,342,333 |
Total Investments
(Cost $700,342,996) | 99.3% | | 892,939,480 |
| Other Assets, Less Liabilities | 0.7 | | 6,723,144 |
| Net Assets | 100.0% | | $ 899,662,624 |
| † | Percentages indicated are based on Fund net assets. |
| ^ | Industry classifications may be different than those used for compliance monitoring purposes. |
Investments in Affiliates (in 000's)
Investments in issuers considered to be affiliate(s) of the Fund during the year ended October 31, 2023 for purposes of Section 2(a)(3) of the Investment Company Act of 1940, as amended, were as follows:
| Affiliated Investment Companies | Value,
Beginning
of Year | Purchases
at Cost | Proceeds
from
Sales | Net
Realized
Gain/(Loss)
on Sales | Change in
Unrealized
Appreciation/
(Depreciation) | Value,
End of
Year | Dividend
Income | Other
Distributions | Shares
End of
Year |
| MainStay U.S. Government Liquidity Fund | $ 15,212 | $ 188,533 | $ (203,745) | $ — | $ — | $ — | $ 461 | $ — | — |
| Abbreviation(s): |
| ADR—American Depositary Receipt |
| REIT—Real Estate Investment Trust |
The following is a summary of the fair valuations according to the inputs used as of October 31, 2023, for valuing the Fund’s assets:
| Description | Quoted
Prices in
Active
Markets for
Identical
Assets
(Level 1) | | Significant
Other
Observable
Inputs
(Level 2) | | Significant
Unobservable
Inputs
(Level 3) | | Total |
| Asset Valuation Inputs | | | | | | | |
| Investments in Securities (a) | | | | | | | |
| Common Stocks | $ 892,939,480 | | $ — | | $ — | | $ 892,939,480 |
| (a) | For a complete listing of investments and their industries, see the Portfolio of Investments. |
The notes to the financial statements are an integral part of, and should be read in conjunction with, the financial statements.
13
Statement of Assets and Liabilities as of October 31, 2023
| Assets |
Investment in securities, at value
(identified cost $700,342,996) | $892,939,480 |
| Receivables: | |
| Investment securities sold | 8,769,990 |
| Dividends | 2,109,718 |
| Fund shares sold | 26,824 |
| Securities lending | 181 |
| Other assets | 99,135 |
| Total assets | 903,945,328 |
| Liabilities |
| Due to custodian | 650,464 |
| Payables: | |
| Fund shares redeemed | 2,777,340 |
| Manager (See Note 3) | 518,030 |
| Transfer agent (See Note 3) | 177,747 |
| NYLIFE Distributors (See Note 3) | 120,959 |
| Professional fees | 23,333 |
| Custodian | 10,348 |
| Shareholder communication | 3,045 |
| Trustees | 248 |
| Accrued expenses | 1,190 |
| Total liabilities | 4,282,704 |
| Net assets | $899,662,624 |
| Composition of Net Assets |
| Shares of beneficial interest outstanding (par value of $.001 per share) unlimited number of shares authorized | $ 49,023 |
| Additional paid-in-capital | 680,543,618 |
| | 680,592,641 |
| Total distributable earnings (loss) | 219,069,983 |
| Net assets | $899,662,624 |
| Class A | |
| Net assets applicable to outstanding shares | $442,341,042 |
| Shares of beneficial interest outstanding | 24,198,795 |
| Net asset value per share outstanding | $ 18.28 |
| Maximum sales charge (5.50% of offering price) | 1.06 |
| Maximum offering price per share outstanding | $ 19.34 |
| Investor Class | |
| Net assets applicable to outstanding shares | $ 67,157,054 |
| Shares of beneficial interest outstanding | 3,692,112 |
| Net asset value per share outstanding | $ 18.19 |
| Maximum sales charge (5.00% of offering price) | 0.96 |
| Maximum offering price per share outstanding | $ 19.15 |
| Class B | |
| Net assets applicable to outstanding shares | $ 2,654,274 |
| Shares of beneficial interest outstanding | 150,727 |
| Net asset value and offering price per share outstanding | $ 17.61 |
| Class C | |
| Net assets applicable to outstanding shares | $ 7,953,926 |
| Shares of beneficial interest outstanding | 451,631 |
| Net asset value and offering price per share outstanding | $ 17.61 |
| Class I | |
| Net assets applicable to outstanding shares | $262,298,591 |
| Shares of beneficial interest outstanding | 14,185,791 |
| Net asset value and offering price per share outstanding | $ 18.49 |
| Class R1 | |
| Net assets applicable to outstanding shares | $ 721,215 |
| Shares of beneficial interest outstanding | 39,033 |
| Net asset value and offering price per share outstanding | $ 18.48 |
| Class R2 | |
| Net assets applicable to outstanding shares | $ 1,199,973 |
| Shares of beneficial interest outstanding | 65,658 |
| Net asset value and offering price per share outstanding | $ 18.28 |
| Class R3 | |
| Net assets applicable to outstanding shares | $ 2,471,021 |
| Shares of beneficial interest outstanding | 135,145 |
| Net asset value and offering price per share outstanding | $ 18.28 |
| Class R6 | |
| Net assets applicable to outstanding shares | $112,772,562 |
| Shares of beneficial interest outstanding | 6,098,985 |
| Net asset value and offering price per share outstanding | $ 18.49 |
| SIMPLE Class | |
| Net assets applicable to outstanding shares | $ 92,966 |
| Shares of beneficial interest outstanding | 5,103 |
| Net asset value and offering price per share outstanding | $ 18.22 |
The notes to the financial statements are an integral part of, and should be read in conjunction with, the financial statements.
| 14 | MainStay Epoch U.S. Equity Yield Fund |
Statement of Operations for the year ended October 31, 2023
| Investment Income (Loss) |
| Income | |
| Dividends-unaffiliated (net of foreign tax withholding of $186,088) | $ 33,403,725 |
| Dividends-affiliated | 460,999 |
| Securities lending, net | 21,400 |
| Total income | 33,886,124 |
| Expenses | |
| Manager (See Note 3) | 7,109,229 |
| Distribution/Service—Class A (See Note 3) | 1,201,935 |
| Distribution/Service—Investor Class (See Note 3) | 181,935 |
| Distribution/Service—Class B (See Note 3) | 38,550 |
| Distribution/Service—Class C (See Note 3) | 99,070 |
| Distribution/Service—Class R2 (See Note 3) | 3,212 |
| Distribution/Service—Class R3 (See Note 3) | 13,431 |
| Distribution/Service—SIMPLE Class (See Note 3) | 434 |
| Transfer agent (See Note 3) | 1,016,505 |
| Registration | 161,714 |
| Professional fees | 136,073 |
| Custodian | 28,293 |
| Trustees | 26,860 |
| Shareholder communication | 8,806 |
| Shareholder service (See Note 3) | 4,748 |
| Miscellaneous | 35,598 |
| Total expenses before waiver/reimbursement | 10,066,393 |
| Expense waiver/reimbursement from Manager (See Note 3) | (309,459) |
| Reimbursement from prior custodian(a) | (2,118) |
| Net expenses | 9,754,816 |
| Net investment income (loss) | 24,131,308 |
| Realized and Unrealized Gain (Loss) |
| Net realized gain (loss) on: | |
| Unaffiliated investment transactions | 23,833,492 |
| Foreign currency transactions | (1,085) |
| Net realized gain (loss) | 23,832,407 |
| Net change in unrealized appreciation (depreciation) on investments | (30,639,605) |
| Net realized and unrealized gain (loss) | (6,807,198) |
| Net increase (decrease) in net assets resulting from operations | $ 17,324,110 |
| (a) | Represents a refund for overbilling of custody fees. |
The notes to the financial statements are an integral part of, and should be read in conjunction with, the financial statements.
15
Statements of Changes in Net Assets
for the years ended October 31, 2023 and October 31, 2022
| | 2023 | 2022 |
| Increase (Decrease) in Net Assets |
| Operations: | | |
| Net investment income (loss) | $ 24,131,308 | $ 22,929,099 |
| Net realized gain (loss) | 23,832,407 | 31,113,371 |
| Net change in unrealized appreciation (depreciation) | (30,639,605) | (83,353,644) |
| Net increase (decrease) in net assets resulting from operations | 17,324,110 | (29,311,174) |
| Distributions to shareholders: | | |
| Class A | (17,376,305) | (9,203,234) |
| Investor Class | (2,460,343) | (1,240,229) |
| Class B | (116,821) | (52,088) |
| Class C | (282,010) | (106,742) |
| Class I | (13,109,171) | (7,426,431) |
| Class R1 | (28,460) | (14,511) |
| Class R2 | (45,789) | (24,522) |
| Class R3 | (84,878) | (44,187) |
| Class R6 | (5,163,424) | (3,012,144) |
| SIMPLE Class | (2,799) | (929) |
| Total distributions to shareholders | (38,670,000) | (21,125,017) |
| Capital share transactions: | | |
| Net proceeds from sales of shares | 53,734,944 | 139,051,648 |
| Net asset value of shares issued to shareholders in reinvestment of distributions | 38,183,715 | 20,858,991 |
| Cost of shares redeemed | (234,806,995) | (169,519,523) |
| Increase (decrease) in net assets derived from capital share transactions | (142,888,336) | (9,608,884) |
| Net increase (decrease) in net assets | (164,234,226) | (60,045,075) |
| Net Assets |
| Beginning of year | 1,063,896,850 | 1,123,941,925 |
| End of year | $ 899,662,624 | $1,063,896,850 |
The notes to the financial statements are an integral part of, and should be read in conjunction with, the financial statements.
| 16 | MainStay Epoch U.S. Equity Yield Fund |
Financial Highlights selected per share data and ratios
| | Year Ended October 31, |
| Class A | 2023 | | 2022 | | 2021 | | 2020 | | 2019 |
| Net asset value at beginning of year | $ 18.78 | | $ 19.70 | | $ 14.96 | | $ 17.07 | | $ 15.70 |
| Net investment income (loss) (a) | 0.42 | | 0.39 | | 0.32 | | 0.36 | | 0.36 |
| Net realized and unrealized gain (loss) | (0.23) | | (0.95) | | 4.78 | | (1.83) | | 1.84 |
| Total from investment operations | 0.19 | | (0.56) | | 5.10 | | (1.47) | | 2.20 |
| Less distributions: | | | | | | | | | |
| From net investment income | (0.40) | | (0.36) | | (0.36) | | (0.34) | | (0.37) |
| From net realized gain on investments | (0.29) | | — | | — | | (0.30) | | (0.46) |
| Total distributions | (0.69) | | (0.36) | | (0.36) | | (0.64) | | (0.83) |
| Net asset value at end of year | $ 18.28 | | $ 18.78 | | $ 19.70 | | $ 14.96 | | $ 17.07 |
| Total investment return (b) | 0.87% | | (2.85)% | | 34.30% | | (8.77)% | | 14.49% |
| Ratios (to average net assets)/Supplemental Data: | | | | | | | | | |
| Net investment income (loss) | 2.22% | | 2.00% | | 1.76% | | 2.31% | | 2.21% |
| Net expenses (c) | 1.06% | | 1.05% | | 1.07% | | 1.08%(d) | | 1.08% |
| Expenses (before waiver/reimbursement) (c) | 1.06% | | 1.05% | | 1.07% | | 1.09% | | 1.08% |
| Portfolio turnover rate | 19% | | 25% | | 16% | | 29% | | 18% |
| Net assets at end of year (in 000’s) | $ 442,341 | | $ 483,936 | | $ 508,888 | | $ 379,695 | | $ 450,979 |
| (a) | Per share data based on average shares outstanding during the year. |
| (b) | Total investment return is calculated exclusive of sales charges and assumes the reinvestment of dividends and distributions. For periods of less than one year, total return is not annualized. |
| (c) | In addition to the fees and expenses which the Fund bears directly, it also indirectly bears a pro-rata share of the fees and expenses of the underlying funds in which it invests. Such indirect expenses are not included in the above expense ratios. |
| (d) | Net of interest expense of less than 0.01%. |
| | Year Ended October 31, |
| Investor Class | 2023 | | 2022 | | 2021 | | 2020 | | 2019 |
| Net asset value at beginning of year | $ 18.69 | | $ 19.61 | | $ 14.89 | | $ 16.99 | | $ 15.63 |
| Net investment income (loss) (a) | 0.37 | | 0.34 | | 0.28 | | 0.32 | | 0.32 |
| Net realized and unrealized gain (loss) | (0.23) | | (0.95) | | 4.75 | | (1.82) | | 1.83 |
| Total from investment operations | 0.14 | | (0.61) | | 5.03 | | (1.50) | | 2.15 |
| Less distributions: | | | | | | | | | |
| From net investment income | (0.35) | | (0.31) | | (0.31) | | (0.30) | | (0.33) |
| From net realized gain on investments | (0.29) | | — | | — | | (0.30) | | (0.46) |
| Total distributions | (0.64) | | (0.31) | | (0.31) | | (0.60) | | (0.79) |
| Net asset value at end of year | $ 18.19 | | $ 18.69 | | $ 19.61 | | $ 14.89 | | $ 16.99 |
| Total investment return (b) | 0.60% | | (3.12)% | | 33.96% | | (8.99)% | | 14.25% |
| Ratios (to average net assets)/Supplemental Data: | | | | | | | | | |
| Net investment income (loss) | 1.95% | | 1.75% | | 1.53% | | 2.07% | | 2.01% |
| Net expenses (c) | 1.33% | | 1.30% | | 1.33% | | 1.33%(d) | | 1.30% |
| Expenses (before waiver/reimbursement) (c) | 1.39% | | 1.30% | | 1.39% | | 1.38% | | 1.35% |
| Portfolio turnover rate | 19% | | 25% | | 16% | | 29% | | 18% |
| Net assets at end of year (in 000's) | $ 67,157 | | $ 73,132 | | $ 86,155 | | $ 81,365 | | $ 100,602 |
| (a) | Per share data based on average shares outstanding during the year. |
| (b) | Total investment return is calculated exclusive of sales charges and assumes the reinvestment of dividends and distributions. For periods of less than one year, total return is not annualized. |
| (c) | In addition to the fees and expenses which the Fund bears directly, it also indirectly bears a pro-rata share of the fees and expenses of the underlying funds in which it invests. Such indirect expenses are not included in the above expense ratios. |
| (d) | Net of interest expense of less than 0.01%. |
The notes to the financial statements are an integral part of, and should be read in conjunction with, the financial statements.
17
Financial Highlights selected per share data and ratios
| | Year Ended October 31, |
| Class B | 2023 | | 2022 | | 2021 | | 2020 | | 2019 |
| Net asset value at beginning of year | $ 18.11 | | $ 19.00 | | $ 14.43 | | $ 16.48 | | $ 15.18 |
| Net investment income (loss) (a) | 0.23 | | 0.19 | | 0.14 | | 0.21 | | 0.20 |
| Net realized and unrealized gain (loss) | (0.24) | | (0.92) | | 4.60 | | (1.78) | | 1.77 |
| Total from investment operations | (0.01) | | (0.73) | | 4.74 | | (1.57) | | 1.97 |
| Less distributions: | | | | | | | | | |
| From net investment income | (0.20) | | (0.16) | | (0.17) | | (0.18) | | (0.21) |
| From net realized gain on investments | (0.29) | | — | | — | | (0.30) | | (0.46) |
| Total distributions | (0.49) | | (0.16) | | (0.17) | | (0.48) | | (0.67) |
| Net asset value at end of year | $ 17.61 | | $ 18.11 | | $ 19.00 | | $ 14.43 | | $ 16.48 |
| Total investment return (b) | (0.16)% | | (3.82)% | | 32.98% | | (9.71)% | | 13.40% |
| Ratios (to average net assets)/Supplemental Data: | | | | | | | | | |
| Net investment income (loss) | 1.24% | | 1.01% | | 0.80% | | 1.36% | | 1.29% |
| Net expenses (c) | 2.08% | | 2.06% | | 2.08% | | 2.08%(d) | | 2.05% |
| Expenses (before waiver/reimbursement) (c) | 2.14% | | 2.06% | | 2.14% | | 2.13% | | 2.10% |
| Portfolio turnover rate | 19% | | 25% | | 16% | | 29% | | 18% |
| Net assets at end of year (in 000’s) | $ 2,654 | | $ 4,827 | | $ 7,840 | | $ 8,894 | | $ 14,579 |
| (a) | Per share data based on average shares outstanding during the year. |
| (b) | Total investment return is calculated exclusive of sales charges and assumes the reinvestment of dividends and distributions. For periods of less than one year, total return is not annualized. |
| (c) | In addition to the fees and expenses which the Fund bears directly, it also indirectly bears a pro-rata share of the fees and expenses of the underlying funds in which it invests. Such indirect expenses are not included in the above expense ratios. |
| (d) | Net of interest expense of less than 0.01%. |
| | Year Ended October 31, |
| Class C | 2023 | | 2022 | | 2021 | | 2020 | | 2019 |
| Net asset value at beginning of year | $ 18.11 | | $ 19.00 | | $ 14.43 | | $ 16.47 | | $ 15.17 |
| Net investment income (loss) (a) | 0.22 | | 0.19 | | 0.14 | | 0.20 | | 0.20 |
| Net realized and unrealized gain (loss) | (0.23) | | (0.92) | | 4.60 | | (1.76) | | 1.77 |
| Total from investment operations | (0.01) | | (0.73) | | 4.74 | | (1.56) | | 1.97 |
| Less distributions: | | | | | | | | | |
| From net investment income | (0.20) | | (0.16) | | (0.17) | | (0.18) | | (0.21) |
| From net realized gain on investments | (0.29) | | — | | — | | (0.30) | | (0.46) |
| Total distributions | (0.49) | | (0.16) | | (0.17) | | (0.48) | | (0.67) |
| Net asset value at end of year | $ 17.61 | | $ 18.11 | | $ 19.00 | | $ 14.43 | | $ 16.47 |
| Total investment return (b) | (0.16)% | | (3.82)% | | 32.98% | | (9.66)% | | 13.41% |
| Ratios (to average net assets)/Supplemental Data: | | | | | | | | | |
| Net investment income (loss) | 1.22% | | 1.00% | | 0.81% | | 1.35% | | 1.30% |
| Net expenses (c) | 2.08% | | 2.06% | | 2.08% | | 2.08%(d) | | 2.05% |
| Expenses (before waiver/reimbursement) (c) | 2.14% | | 2.06% | | 2.14% | | 2.13% | | 2.10% |
| Portfolio turnover rate | 19% | | 25% | | 16% | | 29% | | 18% |
| Net assets at end of year (in 000’s) | $ 7,954 | | $ 10,961 | | $ 14,435 | | $ 17,920 | | $ 30,663 |
| (a) | Per share data based on average shares outstanding during the year. |
| (b) | Total investment return is calculated exclusive of sales charges and assumes the reinvestment of dividends and distributions. For periods of less than one year, total return is not annualized. |
| (c) | In addition to the fees and expenses which the Fund bears directly, it also indirectly bears a pro-rata share of the fees and expenses of the underlying funds in which it invests. Such indirect expenses are not included in the above expense ratios. |
| (d) | Net of interest expense of less than 0.01%. |
The notes to the financial statements are an integral part of, and should be read in conjunction with, the financial statements.
| 18 | MainStay Epoch U.S. Equity Yield Fund |
Financial Highlights selected per share data and ratios
| | Year Ended October 31, |
| Class I | 2023 | | 2022 | | 2021 | | 2020 | | 2019 |
| Net asset value at beginning of year | $ 18.99 | | $ 19.91 | | $ 15.11 | | $ 17.24 | | $ 15.85 |
| Net investment income (loss) (a) | 0.49 | | 0.45 | | 0.39 | | 0.41 | | 0.40 |
| Net realized and unrealized gain (loss) | (0.24) | | (0.95) | | 4.82 | | (1.85) | | 1.86 |
| Total from investment operations | 0.25 | | (0.50) | | 5.21 | | (1.44) | | 2.26 |
| Less distributions: | | | | | | | | | |
| From net investment income | (0.46) | | (0.42) | | (0.41) | | (0.39) | | (0.41) |
| From net realized gain on investments | (0.29) | | — | | — | | (0.30) | | (0.46) |
| Total distributions | (0.75) | | (0.42) | | (0.41) | | (0.69) | | (0.87) |
| Net asset value at end of year | $ 18.49 | | $ 18.99 | | $ 19.91 | | $ 15.11 | | $ 17.24 |
| Total investment return (b) | 1.18% | | (2.50)% | | 34.78% | | (8.50)% | | 14.76% |
| Ratios (to average net assets)/Supplemental Data: | | | | | | | | | |
| Net investment income (loss) | 2.56% | | 2.32% | | 2.10% | | 2.63% | | 2.46% |
| Net expenses (c) | 0.73% | | 0.73% | | 0.73% | | 0.76%(d) | | 0.83% |
| Expenses (before waiver/reimbursement) (c) | 0.81% | | 0.80% | | 0.82% | | 0.84% | | 0.83% |
| Portfolio turnover rate | 19% | | 25% | | 16% | | 29% | | 18% |
| Net assets at end of year (in 000’s) | $ 262,299 | | $ 351,106 | | $ 357,565 | | $ 269,100 | | $ 313,261 |
| (a) | Per share data based on average shares outstanding during the year. |
| (b) | Total investment return is calculated exclusive of sales charges and assumes the reinvestment of dividends and distributions. Class I shares are not subject to sales charges. For periods of less than one year, total return is not annualized. |
| (c) | In addition to the fees and expenses which the Fund bears directly, it also indirectly bears a pro-rata share of the fees and expenses of the underlying funds in which it invests. Such indirect expenses are not included in the above expense ratios. |
| (d) | Net of interest expense of less than 0.01%. |
| | Year Ended October 31, |
| Class R1 | 2023 | | 2022 | | 2021 | | 2020 | | 2019 |
| Net asset value at beginning of year | $ 18.98 | | $ 19.90 | | $ 15.11 | | $ 17.24 | | $ 15.84 |
| Net investment income (loss) (a) | 0.46 | | 0.42 | | 0.35 | | 0.41 | | 0.38 |
| Net realized and unrealized gain (loss) | (0.24) | | (0.95) | | 4.82 | | (1.88) | | 1.87 |
| Total from investment operations | 0.22 | | (0.53) | | 5.17 | | (1.47) | | 2.25 |
| Less distributions: | | | | | | | | | |
| From net investment income | (0.43) | | (0.39) | | (0.38) | | (0.36) | | (0.39) |
| From net realized gain on investments | (0.29) | | — | | — | | (0.30) | | (0.46) |
| Total distributions | (0.72) | | (0.39) | | (0.38) | | (0.66) | | (0.85) |
| Net asset value at end of year | $ 18.48 | | $ 18.98 | | $ 19.90 | | $ 15.11 | | $ 17.24 |
| Total investment return (b) | 1.01% | | (2.66)% | | 34.50% | | (8.66)% | | 14.73% |
| Ratios (to average net assets)/Supplemental Data: | | | | | | | | | |
| Net investment income (loss) | 2.37% | | 2.13% | | 1.91% | | 2.54% | | 2.32% |
| Net expenses (c) | 0.91% | | 0.90% | | 0.92% | | 0.93%(d) | | 0.93% |
| Expenses (before waiver/reimbursement) (c) | 0.91% | | 0.90% | | 0.92% | | 0.94% | | 0.93% |
| Portfolio turnover rate | 19% | | 25% | | 16% | | 29% | | 18% |
| Net assets at end of year (in 000’s) | $ 721 | | $ 751 | | $ 719 | | $ 530 | | $ 1,009 |
| (a) | Per share data based on average shares outstanding during the year. |
| (b) | Total investment return is calculated exclusive of sales charges and assumes the reinvestment of dividends and distributions. Class R1 shares are not subject to sales charges. For periods of less than one year, total return is not annualized. |
| (c) | In addition to the fees and expenses which the Fund bears directly, it also indirectly bears a pro-rata share of the fees and expenses of the underlying funds in which it invests. Such indirect expenses are not included in the above expense ratios. |
| (d) | Net of interest expense of less than 0.01%. |
The notes to the financial statements are an integral part of, and should be read in conjunction with, the financial statements.
19
Financial Highlights selected per share data and ratios
| | Year Ended October 31, |
| Class R2 | 2023 | | 2022 | | 2021 | | 2020 | | 2019 |
| Net asset value at beginning of year | $ 18.78 | | $ 19.69 | | $ 14.95 | | $ 17.06 | | $ 15.69 |
| Net investment income (loss) (a) | 0.40 | | 0.37 | | 0.32 | | 0.35 | | 0.34 |
| Net realized and unrealized gain (loss) | (0.23) | | (0.95) | | 4.76 | | (1.84) | | 1.84 |
| Total from investment operations | 0.17 | | (0.58) | | 5.08 | | (1.49) | | 2.18 |
| Less distributions: | | | | | | | | | |
| From net investment income | (0.38) | | (0.33) | | (0.34) | | (0.32) | | (0.35) |
| From net realized gain on investments | (0.29) | | — | | — | | (0.30) | | (0.46) |
| Total distributions | (0.67) | | (0.33) | | (0.34) | | (0.62) | | (0.81) |
| Net asset value at end of year | $ 18.28 | | $ 18.78 | | $ 19.69 | | $ 14.95 | | $ 17.06 |
| Total investment return (b) | 0.77% | | (2.91)% | | 34.20% | | (8.87)% | | 14.39% |
| Ratios (to average net assets)/Supplemental Data: | | | | | | | | | |
| Net investment income (loss) | 2.12% | | 1.90% | | 1.76% | | 2.23% | | 2.12% |
| Net expenses (c) | 1.16% | | 1.15% | | 1.17% | | 1.18%(d) | | 1.18% |
| Expenses (before waiver/reimbursement) (c) | 1.16% | | 1.15% | | 1.17% | | 1.19% | | 1.18% |
| Portfolio turnover rate | 19% | | 25% | | 16% | | 29% | | 18% |
| Net assets at end of year (in 000’s) | $ 1,200 | | $ 1,315 | | $ 1,609 | | $ 2,135 | | $ 2,812 |
| (a) | Per share data based on average shares outstanding during the year. |
| (b) | Total investment return is calculated exclusive of sales charges and assumes the reinvestment of dividends and distributions. Class R2 shares are not subject to sales charges. For periods of less than one year, total return is not annualized. |
| (c) | In addition to the fees and expenses which the Fund bears directly, it also indirectly bears a pro-rata share of the fees and expenses of the underlying funds in which it invests. Such indirect expenses are not included in the above expense ratios. |
| (d) | Net of interest expense of less than 0.01%. |
| | Year Ended October 31, |
| Class R3 | 2023 | | 2022 | | 2021 | | 2020 | | 2019 |
| Net asset value at beginning of year | $ 18.79 | | $ 19.70 | | $ 14.96 | | $ 17.06 | | $ 15.69 |
| Net investment income (loss) (a) | 0.36 | | 0.32 | | 0.26 | | 0.31 | | 0.30 |
| Net realized and unrealized gain (loss) | (0.25) | | (0.95) | | 4.77 | | (1.83) | | 1.84 |
| Total from investment operations | 0.11 | | (0.63) | | 5.03 | | (1.52) | | 2.14 |
| Less distributions: | | | | | | | | | |
| From net investment income | (0.33) | | (0.28) | | (0.29) | | (0.28) | | (0.31) |
| From net realized gain on investments | (0.29) | | — | | — | | (0.30) | | (0.46) |
| Total distributions | (0.62) | | (0.28) | | (0.29) | | (0.58) | | (0.77) |
| Net asset value at end of year | $ 18.28 | | $ 18.79 | | $ 19.70 | | $ 14.96 | | $ 17.06 |
| Total investment return (b) | 0.46% | | (3.17)% | | 33.83% | | (9.06)% | | 14.11% |
| Ratios (to average net assets)/Supplemental Data: | | | | | | | | | |
| Net investment income (loss) | 1.86% | | 1.66% | | 1.45% | | 1.96% | | 1.86% |
| Net expenses (c) | 1.41% | | 1.40% | | 1.42% | | 1.43%(d) | | 1.43% |
| Expenses (before waiver/reimbursement) (c) | 1.41% | | 1.40% | | 1.42% | | 1.44% | | 1.43% |
| Portfolio turnover rate | 19% | | 25% | | 16% | | 29% | | 18% |
| Net assets at end of year (in 000’s) | $ 2,471 | | $ 2,602 | | $ 3,252 | | $ 3,184 | | $ 4,339 |
| (a) | Per share data based on average shares outstanding during the year. |
| (b) | Total investment return is calculated exclusive of sales charges and assumes the reinvestment of dividends and distributions. Class R3 shares are not subject to sales charges. For periods of less than one year, total return is not annualized. |
| (c) | In addition to the fees and expenses which the Fund bears directly, it also indirectly bears a pro-rata share of the fees and expenses of the underlying funds in which it invests. Such indirect expenses are not included in the above expense ratios. |
| (d) | Net of interest expense of less than 0.01%. |
The notes to the financial statements are an integral part of, and should be read in conjunction with, the financial statements.
| 20 | MainStay Epoch U.S. Equity Yield Fund |
Financial Highlights selected per share data and ratios
| | Year Ended October 31, |
| Class R6 | 2023 | | 2022 | | 2021 | | 2020 | | 2019 |
| Net asset value at beginning of year | $ 18.99 | | $ 19.92 | | $ 15.12 | | $ 17.25 | | $ 15.85 |
| Net investment income (loss) (a) | 0.49 | | 0.46 | | 0.39 | | 0.42 | | 0.42 |
| Net realized and unrealized gain (loss) | (0.24) | | (0.97) | | 4.83 | | (1.86) | | 1.86 |
| Total from investment operations | 0.25 | | (0.51) | | 5.22 | | (1.44) | | 2.28 |
| Less distributions: | | | | | | | | | |
| From net investment income | (0.46) | | (0.42) | | (0.42) | | (0.39) | | (0.42) |
| From net realized gain on investments | (0.29) | | — | | — | | (0.30) | | (0.46) |
| Total distributions | (0.75) | | (0.42) | | (0.42) | | (0.69) | | (0.88) |
| Net asset value at end of year | $ 18.49 | | $ 18.99 | | $ 19.92 | | $ 15.12 | | $ 17.25 |
| Total investment return (b) | 1.19% | | (2.54)% | | 34.78% | | (8.46)% | | 14.94% |
| Ratios (to average net assets)/Supplemental Data: | | | | | | | | | |
| Net investment income (loss) | 2.56% | | 2.32% | | 2.11% | | 2.68% | | 2.60% |
| Net expenses (c) | 0.73%(d) | | 0.73% | | 0.73% | | 0.73%(e) | | 0.73% |
| Expenses (before waiver/reimbursement) (c) | 0.73% | | 0.73% | | 0.73% | | 0.74% | | 0.73% |
| Portfolio turnover rate | 19% | | 25% | | 16% | | 29% | | 18% |
| Net assets at end of year (in 000’s) | $ 112,773 | | $ 135,192 | | $ 143,436 | | $ 107,887 | | $ 165,999 |
| (a) | Per share data based on average shares outstanding during the year. |
| (b) | Total investment return is calculated exclusive of sales charges and assumes the reinvestment of dividends and distributions. Class R6 shares are not subject to sales charges. For periods of less than one year, total return is not annualized. |
| (c) | In addition to the fees and expenses which the Fund bears directly, it also indirectly bears a pro-rata share of the fees and expenses of the underlying funds in which it invests. Such indirect expenses are not included in the above expense ratios. |
| (d) | Expense waiver/reimbursement less than 0.01%. |
| (e) | Net of interest expense of less than 0.01%. |
The notes to the financial statements are an integral part of, and should be read in conjunction with, the financial statements.
21
Financial Highlights selected per share data and ratios
| | Year Ended October 31, | | August 31, 2020^ through
October 31, |
| SIMPLE Class | 2023 | | 2022 | | 2021 | | 2020 |
| Net asset value at beginning of period | $ 18.74 | | $ 19.65 | | $ 14.89 | | $ 15.57* |
| Net investment income (loss) (a) | 0.36 | | 0.28 | | 0.22 | | 0.03 |
| Net realized and unrealized gain (loss) | (0.24) | | (0.93) | | 4.76 | | (0.68) |
| Total from investment operations | 0.12 | | (0.65) | | 4.98 | | (0.65) |
| Less distributions: | | | | | | | |
| From net investment income | (0.35) | | (0.26) | | (0.22) | | (0.03) |
| From net realized gain on investments | (0.29) | | — | | — | | — |
| Total distributions | (0.64) | | (0.26) | | (0.22) | | (0.03) |
| Net asset value at end of period | $ 18.22 | | $ 18.74 | | $ 19.65 | | $ 14.89 |
| Total investment return (b) | 0.55% | | (3.34)% | | 33.61% | | (4.16)% |
| Ratios (to average net assets)/Supplemental Data: | | | | | | | |
| Net investment income (loss) | 1.88% | | 1.48% | | 1.20% | | 0.98%†† |
| Net expenses (c) | 1.38% | | 1.55% | | 1.58% | | 1.57%††(d) |
| Expenses (before waiver/reimbursement) (c) | 1.38% | | 1.55% | | 1.65% | | 1.63%†† |
| Portfolio turnover rate | 19% | | 25% | | 16% | | 29% |
| Net assets at end of period (in 000’s) | $ 93 | | $ 77 | | $ 43 | | $ 24 |
| ^ | Inception date. |
| * | Based on the net asset value of Investor Class as of August 31, 2020. |
| †† | Annualized. |
| (a) | Per share data based on average shares outstanding during the period. |
| (b) | Total investment return is calculated exclusive of sales charges and assumes the reinvestment of dividends and distributions. SIMPLE Class shares are not subject to sales charges. For periods of less than one year, total return is not annualized. |
| (c) | In addition to the fees and expenses which the Fund bears directly, it also indirectly bears a pro-rata share of the fees and expenses of the underlying funds in which it invests. Such indirect expenses are not included in the above expense ratios. |
| (d) | Net of interest expense of less than 0.01%. |
The notes to the financial statements are an integral part of, and should be read in conjunction with, the financial statements.
| 22 | MainStay Epoch U.S. Equity Yield Fund |
Notes to Financial Statements
Note 1-Organization and Business
MainStay Funds Trust (the “Trust”) was organized as a Delaware statutory trust on April 28, 2009. The Trust is registered under the Investment Company Act of 1940, as amended (the “1940 Act”), as an open-end management investment company, and is comprised of thirty-seven funds (collectively referred to as the “Funds”). These financial statements and notes relate to the MainStay Epoch U.S. Equity Yield Fund (the "Fund"), a “diversified” fund, as that term is defined in the 1940 Act, as interpreted or modified by regulatory authorities having jurisdiction, from time to time.
The following table lists the Fund's share classes that have been registered and commenced operations:
| Class | Commenced Operations |
| Class A | February 3, 2009 |
| Investor Class | November 16, 2009 |
| Class B | May 8, 2017 |
| Class C | November 16, 2009 |
| Class I | December 3, 2008 |
| Class R1* | May 8, 2017 |
| Class R2* | May 8, 2017 |
| Class R3* | May 8, 2017 |
| Class R6 | May 8, 2017 |
| SIMPLE Class | August 31, 2020 |
| * | As of October 31, 2023, Class R1, Class R2 and Class R3 shares are closed to new investors and, upon the close of business on December 29, 2023, Class R1, Class R2 and Class R3 shares are closed to additional investments by existing shareholders. Additionally, Class R1, Class R2 and Class R3 shares will be liquidated on or about February 28, 2024 (the "Liquidation Date"). It is expected that the Fund will distribute to remaining shareholders invested in Class R1, Class R2 or Class R3 shares, on or promptly after the Liquidation Date, a liquidating distribution in cash or cash equivalents equal to the net asset value of such shares. |
Class B shares of the MainStay Group of Funds are closed to all new purchases as well as additional investments by existing Class B shareholders. Existing Class B shareholders may continue to reinvest dividends and capital gains distributions, as well as exchange their Class B shares for Class B shares of other funds in the MainStay Group of Funds as permitted by the current exchange privileges. Class B shareholders continue to be subject to any applicable contingent deferred sales charge ("CDSC") at the time of redemption. All other features of the Class B shares, including but not limited to the fees and expenses applicable to Class B shares, remain unchanged. Unless redeemed, Class B shareholders will remain in Class B shares of their respective fund until the Class B shares are converted to Class A or Investor Class shares pursuant to the applicable conversion schedule.
Class A and Investor Class shares are offered at net asset value (“NAV”) per share plus an initial sales charge. No initial sales charge applies to investments of $1 million or more (and certain other qualified purchases) in Class A and Investor Class shares. However, a CDSC of 1.00% may be imposed on certain redemptions made within 18 months of the date of purchase on shares that were purchased without an initial sales charge.
Class B and Class C shares are offered at NAV without an initial sales charge, although a CDSC that declines depending on the number of years a shareholder held its Class B shares may be imposed on redemptions made within six years of the date of purchase of such shares and a 1.00% CDSC may be imposed on redemptions made within one year of the date of purchase of Class C shares. Class I, Class R1, Class R2, Class R3, Class R6 and SIMPLE Class shares are offered at NAV without a sales charge. Depending upon eligibility, Class B shares convert to either Class A or Investor Class shares at the end of the calendar quarter eight years after the date they were purchased. In addition, depending upon eligibility, Class C shares convert to either Class A or Investor Class shares at the end of the calendar quarter eight years after the date they were purchased. Additionally, Investor Class shares may convert automatically to Class A shares. SIMPLE Class shares convert to Class A shares, or Investor Class shares if you are not eligible to hold Class A shares, at the end of the calendar quarter, ten years after the date they were purchased. Share class conversions are based on the relevant NAVs of the two classes at the time of the conversion, and no sales load or other charge is imposed. Under certain circumstances and as may be permitted by the Trust’s multiple class plan pursuant to Rule 18f-3 under the 1940 Act, specified share classes of the Fund may be converted to one or more other share classes of the Fund as disclosed in the capital share transactions within these Notes. The classes of shares have the same voting (except for issues that relate solely to one class), dividend, liquidation and other rights, and the same terms and conditions, except that Class B and Class C shares are subject to higher distribution and/or service fees than Class A, Investor Class, Class R2, Class R3 and SIMPLE Class shares under distribution plans pursuant to Rule 12b-1 under the 1940 Act. Class I, Class R1 and Class R6 shares are not subject to a distribution and/or service fee. Class R1, Class R2 and Class R3 shares are subject to a shareholder service fee, which is in addition to fees paid under a distribution plan for Class R1, Class R2 and Class R3 shares.
At a meeting held on September 25-26, 2023, the Board of Trustees (the “Board”) of the Trust, after careful consideration of a number of factors and upon the recommendation of the Fund’s investment adviser, New York Life Investment Management LLC (“New York Life Investments” or the "Manager"), approved a proposal to liquidate Class R1, Class R2 and Class R3 shares of the Fund on or about February 28, 2024, pursuant to the terms of a plan of liquidation.
The Fund's investment objective is to seek current income and capital appreciation.
Note 2–Significant Accounting Policies
The Fund is an investment company and accordingly follows the investment company accounting and reporting guidance of the Financial Accounting Standards Board (“FASB”) Accounting Standards Codification Topic 946 Financial Services—Investment Companies. The Fund prepares its financial statements in accordance with generally accepted accounting principles (“GAAP”) in the United States of America and follows the significant accounting policies described below.
Notes to Financial Statements (continued)
(A) Securities Valuation. Investments are usually valued as of the close of regular trading on the New York Stock Exchange (the "Exchange") (usually 4:00 p.m. Eastern time) on each day the Fund is open for business ("valuation date").
Pursuant to Rule 2a-5 under the 1940 Act, the Board has designated New York Life Investments as its Valuation Designee (the "Valuation Designee"). The Valuation Designee is responsible for performing fair valuations relating to all investments in the Fund’s portfolio for which market quotations are not readily available; periodically assessing and managing material valuation risks; establishing and applying fair value methodologies; testing fair valuation methodologies; evaluating and overseeing pricing services; ensuring appropriate segregation of valuation and portfolio management functions; providing quarterly, annual and prompt reporting to the Board, as appropriate; identifying potential conflicts of interest; and maintaining appropriate records. The Valuation Designee has established a valuation committee ("Valuation Committee") to assist in carrying out the Valuation Designee’s responsibilities and establish prices of securities for which market quotations are not readily available. The Fund's and the Valuation Designee's policies and procedures ("Valuation Procedures") govern the Valuation Designee’s selection and application of methodologies for determining and calculating the fair value of Fund investments. The Valuation Designee may value the Fund's portfolio securities for which market quotations are not readily available and other Fund assets utilizing inputs from pricing services and other third-party sources. The Valuation Committee meets (in person, via electronic mail or via teleconference) on an ad-hoc basis to determine fair valuations and on a quarterly basis to review fair value events with respect to certain securities for which market quotations are not readily available, including valuation risks and back-testing results, and preview reports to the Board.
The Valuation Committee establishes prices of securities for which market quotations are not readily available based on such methodologies and measurements on a regular basis after considering information that is reasonably available and deemed relevant by the Valuation Committee. The Board shall oversee the Valuation Designee and review fair valuation materials on a prompt, quarterly and annual basis and approve proposed revisions to the Valuation Procedures.
Investments for which market quotations are not readily available are valued at fair value as determined in good faith pursuant to the Valuation Procedures. A market quotation is readily available only when that quotation is a quoted price (unadjusted) in active markets for identical investments that the Fund can access at the measurement date, provided that a quotation will not be readily available if it is not reliable. "Fair value" is defined as the price the Fund would reasonably expect to receive upon selling an asset or liability in an orderly transaction to an independent buyer in the principal or most advantageous market for the asset or liability. Fair value measurements are determined within a framework that establishes a three-tier hierarchy that maximizes the use of observable market data and minimizes the use of unobservable inputs to establish a classification of fair value measurements for disclosure purposes.
"Inputs" refer broadly to the assumptions that market participants would use in pricing the asset or liability, including assumptions about risk, such as the risk inherent in a particular valuation technique used to measure fair value using a pricing model and/or the risk inherent in the inputs for the valuation technique. Inputs may be observable or unobservable. Observable inputs reflect the assumptions market participants would use in pricing the asset or liability based on market data obtained from sources independent of the Fund. Unobservable inputs reflect the Fund’s own assumptions about the assumptions market participants would use in pricing the asset or liability based on the information available. The inputs or methodology used for valuing assets or liabilities may not be an indication of the risks associated with investing in those assets or liabilities. The three-tier hierarchy of inputs is summarized below.
| • | Level 1—quoted prices (unadjusted) in active markets for an identical asset or liability |
| • | Level 2—other significant observable inputs (including quoted prices for a similar asset or liability in active markets, interest rates and yield curves, prepayment speeds, credit risk, etc.) |
| • | Level 3—significant unobservable inputs (including the Fund's own assumptions about the assumptions that market participants would use in measuring fair value of an asset or liability) |
The level of an asset or liability within the fair value hierarchy is based on the lowest level of an input, both individually and in the aggregate, that is significant to the fair value measurement. The aggregate value by input level of the Fund’s assets and liabilities as of October 31, 2023, is included at the end of the Portfolio of Investments.
The Fund may use third-party vendor evaluations, whose prices may be derived from one or more of the following standard inputs, among others:
| • Broker/dealer quotes | • Benchmark securities |
| • Two-sided markets | • Reference data (corporate actions or material event notices) |
| • Bids/offers | • Monthly payment information |
| • Industry and economic events | • Reported trades |
An asset or liability for which a market quotation is not readily available is valued by methods deemed reasonable in good faith by the Valuation Committee, following the Valuation Procedures to represent fair value. Under these procedures, the Valuation Designee generally uses a market-based approach which may use related or comparable assets or liabilities, recent transactions, market multiples, book values and other relevant information. The Valuation Designee may also use an income-based valuation approach in which the anticipated future cash flows of the asset or liability are discounted to calculate fair value. Discounts may also be applied due to the nature and/or duration of any restrictions on the disposition of the asset or liability. Fair value represents a good faith approximation of the value of a security. Fair value determinations involve the consideration of a number of subjective factors, an analysis of applicable facts and circumstances and the exercise of judgment. As a result, it is possible that the fair value for a
| 24 | MainStay Epoch U.S. Equity Yield Fund |
security determined in good faith in accordance with the Valuation Procedures may differ from valuations for the same security determined for other funds using their own valuation procedures. Although the Valuation Procedures are designed to value a security at the price the Fund may reasonably expect to receive upon the security's sale in an orderly transaction, there can be no assurance that any fair value determination thereunder would, in fact, approximate the amount that the Fund would actually realize upon the sale of the security or the price at which the security would trade if a reliable market price were readily available. During the year ended October 31, 2023, there were no material changes to the fair value methodologies.
Securities which may be valued in this manner include, but are not limited to: (i) a security for which trading has been halted or suspended or otherwise does not have a readily available market quotation on a given day; (ii) a debt security that has recently gone into default and for which there is not a current market quotation; (iii) a security of an issuer that has entered into a restructuring; (iv) a security that has been delisted from a national exchange; (v) a security subject to trading collars for which no or limited trading takes place; and (vi) a security whose principal market has been temporarily closed at a time when, under normal conditions, it would be open. Securities valued in this manner are generally categorized as Level 2 or 3 in the hierarchy. No securities held by the Fund as of October 31, 2023, were fair valued in such a manner.
Equity securities, rights and warrants, if applicable, are valued at the last quoted sales prices as of the close of regular trading on the relevant exchange on each valuation date. Securities that are not traded on the valuation date are valued at the mean of the last quoted bid and ask prices. Prices are normally taken from the principal market in which each security trades. These securities are generally categorized as Level 1 in the hierarchy.
Investments in mutual funds, including money market funds, are valued at their respective NAVs at the close of business each day on the valuation date. These securities are generally categorized as Level 1 in the hierarchy.
The information above is not intended to reflect an exhaustive list of the methodologies that may be used to value portfolio investments. The Valuation Procedures permit the use of a variety of valuation methodologies in connection with valuing portfolio investments. The methodology used for a specific type of investment may vary based on the market data available or other considerations. The methodologies summarized above may not represent the specific means by which portfolio investments are valued on any particular business day.
(B) Income Taxes. The Fund's policy is to comply with the requirements of the Internal Revenue Code of 1986, as amended (the “Internal Revenue Code”), applicable to regulated investment companies and to distribute all of its taxable income to the shareholders of the Fund within the allowable time limits.
The Manager evaluates the Fund’s tax positions to determine if the tax positions taken meet the minimum recognition threshold in connection
with accounting for uncertainties in income tax positions taken or expected to be taken for the purposes of measuring and recognizing tax liabilities in the financial statements. Recognition of tax benefits of an uncertain tax position is permitted only to the extent the position is “more likely than not” to be sustained assuming examination by taxing authorities. The Manager analyzed the Fund's tax positions taken on federal, state and local income tax returns for all open tax years (for up to three tax years) and has concluded that no provisions for federal, state and local income tax are required in the Fund's financial statements. The Fund's federal, state and local income tax and federal excise tax returns for tax years for which the applicable statutes of limitations have not expired are subject to examination by the Internal Revenue Service and state and local departments of revenue.
(C) Dividends and Distributions to Shareholders. Dividends and distributions are recorded on the ex-dividend date. The Fund intends to declare and pay dividends from net investment income, if any, at least quarterly and distributions from net realized capital and currency gains, if any, at least annually. Unless a shareholder elects otherwise, all dividends and distributions are reinvested at NAV in the same class of shares of the Fund. Dividends and distributions to shareholders are determined in accordance with federal income tax regulations and may differ from determinations using GAAP.
(D) Security Transactions and Investment Income. The Fund records security transactions on the trade date. Realized gains and losses on security transactions are determined using the identified cost method. Dividend income is recognized on the ex-dividend date, net of any foreign tax withheld at the source, and interest income is accrued as earned using the effective interest rate method. Distributions received from real estate investment trusts may be classified as dividends, capital gains and/or return of capital.
Investment income and realized and unrealized gains and losses on investments of the Fund are allocated pro rata to the separate classes of shares based upon their relative net assets on the date the income is earned or realized and unrealized gains and losses are incurred.
(E) Expenses. Expenses of the Trust are allocated to the individual Funds in proportion to the net assets of the respective Funds when the expenses are incurred, except where direct allocations of expenses can be made. Expenses (other than transfer agent expenses and fees incurred under the shareholder services plans and/or the distribution plans further discussed in Note 3(B)) are allocated to separate classes of shares pro rata based upon their relative net assets on the date the expenses are incurred. The expenses borne by the Fund, including those of related parties to the Fund, are shown in the Statement of Operations.
(F) Use of Estimates. In preparing financial statements in conformity with GAAP, the Manager makes estimates and assumptions that affect the reported amounts and disclosures in the financial statements. Actual results could differ from those estimates and assumptions.
Notes to Financial Statements (continued)
(G) Securities Lending. In order to realize additional income, the Fund may engage in securities lending, subject to the limitations set forth in the 1940 Act and relevant guidance by the staff of the Securities and Exchange Commission (“SEC”). If the Fund engages in securities lending, the Fund will lend through its custodian, JPMorgan Chase Bank, N.A., ("JPMorgan"), acting as securities lending agent on behalf of the Fund. Under the current arrangement, JPMorgan will manage the Fund's collateral in accordance with the securities lending agency agreement between the Fund and JPMorgan, and indemnify the Fund against counterparty risk. The loans will be collateralized by cash (which may be invested in a money market fund) and/or non-cash collateral (which may include U.S. Treasury securities and/or U.S. government agency securities issued or guaranteed by the United States government or its agencies or instrumentalities) at least equal at all times to the market value of the securities loaned. Non-cash collateral held at year end is segregated and cannot be transferred by the Fund. The Fund bears the risk of delay in recovery of, or loss of rights in, the securities loaned. The Fund may also record a realized gain or loss on securities deemed sold due to a borrower’s inability to return securities on loan. The Fund bears the risk of any loss on investment of cash collateral. The Fund will receive compensation for lending its securities in the form of fees or it will retain a portion of interest earned on the investment of any cash collateral. The Fund will also continue to receive interest and dividends on the securities loaned and any gain or loss in the market price of the securities loaned that may occur during the term of the loan will be for the account of the Fund. Income earned from securities lending activities, if any, is reflected in the Statement of Operations. As of October 31, 2023, the Fund did not have any portfolio securities on loan.
(H) Large Transaction Risks. From time to time, the Fund may receive large purchase or redemption orders from affiliated or unaffiliated mutual funds or other investors. Such large transactions could have adverse effects on the Fund’s performance if the Fund were required to sell securities or invest cash at times when it otherwise would not do so. This activity could also accelerate the realization of capital gains and increase the Fund’s transaction costs. The Fund has adopted procedures designed to mitigate the negative impacts of such large transactions, but there can be no assurance that these procedures will be effective.
(I) Indemnifications. Under the Trust’s organizational documents, its officers and trustees are indemnified against certain liabilities that may arise out of performance of their duties to the Trust. Additionally, in the normal course of business, the Fund enters into contracts with third-party service providers that contain a variety of representations and warranties and that may provide general indemnifications. The Fund's maximum exposure under these arrangements is unknown, as this would involve future claims that may be made against the Fund that have not yet occurred. The Manager believes that the risk of loss in connection with these potential indemnification obligations is remote. However, there can be no assurance that material liabilities related to such obligations will not arise in the future, which could adversely impact the Fund.
Note 3–Fees and Related Party Transactions
(A) Manager and Subadvisor. New York Life Investments, a registered investment adviser and an indirect, wholly-owned subsidiary of New York Life Insurance Company ("New York Life"), serves as the Fund's Manager, pursuant to an Amended and Restated Management Agreement (“Management Agreement”). The Manager provides offices, conducts clerical, recordkeeping and bookkeeping services and keeps most of the financial and accounting records required to be maintained by the Fund. Except for the portion of salaries and expenses that are the responsibility of the Fund, the Manager pays the salaries and expenses of all personnel affiliated with the Fund and certain operational expenses of the Fund. The Fund reimburses New York Life Investments in an amount equal to the portion of the compensation of the Chief Compliance Officer attributable to the Fund. Epoch Investment Partners, Inc. (“Epoch” or the “Subadvisor”), a registered investment adviser, serves as the Subadvisor to the Fund and is responsible for the day-to-day portfolio management of the Fund. Pursuant to the terms of an Amended and Restated Subadvisory Agreement ("Subadvisory Agreement") between New York Life Investments and Epoch, New York Life Investments pays for the services of the Subadvisor.
Pursuant to the Management Agreement, the Fund pays the Manager a monthly fee for the services performed and the facilities furnished at an annual rate of the Fund’s average daily net assets as follows: 0.70% up to $500 million; 0.68% from $500 million to $1 billion; 0.66% from $1 billion to $2 billion; and 0.65% in excess of $2 billion. During the year ended October 31, 2023, the effective management fee rate was 0.69% of the Fund’s average daily net assets, exclusive of any applicable waivers/reimbursements.
New York Life Investments has contractually agreed to waive fees and/or reimburse expenses so that Total Annual Fund Operating Expenses (excluding taxes, interest, litigation, extraordinary expenses, brokerage and other transaction expenses relating to the purchase or sale of portfolio investments, and acquired (underlying) fund fees and expenses) of Class I do not exceed 0.73%. In addition, New York Life Investments will waive fees and/or reimburse expenses so that Total Annual Fund Operating Expenses (excluding taxes, interest, litigation, extraordinary expenses, brokerage and other transaction expenses relating to the purchase or sale of portfolio investments, and acquired (underlying) fund fees and expenses) of Class R6 do not exceed those of Class I. These agreements will remain in effect until February 28, 2024, and shall renew automatically for one-year terms unless New York Life Investments provides written notice of termination prior to the start of the next term or upon approval of the Board.
During the year ended October 31, 2023, New York Life Investments earned fees from the Fund in the amount of $7,109,229 and waived fees and/or reimbursed certain class specific expenses in the amount of $309,459 and paid the Subadvisor in the amount of $3,426,397.
JPMorgan provides sub-administration and sub-accounting services to the Fund pursuant to an agreement with New York Life Investments.
| 26 | MainStay Epoch U.S. Equity Yield Fund |
These services include calculating the daily NAVs of the Fund, maintaining the general ledger and sub-ledger accounts for the calculation of the Fund's NAVs, and assisting New York Life Investments in conducting various aspects of the Fund's administrative operations. For providing these services to the Fund, JPMorgan is compensated by New York Life Investments.
Pursuant to an agreement between the Trust and New York Life Investments, New York Life Investments is responsible for providing or procuring certain regulatory reporting services for the Fund. The Fund will reimburse New York Life Investments for the actual costs incurred by New York Life Investments in connection with providing or procuring these services for the Fund.
(B) Distribution and Service Fees. The Trust, on behalf of the Fund, has entered into a distribution agreement with NYLIFE Distributors LLC (the “Distributor”), an affiliate of New York Life Investments. The Fund has adopted distribution plans (the “Plans”) in accordance with the provisions of Rule 12b-1 under the 1940 Act.
Pursuant to the Class A, Investor Class and Class R2 Plans, the Distributor receives a monthly fee from the Class A, Investor Class and Class R2 shares at an annual rate of 0.25% of the average daily net assets of the Class A, Investor Class and Class R2 shares for distribution and/or service activities as designated by the Distributor. Pursuant to the Class B and Class C Plans, Class B and Class C shares pay the Distributor a monthly distribution fee at an annual rate of 0.75% of the average daily net assets of the Class B and Class C shares, along with a service fee at an annual rate of 0.25% of the average daily net assets of the Class B and Class C shares, for a total 12b-1 fee of 1.00%. Pursuant to the Class R3 and SIMPLE Class Plans, Class R3 and SIMPLE Class shares pay the Distributor a monthly distribution fee at an annual rate of 0.25% of the average daily net assets of the Class R3 and SIMPLE Class shares, along with a service fee at an annual rate of 0.25% of the average daily net assets of the Class R3 and SIMPLE Class shares, for a total 12b-1 fee of 0.50%. Class I, Class R1 and Class R6 shares are not subject to a distribution and/or service fee.
The Plans provide that the distribution and service fees are payable to the Distributor regardless of the amounts actually expended by the Distributor for distribution of the Fund's shares and service activities.
In accordance with the Shareholder Services Plans for the Class R1, Class R2 and Class R3 shares, the Manager has agreed to provide, through its affiliates or independent third parties, various shareholder and administrative support services to shareholders of the Class R1, Class R2 and Class R3 shares. For its services, the Manager, its affiliates or independent third-party service providers are entitled to a shareholder service fee accrued daily and paid monthly at an annual rate of 0.10% of the average daily net assets of the Class R1, Class R2 and Class R3 shares. This is in addition to any fees paid under the Class R2 and Class R3 Plans.
During the year ended October 31, 2023, shareholder service fees incurred by the Fund were as follows:
| |
| Class R1 | $ 777 |
| Class R2 | 1,285 |
| Class R3 | 2,686 |
(C) Sales Charges. The Fund was advised by the Distributor that the amount of initial sales charges retained on sales of Class A and Investor Class shares during the year ended October 31, 2023, were $33,205 and $5,396, respectively.
The Fund was also advised that the Distributor retained CDSCs on redemptions of Class A, Class B and Class C shares during the year ended October 31, 2023, of $4,073, $35 and $887, respectively.
(D) Transfer, Dividend Disbursing and Shareholder Servicing Agent. NYLIM Service Company LLC, an affiliate of New York Life Investments, is the Fund's transfer, dividend disbursing and shareholder servicing agent pursuant to an agreement between NYLIM Service Company LLC and the Trust. NYLIM Service Company LLC has entered into an agreement with SS&C Global Investor & Distribution Solutions, Inc. ("SS&C"), pursuant to which SS&C performs certain transfer agent services on behalf of NYLIM Service Company LLC. New York Life Investments has contractually agreed to limit the transfer agency expenses charged to the Fund’s share classes to a maximum of 0.35% of that share class’s average daily net assets on an annual basis after deducting any applicable Fund or class-level expense reimbursement or small account fees. This agreement will remain in effect until February 28, 2024, and shall renew automatically for one-year terms unless New York Life Investments provides written notice of termination prior to the start of the next term or upon approval of the Board. During the year ended October 31, 2023, transfer agent expenses incurred by the Fund and any reimbursements, pursuant to the aforementioned Transfer Agency expense limitation agreement, were as follows:
| Class | Expense | Waived |
| Class A | $388,762 | $ — |
| Investor Class | 297,925 | (44,230) |
| Class B | 15,907 | (2,455) |
| Class C | 40,710 | (6,156) |
| Class I | 263,897 | — |
| Class R1 | 629 | — |
| Class R2 | 1,039 | — |
| Class R3 | 2,172 | — |
| Class R6 | 5,328 | — |
| SIMPLE Class | 136 | — |
(E) Small Account Fee. Shareholders with small accounts adversely impact the cost of providing transfer agency services. In an effort to reduce total transfer agency expenses, the Fund has implemented a small account fee on certain types of accounts. As described in the Fund's
Notes to Financial Statements (continued)
prospectus, certain shareholders with an account balance of less than $1,000 ($5,000 for Class A share accounts) are charged an annual per account fee of $20 (assessed semi-annually), the proceeds from which offset transfer agent fees as reflected in the Statement of Operations. This small account fee will not apply to certain types of accounts as described further in the Fund’s prospectus.
(F) Capital. As of October 31, 2023, New York Life and its affiliates beneficially held shares of the Fund with the values and percentages of net assets as follows:
Note 4-Federal Income Tax
As of October 31, 2023, the cost and unrealized appreciation (depreciation) of the Fund’s investment portfolio, including applicable derivative contracts and other financial instruments, as determined on a federal income tax basis, were as follows:
| | Federal Tax
Cost | Gross
Unrealized
Appreciation | Gross
Unrealized
(Depreciation) | Net
Unrealized
Appreciation/
(Depreciation) |
| Investments in Securities | $696,083,205 | $243,075,067 | $(46,218,792) | $196,856,275 |
As of October 31, 2023, the components of accumulated gain (loss) on a tax basis were as follows:
Ordinary
Income | Accumulated
Capital
and Other
Gain (Loss) | Other
Temporary
Differences | Unrealized
Appreciation
(Depreciation) | Total
Accumulated
Gain (Loss) |
| $2,435,478 | $29,693,267 | $— | $186,941,238 | $219,069,983 |
The difference between book-basis and tax-basis unrealized appreciation (depreciation) is primarily due to wash sale and partnership adjustments.
The following table discloses the current year reclassifications between total distributable earnings (loss) and additional paid-in capital arising from permanent differences; net assets as of October 31, 2023 were not affected.
| | Total
Distributable
Earnings (Loss) | Additional
Paid-In
Capital |
| | $4,241 | $(4,241) |
The reclassifications for the Fund are primarily due to different book and tax treatment of investments in partnerships.
During the years ended October 31, 2023 and October 31, 2022, the tax character of distributions paid as reflected in the Statements of Changes in Net Assets was as follows:
| | 2023 | 2022 |
| Distributions paid from: | | |
| Ordinary Income | $22,404,190 | $21,125,017 |
| Long-Term Capital Gains | 16,265,810 | — |
| Total | $38,670,000 | $21,125,017 |
Note 5–Custodian
JPMorgan is the custodian of cash and securities held by the Fund. Custodial fees are charged to the Fund based on the Fund's net assets and/or the market value of securities held by the Fund and the number of certain transactions incurred by the Fund.
Note 6–Line of Credit
The Fund and certain other funds managed by New York Life Investments maintain a line of credit with a syndicate of banks in order to secure a source of funds for temporary purposes to meet unanticipated or excessive redemption requests.
Effective July 25, 2023, under the credit agreement (the “Credit Agreement”), the aggregate commitment amount is $600,000,000 with an additional uncommitted amount of $100,000,000. The commitment fee is an annual rate of 0.15% of the average commitment amount payable quarterly, regardless of usage, to JPMorgan, who serves as the agent to the syndicate. The commitment fee is allocated among the Fund and certain other funds managed by New York Life Investments based upon their respective net assets and other factors. Interest on any revolving credit loan is charged based upon the Federal Funds Rate, Daily Simple Secured Overnight Financing Rate ("SOFR") + 0.10%, or the Overnight Bank Funding Rate, whichever is higher. The Credit Agreement expires on July 23, 2024, although the Fund, certain other funds managed by New York Life Investments and the syndicate of banks may renew the Credit Agreement for an additional year on the same or different terms or enter into a credit agreement with a different syndicate of banks. Prior to July 25, 2023, the aggregate commitment amount and the commitment fee were the same as those under the current Credit Agreement. During the year ended October 31, 2023, there were no borrowings made or outstanding with respect to the Fund under the Credit Agreement.
Note 7–Interfund Lending Program
Pursuant to an exemptive order issued by the SEC, the Fund, along with certain other funds managed by New York Life Investments, may participate in an interfund lending program. The interfund lending program provides an alternative credit facility that permits the Fund and certain other funds managed by New York Life Investments to lend or borrow money for temporary purposes directly to or from one another, subject to the conditions of the exemptive order. During the year ended
| 28 | MainStay Epoch U.S. Equity Yield Fund |
October 31, 2023, there were no interfund loans made or outstanding with respect to the Fund.
Note 8–Purchases and Sales of Securities (in 000’s)
During the year ended October 31, 2023, purchases and sales of securities, other than short-term securities, were $190,023 and $337,098, respectively.
Note 9–Capital Share Transactions
Transactions in capital shares for the years ended October 31, 2023 and October 31, 2022, were as follows:
| Class A | Shares | Amount |
| Year ended October 31, 2023: | | |
| Shares sold | 973,771 | $ 18,604,666 |
| Shares issued to shareholders in reinvestment of distributions | 885,565 | 17,036,428 |
| Shares redeemed | (3,625,920) | (69,451,735) |
| Net increase (decrease) in shares outstanding before conversion | (1,766,584) | (33,810,641) |
| Shares converted into Class A (See Note 1) | 226,614 | 4,297,248 |
| Shares converted from Class A (See Note 1) | (25,712) | (498,356) |
| Net increase (decrease) | (1,565,682) | $ (30,011,749) |
| Year ended October 31, 2022: | | |
| Shares sold | 2,023,734 | $ 39,515,886 |
| Shares issued to shareholders in reinvestment of distributions | 480,909 | 9,018,052 |
| Shares redeemed | (3,068,447) | (59,210,657) |
| Net increase (decrease) in shares outstanding before conversion | (563,804) | (10,676,719) |
| Shares converted into Class A (See Note 1) | 497,544 | 9,884,122 |
| Shares converted from Class A (See Note 1) | (1,519) | (30,097) |
| Net increase (decrease) | (67,779) | $ (822,694) |
| |
| Investor Class | Shares | Amount |
| Year ended October 31, 2023: | | |
| Shares sold | 63,894 | $ 1,214,662 |
| Shares issued to shareholders in reinvestment of distributions | 127,791 | 2,449,156 |
| Shares redeemed | (311,398) | (5,917,493) |
| Net increase (decrease) in shares outstanding before conversion | (119,713) | (2,253,675) |
| Shares converted into Investor Class (See Note 1) | 41,278 | 793,765 |
| Shares converted from Investor Class (See Note 1) | (141,499) | (2,664,862) |
| Net increase (decrease) | (219,934) | $ (4,124,772) |
| Year ended October 31, 2022: | | |
| Shares sold | 133,288 | $ 2,595,443 |
| Shares issued to shareholders in reinvestment of distributions | 66,093 | 1,233,644 |
| Shares redeemed | (319,282) | (6,151,698) |
| Net increase (decrease) in shares outstanding before conversion | (119,901) | (2,322,611) |
| Shares converted into Investor Class (See Note 1) | 52,662 | 1,021,358 |
| Shares converted from Investor Class (See Note 1) | (414,979) | (8,255,610) |
| Net increase (decrease) | (482,218) | $ (9,556,863) |
| |
| Class B | Shares | Amount |
| Year ended October 31, 2023: | | |
| Shares sold | 834 | $ 15,521 |
| Shares issued to shareholders in reinvestment of distributions | 6,217 | 116,032 |
| Shares redeemed | (29,897) | (547,694) |
| Net increase (decrease) in shares outstanding before conversion | (22,846) | (416,141) |
| Shares converted from Class B (See Note 1) | (92,917) | (1,713,976) |
| Net increase (decrease) | (115,763) | $ (2,130,117) |
| Year ended October 31, 2022: | | |
| Shares sold | 4,380 | $ 83,831 |
| Shares issued to shareholders in reinvestment of distributions | 2,863 | 51,913 |
| Shares redeemed | (45,406) | (854,600) |
| Net increase (decrease) in shares outstanding before conversion | (38,163) | (718,856) |
| Shares converted from Class B (See Note 1) | (107,981) | (2,013,472) |
| Net increase (decrease) | (146,144) | $ (2,732,328) |
| |
Notes to Financial Statements (continued)
| Class C | Shares | Amount |
| Year ended October 31, 2023: | | |
| Shares sold | 36,529 | $ 675,156 |
| Shares issued to shareholders in reinvestment of distributions | 15,082 | 281,221 |
| Shares redeemed | (175,742) | (3,221,325) |
| Net increase (decrease) in shares outstanding before conversion | (124,131) | (2,264,948) |
| Shares converted from Class C (See Note 1) | (29,423) | (543,346) |
| Net increase (decrease) | (153,554) | $ (2,808,294) |
| Year ended October 31, 2022: | | |
| Shares sold | 87,124 | $ 1,633,926 |
| Shares issued to shareholders in reinvestment of distributions | 5,893 | 106,407 |
| Shares redeemed | (215,025) | (4,031,784) |
| Net increase (decrease) in shares outstanding before conversion | (122,008) | (2,291,451) |
| Shares converted from Class C (See Note 1) | (32,685) | (611,280) |
| Net increase (decrease) | (154,693) | $ (2,902,731) |
| |
| Class I | Shares | Amount |
| Year ended October 31, 2023: | | |
| Shares sold | 1,292,727 | $ 24,919,097 |
| Shares issued to shareholders in reinvestment of distributions | 667,328 | 12,979,243 |
| Shares redeemed | (6,280,669) | (122,008,540) |
| Net increase (decrease) in shares outstanding before conversion | (4,320,614) | (84,110,200) |
| Shares converted into Class I (See Note 1) | 24,789 | 485,968 |
| Shares converted from Class I (See Note 1) | (7,236) | (133,794) |
| Net increase (decrease) | (4,303,061) | $ (83,758,026) |
| Year ended October 31, 2022: | | |
| Shares sold | 4,180,482 | $ 81,194,638 |
| Shares issued to shareholders in reinvestment of distributions | 388,567 | 7,353,728 |
| Shares redeemed | (4,038,116) | (79,778,322) |
| Net increase (decrease) in shares outstanding before conversion | 530,933 | 8,770,044 |
| Shares converted into Class I (See Note 1) | 1,502 | 30,097 |
| Net increase (decrease) | 532,435 | $ 8,800,141 |
| |
| Class R1 | Shares | Amount |
| Year ended October 31, 2023: | | |
| Shares sold | 2,969 | $ 56,557 |
| Shares issued to shareholders in reinvestment of distributions | 1,465 | 28,460 |
| Shares redeemed | (4,954) | (96,705) |
| Net increase (decrease) | (520) | $ (11,688) |
| Year ended October 31, 2022: | | |
| Shares sold | 9,871 | $ 187,910 |
| Shares issued to shareholders in reinvestment of distributions | 767 | 14,511 |
| Shares redeemed | (7,206) | (145,990) |
| Net increase (decrease) | 3,432 | $ 56,431 |
| |
| Class R2 | Shares | Amount |
| Year ended October 31, 2023: | | |
| Shares sold | 6,639 | $ 126,811 |
| Shares issued to shareholders in reinvestment of distributions | 2,289 | 44,058 |
| Shares redeemed | (13,272) | (256,137) |
| Net increase (decrease) | (4,344) | $ (85,268) |
| Year ended October 31, 2022: | | |
| Shares sold | 17,561 | $ 341,153 |
| Shares issued to shareholders in reinvestment of distributions | 1,261 | 23,678 |
| Shares redeemed | (30,527) | (590,639) |
| Net increase (decrease) | (11,705) | $ (225,808) |
| |
| Class R3 | Shares | Amount |
| Year ended October 31, 2023: | | |
| Shares sold | 21,163 | $ 400,482 |
| Shares issued to shareholders in reinvestment of distributions | 4,303 | 82,894 |
| Shares redeemed | (28,792) | (550,277) |
| Net increase (decrease) | (3,326) | $ (66,901) |
| Year ended October 31, 2022: | | |
| Shares sold | 31,718 | $ 610,972 |
| Shares issued to shareholders in reinvestment of distributions | 2,333 | 43,986 |
| Shares redeemed | (60,678) | (1,204,977) |
| Net increase (decrease) | (26,627) | $ (550,019) |
| |
| 30 | MainStay Epoch U.S. Equity Yield Fund |
| Class R6 | Shares | Amount |
| Year ended October 31, 2023: | | |
| Shares sold | 399,650 | $ 7,703,241 |
| Shares issued to shareholders in reinvestment of distributions | 265,704 | 5,163,424 |
| Shares redeemed | (1,683,921) | (32,754,489) |
| Net increase (decrease) in shares outstanding before conversion | (1,018,567) | (19,887,824) |
| Shares converted from Class R6 (See Note 1) | (1,162) | (22,647) |
| Net increase (decrease) | (1,019,729) | $ (19,910,471) |
| Year ended October 31, 2022: | | |
| Shares sold | 650,236 | $ 12,850,146 |
| Shares issued to shareholders in reinvestment of distributions | 158,717 | 3,012,143 |
| Shares redeemed | (891,227) | (17,550,643) |
| Net increase (decrease) in shares outstanding before conversion | (82,274) | (1,688,354) |
| Shares converted from Class R6 (See Note 1) | (1,267) | (25,118) |
| Net increase (decrease) | (83,541) | $ (1,713,472) |
| |
| SIMPLE Class | Shares | Amount |
| Year ended October 31, 2023: | | |
| Shares sold | 986 | $ 18,751 |
| Shares issued to shareholders in reinvestment of distributions | 146 | 2,799 |
| Shares redeemed | (134) | (2,600) |
| Net increase (decrease) | 998 | $ 18,950 |
| Year ended October 31, 2022: | | |
| Shares sold | 1,887 | $ 37,743 |
| Shares issued to shareholders in reinvestment of distributions | 50 | 929 |
| Shares redeemed | (10) | (213) |
| Net increase (decrease) | 1,927 | $ 38,459 |
Note 10–Other Matters
As of the date of this report, the Fund faces a heightened level of risk associated with current uncertainty, volatility and state of economies, financial markets, rising interest rates, and labor and health conditions around the world. Events such as war, acts of terrorism, recessions, rapid inflation, the imposition of international sanctions, earthquakes, hurricanes, epidemics and pandemics and other unforeseen natural or human disasters may have broad adverse social, political and economic effects on the global economy, which could negatively impact the value of the Fund's investments. Developments that disrupt global economies and financial markets may magnify factors that affect the Fund's performance.
Note 11–Subsequent Events
In connection with the preparation of the financial statements of the Fund as of and for the year ended October 31, 2023, events and transactions subsequent to October 31, 2023, through the date the financial statements were issued, have been evaluated by the Manager for possible adjustment and/or disclosure. No subsequent events requiring financial statement adjustment or disclosure have been identified.
Report of Independent Registered Public Accounting Firm
To the Shareholders of the Fund and Board of Trustees
MainStay Funds Trust:
Opinion on the Financial Statements
We have audited the accompanying statement of assets and liabilities of MainStay Epoch U.S. Equity Yield Fund (the Fund), one of the funds constituting MainStay Funds Trust, including the portfolio of investments, as of October 31, 2023, the related statement of operations for the year then ended, the statements of changes in net assets for each of the years in the two-year period then ended, and the related notes (collectively, the financial statements) and the financial highlights for each of the years or periods in the five-year period then ended. In our opinion, the financial statements and financial highlights present fairly, in all material respects, the financial position of the Fund as of October 31, 2023, the results of its operations for the year then ended, the changes in its net assets for each of the years in the two-year period then ended, and the financial highlights for each of the years or periods in the five-year period then ended, in conformity with U.S. generally accepted accounting principles.
Basis for Opinion
These financial statements and financial highlights are the responsibility of the Fund's management. Our responsibility is to express an opinion on these financial statements and financial highlights based on our audits. We are a public accounting firm registered with the Public Company Accounting Oversight Board (United States) (PCAOB) and are required to be independent with respect to the Fund in accordance with the U.S. federal securities laws and the applicable rules and regulations of the Securities and Exchange Commission and the PCAOB.
We conducted our audits in accordance with the standards of the PCAOB. Those standards require that we plan and perform the audit to obtain reasonable assurance about whether the financial statements and financial highlights are free of material misstatement, whether due to error or fraud. Our audits included performing procedures to assess the risks of material misstatement of the financial statements and financial highlights, whether due to error or fraud, and performing procedures that respond to those risks. Such procedures included examining, on a test basis, evidence regarding the amounts and disclosures in the financial statements and financial highlights. Such procedures also included confirmation of securities owned as of October 31, 2023, by correspondence with the custodian and the transfer agent. Our audits also included evaluating the accounting principles used and significant estimates made by management, as well as evaluating the overall presentation of the financial statements and financial highlights. We believe that our audits provide a reasonable basis for our opinion.

We have served as the auditor of one or more New York Life Investment Management investment companies since 2003.
Philadelphia, Pennsylvania
December 22, 2023
| 32 | MainStay Epoch U.S. Equity Yield Fund |
Federal Income Tax Information
(Unaudited)
The Fund is required under the Internal Revenue Code to advise shareholders in a written statement as to the federal tax status of dividends paid by the Fund during such fiscal years. Accordingly, the Fund paid $16,265,810 as long term capital gain distributions.
For the fiscal year ended October 31, 2023, the Fund designated approximately $22,404,190 under the Internal Revenue Code as qualified dividend income eligible for reduced tax rates.
The dividends paid by the Fund during the fiscal year ended October 31, 2023 should be multiplied by 100.00% to arrive at the amount eligible for the corporate dividend-received deduction.
In February 2024, shareholders will receive an IRS Form 1099-DIV or substitute Form 1099, which will show the federal tax status of the distributions received by shareholders in calendar year 2023. The amounts that will be reported on such 1099-DIV or substitute Form 1099 will be the amounts you are to use on your federal income tax return and will differ from the amounts which we must report for the Fund's fiscal year ended October 31, 2023.
Proxy Voting Policies and Procedures and Proxy Voting Record
The Fund is required to file with the SEC its proxy voting record for the 12-month period ending June 30 on Form N-PX. A description of the policies and procedures that are used to vote proxies relating to portfolio securities of the Fund is available free of charge upon request by calling 800-624-6782 or visiting the SEC’s website at www.sec.gov. The most recent Form N-PX or proxy voting record is available free of charge upon request by calling 800-624-6782; visiting newyorklifeinvestments.com; or visiting the SEC’s website at www.sec.gov.
Shareholder Reports and Quarterly Portfolio Disclosure
The Fund is required to file its complete schedule of portfolio holdings with the SEC 60 days after its first and third fiscal quarter on Form N-PORT. The Fund's holdings report is available free of charge upon request by calling New York Life Investments at 800-624-6782.
Board of Trustees and Officers (Unaudited)
The Trustees and officers of the Fund are listed below. The Board oversees the MainStay Group of Funds (which consists of MainStay Funds and MainStay Funds Trust), MainStay VP Funds Trust, MainStay MacKay DefinedTerm Municipal Opportunities Fund, MainStay CBRE Global Infrastructure Megatrends Term Fund, the Manager and the Subadvisors, and elects the officers of the Funds who are responsible for the day-to-day operations of the Fund. Information pertaining to the Trustees and officers is set forth below. Each Trustee serves until his or her successor is elected and qualified or until his or her resignation, death or
removal. Under the Board’s retirement policy, unless an exception is made, a Trustee must tender his or her resignation by the end of the calendar year during which he or she reaches the age of 75. Officers are elected annually by the Board. The business address of each Trustee and officer listed below is 51 Madison Avenue, New York, New York 10010. A majority of the Trustees are not “interested persons” (as defined by the 1940 Act and rules adopted by the SEC thereunder) of the Fund (“Independent Trustees”).
| | Name and
Year of Birth | Term of Office,
Position(s) Held and
Length of Service | Principal Occupation(s)
During Past Five Years | Number of
Portfolios in
Fund Complex
Overseen by
Trustee | Other Directorships
Held by Trustee |
| | | | | | |
| | Naïm Abou-Jaoudé*
1966 | MainStay Funds: Trustee
since 2023
MainStay Funds Trust:
Trustee since 2023 | Chief Executive Officer of New York Life Investment Management LLC (since 2023). Chief Executive Officer of Candriam (an affiliate of New York Life Investment Management LLC) (2007 to 2023). | 81 | MainStay VP Funds Trust:
Trustee since 2023 (31 portfolios);
MainStay MacKay DefinedTerm Municipal Opportunities Fund: Trustee
since 2023;
MainStay CBRE Global Infrastructure Megatrends Term Fund: Trustee
since 2023; and
New York Life Investment Management International (Chair) since 2015 |
| * | This Trustee is considered to be an “interested person” of the MainStay Group of Funds, MainStay VP Funds Trust, MainStay CBRE Global Infrastructure Megatrends Term Fund and MainStay MacKay DefinedTerm Municipal Opportunities Fund, within the meaning of the 1940 Act because of his affiliation with New York Life Investment Management LLC and Candriam, as described in detail above in the column entitled “Principal Occupation(s) During Past Five Years.” |
| | |
| 34 | MainStay Epoch U.S. Equity Yield Fund |
| | Name and
Year of Birth | Term of Office,
Position(s) Held and
Length of Service | Principal Occupation(s)
During Past Five Years | Number of
Portfolios in
Fund Complex
Overseen by
Trustee | Other Directorships
Held by Trustee |
| | | | | | |
| | David H. Chow
1957 | MainStay Funds: Trustee since January 2016, Advisory Board Member (June 2015 to December 2015);MainStay Funds Trust:
Trustee since January 2016, Advisory Board Member (June 2015 to December 2015) | Founder and CEO, DanCourt Management, LLC (since 1999) | 81 | MainStay VP Funds Trust: Trustee since January 2016, Advisory Board Member (June 2015 to December 2015) (31 portfolios);
MainStay MacKay DefinedTerm Municipal Opportunities Fund: Trustee since January 2016, Advisory Board Member (June 2015 to December 2015);
MainStay CBRE Global Infrastructure Megatrends Term Fund: Trustee since 2021;
VanEck Vectors Group of Exchange-Traded Funds: Trustee since 2006 and Independent Chairman of the Board of Trustees from 2008 to 2022 (57 portfolios); and
Berea College of Kentucky: Trustee since 2009, Chair of the Investment Committee since 2018 |
| | Karen Hammond
1956 | MainStay Funds: Trustee since December 2021, Advisory Board Member (June 2021 to December 2021);MainStay Funds Trust:
Trustee since December 2021, Advisory Board Member (June 2021 to December 2021)
| Retired, Managing Director, Devonshire Investors (2007 to 2013); Senior Vice President, Fidelity Management & Research Co. (2005 to 2007); Senior Vice President and Corporate Treasurer, FMR Corp. (2003 to 2005); Chief Operating Officer, Fidelity Investments Japan (2001 to 2003) | 81 | MainStay VP Funds Trust: Trustee since December 2021, Advisory Board Member (June 2021 to December 2021) (31 portfolios);
MainStay MacKay DefinedTerm Municipal Opportunities Fund: Trustee since December 2021, Advisory Board Member (June 2021 to December 2021);
MainStay CBRE Global Infrastructure Megatrends Term Fund: Trustee since December 2021, Advisory Board Member (June 2021 to December 2021);
Two Harbors Investment Corp.: Director since 2018;
Rhode Island State Investment Commission: Member since 2017; and
Blue Cross Blue Shield of Rhode Island: Director since 2019 |
| | Susan B. Kerley
1951 | MainStay Funds: Chair since January 2017 and Trustee since 2007;MainStay Funds Trust:
Chair since January 2017 and Trustee since 1990*** | President, Strategic Management Advisors LLC (since 1990) | 81 | MainStay VP Funds Trust: Chair since January 2017 and Trustee since 2007 (31 portfolios)**;
MainStay MacKay DefinedTerm Municipal Opportunities Fund: Chair since January 2017 and Trustee since 2011;
MainStay CBRE Global Infrastructure Megatrends Term Fund: Trustee since June 2021; and
Legg Mason Partners Funds: Trustee since 1991 (45 portfolios) |
Board of Trustees and Officers (Unaudited) (continued)
| | Name and
Year of Birth | Term of Office,
Position(s) Held and
Length of Service | Principal Occupation(s)
During Past Five Years | Number of
Portfolios in
Fund Complex
Overseen by
Trustee | Other Directorships
Held by Trustee |
| | | | | | |
| | Alan R. Latshaw
1951 | MainStay Funds: Trusteesince 2006;MainStay Funds Trust:
Trustee since 2007*** | Retired; Partner, Ernst & Young LLP (2002 to 2003); Partner, Arthur Andersen LLP (1989 to 2002); Consultant to the MainStay Funds Audit and Compliance Committee (2004 to 2006) | 81 | MainStay VP Funds Trust: Trustee since 2007 (31 portfolios)**;
MainStay MacKay DefinedTerm Municipal Opportunities Fund: Trustee since 2011; and
MainStay CBRE Global Infrastructure Megatrends Term Fund: Trustee since June 2021 |
| | Jacques P. Perold
1958 | MainStay Funds: Trustee since January 2016, Advisory Board Member (June 2015to December 2015);MainStay Funds Trust:
Trustee since January 2016, Advisory Board Member (June 2015 to December 2015) | Founder and Chief Executive Officer, CapShift Advisors LLC (since 2018); President, Fidelity Management & Research Company (2009 to 2014); President and Chief Investment Officer, Geode Capital Management, LLC (2001 to 2009) | 81 | MainStay VP Funds Trust: Trustee since January 2016, Advisory Board Member (June 2015 to December 2015) (31 portfolios);
MainStay MacKay DefinedTerm Municipal Opportunities Fund: Trustee since January 2016, Advisory Board Member (June 2015 to December 2015);
MainStay CBRE Global Infrastructure Megatrends Term Fund: Trustee since June 2021;
Allstate Corporation: Director since 2015; and
MSCI Inc.: Director since 2017 |
| | Richard S. Trutanic
1952 | MainStay Funds: Trustee since 1994;MainStay Funds Trust:
Trustee since 2007*** | Chairman and Chief Executive Officer, Somerset & Company (financial advisory firm) (since 2004); Managing Director, The Carlyle Group (private investment firm) (2002 to 2004); Senior Managing Director, Partner and Board Member, Groupe Arnault S.A. (private investment firm) (1999 to 2002) | 81 | MainStay VP Funds Trust: Trustee since 2007 (31 portfolios)**;
MainStay MacKay DefinedTerm Municipal Opportunities Fund: Trustee since 2011; and
MainStay CBRE Global Infrastructure Megatrends Term Fund: Trustee since June 2021 |
| ** | Includes prior service as a Director of MainStay VP Series Fund, Inc., the predecessor to MainStay VP Funds Trust. |
| *** | Includes prior service as a Director/Trustee of certain predecessor entities to MainStay Funds Trust. |
| 36 | MainStay Epoch U.S. Equity Yield Fund |
| | Name and
Year of Birth | Position(s) Held and
Length of Service | Principal Occupation(s)
During Past Five Years | |
| | | | | |
| | Kirk C. Lehneis
1974 | President, MainStay Funds, MainStay Funds Trust (since 2017) | Chief Operating Officer and Senior Managing Director (since 2016), New York Life Investment Management LLC and New York Life Investment Management Holdings LLC; Member of the Board of Managers (since 2017) and Senior Managing Director (since 2018), NYLIFE Distributors LLC; Chairman of the Board and Senior Managing Director, NYLIM Service Company LLC (since 2017); Trustee, President and Principal Executive Officer of IndexIQ Trust, IndexIQ ETF Trust and IndexIQ Active ETF Trust (since 2018); President, MainStay CBRE Global Infrastructure Megatrends Term Fund (since 2021), MainStay MacKay DefinedTerm Municipal Opportunities Fund and MainStay VP Funds Trust (since 2017)**; Senior Managing Director, Global Product Development (2015 to 2016); Managing Director, Product Development (2010 to 2015), New York Life Investment Management LLC | |
| | Jack R. Benintende
1964 | Treasurer and Principal Financial and Accounting Officer, MainStay Funds (since 2007), MainStay Funds Trust (since 2009) | Managing Director, New York Life Investment Management LLC (since 2007); Treasurer and Principal Financial and Accounting Officer, MainStay CBRE Global Infrastructure Megatrends Term Fund (since 2021), MainStay MacKay DefinedTerm Municipal Opportunities Fund (since 2011) and MainStay VP Funds Trust (since 2007)**; and Assistant Treasurer, New York Life Investment Management Holdings LLC (2008 to 2012) | |
| | J. Kevin Gao
1967 | Secretary and Chief Legal Officer, MainStay Funds and MainStay Funds Trust (since 2010) | Managing Director and Associate General Counsel, New York Life Investment Management LLC (since 2010); Secretary and Chief Legal Officer, MainStay CBRE Global Infrastructure Megatrends Term Fund (since 2021), MainStay MacKay DefinedTerm Municipal Opportunities Fund (since 2011) and MainStay VP Funds Trust (since 2010)** | |
| | Kevin M. Gleason
1967 | Vice President and Chief Compliance Officer, MainStay Funds and MainStay Funds Trust (since June 2022) | Vice President and Chief Compliance Officer, IndexIQ Trust, IndexIQ ETF Trust and Index IQ Active ETF Trust (since June 2022); Vice President and Chief Compliance Officer, MainStay CBRE Global Infrastructure Megatrends Term Fund, MainStay VP Funds Trust and MainStay MacKay DefinedTerm Municipal Opportunities Fund (since June 2022); Senior Vice President, Voya Investment Management and Chief Compliance Officer, Voya Family of Funds (2012 to 2022) | |
| | Scott T. Harrington
1959 | Vice President— Administration, MainStay Funds (since 2005), MainStay Funds Trust (since 2009) | Managing Director, New York Life Investment Management LLC (including predecessor advisory organizations) (since 2000); Member of the Board of Directors, New York Life Trust Company (since 2009); Vice President—Administration, MainStay CBRE Global Infrastructure Megatrends Term Fund (since 2021), MainStay MacKay DefinedTerm Municipal Opportunities Fund (since 2011) and MainStay VP Funds Trust (since 2005)** | |
| * | The officers listed above are considered to be “interested persons” of the MainStay Group of Funds, MainStay VP Funds Trust, MainStay CBRE Global Infrastructure Megatrends Term Fund and MainStay MacKay DefinedTerm Municipal Opportunities Fund within the meaning of the 1940 Act because of their affiliation with the MainStay Group of Funds, New York Life Insurance Company and/or its affiliates, including New York Life Investment Management LLC, New York Life Insurance Company, NYLIM Service Company LLC, NYLIFE Securities LLC and/or NYLIFE Distributors LLC, as described in detail in the column captioned “Principal Occupation(s) During Past Five Years.” Officers are elected annually by the Board. |
| ** | Includes prior service as an Officer of MainStay VP Series Fund, Inc., the predecessor to MainStay VP Funds Trust. |
Officers of the Trust (Who are not Trustees)*
This page intentionally left blank.
Equity
U.S. Equity
MainStay Epoch U.S. Equity Yield Fund
MainStay Fiera SMID Growth Fund
MainStay PineStone U.S. Equity Fund
MainStay S&P 500 Index Fund
MainStay Winslow Large Cap Growth Fund
MainStay WMC Enduring Capital Fund
MainStay WMC Growth Fund
MainStay WMC Small Companies Fund
MainStay WMC Value Fund
International Equity
MainStay Epoch International Choice Fund
MainStay PineStone International Equity Fund
MainStay WMC International Research Equity Fund
Emerging Markets Equity
MainStay Candriam Emerging Markets Equity Fund
Global Equity
MainStay Epoch Capital Growth Fund
MainStay Epoch Global Equity Yield Fund
MainStay PineStone Global Equity Fund
Fixed Income
Taxable Income
MainStay Candriam Emerging Markets Debt Fund
MainStay Floating Rate Fund
MainStay MacKay High Yield Corporate Bond Fund
MainStay MacKay Short Duration High Yield Fund
MainStay MacKay Strategic Bond Fund
MainStay MacKay Total Return Bond Fund
MainStay MacKay U.S. Infrastructure Bond Fund
MainStay Short Term Bond Fund
Tax-Exempt Income
MainStay MacKay California Tax Free Opportunities Fund1
MainStay MacKay High Yield Municipal Bond Fund
MainStay MacKay New York Tax Free Opportunities Fund2
MainStay MacKay Short Term Municipal Fund
MainStay MacKay Strategic Municipal Allocation Fund
MainStay MacKay Tax Free Bond Fund
Money Market
MainStay Money Market Fund
Mixed Asset
MainStay Balanced Fund
MainStay Income Builder Fund
MainStay MacKay Convertible Fund
Speciality
MainStay CBRE Global Infrastructure Fund
MainStay CBRE Real Estate Fund
MainStay Cushing MLP Premier Fund
Asset Allocation
MainStay Conservative Allocation Fund
MainStay Conservative ETF Allocation Fund
MainStay Defensive ETF Allocation Fund
MainStay Equity Allocation Fund
MainStay Equity ETF Allocation Fund
MainStay ESG Multi-Asset Allocation Fund
MainStay Growth Allocation Fund
MainStay Growth ETF Allocation Fund
MainStay Moderate Allocation Fund
MainStay Moderate ETF Allocation Fund
Manager
New York Life Investment Management LLC
New York, New York
Subadvisors
Candriam3
Strassen, Luxembourg
CBRE Investment Management Listed Real Assets LLC
Radnor, Pennsylvania
Cushing Asset Management, LP
Dallas, Texas
Epoch Investment Partners, Inc.
New York, New York
Fiera Capital Inc.
New York, New York
IndexIQ Advisors LLC3
New York, New York
MacKay Shields LLC3
New York, New York
NYL Investors LLC3
New York, New York
PineStone Asset Management Inc.
Montreal, Québec
Wellington Management Company LLP
Boston, Massachusetts
Winslow Capital Management, LLC
Minneapolis, Minnesota
Legal Counsel
Dechert LLP
Washington, District of Columbia
Independent Registered Public Accounting Firm
KPMG LLP
Philadelphia, Pennsylvania
Distributor
NYLIFE Distributors LLC3
Jersey City, New Jersey
Custodian
JPMorgan Chase Bank, N.A.
New York, New York
1.
This Fund is registered for sale in AZ, CA, NV, OR, TX, UT, WA and MI (Class A and Class I shares only), and CO, FL, GA, HI, ID, MA, MD, NH, NJ and NY (Class I shares only).
| 2. | This Fund is registered for sale in CA, CT, DE, FL, MA, NJ, NY and VT. |
| 3. | An affiliate of New York Life Investment Management LLC. |
Not part of the Annual Report
For more information
800-624-6782
newyorklifeinvestments.com
“New York Life Investments” is both a service mark, and the common trade name, of certain investment advisors affiliated with New York Life Insurance Company. The MainStay Funds® are managed by New York Life Investment Management LLC and distributed by NYLIFE Distributors LLC, 30 Hudson Street, Jersey City, NJ 07302, a wholly owned subsidiary of New York Life Insurance Company. NYLIFE Distributors LLC is a Member FINRA/SIPC.
©2023 NYLIFE Distributors LLC. All rights reserved.
| 5013893MS139-23 | MSEUE11-12/23 |
(NYLIM) NL239
MainStay Floating Rate Fund
Message from the President and Annual Report
October 31, 2023
Special Notice:
Beginning in July 2024, new regulations issued by the Securities and Exchange Commission (SEC) will take effect requiring open-end mutual fund companies and ETFs to (1) overhaul the content of their shareholder reports and (2) mail paper copies of the new tailored shareholder reports to shareholders who have not opted to receive these documents electronically.
If you have not yet elected to receive your shareholder reports electronically, please contact your financial intermediary or visit newyorklifeinvestments.com/accounts.
| Not FDIC/NCUA Insured | Not a Deposit | May Lose Value | No Bank Guarantee | Not Insured by Any Government Agency |
This page intentionally left blank
Message from the President
Volatile economic and geopolitical forces drove market behavior during the 12-month reporting period ended October 31, 2023. While equity markets generally gained ground, bond prices trended broadly lower.
Although the war in Ukraine, the outbreak of hostilities in the Middle East and several other notable events affected financial assets, inflation and interest rate trends stood at the forefront of market developments during most of the period. As the reporting period began, high levels of inflation already showed signs of easing in the face of aggressive rate hikes by the U.S. Federal Reserve (the “Fed”). From a peak of 9.1% in June 2022, the annualized U.S. inflation rate dropped to 7.1% in November 2022, and to 3.2% in October 2023. At the same time, the Fed increased the benchmark federal funds rate from 3.75%–4.00% at the beginning of the reporting period to 5.25%–5.50% as of October 31, 2023. As the pace of rate increases slowed during the period, investors hoped for an early shift to a looser monetary policy. However, comments from Fed members late in the period reinforced the central bank’s hawkish stance in response to surprisingly robust U.S. economic growth and rising wage pressures, thus increasing the likelihood that interest rates would stay higher for longer. International developed markets exhibited similar dynamics of elevated inflation and rising interest rates.
Despite the backdrop of high interest rates—along with political dysfunction in Washington D.C. and intensifying global geopolitical instability—equity markets managed to advance, supported by healthy consumer spending trends and persistent domestic economic growth. The S&P 500® Index, a widely regarded benchmark of large-cap U.S. market performance, gained ground, bolstered by the strong performance of energy stocks amid surging petroleum prices and mega-cap, growth-oriented, technology-related shares, which rose as investors flocked to companies creating the infrastructure for developments in artificial intelligence. Smaller-cap stocks and value-oriented shares produced milder returns. Among industry sectors, energy and
information technology posted the strongest gains. Real estate declined most sharply under pressure from rising mortgage rates and weak levels of office occupancy. Developed international markets outperformed U.S. markets, with Europe benefiting during the first half of the period from unexpected economic resilience in the face of rising energy prices and the ongoing war in Ukraine. Emerging markets posted positive results but lagged developed markets, largely due to slow economic growth in China despite the relaxation of pandemic-era lockdowns.
Bond prices were driven lower by rising yields and increasing expectations of high interest rates for an extended period of time. The U.S. yield curve steepened, with the 30-year Treasury yield exceeding 5% for the first time in more than a decade. The yield curve remained inverted, with the 10-year Treasury yield ending the period at 4.88%, compared with 5.07% for the 2-year Treasury yield. Corporate bonds outperformed long-term Treasury bonds, but still trended lower under pressure from rising yields and an uptick in default rates. Among corporates, lower-credit-quality instruments performed slightly better than their higher-credit-quality counterparts, while floating rate securities performed better still.
In the face of today’s uncertain market environment, New York Life Investments remains dedicated to providing the guidance, resources and investment solutions you need to pursue your financial goals.
Thank you for trusting us to help meet your investment needs.
Sincerely,
Kirk C. Lehneis
President
The opinions expressed are as of the date of this report and are subject to change. There is no guarantee that any forecast made will come to pass. This material does not constitute investment advice and is not intended as an endorsement of any specific investment. Past performance is no guarantee of future results.
Not part of the Annual Report
Investors should refer to the Fund’s Summary Prospectus and/or Prospectus and consider the Fund’s investment objectives, strategies, risks, charges and expenses carefully before investing. The Summary Prospectus and/or Prospectus contain this and other information about the Fund. You may obtain copies of the Fund’s Summary Prospectus, Prospectus and Statement of Additional Information, which includes information about the MainStay Funds Trust's Trustees, free of charge, upon request, by calling toll-free 800-624-6782, by writing to NYLIFE Distributors LLC, Attn: MainStay Marketing Department, 30 Hudson Street, Jersey City, NJ 07302 or by sending an e-mail to MainStayShareholderServices@nylim.com. These documents are also available via the MainStay Funds’ website at newyorklifeinvestments.com. Please read the Fund’s Summary Prospectus and/or Prospectus carefully before investing.
Investment and Performance Comparison (Unaudited)
Performance data quoted represents past performance. Past performance is no guarantee of future results. Because of market volatility and other factors, current performance may be lower or higher than the figures shown. Investment return and principal value will fluctuate, and as a result, when shares are redeemed, they may be worth more or less than their original cost. The graph below depicts the historical performance of Class I shares of the Fund. Performance will vary from class to class based on differences in class-specific expenses and sales charges. For performance information current to the most recent month-end, please call 800-624-6782 or visit newyorklifeinvestments.com.
The performance table and graph do not reflect the deduction of taxes that a shareholder would pay on distributions or Fund share redemptions. Total returns reflect maximum applicable sales charges as indicated in the table below, if any, changes in share price, and reinvestment of dividend and capital gain distributions. The graph assumes the initial investment amount shown below and reflects the deduction of all sales charges that would have applied for the period of investment. Performance figures may reflect certain fee waivers and/or expense limitations, without which total returns may have been lower. For more information on share classes and current fee waivers and/or expense limitations (if any), please refer to the Notes to Financial Statements.
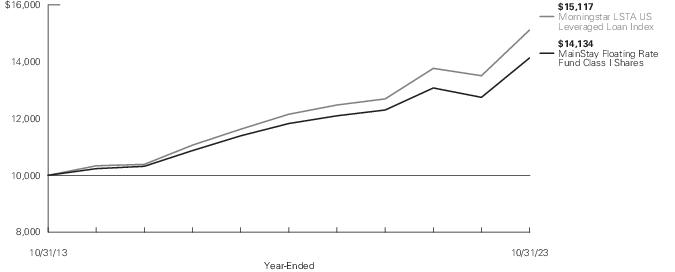
| Average Annual Total Returns for the Year-Ended October 31, 2023 |
| Class | Sales Charge | | Inception
Date | One
Year | Five
Years | Ten Years
or Since
Inception | Gross
Expense
Ratio1 |
| Class A Shares | Maximum 3.00% Initial Sales Charge | With sales charges | 5/3/2004 | 7.29% | 2.75% | 2.95% | 1.00% |
| | | Excluding sales charges | | 10.61 | 3.38 | 3.26 | 1.00 |
| Investor Class Shares2 | Maximum 2.50% Initial Sales Charge | With sales charges | 2/28/2008 | 7.71 | 2.69 | 2.92 | 1.08 |
| | | Excluding sales charges | | 10.47 | 3.32 | 3.23 | 1.08 |
| Class B Shares3 | Maximum 3.00% CDSC | With sales charges | 5/3/2004 | 6.77 | 2.54 | 2.46 | 1.83 |
| | if Redeemed Within the First Four Years of Purchase | Excluding sales charges | | 9.77 | 2.54 | 2.46 | 1.83 |
| Class C Shares | Maximum 1.00% CDSC | With sales charges | 5/3/2004 | 8.65 | 2.54 | 2.46 | 1.83 |
| | if Redeemed Within One Year of Purchase | Excluding sales charges | | 9.65 | 2.54 | 2.46 | 1.83 |
| Class I Shares | No Sales Charge | | 5/3/2004 | 10.89 | 3.63 | 3.52 | 0.75 |
| Class R3 Shares4 | No Sales Charge | | 2/29/2016 | 10.22 | 3.01 | 3.90 | 1.35 |
| Class R6 Shares | No Sales Charge | | 2/28/2019 | 11.10 | N/A | 3.94 | 0.64 |
| SIMPLE Class Shares | No Sales Charge | | 8/31/2020 | 10.33 | N/A | 4.11 | 1.33 |
| 1. | The gross expense ratios presented reflect the Fund’s “Total Annual Fund Operating Expenses” from the most recent Prospectus, as supplemented, and may differ from other expense ratios disclosed in this report. |
| 2. | Prior to June 30, 2020, the maximum initial sales charge was 3.00%, which is reflected in the applicable average annual total return figures shown. |
| 3. | Class B shares are closed to all new purchases as well as additional investments by existing Class B shareholders and will be converted into Class A or Investor Class shares based on shareholder eligibility on or about February 28, 2024. |
| 4. | As of October 31, 2023, Class R3 shares are closed to new investors and, upon the close of business on December 29, 2023, Class R3 shares are closed to additional investments by existing shareholders. Additionally, Class R3 shares will be liquidated on or about February 28, 2024 (the "Liquidation Date"). It is expected that the Fund will distribute to remaining shareholders invested in Class R3 shares, on or promptly after the Liquidation Date, a liquidating distribution in cash or cash equivalents equal to the net asset value of such shares. |
The footnotes on the next page are an integral part of the table and graph and should be carefully read in conjunction with them.
| Benchmark Performance* | One
Year | Five
Years | Ten
Years |
| Morningstar LSTA US Leveraged Loan Index1 | 11.92% | 4.46% | 4.22% |
| Morningstar Bank Loan Category Average2 | 10.44 | 3.08 | 3.12 |
| * | Returns for indices reflect no deductions for fees, expenses or taxes, except for foreign withholding taxes where applicable. Results assume reinvestment of all dividends and capital gains. An investment cannot be made directly in an index. |
| 1. | The Morningstar LSTA US Leveraged Loan Index is the Fund's primary broad-based securities market index for comparison purposes. The Morningstar LSTA US Leveraged Loan Index is a broad index designed to reflect the performance of U.S. dollar facilities in the leveraged loan market. |
| 2. | The Morningstar Bank Loan Category Average is representative of funds that invest in floating-rate bank loans instead of bonds. In exchange for their credit risk, these loans offer high interest payments that typically float above a common short-term benchmark. Results are based on average total returns of similar funds with all dividends and capital gain distributions reinvested. |
The footnotes on the preceding page are an integral part of the table and graph and should be carefully read in conjunction with them.
| 6 | MainStay Floating Rate Fund |
Cost in Dollars of a $1,000 Investment in MainStay Floating Rate Fund (Unaudited)
The example below is intended to describe the fees and expenses borne by shareholders during the six-month period from May 1, 2023 to October 31, 2023, and the impact of those costs on your investment.
Example
As a shareholder of the Fund you incur two types of costs: (1) transaction costs, including exchange fees and sales charges (loads) on purchases (as applicable), and (2) ongoing costs, including management fees, distribution and/or service (12b-1) fees and other Fund expenses (as applicable). This example is intended to help you understand your ongoing costs (in dollars) of investing in the Fund and to compare these costs with the ongoing costs of investing in other mutual funds. The example is based on an investment of $1,000 made at the beginning of the six-month period and held for the entire period from May 1, 2023 to October 31, 2023.
This example illustrates your Fund’s ongoing costs in two ways:
Actual Expenses
The second and third data columns in the table below provide information about actual account values and actual expenses. You may use the information in these columns, together with the amount you invested, to estimate the expenses that you paid during the six months ended October 31, 2023. Simply divide your account value by $1,000 (for example, an
$8,600 account value divided by $1,000 = 8.6), then multiply the result by the number under the heading entitled “Expenses Paid During Period” to estimate the expenses you paid on your account during this period.
Hypothetical Example for Comparison Purposes
The fourth and fifth data columns in the table below provide information about hypothetical account values and hypothetical expenses based on the Fund’s actual expense ratio and an assumed rate of return of 5% per year before expenses, which is not the Fund’s actual return. The hypothetical account values and expenses may not be used to estimate the actual ending account balances or expenses you paid for the six-month period shown. You may use this information to compare the ongoing costs of investing in the Fund with the ongoing costs of investing in other mutual funds. To do so, compare this 5% hypothetical example with the 5% hypothetical examples that appear in the shareholder reports of the other mutual funds.
Please note that the expenses shown in the table are meant to highlight your ongoing costs only and do not reflect any transactional costs, such as exchange fees or sales charges (loads). Therefore, the fourth and fifth data columns of the table are useful in comparing ongoing costs only and will not help you determine the relative total costs of owning different funds. In addition, if these transactional costs were included, your costs would have been higher.
| Share Class | Beginning
Account
Value
5/1/23 | Ending Account
Value (Based
on Actual
Returns and
Expenses)
10/31/23 | Expenses
Paid
During
Period1 | Ending Account
Value (Based
on Hypothetical
5% Annualized
Return and
Actual Expenses)
10/31/23 | Expenses
Paid
During
Period1 | Net Expense
Ratio
During
Period2 |
| Class A Shares | $1,000.00 | $1,044.10 | $4.89 | $1,020.42 | $4.84 | 0.95% |
| Investor Class Shares | $1,000.00 | $1,043.20 | $5.72 | $1,019.61 | $5.65 | 1.11% |
| Class B Shares | $1,000.00 | $1,039.30 | $9.56 | $1,015.83 | $9.45 | 1.86% |
| Class C Shares | $1,000.00 | $1,038.10 | $9.56 | $1,015.83 | $9.45 | 1.86% |
| Class I Shares | $1,000.00 | $1,045.40 | $3.61 | $1,021.68 | $3.57 | 0.70% |
| Class R3 Shares | $1,000.00 | $1,041.00 | $6.64 | $1,018.70 | $6.56 | 1.29% |
| Class R6 Shares | $1,000.00 | $1,045.70 | $3.30 | $1,021.98 | $3.26 | 0.64% |
| SIMPLE Class Shares | $1,000.00 | $1,042.80 | $6.08 | $1,019.26 | $6.01 | 1.18% |
| 1. | Expenses are equal to the Fund’s annualized expense ratio of each class multiplied by the average account value over the period, divided by 365 and multiplied by 184 (to reflect the six-month period). The table above represents the actual expenses incurred during the six-month period. In addition to the fees and expenses which the Fund bears directly, it also indirectly bears a pro rata share of the fees and expenses of the underlying funds in which it invests. Such indirect expenses are not included in the above-reported expense figures. |
| 2. | Expenses are equal to the Fund's annualized expense ratio to reflect the six-month period. |
Industry Composition as of October 31, 2023 (Unaudited)
| Finance | 6.5% |
| Electronics | 6.1 |
| Services: Business | 5.4 |
| Chemicals, Plastics & Rubber | 5.2 |
| Other Asset-Backed Securities | 4.9 |
| Healthcare, Education & Childcare | 4.8 |
| Insurance | 4.0 |
| Telecommunications | 3.5 |
| Hotels, Motels, Inns & Gaming | 3.3 |
| Software | 3.1 |
| Containers, Packaging & Glass | 3.0 |
| Aerospace & Defense | 2.9 |
| Manufacturing | 2.9 |
| Oil & Gas | 2.3 |
| Diversified/Conglomerate Manufacturing | 2.2 |
| Buildings & Real Estate | 2.2 |
| Diversified/Conglomerate Service | 2.1 |
| High Tech Industries | 2.0 |
| Broadcasting & Entertainment | 1.9 |
| Automobile | 1.9 |
| Healthcare | 1.9 |
| Utilities | 1.8 |
| Media | 1.8 |
| Personal & Nondurable Consumer Products | 1.6 |
| Healthcare & Pharmaceuticals | 1.5 |
| Beverage, Food & Tobacco | 1.4 |
| Retail Store | 1.2 |
| Personal, Food & Miscellaneous Services | 1.2 |
| Leisure, Amusement, Motion Pictures & Entertainment | 1.1 |
| Entertainment | 1.1 |
| Printing & Publishing | 0.8 |
| Banking | 0.8 |
| Mining, Steel, Iron & Non-Precious Metals | 0.7 |
| Personal & Nondurable Consumer Products (Manufacturing Only) | 0.7 |
| Machinery (Non-Agriculture, Non-Construct & Non-Electronic) | 0.6 |
| Chemicals | 0.6 |
| Retail | 0.5 |
| Hotel, Gaming & Leisure | 0.5 |
| Commercial Services | 0.5 |
| Affiliated Investment Company | 0.4 |
| Capital Equipment | 0.4 |
| Pharmaceuticals | 0.3 |
| Real Estate | 0.3% |
| Packaging | 0.3 |
| Energy (Electricity) | 0.3 |
| Packaging & Containers | 0.3 |
| Cargo Transport | 0.2 |
| Water | 0.2 |
| Consumer Durables | 0.2 |
| Animal Food | 0.2 |
| Ecological | 0.2 |
| Personal Transportation | 0.2 |
| Environmental Control | 0.2 |
| Auto Manufacturers | 0.2 |
| Diversified Financial Services | 0.2 |
| Electric | 0.1 |
| Lodging | 0.1 |
| Healthcare-Services | 0.1 |
| Machinery-Diversified | 0.1 |
| Building Materials | 0.1 |
| Real Estate Investment Trusts | 0.1 |
| Airlines | 0.1 |
| Internet | 0.1 |
| Engineering & Construction | 0.1 |
| Services: Consumer | 0.0‡ |
| Iron & Steel | 0.0‡ |
| Distribution & Wholesale | 0.0‡ |
| Food | 0.0‡ |
| Oil & Gas Services | 0.0‡ |
| Healthcare-Products | 0.0‡ |
| Communications Equipment | 0.0‡ |
| Technology Hardware, Storage & Peripherals | 0.0‡ |
| Machinery | 0.0‡ |
| Health Care Equipment & Supplies | 0.0‡ |
| Specialty Retail | 0.0‡ |
| Independent Power and Renewable Electricity Producers | 0.0‡ |
| Automobile Components | 0.0‡ |
| Household Durables | 0.0‡ |
| Commercial Services & Supplies | 0.0‡ |
| Capital Markets | 0.0‡ |
| Short-Term Investments | 5.3 |
| Other Assets, Less Liabilities | -0.8 |
| | 100.0% |
| ‡ | Less than one-tenth of a percent. |
See Portfolio of Investments beginning on page 12 for specific holdings within these categories. The Fund's holdings are subject to change.
| 8 | MainStay Floating Rate Fund |
Top Ten Holdings and/or Issuers Held as of October 31, 2023 (excluding short-term investments) (Unaudited)
| 1. | Asurion LLC, 8.689%-10.689%, due 12/23/26–1/20/29 |
| 2. | Palmer Square CLO Ltd., 7.305%-13.246%, due 7/20/34–10/15/34 |
| 3. | Univision Communications, Inc., 6.625%-9.64%, due 6/1/27–6/24/29 |
| 4. | Allied Universal Holdco LLC, 9.174%-10.074%, due 5/12/28 |
| 5. | UKG, Inc., 8.764%-10.764%, due 5/4/26–5/3/27 |
| 6. | Agiliti Health, Inc., 8.395%, due 5/1/30 |
| 7. | Nouryon Finance BV, 9.419%-9.434%, due 4/3/28 |
| 8. | UFC Holdings LLC, 8.399%, due 4/29/26 |
| 9. | Connect Finco SARL, 8.824%, due 12/11/26 |
| 10. | Epicor Software Corp., 8.689%-9.074%, due 7/30/27 |
Portfolio Management Discussion and Analysis (Unaudited)
Questions answered by portfolio managers Mark A. Campellone and Arthur S. Torrey of NYL Investors LLC, the Fund’s Subadvisor.
How did MainStay Floating Rate Fund perform relative to its benchmark and peer group during the 12 months ended October 31, 2023?
For the 12 months ended October 31, 2023, Class I shares of MainStay Floating Rate Fund returned 10.89%, underperforming the 11.92% return of the Fund’s benchmark, the Morningstar LSTA US Leveraged Loan Index (the “Index”). Over the same period, Class I shares outperformed the 10.44% return of the Morningstar Bank Loan Category Average.1
What factors affected the Fund’s relative performance during the reporting period?
Loan indexes traded higher during the reporting period despite lingering uncertainties and volatility from geopolitical risks, rising interest rates, inflation and the potential for recession in the United States. The market for floating-rate loans was insulated from—but not immune to—these uncertainties and volatility.
The Fund has historically been focused on maintaining a larger position in higher-credit-quality loans rated BB, and less exposure to lower-credit-quality loans rated CCC and below.2 Most of the Fund’s peers saw outflows in the beginning of the reporting period. This started to reverse later in the reporting period, with some peers seeing inflows over the closing months. The Fund maintained higher cash balances late in the reporting period due to inflow and outflow volatility. This cash balance detracted from performance relative to the Index.
What was the Fund’s duration3 strategy during the reporting period?
Floating-rate loans are, by their nature, a low-duration asset. Loans earn a stated spread4 over a floating reference rate, which is tied to LIBOR5 or SOFR.6 Issuers can generally borrow under a
30-to-90-day range. The weighted average time to LIBOR/SOFR reset on the Fund’s portfolio averaged less than 40 days during the reporting period.
During the reporting period, which sectors were the strongest positive contributors to the Fund’s relative performance and which sectors were particularly weak?
The strongest contributions to the Fund’s relative performance were off-Index positions and overweight positions in pharmaceuticals and chemicals. (Contributions take weightings and total returns into account.) The largest detractors were underweight positions in software, capital markets, and diversified consumer services.
What were some of the Fund’s largest purchases and sales during the reporting period?
The Fund’s largest purchases during the reporting period included loans issued by Koppers Holdings, Power Solutions International, Creative Artists Agency and Copeland, reflecting our favorable view towards the relative value, business prospects and management teams of these issuers. The largest sales during the same period were loans issued by West Marine, Fairbanks, and Apollo Commercial Real Estate. These sales were made primarily to rebalance the Fund’s holdings for relative value and liquidity reasons.
How did the Fund’s sector weightings change during the reporting period?
During the reporting period, we increased the Fund’s cash position. We also increased exposure to the chemicals, insurance, and construction materials industries, as well as exposure to assets that fall outside standard industry classifications. Conversely, we reduced the Fund’s exposure to U.S. Treasury
| 1. | See "Investment and Performance Comparison" for other share class returns, which may be higher or lower than Class I share returns, and for more information on benchmark and peer group returns. |
| 2. | An obligation rated ‘BB’ by Standard & Poor’s (“S&P”) is deemed by S&P to be less vulnerable to nonpayment than other speculative issues. In the opinion of S&P, however, the obligor faces major ongoing uncertainties or exposure to adverse business, financial or economic conditions which could lead to the obligor’s inadequate capacity to meet its financial commitment on the obligation. An obligation rated ‘CCC’ by S&P is deemed by S&P to be currently vulnerable to nonpayment and is dependent upon favorable business, financial and economic conditions for the obligor to meet its financial commitment on the obligation. It is the opinion of S&P that in the event of adverse business, financial or economic conditions, the obligor is not likely to have the capacity to meet its financial commitment on the obligation. When applied to Fund holdings, ratings are based solely on the creditworthiness of the bonds in the portfolio and are not meant to represent the security or safety of the Fund. |
| 3. | Duration is a measure of the price sensitivity of a fixed-income investment to changes in interest rates. Duration is expressed as a number of years and is considered a more accurate sensitivity gauge than average maturity. |
| 4. | The terms “spread” and “yield spread” may refer to the difference in yield between a security or type of security and comparable U.S. Treasury issues. The terms may also refer to the difference in yield between two specific securities or types of securities at a given time. |
| 5. | The London InterBank Offered Rate (LIBOR) is a composite of interest rates at which banks borrow from one another in the London market, and it is a benchmark for short-term interest rates. |
| 6. | The Secured Overnight Financing Rate (SOFR) is a secured, interbank overnight interest rate established as an alternative to LIBOR. |
| 10 | MainStay Floating Rate Fund |
securities and to the media, specialty retail and software industries.
How was the Fund positioned at the end of the reporting period?
As of October 31, 2023, we remain cautiously optimistic about the performance of the floating-rate market. The Fund holds its most overweight positions relative to the Index in health care equipment & supplies, hotels, restaurants & leisure, containers & packaging and off-index industry positions. The Fund holds its most significantly underweight positions in the software, capital markets and professional services industries. We continue to look for opportunities to add exposure in these underweight sectors, subject to our underwriting criteria.
From a ratings perspective, the Fund holds overweight positions in credit rated BB and NR,7 while maintaining underweight exposure to credit rated BBB, B and CCC and below, 8 reflecting our view favoring higher-rated credit in the loan market. As of the end of the reporting period, the Fund’s cash balances remain high, given the volatile market conditions and inflows/outflows.
| 7. | NR indicates that S&P has not assigned an obligation with a rating, or a rating is no longer assigned. |
| 8. | An obligation rated ‘BBB’ by S&P is deemed by S&P to exhibit adequate protection parameters. In the opinion of S&P, however, adverse economic conditions or changing circumstances are more likely to lead to a weakened capacity of the obligor to meet its financial commitment on the obligation. An obligation rated ‘B’ by S&P is deemed by S&P to be more vulnerable to nonpayment than obligations rated ‘BB’, but in the opinion of S&P, the obligor currently has the capacity to meet its financial commitment on the obligation. It is the opinion of S&P that adverse business, financial, or economic conditions will likely impair the obligor's capacity or willingness to meet its financial commitment on the obligation. When applied to Fund holdings, ratings are based solely on the creditworthiness of the bonds in the portfolio and are not meant to represent the security or safety of the Fund. |
The opinions expressed are those of the portfolio managers as of the date of this report and are subject to change. There is no guarantee that any forecasts will come to pass. This material does not constitute investment advice and is not intended as an endorsement of any specific investment.
Portfolio of Investments October 31, 2023†^
| | Principal
Amount | Value |
| Long-Term Bonds 95.1% |
| Asset-Backed Securities 4.9% |
| Other Asset-Backed Securities 4.9% |
| AGL CLO 20 Ltd. (a)(b) | |
| Series 2022-20A, Class B | | |
| 8.366% (3 Month SOFR + 2.95%), due 7/20/35 | $ 2,500,000 | $ 2,505,192 |
| Series 2022-20A, Class E | | |
| 13.776% (3 Month SOFR + 8.36%), due 7/20/35 | 2,500,000 | 2,505,897 |
| AIMCO CLO 16 Ltd. (a)(b) | |
| Series 2021-16A, Class B | | |
| 7.314% (3 Month SOFR + 1.912%), due 1/17/35 | 2,500,000 | 2,460,140 |
| Series 2021-16A, Class E | | |
| 11.864% (3 Month SOFR + 6.462%), due 1/17/35 | 2,500,000 | 2,449,858 |
| AIMCO CLO 20 Ltd. (a)(b)(c) | |
| Series 2023-20A, Class D | | |
| 7.565% (3 Month SOFR + 4.00%), due 10/16/36 | 1,276,785 | 1,276,341 |
| Series 2023-20A, Class B1 | | |
| 9.356% (3 Month SOFR + 2.20%), due 10/16/36 | 1,500,000 | 1,499,478 |
| Ballyrock CLO 21 Ltd. (a)(b) | |
| Series 2022-21A, Class A2A | | |
| 8.216% (3 Month SOFR + 2.80%), due 10/20/35 | 2,700,000 | 2,712,112 |
| Series 2022-21A, Class C | | |
| 10.736% (3 Month SOFR + 5.32%), due 10/20/35 | 2,500,000 | 2,522,662 |
| Carlyle U.S. CLO Ltd. (a)(b) | |
| Series 2022-2A, Class A2 | | |
| 7.416% (3 Month SOFR + 2.00%), due 4/20/35 | 2,500,000 | 2,457,735 |
| Series 2022-2A, Class D | | |
| 12.816% (3 Month SOFR + 7.40%), due 4/20/35 | 2,500,000 | 2,370,485 |
| Danby Park CLO Ltd. (a)(b) | |
| Series 2022-1A, Class B | | |
| 8.362% (3 Month SOFR + 2.95%), due 10/21/35 | 1,000,000 | 1,004,966 |
| Series 2022-1A, Class D | | |
| 10.742% (3 Month SOFR + 5.33%), due 10/21/35 | 1,000,000 | 1,010,399 |
| Elmwood CLO 16 Ltd. (a)(b) | |
| Series 2022-3A, Class B | | |
| 7.366% (3 Month SOFR + 1.95%), due 4/20/34 | 2,500,000 | 2,468,280 |
| | Principal
Amount | Value |
| |
| Other Asset-Backed Securities (continued) |
| Elmwood CLO 16 Ltd. (a)(b) (continued) | |
| Series 2022-3A, Class E | | |
| 12.636% (3 Month SOFR + 7.22%), due 4/20/34 | $ 2,500,000 | $ 2,504,345 |
| Elmwood CLO XII Ltd. (a)(b) | |
| Series 2021-5A, Class B | | |
| 7.377% (3 Month SOFR + 1.962%), due 1/20/35 | 2,500,000 | 2,460,602 |
| Series 2021-5A, Class E | | |
| 12.027% (3 Month SOFR + 6.612%), due 1/20/35 | 2,500,000 | 2,420,478 |
| Empower CLO Ltd. (a)(b) | |
| Series 2023-2A, Class B | | |
| 8.09% (3 Month SOFR + 2.75%), due 7/15/36 | 1,250,000 | 1,253,104 |
| Series 2023-2A, Class D | | |
| 10.74% (3 Month SOFR + 5.40%), due 7/15/36 | 1,250,000 | 1,242,546 |
| Galaxy 32 CLO Ltd. (a)(b) | |
| Series 2023-32A, Class B | | |
| (zero coupon) (3 Month SOFR + 2.30%), due 10/20/36 | 1,500,000 | 1,500,000 |
| Series 2023-32A, Class D | | |
| 7.674% (3 Month SOFR + 4.30%), due 10/20/36 | 1,500,000 | 1,500,000 |
| Magnetite XXXI Ltd. (a)(b) | |
| Series 2021-31A, Class B | | |
| 7.305% (3 Month SOFR + 1.912%), due 7/15/34 | 2,500,000 | 2,456,892 |
| Series 2021-31A, Class E | | |
| 11.655% (3 Month SOFR + 6.262%), due 7/15/34 | 2,500,000 | 2,350,535 |
| Neuberger Berman Loan Advisers CLO 43 Ltd. (a)(b) | |
| Series 2021-43A, Class C | | |
| 7.614% (3 Month SOFR + 2.212%), due 7/17/35 | 2,500,000 | 2,430,375 |
| Series 2021-43A, Class E | | |
| 11.664% (3 Month SOFR + 6.262%), due 7/17/35 | 2,500,000 | 2,349,608 |
| Neuberger Berman Loan Advisers CLO 51 Ltd. (a)(b) | |
| Series 2022-51A, Class B | | |
| 8.462% (3 Month SOFR + 3.05%), due 10/23/35 | 1,250,000 | 1,256,810 |
| Series 2022-51A, Class D | | |
| 11.112% (3 Month SOFR + 5.70%), due 10/23/35 | 1,250,000 | 1,262,446 |
The notes to the financial statements are an integral part of, and should be read in conjunction with, the financial statements.
| 12 | MainStay Floating Rate Fund |
| | Principal
Amount | Value |
| Asset-Backed Securities (continued) |
| Other Asset-Backed Securities (continued) |
| Octagon Investment Partners 51 Ltd. (a)(b) | |
| Series 2021-1A, Class B | | |
| 7.377% (3 Month SOFR + 1.962%), due 7/20/34 | $ 2,500,000 | $ 2,451,670 |
| Series 2021-1A, Class E | | |
| 12.427% (3 Month SOFR + 7.012%), due 7/20/34 | 2,500,000 | 2,307,780 |
| OHA Credit Funding 16 Ltd. (a)(b) | |
| Series 2023-16A, Class B | | |
| (zero coupon) (3 Month SOFR + 2.25%), due 10/20/36 | 1,500,000 | 1,499,489 |
| Series 2023-16A, Class D | | |
| 7.606% (3 Month SOFR + 4.00%), due 10/20/36 | 1,500,000 | 1,499,489 |
| Palmer Square CLO Ltd. (a)(b) | |
| Series 2021-4A, Class B | | |
| 7.305% (3 Month SOFR + 1.912%), due 10/15/34 | 2,500,000 | 2,450,058 |
| Series 2022-2A, Class B | | |
| 7.616% (3 Month SOFR + 2.20%), due 7/20/34 | 2,500,000 | 2,494,265 |
| Series 2021-4A, Class D | | |
| 8.605% (3 Month SOFR + 3.212%), due 10/15/34 | 1,500,000 | 1,424,765 |
| Series 2021-4A, Class E | | |
| 11.705% (3 Month SOFR + 6.312%), due 10/15/34 | 2,500,000 | 2,360,378 |
| Series 2022-2A, Class E | | |
| 13.246% (3 Month SOFR + 7.83%), due 7/20/34 | 2,500,000 | 2,505,590 |
| Rockland Park CLO Ltd. (a)(b) | |
| Series 2021-1A, Class B | | |
| 7.327% (3 Month SOFR + 1.912%), due 4/20/34 | 2,500,000 | 2,456,122 |
| Series 2021-1A, Class E | | |
| 11.927% (3 Month SOFR + 6.512%), due 4/20/34 | 2,500,000 | 2,291,165 |
| Sixth Street CLO XXI Ltd. (a)(b) | |
| Series 2022-21A, Class B | | |
| 8.394% (3 Month SOFR + 3.00%), due 10/15/35 | 2,500,000 | 2,513,777 |
| Series 2022-21A, Class D | | |
| 10.494% (3 Month SOFR + 5.10%), due 10/15/35 | 1,429,000 | 1,440,818 |
Total Asset-Backed Securities
(Cost $81,156,996) | | 79,926,652 |
| | Principal
Amount | Value |
| Corporate Bonds 3.6% |
| Aerospace & Defense 0.1% |
| Spirit AeroSystems, Inc. (a) | | |
| 7.50%, due 4/15/25 | $ 2,100,000 | $ 2,094,821 |
| 9.375%, due 11/30/29 | 250,000 | 256,732 |
| | | 2,351,553 |
| Airlines 0.1% |
| United Airlines, Inc. | | |
| 4.375%, due 4/15/26 (a) | 800,000 | 742,092 |
| Auto Manufacturers 0.2% |
| Ford Motor Co. | | |
| 6.10%, due 8/19/32 | 1,900,000 | 1,757,403 |
| Ford Motor Credit Co. LLC | | |
| 7.35%, due 11/4/27 | 2,000,000 | 2,024,346 |
| | | 3,781,749 |
| Building Materials 0.1% |
| JELD-WEN, Inc. (a) | | |
| 4.625%, due 12/15/25 | 294,000 | 277,462 |
| 4.875%, due 12/15/27 | 780,000 | 661,162 |
| | | 938,624 |
| Chemicals 0.3% |
| ASP Unifrax Holdings, Inc. | | |
| 5.25%, due 9/30/28 (a) | 730,000 | 493,076 |
| Olympus Water US Holding Corp. | | |
| 9.75%, due 11/15/28 (a) | 3,500,000 | 3,418,454 |
| SCIL IV LLC | | |
| 5.375%, due 11/1/26 (a) | 660,000 | 585,437 |
| WR Grace Holdings LLC | | |
| 5.625%, due 8/15/29 (a) | 700,000 | 542,500 |
| | | 5,039,467 |
| Commercial Services 0.2% |
| Prime Security Services Borrower LLC | | |
| 6.25%, due 1/15/28 (a) | 1,000,000 | 927,303 |
| Sotheby's | | |
| 5.875%, due 6/1/29 (a) | 2,100,000 | 1,674,519 |
| | | 2,601,822 |
| Distribution & Wholesale 0.0% ‡ |
| OPENLANE, Inc. | | |
| 5.125%, due 6/1/25 (a) | 400,000 | 385,854 |
| Diversified Financial Services 0.2% |
| GGAM Finance Ltd. | | |
| 7.75%, due 5/15/26 (a) | 2,625,000 | 2,604,052 |
The notes to the financial statements are an integral part of, and should be read in conjunction with, the financial statements.
13
Portfolio of Investments October 31, 2023†^ (continued)
| | Principal
Amount | Value |
| Corporate Bonds (continued) |
| Diversified Financial Services (continued) |
| NFP Corp. | | |
| 8.50%, due 10/1/31 (a) | $ 1,330,000 | $ 1,307,718 |
| | | 3,911,770 |
| Electric 0.1% |
| Vistra Operations Co. LLC | | |
| 5.00%, due 7/31/27 (a) | 1,500,000 | 1,372,180 |
| Engineering & Construction 0.1% |
| Brand Industrial Services, Inc. | | |
| 10.375%, due 8/1/30 (a) | 1,500,000 | 1,488,750 |
| Entertainment 0.2% |
| Caesars Entertainment, Inc. | | |
| 7.00%, due 2/15/30 (a) | 1,420,000 | 1,370,432 |
| Caesars Resort Collection LLC | | |
| 5.75%, due 7/1/25 (a) | 500,000 | 492,009 |
| Light & Wonder International, Inc. | | |
| 7.00%, due 5/15/28 (a) | 1,350,000 | 1,315,965 |
| | | 3,178,406 |
| Environmental Control 0.2% |
| GFL Environmental, Inc. (a) | | |
| 4.25%, due 6/1/25 | 1,200,000 | 1,153,510 |
| 4.75%, due 6/15/29 | 2,000,000 | 1,750,804 |
| | | 2,904,314 |
| Food 0.0% ‡ |
| Post Holdings, Inc. | | |
| 5.50%, due 12/15/29 (a) | 240,000 | 214,035 |
| US Foods, Inc. | | |
| 7.25%, due 1/15/32 (a) | 500,000 | 490,819 |
| | | 704,854 |
| Healthcare-Products 0.0% ‡ |
| Medline Borrower LP | | |
| 5.25%, due 10/1/29 (a) | 470,000 | 400,074 |
| Healthcare-Services 0.1% |
| Acadia Healthcare Co., Inc. | | |
| 5.00%, due 4/15/29 (a) | 240,000 | 213,988 |
| Fortrea Holdings, Inc. | | |
| 7.50%, due 7/1/30 (a) | 840,000 | 810,600 |
| | | 1,024,588 |
| | Principal
Amount | Value |
| |
| Insurance 0.1% |
| GTCR AP Finance, Inc. | | |
| 8.00%, due 5/15/27 (a) | $ 900,000 | $ 876,335 |
| Internet 0.1% |
| Gen Digital, Inc. | | |
| 6.75%, due 9/30/27 (a) | 1,320,000 | 1,284,876 |
| Iron & Steel 0.0% ‡ |
| Carpenter Technology Corp. | | |
| 6.375%, due 7/15/28 | 630,000 | 599,250 |
| Lodging 0.1% |
| Hilton Domestic Operating Co., Inc. | | |
| 5.375%, due 5/1/25 (a) | 1,000,000 | 983,052 |
| Machinery-Diversified 0.1% |
| GrafTech Finance, Inc. | | |
| 4.625%, due 12/15/28 (a) | 430,000 | 315,207 |
| GrafTech Global Enterprises, Inc. | | |
| 9.875%, due 12/15/28 (a) | 2,100,000 | 1,880,525 |
| | | 2,195,732 |
| Media 0.3% |
| Radiate Holdco LLC | | |
| 4.50%, due 9/15/26 (a) | 730,000 | 558,187 |
| Univision Communications, Inc. (a) | | |
| 6.625%, due 6/1/27 | 1,400,000 | 1,278,755 |
| 8.00%, due 8/15/28 | 2,400,000 | 2,266,372 |
| | | 4,103,314 |
| Oil & Gas 0.1% |
| Civitas Resources, Inc. | | |
| 8.625%, due 11/1/30 (a) | 2,270,000 | 2,310,465 |
| Oil & Gas Services 0.0% ‡ |
| USA Compression Partners LP | | |
| 6.875%, due 4/1/26 | 640,000 | 621,506 |
| Packaging & Containers 0.3% |
| Ardagh Metal Packaging Finance USA LLC | | |
| 4.00%, due 9/1/29 (a) | 600,000 | 450,042 |
| Ardagh Packaging Finance plc | | |
| 5.25%, due 4/30/25 (a) | 1,000,000 | 963,370 |
| Clydesdale Acquisition Holdings, Inc. | | |
| 8.75%, due 4/15/30 (a) | 900,000 | 717,372 |
The notes to the financial statements are an integral part of, and should be read in conjunction with, the financial statements.
| 14 | MainStay Floating Rate Fund |
| | Principal
Amount | Value |
| Corporate Bonds (continued) |
| Packaging & Containers (continued) |
| Mauser Packaging Solutions Holding Co. | | |
| 7.875%, due 8/15/26 (a) | $ 1,500,000 | $ 1,404,928 |
| Trident TPI Holdings, Inc. | | |
| 12.75%, due 12/31/28 (a) | 1,180,000 | 1,205,818 |
| | | 4,741,530 |
| Pharmaceuticals 0.1% |
| Bausch Health Cos., Inc. | | |
| 5.50%, due 11/1/25 (a) | 700,000 | 603,750 |
| Organon & Co. | | |
| 5.125%, due 4/30/31 (a) | 1,400,000 | 1,093,284 |
| | | 1,697,034 |
| Real Estate 0.1% |
| Realogy Group LLC | | |
| 5.75%, due 1/15/29 (a) | 1,670,000 | 1,052,423 |
| Real Estate Investment Trusts 0.1% |
| RHP Hotel Properties LP | | |
| 4.75%, due 10/15/27 | 300,000 | 272,580 |
| 7.25%, due 7/15/28 (a) | 2,100,000 | 2,035,653 |
| | | 2,308,233 |
| Retail 0.1% |
| IRB Holding Corp. | | |
| 7.00%, due 6/15/25 (a) | 580,000 | 575,667 |
| LBM Acquisition LLC | | |
| 6.25%, due 1/15/29 (a) | 2,000,000 | 1,580,000 |
| | | 2,155,667 |
| Software 0.1% |
| Clarivate Science Holdings Corp. (a) | | |
| 3.875%, due 7/1/28 | 700,000 | 601,022 |
| 4.875%, due 7/1/29 | 700,000 | 590,370 |
| | | 1,191,392 |
| Telecommunications 0.1% |
| Level 3 Financing, Inc. | | |
| 10.50%, due 5/15/30 (a) | 731,000 | 731,573 |
| Telesat Canada | | |
| 4.875%, due 6/1/27 (a) | 900,000 | 533,250 |
| | | 1,264,823 |
Total Corporate Bonds
(Cost $63,666,499) | | 58,211,729 |
| | Principal
Amount | Value |
| Loan Assignments 86.6% |
| Aerospace & Defense 2.8% |
| Amentum Government Services Holdings LLC (b) | |
| First Lien Tranche 3 Term Loan | |
| 9.335% (1 Month SOFR + 4.00%), due 2/15/29 | $ 4,032,292 | $ 3,935,267 |
| First Lien Tranche Term Loan 1 | |
| 9.439% (1 Month SOFR + 4.00%), due 1/29/27 | 1,998,937 | 1,961,457 |
| Arcline FM Holdings LLC | |
| First Lien Initial Term Loan | |
| 10.402% (3 Month SOFR + 4.75%), due 6/23/28 (b) | 3,118,305 | 3,077,377 |
| Asplundh Tree Expert LLC | |
| Amendment No. 1 Term Loan | |
| 7.174% (1 Month SOFR + 1.75%), due 9/7/27 (b) | 3,768,049 | 3,768,049 |
| Barnes Group, Inc. | |
| Initial Term Loan | |
| 8.424% (1 Month SOFR + 3.00%), due 9/3/30 (b) | 1,200,000 | 1,186,874 |
| Cobham Ultra SeniorCo. SARL | |
| USD Facility Term Loan B | |
| 9.363% (6 Month SOFR + 3.50%), due 8/3/29 (b) | 3,361,165 | 3,253,608 |
| Dynasty Acquisition Co., Inc. (b) | |
| 2023 Specified Refinancing Term Loan B1 | |
| 9.324% (1 Month SOFR + 4.00%), due 8/24/28 | 3,989,541 | 3,940,917 |
| 2023 Specified Refinancing Term Loan B2 | |
| 9.324% (1 Month SOFR + 4.00%), due 8/24/28 | 1,709,803 | 1,688,964 |
| Russell Investments U.S. Institutional Holdco, Inc. | |
| 2025 Term Loan | |
| 8.924% (1 Month SOFR + 3.50%), due 5/30/25 (b) | 5,399,014 | 5,109,940 |
| SkyMiles IP Ltd. | |
| Initial Term Loan | |
| 9.166% (3 Month SOFR + 3.75%), due 10/20/27 (b) | 4,251,428 | 4,345,759 |
| TransDigm, Inc. (b) | |
| Tranche Term Loan H | |
| 8.64% (3 Month SOFR + 3.25%), due 2/22/27 | 1,959,810 | 1,957,530 |
| Tranche Term Loan I | |
| 8.64% (3 Month SOFR + 3.25%), due 8/24/28 | 5,003,581 | 4,994,875 |
The notes to the financial statements are an integral part of, and should be read in conjunction with, the financial statements.
15
Portfolio of Investments October 31, 2023†^ (continued)
| | Principal
Amount | Value |
| Loan Assignments (continued) |
| Aerospace & Defense (continued) |
| United AirLines, Inc. | |
| Term Loan B | |
| 9.189% (1 Month SOFR + 3.75%), due 4/21/28 (b) | $ 3,259,286 | $ 3,265,058 |
| WestJet Airlines Ltd. | |
| Term Loan | |
| 8.424% (1 Month SOFR + 3.00%), due 12/11/26 (b) | 4,101,695 | 3,954,034 |
| | | 46,439,709 |
| Animal Food 0.2% |
| Alltech, Inc. | |
| Term Loan B | |
| 9.439% (1 Month SOFR + 4.00%), due 10/13/28 (b) | 3,066,063 | 2,989,412 |
| Automobile 1.9% |
| American Auto Auction Group LLC | |
| First Lien Tranche Term Loan B | |
| 10.54% (3 Month SOFR + 5.00%), due 12/30/27 (b) | 5,895,000 | 5,718,150 |
| Autokiniton U.S. Holdings, Inc. | |
| Closing Date Term Loan B | |
| 9.939% (1 Month SOFR + 4.50%), due 4/6/28 (b) | 4,043,792 | 3,957,862 |
| Belron Finance 2019 LLC | |
| Dollar Second Incremental Term Loan | |
| 7.902% (3 Month SOFR + 2.25%), due 10/30/26 (b) | 4,157,089 | 4,151,893 |
| Belron Finance US LLC | |
| Dollar Fourth Incremental Term Loan | |
| 8.245% (3 Month SOFR + 2.75%), due 4/18/29 (b) | 498,750 | 498,999 |
| Belron Group SA | |
| Dollar Third Incremental Term Loan | |
| 8.056% (3 Month SOFR + 2.425%), due 4/13/28 (b) | 4,298,095 | 4,292,723 |
| Clarios Global LP | |
| First Lien 2023 Term Loan | |
| 9.074% (1 Month SOFR + 3.75%), due 5/6/30 (b) | 6,428,572 | 6,412,500 |
| First Brand Group LLC | |
| First Lien 2021 Term Loan | |
| 10.881% (6 Month SOFR + 5.00%), due 3/30/27 (b) | 1,333,333 | 1,312,777 |
| | Principal
Amount | Value |
| |
| Automobile (continued) |
| Wand Newco 3, Inc. | |
| First Lien Tranche Term Loan B1 | |
| 8.174% (1 Month SOFR + 2.75%), due 2/5/26 (b) | $ 5,056,682 | $ 5,044,040 |
| | | 31,388,944 |
| Banking 0.8% |
| Apollo Commercial Real Estate Finance, Inc. (b) | |
| Initial Term Loan | |
| 8.189% (1 Month SOFR + 2.75%), due 5/15/26 | 240,130 | 231,726 |
| Term Loan B1 | |
| 8.939% (1 Month SOFR + 3.50%), due 3/11/28 | 82,494 | 77,957 |
| Edelman Financial Engines Center LLC (The) | |
| First Lien 2021 Initial Term Loan | |
| 8.939% (1 Month SOFR + 3.50%), due 4/7/28 (b) | 5,583,171 | 5,479,647 |
| Jane Street Group LLC | |
| Dollar Term Loan | |
| 8.189% (1 Month SOFR + 2.75%), due 1/26/28 (b) | 6,684,154 | 6,661,876 |
| | | 12,451,206 |
| Beverage, Food & Tobacco 1.4% |
| 8th Avenue Food & Provisions, Inc. | |
| First Lien Term Loan | |
| 9.189% (1 Month SOFR + 3.75%), due 10/1/25 (b) | 2,226,616 | 2,098,029 |
| CHG PPC Parent LLC | |
| First Lien 2021-1 U.S. Term Loan | |
| 8.439% (1 Month SOFR + 3.00%), due 12/8/28 (b) | 4,250,929 | 4,187,165 |
| Froneri International Ltd. | |
| First Lien Facility Term Loan B2 | |
| 7.674% (1 Month SOFR + 2.25%), due 1/29/27 (b) | 2,917,012 | 2,893,615 |
| H-Food Holdings LLC | |
| Initial Term Loan | |
| 9.269% (3 Month SOFR + 3.688%), due 5/23/25 (b) | 2,453,582 | 2,064,417 |
| Naked Juice LLC | |
| First Lien Initial Term Loan | |
| 8.74% (3 Month SOFR + 3.25%), due 1/24/29 (b) | 887,200 | 814,338 |
| Pegasus BidCo BV | |
| Initial Dollar Term Loan | |
| 9.615% (3 Month SOFR + 4.25%), due 7/12/29 (b) | 4,367,000 | 4,326,968 |
The notes to the financial statements are an integral part of, and should be read in conjunction with, the financial statements.
| 16 | MainStay Floating Rate Fund |
| | Principal
Amount | Value |
| Loan Assignments (continued) |
| Beverage, Food & Tobacco (continued) |
| Sotheby's | |
| 2021 Second Refinancing Term Loan | |
| 10.155% (3 Month SOFR + 4.50%), due 1/15/27 (b) | $ 2,239,608 | $ 2,164,021 |
| U.S. Foods, Inc. | |
| Incremental 2021 Term Loan B | |
| 7.939% (1 Month SOFR + 2.50%), due 11/22/28 (b) | 3,982,294 | 3,986,125 |
| United Natural Foods, Inc. | |
| Initial Term Loan | |
| 8.689% (1 Month SOFR + 3.25%), due 10/22/25 (b) | 1,136,179 | 1,131,090 |
| | | 23,665,768 |
| Broadcasting & Entertainment 1.9% |
| Altice France SA | |
| USD Term Loan B14 | |
| 10.894% (3 Month SOFR + 5.50%), due 8/15/28 (b) | 6,095,496 | 5,400,865 |
| Charter Communications Operating LLC | |
| Term Loan B1 7.074% - 7.133% | |
| (1 Month SOFR + 1.75%, 3 Month SOFR + 1.75%), due 4/30/25 (b) | 6,456,496 | 6,455,005 |
| Clear Channel Outdoor Holdings, Inc. | |
| Term Loan B 9.131% - 9.145% | |
| (3 Month SOFR + 3.50%), due 8/21/26 (b) | 4,134,249 | 3,966,295 |
| CMG Media Corp. | |
| First Lien 2021 Term Loan B | |
| 8.99% (3 Month SOFR + 3.50%), due 12/17/26 (b) | 5,186,784 | 4,662,919 |
| Gray Television, Inc. (b) | |
| Term Loan E | |
| 7.929% (1 Month SOFR + 2.50%), due 1/2/26 | 11,963 | 11,923 |
| Term Loan D | |
| 8.429% (1 Month SOFR + 3.00%), due 12/1/28 | 2,335,589 | 2,236,976 |
| Nexstar Media, Inc. | |
| Term Loan B4 | |
| 7.939% (1 Month SOFR + 2.50%), due 9/18/26 (b) | 2,916,699 | 2,913,963 |
| Univision Communications, Inc. (b) | |
| First Lien Initial Term Loan | |
| 8.689% (1 Month SOFR + 3.25%), due 1/31/29 | 4,437,313 | 4,359,660 |
| | Principal
Amount | Value |
| |
| Broadcasting & Entertainment (continued) |
| Univision Communications, Inc. (b) (continued) | |
| First Lien 2022 Incremental Term Loan | |
| 9.64% (3 Month SOFR + 4.25%), due 6/24/29 | $ 925,781 | $ 922,309 |
| | | 30,929,915 |
| Buildings & Real Estate 2.2% |
| Allspring Buyer LLC | |
| Initial Term Loan | �� |
| 8.949% (3 Month SOFR + 3.25%), due 11/1/28 (b) | 3,664,982 | 3,559,614 |
| Beacon Roofing Supply, Inc. | |
| 2028 Term Loan | |
| 7.689% (1 Month SOFR + 2.25%), due 5/19/28 (b) | 3,421,250 | 3,414,835 |
| Core & Main LP | |
| Tranche Term Loan B 7.926% - 8.056% | |
| (1 Month SOFR + 2.50%, 6 Month SOFR + 2.50%), due 7/27/28 (b) | 5,341,958 | 5,320,590 |
| Cornerstone Building Brands, Inc. | |
| Tranche Term Loan B | |
| 8.685% (1 Month SOFR + 3.25%), due 4/12/28 (b) | 6,426,055 | 6,095,383 |
| Cushman & Wakefield U.S. Borrower LLC (b) | |
| Replacement Term Loan | |
| 8.189% (1 Month SOFR + 2.75%), due 8/21/25 | 32,502 | 32,400 |
| 2023-1 Refinancing Term Loan | |
| 8.674% (1 Month SOFR + 3.25%), due 1/31/30 | 4,106,162 | 3,911,119 |
| 2023-2 Refinancing Term Loan | |
| 9.324% (1 Month SOFR + 4.00%), due 1/31/30 | 208,333 | 197,917 |
| SRS Distribution, Inc. (b) | |
| 2022 Refinancing Term Loan | |
| 8.924% (1 Month SOFR + 3.50%), due 6/2/28 | 1,375,500 | 1,343,864 |
| 2021 Refinancing Term Loan | |
| 8.939% (1 Month SOFR + 3.50%), due 6/2/28 | 2,971,931 | 2,899,862 |
| VC GB Holdings I Corp. | |
| First Lien Initial Term Loan | |
| 8.652% (3 Month SOFR + 3.00%), due 7/21/28 (b) | 3,180,688 | 3,065,388 |
The notes to the financial statements are an integral part of, and should be read in conjunction with, the financial statements.
17
Portfolio of Investments October 31, 2023†^ (continued)
| | Principal
Amount | Value |
| Loan Assignments (continued) |
| Buildings & Real Estate (continued) |
| Wilsonart LLC | |
| Tranche Term Loan E | |
| 8.74% (3 Month SOFR + 3.25%), due 12/31/26 (b) | $ 5,687,580 | $ 5,629,913 |
| | | 35,470,885 |
| Capital Equipment 0.4% |
| AZZ, Inc. | |
| Initial Term Loan | |
| 9.074% (1 Month SOFR + 3.75%), due 5/13/29 (b) | 3,170,000 | 3,168,415 |
| CPM Holdings, Inc. | |
| Initial Term Loan | |
| 9.827% (1 Month SOFR + 4.50%), due 9/28/28 (b) | 3,000,000 | 2,995,314 |
| | | 6,163,729 |
| Cargo Transport 0.2% |
| Genesee & Wyoming, Inc. | |
| Initial Term Loan | |
| 7.49% (3 Month SOFR + 2.00%), due 12/30/26 (b) | 3,839,641 | 3,835,947 |
| Chemicals 0.3% |
| ASP Unifrax Holdings, Inc. | |
| First Lien USD Term Loan | |
| 9.29% (3 Month SOFR + 3.75%), due 12/12/25 (b) | 2,945,876 | 2,741,768 |
| LSF11 A5 Holdco LLC (b) | |
| Term Loan | |
| 8.939% (1 Month SOFR + 3.50%), due 10/15/28 | 2,288,384 | 2,224,309 |
| Fourth Amendment Incremental Term Loan | |
| 9.674% (1 Month SOFR + 4.25%), due 10/15/28 | 448,875 | 439,617 |
| | | 5,405,694 |
| Chemicals, Plastics & Rubber 5.2% |
| Aruba Investments Holdings LLC (b) | |
| First Lien Initial Dollar Term Loan | |
| 9.424% (1 Month SOFR + 4.00%), due 11/24/27 | 1,285,095 | 1,259,393 |
| First Lien 2022 Incremental Term Loan | |
| 10.074% (1 Month SOFR + 4.75%), due 11/24/27 (d)(e) | 1,488,750 | 1,458,975 |
| | Principal
Amount | Value |
| |
| Chemicals, Plastics & Rubber (continued) |
| Bakelite UK Intermediate Ltd. | |
| Term Loan | |
| 9.54% (3 Month SOFR + 4.00%), due 5/29/29 (b) | $ 5,127,538 | $ 4,960,893 |
| Clydesdale Acquisition Holdings, Inc. | |
| First Lien Term Loan B | |
| 9.599% (1 Month SOFR + 4.175%), due 4/13/29 (b) | 4,922,625 | 4,752,091 |
| Entegris, Inc. | |
| Tranche Term Loan B | |
| 7.89% (3 Month SOFR + 2.50%), due 7/6/29 (b) | 4,041,534 | 4,045,324 |
| Herens Holdco SARL | |
| USD Facility Term Loan B | |
| 9.415% (3 Month SOFR + 3.925%), due 7/3/28 (b) | 1,812,652 | 1,525,650 |
| Ineos Quattro Holdings U.K. Ltd. (b) | |
| 2026 Tranche Dollar Term Loan B | |
| 8.189% (1 Month SOFR + 2.75%), due 1/29/26 | 3,479,900 | 3,407,403 |
| 2030 Tranche Dollar Term Loan B | |
| 9.174% (1 Month SOFR + 3.75%), due 3/14/30 | 1,496,250 | 1,464,455 |
| Ineos U.S. Finance LLC (b) | |
| 2030 Dollar Term Loan | |
| 8.924% (1 Month SOFR + 3.50%), due 2/18/30 | 997,500 | 975,768 |
| 2027-II Dollar Term Loan | |
| 9.174% (1 Month SOFR + 3.75%), due 11/8/27 | 2,351,349 | 2,319,018 |
| Innophos Holdings, Inc. | |
| Initial Term Loan | |
| 8.689% (1 Month SOFR + 3.25%), due 2/5/27 (b) | 5,336,733 | 5,271,358 |
| Jazz Pharmaceuticals plc | |
| Initial Dollar Term Loan | |
| 8.939% (1 Month SOFR + 3.50%), due 5/5/28 (b) | 7,175,304 | 7,172,312 |
| Koppers, Inc. | |
| Term Loan B 8.91% - 8.95% | |
| (1 Month SOFR + 3.50%), due 4/10/30 (b) | 4,488,750 | 4,488,750 |
| Nouryon Finance BV (b) | |
| 2023 Term Loan | |
| 9.419% (1 Month SOFR + 4.00%), due 4/3/28 | 1,246,875 | 1,215,703 |
The notes to the financial statements are an integral part of, and should be read in conjunction with, the financial statements.
| 18 | MainStay Floating Rate Fund |
| | Principal
Amount | Value |
| Loan Assignments (continued) |
| Chemicals, Plastics & Rubber (continued) |
| Nouryon Finance BV (b) (continued) | |
| Extended Dollar Term Loan | |
| 9.434% (1 Month SOFR + 4.00%), due 4/3/28 | $ 6,430,030 | $ 6,274,102 |
| Olympus Water U.S. Holding Corp. | |
| Initial Dollar Term Loan | |
| 9.402% (3 Month SOFR + 3.75%), due 11/9/28 (b) | 2,677,102 | 2,606,828 |
| Oxea Holding Vier GmbH | |
| Tranche Term Loan B2 | |
| 9.014% (3 Month SOFR + 3.50%), due 10/14/24 (b) | 3,410,007 | 3,339,676 |
| PMHC II, Inc. | |
| Initial Term Loan | |
| 9.807% (3 Month SOFR + 4.25%), due 4/23/29 (b) | 5,940,000 | 5,388,697 |
| SCIH Salt Holdings, Inc. | |
| First Lien Incremental Term Loan B1 | |
| 9.439% (1 Month SOFR + 4.00%), due 3/16/27 (b) | 6,247,581 | 6,153,867 |
| Sparta U.S. Holdco LLC | |
| First Lien Initial Term Loan | |
| 8.679% (1 Month SOFR + 3.25%), due 8/2/28 (b) | 2,063,250 | 2,042,617 |
| Tricorbraun Holdings, Inc. | |
| First Lien Closing Date Initial Term Loan | |
| 8.689% (1 Month SOFR + 3.25%), due 3/3/28 (b) | 5,821,120 | 5,641,637 |
| Tronox Finance LLC | |
| First Lien 2022 Incremental Term Loan | |
| 8.64% (3 Month SOFR + 3.25%), due 4/4/29 (b) | 2,540,630 | 2,496,169 |
| W. R. Grace Holdings LLC | |
| Initial Term Loan | |
| 9.402% (3 Month SOFR + 3.75%), due 9/22/28 (b) | 3,438,750 | 3,369,975 |
| Windsor Holdings III LLC | |
| Dollar Term Loan B | |
| 9.815% (1 Month SOFR + 4.50%), due 8/1/30 (b) | 4,000,000 | 3,982,500 |
| | | 85,613,161 |
| Commercial Services 0.3% |
| Prime Security Services Borrower LLC | |
| First Lien 2023 Refinancing Term Loan B1 | |
| 7.832% (1 Month SOFR + 2.50%), due 10/13/30 (b) | 5,000,000 | 4,985,715 |
| | Principal
Amount | Value |
| |
| Consumer Durables 0.2% |
| SWF Holdings I Corp. | |
| First Lien Initial Term Loan | |
| 9.439% (1 Month SOFR + 4.00%), due 10/6/28 (b) | $ 4,811,613 | $ 3,929,486 |
| Containers, Packaging & Glass 3.0% |
| Alliance Laundry Systems LLC | |
| Initial Term Loan B 8.932% - 8.994% | |
| (1 Month SOFR + 3.50%, 3 Month SOFR + 3.50%), due 10/8/27 (b) | 4,913,177 | 4,900,211 |
| Altium Packaging LLC | |
| First Lien 2021 Term Loan | |
| 8.189% (1 Month SOFR + 2.75%), due 2/3/28 (b) | 3,007,979 | 2,952,653 |
| Anchor Glass Container Corp. | |
| First Lien August 2023 Extended Term Loan 10.628% - 10.896% | |
| (3 Month SOFR + 5.00%, 6 Month SOFR + 5.00%), due 12/7/25 (b) | 2,637,165 | 2,149,290 |
| Berlin Packaging LLC (b) | |
| Tranche Initial Term Loan B4 8.566% - 8.77% | |
| (1 Month SOFR + 3.25%, 3 Month SOFR + 3.25%), due 3/11/28 | 3,900,014 | 3,767,171 |
| Tranche Term Loan B5 9.179% - 9.402% | |
| (1 Month SOFR + 3.75%, 3 Month SOFR + 3.75%), due 3/11/28 | 1,058,400 | 1,032,129 |
| Charter Next Generation, Inc. | |
| First Lien 2021 Initial Term Loan | |
| 9.189% (1 Month SOFR + 3.75%), due 12/1/27 (b) | 6,004,178 | 5,837,190 |
| Flint Group Packaging Inks North America Holdings LLC (b) | |
| USD PIK Holdco Term Loan | |
| 5.71% (3 Month SOFR + 0.10%), due 12/31/27 | 399,924 | 282,946 |
| Second Lien USD PIK Holdco Term Loan | |
| 5.71% (3 Month SOFR + 0.10%), due 12/31/27 | 533,320 | 86,664 |
| USD Facility Term Loan B | |
| 9.856% (3 Month SOFR + 4.25%), due 12/31/26 | 844,489 | 784,674 |
| Graham Packaging Co., Inc. | |
| 2021 Initial Term Loan | |
| 8.439% (1 Month SOFR + 3.00%), due 8/4/27 (b) | 5,814,429 | 5,749,744 |
The notes to the financial statements are an integral part of, and should be read in conjunction with, the financial statements.
19
Portfolio of Investments October 31, 2023†^ (continued)
| | Principal
Amount | Value |
| Loan Assignments (continued) |
| Containers, Packaging & Glass (continued) |
| Mauser Packaging Solutions Holding Co. | |
| Initial Term Loan | |
| 9.319% (1 Month SOFR + 4.00%), due 8/14/26 (b) | $ 182,417 | $ 176,574 |
| Pactiv Evergreen, Inc. (b) | |
| Tranche U.S. Term Loan B2 | |
| 8.689% (1 Month SOFR + 3.25%), due 2/5/26 | 1,779,299 | 1,773,616 |
| Tranche U.S. Term Loan B3 | |
| 8.689% (1 Month SOFR + 3.25%), due 9/24/28 | 980,000 | 974,181 |
| Pretium PKG Holdings, Inc. (b) | |
| First Lien Initial Term Loan 9.441% - 9.53% | |
| (1 Month SOFR + 4.00%, 3 Month SOFR + 4.00%), due 10/2/28 | 3,615,600 | 2,693,622 |
| Second Lien Initial Term Loan 12.195% - 12.206% | |
| (1 Month SOFR + 6.75%), due 10/1/29 (d) | 1,750,000 | 745,937 |
| First Lien Third Amendment Tranche Term Loan A | |
| 10.395% (3 Month SOFR + 5.00%), due 10/2/28 | 2,073,106 | 2,029,917 |
| ProAmpac PG Borrower LLC | |
| 2023-1 Term Loan 9.887% - 12.00% | |
| (3 Month SOFR + 3.50%, 3 Month SOFR + 4.50%), due 9/15/28 (b) | 3,166,667 | 3,123,125 |
| Reynolds Consumer Products LLC | |
| Initial Term Loan | |
| 7.174% (1 Month SOFR + 1.75%), due 2/4/27 (b) | 126,925 | 126,343 |
| RLG Holdings LLC | |
| First Lien Closing Date Initial Term Loan | |
| 9.689% (1 Month SOFR + 4.25%), due 7/7/28 (b) | 4,912,500 | 4,525,641 |
| Trident TPI Holdings, Inc. (b) | |
| Tranche Initial Term Loan B3 | |
| 9.652% (3 Month SOFR + 4.00%), due 9/15/28 | 3,698,360 | 3,646,739 |
| Tranche Initial Term Loan B5 | |
| 9.89% (3 Month SOFR + 4.50%), due 9/15/28 | 970,555 | 965,433 |
| Tranche Initial Term Loan B4 | |
| 10.64% (3 Month SOFR + 5.25%), due 9/15/28 | 397,000 | 394,353 |
| | | 48,718,153 |
| | Principal
Amount | Value |
| |
| Diversified/Conglomerate Manufacturing 2.2% |
| Allied Universal Holdco LLC (b) | |
| Initial U.S. Dollar Term Loan | |
| 9.174% (1 Month SOFR + 3.75%), due 5/12/28 | $ 5,976,608 | $ 5,662,836 |
| Amendment No. 3 Term Loan | |
| 10.074% (1 Month SOFR + 4.75%), due 5/12/28 | 3,000,000 | 2,902,968 |
| Filtration Group Corp. (b) | |
| 2021 Incremental Term Loan | |
| 8.939% (1 Month SOFR + 3.50%), due 10/21/28 | 2,954,774 | 2,930,766 |
| 2023 Extended Dollar Term Loan | |
| 9.689% (1 Month SOFR + 4.25%), due 10/21/28 | 2,756,958 | 2,755,481 |
| Gardner Denver, Inc. | |
| 2020 GDI Tranche Dollar Term Loan B2 | |
| 7.174% (1 Month SOFR + 1.75%), due 3/1/27 (b) | 3,308,796 | 3,311,692 |
| GYP Holdings III Corp. | |
| First Lien 2023 Refinancing Term Loan | |
| 8.324% (1 Month SOFR + 3.00%), due 5/12/30 (b) | 570,787 | 571,679 |
| Ingersoll-Rand Services Co. | |
| 2020 Spinco Tranche Dollar Term Loan B1 | |
| 7.174% (1 Month SOFR + 1.75%), due 3/1/27 (b) | 162,026 | 162,168 |
| Iron Mountain Information Management LLC | |
| Incremental Term Loan B | |
| 7.189% (1 Month LIBOR + 1.75%), due 1/2/26 (b) | 3,177,413 | 3,166,489 |
| LTI Holdings, Inc. (b) | |
| First Lien Initial Term Loan | |
| 8.939% (1 Month SOFR + 3.50%), due 9/6/25 | 1,282,465 | 1,219,624 |
| First Lien First Amendment Additional Term Loan | |
| 10.189% (1 Month LIBOR + 4.75%), due 7/24/26 | 1,719,211 | 1,640,414 |
| QUIKRETE Holdings, Inc. | |
| First Lien Fourth Amendment Term Loan | |
| 8.189% (1 Month SOFR + 2.75%), due 3/19/29 (b) | 5,417,500 | 5,412,418 |
| Red Ventures LLC | |
| First Lien Term Loan B4 | |
| 8.324% (1 Month SOFR + 3.00%), due 3/3/30 (b) | 4,136,748 | 4,091,244 |
The notes to the financial statements are an integral part of, and should be read in conjunction with, the financial statements.
| 20 | MainStay Floating Rate Fund |
| | Principal
Amount | Value |
| Loan Assignments (continued) |
| Diversified/Conglomerate Manufacturing (continued) |
| WP CPP Holdings LLC | |
| First Lien Initial Term Loan | |
| 9.29% (3 Month SOFR + 3.75%), due 4/30/25 (b) | $ 2,938,549 | $ 2,804,845 |
| | | 36,632,624 |
| Diversified/Conglomerate Service 2.1% |
| Applied Systems, Inc. (b) | |
| First Lien 2026 Term Loan | |
| 9.89% (3 Month SOFR + 4.50%), due 9/18/26 | 3,446,479 | 3,451,404 |
| Second Lien 2021 Term Loan | |
| 12.14% (3 Month SOFR + 6.75%), due 9/17/27 | 1,982,109 | 1,988,923 |
| Blackhawk Network Holdings, Inc. | |
| First Lien Term Loan | |
| 8.172% (3 Month SOFR + 2.75%), due 6/15/25 (b) | 3,778,627 | 3,743,988 |
| Brightview Landscapes LLC | |
| 2022 Initial Term Loan | |
| 8.633% (3 Month SOFR + 3.25%), due 4/20/29 (b) | 880,595 | 878,668 |
| Element Materials Technology Group U.S. Holdings, Inc. (b) | |
| Initial USD Term Loan B | |
| 9.74% (3 Month SOFR + 4.25%), due 6/22/29 | 1,901,421 | 1,834,871 |
| First Lien Delayed Draw Term Loan B | |
| 9.74% (3 Month SOFR + 4.25%), due 6/22/29 | 877,579 | 846,864 |
| Genesys Cloud Services Holdings I LLC | |
| 2020 Initial Dollar Term Loan | |
| 9.439% (1 Month SOFR + 4.00%), due 12/1/27 (b) | 5,764,508 | 5,757,303 |
| MKS Instruments, Inc. | |
| 2023-1 Dollar Term Loan B | |
| 7.819% (1 Month SOFR + 2.50%), due 8/17/29 (b) | 6,791,244 | 6,721,634 |
| TruGreen LP | |
| First Lien Second Refinancing Term Loan | |
| 9.424% (1 Month SOFR + 4.00%), due 11/2/27 (b) | 6,317,688 | 5,913,356 |
| Verscend Holding Corp. | |
| Term Loan B1 | |
| 9.439% (1 Month SOFR + 4.00%), due 8/27/25 (b) | 4,036,277 | 4,029,339 |
| | | 35,166,350 |
| | Principal
Amount | Value |
| |
| Ecological 0.2% |
| GFL Environmental, Inc. | |
| 2023 Refinancing Term Loan A | |
| 7.912% (3 Month SOFR + 2.50%), due 5/31/27 (b) | $ 3,019,667 | $ 3,018,912 |
| Electronics 6.1% |
| Camelot U.S. Acquisition LLC (b) | |
| Initial Term Loan | |
| 8.439% (1 Month SOFR + 3.00%), due 10/30/26 | 2,686,593 | 2,681,795 |
| Amendment No. 2 Incremental Term Loan | |
| 8.439% (1 Month SOFR + 3.00%), due 10/30/26 | 2,814,736 | 2,809,208 |
| Castle U.S. Holding Corp. (b) | |
| Initial Dollar Term Loan | |
| 9.434% (3 Month SOFR + 3.75%), due 1/29/27 | 219,046 | 158,926 |
| Dollar Term Loan B2 | |
| 9.684% (3 Month SOFR + 4.00%), due 1/29/27 | 4,895,833 | 3,598,437 |
| Commscope, Inc. | |
| Initial Term Loan | |
| 8.689% (1 Month SOFR + 3.25%), due 4/6/26 (b) | 6,123,151 | 5,258,256 |
| CoreLogic, Inc. | |
| First Lien Initial Term Loan | |
| 8.939% (1 Month SOFR + 3.50%), due 6/2/28 (b) | 6,414,526 | 5,807,821 |
| DCert Buyer, Inc. | |
| First Lien Initial Term Loan | |
| 9.324% (1 Month SOFR + 4.00%), due 10/16/26 (b) | 5,347,829 | 5,245,113 |
| ECi Macola/MAX Holding LLC | |
| First Lien Initial Term Loan | |
| 9.402% (3 Month SOFR + 3.75%), due 11/9/27 (b) | 3,403,750 | 3,383,539 |
| Epicor Software Corp. (b) | |
| Term Loan C | |
| 8.689% (1 Month SOFR + 3.25%), due 7/30/27 | 6,107,378 | 6,072,389 |
| Term Loan D | |
| 9.074% (1 Month SOFR + 3.75%), due 7/30/27 | 1,250,000 | 1,250,625 |
| Flexera Software LLC | |
| First Lien Term Loan B1 | |
| 9.189% (1 Month SOFR + 3.75%), due 3/3/28 (b) | 3,653,013 | 3,604,307 |
The notes to the financial statements are an integral part of, and should be read in conjunction with, the financial statements.
21
Portfolio of Investments October 31, 2023†^ (continued)
| | Principal
Amount | Value |
| Loan Assignments (continued) |
| Electronics (continued) |
| Gainwell Acquisition Corp. | |
| First Lien Term Loan B | |
| 9.49% (3 Month SOFR + 4.00%), due 10/1/27 (b) | $ 5,532,793 | $ 5,279,208 |
| Go Daddy Operating Co. LLC | |
| Amendment No. 6 Term Loan | |
| 7.824% (1 Month SOFR + 2.50%), due 11/9/29 (b) | 2,131,646 | 2,132,089 |
| Helios Software Holdings, Inc. | |
| 2021 Initial Dollar Term Loan | |
| 9.29% (3 Month SOFR + 3.75%), due 3/11/28 (b) | 1,403,009 | 1,368,810 |
| ION Trading Finance Ltd. | |
| 2021 Initial Dollar Term Loan | |
| 10.24% (3 Month SOFR + 4.75%), due 4/1/28 (b) | 3,910,000 | 3,775,246 |
| MH Sub I LLC | |
| First Lien 2023 May Incremental Term Loan | |
| 9.574% (1 Month SOFR + 4.25%), due 5/3/28 (b) | 6,751,352 | 6,443,659 |
| Project Alpha Intermediate Holding, Inc. | |
| Initial Term Loan | |
| 10.075% (1 Month SOFR + 4.75%), due 10/28/30 (b) | 6,500,000 | 6,299,196 |
| Proofpoint, Inc. | |
| First Lien Initial Term Loan | |
| 8.689% (1 Month SOFR + 3.25%), due 8/31/28 (b) | 5,472,302 | 5,374,562 |
| Rocket Software, Inc. | |
| Extended Dollar Term Loan | |
| 10.074% (1 Month SOFR + 4.75%), due 11/28/28 (b) | 5,171,464 | 5,057,691 |
| Sharp Services LLC (b) | |
| First Lien Initial Term Loan | |
| 9.49% (3 Month SOFR + 4.00%), due 12/31/28 | 4,117,101 | 4,096,516 |
| First Lien Tranche Term Loan B | |
| 9.896% (3 Month SOFR + 4.50%), due 12/31/28 | 1,000,000 | 991,250 |
| SS&C Technologies Holdings, Inc. (b) | |
| Term Loan B6 | |
| 7.674% (1 Month SOFR + 2.25%), due 3/22/29 | 2,032,522 | 2,030,176 |
| Term Loan B7 | |
| 7.674% (1 Month SOFR + 2.25%), due 3/22/29 | 3,219,693 | 3,215,978 |
| | Principal
Amount | Value |
| |
| Electronics (continued) |
| Surf Holdings SARL | |
| First Lien Dollar Tranche Term Loan | |
| 8.956% (1 Month SOFR + 3.50%), due 3/5/27 (b) | $ 2,957,246 | $ 2,935,889 |
| Vertiv Group Corp. | |
| Term Loan B | |
| 8.179% (1 Month SOFR + 2.75%), due 3/2/27 (b) | 5,793,071 | 5,776,978 |
| VS Buyer LLC | |
| Initial Term Loan | |
| 8.674% (1 Month SOFR + 3.25%), due 2/28/27 (b) | 1,447,500 | 1,432,573 |
| WEX, Inc. | |
| Term Loan B | |
| 7.689% (1 Month SOFR + 2.25%), due 3/31/28 (b) | 3,900,000 | 3,895,667 |
| | | 99,975,904 |
| Energy (Electricity) 0.3% |
| Covanta Holding Corp. (b) | |
| Initial Term Loan B | |
| 7.824% (1 Month SOFR + 2.50%), due 11/30/28 | 4,031,979 | 3,976,540 |
| Initial Term Loan C | |
| 7.824% (1 Month SOFR + 2.50%), due 11/30/28 | 306,620 | 302,404 |
| | | 4,278,944 |
| Entertainment 0.9% |
| Alterra Mountain Co. (b) | |
| Term Loan B2 | |
| 8.939% (1 Month SOFR + 3.50%), due 8/17/28 | 4,742,829 | 4,745,793 |
| Term Loan B3 | |
| 9.174% (1 Month SOFR + 3.75%), due 5/31/30 | 498,750 | 498,750 |
| Fertitta Entertainment LLC | |
| Initial Term Loan B | |
| 9.324% (1 Month SOFR + 4.00%), due 1/27/29 (b) | 4,149,146 | 4,052,765 |
| Formula One Management Ltd. | |
| First Lien Facility Term Loan B | |
| 7.574% (1 Month SOFR + 2.25%), due 1/15/30 (b) | 984,615 | 982,359 |
The notes to the financial statements are an integral part of, and should be read in conjunction with, the financial statements.
| 22 | MainStay Floating Rate Fund |
| | Principal
Amount | Value |
| Loan Assignments (continued) |
| Entertainment (continued) |
| J&J Ventures Gaming LLC | |
| Initial Term Loan | |
| 9.652% (3 Month SOFR + 4.00%), due 4/26/28 (b) | $ 5,370,202 | $ 5,094,979 |
| | | 15,374,646 |
| Finance 6.5% |
| AAdvantage Loyality IP Ltd. | |
| Initial Term Loan | |
| 10.427% (3 Month SOFR + 4.75%), due 4/20/28 (b) | 5,580,000 | 5,648,483 |
| Acuris Finance U.S., Inc. | |
| Initial Dollar Term Loan | |
| 9.54% (3 Month SOFR + 4.00%), due 2/16/28 (b) | 5,647,135 | 5,555,369 |
| ADMI Corp. (b) | |
| Amendment No.4 Refinancing Term Loan | |
| 8.814% (1 Month SOFR + 3.375%), due 12/23/27 | 2,437,500 | 2,186,640 |
| Amendment No. 5 Incremental Term Loan | |
| 9.189% (1 Month SOFR + 3.75%), due 12/23/27 | 3,675,000 | 3,307,500 |
| Ahlstrom-Munksjo Holding 3 Oy | |
| USD Facility Term Loan B | |
| 9.652% (3 Month SOFR + 4.00%), due 2/4/28 (b) | 3,120,894 | 3,001,261 |
| AlixPartners LLP | |
| Initial Dollar Term Loan | |
| 8.189% (1 Month SOFR + 2.75%), due 2/4/28 (b) | 3,357,968 | 3,353,072 |
| Blackstone Mortgage Trust, Inc. | |
| Term Loan B4 | |
| 8.824% (1 Month SOFR + 3.50%), due 5/9/29 (b) | 316,585 | 300,756 |
| Blue Tree Holdings, Inc. | |
| Term Loan | |
| 8.152% (3 Month SOFR + 2.50%), due 3/4/28 (b) | 1,462,500 | 1,425,937 |
| Boxer Parent Co., Inc. | |
| 2021 Replacement Dollar Term Loan | |
| 9.189% (1 Month SOFR + 3.75%), due 10/2/25 (b) | 3,852,448 | 3,846,739 |
| Covia Holdings LLC | |
| Initial Term Loan | |
| 9.676% (3 Month SOFR + 4.00%), due 7/31/26 (b) | 837,917 | 831,633 |
| | Principal
Amount | Value |
| |
| Finance (continued) |
| CPC Acquisition Corp. | |
| First Lien Initial Term Loan | |
| 9.402% (3 Month SOFR + 3.75%), due 12/29/27 (b) | $ 3,770,462 | $ 2,948,030 |
| Deerfield Dakota Holding LLC | |
| First Lien Initial Dollar Term Loan | |
| 9.14% (3 Month SOFR + 3.75%), due 4/9/27 (b) | 5,296,412 | 5,111,038 |
| Endurance International Group Holdings, Inc. | |
| Initial Term Loan | |
| 9.422% (6 Month SOFR + 3.50%), due 2/10/28 (b) | 5,617,612 | 5,201,561 |
| GTCR W. Merger Sub LLC | |
| USD Term Loan B | |
| TBD, due 9/20/30 | 5,000,000 | 4,958,035 |
| LBM Acquisition LLC | |
| First Lien Initial Term Loan | |
| 9.174% (1 Month LIBOR + 3.75%), due 12/17/27 (b) | 4,470,767 | 4,250,022 |
| LSF11 Trinity Bidco, Inc. | |
| Initial Term Loan | |
| 9.835% (1 Month SOFR + 4.50%), due 6/14/30 (b) | 3,740,625 | 3,726,598 |
| Minimax Viking GmbH | |
| Facility Term Loan B1C | |
| 7.931% (1 Month SOFR + 2.50%), due 7/31/25 (b) | 4,043,004 | 4,038,961 |
| Onex TSG Intermediate Corp. | |
| Initial Term Loan | |
| 10.395% (3 Month SOFR + 4.75%), due 2/28/28 (b) | 2,912,551 | 2,675,906 |
| Park River Holdings, Inc. | |
| First Lien Initial Term Loan | |
| 8.907% (3 Month SOFR + 3.25%), due 12/28/27 (b) | 4,529,911 | 4,271,869 |
| Peraton Corp. | |
| First Lien Term Loan B | |
| 9.174% (1 Month SOFR + 3.75%), due 2/1/28 (b) | 4,968,856 | 4,863,268 |
| Pluto Acquisition I, Inc. | |
| First Lien 2021 Term Loan | |
| 9.684% (3 Month SOFR + 4.00%), due 6/22/26 (b) | 3,747,505 | 3,147,904 |
| Potters Industries LLC | |
| Initial Term Loan | |
| 9.49% (3 Month SOFR + 4.00%), due 12/14/27 (b) | 1,170,000 | 1,170,975 |
The notes to the financial statements are an integral part of, and should be read in conjunction with, the financial statements.
23
Portfolio of Investments October 31, 2023†^ (continued)
| | Principal
Amount | Value |
| Loan Assignments (continued) |
| Finance (continued) |
| RealPage, Inc. | |
| First Lien Initial Term Loan | |
| 8.439% (1 Month SOFR + 3.00%), due 4/24/28 (b) | $ 4,789,423 | $ 4,672,408 |
| RealTruck Group, Inc. | |
| Initial Term Loan | |
| 9.189% (1 Month SOFR + 3.75%), due 1/31/28 (b) | 5,884,236 | 5,592,783 |
| Triton Water Holdings, Inc. | |
| First Lien Initial Term Loan | |
| 8.902% (3 Month SOFR + 3.25%), due 3/31/28 (b) | 3,801,622 | 3,599,661 |
| WCG Purchaser Corp. | |
| First Lien Initial Term Loan | |
| 9.439% (1 Month SOFR + 4.00%), due 1/8/27 (b) | 6,417,795 | 6,323,133 |
| WildBrain Ltd. | |
| Initial Term Loan | |
| 9.689% (1 Month SOFR + 4.25%), due 3/24/28 (b) | 5,469,305 | 5,291,552 |
| WIN Waste Innovations Holdings, Inc. | |
| Initial Term Loan | |
| 8.189% (1 Month SOFR + 2.75%), due 3/24/28 (b) | 6,284,727 | 5,588,171 |
| | | 106,889,265 |
| Healthcare 1.9% |
| AHP Health Partners, Inc. | |
| Initial Term Loan | |
| 8.939% (1 Month SOFR + 3.50%), due 8/24/28 (b) | 1,960,000 | 1,957,550 |
| Chariot Buyer LLC | |
| First Lien Initial Term Loan | |
| 8.674% (1 Month SOFR + 3.25%), due 11/3/28 (b) | 5,069,428 | 4,916,554 |
| CHG Healthcare Services, Inc. | |
| First Lien Initial Term Loan | |
| 8.689% (1 Month SOFR + 3.25%), due 9/29/28 (b) | 6,083,368 | 6,012,077 |
| ICU Medical, Inc. | |
| Tranche Term Loan B | |
| 8.04% (3 Month SOFR + 2.50%), due 1/8/29 (b) | 4,304,151 | 4,284,426 |
| LSCS Holdings, Inc. | |
| First Lien Initial Term Loan | |
| 9.939% (1 Month SOFR + 4.50%), due 12/16/28 (b) | 4,716,000 | 4,615,785 |
| | Principal
Amount | Value |
| |
| Healthcare (continued) |
| Medical Solutions Holdings, Inc. | |
| First Lien Initial Term Loan | |
| 8.772% (3 Month SOFR + 3.25%), due 11/1/28 (b) | $ 2,027,917 | $ 1,885,117 |
| Medline Borrower LP | |
| Initial Dollar Term Loan | |
| 8.689% (1 Month SOFR + 3.25%), due 10/23/28 (b) | 5,284,239 | 5,245,210 |
| U.S. Anesthesia Partners, Inc. | |
| First Lien Initial Term Loan | |
| 9.679% (1 Month SOFR + 4.25%), due 10/1/28 (b) | 1,900,303 | 1,644,290 |
| | | 30,561,009 |
| Healthcare & Pharmaceuticals 1.5% |
| Bausch & Lomb Corp. | |
| Initial Term Loan | |
| 8.755% (3 Month SOFR + 3.25%), due 5/10/27 (b) | 5,920,050 | 5,656,117 |
| Bausch Health Cos., Inc. | |
| Second Amendment Term Loan | |
| 10.689% (1 Month SOFR + 5.25%), due 2/1/27 (b) | 2,667,321 | 2,071,937 |
| Embecta Corp. | |
| First Lien Initial Term Loan | |
| 8.337% (6 Month SOFR + 3.00%), due 3/30/29 (b) | 6,327,554 | 6,112,867 |
| Envision Healthcare Corp. (f)(g) | |
| First Out Term Loan | |
| TBD (3 Month SOFR + 7.875%), due 3/31/27 (b) | 522,312 | 616,329 |
| Second Out Term Loan | |
| TBD, due 3/31/27 (d)(e) | 3,076,502 | 461,475 |
| 2018 Third Out Term Loan | |
| 8.992% (3 Month SOFR + 3.75%), due 3/31/27 (b)(d) | 1,444,155 | 7,221 |
| Owens & Minor, Inc. | |
| Term Loan B1 9.174% - 9.24% | |
| (1 Month SOFR + 3.75%, 3 Month SOFR + 3.75%), due 3/29/29 (b) | 3,590,000 | 3,585,512 |
| Pediatric Associates Holding Co. LLC | |
| Amendment No. 1 Incremental Term Loan | |
| 8.689% (1 Month SOFR + 3.25%), due 12/29/28 (b) | 3,325,282 | 3,187,282 |
The notes to the financial statements are an integral part of, and should be read in conjunction with, the financial statements.
| 24 | MainStay Floating Rate Fund |
| | Principal
Amount | Value |
| Loan Assignments (continued) |
| Healthcare & Pharmaceuticals (continued) |
| Physician Partners LLC | |
| Initial Term Loan | |
| 9.533% (3 Month SOFR + 4.00%), due 12/23/28 (b) | $ 2,570,776 | $ 2,419,743 |
| | | 24,118,483 |
| Healthcare, Education & Childcare 4.8% |
| Agiliti Health, Inc. | |
| Term Loan | |
| 8.395% (3 Month SOFR + 3.00%), due 5/1/30 (b) | 7,879,279 | 7,761,090 |
| Alvogen Pharma U.S., Inc. | |
| January 2020 Term Loan | |
| 10.79% (3 Month SOFR + 5.25%), due 12/31/23 (b) | 462,501 | 453,251 |
| Amneal Pharmaceuticals LLC | |
| Initial Term Loan | |
| 8.939% (1 Month SOFR + 3.50%), due 5/4/25 (b) | 6,888,268 | 6,739,743 |
| athenahealth Group, Inc. | |
| Initial Term Loan | |
| 8.577% (1 Month SOFR + 3.25%), due 2/15/29 (b) | 4,822,815 | 4,654,017 |
| Carestream Dental Technology Parent Ltd. (b) | |
| First Lien Initial Term Loan | |
| 8.981% (3 Month LIBOR + 3.25%), due 9/1/24 | 1,382,762 | 1,151,149 |
| First Lien Tranche Term Loan B | |
| 10.231% (6 Month SOFR + 4.50%), due 9/1/24 | 1,834,678 | 1,531,956 |
| Carestream Health, Inc. | |
| Term Loan | |
| 12.99% (3 Month SOFR + 7.50%), due 9/30/27 (b) | 2,498,325 | 1,830,023 |
| Ecovyst Catalyst Technologies LLC | |
| Initial Term Loan | |
| 7.983% (3 Month SOFR + 2.50%), due 6/9/28 (b) | 5,450,250 | 5,410,507 |
| Elanco Animal Health, Inc. | |
| Term Loan | |
| 7.165% (1 Month SOFR + 1.75%), due 8/1/27 (b) | 2,610,827 | 2,546,744 |
| eResearchTechnology, Inc. | |
| First Lien Initial Term Loan | |
| 9.939% (1 Month SOFR + 4.50%), due 2/4/27 (b) | 1,328,470 | 1,280,867 |
| | Principal
Amount | Value |
| |
| Healthcare, Education & Childcare (continued) |
| FC Compassus LLC | |
| Term Loan B1 | |
| 9.895% (3 Month SOFR + 4.25%), due 12/31/26 (b)(d) | $ 5,266,698 | $ 5,072,488 |
| Grifols Worldwide Operations Ltd. | |
| Dollar Tranche Term Loan B | |
| 7.424% (1 Month SOFR + 2.00%), due 11/15/27 (b) | 3,730,270 | 3,624,774 |
| Insulet Corp. | |
| Term Loan B | |
| 8.689% (1 Month SOFR + 3.25%), due 5/4/28 (b) | 5,459,002 | 5,433,983 |
| Journey Personal Care Corp. | |
| Initial Term Loan | |
| 9.981% (3 Month LIBOR + 4.25%), due 3/1/28 (b) | 3,890,051 | 3,717,430 |
| Mallinckrodt International Finance SA | |
| 2017 Replacement Term Loan | |
| 12.703% (1 Month SOFR + 7.25%), due 9/30/27 (b)(f) | 1,935,237 | 1,461,104 |
| National Mentor Holdings, Inc. (b) | |
| First Lien Initial Term Loan 9.174% - 9.24% | |
| (1 Month SOFR + 3.75%, 3 Month SOFR + 3.75%), due 3/2/28 | 2,142,388 | 1,863,878 |
| First Lien Initial Term Loan C | |
| 9.24% (3 Month SOFR + 3.75%), due 3/2/28 | 79,651 | 69,296 |
| Organon & Co. | |
| Dollar Term Loan | |
| 8.45% (1 Month SOFR + 3.00%), due 6/2/28 (b) | 5,594,676 | 5,566,703 |
| Petco Health and Wellness Co., Inc. | |
| First Lien Initial Term Loan | |
| 8.902% (3 Month SOFR + 3.25%), due 3/3/28 (b) | 6,534,215 | 6,373,584 |
| Raptor Acquisition Corp. | |
| First Lien Term Loan B | |
| 9.658% (3 Month SOFR + 4.00%), due 11/1/26 (b) | 4,196,875 | 4,190,580 |
| Select Medical Corp. | |
| Tranche Term Loan B1 | |
| 8.324% (1 Month SOFR + 3.00%), due 3/6/27 (b) | 2,348,958 | 2,339,417 |
| Sound Inpatient Physicians, Inc. | |
| First Lien Initial Term Loan | |
| 8.645% (3 Month SOFR + 3.00%), due 6/27/25 (b)(d) | 1,895,000 | 555,709 |
The notes to the financial statements are an integral part of, and should be read in conjunction with, the financial statements.
25
Portfolio of Investments October 31, 2023†^ (continued)
| | Principal
Amount | Value |
| Loan Assignments (continued) |
| Healthcare, Education & Childcare (continued) |
| Sunshine Luxembourg VII SARL | |
| Facility Term Loan B3 | |
| 9.24% (3 Month LIBOR + 3.75%), due 10/1/26 (b) | $ 5,628,840 | $ 5,619,457 |
| | | 79,247,750 |
| High Tech Industries 2.0% |
| Altar BidCo, Inc. | |
| First Lien Initial Term Loan 7.993% - 8.262% | |
| (1 Year SOFR + 3.10%, 3 Month SOFR + 3.10%), due 2/1/29 (b) | 4,062,244 | 4,019,444 |
| AP Gaming I LLC | |
| Term Loan B | |
| 9.54% (3 Month SOFR + 4.00%), due 2/15/29 (b) | 5,745,834 | 5,717,104 |
| Central Parent LLC | |
| First Lien 2023 Refinancing Term Loan | |
| 9.406% (3 Month SOFR + 4.00%), due 7/6/29 (b) | 2,000,000 | 1,987,272 |
| Hanesbands, Inc. | |
| Tranche Initial Term Loan B | |
| 9.074% (1 Month SOFR + 3.75%), due 3/8/30 (b) | 3,482,500 | 3,434,615 |
| NAB Holdings LLC | |
| Initial Term Loan | |
| 8.54% (3 Month SOFR + 3.00%), due 11/23/28 (b) | 1,426,704 | 1,415,494 |
| Nielsen Consumer, Inc. | |
| Fifth Amendment Dollar Incremental Term Loan | |
| 11.574% (1 Month SOFR + 6.25%), due 3/6/28 (b) | 1,828,750 | 1,767,030 |
| Open Text Corp. | |
| 2023 Replacement Term Loan | |
| 8.174% (1 Month SOFR + 2.75%), due 1/31/30 (b) | 4,441,506 | 4,439,126 |
| Scientific Games Holdings LP | |
| First Lien Initial Dollar Term Loan | |
| 8.914% (3 Month SOFR + 3.50%), due 4/4/29 (b) | 4,302,692 | 4,228,738 |
| Star Parent, Inc. | |
| Term Loan | |
| 9.386% (3 Month SOFR + 4.00%), due 9/27/30 (b) | 4,500,000 | 4,287,654 |
| | Principal
Amount | Value |
| |
| High Tech Industries (continued) |
| Trans Union LLC | |
| 2021 Incremental Term Loan B6 | |
| 7.689% (1 Month SOFR + 2.25%), due 12/1/28 (b) | $ 1,720,692 | $ 1,717,053 |
| | | 33,013,530 |
| Hotel, Gaming & Leisure 0.5% |
| Flutter Entertainment plc | |
| 2028 Third Amendment Term Loan B | |
| 8.902% (3 Month SOFR + 3.25%), due 7/22/28 (b) | 7,215,131 | 7,215,131 |
| Ontario Gaming GTA LP | |
| First Lien Term Loan B | |
| 9.64% (3 Month SOFR + 4.25%), due 8/1/30 (b) | 1,000,000 | 998,750 |
| | | 8,213,881 |
| Hotels, Motels, Inns & Gaming 3.3% |
| Aimbridge Acquisition Co., Inc. | |
| First Lien 2019 Initial Term Loan | |
| 9.189% (1 Month SOFR + 3.75%), due 2/2/26 (b) | 3,307,435 | 3,154,466 |
| Caesars Entertainment, Inc. | |
| 2023 Incremental Term Loan B | |
| 8.674% (1 Month SOFR + 3.25%), due 2/6/30 (b) | 2,089,500 | 2,078,727 |
| Entain plc (b) | |
| USD Facility Term Loan B | |
| 7.99% (3 Month SOFR + 2.50%), due 3/29/27 | 4,713,035 | 4,705,966 |
| USD Facility Term Loan B2 | |
| 8.99% (3 Month SOFR + 3.50%), due 10/31/29 | 1,588,004 | 1,585,622 |
| Everi Holdings, Inc. | |
| Term Loan B | |
| 7.939% (1 Month LIBOR + 2.50%), due 8/3/28 (b) | 4,038,730 | 4,030,879 |
| Four Seasons Holdings, Inc. | |
| First Lien 2023 Repricing Term Loan | |
| 7.924% (1 Month SOFR + 2.50%), due 11/30/29 (b) | 1,426,992 | 1,426,199 |
| Golden Entertainment, Inc. | |
| First Lien 2023 Refinancing Facility Term Loan B1 | |
| 8.176% (1 Month SOFR + 2.75%), due 5/28/30 (b) | 872,813 | 870,266 |
| Hilton Worldwide Finance LLC | |
| Refinanced Term Loan B2 | |
| 7.174% (1 Month SOFR + 1.75%), due 6/22/26 (b) | 1,720,157 | 1,718,237 |
The notes to the financial statements are an integral part of, and should be read in conjunction with, the financial statements.
| 26 | MainStay Floating Rate Fund |
| | Principal
Amount | Value |
| Loan Assignments (continued) |
| Hotels, Motels, Inns & Gaming (continued) |
| Light and Wonder International, Inc. | |
| Initial Term Loan B | |
| 8.435% (1 Month SOFR + 3.00%), due 4/14/29 (b) | $ 5,917,575 | $ 5,896,443 |
| Oceankey U.S. II Corp. | |
| Initial Term Loan | |
| 8.924% (1 Month SOFR + 3.50%), due 12/15/28 (b) | 3,551,441 | 3,345,013 |
| PCI Gaming Authority | |
| Facility Term Loan B | |
| 7.939% (1 Month SOFR + 2.50%), due 5/29/26 (b) | 1,370,300 | 1,368,015 |
| Penn Entertainment, Inc. | |
| Facility Term Loan B | |
| 8.17% (1 Month SOFR + 2.75%), due 5/3/29 (b) | 1,975,000 | 1,970,511 |
| Station Casinos LLC | |
| Facility Term Loan B1 | |
| 7.674% (1 Month SOFR + 2.25%), due 2/8/27 (b) | 1,875,210 | 1,863,021 |
| Travel + Leisure Co. | |
| Term Loan B | |
| 7.895% (3 Month SOFR + 2.25%), due 5/30/25 (b) | 3,800,000 | 3,792,875 |
| UFC Holdings LLC | |
| First Lien Term Loan B3 | |
| 8.399% (3 Month SOFR + 2.75%), due 4/29/26 (b) | 7,413,789 | 7,403,136 |
| Whatabrands LLC | |
| Initial Term Loan B | |
| 8.439% (1 Month SOFR + 3.00%), due 8/3/28 (b) | 5,885,150 | 5,823,027 |
| Wyndham Hotels & Resorts, Inc. | |
| 2023 Term Loan B | |
| 7.674% (1 Month SOFR + 2.25%), due 5/24/30 (b) | 2,496,244 | 2,498,116 |
| | | 53,530,519 |
| Insurance 3.9% |
| Acrisure LLC | |
| First Lien 2021-2 Additional Term Loan | |
| 9.689% (1 Month LIBOR + 4.25%), due 2/15/27 (b) | 4,863,375 | 4,832,979 |
| Alliant Holdings Intermediate LLC | |
| New Term Loan B4 | |
| 8.939% (1 Month LIBOR + 3.50%), due 11/5/27 (b) | 3,920,000 | 3,905,088 |
| | Principal
Amount | Value |
| |
| Insurance (continued) |
| AmWINS Group, Inc. | |
| Term Loan | |
| 7.689% (1 Month SOFR + 2.25%), due 2/19/28 (b) | $ 7,300,537 | $ 7,231,182 |
| AssuredPartners Capital, Inc. | |
| 2022 Term Loan | |
| 8.824% (1 Month SOFR + 3.50%), due 2/12/27 (b) | 2,955,000 | 2,926,928 |
| AssuredPartners, Inc. | |
| 2020 February Refinancing Term Loan | |
| 8.939% (1 Month SOFR + 3.50%), due 2/12/27 (b) | 3,886,405 | 3,850,778 |
| Asurion LLC (b) | |
| New Term Loan B8 | |
| 8.689% (1 Month SOFR + 3.25%), due 12/23/26 | 3,000,000 | 2,895,000 |
| New Term Loan B11 | |
| 9.674% (1 Month SOFR + 4.25%), due 8/19/28 | 3,277,520 | 3,125,934 |
| Second Lien New Term Loan B3 | |
| 10.689% (1 Month SOFR + 5.25%), due 1/31/28 | 4,200,000 | 3,640,001 |
| Second Lien New Term Loan B4 | |
| 10.689% (1 Month SOFR + 5.25%), due 1/20/29 | 4,500,000 | 3,836,250 |
| Broadstreet Partners, Inc. (b) | |
| 2020 Initial Term Loan | |
| 8.439% (1 Month SOFR + 3.00%), due 1/27/27 | 4,208,017 | 4,160,677 |
| Tranche Term Loan B2 | |
| 8.689% (1 Month SOFR + 3.25%), due 1/27/27 | 1,143,333 | 1,130,590 |
| Initial Term Loan B | |
| 9.324% (1 Month SOFR + 4.00%), due 1/27/29 | 498,750 | 497,018 |
| Hub International Ltd. (b) | |
| 2022 Incremental Term Loan | |
| 9.365% (3 Month SOFR + 4.00%), due 11/10/29 | 357,300 | 356,608 |
| 2023 Refinancing Term Loan | |
| 9.662% (3 Month SOFR + 4.25%), due 6/20/30 | 3,600,000 | 3,597,541 |
| NFP Corp. | |
| Closing Date Term Loan | |
| 8.689% (1 Month SOFR + 3.25%), due 2/16/27 (b) | 3,312,417 | 3,245,248 |
The notes to the financial statements are an integral part of, and should be read in conjunction with, the financial statements.
27
Portfolio of Investments October 31, 2023†^ (continued)
| | Principal
Amount | Value |
| Loan Assignments (continued) |
| Insurance (continued) |
| Ryan Specialty Group LLC | |
| Initial Term Loan | |
| 8.424% (1 Month SOFR + 3.00%), due 9/1/27 (b) | $ 3,916,835 | $ 3,907,858 |
| Sedgwick Claims Management Services, Inc. | |
| 2023 Term Loan | |
| 9.074% (1 Month SOFR + 3.75%), due 2/24/28 (b) | 6,185,326 | 6,158,618 |
| USI, Inc. | |
| 2022 Incremental Term Loan | |
| 9.14% (3 Month SOFR + 3.75%), due 11/22/29 (b) | 5,199,757 | 5,187,569 |
| | | 64,485,867 |
| Leisure, Amusement, Motion Pictures & Entertainment 1.1% |
| Bombardier Recreational Products, Inc. | |
| 2020 Replacement Term Loan | |
| 7.424% (1 Month SOFR + 2.00%), due 5/24/27 (b) | 4,176,571 | 4,134,805 |
| Creative Artists Agency LLC | |
| Term Loan B | |
| 8.824% (1 Month SOFR + 3.50%), due 11/27/28 (b) | 5,799,436 | 5,772,858 |
| Lions Gate Capital Holdings LLC | |
| Term Loan B | |
| 7.674% (1 Month SOFR + 2.25%), due 3/24/25 (b) | 1,322,424 | 1,318,646 |
| Marriott Ownership Resorts, Inc. | |
| 2019 Refinancing Term Loan | |
| 7.174% (1 Month SOFR + 1.75%), due 8/29/25 (b) | 2,910,432 | 2,900,731 |
| William Morris Endeavor Entertainment LLC | |
| First Lien Term Loan B1 | |
| 8.189% (1 Month SOFR + 2.75%), due 5/18/25 (b) | 3,644,077 | 3,635,878 |
| | | 17,762,918 |
| Machinery (Non-Agriculture, Non-Construct & Non-Electronic) 0.6% |
| Advanced Drainage Systems, Inc. | |
| Initial Term Loan | |
| 7.665% (1 Month SOFR + 2.25%), due 7/31/26 (b) | 452,143 | 455,157 |
| Columbus McKinnon Corp. | |
| Initial Term Loan | |
| 8.422% (3 Month SOFR + 2.75%), due 5/14/28 (b) | 5,567,342 | 5,560,383 |
| | Principal
Amount | Value |
| |
| Machinery (Non-Agriculture, Non-Construct & Non-Electronic) (continued) |
| Husky Injection Molding Systems Ltd. | |
| Initial Term Loan | |
| 8.731% (3 Month SOFR + 3.00%), due 3/28/25 (b) | $ 3,397,604 | $ 3,341,034 |
| | | 9,356,574 |
| Manufacturing 2.9% |
| ASP Blade Holdings, Inc. | |
| Initial Term Loan | |
| 9.652% (3 Month SOFR + 4.00%), due 10/13/28 (b) | 5,908,135 | 5,154,848 |
| Chart Industries, Inc. | |
| Amendment No. 5 Term Loan | |
| 8.665% (1 Month SOFR + 3.25%), due 3/15/30 (b) | 3,129,639 | 3,117,903 |
| Clark Equipment Co. | |
| Tranche Term Loan B | |
| 7.99% (3 Month SOFR + 2.50%), due 4/20/29 (b) | 433,676 | 433,568 |
| Coherent Corp. | |
| Initial Term Loan B | |
| 8.189% (1 Month SOFR + 2.75%), due 7/2/29 (b) | 5,790,206 | 5,766,686 |
| CP Atlas Buyer, Inc. | |
| Term Loan B | |
| 9.174% (1 Month SOFR + 3.75%), due 11/23/27 (b) | 5,345,966 | 4,931,654 |
| CPG International LLC | |
| Closing Date Term Loan | |
| 7.924% (1 Month SOFR + 2.50%), due 4/28/29 (b) | 3,712,500 | 3,702,291 |
| EMRLD Borrower LP | |
| Initial Term Loan B | |
| 8.324% (1 Month SOFR + 3.00%), due 5/31/30 (b) | 6,209,289 | 6,193,766 |
| FCG Acquisitions, Inc. | |
| First Lien Initial Term Loan | |
| 9.402% (3 Month LIBOR + 3.75%), due 3/31/28 (b) | 3,384,544 | 3,315,797 |
| LSF12 Badger Bidco LLC | |
| Initial Term Loan | |
| 11.324% (1 Month SOFR + 6.00%), due 8/30/30 (b) | 1,250,000 | 1,248,438 |
| Madison IAQ LLC | |
| Term Loan | |
| 8.703% (1 Month LIBOR + 3.25%), due 6/21/28 (b) | 2,749,585 | 2,646,967 |
The notes to the financial statements are an integral part of, and should be read in conjunction with, the financial statements.
| 28 | MainStay Floating Rate Fund |
| | Principal
Amount | Value |
| Loan Assignments (continued) |
| Manufacturing (continued) |
| Pro Mach Group, Inc. | |
| First Lien Closing Date Initial Term Loan | |
| 9.439% (1 Month SOFR + 4.00%), due 8/31/28 (b) | $ 6,295,930 | $ 6,270,746 |
| Standard Building Solutions, Inc. | |
| Initial Term Loan | |
| 7.953% (1 Month SOFR + 2.50%), due 9/22/28 (b) | 2,428,725 | 2,430,243 |
| Zurn LLC | |
| First Lien Term Loan B | |
| 7.439% (1 Month SOFR + 2.00%), due 10/4/28 (b) | 1,877,830 | 1,879,170 |
| | | 47,092,077 |
| Media 1.5% |
| Apple Bidco LLC (b) | |
| First Lien Initial Term Loan | |
| 8.189% (1 Month SOFR + 2.75%), due 9/22/28 | 5,408,352 | 5,295,961 |
| First Lien Amendment No. 1 Term Loan | |
| 9.324% (1 Month SOFR + 4.00%), due 9/22/28 | 1,736,875 | 1,731,809 |
| Cogeco Communications Finance (USA) LP | |
| Amendment No. 5 Incremental Term Loan B | |
| 7.931% (1 Month SOFR + 2.50%), due 9/1/28 (b) | 4,124,122 | 4,037,771 |
| Diamond Sports Group LLC | |
| Second Lien Term Loan | |
| TBD (1 Month SOFR + 5.25%, 3 Month SOFR + 3.25%), due 8/24/26 (b)(f)(g) | 2,898,312 | 32,606 |
| DIRECTV Financing LLC | |
| Closing Date Term Loan | |
| 10.439% (1 Month SOFR + 5.00%), due 8/2/27 (b) | 2,502,618 | 2,430,891 |
| Mission Broadcasting, Inc. | |
| Term Loan B4 | |
| 7.939% (1 Month SOFR + 2.50%), due 6/2/28 (b) | 1,368,500 | 1,368,073 |
| Radiate Holdco LLC | |
| Amendment No. 6 Term Loan B | |
| 8.689% (1 Month SOFR + 3.25%), due 9/25/26 (b) | 4,541,060 | 3,745,666 |
| Sinclair Television Group, Inc. | |
| Term Loan B4 | |
| 9.174% (1 Month SOFR + 3.75%), due 4/21/29 (b) | 2,943,863 | 1,999,987 |
| | Principal
Amount | Value |
| |
| Media (continued) |
| Virgin Media Bristol LLC | |
| Facility Term Loan Y | |
| 8.79% (6 Month SOFR + 3.25%), due 3/31/31 (b) | $ 3,666,667 | $ 3,585,083 |
| | | 24,227,847 |
| Mining, Steel, Iron & Non-Precious Metals 0.7% |
| American Rock Salt Co. LLC | |
| First Lien Initial Term Loan | |
| 9.439% (1 Month SOFR + 4.00%), due 6/9/28 (b) | 3,414,878 | 3,081,927 |
| Arsenal AIC Parent LLC | |
| Term Loan B | |
| 9.879% (3 Month SOFR + 4.50%), due 8/18/30 (b) | 2,571,429 | 2,563,928 |
| Gates Global LLC | |
| Initial Dollar Term Loan B3 | |
| 7.924% (1 Month SOFR + 2.50%), due 3/31/27 (b) | 3,796,264 | 3,786,379 |
| MRC Global U.S., Inc. | |
| 2018 Refinancing Term Loan | |
| 8.439% (1 Month LIBOR + 3.00%), due 9/20/24 (b) | 2,283,164 | 2,260,332 |
| | | 11,692,566 |
| Oil & Gas 2.2% |
| Buckeye Partners LP | |
| 2021 Tranche Term Loan B1 | |
| 7.666% (1 Month SOFR + 2.25%), due 11/1/26 (b) | 312,721 | 312,330 |
| ChampionX Corp. | |
| Term Loan B1 | |
| 8.177% (1 Month SOFR + 2.75%), due 6/7/29 (b) | 4,455,000 | 4,466,138 |
| DT Midstream, Inc. | |
| Initial Term Loan | |
| 7.439% (1 Month SOFR + 2.00%), due 6/26/28 (b) | 1,277,850 | 1,278,329 |
| Fleet Midco I Ltd. | |
| Facility Term Loan B | |
| 8.439% (1 Month LIBOR + 3.00%), due 10/7/26 (b) | 3,164,194 | 3,160,239 |
| GIP III Stetson I LP | |
| Initial Term Loan | |
| 9.574% (1 Month SOFR + 4.25%), due 7/18/25 (b)(d) | 1,775,927 | 1,772,720 |
The notes to the financial statements are an integral part of, and should be read in conjunction with, the financial statements.
29
Portfolio of Investments October 31, 2023†^ (continued)
| | Principal
Amount | Value |
| Loan Assignments (continued) |
| Oil & Gas (continued) |
| GIP Pilot Acquisition Partners LP | |
| Initial Term Loan | |
| 8.388% (3 Month SOFR + 3.00%), due 10/4/30 (b) | $ 1,363,636 | $ 1,360,227 |
| Medallion Midland Acquisition LLC | |
| Initial Term Loan | |
| 9.402% (3 Month SOFR + 3.75%), due 10/18/28 (b) | 3,751,237 | 3,748,892 |
| Murphy Oil USA, Inc. | |
| Tranche Term Loan B | |
| 7.179% (1 Month SOFR + 1.75%), due 1/31/28 (b) | 780,000 | 780,975 |
| NorthRiver Midstream Finance LP | |
| First Lien Initial Term Loan B | |
| 8.395% (3 Month SOFR + 3.00%), due 8/16/30 (b) | 1,562,402 | 1,556,760 |
| Oryx Midstream Services Permian Basin LLC | |
| 2023 Incremental Term Loan | |
| 8.692% (1 Month SOFR + 3.25%), due 10/5/28 (b) | 3,891,841 | 3,883,084 |
| PES Holdings LLC | |
| Tranche Term Loan C (zero coupon) - 13.00% | |
| (3.00% PIK) (1 Month LIBOR + 4.50%), due 12/31/23 (b)(d)(f)(g)(h) | 1,999,165 | 39,983 |
| Prairie ECI Acquiror LP | |
| Initial Term Loan | |
| 10.174% (1 Month SOFR + 4.75%), due 3/11/26 (b) | 3,250,723 | 3,238,533 |
| TransMontaigne Operating Co. LP | |
| Tranche Term Loan B 8.939% - 8.941% | |
| (1 Month SOFR + 3.50%), due 11/17/28 (b) | 4,912,500 | 4,848,790 |
| Traverse Midstream Partners LLC | |
| Advance Term Loan | |
| 9.24% (3 Month SOFR + 3.75%), due 2/16/28 (b) | 2,890,791 | 2,881,156 |
| Veritas U.S., Inc. | |
| 2021 Dollar Term Loan B | |
| 10.439% (1 Month SOFR + 5.00%), due 9/1/25 (b) | 2,736,683 | 2,302,804 |
| | | 35,630,960 |
| | Principal
Amount | Value |
| |
| Packaging 0.3% |
| LABL, Inc. | |
| Initial Dollar Term Loan | |
| 10.424% (1 Month SOFR + 5.00%), due 10/29/28 (b) | $ 2,652,750 | $ 2,491,264 |
| Plastipak Holdings, Inc. | |
| 2021 Tranche Term Loan B | |
| 7.924% (1 Month SOFR + 2.50%), due 12/1/28 (b) | 1,906,177 | 1,897,326 |
| | | 4,388,590 |
| Personal & Nondurable Consumer Products 1.6% |
| ABG Intermediate Holdings 2 LLC | |
| First Lien Tranche Term Loan B1 | |
| 8.924% (1 Month SOFR + 3.50%), due 12/21/28 (b) | 7,016,125 | 6,994,824 |
| Foundation Building Materials, Inc. | |
| First Lien Initial Term Loan 8.689% - 8.895% | |
| (1 Month SOFR + 3.25%, 3 Month SOFR + 3.25%), due 1/31/28 (b) | 5,124,288 | 5,037,462 |
| Hunter Douglas Holding BV | |
| Tranche Term Loan B1 | |
| 8.891% (3 Month SOFR + 3.50%), due 2/26/29 (b) | 3,441,288 | 3,245,565 |
| Leslie's Poolmart, Inc. | |
| Initial Term Loan | |
| 8.189% (1 Month SOFR + 2.75%), due 3/9/28 (b) | 4,332,820 | 4,220,435 |
| Michaels Cos., Inc. (The) | |
| Term Loan B | |
| 9.902% (3 Month SOFR + 4.25%), due 4/15/28 (b) | 1,712,556 | 1,426,925 |
| Perrigo Co. plc | |
| Initial Term Loan B | |
| 7.674% (1 Month SOFR + 2.25%), due 4/20/29 (b) | 4,937,500 | 4,910,754 |
| Prestige Brands, Inc. | |
| Term Loan B5 | |
| 7.439% (1 Month SOFR + 2.00%), due 7/3/28 (b) | 892,500 | 890,408 |
| | | 26,726,373 |
| Personal & Nondurable Consumer Products (Manufacturing Only) 0.7% |
| American Builders & Contractors Supply Co., Inc. | |
| Restatement Effective Date Term Loan | |
| 7.424% (1 Month SOFR + 2.00%), due 1/15/27 (b) | 2,640,000 | 2,633,674 |
The notes to the financial statements are an integral part of, and should be read in conjunction with, the financial statements.
| 30 | MainStay Floating Rate Fund |
| | Principal
Amount | Value |
| Loan Assignments (continued) |
| Personal & Nondurable Consumer Products (Manufacturing Only) (continued) |
| Hercules Achievement, Inc. | |
| First Lien Third Amendment Extended Term Loan | |
| 10.439% (1 Month SOFR + 5.00%), due 12/15/26 (b) | $ 4,243,136 | $ 4,064,572 |
| SRAM LLC | |
| Initial Term Loan | |
| 8.189% (1 Month SOFR + 2.75%), due 5/18/28 (b) | 4,645,454 | 4,617,870 |
| | | 11,316,116 |
| Personal Transportation 0.2% |
| Uber Technologies, Inc. | |
| Term Loan B | |
| TBD, due 1/1/38 | 2,500,000 | 2,497,187 |
| Personal, Food & Miscellaneous Services 1.2% |
| 1011778 B.C. Unlimited Liability Co. | |
| Term Loan B5 | |
| 7.574% (1 Month SOFR + 2.25%), due 9/23/30 (b) | 5,004,160 | 4,964,127 |
| Aramark Intermediate HoldCo Corp. | |
| U.S. Term Loan B5 | |
| 7.939% (1 Month SOFR + 2.50%), due 4/6/28 (b) | 6,051,889 | 6,036,759 |
| Hayward Industries, Inc. | |
| First Lien Refinancing Term Loan | |
| 8.189% (1 Month SOFR + 2.75%), due 5/30/28 (b) | 1,594,619 | 1,564,222 |
| Hillman Group, Inc. (The) | |
| Initial Term Loan | |
| 8.189% (1 Month SOFR + 2.75%), due 7/14/28 (b) | 1,484,630 | 1,479,858 |
| IRB Holding Corp. | |
| 2022 Replacement Term Loan B | |
| 8.424% (1 Month SOFR + 3.00%), due 12/15/27 (b) | 4,102,512 | 4,053,795 |
| KFC Holding Co. | |
| 2021 Term Loan B | |
| 7.199% (1 Month SOFR + 1.75%), due 3/15/28 (b) | 2,161,658 | 2,156,929 |
| | | 20,255,690 |
| | Principal
Amount | Value |
| |
| Pharmaceuticals 0.2% |
| Padagis LLC | |
| Term Loan B | |
| 10.434% (3 Month SOFR + 4.75%), due 7/6/28 (b) | $ 4,011,765 | $ 3,520,323 |
| Printing & Publishing 0.8% |
| Getty Images, Inc. | |
| Initial Dollar Term Loan | |
| 9.99% (3 Month SOFR + 4.50%), due 2/19/26 (b) | 2,559,611 | 2,561,211 |
| Severin Acquisition LLC | |
| First Lien Initial Term Loan | |
| 8.633% (3 Month SOFR + 3.25%), due 8/1/27 (b) | 4,318,042 | 4,308,788 |
| Springer Nature Deutschland GmbH | |
| Initial Term Loan B18 | |
| 8.652% (3 Month SOFR + 3.00%), due 8/14/26 (b) | 5,992,564 | 5,981,328 |
| | | 12,851,327 |
| Real Estate 0.2% |
| RHP Hotel Properties LP | |
| Tranche Term Loan B | |
| 8.074% (1 Month SOFR + 2.75%), due 5/18/30 (b) | 2,653,333 | 2,652,007 |
| Retail 0.4% |
| Great Outdoors Group LLC | |
| Term Loan B2 | |
| 9.402% (3 Month SOFR + 3.75%), due 3/6/28 (b) | 6,047,047 | 5,990,356 |
| Retail Store 1.2% |
| EG Group Ltd. (b) | |
| USD Facility Term Loan B | |
| 9.164% (1 Month SOFR + 4.00%), due 2/7/25 | 1,206,435 | 1,203,419 |
| USD Additional Facility Term Loan | |
| 9.414% (1 Month SOFR + 4.00%), due 2/7/25 | 1,301,546 | 1,298,292 |
| USD Additional Facility Term Loan | |
| 9.664% (1 Month LIBOR + 4.25%), due 3/31/26 | 2,720,017 | 2,709,817 |
| Harbor Freight Tools USA, Inc. | |
| 2021 Initial Term Loan | |
| 8.189% (1 Month SOFR + 2.75%), due 10/19/27 (b) | 2,870,742 | 2,831,628 |
The notes to the financial statements are an integral part of, and should be read in conjunction with, the financial statements.
31
Portfolio of Investments October 31, 2023†^ (continued)
| | Principal
Amount | Value |
| Loan Assignments (continued) |
| Retail Store (continued) |
| PetSmart LLC | |
| Initial Term Loan | |
| 9.174% (1 Month SOFR + 3.75%), due 2/11/28 (b) | $ 6,411,760 | $ 6,329,325 |
| White Cap Supply Holdings LLC | |
| Initial Closing Date Term Loan | |
| 9.074% (1 Month SOFR + 3.75%), due 10/19/27 (b) | 5,812,506 | 5,767,592 |
| | | 20,140,073 |
| Services: Business 5.4% |
| Ascensus Group Holdings, Inc. | |
| First Lien Initial Term Loan | |
| 8.939% (1 Month SOFR + 3.50%), due 8/2/28 (b) | 5,408,293 | 5,295,622 |
| Avis Budget Car Rental LLC | |
| Tranche Term Loan C | |
| 8.924% (1 Month SOFR + 3.50%), due 3/16/29 (b) | 4,925,000 | 4,920,075 |
| Brown Group Holdings LLC (b) | |
| Facility Incremental Term Loan B2 9.074% - 9.172% | |
| (1 Month SOFR + 3.75%, 3 Month SOFR + 3.75%), due 7/2/29 | 1,200,603 | 1,197,227 |
| Initial Term Loan | |
| 8.174% (1 Month SOFR + 2.75%), due 6/7/28 | 4,853,975 | 4,761,230 |
| Charlotte Buyer, Inc. | |
| First Lien Initial Term Loan B | |
| 10.591% (1 Month SOFR + 5.25%), due 2/11/28 (b) | 2,524,333 | 2,494,041 |
| ConnectWise LLC | |
| Initial Term Loan | |
| 8.939% (1 Month SOFR + 3.50%), due 9/29/28 (b) | 3,537,000 | 3,433,101 |
| Corporation Service Co. | |
| Term Loan B | |
| 8.674% (1 Month SOFR + 3.25%), due 11/2/29 (b) | 1,290,750 | 1,289,943 |
| Dun & Bradstreet Corp. (The) (b) | |
| Refinancing Term Loan | |
| 8.176% (1 Month SOFR + 2.75%), due 2/6/26 | 4,859,856 | 4,852,911 |
| 2022 Incremental Term Loan B2 | |
| 8.326% (1 Month SOFR + 3.00%), due 1/18/29 | 689,500 | 687,776 |
| | Principal
Amount | Value |
| |
| Services: Business (continued) |
| Electron Bidco, Inc. | |
| First Lien Initial Term Loan | |
| 8.439% (1 Month SOFR + 3.00%), due 11/1/28 (b) | $ 7,031,887 | $ 6,953,875 |
| Fortrea Holdings, Inc. | |
| Initial Term Loan B | |
| 9.074% (1 Month SOFR + 3.75%), due 7/1/30 (b) | 1,246,875 | 1,244,693 |
| GIP II Blue Holding LP | |
| Initial Term Loan | |
| 9.939% (1 Month SOFR + 4.50%), due 9/29/28 (b) | 4,265,427 | 4,263,427 |
| Hunter Holdco 3 Ltd. | |
| First Lien Initial Dollar Term Loan | |
| 9.74% (3 Month SOFR + 4.25%), due 8/19/28 (b) | 7,077,000 | 6,988,537 |
| Icon plc (b) | |
| Lux Term Loan | |
| 7.902% (3 Month SOFR + 2.25%), due 7/3/28 | 2,917,637 | 2,918,001 |
| U.S. Term Loan | |
| 7.902% (3 Month SOFR + 2.25%), due 7/3/28 | 726,931 | 727,022 |
| Mitchell International, Inc. (b) | |
| First Lien Initial Term Loan | |
| 9.189% (1 Month SOFR + 3.75%), due 10/15/28 | 3,283,333 | 3,199,756 |
| Second Lien Initial Term Loan | |
| 11.939% (1 Month SOFR + 6.50%), due 10/15/29 | 1,800,000 | 1,674,751 |
| MPH Acquisition Holdings LLC | |
| Initial Term Loan | |
| 9.916% (3 Month SOFR + 4.25%), due 9/1/28 (b) | 4,900,000 | 4,548,832 |
| Nielsen Consumer, Inc. | |
| 2021 Refinancing Dollar Term Loan | |
| 9.074% (1 Month SOFR + 3.75%), due 3/6/28 (b) | 4,348,453 | 4,073,957 |
| Orbit Private Holdings I Ltd. | |
| First Lien Initial Dollar Term Loan | |
| 10.087% (6 Month SOFR + 4.50%), due 12/11/28 (b) | 3,607,425 | 3,607,425 |
| Parexel International, Inc. | |
| First Lien Initial Term Loan | |
| 8.689% (1 Month SOFR + 3.25%), due 11/15/28 (b) | 5,890,138 | 5,813,567 |
The notes to the financial statements are an integral part of, and should be read in conjunction with, the financial statements.
| 32 | MainStay Floating Rate Fund |
| | Principal
Amount | Value |
| Loan Assignments (continued) |
| Services: Business (continued) |
| PECF USS Intermediate Holding III Corp. | |
| Initial Term Loan 9.689% - 9.895% | |
| (1 Month SOFR + 4.25%, 3 Month SOFR + 4.25%), due 12/15/28 (b) | $ 2,905,304 | $ 2,186,241 |
| Polaris Newco LLC | |
| First Lien Dollar Term Loan | |
| 9.439% (1 Month SOFR + 4.00%), due 6/2/28 (b) | 4,407,432 | 4,155,657 |
| Project Boost Purchaser LLC | |
| 2021 Tranche Term Loan 2 | |
| 8.939% (1 Month SOFR + 3.50%), due 5/30/26 (b) | 4,250,490 | 4,220,384 |
| Prometric Holdings, Inc. | |
| First Lien Initial Term Loan | |
| 10.695% (3 Month SOFR + 3.00%), due 1/31/28 (b) | 1,617,647 | 1,586,305 |
| Vizient, Inc. | |
| Term Loan B7 | |
| 7.677% (1 Month SOFR + 2.25%), due 5/16/29 (b) | 2,221,875 | 2,222,493 |
| | | 89,316,849 |
| Services: Consumer 0.0% ‡ |
| West Technology Group LLC | |
| Term Loan B3 | |
| 9.633% (3 Month SOFR + 4.00%), due 4/10/27 (b) | 915,385 | 850,799 |
| Software 3.0% |
| AppLovin Corp. | |
| Amendment No. 6 New Term Loan | |
| 8.424% (1 Month SOFR + 3.10%), due 10/25/28 (b) | 4,732,937 | 4,715,189 |
| Cloud Software Group, Inc. | |
| First Lien Dollar Term Loan B | |
| 9.99% (3 Month SOFR + 4.50%), due 3/30/29 (b) | 3,888,000 | 3,688,254 |
| Cornerstone OnDemand, Inc. | |
| First Lien Initial Term Loan | |
| 9.189% (1 Month SOFR + 3.75%), due 10/16/28 (b) | 2,578,182 | 2,431,548 |
| Gen Digital, Inc. | |
| Tranche Initial Term Loan B | |
| 7.424% (1 Month SOFR + 2.00%), due 9/12/29 (b) | 4,222,327 | 4,180,762 |
| | Principal
Amount | Value |
| |
| Software (continued) |
| Informatica LLC | |
| Initial Term Loan | |
| 8.189% (1 Month SOFR + 2.75%), due 10/27/28 (b) | $ 3,727,828 | $ 3,712,685 |
| ISolved, Inc. | |
| Closing Date Term Loan | |
| 9.484% (6 Month SOFR + 4.00%), due 10/14/30 (b) | 588,235 | 587,868 |
| Magenta Buyer LLC | |
| First Lien Initial Term Loan | |
| 10.645% (3 Month SOFR + 5.00%), due 7/27/28 (b) | 3,199,278 | 2,199,504 |
| McAfee Corp. | |
| Tranche Term Loan B1 | |
| 9.165% (1 Month SOFR + 3.75%), due 3/1/29 (b) | 2,930,226 | 2,788,599 |
| Mitnick Corp. Purchaser, Inc. | |
| Initial Term Loan | |
| 9.983% (3 Month SOFR + 4.50%), due 5/2/29 (b) | 3,465,000 | 3,231,979 |
| Precisely Software, Inc. | |
| First Lien Third Incremental Term Loan | |
| 9.64% (3 Month SOFR + 4.00%), due 4/24/28 (b) | 2,745,692 | 2,609,552 |
| Quartz AcquireCo LLC | |
| Term Loan | |
| 8.827% (1 Month SOFR + 3.50%), due 6/28/30 (b) | 1,250,000 | 1,246,875 |
| Quest Software U.S. Holdings, Inc. | |
| First Lien Initial Term Loan | |
| 9.783% (3 Month SOFR + 4.25%), due 2/1/29 (b) | 4,495,544 | 3,548,270 |
| Sophia LP | |
| First Lien Term Loan B | |
| 8.924% (1 Month SOFR + 3.50%), due 10/7/27 (b) | 2,823,514 | 2,782,572 |
| Sovos Compliance LLC | |
| First Lien Initial Term Loan | |
| 9.939% (1 Month SOFR + 4.50%), due 8/11/28 (b) | 2,932,153 | 2,866,587 |
| UKG, Inc. (b) | |
| First Lien 2021-2 Incremental Term Loan | |
| 8.764% (3 Month SOFR + 3.25%), due 5/4/26 | 2,100,314 | 2,087,975 |
| First Lien Initial Term Loan | |
| 9.233% (3 Month SOFR + 3.75%), due 5/4/26 | 4,873,846 | 4,859,376 |
The notes to the financial statements are an integral part of, and should be read in conjunction with, the financial statements.
33
Portfolio of Investments October 31, 2023†^ (continued)
| | Principal
Amount | Value |
| Loan Assignments (continued) |
| Software (continued) |
| UKG, Inc. (b) (continued) | |
| Second Lien 2021 Incremental Term Loan | |
| 10.764% (3 Month SOFR + 5.25%), due 5/3/27 | $ 1,300,000 | $ 1,294,583 |
| | | 48,832,178 |
| Telecommunications 3.4% |
| Avaya, Inc. | |
| Initial Term Loan | |
| 13.824% (7.00% PIK) (1 Month SOFR + 8.50%), due 8/1/28 (b)(h) | 408,225 | 353,625 |
| Azalea TopCo, Inc. (b) | |
| First Lien Initial Term Loan | |
| 9.184% (3 Month SOFR + 3.50%), due 7/24/26 | 907,772 | 860,114 |
| First Lien 2022 Incremental Term Loan | |
| 9.322% (3 Month SOFR + 3.75%), due 7/24/26 | 2,955,000 | 2,802,324 |
| First Lien 2021 Term Loan | |
| 9.434% (3 Month SOFR + 3.75%), due 7/24/26 | 1,955,000 | 1,857,250 |
| Cablevision Lightpath LLC | |
| Initial Term Loan | |
| 8.699% (1 Month SOFR + 3.25%), due 11/30/27 (b) | 4,011,881 | 3,962,567 |
| Ciena Corp. | |
| 2020 Refinancing Term Loan 7.089% - 9.25% | |
| (1 Month SOFR + 0.75%, 1 Month SOFR + 1.75%), due 10/24/30 (b) | 995,000 | 993,963 |
| Connect Finco SARL | |
| Amendement No.1 Refinancing Term Loan | |
| 8.824% (1 Month SOFR + 3.50%), due 12/11/26 (b) | 7,522,246 | 7,324,787 |
| CSC Holdings LLC | |
| September 2019 Initial Term Loan | |
| 7.949% (1 Month LIBOR + 2.50%), due 4/15/27 (b) | 6,428,618 | 5,784,753 |
| Cyxtera DC Holdings, Inc. (b) | |
| First Lien Initial Term Loan | |
| 10.50% (3 Month SOFR + 2.00%), due 5/1/24 (d)(f) | 1,413,750 | 804,070 |
| Initial Term Loan | |
| 13.95% (1 Month SOFR + 8.50%), due 12/7/23 | 2,000,000 | 2,000,624 |
| | Principal
Amount | Value |
| |
| Telecommunications (continued) |
| Frontier Communications Holdings LLC | |
| Term Loan B | |
| 9.189% (1 Month SOFR + 3.75%), due 10/8/27 (b) | $ 5,713,549 | $ 5,495,720 |
| Gogo Intermediate Holdings LLC | |
| Initial Term Loan | |
| 9.189% (1 Month SOFR + 3.75%), due 4/30/28 (b) | 5,433,646 | 5,423,458 |
| Iridium Satellite LLC | |
| Term Loan B3 | |
| 7.824% (1 Month SOFR + 2.50%), due 9/20/30 (b) | 500,000 | 499,107 |
| Level 3 Financing, Inc. | |
| Tranche 2027 Term Loan B | |
| 7.189% (1 Month SOFR + 1.75%), due 3/1/27 (b) | 1,937,389 | 1,812,999 |
| Lumen Technologies, Inc. | |
| Term Loan B | |
| 7.689% (1 Month SOFR + 2.25%), due 3/15/27 (b) | 3,479,518 | 2,595,505 |
| Redstone HoldCo 2 LP | |
| First Lien Initial Term Loan | |
| 10.189% (1 Month SOFR + 4.75%), due 4/27/28 (b) | 1,525,765 | 1,212,984 |
| SBA Senior Finance II LLC | |
| Initial Term Loan | |
| 7.18% (1 Month LIBOR + 1.75%), due 4/11/25 (b) | 6,184,789 | 6,180,064 |
| Telesat Canada | |
| Term Loan B5 | |
| 8.434% (3 Month SOFR + 2.75%), due 12/7/26 (b) | 2,034,078 | 1,390,166 |
| Zayo Group Holdings, Inc. | |
| Initial Dollar Term Loan | |
| 8.439% (1 Month SOFR + 3.00%), due 3/9/27 (b) | 5,075,110 | 4,266,264 |
| | | 55,620,344 |
| Utilities 1.8% |
| Astoria Energy LLC | |
| 2020 Advance Term Loan B | |
| 8.939% (1 Month SOFR + 3.50%), due 12/10/27 (b) | 868,982 | 867,352 |
| Brookfield WEC Holdings, Inc. (b) | |
| First Lien 2021 Initial Term Loan | |
| 8.189% (1 Month SOFR + 2.75%), due 8/1/25 | 2,241,461 | 2,237,188 |
The notes to the financial statements are an integral part of, and should be read in conjunction with, the financial statements.
| 34 | MainStay Floating Rate Fund |
| | Principal
Amount | Value |
| Loan Assignments (continued) |
| Utilities (continued) |
| Brookfield WEC Holdings, Inc. (b) (continued) | |
| Initial Term Loan | |
| 9.074% (1 Month SOFR + 3.75%), due 8/1/25 | $ 1,732,500 | $ 1,732,717 |
| Calpine Corp. | |
| 2019 Term Loan | |
| 7.439% (1 Month LIBOR + 2.00%), due 4/5/26 (b) | 2,010,750 | 2,008,236 |
| Compass Power Generation LLC | |
| Tranche Term Loan B2 | |
| 9.688% (1 Month SOFR + 4.25%), due 4/14/29 (b) | 1,742,559 | 1,730,941 |
| Constellation Renewables LLC | |
| Term Loan | |
| 8.184% (3 Month SOFR + 2.50%), due 12/15/27 (b) | 2,348,856 | 2,336,132 |
| Edgewater Generation LLC | |
| Term Loan | |
| 9.189% (1 Month SOFR + 3.75%), due 12/13/25 (b) | 4,591,135 | 4,498,491 |
| Granite Generation LLC | |
| Term Loan | |
| 9.189% (1 Month SOFR + 3.75%), due 11/9/26 (b) | 5,923,979 | 5,802,538 |
| Hamilton Projects Acquiror LLC | |
| Term Loan | |
| 9.939% (1 Month SOFR + 4.50%), due 6/17/27 (b) | 2,005,714 | 1,997,357 |
| PG&E Corp. | |
| Term Loan | |
| 8.439% (1 Month SOFR + 3.00%), due 6/23/25 (b) | 3,144,375 | 3,136,514 |
| Vistra Operations Co. LLC | |
| 2018 Incremental Term Loan | |
| 7.189% (1 Month SOFR + 1.75%), due 12/31/25 (b) | 2,857,329 | 2,855,543 |
| | | 29,203,009 |
| | Principal
Amount | Value |
| |
| Water 0.2% |
| Osmosis Buyer Ltd. | |
| 2022 Refinanciang Term Loan B | |
| 9.082% (1 Month SOFR + 3.75%), due 7/31/28 (b) | $ 4,005,976 | $ 3,922,519 |
Total Loan Assignments
(Cost $1,468,118,483) | | 1,420,342,090 |
Total Long-Term Bonds
(Cost $1,612,941,978) | | 1,558,480,471 |
| |
| | Shares | |
| |
| Affiliated Investment Company 0.4% |
| Fixed Income Fund 0.4% | | |
| MainStay MacKay High Yield Corporate Bond Fund Class I | 1,299,065 | 6,376,981 |
Total Affiliated Investment Company
(Cost $7,308,299) | | 6,376,981 |
| Common Stocks 0.0% ‡ |
| Automobile Components 0.0% ‡ |
| Millennium Corporate Trust (d)(e)(i) | 4,973 | — |
| Millennium Lender Trust (d)(e)(i) | 5,298 | — |
| | | — |
| Commercial Services & Supplies 0.0% ‡ |
| New Topco Shares, Class A (d)(e)(i) | 482,014 | — |
| Communications Equipment 0.0% ‡ |
| Avaya, Inc. (d)(e)(i) | 40,688 | 294,988 |
| Health Care Equipment & Supplies 0.0% ‡ |
| Carestream Equity (d)(e)(i) | 5,387 | 28,874 |
| Household Durables 0.0% ‡ |
| SSB Equipment Co., Inc. (d)(e)(i) | 1,277 | — |
| Independent Power and Renewable Electricity Producers 0.0% ‡ |
| Sempra Texas Holdings Corp. (d)(e)(i) | 175,418 | — |
| Machinery 0.0% ‡ |
| Ameriforge Group, Inc. (d)(e)(i) | 60,753 | 59,538 |
| Specialty Retail 0.0% ‡ |
| Serta Simmons Bedding, Inc. (d)(e)(i) | 1,277 | 17,878 |
The notes to the financial statements are an integral part of, and should be read in conjunction with, the financial statements.
35
Portfolio of Investments October 31, 2023†^ (continued)
| | Shares | | Value |
| Common Stocks (continued) ‡ |
| Technology Hardware, Storage & Peripherals 0.0% ‡ |
| Diebold Nixdorf, Inc. (i) | 11,878 | | $ 225,445 |
Total Common Stocks
(Cost $3,119,934) | | | 626,723 |
| |
| | Number of
Rights | | |
| |
| Rights 0.0% ‡ |
| Independent Power and Renewable Electricity Producers 0.0% ‡ |
| Vistra Corp. Expires 12/31/46 (d)(e)(i) | 107,130 | | 147,839 |
Total Rights
(Cost $87,846) | | | 147,839 |
| |
| | Number of
Warrants | | |
| |
| Warrants 0.0% ‡ |
| Capital Markets 0.0% ‡ |
| THAIHOT Investment Co. Ltd. | | | |
| Expires 10/13/27 (d)(e)(i)(j) | 26 | | 0 |
Total Warrants
(Cost $0) | | | 0 |
| |
| | Principal
Amount | | |
| |
| Short-Term Investments 5.3% |
| U.S. Treasury Debt 5.3% |
| U.S. Treasury Bills (k) | | | |
| 5.306%, due 11/28/23 | $ 17,047,000 | | 16,979,366 |
| 5.311%, due 11/21/23 | 26,784,000 | | 26,705,229 |
| 5.32%, due 11/7/23 | 44,079,000 | | 44,040,211 |
Total Short-Term Investments
(Cost $87,724,781) | | | 87,724,806 |
Total Investments
(Cost $1,711,182,838) | 100.8% | | 1,653,356,820 |
| Other Assets, Less Liabilities | (0.8) | | (13,795,720) |
| Net Assets | 100.0% | | $ 1,639,561,100 |
| † | Percentages indicated are based on Fund net assets. |
| ^ | Industry classifications may be different than those used for compliance monitoring purposes. |
| ‡ | Less than one-tenth of a percent. |
| (a) | May be sold to institutional investors only under Rule 144A or securities offered pursuant to Section 4(a)(2) of the Securities Act of 1933, as amended. |
| (b) | Floating rate—Rate shown was the rate in effect as of October 31, 2023. |
| (c) | Delayed delivery security. |
| (d) | Illiquid security—As of October 31, 2023, the total market value deemed illiquid under procedures approved by the Board of Trustees was $11,467,695, which represented 0.7% of the Fund’s net assets. (Unaudited) |
| (e) | Security in which significant unobservable inputs (Level 3) were used in determining fair value. |
| (f) | Issue in default. |
| (g) | Issue in non-accrual status. |
| (h) | PIK ("Payment-in-Kind")—issuer may pay interest or dividends with additional securities and/or in cash. |
| (i) | Non-income producing security. |
| (j) | Less than $1. |
| (k) | Interest rate shown represents yield to maturity. |
The notes to the financial statements are an integral part of, and should be read in conjunction with, the financial statements.
| 36 | MainStay Floating Rate Fund |
Investments in Affiliates (in 000's)
Investments in issuers considered to be affiliate(s) of the Fund during the year ended October 31, 2023 for purposes of Section 2(a)(3) of the Investment Company Act of 1940, as amended, were as follows:
| Affiliated Investment Companies | Value,
Beginning
of Year | Purchases
at Cost | Proceeds
from
Sales | Net
Realized
Gain/(Loss)
on Sales | Change in
Unrealized
Appreciation/
(Depreciation) | Value,
End of
Year | Dividend
Income | Other
Distributions | Shares
End of
Year |
| MainStay MacKay High Yield Corporate Bond Fund Class I | $ 6,342 | $ — | $ — | $ 19 | $ 16 | $ 6,377 | $ 331 | $ — | 1,299 |
| Abbreviation(s): |
| CLO—Collateralized Loan Obligation |
| LIBOR—London Interbank Offered Rate |
| SOFR—Secured Overnight Financing Rate |
| TBD—To Be Determined |
| USD—United States Dollar |
The following is a summary of the fair valuations according to the inputs used as of October 31, 2023, for valuing the Fund’s assets:
| Description | Quoted
Prices in
Active
Markets for
Identical
Assets
(Level 1) | | Significant
Other
Observable
Inputs
(Level 2) | | Significant
Unobservable
Inputs
(Level 3) | | Total |
| Asset Valuation Inputs | | | | | | | |
| Investments in Securities (a) | | | | | | | |
| Long-Term Bonds | | | | | | | |
| Asset-Backed Securities | $ — | | $ 79,926,652 | | $ — | | $ 79,926,652 |
| Corporate Bonds | — | | 58,211,729 | | — | | 58,211,729 |
| Loan Assignments | — | | 1,418,421,640 | | 1,920,450 | | 1,420,342,090 |
| Total Long-Term Bonds | — | | 1,556,560,021 | | 1,920,450 | | 1,558,480,471 |
| Affiliated Investment Company | | | | | | | |
| Fixed Income Fund | 6,376,981 | | — | | — | | 6,376,981 |
| Common Stocks | 225,445 | | — | | 401,278 | | 626,723 |
| Rights | — | | — | | 147,839 | | 147,839 |
| Warrants (b) | — | | — | | 0 | | 0 |
| Short-Term Investments | | | | | | | |
| U.S. Treasury Debt | — | | 87,724,806 | | — | | 87,724,806 |
| Total Investments in Securities | $ 6,602,426 | | $ 1,644,284,827 | | $ 2,469,567 | | $ 1,653,356,820 |
| (a) | For a complete listing of investments and their industries, see the Portfolio of Investments. |
| (b) | Less than $1. |
The notes to the financial statements are an integral part of, and should be read in conjunction with, the financial statements.
37
Statement of Assets and Liabilities as of October 31, 2023
| Assets |
Investment in unaffiliated securities, at value
(identified cost $1,703,874,539) | $1,646,979,839 |
Investment in affiliated investment companies, at value
(identified cost $7,308,299) | 6,376,981 |
| Cash | 8,463,930 |
| Receivables: | |
| Investment securities sold | 13,911,568 |
| Interest | 6,154,723 |
| Fund shares sold | 1,975,762 |
| Other assets | 113,688 |
| Total assets | 1,683,976,491 |
| Liabilities |
| Payables: | |
| Investment securities purchased | 37,224,536 |
| Fund shares redeemed | 4,049,797 |
| Manager (See Note 3) | 825,048 |
| Transfer agent (See Note 3) | 260,566 |
| NYLIFE Distributors (See Note 3) | 174,475 |
| Professional fees | 46,357 |
| Custodian | 24,027 |
| Shareholder communication | 5,185 |
| Accrued expenses | 619 |
| Distributions payable | 1,804,781 |
| Total liabilities | 44,415,391 |
| Net assets | $1,639,561,100 |
| Composition of Net Assets |
| Shares of beneficial interest outstanding (par value of $.001 per share) unlimited number of shares authorized | $ 187,313 |
| Additional paid-in-capital | 1,864,045,369 |
| | 1,864,232,682 |
| Total distributable earnings (loss) | (224,671,582) |
| Net assets | $1,639,561,100 |
| Class A | |
| Net assets applicable to outstanding shares | $617,219,939 |
| Shares of beneficial interest outstanding | 70,524,565 |
| Net asset value per share outstanding | $ 8.75 |
| Maximum sales charge (3.00% of offering price) | 0.27 |
| Maximum offering price per share outstanding | $ 9.02 |
| Investor Class | |
| Net assets applicable to outstanding shares | $ 18,015,674 |
| Shares of beneficial interest outstanding | 2,058,356 |
| Net asset value per share outstanding | $ 8.75 |
| Maximum sales charge (2.50% of offering price) | 0.22 |
| Maximum offering price per share outstanding | $ 8.97 |
| Class B | |
| Net assets applicable to outstanding shares | $ 414,979 |
| Shares of beneficial interest outstanding | 47,379 |
| Net asset value and offering price per share outstanding | $ 8.76 |
| Class C | |
| Net assets applicable to outstanding shares | $ 46,481,745 |
| Shares of beneficial interest outstanding | 5,309,272 |
| Net asset value and offering price per share outstanding | $ 8.75 |
| Class I | |
| Net assets applicable to outstanding shares | $743,846,254 |
| Shares of beneficial interest outstanding | 84,979,153 |
| Net asset value and offering price per share outstanding | $ 8.75 |
| Class R3 | |
| Net assets applicable to outstanding shares | $ 1,083,082 |
| Shares of beneficial interest outstanding | 123,718 |
| Net asset value and offering price per share outstanding | $ 8.75 |
| Class R6 | |
| Net assets applicable to outstanding shares | $212,357,102 |
| Shares of beneficial interest outstanding | 24,254,098 |
| Net asset value and offering price per share outstanding | $ 8.76 |
| SIMPLE Class | |
| Net assets applicable to outstanding shares | $ 142,325 |
| Shares of beneficial interest outstanding | 16,261 |
| Net asset value and offering price per share outstanding | $ 8.75 |
The notes to the financial statements are an integral part of, and should be read in conjunction with, the financial statements.
| 38 | MainStay Floating Rate Fund |
Statement of Operations for the year ended October 31, 2023
| Investment Income (Loss) |
| Income | |
| Interest | $160,426,066 |
| Dividends-affiliated | 331,297 |
| Total income | 160,757,363 |
| Expenses | |
| Manager (See Note 3) | 10,793,440 |
| Distribution/Service—Class A (See Note 3) | 1,373,368 |
| Distribution/Service—Investor Class (See Note 3) | 46,129 |
| Distribution/Service—Class B (See Note 3) | 4,932 |
| Distribution/Service—Class C (See Note 3) | 506,657 |
| Distribution/Service—Class R3 (See Note 3) | 4,497 |
| Distribution/Service—SIMPLE Class (See Note 3) | 417 |
| Transfer agent (See Note 3) | 1,586,690 |
| Professional fees | 249,251 |
| Registration | 191,974 |
| Shareholder communication | 113,604 |
| Custodian | 75,562 |
| Trustees | 45,503 |
| Shareholder service (See Note 3) | 899 |
| Miscellaneous | 96,505 |
| Total expenses before waiver/reimbursement | 15,089,428 |
| Reimbursement from prior custodian(a) | (3,871) |
| Net expenses | 15,085,557 |
| Net investment income (loss) | 145,671,806 |
| Realized and Unrealized Gain (Loss) |
| Net realized gain (loss) on: | |
| Unaffiliated investment transactions | (49,009,262) |
| Affiliated investment company transactions | 19,459 |
| Net realized gain (loss) | (48,989,803) |
| Net change in unrealized appreciation (depreciation) on: | |
| Unaffiliated investments | 94,823,156 |
| Affiliated investments | 58,319 |
| Unfunded commitments | 221,518 |
| Net change in unrealized appreciation (depreciation) | 95,102,993 |
| Net realized and unrealized gain (loss) | 46,113,190 |
| Net increase (decrease) in net assets resulting from operations | $191,784,996 |
| (a) | Represents a refund for overbilling of custody fees. |
The notes to the financial statements are an integral part of, and should be read in conjunction with, the financial statements.
39
Statements of Changes in Net Assets
for the years ended October 31, 2023 and October 31, 2022
| | 2023 | 2022 |
| Increase (Decrease) in Net Assets |
| Operations: | | |
| Net investment income (loss) | $ 145,671,806 | $ 93,556,460 |
| Net realized gain (loss) | (48,989,803) | (28,663,269) |
| Net change in unrealized appreciation (depreciation) | 95,102,993 | (142,915,138) |
| Net increase (decrease) in net assets resulting from operations | 191,784,996 | (78,021,947) |
| Distributions to shareholders: | | |
| Class A | (42,905,590) | (18,650,038) |
| Investor Class | (1,416,352) | (674,941) |
| Class B | (34,075) | (19,904) |
| Class C | (3,493,618) | (1,701,117) |
| Class I | (75,206,717) | (56,965,680) |
| Class R3 | (67,129) | (24,753) |
| Class R6 | (21,775,159) | (15,202,101) |
| SIMPLE Class | (6,483) | (887) |
| Total distributions to shareholders | (144,905,123) | (93,239,421) |
| Capital share transactions: | | |
| Net proceeds from sales of shares | 722,369,202 | 1,632,823,205 |
| Net asset value of shares issued to shareholders in reinvestment of distributions | 122,065,730 | 78,654,636 |
| Cost of shares redeemed | (1,460,955,196) | (1,354,635,928) |
| Increase (decrease) in net assets derived from capital share transactions | (616,520,264) | 356,841,913 |
| Net increase (decrease) in net assets | (569,640,391) | 185,580,545 |
| Net Assets |
| Beginning of year | 2,209,201,491 | 2,023,620,946 |
| End of year | $ 1,639,561,100 | $ 2,209,201,491 |
The notes to the financial statements are an integral part of, and should be read in conjunction with, the financial statements.
| 40 | MainStay Floating Rate Fund |
Financial Highlights selected per share data and ratios
| | Year Ended October 31, |
| Class A | 2023 | | 2022 | | 2021 | | 2020 | | 2019 |
| Net asset value at beginning of year | $ 8.55 | | $ 9.13 | | $ 8.84 | | $ 9.02 | | $ 9.28 |
| Net investment income (loss) (a) | 0.69 | | 0.34 | | 0.25 | | 0.31 | | 0.43 |
| Net realized and unrealized gain (loss) | 0.19 | | (0.59) | | 0.28 | | (0.18) | | (0.26) |
| Total from investment operations | 0.88 | | (0.25) | | 0.53 | | 0.13 | | 0.17 |
| Less distributions: | | | | | | | | | |
| From net investment income | (0.68) | | (0.33) | | (0.24) | | (0.31) | | (0.43) |
| Net asset value at end of year | $ 8.75 | | $ 8.55 | | $ 9.13 | | $ 8.84 | | $ 9.02 |
| Total investment return (b) | 10.61% | | (2.77)% | | 6.05% | | 1.55% | | 1.94% |
| Ratios (to average net assets)/Supplemental Data: | | | | | | | | | |
| Net investment income (loss) | 7.85% | | 3.82% | | 2.78% | | 3.56% | | 4.76% |
| Net expenses (c) | 0.97% | | 0.99% | | 1.02% | | 1.14% | | 1.09% |
| Portfolio turnover rate | 11% | | 27% | | 22% | | 22% | | 19% |
| Net assets at end of year (in 000’s) | $ 617,220 | | $ 513,558 | | $ 397,101 | | $ 279,188 | | $ 338,392 |
| (a) | Per share data based on average shares outstanding during the year. |
| (b) | Total investment return is calculated exclusive of sales charges and assumes the reinvestment of dividends and distributions. For periods of less than one year, total return is not annualized. |
| (c) | In addition to the fees and expenses which the Fund bears directly, it also indirectly bears a pro-rata share of the fees and expenses of the underlying funds in which it invests. Such indirect expenses are not included in the above expense ratios. |
| | Year Ended October 31, |
| Investor Class | 2023 | | 2022 | | 2021 | | 2020 | | 2019 |
| Net asset value at beginning of year | $ 8.55 | | $ 9.13 | | $ 8.84 | | $ 9.02 | | $ 9.28 |
| Net investment income (loss) (a) | 0.67 | | 0.32 | | 0.24 | | 0.31 | | 0.43 |
| Net realized and unrealized gain (loss) | 0.20 | | (0.58) | | 0.28 | | (0.18) | | (0.26) |
| Total from investment operations | 0.87 | | (0.26) | | 0.52 | | 0.13 | | 0.17 |
| Less distributions: | | | | | | | | | |
| From net investment income | (0.67) | | (0.32) | | (0.23) | | (0.31) | | (0.43) |
| Net asset value at end of year | $ 8.75 | | $ 8.55 | | $ 9.13 | | $ 8.84 | | $ 9.02 |
| Total investment return (b) | 10.47% | | (2.85)% | | 5.96% | | 1.55% | | 1.95% |
| Ratios (to average net assets)/Supplemental Data: | | | | | | | | | |
| Net investment income (loss) | 7.72% | | 3.64% | | 2.67% | | 3.55% | | 4.77% |
| Net expenses (c) | 1.10% | | 1.07% | | 1.12% | | 1.13% | | 1.08% |
| Portfolio turnover rate | 11% | | 27% | | 22% | | 22% | | 19% |
| Net assets at end of year (in 000's) | $ 18,016 | | $ 17,820 | | $ 19,314 | | $ 20,569 | | $ 23,496 |
| (a) | Per share data based on average shares outstanding during the year. |
| (b) | Total investment return is calculated exclusive of sales charges and assumes the reinvestment of dividends and distributions. For periods of less than one year, total return is not annualized. |
| (c) | In addition to the fees and expenses which the Fund bears directly, it also indirectly bears a pro-rata share of the fees and expenses of the underlying funds in which it invests. Such indirect expenses are not included in the above expense ratios. |
The notes to the financial statements are an integral part of, and should be read in conjunction with, the financial statements.
41
Financial Highlights selected per share data and ratios
| | Year Ended October 31, |
| Class B | 2023 | | 2022 | | 2021 | | 2020 | | 2019 |
| Net asset value at beginning of year | $ 8.55 | | $ 9.14 | | $ 8.85 | | $ 9.03 | | $ 9.28 |
| Net investment income (loss) (a) | 0.61 | | 0.25 | | 0.17 | | 0.25 | | 0.37 |
| Net realized and unrealized gain (loss) | 0.20 | | (0.58) | | 0.28 | | (0.18) | | (0.25) |
| Total from investment operations | 0.81 | | (0.33) | | 0.45 | | 0.07 | | 0.12 |
| Less distributions: | | | | | | | | | |
| From net investment income | (0.60) | | (0.26) | | (0.16) | | (0.25) | | (0.37) |
| Net asset value at end of year | $ 8.76 | | $ 8.55 | | $ 9.14 | | $ 8.85 | | $ 9.03 |
| Total investment return (b) | 9.77% | | (3.69)% | | 5.16% | | 0.79% | | 1.19% |
| Ratios (to average net assets)/Supplemental Data: | | | | | | | | | |
| Net investment income (loss) | 6.95% | | 2.77% | | 1.90% | | 2.87% | | 4.04% |
| Net expenses (c) | 1.85% | | 1.82% | | 1.88% | | 1.88% | | 1.83% |
| Portfolio turnover rate | 11% | | 27% | | 22% | | 22% | | 19% |
| Net assets at end of year (in 000’s) | $ 415 | | $ 549 | | $ 897 | | $ 1,584 | | $ 3,119 |
| (a) | Per share data based on average shares outstanding during the year. |
| (b) | Total investment return is calculated exclusive of sales charges and assumes the reinvestment of dividends and distributions. For periods of less than one year, total return is not annualized. |
| (c) | In addition to the fees and expenses which the Fund bears directly, it also indirectly bears a pro-rata share of the fees and expenses of the underlying funds in which it invests. Such indirect expenses are not included in the above expense ratios. |
| | Year Ended October 31, |
| Class C | 2023 | | 2022 | | 2021 | | 2020 | | 2019 |
| Net asset value at beginning of year | $ 8.55 | | $ 9.13 | | $ 8.84 | | $ 9.03 | | $ 9.28 |
| Net investment income (loss) (a) | 0.61 | | 0.26 | | 0.17 | | 0.25 | | 0.37 |
| Net realized and unrealized gain (loss) | 0.19 | | (0.58) | | 0.28 | | (0.19) | | (0.25) |
| Total from investment operations | 0.80 | | (0.32) | | 0.45 | | 0.06 | | 0.12 |
| Less distributions: | | | | | | | | | |
| From net investment income | (0.60) | | (0.26) | | (0.16) | | (0.25) | | (0.37) |
| Net asset value at end of year | $ 8.75 | | $ 8.55 | | $ 9.13 | | $ 8.84 | | $ 9.03 |
| Total investment return (b) | 9.65% | | (3.58)% | | 5.17% | | 0.68% | | 1.30% |
| Ratios (to average net assets)/Supplemental Data: | | | | | | | | | |
| Net investment income (loss) | 6.94% | | 2.92% | | 1.91% | | 2.85% | | 4.03% |
| Net expenses (c) | 1.85% | | 1.82% | | 1.88% | | 1.88% | | 1.83% |
| Portfolio turnover rate | 11% | | 27% | | 22% | | 22% | | 19% |
| Net assets at end of year (in 000’s) | $ 46,482 | | $ 56,706 | | $ 52,522 | | $ 55,153 | | $ 86,012 |
| (a) | Per share data based on average shares outstanding during the year. |
| (b) | Total investment return is calculated exclusive of sales charges and assumes the reinvestment of dividends and distributions. For periods of less than one year, total return is not annualized. |
| (c) | In addition to the fees and expenses which the Fund bears directly, it also indirectly bears a pro-rata share of the fees and expenses of the underlying funds in which it invests. Such indirect expenses are not included in the above expense ratios. |
The notes to the financial statements are an integral part of, and should be read in conjunction with, the financial statements.
| 42 | MainStay Floating Rate Fund |
Financial Highlights selected per share data and ratios
| | Year Ended October 31, |
| Class I | 2023 | | 2022 | | 2021 | | 2020 | | 2019 |
| Net asset value at beginning of year | $ 8.55 | | $ 9.13 | | $ 8.84 | | $ 9.03 | | $ 9.28 |
| Net investment income (loss) (a) | 0.70 | | 0.35 | | 0.28 | | 0.33 | | 0.46 |
| Net realized and unrealized gain (loss) | 0.20 | | (0.58) | | 0.27 | | (0.19) | | (0.25) |
| Total from investment operations | 0.90 | | (0.23) | | 0.55 | | 0.14 | | 0.21 |
| Less distributions: | | | | | | | | | |
| From net investment income | (0.70) | | (0.35) | | (0.26) | | (0.33) | | (0.46) |
| Net asset value at end of year | $ 8.75 | | $ 8.55 | | $ 9.13 | | $ 8.84 | | $ 9.03 |
| Total investment return (b) | 10.89% | | (2.53)% | | 6.31% | | 1.69% | | 2.31% |
| Ratios (to average net assets)/Supplemental Data: | | | | | | | | | |
| Net investment income (loss) | 8.01% | | 3.98% | | 3.04% | | 3.85% | | 5.02% |
| Net expenses (c) | 0.73% | | 0.74% | | 0.77% | | 0.89% | | 0.84% |
| Portfolio turnover rate | 11% | | 27% | | 22% | | 22% | | 19% |
| Net assets at end of year (in 000’s) | $ 743,846 | | $ 1,287,716 | | $ 1,186,421 | | $ 445,468 | | $ 716,692 |
| (a) | Per share data based on average shares outstanding during the year. |
| (b) | Total investment return is calculated exclusive of sales charges and assumes the reinvestment of dividends and distributions. Class I shares are not subject to sales charges. For periods of less than one year, total return is not annualized. |
| (c) | In addition to the fees and expenses which the Fund bears directly, it also indirectly bears a pro-rata share of the fees and expenses of the underlying funds in which it invests. Such indirect expenses are not included in the above expense ratios. |
| | Year Ended October 31, |
| Class R3 | 2023 | | 2022 | | 2021 | | 2020 | | 2019 |
| Net asset value at beginning of year | $ 8.55 | | $ 9.13 | | $ 8.84 | | $ 9.03 | | $ 9.28 |
| Net investment income (loss) (a) | 0.66 | | 0.30 | | 0.22 | | 0.28 | | 0.40 |
| Net realized and unrealized gain (loss) | 0.19 | | (0.58) | | 0.28 | | (0.19) | | (0.25) |
| Total from investment operations | 0.85 | | (0.28) | | 0.50 | | 0.09 | | 0.15 |
| Less distributions: | | | | | | | | | |
| From net investment income | (0.65) | | (0.30) | | (0.21) | | (0.28) | | (0.40) |
| Net asset value at end of year | $ 8.75 | | $ 8.55 | | $ 9.13 | | $ 8.84 | | $ 9.03 |
| Total investment return (b) | 10.22% | | (3.11)% | | 5.68% | | 1.08% | | 1.69% |
| Ratios (to average net assets)/Supplemental Data: | | | | | | | | | |
| Net investment income (loss) | 7.51% | | 3.41% | | 2.43% | | 3.14% | | 4.37% |
| Net expenses (c) | 1.32% | | 1.34% | | 1.37% | | 1.49% | | 1.43% |
| Portfolio turnover rate | 11% | | 27% | | 22% | | 22% | | 19% |
| Net assets at end of year (in 000’s) | $ 1,083 | | $ 745 | | $ 620 | | $ 523 | | $ 436 |
| (a) | Per share data based on average shares outstanding during the year. |
| (b) | Total investment return is calculated exclusive of sales charges and assumes the reinvestment of dividends and distributions. Class R3 shares are not subject to sales charges. For periods of less than one year, total return is not annualized. |
| (c) | In addition to the fees and expenses which the Fund bears directly, it also indirectly bears a pro-rata share of the fees and expenses of the underlying funds in which it invests. Such indirect expenses are not included in the above expense ratios. |
The notes to the financial statements are an integral part of, and should be read in conjunction with, the financial statements.
43
Financial Highlights selected per share data and ratios
| | Year Ended October 31, | | February 28, 2019^ through
October 31,
2019 |
| Class R6 | 2023 | | 2022 | | 2021 | | 2020 | |
| Net asset value at beginning of period | $ 8.55 | | $ 9.13 | | $ 8.84 | | $ 9.03 | | $ 9.18 |
| Net investment income (loss) (a) | 0.71 | | 0.36 | | 0.30 | | 0.35 | | 0.32 |
| Net realized and unrealized gain (loss) | 0.21 | | (0.58) | | 0.27 | | (0.19) | | (0.15) |
| Total from investment operations | 0.92 | | (0.22) | | 0.57 | | 0.16 | | 0.17 |
| Less distributions: | | | | | | | | | |
| From net investment income | (0.71) | | (0.36) | | (0.28) | | (0.35) | | (0.32) |
| Net asset value at end of period | $ 8.76 | | $ 8.55 | | $ 9.13 | | $ 8.84 | | $ 9.03 |
| Total investment return (b) | 11.10% | | (2.42)% | | 6.47% | | 1.92% | | 1.84% |
| Ratios (to average net assets)/Supplemental Data: | | | | | | | | | |
| Net investment income (loss) | 8.11% | | 4.07% | | 3.24% | | 3.99% | | 5.18%†† |
| Net expenses (c) | 0.64% | | 0.63% | | 0.62% | | 0.67% | | 0.64%†† |
| Portfolio turnover rate | 11% | | 27% | | 22% | | 22% | | 19% |
| Net assets at end of period (in 000’s) | $ 212,357 | | $ 332,082 | | $ 366,720 | | $ 120,432 | | $ 71,077 |
| ^ | Inception date. |
| †† | Annualized. |
| (a) | Per share data based on average shares outstanding during the period. |
| (b) | Total investment return is calculated exclusive of sales charges and assumes the reinvestment of dividends and distributions. Class R6 shares are not subject to sales charges. For periods of less than one year, total return is not annualized. |
| (c) | In addition to the fees and expenses which the Fund bears directly, it also indirectly bears a pro-rata share of the fees and expenses of the underlying funds in which it invests. Such indirect expenses are not included in the above expense ratios. |
| | Year Ended October 31, | | August 31, 2020^ through
October 31, |
| SIMPLE Class | 2023 | | 2022 | | 2021 | | 2020 |
| Net asset value at beginning of period | $ 8.55 | | $ 9.13 | | $ 8.84 | | $ 8.83* |
| Net investment income (loss) (a) | 0.68 | | 0.30 | | 0.22 | | 0.04 |
| Net realized and unrealized gain (loss) | 0.18 | | (0.58) | | 0.28 | | 0.01 |
| Total from investment operations | 0.86 | | (0.28) | | 0.50 | | 0.05 |
| Less distributions: | | | | | | | |
| From net investment income | (0.66) | | (0.30) | | (0.21) | | (0.04) |
| Net asset value at end of period | $ 8.75 | | $ 8.55 | | $ 9.13 | | $ 8.84 |
| Total investment return (b) | 10.33% | | (3.09)% | | 5.67% | | 0.57% |
| Ratios (to average net assets)/Supplemental Data: | | | | | | | |
| Net investment income (loss) | 7.82% | | 3.41% | | 2.42% | | 2.72%†† |
| Net expenses (c) | 1.20% | | 1.32% | | 1.38% | | 1.37%†† |
| Portfolio turnover rate | 11% | | 27% | | 22% | | 22% |
| Net assets at end of period (in 000’s) | $ 142 | | $ 26 | | $ 27 | | $ 25 |
| ^ | Inception date. |
| * | Based on the net asset value of Investor Class as of August 31, 2020. |
| †† | Annualized. |
| (a) | Per share data based on average shares outstanding during the period. |
| (b) | Total investment return is calculated exclusive of sales charges and assumes the reinvestment of dividends and distributions. SIMPLE Class shares are not subject to sales charges. For periods of less than one year, total return is not annualized. |
| (c) | In addition to the fees and expenses which the Fund bears directly, it also indirectly bears a pro-rata share of the fees and expenses of the underlying funds in which it invests. Such indirect expenses are not included in the above expense ratios. |
The notes to the financial statements are an integral part of, and should be read in conjunction with, the financial statements.
| 44 | MainStay Floating Rate Fund |
Notes to Financial Statements
Note 1-Organization and Business
MainStay Funds Trust (the “Trust”) was organized as a Delaware statutory trust on April 28, 2009. The Trust is registered under the Investment Company Act of 1940, as amended (the “1940 Act”), as an open-end management investment company, and is comprised of thirty-seven funds (collectively referred to as the “Funds”). These financial statements and notes relate to the MainStay Floating Rate Fund (the "Fund"), a “diversified” fund, as that term is defined in the 1940 Act, as interpreted or modified by regulatory authorities having jurisdiction, from time to time.
The following table lists the Fund's share classes that have been registered and commenced operations:
| Class | Commenced Operations |
| Class A | May 3, 2004 |
| Investor Class | February 28, 2008 |
| Class B^ | May 3, 2004 |
| Class C | May 3, 2004 |
| Class I | May 3, 2004 |
| Class R3* | February 29, 2016 |
| Class R6 | February 28, 2019 |
| SIMPLE Class | August 31, 2020 |
| ^ | Class B shares are closed to all new purchases as well as additional investments by existing Class B shareholders and will be converted into Class A or Investor Class shares based on shareholder eligibility on or about February 28, 2024. |
| * | As of October 31, 2023, Class R3 shares are closed to new investors and, upon the close of business on December 29, 2023, Class R3 shares are closed to additional investments by existing shareholders. Additionally, Class R3 shares will be liquidated on or about February 28, 2024 (the "Liquidation Date"). It is expected that the Fund will distribute to remaining shareholders invested in Class R3 shares, on or promptly after the Liquidation Date, a liquidating distribution in cash or cash equivalents equal to the net asset value of such shares. |
Class B shares of the MainStay Group of Funds are closed to all new purchases as well as additional investments by existing Class B shareholders. Existing Class B shareholders may continue to reinvest dividends and capital gains distributions, as well as exchange their Class B shares for Class B shares of other funds in the MainStay Group of Funds as permitted by the current exchange privileges. Class B shareholders continue to be subject to any applicable contingent deferred sales charge ("CDSC") at the time of redemption. All other features of the Class B shares, including but not limited to the fees and expenses applicable to Class B shares, remain unchanged. Unless redeemed, Class B shareholders will remain in Class B shares of their respective fund until the Class B shares are converted to Class A or Investor Class shares pursuant to the applicable conversion schedule.
Class A and Investor Class shares are offered at net asset value (“NAV”) per share plus an initial sales charge. No initial sales charge applies to investments of $250,000 or more (and certain other qualified purchases) in Class A and Investor Class shares. However, a CDSC of 1.00% may be imposed on certain redemptions of Class A and Investor Class shares
made within 18 months of the date of purchase on shares that were purchased without an initial sales charge. For purchases of Class A and Investor Class shares made from August 1, 2017 through April 14, 2019, a CDSC of 1.00% may be imposed on certain redemptions (for investments of $500,000 which paid no initial sales charge) of such shares within 18 months of the date of purchase on shares that were purchased without an initial sales charge. Class C shares are offered at NAV without an initial sales charge, although a 1.00% CDSC may be imposed on redemptions of such shares made within one year of the date of purchase of Class C shares. Investments in Class C shares are subject to a purchase maximum of $250,000. When Class B shares were offered, they were offered at NAV without an initial sales charge, although a CDSC that declines depending on the number of years a shareholder held its Class B shares may be imposed on certain redemptions of such shares made within six years of the date of purchase of such shares. Class I, Class R3, Class R6 and SIMPLE Class shares are offered at NAV without a sales charge. Depending upon eligibility, Class B shares convert to Class A or Investor Class shares at the end of the calendar quarter four years after the date they were purchased. In addition, depending upon eligibility, Class C shares convert to either Class A or Investor Class shares at the end of the calendar quarter eight years after the date they were purchased. Additionally, Investor Class shares may convert automatically to Class A shares. SIMPLE Class shares convert to Class A shares, or Investor Class shares if you are not eligible to hold Class A shares, at the end of the calendar quarter, ten years after the date they were purchased. Share class conversions are based on the relevant NAVs of the two classes at the time of the conversion, and no sales load or other charge is imposed. Under certain circumstances and as may be permitted by the Trust’s multiple class plan pursuant to Rule 18f-3 under the 1940 Act, specified share classes of the Fund may be converted to one or more other share classes of the Fund as disclosed in the capital share transactions within these Notes. The classes of shares have the same voting (except for issues that relate solely to one class), dividend, liquidation and other rights, and the same terms and conditions, except that under distribution plans pursuant to Rule 12b-1 under the 1940 Act, Class B and Class C shares are subject to higher distribution and/or service fees than Class A, Investor Class, Class R3 and SIMPLE Class shares. Class I and Class R6 shares are not subject to a distribution and/or service fee. Class R3 shares are subject to a shareholder service fee, which is in addition to fees paid under the distribution plan for Class R3 shares.
At a meeting held on September 25-26, 2023, the Board of Trustees (the “Board”) of the Trust, after careful consideration of a number of factors and upon the recommendation of the Fund's investment adviser, New York Life Investment Management LLC (“New York Life Investments” or the "Manager"), approved a proposal to liquidate Class R3 shares of the Fund on or about February 28, 2024, pursuant to the terms of a plan of liquidation.
In addition, the Board approved a proposal to accelerate the conversion of the Fund’s Class B shares into Class A shares, or Investor Class shares, based on shareholder eligibility. Class B shareholders of the Fund will
Notes to Financial Statements (continued)
receive Class A shares of the Fund if they hold at least $15,000 of Class B shares of the Fund on or around February 28, 2024; otherwise, Class B shareholders of the Fund will receive Investor Class shares of the Fund.
The Fund's investment objective is to seek high current income.
Note 2–Significant Accounting Policies
The Fund is an investment company and accordingly follows the investment company accounting and reporting guidance of the Financial Accounting Standards Board (“FASB”) Accounting Standards Codification Topic 946 Financial Services—Investment Companies. The Fund prepares its financial statements in accordance with generally accepted accounting principles (“GAAP”) in the United States of America and follows the significant accounting policies described below.
(A) Securities Valuation. Investments are usually valued as of the close of regular trading on the New York Stock Exchange (the "Exchange") (usually 4:00 p.m. Eastern time) on each day the Fund is open for business ("valuation date").
Pursuant to Rule 2a-5 under the 1940 Act, the Board has designated New York Life Investments as its Valuation Designee (the "Valuation Designee"). The Valuation Designee is responsible for performing fair valuations relating to all investments in the Fund’s portfolio for which market quotations are not readily available; periodically assessing and managing material valuation risks; establishing and applying fair value methodologies; testing fair valuation methodologies; evaluating and overseeing pricing services; ensuring appropriate segregation of valuation and portfolio management functions; providing quarterly, annual and prompt reporting to the Board, as appropriate; identifying potential conflicts of interest; and maintaining appropriate records. The Valuation Designee has established a valuation committee ("Valuation Committee") to assist in carrying out the Valuation Designee’s responsibilities and establish prices of securities for which market quotations are not readily available. The Fund's and the Valuation Designee's policies and procedures ("Valuation Procedures") govern the Valuation Designee’s selection and application of methodologies for determining and calculating the fair value of Fund investments. The Valuation Designee may value the Fund's portfolio securities for which market quotations are not readily available and other Fund assets utilizing inputs from pricing services and other third-party sources. The Valuation Committee meets (in person, via electronic mail or via teleconference) on an ad-hoc basis to determine fair valuations and on a quarterly basis to review fair value events with respect to certain securities for which market quotations are not readily available, including valuation risks and back-testing results, and preview reports to the Board.
The Valuation Committee establishes prices of securities for which market quotations are not readily available based on such methodologies and measurements on a regular basis after considering information that is reasonably available and deemed relevant by the Valuation Committee. The Board shall oversee the Valuation Designee and review fair valuation
materials on a prompt, quarterly and annual basis and approve proposed revisions to the Valuation Procedures.
Investments for which market quotations are not readily available are valued at fair value as determined in good faith pursuant to the Valuation Procedures. A market quotation is readily available only when that quotation is a quoted price (unadjusted) in active markets for identical investments that the Fund can access at the measurement date, provided that a quotation will not be readily available if it is not reliable. "Fair value" is defined as the price the Fund would reasonably expect to receive upon selling an asset or liability in an orderly transaction to an independent buyer in the principal or most advantageous market for the asset or liability. Fair value measurements are determined within a framework that establishes a three-tier hierarchy that maximizes the use of observable market data and minimizes the use of unobservable inputs to establish a classification of fair value measurements for disclosure purposes. "Inputs" refer broadly to the assumptions that market participants would use in pricing the asset or liability, including assumptions about risk, such as the risk inherent in a particular valuation technique used to measure fair value using a pricing model and/or the risk inherent in the inputs for the valuation technique. Inputs may be observable or unobservable. Observable inputs reflect the assumptions market participants would use in pricing the asset or liability based on market data obtained from sources independent of the Fund. Unobservable inputs reflect the Fund’s own assumptions about the assumptions market participants would use in pricing the asset or liability based on the information available. The inputs or methodology used for valuing assets or liabilities may not be an indication of the risks associated with investing in those assets or liabilities. The three-tier hierarchy of inputs is summarized below.
| • | Level 1—quoted prices (unadjusted) in active markets for an identical asset or liability |
| • | Level 2—other significant observable inputs (including quoted prices for a similar asset or liability in active markets, interest rates and yield curves, prepayment speeds, credit risk, etc.) |
| • | Level 3—significant unobservable inputs (including the Fund's own assumptions about the assumptions that market participants would use in measuring fair value of an asset or liability) |
The level of an asset or liability within the fair value hierarchy is based on the lowest level of an input, both individually and in the aggregate, that is significant to the fair value measurement. The aggregate value by input level of the Fund’s assets and liabilities as of October 31, 2023, is included at the end of the Portfolio of Investments.
| 46 | MainStay Floating Rate Fund |
The Fund may use third-party vendor evaluations, whose prices may be derived from one or more of the following standard inputs, among others:
| • Benchmark yields | • Reported trades |
| • Broker/dealer quotes | • Issuer spreads |
| • Two-sided markets | • Benchmark securities |
| • Bids/offers | • Reference data (corporate actions or material event notices) |
| • Industry and economic events | • Comparable bonds |
| • Monthly payment information | |
An asset or liability for which a market quotation is not readily available is valued by methods deemed reasonable in good faith by the Valuation Committee, following the Valuation Procedures to represent fair value. Under these procedures, the Valuation Designee generally uses a market-based approach which may use related or comparable assets or liabilities, recent transactions, market multiples, book values and other relevant information. The Valuation Designee may also use an income-based valuation approach in which the anticipated future cash flows of the asset or liability are discounted to calculate fair value. Discounts may also be applied due to the nature and/or duration of any restrictions on the disposition of the asset or liability. Fair value represents a good faith approximation of the value of a security. Fair value determinations involve the consideration of a number of subjective factors, an analysis of applicable facts and circumstances and the exercise of judgment. As a result, it is possible that the fair value for a security determined in good faith in accordance with the Valuation Procedures may differ from valuations for the same security determined for other funds using their own valuation procedures. Although the Valuation Procedures are designed to value a security at the price the Fund may reasonably expect to receive upon the security's sale in an orderly transaction, there can be no assurance that any fair value determination thereunder would, in fact, approximate the amount that the Fund would actually realize upon the sale of the security or the price at which the security would trade if a reliable market price were readily available. During the year ended October 31, 2023, there were no material changes to the fair value methodologies.
Securities which may be valued in this manner include, but are not limited to: (i) a security for which trading has been halted or suspended or otherwise does not have a readily available market quotation on a given day; (ii) a debt security that has recently gone into default and for which there is not a current market quotation; (iii) a security of an issuer that has entered into a restructuring; (iv) a security that has been delisted from a national exchange; (v) a security subject to trading collars for which no or limited trading takes place; and (vi) a security whose principal market has been temporarily closed at a time when, under normal conditions, it would be open. Securities valued in this manner are generally categorized as Level 2 or 3 in the hierarchy. As of October 31, 2023, securities that were fair valued in such a manner are shown in the Portfolio of Investments.
Equity securities, rights and warrants, if applicable, are valued at the last quoted sales prices as of the close of regular trading on the relevant exchange on each valuation date. Securities that are not traded on the valuation date are valued at the mean of the last quoted bid and ask prices. Prices are normally taken from the principal market in which each security trades. These securities are generally categorized as Level 1 in the hierarchy.
Investments in mutual funds, including money market funds, are valued at their respective NAVs at the close of business each day on the valuation date. These securities are generally categorized as Level 1 in the hierarchy.
Debt securities (other than convertible and municipal bonds) are valued at the evaluated bid prices (evaluated mean prices in the case of convertible and municipal bonds) supplied by a pricing agent or broker selected by the Valuation Designee, in consultation with the Subadvisor. The evaluations are market-based measurements processed through a pricing application and represents the pricing agent’s good faith determination as to what a holder may receive in an orderly transaction under market conditions. The rules-based logic utilizes valuation techniques that reflect participants’ assumptions and vary by asset class and per methodology, maximizing the use of relevant observable data including quoted prices for similar assets, benchmark yield curves and market corroborated inputs. The evaluated bid or mean prices are deemed by the Valuation Designee, in consultation with the Subadvisor, to be representative of market values at the regular close of trading of the Exchange on each valuation date. Debt securities purchased on a delayed delivery basis are marked to market daily until settlement at the forward settlement date. Debt securities, including corporate bonds, U.S. government and federal agency bonds, municipal bonds, foreign bonds, convertible bonds, asset-backed securities and mortgage-backed securities are generally categorized as Level 2 in the hierarchy.
Loan assignments, participations and commitments are valued at the average of bid quotations obtained from the engaged independent pricing service and are generally categorized as Level 2 in the hierarchy. Certain loan assignments, participations and commitments may be valued by utilizing significant unobservable inputs obtained from the pricing service and are generally categorized as Level 3 in the hierarchy. As of October 31, 2023, securities that were fair valued in such a manner are shown in the Portfolio of Investments.
Temporary cash investments acquired in excess of 60 days to maturity at the time of purchase are valued using the latest bid prices or using valuations based on a matrix system (which considers such factors as security prices, yields, maturities and ratings), both as furnished by independent pricing services. Temporary cash investments that mature in 60 days or less at the time of purchase ("Short-Term Investments") are valued using the amortized cost method of valuation, unless the use of such method would be inappropriate. The amortized cost method involves valuing a security at its cost on the date of purchase and thereafter assuming a constant amortization to maturity of the difference between such cost and the value on maturity date. Amortized cost approximates
Notes to Financial Statements (continued)
the current fair value of a security. Securities valued using the amortized cost method are not valued using quoted prices in an active market and are generally categorized as Level 2 in the hierarchy.
The information above is not intended to reflect an exhaustive list of the methodologies that may be used to value portfolio investments. The Valuation Procedures permit the use of a variety of valuation methodologies in connection with valuing portfolio investments. The methodology used for a specific type of investment may vary based on the market data available or other considerations. The methodologies summarized above may not represent the specific means by which portfolio investments are valued on any particular business day.
A portfolio investment may be classified as an illiquid investment under the Trust's written liquidity risk management program and related procedures (“Liquidity Program”). Illiquidity of an investment might prevent the sale of such investment at a time when the Manager or the Subadvisor might wish to sell, and these investments could have the effect of decreasing the overall level of the Fund's liquidity. Further, the lack of an established secondary market may make it more difficult to value illiquid investments, requiring the Fund to rely on judgments that may be somewhat subjective in measuring value, which could vary materially from the amount that the Fund could realize upon disposition. Difficulty in selling illiquid investments may result in a loss or may be costly to the Fund. An illiquid investment is any investment that the Manager or Subadvisor reasonably expects cannot be sold or disposed of in current market conditions in seven calendar days or less without the sale or disposition significantly changing the market value of the investment. The liquidity classification of each investment will be made using information obtained after reasonable inquiry and taking into account, among other things, relevant market, trading and investment-specific considerations in accordance with the Liquidity Program. Illiquid investments are often fair valued in accordance with the Fund's procedures described above. The liquidity of the Fund's investments was determined as of October 31, 2023, and can change at any time. Illiquid investments as of October 31, 2023, are shown in the Portfolio of Investments.
(B) Income Taxes. The Fund's policy is to comply with the requirements of the Internal Revenue Code of 1986, as amended (the “Internal Revenue Code”), applicable to regulated investment companies and to distribute all of its taxable income to the shareholders of the Fund within the allowable time limits.
The Manager evaluates the Fund’s tax positions to determine if the tax positions taken meet the minimum recognition threshold in connection with accounting for uncertainties in income tax positions taken or expected to be taken for the purposes of measuring and recognizing tax liabilities in the financial statements. Recognition of tax benefits of an uncertain tax position is permitted only to the extent the position is “more likely than not” to be sustained assuming examination by taxing authorities. The Manager analyzed the Fund's tax positions taken on federal, state and local income tax returns for all open tax years (for up to three tax years) and has concluded that no provisions for federal, state
and local income tax are required in the Fund's financial statements. The Fund's federal, state and local income tax and federal excise tax returns for tax years for which the applicable statutes of limitations have not expired are subject to examination by the Internal Revenue Service and state and local departments of revenue.
(C) Dividends and Distributions to Shareholders. Dividends and distributions are recorded on the ex-dividend date. The Fund intends to declare dividends from net investment income, if any, daily and intends to pay them at least monthly and pays distributions from net realized capital and currency gains, if any, at least annually. Unless a shareholder elects otherwise, all dividends and distributions are reinvested at NAV in the same class of shares of the Fund. Dividends and distributions to shareholders are determined in accordance with federal income tax regulations and may differ from determinations using GAAP.
(D) Security Transactions and Investment Income. The Fund records security transactions on the trade date. Realized gains and losses on security transactions are determined using the identified cost method. Dividend income is recognized on the ex-dividend date, net of any foreign tax withheld at the source. Premiums and discount on purchased securities other than bank loans, are accreted and amortized, respectively on the effective interest rate method. Premiums and discounts on purchased bank loan securities are accreted and amortized, respectively, on the straight line method. Distributions received from real estate investment trusts may be classified as dividends, capital gains and/or return of capital.
Investment income and realized and unrealized gains and losses on investments of the Fund are allocated pro rata to the separate classes of shares based upon their relative net assets on the date the income is earned or realized and unrealized gains and losses are incurred.
The Fund may place a debt security on non-accrual status and reduce related interest income by ceasing current accruals and writing off all or a portion of any interest receivables when the collection of all or a portion of such interest has become doubtful. A debt security is removed from non-accrual status when the issuer resumes interest payments or when collectability of interest is reasonably assured.
(E) Expenses. Expenses of the Trust are allocated to the individual Funds in proportion to the net assets of the respective Funds when the expenses are incurred, except where direct allocations of expenses can be made. Expenses (other than transfer agent expenses and fees incurred under the shareholder services plans and/or the distribution plans further discussed in Note 3(B)) are allocated to separate classes of shares pro rata based upon their relative net assets on the date the expenses are incurred. The expenses borne by the Fund, including those of related parties to the Fund, are shown in the Statement of Operations.
Additionally, the Fund may invest in ETFs and mutual funds, which are subject to management fees and other fees that may cause the costs of investing in ETFs and mutual funds to be greater than the costs of owning the underlying securities directly. These indirect expenses of ETFs and
| 48 | MainStay Floating Rate Fund |
mutual funds are not included in the amounts shown as expenses in the Statement of Operations or in the expense ratios included in the Financial Highlights.
(F) Use of Estimates. In preparing financial statements in conformity with GAAP, the Manager makes estimates and assumptions that affect the reported amounts and disclosures in the financial statements. Actual results could differ from those estimates and assumptions.
(G) Loan Assignments, Participations and Commitments. The Fund may invest in loan assignments and participations ("loans"). Commitments are agreements to make money available to a borrower in a specified amount, at a specified rate and within a specified time. The Fund records an investment when the borrower withdraws money on a commitment or when a funded loan is purchased (trade date) and records interest as earned. These loans pay interest at rates that are periodically reset by reference to a base lending rate plus a spread. These base lending rates are generally the prime rate offered by a designated U.S. bank, the Secured Overnight Financing Rate ("SOFR") or an alternative reference rate.
The loans in which the Fund may invest are generally readily marketable, but may be subject to some restrictions on resale. For example, the Fund may be contractually obligated to receive approval from the agent bank and/or borrower prior to the sale of these investments. If the Fund purchases an assignment from a lender, the Fund will generally have direct contractual rights against the borrower in favor of the lender. If the Fund purchases a participation interest either from a lender or a participant, the Fund typically will have established a direct contractual relationship with the seller of the participation interest, but not with the borrower. Consequently, the Fund is subject to the credit risk of the lender or participant who sold the participation interest to the Fund, in addition to the usual credit risk of the borrower. In the event that the borrower, selling participant or intermediate participants become insolvent or enter into bankruptcy, the Fund may incur certain costs and delays in realizing payment, or may suffer a loss of principal and/or interest.
Unfunded commitments represent the remaining obligation of the Fund to the borrower. At any point in time, up to the maturity date of the issue, the borrower may demand the unfunded portion. Unfunded amounts, if any, are marked to market and any unrealized gains or losses are recorded in the Statement of Assets and Liabilities. As of October 31, 2023, the Fund did not hold any unfunded commitments.
(H) Rights and Warrants. Rights are certificates that permit the holder to purchase a certain number of shares, or a fractional share, of a new stock from the issuer at a specific price. Warrants are instruments that entitle the holder to buy an equity security at a specific price for a specific period of time. These investments can provide a greater potential for profit or loss than an equivalent investment in the underlying security. Prices of these investments do not necessarily move in tandem with the prices of the underlying securities.
There is risk involved in the purchase of rights and warrants in that these investments are speculative investments. The Fund could also lose the
entire value of its investment in warrants if such warrants are not exercised by the date of its expiration. The Fund is exposed to risk until the sale or exercise of each right or warrant is completed. Rights and Warrants as of October 31, 2023 are shown in the Portfolio of Investments.
(I) Delayed Delivery Transactions. The Fund may purchase or sell securities on a delayed delivery basis. These transactions involve a commitment by the Fund to purchase or sell securities for a predetermined price or yield, with payment and delivery taking place beyond the customary settlement period. When delayed delivery purchases are outstanding, the Fund will designate liquid assets in an amount sufficient to meet the purchase price. When purchasing a security on a delayed delivery basis, the Fund assumes the rights and risks of ownership of the security, including the risk of price and yield fluctuations, and takes such fluctuations into account when determining its NAV. The Fund may dispose of or renegotiate a delayed delivery transaction after it is entered into, and may sell delayed delivery securities before they are delivered, which may result in a realized gain or loss. When the Fund has sold a security it owns on a delayed delivery basis, the Fund does not participate in future gains and losses with respect to the security. Delayed delivery transactions as of October 31, 2023, are shown in the Portfolio of Investments.
(J) Loan Risk. The Fund may invest in loans which are usually rated below investment grade and are generally considered speculative because they present a greater risk of loss, including default, than higher rated debt securities. These investments pay investors a higher interest rate than investment grade debt securities because of the increased risk of loss. Although certain loans are collateralized, there is no guarantee that the value of the collateral will be sufficient to repay the loan. In a recession or serious credit event, the value of these investments could decline significantly. As a result of these and other events, the Fund's NAVs could go down and you could lose money.
In addition, loans generally are subject to extended settlement periods that may be longer than seven days. As a result, the Fund may be adversely affected by selling other investments at an unfavorable time and/or under unfavorable conditions or engaging in borrowing transactions, such as borrowing against its credit facility, to raise cash to meet redemption obligations or pursue other investment opportunities.
In certain circumstances, loans may not be deemed to be securities. As a result, the Fund may not have the protection of the anti-fraud provisions of the federal securities laws. In such cases, the Fund generally must rely on the contractual provisions in the loan agreement and common-law fraud protections under applicable state law.
(K) Foreign Securities Risk. The Fund may invest in foreign securities, which carry certain risks that are in addition to the usual risks inherent in domestic securities. Foreign regulatory regimes and securities markets can have less stringent investor protections and disclosure standards and less liquid trading markets than U.S. regulatory regimes and securities markets, and can experience political, social and economic
Notes to Financial Statements (continued)
developments that may affect the value of investments in foreign securities. These risks include those resulting from currency fluctuations, future adverse political or economic developments and possible imposition of currency exchange blockages or other foreign governmental laws or restrictions. Economic sanctions and other similar governmental actions or developments could, among other things, effectively restrict or eliminate the Fund's ability to purchase or sell certain foreign securities or groups of foreign securities, and thus may make the Fund's investments in such securities less liquid or more difficult to value. These risks are likely to be greater in emerging markets than in developed markets. The ability of issuers of debt securities held by the Fund to meet their obligations may be affected by, among other things, economic or political developments in a specific country, industry or region.
(L) Debt Securities Risk. The Fund's investments may include securities such as variable rate notes, floaters and mortgage-related and asset-backed securities. If expectations about changes in interest rates or assessments of an issuer's credit worthiness or market conditions are incorrect, investments in these types of securities could lose money for the Fund.
(M) LIBOR Replacement Risk. The Fund may invest in certain debt securities, derivatives or other financial instruments that have relied or continue to rely on the London Interbank Offered Rate ("LIBOR"), as a “benchmark” or “reference rate” for various interest rate calculations. As of January 1, 2022, the United Kingdom Financial Conduct Authority ("FCA"), which regulates LIBOR, ceased its active encouragement of banks to provide the quotations needed to sustain most LIBOR rates due to the absence of an active market for interbank unsecured lending and other reasons. In connection with supervisory guidance from U.S. regulators, certain U.S. regulated entities have generally ceased to enter into certain new LIBOR contracts after January 1, 2022. On March 15, 2022, the Adjustable Interest Rate (LIBOR) Act was signed into law. This law provides a statutory fallback mechanism on a nationwide basis to replace LIBOR with a benchmark rate that is selected by the Board of Governors of the Federal Reserve System and based on Secured Overnight Financing Rate ("SOFR") (which measures the cost of overnight borrowings through repurchase agreement transactions collateralized with U.S. Treasury securities) for tough legacy contracts. On February 27, 2023, the Federal Reserve System’s final rule in connection with this law became effective, establishing benchmark replacements based on SOFR and Term SOFR (a forward-looking measurement of market expectations of SOFR implied from certain derivatives markets) for applicable tough legacy contracts governed by U.S. law. In addition, the FCA has announced that it will require the publication of synthetic LIBOR for the one-month, three-month and six-month U.S. Dollar LIBOR settings after June 30, 2023 through at least September 30, 2024. Certain of the Fund's investments may involve individual tough legacy contracts which may be subject to the Adjustable Interest Rate (LIBOR) Act or synthetic LIBOR and no assurances can be given that these measures will have had the intended effects. Although the transition process away from LIBOR for many instruments has been completed, some LIBOR use is
continuing and there are potential effects related to the transition away from LIBOR or continued use of LIBOR on the Fund.
The elimination of LIBOR or changes to other reference rates or any other changes or reforms to the determination or supervision of reference rates could have an adverse impact on the market for, or value of, any securities or payments linked to those reference rates, which may adversely affect the Fund's performance and/or net asset value. It could also lead to a reduction in the interest rates on, and the value of, some LIBOR-based investments and reduce the effectiveness of hedges mitigating risk in connection with LIBOR-based investments. Uncertainty and risk also remain regarding the willingness and ability of issuers and lenders to include enhanced provisions in new and existing contracts or instruments. Consequently, the transition away from LIBOR to other reference rates may lead to increased volatility and illiquidity in markets that are tied to LIBOR, fluctuations in values of LIBOR-related investments or investments in issuers that utilize LIBOR, increased difficulty in borrowing or refinancing and diminished effectiveness of hedging strategies, adversely affecting the Fund's performance. Furthermore, the risks associated with the expected discontinuation of LIBOR and transition may be exacerbated if the work necessary to effect an orderly transition to an alternative reference rate is not completed in a timely manner. The usefulness of LIBOR as a benchmark could deteriorate anytime during this transition period. Any such effects of the transition process, including unforeseen effects, could result in losses to the Fund.
(N) Indemnifications. Under the Trust’s organizational documents, its officers and trustees are indemnified against certain liabilities that may arise out of performance of their duties to the Trust. Additionally, in the normal course of business, the Fund enters into contracts with third-party service providers that contain a variety of representations and warranties and that may provide general indemnifications. The Fund's maximum exposure under these arrangements is unknown, as this would involve future claims that may be made against the Fund that have not yet occurred. The Manager believes that the risk of loss in connection with these potential indemnification obligations is remote. However, there can be no assurance that material liabilities related to such obligations will not arise in the future, which could adversely impact the Fund.
Note 3–Fees and Related Party Transactions
(A) Manager and Subadvisor. New York Life Investments, a registered investment adviser and an indirect, wholly-owned subsidiary of New York Life Insurance Company ("New York Life"), serves as the Fund's Manager pursuant to an Amended and Restated Management Agreement ("Management Agreement"). The Manager provides offices, conducts clerical, recordkeeping and bookkeeping services and keeps most of the financial and accounting records required to be maintained by the Fund. Except for the portion of salaries and expenses that are the responsibility of the Fund, the Manager pays the salaries and expenses of all personnel affiliated with the Fund and certain operational expenses of the Fund. The Fund reimburses New York Life Investments in an amount equal to the portion of the compensation of the Chief Compliance Officer attributable
| 50 | MainStay Floating Rate Fund |
to the Fund. NYL Investors LLC ("NYL Investors" or ''Subadvisor''), a registered investment adviser and a direct, wholly-owned subsidiary of New York Life, serves as the Subadvisor to the Fund and is responsible for the day-to-day portfolio management of the Fund. Pursuant to the terms of a Subadvisory Agreement ("Subadvisory Agreement") between New York Life Investments and NYL Investors, New York Life Investments pays for the services of the Subadvisor.
Pursuant to the Management Agreement, the Fund pays the Manager a monthly fee for the services performed and the facilities furnished at an annual rate of the Fund’s average daily net assets as follows: 0.60% up to $1 billion; 0.575% from $1 billion to $3 billion; and 0.565% in excess of $3 billion. During the year ended October 31, 2023, the effective management fee rate was 0.59%.
New York Life Investments has contractually agreed to waive fees and/or reimburse expenses so that Total Annual Fund Operating Expenses (excluding taxes, interest, litigation, extraordinary expenses, brokerage and other transaction expenses relating to the purchase or sale of portfolio investments, and acquired (underlying) fund fees and expenses) for Class A shares do not exceed 1.05% of the Fund’s average daily net assets. New York Life Investments will apply an equivalent waiver or reimbursement, in an equal number of basis points, to the other share classes of the Fund, except for Class R6 shares. New York Life Investments has contractually agreed to waive fees and/or reimburse expenses so that Class R6 fees and expenses do not exceed those of Class I. This agreement will remain in effect until February 28, 2024, and shall renew automatically for one-year terms unless New York Life Investments provides written notice of termination prior to the start of the next term or upon approval of the Board.
During the year ended October 31, 2023, New York Life Investments earned fees from the Fund in the amount of $10,793,440 and paid the Subadvisor in the amount of $5,400,442.
JPMorgan Chase Bank, N.A. ("JPMorgan") provides sub-administration and sub-accounting services to the Fund pursuant to an agreement with New York Life Investments. These services include calculating the daily NAVs of the Fund, maintaining the general ledger and sub-ledger accounts for the calculation of the Fund's NAVs, and assisting New York Life Investments in conducting various aspects of the Fund's administrative operations. For providing these services to the Fund, JPMorgan is compensated by New York Life Investments.
Pursuant to an agreement between the Trust and New York Life Investments, New York Life Investments is responsible for providing or procuring certain regulatory reporting services for the Fund. The Fund will reimburse New York Life Investments for the actual costs incurred by New York Life Investments in connection with providing or procuring these services for the Fund.
(B) Distribution and Service Fees. The Trust, on behalf of the Fund, has entered into a distribution agreement with NYLIFE Distributors LLC (the “Distributor”), an affiliate of New York Life
Investments. The Fund has adopted distribution plans (the “Plans”) in accordance with the provisions of Rule 12b-1 under the 1940 Act.
Pursuant to the Class A and Investor Class Plans, the Distributor receives a monthly fee from the Class A and Investor Class shares at an annual rate of 0.25% of the average daily net assets of the Class A and Investor Class shares for distribution and/or service activities as designated by the Distributor. Pursuant to the Class B and Class C Plans, the Distributor receives a monthly distribution fee at an annual rate of 0.75% of the average daily net assets of the Class B and Class C shares, along with a service fee at an annual rate of 0.25% of the average daily net assets of the Class B and Class C shares, for a total 12b-1 fee of 1.00%. Pursuant to the Class R3 and SIMPLE Class shares Plans, Class R3 and SIMPLE Class shares pay the Distributor a monthly distribution fee at an annual rate of 0.25% of the average daily net assets of the Class R3 and SIMPLE Class shares, along with a service fee at an annual rate of 0.25% of the average daily net assets of the Class R3 and SIMPLE Class shares, for a total 12b-1 fee of 0.50%. Class I and Class R6 shares are not subject to a distribution and/or service fee.
The Plans provide that the distribution and service fees are payable to the Distributor regardless of the amounts actually expended by the Distributor for distribution of the Fund's shares and service activities.
In accordance with the Shareholder Services Plans for the Class R3 shares, the Manager has agreed to provide, through its affiliates or independent third parties, various shareholder and administrative support services to shareholders of the Class R3 shares. For its services, the Manager, its affiliates or independent third-party service providers are entitled to a shareholder service fee accrued daily and paid monthly at an annual rate of 0.10% of the average daily net assets of the Class R3 shares. This is in addition to any fees paid under the Class R3 Plan.
During the year ended October 31, 2023, shareholder service fees incurred by the Fund were as follows:
(C) Sales Charges. The Fund was advised by the Distributor that the amount of initial sales charges retained on sales of Class A and Investor Class shares during the year ended October 31, 2023, were $52,538 and $1,272, respectively.
The Fund was also advised that the Distributor retained CDSCs on redemptions of Class A, Investor Class and Class C shares during the year ended October 31, 2023, of $166,295, $8 and $7,948, respectively.
(D) Transfer, Dividend Disbursing and Shareholder Servicing Agent. NYLIM Service Company LLC, an affiliate of New York Life Investments, is the Fund's transfer, dividend disbursing and shareholder servicing agent pursuant to an agreement between NYLIM Service Company LLC and the Trust. NYLIM Service Company LLC has entered into an agreement with SS&C Global Investor & Distribution Solutions, Inc. ("SS&C"), pursuant to which SS&C performs certain transfer agent services on behalf of NYLIM Service Company LLC. New York Life
Notes to Financial Statements (continued)
Investments has contractually agreed to limit the transfer agency expenses charged to the Fund’s share classes to a maximum of 0.35% of that share class’s average daily net assets on an annual basis after deducting any applicable Fund or class-level expense reimbursement or small account fees. This agreement will remain in effect until February 28, 2024, and shall renew automatically for one-year terms unless New York Life Investments provides written notice of termination prior to the start of the next term or upon approval of the Board. During the year ended October 31, 2023, transfer agent expenses incurred by the Fund and any reimbursements, pursuant to the aforementioned Transfer Agency expense limitation agreement, were as follows:
| Class | Expense | Waived |
| Class A | $499,206 | $— |
| Investor Class | 40,258 | — |
| Class B | 1,074 | — |
| Class C | 110,231 | — |
| Class I | 924,256 | — |
| Class R3 | 815 | — |
| Class R6 | 10,793 | — |
| SIMPLE Class | 57 | — |
(E) Small Account Fee. Shareholders with small accounts adversely impact the cost of providing transfer agency services. In an effort to reduce total transfer agency expenses, the Fund has implemented a small account fee on certain types of accounts. As described in the Fund's prospectus, certain shareholders with an account balance of less than $1,000 ($5,000 for Class A share accounts) are charged an annual per account fee of $20 (assessed semi-annually), the proceeds from which offset transfer agent fees as reflected in the Statement of Operations. This small account fee will not apply to certain types of accounts as described further in the Fund’s prospectus.
(F) Capital. As of October 31, 2023, New York Life and its affiliates beneficially held shares of the Fund with the values and percentages of net assets as follows:
| Class R6 | $29,731 | 0.0%‡ |
| SIMPLE Class | 28,216 | 19.8 |
| ‡ | Less than one-tenth of a percent. |
Note 4-Federal Income Tax
As of October 31, 2023, the cost and unrealized appreciation (depreciation) of the Fund’s investment portfolio, including applicable derivative contracts and other financial instruments, as determined on a federal income tax basis, were as follows:
| | Federal Tax
Cost | Gross
Unrealized
Appreciation | Gross
Unrealized
(Depreciation) | Net
Unrealized
Appreciation/
(Depreciation) |
| Investments in Securities | $1,711,313,594 | $3,263,711 | $(61,220,485) | $(57,956,774) |
As of October 31, 2023, the components of accumulated gain (loss) on a tax basis were as follows:
Ordinary
Income | Accumulated
Capital
and Other
Gain (Loss) | Other
Temporary
Differences | Unrealized
Appreciation
(Depreciation) | Total
Accumulated
Gain (Loss) |
| $3,548,720 | $(167,428,730) | $(2,834,798) | $(57,956,774) | $(224,671,582) |
The difference between book-basis and tax-basis unrealized appreciation (depreciation) is primarily due to other temporary differences of interest accruals on defaulted securities and dividends payable.
As of October 31, 2023, for federal income tax purposes, capital loss carryforwards of $167,428,730, as shown in the table below, were available to the extent provided by the regulations to offset future realized gains of the Fund. Accordingly, no capital gains distributions are expected to be paid to shareholders until net gains have been realized in excess of such amounts.
Capital Loss
Available Through | Short-Term
Capital Loss
Amounts (000’s) | Long-Term
Capital Loss
Amounts (000’s) |
| Unlimited | $27,972 | $139,457 |
During the years ended October 31, 2023 and October 31, 2022, the tax character of distributions paid as reflected in the Statements of Changes in Net Assets was as follows:
| | 2023 | 2022 |
| Distributions paid from: | | |
| Ordinary Income | $144,905,123 | $93,239,421 |
Note 5–Custodian
JPMorgan is the custodian of cash and securities held by the Fund. Custodial fees are charged to the Fund based on the Fund's net assets and/or the market value of securities held by the Fund and the number of certain transactions incurred by the Fund.
| 52 | MainStay Floating Rate Fund |
Note 6–Line of Credit
The Fund and certain other funds managed by New York Life Investments maintain a line of credit with a syndicate of banks in order to secure a source of funds for temporary purposes to meet unanticipated or excessive redemption requests.
Effective July 25, 2023, under the credit agreement (the “Credit Agreement”), the aggregate commitment amount is $600,000,000 with an additional uncommitted amount of $100,000,000. The commitment fee is an annual rate of 0.15% of the average commitment amount payable quarterly, regardless of usage, to JPMorgan, who serves as the agent to the syndicate. The commitment fee is allocated among the Fund and certain other funds managed by New York Life Investments based upon their respective net assets and other factors. Interest on any revolving credit loan is charged based upon the Federal Funds Rate, Daily Simple Secured Overnight Financing Rate ("SOFR") + 0.10%, or the Overnight Bank Funding Rate, whichever is higher. The Credit Agreement expires on July 23, 2024, although the Fund, certain other funds managed by New York Life Investments and the syndicate of banks may renew the Credit Agreement for an additional year on the same or different terms or enter into a credit agreement with a different syndicate of banks. Prior to July 25, 2023, the aggregate commitment amount and the commitment fee were the same as those under the current Credit Agreement. During the year ended October 31, 2023, there were no borrowings made or outstanding with respect to the Fund under the Credit Agreement.
Note 7–Interfund Lending Program
Pursuant to an exemptive order issued by the SEC, the Fund, along with certain other funds managed by New York Life Investments, may participate in an interfund lending program. The interfund lending program provides an alternative credit facility that permits the Fund and certain other funds managed by New York Life Investments to lend or borrow money for temporary purposes directly to or from one another, subject to the conditions of the exemptive order. During the year ended October 31, 2023, there were no interfund loans made or outstanding with respect to the Fund.
Note 8–Purchases and Sales of Securities (in 000’s)
During the year ended October 31, 2023, purchases and sales of securities, other than short-term securities, were $188,009 and $816,182, respectively.
Note 9–Capital Share Transactions
Transactions in capital shares for the years ended October 31, 2023 and October 31, 2022, were as follows:
| Class A | Shares | Amount |
| Year ended October 31, 2023: | | |
| Shares sold | 29,660,554 | $ 259,073,096 |
| Shares issued to shareholders in reinvestment of distributions | 4,535,788 | 39,624,570 |
| Shares redeemed | (24,335,648) | (212,100,606) |
| Net increase (decrease) in shares outstanding before conversion | 9,860,694 | 86,597,060 |
| Shares converted into Class A (See Note 1) | 653,220 | 5,709,218 |
| Shares converted from Class A (See Note 1) | (76,460) | (666,225) |
| Net increase (decrease) | 10,437,454 | $ 91,640,053 |
| Year ended October 31, 2022: | | |
| Shares sold | 35,322,150 | $ 315,191,998 |
| Shares issued to shareholders in reinvestment of distributions | 1,953,269 | 17,079,210 |
| Shares redeemed | (21,176,272) | (186,216,536) |
| Net increase (decrease) in shares outstanding before conversion | 16,099,147 | 146,054,672 |
| Shares converted into Class A (See Note 1) | 529,231 | 4,710,199 |
| Shares converted from Class A (See Note 1) | (42,046) | (372,281) |
| Net increase (decrease) | 16,586,332 | $ 150,392,590 |
| |
| Investor Class | Shares | Amount |
| Year ended October 31, 2023: | | |
| Shares sold | 366,136 | $ 3,196,355 |
| Shares issued to shareholders in reinvestment of distributions | 158,344 | 1,382,777 |
| Shares redeemed | (243,798) | (2,129,368) |
| Net increase (decrease) in shares outstanding before conversion | 280,682 | 2,449,764 |
| Shares converted into Investor Class (See Note 1) | 46,843 | 408,287 |
| Shares converted from Investor Class (See Note 1) | (353,983) | (3,095,302) |
| Net increase (decrease) | (26,458) | $ (237,251) |
| Year ended October 31, 2022: | | |
| Shares sold | 496,359 | $ 4,443,739 |
| Shares issued to shareholders in reinvestment of distributions | 75,245 | 659,414 |
| Shares redeemed | (329,433) | (2,911,023) |
| Net increase (decrease) in shares outstanding before conversion | 242,171 | 2,192,130 |
| Shares converted into Investor Class (See Note 1) | 64,918 | 575,033 |
| Shares converted from Investor Class (See Note 1) | (337,925) | (3,027,893) |
| Net increase (decrease) | (30,836) | $ (260,730) |
| |
Notes to Financial Statements (continued)
| Class B | Shares | Amount |
| Year ended October 31, 2023: | | |
| Shares sold | 15,627 | $ 136,525 |
| Shares issued to shareholders in reinvestment of distributions | 2,980 | 26,053 |
| Shares redeemed | (18,403) | (160,726) |
| Net increase (decrease) in shares outstanding before conversion | 204 | 1,852 |
| Shares converted from Class B (See Note 1) | (16,990) | (148,518) |
| Net increase (decrease) | (16,786) | $ (146,666) |
| Year ended October 31, 2022: | | |
| Shares sold | 15,256 | $ 135,583 |
| Shares issued to shareholders in reinvestment of distributions | 1,635 | 14,353 |
| Shares redeemed | (28,245) | (250,015) |
| Net increase (decrease) in shares outstanding before conversion | (11,354) | (100,079) |
| Shares converted from Class B (See Note 1) | (22,634) | (200,602) |
| Net increase (decrease) | (33,988) | $ (300,681) |
| |
| Class C | Shares | Amount |
| Year ended October 31, 2023: | | |
| Shares sold | 1,027,146 | $ 8,965,639 |
| Shares issued to shareholders in reinvestment of distributions | 382,406 | 3,340,107 |
| Shares redeemed | (2,584,724) | (22,521,244) |
| Net increase (decrease) in shares outstanding before conversion | (1,175,172) | (10,215,498) |
| Shares converted from Class C (See Note 1) | (148,091) | (1,290,540) |
| Net increase (decrease) | (1,323,263) | $ (11,506,038) |
| Year ended October 31, 2022: | | |
| Shares sold | 3,237,524 | $ 29,019,142 |
| Shares issued to shareholders in reinvestment of distributions | 184,730 | 1,614,748 |
| Shares redeemed | (2,369,536) | (20,786,152) |
| Net increase (decrease) in shares outstanding before conversion | 1,052,718 | 9,847,738 |
| Shares converted from Class C (See Note 1) | (171,884) | (1,522,009) |
| Net increase (decrease) | 880,834 | $ 8,325,729 |
| |
| Class I | Shares | Amount |
| Year ended October 31, 2023: | | |
| Shares sold | 47,944,395 | $ 417,819,396 |
| Shares issued to shareholders in reinvestment of distributions | 6,430,803 | 56,101,128 |
| Shares redeemed | (119,984,501) | (1,042,874,690) |
| Net increase (decrease) in shares outstanding before conversion | (65,609,303) | (568,954,166) |
| Shares converted into Class I (See Note 1) | 74,860 | 652,282 |
| Shares converted from Class I (See Note 1) | (134,653) | (1,184,095) |
| Net increase (decrease) | (65,669,096) | $ (569,485,979) |
| Year ended October 31, 2022: | | |
| Shares sold | 130,993,383 | $ 1,172,562,445 |
| Shares issued to shareholders in reinvestment of distributions | 5,028,139 | 44,069,454 |
| Shares redeemed | (115,362,508) | (1,009,434,495) |
| Net increase (decrease) in shares outstanding before conversion | 20,659,014 | 207,197,404 |
| Shares converted into Class I (See Note 1) | 40,608 | 359,148 |
| Shares converted from Class I (See Note 1) | (5,009) | (42,826) |
| Net increase (decrease) | 20,694,613 | $ 207,513,726 |
| |
| Class R3 | Shares | Amount |
| Year ended October 31, 2023: | | |
| Shares sold | 54,334 | $ 474,247 |
| Shares issued to shareholders in reinvestment of distributions | 3,966 | 34,653 |
| Shares redeemed | (21,727) | (189,364) |
| Net increase (decrease) | 36,573 | $ 319,536 |
| Year ended October 31, 2022: | | |
| Shares sold | 29,390 | $ 264,271 |
| Shares issued to shareholders in reinvestment of distributions | 1,663 | 14,553 |
| Shares redeemed | (11,770) | (103,249) |
| Net increase (decrease) | 19,283 | $ 175,575 |
| |
| 54 | MainStay Floating Rate Fund |
| Class R6 | Shares | Amount |
| Year ended October 31, 2023: | | |
| Shares sold | 3,742,287 | $ 32,595,005 |
| Shares issued to shareholders in reinvestment of distributions | 2,467,779 | 21,549,959 |
| Shares redeemed | (20,748,220) | (180,979,198) |
| Net increase (decrease) in shares outstanding before conversion | (14,538,154) | (126,834,234) |
| Shares converted from Class R6 (See Note 1) | (44,493) | (385,107) |
| Net increase (decrease) | (14,582,647) | $ (127,219,341) |
| Year ended October 31, 2022: | | |
| Shares sold | 12,396,571 | $ 111,206,027 |
| Shares issued to shareholders in reinvestment of distributions | 1,732,416 | 15,202,017 |
| Shares redeemed | (15,392,660) | (134,934,458) |
| Net increase (decrease) in shares outstanding before conversion | (1,263,673) | (8,526,414) |
| Shares converted from Class R6 (See Note 1) | (55,146) | (478,769) |
| Net increase (decrease) | (1,318,819) | $ (9,005,183) |
| |
| SIMPLE Class | Shares | Amount |
| Year ended October 31, 2023: | | |
| Shares sold | 12,509 | $ 108,939 |
| Shares issued to shareholders in reinvestment of distributions | 740 | 6,483 |
| Net increase (decrease) | 13,249 | $ 115,422 |
| Year ended October 31, 2022: | | |
| Shares issued to shareholders in reinvestment of distributions | 102 | $ 887 |
| Net increase (decrease) | 102 | $ 887 |
Note 10–Other Matters
As of the date of this report, the Fund faces a heightened level of risk associated with current uncertainty, volatility and state of economies, financial markets, rising interest rates, and labor and health conditions around the world. Events such as war, acts of terrorism, recessions, rapid inflation, the imposition of international sanctions, earthquakes, hurricanes, epidemics and pandemics and other unforeseen natural or human disasters may have broad adverse social, political and economic effects on the global economy, which could negatively impact the value of the Fund's investments. Developments that disrupt global economies and financial markets may magnify factors that affect the Fund's performance.
Note 11–Subsequent Events
In connection with the preparation of the financial statements of the Fund as of and for the year ended October 31, 2023, events and transactions subsequent to October 31, 2023, through the date the financial statements were issued, have been evaluated by the Manager for
possible adjustment and/or disclosure. No subsequent events requiring financial statement adjustment or disclosure have been identified.
Report of Independent Registered Public Accounting Firm
To the Shareholders of the Fund and Board of Trustees
MainStay Funds Trust:
Opinion on the Financial Statements
We have audited the accompanying statement of assets and liabilities of MainStay Floating Rate Fund (the Fund), one of the funds constituting MainStay Funds Trust, including the portfolio of investments, as of October 31, 2023, the related statement of operations for the year then ended, the statements of changes in net assets for each of the years in the two-year period then ended, and the related notes (collectively, the financial statements) and the financial highlights for each of the years or periods in the five-year period then ended. In our opinion, the financial statements and financial highlights present fairly, in all material respects, the financial position of the Fund as of October 31, 2023, the results of its operations for the year then ended, the changes in its net assets for each of the years in the two-year period then ended, and the financial highlights for each of the years or periods in the five-year period then ended, in conformity with U.S. generally accepted accounting principles.
Basis for Opinion
These financial statements and financial highlights are the responsibility of the Fund's management. Our responsibility is to express an opinion on these financial statements and financial highlights based on our audits. We are a public accounting firm registered with the Public Company Accounting Oversight Board (United States) (PCAOB) and are required to be independent with respect to the Fund in accordance with the U.S. federal securities laws and the applicable rules and regulations of the Securities and Exchange Commission and the PCAOB.
We conducted our audits in accordance with the standards of the PCAOB. Those standards require that we plan and perform the audit to obtain reasonable assurance about whether the financial statements and financial highlights are free of material misstatement, whether due to error or fraud. Our audits included performing procedures to assess the risks of material misstatement of the financial statements and financial highlights, whether due to error or fraud, and performing procedures that respond to those risks. Such procedures included examining, on a test basis, evidence regarding the amounts and disclosures in the financial statements and financial highlights. Such procedures also included confirmation of securities owned as of October 31, 2023, by correspondence with custodians, agent banks and brokers; when replies were not received from agent banks and brokers, we performed other auditing procedures. Our audits also included evaluating the accounting principles used and significant estimates made by management, as well as evaluating the overall presentation of the financial statements and financial highlights. We believe that our audits provide a reasonable basis for our opinion.

We have served as the auditor of one or more New York Life Investment Management investment companies since 2003.
Philadelphia, Pennsylvania
December 22, 2023
| 56 | MainStay Floating Rate Fund |
Federal Income Tax Information
(Unaudited)
The Fund is required under the Internal Revenue Code to advise shareholders in a written statement as to the federal tax status of dividends paid by the Fund during such fiscal years.
In February 2024, shareholders will receive an IRS Form 1099-DIV or substitute Form 1099, which will show the federal tax status of the distributions received by shareholders in calendar year 2023. The amounts that will be reported on such 1099-DIV or substitute Form 1099 will be the amounts you are to use on your federal income tax return and will differ from the amounts which we must report for the Fund's fiscal year ended October 31, 2023.
Proxy Voting Policies and Procedures and Proxy Voting Record
The Fund is required to file with the SEC its proxy voting record for the 12-month period ending June 30 on Form N-PX. A description of the policies and procedures that are used to vote proxies relating to portfolio securities of the Fund is available free of charge upon request by calling 800-624-6782 or visiting the SEC’s website at www.sec.gov. The most recent Form N-PX or proxy voting record is available free of charge upon request by calling 800-624-6782; visiting newyorklifeinvestments.com; or visiting the SEC’s website at www.sec.gov.
Shareholder Reports and Quarterly Portfolio Disclosure
The Fund is required to file its complete schedule of portfolio holdings with the SEC 60 days after its first and third fiscal quarter on Form N-PORT. The Fund's holdings report is available free of charge upon request by calling New York Life Investments at 800-624-6782.
Board of Trustees and Officers (Unaudited)
The Trustees and officers of the Fund are listed below. The Board oversees the MainStay Group of Funds (which consists of MainStay Funds and MainStay Funds Trust), MainStay VP Funds Trust, MainStay MacKay DefinedTerm Municipal Opportunities Fund, MainStay CBRE Global Infrastructure Megatrends Term Fund, the Manager and the Subadvisors, and elects the officers of the Funds who are responsible for the day-to-day operations of the Fund. Information pertaining to the Trustees and officers is set forth below. Each Trustee serves until his or her successor is elected and qualified or until his or her resignation, death or
removal. Under the Board’s retirement policy, unless an exception is made, a Trustee must tender his or her resignation by the end of the calendar year during which he or she reaches the age of 75. Officers are elected annually by the Board. The business address of each Trustee and officer listed below is 51 Madison Avenue, New York, New York 10010. A majority of the Trustees are not “interested persons” (as defined by the 1940 Act and rules adopted by the SEC thereunder) of the Fund (“Independent Trustees”).
| | Name and
Year of Birth | Term of Office,
Position(s) Held and
Length of Service | Principal Occupation(s)
During Past Five Years | Number of
Portfolios in
Fund Complex
Overseen by
Trustee | Other Directorships
Held by Trustee |
| | | | | | |
| | Naïm Abou-Jaoudé*
1966 | MainStay MacKay DefinedTerm Municipal Opportunities Fund:
Trustee since June 2023 | Chief Executive Officer of New York Life Investment Management LLC since 2023. Previously, Abou-Jaoudé was the Chief Executive Officer of Candriam (an affiliate of New York Life Investment Management LLC) from 2007 to 2023. | 79 | MainStay Funds: Trustee since June 2023;
MainStay Funds Trust: Trustee since June 2023;
MainStay VP Funds Trust: Trustee since June 2023 (31 portfolios);
MainStay CBRE Global Infrastructure Megatrends Fund: Trustee since June 2023; and
New York Life Investment Management International: Chair since 2015 |
| * | This Trustee is considered to be an “interested person” of the MainStay Group of Funds, MainStay VP Funds Trust, MainStay CBRE Global Infrastructure Megatrends Term Fund and MainStay MacKay DefinedTerm Municipal Opportunities Fund, within the meaning of the 1940 Act because of his affiliation with New York Life Investment Management LLC and Candriam, as described in detail above in the column entitled “Principal Occupation(s) During Past Five Years.” |
| | |
| 58 | MainStay Floating Rate Fund |
| | Name and
Year of Birth | Term of Office,
Position(s) Held and
Length of Service | Principal Occupation(s)
During Past Five Years | Number of
Portfolios in
Fund Complex
Overseen by
Trustee | Other Directorships
Held by Trustee |
| | | | | | |
| | David H. Chow
1957 | MainStay Funds: Trustee since January 2016, Advisory Board Member (June 2015 to December 2015);MainStay Funds Trust:
Trustee since January 2016, Advisory Board Member (June 2015 to December 2015) | Founder and CEO, DanCourt Management, LLC (since 1999) | 81 | MainStay VP Funds Trust: Trustee since January 2016, Advisory Board Member (June 2015 to December 2015) (31 portfolios);
MainStay MacKay DefinedTerm Municipal Opportunities Fund: Trustee since January 2016, Advisory Board Member (June 2015 to December 2015);
MainStay CBRE Global Infrastructure Megatrends Term Fund: Trustee since 2021;
VanEck Vectors Group of Exchange-Traded Funds: Trustee since 2006 and Independent Chairman of the Board of Trustees from 2008 to 2022 (57 portfolios); and
Berea College of Kentucky: Trustee since 2009, Chair of the Investment Committee since 2018 |
| | Karen Hammond
1956 | MainStay Funds: Trustee since December 2021, Advisory Board Member (June 2021 to December 2021);MainStay Funds Trust:
Trustee since December 2021, Advisory Board Member (June 2021 to December 2021)
| Retired, Managing Director, Devonshire Investors (2007 to 2013); Senior Vice President, Fidelity Management & Research Co. (2005 to 2007); Senior Vice President and Corporate Treasurer, FMR Corp. (2003 to 2005); Chief Operating Officer, Fidelity Investments Japan (2001 to 2003) | 81 | MainStay VP Funds Trust: Trustee since December 2021, Advisory Board Member (June 2021 to December 2021) (31 portfolios);
MainStay MacKay DefinedTerm Municipal Opportunities Fund: Trustee since December 2021, Advisory Board Member (June 2021 to December 2021);
MainStay CBRE Global Infrastructure Megatrends Term Fund: Trustee since December 2021, Advisory Board Member (June 2021 to December 2021);
Two Harbors Investment Corp.: Director since 2018;
Rhode Island State Investment Commission: Member since 2017; and
Blue Cross Blue Shield of Rhode Island: Director since 2019 |
| | Susan B. Kerley
1951 | MainStay Funds: Chair since January 2017 and Trustee since 2007;MainStay Funds Trust:
Chair since January 2017 and Trustee since 1990*** | President, Strategic Management Advisors LLC (since 1990) | 81 | MainStay VP Funds Trust: Chair since January 2017 and Trustee since 2007 (31 portfolios)**;
MainStay MacKay DefinedTerm Municipal Opportunities Fund: Chair since January 2017 and Trustee since 2011;
MainStay CBRE Global Infrastructure Megatrends Term Fund: Trustee since June 2021; and
Legg Mason Partners Funds: Trustee since 1991 (45 portfolios) |
Board of Trustees and Officers (Unaudited) (continued)
| | Name and
Year of Birth | Term of Office,
Position(s) Held and
Length of Service | Principal Occupation(s)
During Past Five Years | Number of
Portfolios in
Fund Complex
Overseen by
Trustee | Other Directorships
Held by Trustee |
| | | | | | |
| | Alan R. Latshaw
1951 | MainStay Funds: Trusteesince 2006;MainStay Funds Trust:
Trustee since 2007*** | Retired; Partner, Ernst & Young LLP (2002 to 2003); Partner, Arthur Andersen LLP (1989 to 2002); Consultant to the MainStay Funds Audit and Compliance Committee (2004 to 2006) | 81 | MainStay VP Funds Trust: Trustee since 2007 (31 portfolios)**;
MainStay MacKay DefinedTerm Municipal Opportunities Fund: Trustee since 2011; and
MainStay CBRE Global Infrastructure Megatrends Term Fund: Trustee since June 2021 |
| | Jacques P. Perold
1958 | MainStay Funds: Trustee since January 2016, Advisory Board Member (June 2015to December 2015);MainStay Funds Trust:
Trustee since January 2016, Advisory Board Member (June 2015 to December 2015) | Founder and Chief Executive Officer, CapShift Advisors LLC (since 2018); President, Fidelity Management & Research Company (2009 to 2014); President and Chief Investment Officer, Geode Capital Management, LLC (2001 to 2009) | 81 | MainStay VP Funds Trust: Trustee since January 2016, Advisory Board Member (June 2015 to December 2015) (31 portfolios);
MainStay MacKay DefinedTerm Municipal Opportunities Fund: Trustee since January 2016, Advisory Board Member (June 2015 to December 2015);
MainStay CBRE Global Infrastructure Megatrends Term Fund: Trustee since June 2021;
Allstate Corporation: Director since 2015; and
MSCI Inc.: Director since 2017 |
| | Richard S. Trutanic
1952 | MainStay Funds: Trustee since 1994;MainStay Funds Trust:
Trustee since 2007*** | Chairman and Chief Executive Officer, Somerset & Company (financial advisory firm) (since 2004); Managing Director, The Carlyle Group (private investment firm) (2002 to 2004); Senior Managing Director, Partner and Board Member, Groupe Arnault S.A. (private investment firm) (1999 to 2002) | 81 | MainStay VP Funds Trust: Trustee since 2007 (31 portfolios)**;
MainStay MacKay DefinedTerm Municipal Opportunities Fund: Trustee since 2011; and
MainStay CBRE Global Infrastructure Megatrends Term Fund: Trustee since June 2021 |
| ** | Includes prior service as a Director of MainStay VP Series Fund, Inc., the predecessor to MainStay VP Funds Trust. |
| *** | Includes prior service as a Director/Trustee of certain predecessor entities to MainStay Funds Trust. |
| 60 | MainStay Floating Rate Fund |
| | Name and
Year of Birth | Position(s) Held and
Length of Service | Principal Occupation(s)
During Past Five Years | |
| | | | | |
| | Kirk C. Lehneis
1974 | President, MainStay Funds, MainStay Funds Trust (since 2017) | Chief Operating Officer and Senior Managing Director (since 2016), New York Life Investment Management LLC and New York Life Investment Management Holdings LLC; Member of the Board of Managers (since 2017) and Senior Managing Director (since 2018), NYLIFE Distributors LLC; Chairman of the Board and Senior Managing Director, NYLIM Service Company LLC (since 2017); Trustee, President and Principal Executive Officer of IndexIQ Trust, IndexIQ ETF Trust and IndexIQ Active ETF Trust (since 2018); President, MainStay CBRE Global Infrastructure Megatrends Term Fund (since 2021), MainStay MacKay DefinedTerm Municipal Opportunities Fund and MainStay VP Funds Trust (since 2017)**; Senior Managing Director, Global Product Development (2015 to 2016); Managing Director, Product Development (2010 to 2015), New York Life Investment Management LLC | |
| | Jack R. Benintende
1964 | Treasurer and Principal Financial and Accounting Officer, MainStay Funds (since 2007), MainStay Funds Trust (since 2009) | Managing Director, New York Life Investment Management LLC (since 2007); Treasurer and Principal Financial and Accounting Officer, MainStay CBRE Global Infrastructure Megatrends Term Fund (since 2021), MainStay MacKay DefinedTerm Municipal Opportunities Fund (since 2011) and MainStay VP Funds Trust (since 2007)**; and Assistant Treasurer, New York Life Investment Management Holdings LLC (2008 to 2012) | |
| | J. Kevin Gao
1967 | Secretary and Chief Legal Officer, MainStay Funds and MainStay Funds Trust (since 2010) | Managing Director and Associate General Counsel, New York Life Investment Management LLC (since 2010); Secretary and Chief Legal Officer, MainStay CBRE Global Infrastructure Megatrends Term Fund (since 2021), MainStay MacKay DefinedTerm Municipal Opportunities Fund (since 2011) and MainStay VP Funds Trust (since 2010)** | |
| | Kevin M. Gleason
1967 | Vice President and Chief Compliance Officer, MainStay Funds and MainStay Funds Trust (since June 2022) | Vice President and Chief Compliance Officer, IndexIQ Trust, IndexIQ ETF Trust and Index IQ Active ETF Trust (since June 2022); Vice President and Chief Compliance Officer, MainStay CBRE Global Infrastructure Megatrends Term Fund, MainStay VP Funds Trust and MainStay MacKay DefinedTerm Municipal Opportunities Fund (since June 2022); Senior Vice President, Voya Investment Management and Chief Compliance Officer, Voya Family of Funds (2012 to 2022) | |
| | Scott T. Harrington
1959 | Vice President— Administration, MainStay Funds (since 2005), MainStay Funds Trust (since 2009) | Managing Director, New York Life Investment Management LLC (including predecessor advisory organizations) (since 2000); Member of the Board of Directors, New York Life Trust Company (since 2009); Vice President—Administration, MainStay CBRE Global Infrastructure Megatrends Term Fund (since 2021), MainStay MacKay DefinedTerm Municipal Opportunities Fund (since 2011) and MainStay VP Funds Trust (since 2005)** | |
| * | The officers listed above are considered to be “interested persons” of the MainStay Group of Funds, MainStay VP Funds Trust, MainStay CBRE Global Infrastructure Megatrends Term Fund and MainStay MacKay DefinedTerm Municipal Opportunities Fund within the meaning of the 1940 Act because of their affiliation with the MainStay Group of Funds, New York Life Insurance Company and/or its affiliates, including New York Life Investment Management LLC, New York Life Insurance Company, NYLIM Service Company LLC, NYLIFE Securities LLC and/or NYLIFE Distributors LLC, as described in detail in the column captioned “Principal Occupation(s) During Past Five Years.” Officers are elected annually by the Board. |
| ** | Includes prior service as an Officer of MainStay VP Series Fund, Inc., the predecessor to MainStay VP Funds Trust. |
Officers of the Trust (Who are not Trustees)*
This page intentionally left blank.
Equity
U.S. Equity
MainStay Epoch U.S. Equity Yield Fund
MainStay Fiera SMID Growth Fund
MainStay PineStone U.S. Equity Fund
MainStay S&P 500 Index Fund
MainStay Winslow Large Cap Growth Fund
MainStay WMC Enduring Capital Fund
MainStay WMC Growth Fund
MainStay WMC Small Companies Fund
MainStay WMC Value Fund
International Equity
MainStay Epoch International Choice Fund
MainStay PineStone International Equity Fund
MainStay WMC International Research Equity Fund
Emerging Markets Equity
MainStay Candriam Emerging Markets Equity Fund
Global Equity
MainStay Epoch Capital Growth Fund
MainStay Epoch Global Equity Yield Fund
MainStay PineStone Global Equity Fund
Fixed Income
Taxable Income
MainStay Candriam Emerging Markets Debt Fund
MainStay Floating Rate Fund
MainStay MacKay High Yield Corporate Bond Fund
MainStay MacKay Short Duration High Yield Fund
MainStay MacKay Strategic Bond Fund
MainStay MacKay Total Return Bond Fund
MainStay MacKay U.S. Infrastructure Bond Fund
MainStay Short Term Bond Fund
Tax-Exempt Income
MainStay MacKay California Tax Free Opportunities Fund1
MainStay MacKay High Yield Municipal Bond Fund
MainStay MacKay New York Tax Free Opportunities Fund2
MainStay MacKay Short Term Municipal Fund
MainStay MacKay Strategic Municipal Allocation Fund
MainStay MacKay Tax Free Bond Fund
Money Market
MainStay Money Market Fund
Mixed Asset
MainStay Balanced Fund
MainStay Income Builder Fund
MainStay MacKay Convertible Fund
Speciality
MainStay CBRE Global Infrastructure Fund
MainStay CBRE Real Estate Fund
MainStay Cushing MLP Premier Fund
Asset Allocation
MainStay Conservative Allocation Fund
MainStay Conservative ETF Allocation Fund
MainStay Defensive ETF Allocation Fund
MainStay Equity Allocation Fund
MainStay Equity ETF Allocation Fund
MainStay ESG Multi-Asset Allocation Fund
MainStay Growth Allocation Fund
MainStay Growth ETF Allocation Fund
MainStay Moderate Allocation Fund
MainStay Moderate ETF Allocation Fund
Manager
New York Life Investment Management LLC
New York, New York
Subadvisors
Candriam3
Strassen, Luxembourg
CBRE Investment Management Listed Real Assets LLC
Radnor, Pennsylvania
Cushing Asset Management, LP
Dallas, Texas
Epoch Investment Partners, Inc.
New York, New York
Fiera Capital Inc.
New York, New York
IndexIQ Advisors LLC3
New York, New York
MacKay Shields LLC3
New York, New York
NYL Investors LLC3
New York, New York
PineStone Asset Management Inc.
Montreal, Québec
Wellington Management Company LLP
Boston, Massachusetts
Winslow Capital Management, LLC
Minneapolis, Minnesota
Legal Counsel
Dechert LLP
Washington, District of Columbia
Independent Registered Public Accounting Firm
KPMG LLP
Philadelphia, Pennsylvania
Distributor
NYLIFE Distributors LLC3
Jersey City, New Jersey
Custodian
JPMorgan Chase Bank, N.A.
New York, New York
1.
This Fund is registered for sale in AZ, CA, NV, OR, TX, UT, WA and MI (Class A and Class I shares only), and CO, FL, GA, HI, ID, MA, MD, NH, NJ and NY (Class I shares only).
| 2. | This Fund is registered for sale in CA, CT, DE, FL, MA, NJ, NY and VT. |
| 3. | An affiliate of New York Life Investment Management LLC. |
Not part of the Annual Report
For more information
800-624-6782
newyorklifeinvestments.com
“New York Life Investments” is both a service mark, and the common trade name, of certain investment advisors affiliated with New York Life Insurance Company. The MainStay Funds® are managed by New York Life Investment Management LLC and distributed by NYLIFE Distributors LLC, 30 Hudson Street, Jersey City, NJ 07302, a wholly owned subsidiary of New York Life Insurance Company. NYLIFE Distributors LLC is a Member FINRA/SIPC.
©2023 NYLIFE Distributors LLC. All rights reserved.
| 5013759MS139-23 | MSFR11-12/23 |
(NYLIM) NL225
MainStay MacKay California Tax Free Opportunities Fund
Message from the President and Annual Report
October 31, 2023
Special Notice:
Beginning in July 2024, new regulations issued by the Securities and Exchange Commission (SEC) will take effect requiring open-end mutual fund companies and ETFs to (1) overhaul the content of their shareholder reports and (2) mail paper copies of the new tailored shareholder reports to shareholders who have not opted to receive these documents electronically.
If you have not yet elected to receive your shareholder reports electronically, please contact your financial intermediary or visit newyorklifeinvestments.com/accounts.
| Not FDIC/NCUA Insured | Not a Deposit | May Lose Value | No Bank Guarantee | Not Insured by Any Government Agency |
This page intentionally left blank
Message from the President
Volatile economic and geopolitical forces drove market behavior during the 12-month reporting period ended October 31, 2023. While equity markets generally gained ground, bond prices trended broadly lower.
Although the war in Ukraine, the outbreak of hostilities in the Middle East and several other notable events affected financial assets, inflation and interest rate trends stood at the forefront of market developments during most of the period. As the reporting period began, high levels of inflation already showed signs of easing in the face of aggressive rate hikes by the U.S. Federal Reserve (the “Fed”). From a peak of 9.1% in June 2022, the annualized U.S. inflation rate dropped to 7.1% in November 2022, and to 3.2% in October 2023. At the same time, the Fed increased the benchmark federal funds rate from 3.75%–4.00% at the beginning of the reporting period to 5.25%–5.50% as of October 31, 2023. As the pace of rate increases slowed during the period, investors hoped for an early shift to a looser monetary policy. However, comments from Fed members late in the period reinforced the central bank’s hawkish stance in response to surprisingly robust U.S. economic growth and rising wage pressures, thus increasing the likelihood that interest rates would stay higher for longer. International developed markets exhibited similar dynamics of elevated inflation and rising interest rates.
Despite the backdrop of high interest rates—along with political dysfunction in Washington D.C. and intensifying global geopolitical instability—equity markets managed to advance, supported by healthy consumer spending trends and persistent domestic economic growth. The S&P 500® Index, a widely regarded benchmark of large-cap U.S. market performance, gained ground, bolstered by the strong performance of energy stocks amid surging petroleum prices and mega-cap, growth-oriented, technology-related shares, which rose as investors flocked to companies creating the infrastructure for developments in artificial intelligence. Smaller-cap stocks and value-oriented shares produced milder returns. Among industry sectors, energy and
information technology posted the strongest gains. Real estate declined most sharply under pressure from rising mortgage rates and weak levels of office occupancy. Developed international markets outperformed U.S. markets, with Europe benefiting during the first half of the period from unexpected economic resilience in the face of rising energy prices and the ongoing war in Ukraine. Emerging markets posted positive results but lagged developed markets, largely due to slow economic growth in China despite the relaxation of pandemic-era lockdowns.
Bond prices were driven lower by rising yields and increasing expectations of high interest rates for an extended period of time. The U.S. yield curve steepened, with the 30-year Treasury yield exceeding 5% for the first time in more than a decade. The yield curve remained inverted, with the 10-year Treasury yield ending the period at 4.88%, compared with 5.07% for the 2-year Treasury yield. Corporate bonds outperformed long-term Treasury bonds, but still trended lower under pressure from rising yields and an uptick in default rates. Among corporates, lower-credit-quality instruments performed slightly better than their higher-credit-quality counterparts, while floating rate securities performed better still.
In the face of today’s uncertain market environment, New York Life Investments remains dedicated to providing the guidance, resources and investment solutions you need to pursue your financial goals.
Thank you for trusting us to help meet your investment needs.
Sincerely,
Kirk C. Lehneis
President
The opinions expressed are as of the date of this report and are subject to change. There is no guarantee that any forecast made will come to pass. This material does not constitute investment advice and is not intended as an endorsement of any specific investment. Past performance is no guarantee of future results.
Not part of the Annual Report
Investors should refer to the Fund’s Summary Prospectus and/or Prospectus and consider the Fund’s investment objectives, strategies, risks, charges and expenses carefully before investing. The Summary Prospectus and/or Prospectus contain this and other information about the Fund. You may obtain copies of the Fund’s Summary Prospectus, Prospectus and Statement of Additional Information, which includes information about the MainStay Funds Trust's Trustees, free of charge, upon request, by calling toll-free 800-624-6782, by writing to NYLIFE Distributors LLC, Attn: MainStay Marketing Department, 30 Hudson Street, Jersey City, NJ 07302 or by sending an e-mail to MainStayShareholderServices@nylim.com. These documents are also available via the MainStay Funds’ website at newyorklifeinvestments.com. Please read the Fund’s Summary Prospectus and/or Prospectus carefully before investing.
Investment and Performance Comparison (Unaudited)
Performance data quoted represents past performance. Past performance is no guarantee of future results. Because of market volatility and other factors, current performance may be lower or higher than the figures shown. Investment return and principal value will fluctuate, and as a result, when shares are redeemed, they may be worth more or less than their original cost. The graph below depicts the historical performance of Class I shares of the Fund. Performance will vary from class to class based on differences in class-specific expenses and sales charges. For performance information current to the most recent month-end, please call 800-624-6782 or visit newyorklifeinvestments.com.
The performance table and graph do not reflect the deduction of taxes that a shareholder would pay on distributions or Fund share redemptions. Total returns reflect maximum applicable sales charges as indicated in the table below, if any, changes in share price, and reinvestment of dividend and capital gain distributions. The graph assumes the initial investment amount shown below and reflects the deduction of all sales charges that would have applied for the period of investment. Performance figures may reflect certain fee waivers and/or expense limitations, without which total returns may have been lower. For more information on share classes and current fee waivers and/or expense limitations (if any), please refer to the Notes to Financial Statements.
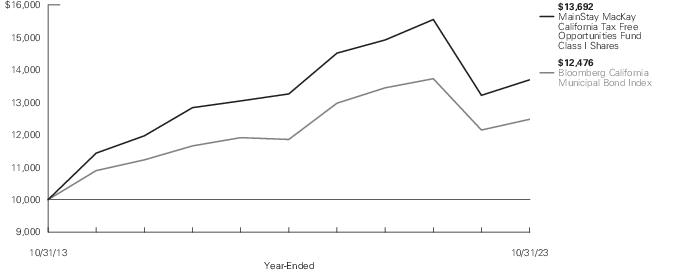
| Average Annual Total Returns for the Year-Ended October 31, 2023 |
| Class | Sales Charge | | Inception
Date | One
Year | Five
Years | Ten Years
or Since
Inception | Gross
Expense
Ratio1 |
| Class A Shares2 | Maximum 3.00% Initial Sales Charge | With sales charges | 2/28/2013 | 0.24% | -0.53% | 2.45% | 0.76% |
| | | Excluding sales charges | | 3.34 | 0.39 | 2.92 | 0.76 |
| Investor Class Shares3, 4 | Maximum 2.50% Initial Sales Charge | With sales charges | 2/28/2013 | 0.73 | -0.55 | 2.41 | 0.78 |
| | | Excluding sales charges | | 3.31 | 0.37 | 2.89 | 0.78 |
| Class C Shares | Maximum 1.00% CDSC | With sales charges | 2/28/2013 | 2.05 | 0.12 | 2.61 | 1.03 |
| | if Redeemed Within One Year of Purchase | Excluding sales charges | | 3.05 | 0.12 | 2.61 | 1.03 |
| Class C2 Shares | Maximum 1.00% CDSC | With sales charges | 8/31/2020 | 1.89 | N/A | -3.40 | 1.18 |
| | if Redeemed Within One Year of Purchase | Excluding sales charges | | 2.89 | N/A | -3.40 | 1.18 |
| Class I Shares | No Sales Charge | | 2/28/2013 | 3.60 | 0.65 | 3.19 | 0.51 |
| Class R6 Shares | No Sales Charge | | 11/1/2019 | 3.49 | N/A | -1.43 | 0.49 |
| 1. | The gross expense ratios presented reflect the Fund’s “Total Annual Fund Operating Expenses” from the most recent Prospectus, as supplemented, and may differ from other expense ratios disclosed in this report. |
| 2. | Prior to August 10, 2022, the maximum initial sales charge was 4.50%, which is reflected in the applicable average annual total return figures shown. |
| 3. | Prior to June 30, 2020, the maximum initial sales charge was 4.50%, which is reflected in the applicable average annual total return figures shown. |
| 4. | Prior to August 10, 2022, the maximum initial sales charge was 4.00%, which is reflected in the applicable average annual total return figures shown. |
The footnotes on the next page are an integral part of the table and graph and should be carefully read in conjunction with them.
| Benchmark Performance* | One
Year | Five
Years | Ten
Years |
| Bloomberg California Municipal Bond Index1 | 2.72% | 1.03% | 2.24% |
| Morningstar Muni California Long Category Average2 | 2.05 | 0.22 | 2.08 |
| * | Returns for indices reflect no deductions for fees, expenses or taxes, except for foreign withholding taxes where applicable. Results assume reinvestment of all dividends and capital gains. An investment cannot be made directly in an index. |
| 1. | The Bloomberg California Municipal Bond Index is the Fund's primary broad-based securities market index for comparison purposes. The Bloomberg California Municipal Bond Index is a market value-weighted index of California investment grade tax exempt fixed-rate municipal bonds with maturities of one year or more. |
| 2. | The Morningstar Muni California Long Category Average is representative of funds that invest at least 80% of assets in California municipal debt. These funds have durations of more than 7.0 years. Results are based on average total returns of similar funds with all dividends and capital gain distributions reinvested. |
The footnotes on the preceding page are an integral part of the table and graph and should be carefully read in conjunction with them.
| 6 | MainStay MacKay California Tax Free Opportunities Fund |
Cost in Dollars of a $1,000 Investment in MainStay MacKay California Tax Free Opportunities Fund (Unaudited)
The example below is intended to describe the fees and expenses borne by shareholders during the six-month period from May 1, 2023 to October 31, 2023, and the impact of those costs on your investment.
Example
As a shareholder of the Fund you incur two types of costs: (1) transaction costs, including exchange fees and sales charges (loads) on purchases (as applicable), and (2) ongoing costs, including management fees, distribution and/or service (12b-1) fees and other Fund expenses (as applicable). This example is intended to help you understand your ongoing costs (in dollars) of investing in the Fund and to compare these costs with the ongoing costs of investing in other mutual funds. The example is based on an investment of $1,000 made at the beginning of the six-month period and held for the entire period from May 1, 2023 to October 31, 2023.
This example illustrates your Fund’s ongoing costs in two ways:
Actual Expenses
The second and third data columns in the table below provide information about actual account values and actual expenses. You may use the information in these columns, together with the amount you invested, to estimate the expenses that you paid during the six months ended October 31, 2023. Simply divide your account value by $1,000 (for example, an
$8,600 account value divided by $1,000 = 8.6), then multiply the result by the number under the heading entitled “Expenses Paid During Period” to estimate the expenses you paid on your account during this period.
Hypothetical Example for Comparison Purposes
The fourth and fifth data columns in the table below provide information about hypothetical account values and hypothetical expenses based on the Fund’s actual expense ratio and an assumed rate of return of 5% per year before expenses, which is not the Fund’s actual return. The hypothetical account values and expenses may not be used to estimate the actual ending account balances or expenses you paid for the six-month period shown. You may use this information to compare the ongoing costs of investing in the Fund with the ongoing costs of investing in other mutual funds. To do so, compare this 5% hypothetical example with the 5% hypothetical examples that appear in the shareholder reports of the other mutual funds.
Please note that the expenses shown in the table are meant to highlight your ongoing costs only and do not reflect any transactional costs, such as exchange fees or sales charges (loads). Therefore, the fourth and fifth data columns of the table are useful in comparing ongoing costs only and will not help you determine the relative total costs of owning different funds. In addition, if these transactional costs were included, your costs would have been higher.
| Share Class | Beginning
Account
Value
5/1/23 | Ending Account
Value (Based
on Actual
Returns and
Expenses)
10/31/23 | Expenses
Paid
During
Period1 | Ending Account
Value (Based
on Hypothetical
5% Annualized
Return and
Actual Expenses)
10/31/23 | Expenses
Paid
During
Period1 | Net Expense
Ratio
During
Period2 |
| Class A Shares | $1,000.00 | $952.70 | $3.69 | $1,021.42 | $3.82 | 0.75% |
| Investor Class Shares | $1,000.00 | $951.60 | $3.84 | $1,021.27 | $3.97 | 0.78% |
| Class C Shares | $1,000.00 | $950.40 | $5.06 | $1,020.01 | $5.24 | 1.03% |
| Class C2 Shares | $1,000.00 | $949.60 | $5.80 | $1,019.26 | $6.01 | 1.18% |
| Class I Shares | $1,000.00 | $953.90 | $2.46 | $1,022.68 | $2.55 | 0.50% |
| Class R6 Shares | $1,000.00 | $953.00 | $2.36 | $1,022.79 | $2.45 | 0.48% |
| 1. | Expenses are equal to the Fund’s annualized expense ratio of each class multiplied by the average account value over the period, divided by 365 and multiplied by 184 (to reflect the six-month period). The table above represents the actual expenses incurred during the six-month period. In addition to the fees and expenses which the Fund bears directly, it also indirectly bears a pro rata share of the fees and expenses of the underlying funds in which it invests. Such indirect expenses are not included in the above-reported expense figures. |
| 2. | Expenses are equal to the Fund's annualized expense ratio to reflect the six-month period. |
Industry Composition as of October 31, 2023 (Unaudited)
| General Obligation | 33.1% |
| Other Revenue | 21.1 |
| Transportation | 14.4 |
| Water & Sewer | 8.7 |
| Education | 4.5 |
| General | 4.2 |
| Hospital | 4.0 |
| Utilities | 3.0% |
| Housing | 1.8 |
| Certificate of Participation/Lease | 1.4 |
| Short–Term Investment | 4.0 |
| Other Assets, Less Liabilities | –0.2 |
| | 100.0% |
See Portfolio of Investments beginning on page 11 for specific holdings within these categories. The Fund's holdings are subject to change.
Top Ten Holdings and/or Issuers Held as of October 31, 2023 (excluding short-term investments) (Unaudited)
| 1. | State of California, 4.00%-5.25%, due 11/1/28–4/1/49 |
| 2. | California Municipal Finance Authority, 3.25%-5.25%, due 8/1/26–10/1/54 |
| 3. | City of Los Angeles, 3.00%-5.50%, due 5/15/29–5/15/48 |
| 4. | California Community Choice Financing Authority, 4.00%-5.50%, due 2/1/52–10/1/54 |
| 5. | Puerto Rico Commonwealth Aqueduct & Sewer Authority, 5.00%, due 7/1/33–7/1/47 |
| 6. | Commonwealth of Puerto Rico, 4.00%-5.75%, due 7/1/27–7/1/35 |
| 7. | California Infrastructure & Economic Development Bank, 3.00%-5.00%, due 10/1/40–1/1/56 |
| 8. | San Francisco City & County Airport Commission, 4.00%-5.75%, due 5/1/40–5/1/52 |
| 9. | Southern California Public Power Authority, 5.244%-5.25%, due 11/1/38–7/1/53 |
| 10. | Puerto Rico Sales Tax Financing Corp., (zero coupon)-5.00%, due 7/1/34–7/1/58 |
| 8 | MainStay MacKay California Tax Free Opportunities Fund |
Portfolio Management Discussion and Analysis (Unaudited)
Questions answered by portfolio managers John Loffredo, CFA, Robert DiMella, CFA, Michael Petty, David Dowden, Scott Sprauer, Frances Lewis and Michael Denlinger, CFA, of MacKay Shields LLC, the Fund’s Subadvisor.
How did MainStay MacKay California Tax Free Opportunities Fund perform relative to its benchmark and peer group during the 12 months ended October 31, 2023?
For the 12 months ended October 31, 2023, Class I shares of MainStay MacKay California Tax Free Opportunities Fund returned 3.60%, outperforming the 2.72% return of the Fund’s benchmark, the Bloomberg California Municipal Bond Index (the "Index"). Over the same period, Class I shares also outperformed the 2.05% return of the Morningstar Muni California Long Category Average.1
What factors affected the Fund’s relative performance during the reporting period?
The Fund outperformed the Index during the reporting period partly due to strong security selection. In addition, the Fund’s overweight exposure to bonds maturing beyond 15 years made a positive contribution to relative return. (Contributions take weightings and total returns into account.) Regarding coupon structure, an overweight allocation to and security selection among 4+% bonds aided on a relative basis. From a geographic perspective, overweight exposure to out-of-Index U.S. Territories—in particular, Puerto Rico—contributed on a relative basis. From a credit perspective, underweight exposure to AA-rated credits,2 as well as security selection among non-rated bonds, also contributed to relative performance. Also, the Fund engaged in significant tax-loss harvesting. This created losses that can be carried forward to offset future gains in the Fund. This activity also resulted in creating a higher book yield for the Fund.
During the reporting period, how was the Fund’s performance materially affected by investments in derivatives?
The Fund, at times, will employ a Treasury futures hedge, typically as a paired strategy with longer maturity bonds, to dampen duration3 and interest-rate sensitivity. During the reporting period, the Fund’s allocation was minimal.
What was the Fund’s duration strategy during the reporting period?
The Fund’s duration was targeted to remain in a neutral range relative to the Fund’s investable universe as outlined in the prospectus. In addition to investment-grade California bonds, the Fund may also invest in bonds of U.S. territories (Puerto Rico, Guam and the U.S. Virgin Islands) and up to 20% of net assets in securities below investment grade. Since the Fund’s investable universe is broader than the Index, the Fund’s duration may also differ from that of the Index. The Fund ended the reporting period with a longer duration posture than the Index. As of October 31, 2023, the Fund's modified duration4 to worst was 8.09 years, while the Index’s modified duration to worst was 6.61 years.
During the reporting period, which sectors were the strongest positive contributors to the Fund’s relative performance and which sectors were particularly weak?
During the reporting period, overweight positioning in the local general obligation and special tax sectors produced the largest relative outperformance; however, an underweight allocation to the electric sector offset some of those gains.
How did the Fund’s sector weighting change during the reporting period?
During the reporting period, there were no material changes to the weightings in the Fund. The Fund increased its allocations to the electric and IDR/PCR (industry development revenue/pollution control revenue) sectors. In addition, the Fund increased its exposure to the long end of the yield curve.5 Conversely, there was a decrease to the Fund’s exposure to the local general obligation sector.
| 1. | See "Investment and Performance Comparison" for other share class returns, which may be higher or lower than Class I share returns, and for more information on benchmark and peer group returns. |
| 2. | An obligation rated ‘AA’ by Standard & Poor’s (“S&P”) is deemed by S&P to differ from the highest-rated obligations only to a small degree. In the opinion of S&P, the obligor's capacity to meet its financial commitment on the obligation is very strong. When applied to Fund holdings, ratings are based solely on the creditworthiness of the bonds in the portfolio and are not meant to represent the security or safety of the Fund. |
| 3. | Duration is a measure of the price sensitivity of a fixed-income investment to changes in interest rates. Duration is expressed as a number of years and is considered a more accurate sensitivity gauge than average maturity. |
| 4. | Modified duration is inversely related to the approximate percentage change in price for a given change in yield. Duration to worst is the duration of a bond computed using the bond’s nearest call date or maturity. This measure ignores future cash flow fluctuations due to embedded optionality. |
| 5. | The yield curve is a line that plots the yields of various securities of similar quality—typically U.S. Treasury issues—across a range of maturities. The U.S. Treasury yield curve serves as a benchmark for other debt and is used in economic forecasting. |
How was the Fund positioned at the end of the reporting period?
As of October 31, 2023, the Fund continued to hold overweight exposure to the long end of the curve where municipal yields are more attractive. In addition, the Fund held an overweight allocation to the special tax and local general obligation sectors. From a ratings perspective, the Fund held overweight exposure to AAA-rated6 bonds, due to their relatively strong financial condition, while available at much higher yields. In addition, the Fund held overweight exposure to bonds from Puerto Rico and non-rated bonds, which are not included in the Index. As of the same date, the Fund held underweight exposure to the state general obligation and prerefunded/ETM (escrowed to maturity) sectors.
| 6. | An obligation rated ‘AAA’ has the highest rating assigned by S&P, and in the opinion of S&P, the obligor’s capacity to meet its financial commitment on the obligation is extremely strong. When applied to Fund holdings, ratings are based solely on the creditworthiness of the bonds in the portfolio and are not meant to represent the security or safety of the Fund. |
The opinions expressed are those of the portfolio managers as of the date of this report and are subject to change. There is no guarantee that any forecasts will come to pass. This material does not constitute investment advice and is not intended as an endorsement of any specific investment.
| 10 | MainStay MacKay California Tax Free Opportunities Fund |
Portfolio of Investments October 31, 2023†^
| | Principal
Amount | Value |
| Municipal Bonds 96.2% |
| Long-Term Municipal Bonds 96.2% |
| Certificate of Participation/Lease 1.4% |
| California Municipal Finance Authority, Palomar Health Obligated Group, Certificate of Participation | | |
| Series A, Insured: AGM | | |
| 5.25%, due 11/1/52 | $ 6,380,000 | $ 6,467,030 |
| Hayward Unified School District, Certificate of Participation | | |
| 5.25%, due 8/1/47 | 6,900,000 | 6,880,716 |
| Oxnard School District, Property Acquisition and Improvement Project, Certificate of Participation | | |
| Insured: BAM | | |
| 5.00%, due 8/1/45 (a) | 950,000 | 962,098 |
| | | 14,309,844 |
| Education 4.5% |
| California Educational Facilities Authority, Loyola Marymount University, Green Bond, Revenue Bonds | | |
| Series B | | |
| 5.00%, due 10/1/31 | 525,000 | 539,531 |
| California Infrastructure & Economic Development Bank, Equitable School Revolving Fund LLC Obligated Group, Revenue Bonds | | |
| Series B | | |
| 5.00%, due 11/1/44 | 350,000 | 335,510 |
| Series B | | |
| 5.00%, due 11/1/49 | 500,000 | 466,982 |
| California Infrastructure & Economic Development Bank, WFCS Portfolio Projects, Revenue Bonds (b) | | |
| Series A-1 | | |
| 5.00%, due 1/1/55 | 2,540,000 | 1,806,220 |
| Series A-1 | | |
| 5.00%, due 1/1/56 | 840,000 | 594,576 |
| California Municipal Finance Authority, Charter School, King Chavez Academy, Revenue Bonds (b) | | |
| Series A | | |
| 5.00%, due 5/1/36 | 1,275,000 | 1,191,661 |
| Series A | | |
| 5.00%, due 5/1/46 | 1,325,000 | 1,159,613 |
| | Principal
Amount | Value |
| |
| Education (continued) |
| California Municipal Finance Authority, Charter School, Palmdale Aerospace Academy Projects (The), Revenue Bonds (b) | | |
| Series A | | |
| 5.00%, due 7/1/36 | $ 1,300,000 | $ 1,222,469 |
| Series A | | |
| 5.00%, due 7/1/46 | 795,000 | 677,053 |
| California Municipal Finance Authority, Claremont Graduate University, Revenue Bonds | | |
| Series B | | |
| 5.00%, due 10/1/54 (b) | 1,380,000 | 1,145,101 |
| California Municipal Finance Authority, Creative Center Los Altos Project (The), Revenue Bonds (b) | | |
| Series B | | |
| 4.00%, due 11/1/36 | 400,000 | 321,941 |
| Series B | | |
| 4.50%, due 11/1/46 | 1,600,000 | 1,203,727 |
| California Municipal Finance Authority, Southern California Institute of Architecture Project, Revenue Bonds | | |
| 5.00%, due 12/1/38 | 845,000 | 827,625 |
| California Municipal Finance Authority, University of San Diego, Revenue Bonds | | |
| Series A | | |
| 5.00%, due 10/1/44 | 3,065,000 | 3,075,758 |
| Series A | | |
| 5.00%, due 10/1/49 | 4,440,000 | 4,395,613 |
| California Public Finance Authority, California University of Science & Medicine Obligated Group, Revenue Bonds | | |
| Series A | | |
| 6.25%, due 7/1/54 (b) | 1,000,000 | 1,021,360 |
| California School Finance Authority, Aspire Public Schools Obligated Group, Revenue Bonds (b) | | |
| 5.00%, due 8/1/27 | 475,000 | 477,646 |
| 5.00%, due 8/1/28 | 650,000 | 653,760 |
| 5.00%, due 8/1/36 | 550,000 | 544,145 |
| 5.00%, due 8/1/41 | 700,000 | 662,339 |
| 5.00%, due 8/1/46 | 900,000 | 822,164 |
The notes to the financial statements are an integral part of, and should be read in conjunction with, the financial statements.
11
Portfolio of Investments October 31, 2023†^ (continued)
| | Principal
Amount | Value |
| Long-Term Municipal Bonds (continued) |
| Education (continued) |
| California School Finance Authority, Classical Academies Project, Revenue Bonds | | |
| Series A | | |
| 5.00%, due 10/1/37 (b) | $ 1,485,000 | $ 1,433,098 |
| California School Finance Authority, Grimmway Schools Obligated Group, Revenue Bonds (b) | | |
| Series A | | |
| 4.25%, due 7/1/28 | 1,240,000 | 1,193,728 |
| Series A | | |
| 5.00%, due 7/1/46 | 750,000 | 662,749 |
| California School Finance Authority, High Tech High Learning Project, Revenue Bonds (b) | | |
| Series A | | |
| 5.00%, due 7/1/37 | 500,000 | 451,616 |
| Series A | | |
| 5.00%, due 7/1/49 | 500,000 | 417,783 |
| California School Finance Authority, Kipp Social Public Schools Project, Revenue Bonds | | |
| Series A | | |
| 5.00%, due 7/1/34 (b) | 600,000 | 601,745 |
| California School Finance Authority, Partnerships to Uplift Communities, Revenue Bonds | | |
| 5.50%, due 8/1/47 (b) | 525,000 | 481,401 |
| California School Finance Authority, Teach Public Schools, Revenue Bonds (b) | | |
| Series A | | |
| 5.00%, due 6/1/39 | 740,000 | 669,204 |
| Series A | | |
| 5.00%, due 6/1/58 | 600,000 | 484,979 |
| California School Finance Authority, Vista Charter Public Schools, Revenue Bonds | | |
| Series A | | |
| 4.00%, due 6/1/51 (b) | 1,790,000 | 1,242,072 |
| California Statewide Communities Development Authority, Lancer Plaza Project, Revenue Bonds | | |
| 5.875%, due 11/1/43 | 1,000,000 | 945,544 |
| | Principal
Amount | Value |
| |
| Education (continued) |
| Irvine Unified School District, Community Facilities District No. 9, Special Tax | | |
| Series A | | |
| 5.00%, due 9/1/36 | $ 545,000 | $ 555,275 |
| Poway Unified School District, Community Facilities District No. 15, Special Tax | | |
| Insured: BAM | | |
| 5.25%, due 9/1/52 | 1,750,000 | 1,747,448 |
| University of California, Revenue Bonds | | |
| Series AV | | |
| 5.25%, due 5/15/42 | 5,000,000 | 5,135,470 |
| Series BN | | |
| 5.50%, due 5/15/40 | 5,700,000 | 6,289,928 |
| | | 45,456,834 |
| General 4.2% |
| California Statewide Communities Development Authority, Special Assessment | | |
| Series A | | |
| 4.00%, due 9/2/50 | 1,000,000 | 742,663 |
| Series D | | |
| 5.50%, due 9/2/53 | 1,000,000 | 900,104 |
| California Statewide Communities Development Authority, Community Facilities District No. 2021-02, Special Tax | | |
| 5.00%, due 9/1/53 | 1,000,000 | 910,528 |
| Cathedral City Redevelopment Agency Successor Agency, Merged Redevelopment Project Area, Tax Allocation | | |
| Series A, Insured: AGM | | |
| 5.00%, due 8/1/34 | 1,000,000 | 1,004,281 |
| City of Irvine, Community Facilities District No. 2013-3, Special Tax | | |
| 5.00%, due 9/1/49 | 1,385,000 | 1,310,157 |
| City of Irvine, Community Facilities District No. 2013-3 Improvement Area No. 1, Special Tax | | |
| Insured: BAM | | |
| 4.00%, due 9/1/58 | 2,750,000 | 2,282,063 |
| Insured: BAM | | |
| 5.25%, due 9/1/53 | 3,000,000 | 3,123,367 |
The notes to the financial statements are an integral part of, and should be read in conjunction with, the financial statements.
| 12 | MainStay MacKay California Tax Free Opportunities Fund |
| | Principal
Amount | Value |
| Long-Term Municipal Bonds (continued) |
| General (continued) |
| City of Palm Desert, University Park, Special Tax | | |
| 3.00%, due 9/1/31 | $ 315,000 | $ 272,042 |
| 4.00%, due 9/1/41 | 450,000 | 365,594 |
| City of Rocklin, Community Facilities District No. 10, Special Tax | | |
| 5.00%, due 9/1/39 | 1,125,000 | 1,109,500 |
| City of San Mateo, Community Facilities District No. 2008-1, Special Tax | | |
| Series 1, Insured: BAM | | |
| 5.25%, due 9/1/40 | 4,000,000 | 4,026,930 |
| City of South San Francisco, Community Facilities District No. 2021-01, Special Tax | | |
| 4.00%, due 9/1/44 | 400,000 | 318,506 |
| Irvine Facilities Financing Authority, Community Facilities District No. 2013-3, Special Tax | | |
| Series A, Insured: BAM | | |
| 5.25%, due 9/1/53 | 12,000,000 | 12,474,317 |
| Mountain View Shoreline Regional Park Community, Tax Allocation | | |
| Series A, Insured: AGM | | |
| 5.00%, due 8/1/36 | 1,645,000 | 1,708,255 |
| River Islands Public Financing Authority, Community Facilities District No. 2003-1, Special Tax | | |
| Series A-1, Insured: AGM | | |
| 5.00%, due 9/1/42 | 1,500,000 | 1,537,740 |
| Series A-1, Insured: AGM | | |
| 5.25%, due 9/1/52 | 1,000,000 | 1,025,676 |
| Romoland School District, Community Facilities District No. 2017-1 Improvement Area 2, Special Tax | | |
| 5.00%, due 9/1/54 | 1,600,000 | 1,429,336 |
| Sacramento Area Flood Control Agency, Consolidated Capital Assessment District No. 2, Special Assessment | | |
| 4.00%, due 10/1/47 | 3,700,000 | 3,236,805 |
| San Francisco City & County Redevelopment Agency Successor Agency, Transbay Infrastructure Project, Tax Allocation, Third Lien | | |
| Series B, Insured: AGM | | |
| 5.00%, due 8/1/48 | 1,500,000 | 1,516,721 |
| | Principal
Amount | Value |
| |
| General (continued) |
San Francisco City & County Redevelopment Agency Successor Agency, Transbay Infrastructure Project, Tax Allocation, Third Lien
(continued) | | |
| Series B, Insured: AGM | | |
| 5.25%, due 8/1/53 | $ 1,400,000 | $ 1,439,862 |
| Tracy Community Facilities District, Special Tax | | |
| 5.75%, due 9/1/48 (c) | 1,000,000 | 976,671 |
| | | 41,711,118 |
| General Obligation 33.1% |
| Alhambra Unified School District, Unlimited General Obligation | | |
| Series B | | |
| 4.25%, due 8/1/43 | 2,000,000 | 1,882,517 |
| Series B | | |
| 5.25%, due 8/1/48 | 3,000,000 | 3,151,576 |
| Cabrillo Unified School District, Election of 2018, Unlimited General Obligation | | |
| Series B, Insured: AGM-CR | | |
| 5.00%, due 8/1/50 | 3,150,000 | 3,173,483 |
| Ceres Unified School District, Unlimited General Obligation | | |
| Insured: BAM | | |
| (zero coupon), due 8/1/37 | 500,000 | 258,223 |
| Chabot-Las Positas Community College District, Unlimited General Obligation | | |
| Series C | | |
| 5.25%, due 8/1/48 | 1,250,000 | 1,312,071 |
| City of Berkeley, Unlimited General Obligation | | |
| 2.00%, due 9/1/39 | 1,560,000 | 981,774 |
| 2.00%, due 9/1/40 | 1,590,000 | 974,294 |
| Clovis Unified School District, Unlimited General Obligation | | |
| Series B | | |
| 5.25%, due 8/1/41 | 1,100,000 | 1,145,282 |
| Series B | | |
| 5.25%, due 8/1/42 | 1,000,000 | 1,037,772 |
| Coalinga-Huron Joint Unified School District, Election of 2016, Unlimited General Obligation | | |
| Series B, Insured: BAM | | |
| 5.00%, due 8/1/48 | 3,250,000 | 3,266,928 |
The notes to the financial statements are an integral part of, and should be read in conjunction with, the financial statements.
13
Portfolio of Investments October 31, 2023†^ (continued)
| | Principal
Amount | Value |
| Long-Term Municipal Bonds (continued) |
| General Obligation (continued) |
| Commonwealth of Puerto Rico, Unlimited General Obligation | | |
| Series A-1 | | |
| 4.00%, due 7/1/33 | $ 10,000,000 | $ 8,715,635 |
| Series A-1 | | |
| 4.00%, due 7/1/35 | 3,350,000 | 2,815,979 |
| Series A-1 | | |
| 5.625%, due 7/1/27 | 8,000,000 | 8,144,816 |
| Series A-1 | | |
| 5.625%, due 7/1/29 | 2,000,000 | 2,046,495 |
| Series A-1 | | |
| 5.75%, due 7/1/31 | 1,800,000 | 1,854,898 |
| Denair Unified School District, Election of 2007, Unlimited General Obligation | | |
| Insured: AGM | | |
| (zero coupon), due 8/1/41 | 4,260,000 | 1,649,852 |
| El Rancho Unified School District, Election of 2016, Unlimited General Obligation | | |
| Series A, Insured: BAM | | |
| 5.25%, due 8/1/46 | 2,745,000 | 2,775,199 |
| El Segundo Unified School District, Election of 2018, Unlimited General Obligation | | |
| Series C | | |
| 4.00%, due 8/1/50 | 500,000 | 433,706 |
| Elk Grove Unified School District, Unlimited General Obligation | | |
| 2.00%, due 8/1/40 | 3,740,000 | 2,338,847 |
| Etiwanda School District, Unlimited General Obligation | | |
| Series C | | |
| 5.25%, due 8/1/52 | 5,675,000 | 5,840,298 |
| Fort Bragg Unified School District, Election of 2020, Unlimited General Obligation | | |
| Series B | | |
| 5.50%, due 8/1/52 | 1,000,000 | 1,022,133 |
| Fremont Union High School District, Unlimited General Obligation | | |
| Series B | | |
| 5.00%, due 8/1/32 | 3,260,000 | 3,437,278 |
| | Principal
Amount | Value |
| |
| General Obligation (continued) |
| Glendale Community College District, Election of 2016, Unlimited General Obligation | | |
| Series B | | |
| 3.00%, due 8/1/47 | $ 4,500,000 | $ 3,088,880 |
| Hartnell Community College District, Unlimited General Obligation | | |
| Series A | | |
| (zero coupon), due 8/1/37 | 2,500,000 | 1,262,004 |
| Healdsburg Unified School District, Unlimited General Obligation | | |
| Series A | | |
| 4.60%, due 8/1/37 | 4,405,000 | 4,431,336 |
| Inglewood Unified School District, Election of 2012, Unlimited General Obligation | | |
| Series B, Insured: BAM | | |
| 5.00%, due 8/1/35 | 800,000 | 826,274 |
| Inglewood Unified School District, Election of 2020, Unlimited General Obligation | | |
| Series A, Insured: AGM | | |
| 4.00%, due 8/1/51 | 2,750,000 | 2,317,275 |
| Jurupa Unified School District, Unlimited General Obligation | | |
| Series B | | |
| 5.00%, due 8/1/37 | 1,000,000 | 1,028,691 |
| Jurupa Unified School District, Election 2014, Unlimited General Obligation | | |
| Series C | | |
| 5.25%, due 8/1/43 | 2,000,000 | 2,063,872 |
| Kern Community College District, Election of 2016, Unlimited General Obligation | | |
| Series C | | |
| 3.00%, due 8/1/46 | 5,000,000 | 3,473,868 |
| Series C, Insured: BAM | | |
| 3.00%, due 8/1/46 | 5,500,000 | 3,853,118 |
| Series D | | |
| 5.25%, due 8/1/33 | 1,000,000 | 1,129,787 |
| Series D | | |
| 5.25%, due 8/1/34 | 700,000 | 787,537 |
| Series D | | |
| 5.25%, due 8/1/38 | 2,000,000 | 2,181,895 |
| Series D | | |
| 5.25%, due 8/1/39 | 1,400,000 | 1,520,439 |
The notes to the financial statements are an integral part of, and should be read in conjunction with, the financial statements.
| 14 | MainStay MacKay California Tax Free Opportunities Fund |
| | Principal
Amount | Value |
| Long-Term Municipal Bonds (continued) |
| General Obligation (continued) |
| Kern Community College District, Election of 2016, Unlimited General Obligation (continued) | | |
| Series D | | |
| 5.25%, due 8/1/40 | $ 2,200,000 | $ 2,378,063 |
| Kern Community College District, Safety Repair & Improvement, Unlimited General Obligation | | |
| Series C | | |
| 5.75%, due 11/1/34 | 650,000 | 650,000 |
| La Mesa-Spring Valley School District, Unlimited General Obligation | | |
| Series B | | |
| 5.00%, due 8/1/47 | 1,100,000 | 1,109,752 |
| Long Beach Community College District, Unlimited General Obligation | | |
| Series C | | |
| 4.00%, due 8/1/49 | 3,000,000 | 2,609,020 |
| Long Beach Unified School District, Unlimited General Obligation | | |
| Series C | | |
| 4.00%, due 8/1/50 | 18,000,000 | 15,717,643 |
| Los Angeles Community College District, Election of 2008, Unlimited General Obligation | | |
| Series I | | |
| 4.00%, due 8/1/34 | 4,000,000 | 4,014,066 |
| Los Angeles Community College District, Election of 2022, Unlimited General Obligation | | |
| Series A-2 | | |
| 5.50%, due 8/1/24 | 3,000,000 | 2,997,561 |
| Los Angeles Unified School District, Unlimited General Obligation | | |
| Series A | | |
| 5.00%, due 7/1/25 | 1,250,000 | 1,276,301 |
| Series A | | |
| 5.00%, due 7/1/32 | 1,500,000 | 1,625,906 |
| Series A | | |
| 5.00%, due 7/1/33 | 1,000,000 | 1,080,577 |
| Series QRR | | |
| 5.25%, due 7/1/40 | 3,500,000 | 3,782,004 |
| Series QRR | | |
| 5.25%, due 7/1/47 | 7,500,000 | 7,878,994 |
| | Principal
Amount | Value |
| |
| General Obligation (continued) |
| Los Banos Unified School District, Election of 2018, Unlimited General Obligation | | |
| 5.25%, due 8/1/49 | $ 2,500,000 | $ 2,594,572 |
| Marysville Joint Unified School District, Election 2008, Unlimited General Obligation | | |
| Insured: AGM | | |
| (zero coupon), due 8/1/35 | 1,500,000 | 851,661 |
| Insured: AGM | | |
| (zero coupon), due 8/1/36 | 2,000,000 | 1,063,308 |
| Insured: AGM | | |
| (zero coupon), due 8/1/37 | 2,000,000 | 988,485 |
| Montebello Unified School District, Unlimited General Obligation | | |
| Series B, Insured: AGM | | |
| 5.50%, due 8/1/47 | 1,500,000 | 1,560,654 |
| Mount San Antonio Community College District, Unlimited General Obligation | | |
| Series A | | |
| 4.00%, due 8/1/49 | 2,000,000 | 1,772,108 |
| Mount San Jacinto Community College District, Election 2014, Unlimited General Obligation | | |
| Series B | | |
| 4.00%, due 8/1/38 | 1,985,000 | 1,875,367 |
| Needles Unified School District, Capital Appreciation, Election 2008, Unlimited General Obligation | | |
| Series B, Insured: AGM | | |
| (zero coupon), due 8/1/45 | 1,250,000 | 890,190 |
| North Orange County Community College District, Election of 2014, Unlimited General Obligation | | |
| Series C | | |
| 4.00%, due 8/1/47 | 4,750,000 | 4,187,207 |
| Norwalk-La Mirada Unified School District, Election of 2014, Unlimited General Obligation | | |
| Series E | | |
| 3.00%, due 8/1/46 | 1,600,000 | 1,102,484 |
| Ocean View School District of Orange County, Unlimited General Obligation | | |
| Series C, Insured: AGM | | |
| 3.00%, due 8/1/47 | 3,040,000 | 2,035,076 |
The notes to the financial statements are an integral part of, and should be read in conjunction with, the financial statements.
15
Portfolio of Investments October 31, 2023†^ (continued)
| | Principal
Amount | Value |
| Long-Term Municipal Bonds (continued) |
| General Obligation (continued) |
| Ojai Unified School District, Unlimited General Obligation | | |
| Series B, Insured: AGM | | |
| 5.25%, due 8/1/48 | $ 1,100,000 | $ 1,133,414 |
| Series B, Insured: AGM | | |
| 5.50%, due 8/1/53 | 1,750,000 | 1,827,915 |
| Ontario Montclair School District, Election of 2016, Unlimited General Obligation | | |
| Series A | | |
| 5.00%, due 8/1/46 | 7,765,000 | 7,864,234 |
| Series C | | |
| 5.25%, due 8/1/52 | 3,125,000 | 3,238,294 |
| Palomar Community College District, Election of 2006, Unlimited General Obligation | | |
| Series B | | |
| (zero coupon), due 8/1/39 | 2,000,000 | 2,051,802 |
| Series D | | |
| 5.25%, due 8/1/45 | 3,500,000 | 3,577,313 |
| Ravenswood City School District, Election 2018, Unlimited General Obligation | | |
| Insured: AGM | | |
| 5.25%, due 8/1/45 | 3,500,000 | 3,614,165 |
| Redwood City School District, Election 2015, Unlimited General Obligation | | |
| 5.25%, due 8/1/44 | 2,000,000 | 2,067,382 |
| Rio Hondo Community College District, Election 2004, Unlimited General Obligation | | |
| Series C | | |
| (zero coupon), due 8/1/42 | 2,000,000 | 2,230,342 |
| Sacramento City Unified School District, Election of 2020, Unlimited General Obligation | | |
| Series A, Insured: BAM | | |
| 5.50%, due 8/1/52 | 4,500,000 | 4,677,644 |
| Salinas Union High School District, Unlimited General Obligation | | |
| Series A | | |
| 4.00%, due 8/1/47 | 4,300,000 | 3,767,303 |
| San Diego Unified School District, Election of 2012, Unlimited General Obligation | | |
| Series R-2 | | |
| (zero coupon), due 7/1/41 | 4,360,000 | 3,575,874 |
| | Principal
Amount | Value |
| |
| General Obligation (continued) |
| San Diego Unified School District, Election of 2012, Unlimited General Obligation (continued) | | |
| Series B-4 | | |
| 5.00%, due 7/1/40 | $ 2,690,000 | $ 2,863,067 |
| San Diego Unified School District, Election of 2018, Unlimited General Obligation | | |
| Series F-2 | | |
| 5.00%, due 7/1/40 | 3,020,000 | 3,193,469 |
| San Diego Unified School District, Election of 2022, Unlimited General Obligation | | |
| Series A-3 | | |
| 4.00%, due 7/1/53 | 6,640,000 | 5,650,036 |
| Series A-3 | | |
| 5.00%, due 7/1/48 | 2,665,000 | 2,766,222 |
| San Francisco Bay Area Rapid Transit District, Election of 2016, Unlimited General Obligation | | |
| Series D-1 | | |
| 5.25%, due 8/1/47 | 6,750,000 | 7,109,305 |
| San Jose Evergreen Community College District, Election of 2016, Unlimited General Obligation | | |
| Series C-1 | | |
| 4.997%, due 9/1/25 | 1,250,000 | 1,244,016 |
| Series C | | |
| 5.00%, due 9/1/39 | 3,000,000 | 3,169,465 |
| Series C | | |
| 5.00%, due 9/1/40 | 2,575,000 | 2,703,749 |
| San Juan Unified School District, Election 2016, Unlimited General Obligation | | |
| 5.00%, due 8/1/36 | 1,500,000 | 1,604,418 |
| 5.00%, due 8/1/38 | 1,800,000 | 1,893,852 |
| San Juan Unified School District, Election of 2012, Unlimited General Obligation | | |
| Series N | | |
| 4.00%, due 8/1/31 | 1,975,000 | 1,975,105 |
| San Luis Obispo County Community College District, Unlimited General Obligation | | |
| Series B | | |
| 4.00%, due 8/1/43 | 2,250,000 | 2,037,696 |
The notes to the financial statements are an integral part of, and should be read in conjunction with, the financial statements.
| 16 | MainStay MacKay California Tax Free Opportunities Fund |
| | Principal
Amount | Value |
| Long-Term Municipal Bonds (continued) |
| General Obligation (continued) |
| San Mateo Foster City School District, Unlimited General Obligation | | |
| Series B | | |
| 5.00%, due 8/1/40 | $ 1,000,000 | $ 1,064,072 |
| Series B | | |
| 5.00%, due 8/1/41 | 1,150,000 | 1,216,374 |
| San Rafael City Elementary School District, Election of 2022, Unlimited General Obligation | | |
| Series A | | |
| 5.25%, due 8/1/52 | 1,250,000 | 1,298,302 |
| San Rafael City High School District, Election of 2022, Unlimited General Obligation | | |
| Series A | | |
| 5.25%, due 8/1/52 | 4,250,000 | 4,401,751 |
| San Ysidro School District, Unlimited General Obligation | | |
| Insured: AGM | | |
| (zero coupon), due 8/1/47 | 3,000,000 | 826,944 |
| Santa Barbara Unified School District, Election of 2010, Unlimited General Obligation | | |
| Series A | | |
| 7.00%, due 8/1/36 | 1,000,000 | 1,264,735 |
| Santa Clarita Community College District, Election of 2016, Unlimited General Obligation | | |
| 5.25%, due 8/1/48 | 2,000,000 | 2,064,367 |
| South San Francisco Unified School District, Unlimited General Obligation | | |
| 4.00%, due 9/1/52 | 15,000,000 | 13,027,711 |
| State of California, Various Purpose, Unlimited General Obligation | | |
| 4.00%, due 9/1/34 | 3,500,000 | 3,463,976 |
| 4.00%, due 3/1/36 | 3,395,000 | 3,345,283 |
| 4.00%, due 10/1/36 | 4,150,000 | 4,052,262 |
| 4.00%, due 11/1/36 | 2,500,000 | 2,437,917 |
| 4.00%, due 10/1/37 | 4,000,000 | 3,835,696 |
| 4.00%, due 10/1/37 | 4,445,000 | 4,262,418 |
| 4.00%, due 11/1/38 | 4,775,000 | 4,534,012 |
| 4.00%, due 10/1/39 | 3,500,000 | 3,308,261 |
| 4.00%, due 3/1/40 | 5,000,000 | 4,665,336 |
| 4.00%, due 9/1/42 | 6,250,000 | 5,712,266 |
| 4.00%, due 4/1/49 | 1,895,000 | 1,653,496 |
| 5.00%, due 11/1/28 | 5,000,000 | 5,313,118 |
| | Principal
Amount | Value |
| |
| General Obligation (continued) |
State of California, Various Purpose, Unlimited General Obligation
(continued) | | |
| 5.00%, due 11/1/30 | $ 4,500,000 | $ 4,869,221 |
| 5.00%, due 9/1/32 | 1,840,000 | 2,002,607 |
| 5.00%, due 4/1/38 | 5,000,000 | 5,001,028 |
| 5.00%, due 9/1/41 | 3,550,000 | 3,702,241 |
| 5.25%, due 9/1/47 | 4,000,000 | 4,280,678 |
| Sunnyvale School District, Unlimited General Obligation | | |
| Series B | | |
| 5.00%, due 9/1/48 | 2,820,000 | 2,912,751 |
| Ukiah Unified School District, Election of 2020, Unlimited General Obligation | | |
| Series B, Insured: AGM | | |
| 5.50%, due 8/1/53 | 2,500,000 | 2,571,700 |
| Vista Unified School District, Election of 2018, Unlimited General Obligation | | |
| Series B, Insured: BAM | | |
| 5.25%, due 8/1/48 | 1,385,000 | 1,427,577 |
| Washington Township Health Care District, Unlimited General Obligation | | |
| Series B, Insured: AGM | | |
| 4.25%, due 8/1/45 | 825,000 | 748,509 |
| Series B, Insured: AGM | | |
| 4.50%, due 8/1/53 | 750,000 | 702,290 |
| Series B | | |
| 5.25%, due 8/1/36 | 500,000 | 535,142 |
| Series B | | |
| 5.25%, due 8/1/40 | 880,000 | 918,354 |
| Series B | | |
| 5.25%, due 8/1/48 | 500,000 | 515,580 |
| Series B | | |
| 5.50%, due 8/1/53 | 2,000,000 | 2,098,526 |
| West Contra Costa Unified School District, Unlimited General Obligation | | |
| Series A-1, Insured: AGM | | |
| 3.00%, due 8/1/51 | 2,230,000 | 1,464,233 |
| | | 331,599,847 |
The notes to the financial statements are an integral part of, and should be read in conjunction with, the financial statements.
17
Portfolio of Investments October 31, 2023†^ (continued)
| | Principal
Amount | Value |
| Long-Term Municipal Bonds (continued) |
| Hospital 4.0% |
| California Health Facilities Financing Authority, Cedars-Sinai Health System, Revenue Bonds | | |
| Series A | | |
| 4.00%, due 8/15/40 | $ 5,000,000 | $ 4,579,254 |
| California Health Facilities Financing Authority, Children's Hospital Los Angeles Obligated Group, Revenue Bonds | | |
| Series A | | |
| 5.00%, due 8/15/47 | 1,500,000 | 1,379,355 |
| California Health Facilities Financing Authority, El Camino Hospital, Revenue Bonds | | |
| 5.00%, due 2/1/47 | 6,500,000 | 6,396,192 |
| California Health Facilities Financing Authority, Lucile Salter Packard Children's Hospital at Stanford, Revenue Bonds | | |
| Series A | | |
| 5.00%, due 11/15/56 | 1,000,000 | 954,714 |
| California Municipal Finance Authority, Community Medical Centers, Revenue Bonds | | |
| Series A | | |
| 5.00%, due 2/1/27 | 1,100,000 | 1,113,894 |
| Series A | | |
| 5.00%, due 2/1/37 | 1,000,000 | 971,788 |
| California Municipal Finance Authority, Healthright 360, Revenue Bonds | | |
| Series A | | |
| 5.00%, due 11/1/39 (b) | 1,000,000 | 893,569 |
| California Public Finance Authority, Hoag Memorial Hospital Presbyterian, Revenue Bonds | | |
| Series A | | |
| 4.00%, due 7/15/51 | 6,925,000 | 6,028,863 |
| Series A | | |
| 5.00%, due 7/15/46 | 1,515,000 | 1,543,690 |
| California Statewide Communities Development Authority, Enloe Medical Center Obligated Group, Revenue Bonds | | |
| Series A, Insured: AGM | | |
| 5.00%, due 8/15/42 | 1,000,000 | 1,020,421 |
| Series A, Insured: AGM | | |
| 5.25%, due 8/15/52 | 3,000,000 | 3,063,399 |
| | Principal
Amount | Value |
| |
| Hospital (continued) |
| California Statewide Communities Development Authority, Methodist Hospital of Southern California, Revenue Bonds | | |
| 5.00%, due 1/1/48 | $ 2,250,000 | $ 2,084,843 |
| Regents of the University of California Medical Center, Pooled, Revenue Bonds | | |
| Series P | | |
| 5.00%, due 5/15/47 | 7,400,000 | 7,541,498 |
| Washington Township Health Care District, Revenue Bonds | | |
| Series B | | |
| 4.00%, due 7/1/36 | 1,380,000 | 1,158,000 |
| Series A | | |
| 5.00%, due 7/1/41 | 400,000 | 361,040 |
| Series A | | |
| 5.00%, due 7/1/42 | 380,000 | 339,514 |
| Series A | | |
| 5.00%, due 7/1/43 | 300,000 | 265,730 |
| Series A | | |
| 5.75%, due 7/1/48 | 300,000 | 298,798 |
| | | 39,994,562 |
| Housing 1.8% |
| California Community College Financing Authority, Orange Coast College Project, Revenue Bonds | | |
| 5.00%, due 5/1/27 | 280,000 | 282,141 |
| 5.00%, due 5/1/28 | 250,000 | 252,705 |
| 5.00%, due 5/1/29 | 1,470,000 | 1,484,723 |
| California Enterprise Development Authority, Provident Group-SDSU Properties LLC M@College Project, Revenue Bonds, First Tier | | |
| Series A | | |
| 5.00%, due 8/1/55 | 1,000,000 | 916,855 |
| California Municipal Finance Authority, Mobile Home Park Caritas Project, Revenue Bonds, Senior Lien | | |
| Series A | | |
| 4.00%, due 8/15/42 | 1,540,000 | 1,304,782 |
| California Municipal Finance Authority, P3 Claremont Holdings LLC, Claremont Colleges Project, Revenue Bonds | | |
| Series A | | |
| 5.00%, due 7/1/40 (b) | 1,000,000 | 873,512 |
The notes to the financial statements are an integral part of, and should be read in conjunction with, the financial statements.
| 18 | MainStay MacKay California Tax Free Opportunities Fund |
| | Principal
Amount | Value |
| Long-Term Municipal Bonds (continued) |
| Housing (continued) |
| California Municipal Finance Authority, Windsor Mobile Country Club, Revenue Bonds | | |
| Series A | | |
| 4.00%, due 11/15/37 | $ 1,320,000 | $ 1,177,661 |
| California School Finance Authority, Sonoma County Junior College Project, Revenue Bonds | | |
| Series A | | |
| 4.00%, due 11/1/36 (b) | 2,000,000 | 1,724,004 |
| California Statewide Communities Development Authority, CHF-Irvine LLC, Student Housing, Revenue Bonds | | |
| 5.00%, due 5/15/40 | 1,000,000 | 951,344 |
| California Statewide Communities Development Authority, Irvine Campus Apartments, Revenue Bonds | | |
| 5.00%, due 5/15/50 | 3,500,000 | 3,171,256 |
| California Statewide Communities Development Authority, Provident Group Pomona Properties LLC Project, Revenue Bonds | | |
| Series A | | |
| 5.75%, due 1/15/45 (b) | 400,000 | 364,409 |
| Hastings Campus Housing Finance Authority, Green Bond, Revenue Bonds, Senior Lien (b) | | |
| Series A | | |
| 5.00%, due 7/1/45 | 3,150,000 | 2,607,808 |
| Series A | | |
| 5.00%, due 7/1/61 | 3,850,000 | 2,958,649 |
| | | 18,069,849 |
| Other Revenue 21.1% |
| Alameda County Transportation Commission, Measure BB, Revenue Bonds, Senior Lien | | |
| Series BB | | |
| 5.00%, due 3/1/45 | 2,500,000 | 2,606,714 |
| California Community Choice Financing Authority, Clean Energy Project, Revenue Bonds | | |
| Series A-1 | | |
| 5.00%, due 12/1/53 (d) | 5,500,000 | 5,466,679 |
| | Principal
Amount | Value |
| |
| Other Revenue (continued) |
| California Community Choice Financing Authority, Clean Energy Project, Revenue Bonds (continued) | | |
| Series E-2 | | |
| 5.228%, due 2/1/54 | $ 4,250,000 | $ 4,218,862 |
| Series C | | |
| 5.25%, due 1/1/54 (d) | 12,325,000 | 12,065,910 |
| Series F | | |
| 5.50%, due 10/1/54 (d) | 3,750,000 | 3,864,723 |
| California Community Choice Financing Authority, Clean Energy Project, Green Bond, Revenue Bonds | | |
| Series B-1 | | |
| 4.00%, due 2/1/52 (d) | 4,725,000 | 4,378,484 |
| California Community Housing Agency, Essential Housing, Revenue Bonds, Senior Lien | | |
| Series A-1 | | |
| 4.00%, due 2/1/56 (b) | 6,285,000 | 4,628,173 |
| California Community Housing Agency, Fountains at Emerald, Revenue Bonds, Senior Lien | | |
| Series A-1 | | |
| 3.00%, due 8/1/56 (b) | 2,700,000 | 1,607,591 |
| California Community Housing Agency, Summit at Sausalito Apartments, Revenue Bonds | | |
| Series A-1 | | |
| 3.00%, due 2/1/57 (b) | 500,000 | 297,662 |
| California County Tobacco Securitization Agency, Golden Gate Tobacco Funding Corp., Asset-Backed, Revenue Bonds | | |
| Series A | | |
| 5.00%, due 6/1/47 | 1,275,000 | 1,086,640 |
| California County Tobacco Securitization Agency, Tobacco Settlement, Revenue Bonds, Senior Lien | | |
| Series A | | |
| 4.00%, due 6/1/34 | 300,000 | 288,199 |
| Series A | | |
| 4.00%, due 6/1/36 | 300,000 | 281,362 |
| Series A | | |
| 4.00%, due 6/1/37 | 275,000 | 253,351 |
| Series A | | |
| 4.00%, due 6/1/38 | 275,000 | 248,972 |
The notes to the financial statements are an integral part of, and should be read in conjunction with, the financial statements.
19
Portfolio of Investments October 31, 2023†^ (continued)
| | Principal
Amount | Value |
| Long-Term Municipal Bonds (continued) |
| Other Revenue (continued) |
| California County Tobacco Securitization Agency, Tobacco Settlement, Revenue Bonds, Senior Lien (continued) | | |
| Series A | | |
| 4.00%, due 6/1/39 | $ 350,000 | $ 313,298 |
| Series A | | |
| 4.00%, due 6/1/49 | 2,500,000 | 2,035,514 |
| California Health Facilities Financing Authority, Lundquist Institute For Biomedical Innovation, Revenue Bonds | | |
| 5.00%, due 9/1/30 | 1,300,000 | 1,311,599 |
| 5.00%, due 9/1/31 | 1,365,000 | 1,375,003 |
| 5.00%, due 9/1/32 | 1,435,000 | 1,442,266 |
| 5.00%, due 9/1/34 | 1,590,000 | 1,600,176 |
| California Infrastructure & Economic Development Bank, Infrastructure State Revolving Fund, Revenue Bonds | | |
| Series A | | |
| 5.00%, due 10/1/47 | 5,000,000 | 5,187,565 |
| California Infrastructure & Economic Development Bank, Los Angeles County Museum of Natural History Foundation, Revenue Bonds | | |
| 3.00%, due 7/1/50 | 8,735,000 | 5,710,409 |
| California Municipal Finance Authority, Orange County Civic Center Infrastructure Program, Revenue Bonds | | |
| Series A | | |
| 5.00%, due 6/1/37 | 2,085,000 | 2,142,559 |
| California Municipal Finance Authority, Rancho Colus LP, Revenue Bonds | | |
| Series A, Insured: HUD Sector 8 | | |
| 5.00%, due 8/1/26 (d) | 3,360,000 | 3,378,721 |
| California Municipal Finance Authority, Republic Services, Inc., Revenue Bonds (d)(e) | | |
| Series B | | |
| 4.20%, due 7/1/51 | 5,000,000 | 4,988,082 |
| Series A | | |
| 4.375%, due 9/1/53 | 7,500,000 | 7,122,201 |
| | Principal
Amount | Value |
| |
| Other Revenue (continued) |
| California Municipal Finance Authority, United Airlines, Inc. Project, Revenue Bonds | | |
| 4.00%, due 7/15/29 (e) | $ 9,000,000 | $ 8,425,823 |
| California State Public Works Board, Various Capital Projects, Revenue Bonds | | |
| Series C | | |
| 5.00%, due 11/1/44 | 3,735,000 | 3,814,486 |
| California Statewide Communities Development Authority, A Community of Seniors, Redwoods Project, Revenue Bonds | | |
| Series A, Insured: California Mortgage Insurance | | |
| 5.375%, due 11/15/44 | 535,000 | 535,323 |
| California Statewide Communities Development Authority, California Baptist University, Revenue Bonds | | |
| Series A | | |
| 6.375%, due 11/1/43 (b) | 500,000 | 500,181 |
| California Statewide Communities Development Authority, Front Porch Communities & Services Obligated Group, Revenue Bonds | | |
| Series A | | |
| 4.00%, due 4/1/42 | 2,000,000 | 1,662,959 |
| Children's Trust Fund, Asset-Backed, Revenue Bonds | | |
| Series A | | |
| (zero coupon), due 5/15/50 | 1,500,000 | 242,263 |
| City of Victorville, Electric, Revenue Bonds | | |
| Series A | | |
| 5.00%, due 5/1/38 | 1,115,000 | 1,140,612 |
| CMFA Special Finance Agency VIII, Elan Huntington Beach, Revenue Bonds, Senior Lien | | |
| Series A-1 | | |
| 3.00%, due 8/1/56 (b) | 2,000,000 | 1,186,814 |
| CSCDA Community Improvement Authority, 1818 Platinum Triangle-Anaheim, Revenue Bonds, Senior Lien | | |
| Series A-2 | | |
| 3.25%, due 4/1/57 (b) | 3,500,000 | 2,126,799 |
The notes to the financial statements are an integral part of, and should be read in conjunction with, the financial statements.
| 20 | MainStay MacKay California Tax Free Opportunities Fund |
| | Principal
Amount | Value |
| Long-Term Municipal Bonds (continued) |
| Other Revenue (continued) |
| CSCDA Community Improvement Authority, Acacia on Santa Rosa Creek, Revenue Bonds, Senior Lien | | |
| Series A | | |
| 4.00%, due 10/1/56 (b) | $ 2,000,000 | $ 1,485,428 |
| CSCDA Community Improvement Authority, Dublin, Revenue Bonds, Senior Lien | | |
| Series A-2 | | |
| 3.00%, due 2/1/57 (b) | 1,250,000 | 741,644 |
| CSCDA Community Improvement Authority, Oceanaire Long Beach, Revenue Bonds | | |
| Series A-2 | | |
| 4.00%, due 9/1/56 (b) | 7,000,000 | 4,630,011 |
| CSCDA Community Improvement Authority, Pasadena Portfolio, Revenue Bonds, Senior Lien | | |
| Series A-1 | | |
| 2.65%, due 12/1/46 (b) | 1,235,000 | 816,808 |
| CSCDA Community Improvement Authority, Theo Pasadena, Revenue Bonds, Senior Lien | | |
| Series A-2 | | |
| 3.25%, due 5/1/57 (b) | 4,500,000 | 2,713,350 |
| Del Mar Race Track Authority, Revenue Bonds | | |
| 5.00%, due 10/1/30 | 1,000,000 | 954,364 |
| Golden State Tobacco Securitization Corp., Tobacco Settlement, Revenue Bonds | | |
| Series A-1 | | |
| 5.00%, due 6/1/51 | 7,165,000 | 7,164,700 |
| Guam Economic Development & Commerce Authority, Tobacco Settlement Asset-Backed, Revenue Bonds | | |
| Series A | | |
| 5.625%, due 6/1/47 | 1,025,000 | 914,154 |
| Indio Finance Authority, Revenue Bonds | | |
| Series A, Insured: BAM | | |
| 4.50%, due 11/1/52 | 2,000,000 | 1,847,934 |
| Series A, Insured: BAM | | |
| 5.25%, due 11/1/42 | 1,500,000 | 1,559,679 |
| | Principal
Amount | Value |
| |
| Other Revenue (continued) |
| Livermore Valley Water Financing Authority, Alameda County Flood Control & Water Conservation District Zone No. 7, Revenue Bonds | | |
| Series A | | |
| 5.00%, due 7/1/47 | $ 3,945,000 | $ 4,002,977 |
| Lodi Public Financing Authority, Electric System, Revenue Bonds | | |
| Insured: AGM | | |
| 5.00%, due 9/1/32 | 1,650,000 | 1,730,143 |
| Los Angeles County Metropolitan Transportation Authority, Sales Tax, Revenue Bonds | | |
| Series A | | |
| 4.00%, due 6/1/38 | 6,245,000 | 5,952,126 |
| Los Angeles Department of Water & Power, Water System, Revenue Bonds | | |
| Series B | | |
| 5.00%, due 7/1/43 | 1,045,000 | 1,046,903 |
| Matching Fund Special Purpose Securitization Corp., Revenue Bonds | | |
| Series A | | |
| 5.00%, due 10/1/30 | 3,140,000 | 3,108,127 |
| Series A | | |
| 5.00%, due 10/1/32 | 3,140,000 | 3,087,561 |
| Series A | | |
| 5.00%, due 10/1/39 | 10,915,000 | 10,351,739 |
| Modesto Irrigation District, Electric System, Revenue Bonds | | |
| Series A | | |
| 5.25%, due 10/1/48 | 7,905,000 | 8,164,984 |
| Montclair Financing Authority, Public Facilities Project, Revenue Bonds | | |
| Insured: AGM | | |
| 5.00%, due 10/1/32 | 1,000,000 | 1,008,719 |
| Peninsula Corridor Joint Powers Board, Green Bond, Revenue Bonds | | |
| Series A | | |
| 5.00%, due 6/1/47 | 4,750,000 | 4,850,145 |
| Puerto Rico Sales Tax Financing Corp., Revenue Bonds | | |
| Series A-1 | | |
| (zero coupon), due 7/1/46 | 12,530,000 | 3,121,553 |
| Series A-1 | | |
| (zero coupon), due 7/1/51 | 5,390,000 | 974,307 |
The notes to the financial statements are an integral part of, and should be read in conjunction with, the financial statements.
21
Portfolio of Investments October 31, 2023†^ (continued)
| | Principal
Amount | Value |
| Long-Term Municipal Bonds (continued) |
| Other Revenue (continued) |
| Puerto Rico Sales Tax Financing Corp., Revenue Bonds (continued) | | |
| Series A-2 | | |
| 4.329%, due 7/1/40 | $ 3,159,000 | $ 2,736,722 |
| Series A-1 | | |
| 4.50%, due 7/1/34 | 1,500,000 | 1,432,522 |
| Series A-2B | | |
| 4.55%, due 7/1/40 | 1,871,000 | 1,665,406 |
| Series A-1 | | |
| 4.75%, due 7/1/53 | 4,366,000 | 3,698,529 |
| Series A-2 | | |
| 4.784%, due 7/1/58 | 4,707,000 | 3,959,074 |
| Series A-1 | | |
| 5.00%, due 7/1/58 | 2,991,078 | 2,618,712 |
| Riverside County Transportation Commission, Sales Tax, Revenue Bonds | | |
| Series B | | |
| 4.00%, due 6/1/36 | 5,000,000 | 4,864,274 |
| San Bernardino County Financing Authority, Court House Facilities Project, Revenue Bonds | | |
| Series C, Insured: NATL-RE | | |
| 5.50%, due 6/1/37 | 950,000 | 893,448 |
| San Joaquin County Transportation Authority, Sales Tax Revenue, Revenue Bonds | | |
| Series K | | |
| 5.00%, due 3/1/37 | 1,705,000 | 1,753,255 |
| South Bayside Waste Management Authority, Green Bond, Revenue Bonds | | |
| Series A, Insured: AGM | | |
| 5.00%, due 9/1/40 | 2,435,000 | 2,469,990 |
| South San Francisco Public Facilities Financing Authority, Multiple Capital Projects at Orange Memorial Park, Revenue Bonds | | |
| Series A | | |
| 5.00%, due 6/1/40 | 1,150,000 | 1,183,050 |
| Southern California Public Power Authority, Southern Transmissional System Renewal Project, Revenue Bonds | | |
| Series A | | |
| 5.244%, due 11/1/38 | 2,500,000 | 2,191,627 |
| | Principal
Amount | Value |
| |
| Other Revenue (continued) |
| Stockton Public Financing Authority, Water Revenue, Green Bonds, Revenue Bonds | | |
| Series A, Insured: BAM | | |
| 4.00%, due 10/1/37 | $ 2,500,000 | $ 2,272,480 |
| Series A, Insured: BAM | | |
| 5.00%, due 10/1/32 | 1,275,000 | 1,345,991 |
| Series A, Insured: BAM | | |
| 5.00%, due 10/1/34 | 1,500,000 | 1,579,175 |
| Territory of Guam, Business Privilege Tax, Revenue Bonds | | |
| Series D | | |
| 5.00%, due 11/15/27 | 2,000,000 | 1,993,370 |
| Series D | | |
| 5.00%, due 11/15/33 | 2,300,000 | 2,232,401 |
| Tobacco Securitization Authority of Northern California, Sacramento County Tobacco Securitization Corp., Revenue Bonds, Senior Lien | | |
| Series A | | |
| 4.00%, due 6/1/49 | 3,000,000 | 2,468,018 |
| Virgin Islands Public Finance Authority, Gross Receipts Taxes Loan, Revenue Bonds | | |
| Series A | | |
| 5.00%, due 10/1/29 (b) | 1,500,000 | 1,379,475 |
| Series A | | |
| 5.00%, due 10/1/32 | 1,150,000 | 1,020,883 |
| | | 211,521,733 |
| Transportation 14.4% |
| Alameda Corridor Transportation Authority, Revenue Bonds | | |
| Series A, Insured: NATL-RE | | |
| (zero coupon), due 10/1/36 | 3,000,000 | 1,604,481 |
| Series C, Insured: AGM | | |
| 5.00%, due 10/1/52 | 3,500,000 | 3,500,233 |
| Bay Area Toll Authority, Revenue Bonds | | |
| Series S-7 | | |
| 4.00%, due 4/1/35 | 3,500,000 | 3,442,972 |
| California Municipal Finance Authority, LINXS APM Project, Revenue Bonds, Senior Lien (e) | | |
| Series A, Insured: AGM | | |
| 3.25%, due 12/31/32 | 1,000,000 | 854,983 |
| Series A, Insured: AGM | | |
| 3.50%, due 12/31/35 | 1,310,000 | 1,094,358 |
The notes to the financial statements are an integral part of, and should be read in conjunction with, the financial statements.
| 22 | MainStay MacKay California Tax Free Opportunities Fund |
| | Principal
Amount | Value |
| Long-Term Municipal Bonds (continued) |
| Transportation (continued) |
| California Municipal Finance Authority, LINXS APM Project, Revenue Bonds, Senior Lien (e) (continued) | | |
| Series A | | |
| 5.00%, due 12/31/33 | $ 3,800,000 | $ 3,840,929 |
| City of Long Beach, Airport System, Revenue Bonds | | |
| Series A, Insured: AGM | | |
| 5.00%, due 6/1/33 | 550,000 | 604,001 |
| Series A, Insured: AGM | | |
| 5.00%, due 6/1/34 | 410,000 | 449,279 |
| Series B, Insured: AGM | | |
| 5.00%, due 6/1/35 | 310,000 | 337,561 |
| Series A, Insured: AGM | | |
| 5.00%, due 6/1/36 | 800,000 | 863,064 |
| Series A, Insured: AGM | | |
| 5.00%, due 6/1/37 | 750,000 | 798,814 |
| Series A, Insured: AGM | | |
| 5.00%, due 6/1/38 | 750,000 | 788,526 |
| Series A, Insured: AGM | | |
| 5.00%, due 6/1/39 | 500,000 | 523,506 |
| Series B, Insured: AGM | | |
| 5.00%, due 6/1/40 | 750,000 | 782,222 |
| City of Long Beach, Harbor, Revenue Bonds | | |
| Series A | | |
| 5.00%, due 5/15/37 | 3,475,000 | 3,654,482 |
| Series A | | |
| 5.00%, due 5/15/40 (e) | 4,915,000 | 4,945,307 |
| City of Los Angeles, Department of Airports, Revenue Bonds (e) | | |
| Series D | | |
| 3.00%, due 5/15/39 | 105,000 | 95,888 |
| Series D | | |
| 5.00%, due 5/15/30 | 3,000,000 | 3,086,361 |
| Series B | | |
| 5.00%, due 5/15/34 | 4,625,000 | 4,689,480 |
| Series D | | |
| 5.00%, due 5/15/35 | 2,000,000 | 2,021,851 |
| Series F | | |
| 5.00%, due 5/15/38 | 1,000,000 | 992,034 |
| City of Los Angeles, Department of Airports, Revenue Bonds, Senior Lien | | |
| Series G | | |
| 4.00%, due 5/15/47 (e) | 2,000,000 | 1,644,139 |
| | Principal
Amount | Value |
| |
| Transportation (continued) |
| City of Los Angeles, Department of Airports, Revenue Bonds, Senior Lien (continued) | | |
| Series C | | |
| 5.00%, due 5/15/29 (e) | $ 5,000,000 | $ 5,147,594 |
| Series I | | |
| 5.00%, due 5/15/48 | 6,175,000 | 6,297,689 |
| Series G | | |
| 5.50%, due 5/15/38 (e) | 1,000,000 | 1,042,276 |
| Series G | | |
| 5.50%, due 5/15/39 (e) | 1,375,000 | 1,427,614 |
| Series G | | |
| 5.50%, due 5/15/40 (e) | 4,000,000 | 4,146,182 |
| Series H | | |
| 5.50%, due 5/15/47 (e) | 4,100,000 | 4,170,087 |
| Foothill-Eastern Transportation Corridor Agency, Revenue Bonds | | |
| Series A, Insured: AGM | | |
| (zero coupon), due 1/15/31 | 2,795,000 | 3,025,753 |
| Foothill-Eastern Transportation Corridor Agency, Revenue Bonds, Senior Lien | | |
| Series A | | |
| 4.00%, due 1/15/46 | 5,270,000 | 4,423,325 |
| Norman Y Mineta San Jose International Airport SJC, Revenue Bonds (e) | | |
| Series A | | |
| 5.00%, due 3/1/30 | 1,855,000 | 1,904,776 |
| Series A | | |
| 5.00%, due 3/1/47 | 6,890,000 | 6,520,849 |
| Oklahoma Turnpike Authority, Revenue Bonds | | |
| 5.50%, due 1/1/53 | 10,000,000 | 10,507,893 |
| Port of Oakland, Revenue Bonds | | |
| Series H | | |
| 5.00%, due 5/1/29 (e) | 1,900,000 | 1,961,487 |
| Puerto Rico Highway & Transportation Authority, Revenue Bonds | | |
| Series B | | |
| (zero coupon), due 7/1/32 | 7,000,000 | 4,471,250 |
| San Diego County Regional Airport Authority, Revenue Bonds (e) | | |
| Series B | | |
| 5.00%, due 7/1/33 | 2,000,000 | 2,054,042 |
| Series B | | |
| 5.00%, due 7/1/49 | 2,325,000 | 2,190,507 |
The notes to the financial statements are an integral part of, and should be read in conjunction with, the financial statements.
23
Portfolio of Investments October 31, 2023†^ (continued)
| | Principal
Amount | Value |
| Long-Term Municipal Bonds (continued) |
| Transportation (continued) |
| San Diego County Regional Airport Authority, Revenue Bonds, Senior Lien (e) | | |
| Series B | | |
| 5.25%, due 7/1/36 | $ 3,370,000 | $ 3,482,891 |
| Series B | | |
| 5.25%, due 7/1/58 | 6,000,000 | 5,885,510 |
| San Francisco City & County Airport Commission, San Francisco International Airport, Revenue Bonds | | |
| Series A | | |
| 5.00%, due 5/1/49 (e) | 3,460,000 | 3,320,685 |
| San Francisco City & County Airport Commission, San Francisco International Airport, Revenue Bonds, Second Series | | |
| Series B | | |
| 4.00%, due 5/1/52 | 2,000,000 | 1,722,537 |
| Series A | | |
| 5.00%, due 5/1/40 (e) | 2,000,000 | 1,955,388 |
| Series A | | |
| 5.00%, due 5/1/44 (e) | 2,500,000 | 2,394,864 |
| Series C | | |
| 5.75%, due 5/1/48 (c)(e) | 10,800,000 | 11,231,025 |
| San Joaquin Hills Transportation Corridor Agency, Revenue Bonds, Junior Lien | | |
| Series B | | |
| 5.25%, due 1/15/44 | 9,750,000 | 9,780,737 |
| Series B | | |
| 5.25%, due 1/15/49 | 1,915,000 | 1,918,613 |
| San Joaquin Hills Transportation Corridor Agency, Revenue Bonds, Senior Lien | | |
| Series A | | |
| 4.00%, due 1/15/50 | 2,948,000 | 2,484,028 |
| | | 144,082,073 |
| Utilities 3.0% |
| Guam Power Authority, Revenue Bonds | | |
| Series A | | |
| 5.00%, due 10/1/27 | 1,230,000 | 1,247,900 |
| Series A | | |
| 5.00%, due 10/1/33 | 1,000,000 | 1,005,611 |
| | Principal
Amount | Value |
| |
| Utilities (continued) |
| Guam Power Authority, Revenue Bonds (continued) | | |
| Series A | | |
| 5.00%, due 10/1/40 | $ 1,000,000 | $ 943,374 |
| Modesto Irrigation District, Electric System, Revenue Bonds | | |
| Series A | | |
| 5.00%, due 10/1/40 | 1,690,000 | 1,705,925 |
| Puerto Rico Electric Power Authority, Revenue Bonds | | |
| Series UU, Insured: AGC | | |
| 4.25%, due 7/1/27 | 460,000 | 446,475 |
| Series UU, Insured: AGM | | |
| 5.00%, due 7/1/24 | 225,000 | 224,717 |
| Series XX | | |
| 5.25%, due 7/1/40 (f)(g) | 1,000,000 | 252,500 |
| Sacramento Municipal Utility District, Revenue Bonds | | |
| Series H | | |
| 5.00%, due 8/15/38 | 4,340,000 | 4,569,127 |
| San Francisco City & County Public Utilities Commission, Power, Revenue Bonds | | |
| Series A | | |
| 4.00%, due 11/1/45 | 1,920,000 | 1,700,847 |
| Southern California Public Power Authority, Southern Transmissional System Renewal Project, Revenue Bonds | | |
| Series A-1 | | |
| 5.25%, due 7/1/53 | 17,500,000 | 18,348,470 |
| | | 30,444,946 |
| Water & Sewer 8.7% |
| California Infrastructure & Economic Development Bank, Clean Water and Drinking Water, Revenue Bonds | | |
| 4.00%, due 10/1/40 | 3,500,000 | 3,245,301 |
| 4.00%, due 10/1/42 | 1,250,000 | 1,145,187 |
| 4.00%, due 10/1/45 | 5,250,000 | 4,736,297 |
| City of Oxnard, Wastewater, Revenue Bonds | | |
| Insured: BAM | | |
| 4.00%, due 6/1/32 | 1,920,000 | 1,910,767 |
| Insured: BAM | | |
| 4.00%, due 6/1/34 | 2,080,000 | 2,037,961 |
The notes to the financial statements are an integral part of, and should be read in conjunction with, the financial statements.
| 24 | MainStay MacKay California Tax Free Opportunities Fund |
| | Principal
Amount | Value |
| Long-Term Municipal Bonds (continued) |
| Water & Sewer (continued) |
| City of Oxnard, Wastewater, Revenue Bonds (continued) | | |
| Insured: BAM | | |
| 5.00%, due 6/1/30 | $ 1,340,000 | $ 1,411,594 |
| City of San Francisco, Public Utilities Commission Water, Revenue Bonds | | |
| Series B | | |
| 5.25%, due 11/1/48 | 3,945,000 | 4,168,093 |
| Series B | | |
| 5.25%, due 11/1/52 | 2,500,000 | 2,629,186 |
| City of Vernon, Water System, Revenue Bonds | | |
| Series A, Insured: AGM | | |
| 3.375%, due 8/1/40 | 650,000 | 507,925 |
| Series A, Insured: AGM | | |
| 5.00%, due 8/1/35 | 1,000,000 | 1,041,214 |
| East Bay Municipal Utility District, Water System, Revenue Bonds | | |
| Series A | | |
| 5.00%, due 6/1/49 | 3,500,000 | 3,576,486 |
| East Bay Municipal Utility District Water System, Green Bonds, Revenue Bonds | | |
| Series A | | |
| 5.00%, due 6/1/37 | 3,000,000 | 3,245,820 |
| Series A | | |
| 5.00%, due 6/1/38 | 1,800,000 | 1,928,800 |
| Eastern Municipal Water District, Water & Wastewater, Revenue Bonds | | |
| Series A | | |
| 5.00%, due 7/1/45 | 2,850,000 | 2,885,426 |
| Guam Government Waterworks Authority, Water and Wastewater System, Revenue Bonds | | |
| 5.00%, due 1/1/46 | 6,290,000 | 5,767,908 |
| Series A | | |
| 5.00%, due 1/1/50 | 2,500,000 | 2,246,357 |
| Los Angeles Department of Water & Power, Water System, Revenue Bonds | | |
| Series C | | |
| 5.00%, due 7/1/40 | 2,000,000 | 2,091,687 |
| Series C | | |
| 5.00%, due 7/1/41 | 1,035,000 | 1,088,638 |
| Series B | | |
| 5.00%, due 7/1/46 | 1,575,000 | 1,616,718 |
| | Principal
Amount | Value |
| |
| Water & Sewer (continued) |
| Los Angeles Department of Water & Power, Water System, Revenue Bonds (continued) | | |
| Series A | | |
| 5.00%, due 7/1/47 | $ 1,250,000 | $ 1,280,049 |
| Series A | | |
| 5.00%, due 7/1/49 | 1,000,000 | 1,030,121 |
| Metropolitan Water District of Southern California, Waterworks, Revenue Bonds | | |
| Series A | | |
| 5.00%, due 10/1/46 | 3,500,000 | 3,629,586 |
| Oxnard Financing Authority, Waste Water, Revenue Bonds | | |
| Insured: AGM | | |
| 5.00%, due 6/1/34 | 1,000,000 | 1,004,970 |
| Puerto Rico Commonwealth Aqueduct & Sewer Authority, Revenue Bonds | | |
| Series B | | |
| 5.00%, due 7/1/33 (b) | 1,330,000 | 1,302,982 |
| Puerto Rico Commonwealth Aqueduct & Sewer Authority, Revenue Bonds, Senior Lien (b) | | |
| Series 2020A | | |
| 5.00%, due 7/1/35 | 8,000,000 | 7,671,660 |
| Series A | | |
| 5.00%, due 7/1/37 | 4,800,000 | 4,526,712 |
| Series A | | |
| 5.00%, due 7/1/47 | 16,295,000 | 14,493,050 |
| San Diego County Water Authority, Revenue Bonds | | |
| Series A | | |
| 5.00%, due 5/1/52 | 2,065,000 | 2,119,087 |
| Santa Margarita-Dana Point Authority, Water District Improvement, Revenue Bonds | | |
| 4.00%, due 8/1/36 | 2,025,000 | 1,965,966 |
| Watereuse Finance Authority, Vallejo Sanitation And Flood Control District Refunding Program, Revenue Bonds | | |
| Series A | | |
| 5.50%, due 5/1/36 | 500,000 | 503,103 |
| | | 86,808,651 |
Total Municipal Bonds
(Cost $1,019,185,959) | | 963,999,457 |
| |
The notes to the financial statements are an integral part of, and should be read in conjunction with, the financial statements.
25
Portfolio of Investments October 31, 2023†^ (continued)
| | Shares | | Value |
| Short-Term Investment 4.0% |
| Unaffiliated Investment Company 4.0% |
| BlackRock Liquidity Funds MuniCash, 3.821% (h) | 40,172,209 | | $ 40,172,209 |
Total Short-Term Investment
(Cost $40,172,209) | | | 40,172,209 |
Total Investments
(Cost $1,059,358,168) | 100.2% | | 1,004,171,666 |
| Other Assets, Less Liabilities | (0.2) | | (2,245,491) |
| Net Assets | 100.0% | | $ 1,001,926,175 |
| † | Percentages indicated are based on Fund net assets. |
| ^ | Industry classifications may be different than those used for compliance monitoring purposes. |
| (a) | Step coupon—Rate shown was the rate in effect as of October 31, 2023. |
| (b) | May be sold to institutional investors only under Rule 144A or securities offered pursuant to Section 4(a)(2) of the Securities Act of 1933, as amended. |
| (c) | Delayed delivery security. |
| (d) | Coupon rate may change based on changes of the underlying collateral or prepayments of principal. Rate shown was the rate in effect as of October 31, 2023. |
| (e) | Interest on these securities was subject to alternative minimum tax. |
| (f) | Issue in default. |
| (g) | Issue in non-accrual status. |
| (h) | Current yield as of October 31, 2023. |
Futures Contracts
As of October 31, 2023, the Fund held the following futures contracts1:
| Type | Number of
Contracts | Expiration
Date | Value at
Trade Date | Current
Notional
Amount | Unrealized
Appreciation
(Depreciation)2 |
| Short Contracts | | | | | |
| U.S. Treasury 10 Year Notes | (305) | December 2023 | $ (32,741,330) | $ (32,382,422) | $ 358,908 |
| 1. | As of October 31, 2023, cash in the amount of $610,000 was on deposit with a broker or futures commission merchant for futures transactions. |
| 2. | Represents the difference between the value of the contracts at the time they were opened and the value as of October 31, 2023. |
| Abbreviation(s): |
| AGC—Assured Guaranty Corp. |
| AGM—Assured Guaranty Municipal Corp. |
| BAM—Build America Mutual Assurance Co. |
| CHF—Collegiate Housing Foundation |
The notes to the financial statements are an integral part of, and should be read in conjunction with, the financial statements.
| 26 | MainStay MacKay California Tax Free Opportunities Fund |
| CR—Custodial Receipts |
| HUD—Housing and Urban Development |
| NATL-RE—National Public Finance Guarantee Corp. |
The following is a summary of the fair valuations according to the inputs used as of October 31, 2023, for valuing the Fund’s assets:
| Description | Quoted
Prices in
Active
Markets for
Identical
Assets
(Level 1) | | Significant
Other
Observable
Inputs
(Level 2) | | Significant
Unobservable
Inputs
(Level 3) | | Total |
| Asset Valuation Inputs | | | | | | | |
| Investments in Securities (a) | | | | | | | |
| Municipal Bonds | | | | | | | |
| Long-Term Municipal Bonds | $ — | | $ 963,999,457 | | $ — | | $ 963,999,457 |
| Short-Term Investment | | | | | | | |
| Unaffiliated Investment Company | 40,172,209 | | — | | — | | 40,172,209 |
| Total Investments in Securities | 40,172,209 | | 963,999,457 | | — | | 1,004,171,666 |
| Other Financial Instruments | | | | | | | |
| Futures Contracts (b) | 358,908 | | — | | — | | 358,908 |
| Total Investments in Securities and Other Financial Instruments | $ 40,531,117 | | $ 963,999,457 | | $ — | | $ 1,004,530,574 |
| (a) | For a complete listing of investments and their industries, see the Portfolio of Investments. |
| (b) | The value listed for these securities reflects unrealized appreciation (depreciation) as shown on the Portfolio of Investments. |
The notes to the financial statements are an integral part of, and should be read in conjunction with, the financial statements.
27
Statement of Assets and Liabilities as of October 31, 2023
| Assets |
Investment in securities, at value
(identified cost $1,059,358,168) | $1,004,171,666 |
| Cash collateral on deposit at broker for futures contracts | 610,000 |
| Due from custodian | 4,633,172 |
| Receivables: | |
| Interest | 12,261,284 |
| Investment securities sold | 10,765,172 |
| Fund shares sold | 8,026,050 |
| Variation margin on futures contracts | 14,299 |
| Other assets | 15,481 |
| Total assets | 1,040,497,124 |
| Liabilities |
| Payables: | |
| Investment securities purchased | 31,945,391 |
| Fund shares redeemed | 5,320,918 |
| Manager (See Note 3) | 369,400 |
| NYLIFE Distributors (See Note 3) | 97,809 |
| Transfer agent (See Note 3) | 61,085 |
| Custodian | 28,272 |
| Professional fees | 22,125 |
| Shareholder communication | 2,292 |
| Trustees | 61 |
| Accrued expenses | 267 |
| Distributions payable | 723,329 |
| Total liabilities | 38,570,949 |
| Net assets | $1,001,926,175 |
| Composition of Net Assets |
| Shares of beneficial interest outstanding (par value of $.001 per share) unlimited number of shares authorized | $ 111,372 |
| Additional paid-in-capital | 1,187,529,610 |
| | 1,187,640,982 |
| Total distributable earnings (loss) | (185,714,807) |
| Net assets | $1,001,926,175 |
| Class A | |
| Net assets applicable to outstanding shares | $389,291,040 |
| Shares of beneficial interest outstanding | 43,274,815 |
| Net asset value per share outstanding | $ 9.00 |
| Maximum sales charge (3.00% of offering price) | 0.28 |
| Maximum offering price per share outstanding | $ 9.28 |
| Investor Class | |
| Net assets applicable to outstanding shares | $ 432,769 |
| Shares of beneficial interest outstanding | 48,101 |
| Net asset value per share outstanding | $ 9.00 |
| Maximum sales charge (2.50% of offering price) | 0.23 |
| Maximum offering price per share outstanding | $ 9.23 |
| Class C | |
| Net assets applicable to outstanding shares | $ 30,931,925 |
| Shares of beneficial interest outstanding | 3,437,867 |
| Net asset value and offering price per share outstanding | $ 9.00 |
| Class C2 | |
| Net assets applicable to outstanding shares | $ 2,167,677 |
| Shares of beneficial interest outstanding | 240,893 |
| Net asset value and offering price per share outstanding | $ 9.00 |
| Class I | |
| Net assets applicable to outstanding shares | $572,918,188 |
| Shares of beneficial interest outstanding | 63,683,312 |
| Net asset value and offering price per share outstanding | $ 9.00 |
| Class R6 | |
| Net assets applicable to outstanding shares | $ 6,184,576 |
| Shares of beneficial interest outstanding | 686,824 |
| Net asset value and offering price per share outstanding | $ 9.00 |
The notes to the financial statements are an integral part of, and should be read in conjunction with, the financial statements.
| 28 | MainStay MacKay California Tax Free Opportunities Fund |
Statement of Operations for the year ended October 31, 2023
| Investment Income (Loss) |
| Income | |
| Interest | $ 40,760,084 |
| Expenses | |
| Manager (See Note 3) | 4,682,691 |
| Distribution/Service—Class A (See Note 3) | 1,016,444 |
| Distribution/Service—Investor Class (See Note 3) | 1,217 |
| Distribution/Service—Class C (See Note 3) | 172,072 |
| Distribution/Service—Class C2 (See Note 3) | 11,120 |
| Transfer agent (See Note 3) | 386,269 |
| Professional fees | 137,186 |
| Custodian | 84,447 |
| Shareholder communication | 27,696 |
| Trustees | 27,363 |
| Registration | 19,042 |
| Miscellaneous | 32,291 |
| Total expenses before waiver/reimbursement | 6,597,838 |
| Expense waiver/reimbursement from Manager (See Note 3) | (175,377) |
| Reimbursement from prior custodian(a) | (2,014) |
| Net expenses | 6,420,447 |
| Net investment income (loss) | 34,339,637 |
| Realized and Unrealized Gain (Loss) |
| Net realized gain (loss) on: | |
| Unaffiliated investment transactions | (39,905,686) |
| Futures transactions | 2,091,869 |
| Net realized gain (loss) | (37,813,817) |
| Net change in unrealized appreciation (depreciation) on: | |
| Unaffiliated investments | 39,010,840 |
| Futures contracts | (3,696,428) |
| Net change in unrealized appreciation (depreciation) | 35,314,412 |
| Net realized and unrealized gain (loss) | (2,499,405) |
| Net increase (decrease) in net assets resulting from operations | $ 31,840,232 |
| (a) | Represents a refund for overbilling of custody fees. |
The notes to the financial statements are an integral part of, and should be read in conjunction with, the financial statements.
29
Statements of Changes in Net Assets
for the years ended October 31, 2023 and October 31, 2022
| | 2023 | 2022 |
| Increase (Decrease) in Net Assets |
| Operations: | | |
| Net investment income (loss) | $ 34,339,637 | $ 26,875,576 |
| Net realized gain (loss) | (37,813,817) | (57,240,026) |
| Net change in unrealized appreciation (depreciation) | 35,314,412 | (155,274,497) |
| Net increase (decrease) in net assets resulting from operations | 31,840,232 | (185,638,947) |
| Distributions to shareholders: | | |
| Class A | (14,220,240) | (10,778,314) |
| Investor Class | (16,900) | (14,429) |
| Class C | (1,108,306) | (1,136,043) |
| Class C2 | (52,634) | (8,264) |
| Class I | (22,219,696) | (20,503,436) |
| Class R6 | (211,293) | (163,799) |
| Total distributions to shareholders | (37,829,069) | (32,604,285) |
| Capital share transactions: | | |
| Net proceeds from sales of shares | 602,509,072 | 616,148,347 |
| Net asset value of shares issued to shareholders in reinvestment of distributions | 28,989,054 | 23,868,297 |
| Cost of shares redeemed | (615,175,105) | (711,867,843) |
| Increase (decrease) in net assets derived from capital share transactions | 16,323,021 | (71,851,199) |
| Net increase (decrease) in net assets | 10,334,184 | (290,094,431) |
| Net Assets |
| Beginning of year | 991,591,991 | 1,281,686,422 |
| End of year | $1,001,926,175 | $ 991,591,991 |
The notes to the financial statements are an integral part of, and should be read in conjunction with, the financial statements.
| 30 | MainStay MacKay California Tax Free Opportunities Fund |
Financial Highlights selected per share data and ratios
| | Year Ended October 31, |
| Class A | 2023 | | 2022 | | 2021 | | 2020 | | 2019 |
| Net asset value at beginning of year | $ 9.02 | | $ 10.94 | | $ 10.75 | | $ 10.76 | | $ 10.12 |
| Net investment income (loss) | 0.30(a) | | 0.23(a) | | 0.20(a) | | 0.23 | | 0.28 |
| Net realized and unrealized gain (loss) | 0.01 | | (1.87) | | 0.23 | | 0.03 | | 0.64 |
| Total from investment operations | 0.31 | | (1.64) | | 0.43 | | 0.26 | | 0.92 |
| Less distributions: | | | | | | | | | |
| From net investment income | (0.33) | | (0.28) | | (0.24) | | (0.27) | | (0.28) |
| Net asset value at end of year | $ 9.00 | | $ 9.02 | | $ 10.94 | | $ 10.75 | | $ 10.76 |
| Total investment return (b) | 3.34% | | (15.22)% | | 4.05% | | 2.46% | | 9.20% |
| Ratios (to average net assets)/Supplemental Data: | | | | | | | | | |
| Net investment income (loss) | 3.16% | | 2.23% | | 1.80% | | 1.97% | | 2.65% |
| Net expenses (c) | 0.75% | | 0.75% | | 0.74% | | 0.75% | | 0.75% |
| Expenses (before waiver/reimbursement) (c) | 0.77% | | 0.76% | | 0.76% | | 0.80% | | 0.81% |
| Portfolio turnover rate | 66% | | 70%(d) | | 17%(d) | | 29%(d) | | 47%(d) |
| Net assets at end of year (in 000’s) | $ 389,291 | | $ 395,405 | | $ 444,628 | | $ 373,966 | | $ 292,589 |
| (a) | Per share data based on average shares outstanding during the year. |
| (b) | Total investment return is calculated exclusive of sales charges and assumes the reinvestment of dividends and distributions. For periods of less than one year, total return is not annualized. |
| (c) | In addition to the fees and expenses which the Fund bears directly, it also indirectly bears a pro-rata share of the fees and expenses of the underlying funds in which it invests. Such indirect expenses are not included in the above expense ratios. |
| (d) | The portfolio turnover rate includes variable rate demand notes. |
| | Year Ended October 31, |
| Investor Class | 2023 | | 2022 | | 2021 | | 2020 | | 2019 |
| Net asset value at beginning of year | $ 9.02 | | $ 10.94 | | $ 10.76 | | $ 10.76 | | $ 10.12 |
| Net investment income (loss) | 0.30(a) | | 0.22(a) | | 0.18(a) | | 0.23 | | 0.28 |
| Net realized and unrealized gain (loss) | 0.01 | | (1.86) | | 0.24 | | 0.04 | | 0.64 |
| Total from investment operations | 0.31 | | (1.64) | | 0.42 | | 0.27 | | 0.92 |
| Less distributions: | | | | | | | | | |
| From net investment income | (0.33) | | (0.28) | | (0.24) | | (0.27) | | (0.28) |
| Net asset value at end of year | $ 9.00 | | $ 9.02 | | $ 10.94 | | $ 10.76 | | $ 10.76 |
| Total investment return (b) | 3.31% | | (15.24)% | | 3.93% | | 2.53% | | 9.18% |
| Ratios (to average net assets)/Supplemental Data: | | | | | | | | | |
| Net investment income (loss) | 3.14% | | 2.22% | | 1.61% | | 1.95% | | 2.65% |
| Net expenses (c) | 0.78% | | 0.77% | | 0.76% | | 0.77% | | 0.77% |
| Expenses (before waiver/reimbursement) (c) | 0.80% | | 0.78% | | 0.78% | | 0.82% | | 0.83% |
| Portfolio turnover rate | 66% | | 70%(d) | | 17%(d) | | 29%(d) | | 47%(d) |
| Net assets at end of year (in 000's) | $ 433 | | $ 493 | | $ 554 | | $ 672 | | $ 506 |
| (a) | Per share data based on average shares outstanding during the year. |
| (b) | Total investment return is calculated exclusive of sales charges and assumes the reinvestment of dividends and distributions. For periods of less than one year, total return is not annualized. |
| (c) | In addition to the fees and expenses which the Fund bears directly, it also indirectly bears a pro-rata share of the fees and expenses of the underlying funds in which it invests. Such indirect expenses are not included in the above expense ratios. |
| (d) | The portfolio turnover rate includes variable rate demand notes. |
The notes to the financial statements are an integral part of, and should be read in conjunction with, the financial statements.
31
Financial Highlights selected per share data and ratios
| | Year Ended October 31, |
| Class C | 2023 | | 2022 | | 2021 | | 2020 | | 2019 |
| Net asset value at beginning of year | $ 9.02 | | $ 10.94 | | $ 10.76 | | $ 10.77 | | $ 10.12 |
| Net investment income (loss) | 0.27(a) | | 0.20(a) | | 0.17(a) | | 0.19 | | 0.25 |
| Net realized and unrealized gain (loss) | 0.02 | | (1.87) | | 0.22 | | 0.04 | | 0.65 |
| Total from investment operations | 0.29 | | (1.67) | | 0.39 | | 0.23 | | 0.90 |
| Less distributions: | | | | | | | | | |
| From net investment income | (0.31) | | (0.25) | | (0.21) | | (0.24) | | (0.25) |
| Net asset value at end of year | $ 9.00 | | $ 9.02 | | $ 10.94 | | $ 10.76 | | $ 10.77 |
| Total investment return (b) | 3.05% | | (15.45)% | | 3.67% | | 2.18% | | 9.01% |
| Ratios (to average net assets)/Supplemental Data: | | | | | | | | | |
| Net investment income (loss) | 2.89% | | 1.93% | | 1.54% | | 1.70% | | 2.38% |
| Net expenses (c) | 1.03% | | 1.02% | | 1.01% | | 1.02% | | 1.02% |
| Expenses (before waiver/reimbursement) (c) | 1.05% | | 1.03% | | 1.03% | | 1.07% | | 1.08% |
| Portfolio turnover rate | 66% | | 70%(d) | | 17%(d) | | 29%(d) | | 47%(d) |
| Net assets at end of year (in 000’s) | $ 30,932 | | $ 34,742 | | $ 58,263 | | $ 61,662 | | $ 52,964 |
| (a) | Per share data based on average shares outstanding during the year. |
| (b) | Total investment return is calculated exclusive of sales charges and assumes the reinvestment of dividends and distributions. For periods of less than one year, total return is not annualized. |
| (c) | In addition to the fees and expenses which the Fund bears directly, it also indirectly bears a pro-rata share of the fees and expenses of the underlying funds in which it invests. Such indirect expenses are not included in the above expense ratios. |
| (d) | The portfolio turnover rate includes variable rate demand notes. |
| | Year Ended October 31, | | August 31, 2020^ through
October 31, |
| Class C2 | 2023 | | 2022 | | 2021 | | 2020 |
| Net asset value at beginning of period | $ 9.02 | | $ 10.94 | | $ 10.75 | | $ 10.83 |
| Net investment income (loss) | 0.26(a) | | 0.19(a) | | 0.28(a) | | 0.03 |
| Net realized and unrealized gain (loss) | 0.01 | | (1.88) | | 0.11 | | (0.07) |
| Total from investment operations | 0.27 | | (1.69) | | 0.39 | | (0.04) |
| Less distributions: | | | | | | | |
| From net investment income | (0.29) | | (0.23) | | (0.20) | | (0.04) |
| Net asset value at end of period | $ 9.00 | | $ 9.02 | | $ 10.94 | | $ 10.75 |
| Total investment return (b) | 2.89% | | (15.58)% | | 3.59% | | (0.40)% |
| Ratios (to average net assets)/Supplemental Data: | | | | | | | |
| Net investment income (loss) | 2.74% | | 1.86% | | 2.56% | | 1.49%†† |
| Net expenses (c) | 1.18% | | 1.17% | | 1.16% | | 1.16%†† |
| Expenses (before waiver/reimbursement) (c) | 1.20% | | 1.18% | | 1.18% | | 1.22%†† |
| Portfolio turnover rate | 66% | | 70%(d) | | 17%(d) | | 29%(d) |
| Net assets at end of period (in 000’s) | $ 2,168 | | $ 361 | | $ 275 | | $ 25 |
| ^ | Inception date. |
| †† | Annualized. |
| (a) | Per share data based on average shares outstanding during the period. |
| (b) | Total investment return is calculated exclusive of sales charges and assumes the reinvestment of dividends and distributions. For periods of less than one year, total return is not annualized. |
| (c) | In addition to the fees and expenses which the Fund bears directly, it also indirectly bears a pro-rata share of the fees and expenses of the underlying funds in which it invests. Such indirect expenses are not included in the above expense ratios. |
| (d) | The portfolio turnover rate includes variable rate demand notes. |
The notes to the financial statements are an integral part of, and should be read in conjunction with, the financial statements.
| 32 | MainStay MacKay California Tax Free Opportunities Fund |
Financial Highlights selected per share data and ratios
| | Year Ended October 31, |
| Class I | 2023 | | 2022 | | 2021 | | 2020 | | 2019 |
| Net asset value at beginning of year | $ 9.02 | | $ 10.94 | | $ 10.76 | | $ 10.76 | | $ 10.12 |
| Net investment income (loss) | 0.32(a) | | 0.25(a) | | 0.23(a) | | 0.28 | | 0.31 |
| Net realized and unrealized gain (loss) | 0.02 | | (1.87) | | 0.22 | | 0.02 | | 0.64 |
| Total from investment operations | 0.34 | | (1.62) | | 0.45 | | 0.30 | | 0.95 |
| Less distributions: | | | | | | | | | |
| From net investment income | (0.36) | | (0.30) | | (0.27) | | (0.30) | | (0.31) |
| Net asset value at end of year | $ 9.00 | | $ 9.02 | | $ 10.94 | | $ 10.76 | | $ 10.76 |
| Total investment return (b) | 3.60% | | (15.01)% | | 4.21% | | 2.81% | | 9.48% |
| Ratios (to average net assets)/Supplemental Data: | | | | | | | | | |
| Net investment income (loss) | 3.41% | | 2.46% | | 2.05% | | 2.20% | | 2.91% |
| Net expenses (c) | 0.50% | | 0.50% | | 0.49% | | 0.50% | | 0.50% |
| Expenses (before waiver/reimbursement) (c) | 0.52% | | 0.51% | | 0.51% | | 0.55% | | 0.56% |
| Portfolio turnover rate | 66% | | 70%(d) | | 17%(d) | | 29%(d) | | 47%(d) |
| Net assets at end of year (in 000’s) | $ 572,918 | | $ 555,049 | | $ 776,207 | | $ 655,579 | | $ 429,106 |
| (a) | Per share data based on average shares outstanding during the year. |
| (b) | Total investment return is calculated exclusive of sales charges and assumes the reinvestment of dividends and distributions. Class I shares are not subject to sales charges. For periods of less than one year, total return is not annualized. |
| (c) | In addition to the fees and expenses which the Fund bears directly, it also indirectly bears a pro-rata share of the fees and expenses of the underlying funds in which it invests. Such indirect expenses are not included in the above expense ratios. |
| (d) | The portfolio turnover rate includes variable rate demand notes. |
| | Year Ended October 31, | | November 1, 2019^ through
October 31, |
| Class R6 | 2023 | | 2022 | | 2021 | | 2020 |
| Net asset value at beginning of period | $ 9.03 | | $ 10.94 | | $ 10.76 | | $ 10.77 |
| Net investment income (loss) | 0.33(a) | | 0.26(a) | | 0.21(a) | | 0.25 |
| Net realized and unrealized gain (loss) | —‡ | | (1.87) | | 0.24 | | 0.04 |
| Total from investment operations | 0.33 | | (1.61) | | 0.45 | | 0.29 |
| Less distributions: | | | | | | | |
| From net investment income | (0.36) | | (0.30) | | (0.27) | | (0.30) |
| Net asset value at end of period | $ 9.00 | | $ 9.03 | | $ 10.94 | | $ 10.76 |
| Total investment return (b) | 3.49% | | (14.90)% | | 4.23% | | 2.83% |
| Ratios (to average net assets)/Supplemental Data: | | | | | | | |
| Net investment income (loss) | 3.43% | | 2.57% | | 1.86% | | 2.25% |
| Net expenses (c) | 0.48% | | 0.49% | | 0.47% | | 0.48% |
| Expenses (before waiver/reimbursement) (c) | 0.48% | | 0.49% | | 0.49% | | 0.53% |
| Portfolio turnover rate | 66% | | 70%(d) | | 17%(d) | | 29%(d) |
| Net assets at end of period (in 000’s) | $ 6,185 | | $ 5,542 | | $ 1,759 | | $ 3,211 |
| ^ | Inception date. |
| ‡ | Less than one cent per share. |
| (a) | Per share data based on average shares outstanding during the period. |
| (b) | Total investment return is calculated exclusive of sales charges and assumes the reinvestment of dividends and distributions. Class R6 shares are not subject to sales charges. For periods of less than one year, total return is not annualized. |
| (c) | In addition to the fees and expenses which the Fund bears directly, it also indirectly bears a pro-rata share of the fees and expenses of the underlying funds in which it invests. Such indirect expenses are not included in the above expense ratios. |
| (d) | The portfolio turnover rate includes variable rate demand notes. |
The notes to the financial statements are an integral part of, and should be read in conjunction with, the financial statements.
33
Notes to Financial Statements
Note 1-Organization and Business
MainStay Funds Trust (the “Trust”) was organized as a Delaware statutory trust on April 28, 2009. The Trust is registered under the Investment Company Act of 1940, as amended (the “1940 Act”), as an open-end management investment company, and is comprised of thirty-seven funds (collectively referred to as the “Funds”). These financial statements and notes relate to the MainStay MacKay California Tax Free Opportunities Fund (the "Fund"), a “diversified” fund, as that term is defined in the 1940 Act, as interpreted or modified by regulatory authorities having jurisdiction, from time to time.
The following table lists the Fund's share classes that have been registered and commenced operations:
| Class | Commenced Operations |
| Class A | February 28, 2013 |
| Investor Class | February 28, 2013 |
| Class C | February 28, 2013 |
| Class C2 | August 31, 2020 |
| Class I | February 28, 2013 |
| Class R6 | November 1, 2019 |
Class A and Investor Class shares are offered at net asset value (“NAV”) per share plus an initial sales charge. No initial sales charge applies to investments of $250,000 or more (and certain other qualified purchases) in Class A and Investor Class shares. However, a contingent deferred sales charge (“CDSC”) of 1.00% may be imposed on certain redemptions made within 18 months of the date of purchase on shares that were purchased without an initial sales charge. Class C and Class C2 shares are offered at NAV without an initial sales charge, although a 1.00% CDSC may be imposed on certain redemptions of such shares made within one year of the date of purchase of Class C and Class C2 shares. Class I and Class R6 shares are offered at NAV without a sales charge. In addition, depending upon eligibility, Class C and Class C2 shares convert to either Class A or Investor Class shares at the end of the calendar quarter eight years after the date they were purchased. Additionally, Investor Class shares may convert automatically to Class A shares based on a shareholder’s account balance as described in the Fund’s prospectus. Under certain circumstances and as may be permitted by the Trust’s multiple class plan pursuant to Rule 18f-3 under the 1940 Act, specified share classes of the Fund may be converted to one or more other share classes of the Fund as disclosed in the capital share transactions within these Notes. The classes of shares have the same voting (except for issues that relate solely to one class), dividend, liquidation and other rights, and the same terms and conditions, except that under distribution plans pursuant to Rule 12b-1 under the 1940 Act, Class C and Class C2 shares are subject to higher distribution and/or service fees than Class A and Investor Class shares. Class I and Class R6 shares are not subject to a distribution and/or service fee.
The Fund's investment objective is to seek current income exempt from federal and California income taxes.
Note 2–Significant Accounting Policies
The Fund is an investment company and accordingly follows the investment company accounting and reporting guidance of the Financial Accounting Standards Board (“FASB”) Accounting Standards Codification Topic 946 Financial Services—Investment Companies. The Fund prepares its financial statements in accordance with generally accepted accounting principles (“GAAP”) in the United States of America and follows the significant accounting policies described below.
(A) Securities Valuation. Investments are usually valued as of the close of regular trading on the New York Stock Exchange (the "Exchange") (usually 4:00 p.m. Eastern time) on each day the Fund is open for business ("valuation date").
Pursuant to Rule 2a-5 under the 1940 Act, the Board of Trustees of the Trust (the "Board") has designated New York Life Investment Management LLC (“New York Life Investments” or the "Manager") as its Valuation Designee (the "Valuation Designee"). The Valuation Designee is responsible for performing fair valuations relating to all investments in the Fund’s portfolio for which market quotations are not readily available; periodically assessing and managing material valuation risks; establishing and applying fair value methodologies; testing fair valuation methodologies; evaluating and overseeing pricing services; ensuring appropriate segregation of valuation and portfolio management functions; providing quarterly, annual and prompt reporting to the Board, as appropriate; identifying potential conflicts of interest; and maintaining appropriate records. The Valuation Designee has established a valuation committee ("Valuation Committee") to assist in carrying out the Valuation Designee’s responsibilities and establish prices of securities for which market quotations are not readily available. The Fund's and the Valuation Designee's policies and procedures ("Valuation Procedures") govern the Valuation Designee’s selection and application of methodologies for determining and calculating the fair value of Fund investments. The Valuation Designee may value the Fund's portfolio securities for which market quotations are not readily available and other Fund assets utilizing inputs from pricing services and other third-party sources. The Valuation Committee meets (in person, via electronic mail or via teleconference) on an ad-hoc basis to determine fair valuations and on a quarterly basis to review fair value events with respect to certain securities for which market quotations are not readily available, including valuation risks and back-testing results, and preview reports to the Board.
The Valuation Committee establishes prices of securities for which market quotations are not readily available based on such methodologies and measurements on a regular basis after considering information that is reasonably available and deemed relevant by the Valuation Committee. The Board shall oversee the Valuation Designee and review fair valuation materials on a prompt, quarterly and annual basis and approve proposed revisions to the Valuation Procedures.
Investments for which market quotations are not readily available are valued at fair value as determined in good faith pursuant to the Valuation Procedures. A market quotation is readily available only when that
| 34 | MainStay MacKay California Tax Free Opportunities Fund |
quotation is a quoted price (unadjusted) in active markets for identical investments that the Fund can access at the measurement date, provided that a quotation will not be readily available if it is not reliable. "Fair value" is defined as the price the Fund would reasonably expect to receive upon selling an asset or liability in an orderly transaction to an independent buyer in the principal or most advantageous market for the asset or liability. Fair value measurements are determined within a framework that establishes a three-tier hierarchy that maximizes the use of observable market data and minimizes the use of unobservable inputs to establish a classification of fair value measurements for disclosure purposes. "Inputs" refer broadly to the assumptions that market participants would use in pricing the asset or liability, including assumptions about risk, such as the risk inherent in a particular valuation technique used to measure fair value using a pricing model and/or the risk inherent in the inputs for the valuation technique. Inputs may be observable or unobservable. Observable inputs reflect the assumptions market participants would use in pricing the asset or liability based on market data obtained from sources independent of the Fund. Unobservable inputs reflect the Fund’s own assumptions about the assumptions market participants would use in pricing the asset or liability based on the information available. The inputs or methodology used for valuing assets or liabilities may not be an indication of the risks associated with investing in those assets or liabilities. The three-tier hierarchy of inputs is summarized below.
| • | Level 1—quoted prices (unadjusted) in active markets for an identical asset or liability |
| • | Level 2—other significant observable inputs (including quoted prices for a similar asset or liability in active markets, interest rates and yield curves, prepayment speeds, credit risk, etc.) |
| • | Level 3—significant unobservable inputs (including the Fund's own assumptions about the assumptions that market participants would use in measuring fair value of an asset or liability) |
The level of an asset or liability within the fair value hierarchy is based on the lowest level of an input, both individually and in the aggregate, that is significant to the fair value measurement. The aggregate value by input level of the Fund’s assets and liabilities as of October 31, 2023, is included at the end of the Portfolio of Investments.
The Fund may use third-party vendor evaluations, whose prices may be derived from one or more of the following standard inputs, among others:
| • Benchmark yields | • Reported trades |
| • Broker/dealer quotes | • Issuer spreads |
| • Two-sided markets | • Benchmark securities |
| • Bids/offers | • Reference data (corporate actions or material event notices) |
| • Industry and economic events | • Comparable bonds |
| • Monthly payment information | |
An asset or liability for which a market quotation is not readily available is valued by methods deemed reasonable in good faith by the Valuation Committee, following the Valuation Procedures to represent fair value.
Under these procedures, the Valuation Designee generally uses a market-based approach which may use related or comparable assets or liabilities, recent transactions, market multiples, book values and other relevant information. The Valuation Designee may also use an income-based valuation approach in which the anticipated future cash flows of the asset or liability are discounted to calculate fair value. Discounts may also be applied due to the nature and/or duration of any restrictions on the disposition of the asset or liability. Fair value represents a good faith approximation of the value of a security. Fair value determinations involve the consideration of a number of subjective factors, an analysis of applicable facts and circumstances and the exercise of judgment. As a result, it is possible that the fair value for a security determined in good faith in accordance with the Valuation Procedures may differ from valuations for the same security determined for other funds using their own valuation procedures. Although the Valuation Procedures are designed to value a security at the price the Fund may reasonably expect to receive upon the security's sale in an orderly transaction, there can be no assurance that any fair value determination thereunder would, in fact, approximate the amount that the Fund would actually realize upon the sale of the security or the price at which the security would trade if a reliable market price were readily available. During the year ended October 31, 2023, there were no material changes to the fair value methodologies.
Securities which may be valued in this manner include, but are not limited to: (i) a security for which trading has been halted or suspended or otherwise does not have a readily available market quotation on a given day; (ii) a debt security that has recently gone into default and for which there is not a current market quotation; (iii) a security of an issuer that has entered into a restructuring; (iv) a security that has been delisted from a national exchange; (v) a security subject to trading collars for which no or limited trading takes place; and (vi) a security whose principal market has been temporarily closed at a time when, under normal conditions, it would be open. Securities valued in this manner are generally categorized as Level 2 or 3 in the hierarchy. No securities held by the Fund as of October 31, 2023, were fair valued in such a manner.
Investments in mutual funds, including money market funds, are valued at their respective NAVs at the close of business each day on the valuation date. These securities are generally categorized as Level 1 in the hierarchy.
Futures contracts are valued at the last posted settlement price on the market where such futures are primarily traded. These securities are generally categorized as Level 1 in the hierarchy.
Municipal debt securities are valued at the evaluated mean prices supplied by a pricing agent or broker selected by the Valuation Designee, in consultation with the Subadvisor. The evaluations are market-based measurements processed through a pricing application and represents the pricing agent's good faith determination as to what a holder may receive in an orderly transaction under market conditions. The rules-based logic utilizes valuation techniques that reflect participants' assumptions and vary by asset class and per methodology, maximizing
Notes to Financial Statements (continued)
the use of relevant observable data including quoted prices for similar assets, benchmark yield curves and market corroborated inputs. The evaluated bid or mean prices are deemed by the Valuation Designee, in consultation with the Subadvisor, to be representative of market values, at the regular close of trading of the Exchange on each valuation date. Municipal debt securities purchased on a delayed delivery basis are marked to market daily until settlement at the forward settlement date. Municipal debt securities are generally categorized as Level 2 in the hierarchy.
Temporary cash investments acquired in excess of 60 days to maturity at the time of purchase are valued using the latest bid prices or using valuations based on a matrix system (which considers such factors as security prices, yields, maturities and ratings), both as furnished by independent pricing services. Temporary cash investments that mature in 60 days or less at the time of purchase ("Short-Term Investments") are valued using the amortized cost method of valuation, unless the use of such method would be inappropriate. The amortized cost method involves valuing a security at its cost on the date of purchase and thereafter assuming a constant amortization to maturity of the difference between such cost and the value on maturity date. Amortized cost approximates the current fair value of a security. Securities valued using the amortized cost method are not valued using quoted prices in an active market and are generally categorized as Level 2 in the hierarchy.
The information above is not intended to reflect an exhaustive list of the methodologies that may be used to value portfolio investments. The Valuation Procedures permit the use of a variety of valuation methodologies in connection with valuing portfolio investments. The methodology used for a specific type of investment may vary based on the market data available or other considerations. The methodologies summarized above may not represent the specific means by which portfolio investments are valued on any particular business day.
(B) Income Taxes. The Fund's policy is to comply with the requirements of the Internal Revenue Code of 1986, as amended (the “Internal Revenue Code”), applicable to regulated investment companies and to distribute all of its taxable income to the shareholders of the Fund within the allowable time limits.
The Manager evaluates the Fund’s tax positions to determine if the tax positions taken meet the minimum recognition threshold in connection with accounting for uncertainties in income tax positions taken or expected to be taken for the purposes of measuring and recognizing tax liabilities in the financial statements. Recognition of tax benefits of an uncertain tax position is permitted only to the extent the position is “more likely than not” to be sustained assuming examination by taxing authorities. The Manager analyzed the Fund's tax positions taken on federal, state and local income tax returns for all open tax years (for up to three tax years) and has concluded that no provisions for federal, state and local income tax are required in the Fund's financial statements. The Fund's federal, state and local income tax and federal excise tax returns for tax years for which the applicable statutes of limitations have not
expired are subject to examination by the Internal Revenue Service and state and local departments of revenue.
(C) Dividends and Distributions to Shareholders. Dividends and distributions are recorded on the ex-dividend date. The Fund intends to declare dividends from net investment income, if any, daily and intends to pay them at least monthly and declares and pays distributions from net realized capital gains, if any, at least annually. Unless a shareholder elects otherwise, all dividends and distributions are reinvested at NAV in the same class of shares of the Fund. Dividends and distributions to shareholders are determined in accordance with federal income tax regulations and may differ from determinations using GAAP.
(D) Security Transactions and Investment Income. The Fund records security transactions on the trade date. Realized gains and losses on security transactions are determined using the identified cost method. Discounts and premiums on securities purchased, other than temporary cash investments that mature in 60 days or less at the time of purchase, for the Fund are accreted and amortized, respectively, on the effective interest rate method.
Investment income and realized and unrealized gains and losses on investments of the Fund are allocated pro rata to the separate classes of shares based upon their relative net assets on the date the income is earned or realized and unrealized gains and losses are incurred.
The Fund may place a debt security on non-accrual status and reduce related interest income by ceasing current accruals and writing off all or a portion of any interest receivables when the collection of all or a portion of such interest has become doubtful. A debt security is removed from non-accrual status when the issuer resumes interest payments or when collectability of interest is reasonably assured.
(E) Expenses. Expenses of the Trust are allocated to the individual Funds in proportion to the net assets of the respective Funds when the expenses are incurred, except where direct allocations of expenses can be made. Expenses (other than transfer agent expenses and fees incurred under the shareholder services plans and/or the distribution plans further discussed in Note 3(B)) are allocated to separate classes of shares pro rata based upon their relative net assets on the date the expenses are incurred. The expenses borne by the Fund, including those of related parties to the Fund, are shown in the Statement of Operations.
Additionally, the Fund may invest in mutual funds, which are subject to management fees and other fees that may cause the costs of investing in mutual funds to be greater than the costs of owning the underlying securities directly. These indirect expenses of mutual funds are not included in the amounts shown as expenses in the Statement of Operations or in the expense ratios included in the Financial Highlights.
(F) Use of Estimates. In preparing financial statements in conformity with GAAP, the Manager makes estimates and assumptions that affect the reported amounts and disclosures in the financial statements. Actual results could differ from those estimates and assumptions.
| 36 | MainStay MacKay California Tax Free Opportunities Fund |
(G) Futures Contracts. A futures contract is an agreement to purchase or sell a specified quantity of an underlying instrument at a specified future date and price, or to make or receive a cash payment based on the value of a financial instrument (e.g., foreign currency, interest rate, security or securities index). The Fund is subject to risks such as market price risk, leverage risk, liquidity risk, counterparty risk, operational risk, legal risk and/or interest rate risk in the normal course of investing in these contracts. Upon entering into a futures contract, the Fund is required to pledge to the broker or futures commission merchant an amount of cash and/or U.S. government securities equal to a certain percentage of the collateral amount, known as the “initial margin.” During the period the futures contract is open, changes in the value of the contract are recognized as unrealized appreciation or depreciation by marking to market such contract on a daily basis to reflect the market value of the contract at the end of each day’s trading. The Fund agrees to receive from or pay to the broker or futures commission merchant an amount of cash equal to the daily fluctuation in the value of the contract. Such receipts or payments are known as “variation margin.” When the futures contract is closed, the Fund records a realized gain or loss equal to the difference between the proceeds from (or cost of) the closing transaction and the Fund's basis in the contract.
The use of futures contracts involves, to varying degrees, elements of market risk in excess of the amount recognized in the Statement of Assets and Liabilities. The contract or notional amounts and variation margin reflect the extent of the Fund's involvement in open futures positions. There are several risks associated with the use of futures contracts as hedging techniques. There can be no assurance that a liquid market will exist at the time when the Fund seeks to close out a futures contract. If no liquid market exists, the Fund would remain obligated to meet margin requirements until the position is closed. Futures contracts may involve a small initial investment relative to the risk assumed, which could result in losses greater than if the Fund did not invest in futures contracts. Futures contracts may be more volatile than direct investments in the instrument underlying the futures and may not correlate to the underlying instrument, causing a given hedge not to achieve its objectives. The Fund's activities in futures contracts have minimal counterparty risk as they are conducted through regulated exchanges that guarantee the futures against default by the counterparty. In the event of a bankruptcy or insolvency of a futures commission merchant that holds margin on behalf of the Fund, the Fund may not be entitled to the return of the entire margin owed to the Fund, potentially resulting in a loss. The Fund may invest in futures contracts to seek enhanced returns or to reduce the risk of loss by hedging certain of its holdings. The Fund's investment in futures contracts and other derivatives may increase the volatility of the Fund's NAVs and may result in a loss to the Fund. Open futures contracts as of October 31, 2023, are shown in the Portfolio of Investments.
(H) Delayed Delivery Transactions. The Fund may purchase or sell securities on a delayed delivery basis. These transactions involve a commitment by the Fund to purchase or sell securities for a predetermined price or yield, with payment and delivery taking place
beyond the customary settlement period. When delayed delivery purchases are outstanding, the Fund will designate liquid assets in an amount sufficient to meet the purchase price. When purchasing a security on a delayed delivery basis, the Fund assumes the rights and risks of ownership of the security, including the risk of price and yield fluctuations, and takes such fluctuations into account when determining its NAV. The Fund may dispose of or renegotiate a delayed delivery transaction after it is entered into, and may sell delayed delivery securities before they are delivered, which may result in a realized gain or loss. When the Fund has sold a security it owns on a delayed delivery basis, the Fund does not participate in future gains and losses with respect to the security. Delayed delivery transactions as of October 31, 2023, are shown in the Portfolio of Investments.
(I) Municipal Bond Risk. The Fund may invest more heavily in municipal bonds from certain cities, states, territories or regions than others, which may increase the Fund’s exposure to losses resulting from economic, political, regulatory occurrences, or declines in tax revenue impacting these particular cities, states, territories or regions. In addition, many state and municipal governments that issue securities are under significant economic and financial stress and may not be able to satisfy their obligations, and these events may be made worse due to economic challenges posed by COVID-19. The Fund may invest a substantial amount of its assets in municipal bonds whose interest is paid solely from revenues of similar projects, such as tobacco settlement bonds. If the Fund concentrates its investments in this manner, it assumes the legal and economic risks relating to such projects and this may have a significant impact on the Fund’s investment performance.
Certain of the issuers in which the Fund may invest have recently experienced, or may experience, significant financial difficulties and repeated credit rating downgrades. On May 3, 2017, the Commonwealth of Puerto Rico (the "Commonwealth") began proceedings pursuant to the Puerto Rico Oversight, Management, and Economic Stability Act (“PROMESA”) to seek bankruptcy-type protections from approximately $74 billion in debt and approximately $48 billion in unfunded pension obligations. In addition, the current economic environment and the resulting pressure on Puerto Rico’s budget have further contributed to its financial challenges. Following the outbreak of COVID-19, the federal government passed certain relief packages, including the Coronavirus Aid, Relief, and Economic Security Act and the American Rescue Plan, which included an aggregate of more than $7 billion in disaster relief funds for the U.S. territories, including Puerto Rico. However, there can be no assurances that the federal funds allocated to the Commonwealth will be sufficient to address the long-term economic challenges that arose from COVID-19.
As of October 31, 2023 PREPA has remained in Title III Bankruptcy for over 6 years. A significant number of net revenue bond creditors, the Oversight Board, and the Commonwealth have been unable to reach a consensual resolution on PREPA’s debt restructuring following the termination of the previous 2019 PREPA Restructuring Support Agreement by the Commonwealth of Puerto Rico in March of 2022. On
Notes to Financial Statements (continued)
December 16, 2022, the Oversight Board filed a proposed plan of adjustment to restructure more than $10 billion of debt and other claims against PREPA. The plan of adjustment, amended in March, proposed to cut PREPA’s unsustainable debt to approximately $5.68 billion.
Bankruptcy litigation has ensued between the Oversight Board and a group of net revenue bond creditors over the security provisions of PREPA’s $8.3 billion of net revenue bonds resulting in a ruling in March that PREPA’s net revenue bonds are unsecured.
In June of 2023, a claims estimation hearing resulted in a ruling that PREPA’s now asserted unsecured net revenue bond claim was valued at approximately 2.383 billion, which is only 28.3% of the full pre-petition claim asserted by net revenue bond holders. Due to the lower claims estimation ruling, at the end of August 2023 the Oversight Board filed a new proposed plan of adjustment to reflect the March lien ruling and June estimation hearing with lower recovery amounts afforded to net revenue bond holders. In conjunction with the new proposed plan of adjustment, a subset of the original litigating PREPA creditors entered into Planned Support Agreements (”PSAs”) supporting the new proposed plan of adjustment.
However, following the new proposed plan of adjustment, a significant amount of creditors not previously involved in the PREPA bankruptcy have objected to the revised plan of adjustment, including the MainStay MacKay Municipal Bond Funds.
Objecting creditors are appealing several rulings, including the March net revenue bond lien ruling, the June net revenue bond claims estimation ruling, and the November disclosure statement approval ruling that provides for a plan with disparate recoveries for the same creditors. Objecting creditors believe the PREPA bankruptcy plan of adjustment is un-confirmable and these rulings will be overturned on appeal, but there is no certainty that objecting creditors will be successful in appealing these rulings, or if overturned, these creditors will receive the relief sought. The proposed PREPA August plan of adjustment provides 3.5% of cash recovery for objecting creditors to the plan as opposed to 12.5% of cash recovery for consenting creditors who have not previously settled. Bankruptcy plan confirmation hearings are currently scheduled to begin in March of 2024.
The Fund’s vulnerability to potential losses associated with such developments may be reduced through investing in municipal securities that feature credit enhancements (such as bond insurance). The bond insurance provider pays both principal and interest when due to the bond holder. The magnitude of Puerto Rico’s debt restructuring or other adverse economic developments could pose significant strains on the ability of municipal securities insurers to meet all future claims. As of October 31, 2023, the Fund's total Puerto Rico investments is 3.5% of total investments, with 9.1% of that amount insured.
(J) Indemnifications. Under the Trust’s organizational documents, its officers and trustees are indemnified against certain liabilities that may arise out of performance of their duties to the Trust. Additionally, in the normal course of business, the Fund enters into contracts with third-party
service providers that contain a variety of representations and warranties and that may provide general indemnifications. The Fund's maximum exposure under these arrangements is unknown, as this would involve future claims that may be made against the Fund that have not yet occurred. The Manager believes that the risk of loss in connection with these potential indemnification obligations is remote. However, there can be no assurance that material liabilities related to such obligations will not arise in the future, which could adversely impact the Fund.
(K) Quantitative Disclosure of Derivative Holdings. The following tables show additional disclosures related to the Fund's derivative and hedging activities, including how such activities are accounted for and their effect on the Fund's financial positions, performance and cash flows.
The Fund entered into futures contracts to help manage the duration and yield curve positioning of the portfolio. These derivatives are not accounted for as hedging instruments.
Fair value of derivative instruments as of October 31, 2023:
| Asset Derivatives | Interest
Rate
Contracts
Risk | Total |
| Futures Contracts - Net Assets—Net unrealized appreciation on futures contracts (a) | $358,908 | $358,908 |
| Total Fair Value | $358,908 | $358,908 |
| (a) | Includes cumulative appreciation (depreciation) of futures contracts as reported in the Portfolio of Investments. Only current day’s variation margin is reported within the Statement of Assets and Liabilities. |
The effect of derivative instruments on the Statement of Operations for the year ended October 31, 2023:
| Net Realized Gain (Loss) from: | Interest
Rate
Contracts
Risk | Total |
| Futures Transactions | $2,091,869 | $2,091,869 |
| Total Net Realized Gain (Loss) | $2,091,869 | $2,091,869 |
| Net Change in Unrealized Appreciation (Depreciation) | Interest
Rate
Contracts
Risk | Total |
| Futures Contracts | $(3,696,428) | $(3,696,428) |
| Total Net Change in Unrealized Appreciation (Depreciation) | $(3,696,428) | $(3,696,428) |
| Average Notional Amount | Total |
| Futures Contracts Short | $(67,320,781) |
| 38 | MainStay MacKay California Tax Free Opportunities Fund |
Note 3–Fees and Related Party Transactions
(A) Manager and Subadvisor. New York Life Investments, a registered investment adviser and an indirect, wholly-owned subsidiary of New York Life Insurance Company ("New York Life"), serves as the Fund's Manager, pursuant to an Amended and Restated Management Agreement ("Management Agreement"). The Manager provides offices, conducts clerical, recordkeeping and bookkeeping services and keeps most of the financial and accounting records required to be maintained by the Fund. Except for the portion of salaries and expenses that are the responsibility of the Fund, the Manager pays the salaries and expenses of all personnel affiliated with the Fund and certain operational expenses of the Fund. The Fund reimburses New York Life Investments in an amount equal to the portion of the compensation of the Chief Compliance Officer attributable to the Fund. MacKay Shields LLC ("MacKay Shields" or the "Subadvisor"), a registered investment adviser and an indirect, wholly-owned subsidiary of New York Life, serves as the Subadvisor to the Fund and is responsible for the day-to-day portfolio management of the Fund. Pursuant to the terms of an Amended and Restated Subadvisory Agreement ("Subadvisory Agreement") between New York Life Investments and MacKay Shields, New York Life Investments pays for the services of the Subadvisor.
Pursuant to the Management Agreement, the Fund pays the Manager a monthly fee for the services performed and the facilities furnished at an annual rate of the Fund’s average daily net assets as follows: 0.45% up to $ 1 billion; 0.43% from $1 billion up to $3 billion and 0.42% in excess of $3 billion. During the year ended October 31, 2023, the effective management fee rate was 0.45% of the Fund’s average daily net assets, exclusive of any applicable waivers/reimbursements.
New York Life Investments has contractually agreed to waive fees and/or reimburse expenses so that Total Annual Fund Operating Expenses (excluding taxes, interest, litigation, extraordinary expenses, brokerage and other transaction expenses relating to the purchase or sale of portfolio investments and acquired (underlying) fund fees and expenses) of Class A shares do not exceed 0.75% of its average daily net assets. New York Life Investments will apply an equivalent waiver or reimbursement, in an equal number of basis points to Investor Class, Class C, Class C2 and Class I shares. New York Life Investments has contractually agreed to waive fees and/or reimburse expenses so that Total Annual Fund Operating Expenses (excluding taxes, interest, litigation, extraordinary expenses, brokerage and other transaction expenses relating to the purchase or sale of portfolio investments, and acquired (underlying) fund fees and expenses) of Class R6 do not exceed those of Class I. These agreements will remain in effect until February 28, 2024, and shall renew automatically for one-year terms unless New York Life Investments provides written notice of termination prior to the start of the next term or upon approval of the Board.
During the year ended October 31, 2023, New York Life Investments earned fees from the Fund in the amount of $4,682,691 and waived fees and/or reimbursed expenses in the amount of $175,377 and paid the Subadvisor fees in the amount of $2,253,657.
JPMorgan Chase Bank, N.A. ("JPMorgan") provides sub-administration and sub-accounting services to the Fund pursuant to an agreement with New York Life Investments. These services include calculating the daily NAVs of the Fund, maintaining the general ledger and sub-ledger accounts for the calculation of the Fund's NAVs, and assisting New York Life Investments in conducting various aspects of the Fund's administrative operations. For providing these services to the Fund, JPMorgan is compensated by New York Life Investments.
Pursuant to an agreement between the Trust and New York Life Investments, New York Life Investments is responsible for providing or procuring certain regulatory reporting services for the Fund. The Fund will reimburse New York Life Investments for the actual costs incurred by New York Life Investments in connection with providing or procuring these services for the Fund.
(B) Distribution and Service Fees. The Trust, on behalf of the Fund, has entered into a distribution agreement with NYLIFE Distributors LLC (the “Distributor”), an affiliate of New York Life Investments. The Fund has adopted distribution plans (the “Plans”) in accordance with the provisions of Rule 12b-1 under the 1940 Act.
Pursuant to the Class A and Investor Class Plans, the Distributor receives a monthly fee from Class A and Investor Class shares at an annual rate of 0.25% of the average daily net assets of the Class A and Investor Class shares for distribution and/or service activities as designated by the Distributor. Pursuant to the Class C Plan, Class C shares pay the Distributor a monthly distribution fee at an annual rate of 0.25% of the average daily net assets of the Class C shares, along with a service fee at an annual rate of 0.25% of the average daily net assets of the Class C shares, for a total 12b-1 fee of 0.50%. Pursuant to the Class C2 Plan, Class C2 shares pay the Distributor a monthly distribution fee at an annual rate of 0.40% of the average daily net assets of the Class C2 shares, along with a service fee at an annual rate of 0.25% of the average daily net assets of the Class C2 shares, for a total 12b-1 fee of 0.65%. Class I and Class R6 shares are not subject to a distribution and/or service fee.
The Plans provide that the distribution and service fees are payable to the Distributor regardless of the amounts actually expended by the Distributor for distribution of the Fund's shares and service activities.
(C) Sales Charges. The Fund was advised by the Distributor that the amount of initial sales charges retained on sales of Class A and Investor Class shares during the year ended October 31, 2023, were $4,360 and $71, respectively.
The Fund was also advised that the Distributor retained CDSCs on redemptions of Class A and Class C shares during the year ended October 31, 2023, of $32,552 and $819, respectively.
(D) Transfer, Dividend Disbursing and Shareholder Servicing Agent. NYLIM Service Company LLC, an affiliate of New York Life Investments, is the Fund's transfer, dividend disbursing and shareholder servicing agent pursuant to an agreement between NYLIM Service
Notes to Financial Statements (continued)
Company LLC and the Trust. NYLIM Service Company LLC has entered into an agreement with SS&C Global Investor & Distribution Solutions, Inc. ("SS&C"), pursuant to which SS&C performs certain transfer agent services on behalf of NYLIM Service Company LLC. New York Life Investments has contractually agreed to limit the transfer agency expenses charged to the Fund’s share classes to a maximum of 0.35% of that share class’s average daily net assets on an annual basis after deducting any applicable Fund or class-level expense reimbursement or small account fees. This agreement will remain in effect until February 28, 2024, and shall renew automatically for one-year terms unless New York Life Investments provides written notice of termination prior to the start of the next term or upon approval of the Board. During the year ended October 31, 2023, transfer agent expenses incurred by the Fund and any reimbursements, pursuant to the aforementioned Transfer Agency expense limitation agreement, were as follows:
| Class | Expense | Waived |
| Class A | $147,097 | $— |
| Investor Class | 309 | — |
| Class C | 21,831 | — |
| Class C2 | 1,111 | — |
| Class I | 215,697 | — |
| Class R6 | 224 | — |
(E) Small Account Fee. Shareholders with small accounts adversely impact the cost of providing transfer agency services. In an effort to reduce total transfer agency expenses, the Fund has implemented a small account fee on certain types of accounts. As described in the Fund's prospectus, certain shareholders with an account balance of less than $1,000 ($5,000 for Class A share accounts) are charged an annual per account fee of $20 (assessed semi-annually), the proceeds from which offset transfer agent fees as reflected in the Statement of Operations. This small account fee will not apply to certain types of accounts as described further in the Fund’s prospectus.
(F) Capital. As of October 31, 2023, New York Life and its affiliates beneficially held shares of the Fund with the values and percentages of net assets as follows:
| Class C2 | $22,339 | 1.0% |
| Class R6 | 23,488 | 0.4 |
Note 4-Federal Income Tax
As of October 31, 2023, the cost and unrealized appreciation (depreciation) of the Fund’s investment portfolio, including applicable derivative contracts and other financial instruments, as determined on a federal income tax basis, were as follows:
| | Federal Tax
Cost | Gross
Unrealized
Appreciation | Gross
Unrealized
(Depreciation) | Net
Unrealized
Appreciation/
(Depreciation) |
| Investments in Securities | $1,065,693,412 | $1,014,623 | $(62,536,369) | $(61,521,746) |
As of October 31, 2023, the components of accumulated gain (loss) on a tax basis were as follows:
Ordinary
Income | Undistributed
Tax Exempt
Income | Accumulated
Capital
and Other
Gain (Loss) | Other
Temporary
Differences | Unrealized
Appreciation
(Depreciation) | Total
Accumulated
Gain (Loss) |
| $— | $741,294 | $(124,211,026) | $(723,329) | $(61,521,746) | $(185,714,807) |
The difference between book-basis and tax-basis unrealized appreciation (depreciation) is primarily due to cumulative bond amortization.
As of October 31, 2023, for federal income tax purposes, capital loss carryforwards of $124,211,026, as shown in the table below, were available to the extent provided by the regulations to offset future realized gains of the Fund. Accordingly, no capital gains distributions are expected to be paid to shareholders until net gains have been realized in excess of such amounts.
Capital Loss
Available Through | Short-Term
Capital Loss
Amounts (000’s) | Long-Term
Capital Loss
Amounts (000’s) |
| Unlimited | $57,535 | $66,676 |
During the years ended October 31, 2023 and October 31, 2022, the tax character of distributions paid as reflected in the Statements of Changes in Net Assets was as follows:
| | 2023 | 2022 |
| Distributions paid from: | | |
| Ordinary Income | $ 977,265 | $ 805,072 |
| Exempt Interest Dividends | 36,851,804 | 31,799,213 |
| Total | $37,829,069 | $32,604,285 |
Note 5–Custodian
JPMorgan is the custodian of cash and securities held by the Fund. Custodial fees are charged to the Fund based on the Fund's net assets and/or the market value of securities held by the Fund and the number of certain transactions incurred by the Fund.
| 40 | MainStay MacKay California Tax Free Opportunities Fund |
Note 6–Line of Credit
The Fund and certain other funds managed by New York Life Investments maintain a line of credit with a syndicate of banks in order to secure a source of funds for temporary purposes to meet unanticipated or excessive redemption requests.
Effective July 25, 2023, under the credit agreement (the “Credit Agreement”), the aggregate commitment amount is $600,000,000 with an additional uncommitted amount of $100,000,000. The commitment fee is an annual rate of 0.15% of the average commitment amount payable quarterly, regardless of usage, to JPMorgan, who serves as the agent to the syndicate. The commitment fee is allocated among the Fund and certain other funds managed by New York Life Investments based upon their respective net assets and other factors. Interest on any revolving credit loan is charged based upon the Federal Funds Rate, Daily Simple Secured Overnight Financing Rate ("SOFR") + 0.10%, or the Overnight Bank Funding Rate, whichever is higher. The Credit Agreement expires on July 23, 2024, although the Fund, certain other funds managed by New York Life Investments and the syndicate of banks may renew the Credit Agreement for an additional year on the same or different terms or enter into a credit agreement with a different syndicate of banks. Prior to July 25, 2023, the aggregate commitment amount and the commitment fee were the same as those under the current Credit Agreement. During the year ended October 31, 2023, there were no borrowings made or outstanding with respect to the Fund under the Credit Agreement.
Note 7–Interfund Lending Program
Pursuant to an exemptive order issued by the SEC, the Fund, along with certain other funds managed by New York Life Investments, may participate in an interfund lending program. The interfund lending program provides an alternative credit facility that permits the Fund and certain other funds managed by New York Life Investments to lend or borrow money for temporary purposes directly to or from one another, subject to the conditions of the exemptive order. During the year ended October 31, 2023, there were no interfund loans made or outstanding with respect to the Fund.
Note 8–Purchases and Sales of Securities (in 000’s)
During the year ended October 31, 2023, purchases and sales of securities, other than short-term securities, were $696,554 and $665,069, respectively.
Note 9–Capital Share Transactions
Transactions in capital shares for the years ended October 31, 2023 and October 31, 2022, were as follows:
| Class A | Shares | Amount |
| Year ended October 31, 2023: | | |
| Shares sold | 17,324,094 | $ 162,169,098 |
| Shares issued to shareholders in reinvestment of distributions | 1,334,292 | 12,668,620 |
| Shares redeemed | (19,318,887) | (181,429,974) |
| Shares converted into Class A (See Note 1) | 99,379 | 969,646 |
| Shares converted from Class A (See Note 1) | (4,004) | (39,036) |
| Net increase (decrease) | (565,126) | $ (5,661,646) |
| Year ended October 31, 2022: | | |
| Shares sold | 19,936,744 | $ 191,379,570 |
| Shares issued to shareholders in reinvestment of distributions | 907,820 | 9,005,771 |
| Shares redeemed | (17,665,075) | (174,189,542) |
| Net increase (decrease) in shares outstanding before conversion | 3,179,489 | 26,195,799 |
| Shares converted into Class A (See Note 1) | 1,974 | 19,505 |
| Net increase (decrease) | 3,181,463 | $ 26,215,304 |
| |
| Investor Class | Shares | Amount |
| Year ended October 31, 2023: | | |
| Shares sold | 4,150 | $ 39,305 |
| Shares issued to shareholders in reinvestment of distributions | 1,760 | 16,720 |
| Shares redeemed | (9,497) | (90,292) |
| Shares converted into Investor Class (See Note 1) | 1,035 | 9,872 |
| Shares converted from Investor Class (See Note 1) | (4,037) | (38,998) |
| Net increase (decrease) | (6,589) | $ (63,393) |
| Year ended October 31, 2022: | | |
| Shares sold | 6,891 | $ 69,084 |
| Shares issued to shareholders in reinvestment of distributions | 1,450 | 14,374 |
| Shares redeemed | (6,634) | (65,508) |
| Net increase (decrease) in shares outstanding before conversion | 1,707 | 17,950 |
| Shares converted into Investor Class (See Note 1) | 2,286 | 21,835 |
| Net increase (decrease) | 3,993 | $ 39,785 |
| |
Notes to Financial Statements (continued)
| Class C | Shares | Amount |
| Year ended October 31, 2023: | | |
| Shares sold | 532,534 | $ 5,079,110 |
| Shares issued to shareholders in reinvestment of distributions | 95,332 | 905,763 |
| Shares redeemed | (1,028,354) | (9,799,048) |
| Shares converted from Class C (See Note 1) | (12,887) | (123,665) |
| Net increase (decrease) | (413,375) | $ (3,937,840) |
| Year ended October 31, 2022: | | |
| Shares sold | 446,504 | $ 4,423,363 |
| Shares issued to shareholders in reinvestment of distributions | 90,527 | 901,967 |
| Shares redeemed | (2,008,512) | (20,002,452) |
| Net increase (decrease) in shares outstanding before conversion | (1,471,481) | (14,677,122) |
| Shares converted from Class C (See Note 1) | (4,259) | (41,340) |
| Net increase (decrease) | (1,475,740) | $ (14,718,462) |
| |
| Class C2 | Shares | Amount |
| Year ended October 31, 2023: | | |
| Shares sold | 228,370 | $ 2,184,892 |
| Shares issued to shareholders in reinvestment of distributions | 5,559 | 52,634 |
| Shares redeemed | (33,076) | (316,300) |
| Net increase (decrease) | 200,853 | $ 1,921,226 |
| Year ended October 31, 2022: | | |
| Shares sold | 14,587 | $ 154,974 |
| Shares issued to shareholders in reinvestment of distributions | 840 | 8,264 |
| Shares redeemed | (507) | (4,957) |
| Net increase (decrease) | 14,920 | $ 158,281 |
| |
| Class I | Shares | Amount |
| Year ended October 31, 2023: | | |
| Shares sold | 44,846,864 | $ 426,734,056 |
| Shares issued to shareholders in reinvestment of distributions | 1,596,133 | 15,152,514 |
| Shares redeemed | (44,211,347) | (417,848,215) |
| Shares converted into Class I (See Note 1) | 4,004 | 39,036 |
| Shares converted from Class I (See Note 1) | (83,490) | (816,855) |
| Net increase (decrease) | 2,152,164 | $ 23,260,536 |
| Year ended October 31, 2022: | | |
| Shares sold | 41,708,471 | $ 413,825,062 |
| Shares issued to shareholders in reinvestment of distributions | 1,386,084 | 13,782,214 |
| Shares redeemed | (52,515,982) | (515,773,797) |
| Net increase (decrease) in shares outstanding before conversion | (9,421,427) | (88,166,521) |
| Shares converted from Class I (See Note 1) | (20,024) | (206,845) |
| Net increase (decrease) | (9,441,451) | $ (88,373,366) |
| |
| Class R6 | Shares | Amount |
| Year ended October 31, 2023: | | |
| Shares sold | 655,411 | $ 6,302,611 |
| Shares issued to shareholders in reinvestment of distributions | 20,325 | 192,803 |
| Shares redeemed | (602,761) | (5,691,276) |
| Net increase (decrease) | 72,975 | $ 804,138 |
| Year ended October 31, 2022: | | |
| Shares sold | 606,143 | $ 6,296,294 |
| Shares issued to shareholders in reinvestment of distributions | 15,818 | 155,707 |
| Shares redeemed | (188,889) | (1,831,587) |
| Net increase (decrease) in shares outstanding before conversion | 433,072 | 4,620,414 |
| Shares converted into Class R6 (See Note 1) | 20,024 | 206,845 |
| Net increase (decrease) | 453,096 | $ 4,827,259 |
Note 10–Other Matters
As of the date of this report, the Fund faces a heightened level of risk associated with current uncertainty, volatility and state of economies, financial markets, rising interest rates, and labor and health conditions around the world. Events such as war, acts of terrorism, recessions, rapid inflation, the imposition of international sanctions, earthquakes, hurricanes, epidemics and pandemics and other unforeseen natural or human disasters may have broad adverse social, political and economic effects on the global economy, which could negatively impact the value of the Fund's investments. Developments that disrupt global economies and financial markets may magnify factors that affect the Fund's performance.
Note 11–Subsequent Events
In connection with the preparation of the financial statements of the Fund as of and for the year ended October 31, 2023, events and transactions subsequent to October 31, 2023, through the date the financial statements were issued, have been evaluated by the Manager for possible adjustment and/or disclosure. No subsequent events requiring financial statement adjustment or disclosure have been identified.
| 42 | MainStay MacKay California Tax Free Opportunities Fund |
Report of Independent Registered Public Accounting Firm
To the Shareholders of the Fund and Board of Trustees
MainStay Funds Trust:
Opinion on the Financial Statements
We have audited the accompanying statement of assets and liabilities of MainStay MacKay California Tax Free Opportunities Fund (the Fund), one of the funds constituting MainStay Funds Trust, including the portfolio of investments, as of October 31, 2023, the related statement of operations for the year then ended, the statements of changes in net assets for each of the years in the two-year period then ended, and the related notes (collectively, the financial statements) and the financial highlights for each of the years or periods in the five-year period then ended. In our opinion, the financial statements and financial highlights present fairly, in all material respects, the financial position of the Fund as of October 31, 2023, the results of its operations for the year then ended, the changes in its net assets for each of the years in the two-year period then ended, and the financial highlights for each of the years or periods in the five-year period then ended, in conformity with U.S. generally accepted accounting principles.
Basis for Opinion
These financial statements and financial highlights are the responsibility of the Fund's management. Our responsibility is to express an opinion on these financial statements and financial highlights based on our audits. We are a public accounting firm registered with the Public Company Accounting Oversight Board (United States) (PCAOB) and are required to be independent with respect to the Fund in accordance with the U.S. federal securities laws and the applicable rules and regulations of the Securities and Exchange Commission and the PCAOB.
We conducted our audits in accordance with the standards of the PCAOB. Those standards require that we plan and perform the audit to obtain reasonable assurance about whether the financial statements and financial highlights are free of material misstatement, whether due to error or fraud. Our audits included performing procedures to assess the risks of material misstatement of the financial statements and financial highlights, whether due to error or fraud, and performing procedures that respond to those risks. Such procedures included examining, on a test basis, evidence regarding the amounts and disclosures in the financial statements and financial highlights. Such procedures also included confirmation of securities owned as of October 31, 2023, by correspondence with the custodian, transfer agent, and brokers; when replies were not received from brokers, we performed other auditing procedures. Our audits also included evaluating the accounting principles used and significant estimates made by management, as well as evaluating the overall presentation of the financial statements and financial highlights. We believe that our audits provide a reasonable basis for our opinion.

We have served as the auditor of one or more New York Life Investment Management investment companies since 2003.
Philadelphia, Pennsylvania
December 22, 2023
Federal Income Tax Information
(Unaudited)
The Fund is required under the Internal Revenue Code to advise shareholders in a written statement as to the federal tax status of dividends paid by the Fund during such fiscal years.
For Federal individual income tax purposes, the Fund designated 97.4% of the ordinary income dividends paid during its fiscal year ended October 31, 2023 as attributable to interest income from Tax Exempt Municipal Bonds. Such dividends are currently exempt from Federal income taxes under Section 103(a) of the Internal Revenue Code.
In February 2024, shareholders will receive an IRS Form 1099-DIV or substitute Form 1099, which will show the federal tax status of the distributions received by shareholders in calendar year 2023. The amounts that will be reported on such 1099-DIV or substitute Form 1099 will be the amounts you are to use on your federal income tax return and will differ from the amounts which we must report for the Fund's fiscal year ended October 31, 2023.
Proxy Voting Policies and Procedures and Proxy Voting Record
The Fund is required to file with the SEC its proxy voting record for the 12-month period ending June 30 on Form N-PX. A description of the policies and procedures that are used to vote proxies relating to portfolio securities of the Fund is available free of charge upon request by calling 800-624-6782 or visiting the SEC’s website at www.sec.gov. The most recent Form N-PX or proxy voting record is available free of charge upon request by calling 800-624-6782; visiting newyorklifeinvestments.com; or visiting the SEC’s website at www.sec.gov.
Shareholder Reports and Quarterly Portfolio Disclosure
The Fund is required to file its complete schedule of portfolio holdings with the SEC 60 days after its first and third fiscal quarter on Form N-PORT. The Fund's holdings report is available free of charge upon request by calling New York Life Investments at 800-624-6782.
| 44 | MainStay MacKay California Tax Free Opportunities Fund |
Board of Trustees and Officers (Unaudited)
The Trustees and officers of the Fund are listed below. The Board oversees the MainStay Group of Funds (which consists of MainStay Funds and MainStay Funds Trust), MainStay VP Funds Trust, MainStay MacKay DefinedTerm Municipal Opportunities Fund, MainStay CBRE Global Infrastructure Megatrends Term Fund, the Manager and the Subadvisors, and elects the officers of the Funds who are responsible for the day-to-day operations of the Fund. Information pertaining to the Trustees and officers is set forth below. Each Trustee serves until his or her successor is elected and qualified or until his or her resignation, death or
removal. Under the Board’s retirement policy, unless an exception is made, a Trustee must tender his or her resignation by the end of the calendar year during which he or she reaches the age of 75. Officers are elected annually by the Board. The business address of each Trustee and officer listed below is 51 Madison Avenue, New York, New York 10010. A majority of the Trustees are not “interested persons” (as defined by the 1940 Act and rules adopted by the SEC thereunder) of the Fund (“Independent Trustees”).
| | Name and
Year of Birth | Term of Office,
Position(s) Held and
Length of Service | Principal Occupation(s)
During Past Five Years | Number of
Portfolios in
Fund Complex
Overseen by
Trustee | Other Directorships
Held by Trustee |
| | | | | | |
| | Naïm Abou-Jaoudé*
1966 | MainStay Funds: Trustee
since 2023
MainStay Funds Trust:
Trustee since 2023 | Chief Executive Officer of New York Life Investment Management LLC (since 2023). Chief Executive Officer of Candriam (an affiliate of New York Life Investment Management LLC) (2007 to 2023). | 81 | MainStay VP Funds Trust:
Trustee since 2023 (31 portfolios);
MainStay MacKay DefinedTerm Municipal Opportunities Fund: Trustee
since 2023;
MainStay CBRE Global Infrastructure Megatrends Term Fund: Trustee
since 2023; and
New York Life Investment Management International (Chair) since 2015 |
| * | This Trustee is considered to be an “interested person” of the MainStay Group of Funds, MainStay VP Funds Trust, MainStay CBRE Global Infrastructure Megatrends Term Fund and MainStay MacKay DefinedTerm Municipal Opportunities Fund, within the meaning of the 1940 Act because of his affiliation with New York Life Investment Management LLC and Candriam, as described in detail above in the column entitled “Principal Occupation(s) During Past Five Years.” |
| | |
Board of Trustees and Officers (Unaudited) (continued)
| | Name and
Year of Birth | Term of Office,
Position(s) Held and
Length of Service | Principal Occupation(s)
During Past Five Years | Number of
Portfolios in
Fund Complex
Overseen by
Trustee | Other Directorships
Held by Trustee |
| | | | | | |
| | David H. Chow
1957 | MainStay Funds: Trustee since January 2016, Advisory Board Member (June 2015 to December 2015);MainStay Funds Trust:
Trustee since January 2016, Advisory Board Member (June 2015 to December 2015) | Founder and CEO, DanCourt Management, LLC (since 1999) | 81 | MainStay VP Funds Trust: Trustee since January 2016, Advisory Board Member (June 2015 to December 2015) (31 portfolios);
MainStay MacKay DefinedTerm Municipal Opportunities Fund: Trustee since January 2016, Advisory Board Member (June 2015 to December 2015);
MainStay CBRE Global Infrastructure Megatrends Term Fund: Trustee since 2021;
VanEck Vectors Group of Exchange-Traded Funds: Trustee since 2006 and Independent Chairman of the Board of Trustees from 2008 to 2022 (57 portfolios); and
Berea College of Kentucky: Trustee since 2009, Chair of the Investment Committee since 2018 |
| | Karen Hammond
1956 | MainStay Funds: Trustee since December 2021, Advisory Board Member (June 2021 to December 2021);MainStay Funds Trust:
Trustee since December 2021, Advisory Board Member (June 2021 to December 2021)
| Retired, Managing Director, Devonshire Investors (2007 to 2013); Senior Vice President, Fidelity Management & Research Co. (2005 to 2007); Senior Vice President and Corporate Treasurer, FMR Corp. (2003 to 2005); Chief Operating Officer, Fidelity Investments Japan (2001 to 2003) | 81 | MainStay VP Funds Trust: Trustee since December 2021, Advisory Board Member (June 2021 to December 2021) (31 portfolios);
MainStay MacKay DefinedTerm Municipal Opportunities Fund: Trustee since December 2021, Advisory Board Member (June 2021 to December 2021);
MainStay CBRE Global Infrastructure Megatrends Term Fund: Trustee since December 2021, Advisory Board Member (June 2021 to December 2021);
Two Harbors Investment Corp.: Director since 2018;
Rhode Island State Investment Commission: Member since 2017; and
Blue Cross Blue Shield of Rhode Island: Director since 2019 |
| | Susan B. Kerley
1951 | MainStay Funds: Chair since January 2017 and Trustee since 2007;MainStay Funds Trust:
Chair since January 2017 and Trustee since 1990*** | President, Strategic Management Advisors LLC (since 1990) | 81 | MainStay VP Funds Trust: Chair since January 2017 and Trustee since 2007 (31 portfolios)**;
MainStay MacKay DefinedTerm Municipal Opportunities Fund: Chair since January 2017 and Trustee since 2011;
MainStay CBRE Global Infrastructure Megatrends Term Fund: Trustee since June 2021; and
Legg Mason Partners Funds: Trustee since 1991 (45 portfolios) |
| 46 | MainStay MacKay California Tax Free Opportunities Fund |
| | Name and
Year of Birth | Term of Office,
Position(s) Held and
Length of Service | Principal Occupation(s)
During Past Five Years | Number of
Portfolios in
Fund Complex
Overseen by
Trustee | Other Directorships
Held by Trustee |
| | | | | | |
| | Alan R. Latshaw
1951 | MainStay Funds: Trusteesince 2006;MainStay Funds Trust:
Trustee since 2007*** | Retired; Partner, Ernst & Young LLP (2002 to 2003); Partner, Arthur Andersen LLP (1989 to 2002); Consultant to the MainStay Funds Audit and Compliance Committee (2004 to 2006) | 81 | MainStay VP Funds Trust: Trustee since 2007 (31 portfolios)**;
MainStay MacKay DefinedTerm Municipal Opportunities Fund: Trustee since 2011; and
MainStay CBRE Global Infrastructure Megatrends Term Fund: Trustee since June 2021 |
| | Jacques P. Perold
1958 | MainStay Funds: Trustee since January 2016, Advisory Board Member (June 2015to December 2015);MainStay Funds Trust:
Trustee since January 2016, Advisory Board Member (June 2015 to December 2015) | Founder and Chief Executive Officer, CapShift Advisors LLC (since 2018); President, Fidelity Management & Research Company (2009 to 2014); President and Chief Investment Officer, Geode Capital Management, LLC (2001 to 2009) | 81 | MainStay VP Funds Trust: Trustee since January 2016, Advisory Board Member (June 2015 to December 2015) (31 portfolios);
MainStay MacKay DefinedTerm Municipal Opportunities Fund: Trustee since January 2016, Advisory Board Member (June 2015 to December 2015);
MainStay CBRE Global Infrastructure Megatrends Term Fund: Trustee since June 2021;
Allstate Corporation: Director since 2015; and
MSCI Inc.: Director since 2017 |
| | Richard S. Trutanic
1952 | MainStay Funds: Trustee since 1994;MainStay Funds Trust:
Trustee since 2007*** | Chairman and Chief Executive Officer, Somerset & Company (financial advisory firm) (since 2004); Managing Director, The Carlyle Group (private investment firm) (2002 to 2004); Senior Managing Director, Partner and Board Member, Groupe Arnault S.A. (private investment firm) (1999 to 2002) | 81 | MainStay VP Funds Trust: Trustee since 2007 (31 portfolios)**;
MainStay MacKay DefinedTerm Municipal Opportunities Fund: Trustee since 2011; and
MainStay CBRE Global Infrastructure Megatrends Term Fund: Trustee since June 2021 |
| ** | Includes prior service as a Director of MainStay VP Series Fund, Inc., the predecessor to MainStay VP Funds Trust. |
| *** | Includes prior service as a Director/Trustee of certain predecessor entities to MainStay Funds Trust. |
Board of Trustees and Officers (Unaudited) (continued)
| | Name and
Year of Birth | Position(s) Held and
Length of Service | Principal Occupation(s)
During Past Five Years | |
| | | | | |
| | Kirk C. Lehneis
1974 | President, MainStay Funds, MainStay Funds Trust (since 2017) | Chief Operating Officer and Senior Managing Director (since 2016), New York Life Investment Management LLC and New York Life Investment Management Holdings LLC; Member of the Board of Managers (since 2017) and Senior Managing Director (since 2018), NYLIFE Distributors LLC; Chairman of the Board and Senior Managing Director, NYLIM Service Company LLC (since 2017); Trustee, President and Principal Executive Officer of IndexIQ Trust, IndexIQ ETF Trust and IndexIQ Active ETF Trust (since 2018); President, MainStay CBRE Global Infrastructure Megatrends Term Fund (since 2021), MainStay MacKay DefinedTerm Municipal Opportunities Fund and MainStay VP Funds Trust (since 2017)**; Senior Managing Director, Global Product Development (2015 to 2016); Managing Director, Product Development (2010 to 2015), New York Life Investment Management LLC | |
| | Jack R. Benintende
1964 | Treasurer and Principal Financial and Accounting Officer, MainStay Funds (since 2007), MainStay Funds Trust (since 2009) | Managing Director, New York Life Investment Management LLC (since 2007); Treasurer and Principal Financial and Accounting Officer, MainStay CBRE Global Infrastructure Megatrends Term Fund (since 2021), MainStay MacKay DefinedTerm Municipal Opportunities Fund (since 2011) and MainStay VP Funds Trust (since 2007)**; and Assistant Treasurer, New York Life Investment Management Holdings LLC (2008 to 2012) | |
| | J. Kevin Gao
1967 | Secretary and Chief Legal Officer, MainStay Funds and MainStay Funds Trust (since 2010) | Managing Director and Associate General Counsel, New York Life Investment Management LLC (since 2010); Secretary and Chief Legal Officer, MainStay CBRE Global Infrastructure Megatrends Term Fund (since 2021), MainStay MacKay DefinedTerm Municipal Opportunities Fund (since 2011) and MainStay VP Funds Trust (since 2010)** | |
| | Kevin M. Gleason
1967 | Vice President and Chief Compliance Officer, MainStay Funds and MainStay Funds Trust (since June 2022) | Vice President and Chief Compliance Officer, IndexIQ Trust, IndexIQ ETF Trust and Index IQ Active ETF Trust (since June 2022); Vice President and Chief Compliance Officer, MainStay CBRE Global Infrastructure Megatrends Term Fund, MainStay VP Funds Trust and MainStay MacKay DefinedTerm Municipal Opportunities Fund (since June 2022); Senior Vice President, Voya Investment Management and Chief Compliance Officer, Voya Family of Funds (2012 to 2022) | |
| | Scott T. Harrington
1959 | Vice President— Administration, MainStay Funds (since 2005), MainStay Funds Trust (since 2009) | Managing Director, New York Life Investment Management LLC (including predecessor advisory organizations) (since 2000); Member of the Board of Directors, New York Life Trust Company (since 2009); Vice President—Administration, MainStay CBRE Global Infrastructure Megatrends Term Fund (since 2021), MainStay MacKay DefinedTerm Municipal Opportunities Fund (since 2011) and MainStay VP Funds Trust (since 2005)** | |
| * | The officers listed above are considered to be “interested persons” of the MainStay Group of Funds, MainStay VP Funds Trust, MainStay CBRE Global Infrastructure Megatrends Term Fund and MainStay MacKay DefinedTerm Municipal Opportunities Fund within the meaning of the 1940 Act because of their affiliation with the MainStay Group of Funds, New York Life Insurance Company and/or its affiliates, including New York Life Investment Management LLC, New York Life Insurance Company, NYLIM Service Company LLC, NYLIFE Securities LLC and/or NYLIFE Distributors LLC, as described in detail in the column captioned “Principal Occupation(s) During Past Five Years.” Officers are elected annually by the Board. |
| ** | Includes prior service as an Officer of MainStay VP Series Fund, Inc., the predecessor to MainStay VP Funds Trust. |
Officers of the Trust (Who are not Trustees)*
| 48 | MainStay MacKay California Tax Free Opportunities Fund |
This page intentionally left blank.
This page intentionally left blank.
Equity
U.S. Equity
MainStay Epoch U.S. Equity Yield Fund
MainStay Fiera SMID Growth Fund
MainStay PineStone U.S. Equity Fund
MainStay S&P 500 Index Fund
MainStay Winslow Large Cap Growth Fund
MainStay WMC Enduring Capital Fund
MainStay WMC Growth Fund
MainStay WMC Small Companies Fund
MainStay WMC Value Fund
International Equity
MainStay Epoch International Choice Fund
MainStay PineStone International Equity Fund
MainStay WMC International Research Equity Fund
Emerging Markets Equity
MainStay Candriam Emerging Markets Equity Fund
Global Equity
MainStay Epoch Capital Growth Fund
MainStay Epoch Global Equity Yield Fund
MainStay PineStone Global Equity Fund
Fixed Income
Taxable Income
MainStay Candriam Emerging Markets Debt Fund
MainStay Floating Rate Fund
MainStay MacKay High Yield Corporate Bond Fund
MainStay MacKay Short Duration High Yield Fund
MainStay MacKay Strategic Bond Fund
MainStay MacKay Total Return Bond Fund
MainStay MacKay U.S. Infrastructure Bond Fund
MainStay Short Term Bond Fund
Tax-Exempt Income
MainStay MacKay California Tax Free Opportunities Fund1
MainStay MacKay High Yield Municipal Bond Fund
MainStay MacKay New York Tax Free Opportunities Fund2
MainStay MacKay Short Term Municipal Fund
MainStay MacKay Strategic Municipal Allocation Fund
MainStay MacKay Tax Free Bond Fund
Money Market
MainStay Money Market Fund
Mixed Asset
MainStay Balanced Fund
MainStay Income Builder Fund
MainStay MacKay Convertible Fund
Speciality
MainStay CBRE Global Infrastructure Fund
MainStay CBRE Real Estate Fund
MainStay Cushing MLP Premier Fund
Asset Allocation
MainStay Conservative Allocation Fund
MainStay Conservative ETF Allocation Fund
MainStay Defensive ETF Allocation Fund
MainStay Equity Allocation Fund
MainStay Equity ETF Allocation Fund
MainStay ESG Multi-Asset Allocation Fund
MainStay Growth Allocation Fund
MainStay Growth ETF Allocation Fund
MainStay Moderate Allocation Fund
MainStay Moderate ETF Allocation Fund
Manager
New York Life Investment Management LLC
New York, New York
Subadvisors
Candriam3
Strassen, Luxembourg
CBRE Investment Management Listed Real Assets LLC
Radnor, Pennsylvania
Cushing Asset Management, LP
Dallas, Texas
Epoch Investment Partners, Inc.
New York, New York
Fiera Capital Inc.
New York, New York
IndexIQ Advisors LLC3
New York, New York
MacKay Shields LLC3
New York, New York
NYL Investors LLC3
New York, New York
PineStone Asset Management Inc.
Montreal, Québec
Wellington Management Company LLP
Boston, Massachusetts
Winslow Capital Management, LLC
Minneapolis, Minnesota
Legal Counsel
Dechert LLP
Washington, District of Columbia
Independent Registered Public Accounting Firm
KPMG LLP
Philadelphia, Pennsylvania
Distributor
NYLIFE Distributors LLC3
Jersey City, New Jersey
Custodian
JPMorgan Chase Bank, N.A.
New York, New York
1.
This Fund is registered for sale in AZ, CA, NV, OR, TX, UT, WA and MI (Class A and Class I shares only), and CO, FL, GA, HI, ID, MA, MD, NH, NJ and NY (Class I shares only).
| 2. | This Fund is registered for sale in CA, CT, DE, FL, MA, NJ, NY and VT. |
| 3. | An affiliate of New York Life Investment Management LLC. |
Not part of the Annual Report
For more information
800-624-6782
newyorklifeinvestments.com
“New York Life Investments” is both a service mark, and the common trade name, of certain investment advisors affiliated with New York Life Insurance Company. The MainStay Funds® are managed by New York Life Investment Management LLC and distributed by NYLIFE Distributors LLC, 30 Hudson Street, Jersey City, NJ 07302, a wholly owned subsidiary of New York Life Insurance Company. NYLIFE Distributors LLC is a Member FINRA/SIPC.
©2023 NYLIFE Distributors LLC. All rights reserved.
| 5013750 MS139-23 | MSCTF11-12/23 |
(NYLIM) NL237
MainStay MacKay High Yield Municipal Bond Fund
Message from the President and Annual Report
October 31, 2023
Special Notice:
Beginning in July 2024, new regulations issued by the Securities and Exchange Commission (SEC) will take effect requiring open-end mutual fund companies and ETFs to (1) overhaul the content of their shareholder reports and (2) mail paper copies of the new tailored shareholder reports to shareholders who have not opted to receive these documents electronically.
If you have not yet elected to receive your shareholder reports electronically, please contact your financial intermediary or visit newyorklifeinvestments.com/accounts.
| Not FDIC/NCUA Insured | Not a Deposit | May Lose Value | No Bank Guarantee | Not Insured by Any Government Agency |
This page intentionally left blank
Message from the President
Volatile economic and geopolitical forces drove market behavior during the 12-month reporting period ended October 31, 2023. While equity markets generally gained ground, bond prices trended broadly lower.
Although the war in Ukraine, the outbreak of hostilities in the Middle East and several other notable events affected financial assets, inflation and interest rate trends stood at the forefront of market developments during most of the period. As the reporting period began, high levels of inflation already showed signs of easing in the face of aggressive rate hikes by the U.S. Federal Reserve (the “Fed”). From a peak of 9.1% in June 2022, the annualized U.S. inflation rate dropped to 7.1% in November 2022, and to 3.2% in October 2023. At the same time, the Fed increased the benchmark federal funds rate from 3.75%–4.00% at the beginning of the reporting period to 5.25%–5.50% as of October 31, 2023. As the pace of rate increases slowed during the period, investors hoped for an early shift to a looser monetary policy. However, comments from Fed members late in the period reinforced the central bank’s hawkish stance in response to surprisingly robust U.S. economic growth and rising wage pressures, thus increasing the likelihood that interest rates would stay higher for longer. International developed markets exhibited similar dynamics of elevated inflation and rising interest rates.
Despite the backdrop of high interest rates—along with political dysfunction in Washington D.C. and intensifying global geopolitical instability—equity markets managed to advance, supported by healthy consumer spending trends and persistent domestic economic growth. The S&P 500® Index, a widely regarded benchmark of large-cap U.S. market performance, gained ground, bolstered by the strong performance of energy stocks amid surging petroleum prices and mega-cap, growth-oriented, technology-related shares, which rose as investors flocked to companies creating the infrastructure for developments in artificial intelligence. Smaller-cap stocks and value-oriented shares produced milder returns. Among industry sectors, energy and
information technology posted the strongest gains. Real estate declined most sharply under pressure from rising mortgage rates and weak levels of office occupancy. Developed international markets outperformed U.S. markets, with Europe benefiting during the first half of the period from unexpected economic resilience in the face of rising energy prices and the ongoing war in Ukraine. Emerging markets posted positive results but lagged developed markets, largely due to slow economic growth in China despite the relaxation of pandemic-era lockdowns.
Bond prices were driven lower by rising yields and increasing expectations of high interest rates for an extended period of time. The U.S. yield curve steepened, with the 30-year Treasury yield exceeding 5% for the first time in more than a decade. The yield curve remained inverted, with the 10-year Treasury yield ending the period at 4.88%, compared with 5.07% for the 2-year Treasury yield. Corporate bonds outperformed long-term Treasury bonds, but still trended lower under pressure from rising yields and an uptick in default rates. Among corporates, lower-credit-quality instruments performed slightly better than their higher-credit-quality counterparts, while floating rate securities performed better still.
In the face of today’s uncertain market environment, New York Life Investments remains dedicated to providing the guidance, resources and investment solutions you need to pursue your financial goals.
Thank you for trusting us to help meet your investment needs.
Sincerely,
Kirk C. Lehneis
President
The opinions expressed are as of the date of this report and are subject to change. There is no guarantee that any forecast made will come to pass. This material does not constitute investment advice and is not intended as an endorsement of any specific investment. Past performance is no guarantee of future results.
Not part of the Annual Report
Investors should refer to the Fund’s Summary Prospectus and/or Prospectus and consider the Fund’s investment objectives, strategies, risks, charges and expenses carefully before investing. The Summary Prospectus and/or Prospectus contain this and other information about the Fund. You may obtain copies of the Fund’s Summary Prospectus, Prospectus and Statement of Additional Information, which includes information about the MainStay Funds Trust's Trustees, free of charge, upon request, by calling toll-free 800-624-6782, by writing to NYLIFE Distributors LLC, Attn: MainStay Marketing Department, 30 Hudson Street, Jersey City, NJ 07302 or by sending an e-mail to MainStayShareholderServices@nylim.com. These documents are also available via the MainStay Funds’ website at newyorklifeinvestments.com. Please read the Fund’s Summary Prospectus and/or Prospectus carefully before investing.
Investment and Performance Comparison (Unaudited)
Performance data quoted represents past performance. Past performance is no guarantee of future results. Because of market volatility and other factors, current performance may be lower or higher than the figures shown. Investment return and principal value will fluctuate, and as a result, when shares are redeemed, they may be worth more or less than their original cost. The graph below depicts the historical performance of Class I shares of the Fund. Performance will vary from class to class based on differences in class-specific expenses and sales charges. For performance information current to the most recent month-end, please call 800-624-6782 or visit newyorklifeinvestments.com.
The performance table and graph do not reflect the deduction of taxes that a shareholder would pay on distributions or Fund share redemptions. Total returns reflect maximum applicable sales charges as indicated in the table below, if any, changes in share price, and reinvestment of dividend and capital gain distributions. The graph assumes the initial investment amount shown below and reflects the deduction of all sales charges that would have applied for the period of investment. Performance figures may reflect certain fee waivers and/or expense limitations, without which total returns may have been lower. For more information on share classes and current fee waivers and/or expense limitations (if any), please refer to the Notes to Financial Statements.
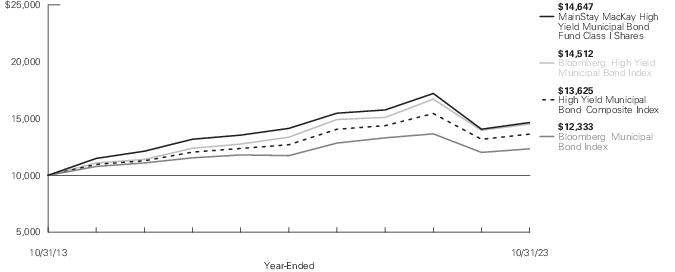
| Average Annual Total Returns for the Year-Ended October 31, 2023 |
| Class | Sales Charge | | Inception
Date | One
Year | Five
Years | Ten Years
or Since
Inception | Gross
Expense
Ratio1 |
| Class A Shares2 | Maximum 3.00% Initial Sales Charge | With sales charges | 3/31/2010 | 0.69% | -0.46% | 3.14% | 0.87% |
| | | Excluding sales charges | | 3.81 | 0.46 | 3.62 | 0.87 |
| Investor Class Shares3, 4 | Maximum 2.50% Initial Sales Charge | With sales charges | 3/31/2010 | 1.29 | -0.47 | 3.13 | 0.88 |
| | | Excluding sales charges | | 3.89 | 0.45 | 3.60 | 0.88 |
| Class C Shares | Maximum 1.00% CDSC | With sales charges | 3/31/2010 | 2.12 | -0.28 | 2.84 | 1.63 |
| | if Redeemed Within One Year of Purchase | Excluding sales charges | | 3.12 | -0.28 | 2.84 | 1.63 |
| Class I Shares | No Sales Charge | | 3/31/2010 | 4.16 | 0.72 | 3.89 | 0.61 |
| Class R6 Shares | No Sales Charge | | 11/1/2019 | 4.13 | N/A | -1.33 | 0.56 |
| 1. | The gross expense ratios presented reflect the Fund’s “Total Annual Fund Operating Expenses” from the most recent Prospectus, as supplemented, and may differ from other expense ratios disclosed in this report. |
| 2. | Prior to August 10, 2022, the maximum initial sales charge was 4.50%, which is reflected in the applicable average annual total return figures shown. |
| 3. | Prior to June 30, 2020, the maximum initial sales charge was 4.50%, which is reflected in the applicable average annual total return figures shown. |
| 4. | Prior to August 10, 2022, the maximum initial sales charge was 4.00%, which is reflected in the applicable average annual total return figures shown. |
The footnotes on the next page are an integral part of the table and graph and should be carefully read in conjunction with them.
| Benchmark Performance* | One
Year | Five
Years | Ten
Years |
| Bloomberg Municipal Bond Index1 | 2.64% | 1.00% | 2.12% |
| Bloomberg High Yield Municipal Bond Index2 | 3.96 | 1.67 | 3.79 |
| High Yield Municipal Bond Composite Index3 | 3.44 | 1.43 | 3.14 |
| Morningstar High Yield Muni Category Average4 | 1.60 | 0.24 | 2.64 |
| * | Returns for indices reflect no deductions for fees, expenses or taxes, except for foreign withholding taxes where applicable. Results assume reinvestment of all dividends and capital gains. An investment cannot be made directly in an index. |
| 1. | The Bloomberg Municipal Bond Index is the Fund's primary broad-based securities market index for comparison purposes. The Bloomberg Municipal Bond Index is considered representative of the broad market for investment-grade, tax-exempt bonds with a maturity of at least one year. Bonds subject to the alternative minimum tax or with floating or zero coupons are excluded. |
| 2. | The Fund has selected the Bloomberg High Yield Municipal Bond Index as an additional benchmark. The Bloomberg Municipal High Yield Bond Index is a flagship measure of the non-investment grade and non-rated U.S. dollar-denominated tax-exempt bond market. |
| 3. | The High Yield Municipal Bond Composite Index is the Fund’s secondary benchmark. The High Yield Municipal Bond Composite Index consists of the Bloomberg High Yield Municipal Bond Index and the Bloomberg Municipal Bond Index weighted 60%/40%, respectively. |
| 4. | The Morningstar High Yield Muni Category Average is representative of funds that invest a substantial portion of assets in high-income municipal securities that are not rated or that are rated at the level of or below BBB by a major ratings agency such as Standard & Poor’s or Moody’s. Results are based on average total returns of similar funds with all dividends and capital gain distributions reinvested. |
The footnotes on the preceding page are an integral part of the table and graph and should be carefully read in conjunction with them.
| 6 | MainStay MacKay High Yield Municipal Bond Fund |
Cost in Dollars of a $1,000 Investment in MainStay MacKay High Yield Municipal Bond Fund (Unaudited)
The example below is intended to describe the fees and expenses borne by shareholders during the six-month period from May 1, 2023 to October 31, 2023, and the impact of those costs on your investment.
Example
As a shareholder of the Fund you incur two types of costs: (1) transaction costs, including exchange fees and sales charges (loads) on purchases (as applicable), and (2) ongoing costs, including management fees, distribution and/or service (12b-1) fees and other Fund expenses (as applicable). This example is intended to help you understand your ongoing costs (in dollars) of investing in the Fund and to compare these costs with the ongoing costs of investing in other mutual funds. The example is based on an investment of $1,000 made at the beginning of the six-month period and held for the entire period from May 1, 2023 to October 31, 2023.
This example illustrates your Fund’s ongoing costs in two ways:
Actual Expenses
The second and third data columns in the table below provide information about actual account values and actual expenses. You may use the information in these columns, together with the amount you invested, to estimate the expenses that you paid during the six months ended October 31, 2023. Simply divide your account value by $1,000 (for example, an
$8,600 account value divided by $1,000 = 8.6), then multiply the result by the number under the heading entitled “Expenses Paid During Period” to estimate the expenses you paid on your account during this period.
Hypothetical Example for Comparison Purposes
The fourth and fifth data columns in the table below provide information about hypothetical account values and hypothetical expenses based on the Fund’s actual expense ratio and an assumed rate of return of 5% per year before expenses, which is not the Fund’s actual return. The hypothetical account values and expenses may not be used to estimate the actual ending account balances or expenses you paid for the six-month period shown. You may use this information to compare the ongoing costs of investing in the Fund with the ongoing costs of investing in other mutual funds. To do so, compare this 5% hypothetical example with the 5% hypothetical examples that appear in the shareholder reports of the other mutual funds.
Please note that the expenses shown in the table are meant to highlight your ongoing costs only and do not reflect any transactional costs, such as exchange fees or sales charges (loads). Therefore, the fourth and fifth data columns of the table are useful in comparing ongoing costs only and will not help you determine the relative total costs of owning different funds. In addition, if these transactional costs were included, your costs would have been higher.
| Share Class | Beginning
Account
Value
5/1/23 | Ending Account
Value (Based
on Actual
Returns and
Expenses)
10/31/23 | Expenses
Paid
During
Period1 | Ending Account
Value (Based
on Hypothetical
5% Annualized
Return and
Actual Expenses)
10/31/23 | Expenses
Paid
During
Period1 | Net Expense
Ratio
During
Period2 |
| Class A Shares | $1,000.00 | $937.30 | $4.20 | $1,020.87 | $4.38 | 0.86% |
| Investor Class Shares | $1,000.00 | $938.00 | $4.35 | $1,020.72 | $4.53 | 0.89% |
| Class C Shares | $1,000.00 | $934.40 | $8.00 | $1,016.94 | $8.34 | 1.64% |
| Class I Shares | $1,000.00 | $939.40 | $2.98 | $1,022.13 | $3.11 | 0.61% |
| Class R6 Shares | $1,000.00 | $939.60 | $2.74 | $1,022.38 | $2.85 | 0.56% |
| 1. | Expenses are equal to the Fund’s annualized expense ratio of each class multiplied by the average account value over the period, divided by 365 and multiplied by 184 (to reflect the six-month period). The table above represents the actual expenses incurred during the six-month period. In addition to the fees and expenses which the Fund bears directly, it also indirectly bears a pro rata share of the fees and expenses of the underlying funds in which it invests. Such indirect expenses are not included in the above-reported expense figures. |
| 2. | Expenses are equal to the Fund's annualized expense ratio to reflect the six-month period. |
Portfolio Composition as of October 31, 2023 (Unaudited)
| Illinois | 10.8% |
| Puerto Rico | 9.5 |
| New York | 9.1 |
| California | 7.2 |
| Texas | 5.1 |
| New Jersey | 4.7 |
| Ohio | 4.6 |
| Pennsylvania | 4.0 |
| Florida | 3.2 |
| Colorado | 3.1 |
| Michigan | 2.8 |
| U.S. Virgin Islands | 2.8 |
| Georgia | 2.6 |
| Wisconsin | 2.5 |
| District of Columbia | 2.4 |
| Alabama | 2.2 |
| Virginia | 2.0 |
| Utah | 1.6 |
| Arizona | 1.5 |
| Washington | 1.4 |
| Arkansas | 1.3 |
| Massachusetts | 1.1 |
| Maryland | 1.1 |
| Iowa | 1.1 |
| Minnesota | 1.1 |
| Kentucky | 0.9 |
| Indiana | 0.8 |
| Missouri | 0.7 |
| South Carolina | 0.7 |
| Tennessee | 0.6% |
| Hawaii | 0.6 |
| North Carolina | 0.6 |
| North Dakota | 0.5 |
| Delaware | 0.5 |
| Connecticut | 0.4 |
| West Virginia | 0.4 |
| Guam | 0.4 |
| Multi–State | 0.3 |
| Nevada | 0.3 |
| Montana | 0.3 |
| Rhode Island | 0.3 |
| Kansas | 0.3 |
| Alaska | 0.2 |
| New Hampshire | 0.2 |
| Wyoming | 0.2 |
| Oregon | 0.1 |
| Idaho | 0.1 |
| Louisiana | 0.1 |
| Oklahoma | 0.1 |
| Vermont | 0.1 |
| Maine | 0.0‡ |
| Mississippi | 0.0‡ |
| Nebraska | 0.0‡ |
| Short–Term Investment | 0.2 |
| Other Assets, Less Liabilities | 1.3 |
| | 100.0% |
| ‡ | Less than one–tenth of a percent. |
See Portfolio of Investments beginning on page 11 for specific holdings within these categories. The Fund's holdings are subject to change.
Top Ten Holdings and/or Issuers Held as of October 31, 2023 (excluding short-term investments) (Unaudited)
| 1. | Metropolitan Pier & Exposition Authority, (zero coupon)-5.00%, due 6/15/30–12/15/56 |
| 2. | Chicago Board of Education, (zero coupon)-7.00%, due 12/1/27–4/1/48 |
| 3. | Puerto Rico Commonwealth Aqueduct & Sewer Authority, 3.50%-5.00%, due 7/1/26–7/1/47 |
| 4. | Public Finance Authority, (zero coupon)-9.00%, due 10/1/24–5/1/71 |
| 5. | New York Transportation Development Corp., 4.00%-5.375%, due 8/1/31–4/30/53 |
| 6. | Matching Fund Special Purpose Securitization Corp., 5.00%, due 10/1/30–10/1/39 |
| 7. | Commonwealth of Puerto Rico, (zero coupon)-4.00%, due 7/1/33–11/1/43 |
| 8. | Puerto Rico Sales Tax Financing Corp., (zero coupon)-5.00%, due 7/1/31–7/1/58 |
| 9. | Buckeye Tobacco Settlement Financing Authority, 4.00%-5.00%, due 6/1/48–6/1/55 |
| 10. | Metropolitan Transportation Authority, 4.00%-5.00%, due 11/15/27–11/15/52 |
| 8 | MainStay MacKay High Yield Municipal Bond Fund |
Portfolio Management Discussion and Analysis (Unaudited)
Questions answered by portfolio managers John Loffredo, CFA, Robert DiMella, CFA, Michael Petty, David Dowden, Scott Sprauer and Frances Lewis of MacKay Shields LLC, the Fund’s Subadvisor.
How did MainStay MacKay High Yield Municipal Bond Fund perform relative to its benchmarks and peer group during the 12 months ended October 31, 2023?
For the 12 months ended October 31, 2023, Class I shares of MainStay MacKay High Yield Municipal Bond Fund returned 4.16%, outperforming the 2.64% return of the Fund’s primary benchmark, the Bloomberg Municipal Bond Index. During the same period, Class I shares outperformed the 3.96% return of the Fund’s secondary benchmark, the Bloomberg High Yield Municipal Bond Index, and the 3.44% return of the High Yield Municipal Bond Composite Index, an additional benchmark of the Fund. For the 12 months ended October 31, 2023, Class I shares also outperformed the 1.60% return of the Morningstar High Yield Muni Category Average.1
What factors affected the Fund’s relative performance during the reporting period?
During the reporting period, MainStay MacKay High Yield Municipal Bond Fund outperformed the Bloomberg Municipal Bond Index, due to several factors. Overweight exposure to bonds maturing beyond 20 years made a positive contribution to relative performance. (Contributions take weightings and total returns into account.) In addition, security selection among zero and 4+% coupon bonds aided on a relative basis. From a rating perspective, the Fund’s overweight exposure to BBB-rated2 and non-investment grade credits further bolstered relative performance. Overweight exposure to bonds from Illinois also added to relative returns. Conversely, underweight exposure to higher-quality bonds detracted from relative returns, as did exposure to defaulted bonds from Puerto Rico. Also, the Fund engaged in significant tax-loss harvesting. This created losses that can be carried forward to offset future gains in the Fund. This activity also resulted in creating a higher book yield for the Fund.
During the reporting period, how was the Fund’s performance materially affected by investments in derivatives?
The Fund, at times, will employ a U.S. Treasury futures hedge, typically as a paired strategy with longer-maturity bonds, to
dampen duration3 and interest-rate sensitivity. During the reporting period, this position had a positive impact on performance.
What was the Fund’s duration strategy during the reporting period?
The Fund’s duration was targeted to remain in a neutral range relative to the Fund’s investable universe, as outlined in the prospectus. In addition to investment-grade bonds, the Fund normally invests a substantial amount of its assets in municipal securities rated below investment grade. Since the Fund’s investable universe is broader than that of the Bloomberg Municipal Bond Index, the Fund’s duration may differ from that of the Bloomberg Municipal Bond Index. As of October 31, 2023, the Fund's modified duration to worst4 was 10.47 years while the Bloomberg Municipal Bond Index's modified duration to worst was 6.90 years.
During the reporting period, which sectors were the strongest positive contributors to the Fund’s relative performance and which sectors were particularly weak?
During the reporting period, overweight exposure to the special tax and tobacco sectors made positive contributions to the Fund’s performance relative to the Bloomberg Municipal Bond Index. During the same period, security selection among electric credits detracted most significantly from relative performance.
What were some of the Fund’s largest purchases and sales during the reporting period?
As the Fund remains focused on diversification and liquidity, no individual purchase or sale was considered significant, although sector overweights or security structure, in their entirety, did have an impact.
How did the Fund’s sector weighting change during the reporting period?
During the reporting period, there were no material changes to the weightings in the Fund. At the margins, there was an increase in the Fund’s exposures to the IDR/PCR (industry development
| 1. | See "Investment and Performance Comparison" for other share class returns, which may be higher or lower than Class I share returns, and for more information on benchmark and peer group returns. |
| 2. | An obligation rated ‘BBB’ by Standard & Poor’s (“S&P”) is deemed by S&P to exhibit adequate protection parameters. In the opinion of S&P, however, adverse economic conditions or changing circumstances are more likely to lead to a weakened capacity of the obligor to meet its financial commitment on the obligation. When applied to Fund holdings, ratings are based solely on the creditworthiness of the bonds in the portfolio and are not meant to represent the security or safety of the Fund. |
| 3. | Duration is a measure of the price sensitivity of a fixed-income investment to changes in interest rates. Duration is expressed as a number of years and is considered a more accurate sensitivity gauge than average maturity. |
| 4. | Modified duration is inversely related to the approximate percentage change in price for a given change in yield. Duration to worst is the duration of a bond computed using the bond’s nearest call date or maturity. This measure ignores future cash flow fluctuations due to embedded optionality. |
revenue/pollution control revenue) and hospital sectors. From a credit perspective, there was increased exposure to bonds rated AA and A.5 In addition, there was an increase to 3+% and 4+% coupon bonds. Conversely, there were reductions in the Fund’s exposure to the electric and state general obligation sectors, to bonds maturing beyond 25 years and to Puerto Rico credits.
How was the Fund positioned at the end of the reporting period?
As of October 31, 2023, relative to the Bloomberg Municipal Bond Index, the Fund maintained overweight exposure to the long end of the yield curve6 where municipal yields are more attractive. In addition, the Fund held overweight exposure to the IDR/PCR, education and hospital sectors. In addition, the Fund was overweight in BBB-rated and non-investment grade bonds. From a geographic perspective, the Fund held overweight exposure to Puerto Rico and Illinois credits. As of the same date, the Fund held underweight exposure to high-quality bonds rated AAA/AA.7 The Fund also held underweight positions in the local and state general obligation sectors, as well as bonds from California and New York.
| 5. | An obligation rated ‘AA’ by S&P is deemed by S&P to differ from the highest-rated obligations only to a small degree. In the opinion of S&P, the obligor's capacity to meet its financial commitment on the obligation is very strong. An obligation rated 'A' by S&P has strong capacity to meet its financial commitments but is somewhat more susceptible to the adverse effects of changes in circumstances and economic conditions than obligors in higher-rated categories. When applied to Fund holdings, ratings are based solely on the creditworthiness of the bonds in the portfolio and are not meant to represent the security or safety of the Fund. |
| 6. | The yield curve is a line that plots the yields of various securities of similar quality—typically U.S. Treasury issues—across a range of maturities. The U.S. Treasury yield curve serves as a benchmark for other debt and is used in economic forecasting. |
| 7. | An obligation rated ‘AAA’ has the highest rating assigned by S&P, and in the opinion of S&P, the obligor’s capacity to meet its financial commitment on the obligation is extremely strong. When applied to Fund holdings, ratings are based solely on the creditworthiness of the bonds in the portfolio and are not meant to represent the security or safety of the Fund. |
The opinions expressed are those of the portfolio managers as of the date of this report and are subject to change. There is no guarantee that any forecasts will come to pass. This material does not constitute investment advice and is not intended as an endorsement of any specific investment.
| 10 | MainStay MacKay High Yield Municipal Bond Fund |
Portfolio of Investments October 31, 2023†^
| | Principal
Amount | Value |
| Municipal Bonds 97.8% |
| Long-Term Municipal Bonds 94.8% |
| Alabama 1.8% |
| Alabama Special Care Facilities Financing Authority, Methodist Home for the Aging, Revenue Bonds | | |
| Series 1 | | |
| 5.75%, due 6/1/45 | $ 1,250,000 | $ 980,064 |
| Black Belt Energy Gas District, Gas Project No.7, Revenue Bonds | | |
| Series C-2 | | |
| 4.44%, due 10/1/52 | 27,720,000 | 27,012,791 |
| Cooper Green Mercy Health Services Authority, County of Jefferson Indigent Care Fund, Revenue Bonds | | |
| Series A | | |
| 5.25%, due 9/1/42 | 4,950,000 | 4,919,343 |
| County of Jefferson, Sewer, Revenue Bonds, Senior Lien | | |
| Series A, Insured: AGM | | |
| 5.50%, due 10/1/53 | 11,560,000 | 11,577,779 |
| County of Jefferson, Sewer, Revenue Bonds, Sub. Lien | | |
| Series D | | |
| 6.00%, due 10/1/42 | 2,500,000 | 2,572,260 |
| Series D | | |
| 6.50%, due 10/1/53 | 2,500,000 | 2,597,357 |
| Hoover Industrial Development Board, United States Steel Corp., Green Bond, Revenue Bonds | | |
| 6.375%, due 11/1/50 (a)(b) | 3,140,000 | 3,264,564 |
| Lower Alabama Gas District (The), Revenue Bonds | | |
| Series A | | |
| 5.00%, due 9/1/46 | 17,360,000 | 16,170,833 |
| Montgomery Educational Building Authority, Faulkner University, Revenue Bonds | | |
| Series A | | |
| 5.00%, due 10/1/43 | 4,780,000 | 4,232,571 |
| Prichard Water Works & Sewer Board, Revenue Bonds | | |
| 4.00%, due 11/1/49 | 6,000,000 | 3,894,818 |
| | Principal
Amount | Value |
| |
| Alabama (continued) |
| Southeast Energy Authority, A Cooperative District, Project No. 2, Revenue Bonds | | |
| Series B | | |
| 4.00%, due 12/1/51 (b) | $ 8,400,000 | $ 7,664,595 |
| Tuscaloosa County Industrial Development Authority, Hunt Refining Project, Revenue Bonds (c) | | |
| Series A | | |
| 4.50%, due 5/1/32 | 11,736,585 | 10,391,200 |
| Series A | | |
| 5.25%, due 5/1/44 | 44,390,000 | 36,586,163 |
| | | 131,864,338 |
| Alaska 0.2% |
| Alaska Industrial Development & Export Authority, Dena' Nena' Henash, Revenue Bonds | | |
| Series A | | |
| 4.00%, due 10/1/49 | 15,440,000 | 12,103,810 |
| Alaska Industrial Development & Export Authority, Interior Gas Utility Project, Revenue Bonds | | |
| Series A | | |
| 5.00%, due 6/1/40 | 1,795,000 | 1,559,769 |
| Series A | | |
| 5.00%, due 6/1/50 | 3,485,000 | 2,852,240 |
| | | 16,515,819 |
| Arizona 1.5% |
| Arizona Industrial Development Authority, GreatHearts Arizona Project, Revenue Bonds | | |
| Series A, Insured: SD CRED PROG | | |
| 3.00%, due 7/1/46 | 4,265,000 | 2,801,045 |
| Series A, Insured: SD CRED PROG | | |
| 3.00%, due 7/1/52 | 9,525,000 | 5,791,953 |
| Arizona Industrial Development Authority, Provident Group, NCCU Properties LLC, Central University Project, Revenue Bonds | | |
| Series A, Insured: BAM | | |
| 4.00%, due 6/1/44 | 2,500,000 | 2,068,797 |
The notes to the financial statements are an integral part of, and should be read in conjunction with, the financial statements.
11
Portfolio of Investments October 31, 2023†^ (continued)
| | Principal
Amount | Value |
| Long-Term Municipal Bonds (continued) |
| Arizona (continued) |
| Arizona Industrial Development Authority, Equitable School Revolving Fund LLC, Revenue Bonds | | |
| Series A | | |
| 4.00%, due 11/1/45 | $ 5,470,000 | $ 4,391,203 |
| Series A | | |
| 4.00%, due 11/1/46 | 1,000,000 | 794,359 |
| Series A | | |
| 4.00%, due 11/1/51 | 3,405,000 | 2,589,122 |
| Series A | | |
| 4.25%, due 11/1/52 | 2,000,000 | 1,581,589 |
| Arizona Industrial Development Authority, University of Indianapolis, Health Pavilion Project, Revenue Bonds | | |
| Series A | | |
| 4.00%, due 10/1/49 | 1,000,000 | 740,831 |
| Series A | | |
| 5.00%, due 10/1/45 | 1,875,000 | 1,710,598 |
| Arizona Industrial Development Authority, Equitable School Revolving Fund LLC Obligated Group, Revenue Bonds | | |
| Series A | | |
| 4.00%, due 11/1/49 | 4,865,000 | 3,750,931 |
| Arizona Industrial Development Authority, Macombs Facility Project, Revenue Bonds | | |
| Series A | | |
| 4.00%, due 7/1/51 | 3,000,000 | 2,240,920 |
| Series A | | |
| 4.00%, due 7/1/61 | 1,830,000 | 1,295,743 |
| Arizona Industrial Development Authority, Jerome Facility Project, Revenue Bonds | | |
| Series B | | |
| 4.00%, due 7/1/51 | 1,420,000 | 1,060,702 |
| Series B | | |
| 4.00%, due 7/1/61 | 1,000,000 | 708,056 |
| Arizona Industrial Development Authority, Odyssey Preparatory Academy, Inc. (The), Revenue Bonds (c) | | |
| Series A | | |
| 4.75%, due 7/1/29 | 2,565,000 | 2,451,845 |
| 5.00%, due 7/1/54 | 2,000,000 | 1,592,128 |
| | Principal
Amount | Value |
| |
| Arizona (continued) |
| Arizona Industrial Development Authority, Idaho State Tax Commission, Linder Village Project, Revenue Bonds | | |
| 5.00%, due 6/1/31 (c) | $ 3,700,000 | $ 3,545,440 |
| Arizona Industrial Development Authority, Arizona Agribusiness and Equine Center, Inc., Revenue Bonds (c) | | |
| Series B | | |
| 5.00%, due 3/1/37 | 3,030,000 | 2,718,393 |
| Series B | | |
| 5.00%, due 3/1/42 | 3,185,000 | 2,704,505 |
| Arizona Industrial Development Authority, Provident Group-NCCU Properties LLC, Revenue Bonds | | |
| Series A, Insured: BAM | | |
| 5.00%, due 6/1/49 | 2,650,000 | 2,560,332 |
| Series A, Insured: BAM | | |
| 5.00%, due 6/1/54 | 2,850,000 | 2,708,156 |
| Arizona Industrial Development Authority, Somerset Academy of Las Vegas Lone Mountain Campus, Revenue Bonds | | |
| Series A | | |
| 5.00%, due 12/15/49 (c) | 1,200,000 | 976,366 |
| Arizona Industrial Development Authority, Mater Academy of Nevada, Bonanza Campus Project, Revenue Bonds | | |
| Series A | | |
| 5.00%, due 12/15/50 (c) | 1,500,000 | 1,266,729 |
| Arizona Industrial Development Authority, Provident Group, Eastern Michigan University Parking Project, Revenue Bonds | | |
| 5.00%, due 5/1/51 (d)(e) | 1,000,000 | 600,000 |
| Arizona Industrial Development Authority, American Charter Schools Foundation, Revenue Bonds (c) | | |
| 6.00%, due 7/1/37 | 2,910,000 | 2,911,606 |
| 6.00%, due 7/1/47 | 7,010,000 | 6,686,207 |
| City of Phoenix, Downtown Phoenix Student Housing LLC, Revenue Bonds | | |
| Series A | | |
| 5.00%, due 7/1/37 | 1,000,000 | 971,021 |
The notes to the financial statements are an integral part of, and should be read in conjunction with, the financial statements.
| 12 | MainStay MacKay High Yield Municipal Bond Fund |
| | Principal
Amount | Value |
| Long-Term Municipal Bonds (continued) |
| Arizona (continued) |
| City of Phoenix, Basis Schools Project, Revenue Bonds (c) | | |
| Series A | | |
| 5.00%, due 7/1/45 | $ 1,000,000 | $ 849,486 |
| Series A | | |
| 5.00%, due 7/1/46 | 3,820,000 | 3,216,576 |
| City of Phoenix, Downtown Phoenix Student Housing II LLC, Revenue Bonds | | |
| Series A | | |
| 5.00%, due 7/1/59 | 2,200,000 | 1,929,923 |
| City of Phoenix, Espiritu Community Development Corp., Revenue Bonds | | |
| Series A | | |
| 6.25%, due 7/1/36 | 820,000 | 729,651 |
| Glendale Industrial Development Authority, Midwestern University Foundation, Revenue Bonds | | |
| Series A | | |
| 2.125%, due 7/1/33 (a) | 2,000,000 | 1,474,098 |
| Glendale Industrial Development Authority, People of Faith, Inc. Obligated Group, Revenue Bonds | | |
| Series A | | |
| 5.00%, due 5/15/56 | 8,150,000 | 6,085,899 |
| Industrial Development Authority of the County of Pima (The), American Leadership Academy Project, Revenue Bonds (c) | | |
| 4.00%, due 6/15/51 | 8,400,000 | 5,735,337 |
| 4.00%, due 6/15/57 | 1,000,000 | 652,137 |
| 5.625%, due 6/15/45 | 3,685,000 | 3,413,617 |
| Industrial Development Authority of the County of Pima (The), Charter Schools Project, Revenue Bonds | | |
| Series Q | | |
| 5.375%, due 7/1/31 | 1,060,000 | 994,889 |
| Maricopa County Industrial Development Authority, Legacy Traditional School Project, Revenue Bonds | | |
| Series A | | |
| 4.00%, due 7/1/51 (c) | 530,000 | 366,523 |
| | Principal
Amount | Value |
| |
| Arizona (continued) |
| Maricopa County Industrial Development Authority, Legacy Traditional Schools Project, Revenue Bonds | | |
| Series A | | |
| 4.00%, due 7/1/56 (c) | $ 1,220,000 | $ 818,415 |
| Maricopa County Industrial Development Authority, Horizon Community Learning Center, Revenue Bonds | | |
| 5.00%, due 7/1/35 | 3,000,000 | 2,736,964 |
| Maricopa County Pollution Control Corp., El Paso Electric Co. Project, Revenue Bonds | | |
| Series B | | |
| 3.60%, due 4/1/40 | 8,650,000 | 6,789,998 |
| Pinal County Industrial Development Authority, WOF SW GGP 1 LLC, Revenue Bonds (a) | | |
| Series A | | |
| 5.50%, due 10/1/33 (c) | 7,673,000 | 6,925,619 |
| Series B | | |
| 5.50%, due 10/1/33 | 2,000,000 | 1,805,192 |
| | | 107,742,901 |
| Arkansas 1.1% |
| Arkansas Development Finance Authority, Washington Regional Medical Center, Revenue Bonds | | |
| 4.00%, due 2/1/42 | 4,390,000 | 3,451,661 |
| Arkansas Development Finance Authority, Baptist Health, Revenue Bonds | | |
| 4.00%, due 12/1/44 | 650,000 | 524,509 |
| Arkansas Development Finance Authority, Big River Steel Project, Revenue Bonds (a)(c) | | |
| 4.50%, due 9/1/49 | 55,600,000 | 49,376,953 |
| Series A | | |
| 4.75%, due 9/1/49 | 16,950,000 | 15,645,309 |
| Arkansas Development Finance Authority, United States Steel Corp., Revenue Bonds | | |
| 5.70%, due 5/1/53 (a) | 7,900,000 | 7,209,486 |
| | | 76,207,918 |
The notes to the financial statements are an integral part of, and should be read in conjunction with, the financial statements.
13
Portfolio of Investments October 31, 2023†^ (continued)
| | Principal
Amount | Value |
| Long-Term Municipal Bonds (continued) |
| California 7.0% |
| Alameda Corridor Transportation Authority, Revenue Bonds | | |
| Series A, Insured: NATL-RE | | |
| (zero coupon), due 10/1/35 | $ 3,440,000 | $ 1,962,460 |
| Bassett Unified School District, Capital Appreciation, Election 2004, Unlimited General Obligation | | |
| Series C, Insured: NATL-RE | | |
| (zero coupon), due 8/1/41 | 2,050,000 | 779,463 |
| Series C, Insured: NATL-RE | | |
| (zero coupon), due 8/1/42 | 2,000,000 | 716,405 |
| California Community Choice Financing Authority, Clean Energy Project, Revenue Bonds | | |
| Series C | | |
| 5.25%, due 1/1/54 (b) | 5,350,000 | 5,237,535 |
| California Community Housing Agency, Summit at Sausalito Apartments, Revenue Bonds | | |
| Series A-1 | | |
| 3.00%, due 2/1/57 (c) | 5,000,000 | 2,976,619 |
| California Community Housing Agency, Essential Housing, Revenue Bonds, Senior Lien | | |
| Series A-1 | | |
| 4.00%, due 2/1/56 (c) | 24,750,000 | 18,225,502 |
| California Community Housing Agency, Annadel Apartments, Revenue Bonds | | |
| Series A | | |
| 5.00%, due 4/1/49 (c) | 10,975,000 | 8,554,748 |
| California Community Housing Agency, Essential Housing, Serenity at Larkspur Apartments, Revenue Bonds | | |
| Series A | | |
| 5.00%, due 2/1/50 (c) | 4,795,000 | 3,571,683 |
| California Health Facilities Financing Authority, CommonSpirit Health, Revenue Bonds | | |
| Series A | | |
| 4.00%, due 4/1/49 | 7,255,000 | 5,750,824 |
| | Principal
Amount | Value |
| |
| California (continued) |
| California Health Facilities Financing Authority, Children's Hospital Los Angeles Obligated Group, Revenue Bonds | | |
| Series A | | |
| 5.00%, due 8/15/47 | $ 5,215,000 | $ 4,795,557 |
| California Infrastructure & Economic Development Bank, Equitable School Revolving Fund LLC Obligated Group, Revenue Bonds | | |
| Series B | | |
| 4.00%, due 11/1/46 | 3,060,000 | 2,464,614 |
| California Infrastructure & Economic Development Bank, WFCS Portfolio Projects, Revenue Bonds | | |
| Series A-1 | | |
| 5.00%, due 1/1/55 (c) | 3,225,000 | 2,293,331 |
| California Municipal Finance Authority, Ochard Park Student Housing Project, Revenue Bonds | | |
| Insured: BAM | | |
| 3.00%, due 5/15/51 | 3,095,000 | 2,070,609 |
| Insured: BAM | | |
| 3.00%, due 5/15/54 | 1,500,000 | 972,278 |
| California Municipal Finance Authority, LINXS APM Project, Revenue Bonds, Senior Lien (a) | | |
| Series A, Insured: AGM | | |
| 3.25%, due 12/31/32 | 5,965,000 | 5,099,973 |
| Series A, Insured: AGM | | |
| 4.00%, due 12/31/47 | 9,380,000 | 7,633,617 |
| Series A | | |
| 5.00%, due 12/31/43 | 5,745,000 | 5,435,951 |
| California Municipal Finance Authority, United Airlines, Inc. Project, Revenue Bonds | | |
| 4.00%, due 7/15/29 (a) | 18,575,000 | 17,389,963 |
| California Municipal Finance Authority, HumanGood California Obligated Group, Revenue Bonds | | |
| 4.00%, due 10/1/49 | 1,785,000 | 1,384,779 |
| California Municipal Finance Authority, Republic Services, Inc., Revenue Bonds (a)(b) | | |
| Series B | | |
| 4.20%, due 7/1/51 | 15,000,000 | 14,964,246 |
| Series A | | |
| 4.375%, due 9/1/53 | 3,750,000 | 3,561,100 |
The notes to the financial statements are an integral part of, and should be read in conjunction with, the financial statements.
| 14 | MainStay MacKay High Yield Municipal Bond Fund |
| | Principal
Amount | Value |
| Long-Term Municipal Bonds (continued) |
| California (continued) |
| California Municipal Finance Authority, William Jessup University, Revenue Bonds (c) | | |
| 5.00%, due 8/1/28 | $ 1,000,000 | $ 966,059 |
| 5.00%, due 8/1/48 | 2,675,000 | 2,131,575 |
| California Municipal Finance Authority, Charter School, Palmdale Aerospace Academy Projects (The), Revenue Bonds | | |
| Series A | | |
| 5.00%, due 7/1/46 (c) | 2,665,000 | 2,269,617 |
| California Municipal Finance Authority, CHF-Davis I LLC, West Village Student Housing Project, Revenue Bonds | | |
| 5.00%, due 5/15/48 | 19,250,000 | 18,436,389 |
| Insured: BAM | | |
| 5.00%, due 5/15/51 | 19,275,000 | 18,636,918 |
| California Municipal Finance Authority, Healthright 360, Revenue Bonds | | |
| Series A | | |
| 5.00%, due 11/1/49 (c) | 2,000,000 | 1,613,322 |
| California Municipal Finance Authority, Baptist University, Revenue Bonds | | |
| Series A | | |
| 5.375%, due 11/1/40 (c) | 3,000,000 | 2,823,206 |
| California Public Finance Authority, Enso Village Project, Revenue Bonds | | |
| Series B-2 | | |
| 2.375%, due 11/15/28 (c) | 1,500,000 | 1,408,110 |
| California Public Finance Authority, Kendal at Sonoma Obligated Group, Revenue Bonds | | |
| Series A | | |
| 5.00%, due 11/15/46 (c) | 750,000 | 619,660 |
| California Public Finance Authority, California University of Science & Medicine Obligated Group, Revenue Bonds | | |
| Series A | | |
| 6.25%, due 7/1/54 (c) | 5,265,000 | 5,377,458 |
| | Principal
Amount | Value |
| |
| California (continued) |
| California Public Finance Authority, California University of Science & Medicine, Revenue Bonds | | |
| Series B | | |
| 7.50%, due 7/1/36 (c) | $ 8,840,000 | $ 8,283,820 |
| California School Finance Authority, Granada Hills Charter High School Obligated Group, Revenue Bonds | | |
| Series A | | |
| 4.00%, due 7/1/48 (c) | 675,000 | 490,594 |
| California School Finance Authority, Vista Charter Public Schools, Revenue Bonds (c) | | |
| Series A | | |
| 4.00%, due 6/1/51 | 2,910,000 | 2,019,234 |
| Series A | | |
| 4.00%, due 6/1/61 | 1,840,000 | 1,201,873 |
| California School Finance Authority, Hawking STEAM Charter Schools, Inc., Revenue Bonds | | |
| Series A | | |
| 5.00%, due 7/1/42 (c) | 1,360,000 | 1,223,939 |
| California School Finance Authority, High Tech High Learning Project, Revenue Bonds | | |
| Series A | | |
| 5.00%, due 7/1/49 (c) | 3,000,000 | 2,506,698 |
| California School Finance Authority, Teach Public Schools, Revenue Bonds | | |
| Series A | | |
| 5.00%, due 6/1/58 (c) | 2,000,000 | 1,616,597 |
| California School Finance Authority, Aspire Public Schools, Revenue Bonds | | |
| Series A | | |
| 5.00%, due 8/1/59 (c) | 1,800,000 | 1,571,252 |
| California Statewide Communities Development Authority, Southern California Edison Co., Revenue Bonds | | |
| Series A | | |
| 1.75%, due 9/1/29 | 7,200,000 | 5,669,816 |
The notes to the financial statements are an integral part of, and should be read in conjunction with, the financial statements.
15
Portfolio of Investments October 31, 2023†^ (continued)
| | Principal
Amount | Value |
| Long-Term Municipal Bonds (continued) |
| California (continued) |
| California Statewide Communities Development Authority, Community Infrastructure Program, Special Assessment | | |
| Series 2021A | | |
| 4.00%, due 9/2/41 | $ 1,000,000 | $ 778,413 |
| Series A | | |
| 4.00%, due 9/2/51 | 995,000 | 689,562 |
| California Statewide Communities Development Authority, Methodist Hospital of Southern California, Revenue Bonds | | |
| 4.375%, due 1/1/48 | 2,185,000 | 1,830,186 |
| 5.00%, due 1/1/48 | 7,150,000 | 6,625,168 |
| California Statewide Communities Development Authority, Lancer Educational Student Housing Project, Revenue Bonds (c) | | |
| Series A | | |
| 5.00%, due 6/1/36 | 2,250,000 | 2,058,720 |
| Series A | | |
| 5.00%, due 6/1/46 | 2,000,000 | 1,674,145 |
| California Statewide Communities Development Authority, Loma Linda University Medical Center, Revenue Bonds (c) | | |
| Series A | | |
| 5.00%, due 12/1/46 | 18,170,000 | 16,056,271 |
| Series A | | |
| 5.25%, due 12/1/56 | 3,970,000 | 3,517,188 |
| California Statewide Communities Development Authority, Irvine Campus Apartments, Revenue Bonds | | |
| 5.00%, due 5/15/50 | 2,000,000 | 1,812,146 |
| California Statewide Communities Development Authority, Lancer Plaza Project, Revenue Bonds | | |
| 5.625%, due 11/1/33 | 680,000 | 675,131 |
| 5.875%, due 11/1/43 | 435,000 | 411,312 |
| California Statewide Communities Development Authority, California Baptist University, Revenue Bonds | | |
| Series A | | |
| 6.375%, due 11/1/43 (c) | 3,185,000 | 3,186,151 |
| | Principal
Amount | Value |
| |
| California (continued) |
| Cathedral City Public Financing Authority, Capital Appreciation, Tax Allocation | | |
| Series A, Insured: NATL-RE | | |
| (zero coupon), due 8/1/26 | $ 1,085,000 | $ 955,725 |
| City of Los Angeles, Department of Airports, Revenue Bonds, Senior Lien | | |
| Series G | | |
| 5.00%, due 5/15/47 (a) | 6,000,000 | 5,793,586 |
| City of South San Francisco, Community Facilities District No. 2021-01, Special Tax | | |
| 5.00%, due 9/1/52 | 1,500,000 | 1,354,194 |
| CMFA Special Finance Agency XII, Allure Apartments, Revenue Bonds, Senior Lien | | |
| Series A-1 | | |
| 3.25%, due 2/1/57 (c) | 5,500,000 | 3,409,051 |
| CSCDA Community Improvement Authority, Pasadena Portfolio, Revenue Bonds, Senior Lien | | |
| Series A-2 | | |
| 3.00%, due 12/1/56 (c) | 2,750,000 | 1,639,102 |
| CSCDA Community Improvement Authority, Theo Pasadena, Revenue Bonds, Senior Lien | | |
| Series A-2 | | |
| 3.25%, due 5/1/57 (c) | 11,100,000 | 6,692,930 |
| CSCDA Community Improvement Authority, Oceanaire Long Beach, Revenue Bonds | | |
| Series A-2 | | |
| 4.00%, due 9/1/56 (c) | 10,060,000 | 6,653,988 |
| CSCDA Community Improvement Authority, Altana Glendale, Revenue Bonds | | |
| Series A-2 | | |
| 4.00%, due 10/1/56 (c) | 9,100,000 | 6,107,076 |
| CSCDA Community Improvement Authority, Escondido Portfolio, Revenue Bonds, Senior Lien | | |
| Series A-2 | | |
| 4.00%, due 6/1/58 (c) | 4,750,000 | 3,263,348 |
| Foothill-Eastern Transportation Corridor Agency, Revenue Bonds | | |
| Series B-2, Insured: AGM-CR | | |
| 3.50%, due 1/15/53 | 13,265,000 | 9,813,860 |
The notes to the financial statements are an integral part of, and should be read in conjunction with, the financial statements.
| 16 | MainStay MacKay High Yield Municipal Bond Fund |
| | Principal
Amount | Value |
| Long-Term Municipal Bonds (continued) |
| California (continued) |
| Foothill-Eastern Transportation Corridor Agency, Revenue Bonds, Junior Lien | | |
| Series C, Insured: AGM-CR | | |
| 4.00%, due 1/15/43 | $ 16,904,000 | $ 14,789,945 |
| Foothill-Eastern Transportation Corridor Agency, Revenue Bonds, Senior Lien | | |
| Series A | | |
| 4.00%, due 1/15/46 | 27,304,000 | 22,917,358 |
| Series A, Insured: AGM-CR | | |
| 4.00%, due 1/15/46 | 27,795,000 | 23,986,026 |
| Golden State Tobacco Securitization Corp., Asset-Backed, Revenue Bonds | | |
| Series B-2 | | |
| (zero coupon), due 6/1/66 (f) | 536,680,000 | 44,019,728 |
| Golden State Tobacco Securitization Corp., Tobacco Settlement, Revenue Bonds | | |
| Series B-1 | | |
| 3.85%, due 6/1/50 | 1,355,000 | 1,232,584 |
| Hastings Campus Housing Finance Authority, Green Bond, Revenue Bonds, Senior Lien | | |
| Series A | | |
| 5.00%, due 7/1/61 (c) | 51,500,000 | 39,576,730 |
| Inland Empire Tobacco Securitization Corp., Revenue Bonds | | |
| Series D | | |
| (zero coupon), due 6/1/57 | 246,450,000 | 15,399,773 |
| Northern California Gas Authority No. 1, Gas Project, Revenue Bonds | | |
| Series B | | |
| 4.51%, due 7/1/27 | 21,900,000 | 21,641,803 |
| Riverside County Transportation Commission, Revenue Bonds, Senior Lien | | |
| Series B-1 | | |
| 3.00%, due 6/1/49 | 1,945,000 | 1,263,828 |
| Rohnerville School District, Election 2010, Unlimited General Obligation | | |
| Series B, Insured: AGM | | |
| (zero coupon), due 8/1/42 | 1,000,000 | 377,634 |
| | Principal
Amount | Value |
| |
| California (continued) |
| Rohnerville School District, Election 2010, Unlimited General Obligation (continued) | | |
| Series B, Insured: AGM | | |
| (zero coupon), due 8/1/47 | $ 1,000,000 | $ 281,941 |
| San Diego County Regional Airport Authority, Revenue Bonds | | |
| Series B | | |
| 4.00%, due 7/1/56 (a) | 11,160,000 | 8,575,701 |
| San Francisco City & County Redevelopment Agency, Community Facilities District No. 6 Bay Public, Special Tax | | |
| Series C | | |
| (zero coupon), due 8/1/37 | 5,015,000 | 2,279,055 |
| Series C | | |
| (zero coupon), due 8/1/38 | 2,000,000 | 846,264 |
| San Joaquin Hills Transportation Corridor Agency, Revenue Bonds, Senior Lien | | |
| Series A | | |
| 4.00%, due 1/15/50 | 7,300,000 | 6,151,087 |
| Santa Ana Unified School District, Capital Appreciation, Election 2008, Unlimited General Obligation | | |
| Series B, Insured: AGC | | |
| (zero coupon), due 8/1/47 | 24,400,000 | 6,227,505 |
| Sierra Kings Health Care District, Unlimited General Obligation | | |
| 5.00%, due 8/1/37 | 2,465,000 | 2,387,228 |
| Stockton Unified School District, Capital Appreciation, Election 2008, Unlimited General Obligation | | |
| Series D, Insured: AGM | | |
| (zero coupon), due 8/1/42 | 8,780,000 | 3,238,196 |
| Sutter Union High School District, Election 2008, Unlimited General Obligation | | |
| Series B | | |
| (zero coupon), due 6/1/50 | 16,010,000 | 2,460,133 |
The notes to the financial statements are an integral part of, and should be read in conjunction with, the financial statements.
17
Portfolio of Investments October 31, 2023†^ (continued)
| | Principal
Amount | Value |
| Long-Term Municipal Bonds (continued) |
| California (continued) |
| Tobacco Securitization Authority of Southern California, San Diego County Tobacco Asset Securitization Corp., Asset-Backed, Revenue Bonds | | |
| Series B-2 | | |
| (zero coupon), due 6/1/54 | $ 18,500,000 | $ 3,181,789 |
| West Contra Costa Healthcare District, Special Tax | | |
| 3.00%, due 7/1/42 | 5,620,000 | 4,036,333 |
| | | 504,575,288 |
| Colorado 2.6% |
| 3rd and Havana Metropolitan District, Tax Supported, Limited General Obligation | | |
| Series A | | |
| 5.25%, due 12/1/49 | 2,250,000 | 1,743,302 |
| Allison Valley Metropolitan District No. 2, Limited General Obligation | | |
| 4.70%, due 12/1/47 | 2,500,000 | 1,874,911 |
| Arkansas River Power Authority, Revenue Bonds | | |
| Series A | | |
| 5.00%, due 10/1/38 | 6,900,000 | 6,600,410 |
| Series A | | |
| 5.00%, due 10/1/43 | 7,025,000 | 6,560,847 |
| Broadway Park North Metropolitan District No. 2, Limited General Obligation (c) | | |
| 5.00%, due 12/1/40 | 1,000,000 | 878,444 |
| 5.00%, due 12/1/49 | 1,000,000 | 835,642 |
| Broadway Station Metropolitan District No. 2, Limited General Obligation | | |
| Series A | | |
| 5.125%, due 12/1/48 | 3,000,000 | 2,188,505 |
| Central Platte Valley Metropolitan District, Unlimited General Obligation | | |
| Series A | | |
| 5.375%, due 12/1/33 | 1,500,000 | 1,501,534 |
| Citadel on Colfax Business Improvement District, Revenue Bonds | | |
| Series A | | |
| 5.35%, due 12/1/50 | 1,000,000 | 814,207 |
| | Principal
Amount | Value |
| |
| Colorado (continued) |
| City & County of Denver, United Airlines, Inc., Project, Revenue Bonds | | |
| 5.00%, due 10/1/32 (a) | $ 6,800,000 | $ 6,375,608 |
| City of Fruita Healthcare, Canyons Hospital & Medical Center Project, Revenue Bonds | | |
| Series A | | |
| 5.50%, due 1/1/48 (c) | 9,650,000 | 7,608,328 |
| Colorado Educational & Cultural Facilities Authority, Northeast Campus Project, Revenue Bonds | | |
| Insured: Moral Obligation State Intercept | | |
| 3.00%, due 8/1/51 | 3,420,000 | 2,010,467 |
| Colorado Educational & Cultural Facilities Authority, New Summit Academy, Revenue Bonds | | |
| Series A | | |
| 4.00%, due 7/1/41 (c) | 1,850,000 | 1,413,379 |
| Colorado Educational & Cultural Facilities Authority, New Vision Chater School, Revenue Bonds | | |
| Series A, Insured: BAM Moral Obligation | | |
| 4.00%, due 6/1/42 | 2,635,000 | 2,210,383 |
| Series A, Insured: BAM Moral Obligation | | |
| 4.00%, due 6/1/52 | 4,700,000 | 3,634,324 |
| Series A, Insured: BAM Moral Obligation | | |
| 4.00%, due 6/1/56 | 6,255,000 | 4,709,421 |
| Colorado Health Facilities Authority, CommonSpirit Health, Revenue Bonds | | |
| Series A-2, Insured: BAM | | |
| 3.25%, due 8/1/49 | 11,600,000 | 7,804,565 |
| Series A-1 | | |
| 4.00%, due 8/1/44 | 4,750,000 | 3,828,720 |
| Series A-2 | | |
| 4.00%, due 8/1/49 | 21,105,000 | 16,326,205 |
| Series A-2 | | |
| 5.00%, due 8/1/44 | 11,425,000 | 10,802,563 |
| Colorado Health Facilities Authority, Covenant Retirement Communities, Revenue Bonds | | |
| Series A | | |
| 5.00%, due 12/1/35 | 3,500,000 | 3,357,099 |
The notes to the financial statements are an integral part of, and should be read in conjunction with, the financial statements.
| 18 | MainStay MacKay High Yield Municipal Bond Fund |
| | Principal
Amount | Value |
| Long-Term Municipal Bonds (continued) |
| Colorado (continued) |
Colorado Health Facilities Authority, Covenant Retirement Communities, Revenue Bonds
(continued) | | |
| Series A | | |
| 5.00%, due 12/1/48 | $ 6,840,000 | $ 5,840,597 |
| Colorado Health Facilities Authority, Mental Health Center of Denver Project, Revenue Bonds | | |
| Series A | | |
| 5.75%, due 2/1/44 | 5,330,000 | 5,331,287 |
| Copper Ridge Metropolitan District, Revenue Bonds | | |
| 5.00%, due 12/1/39 | 3,750,000 | 3,248,920 |
| Denver Health & Hospital Authority, 550 Acoma, Inc., Certificate of Participation | | |
| 5.00%, due 12/1/48 | 1,755,000 | 1,477,288 |
| Denver Health & Hospital Authority, Revenue Bonds | | |
| Series A | | |
| 5.25%, due 12/1/45 | 4,250,000 | 4,085,687 |
| E-470 Public Highway Authority, Revenue Bonds | | |
| Series B, Insured: NATL-RE | | |
| (zero coupon), due 9/1/25 | 245,000 | 226,529 |
| Series B, Insured: NATL-RE | | |
| (zero coupon), due 9/1/29 | 4,510,000 | 3,517,030 |
| Series B, Insured: NATL-RE | | |
| (zero coupon), due 9/1/30 | 500,000 | 372,177 |
| Series B, Insured: NATL-RE | | |
| (zero coupon), due 9/1/35 | 2,245,000 | 1,254,777 |
| Series B, Insured: NATL-RE | | |
| (zero coupon), due 9/1/37 | 1,170,000 | 586,086 |
| Series A | | |
| (zero coupon), due 9/1/39 | 1,800,000 | 780,650 |
| Series B, Insured: NATL-RE | | |
| (zero coupon), due 9/1/39 | 515,000 | 226,824 |
| Series A | | |
| (zero coupon), due 9/1/40 | 3,450,000 | 1,413,388 |
| Series A | | |
| (zero coupon), due 9/1/41 | 3,925,000 | 1,510,722 |
| Eagle County Airport Terminal Corp., Revenue Bonds | | |
| Series B | | |
| 5.00%, due 5/1/33 (a) | 1,980,000 | 1,954,222 |
| | Principal
Amount | Value |
| |
| Colorado (continued) |
| Evan's Place Metropolitan District, Limited General Obligation | | |
| Series A(3) | | |
| 5.00%, due 12/1/50 | $ 2,660,000 | $ 2,157,471 |
| Green Gables Metropolitan District No. 2, Limited General Obligation | | |
| Series A, Insured: BAM | | |
| 5.125%, due 12/1/53 | 675,000 | 645,447 |
| Series A, Insured: BAM | | |
| 5.25%, due 12/1/58 | 575,000 | 550,889 |
| Jefferson Center Metropolitan District No. 1, Revenue Bonds | | |
| Series B | | |
| 5.75%, due 12/15/50 | 4,115,000 | 3,634,001 |
| Johnstown Plaza Metropolitan District, Limited General Obligation | | |
| 4.25%, due 12/1/46 | 10,100,000 | 7,427,408 |
| Jones District Community Authority Board, Revenue Bonds | | |
| Series A | | |
| (zero coupon), due 12/1/50 (g) | 4,550,000 | 3,557,977 |
| Karl's Farm Metropolitan District No. 2, Limited General Obligation | | |
| Series A(3) | | |
| 5.625%, due 12/1/50 (c) | 1,485,000 | 1,257,260 |
| Mirabelle Metropolitan District No. 2, Limited General Obligation, Senior Lien | | |
| Series A | | |
| 5.00%, due 12/1/39 | 700,000 | 623,690 |
| Series A | | |
| 5.00%, due 12/1/49 | 1,250,000 | 1,025,767 |
| North Range Metropolitan District No. 3, Limited General Obligation | | |
| Series 2020A-3 | | |
| 5.25%, due 12/1/50 | 1,000,000 | 829,542 |
| Park Creek Metropolitan District, Revenue Bonds, Senior Lien | | |
| Series A, Insured: AGM | | |
| 4.00%, due 12/1/37 | 2,790,000 | 2,511,539 |
| Series A, Insured: AGM | | |
| 4.00%, due 12/1/46 | 20,600,000 | 17,026,528 |
| Park Creek Metropolitan District, Senior Ltd., Property, Revenue Bonds, Senior Lien | | |
| Series A | | |
| 5.00%, due 12/1/45 | 4,000,000 | 3,855,451 |
The notes to the financial statements are an integral part of, and should be read in conjunction with, the financial statements.
19
Portfolio of Investments October 31, 2023†^ (continued)
| | Principal
Amount | Value |
| Long-Term Municipal Bonds (continued) |
| Colorado (continued) |
| Raindance Metropolitan District No. 1 Non-Potable Water System, Revenue Bonds | | |
| 5.25%, due 12/1/50 | $ 1,500,000 | $ 1,232,970 |
| Raindance Metropolitan District No. 2, Limited General Obligation | | |
| Series A | | |
| 5.00%, due 12/1/49 | 2,500,000 | 2,056,030 |
| Southglenn Metropolitan District, Special Revenue, Limited General Obligation | | |
| 5.00%, due 12/1/46 | 2,100,000 | 1,776,841 |
| Sterling Ranch Community Authority Board, Colorado Limited Tax Supported and Special Revenue Senior Bonds, Revenue Bonds | | |
| Series A | | |
| 4.25%, due 12/1/50 | 1,250,000 | 954,801 |
| Village Metropolitan District (The), Special Revenue and Limited Property Tax, Limited General Obligation | | |
| 5.00%, due 12/1/40 | 750,000 | 668,734 |
| Villages at Castle Rock Metropolitan District No. 6, Limited General Obligation | | |
| Series A | | |
| 4.125%, due 12/1/51 (c) | 17,949,000 | 11,763,346 |
| | | 188,460,740 |
| Connecticut 0.4% |
| City of New Haven, Unlimited General Obligation | | |
| Series A | | |
| 4.00%, due 8/1/40 | 2,000,000 | 1,644,315 |
| City of West Haven, Unlimited General Obligation | | |
| Insured: BAM | | |
| 4.00%, due 9/15/41 | 1,130,000 | 972,183 |
| Connecticut State Health & Educational Facilities Authority, Yale University, Revenue Bonds | | |
| Series A | | |
| 0.375%, due 7/1/35 (b) | 100,000 | 96,906 |
| | Principal
Amount | Value |
| |
| Connecticut (continued) |
| Connecticut State Health & Educational Facilities Authority, University of Hartford (The), Revenue Bonds | | |
| Series N | | |
| 4.00%, due 7/1/39 | $ 5,550,000 | $ 4,212,311 |
| Series N | | |
| 4.00%, due 7/1/49 | 4,000,000 | 2,634,484 |
| Series N | | |
| 5.00%, due 7/1/31 | 575,000 | 551,966 |
| Series N | | |
| 5.00%, due 7/1/32 | 575,000 | 548,112 |
| Series N | | |
| 5.00%, due 7/1/33 | 475,000 | 449,166 |
| Series N | | |
| 5.00%, due 7/1/34 | 700,000 | 656,930 |
| Connecticut State Health & Educational Facilities Authority, Jerome Home, Revenue Bonds | | |
| Series E | | |
| 4.00%, due 7/1/51 | 1,250,000 | 835,664 |
| Connecticut State Health & Educational Facilities Authority, Mary Wade Home Obligated Group, Revenue Bonds (c) | | |
| Series A-1 | | |
| 4.50%, due 10/1/34 | 2,350,000 | 1,919,187 |
| Series A-1 | | |
| 5.00%, due 10/1/39 | 1,000,000 | 790,309 |
| Connecticut State Health & Educational Facilities Authority, McLean Issue, Revenue Bonds | | |
| Series A | | |
| 5.00%, due 1/1/30 (c) | 500,000 | 471,517 |
| Connecticut State Health & Educational Facilities Authority, University of New Haven, Inc., Revenue Bonds | | |
| Series K-3 | | |
| 5.00%, due 7/1/48 | 3,445,000 | 2,872,774 |
| Connecticut State Health & Educational Facilities Authority, Griffin Health Obligated Group, Revenue Bonds | | |
| Series G-1 | | |
| 5.00%, due 7/1/50 (c) | 1,750,000 | 1,394,383 |
The notes to the financial statements are an integral part of, and should be read in conjunction with, the financial statements.
| 20 | MainStay MacKay High Yield Municipal Bond Fund |
| | Principal
Amount | Value |
| Long-Term Municipal Bonds (continued) |
| Connecticut (continued) |
| Connecticut State Health & Educational Facilities Authority, Church Home of Hartford Obligated Group, Revenue Bonds | | |
| Series A | | |
| 5.00%, due 9/1/53 (c) | $ 2,235,000 | $ 1,611,458 |
| Connecticut State Higher Education Supplement Loan Authority, Chesla Loan Program, Revenue Bonds | | |
| Series B, Insured: BAM | | |
| 3.25%, due 11/15/35 (a) | 5,300,000 | 4,358,987 |
| Hartford Stadium Authority, Stadium Authority Lease, Revenue Bonds | | |
| Series A | | |
| 5.00%, due 2/1/36 | 1,475,000 | 1,407,248 |
| Steel Point Infrastructure Improvement District, Steelpointe Harbor Project, Tax Allocation (c) | | |
| 4.00%, due 4/1/31 | 700,000 | 638,343 |
| 4.00%, due 4/1/36 | 1,090,000 | 925,806 |
| 4.00%, due 4/1/41 | 1,785,000 | 1,423,915 |
| 4.00%, due 4/1/51 | 1,250,000 | 914,353 |
| | | 31,330,317 |
| Delaware 0.5% |
| County of Kent, Student Housing & Dining Facility, CHF-Dover LLC, Delaware State University Project, Revenue Bonds | | |
| Series A | | |
| 5.00%, due 7/1/40 | 1,050,000 | 968,329 |
| Series A | | |
| 5.00%, due 7/1/48 | 2,735,000 | 2,414,379 |
| Series A | | |
| 5.00%, due 7/1/53 | 4,040,000 | 3,499,347 |
| Series A | | |
| 5.00%, due 7/1/58 | 8,100,000 | 6,874,615 |
| Delaware State Economic Development Authority, Newark Charter School, Inc., Revenue Bonds | | |
| 4.00%, due 9/1/51 | 1,600,000 | 1,206,631 |
| Delaware State Health Facilities Authority, Beebe Medical Center, Revenue Bonds | | |
| 4.25%, due 6/1/38 | 2,235,000 | 1,893,966 |
| | Principal
Amount | Value |
| |
| Delaware (continued) |
| Delaware State Health Facilities Authority, Beebe Medical Center, Revenue Bonds (continued) | | |
| 4.375%, due 6/1/48 | $ 9,300,000 | $ 7,456,569 |
| 5.00%, due 6/1/37 | 1,000,000 | 983,287 |
| Delaware State Health Facilities Authority, Christiana Care Health System, Revenue Bonds | | |
| Series A | | |
| 5.00%, due 10/1/45 | 7,950,000 | 7,862,416 |
| Delaware State Health Facilities Authority, Beebe Medical Center, Inc., Revenue Bonds | | |
| 5.00%, due 6/1/48 | 4,700,000 | 4,250,348 |
| | | 37,409,887 |
| District of Columbia 2.1% |
| District of Columbia, Tobacco Settlement Financing Corp., Asset Backed, Revenue Bonds | | |
| Series A | | |
| (zero coupon), due 6/15/46 | 82,000,000 | 17,598,553 |
| District of Columbia, KIPP DC Project, Revenue Bonds | | |
| 4.00%, due 7/1/49 | 1,750,000 | 1,365,212 |
| District of Columbia, Provident Group-Howard Properties LLC, Revenue Bonds | | |
| 5.00%, due 10/1/30 | 1,500,000 | 1,438,959 |
| 5.00%, due 10/1/45 | 5,055,000 | 4,349,262 |
| District of Columbia, Friendship Public Charter School, Revenue Bonds | | |
| Series A | | |
| 5.00%, due 6/1/46 | 1,400,000 | 1,229,358 |
| District of Columbia, International School Obligated Group, Revenue Bonds | | |
| 5.00%, due 7/1/54 | 2,550,000 | 2,232,251 |
| District of Columbia, Revenue Bonds | | |
| 5.00%, due 6/1/55 | 4,110,000 | 3,268,143 |
| District of Columbia, Methodist Home, Revenue Bonds | | |
| Series A | | |
| 5.25%, due 1/1/39 | 1,015,000 | 817,182 |
The notes to the financial statements are an integral part of, and should be read in conjunction with, the financial statements.
21
Portfolio of Investments October 31, 2023†^ (continued)
| | Principal
Amount | Value |
| Long-Term Municipal Bonds (continued) |
| District of Columbia (continued) |
| Metropolitan Washington Airports Authority, Dulles Toll Road, Revenue Bonds, Senior Lien | | |
| Series B | | |
| (zero coupon), due 10/1/39 | $ 5,005,000 | $ 2,088,703 |
| Metropolitan Washington Airports Authority, Dulles Toll Road, Revenue Bonds, Sub. Lien | | |
| Series B | | |
| 4.00%, due 10/1/49 | 98,895,000 | 77,508,561 |
| Metropolitan Washington Airports Authority, Dulles Toll Road, Metrorail & Capital Improvement Project, Revenue Bonds, Senior Lien | | |
| Series A, Insured: AGM | | |
| 4.00%, due 10/1/52 | 4,000,000 | 3,319,688 |
| Metropolitan Washington Airports Authority, Dulles Toll Road, Metrorail & Capital Improvement Project, Revenue Bonds, Sub. Lien | | |
| Series B, Insured: AGM | | |
| 4.00%, due 10/1/53 | 12,950,000 | 10,701,911 |
| Metropolitan Washington Airports Authority, Revenue Bonds (a) | | |
| Series A | | |
| 5.00%, due 10/1/32 | 15,750,000 | 15,783,280 |
| Series A | | |
| 5.00%, due 10/1/46 | 7,795,000 | 7,475,136 |
| | | 149,176,199 |
| Florida 3.2% |
| Capital Projects Finance Authority, Provident Group - Continuum Properties LLC, Revenue Bonds, Senior Lien | | |
| Series A-1 | | |
| 5.00%, due 11/1/53 | 3,125,000 | 2,820,594 |
| Capital Trust Agency, Inc., Wonderful Foundations Charter School, Revenue Bonds | | |
| Series B | | |
| (zero coupon), due 1/1/60 | 16,000,000 | 703,139 |
| Series A-1 | | |
| 5.00%, due 1/1/55 (c) | 1,750,000 | 1,225,294 |
| | Principal
Amount | Value |
| |
| Florida (continued) |
| Capital Trust Agency, Inc., Odyssey Charter School, Inc., Revenue Bonds | | |
| Series A | | |
| 5.50%, due 7/1/47 (c) | $ 2,000,000 | $ 1,766,412 |
| Celebration Community Development District, Assessment Area 1 Project, Special Assessment | | |
| 3.125%, due 5/1/41 | 590,000 | 402,808 |
| 4.00%, due 5/1/51 | 845,000 | 595,898 |
| CFM Community Development District, Capital Improvement, Special Assessment | | |
| 3.35%, due 5/1/41 | 200,000 | 141,174 |
| 4.00%, due 5/1/51 | 290,000 | 204,289 |
| City of Atlantic Beach, Fleet Landing Project, Revenue Bonds | | |
| Series A | | |
| 5.00%, due 11/15/48 | 3,000,000 | 2,453,540 |
| Series B | | |
| 5.625%, due 11/15/43 | 1,500,000 | 1,405,039 |
| City of Fort Myers, Utility System, Revenue Bonds | | |
| Series A | | |
| 4.00%, due 10/1/49 | 10,155,000 | 8,325,225 |
| City of Pompano Beach, John Knox Village Project, Revenue Bonds | | |
| Series A | | |
| 4.00%, due 9/1/51 | 650,000 | 435,917 |
| Series A | | |
| 4.00%, due 9/1/56 | 4,915,000 | 3,180,051 |
| City of Tallahassee, Tallahassee Memorial HealthCare, Inc., Revenue Bonds | | |
| Series A | | |
| 5.00%, due 12/1/40 | 6,835,000 | 6,321,558 |
| Collier County Health Facilities Authority, Moorings, Inc. Obligated Group (The), Revenue Bonds | | |
| 4.00%, due 5/1/52 | 7,900,000 | 6,129,803 |
| Cordova Palms Community Development District, Special Assessment | | |
| 3.00%, due 5/1/41 | 1,215,000 | 818,352 |
The notes to the financial statements are an integral part of, and should be read in conjunction with, the financial statements.
| 22 | MainStay MacKay High Yield Municipal Bond Fund |
| | Principal
Amount | Value |
| Long-Term Municipal Bonds (continued) |
| Florida (continued) |
| County of Osceola, Transportation, Revenue Bonds | | |
| Series A-1 | | |
| 4.00%, due 10/1/54 | $ 4,345,000 | $ 3,241,617 |
| Series A-1 | | |
| 5.00%, due 10/1/44 | 11,000,000 | 10,317,770 |
| Cypress Ridge Community Development District, Assessment Area One Project, Special Assessment | | |
| 5.625%, due 5/1/43 | 1,250,000 | 1,156,020 |
| 5.875%, due 5/1/53 | 1,000,000 | 915,971 |
| Elevation Pointe Community Development District, Special Assessment | | |
| Series A-1 | | |
| 4.60%, due 5/1/52 | 1,090,000 | 849,006 |
| Epperson North Community Development District, Assessment Area 3, Special Assessment | | |
| Series A | | |
| 3.40%, due 11/1/41 | 2,050,000 | 1,439,722 |
| Epperson North Community Development District, Assessment Area 2, Special Assessment | | |
| 3.50%, due 5/1/41 | 735,000 | 528,031 |
| Escambia County Health Facilities Authority, Baptist Health Care Corp. Obligated Group, Revenue Bonds | | |
| Series A | | |
| 4.00%, due 8/15/50 | 4,865,000 | 3,673,561 |
| Florida Development Finance Corp., Mayflower Retirement Community Centre, Inc., Revenue Bonds | | |
| Series B-1 | | |
| 2.375%, due 6/1/27 (c) | 100,000 | 99,980 |
| Florida Development Finance Corp., UF Health Jacksonville Project, Revenue Bonds | | |
| Series A, Insured: AGM-CR | | |
| 4.00%, due 2/1/52 | 14,005,000 | 11,194,846 |
| Series A | | |
| 5.00%, due 2/1/40 | 2,600,000 | 2,213,630 |
| Series A | | |
| 5.00%, due 2/1/52 | 6,350,000 | 5,056,293 |
| | Principal
Amount | Value |
| |
| Florida (continued) |
| Florida Development Finance Corp., River City Education Obligated Group, Revenue Bonds | | |
| Series A | | |
| 4.00%, due 7/1/55 | $ 1,000,000 | $ 689,005 |
| Florida Development Finance Corp., Florida Charter Foundation, Inc. Project, Revenue Bonds | | |
| Series A | | |
| 4.75%, due 7/15/36 (c) | 4,255,000 | 3,803,970 |
| Florida Development Finance Corp., Mater Academy Project, Revenue Bonds | | |
| Series A | | |
| 5.00%, due 6/15/47 | 1,700,000 | 1,543,139 |
| Series A | | |
| 5.00%, due 6/15/50 | 3,000,000 | 2,685,902 |
| Series A | | |
| 5.00%, due 6/15/52 | 1,275,000 | 1,133,397 |
| Series A | | |
| 5.00%, due 6/15/55 | 5,550,000 | 4,886,875 |
| Florida Higher Educational Facilities Financial Authority, Ringling College Project, Revenue Bonds | | |
| 4.00%, due 3/1/47 | 6,370,000 | 4,750,842 |
| 5.00%, due 3/1/47 | 4,750,000 | 4,186,341 |
| Florida Higher Educational Facilities Financial Authority, Saint Leo University Project, Revenue Bonds | | |
| 5.00%, due 3/1/44 | 1,370,000 | 1,087,611 |
| 5.00%, due 3/1/49 | 1,630,000 | 1,250,371 |
| Hillsborough County Industrial Development Authority, Tampa General Hospital Project, Revenue Bonds | | |
| Series A | | |
| 4.00%, due 8/1/50 | 40,340,000 | 31,655,972 |
| Series A | | |
| 4.00%, due 8/1/55 | 52,185,000 | 39,593,840 |
| Lakewood Ranch Stewardship District, Star Farms at Lakewood Ranch Project Phase 1 and 2, Special Assessment | | |
| 3.00%, due 5/1/41 | 430,000 | 293,128 |
| 4.00%, due 5/1/52 | 675,000 | 476,828 |
The notes to the financial statements are an integral part of, and should be read in conjunction with, the financial statements.
23
Portfolio of Investments October 31, 2023†^ (continued)
| | Principal
Amount | Value |
| Long-Term Municipal Bonds (continued) |
| Florida (continued) |
| Lee Memorial Health System, Revenue Bonds | | |
| Series A-1 | | |
| 4.00%, due 4/1/49 | $ 4,015,000 | $ 3,234,054 |
| Miami Beach Health Facilities Authority, Mt Sinai Medical Center, Revenue Bonds | | |
| Series B | | |
| 3.00%, due 11/15/51 | 4,190,000 | 2,510,815 |
| 5.00%, due 11/15/39 | 2,230,000 | 2,121,790 |
| Mid-Bay Bridge Authority, Revenue Bonds | | |
| Series A | | |
| 5.00%, due 10/1/35 | 1,500,000 | 1,477,992 |
| Series C | | |
| 5.00%, due 10/1/40 | 1,000,000 | 936,664 |
| Mirada II Community Development District, Capital Improvement, Special Assessment | | |
| 3.125%, due 5/1/31 | 500,000 | 427,208 |
| 3.50%, due 5/1/41 | 1,000,000 | 728,280 |
| 4.00%, due 5/1/51 | 1,900,000 | 1,337,529 |
| New Port Tampa Bay Community Development District, Special Assessment | | |
| 3.50%, due 5/1/31 | 310,000 | 270,239 |
| 4.125%, due 5/1/52 | 365,000 | 261,144 |
| North Powerline Road Community Development District, Special Assessment | | |
| 3.625%, due 5/1/40 | 500,000 | 374,557 |
| 4.00%, due 5/1/51 | 1,075,000 | 758,095 |
| Osceola County Expressway Authority, Poinciana Parkway Project, Revenue Bonds, Senior Lien | | |
| Series B-2 | | |
| (zero coupon), due 10/1/36 (g) | 3,700,000 | 3,969,330 |
| Palm Beach County Health Facilities Authority, Toby & Leon Cooperman Sinai residencies of Boca Raton, Revenue Bonds | | |
| 4.00%, due 6/1/36 | 4,000,000 | 3,241,914 |
| | Principal
Amount | Value |
| |
| Florida (continued) |
| Pinellas County Educational Facilities Authority, Pinellas Academy Math & Science Project, Revenue Bonds | | |
| Series A | | |
| 5.00%, due 12/15/48 (c) | $ 3,030,000 | $ 2,618,103 |
| Polk County Industrial Development Authority, Carpenter's Home Estates, Inc., Revenue Bonds | | |
| Series A | | |
| 5.00%, due 1/1/39 | 1,750,000 | 1,534,380 |
| Polk County Industrial Development Authority, Carpenter's Home Estates, Inc. Project, Revenue Bonds | | |
| Series A | | |
| 5.00%, due 1/1/55 | 800,000 | 615,352 |
| Preston Cove Community Development District, Special Assessment | | |
| 4.00%, due 5/1/42 | 1,825,000 | 1,413,508 |
| Sawyers Landing Community Development District, Special Assessment | | |
| 3.75%, due 5/1/31 | 1,550,000 | 1,340,193 |
| 4.25%, due 5/1/53 | 3,000,000 | 2,109,914 |
| Shingle Creek at Bronson Community Development District, Special Assessment | | |
| 3.50%, due 6/15/41 | 1,000,000 | 721,018 |
| South Broward Hospital District, Revenue Bonds | | |
| Series A | | |
| 3.00%, due 5/1/51 | 17,550,000 | 11,024,745 |
| Stillwater Community Development District, 2021 Project, Special Assessment (c) | | |
| 3.00%, due 6/15/31 | 410,000 | 345,075 |
| 3.50%, due 6/15/41 | 1,000,000 | 724,189 |
| Tradition Community Development District No. 9, Special Assessment | | |
| 3.00%, due 5/1/41 | 1,800,000 | 1,204,910 |
| Two Rivers North Community Development District, Special Assessment | | |
| 5.25%, due 5/1/52 | 1,500,000 | 1,301,544 |
The notes to the financial statements are an integral part of, and should be read in conjunction with, the financial statements.
| 24 | MainStay MacKay High Yield Municipal Bond Fund |
| | Principal
Amount | Value |
| Long-Term Municipal Bonds (continued) |
| Florida (continued) |
| V-Dana Community Development District, Special Assessment | | |
| 3.625%, due 5/1/41 | $ 1,040,000 | $ 774,436 |
| Veranda Community Development District II, Special Assessment | | |
| 3.60%, due 5/1/41 (c) | 240,000 | 174,761 |
| Viera Stewardship District, Village 2 Project, Special Assessment | | |
| Series 2 | | |
| 5.30%, due 5/1/43 | 2,340,000 | 2,138,161 |
| Series 2 | | |
| 5.50%, due 5/1/54 | 3,000,000 | 2,680,199 |
| Village Community Development District No. 15, Special Assessment (c) | | |
| 5.00%, due 5/1/43 | 1,000,000 | 932,725 |
| 5.25%, due 5/1/54 | 1,800,000 | 1,659,156 |
| Windward at Lakewood Ranch Community Development District, Phase 2 Project, Special Assessment | | |
| 4.00%, due 5/1/42 | 1,055,000 | 817,202 |
| 4.25%, due 5/1/52 | 1,350,000 | 989,171 |
| | | 232,421,114 |
| Georgia 1.4% |
| Atlanta Urban Redevelopment Agency, Atlanta BeltLine Special Service District, Revenue Bonds | | |
| Insured: BAM | | |
| 3.625%, due 7/1/42 (c) | 5,355,000 | 4,271,299 |
| Brookhaven Development Authority, Children's Healthcare of Atlanta, Revenue Bonds | | |
| Series A | | |
| 4.00%, due 7/1/49 | 9,600,000 | 8,093,820 |
| Columbia County Hospital Authority, WellStar Health System, Revenue Bonds | | |
| Series A | | |
| 5.75%, due 4/1/53 | 10,500,000 | 10,969,241 |
| Development Authority of Cobb County (The), Kennesaw State University, Revenue Bonds, Junior Lien | | |
| Series C | | |
| 5.00%, due 7/15/38 | 85,000 | 86,575 |
| | Principal
Amount | Value |
| |
| Georgia (continued) |
| Development Authority of Cobb County (The), Kennesaw State University, Revenue Bonds, Junior Lien (continued) | | |
| Series C | | |
| 5.00%, due 7/15/38 | $ 2,305,000 | $ 2,189,635 |
| Fulton County Residential Care Facilities for the Elderly Authority, Lenbrook Square Foundation, Inc., Revenue Bonds | | |
| 5.00%, due 7/1/36 | 3,500,000 | 3,274,857 |
| Gainesville & Hall County Development Authority, Riverside Military Academy, Inc., Revenue Bonds | | |
| 5.125%, due 3/1/52 | 1,500,000 | 991,510 |
| George L Smith II Congress Center Authority, Convention Centre Hotel, Revenue Bonds, First Tier | | |
| Series A | | |
| 4.00%, due 1/1/54 | 4,750,000 | 3,559,289 |
| George L Smith II Congress Center Authority, Convention Centre Hotel, Revenue Bonds, Second Tier | | |
| Series B | | |
| 5.00%, due 1/1/54 (c) | 4,000,000 | 2,987,717 |
| Main Street Natural Gas, Inc., Revenue Bonds | | |
| Series A | | |
| 4.00%, due 5/15/39 | 6,550,000 | 5,558,438 |
| Series A | | |
| 5.00%, due 5/15/38 | 3,500,000 | 3,340,502 |
| Municipal Electric Authority of Georgia, Project One Subordinated Bonds, Revenue Bonds | | |
| Series A, Insured: BAM | | |
| 4.00%, due 1/1/49 | 14,150,000 | 11,585,748 |
| Municipal Electric Authority of Georgia, Plant Vogtle Units 3&4 Project, Revenue Bonds | | |
| Series B, Insured: BAM | | |
| 4.00%, due 1/1/49 | 56,515,000 | 46,273,397 |
| | | 103,182,028 |
The notes to the financial statements are an integral part of, and should be read in conjunction with, the financial statements.
25
Portfolio of Investments October 31, 2023†^ (continued)
| | Principal
Amount | Value |
| Long-Term Municipal Bonds (continued) |
| Guam 0.4% |
| Guam Department of Education, John F. Kennedy High School Refunding & Energy Efficiency Project, Certificate of Participation | | |
| Series A | | |
| 4.25%, due 2/1/30 | $ 1,190,000 | $ 1,092,033 |
| Series A | | |
| 5.00%, due 2/1/40 | 4,825,000 | 4,244,511 |
| Guam Government Waterworks Authority, Water and Wastewater System, Revenue Bonds | | |
| 5.00%, due 7/1/40 | 230,000 | 214,299 |
| Series A | | |
| 5.00%, due 1/1/50 | 5,890,000 | 5,292,418 |
| Port Authority of Guam, Revenue Bonds | | |
| Series A | | |
| 5.00%, due 7/1/48 | 4,850,000 | 4,475,248 |
| Territory of Guam, Business Privilege Tax, Revenue Bonds | | |
| Series F | | |
| 4.00%, due 1/1/36 | 5,820,000 | 5,235,901 |
| Series D | | |
| 5.00%, due 11/15/32 | 2,000,000 | 1,961,486 |
| Series D | | |
| 5.00%, due 11/15/34 | 4,580,000 | 4,414,506 |
| Series D | | |
| 5.00%, due 11/15/35 | 5,600,000 | 5,341,745 |
| | | 32,272,147 |
| Hawaii 0.6% |
| Kauai County Community Facilities District, Kukui'ula Development Project, Special Tax | | |
| 4.375%, due 5/15/42 | 2,300,000 | 1,887,492 |
| 5.00%, due 5/15/49 | 4,250,000 | 3,831,140 |
| 5.00%, due 5/15/51 | 5,585,000 | 5,002,241 |
| State of Hawaii Department of Budget & Finance, Hawaiian Electric Co., Inc., Revenue Bonds (a) | | |
| Insured: AGM-CR | | |
| 3.50%, due 10/1/49 | 25,800,000 | 18,109,386 |
| Series B | | |
| 4.00%, due 3/1/37 | 5,000,000 | 3,237,824 |
| | Principal
Amount | Value |
| |
| Hawaii (continued) |
| State of Hawaii Department of Budget & Finance, Chaminade University of Honolulu, Revenue Bonds | | |
| Series A | | |
| 5.00%, due 1/1/45 (c) | $ 1,500,000 | $ 1,175,347 |
| State of Hawaii Department of Budget & Finance, Hawaii Pacific University, Revenue Bonds (c) | | |
| Series A | | |
| 6.625%, due 7/1/33 | 2,085,000 | 2,085,852 |
| Series A | | |
| 6.875%, due 7/1/43 | 4,240,000 | 4,239,693 |
| | | 39,568,975 |
| Idaho 0.1% |
| Idaho Health Facilities Authority, St Luke's Health System Project, Revenue Bonds | | |
| Series A | | |
| 3.00%, due 3/1/51 | 8,750,000 | 5,437,317 |
| Idaho Health Facilities Authority, Madison Memorial Hospital, Revenue Bonds | | |
| 5.00%, due 9/1/37 | 1,000,000 | 901,257 |
| Idaho Housing & Finance Association, Gem Prep: Meridian Project, Revenue Bonds | | |
| Series A, Insured: School Bond Guaranty | | |
| 4.00%, due 5/1/57 | 4,315,000 | 3,050,778 |
| | | 9,389,352 |
| Illinois 10.8% |
| Bridgeview Finance Corp., Sales Tax, Revenue Bonds | | |
| Series A | | |
| 5.00%, due 12/1/42 | 7,150,000 | 6,350,671 |
| Chicago Board of Education, Capital Appreciation, School Reform, Unlimited General Obligation | | |
| Series A, Insured: NATL-RE | | |
| (zero coupon), due 12/1/27 | 5,125,000 | 4,196,322 |
| Series B-1, Insured: NATL-RE | | |
| (zero coupon), due 12/1/30 | 12,900,000 | 9,024,105 |
| Series A, Insured: NATL-RE | | |
| (zero coupon), due 12/1/31 | 170,000 | 112,562 |
| Series B-1, Insured: NATL-RE | | |
| (zero coupon), due 12/1/31 | 1,095,000 | 725,030 |
The notes to the financial statements are an integral part of, and should be read in conjunction with, the financial statements.
| 26 | MainStay MacKay High Yield Municipal Bond Fund |
| | Principal
Amount | Value |
| Long-Term Municipal Bonds (continued) |
| Illinois (continued) |
| Chicago Board of Education, Unlimited General Obligation | | |
| Series B | | |
| 4.00%, due 12/1/38 | $ 3,750,000 | $ 3,092,325 |
| Series A | | |
| 4.00%, due 12/1/42 | 2,965,000 | 2,310,166 |
| Series A | | |
| 4.00%, due 12/1/43 | 4,000,000 | 3,085,294 |
| Series A | | |
| 4.00%, due 12/1/47 | 43,945,000 | 32,647,655 |
| Series A | | |
| 5.00%, due 12/1/30 | 3,500,000 | 3,460,862 |
| Series B | | |
| 5.00%, due 12/1/31 | 4,650,000 | 4,586,061 |
| Series A | | |
| 5.00%, due 12/1/37 | 13,405,000 | 12,603,157 |
| Series A | | |
| 5.00%, due 12/1/38 | 5,150,000 | 4,788,277 |
| Series G | | |
| 5.00%, due 12/1/44 | 2,785,000 | 2,487,523 |
| Series D | | |
| 5.00%, due 12/1/46 | 11,100,000 | 9,770,086 |
| Series A | | |
| 5.00%, due 12/1/47 | 30,695,000 | 26,928,014 |
| Series C | | |
| 5.25%, due 12/1/39 | 1,405,000 | 1,301,277 |
| Series A | | |
| 7.00%, due 12/1/44 | 10,975,000 | 11,216,441 |
| Chicago Board of Education, Dedicated Capital Improvement, Unlimited General Obligation | | |
| Series C | | |
| 5.00%, due 12/1/34 | 2,270,000 | 2,205,715 |
| Series H | | |
| 5.00%, due 12/1/36 | 1,915,000 | 1,811,685 |
| Series B | | |
| 7.00%, due 12/1/42 (c) | 9,600,000 | 10,015,176 |
| Series A | | |
| 7.00%, due 12/1/46 (c) | 3,650,000 | 3,789,818 |
| Chicago Board of Education, Dedicated Capital Improvement, Revenue Bonds | | |
| 5.00%, due 4/1/35 | 1,615,000 | 1,603,515 |
| 5.00%, due 4/1/36 | 1,270,000 | 1,247,472 |
| 5.00%, due 4/1/42 | 3,500,000 | 3,211,971 |
| 5.00%, due 4/1/46 | 4,650,000 | 4,151,623 |
| 5.75%, due 4/1/48 | 5,750,000 | 5,782,552 |
| | Principal
Amount | Value |
| |
| Illinois (continued) |
| Chicago Board of Education, Dedicated Capital Improvement, Revenue Bonds (continued) | | |
| 6.00%, due 4/1/46 | $ 41,400,000 | $ 41,649,091 |
| Chicago O'Hare International Airport, TRIPS Obligated Group, Revenue Bonds | | |
| 5.00%, due 7/1/38 (a) | 1,500,000 | 1,413,831 |
| Chicago O'Hare International Airport, General, Revenue Bonds, Senior Lien | | |
| Series A, Insured: AGM | | |
| 5.50%, due 1/1/53 (a) | 4,690,000 | 4,714,023 |
| City of Chicago, City Colleges Capital Improvement Project, Unlimited General Obligation | | |
| Insured: NATL-RE | | |
| (zero coupon), due 1/1/34 | 300,000 | 174,927 |
| City of Chicago, Waterworks, Revenue Bonds, Second Lien | | |
| 4.00%, due 11/1/37 | 3,145,000 | 2,764,154 |
| City of Chicago, Unlimited General Obligation | | |
| Series A | | |
| 5.00%, due 1/1/39 | 5,650,000 | 5,512,252 |
| Series A | | |
| 5.00%, due 1/1/40 | 3,900,000 | 3,779,675 |
| Series A | | |
| 5.00%, due 1/1/44 | 11,150,000 | 10,527,862 |
| Series A | | |
| 5.50%, due 1/1/49 | 17,950,000 | 17,542,090 |
| Series A | | |
| 6.00%, due 1/1/38 | 38,545,000 | 39,490,305 |
| City of Chicago, Taxable Project, Unlimited General Obligation | | |
| Series B | | |
| 5.50%, due 1/1/31 | 2,360,000 | 2,362,437 |
| Series D | | |
| 5.50%, due 1/1/37 | 3,500,000 | 3,454,603 |
| Series A | | |
| 5.75%, due 1/1/34 | 3,550,000 | 3,647,996 |
| City of Galesburg, Knox College Project, Revenue Bonds | | |
| Series A | | |
| 4.00%, due 10/1/46 | 6,700,000 | 5,041,751 |
The notes to the financial statements are an integral part of, and should be read in conjunction with, the financial statements.
27
Portfolio of Investments October 31, 2023†^ (continued)
| | Principal
Amount | Value |
| Long-Term Municipal Bonds (continued) |
| Illinois (continued) |
| Illinois Finance Authority, Midwestern University Foundation, Revenue Bonds | | |
| Series A | | |
| 2.25%, due 7/1/33 (a) | $ 500,000 | $ 373,870 |
| Illinois Finance Authority, University of Illinois Health Services, Revenue Bonds | | |
| 4.00%, due 10/1/50 | 13,850,000 | 10,390,803 |
| 4.00%, due 10/1/55 | 5,365,000 | 3,912,376 |
| Illinois Finance Authority, Bradley University, Revenue Bonds | | |
| Series A | | |
| 4.00%, due 8/1/51 | 3,225,000 | 2,404,415 |
| Illinois Finance Authority, Learn Charter School Project, Revenue Bonds | | |
| 4.00%, due 11/1/51 | 1,100,000 | 827,985 |
| 4.00%, due 11/1/56 | 750,000 | 548,259 |
| Illinois Finance Authority, Rosalind Franklin University of Medicine & Science, Revenue Bonds | | |
| Series C | | |
| 4.25%, due 8/1/42 | 2,900,000 | 2,436,275 |
| Illinois Finance Authority, Columbia College Chicago, Revenue Bonds | | |
| Series A | | |
| 5.00%, due 12/1/23 | 1,125,000 | 1,124,508 |
| Series A | | |
| 5.00%, due 12/1/37 | 9,650,000 | 9,030,792 |
| Illinois Finance Authority, Noble Network Charter Schools, Revenue Bonds | | |
| 5.00%, due 9/1/32 | 1,830,000 | 1,800,467 |
| Illinois Finance Authority, Friendship Village Schaumburg, Revenue Bonds (d)(e)(g) | | |
| 5.00%, due 2/15/37 | 7,375,000 | 1,991,250 |
| 5.125%, due 2/15/45 | 5,715,000 | 1,543,050 |
| Illinois Finance Authority, Christian Homes, Inc., Revenue Bonds | | |
| 5.00%, due 5/15/40 | 1,265,000 | 572,412 |
| Illinois Finance Authority, Franciscan Communities, Inc., Revenue Bonds | | |
| Series A | | |
| 5.00%, due 5/15/47 | 1,155,000 | 965,803 |
| | Principal
Amount | Value |
| |
| Illinois (continued) |
| Illinois Finance Authority, Chicago International School Project, Revenue Bonds | | |
| Series A | | |
| 5.00%, due 12/1/47 | $ 3,000,000 | $ 2,563,879 |
| Illinois Finance Authority, Rosalind Franklin University of Medicine and Science, Revenue Bonds | | |
| Series C | | |
| 5.00%, due 8/1/49 | 1,300,000 | 1,168,201 |
| Illinois Finance Authority, Student Housing & Academic Facility, CHF-Chicago LLC, University of Illinois at Chicago Project, Revenue Bonds | | |
| Series A | | |
| 5.00%, due 2/15/50 | 7,985,000 | 6,887,704 |
| Illinois Finance Authority, Roosevelt University Project, Revenue Bonds | | |
| 5.50%, due 4/1/32 | 2,000,000 | 1,843,777 |
| Illinois Finance Authority, Roosevelt University, Revenue Bonds (c) | | |
| Series A | | |
| 6.00%, due 4/1/38 | 3,130,000 | 2,798,871 |
| Series A | | |
| 6.125%, due 4/1/49 | 2,355,000 | 2,022,605 |
| Macon County School District No. 61 Decatur, Unlimited General Obligation | | |
| Series C, Insured: AGM | | |
| 4.00%, due 1/1/40 | 2,500,000 | 2,165,607 |
| Series C, Insured: AGM | | |
| 4.00%, due 1/1/45 | 2,875,000 | 2,436,834 |
| Metropolitan Pier & Exposition Authority, McCormick Place Expansion Project, Revenue Bonds | | |
| Series A, Insured: AGM-CR | | |
| (zero coupon), due 6/15/30 | 5,675,000 | 4,192,056 |
| Series A, Insured: NATL-RE | | |
| (zero coupon), due 12/15/32 | 37,700,000 | 24,371,862 |
| Series A, Insured: NATL-RE | | |
| (zero coupon), due 6/15/33 | 1,165,000 | 734,964 |
| Series A, Insured: NATL-RE | | |
| (zero coupon), due 12/15/33 | 2,250,000 | 1,384,549 |
| Series A, Insured: NATL-RE | | |
| (zero coupon), due 6/15/34 | 45,315,000 | 27,160,130 |
The notes to the financial statements are an integral part of, and should be read in conjunction with, the financial statements.
| 28 | MainStay MacKay High Yield Municipal Bond Fund |
| | Principal
Amount | Value |
| Long-Term Municipal Bonds (continued) |
| Illinois (continued) |
| Metropolitan Pier & Exposition Authority, McCormick Place Expansion Project, Revenue Bonds (continued) | | |
| Series A, Insured: NATL-RE | | |
| (zero coupon), due 12/15/36 | $ 33,795,000 | $ 17,347,937 |
| Series A, Insured: NATL-RE | | |
| (zero coupon), due 6/15/37 | 6,000,000 | 2,974,808 |
| Series A | | |
| (zero coupon), due 6/15/37 | 3,000,000 | 1,448,457 |
| Series A, Insured: NATL-RE | | |
| (zero coupon), due 12/15/37 | 29,910,000 | 14,329,648 |
| Series A, Insured: NATL-RE | | |
| (zero coupon), due 6/15/38 | 14,365,000 | 6,640,744 |
| Series A | | |
| (zero coupon), due 12/15/39 | 3,500,000 | 1,435,206 |
| Series A, Insured: AGM-CR NATL-RE | | |
| (zero coupon), due 12/15/40 | 27,700,000 | 11,212,902 |
| Series B-1, Insured: AGM | | |
| (zero coupon), due 6/15/44 | 13,660,000 | 4,426,852 |
| Series B-1, Insured: AGM | | |
| (zero coupon), due 6/15/47 | 6,270,000 | 1,702,535 |
| Series B | | |
| (zero coupon), due 12/15/50 | 37,865,000 | 7,835,113 |
| Series B | | |
| (zero coupon), due 12/15/51 | 57,100,000 | 11,106,938 |
| Series A, Insured: AGM | | |
| (zero coupon), due 12/15/52 | 6,180,000 | 1,216,804 |
| Series B, Insured: BAM | | |
| (zero coupon), due 12/15/54 | 56,510,000 | 9,915,160 |
| Series A, Insured: BAM | | |
| (zero coupon), due 12/15/56 | 51,050,000 | 7,957,873 |
| Series A, Insured: AGM-CR | | |
| (zero coupon), due 12/15/56 | 22,250,000 | 3,468,417 |
| Series B, Insured: AGM | | |
| (zero coupon), due 12/15/56 | 10,000,000 | 1,558,839 |
| Series A, Insured: BAM | | |
| 4.00%, due 12/15/42 | 2,500,000 | 2,142,296 |
| Series A | | |
| 4.00%, due 6/15/50 | 23,900,000 | 18,605,000 |
| Series A | | |
| 4.00%, due 6/15/52 | 27,500,000 | 21,183,877 |
| Series B | | |
| 5.00%, due 6/15/42 | 1,430,000 | 1,382,414 |
| Series A | | |
| 5.00%, due 6/15/50 | 1,000,000 | 929,902 |
| | Principal
Amount | Value |
| |
| Illinois (continued) |
| Metropolitan Pier & Exposition Authority, Mccormick Place Expansion Project, Revenue Bonds | | |
| Series A | | |
| (zero coupon), due 12/15/38 | $ 3,750,000 | $ 1,639,448 |
| Metropolitan Pier & Exposition Authority, McCormick Place Expansion Project, Capital Appreciation, Revenue Bonds | | |
| Series B-1, Insured: AGM | | |
| (zero coupon), due 6/15/43 | 32,130,000 | 11,077,264 |
| Northern Illinois University, Revenue Bonds | | |
| Insured: BAM | | |
| 4.00%, due 10/1/40 | 1,245,000 | 1,059,796 |
| Insured: BAM | | |
| 4.00%, due 10/1/41 | 1,660,000 | 1,391,687 |
| Richland Clark Etc Counties Community College District No. 529, Illinois Eastern | | |
| 5.00%, due 12/1/33 | 6,035,000 | 5,764,739 |
| Sangamon County Water Reclamation District, Alternative Revenue Source, Unlimited General Obligation | | |
| Series A, Insured: BAM | | |
| 4.00%, due 1/1/49 | 13,600,000 | 11,128,503 |
| State of Illinois, Unlimited General Obligation | | |
| Series A | | |
| 4.00%, due 3/1/40 | 1,360,000 | 1,159,163 |
| Series C | | |
| 4.00%, due 10/1/40 | 1,500,000 | 1,267,944 |
| Insured: BAM | | |
| 4.00%, due 6/1/41 | 27,720,000 | 23,900,469 |
| Series C | | |
| 4.00%, due 10/1/41 | 7,550,000 | 6,334,786 |
| Series C | | |
| 4.00%, due 10/1/42 | 8,650,000 | 7,199,239 |
| Series C | | |
| 4.25%, due 10/1/45 | 23,200,000 | 19,258,039 |
| Series A | | |
| 4.50%, due 12/1/41 | 6,425,000 | 5,712,910 |
| Series A | | |
| 5.00%, due 12/1/27 | 2,315,000 | 2,373,619 |
| Series B | | |
| 5.00%, due 12/1/27 | 8,915,000 | 9,140,738 |
The notes to the financial statements are an integral part of, and should be read in conjunction with, the financial statements.
29
Portfolio of Investments October 31, 2023†^ (continued)
| | Principal
Amount | Value |
| Long-Term Municipal Bonds (continued) |
| Illinois (continued) |
| State of Illinois, Unlimited General Obligation (continued) | | |
| 5.00%, due 2/1/28 | $ 2,700,000 | $ 2,752,642 |
| Series C | | |
| 5.00%, due 11/1/29 | 14,135,000 | 14,426,407 |
| Series A | | |
| 5.00%, due 12/1/31 | 1,485,000 | 1,508,907 |
| Series A | | |
| 5.00%, due 12/1/39 | 2,400,000 | 2,279,695 |
| Series A | | |
| 5.00%, due 5/1/40 | 2,000,000 | 1,892,545 |
| 5.75%, due 5/1/45 | 16,820,000 | 17,164,369 |
| State of Illinois, Rebuild Illinois Program, Unlimited General Obligation | | |
| Series C | | |
| 4.00%, due 11/1/41 | 19,300,000 | 16,176,426 |
| Upper Illinois River Valley Development Authority, Morris Hospital Obligated Group, Revenue Bonds | | |
| 5.00%, due 12/1/43 | 1,600,000 | 1,441,716 |
| 5.00%, due 12/1/48 | 13,055,000 | 11,390,670 |
| Village of Bridgeview, Unlimited General Obligation | | |
| Series A | | |
| 5.125%, due 12/1/44 | 100,000 | 81,090 |
| Series A | | |
| 5.50%, due 12/1/43 | 1,545,000 | 1,327,857 |
| Series A | | |
| 5.50%, due 12/1/43 | 1,260,000 | 1,082,913 |
| Series A | | |
| 5.625%, due 12/1/41 | 3,940,000 | 3,500,717 |
| Series A | | |
| 5.75%, due 12/1/35 | 2,705,000 | 2,607,819 |
| Village of Oak Lawn, Corporate Purpose, Unlimited General Obligation | | |
| Insured: NATL-RE | | |
| 4.40%, due 12/1/26 | 400,000 | 376,321 |
| Insured: NATL-RE | | |
| 4.45%, due 12/1/28 | 430,000 | 392,598 |
| Insured: NATL-RE | | |
| 4.50%, due 12/1/30 | 475,000 | 452,036 |
| Insured: NATL-RE | | |
| 4.50%, due 12/1/32 | 520,000 | 453,788 |
| | Principal
Amount | Value |
| |
| Illinois (continued) |
| Village of Oak Lawn, Corporate Purpose, Unlimited General Obligation (continued) | | |
| Insured: NATL-RE | | |
| 4.50%, due 12/1/34 | $ 575,000 | $ 550,669 |
| Village of Riverdale, Unlimited General Obligation | | |
| 8.00%, due 10/1/36 | 1,610,000 | 1,612,511 |
| Village of Romeoville, Lewis University, Revenue Bonds | | |
| Series B | | |
| 4.125%, due 10/1/46 | 3,600,000 | 2,727,923 |
| Series B | | |
| 5.00%, due 10/1/36 | 1,000,000 | 958,761 |
| Series B | | |
| 5.00%, due 10/1/39 | 1,275,000 | 1,177,669 |
| | | 775,799,771 |
| Indiana 0.8% |
| City of Mount Vernon, Southern Indiana Gas & Electric Co., Revenue Bonds | | |
| 4.25%, due 9/1/55 (a)(b) | 7,750,000 | 7,543,526 |
| City of Valparaiso, Pratt Paper LLC Project, Revenue Bonds | | |
| 7.00%, due 1/1/44 (a) | 5,200,000 | 5,210,190 |
| County of Warrick, Southern Indiana Gas & Electric Co., Revenue Bonds | | |
| 4.25%, due 9/1/55 (a)(b) | 7,350,000 | 7,154,183 |
| Gary Chicago International Airport Authority, Revenue Bonds (a) | | |
| 5.00%, due 2/1/29 | 1,170,000 | 1,170,151 |
| 5.25%, due 2/1/34 | 750,000 | 750,686 |
| Indiana Finance Authority, Marian University, Inc., Revenue Bonds | | |
| Series A | | |
| 4.00%, due 9/15/44 | 1,090,000 | 829,196 |
| Indiana Finance Authority, University of Indianapolis Education Facilities Project, Revenue Bonds | | |
| 5.00%, due 10/1/43 | 2,000,000 | 1,814,126 |
| Indiana Finance Authority, BHI Senior Living, Inc., Revenue Bonds | | |
| Series A | | |
| 5.00%, due 11/15/48 | 4,650,000 | 3,939,817 |
| Series A | | |
| 5.00%, due 11/15/53 | 4,100,000 | 3,399,444 |
The notes to the financial statements are an integral part of, and should be read in conjunction with, the financial statements.
| 30 | MainStay MacKay High Yield Municipal Bond Fund |
| | Principal
Amount | Value |
| Long-Term Municipal Bonds (continued) |
| Indiana (continued) |
| Indiana Finance Authority, United States Steel Corp., Revenue Bonds | | |
| Series A | | |
| 6.75%, due 5/1/39 (a) | $ 1,250,000 | $ 1,314,574 |
| Terre Haute Sanitary District, Revenue Bonds | | |
| 5.25%, due 9/28/28 | 20,250,000 | 19,887,632 |
| Town of Upland, Taylor University Project, Revenue Bonds | | |
| 4.00%, due 9/1/46 | 3,000,000 | 2,312,535 |
| | | 55,326,060 |
| Iowa 1.1% |
| City of Coralville, Annual Appropriation, Revenue Bonds | | |
| Series B | | |
| 4.25%, due 5/1/37 | 890,000 | 738,540 |
| City of Coralville, Annual Appropriation, Tax Allocation | | |
| Series C | | |
| 4.50%, due 5/1/47 | 2,930,000 | 2,396,331 |
| City of Coralville, Revenue Bonds | | |
| Series C | | |
| 5.00%, due 5/1/42 | 6,900,000 | 5,946,813 |
| Iowa Finance Authority, Iowa Fertilizer Co. Project, Revenue Bonds | | |
| 5.00%, due 12/1/50 | 15,235,000 | 13,522,798 |
| 5.00%, due 12/1/50 (b) | 7,015,000 | 6,387,169 |
| Iowa Higher Education Loan Authority, Des Moines University Project, Revenue Bonds | | |
| 4.00%, due 10/1/45 | 13,850,000 | 10,945,168 |
| Iowa Tobacco Settlement Authority, Capital Appreciation, Revenue Bonds | | |
| Series B-2, Class 2 | | |
| (zero coupon), due 6/1/65 | 230,200,000 | 21,361,363 |
| Iowa Tobacco Settlement Authority, Revenue Bonds | | |
| Series A-2, Class 1 | | |
| 4.00%, due 6/1/49 | 8,905,000 | 7,293,452 |
| Series B-1, Class 2 | | |
| 4.00%, due 6/1/49 | 3,820,000 | 3,408,628 |
| | Principal
Amount | Value |
| |
| Iowa (continued) |
| State of Iowa Board of Regents, University of Iowa Hospitals & Clinics, Revenue Bonds | | |
| Series B | | |
| 3.00%, due 9/1/61 | $ 8,700,000 | $ 5,068,885 |
| | | 77,069,147 |
| Kansas 0.3% |
| City of Manhattan, Meadowlark Hills Retirement Community, Revenue Bonds | | |
| Series A | | |
| 4.00%, due 6/1/46 | 1,000,000 | 670,509 |
| Wyandotte County-Kansas City Unified Government, Vacation Village Project Area 4 - Major Multi-Sport Athletic Complex Project, Revenue Bonds | | |
| (zero coupon), due 9/1/34 (c) | 51,985,000 | 18,810,996 |
| | | 19,481,505 |
| Kentucky 0.9% |
| City of Campbellsville, Campbellsville University Project, Revenue Bonds | | |
| 5.00%, due 3/1/39 | 4,430,000 | 3,896,472 |
| City of Columbia, Lindsey Wilson College Project, Revenue Bonds | | |
| 5.00%, due 12/1/33 | 3,555,000 | 3,338,878 |
| City of Henderson, Pratt Paper LLC Project, Revenue Bonds (a)(c) | | |
| Series A | | |
| 4.45%, due 1/1/42 | 7,950,000 | 7,040,050 |
| Series B | | |
| 4.45%, due 1/1/42 | 8,950,000 | 7,925,591 |
| Series A | | |
| 4.70%, due 1/1/52 | 12,155,000 | 10,520,577 |
| Series B | | |
| 4.70%, due 1/1/52 | 4,350,000 | 3,765,077 |
| Kentucky Economic Development Finance Authority, Owensboro Health, Revenue Bonds | | |
| Series A | | |
| 5.00%, due 6/1/45 | 13,500,000 | 12,186,093 |
The notes to the financial statements are an integral part of, and should be read in conjunction with, the financial statements.
31
Portfolio of Investments October 31, 2023†^ (continued)
| | Principal
Amount | Value |
| Long-Term Municipal Bonds (continued) |
| Kentucky (continued) |
| Kentucky Municipal Power Agency, Prairie State Project, Revenue Bonds | | |
| Series A | | |
| 4.00%, due 9/1/45 | $ 20,695,000 | $ 16,114,435 |
| | | 64,787,173 |
| Louisiana 0.1% |
| Calcasieu Parish Memorial Hospital Service District, Lake Charles Memorial Hospital Project, Revenue Bonds | | |
| 5.00%, due 12/1/39 | 1,475,000 | 1,183,441 |
| Louisiana Local Government Environmental Facilities & Community Development Authority, Peoples of Bastrop LLC Project, Revenue Bonds | | |
| 5.625%, due 6/15/51 (c) | 2,500,000 | 1,878,483 |
| Louisiana Public Facilities Authority, Ochsner Clinic Foundation Obligated Group, Revenue Bonds | | |
| 5.00%, due 5/15/47 | 4,700,000 | 4,436,206 |
| | | 7,498,130 |
| Maine 0.0% ‡ |
| City of Portland, General Airport, Green Bond, Revenue Bonds | | |
| 4.00%, due 1/1/40 | 1,250,000 | 1,083,184 |
| Maryland 1.1% |
| County of Baltimore, Oak Crest Village, Inc. Facility, Revenue Bonds | | |
| 4.00%, due 1/1/45 | 4,000,000 | 3,163,360 |
| County of Frederick, Oakdale Lake Linganore Project, Tax Allocation | | |
| 3.75%, due 7/1/39 | 1,410,000 | 1,122,119 |
| County of Frederick, Technology Park Project TIF Development District, Tax Allocation | | |
| Series B | | |
| 4.625%, due 7/1/43 (c) | 10,830,000 | 9,509,686 |
| | Principal
Amount | Value |
| |
| Maryland (continued) |
| County of Frederick, Mount St Mary's University, Inc., Revenue Bonds (c) | | |
| Series A | | |
| 5.00%, due 9/1/37 | $ 3,000,000 | $ 2,717,842 |
| Series A | | |
| 5.00%, due 9/1/45 | 500,000 | 419,776 |
| Maryland Economic Development Corp., Port Convington Project, Tax Allocation | | |
| 4.00%, due 9/1/50 | 6,750,000 | 4,981,716 |
| Maryland Economic Development Corp., Purple Line Light Project, Green Bond, Revenue Bonds | | |
| Series B | | |
| 5.25%, due 6/30/47 (a) | 34,650,000 | 32,480,311 |
| Maryland Health & Higher Educational Facilities Authority, Stevenson University, Inc., Revenue Bonds | | |
| Series A | | |
| 4.00%, due 6/1/46 | 750,000 | 607,057 |
| Maryland Health & Higher Educational Facilities Authority, Adventist Healthcare, Revenue Bonds | | |
| Series B | | |
| 4.00%, due 1/1/51 | 20,110,000 | 14,571,887 |
| Maryland Health & Higher Educational Facilities Authority, Stevenson University, Inc. Project, Revenue Bonds | | |
| Series A | | |
| 4.00%, due 6/1/55 | 900,000 | 684,370 |
| Maryland Health & Higher Educational Facilities Authority, Broadmead Issue, Revenue Bonds | | |
| Series A | | |
| 5.00%, due 7/1/38 | 1,000,000 | 954,887 |
| Series A | | |
| 5.00%, due 7/1/48 | 3,000,000 | 2,672,583 |
| Maryland Health & Higher Educational Facilities Authority, Meritus Medical Center Issue, Revenue Bonds | | |
| 5.00%, due 7/1/45 | 4,000,000 | 3,726,444 |
The notes to the financial statements are an integral part of, and should be read in conjunction with, the financial statements.
| 32 | MainStay MacKay High Yield Municipal Bond Fund |
| | Principal
Amount | Value |
| Long-Term Municipal Bonds (continued) |
| Maryland (continued) |
| Maryland Health & Higher Educational Facilities Authority, Green Street Academy Inc., Revenue Bonds (c) | | |
| Series A | | |
| 5.125%, due 7/1/37 | $ 1,260,000 | $ 1,149,289 |
| Series A | | |
| 5.375%, due 7/1/52 | 1,530,000 | 1,303,878 |
| Maryland Health & Higher Educational Facilities Authority, Edenwald Issue, Revenue Bonds | | |
| 5.25%, due 1/1/37 | 1,000,000 | 964,022 |
| | | 81,029,227 |
| Massachusetts 1.0% |
| Massachusetts Development Finance Agency, Wellforce Obligated Group, Revenue Bonds | | |
| Series C, Insured: AGM | | |
| 4.00%, due 10/1/45 | 2,150,000 | 1,796,633 |
| Massachusetts Development Finance Agency, Equitable School Revolving Fund LLC, Revenue Bonds | | |
| Series C | | |
| 4.00%, due 11/1/46 | 1,500,000 | 1,194,834 |
| Series C | | |
| 4.00%, due 11/1/51 | 20,000 | 15,391 |
| Massachusetts Development Finance Agency, Linden Ponds, Inc., Revenue Bonds (c) | | |
| 5.00%, due 11/15/33 | 3,000,000 | 3,002,241 |
| 5.125%, due 11/15/46 | 5,600,000 | 5,263,898 |
| Massachusetts Development Finance Agency, Milford Regional Medical Center, Revenue Bonds (c) | | |
| Series G | | |
| 5.00%, due 7/15/35 | 270,000 | 237,592 |
| Series G | | |
| 5.00%, due 7/15/36 | 235,000 | 204,672 |
| Series G | | |
| 5.00%, due 7/15/37 | 245,000 | 211,177 |
| Series G | | |
| 5.00%, due 7/15/46 | 1,100,000 | 882,065 |
| | Principal
Amount | Value |
| |
| Massachusetts (continued) |
| Massachusetts Development Finance Agency, Provident Commonwealth Education Resources II, Inc., Revenue Bonds | | |
| 5.00%, due 10/1/38 | $ 1,215,000 | $ 1,086,795 |
| Massachusetts Development Finance Agency, Western New England University, Revenue Bonds | | |
| 5.00%, due 9/1/40 | 1,325,000 | 1,191,796 |
| 5.00%, due 9/1/45 | 1,175,000 | 1,010,504 |
| Massachusetts Development Finance Agency, Dexter Southfield, Revenue Bonds | | |
| 5.00%, due 5/1/41 | 2,700,000 | 2,639,335 |
| Massachusetts Development Finance Agency, Ascentria Care Alliance Project, Revenue Bonds | | |
| 5.00%, due 7/1/41 (c) | 3,875,000 | 3,089,208 |
| Massachusetts Development Finance Agency, UMass Dartmouth Student Housing Project, Revenue Bonds | | |
| 5.00%, due 10/1/43 | 2,000,000 | 1,718,264 |
| 5.00%, due 10/1/48 | 7,650,000 | 6,407,613 |
| 5.00%, due 10/1/54 | 15,400,000 | 12,563,727 |
| Massachusetts Development Finance Agency, UMass Memorial Health Care Obligated Group, Revenue Bonds | | |
| Series L | | |
| 5.00%, due 7/1/44 | 8,105,000 | 7,550,904 |
| Series I | | |
| 5.00%, due 7/1/46 | 2,000,000 | 1,853,771 |
| Massachusetts Development Finance Agency, UMass Boston Student Housing Project, Revenue Bonds | | |
| 5.00%, due 10/1/48 | 10,040,000 | 8,749,787 |
| Massachusetts Educational Financing Authority, Educational Loan, Revenue Bonds (a) | | |
| Series B | | |
| 2.00%, due 7/1/37 | 3,600,000 | 2,857,444 |
| Series C | | |
| 3.00%, due 7/1/51 | 7,305,000 | 4,271,304 |
The notes to the financial statements are an integral part of, and should be read in conjunction with, the financial statements.
33
Portfolio of Investments October 31, 2023†^ (continued)
| | Principal
Amount | Value |
| Long-Term Municipal Bonds (continued) |
| Massachusetts (continued) |
| Massachusetts Educational Financing Authority, Revenue Bonds, Senior Lien | | |
| Series B | | |
| 3.00%, due 7/1/35 (a) | $ 490,000 | $ 488,489 |
| Town of Stoneham, Limited General Obligation | | |
| 2.25%, due 1/15/40 | 4,030,000 | 2,649,285 |
| | | 70,936,729 |
| Michigan 2.8% |
| Calhoun County Hospital Finance Authority, Oaklawn Hospital, Revenue Bonds | | |
| 5.00%, due 2/15/41 | 3,260,000 | 2,849,245 |
| 5.00%, due 2/15/47 | 3,000,000 | 2,486,522 |
| Chandler Park Academy, Revenue Bonds | | |
| 5.125%, due 11/1/30 | 1,050,000 | 998,113 |
| 5.125%, due 11/1/35 | 605,000 | 559,527 |
| City of Detroit, Unlimited General Obligation | | |
| Insured: AMBAC | | |
| 4.60%, due 4/1/24 | 20,150 | 19,936 |
| 5.00%, due 4/1/27 | 850,000 | 853,584 |
| 5.00%, due 4/1/31 | 1,000,000 | 1,001,393 |
| 5.00%, due 4/1/33 | 1,200,000 | 1,201,155 |
| 5.00%, due 4/1/35 | 1,000,000 | 994,608 |
| 5.00%, due 4/1/37 | 1,100,000 | 1,066,599 |
| 5.00%, due 4/1/38 | 850,000 | 810,643 |
| Insured: AMBAC | | |
| 5.25%, due 4/1/24 | 45,725 | 45,359 |
| 5.50%, due 4/1/45 | 1,100,000 | 1,062,947 |
| 5.50%, due 4/1/50 | 2,070,000 | 1,977,228 |
| City of Detroit, Water Supply System, Revenue Bonds, Second Lien | | |
| Series B, Insured: NATL-RE | | |
| 5.00%, due 7/1/34 | 10,000 | 10,010 |
| Detroit Service Learning Academy, Revenue Bonds | | |
| 4.00%, due 7/1/31 | 1,745,000 | 1,570,207 |
| 4.00%, due 7/1/41 | 3,600,000 | 2,693,420 |
| Great Lakes Water Authority, Water Supply System, Revenue Bonds, Second Lien | | |
| Series B | | |
| 5.00%, due 7/1/46 | 3,000,000 | 2,920,614 |
| | Principal
Amount | Value |
| |
| Michigan (continued) |
| Kentwood Economic Development Corp., Holland Home Obligated Group, Revenue Bonds | | |
| 5.00%, due 11/15/41 | $ 2,085,000 | $ 1,759,493 |
| Michigan Finance Authority, Tobacco Settlement Asset-Backed, Capital Appreciation, Revenue Bonds, Senior Lien | | |
| Series B | | |
| (zero coupon), due 6/1/45 | 48,300,000 | 10,633,250 |
| Michigan Finance Authority, Tobacco Settlement Asset-Backed, Revenue Bonds, Senior Lien | | |
| Series B-2, Class 2 | | |
| (zero coupon), due 6/1/65 | 287,185,000 | 21,344,853 |
| Michigan Finance Authority, Calvin University Obligated Group, Revenue Bonds | | |
| 4.00%, due 9/1/46 | 4,470,000 | 3,425,130 |
| Michigan Finance Authority, Wayne County Criminal Justice Center Project, Revenue Bonds, Senior Lien | | |
| 4.00%, due 11/1/48 | 6,650,000 | 5,465,191 |
| Michigan Finance Authority, Henry Ford Health System, Revenue Bonds | | |
| Series A | | |
| 4.00%, due 11/15/50 | 4,945,000 | 3,875,363 |
| Michigan Finance Authority, Great Lakes Water Authority Sewage Disposal System, Revenue Bonds | | |
| Series C | | |
| 5.00%, due 7/1/34 | 1,000,000 | 1,007,363 |
| Series C | | |
| 5.00%, due 7/1/35 | 2,000,000 | 2,016,640 |
| Michigan Finance Authority, Local Government Loan Program, Revenue Bonds | | |
| Series D-4 | | |
| 5.00%, due 7/1/34 | 1,000,000 | 991,724 |
| Michigan Finance Authority, College for Creative Studies, Revenue Bonds | | |
| 5.00%, due 12/1/36 | 1,000,000 | 958,042 |
| 5.00%, due 12/1/40 | 1,700,000 | 1,546,347 |
| 5.00%, due 12/1/45 | 4,400,000 | 3,852,734 |
The notes to the financial statements are an integral part of, and should be read in conjunction with, the financial statements.
| 34 | MainStay MacKay High Yield Municipal Bond Fund |
| | Principal
Amount | Value |
| Long-Term Municipal Bonds (continued) |
| Michigan (continued) |
| Michigan Finance Authority, Lawrence Technological University, Revenue Bonds | | |
| 5.00%, due 2/1/37 | $ 1,550,000 | $ 1,411,467 |
| 5.25%, due 2/1/32 | 3,350,000 | 3,260,534 |
| Michigan Finance Authority, Local Government Loan Program, Public Lightning Local Project, Revenue Bonds | | |
| Series B | | |
| 5.00%, due 7/1/44 | 4,000,000 | 3,551,167 |
| Michigan Finance Authority, Landmark Academy, Revenue Bonds | | |
| 5.00%, due 6/1/45 | 2,920,000 | 2,346,305 |
| Michigan Finance Authority, Presbyterian Villages of Michigan Obligated Group, Revenue Bonds | | |
| 5.50%, due 11/15/45 | 1,025,000 | 828,101 |
| Michigan Finance Authority, Universal Learning Academy, Revenue Bonds | | |
| 5.75%, due 11/1/40 | 2,630,000 | 2,378,737 |
| Michigan Finance Authority, Public School Academy-Voyageur, Revenue Bonds | | |
| 5.90%, due 7/15/46 (c) | 1,955,000 | 1,430,143 |
| Michigan Municipal Bond Authority, Local Government Loan Program, Revenue Bonds | | |
| Series A, Insured: AMBAC | | |
| 4.50%, due 5/1/31 | 305,000 | 280,993 |
| Michigan Strategic Fund, Holland Home Obligated Group, Revenue Bonds | | |
| 5.00%, due 11/15/42 | 1,765,000 | 1,473,109 |
| 5.00%, due 11/15/43 | 2,220,000 | 1,836,861 |
| Michigan Strategic Fund, State of Michigan Department of Transportation, Revenue Bonds | | |
| 5.00%, due 6/30/48 (a) | 18,680,000 | 17,004,200 |
| Michigan Tobacco Settlement Finance Authority, Tobacco Settlement Asset-Backed, Capital Appreciation, Revenue Bonds | | |
| Series B | | |
| (zero coupon), due 6/1/46 | 281,605,000 | 29,667,481 |
| | Principal
Amount | Value |
| |
| Michigan (continued) |
Michigan Tobacco Settlement Finance Authority, Tobacco Settlement Asset-Backed, Capital Appreciation, Revenue Bonds
(continued) | | |
| Series B | | |
| (zero coupon), due 6/1/52 | $ 23,170,000 | $ 2,267,266 |
| Series C | | |
| (zero coupon), due 6/1/58 | 407,380,000 | 18,401,843 |
| Richfield Public School Academy, Revenue Bonds | | |
| 4.00%, due 9/1/30 | 750,000 | 668,471 |
| State of Michigan, Trunk Line, Revenue Bonds | | |
| 5.50%, due 11/15/49 | 31,180,000 | 33,209,893 |
| Summit Academy North, Michigan Public School Academy, Revenue Bonds | | |
| 4.00%, due 11/1/41 | 2,875,000 | 2,181,879 |
| | | 202,195,690 |
| Minnesota 1.1% |
| City of Crookston, Riverview Healthcare Project, Revenue Bonds | | |
| 5.00%, due 5/1/51 | 4,000,000 | 2,715,932 |
| City of Forest Lake, Lakes International Language Academy Project, Revenue Bonds | | |
| Series A | | |
| 5.375%, due 8/1/50 | 1,250,000 | 1,065,626 |
| City of Ham Lake, Parnassus Preparatory School Project, Revenue Bonds | | |
| Series A | | |
| 5.00%, due 11/1/47 | 3,250,000 | 2,706,232 |
| City of Independence, Global Academy Project, Revenue Bonds | | |
| Series A | | |
| 4.00%, due 7/1/51 | 1,400,000 | 942,524 |
| Series A | | |
| 4.00%, due 7/1/56 | 1,080,000 | 703,421 |
| City of Minneapolis, Twin Cities International School Project, Revenue Bonds | | |
| Series A | | |
| 5.00%, due 12/1/47 (c) | 3,785,000 | 3,195,638 |
The notes to the financial statements are an integral part of, and should be read in conjunction with, the financial statements.
35
Portfolio of Investments October 31, 2023†^ (continued)
| | Principal
Amount | Value |
| Long-Term Municipal Bonds (continued) |
| Minnesota (continued) |
| City of Rochester, Samaritan Bethany, Inc. Project, Revenue Bonds | | |
| Series A | | |
| 5.00%, due 8/1/48 | $ 925,000 | $ 672,929 |
| Duluth Economic Development Authority, Essentia Health Obligated Group, Revenue Bonds | | |
| Series A | | |
| 5.00%, due 2/15/53 | 15,350,000 | 13,821,158 |
| Series A | | |
| 5.25%, due 2/15/53 | 22,465,000 | 21,641,027 |
| Series A | | |
| 5.25%, due 2/15/58 | 16,165,000 | 15,491,749 |
| Duluth Economic Development Authority, St. Luke's Hospital of Duluth, Revenue Bonds | | |
| Series B | | |
| 5.25%, due 6/15/42 | 4,000,000 | 3,667,900 |
| Series B | | |
| 5.25%, due 6/15/47 | 3,000,000 | 2,695,995 |
| Series B | | |
| 5.25%, due 6/15/52 | 4,750,000 | 4,158,146 |
| Duluth Economic Development Authority, Cambia Hills of Bethel Project, Revenue Bonds | | |
| 5.625%, due 12/1/55 (d)(e)(f) | 3,871,624 | 2,168,110 |
| | | 75,646,387 |
| Mississippi 0.0% ‡ |
| Mississippi Business Finance Corp., System Energy Resources, Inc. Project, Revenue Bonds | | |
| 2.375%, due 6/1/44 | 6,700,000 | 3,557,762 |
| Missouri 0.7% |
| Branson Industrial Development Authority, Tax Increment, Branson Landing-Retail Project, Tax Allocation | | |
| 5.50%, due 6/1/29 | 2,690,000 | 2,455,597 |
| Cape Girardeau County Industrial Development Authority, Southeast Health, Revenue Bonds | | |
| 4.00%, due 3/1/41 | 530,000 | 430,209 |
| 4.00%, due 3/1/46 | 1,695,000 | 1,318,896 |
| | Principal
Amount | Value |
| |
| Missouri (continued) |
| City of Lees Summit, Department of Airports, Summit Fair Project, Tax Allocation | | |
| 4.875%, due 11/1/37 (c) | $ 3,045,000 | $ 2,572,809 |
| Health & Educational Facilities Authority of the State of Missouri, Maryville University of St. Louis, Revenue Bonds | | |
| Series A | | |
| 4.00%, due 6/15/41 | 3,300,000 | 2,650,596 |
| Series A | | |
| 5.00%, due 6/15/45 | 3,270,000 | 2,907,144 |
| Health & Educational Facilities Authority of the State of Missouri, Lutheran Senior Services Project, Revenue Bonds | | |
| 4.00%, due 2/1/42 | 3,750,000 | 2,945,875 |
| Health & Educational Facilities Authority of the State of Missouri, AT Still University of Health Sciences, Revenue Bonds | | |
| Series A | | |
| 4.00%, due 10/1/43 | 1,125,000 | 931,999 |
| Health & Educational Facilities Authority of the State of Missouri, Lake Regional Health System, Revenue Bonds | | |
| 4.00%, due 2/15/51 | 2,125,000 | 1,553,374 |
| Health & Educational Facilities Authority of the State of Missouri, Mercy Health, Revenue Bonds | | |
| 4.00%, due 6/1/53 | 6,915,000 | 5,478,568 |
| 5.00%, due 12/1/52 | 4,400,000 | 4,249,168 |
| Health & Educational Facilities Authority of the State of Missouri, Capital Region Medical Center, Revenue Bonds | | |
| 5.00%, due 11/1/40 | 1,850,000 | 1,781,685 |
| Kansas City Industrial Development Authority, Airport, Revenue Bonds | | |
| Series A, Insured: AGM | | |
| 4.00%, due 3/1/57 (a) | 2,400,000 | 1,840,228 |
| Kansas City Land Clearance Redevelopment Authority, Convention Center Hotel Project, Tax Allocation | | |
| Series B | | |
| 5.00%, due 2/1/40 (c) | 4,700,000 | 3,537,847 |
The notes to the financial statements are an integral part of, and should be read in conjunction with, the financial statements.
| 36 | MainStay MacKay High Yield Municipal Bond Fund |
| | Principal
Amount | Value |
| Long-Term Municipal Bonds (continued) |
| Missouri (continued) |
| Lees Summit Industrial Development Authority, Fair Community Improvement District, Special Assessment | | |
| 5.00%, due 5/1/35 | $ 785,000 | $ 676,915 |
| 6.00%, due 5/1/42 | 2,800,000 | 2,371,106 |
| Maryland Heights Industrial Development Authority, St. Louis Community Ice Center Project, Revenue Bonds | | |
| Series A | | |
| 5.00%, due 3/15/49 | 7,500,000 | 5,789,636 |
| Springfield School District No. R-12, Unlimited General Obligation | | |
| 2.25%, due 3/1/40 | 2,000,000 | 1,281,447 |
| St. Louis County Industrial Development Authority, Nazareth Living Center Project, Revenue Bonds | | |
| Series A | | |
| 5.125%, due 8/15/45 | 1,900,000 | 1,478,813 |
| St. Louis Land Clearance for Redevelopment Authority, Scottrade Center Project, Revenue Bonds | | |
| Series A | | |
| 5.00%, due 4/1/48 | 2,000,000 | 1,855,378 |
| | | 48,107,290 |
| Montana 0.3% |
| City of Forsyth, NorthWestern Corp., Revenue Bonds | | |
| 3.875%, due 7/1/28 | 9,750,000 | 9,321,516 |
| County of Gallatin, Bozeman Fiber Project, Revenue Bonds (c) | | |
| Series A | | |
| 4.00%, due 10/15/41 | 500,000 | 362,008 |
| Series A | | |
| 4.00%, due 10/15/46 | 2,500,000 | 1,678,984 |
| Series A | | |
| 4.00%, due 10/15/51 | 3,750,000 | 2,404,469 |
| Montana Facility Finance Authority, Kalispell Regional Medical Center, Revenue Bonds | | |
| Series B | | |
| 5.00%, due 7/1/48 | 5,465,000 | 4,723,922 |
| | | 18,490,899 |
| | Principal
Amount | Value |
| |
| Nebraska 0.0% ‡ |
| County of Douglas, Creighton University, Revenue Bonds | | |
| Series A | | |
| 3.00%, due 7/1/51 | $ 2,500,000 | $ 1,535,985 |
| Nevada 0.3% |
| City of Reno, Sales Tax, Transportation Rail Access Corridor Project, Revenue Bonds | | |
| Series C | | |
| (zero coupon), due 7/1/58 (c) | 14,000,000 | 1,426,277 |
| City of Reno, Sales Tax, Transportation Rail Access Corridor Project, Revenue Bonds, First Lien | | |
| Series A | | |
| 4.00%, due 6/1/43 | 2,500,000 | 2,000,931 |
| City of Reno, Sales Tax, Revenue Bonds | | |
| Series D | | |
| (zero coupon), due 7/1/58 (c) | 9,000,000 | 888,221 |
| Las Vegas Redevelopment Agency, Tax Allocation | | |
| 5.00%, due 6/15/45 | 2,750,000 | 2,578,617 |
| State of Nevada Department of Business & Industry, Somerset Academy of Las Vegas, Revenue Bonds | | |
| Series A | | |
| 5.00%, due 12/15/48 (c) | 4,215,000 | 3,450,482 |
| Tahoe-Douglas Visitors Authority, Revenue Bonds | | |
| 5.00%, due 7/1/30 | 2,755,000 | 2,716,713 |
| 5.00%, due 7/1/34 | 2,000,000 | 1,951,339 |
| 5.00%, due 7/1/45 | 5,050,000 | 4,427,532 |
| | | 19,440,112 |
| New Hampshire 0.2% |
| Manchester Housing and Redevelopment Authority, Inc., Revenue Bonds | | |
| Series B, Insured: BAM | | |
| (zero coupon), due 1/1/26 | 1,995,000 | 1,768,817 |
| Series B, Insured: BAM | | |
| (zero coupon), due 1/1/27 | 2,380,000 | 1,989,894 |
The notes to the financial statements are an integral part of, and should be read in conjunction with, the financial statements.
37
Portfolio of Investments October 31, 2023†^ (continued)
| | Principal
Amount | Value |
| Long-Term Municipal Bonds (continued) |
| New Hampshire (continued) |
| New Hampshire Business Finance Authority, Springpoint Senior Living Project, Revenue Bonds | | |
| 4.00%, due 1/1/41 | $ 3,175,000 | $ 2,415,381 |
| 4.00%, due 1/1/51 | 4,600,000 | 3,141,737 |
| New Hampshire Business Finance Authority, Ascentria Care Alliance Project, Revenue Bonds (c) | | |
| 5.00%, due 7/1/51 | 2,000,000 | 1,427,231 |
| 5.00%, due 7/1/56 | 910,000 | 632,315 |
| New Hampshire Business Finance Authority, The Vista Project, Revenue Bonds | | |
| Series A | | |
| 5.75%, due 7/1/54 (c) | 1,500,000 | 1,227,561 |
| New Hampshire Health and Education Facilities Authority Act, Kendal at Hanover, Revenue Bonds | | |
| 5.00%, due 10/1/46 | 1,800,000 | 1,547,323 |
| | | 14,150,259 |
| New Jersey 4.7% |
| Camden County Improvement Authority (The), Camden School Prep Project, Revenue Bonds | | |
| 5.00%, due 7/15/52 (c) | 2,000,000 | 1,713,186 |
| Essex County Improvement Authority, North Star Academy Charter School of Newark, Inc., Revenue Bonds | | |
| 4.00%, due 7/15/50 (c) | 2,450,000 | 1,842,708 |
| 4.00%, due 6/15/51 | 1,100,000 | 855,564 |
| 4.00%, due 7/15/60 (c) | 8,155,000 | 5,800,436 |
| Series A | | |
| 4.00%, due 8/1/60 (c) | 3,755,000 | 2,670,451 |
| New Jersey Economic Development Authority, School Facilities Construction, Revenue Bonds | | |
| Series LLL | | |
| 5.00%, due 6/15/36 | 5,200,000 | 5,320,036 |
| Series LLL | | |
| 5.00%, due 6/15/44 | 1,000,000 | 991,520 |
| Series LLL | | |
| 5.00%, due 6/15/49 | 6,790,000 | 6,638,726 |
| | Principal
Amount | Value |
| |
| New Jersey (continued) |
| New Jersey Economic Development Authority, New Jersey Transit Transportation Project, Revenue Bonds | | |
| Series A | | |
| 5.00%, due 11/1/36 | $ 3,500,000 | $ 3,575,482 |
| New Jersey Economic Development Authority, Provident Group-Kean Properties LLC, Revenue Bonds | | |
| Series A | | |
| 5.00%, due 7/1/37 | 2,650,000 | 2,446,912 |
| Series A | | |
| 5.00%, due 7/1/47 | 3,095,000 | 2,633,546 |
| New Jersey Economic Development Authority, State Government Buildings Project, Revenue Bonds | | |
| Series C | | |
| 5.00%, due 6/15/42 | 8,860,000 | 8,788,859 |
| New Jersey Economic Development Authority, Port Newark Container Terminal LLC, Revenue Bonds | | |
| 5.00%, due 10/1/47 (a) | 15,905,000 | 14,402,679 |
| New Jersey Economic Development Authority, Provident Group-Rowan Properties LLC, Revenue Bonds | | |
| Series A | | |
| 5.00%, due 1/1/48 | 11,985,000 | 10,037,348 |
| New Jersey Economic Development Authority, The Goethals Bridge Replacement Project, Revenue Bonds (a) | | |
| 5.125%, due 1/1/34 | 3,000,000 | 3,001,496 |
| Insured: AGM | | |
| 5.125%, due 7/1/42 | 1,705,000 | 1,704,846 |
| 5.375%, due 1/1/43 | 12,105,000 | 11,758,730 |
| New Jersey Economic Development Authority, Continental Airlines, Inc. Project, Revenue Bonds | | |
| Series B | | |
| 5.625%, due 11/15/30 (a) | 10,335,000 | 10,334,789 |
| New Jersey Economic Development Authority, NYNJ Link Borrower LLC, Revenue Bonds | | |
| 5.625%, due 1/1/52 (a) | 16,695,000 | 16,696,184 |
| New Jersey Economic Development Authority, Team Academy Charter School Project, Revenue Bonds | | |
| 6.00%, due 10/1/43 | 2,055,000 | 2,055,812 |
The notes to the financial statements are an integral part of, and should be read in conjunction with, the financial statements.
| 38 | MainStay MacKay High Yield Municipal Bond Fund |
| | Principal
Amount | Value |
| Long-Term Municipal Bonds (continued) |
| New Jersey (continued) |
| New Jersey Educational Facilities Authority, St Elizabeth University, Revenue Bonds | | |
| Series D | | |
| 5.00%, due 7/1/46 | $ 2,190,000 | $ 1,785,178 |
| New Jersey Transportation Trust Fund Authority, Transportation Program, Revenue Bonds | | |
| Series AA | | |
| 4.00%, due 6/15/38 | 10,350,000 | 9,449,924 |
| Series AA | | |
| 4.00%, due 6/15/40 | 11,250,000 | 9,995,471 |
| Series A | | |
| 4.00%, due 6/15/41 | 3,000,000 | 2,643,766 |
| Series BB | | |
| 4.00%, due 6/15/41 | 3,750,000 | 3,304,707 |
| Series BB | | |
| 4.00%, due 6/15/44 | 14,890,000 | 12,752,886 |
| Series AA | | |
| 4.00%, due 6/15/45 | 40,170,000 | 34,244,105 |
| Series BB | | |
| 4.00%, due 6/15/46 | 6,140,000 | 5,235,588 |
| Series AA | | |
| 4.00%, due 6/15/50 | 5,810,000 | 4,830,507 |
| Series BB | | |
| 4.00%, due 6/15/50 | 22,105,000 | 18,378,373 |
| Series AA | | |
| 4.25%, due 6/15/44 | 2,055,000 | 1,832,129 |
| Series AA | | |
| 5.00%, due 6/15/50 | 6,910,000 | 6,736,533 |
| New Jersey Turnpike Authority, Revenue Bonds | | |
| Series D-1 | | |
| 4.50%, due 1/1/24 | 64,150,000 | 64,139,466 |
| South Jersey Port Corp., Marine Terminal, Revenue Bonds | | |
| Series B | | |
| 5.00%, due 1/1/48 (a) | 24,010,000 | 21,935,224 |
| South Jersey Transportation Authority, Revenue Bonds | | |
| Series A, Insured: AGM-CR | | |
| 4.00%, due 11/1/50 | 10,900,000 | 8,966,640 |
| Series A | | |
| 5.00%, due 11/1/39 | 500,000 | 468,697 |
| Series A, Insured: BAM | | |
| 5.00%, due 11/1/45 | 10,150,000 | 9,917,425 |
| | Principal
Amount | Value |
| |
| New Jersey (continued) |
| Tobacco Settlement Financing Corp., Revenue Bonds | | |
| Series A | | |
| 5.00%, due 6/1/46 | $ 5,125,000 | $ 4,808,289 |
| | | 334,694,218 |
| New York 8.7% |
| Brooklyn Arena Local Development Corp., Barclays Center Project, Revenue Bonds | | |
| Series A, Insured: AGM | | |
| 3.00%, due 7/15/43 | 2,135,000 | 1,446,185 |
| Build NYC Resource Corp., Pratt Paper, Inc. Project, Revenue Bonds | | |
| 5.00%, due 1/1/35 (a)(c) | 1,500,000 | 1,463,569 |
| Build NYC Resource Corp., Metropolitan Lighthouse Charter School Project, Revenue Bonds | | |
| Series A | | |
| 5.00%, due 6/1/47 (c) | 1,225,000 | 1,086,928 |
| Build NYC Resource Corp., Hellenic Classical Charter Schools, Revenue Bonds | | |
| Series A | | |
| 5.00%, due 12/1/51 (c) | 2,125,000 | 1,641,886 |
| Dutchess County Local Development Corp., Bard College Project, Revenue Bonds | | |
| Series A | | |
| 5.00%, due 7/1/45 | 6,600,000 | 6,062,910 |
| Erie Tobacco Asset Securitization Corp., Tobacco Settlement, Asset-Backed, Revenue Bonds | | |
| Series B | | |
| (zero coupon), due 6/1/47 | 37,500,000 | 6,321,154 |
| Genesee County Funding Corp. (The), Rochester Regional Health Obligated Group, Revenue Bonds | | |
| Series A | | |
| 5.25%, due 12/1/52 | 6,750,000 | 6,394,528 |
| Huntington Local Development Corp., Fountaingate Gardens Project, Revenue Bonds | | |
| Series B | | |
| 4.00%, due 7/1/27 | 4,610,000 | 4,314,753 |
The notes to the financial statements are an integral part of, and should be read in conjunction with, the financial statements.
39
Portfolio of Investments October 31, 2023†^ (continued)
| | Principal
Amount | Value |
| Long-Term Municipal Bonds (continued) |
| New York (continued) |
| Jefferson County Civic Facility Development Corp., Samaritan Medical Center Project, Revenue Bonds | | |
| Series A | | |
| 4.00%, due 11/1/42 | $ 2,075,000 | $ 1,374,231 |
| Series A | | |
| 4.00%, due 11/1/47 | 1,530,000 | 946,577 |
| Metropolitan Transportation Authority, Green Bond, Revenue Bonds | | |
| Series A-1 | | |
| 4.00%, due 11/15/45 | 31,350,000 | 25,926,679 |
| Series E | | |
| 4.00%, due 11/15/45 | 23,375,000 | 19,335,115 |
| Series A-1 | | |
| 4.00%, due 11/15/46 | 21,195,000 | 17,364,612 |
| Series A-1 | | |
| 4.00%, due 11/15/46 | 11,050,000 | 9,053,030 |
| Series A-3, Insured: AGM | | |
| 4.00%, due 11/15/46 | 2,930,000 | 2,434,426 |
| Series A-1 | | |
| 4.00%, due 11/15/48 | 6,440,000 | 5,201,364 |
| Series A-1 | | |
| 4.00%, due 11/15/49 | 35,565,000 | 28,543,530 |
| Series A-1, Insured: AGM | | |
| 4.00%, due 11/15/50 | 8,550,000 | 6,956,905 |
| Series A-1 | | |
| 4.00%, due 11/15/50 | 800,000 | 639,431 |
| Series D | | |
| 4.00%, due 11/15/50 | 7,730,000 | 6,218,548 |
| Series A-1 | | |
| 4.00%, due 11/15/51 | 10,290,000 | 8,182,333 |
| Series A-1 | | |
| 4.00%, due 11/15/52 | 3,340,000 | 2,643,529 |
| Series A-2 | | |
| 5.00%, due 11/15/27 | 3,150,000 | 3,198,496 |
| Series B | | |
| 5.00%, due 11/15/28 | 1,190,000 | 1,219,365 |
| Metropolitan Transportation Authority, Climate Certified Green Bond, Revenue Bonds | | |
| Series C, Insured: AGM | | |
| 4.00%, due 11/15/47 | 2,000,000 | 1,649,673 |
| | Principal
Amount | Value |
| |
| New York (continued) |
| Metropolitan Transportation Authority, Revenue Bonds | | |
| Series D | | |
| 5.00%, due 11/15/27 | $ 2,055,000 | $ 2,086,638 |
| Monroe County Industrial Development Corp., St. Ann's Community Project, Revenue Bonds | | |
| 5.00%, due 1/1/50 | 1,000,000 | 745,170 |
| Nassau County Tobacco Settlement Corp., Tobacco Settlement, Asset-Backed, Revenue Bonds | | |
| Series A-3 | | |
| 5.00%, due 6/1/35 | 2,075,000 | 1,821,252 |
| Series A-3 | | |
| 5.125%, due 6/1/46 | 12,605,000 | 10,672,071 |
| New York City Industrial Development Agency, Queens Baseball Stadium Project, Revenue Bonds | | |
| Series A, Insured: AGM | | |
| 3.00%, due 1/1/46 | 12,365,000 | 8,251,754 |
| New York City Industrial Development Agency, Yankee Stadium Project, Revenue Bonds | | |
| Series A, Insured: AGM | | |
| 3.00%, due 3/1/49 | 1,750,000 | 1,131,592 |
| Series A, Insured: AGM-CR | | |
| 3.00%, due 3/1/49 | 17,600,000 | 11,380,581 |
| New York City Transitional Finance Authority, Future Tax Secured, Revenue Bonds | | |
| Series E-1 | | |
| 4.00%, due 2/1/49 | 49,060,000 | 41,412,493 |
| New York Convention Center Development Corp., Hotel Unit Fee, Revenue Bonds, Senior Lien | | |
| Series A | | |
| (zero coupon), due 11/15/47 | 10,000,000 | 2,479,780 |
| New York Counties Tobacco Trust V, Pass Through, Capital Appreciation, Revenue Bonds | | |
| Series S-1 | | |
| (zero coupon), due 6/1/38 | 2,500,000 | 943,221 |
The notes to the financial statements are an integral part of, and should be read in conjunction with, the financial statements.
| 40 | MainStay MacKay High Yield Municipal Bond Fund |
| | Principal
Amount | Value |
| Long-Term Municipal Bonds (continued) |
| New York (continued) |
| New York Liberty Development Corp., 1 World Trade Center, Revenue Bonds | | |
| Insured: BAM | | |
| 2.75%, due 2/15/44 | $ 14,600,000 | $ 9,781,631 |
| New York Liberty Development Corp., Green Bond, Revenue Bonds | | |
| Series A, Insured: BAM | | |
| 3.00%, due 11/15/51 | 3,750,000 | 2,439,200 |
| New York Liberty Development Corp., 7 World Trade Center Project, Revenue Bonds | | |
| Series A | | |
| 3.125%, due 9/15/50 | 21,530,000 | 14,036,712 |
| New York Liberty Development Corp., 3 World Trade Center LLC, Revenue Bonds | | |
| Class 1 | | |
| 5.00%, due 11/15/44 (c) | 72,180,000 | 64,648,039 |
| New York State Dormitory Authority, Montefiore Obligated Group, Revenue Bonds | | |
| Series A | | |
| 4.00%, due 8/1/37 | 3,250,000 | 2,833,548 |
| Series A | | |
| 4.00%, due 8/1/38 | 1,750,000 | 1,496,889 |
| Series A | | |
| 4.00%, due 9/1/50 | 6,700,000 | 4,999,393 |
| New York State Dormitory Authority, NYU Langone Hospitals Obligated Group, Revenue Bonds | | |
| Series A | | |
| 4.00%, due 7/1/50 | 4,240,000 | 3,411,403 |
| Series A | | |
| 4.00%, due 7/1/53 | 4,310,000 | 3,413,032 |
| New York State Dormitory Authority, Orange Regional Medical Center Obligated Group, Revenue Bonds | | |
| 5.00%, due 12/1/30 (c) | 2,200,000 | 2,063,517 |
| New York State Thruway Authority, State Personal Income Tax, Revenue Bonds | | |
| Series A-1 | | |
| 3.00%, due 3/15/48 | 8,500,000 | 5,855,573 |
| Series A-1 | | |
| 3.00%, due 3/15/51 | 33,195,000 | 22,215,986 |
| | Principal
Amount | Value |
| |
| New York (continued) |
| New York State Thruway Authority, State Personal Income Tax, Revenue Bonds (continued) | | |
| Series A-1 | | |
| 4.00%, due 3/15/53 | $ 14,875,000 | $ 12,449,075 |
| New York State Thruway Authority, General Revenue Junior Indebtedness Obligation, Revenue Bonds | | |
| Series B | | |
| 4.00%, due 1/1/50 | 10,135,000 | 8,243,053 |
| New York State Urban Development Corp., Sales Tax, Revenue Bonds | | |
| Series A | | |
| 3.00%, due 3/15/50 | 9,700,000 | 6,480,627 |
| New York State Urban Development Corp., Personal Income Tax, Revenue Bonds | | |
| Series E | | |
| 4.00%, due 3/15/43 | 6,150,000 | 5,372,289 |
| New York Transportation Development Corp., New York State Thruway Service Areas Project, Revenue Bonds | | |
| 4.00%, due 4/30/53 (a) | 4,870,000 | 3,665,475 |
| New York Transportation Development Corp., Delta Air Lines, Inc. - LaGuardia Airport Terminals C&D Redevelopment Project, Revenue Bonds (a) | | |
| 4.375%, due 10/1/45 | 75,465,000 | 62,380,320 |
| 5.00%, due 10/1/35 | 6,110,000 | 5,810,141 |
| New York Transportation Development Corp., Terminal 4 JFK International Airport Project, Revenue Bonds (a) | | |
| 5.00%, due 12/1/34 | 9,750,000 | 9,754,431 |
| 5.00%, due 12/1/36 | 5,000,000 | 4,979,701 |
| 5.00%, due 12/1/38 | 9,750,000 | 9,499,822 |
| 5.00%, due 12/1/39 | 13,805,000 | 13,363,586 |
| 5.00%, due 12/1/40 | 4,135,000 | 3,977,186 |
| New York Transportation Development Corp., Terminal 4 John F. Kennedy International Airport Project, Revenue Bonds (a) | | |
| Insured: AGM-CR | | |
| 5.00%, due 12/1/40 | 17,260,000 | 16,961,549 |
| 5.00%, due 12/1/42 | 3,375,000 | 3,187,476 |
The notes to the financial statements are an integral part of, and should be read in conjunction with, the financial statements.
41
Portfolio of Investments October 31, 2023†^ (continued)
| | Principal
Amount | Value |
| Long-Term Municipal Bonds (continued) |
| New York (continued) |
| New York Transportation Development Corp., LaGuardia Airport Terminal B Redevelopment Project, Revenue Bonds (a) | | |
| Series A | | |
| 5.00%, due 7/1/41 | $ 17,960,000 | $ 17,055,098 |
| Series A | | |
| 5.00%, due 7/1/46 | 12,125,000 | 11,165,322 |
| New York Transportation Development Corp., American Airlines, Inc. John F. Kennedy International Airport Project, Revenue Bonds (a) | | |
| 5.25%, due 8/1/31 | 3,750,000 | 3,746,411 |
| 5.375%, due 8/1/36 | 3,445,000 | 3,338,139 |
| Oneida County Local Development Corp., Mohawk Valley Health System Project, Revenue Bonds | | |
| Series A, Insured: AGM | | |
| 3.00%, due 12/1/40 | 3,755,000 | 2,699,193 |
| Series A, Insured: AGM | | |
| 3.00%, due 12/1/44 | 6,450,000 | 4,334,939 |
| Orange County Funding Corp., Mount St. Mary College, Revenue Bonds | | |
| Series A | | |
| 5.00%, due 7/1/42 | 1,430,000 | 1,288,064 |
| Port Authority of New York & New Jersey, Revenue Bonds (a) | | |
| Series 223 | | |
| 4.00%, due 7/15/46 | 9,520,000 | 7,685,971 |
| Series 236 | | |
| 5.00%, due 1/15/52 | 4,285,000 | 4,056,032 |
| Port Authority of New York & New Jersey, Consolidated 218th, Revenue Bonds | | |
| Series 218 | | |
| 4.00%, due 11/1/47 (a) | 2,455,000 | 1,968,604 |
| Riverhead Industrial Development Agency, Riverhead Charter School, Revenue Bonds | | |
| Series A | | |
| 7.00%, due 8/1/43 | 1,500,000 | 1,501,955 |
| | Principal
Amount | Value |
| |
| New York (continued) |
| Rockland Tobacco Asset Securitization Corp., Tobacco Settlement, Asset-Backed, Revenue Bonds | | |
| Series B | | |
| (zero coupon), due 8/15/50 (c) | $ 13,000,000 | $ 2,021,571 |
| Southold Local Development Corp., Peconic Landing, Inc. Project, Revenue Bonds | | |
| 4.00%, due 12/1/45 | 815,000 | 589,975 |
| Suffolk Tobacco Asset Securitization Corp., Tobacco Settlement, Asset Backed, Revenue Bonds | | |
| Series B-2 | | |
| (zero coupon), due 6/1/66 | 60,995,000 | 5,171,455 |
| Tompkins County Development Corp., Kendal at Ithaca Project, Revenue Bonds | | |
| Series 2014A | | |
| 5.00%, due 7/1/44 | 915,000 | 796,624 |
| Westchester County Local Development Corp., Pace University, Revenue Bonds | | |
| Series A | | |
| 5.50%, due 5/1/42 | 5,205,000 | 5,045,057 |
| | | 626,328,373 |
| North Carolina 0.6% |
| North Carolina Medical Care Commission, The Forest at Duke Project, Revenue Bonds | | |
| 4.00%, due 9/1/41 | 2,300,000 | 1,762,598 |
| 4.00%, due 9/1/51 | 1,405,000 | 969,286 |
| North Carolina Medical Care Commission, Plantation Village, Inc., Revenue Bonds | | |
| Series A | | |
| 4.00%, due 1/1/52 | 3,040,000 | 2,087,171 |
| North Carolina Medical Care Commission, Pines at Davidson Project (The), Revenue Bonds | | |
| Series A | | |
| 5.00%, due 1/1/49 | 3,525,000 | 2,997,156 |
| North Carolina Turnpike Authority, Triangle Expressway System, Revenue Bonds, Senior Lien | | |
| Insured: AGM | | |
| 3.00%, due 1/1/42 | 2,370,000 | 1,676,111 |
The notes to the financial statements are an integral part of, and should be read in conjunction with, the financial statements.
| 42 | MainStay MacKay High Yield Municipal Bond Fund |
| | Principal
Amount | Value |
| Long-Term Municipal Bonds (continued) |
| North Carolina (continued) |
North Carolina Turnpike Authority, Triangle Expressway System, Revenue Bonds, Senior Lien
(continued) | | |
| Insured: AGM | | |
| 5.00%, due 1/1/49 | $ 4,750,000 | $ 4,676,522 |
| Insured: AGM-CR | | |
| 5.00%, due 1/1/49 | 23,700,000 | 23,300,423 |
| North Carolina Turnpike Authority, Monroe Expressway Toll, Revenue Bonds | | |
| Series A | | |
| 5.00%, due 7/1/51 | 2,745,000 | 2,577,543 |
| Series A | | |
| 5.00%, due 7/1/54 | 6,755,000 | 6,283,680 |
| | | 46,330,490 |
| North Dakota 0.5% |
| City of Grand Forks, Altru Health System, Revenue Bonds | | |
| Insured: AGM-CR | | |
| 4.00%, due 12/1/46 | 3,955,000 | 3,118,478 |
| Series A, Insured: AGM | | |
| 5.00%, due 12/1/48 | 2,950,000 | 2,875,797 |
| Series A, Insured: AGM | | |
| 5.00%, due 12/1/53 | 2,800,000 | 2,665,596 |
| County of Cass, Essentia Health Obligated Group, Revenue Bonds | | |
| Series B | | |
| 5.25%, due 2/15/53 | 9,100,000 | 8,766,229 |
| County of Ward, Trinity Health, Revenue Bonds | | |
| Series C | | |
| 5.00%, due 6/1/48 | 26,890,000 | 19,113,657 |
| Series C | | |
| 5.00%, due 6/1/53 | 725,000 | 499,721 |
| | | 37,039,478 |
| Ohio 4.5% |
| Akron Bath Copley Joint Township Hospital District, Summa Health System Obligated Group, Revenue Bonds | | |
| 5.25%, due 11/15/46 | 29,875,000 | 27,475,548 |
| | Principal
Amount | Value |
| |
| Ohio (continued) |
| Buckeye Tobacco Settlement Financing Authority, Revenue Bonds, Senior Lien | | |
| Series A-2, Class 1 | | |
| 4.00%, due 6/1/48 | $ 1,500,000 | $ 1,200,528 |
| Series B-2, Class 2 | | |
| 5.00%, due 6/1/55 | 180,820,000 | 148,126,786 |
| Cleveland-Cuyahoga County Port Authority, Euclid Avenue Development Corp. Project, Revenue Bonds | | |
| 4.00%, due 8/1/44 | 12,270,000 | 10,143,786 |
| Series A | | |
| 5.50%, due 8/1/52 | 1,000,000 | 991,435 |
| Cleveland-Cuyahoga County Port Authority, Centers for Dialysis Care Project, Revenue Bonds | | |
| Series A | | |
| 5.00%, due 12/1/42 | 4,905,000 | 4,353,583 |
| Series A | | |
| 5.00%, due 12/1/47 | 1,435,000 | 1,226,813 |
| Cleveland-Cuyahoga County Port Authority, Starwood Wasserman University Heights Holding LLC, Revenue Bonds (d)(e)(f) | | |
| Series A | | |
| 7.00%, due 12/1/18 | 710,000 | 184,600 |
| Series A | | |
| 7.35%, due 12/1/31 | 6,000,000 | 1,560,000 |
| County of Cuyahoga, MetroHealth System (The), Revenue Bonds | | |
| 4.75%, due 2/15/47 | 1,440,000 | 1,263,662 |
| 5.00%, due 2/15/37 | 5,050,000 | 4,924,296 |
| 5.00%, due 2/15/52 | 7,785,000 | 6,855,708 |
| 5.00%, due 2/15/57 | 8,260,000 | 7,158,209 |
| 5.50%, due 2/15/57 | 32,555,000 | 30,567,071 |
| County of Cuyahoga, MetroHealth System, Revenue Bonds | | |
| 5.50%, due 2/15/52 | 550,000 | 522,073 |
| County of Hamilton, Life Enriching Communities Project, Revenue Bonds | | |
| 5.00%, due 1/1/42 | 1,080,000 | 938,768 |
| 5.00%, due 1/1/46 | 2,090,000 | 1,756,657 |
| County of Montgomery, Kettering Health Network Obligated Group, Revenue Bonds | | |
| 4.00%, due 8/1/51 | 3,265,000 | 2,512,725 |
The notes to the financial statements are an integral part of, and should be read in conjunction with, the financial statements.
43
Portfolio of Investments October 31, 2023†^ (continued)
| | Principal
Amount | Value |
| Long-Term Municipal Bonds (continued) |
| Ohio (continued) |
| Franklin County Convention Facilities Authority, Greater Columbus Convention Center Hotel Expansion Project, Revenue Bonds | | |
| 5.00%, due 12/1/51 | $ 4,250,000 | $ 3,465,377 |
| Ohio Air Quality Development Authority, Pratt Paper LLC Project, Revenue Bonds | | |
| 4.50%, due 1/15/48 (a)(c) | 2,450,000 | 2,092,105 |
| Ohio Higher Educational Facility Commission, Tiffin University Project, Revenue Bonds | | |
| 4.00%, due 11/1/49 | 4,700,000 | 3,042,996 |
| 5.00%, due 11/1/44 | 750,000 | 605,951 |
| Ohio Higher Educational Facility Commission, University of Findlay (The), Revenue Bonds | | |
| 5.00%, due 3/1/39 | 1,675,000 | 1,467,635 |
| 5.00%, due 3/1/44 | 9,260,000 | 7,777,806 |
| Ohio Higher Educational Facility Commission, Menorah Park Obligated Group, Revenue Bonds | | |
| 5.25%, due 1/1/48 | 4,045,000 | 2,444,911 |
| Ohio Higher Educational Facility Commission, Cleveland Institute of Art (The), Revenue Bonds | | |
| 5.25%, due 12/1/48 | 1,000,000 | 834,465 |
| 5.50%, due 12/1/53 | 1,215,000 | 1,030,035 |
| State of Ohio, University Hospitals Health System, Inc., Revenue Bonds | | |
| Series A | | |
| 4.00%, due 1/15/46 | 8,000,000 | 6,433,827 |
| Series A, Insured: BAM | | |
| 4.00%, due 1/15/50 | 33,060,000 | 26,677,552 |
| Toledo-Lucas County Port Authority, University of Toledo Parking Project, Revenue Bonds | | |
| 4.00%, due 1/1/57 | 6,150,000 | 4,210,394 |
| Toledo-Lucas County Port Authority, University of Toledo Project, Revenue Bonds | | |
| Series A | | |
| 5.00%, due 7/1/34 | 1,400,000 | 1,307,513 |
| Series A | | |
| 5.00%, due 7/1/39 | 2,000,000 | 1,806,082 |
| | Principal
Amount | Value |
| |
| Ohio (continued) |
| Toledo-Lucas County Port Authority, University of Toledo Project, Revenue Bonds (continued) | | |
| Series A | | |
| 5.00%, due 7/1/46 | $ 9,440,000 | $ 8,090,469 |
| | | 323,049,366 |
| Oklahoma 0.1% |
| Norman Regional Hospital Authority, Norman Regional Hospital Authority Obligated Group, Revenue Bonds | | |
| 4.00%, due 9/1/45 | 2,500,000 | 1,828,540 |
| 5.00%, due 9/1/37 | 3,500,000 | 3,372,010 |
| Oklahoma Development Finance Authority, Provident Oklahoma Education Resources, Inc. Cross Village Student Housing Project, Revenue Bonds (d)(e) | | |
| Series A | | |
| 5.00%, due 8/1/47 | 6,525,171 | 6,525 |
| Series A | | |
| 5.25%, due 8/1/57 | 8,192,966 | 8,193 |
| Tulsa Authority for Economic Opportunity, Sante FE Square Project, Tax Allocation | | |
| 4.375%, due 12/1/41 (c) | 1,500,000 | 1,305,046 |
| Tulsa County Industrial Authority, Montereau, Inc., Project, Revenue Bonds | | |
| 5.25%, due 11/15/45 | 1,250,000 | 1,115,188 |
| | | 7,635,502 |
| Oregon 0.1% |
| Astoria Hospital Facilities Authority, Columbia Memorial Hospital Obligated Group, Revenue Bonds | | |
| 3.50%, due 8/1/42 | 845,000 | 618,475 |
| County of Yamhill, George Fox University Project, Revenue Bonds | | |
| 4.00%, due 12/1/51 | 3,150,000 | 2,357,786 |
| Oregon State Facilities Authority, Samaritan Health, Revenue Bonds | | |
| Series A | | |
| 5.00%, due 10/1/46 | 2,280,000 | 2,028,776 |
The notes to the financial statements are an integral part of, and should be read in conjunction with, the financial statements.
| 44 | MainStay MacKay High Yield Municipal Bond Fund |
| | Principal
Amount | Value |
| Long-Term Municipal Bonds (continued) |
| Oregon (continued) |
| Oregon State Facilities Authority, College Housing Northwest Project, Revenue Bonds | | |
| Series A | | |
| 5.00%, due 10/1/48 (c) | $ 1,560,000 | $ 1,279,674 |
| | | 6,284,711 |
| Pennsylvania 4.0% |
| Allegheny County Airport Authority, Revenue Bonds (a) | | |
| Series A, Insured: AGM | | |
| 4.00%, due 1/1/46 | 7,970,000 | 6,572,220 |
| Series A | | |
| 4.00%, due 1/1/56 | 7,500,000 | 5,663,975 |
| Allegheny County Hospital Development Authority, Allegheny Health Network, Revenue Bonds | | |
| Series A, Insured: AGM-CR | | |
| 4.00%, due 4/1/44 | 15,900,000 | 13,091,066 |
| Allegheny County Industrial Development Authority, Urban Academy of Greater Pittsburgh Charter School, Revenue Bonds | | |
| Series A | | |
| 4.00%, due 6/15/41 (c) | 1,895,000 | 1,410,292 |
| Allegheny County Industrial Development Authority, Propel Charter School - Sunrise, Revenue Bonds | | |
| 6.00%, due 7/15/38 | 2,850,000 | 2,851,361 |
| Allentown Neighborhood Improvement Zone Development Authority, City Center Project, Revenue Bonds (c) | | |
| 5.00%, due 5/1/42 | 14,750,000 | 13,484,569 |
| 5.00%, due 5/1/42 | 6,465,000 | 5,924,120 |
| 5.125%, due 5/1/32 | 4,250,000 | 4,187,086 |
| 5.25%, due 5/1/42 | 1,110,000 | 1,029,423 |
| 5.375%, due 5/1/42 | 4,225,000 | 3,990,529 |
| Allentown Neighborhood Improvement Zone Development Authority, Revenue Bonds | | |
| 5.00%, due 5/1/42 | 3,500,000 | 3,176,605 |
| 6.00%, due 5/1/42 (c) | 4,350,000 | 4,245,683 |
| | Principal
Amount | Value |
| |
| Pennsylvania (continued) |
| Bucks County Industrial Development Authority, Grand View Hospital Project, Revenue Bonds | | |
| 4.00%, due 7/1/46 | $ 2,900,000 | $ 1,930,191 |
| 4.00%, due 7/1/51 | 7,200,000 | 4,543,952 |
| 5.00%, due 7/1/40 | 655,000 | 535,450 |
| 5.00%, due 7/1/41 | 2,500,000 | 2,026,292 |
| Cambria County General Financing Authority, St. Francis University, Revenue Bonds | | |
| Series TT5 | | |
| 4.00%, due 4/1/46 | 2,035,000 | 1,490,380 |
| Chambersburg Area Municipal Authority, Wilson College, Revenue Bonds | | |
| 5.50%, due 10/1/33 | 1,230,000 | 1,137,670 |
| 5.75%, due 10/1/38 | 3,200,000 | 2,863,105 |
| 5.75%, due 10/1/43 | 2,290,000 | 1,973,829 |
| Chester County Industrial Development Authority, Renaissance Academy Charter School, Revenue Bonds | | |
| 5.00%, due 10/1/39 | 1,575,000 | 1,372,820 |
| Chester County Industrial Development Authority, Woodlands at Greystone Project, Special Assessment | | |
| 5.125%, due 3/1/48 (c) | 760,000 | 647,351 |
| City of Erie Higher Education Building Authority, Mercyhurst University Project, Revenue Bonds (c) | | |
| 5.00%, due 9/15/27 | 705,000 | 680,873 |
| 5.00%, due 9/15/28 | 740,000 | 708,731 |
| 5.00%, due 9/15/29 | 150,000 | 142,233 |
| 5.00%, due 9/15/37 | 640,000 | 655,661 |
| 5.00%, due 9/15/37 | 2,755,000 | 2,401,380 |
| Commonwealth Financing Authority, Tobacco Master Settlement Payment, Revenue Bonds | | |
| Insured: AGM | | |
| 4.00%, due 6/1/39 | 3,150,000 | 2,822,019 |
| County of Lehigh, Lehigh Valley Health Network, Revenue Bonds | | |
| Series A | | |
| 4.00%, due 7/1/49 | 1,660,000 | 1,324,888 |
The notes to the financial statements are an integral part of, and should be read in conjunction with, the financial statements.
45
Portfolio of Investments October 31, 2023†^ (continued)
| | Principal
Amount | Value |
| Long-Term Municipal Bonds (continued) |
| Pennsylvania (continued) |
| Cumberland County Municipal Authority, Diakon Lutheran Social Ministries, Revenue Bonds | | |
| Series A | | |
| 5.00%, due 1/1/39 | $ 195,000 | $ 205,651 |
| Series A | | |
| 5.00%, due 1/1/39 | 290,000 | 267,061 |
| Dauphin County General Authority, Harrisburg University Science Technology Project (The), Revenue Bonds (c) | | |
| 5.00%, due 10/15/34 | 5,535,000 | 4,535,106 |
| 5.125%, due 10/15/41 | 4,650,000 | 3,369,882 |
| 5.875%, due 10/15/40 | 3,700,000 | 2,976,990 |
| 6.25%, due 10/15/53 | 9,150,000 | 7,030,732 |
| Delaware County Authority, Cabrini University, Revenue Bonds | | |
| 5.00%, due 7/1/42 | 1,205,000 | 1,072,872 |
| Franklin County Industrial Development Authority, Menno-Haven, Inc. Project, Revenue Bonds | | |
| 5.00%, due 12/1/39 | 375,000 | 301,722 |
| 5.00%, due 12/1/49 | 1,020,000 | 737,018 |
| General Authority of Southcentral Pennsylvania, York Academy Regional Charter School Project, Revenue Bonds (c) | | |
| Series A | | |
| 6.00%, due 7/15/38 | 2,795,000 | 2,743,910 |
| Series A | | |
| 6.50%, due 7/15/48 | 4,150,000 | 4,161,115 |
| Huntingdon County General Authority, AICUP Financing Program, Revenue Bonds | | |
| Series OO2 | | |
| 5.00%, due 5/1/46 | 3,955,000 | 3,386,994 |
| Lancaster Higher Education Authority, Elizabethtown College Project, Revenue Bonds | | |
| Series A | | |
| 5.00%, due 10/1/51 | 3,000,000 | 2,487,650 |
| Lancaster Industrial Development Authority, Willow Valley Communities Project, Revenue Bonds | | |
| 4.00%, due 12/1/44 | 1,550,000 | 1,237,139 |
| | Principal
Amount | Value |
| |
| Pennsylvania (continued) |
| Lancaster Industrial Development Authority, Willow Valley Communities Project, Revenue Bonds (continued) | | |
| 4.00%, due 12/1/49 | $ 1,900,000 | $ 1,445,220 |
| 5.00%, due 12/1/49 | 3,940,000 | 3,548,246 |
| Lancaster Industrial Development Authority, Landis Homes Retirement Community, Revenue Bonds | | |
| 4.00%, due 7/1/51 | 2,750,000 | 1,823,128 |
| Montgomery County Higher Education and Health Authority, Thomas Jefferson University Project, Revenue Bonds | | |
| 4.00%, due 9/1/44 | 3,000,000 | 2,516,887 |
| 4.00%, due 9/1/49 | 4,750,000 | 3,786,423 |
| Insured: AGM-CR | | |
| 4.00%, due 9/1/49 | 15,610,000 | 12,740,879 |
| Montgomery County Higher Education and Health Authority, Philadelphia Presbyterian Homes Project, Revenue Bonds | | |
| 4.00%, due 12/1/48 | 3,995,000 | 2,700,465 |
| Montgomery County Industrial Development Authority, ACTS Retirement-Life Communities, Inc. Obligated Group, Revenue Bonds | | |
| 5.00%, due 11/15/36 | 4,650,000 | 4,481,635 |
| New Wilmington Municipal Authority, Westminster College Project, Revenue Bonds | | |
| Series PP-1 | | |
| 5.25%, due 5/1/46 | 2,595,000 | 2,347,115 |
| Northeastern Pennsylvania Hospital and Education Authority, King's College Project, Revenue Bonds | | |
| 5.00%, due 5/1/44 | 1,000,000 | 843,399 |
| 5.00%, due 5/1/49 | 1,350,000 | 1,096,656 |
| Pennsylvania Economic Development Financing Authority, Waste Management, Inc. Project, Revenue Bonds | | |
| 0.95%, due 12/1/33 (b) | 9,250,000 | 8,226,640 |
The notes to the financial statements are an integral part of, and should be read in conjunction with, the financial statements.
| 46 | MainStay MacKay High Yield Municipal Bond Fund |
| | Principal
Amount | Value |
| Long-Term Municipal Bonds (continued) |
| Pennsylvania (continued) |
| Pennsylvania Economic Development Financing Authority, Rapid Bridge Replacement Project, Revenue Bonds | | |
| 4.125%, due 12/31/38 | $ 4,000,000 | $ 3,370,173 |
| Pennsylvania Economic Development Financing Authority, Penndot Major Bridges Project, Revenue Bonds (a) | | |
| Insured: AGM | | |
| 5.00%, due 12/31/57 | 7,900,000 | 7,599,413 |
| 5.25%, due 6/30/53 | 8,395,000 | 7,946,747 |
| 5.75%, due 6/30/48 | 6,560,000 | 6,685,722 |
| Pennsylvania Turnpike Commission, Revenue Bonds | | |
| Series B | | |
| 4.00%, due 12/1/46 | 6,770,000 | 5,613,182 |
| Series A | | |
| 4.00%, due 12/1/50 | 7,650,000 | 6,212,182 |
| Series A, Insured: BAM | | |
| 4.00%, due 12/1/50 | 46,265,000 | 37,631,595 |
| Philadelphia Authority for Industrial Development, Mariana Bracetti Academy Charter School, Revenue Bonds | | |
| Series B | | |
| 4.875%, due 12/15/35 (c) | 6,580,000 | 5,826,440 |
| Philadelphia Authority for Industrial Development, Russell Byers Charter School, Revenue Bonds | | |
| Series A | | |
| 5.00%, due 5/1/40 | 1,105,000 | 991,017 |
| Series A | | |
| 5.00%, due 5/1/50 | 3,130,000 | 2,596,974 |
| Philadelphia Authority for Industrial Development, MaST Charter School Project, Revenue Bonds | | |
| Series A | | |
| 5.00%, due 8/1/40 | 600,000 | 541,029 |
| Series A | | |
| 5.00%, due 8/1/50 | 1,050,000 | 883,447 |
| Philadelphia Authority for Industrial Development, University of the Arts (The), Revenue Bonds (c) | | |
| 5.00%, due 3/15/45 | 300,000 | 315,696 |
| 5.00%, due 3/15/45 | 4,875,000 | 3,808,201 |
| | Principal
Amount | Value |
| |
| Pennsylvania (continued) |
| Philadelphia Authority for Industrial Development, Philadelphia Performing Arts Charter School, Revenue Bonds | | |
| Series A | | |
| 5.00%, due 6/15/50 (c) | $ 1,700,000 | $ 1,425,950 |
| Philadelphia Authority for Industrial Development, International Education & Community Initiatives Project, Revenue Bonds (c) | | |
| Series A | | |
| 5.125%, due 6/1/38 | 2,000,000 | 1,777,867 |
| Series A | | |
| 5.25%, due 6/1/48 | 3,085,000 | 2,594,821 |
| Philadelphia Authority for Industrial Development, Greater Philadelphia Health Action, Inc., Revenue Bonds | | |
| Series A | | |
| 6.50%, due 6/1/45 | 2,200,000 | 2,016,715 |
| Philadelphia Authority for Industrial Development, First Philadelphia Preparatory Charter School, Revenue Bonds | | |
| Series A | | |
| 7.25%, due 6/15/43 | 4,150,000 | 4,203,896 |
| Scranton Redevelopment Authority, Revenue Bonds | | |
| Series A, Insured: MUN GOVT GTD | | |
| 5.00%, due 11/15/28 | 7,580,000 | 7,395,582 |
| Scranton-Lackawanna Health and Welfare Authority, Marywood University Project, Revenue Bonds | | |
| 5.00%, due 6/1/36 | 1,000,000 | 884,171 |
| 5.00%, due 6/1/46 | 2,625,000 | 2,124,839 |
| Wilkes-Barre Finance Authority, Wilkes University Project, Revenue Bonds | | |
| 4.00%, due 3/1/42 | 2,500,000 | 1,874,896 |
| | | 287,274,844 |
| Puerto Rico 9.5% |
| Children's Trust Fund, Asset-Backed, Revenue Bonds | | |
| Series A | | |
| (zero coupon), due 5/15/50 | 43,900,000 | 7,090,232 |
The notes to the financial statements are an integral part of, and should be read in conjunction with, the financial statements.
47
Portfolio of Investments October 31, 2023†^ (continued)
| | Principal
Amount | Value |
| Long-Term Municipal Bonds (continued) |
| Puerto Rico (continued) |
| Children's Trust Fund, Asset-Backed, Revenue Bonds (continued) | | |
| Series B | | |
| (zero coupon), due 5/15/57 | $ 97,900,000 | $ 4,562,209 |
| 5.50%, due 5/15/39 | 1,295,000 | 1,297,928 |
| 5.625%, due 5/15/43 | 36,560,000 | 36,747,465 |
| Commonwealth of Puerto Rico, Unlimited General Obligation | | |
| Series A-1 | | |
| (zero coupon), due 7/1/33 | 26,422,270 | 15,134,547 |
| Series A-1 | | |
| 4.00%, due 7/1/33 | 9,350,206 | 8,149,298 |
| Series A-1 | | |
| 4.00%, due 7/1/35 | 53,687,833 | 45,129,488 |
| Series A-1 | | |
| 4.00%, due 7/1/37 | 33,524,000 | 27,302,117 |
| Series A-1 | | |
| 4.00%, due 7/1/41 | 17,049,102 | 13,193,797 |
| Commonwealth of Puerto Rico | | |
| (zero coupon), due 11/1/43 | 97,809,855 | 48,782,665 |
| GDB Debt Recovery Authority of Puerto Rico, Revenue Bonds | | |
| 7.50%, due 8/20/40 | 98,693,447 | 80,681,893 |
| Puerto Rico Commonwealth Aqueduct & Sewer Authority, Revenue Bonds, Senior Lien (c) | | |
| Series C | | |
| 3.50%, due 7/1/26 | 14,625,000 | 13,967,663 |
| Series A | | |
| 5.00%, due 7/1/27 | 345,000 | 346,466 |
| Series 2020A | | |
| 5.00%, due 7/1/30 | 4,135,000 | 4,111,598 |
| Series 2020A | | |
| 5.00%, due 7/1/35 | 18,460,000 | 17,702,355 |
| Series A | | |
| 5.00%, due 7/1/37 | 5,750,000 | 5,422,624 |
| Series A | | |
| 5.00%, due 7/1/47 | 123,655,000 | 109,980,859 |
| Puerto Rico Commonwealth Aqueduct & Sewer Authority, Revenue Bonds (c) | | |
| Series B | | |
| 5.00%, due 7/1/33 | 5,300,000 | 5,192,335 |
| Series B | | |
| 5.00%, due 7/1/37 | 20,695,000 | 19,516,921 |
| | Principal
Amount | Value |
| |
| Puerto Rico (continued) |
| Puerto Rico Electric Power Authority, Revenue Bonds | | |
| Series DDD | | |
| 3.30%, due 7/1/19 (d)(e)(f) | $ 1,015,000 | $ 253,750 |
| Series ZZ | | |
| 4.25%, due 7/1/20 (d)(e)(f) | 1,355,000 | 338,750 |
| Series CCC | | |
| 4.25%, due 7/1/23 (d)(e) | 1,150,000 | 287,500 |
| Series UU, Insured: AGM | | |
| 4.31%, due 7/1/29 | 4,640,000 | 4,360,669 |
| Series CCC | | |
| 4.375%, due 7/1/22 (d)(e)(f) | 115,000 | 28,750 |
| Series CCC | | |
| 4.60%, due 7/1/24 (d)(e) | 200,000 | 50,500 |
| Series CCC | | |
| 4.625%, due 7/1/25 (d)(e) | 1,085,000 | 273,963 |
| Series XX | | |
| 4.75%, due 7/1/26 (d)(e) | 320,000 | 80,800 |
| Series ZZ | | |
| 4.75%, due 7/1/27 (d)(e) | 405,000 | 102,263 |
| Series A | | |
| 4.80%, due 7/1/29 (d)(e) | 690,000 | 174,225 |
| Series DDD | | |
| 5.00%, due 7/1/20 (d)(e)(f) | 3,250,000 | 812,500 |
| Series TT | | |
| 5.00%, due 7/1/20 (d)(e)(f) | 2,195,000 | 548,750 |
| Series CCC | | |
| 5.00%, due 7/1/21 (d)(e)(f) | 470,000 | 117,500 |
| Series DDD | | |
| 5.00%, due 7/1/21 (d)(e)(f) | 275,000 | 68,750 |
| Series TT | | |
| 5.00%, due 7/1/21 (d)(e)(f) | 1,215,000 | 303,750 |
| Series TT | | |
| 5.00%, due 7/1/23 (d)(e) | 365,000 | 91,250 |
| Series CCC | | |
| 5.00%, due 7/1/24 (d)(e) | 1,845,000 | 465,863 |
| Series RR, Insured: NATL-RE | | |
| 5.00%, due 7/1/24 | 115,000 | 115,018 |
| Series TT | | |
| 5.00%, due 7/1/24 (d)(e) | 450,000 | 113,625 |
| Series CCC | | |
| 5.00%, due 7/1/25 (d)(e) | 575,000 | 145,188 |
| Series SS, Insured: NATL-RE | | |
| 5.00%, due 7/1/25 | 770,000 | 763,864 |
| Series TT | | |
| 5.00%, due 7/1/25 (d)(e) | 1,030,000 | 260,075 |
| Series TT | | |
| 5.00%, due 7/1/26 (d)(e) | 1,050,000 | 265,125 |
The notes to the financial statements are an integral part of, and should be read in conjunction with, the financial statements.
| 48 | MainStay MacKay High Yield Municipal Bond Fund |
| | Principal
Amount | Value |
| Long-Term Municipal Bonds (continued) |
| Puerto Rico (continued) |
| Puerto Rico Electric Power Authority, Revenue Bonds (continued) | | |
| Series TT, Insured: AGM-CR | | |
| 5.00%, due 7/1/27 | $ 150,000 | $ 149,000 |
| Series TT | | |
| 5.00%, due 7/1/27 (d)(e) | 1,250,000 | 315,625 |
| Series WW | | |
| 5.00%, due 7/1/28 (d)(e) | 380,000 | 95,950 |
| Series TT | | |
| 5.00%, due 7/1/32 (d)(e) | 9,320,000 | 2,353,300 |
| Series A | | |
| 5.00%, due 7/1/42 (d)(e) | 8,755,000 | 2,210,637 |
| Series A | | |
| 5.05%, due 7/1/42 (d)(e) | 825,000 | 208,313 |
| Series ZZ | | |
| 5.25%, due 7/1/20 (d)(e)(f) | 225,000 | 56,250 |
| Series ZZ | | |
| 5.25%, due 7/1/23 (d)(e) | 620,000 | 155,000 |
| Series AAA | | |
| 5.25%, due 7/1/24 (d)(e) | 3,000,000 | 757,500 |
| Series WW | | |
| 5.25%, due 7/1/25 (d)(e) | 1,605,000 | 405,263 |
| Series AAA | | |
| 5.25%, due 7/1/26 (d)(e) | 110,000 | 27,775 |
| Series ZZ | | |
| 5.25%, due 7/1/26 (d)(e) | 3,520,000 | 888,800 |
| Series VV, Insured: NATL-RE | | |
| 5.25%, due 7/1/29 | 630,000 | 624,062 |
| Series AAA | | |
| 5.25%, due 7/1/30 (d)(e) | 985,000 | 248,713 |
| Series VV, Insured: NATL-RE | | |
| 5.25%, due 7/1/30 | 3,850,000 | 3,810,959 |
| Series VV, Insured: NATL-RE | | |
| 5.25%, due 7/1/32 | 345,000 | 340,399 |
| Series WW | | |
| 5.25%, due 7/1/33 (d)(e) | 8,310,000 | 2,098,275 |
| Series XX | | |
| 5.25%, due 7/1/35 (d)(e) | 2,265,000 | 571,913 |
| Series XX | | |
| 5.25%, due 7/1/40 (d)(e) | 18,055,000 | 4,558,887 |
| Series BBB | | |
| 5.40%, due 7/1/28 (d)(e) | 9,615,000 | 2,427,787 |
| Series WW | | |
| 5.50%, due 7/1/38 (d)(e) | 11,595,000 | 2,927,737 |
| Series XX | | |
| 5.75%, due 7/1/36 (d)(e) | 4,055,000 | 1,023,887 |
| | Principal
Amount | Value |
| |
| Puerto Rico (continued) |
| Puerto Rico Electric Power Authority, Revenue Bonds (continued) | | |
| Series A | | |
| 6.75%, due 7/1/36 (d)(e) | $ 11,550,000 | $ 2,916,375 |
| Series A | | |
| 7.00%, due 7/1/33 (d)(e) | 1,500,000 | 378,750 |
| Series A | | |
| 7.00%, due 7/1/43 (d)(e) | 4,750,000 | 1,199,375 |
| Puerto Rico Electric Power Authority, Build America Bonds, Revenue Bonds (d)(e) | | |
| Series EEE | | |
| 5.95%, due 7/1/30 | 25,585,000 | 6,460,212 |
| Series EEE | | |
| 6.05%, due 7/1/32 | 12,265,000 | 3,096,912 |
| Series YY | | |
| 6.125%, due 7/1/40 | 44,950,000 | 11,349,875 |
| Series EEE | | |
| 6.25%, due 7/1/40 | 10,165,000 | 2,566,662 |
| Puerto Rico Highway & Transportation Authority, Revenue Bonds | | |
| Series B | | |
| (zero coupon), due 7/1/32 | 8,244,000 | 5,265,855 |
| Puerto Rico Municipal Finance Agency, Revenue Bonds | | |
| Series A, Insured: AGM | | |
| 5.00%, due 8/1/27 | 1,705,000 | 1,716,197 |
| Puerto Rico Sales Tax Financing Corp., Revenue Bonds | | |
| Series A-1 | | |
| (zero coupon), due 7/1/31 | 1,842,000 | 1,282,520 |
| Series A-1 | | |
| (zero coupon), due 7/1/46 | 141,058,000 | 35,141,258 |
| Series A-1 | | |
| (zero coupon), due 7/1/51 | 40,375,000 | 7,298,262 |
| (zero coupon), due 8/1/54 | 516,302 | 93,325 |
| Series A-2 | | |
| 4.329%, due 7/1/40 | 20,500,000 | 17,759,673 |
| Series A-1 | | |
| 4.50%, due 7/1/34 | 725,000 | 692,386 |
| Series A-1 | | |
| 4.75%, due 7/1/53 | 8,900,000 | 7,539,374 |
| Series A-2 | | |
| 4.784%, due 7/1/58 | 19,809,000 | 16,661,419 |
| Series A-1 | | |
| 5.00%, due 7/1/58 | 74,079,000 | 64,856,750 |
| | | 686,866,100 |
The notes to the financial statements are an integral part of, and should be read in conjunction with, the financial statements.
49
Portfolio of Investments October 31, 2023†^ (continued)
| | Principal
Amount | Value |
| Long-Term Municipal Bonds (continued) |
| Rhode Island 0.3% |
| Providence Redevelopment Agency, Port Providence Lease, Certificate of Participation | | |
| Series A, Insured: AGC | | |
| (zero coupon), due 9/1/24 | $ 1,735,000 | $ 1,669,413 |
| Series A, Insured: AGC | | |
| (zero coupon), due 9/1/26 | 685,000 | 600,666 |
| Series A, Insured: AGC | | |
| (zero coupon), due 9/1/29 | 1,835,000 | 1,403,508 |
| Series A, Insured: AGC | | |
| (zero coupon), due 9/1/30 | 1,835,000 | 1,335,222 |
| Series A, Insured: AGC | | |
| (zero coupon), due 9/1/32 | 1,500,000 | 989,293 |
| Series A, Insured: AGC | | |
| (zero coupon), due 9/1/34 | 1,000,000 | 599,641 |
| Series A, Insured: AGC | | |
| (zero coupon), due 9/1/35 | 360,000 | 204,246 |
| Series A, Insured: AGC | | |
| (zero coupon), due 9/1/36 | 470,000 | 249,843 |
| Tobacco Settlement Financing Corp., Revenue Bonds | | |
| Series A | | |
| (zero coupon), due 6/1/52 | 78,620,000 | 11,033,806 |
| | | 18,085,638 |
| South Carolina 0.7% |
| South Carolina Jobs-Economic Development Authority, Bishop Gadsden Episcopal Retirement Community, Revenue Bonds | | |
| Series A | | |
| 4.00%, due 4/1/54 | 1,160,000 | 746,911 |
| Series A | | |
| 5.00%, due 4/1/54 | 3,000,000 | 2,396,497 |
| South Carolina Jobs-Economic Development Authority, Green Charter School Project, Revenue Bonds | | |
| Series A | | |
| 4.00%, due 6/1/56 (c) | 3,530,000 | 2,076,943 |
| South Carolina Jobs-Economic Development Authority, Woodlands at Furman Project, Revenue Bonds | | |
| Series A | | |
| 5.00%, due 11/15/54 | 1,000,000 | 769,536 |
| 5.25%, due 11/15/47 | 5,025,000 | 4,228,741 |
| | Principal
Amount | Value |
| |
| South Carolina (continued) |
| South Carolina Jobs-Economic Development Authority, Woodlands at Furman Project, Revenue Bonds (continued) | | |
| 5.25%, due 11/15/52 | $ 1,625,000 | $ 1,332,259 |
| South Carolina Public Service Authority, Santee Cooper Project, Revenue Bonds | | |
| Series B, Insured: BAM | | |
| 4.00%, due 12/1/46 | 5,710,000 | 4,721,075 |
| Series B, Insured: BAM | | |
| 4.00%, due 12/1/48 | 20,839,000 | 16,956,807 |
| Series B, Insured: BAM | | |
| 4.00%, due 12/1/50 | 4,805,000 | 3,857,972 |
| Series B, Insured: BAM | | |
| 4.00%, due 12/1/54 | 4,932,000 | 3,893,898 |
| Series B, Insured: BAM | | |
| 4.00%, due 12/1/55 | 14,546,000 | 11,457,692 |
| | | 52,438,331 |
| Tennessee 0.6% |
| Chattanooga Health Educational & Housing Facility Board, CommonSpirit Health, Revenue Bonds | | |
| Series A-2 | | |
| 5.00%, due 8/1/44 | 2,640,000 | 2,496,172 |
| Chattanooga-Hamilton County Hospital Authority, Revenue Bonds | | |
| Series A | | |
| 5.00%, due 10/1/44 | 6,200,000 | 5,453,037 |
| Metropolitan Government Nashville & Davidson County Health & Educational Facilities Board, Belmont University, Revenue Bonds | | |
| 4.00%, due 5/1/46 | 2,500,000 | 2,067,454 |
| 4.00%, due 5/1/51 | 13,900,000 | 11,134,815 |
| Metropolitan Government Nashville & Davidson County Health & Educational Facilities Board, Trevecca Nazarene University Project, Revenue Bonds | | |
| Series B | | |
| 4.00%, due 10/1/51 | 4,580,000 | 3,284,330 |
The notes to the financial statements are an integral part of, and should be read in conjunction with, the financial statements.
| 50 | MainStay MacKay High Yield Municipal Bond Fund |
| | Principal
Amount | Value |
| Long-Term Municipal Bonds (continued) |
| Tennessee (continued) |
| Metropolitan Government Nashville & Davidson County Health & Educational Facilities Board, Revenue Bonds | | |
| 5.00%, due 10/1/48 | $ 2,800,000 | $ 2,446,712 |
| Metropolitan Government Nashville & Davidson County Health & Educational Facilities Board, Lipscomb University Project, Revenue Bonds | | |
| Series A | | |
| 5.25%, due 10/1/58 | 8,650,000 | 7,867,285 |
| Tennessee Energy Acquisition Corp., Revenue Bonds | | |
| Series A | | |
| 5.00%, due 5/1/52 (b) | 6,550,000 | 6,457,020 |
| | | 41,206,825 |
| Texas 5.1% |
| Bastrop Independent School District, Unlimited General Obligation | | |
| Insured: PSF-GTD | | |
| 5.00%, due 2/15/53 | 4,750,000 | 4,787,234 |
| Bexar County Health Facilities Development Corp., Army Retirement Residence Foundation Project, Revenue Bonds | | |
| 5.00%, due 7/15/41 | 3,300,000 | 2,702,365 |
| Calhoun County Navigation Industrial Development Authority, Max Midstream Texas LLC Project, Revenue Bonds, Senior Lien (c) | | |
| Series A | | |
| 3.625%, due 7/1/26 (a) | 14,805,000 | 13,418,398 |
| Series B | | |
| 6.50%, due 7/1/26 | 13,700,000 | 12,777,839 |
| Central Texas Regional Mobility Authority, Capital Appreciation, Revenue Bonds | | |
| (zero coupon), due 1/1/33 | 315,000 | 206,867 |
| (zero coupon), due 1/1/34 | 3,275,000 | 2,044,827 |
| (zero coupon), due 1/1/35 | 3,700,000 | 2,185,886 |
| (zero coupon), due 1/1/36 | 2,000,000 | 1,104,948 |
| (zero coupon), due 1/1/39 | 3,500,000 | 1,542,393 |
| Central Texas Regional Mobility Authority, Revenue Bonds | | |
| 4.00%, due 1/1/41 | 6,000,000 | 5,165,957 |
| | Principal
Amount | Value |
| |
| Texas (continued) |
| City of Arlington, Tax Increment Reinvestment Zone No. 5, Tax Allocation | | |
| 4.00%, due 8/15/50 | $ 2,355,000 | $ 1,722,398 |
| City of Houston, Airport System, United Airlines Inc. Project, Revenue Bonds (a) | | |
| Series B-1 | | |
| 4.00%, due 7/15/41 | 4,100,000 | 3,251,847 |
| Series B-1 | | |
| 5.00%, due 7/15/30 | 2,000,000 | 1,916,584 |
| City of Houston, Airport System, Revenue Bonds, Sub. Lien (a) | | |
| Series A | | |
| 4.00%, due 7/1/48 | 6,810,000 | 5,478,794 |
| Series A, Insured: AGM | | |
| 5.25%, due 7/1/53 | 3,500,000 | 3,416,748 |
| City of Lago Vista, Tessera on Lake Travis Public Improvement District Project, Special Assessment | | |
| Series B | | |
| 4.875%, due 9/1/50 (c) | 1,250,000 | 1,035,248 |
| Clifton Higher Education Finance Corp., IDEA Public Schools, Revenue Bonds | | |
| Series A | | |
| 4.00%, due 8/15/47 | 4,030,000 | 3,042,142 |
| 6.00%, due 8/15/43 | 3,250,000 | 3,250,937 |
| Danbury Higher Education Authority, Inc., Golden Rule School, Inc., Revenue Bonds | | |
| Series A | | |
| 4.00%, due 8/15/49 | 1,725,000 | 1,188,660 |
| Decatur Hospital Authority, Wise Regional Health System, Revenue Bonds | | |
| Series A | | |
| 5.25%, due 9/1/44 | 3,250,000 | 2,994,655 |
| Denton Independent School District, Unlimited General Obligation | | |
| Insured: PSF-GTD | | |
| 5.00%, due 8/15/48 | 13,565,000 | 13,805,757 |
| Grand Parkway Transportation Corp., Revenue Bonds, First Tier | | |
| Series C, Insured: AGM-CR | | |
| 4.00%, due 10/1/49 | 72,540,000 | 59,469,409 |
The notes to the financial statements are an integral part of, and should be read in conjunction with, the financial statements.
51
Portfolio of Investments October 31, 2023†^ (continued)
| | Principal
Amount | Value |
| Long-Term Municipal Bonds (continued) |
| Texas (continued) |
| Harris County Cultural Education Facilities Finance Corp., YMCA Greater Houston Area, Revenue Bonds | | |
| Series A | | |
| 5.00%, due 6/1/33 | $ 900,000 | $ 807,164 |
| Series A | | |
| 5.00%, due 6/1/38 | 1,960,000 | 1,608,359 |
| Harris County-Houston Sports Authority, Revenue Bonds, Junior Lien | | |
| Series H, Insured: NATL-RE | | |
| (zero coupon), due 11/15/26 | 65,000 | 56,866 |
| Series H, Insured: NATL-RE | | |
| (zero coupon), due 11/15/26 | 535,000 | 459,974 |
| Series H, Insured: NATL-RE | | |
| (zero coupon), due 11/15/29 | 10,000 | 7,683 |
| Series H, Insured: NATL-RE | | |
| (zero coupon), due 11/15/29 | 725,000 | 531,648 |
| Series H, Insured: NATL-RE | | |
| (zero coupon), due 11/15/32 | 250,000 | 152,505 |
| Series H, Insured: NATL-RE | | |
| (zero coupon), due 11/15/33 | 185,000 | 105,355 |
| Series H, Insured: NATL-RE | | |
| (zero coupon), due 11/15/38 | 1,395,000 | 555,748 |
| Series H, Insured: NATL-RE | | |
| (zero coupon), due 11/15/39 | 1,525,000 | 566,754 |
| Series H, Insured: NATL-RE | | |
| (zero coupon), due 11/15/40 | 1,855,000 | 640,218 |
| Series H, Insured: NATL-RE | | |
| (zero coupon), due 11/15/41 | 700,000 | 224,835 |
| Harris County-Houston Sports Authority, Revenue Bonds, Third Lien | | |
| Series A-3, Insured: NATL-RE | | |
| (zero coupon), due 11/15/32 | 1,670,000 | 983,997 |
| Series A-3, Insured: NATL-RE | | |
| (zero coupon), due 11/15/33 | 890,000 | 491,597 |
| Series A-3, Insured: NATL-RE | | |
| (zero coupon), due 11/15/34 | 220,000 | 117,208 |
| Series A-3, Insured: NATL-RE | | |
| (zero coupon), due 11/15/34 | 2,320,000 | 1,197,963 |
| Harris County-Houston Sports Authority, Revenue Bonds, Senior Lien | | |
| Series A, Insured: AGM NATL-RE | | |
| (zero coupon), due 11/15/34 | 2,035,000 | 1,115,296 |
| | Principal
Amount | Value |
| |
| Texas (continued) |
| Harris County-Houston Sports Authority, Revenue Bonds, Senior Lien (continued) | | |
| Series A, Insured: AGM NATL-RE | | |
| (zero coupon), due 11/15/38 | $ 35,615,000 | $ 14,701,345 |
| Series A, Insured: AGM NATL-RE | | |
| (zero coupon), due 11/15/40 | 1,310,000 | 472,064 |
| Hemphill County Hospital District, Limited General Obligation | | |
| 4.625%, due 2/1/39 | 2,765,000 | 2,306,185 |
| Montgomery County Toll Road Authority, Revenue Bonds, Senior Lien | | |
| 5.00%, due 9/15/48 | 2,500,000 | 2,232,168 |
| New Hope Cultural Education Facilities Finance Corp., Jubilee Academic Center, Inc., Revenue Bonds (c) | | |
| 4.00%, due 8/15/36 | 1,000,000 | 808,399 |
| 4.00%, due 8/15/41 | 6,315,000 | 4,626,606 |
| 4.00%, due 8/15/46 | 880,000 | 604,229 |
| 4.00%, due 8/15/56 | 6,900,000 | 4,367,002 |
| New Hope Cultural Education Facilities Finance Corp., CHF-Collegiate Housing Denton LLC, Revenue Bonds | | |
| Series B-1, Insured: AGM | | |
| 4.00%, due 7/1/48 | 1,000,000 | 785,277 |
| New Hope Cultural Education Facilities Finance Corp., Westminster Project, Revenue Bonds | | |
| 4.00%, due 11/1/49 | 1,600,000 | 1,171,309 |
| New Hope Cultural Education Facilities Finance Corp., Quality Senior Housing Foundation of East Texas, Inc., Revenue Bonds | | |
| Series A-1 | | |
| 4.00%, due 12/1/54 | 555,000 | 361,198 |
| Series A-1 | | |
| 5.00%, due 12/1/54 | 2,770,000 | 2,255,775 |
| New Hope Cultural Education Facilities Finance Corp., Cumberland Academy, Inc., Revenue Bonds (c) | | |
| Series A | | |
| 5.00%, due 8/15/40 | 3,950,000 | 3,360,348 |
The notes to the financial statements are an integral part of, and should be read in conjunction with, the financial statements.
| 52 | MainStay MacKay High Yield Municipal Bond Fund |
| | Principal
Amount | Value |
| Long-Term Municipal Bonds (continued) |
| Texas (continued) |
| New Hope Cultural Education Facilities Finance Corp., Cumberland Academy, Inc., Revenue Bonds (c) (continued) | | |
| Series A | | |
| 5.00%, due 8/15/50 | $ 750,000 | $ 589,870 |
| New Hope Cultural Education Facilities Finance Corp., Southwest Preparatory School, Revenue Bonds | | |
| Series A | | |
| 5.00%, due 8/15/50 (c) | 3,880,000 | 2,946,561 |
| New Hope Cultural Education Facilities Finance Corp., Wesleyan Homes, Inc., Project, Revenue Bonds | | |
| 5.00%, due 1/1/55 | 1,500,000 | 977,688 |
| New Hope Cultural Education Facilities Finance Corp., Legacy at Midtown Park Project, Revenue Bonds | | |
| Series A | | |
| 5.50%, due 7/1/54 | 2,500,000 | 1,763,308 |
| North Texas Tollway Authority, Revenue Bonds, Second Tier | | |
| Series B, Insured: BAM | | |
| 3.00%, due 1/1/46 | 17,800,000 | 12,474,436 |
| 5.00%, due 1/1/50 | 1,750,000 | 1,736,761 |
| Port Freeport, Revenue Bonds, Senior Lien | | |
| 4.00%, due 6/1/51 (a) | 4,035,000 | 2,868,198 |
| Port of Port Arthur Navigation District, Port Improvement, Unlimited General Obligation | | |
| 4.00%, due 3/1/47 (a) | 4,200,000 | 3,405,880 |
| Reagan Hospital District of Reagan County, Limited General Obligation | | |
| Series A | | |
| 5.125%, due 2/1/39 | 1,400,000 | 1,317,575 |
| Red River Education Finance Corp., Houston Baptist University Project, Revenue Bonds | | |
| 5.50%, due 10/1/46 | 5,950,000 | 5,694,893 |
| | Principal
Amount | Value |
| |
| Texas (continued) |
| San Antonio Education Facilities Corp., University of the Incarnate Word, Revenue Bonds | | |
| Series A | | |
| 4.00%, due 4/1/51 | $ 4,000,000 | $ 2,868,016 |
| Tarrant County Cultural Education Facilities Finance Corp., Barton Creek Senior Living Center Project, Revenue Bonds | | |
| 5.00%, due 11/15/40 | 1,350,000 | 1,156,872 |
| Tarrant County Cultural Education Facilities Finance Corp., Buckner Retirement Services, Revenue Bonds | | |
| Series B | | |
| 5.00%, due 11/15/40 | 1,250,000 | 1,123,514 |
| Tarrant County Cultural Education Facilities Finance Corp., Buckner Retirement Services, Inc. Project, Revenue Bonds | | |
| 5.00%, due 11/15/46 | 3,025,000 | 2,602,273 |
| Texas Municipal Gas Acquisition & Supply Corp. II, Revenue Bonds | | |
| Series C | | |
| 4.433%, due 9/15/27 | 35,655,000 | 34,876,537 |
| Texas Private Activity Bond Surface Transportation Corp., North Tarrant Express Managed Lanes Project, Revenue Bonds, Senior Lien | | |
| Series A | | |
| 4.00%, due 12/31/37 | 2,120,000 | 1,880,094 |
| Series A | | |
| 4.00%, due 12/31/38 | 2,745,000 | 2,402,755 |
| Series A | | |
| 4.00%, due 12/31/39 | 4,385,000 | 3,806,576 |
| 5.50%, due 12/31/58 (a) | 23,935,000 | 24,078,562 |
| Texas Private Activity Bond Surface Transportation Corp., Blueridge Transportation Group LLC, Revenue Bonds, Senior Lien | | |
| 5.00%, due 12/31/55 (a) | 9,990,000 | 8,750,008 |
| Texas Private Activity Bond Surface Transportation Corp., NTE Mobility Partners Segments 3 LLC, Revenue Bonds, Senior Lien (a) | | |
| 5.00%, due 6/30/58 | 25,855,000 | 23,675,049 |
| 6.75%, due 6/30/43 | 11,250,000 | 11,264,983 |
The notes to the financial statements are an integral part of, and should be read in conjunction with, the financial statements.
53
Portfolio of Investments October 31, 2023†^ (continued)
| | Principal
Amount | Value |
| Long-Term Municipal Bonds (continued) |
| Texas (continued) |
| Texas Transportation Commission, State Highway 249, Revenue Bonds, First Tier | | |
| Series A | | |
| (zero coupon), due 8/1/43 | $ 3,750,000 | $ 1,155,305 |
| Series A | | |
| (zero coupon), due 8/1/44 | 4,200,000 | 1,209,774 |
| Texas Water Development Board, State Water Implementation Fund, Revenue Bonds | | |
| Series A | | |
| 5.00%, due 10/15/58 | 11,000,000 | 11,049,898 |
| Tomball Independent School District, Unlimited General Obligation | | |
| Insured: PSF-GTD | | |
| 5.00%, due 2/15/48 | 6,185,000 | 6,237,918 |
| | | 366,098,272 |
| U.S. Virgin Islands 2.8% |
| Matching Fund Special Purpose Securitization Corp., Revenue Bonds | | |
| Series A | | |
| 5.00%, due 10/1/30 | 23,765,000 | 23,523,768 |
| Series A | | |
| 5.00%, due 10/1/32 | 37,995,000 | 37,360,476 |
| Series A | | |
| 5.00%, due 10/1/39 | 104,875,000 | 99,462,999 |
| Virgin Islands Public Finance Authority, Gross Receipts Taxes Loan, Revenue Bonds | | |
| Series C | | |
| 5.00%, due 10/1/30 (c) | 16,670,000 | 15,281,054 |
| Series A | | |
| 5.00%, due 10/1/32 | 14,100,000 | 12,516,918 |
| Series A | | |
| 5.00%, due 10/1/34 (c) | 2,600,000 | 2,237,029 |
| Series C | | |
| 5.00%, due 10/1/39 (c) | 9,310,000 | 7,527,853 |
| | | 197,910,097 |
| Utah 1.6% |
| Black Desert Public Infrastructure District, Limited General Obligation (c) | | |
| Series A | | |
| 3.75%, due 3/1/41 | 410,000 | 302,917 |
| | Principal
Amount | Value |
| |
| Utah (continued) |
| Black Desert Public Infrastructure District, Limited General Obligation (c) (continued) | | |
| Series A | | |
| 4.00%, due 3/1/51 | $ 2,725,000 | $ 1,848,767 |
| City of Salt Lake City, Airport, Revenue Bonds (a) | | |
| Series A | | |
| 5.00%, due 7/1/51 | 8,450,000 | 7,911,583 |
| Series A | | |
| 5.25%, due 7/1/48 | 25,750,000 | 25,293,867 |
| Series A | | |
| 5.25%, due 7/1/53 | 1,750,000 | 1,710,902 |
| Series A | | |
| 5.50%, due 7/1/53 | 1,760,000 | 1,770,155 |
| Mida Golf and Equestrian Center Public Infrastructure District, Limited General Obligation (c) | | |
| 4.50%, due 6/1/51 | 8,500,000 | 5,508,349 |
| 4.625%, due 6/1/57 | 2,000,000 | 1,277,161 |
| Mida Mountain Village Public Infrastructure District, Assessment Area No. 2, Special Assessment | | |
| 4.00%, due 8/1/50 (c) | 2,000,000 | 1,377,644 |
| Mida Mountain Village Public Infrastructure District, Special Assessment (c) | | |
| Series A | | |
| 4.50%, due 8/1/40 | 1,500,000 | 1,209,239 |
| Series A | | |
| 5.00%, due 8/1/50 | 5,000,000 | 3,943,426 |
| Military Installation Development Authority, Revenue Bonds | | |
| Series A-1 | | |
| 4.00%, due 6/1/36 | 4,000,000 | 3,164,397 |
| Series A-1 | | |
| 4.00%, due 6/1/41 | 2,430,000 | 1,790,581 |
| Series A-1 | | |
| 4.00%, due 6/1/52 | 14,425,000 | 9,684,851 |
| UIPA Crossroads Public Infrastructure District, Tax Allocation | | |
| 4.375%, due 6/1/52 (c) | 5,500,000 | 4,291,359 |
The notes to the financial statements are an integral part of, and should be read in conjunction with, the financial statements.
| 54 | MainStay MacKay High Yield Municipal Bond Fund |
| | Principal
Amount | Value |
| Long-Term Municipal Bonds (continued) |
| Utah (continued) |
| Utah Charter School Finance Authority, Spectrum Academy Project, Revenue Bonds | | |
| Insured: BAM UT CSCE | | |
| 4.00%, due 4/15/45 | $ 2,975,000 | $ 2,424,797 |
| Insured: BAM UT CSCE | | |
| 4.00%, due 4/15/50 | 3,395,000 | 2,652,173 |
| Utah Charter School Finance Authority, North Star Academy Project, Revenue Bonds | | |
| Series A, Insured: UT CSCE | | |
| 4.00%, due 4/15/45 | 2,020,000 | 1,590,386 |
| Utah Charter School Finance Authority, Vista School, Revenue Bonds | | |
| Series 2020A, Insured: UT CSCE | | |
| 4.00%, due 10/15/45 | 1,870,000 | 1,467,598 |
| Series 2020A, Insured: UT CSCE | | |
| 4.00%, due 10/15/54 | 4,700,000 | 3,446,361 |
| Utah Charter School Finance Authority, Providence Hall Project, Revenue Bonds | | |
| Series A, Insured: BAM UT CSCE | | |
| 4.00%, due 10/15/51 | 3,000,000 | 2,316,045 |
| Utah Infrastructure Agency, Telecommunication, Revenue Bonds | | |
| 3.00%, due 10/15/45 | 4,425,000 | 2,669,067 |
| 4.00%, due 10/15/42 | 3,970,000 | 3,021,427 |
| Series A | | |
| 5.00%, due 10/15/32 | 1,615,000 | 1,608,077 |
| Series A | | |
| 5.00%, due 10/15/34 | 3,085,000 | 3,037,965 |
| Series A | | |
| 5.00%, due 10/15/37 | 1,100,000 | 1,028,087 |
| Series A | | |
| 5.00%, due 10/15/40 | 3,780,000 | 3,417,285 |
| 5.00%, due 10/15/46 | 3,400,000 | 2,918,183 |
| Series A | | |
| 5.375%, due 10/15/40 | 5,910,000 | 5,620,798 |
| 5.625%, due 10/15/38 | 2,530,000 | 2,526,634 |
| 6.00%, due 10/15/47 | 6,350,000 | 6,365,653 |
| | | 117,195,734 |
| | Principal
Amount | Value |
| |
| Vermont 0.1% |
| Vermont Economic Development Authority, Wake Robin Corp. Project, Revenue Bonds | | |
| Series A | | |
| 4.00%, due 5/1/45 | $ 2,350,000 | $ 1,694,054 |
| Vermont Student Assistance Corp., Education Loan, Revenue Bonds | | |
| Series B | | |
| 4.50%, due 6/15/45 (a) | 3,500,000 | 2,661,124 |
| | | 4,355,178 |
| Virginia 2.0% |
| Farmville Industrial Development Authority, Longwood University Student Project, Revenue Bonds | | |
| Series A | | |
| 5.00%, due 1/1/48 | 6,700,000 | 5,603,955 |
| Series A | | |
| 5.00%, due 1/1/55 | 16,100,000 | 13,052,837 |
| Farmville Industrial Development Authority, Longwood University Student Housing Project, Revenue Bonds | | |
| Series A | | |
| 5.00%, due 1/1/59 | 7,255,000 | 5,790,003 |
| Henrico County Economic Development Authority, LifeSpire of Virginia, Residential Care Facility, Revenue Bonds | | |
| Series C | | |
| 5.00%, due 12/1/47 | 2,200,000 | 1,944,466 |
| James City County Economic Development Authority, Williamsburg Landing, Inc., Revenue Bonds | | |
| Series A | | |
| 4.00%, due 12/1/50 | 3,235,000 | 2,242,028 |
| Lynchburg Economic Development Authority, Randolph College Project, Revenue Bonds | | |
| 5.00%, due 9/1/48 | 3,455,000 | 3,043,920 |
| Newport News Economic Development Authority, LifeSpire of Virginia Obligated Group, Revenue Bonds | | |
| 5.00%, due 12/1/38 | 2,575,000 | 2,426,446 |
The notes to the financial statements are an integral part of, and should be read in conjunction with, the financial statements.
55
Portfolio of Investments October 31, 2023†^ (continued)
| | Principal
Amount | Value |
| Long-Term Municipal Bonds (continued) |
| Virginia (continued) |
| Roanoke Economic Development Authority, Lynchburg College, Revenue Bonds | | |
| Series A | | |
| 4.00%, due 9/1/48 | $ 4,590,000 | $ 3,417,003 |
| Salem Economic Development Authority, Educational Facilities, Roanoke College, Revenue Bonds | | |
| 4.00%, due 4/1/45 | 865,000 | 665,233 |
| 5.00%, due 4/1/49 | 1,000,000 | 883,474 |
| Tobacco Settlement Financing Corp., Tobacco Settlement Asset-Backed, Revenue Bonds | | |
| Series 2007A-1 | | |
| 6.706%, due 6/1/46 | 30,880,000 | 24,959,674 |
| Virginia College Building Authority, Regent University Project, Revenue Bonds | | |
| 3.00%, due 6/1/41 | 4,275,000 | 2,945,334 |
| Virginia College Building Authority, Marymount University Project, Green Bond, Revenue Bonds | | |
| Series B | | |
| 5.00%, due 7/1/45 (c) | 1,945,000 | 1,666,605 |
| Virginia Small Business Financing Authority, 95 Express Lanes LLC, Revenue Bonds, Senior Lien (a) | | |
| 4.00%, due 7/1/39 | 1,380,000 | 1,180,380 |
| 4.00%, due 1/1/48 | 20,170,000 | 16,081,890 |
| 5.00%, due 1/1/36 | 1,345,000 | 1,349,567 |
| 5.00%, due 1/1/38 | 3,000,000 | 2,905,705 |
| Virginia Small Business Financing Authority, National Senior Campuses, Inc., Revenue Bonds | | |
| Series A | | |
| 4.00%, due 1/1/45 | 2,510,000 | 2,006,049 |
| Virginia Small Business Financing Authority, National Senior Campuses Inc. Obligated Group, Revenue Bonds | | |
| Series A | | |
| 4.00%, due 1/1/51 | 11,840,000 | 8,984,489 |
| Virginia Small Business Financing Authority, Transform 66 P3 Project, Revenue Bonds, Senior Lien (a) | | |
| 5.00%, due 12/31/52 | 9,750,000 | 9,045,046 |
| | Principal
Amount | Value |
| |
| Virginia (continued) |
| Virginia Small Business Financing Authority, Transform 66 P3 Project, Revenue Bonds, Senior Lien (a) (continued) | | |
| 5.00%, due 12/31/56 | $ 18,375,000 | $ 16,849,032 |
| Virginia Small Business Financing Authority, I-495 Hot Lanes Project, Revenue Bonds, Senior Lien | | |
| 5.00%, due 12/31/52 (a) | 18,415,000 | 17,186,243 |
| | | 144,229,379 |
| Washington 1.4% |
| Grant County Public Hospital District No. 1, Unlimited General Obligation | | |
| 5.125%, due 12/1/48 | 3,945,000 | 3,576,208 |
| 5.125%, due 12/1/52 | 2,550,000 | 2,273,372 |
| Pend Oreille County Public Utility District No. 1 Box Canyon, Revenue Bonds | | |
| 4.00%, due 1/1/41 | 3,000,000 | 2,461,248 |
| Pend Oreille County Public Utility District No. 1 Box Canyon, Green Bond, Revenue Bonds | | |
| 5.00%, due 1/1/48 | 5,130,000 | 4,680,413 |
| Port of Seattle, Revenue Bonds | | |
| Series B | | |
| 5.00%, due 8/1/47 (a) | 5,800,000 | 5,505,874 |
| Port of Seattle Industrial Development Corp., Delta Air Lines, Inc., Revenue Bonds | | |
| 5.00%, due 4/1/30 (a) | 1,825,000 | 1,783,856 |
| Washington Economic Development Finance Authority, North Pacific Paper Co. Recycling Project, Green Bond, Revenue Bonds | | |
| Series A | | |
| 5.625%, due 12/1/40 (a)(c) | 4,000,000 | 3,611,334 |
| Washington Health Care Facilities Authority, CommonSpirit Health, Revenue Bonds | | |
| Series A-2 | | |
| 5.00%, due 8/1/44 | 8,685,000 | 8,211,839 |
| Washington Higher Education Facilities Authority, Whitworth University Project, Revenue Bonds | | |
| 4.00%, due 10/1/38 | 1,665,000 | 1,413,325 |
The notes to the financial statements are an integral part of, and should be read in conjunction with, the financial statements.
| 56 | MainStay MacKay High Yield Municipal Bond Fund |
| | Principal
Amount | Value |
| Long-Term Municipal Bonds (continued) |
| Washington (continued) |
Washington Higher Education Facilities Authority, Whitworth University Project, Revenue Bonds
(continued) | | |
| Series A | | |
| 5.00%, due 10/1/40 | $ 3,000,000 | $ 2,831,940 |
| Washington Higher Education Facilities Authority, Seattle Pacific University Project, Revenue Bonds | | |
| Series A | | |
| 5.00%, due 10/1/45 | 3,130,000 | 2,728,382 |
| Washington State Convention Center Public Facilities District, Lodging Tax, Revenue Bonds | | |
| Series B | | |
| 3.00%, due 7/1/43 | 5,565,000 | 3,852,060 |
| Series B | | |
| 3.00%, due 7/1/48 | 2,465,000 | 1,570,099 |
| Series B | | |
| 3.00%, due 7/1/58 | 13,510,000 | 7,844,097 |
| Series B | | |
| 3.00%, due 7/1/58 | 4,000,000 | 2,272,092 |
| Series B | | |
| 3.00%, due 7/1/58 | 8,875,000 | 5,041,204 |
| 4.00%, due 7/1/58 | 8,810,000 | 6,640,249 |
| Series B | | |
| 4.00%, due 7/1/58 | 1,750,000 | 1,327,609 |
| 5.00%, due 7/1/58 | 9,750,000 | 9,024,345 |
| Series A | | |
| 5.00%, due 7/1/58 | 5,615,000 | 5,197,097 |
| Washington State Housing Finance Commission, Eliseo Project, Revenue Bonds (c) | | |
| Series A | | |
| 4.00%, due 1/1/41 | 4,520,000 | 3,282,210 |
| Series A | | |
| 4.00%, due 1/1/51 | 1,700,000 | 1,085,177 |
| Series A | | |
| 4.00%, due 1/1/57 | 7,785,000 | 4,748,130 |
| Washington State Housing Finance Commission, Riverview Retirement Community, Revenue Bonds | | |
| 5.00%, due 1/1/48 | 3,000,000 | 2,381,328 |
| | Principal
Amount | Value |
| |
| Washington (continued) |
| Whidbey Island Public Hospital District, Whidbey General Hospital, Limited General Obligation | | |
| 3.75%, due 12/1/32 | $ 100,000 | $ 77,812 |
| 4.00%, due 12/1/37 | 290,000 | 208,680 |
| Whidbey Island Public Hospital District, Unlimited General Obligation | | |
| 5.375%, due 12/1/39 | 9,520,000 | 7,632,404 |
| 5.50%, due 12/1/33 | 2,070,000 | 1,849,366 |
| | | 103,111,750 |
| West Virginia 0.4% |
| County of Monongalia, Development District No. 4 University Town Center, Tax Allocation | | |
| Series A | | |
| 6.00%, due 6/1/53 (c) | 3,000,000 | 3,027,438 |
| County of Ohio, Special District Excise Tax, The Highlands Project, Revenue Bonds | | |
| Series B | | |
| 4.25%, due 3/1/35 | 4,000,000 | 3,549,652 |
| Glenville State College, Board of Governors, Revenue Bonds | | |
| 5.25%, due 6/1/47 | 3,750,000 | 3,023,042 |
| Monongalia County Commission Excise Tax District, University Town Centre, Revenue Bonds | | |
| Series A | | |
| 4.125%, due 6/1/43 (c) | 950,000 | 783,606 |
| Monongalia County Commission Excise Tax District, University Town Center, Revenue Bonds | | |
| Series A | | |
| 5.50%, due 6/1/37 (c) | 4,000,000 | 4,010,896 |
| West Virginia Hospital Finance Authority, Cabell Huntington Hospital Obligated Group, Revenue Bonds | | |
| Series A, Insured: AGM-CR | | |
| 4.00%, due 1/1/37 | 4,825,000 | 4,188,319 |
| Series A, Insured: AGM-CR | | |
| 4.00%, due 1/1/38 | 2,500,000 | 2,110,517 |
| Series A, Insured: AGM-CR | | |
| 4.125%, due 1/1/47 | 13,200,000 | 10,074,705 |
| | | 30,768,175 |
The notes to the financial statements are an integral part of, and should be read in conjunction with, the financial statements.
57
Portfolio of Investments October 31, 2023†^ (continued)
| | Principal
Amount | Value |
| Long-Term Municipal Bonds (continued) |
| Wisconsin 2.5% |
| Public Finance Authority, Wonderful Foundations Charter School, Revenue Bonds (c) | | |
| Series B | | |
| (zero coupon), due 1/1/60 | $ 70,900,000 | $ 3,115,786 |
| Series A-1 | | |
| 5.00%, due 1/1/55 | 18,765,000 | 13,138,651 |
| Public Finance Authority, Methodist University, Inc. (The), Revenue Bonds (c) | | |
| 4.00%, due 3/1/26 | 755,000 | 720,513 |
| 4.00%, due 3/1/30 | 950,000 | 847,377 |
| Public Finance Authority, North Carolina Leadership Charter Academy, Inc., Revenue Bonds | | |
| Series A | | |
| 4.00%, due 6/15/29 (c) | 235,000 | 214,841 |
| Public Finance Authority, National Gypsum Co., Revenue Bonds | | |
| 4.00%, due 8/1/35 (a) | 4,000,000 | 3,287,748 |
| Public Finance Authority, Roseman University of Health Sciences, Revenue Bonds | | |
| 4.00%, due 4/1/42 (c) | 900,000 | 690,111 |
| 4.00%, due 4/1/42 (c) | 100,000 | 102,014 |
| 4.00%, due 4/1/52 (c) | 3,000,000 | 2,071,599 |
| 5.00%, due 4/1/30 (c) | 100,000 | 104,558 |
| 5.00%, due 4/1/30 (c) | 600,000 | 590,612 |
| 5.00%, due 4/1/40 (c) | 300,000 | 271,549 |
| 5.00%, due 4/1/50 (c) | 100,000 | 106,728 |
| 5.00%, due 4/1/50 (c) | 1,400,000 | 1,176,608 |
| 5.875%, due 4/1/45 | 6,250,000 | 6,068,216 |
| Public Finance Authority, Fellowship Senior Living Project, Revenue Bonds | | |
| Series A | | |
| 4.00%, due 1/1/46 | 11,260,000 | 7,915,964 |
| Series A | | |
| 4.00%, due 1/1/52 | 3,130,000 | 2,085,947 |
| Public Finance Authority, Appalachian State University Project, Revenue Bonds | | |
| Series A, Insured: AGM | | |
| 4.00%, due 7/1/50 | 1,000,000 | 790,936 |
| Series A, Insured: AGM | | |
| 4.00%, due 7/1/55 | 1,250,000 | 968,927 |
| | Principal
Amount | Value |
| |
| Wisconsin (continued) |
Public Finance Authority, Appalachian State University Project, Revenue Bonds
(continued) | | |
| Series A, Insured: AGM | | |
| 4.00%, due 7/1/59 | $ 775,000 | $ 605,994 |
| Public Finance Authority, UNC Health Southeastern, Revenue Bonds | | |
| Series A | | |
| 4.00%, due 2/1/51 | 3,970,000 | 2,526,489 |
| Public Finance Authority, Fargo-Moorhead Metropolitan Area Flood Risk Management Project, Revenue Bonds (a) | | |
| 4.00%, due 9/30/51 | 13,995,000 | 10,109,304 |
| 4.00%, due 3/31/56 | 8,965,000 | 6,269,116 |
| Public Finance Authority, College Achieve Paterson Charter School Project, Revenue Bonds | | |
| Series A | | |
| 4.00%, due 6/15/52 (c) | 1,565,000 | 1,043,044 |
| Public Finance Authority, Appalachian Regional Healthcare System Obligated Group, Revenue Bonds | | |
| Series A | | |
| 4.00%, due 7/1/56 | 2,250,000 | 1,491,247 |
| Public Finance Authority, Givens Estates, Revenue Bonds | | |
| 4.00%, due 12/1/56 | 4,500,000 | 3,162,190 |
| Public Finance Authority, Ultimate Medical Academy Project, Revenue Bonds (c) | | |
| Series A | | |
| 5.00%, due 10/1/24 | 2,200,000 | 2,190,798 |
| Series A | | |
| 5.00%, due 10/1/28 | 1,000,000 | 984,580 |
| Series A | | |
| 5.00%, due 10/1/29 | 2,000,000 | 1,957,884 |
| Series A | | |
| 5.00%, due 10/1/34 | 1,090,000 | 1,045,667 |
| Series A | | |
| 5.00%, due 10/1/39 | 16,300,000 | 14,658,297 |
| Public Finance Authority, Bancroft NeuroHealth Project, Revenue Bonds | | |
| Series A | | |
| 5.00%, due 6/1/36 (c) | 750,000 | 656,042 |
The notes to the financial statements are an integral part of, and should be read in conjunction with, the financial statements.
| 58 | MainStay MacKay High Yield Municipal Bond Fund |
| | Principal
Amount | Value |
| Long-Term Municipal Bonds (continued) |
| Wisconsin (continued) |
| Public Finance Authority, Carmelite System, Inc. Obligated Group (The), Revenue Bonds | | |
| 5.00%, due 1/1/40 | $ 6,535,000 | $ 5,876,566 |
| 5.00%, due 1/1/45 | 560,000 | 486,084 |
| Public Finance Authority, NC A&T Real Estate Foundation LLC Project, Revenue Bonds | | |
| Series A | | |
| 5.00%, due 6/1/44 | 1,350,000 | 1,204,756 |
| Series A | | |
| 5.00%, due 6/1/49 | 6,775,000 | 5,854,798 |
| Series B | | |
| 5.00%, due 6/1/49 | 2,720,000 | 2,350,561 |
| Public Finance Authority, Guilford College, Revenue Bonds | | |
| Series A | | |
| 5.00%, due 1/1/48 | 1,950,000 | 1,599,847 |
| 5.50%, due 1/1/47 | 5,860,000 | 5,222,826 |
| Public Finance Authority, Coral Academy of Science Las Vegas, Revenue Bonds | | |
| Series A | | |
| 5.00%, due 7/1/48 | 2,000,000 | 1,654,245 |
| Public Finance Authority, Wilson Preparatory Academy, Revenue Bonds | | |
| Series A | | |
| 5.00%, due 6/15/49 (c) | 1,100,000 | 902,445 |
| Public Finance Authority, College Achieve Central Charter School, Revenue Bonds | | |
| Series A | | |
| 5.00%, due 6/15/51 (c) | 2,145,000 | 1,713,648 |
| Public Finance Authority, Grand Hyatt San Antonio Hotel Acquisition Project, Revenue Bonds, Senior Lien | | |
| Series A | | |
| 5.00%, due 2/1/52 | 4,000,000 | 3,478,284 |
| Public Finance Authority, The Franklin School Of Innovation, Inc., Revenue Bonds | | |
| 5.00%, due 1/1/57 (c) | 3,200,000 | 2,370,706 |
| | Principal
Amount | Value |
| |
| Wisconsin (continued) |
| Public Finance Authority, Nevada State College, Revenue Bonds (c) | | |
| Series A | | �� |
| 5.00%, due 5/1/60 | $ 6,500,000 | $ 5,122,960 |
| Series B | | |
| 9.00%, due 5/1/71 | 2,985,000 | 2,911,624 |
| Public Finance Authority, Wingate University, Revenue Bonds | | |
| Series A | | |
| 5.25%, due 10/1/38 | 3,250,000 | 2,985,377 |
| Public Finance Authority, CHF-Cullowhee, LLC - Western Carolina University Project, Revenue Bonds | | |
| Series A | | |
| 5.25%, due 7/1/47 | 2,000,000 | 1,741,085 |
| Public Finance Authority, CHF - Manoa LLC, Revenue Bonds, Senior Lien (c) | | |
| Series A | | |
| 5.75%, due 7/1/53 | 3,950,000 | 3,787,186 |
| Series A | | |
| 5.75%, due 7/1/63 | 20,150,000 | 18,927,796 |
| Public Finance Authority, Lake Erie College Project, Revenue Bonds | | |
| Series A | | |
| 5.875%, due 10/1/54 (c) | 2,000,000 | 1,464,500 |
| Public Finance Authority, Irving Convention Center Hotel Project, Revenue Bonds | | |
| Series A-2 | | |
| 7.00%, due 1/1/50 (c) | 12,440,000 | 12,666,789 |
| Wisconsin Health & Educational Facilities Authority, St. Camillus Health System, Inc., Revenue Bonds | | |
| Series B-2 | | |
| 2.55%, due 11/1/27 | 85,000 | 84,972 |
| Wisconsin Health & Educational Facilities Authority, HOPE Christian Schools, Revenue Bonds | | |
| 3.00%, due 12/1/31 | 560,000 | 445,881 |
| Wisconsin Health & Educational Facilities Authority, Children's Hospital of Wisconsin Obligated Group, Revenue Bonds | | |
| 3.00%, due 8/15/52 | 2,000,000 | 1,238,828 |
The notes to the financial statements are an integral part of, and should be read in conjunction with, the financial statements.
59
Portfolio of Investments October 31, 2023†^ (continued)
| | Principal
Amount | Value |
| Long-Term Municipal Bonds (continued) |
| Wisconsin (continued) |
| Wisconsin Health & Educational Facilities Authority, Sauk-Prairie Memorial Hospital Inc. Obligated Group, Revenue Bonds | | |
| Series A | | |
| 5.375%, due 2/1/48 | $ 3,200,000 | $ 2,730,505 |
| | | 177,791,606 |
| Wyoming 0.2% |
| Sublette County Hospital District, Hospital Construction Project, Revenue Bonds | | |
| Series A | | |
| 5.00%, due 6/15/26 | 11,933,000 | 11,696,781 |
Total Long-Term Municipal Bonds
(Cost $7,851,110,136) | | 6,816,643,181 |
| Short-Term Municipal Notes 3.0% |
| Alabama 0.4% |
| Walker County Economic & Industrial Development Authority, Alabama Power Co., Revenue Bonds, First Series | | |
| Series 1 | | |
| 4.25%, due 8/1/63 (a)(h) | 31,125,000 | 31,125,000 |
| Arkansas 0.2% |
| Arkansas Development Finance Authority, Baptist Memorial Health Care, Revenue Bonds | | |
| Series B-4 | | |
| 5.43%, due 9/1/44 (h) | 11,730,000 | 11,730,000 |
| California 0.2% |
| Tender Option Bond Trust Receipts, Revenue Bonds (c)(h) | | |
| 4.30%, due 4/1/43 | 5,540,000 | 5,540,000 |
| 4.30%, due 4/1/43 | 4,777,000 | 4,777,000 |
| 4.30%, due 4/1/43 | 3,300,000 | 3,300,000 |
| | | 13,617,000 |
| Colorado 0.5% |
| Rib Floater Trust Various States, Revenue Bonds | | |
| 4.39%, due 2/1/46 (c)(h) | 37,575,000 | 37,575,000 |
| | Principal
Amount | Value |
| |
| District of Columbia 0.2% |
| Tender Option Bond Trust Receipts, Revenue Bonds | | |
| 4.30%, due 7/1/63 (c)(h) | $ 10,470,000 | $ 10,470,000 |
| Florida 0.0% ‡ |
| City of Orlando, Tourist Development Tax, Revenue Bonds, Third Lien | | |
| Series C, Insured: AGC | | |
| 5.50%, due 11/1/38 (h) | 230,000 | 230,000 |
| Georgia 1.2% |
| Bartow-Cartersville Joint Development Authority, Hanwha Q Cells USA, Inc., Revenue Bonds | | |
| Series A | | |
| 4.45%, due 8/1/33 (a)(c)(h) | 73,100,000 | 73,100,000 |
| Development Authority of Appling County, Georgia Power Co., Revenue Bonds | | |
| Series 1 | | |
| 4.30%, due 9/1/41 (h) | 15,250,000 | 15,250,000 |
| | | 88,350,000 |
| New York 0.3% |
| City of New York, Unlimited General Obligation | | |
| Series E | | |
| 3.95%, due 3/1/48 (h) | 17,335,000 | 17,335,000 |
| New York City Municipal Water Finance Authority, Water & Sewer System Second General Resolution, Revenue Bonds | | |
| Series CC | | |
| 3.95%, due 6/15/41 (h) | 4,000,000 | 4,000,000 |
| | | 21,335,000 |
| Ohio 0.0% ‡ |
| Ohio Higher Educational Facility Commission, Cleveland Clinic Health System, Revenue Bonds | | |
| Series B-4 | | |
| 3.97%, due 1/1/43 (h) | 2,985,000 | 2,985,000 |
Total Short-Term Municipal Notes
(Cost $217,417,000) | | 217,417,000 |
Total Municipal Bonds
(Cost $8,068,527,136) | | 7,034,060,181 |
| |
The notes to the financial statements are an integral part of, and should be read in conjunction with, the financial statements.
| 60 | MainStay MacKay High Yield Municipal Bond Fund |
| | Principal
Amount | Value |
| Long-Term Bonds 0.2% |
| Corporate Bonds 0.2% |
| Commercial Services 0.1% |
| Howard University | | |
| Series 21A | | |
| 4.756%, due 10/1/51 | $ 5,200,000 | $ 3,847,901 |
| Wildflower Improvement Association | | |
| 6.625%, due 3/1/31 (c) | 2,593,506 | 2,406,481 |
| | | 6,254,382 |
| Healthcare-Services 0.1% |
| Toledo Hospital (The) | | |
| 6.015%, due 11/15/48 | 9,350,000 | 6,229,438 |
Total Corporate Bonds
(Cost $14,068,048) | | 12,483,820 |
Total Long-Term Bonds
(Cost $14,068,048) | | 12,483,820 |
| |
| | Shares | Value |
| Closed-End Funds 0.5% |
| Massachusetts 0.1% |
| DWS Municipal Income Trust | 131,002 | 979,895 |
| Pioneer Municipal High Income Advantage Fund, Inc. | 200,399 | 1,290,570 |
| Pioneer Municipal High Income Fund Trust | 200,954 | 1,404,668 |
| | | 3,675,133 |
| Michigan 0.0% ‡ |
| BlackRock MuniYield Michigan Quality Fund, Inc. | 245,271 | 2,347,243 |
| Multi-State 0.3% |
| BlackRock Municipal 2030 Target Term Trust | 427,334 | 8,277,460 |
| BlackRock MuniHoldings Fund, Inc. | 146,484 | 1,482,418 |
| BlackRock MuniYield Quality Fund II, Inc. | 588,091 | 5,122,273 |
| BlackRock MuniYield Quality Fund, Inc. | 287,227 | 2,855,036 |
| | | 17,737,187 |
| New Jersey 0.0% ‡ |
| BlackRock MuniHoldings New Jersey Quality Fund, Inc. | 307,548 | 3,066,254 |
| | Shares | | Value |
| |
| New York 0.1% |
| BlackRock MuniHoldings New York Quality Fund, Inc. | 525,108 | | $ 4,673,461 |
| BlackRock MuniYield New York Quality Fund, Inc. | 543,595 | | 4,685,789 |
| BlackRock New York Municipal Income Trust | 26,795 | | 235,260 |
| | | | 9,594,510 |
| Pennsylvania 0.0% ‡ |
| Invesco Pennsylvania Value Municipal Income Trust | 18,699 | | 161,746 |
Total Closed-End Funds
(Cost $53,605,846) | | | 36,582,073 |
| Short-Term Investment 0.2% |
| Unaffiliated Investment Company 0.2% |
| BlackRock Liquidity Funds MuniCash, 3.821% (i) | 17,558,981 | | 17,558,764 |
Total Short-Term Investment
(Cost $17,558,764) | | | 17,558,764 |
Total Investments
(Cost $8,153,759,794) | 98.7% | | 7,100,684,838 |
| Other Assets, Less Liabilities | 1.3 | | 93,283,498 |
| Net Assets | 100.0% | | $ 7,193,968,336 |
| † | Percentages indicated are based on Fund net assets. |
| ^ | Industry classifications may be different than those used for compliance monitoring purposes. |
| ‡ | Less than one-tenth of a percent. |
| (a) | Interest on these securities was subject to alternative minimum tax. |
| (b) | Coupon rate may change based on changes of the underlying collateral or prepayments of principal. Rate shown was the rate in effect as of October 31, 2023. |
| (c) | May be sold to institutional investors only under Rule 144A or securities offered pursuant to Section 4(a)(2) of the Securities Act of 1933, as amended. |
| (d) | Issue in default. |
| (e) | Issue in non-accrual status. |
| (f) | Illiquid security—As of October 31, 2023, the total market value deemed illiquid under procedures approved by the Board of Trustees was $50,461,188, which represented 0.7% of the Fund’s net assets. (Unaudited) |
| (g) | Step coupon—Rate shown was the rate in effect as of October 31, 2023. |
The notes to the financial statements are an integral part of, and should be read in conjunction with, the financial statements.
61
Portfolio of Investments October 31, 2023†^ (continued)
| (h) | Variable-rate demand notes (VRDNs)—Provide the right to sell the security at face value on either that day or within the rate-reset period. VRDNs will normally trade as if the maturity is the earlier put date, even though stated maturity is longer. The interest rate is reset on the put date at a stipulated daily, weekly, monthly, quarterly, or other specified time interval to reflect current market conditions. These securities do not indicate a reference rate and spread in their description. The maturity date shown is the final maturity. |
| (i) | Current yield as of October 31, 2023. |
Futures Contracts
As of October 31, 2023, the Fund held the following futures contracts1:
| Type | Number of
Contracts | Expiration
Date | Value at
Trade Date | Current
Notional
Amount | Unrealized
Appreciation
(Depreciation)2 |
| Short Contracts | | | | | |
| U.S. Treasury 10 Year Notes | (5,000) | December 2023 | $ (548,421,960) | $ (530,859,375) | $ 17,562,585 |
| U.S. Treasury Long Bonds | (1,510) | December 2023 | (180,088,793) | (165,250,625) | 14,838,168 |
| Net Unrealized Appreciation | | | | | $ 32,400,753 |
| 1. | As of October 31, 2023, cash in the amount of $15,889,000 was on deposit with a broker or futures commission merchant for futures transactions. |
| 2. | Represents the difference between the value of the contracts at the time they were opened and the value as of October 31, 2023. |
| Abbreviation(s): |
| AGC—Assured Guaranty Corp. |
| AGM—Assured Guaranty Municipal Corp. |
| AMBAC—Ambac Assurance Corp. |
| BAM—Build America Mutual Assurance Co. |
| CHF—Collegiate Housing Foundation |
| CR—Custodial Receipts |
| MUN GOVT GTD—Municipal Government Guaranteed |
| NATL-RE—National Public Finance Guarantee Corp. |
| PSF-GTD—Permanent School Fund Guaranteed |
| SD CRED PROG—School District Credit Enhancement Program |
| UT CSCE—Utah Charter School Credit Enhancement Program |
The notes to the financial statements are an integral part of, and should be read in conjunction with, the financial statements.
| 62 | MainStay MacKay High Yield Municipal Bond Fund |
The following is a summary of the fair valuations according to the inputs used as of October 31, 2023, for valuing the Fund’s assets:
| Description | Quoted
Prices in
Active
Markets for
Identical
Assets
(Level 1) | | Significant
Other
Observable
Inputs
(Level 2) | | Significant
Unobservable
Inputs
(Level 3) | | Total |
| Asset Valuation Inputs | | | | | | | |
| Investments in Securities (a) | | | | | | | |
| Municipal Bonds | | | | | | | |
| Long-Term Municipal Bonds | $ — | | $ 6,816,643,181 | | $ — | | $ 6,816,643,181 |
| Short-Term Municipal Notes | — | | 217,417,000 | | — | | 217,417,000 |
| Total Municipal Bonds | — | | 7,034,060,181 | | — | | 7,034,060,181 |
| Long-Term Bonds | | | | | | | |
| Corporate Bonds | — | | 12,483,820 | | — | | 12,483,820 |
| Total Corporate Bonds | — | | 12,483,820 | | — | | 12,483,820 |
| Closed-End Funds | 36,582,073 | | — | | — | | 36,582,073 |
| Short-Term Investment | | | | | | | |
| Unaffiliated Investment Company | 17,558,764 | | — | | — | | 17,558,764 |
| Total Investments in Securities | 54,140,837 | | 7,046,544,001 | | — | | 7,100,684,838 |
| Other Financial Instruments | | | | | | | |
| Futures Contracts (b) | 32,400,753 | | — | | — | | 32,400,753 |
| Total Investments in Securities and Other Financial Instruments | $ 86,541,590 | | $ 7,046,544,001 | | $ — | | $ 7,133,085,591 |
| (a) | For a complete listing of investments and their industries, see the Portfolio of Investments. |
| (b) | The value listed for these securities reflects unrealized appreciation (depreciation) as shown on the Portfolio of Investments. |
The notes to the financial statements are an integral part of, and should be read in conjunction with, the financial statements.
63
Statement of Assets and Liabilities as of October 31, 2023
| Assets |
Investment in securities, at value
(identified cost $8,153,759,794) | $ 7,100,684,838 |
| Cash | 9,000 |
| Cash collateral on deposit at broker for futures contracts | 15,889,000 |
| Receivables: | |
| Dividends and interest | 99,421,088 |
| Fund shares sold | 35,616,773 |
| Investment securities sold | 29,095,000 |
| Other assets | 151,033 |
| Total assets | 7,280,866,732 |
| Liabilities |
| Payables: | |
| Fund shares redeemed | 62,070,347 |
| Investment securities purchased | 10,877,580 |
| Manager (See Note 3) | 3,351,071 |
| Transfer agent (See Note 3) | 727,005 |
| NYLIFE Distributors (See Note 3) | 452,232 |
| Professional fees | 116,870 |
| Custodian | 75,646 |
| Shareholder communication | 35,226 |
| Variation margin on futures contracts | 1,601 |
| Trustees | 902 |
| Accrued expenses | 7,331 |
| Distributions payable | 9,182,585 |
| Total liabilities | 86,898,396 |
| Net assets | $ 7,193,968,336 |
| Composition of Net Assets |
| Shares of beneficial interest outstanding (par value of $.001 per share) unlimited number of shares authorized | $ 678,455 |
| Additional paid-in-capital | 8,908,232,679 |
| | 8,908,911,134 |
| Total distributable earnings (loss) | (1,714,942,798) |
| Net assets | $ 7,193,968,336 |
| Class A | |
| Net assets applicable to outstanding shares | $1,454,442,322 |
| Shares of beneficial interest outstanding | 137,178,359 |
| Net asset value per share outstanding | $ 10.60 |
| Maximum sales charge (3.00% of offering price) | 0.33 |
| Maximum offering price per share outstanding | $ 10.93 |
| Investor Class | |
| Net assets applicable to outstanding shares | $ 3,560,122 |
| Shares of beneficial interest outstanding | 336,185 |
| Net asset value per share outstanding | $ 10.59 |
| Maximum sales charge (2.50% of offering price) | 0.27 |
| Maximum offering price per share outstanding | $ 10.86 |
| Class C | |
| Net assets applicable to outstanding shares | $ 151,802,546 |
| Shares of beneficial interest outstanding | 14,352,851 |
| Net asset value and offering price per share outstanding | $ 10.58 |
| Class I | |
| Net assets applicable to outstanding shares | $4,660,777,224 |
| Shares of beneficial interest outstanding | 439,489,140 |
| Net asset value and offering price per share outstanding | $ 10.60 |
| Class R6 | |
| Net assets applicable to outstanding shares | $ 923,386,122 |
| Shares of beneficial interest outstanding | 87,098,506 |
| Net asset value and offering price per share outstanding | $ 10.60 |
The notes to the financial statements are an integral part of, and should be read in conjunction with, the financial statements.
| 64 | MainStay MacKay High Yield Municipal Bond Fund |
Statement of Operations for the year ended October 31, 2023
| Investment Income (Loss) |
| Income | |
| Interest | $ 371,857,447 |
| Dividends | 1,683,210 |
| Total income | 373,540,657 |
| Expenses | |
| Manager (See Note 3) | 41,356,079 |
| Distribution/Service—Class A (See Note 3) | 4,349,207 |
| Distribution/Service—Investor Class (See Note 3) | 10,202 |
| Distribution/Service—Class C (See Note 3) | 1,859,712 |
| Transfer agent (See Note 3) | 4,533,403 |
| Professional fees | 565,089 |
| Registration | 433,551 |
| Custodian | 214,694 |
| Trustees | 199,202 |
| Shareholder communication | 140,484 |
| Miscellaneous | 238,276 |
| Total expenses before waiver/reimbursement | 53,899,899 |
| Reimbursement from prior custodian(a) | (15,296) |
| Net expenses | 53,884,603 |
| Net investment income (loss) | 319,656,054 |
| Realized and Unrealized Gain (Loss) |
| Net realized gain (loss) on: | |
| Unaffiliated investment transactions | (375,849,860) |
| In-kind Transactions | (3,463,399) |
| Futures transactions | 107,591,062 |
| Net realized gain (loss) | (271,722,197) |
| Net change in unrealized appreciation (depreciation) on: | |
| Unaffiliated investments | 298,040,136 |
| Futures contracts | (28,588,715) |
| Net change in unrealized appreciation (depreciation) | 269,451,421 |
| Net realized and unrealized gain (loss) | (2,270,776) |
| Net increase (decrease) in net assets resulting from operations | $ 317,385,278 |
| (a) | Represents a refund for overbilling of custody fees. |
The notes to the financial statements are an integral part of, and should be read in conjunction with, the financial statements.
65
Statements of Changes in Net Assets
for the years ended October 31, 2023 and October 31, 2022
| | 2023 | 2022 |
| Increase (Decrease) in Net Assets |
| Operations: | | |
| Net investment income (loss) | $ 319,656,054 | $ 325,745,230 |
| Net realized gain (loss) | (271,722,197) | (296,983,633) |
| Net change in unrealized appreciation (depreciation) | 269,451,421 | (2,142,991,678) |
| Net increase (decrease) in net assets resulting from operations | 317,385,278 | (2,114,230,081) |
| Distributions to shareholders: | | |
| Class A | (71,226,979) | (76,320,100) |
| Investor Class | (166,636) | (145,969) |
| Class C | (6,208,135) | (6,843,792) |
| Class I | (214,754,997) | (233,072,302) |
| Class R6 | (40,495,808) | (43,550,777) |
| Total distributions to shareholders | (332,852,555) | (359,932,940) |
| Capital share transactions: | | |
| Net proceeds from sales of shares | 4,134,959,360 | 6,094,387,364 |
| Net asset value of shares issued to shareholders in reinvestment of distributions | 233,389,061 | 247,680,574 |
| Cost of shares redeemed | (4,856,892,832) | (7,962,906,928) |
| Redemptions in-kind | (89,218,096) | (294,446,031) |
| Increase (decrease) in net assets derived from capital share transactions | (577,762,507) | (1,915,285,021) |
| Net increase (decrease) in net assets | (593,229,784) | (4,389,448,042) |
| Net Assets |
| Beginning of year | 7,787,198,120 | 12,176,646,162 |
| End of year | $ 7,193,968,336 | $ 7,787,198,120 |
The notes to the financial statements are an integral part of, and should be read in conjunction with, the financial statements.
| 66 | MainStay MacKay High Yield Municipal Bond Fund |
Financial Highlights selected per share data and ratios
| | Year Ended October 31, |
| Class A | 2023 | | 2022 | | 2021 | | 2020 | | 2019 |
| Net asset value at beginning of year | $ 10.64 | | $ 13.49 | | $ 12.75 | | $ 12.98 | | $ 12.33 |
| Net investment income (loss) | 0.45(a) | | 0.36(a) | | 0.36(a) | | 0.40 | | 0.47 |
| Net realized and unrealized gain (loss) | (0.02) | | (2.81) | | 0.77 | | (0.20) | | 0.66 |
| Total from investment operations | 0.43 | | (2.45) | | 1.13 | | 0.20 | | 1.13 |
| Less distributions: | | | | | | | | | |
| From net investment income | (0.47) | | (0.40) | | (0.39) | | (0.43) | | (0.47) |
| From net realized gain on investments | — | | — | | — | | (0.00)‡ | | (0.01) |
| Total distributions | (0.47) | | (0.40) | | (0.39) | | (0.43) | | (0.48) |
| Net asset value at end of year | $ 10.60 | | $ 10.64 | | $ 13.49 | | $ 12.75 | | $ 12.98 |
| Total investment return (b) | 3.81% | | (18.48)% | | 8.93% | | 1.60% | | 9.28% |
| Ratios (to average net assets)/Supplemental Data: | | | | | | | | | |
| Net investment income (loss) | 3.92% | | 2.86% | | 2.66% | | 3.15% | | 3.69% |
| Net expenses (c) | 0.87% | | 0.86% | | 0.84% | | 0.86% | | 0.87% |
| Portfolio turnover rate (d) | 38%(e) | | 56%(e) | | 14% | | 37% | | 27% |
| Net assets at end of year (in 000’s) | $ 1,454,442 | | $ 1,751,791 | | $ 2,696,103 | | $ 2,073,226 | | $ 2,210,862 |
| ‡ | Less than one cent per share. |
| (a) | Per share data based on average shares outstanding during the year. |
| (b) | Total investment return is calculated exclusive of sales charges and assumes the reinvestment of dividends and distributions. For periods of less than one year, total return is not annualized. |
| (c) | In addition to the fees and expenses which the Fund bears directly, it also indirectly bears a pro-rata share of the fees and expenses of the underlying funds in which it invests. Such indirect expenses are not included in the above expense ratios. |
| (d) | The portfolio turnover rate includes variable rate demand notes. |
| (e) | The portfolio turnover rate excludes in-kind transactions. |
| | Year Ended October 31, |
| Investor Class | 2023 | | 2022 | | 2021 | | 2020 | | 2019 |
| Net asset value at beginning of year | $ 10.63 | | $ 13.47 | | $ 12.73 | | $ 12.96 | | $ 12.32 |
| Net investment income (loss) | 0.45(a) | | 0.36(a) | | 0.36(a) | | 0.40 | | 0.47 |
| Net realized and unrealized gain (loss) | (0.02) | | (2.80) | | 0.77 | | (0.20) | | 0.65 |
| Total from investment operations | 0.43 | | (2.44) | | 1.13 | | 0.20 | | 1.12 |
| Less distributions: | | | | | | | | | |
| From net investment income | (0.47) | | (0.40) | | (0.39) | | (0.43) | | (0.47) |
| From net realized gain on investments | — | | — | | — | | (0.00)‡ | | (0.01) |
| Total distributions | (0.47) | | (0.40) | | (0.39) | | (0.43) | | (0.48) |
| Net asset value at end of year | $ 10.59 | | $ 10.63 | | $ 13.47 | | $ 12.73 | | $ 12.96 |
| Total investment return (b) | 3.89% | | (18.52)% | | 8.92% | | 1.59% | | 9.19% |
| Ratios (to average net assets)/Supplemental Data: | | | | | | | | | |
| Net investment income (loss) | 3.91% | | 2.88% | | 2.69% | | 3.15% | | 3.69% |
| Net expenses (c) | 0.89% | | 0.87% | | 0.86% | | 0.87% | | 0.88% |
| Portfolio turnover rate (d) | 38%(e) | | 56%(e) | | 14% | | 37% | | 27% |
| Net assets at end of year (in 000's) | $ 3,560 | | $ 3,749 | | $ 5,107 | | $ 5,211 | | $ 5,449 |
| ‡ | Less than one cent per share. |
| (a) | Per share data based on average shares outstanding during the year. |
| (b) | Total investment return is calculated exclusive of sales charges and assumes the reinvestment of dividends and distributions. For periods of less than one year, total return is not annualized. |
| (c) | In addition to the fees and expenses which the Fund bears directly, it also indirectly bears a pro-rata share of the fees and expenses of the underlying funds in which it invests. Such indirect expenses are not included in the above expense ratios. |
| (d) | The portfolio turnover rate includes variable rate demand notes. |
| (e) | The portfolio turnover rate excludes in-kind transactions. |
The notes to the financial statements are an integral part of, and should be read in conjunction with, the financial statements.
67
Financial Highlights selected per share data and ratios
| | Year Ended October 31, |
| Class C | 2023 | | 2022 | | 2021 | | 2020 | | 2019 |
| Net asset value at beginning of year | $ 10.61 | | $ 13.46 | | $ 12.71 | | $ 12.95 | | $ 12.30 |
| Net investment income (loss) | 0.36(a) | | 0.26(a) | | 0.26(a) | | 0.29 | | 0.37 |
| Net realized and unrealized gain (loss) | (0.01) | | (2.80) | | 0.78 | | (0.20) | | 0.66 |
| Total from investment operations | 0.35 | | (2.54) | | 1.04 | | 0.09 | | 1.03 |
| Less distributions: | | | | | | | | | |
| From net investment income | (0.38) | | (0.31) | | (0.29) | | (0.33) | | (0.37) |
| From net realized gain on investments | — | | — | | — | | (0.00)‡ | | (0.01) |
| Total distributions | (0.38) | | (0.31) | | (0.29) | | (0.33) | | (0.38) |
| Net asset value at end of year | $ 10.58 | | $ 10.61 | | $ 13.46 | | $ 12.71 | | $ 12.95 |
| Total investment return (b) | 3.12% | | (19.15)% | | 8.20% | | 0.75% | | 8.47% |
| Ratios (to average net assets)/Supplemental Data: | | | | | | | | | |
| Net investment income (loss) | 3.17% | | 2.11% | | 1.95% | | 2.41% | | 2.94% |
| Net expenses (c) | 1.64% | | 1.62% | | 1.61% | | 1.62% | | 1.63% |
| Portfolio turnover rate (d) | 38%(e) | | 56%(e) | | 14% | | 37% | | 27% |
| Net assets at end of year (in 000’s) | $ 151,803 | | $ 202,196 | | $ 340,700 | | $ 355,498 | | $ 433,318 |
| ‡ | Less than one cent per share. |
| (a) | Per share data based on average shares outstanding during the year. |
| (b) | Total investment return is calculated exclusive of sales charges and assumes the reinvestment of dividends and distributions. For periods of less than one year, total return is not annualized. |
| (c) | In addition to the fees and expenses which the Fund bears directly, it also indirectly bears a pro-rata share of the fees and expenses of the underlying funds in which it invests. Such indirect expenses are not included in the above expense ratios. |
| (d) | The portfolio turnover rate includes variable rate demand notes. |
| (e) | The portfolio turnover rate excludes in-kind transactions. |
| | Year Ended October 31, |
| Class I | 2023 | | 2022 | | 2021 | | 2020 | | 2019 |
| Net asset value at beginning of year | $ 10.64 | | $ 13.49 | | $ 12.75 | | $ 12.98 | | $ 12.34 |
| Net investment income (loss) | 0.48(a) | | 0.39(a) | | 0.39(a) | | 0.45 | | 0.50 |
| Net realized and unrealized gain (loss) | (0.02) | | (2.81) | | 0.77 | | (0.22) | | 0.65 |
| Total from investment operations | 0.46 | | (2.42) | | 1.16 | | 0.23 | | 1.15 |
| Less distributions: | | | | | | | | | |
| From net investment income | (0.50) | | (0.43) | | (0.42) | | (0.46) | | (0.50) |
| From net realized gain on investments | — | | — | | — | | (0.00)‡ | | (0.01) |
| Total distributions | (0.50) | | (0.43) | | (0.42) | | (0.46) | | (0.51) |
| Net asset value at end of year | $ 10.60 | | $ 10.64 | | $ 13.49 | | $ 12.75 | | $ 12.98 |
| Total investment return (b) | 4.16% | | (18.28)% | | 9.20% | | 1.86% | | 9.46% |
| Ratios (to average net assets)/Supplemental Data: | | | | | | | | | |
| Net investment income (loss) | 4.17% | | 3.10% | | 2.90% | | 3.38% | | 3.93% |
| Net expenses (c) | 0.62% | | 0.60% | | 0.59% | | 0.61% | | 0.62% |
| Portfolio turnover rate (d) | 38%(e) | | 56%(e) | | 14% | | 37% | | 27% |
| Net assets at end of year (in 000’s) | $ 4,660,777 | | $ 4,904,132 | | $ 7,894,324 | | $ 6,063,243 | | $ 4,415,639 |
| ‡ | Less than one cent per share. |
| (a) | Per share data based on average shares outstanding during the year. |
| (b) | Total investment return is calculated exclusive of sales charges and assumes the reinvestment of dividends and distributions. Class I shares are not subject to sales charges. For periods of less than one year, total return is not annualized. |
| (c) | In addition to the fees and expenses which the Fund bears directly, it also indirectly bears a pro-rata share of the fees and expenses of the underlying funds in which it invests. Such indirect expenses are not included in the above expense ratios. |
| (d) | The portfolio turnover rate includes variable rate demand notes. |
| (e) | The portfolio turnover rate excludes in-kind transactions. |
The notes to the financial statements are an integral part of, and should be read in conjunction with, the financial statements.
| 68 | MainStay MacKay High Yield Municipal Bond Fund |
Financial Highlights selected per share data and ratios
| | Year Ended October 31, | | November 1, 2019^ through
October 31, |
| Class R6 | 2023 | | 2022 | | 2021 | | 2020 |
| Net asset value at beginning of period | $ 10.64 | | $ 13.49 | | $ 12.74 | | $ 12.98 |
| Net investment income (loss) (a) | 0.48 | | 0.40 | | 0.39 | | 0.43 |
| Net realized and unrealized gain (loss) | (0.02) | | (2.81) | | 0.79 | | (0.21) |
| Total from investment operations | 0.46 | | (2.41) | | 1.18 | | 0.22 |
| Less distributions: | | | | | | | |
| From net investment income | (0.50) | | (0.44) | | (0.43) | | (0.46) |
| From net realized gain on investments | — | | — | | — | | (0.00)‡ |
| Total distributions | (0.50) | | (0.44) | | (0.43) | | (0.46) |
| Net asset value at end of period | $ 10.60 | | $ 10.64 | | $ 13.49 | | $ 12.74 |
| Total investment return (b) | 4.13% | | (18.23)% | | 9.34% | | 1.80% |
| Ratios (to average net assets)/Supplemental Data: | | | | | | | |
| Net investment income (loss) | 4.23% | | 3.22% | | 2.91% | | 3.40% |
| Net expenses (c) | 0.56% | | 0.55% | | 0.54% | | 0.56% |
| Portfolio turnover rate (d) | 38%(e) | | 56%(e) | | 14% | | 37% |
| Net assets at end of period (in 000’s) | $ 923,386 | | $ 925,330 | | $ 1,240,412 | | $ 6,535 |
| ^ | Inception date. |
| ‡ | Less than one cent per share. |
| (a) | Per share data based on average shares outstanding during the period. |
| (b) | Total investment return is calculated exclusive of sales charges and assumes the reinvestment of dividends and distributions. Class R6 shares are not subject to sales charges. For periods of less than one year, total return is not annualized. |
| (c) | In addition to the fees and expenses which the Fund bears directly, it also indirectly bears a pro-rata share of the fees and expenses of the underlying funds in which it invests. Such indirect expenses are not included in the above expense ratios. |
| (d) | The portfolio turnover rate includes variable rate demand notes. |
| (e) | The portfolio turnover rate excludes in-kind transactions. |
The notes to the financial statements are an integral part of, and should be read in conjunction with, the financial statements.
69
Notes to Financial Statements
Note 1-Organization and Business
MainStay Funds Trust (the “Trust”) was organized as a Delaware statutory trust on April 28, 2009. The Trust is registered under the Investment Company Act of 1940, as amended (the “1940 Act”), as an open-end management investment company, and is comprised of thirty-seven funds (collectively referred to as the “Funds”). These financial statements and notes relate to the MainStay MacKay High Yield Municipal Bond Fund (the "Fund"), a “diversified” fund, as that term is defined in the 1940 Act, as interpreted or modified by regulatory authorities having jurisdiction, from time to time.
The following table lists the Fund's share classes that have been registered and commenced operations:
| Class | Commenced Operations |
| Class A | March 31, 2010 |
| Investor Class | March 31, 2010 |
| Class C | March 31, 2010 |
| Class I | March 31, 2010 |
| Class R6 | November 1, 2019 |
Class A and Investor Class shares are offered at net asset value (“NAV”) per share plus an initial sales charge. No initial sales charge applies to investments of $250,000 or more (and certain other qualified purchases) in Class A and Investor Class shares. However, a contingent deferred sales charge (“CDSC”) of 1.00% may be imposed on certain redemptions made within 18 months of the date of purchase on shares that were purchased without an initial sales charge. Class C shares are offered at NAV without an initial sales charge, although a 1.00% CDSC may be imposed on certain redemptions of such shares made within one year of the date of purchase of Class C shares. Class I and Class R6 shares are offered at NAV without a sales charge. In addition, depending upon eligibility, Class C shares convert to either Class A or Investor Class shares at the end of the calendar quarter eight years after the date they were purchased. Investor Class shares may convert automatically to Class A shares. Under certain circumstances and as may be permitted by the Trust’s multiple class plan pursuant to Rule 18f-3 under the 1940 Act, specified share classes of the Fund may be converted to one or more other share classes of the Fund as disclosed in the capital share transactions within these Notes. The classes of shares have the same voting (except for issues that relate solely to one class), dividend, liquidation and other rights, and the same terms and conditions, except that under distribution plans pursuant to Rule 12b-1 under the 1940 Act, Class C shares are subject to higher distribution and/or service fees than Class A and Investor Class shares. Class I and Class R6 shares are not subject to a distribution and/or service fee.
The Fund's investment objective is to seek a high level of current income exempt from federal income taxes. The Fund’s secondary investment objective is total return.
Note 2–Significant Accounting Policies
The Fund is an investment company and accordingly follows the investment company accounting and reporting guidance of the Financial Accounting Standards Board (“FASB”) Accounting Standards Codification Topic 946 Financial Services—Investment Companies. The Fund prepares its financial statements in accordance with generally accepted accounting principles (“GAAP”) in the United States of America and follows the significant accounting policies described below.
(A) Securities Valuation. Investments are usually valued as of the close of regular trading on the New York Stock Exchange (the "Exchange") (usually 4:00 p.m. Eastern time) on each day the Fund is open for business ("valuation date").
Pursuant to Rule 2a-5 under the 1940 Act, the Board of Trustees of the Trust (the "Board") has designated New York Life Investment Management LLC (“New York Life Investments” or the "Manager") as its Valuation Designee (the "Valuation Designee"). The Valuation Designee is responsible for performing fair valuations relating to all investments in the Fund’s portfolio for which market quotations are not readily available; periodically assessing and managing material valuation risks; establishing and applying fair value methodologies; testing fair valuation methodologies; evaluating and overseeing pricing services; ensuring appropriate segregation of valuation and portfolio management functions; providing quarterly, annual and prompt reporting to the Board, as appropriate; identifying potential conflicts of interest; and maintaining appropriate records. The Valuation Designee has established a valuation committee ("Valuation Committee") to assist in carrying out the Valuation Designee’s responsibilities and establish prices of securities for which market quotations are not readily available. The Fund's and the Valuation Designee's policies and procedures ("Valuation Procedures") govern the Valuation Designee’s selection and application of methodologies for determining and calculating the fair value of Fund investments. The Valuation Designee may value the Fund's portfolio securities for which market quotations are not readily available and other Fund assets utilizing inputs from pricing services and other third-party sources. The Valuation Committee meets (in person, via electronic mail or via teleconference) on an ad-hoc basis to determine fair valuations and on a quarterly basis to review fair value events with respect to certain securities for which market quotations are not readily available, including valuation risks and back-testing results, and preview reports to the Board.
The Valuation Committee establishes prices of securities for which market quotations are not readily available based on such methodologies and measurements on a regular basis after considering information that is reasonably available and deemed relevant by the Valuation Committee. The Board shall oversee the Valuation Designee and review fair valuation materials on a prompt, quarterly and annual basis and approve proposed revisions to the Valuation Procedures.
Investments for which market quotations are not readily available are valued at fair value as determined in good faith pursuant to the Valuation Procedures. A market quotation is readily available only when that
| 70 | MainStay MacKay High Yield Municipal Bond Fund |
quotation is a quoted price (unadjusted) in active markets for identical investments that the Fund can access at the measurement date, provided that a quotation will not be readily available if it is not reliable. "Fair value" is defined as the price the Fund would reasonably expect to receive upon selling an asset or liability in an orderly transaction to an independent buyer in the principal or most advantageous market for the asset or liability. Fair value measurements are determined within a framework that establishes a three-tier hierarchy that maximizes the use of observable market data and minimizes the use of unobservable inputs to establish a classification of fair value measurements for disclosure purposes. "Inputs" refer broadly to the assumptions that market participants would use in pricing the asset or liability, including assumptions about risk, such as the risk inherent in a particular valuation technique used to measure fair value using a pricing model and/or the risk inherent in the inputs for the valuation technique. Inputs may be observable or unobservable. Observable inputs reflect the assumptions market participants would use in pricing the asset or liability based on market data obtained from sources independent of the Fund. Unobservable inputs reflect the Fund’s own assumptions about the assumptions market participants would use in pricing the asset or liability based on the information available. The inputs or methodology used for valuing assets or liabilities may not be an indication of the risks associated with investing in those assets or liabilities. The three-tier hierarchy of inputs is summarized below.
| • | Level 1—quoted prices (unadjusted) in active markets for an identical asset or liability |
| • | Level 2—other significant observable inputs (including quoted prices for a similar asset or liability in active markets, interest rates and yield curves, prepayment speeds, credit risk, etc.) |
| • | Level 3—significant unobservable inputs (including the Fund's own assumptions about the assumptions that market participants would use in measuring fair value of an asset or liability) |
The level of an asset or liability within the fair value hierarchy is based on the lowest level of an input, both individually and in the aggregate, that is significant to the fair value measurement. The aggregate value by input level of the Fund’s assets and liabilities as of October 31, 2023, is included at the end of the Portfolio of Investments.
The Fund may use third-party vendor evaluations, whose prices may be derived from one or more of the following standard inputs, among others:
| • Benchmark yields | • Reported trades |
| • Broker/dealer quotes | • Issuer spreads |
| • Two-sided markets | • Benchmark securities |
| • Bids/offers | • Reference data (corporate actions or material event notices) |
| • Industry and economic events | • Comparable bonds |
| • Monthly payment information | |
An asset or liability for which a market quotation is not readily available is valued by methods deemed reasonable in good faith by the Valuation Committee, following the Valuation Procedures to represent fair value.
Under these procedures, the Valuation Designee generally uses a market-based approach which may use related or comparable assets or liabilities, recent transactions, market multiples, book values and other relevant information. The Valuation Designee may also use an income-based valuation approach in which the anticipated future cash flows of the asset or liability are discounted to calculate fair value. Discounts may also be applied due to the nature and/or duration of any restrictions on the disposition of the asset or liability. Fair value represents a good faith approximation of the value of a security. Fair value determinations involve the consideration of a number of subjective factors, an analysis of applicable facts and circumstances and the exercise of judgment. As a result, it is possible that the fair value for a security determined in good faith in accordance with the Valuation Procedures may differ from valuations for the same security determined for other funds using their own valuation procedures. Although the Valuation Procedures are designed to value a security at the price the Fund may reasonably expect to receive upon the security's sale in an orderly transaction, there can be no assurance that any fair value determination thereunder would, in fact, approximate the amount that the Fund would actually realize upon the sale of the security or the price at which the security would trade if a reliable market price were readily available. During the year ended October 31, 2023, there were no material changes to the fair value methodologies.
Securities which may be valued in this manner include, but are not limited to: (i) a security for which trading has been halted or suspended or otherwise does not have a readily available market quotation on a given day; (ii) a debt security that has recently gone into default and for which there is not a current market quotation; (iii) a security of an issuer that has entered into a restructuring; (iv) a security that has been delisted from a national exchange; (v) a security subject to trading collars for which no or limited trading takes place; and (vi) a security whose principal market has been temporarily closed at a time when, under normal conditions, it would be open. Securities valued in this manner are generally categorized as Level 2 or 3 in the hierarchy. No securities held by the Fund as of October 31, 2023, were fair valued in such a manner.
Investments in mutual funds, including money market funds, are valued at their respective NAVs at the close of business each day on the valuation date. These securities are generally categorized as Level 1 in the hierarchy.
Futures contracts are valued at the last posted settlement price on the market where such futures are primarily traded. These securities are generally categorized as Level 1 in the hierarchy.
Municipal debt securities are valued at the evaluated mean prices supplied by a pricing agent or broker selected by the Valuation Designee, in consultation with the Subadvisor. The evaluations are market-based measurements processed through a pricing application and represents the pricing agent's good faith determination as to what a holder may receive in an orderly transaction under market conditions. The rules-based logic utilizes valuation techniques that reflect participants' assumptions and vary by asset class and per methodology, maximizing
Notes to Financial Statements (continued)
the use of relevant observable data including quoted prices for similar assets, benchmark yield curves and market corroborated inputs. The evaluated bid or mean prices are deemed by the Valuation Designee, in consultation with the Subadvisor, to be representative of market values, at the regular close of trading of the Exchange on each valuation date. Municipal debt securities purchased on a delayed delivery basis are marked to market daily until settlement at the forward settlement date. Municipal debt securities are generally categorized as Level 2 in the hierarchy.
In calculating NAV, each closed-end fund is valued at market value, which will generally be determined using the last reported official closing or last trading price on the exchange or market on which the security is primarily traded at the time of valuation. Price information on closed-end funds is taken from the exchange where the security is primarily traded. In addition, because closed-end funds and exchange-traded funds trade on a secondary market, their shares may trade at a premium or discount to the actual net asset value of their portfolio securities and their shares may have greater volatility because of the potential lack of liquidity. These closed-end funds are generally categorized as Level 1 in the hierarchy.
Temporary cash investments acquired in excess of 60 days to maturity at the time of purchase are valued using the latest bid prices or using valuations based on a matrix system (which considers such factors as security prices, yields, maturities and ratings), both as furnished by independent pricing services. Temporary cash investments that mature in 60 days or less at the time of purchase ("Short-Term Investments") are valued using the amortized cost method of valuation, unless the use of such method would be inappropriate. The amortized cost method involves valuing a security at its cost on the date of purchase and thereafter assuming a constant amortization to maturity of the difference between such cost and the value on maturity date. Amortized cost approximates the current fair value of a security. Securities valued using the amortized cost method are not valued using quoted prices in an active market and are generally categorized as Level 2 in the hierarchy.
The information above is not intended to reflect an exhaustive list of the methodologies that may be used to value portfolio investments. The Valuation Procedures permit the use of a variety of valuation methodologies in connection with valuing portfolio investments. The methodology used for a specific type of investment may vary based on the market data available or other considerations. The methodologies summarized above may not represent the specific means by which portfolio investments are valued on any particular business day.
A portfolio investment may be classified as an illiquid investment under the Trust's written liquidity risk management program and related procedures (“Liquidity Program”). Illiquidity of an investment might prevent the sale of such investment at a time when the Manager or the Subadvisor might wish to sell, and these investments could have the effect of decreasing the overall level of the Fund's liquidity. Further, the lack of an established secondary market may make it more difficult to value illiquid investments, requiring the Fund to rely on judgments that may be somewhat subjective in measuring value, which could vary
materially from the amount that the Fund could realize upon disposition. Difficulty in selling illiquid investments may result in a loss or may be costly to the Fund. An illiquid investment is any investment that the Manager or Subadvisor reasonably expects cannot be sold or disposed of in current market conditions in seven calendar days or less without the sale or disposition significantly changing the market value of the investment. The liquidity classification of each investment will be made using information obtained after reasonable inquiry and taking into account, among other things, relevant market, trading and investment-specific considerations in accordance with the Liquidity Program. Illiquid investments are often fair valued in accordance with the Fund's procedures described above. The liquidity of the Fund's investments was determined as of October 31, 2023, and can change at any time. Illiquid investments as of October 31, 2023, are shown in the Portfolio of Investments.
(B) Income Taxes. The Fund's policy is to comply with the requirements of the Internal Revenue Code of 1986, as amended (the “Internal Revenue Code”), applicable to regulated investment companies and to distribute all of its taxable income to the shareholders of the Fund within the allowable time limits.
The Manager evaluates the Fund’s tax positions to determine if the tax positions taken meet the minimum recognition threshold in connection with accounting for uncertainties in income tax positions taken or expected to be taken for the purposes of measuring and recognizing tax liabilities in the financial statements. Recognition of tax benefits of an uncertain tax position is permitted only to the extent the position is “more likely than not” to be sustained assuming examination by taxing authorities. The Manager analyzed the Fund's tax positions taken on federal, state and local income tax returns for all open tax years (for up to three tax years) and has concluded that no provisions for federal, state and local income tax are required in the Fund's financial statements. The Fund's federal, state and local income tax and federal excise tax returns for tax years for which the applicable statutes of limitations have not expired are subject to examination by the Internal Revenue Service and state and local departments of revenue.
(C) Dividends and Distributions to Shareholders. Dividends and distributions are recorded on the ex-dividend date. The Fund intends to declare dividends from net investment income, if any, daily and intends to pay them at least monthly and declares and pays distributions from net realized capital gains, if any, at least annually. Unless a shareholder elects otherwise, all dividends and distributions are reinvested at NAV in the same class of shares of the Fund. Dividends and distributions to shareholders are determined in accordance with federal income tax regulations and may differ from determinations using GAAP.
(D) Security Transactions and Investment Income. The Fund records security transactions on the trade date. Realized gains and losses on security transactions are determined using the identified cost method. Discounts and premiums on securities purchased, other than temporary cash investments that mature in 60 days or less at the time of purchase,
| 72 | MainStay MacKay High Yield Municipal Bond Fund |
for the Fund are accreted and amortized, respectively, on the effective interest rate method.
Investment income and realized and unrealized gains and losses on investments of the Fund are allocated pro rata to the separate classes of shares based upon their relative net assets on the date the income is earned or realized and unrealized gains and losses are incurred.
The Fund may place a debt security on non-accrual status and reduce related interest income by ceasing current accruals and writing off all or a portion of any interest receivables when the collection of all or a portion of such interest has become doubtful. A debt security is removed from non-accrual status when the issuer resumes interest payments or when collectability of interest is reasonably assured.
(E) Expenses. Expenses of the Trust are allocated to the individual Funds in proportion to the net assets of the respective Funds when the expenses are incurred, except where direct allocations of expenses can be made. Expenses (other than transfer agent expenses and fees incurred under the shareholder services plans and/or the distribution plans further discussed in Note 3(B)) are allocated to separate classes of shares pro rata based upon their relative net assets on the date the expenses are incurred. The expenses borne by the Fund, including those of related parties to the Fund, are shown in the Statement of Operations.
Additionally, the Fund may invest in mutual funds, which are subject to management fees and other fees that may cause the costs of investing in mutual funds to be greater than the costs of owning the underlying securities directly. These indirect expenses of mutual funds are not included in the amounts shown as expenses in the Statement of Operations or in the expense ratios included in the Financial Highlights.
(F) Use of Estimates. In preparing financial statements in conformity with GAAP, the Manager makes estimates and assumptions that affect the reported amounts and disclosures in the financial statements. Actual results could differ from those estimates and assumptions.
(G) Futures Contracts. A futures contract is an agreement to purchase or sell a specified quantity of an underlying instrument at a specified future date and price, or to make or receive a cash payment based on the value of a financial instrument (e.g., foreign currency, interest rate, security or securities index). The Fund is subject to risks such as market price risk, leverage risk, liquidity risk, counterparty risk, operational risk, legal risk and/or interest rate risk in the normal course of investing in these contracts. Upon entering into a futures contract, the Fund is required to pledge to the broker or futures commission merchant an amount of cash and/or U.S. government securities equal to a certain percentage of the collateral amount, known as the “initial margin.” During the period the futures contract is open, changes in the value of the contract are recognized as unrealized appreciation or depreciation by marking to market such contract on a daily basis to reflect the market value of the contract at the end of each day’s trading. The Fund agrees to receive from or pay to the broker or futures commission merchant an amount of cash equal to the daily fluctuation in the value of the contract. Such receipts or payments are known as “variation margin.” When the
futures contract is closed, the Fund records a realized gain or loss equal to the difference between the proceeds from (or cost of) the closing transaction and the Fund's basis in the contract.
The use of futures contracts involves, to varying degrees, elements of market risk in excess of the amount recognized in the Statement of Assets and Liabilities. The contract or notional amounts and variation margin reflect the extent of the Fund's involvement in open futures positions. There are several risks associated with the use of futures contracts as hedging techniques. There can be no assurance that a liquid market will exist at the time when the Fund seeks to close out a futures contract. If no liquid market exists, the Fund would remain obligated to meet margin requirements until the position is closed. Futures contracts may involve a small initial investment relative to the risk assumed, which could result in losses greater than if the Fund did not invest in futures contracts. Futures contracts may be more volatile than direct investments in the instrument underlying the futures and may not correlate to the underlying instrument, causing a given hedge not to achieve its objectives. The Fund's activities in futures contracts have minimal counterparty risk as they are conducted through regulated exchanges that guarantee the futures against default by the counterparty. In the event of a bankruptcy or insolvency of a futures commission merchant that holds margin on behalf of the Fund, the Fund may not be entitled to the return of the entire margin owed to the Fund, potentially resulting in a loss. The Fund may invest in futures contracts to seek enhanced returns or to reduce the risk of loss by hedging certain of its holdings. The Fund's investment in futures contracts and other derivatives may increase the volatility of the Fund's NAVs and may result in a loss to the Fund. Open futures contracts as of October 31, 2023, are shown in the Portfolio of Investments.
(H) Municipal Bond Risk. The Fund may invest more heavily in municipal bonds from certain cities, states, territories or regions than others, which may increase the Fund’s exposure to losses resulting from economic, political, regulatory occurrences, or declines in tax revenue impacting these particular cities, states, territories or regions. In addition, many state and municipal governments that issue securities are under significant economic and financial stress and may not be able to satisfy their obligations, and these events may be made worse due to economic challenges posed by COVID-19. The Fund may invest a substantial amount of its assets in municipal bonds whose interest is paid solely from revenues of similar projects, such as tobacco settlement bonds. If the Fund concentrates its investments in this manner, it assumes the legal and economic risks relating to such projects and this may have a significant impact on the Fund’s investment performance.
Certain of the issuers in which the Fund may invest have recently experienced, or may experience, significant financial difficulties and repeated credit rating downgrades. On May 3, 2017, the Commonwealth of Puerto Rico (the "Commonwealth") began proceedings pursuant to the Puerto Rico Oversight, Management, and Economic Stability Act (“PROMESA”) to seek bankruptcy-type protections from approximately $74 billion in debt and approximately $48 billion in unfunded pension
Notes to Financial Statements (continued)
obligations. In addition, the current economic environment and the resulting pressure on Puerto Rico’s budget have further contributed to its financial challenges. Following the outbreak of COVID-19, the federal government passed certain relief packages, including the Coronavirus Aid, Relief, and Economic Security Act and the American Rescue Plan, which included an aggregate of more than $7 billion in disaster relief funds for the U.S. territories, including Puerto Rico. However, there can be no assurances that the federal funds allocated to the Commonwealth will be sufficient to address the long-term economic challenges that arose from COVID-19.
As of October 31, 2023 PREPA has remained in Title III Bankruptcy for over 6 years. A significant number of net revenue bond creditors, the Oversight Board, and the Commonwealth have been unable to reach a consensual resolution on PREPA’s debt restructuring following the termination of the previous 2019 PREPA Restructuring Support Agreement by the Commonwealth of Puerto Rico in March of 2022. On December 16, 2022, the Oversight Board filed a proposed plan of adjustment to restructure more than $10 billion of debt and other claims against PREPA. The plan of adjustment, amended in March, proposed to cut PREPA’s unsustainable debt to approximately $5.68 billion.
Bankruptcy litigation has ensued between the Oversight Board and a group of net revenue bond creditors over the security provisions of PREPA’s $8.3 billion of net revenue bonds resulting in a ruling in March that PREPA’s net revenue bonds are unsecured.
In June of 2023, a claims estimation hearing resulted in a ruling that PREPA’s now asserted unsecured net revenue bond claim was valued at approximately 2.383 billion, which is only 28.3% of the full pre-petition claim asserted by net revenue bond holders. Due to the lower claims estimation ruling, at the end of August 2023 the Oversight Board filed a new proposed plan of adjustment to reflect the March lien ruling and June estimation hearing with lower recovery amounts afforded to net revenue bond holders. In conjunction with the new proposed plan of adjustment, a subset of the original litigating PREPA creditors entered into Planned Support Agreements (”PSAs”) supporting the new proposed plan of adjustment.
However, following the new proposed plan of adjustment, a significant amount of creditors not previously involved in the PREPA bankruptcy have objected to the revised plan of adjustment, including the MainStay MacKay Municipal Bond Funds.
Objecting creditors are appealing several rulings, including the March net revenue bond lien ruling, the June net revenue bond claims estimation ruling, and the November disclosure statement approval ruling that provides for a plan with disparate recoveries for the same creditors. Objecting creditors believe the PREPA bankruptcy plan of adjustment is un-confirmable and these rulings will be overturned on appeal, but there is no certainty that objecting creditors will be successful in appealing these rulings, or if overturned, these creditors will receive the relief sought. The proposed PREPA August plan of adjustment provides 3.5% of cash recovery for objecting creditors to the plan as opposed to 12.5% of cash recovery for consenting creditors who have not previously settled.
Bankruptcy plan confirmation hearings are currently scheduled to begin in March of 2024.
The Fund’s vulnerability to potential losses associated with such developments may be reduced through investing in municipal securities that feature credit enhancements (such as bond insurance). The bond insurance provider pays both principal and interest when due to the bond holder. The magnitude of Puerto Rico’s debt restructuring or other adverse economic developments could pose significant strains on the ability of municipal securities insurers to meet all future claims. As of October 31, 2023, the Fund's total Puerto Rico investments is 6.4% of total investments, with 9.8% of that amount insured.
(I) Indemnifications. Under the Trust’s organizational documents, its officers and trustees are indemnified against certain liabilities that may arise out of performance of their duties to the Trust. Additionally, in the normal course of business, the Fund enters into contracts with third-party service providers that contain a variety of representations and warranties and that may provide general indemnifications. The Fund's maximum exposure under these arrangements is unknown, as this would involve future claims that may be made against the Fund that have not yet occurred. The Manager believes that the risk of loss in connection with these potential indemnification obligations is remote. However, there can be no assurance that material liabilities related to such obligations will not arise in the future, which could adversely impact the Fund.
(J) Quantitative Disclosure of Derivative Holdings. The following tables show additional disclosures related to the Fund's derivative and hedging activities, including how such activities are accounted for and their effect on the Fund's financial positions, performance and cash flows.
The Fund entered into futures contracts to help manage the duration and yield curve positioning of the portfolio. These derivatives are not accounted for as hedging instruments.
Fair value of derivative instruments as of October 31, 2023:
| Asset Derivatives | Interest
Rate
Contracts
Risk | Total |
| Futures Contracts - Net Assets—Net unrealized appreciation on futures contracts (a) | $32,400,753 | $32,400,753 |
| Total Fair Value | $32,400,753 | $32,400,753 |
| (a) | Includes cumulative appreciation (depreciation) of futures contracts as reported in the Portfolio of Investments. Only current day’s variation margin is reported within the Statement of Assets and Liabilities. |
| 74 | MainStay MacKay High Yield Municipal Bond Fund |
The effect of derivative instruments on the Statement of Operations for the year ended October 31, 2023:
| Net Realized Gain (Loss) from: | Interest
Rate
Contracts
Risk | Total |
| Futures Transactions | $107,591,062 | $107,591,062 |
| Total Net Realized Gain (Loss) | $107,591,062 | $107,591,062 |
| Net Change in Unrealized Appreciation (Depreciation) | Interest
Rate
Contracts
Risk | Total |
| Futures Contracts | $(28,588,715) | $(28,588,715) |
| Total Net Change in Unrealized Appreciation (Depreciation) | $(28,588,715) | $(28,588,715) |
| Average Notional Amount | Total |
| Futures Contracts Short | $(1,187,757,878) |
Note 3–Fees and Related Party Transactions
(A) Manager and Subadvisor. New York Life Investments, a registered investment adviser and an indirect, wholly-owned subsidiary of New York Life Insurance Company ("New York Life"), serves as the Fund's Manager, pursuant to an Amended and Restated Management Agreement ("Management Agreement"). The Manager provides offices, conducts clerical, recordkeeping and bookkeeping services and keeps most of the financial and accounting records required to be maintained by the Fund. Except for the portion of salaries and expenses that are the responsibility of the Fund, the Manager pays the salaries and expenses of all personnel affiliated with the Fund and certain operational expenses of the Fund. The Fund reimburses New York Life Investments in an amount equal to the portion of the compensation of the Chief Compliance Officer attributable to the Fund. MacKay Shields LLC ("MacKay Shields" or the "Subadvisor"), a registered investment adviser and an indirect, wholly-owned subsidiary of New York Life, serves as the Subadvisor to the Fund and is responsible for the day-to-day portfolio management of the Fund. Pursuant to the terms of an Amended and Restated Subadvisory Agreement ("Subadvisory Agreement") between New York Life Investments and MacKay Shields, New York Life Investments pays for the services of the Subadvisor.
Pursuant to the Management Agreement, the Fund pays the Manager a monthly fee for the services performed and the facilities furnished at an annual rate of the Fund's average daily net assets as follows: 0.55% up to $1 billion; 0.54% from $1 billion to $3 billion; 0.53% from $3 billion to $5 billion; 0.52% from $5 billion to $7 billion; 0.51% from $7 billion to $9 billion; 0.50% from $9 billion to $11 billion; 0.49% from $11 billion to $13 billion and 0.48% in excess of $13 billion. During the year ended October 31, 2023, the effective management fee rate was 0.53%
of the Fund's average daily net assets, exclusive of any applicable waivers/reimbursements.
New York Life Investments has contractually agreed to waive fees and/or reimburse expenses so that Total Annual Fund Operating Expenses (excluding taxes, interest, litigation, extraordinary expenses, brokerage and other transaction expenses relating to the purchase or sale of portfolio investments and acquired (underlying) fund fees and expenses) of Class A shares do not exceed 0.875% of its average daily net assets. New York Life Investments will apply an equivalent waiver or reimbursement, in an equal number of basis points to Investor Class, Class C and Class I shares. New York Life Investments has contractually agreed to waive fees and/or reimburse expenses so that Total Annual Fund Operating Expenses (excluding taxes, interest, litigation, extraordinary expenses, brokerage and other transaction expenses relating to the purchase or sale of portfolio investments, and acquired (underlying) fund fees and expenses) of Class R6 do not exceed those of Class I. These agreements will remain in effect until February 28, 2024, and shall renew automatically for one-year terms unless New York Life Investments provides written notice of termination prior to the start of the next term or upon approval of the Board.
During the year ended October 31, 2023, New York Life Investments earned fees from the Fund in the amount of $41,356,079 and paid the Subadvisor fees in the amount of $20,678,148.
JPMorgan Chase Bank, N.A. ("JPMorgan") provides sub-administration and sub-accounting services to the Fund pursuant to an agreement with New York Life Investments. These services include calculating the daily NAVs of the Fund, maintaining the general ledger and sub-ledger accounts for the calculation of the Fund's NAVs, and assisting New York Life Investments in conducting various aspects of the Fund's administrative operations. For providing these services to the Fund, JPMorgan is compensated by New York Life Investments.
Pursuant to an agreement between the Trust and New York Life Investments, New York Life Investments is responsible for providing or procuring certain regulatory reporting services for the Fund. The Fund will reimburse New York Life Investments for the actual costs incurred by New York Life Investments in connection with providing or procuring these services for the Fund.
(B) Distribution and Service Fees. The Trust, on behalf of the Fund, has entered into a distribution agreement with NYLIFE Distributors LLC (the “Distributor”), an affiliate of New York Life Investments. The Fund has adopted distribution plans (the “Plans”) in accordance with the provisions of Rule 12b-1 under the 1940 Act.
Pursuant to the Class A and Investor Class Plans, the Distributor receives a monthly fee from the Class A and Investor Class shares at an annual rate of 0.25% of the average daily net assets of the Class A and Investor Class shares for distribution and/or service activities as designated by the Distributor. Pursuant to the Class C Plan, Class C shares pay the Distributor a monthly distribution fee at an annual rate of 0.75% of the average daily net assets of the Class C shares, along with a service fee at
Notes to Financial Statements (continued)
an annual rate of 0.25% of the average daily net assets of the Class C shares, for a total 12b-1 fee of 1.00%. Class I and Class R6 shares are not subject to a distribution and/or service fee.
The Plans provide that the distribution and service fees are payable to the Distributor regardless of the amounts actually expended by the Distributor for distribution of the Fund's shares and service activities.
(C) Sales Charges. The Fund was advised by the Distributor that the amount of initial sales charges retained on sales of Class A and Investor Class shares during the year ended October 31, 2023, were $35,548 and $1,473, respectively.
The Fund was also advised that the Distributor retained CDSCs on redemptions of Class A, Investor Class and Class C shares during the year ended October 31, 2023, of $206,107, $7 and $78,999, respectively.
(D) Transfer, Dividend Disbursing and Shareholder Servicing Agent. NYLIM Service Company LLC, an affiliate of New York Life Investments, is the Fund's transfer, dividend disbursing and shareholder servicing agent pursuant to an agreement between NYLIM Service Company LLC and the Trust. NYLIM Service Company LLC has entered into an agreement with SS&C Global Investor & Distribution Solutions, Inc. ("SS&C"), pursuant to which SS&C performs certain transfer agent services on behalf of NYLIM Service Company LLC. New York Life Investments has contractually agreed to limit the transfer agency expenses charged to the Fund’s share classes to a maximum of 0.35% of that share class’s average daily net assets on an annual basis after deducting any applicable Fund or class-level expense reimbursement or small account fees. This agreement will remain in effect until February 28, 2024, and shall renew automatically for one-year terms unless New York Life Investments provides written notice of termination prior to the start of the next term or upon approval of the Board. During the year ended October 31, 2023, transfer agent expenses incurred by the Fund and any reimbursements, pursuant to the aforementioned Transfer Agency expense limitation agreement, were as follows:
| Class | Expense | Waived |
| Class A | $1,131,566 | $— |
| Investor Class | 3,405 | — |
| Class C | 155,321 | — |
| Class I | 3,206,331 | — |
| Class R6 | 36,780 | — |
(E) Small Account Fee. Shareholders with small accounts adversely impact the cost of providing transfer agency services. In an effort to reduce total transfer agency expenses, the Fund has implemented a small account fee on certain types of accounts. As described in the Fund's prospectus, certain shareholders with an account balance of less than $1,000 ($5,000 for Class A share accounts) are charged an annual per account fee of $20 (assessed semi-annually), the proceeds from which offset transfer agent fees as reflected in the Statement of Operations. This small account fee will not apply to certain types of accounts as described further in the Fund’s prospectus.
(F) Capital. As of October 31, 2023, New York Life and its affiliates beneficially held shares of the Fund with the values and percentages of net assets as follows:
| ‡ | Less than one-tenth of a percent. |
Note 4-Federal Income Tax
As of October 31, 2023, the cost and unrealized appreciation (depreciation) of the Fund’s investment portfolio, including applicable derivative contracts and other financial instruments, as determined on a federal income tax basis, were as follows:
| | Federal Tax
Cost | Gross
Unrealized
Appreciation | Gross
Unrealized
(Depreciation) | Net
Unrealized
Appreciation/
(Depreciation) |
| Investments in Securities | $8,208,021,711 | $28,254,211 | $(1,135,591,084) | $(1,107,336,873) |
As of October 31, 2023, the components of accumulated gain (loss) on a tax basis were as follows:
Ordinary
Income | Undistributed
Tax Exempt
Income | Accumulated
Capital
and Other
Gain (Loss) | Other
Temporary
Differences | Unrealized
Appreciation
(Depreciation) | Total
Accumulated
Gain (Loss) |
| $— | $68,864,801 | $(647,816,076) | $(28,654,650) | $(1,107,336,873) | $(1,714,942,798) |
The difference between book-basis and tax-basis unrealized appreciation (depreciation) is primarily due to mark to market of futures, wash sales, and cumulative bond amortization adjustments. The other temporary differences are primarily due to dividends payable and interest accrual on defaulted securities.
The following table discloses the current year reclassifications between total distributable earnings (loss) and additional paid-in capital arising from permanent differences; net assets as of October 31, 2023 were not affected.
| | Total
Distributable
Earnings (Loss) | Additional
Paid-In
Capital |
| | $4,382,789 | $(4,382,789) |
The reclassifications for the Fund are primarily due to redemption in-kind adjustments.
As of October 31, 2023, for federal income tax purposes, capital loss carryforwards of $647,816,076, as shown in the table below, were available to the extent provided by the regulations to offset future realized gains of the Fund. Accordingly, no capital gains distributions are expected
| 76 | MainStay MacKay High Yield Municipal Bond Fund |
to be paid to shareholders until net gains have been realized in excess of such amounts.
Capital Loss
Available Through | Short-Term
Capital Loss
Amounts (000’s) | Long-Term
Capital Loss
Amounts (000’s) |
| Unlimited | $261,454 | $386,362 |
During the years ended October 31, 2023 and October 31, 2022, the tax character of distributions paid as reflected in the Statements of Changes in Net Assets was as follows:
| | 2023 | 2022 |
| Distributions paid from: | | |
| Ordinary Income | $ 25,235,436 | $ 27,882,361 |
| Exempt Interest Dividends | 307,617,119 | 332,050,579 |
| Total | $332,852,555 | $359,932,940 |
Note 5–Custodian
JPMorgan is the custodian of cash and securities held by the Fund. Custodial fees are charged to the Fund based on the Fund's net assets and/or the market value of securities held by the Fund and the number of certain transactions incurred by the Fund.
Note 6–Line of Credit
The Fund and certain other funds managed by New York Life Investments maintain a line of credit with a syndicate of banks in order to secure a source of funds for temporary purposes to meet unanticipated or excessive redemption requests.
Effective July 25, 2023, under the credit agreement (the “Credit Agreement”), the aggregate commitment amount is $600,000,000 with an additional uncommitted amount of $100,000,000. The commitment fee is an annual rate of 0.15% of the average commitment amount payable quarterly, regardless of usage, to JPMorgan, who serves as the agent to the syndicate. The commitment fee is allocated among the Fund and certain other funds managed by New York Life Investments based upon their respective net assets and other factors. Interest on any revolving credit loan is charged based upon the Federal Funds Rate, Daily Simple Secured Overnight Financing Rate ("SOFR") + 0.10%, or the Overnight Bank Funding Rate, whichever is higher. The Credit Agreement expires on July 23, 2024, although the Fund, certain other funds managed by New York Life Investments and the syndicate of banks may renew the Credit Agreement for an additional year on the same or different terms or enter into a credit agreement with a different syndicate of banks. Prior to July 25, 2023, the aggregate commitment amount and the commitment fee were the same as those under the current Credit Agreement. During the year ended October 31, 2023, there were no borrowings made or outstanding with respect to the Fund under the Credit Agreement.
Note 7–Interfund Lending Program
Pursuant to an exemptive order issued by the SEC, the Fund, along with certain other funds managed by New York Life Investments, may participate in an interfund lending program. The interfund lending program provides an alternative credit facility that permits the Fund and certain other funds managed by New York Life Investments to lend or borrow money for temporary purposes directly to or from one another, subject to the conditions of the exemptive order. During the year ended October 31, 2023, there were no interfund loans made or outstanding with respect to the Fund.
Note 8–Purchases and Sales of Securities (in 000’s)
During the year ended October 31, 2023, purchases and sales of securities, other than short-term securities, were $2,881,320 and $3,314,564, respectively.
Note 9–Capital Share Transactions
Transactions in capital shares for the years ended October 31, 2023 and October 31, 2022, were as follows:
| Class A | Shares | Amount |
| Year ended October 31, 2023: | | |
| Shares sold | 44,419,061 | $ 500,172,378 |
| Shares issued to shareholders in reinvestment of distributions | 5,332,267 | 60,512,994 |
| Shares redeemed | (70,976,284) | (796,386,385) |
| Shares redeemed in connection with in-kind transactions | (8,037,956) | (89,218,096) |
| Net increase (decrease) in shares outstanding before conversion | (29,262,912) | (324,919,109) |
| Shares converted into Class A (See Note 1) | 2,430,861 | 27,933,257 |
| Shares converted from Class A (See Note 1) | (664,723) | (7,558,233) |
| Net increase (decrease) | (27,496,774) | $ (304,544,085) |
| Year ended October 31, 2022: | | |
| Shares sold | 179,714,632 | $ 2,169,853,689 |
| Shares issued to shareholders in reinvestment of distributions | 5,398,927 | 65,734,399 |
| Shares redeemed | (201,191,940) | (2,380,543,511) |
| Shares redeemed in connection with in-kind transactions | (22,519,084) | (294,446,031) |
| Net increase (decrease) in shares outstanding before conversion | (38,597,465) | (439,401,454) |
| Shares converted into Class A (See Note 1) | 3,711,349 | 45,615,641 |
| Shares converted from Class A (See Note 1) | (311,546) | (3,772,990) |
| Net increase (decrease) | (35,197,662) | $ (397,558,803) |
| |
Notes to Financial Statements (continued)
| Investor Class | Shares | Amount |
| Year ended October 31, 2023: | | |
| Shares sold | 101,216 | $ 1,155,142 |
| Shares issued to shareholders in reinvestment of distributions | 14,253 | 161,537 |
| Shares redeemed | (65,132) | (738,349) |
| Net increase (decrease) in shares outstanding before conversion | 50,337 | 578,330 |
| Shares converted into Investor Class (See Note 1) | 21,529 | 245,660 |
| Shares converted from Investor Class (See Note 1) | (88,480) | (1,018,535) |
| Net increase (decrease) | (16,614) | $ (194,545) |
| Year ended October 31, 2022: | | |
| Shares sold | 92,787 | $ 1,178,888 |
| Shares issued to shareholders in reinvestment of distributions | 11,741 | 142,182 |
| Shares redeemed | (82,666) | (1,021,684) |
| Net increase (decrease) in shares outstanding before conversion | 21,862 | 299,386 |
| Shares converted into Investor Class (See Note 1) | 11,037 | 135,526 |
| Shares converted from Investor Class (See Note 1) | (59,147) | (748,641) |
| Net increase (decrease) | (26,248) | $ (313,729) |
| |
| Class C | Shares | Amount |
| Year ended October 31, 2023: | | |
| Shares sold | 2,115,239 | $ 24,106,172 |
| Shares issued to shareholders in reinvestment of distributions | 474,069 | 5,367,827 |
| Shares redeemed | (7,121,896) | (80,657,074) |
| Net increase (decrease) in shares outstanding before conversion | (4,532,588) | (51,183,075) |
| Shares converted from Class C (See Note 1) | (168,556) | (1,929,338) |
| Net increase (decrease) | (4,701,144) | $ (53,112,413) |
| Year ended October 31, 2022: | | |
| Shares sold | 2,413,582 | $ 29,806,079 |
| Shares issued to shareholders in reinvestment of distributions | 484,254 | 5,854,802 |
| Shares redeemed | (9,068,981) | (109,411,843) |
| Net increase (decrease) in shares outstanding before conversion | (6,171,145) | (73,750,962) |
| Shares converted into Class C (See Note 1) | 782 | 10,609 |
| Shares converted from Class C (See Note 1) | (94,933) | (1,127,464) |
| Net increase (decrease) | (6,265,296) | $ (74,867,817) |
| |
| Class I | Shares | Amount |
| Year ended October 31, 2023: | | |
| Shares sold | 258,846,677 | $ 2,948,360,609 |
| Shares issued to shareholders in reinvestment of distributions | 14,527,416 | 164,719,241 |
| Shares redeemed | (295,278,805) | (3,341,003,833) |
| Net increase (decrease) in shares outstanding before conversion | (21,904,712) | (227,923,983) |
| Shares converted into Class I (See Note 1) | 654,893 | 7,441,967 |
| Shares converted from Class I (See Note 1) | (162,850) | (1,844,711) |
| Net increase (decrease) | (21,412,669) | $ (222,326,727) |
| Year ended October 31, 2022: | | |
| Shares sold | 281,989,510 | $ 3,456,526,376 |
| Shares issued to shareholders in reinvestment of distributions | 14,323,947 | 174,363,390 |
| Shares redeemed | (388,088,367) | (4,644,748,540) |
| Net increase (decrease) in shares outstanding before conversion | (91,774,910) | (1,013,858,774) |
| Shares converted into Class I (See Note 1) | 1,206,028 | 15,314,351 |
| Shares converted from Class I (See Note 1) | (33,636,572) | (420,626,039) |
| Net increase (decrease) | (124,205,454) | $(1,419,170,462) |
| |
| Class R6 | Shares | Amount |
| Year ended October 31, 2023: | | |
| Shares sold | 58,388,901 | $ 661,165,059 |
| Shares issued to shareholders in reinvestment of distributions | 232,472 | 2,627,462 |
| Shares redeemed | (56,487,831) | (638,107,191) |
| Net increase (decrease) in shares outstanding before conversion | 2,133,542 | 25,685,330 |
| Shares converted into Class R6 (See Note 1) | 124,218 | 1,435,145 |
| Shares converted from Class R6 (See Note 1) | (2,147,545) | (24,705,212) |
| Net increase (decrease) | 110,215 | $ 2,415,263 |
| Year ended October 31, 2022: | | |
| Shares sold | 35,564,395 | $ 437,022,332 |
| Shares issued to shareholders in reinvestment of distributions | 132,818 | 1,585,801 |
| Shares redeemed | (69,848,536) | (827,181,350) |
| Net increase (decrease) in shares outstanding before conversion | (34,151,323) | (388,573,217) |
| Shares converted into Class R6 (See Note 1) | 33,540,978 | 419,577,752 |
| Shares converted from Class R6 (See Note 1) | (4,369,016) | (54,378,745) |
| Net increase (decrease) | (4,979,361) | $ (23,374,210) |
| 78 | MainStay MacKay High Yield Municipal Bond Fund |
Note 10–Other Matters
As of the date of this report, the Fund faces a heightened level of risk associated with current uncertainty, volatility and state of economies, financial markets, rising interest rates, and labor and health conditions around the world. Events such as war, acts of terrorism, recessions, rapid inflation, the imposition of international sanctions, earthquakes, hurricanes, epidemics and pandemics and other unforeseen natural or human disasters may have broad adverse social, political and economic effects on the global economy, which could negatively impact the value of the Fund's investments. Developments that disrupt global economies and financial markets may magnify factors that affect the Fund's performance.
Note 11–Subsequent Events
In connection with the preparation of the financial statements of the Fund as of and for the year ended October 31, 2023, events and transactions subsequent to October 31, 2023, through the date the financial statements were issued, have been evaluated by the Manager for possible adjustment and/or disclosure. No subsequent events requiring financial statement adjustment or disclosure have been identified.
Report of Independent Registered Public Accounting Firm
To the Shareholders of the Fund and Board of Trustees
MainStay Funds Trust:
Opinion on the Financial Statements
We have audited the accompanying statement of assets and liabilities of MainStay MacKay High Yield Municipal Bond Fund (the Fund), one of the funds constituting MainStay Funds Trust, including the portfolio of investments, as of October 31, 2023, the related statement of operations for the year then ended, the statements of changes in net assets for each of the years in the two-year period then ended, and the related notes (collectively, the financial statements) and the financial highlights for each of the years or periods in the five-year period then ended. In our opinion, the financial statements and financial highlights present fairly, in all material respects, the financial position of the Fund as of October 31, 2023, the results of its operations for the year then ended, the changes in its net assets for each of the years in the two-year period then ended, and the financial highlights for each of the years or periods in the five-year period then ended, in conformity with U.S. generally accepted accounting principles.
Basis for Opinion
These financial statements and financial highlights are the responsibility of the Fund's management. Our responsibility is to express an opinion on these financial statements and financial highlights based on our audits. We are a public accounting firm registered with the Public Company Accounting Oversight Board (United States) (PCAOB) and are required to be independent with respect to the Fund in accordance with the U.S. federal securities laws and the applicable rules and regulations of the Securities and Exchange Commission and the PCAOB.
We conducted our audits in accordance with the standards of the PCAOB. Those standards require that we plan and perform the audit to obtain reasonable assurance about whether the financial statements and financial highlights are free of material misstatement, whether due to error or fraud. Our audits included performing procedures to assess the risks of material misstatement of the financial statements and financial highlights, whether due to error or fraud, and performing procedures that respond to those risks. Such procedures included examining, on a test basis, evidence regarding the amounts and disclosures in the financial statements and financial highlights. Such procedures also included confirmation of securities owned as of October 31, 2023, by correspondence with custodians and brokers; when replies were not received from brokers, we performed other auditing procedures. Our audits also included evaluating the accounting principles used and significant estimates made by management, as well as evaluating the overall presentation of the financial statements and financial highlights. We believe that our audits provide a reasonable basis for our opinion.

We have served as the auditor of one or more New York Life Investment Management investment companies since 2003.
Philadelphia, Pennsylvania
December 22, 2023
| 80 | MainStay MacKay High Yield Municipal Bond Fund |
Federal Income Tax Information
(Unaudited)
The Fund is required under the Internal Revenue Code to advise shareholders in a written statement as to the federal tax status of dividends paid by the Fund during such fiscal years.
For Federal individual income tax purposes, the Fund designated 92.4% of the ordinary income dividends paid during its fiscal year ended October 31, 2023 as attributable to interest income from Tax Exempt Municipal Bonds. Such dividends are currently exempt from Federal income taxes under Section 103(a) of the Internal Revenue Code.
In February 2024, shareholders will receive an IRS Form 1099-DIV or substitute Form 1099, which will show the federal tax status of the distributions received by shareholders in calendar year 2023. The amounts that will be reported on such 1099-DIV or substitute Form 1099 will be the amounts you are to use on your federal income tax return and will differ from the amounts which we must report for the Fund's fiscal year ended October 31, 2023.
Proxy Voting Policies and Procedures and Proxy Voting Record
The Fund is required to file with the SEC its proxy voting record for the 12-month period ending June 30 on Form N-PX. A description of the policies and procedures that are used to vote proxies relating to portfolio securities of the Fund is available free of charge upon request by calling 800-624-6782 or visiting the SEC’s website at www.sec.gov. The most recent Form N-PX or proxy voting record is available free of charge upon request by calling 800-624-6782; visiting newyorklifeinvestments.com; or visiting the SEC’s website at www.sec.gov.
Shareholder Reports and Quarterly Portfolio Disclosure
The Fund is required to file its complete schedule of portfolio holdings with the SEC 60 days after its first and third fiscal quarter on Form N-PORT. The Fund's holdings report is available free of charge upon request by calling New York Life Investments at 800-624-6782.
Board of Trustees and Officers (Unaudited)
The Trustees and officers of the Fund are listed below. The Board oversees the MainStay Group of Funds (which consists of MainStay Funds and MainStay Funds Trust), MainStay VP Funds Trust, MainStay MacKay DefinedTerm Municipal Opportunities Fund, MainStay CBRE Global Infrastructure Megatrends Term Fund, the Manager and the Subadvisors, and elects the officers of the Funds who are responsible for the day-to-day operations of the Fund. Information pertaining to the Trustees and officers is set forth below. Each Trustee serves until his or her successor is elected and qualified or until his or her resignation, death or
removal. Under the Board’s retirement policy, unless an exception is made, a Trustee must tender his or her resignation by the end of the calendar year during which he or she reaches the age of 75. Officers are elected annually by the Board. The business address of each Trustee and officer listed below is 51 Madison Avenue, New York, New York 10010. A majority of the Trustees are not “interested persons” (as defined by the 1940 Act and rules adopted by the SEC thereunder) of the Fund (“Independent Trustees”).
| | Name and
Year of Birth | Term of Office,
Position(s) Held and
Length of Service | Principal Occupation(s)
During Past Five Years | Number of
Portfolios in
Fund Complex
Overseen by
Trustee | Other Directorships
Held by Trustee |
| | | | | | |
| | Naïm Abou-Jaoudé*
1966 | MainStay Funds: Trustee
since 2023
MainStay Funds Trust:
Trustee since 2023 | Chief Executive Officer of New York Life Investment Management LLC (since 2023). Chief Executive Officer of Candriam (an affiliate of New York Life Investment Management LLC) (2007 to 2023). | 81 | MainStay VP Funds Trust:
Trustee since 2023 (31 portfolios);
MainStay MacKay DefinedTerm Municipal Opportunities Fund: Trustee
since 2023;
MainStay CBRE Global Infrastructure Megatrends Term Fund: Trustee
since 2023; and
New York Life Investment Management International (Chair) since 2015 |
| * | This Trustee is considered to be an “interested person” of the MainStay Group of Funds, MainStay VP Funds Trust, MainStay CBRE Global Infrastructure Megatrends Term Fund and MainStay MacKay DefinedTerm Municipal Opportunities Fund, within the meaning of the 1940 Act because of his affiliation with New York Life Investment Management LLC and Candriam, as described in detail above in the column entitled “Principal Occupation(s) During Past Five Years.” |
| | |
| 82 | MainStay MacKay High Yield Municipal Bond Fund |
| | Name and
Year of Birth | Term of Office,
Position(s) Held and
Length of Service | Principal Occupation(s)
During Past Five Years | Number of
Portfolios in
Fund Complex
Overseen by
Trustee | Other Directorships
Held by Trustee |
| | | | | | |
| | David H. Chow
1957 | MainStay Funds: Trustee since January 2016, Advisory Board Member (June 2015 to December 2015);MainStay Funds Trust:
Trustee since January 2016, Advisory Board Member (June 2015 to December 2015) | Founder and CEO, DanCourt Management, LLC (since 1999) | 81 | MainStay VP Funds Trust: Trustee since January 2016, Advisory Board Member (June 2015 to December 2015) (31 portfolios);
MainStay MacKay DefinedTerm Municipal Opportunities Fund: Trustee since January 2016, Advisory Board Member (June 2015 to December 2015);
MainStay CBRE Global Infrastructure Megatrends Term Fund: Trustee since 2021;
VanEck Vectors Group of Exchange-Traded Funds: Trustee since 2006 and Independent Chairman of the Board of Trustees from 2008 to 2022 (57 portfolios); and
Berea College of Kentucky: Trustee since 2009, Chair of the Investment Committee since 2018 |
| | Karen Hammond
1956 | MainStay Funds: Trustee since December 2021, Advisory Board Member (June 2021 to December 2021);MainStay Funds Trust:
Trustee since December 2021, Advisory Board Member (June 2021 to December 2021)
| Retired, Managing Director, Devonshire Investors (2007 to 2013); Senior Vice President, Fidelity Management & Research Co. (2005 to 2007); Senior Vice President and Corporate Treasurer, FMR Corp. (2003 to 2005); Chief Operating Officer, Fidelity Investments Japan (2001 to 2003) | 81 | MainStay VP Funds Trust: Trustee since December 2021, Advisory Board Member (June 2021 to December 2021) (31 portfolios);
MainStay MacKay DefinedTerm Municipal Opportunities Fund: Trustee since December 2021, Advisory Board Member (June 2021 to December 2021);
MainStay CBRE Global Infrastructure Megatrends Term Fund: Trustee since December 2021, Advisory Board Member (June 2021 to December 2021);
Two Harbors Investment Corp.: Director since 2018;
Rhode Island State Investment Commission: Member since 2017; and
Blue Cross Blue Shield of Rhode Island: Director since 2019 |
| | Susan B. Kerley
1951 | MainStay Funds: Chair since January 2017 and Trustee since 2007;MainStay Funds Trust:
Chair since January 2017 and Trustee since 1990*** | President, Strategic Management Advisors LLC (since 1990) | 81 | MainStay VP Funds Trust: Chair since January 2017 and Trustee since 2007 (31 portfolios)**;
MainStay MacKay DefinedTerm Municipal Opportunities Fund: Chair since January 2017 and Trustee since 2011;
MainStay CBRE Global Infrastructure Megatrends Term Fund: Trustee since June 2021; and
Legg Mason Partners Funds: Trustee since 1991 (45 portfolios) |
Board of Trustees and Officers (Unaudited) (continued)
| | Name and
Year of Birth | Term of Office,
Position(s) Held and
Length of Service | Principal Occupation(s)
During Past Five Years | Number of
Portfolios in
Fund Complex
Overseen by
Trustee | Other Directorships
Held by Trustee |
| | | | | | |
| | Alan R. Latshaw
1951 | MainStay Funds: Trusteesince 2006;MainStay Funds Trust:
Trustee since 2007*** | Retired; Partner, Ernst & Young LLP (2002 to 2003); Partner, Arthur Andersen LLP (1989 to 2002); Consultant to the MainStay Funds Audit and Compliance Committee (2004 to 2006) | 81 | MainStay VP Funds Trust: Trustee since 2007 (31 portfolios)**;
MainStay MacKay DefinedTerm Municipal Opportunities Fund: Trustee since 2011; and
MainStay CBRE Global Infrastructure Megatrends Term Fund: Trustee since June 2021 |
| | Jacques P. Perold
1958 | MainStay Funds: Trustee since January 2016, Advisory Board Member (June 2015to December 2015);MainStay Funds Trust:
Trustee since January 2016, Advisory Board Member (June 2015 to December 2015) | Founder and Chief Executive Officer, CapShift Advisors LLC (since 2018); President, Fidelity Management & Research Company (2009 to 2014); President and Chief Investment Officer, Geode Capital Management, LLC (2001 to 2009) | 81 | MainStay VP Funds Trust: Trustee since January 2016, Advisory Board Member (June 2015 to December 2015) (31 portfolios);
MainStay MacKay DefinedTerm Municipal Opportunities Fund: Trustee since January 2016, Advisory Board Member (June 2015 to December 2015);
MainStay CBRE Global Infrastructure Megatrends Term Fund: Trustee since June 2021;
Allstate Corporation: Director since 2015; and
MSCI Inc.: Director since 2017 |
| | Richard S. Trutanic
1952 | MainStay Funds: Trustee since 1994;MainStay Funds Trust:
Trustee since 2007*** | Chairman and Chief Executive Officer, Somerset & Company (financial advisory firm) (since 2004); Managing Director, The Carlyle Group (private investment firm) (2002 to 2004); Senior Managing Director, Partner and Board Member, Groupe Arnault S.A. (private investment firm) (1999 to 2002) | 81 | MainStay VP Funds Trust: Trustee since 2007 (31 portfolios)**;
MainStay MacKay DefinedTerm Municipal Opportunities Fund: Trustee since 2011; and
MainStay CBRE Global Infrastructure Megatrends Term Fund: Trustee since June 2021 |
| ** | Includes prior service as a Director of MainStay VP Series Fund, Inc., the predecessor to MainStay VP Funds Trust. |
| *** | Includes prior service as a Director/Trustee of certain predecessor entities to MainStay Funds Trust. |
| 84 | MainStay MacKay High Yield Municipal Bond Fund |
| | Name and
Year of Birth | Position(s) Held and
Length of Service | Principal Occupation(s)
During Past Five Years | |
| | | | | |
| | Kirk C. Lehneis
1974 | President, MainStay Funds, MainStay Funds Trust (since 2017) | Chief Operating Officer and Senior Managing Director (since 2016), New York Life Investment Management LLC and New York Life Investment Management Holdings LLC; Member of the Board of Managers (since 2017) and Senior Managing Director (since 2018), NYLIFE Distributors LLC; Chairman of the Board and Senior Managing Director, NYLIM Service Company LLC (since 2017); Trustee, President and Principal Executive Officer of IndexIQ Trust, IndexIQ ETF Trust and IndexIQ Active ETF Trust (since 2018); President, MainStay CBRE Global Infrastructure Megatrends Term Fund (since 2021), MainStay MacKay DefinedTerm Municipal Opportunities Fund and MainStay VP Funds Trust (since 2017)**; Senior Managing Director, Global Product Development (2015 to 2016); Managing Director, Product Development (2010 to 2015), New York Life Investment Management LLC | |
| | Jack R. Benintende
1964 | Treasurer and Principal Financial and Accounting Officer, MainStay Funds (since 2007), MainStay Funds Trust (since 2009) | Managing Director, New York Life Investment Management LLC (since 2007); Treasurer and Principal Financial and Accounting Officer, MainStay CBRE Global Infrastructure Megatrends Term Fund (since 2021), MainStay MacKay DefinedTerm Municipal Opportunities Fund (since 2011) and MainStay VP Funds Trust (since 2007)**; and Assistant Treasurer, New York Life Investment Management Holdings LLC (2008 to 2012) | |
| | J. Kevin Gao
1967 | Secretary and Chief Legal Officer, MainStay Funds and MainStay Funds Trust (since 2010) | Managing Director and Associate General Counsel, New York Life Investment Management LLC (since 2010); Secretary and Chief Legal Officer, MainStay CBRE Global Infrastructure Megatrends Term Fund (since 2021), MainStay MacKay DefinedTerm Municipal Opportunities Fund (since 2011) and MainStay VP Funds Trust (since 2010)** | |
| | Kevin M. Gleason
1967 | Vice President and Chief Compliance Officer, MainStay Funds and MainStay Funds Trust (since June 2022) | Vice President and Chief Compliance Officer, IndexIQ Trust, IndexIQ ETF Trust and Index IQ Active ETF Trust (since June 2022); Vice President and Chief Compliance Officer, MainStay CBRE Global Infrastructure Megatrends Term Fund, MainStay VP Funds Trust and MainStay MacKay DefinedTerm Municipal Opportunities Fund (since June 2022); Senior Vice President, Voya Investment Management and Chief Compliance Officer, Voya Family of Funds (2012 to 2022) | |
| | Scott T. Harrington
1959 | Vice President— Administration, MainStay Funds (since 2005), MainStay Funds Trust (since 2009) | Managing Director, New York Life Investment Management LLC (including predecessor advisory organizations) (since 2000); Member of the Board of Directors, New York Life Trust Company (since 2009); Vice President—Administration, MainStay CBRE Global Infrastructure Megatrends Term Fund (since 2021), MainStay MacKay DefinedTerm Municipal Opportunities Fund (since 2011) and MainStay VP Funds Trust (since 2005)** | |
| * | The officers listed above are considered to be “interested persons” of the MainStay Group of Funds, MainStay VP Funds Trust, MainStay CBRE Global Infrastructure Megatrends Term Fund and MainStay MacKay DefinedTerm Municipal Opportunities Fund within the meaning of the 1940 Act because of their affiliation with the MainStay Group of Funds, New York Life Insurance Company and/or its affiliates, including New York Life Investment Management LLC, New York Life Insurance Company, NYLIM Service Company LLC, NYLIFE Securities LLC and/or NYLIFE Distributors LLC, as described in detail in the column captioned “Principal Occupation(s) During Past Five Years.” Officers are elected annually by the Board. |
| ** | Includes prior service as an Officer of MainStay VP Series Fund, Inc., the predecessor to MainStay VP Funds Trust. |
Officers of the Trust (Who are not Trustees)*
This page intentionally left blank.
Equity
U.S. Equity
MainStay Epoch U.S. Equity Yield Fund
MainStay Fiera SMID Growth Fund
MainStay PineStone U.S. Equity Fund
MainStay S&P 500 Index Fund
MainStay Winslow Large Cap Growth Fund
MainStay WMC Enduring Capital Fund
MainStay WMC Growth Fund
MainStay WMC Small Companies Fund
MainStay WMC Value Fund
International Equity
MainStay Epoch International Choice Fund
MainStay PineStone International Equity Fund
MainStay WMC International Research Equity Fund
Emerging Markets Equity
MainStay Candriam Emerging Markets Equity Fund
Global Equity
MainStay Epoch Capital Growth Fund
MainStay Epoch Global Equity Yield Fund
MainStay PineStone Global Equity Fund
Fixed Income
Taxable Income
MainStay Candriam Emerging Markets Debt Fund
MainStay Floating Rate Fund
MainStay MacKay High Yield Corporate Bond Fund
MainStay MacKay Short Duration High Yield Fund
MainStay MacKay Strategic Bond Fund
MainStay MacKay Total Return Bond Fund
MainStay MacKay U.S. Infrastructure Bond Fund
MainStay Short Term Bond Fund
Tax-Exempt Income
MainStay MacKay California Tax Free Opportunities Fund1
MainStay MacKay High Yield Municipal Bond Fund
MainStay MacKay New York Tax Free Opportunities Fund2
MainStay MacKay Short Term Municipal Fund
MainStay MacKay Strategic Municipal Allocation Fund
MainStay MacKay Tax Free Bond Fund
Money Market
MainStay Money Market Fund
Mixed Asset
MainStay Balanced Fund
MainStay Income Builder Fund
MainStay MacKay Convertible Fund
Speciality
MainStay CBRE Global Infrastructure Fund
MainStay CBRE Real Estate Fund
MainStay Cushing MLP Premier Fund
Asset Allocation
MainStay Conservative Allocation Fund
MainStay Conservative ETF Allocation Fund
MainStay Defensive ETF Allocation Fund
MainStay Equity Allocation Fund
MainStay Equity ETF Allocation Fund
MainStay ESG Multi-Asset Allocation Fund
MainStay Growth Allocation Fund
MainStay Growth ETF Allocation Fund
MainStay Moderate Allocation Fund
MainStay Moderate ETF Allocation Fund
Manager
New York Life Investment Management LLC
New York, New York
Subadvisors
Candriam3
Strassen, Luxembourg
CBRE Investment Management Listed Real Assets LLC
Radnor, Pennsylvania
Cushing Asset Management, LP
Dallas, Texas
Epoch Investment Partners, Inc.
New York, New York
Fiera Capital Inc.
New York, New York
IndexIQ Advisors LLC3
New York, New York
MacKay Shields LLC3
New York, New York
NYL Investors LLC3
New York, New York
PineStone Asset Management Inc.
Montreal, Québec
Wellington Management Company LLP
Boston, Massachusetts
Winslow Capital Management, LLC
Minneapolis, Minnesota
Legal Counsel
Dechert LLP
Washington, District of Columbia
Independent Registered Public Accounting Firm
KPMG LLP
Philadelphia, Pennsylvania
Distributor
NYLIFE Distributors LLC3
Jersey City, New Jersey
Custodian
JPMorgan Chase Bank, N.A.
New York, New York
1.
This Fund is registered for sale in AZ, CA, NV, OR, TX, UT, WA and MI (Class A and Class I shares only), and CO, FL, GA, HI, ID, MA, MD, NH, NJ and NY (Class I shares only).
| 2. | This Fund is registered for sale in CA, CT, DE, FL, MA, NJ, NY and VT. |
| 3. | An affiliate of New York Life Investment Management LLC. |
Not part of the Annual Report
For more information
800-624-6782
newyorklifeinvestments.com
“New York Life Investments” is both a service mark, and the common trade name, of certain investment advisors affiliated with New York Life Insurance Company. The MainStay Funds® are managed by New York Life Investment Management LLC and distributed by NYLIFE Distributors LLC, 30 Hudson Street, Jersey City, NJ 07302, a wholly owned subsidiary of New York Life Insurance Company. NYLIFE Distributors LLC is a Member FINRA/SIPC.
©2023 NYLIFE Distributors LLC. All rights reserved.
| 5013761MS139-23 | MSMHY11-12/23 |
(NYLIM) NL243
MainStay MacKay New York Tax Free Opportunities Fund
Message from the President and Annual Report
October 31, 2023
Special Notice:
Beginning in July 2024, new regulations issued by the Securities and Exchange Commission (SEC) will take effect requiring open-end mutual fund companies and ETFs to (1) overhaul the content of their shareholder reports and (2) mail paper copies of the new tailored shareholder reports to shareholders who have not opted to receive these documents electronically.
If you have not yet elected to receive your shareholder reports electronically, please contact your financial intermediary or visit newyorklifeinvestments.com/accounts.
| Not FDIC/NCUA Insured | Not a Deposit | May Lose Value | No Bank Guarantee | Not Insured by Any Government Agency |
This page intentionally left blank
Message from the President
Volatile economic and geopolitical forces drove market behavior during the 12-month reporting period ended October 31, 2023. While equity markets generally gained ground, bond prices trended broadly lower.
Although the war in Ukraine, the outbreak of hostilities in the Middle East and several other notable events affected financial assets, inflation and interest rate trends stood at the forefront of market developments during most of the period. As the reporting period began, high levels of inflation already showed signs of easing in the face of aggressive rate hikes by the U.S. Federal Reserve (the “Fed”). From a peak of 9.1% in June 2022, the annualized U.S. inflation rate dropped to 7.1% in November 2022, and to 3.2% in October 2023. At the same time, the Fed increased the benchmark federal funds rate from 3.75%–4.00% at the beginning of the reporting period to 5.25%–5.50% as of October 31, 2023. As the pace of rate increases slowed during the period, investors hoped for an early shift to a looser monetary policy. However, comments from Fed members late in the period reinforced the central bank’s hawkish stance in response to surprisingly robust U.S. economic growth and rising wage pressures, thus increasing the likelihood that interest rates would stay higher for longer. International developed markets exhibited similar dynamics of elevated inflation and rising interest rates.
Despite the backdrop of high interest rates—along with political dysfunction in Washington D.C. and intensifying global geopolitical instability—equity markets managed to advance, supported by healthy consumer spending trends and persistent domestic economic growth. The S&P 500® Index, a widely regarded benchmark of large-cap U.S. market performance, gained ground, bolstered by the strong performance of energy stocks amid surging petroleum prices and mega-cap, growth-oriented, technology-related shares, which rose as investors flocked to companies creating the infrastructure for developments in artificial intelligence. Smaller-cap stocks and value-oriented shares produced milder returns. Among industry sectors, energy and
information technology posted the strongest gains. Real estate declined most sharply under pressure from rising mortgage rates and weak levels of office occupancy. Developed international markets outperformed U.S. markets, with Europe benefiting during the first half of the period from unexpected economic resilience in the face of rising energy prices and the ongoing war in Ukraine. Emerging markets posted positive results but lagged developed markets, largely due to slow economic growth in China despite the relaxation of pandemic-era lockdowns.
Bond prices were driven lower by rising yields and increasing expectations of high interest rates for an extended period of time. The U.S. yield curve steepened, with the 30-year Treasury yield exceeding 5% for the first time in more than a decade. The yield curve remained inverted, with the 10-year Treasury yield ending the period at 4.88%, compared with 5.07% for the 2-year Treasury yield. Corporate bonds outperformed long-term Treasury bonds, but still trended lower under pressure from rising yields and an uptick in default rates. Among corporates, lower-credit-quality instruments performed slightly better than their higher-credit-quality counterparts, while floating rate securities performed better still.
In the face of today’s uncertain market environment, New York Life Investments remains dedicated to providing the guidance, resources and investment solutions you need to pursue your financial goals.
Thank you for trusting us to help meet your investment needs.
Sincerely,
Kirk C. Lehneis
President
The opinions expressed are as of the date of this report and are subject to change. There is no guarantee that any forecast made will come to pass. This material does not constitute investment advice and is not intended as an endorsement of any specific investment. Past performance is no guarantee of future results.
Not part of the Annual Report
Investors should refer to the Fund’s Summary Prospectus and/or Prospectus and consider the Fund’s investment objectives, strategies, risks, charges and expenses carefully before investing. The Summary Prospectus and/or Prospectus contain this and other information about the Fund. You may obtain copies of the Fund’s Summary Prospectus, Prospectus and Statement of Additional Information, which includes information about the MainStay Funds Trust's Trustees, free of charge, upon request, by calling toll-free 800-624-6782, by writing to NYLIFE Distributors LLC, Attn: MainStay Marketing Department, 30 Hudson Street, Jersey City, NJ 07302 or by sending an e-mail to MainStayShareholderServices@nylim.com. These documents are also available via the MainStay Funds’ website at newyorklifeinvestments.com. Please read the Fund’s Summary Prospectus and/or Prospectus carefully before investing.
Investment and Performance Comparison (Unaudited)
Performance data quoted represents past performance. Past performance is no guarantee of future results. Because of market volatility and other factors, current performance may be lower or higher than the figures shown. Investment return and principal value will fluctuate, and as a result, when shares are redeemed, they may be worth more or less than their original cost. The graph below depicts the historical performance of Class I shares of the Fund. Performance will vary from class to class based on differences in class-specific expenses and sales charges. For performance information current to the most recent month-end, please call 800-624-6782 or visit newyorklifeinvestments.com.
The performance table and graph do not reflect the deduction of taxes that a shareholder would pay on distributions or Fund share redemptions. Total returns reflect maximum applicable sales charges as indicated in the table below, if any, changes in share price, and reinvestment of dividend and capital gain distributions. The graph assumes the initial investment amount shown below and reflects the deduction of all sales charges that would have applied for the period of investment. Performance figures may reflect certain fee waivers and/or expense limitations, without which total returns may have been lower. For more information on share classes and current fee waivers and/or expense limitations (if any), please refer to the Notes to Financial Statements.
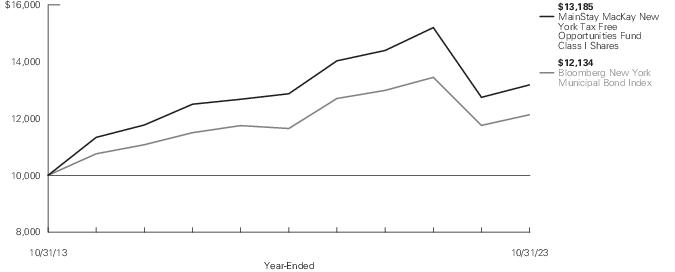
| Average Annual Total Returns for the Year-Ended October 31, 2023 |
| Class | Sales Charge | | Inception
Date | One
Year | Five
Years | Ten Years
or Since
Inception | Gross
Expense
Ratio1 |
| Class A Shares2 | Maximum 3.00% Initial Sales Charge | With sales charges | 5/14/2012 | 0.08% | -0.67% | 2.08% | 0.77% |
| | | Excluding sales charges | | 3.18 | 0.25 | 2.56 | 0.77 |
| Investor Class Shares3, 4 | Maximum 2.50% Initial Sales Charge | With sales charges | 5/14/2012 | 0.57 | -0.70 | 2.04 | 0.78 |
| | | Excluding sales charges | | 3.15 | 0.21 | 2.51 | 0.78 |
| Class C Shares | Maximum 1.00% CDSC | With sales charges | 5/14/2012 | 1.90 | -0.02 | 2.25 | 1.03 |
| | if Redeemed Within One Year of Purchase | Excluding sales charges | | 2.89 | -0.02 | 2.25 | 1.03 |
| Class C2 Shares | Maximum 1.00% CDSC | With sales charges | 8/31/2020 | 1.86 | N/A | -3.51 | 1.18 |
| | if Redeemed Within One Year of Purchase | Excluding sales charges | | 2.86 | N/A | -3.51 | 1.18 |
| Class I Shares | No Sales Charge | | 5/14/2012 | 3.43 | 0.48 | 2.80 | 0.52 |
| Class R6 Shares | No Sales Charge | | 11/1/2019 | 3.45 | N/A | -1.53 | 0.49 |
| 1. | The gross expense ratios presented reflect the Fund’s “Total Annual Fund Operating Expenses” from the most recent Prospectus, as supplemented, and may differ from other expense ratios disclosed in this report. |
| 2. | Prior to August 10, 2022, the maximum initial sales charge was 4.50%, which is reflected in the applicable average annual total return figures shown. |
| 3. | Prior to June 30, 2020, the maximum initial sales charge was 4.50%, which is reflected in the applicable average annual total return figures shown. |
| 4. | Prior to August 10, 2022, the maximum initial sales charge was 4.00%, which is reflected in the applicable average annual total return figures shown. |
The footnotes on the next page are an integral part of the table and graph and should be carefully read in conjunction with them.
| Benchmark Performance* | One
Year | Five
Years | Ten
Years |
| Bloomberg New York Municipal Bond Index1 | 3.21% | 0.82% | 1.95% |
| Morningstar Muni New York Long Category Average2 | 2.29 | 0.14 | 1.82 |
| * | Returns for indices reflect no deductions for fees, expenses or taxes, except for foreign withholding taxes where applicable. Results assume reinvestment of all dividends and capital gains. An investment cannot be made directly in an index. |
| 1. | The Bloomberg New York Municipal Bond Index is the Fund's primary broad-based securities market index for comparison purposes. The Bloomberg New York Municipal Bond Index is a market value-weighted index of New York investment grade tax exempt fixed-rate municipal bonds with maturities of one year or more. |
| 2. | The Morningstar Muni New York Long Category Average is representative of funds that invest at least 80% of assets in New York municipal debt. These funds have durations of more than 7.0 years. Results are based on average total returns of similar funds with all dividends and capital gain distributions reinvested. |
The footnotes on the preceding page are an integral part of the table and graph and should be carefully read in conjunction with them.
| 6 | MainStay MacKay New York Tax Free Opportunities Fund |
Cost in Dollars of a $1,000 Investment in MainStay MacKay New York Tax Free Opportunities Fund (Unaudited)
The example below is intended to describe the fees and expenses borne by shareholders during the six-month period from May 1, 2023 to October 31, 2023, and the impact of those costs on your investment.
Example
As a shareholder of the Fund you incur two types of costs: (1) transaction costs, including exchange fees and sales charges (loads) on purchases (as applicable), and (2) ongoing costs, including management fees, distribution and/or service (12b-1) fees and other Fund expenses (as applicable). This example is intended to help you understand your ongoing costs (in dollars) of investing in the Fund and to compare these costs with the ongoing costs of investing in other mutual funds. The example is based on an investment of $1,000 made at the beginning of the six-month period and held for the entire period from May 1, 2023 to October 31, 2023.
This example illustrates your Fund’s ongoing costs in two ways:
Actual Expenses
The second and third data columns in the table below provide information about actual account values and actual expenses. You may use the information in these columns, together with the amount you invested, to estimate the expenses that you paid during the six months ended October 31, 2023. Simply divide your account value by $1,000 (for example, an
$8,600 account value divided by $1,000 = 8.6), then multiply the result by the number under the heading entitled “Expenses Paid During Period” to estimate the expenses you paid on your account during this period.
Hypothetical Example for Comparison Purposes
The fourth and fifth data columns in the table below provide information about hypothetical account values and hypothetical expenses based on the Fund’s actual expense ratio and an assumed rate of return of 5% per year before expenses, which is not the Fund’s actual return. The hypothetical account values and expenses may not be used to estimate the actual ending account balances or expenses you paid for the six-month period shown. You may use this information to compare the ongoing costs of investing in the Fund with the ongoing costs of investing in other mutual funds. To do so, compare this 5% hypothetical example with the 5% hypothetical examples that appear in the shareholder reports of the other mutual funds.
Please note that the expenses shown in the table are meant to highlight your ongoing costs only and do not reflect any transactional costs, such as exchange fees or sales charges (loads). Therefore, the fourth and fifth data columns of the table are useful in comparing ongoing costs only and will not help you determine the relative total costs of owning different funds. In addition, if these transactional costs were included, your costs would have been higher.
| Share Class | Beginning
Account
Value
5/1/23 | Ending Account
Value (Based
on Actual
Returns and
Expenses)
10/31/23 | Expenses
Paid
During
Period1 | Ending Account
Value (Based
on Hypothetical
5% Annualized
Return and
Actual Expenses)
10/31/23 | Expenses
Paid
During
Period1 | Net Expense
Ratio
During
Period2 |
| Class A Shares | $1,000.00 | $941.90 | $3.67 | $1,021.42 | $3.82 | 0.75% |
| Investor Class Shares | $1,000.00 | $941.70 | $3.82 | $1,021.27 | $3.97 | 0.78% |
| Class C Shares | $1,000.00 | $940.60 | $5.04 | $1,020.01 | $5.24 | 1.03% |
| Class C2 Shares | $1,000.00 | $939.80 | $5.77 | $1,019.26 | $6.01 | 1.18% |
| Class I Shares | $1,000.00 | $942.10 | $2.45 | $1,022.68 | $2.55 | 0.50% |
| Class R6 Shares | $1,000.00 | $943.20 | $2.35 | $1,022.79 | $2.45 | 0.48% |
| 1. | Expenses are equal to the Fund’s annualized expense ratio of each class multiplied by the average account value over the period, divided by 365 and multiplied by 184 (to reflect the six-month period). The table above represents the actual expenses incurred during the six-month period. In addition to the fees and expenses which the Fund bears directly, it also indirectly bears a pro rata share of the fees and expenses of the underlying funds in which it invests. Such indirect expenses are not included in the above-reported expense figures. |
| 2. | Expenses are equal to the Fund's annualized expense ratio to reflect the six-month period. |
Industry Composition as of October 31, 2023 (Unaudited)
| Other Revenue | 38.9% |
| Education | 13.7 |
| Transportation | 12.8 |
| General Obligation | 12.0 |
| Water & Sewer | 9.0 |
| Hospital | 5.1 |
| Utilities | 3.4 |
| Housing | 1.0% |
| Certificate of Participation/Lease | 0.1 |
| Closed–End Funds | 0.2 |
| Short–Term Investment | 1.4 |
| Other Assets, Less Liabilities | 2.4 |
| | 100.0% |
See Portfolio of Investments beginning on page 11 for specific holdings within these categories. The Fund's holdings are subject to change.
Top Ten Holdings and/or Issuers Held as of October 31, 2023 (excluding short-term investments) (Unaudited)
| 1. | New York State Dormitory Authority, 3.00%-5.25%, due 12/1/31–7/1/53 |
| 2. | Triborough Bridge & Tunnel Authority, 4.00%-5.50%, due 11/15/40–5/15/63 |
| 3. | City of New York, 4.00%-5.25%, due 12/1/33–8/1/50 |
| 4. | New York City Transitional Finance Authority, 1.58%-5.50%, due 5/1/24–5/1/47 |
| 5. | Build NYC Resource Corp., 4.00%-5.50%, due 7/1/30–6/15/63 |
| 6. | Metropolitan Transportation Authority, (zero coupon)-5.00%, due 11/15/29–11/15/52 |
| 7. | New York City Municipal Water Finance Authority, 4.00%-5.25%, due 6/15/38–6/15/52 |
| 8. | Port Authority of New York & New Jersey, 4.00%-5.50%, due 12/1/31–9/15/48 |
| 9. | Battery Park City Authority, 4.00%-5.00%, due 11/1/44–11/1/53 |
| 10. | New York City Industrial Development Agency, (zero coupon)-5.00%, due 7/1/28–3/1/49 |
| 8 | MainStay MacKay New York Tax Free Opportunities Fund |
Portfolio Management Discussion and Analysis (Unaudited)
Questions answered by portfolio managers John Loffredo, CFA, Robert DiMella, CFA, Michael Petty, David Dowden, Scott Sprauer, Frances Lewis and Michael Denlinger, CFA, of MacKay Shields LLC, the Fund’s Subadvisor.
How did MainStay MacKay New York Tax Free Opportunities Fund perform relative to its benchmark and peer group during the 12 months ended October 31, 2023?
For the 12 months ended October 31, 2023, Class I shares of MainStay MacKay New York Tax Free Opportunities Fund returned 3.43%, outperforming the 3.21% return of the Fund’s benchmark, the Bloomberg New York Municipal Bond Index (the "Index"). Over the same period, Class I shares also outperformed the 2.29% return of the Morningstar Muni New York Long Category Average.1
What factors affected the Fund’s relative performance during the reporting period?
The Fund outperformed the Index during the reporting period in part due to structure and yield curve2 positioning. Adding to the relative return was the Fund’s overweight exposure to bonds maturing beyond 15 years. In addition, overweight exposure to 4+% coupons aided on a relative basis. From a geographic perspective, overweight exposure to out-of-Index U.S. territories made a positive contribution on a relative basis. (Contributions take weightings and total returns into account.) From a credit perspective, underweight exposure to AA-rated3 credits was a positive contributor to relative performance. Conversely, underweight exposure to 5% coupons, and AAA-rated4 bonds, detracted from relative returns. Also, the Fund engaged in significant tax-loss harvesting. This created losses that can be carried forward to offset future gains in the Fund. This activity also resulted in creating a higher book yield for the Fund.
During the reporting period, how was the Fund’s performance materially affected by investments in derivatives?
The Fund, at times, will employ a Treasury futures hedge, typically as a paired strategy with longer maturity bonds, to dampen duration5 and interest-rate sensitivity. During the reporting period, the Fund’s allocation was minimal.
What was the Fund’s duration strategy during the reporting period?
The Fund’s duration was targeted to remain in a neutral range relative to the Fund’s investable universe as outlined in the prospectus. In addition to investment-grade New York bonds, the Fund may also invest in bonds of U.S. territories (Puerto Rico, Guam and the U.S. Virgin Islands) and up to 20% of net assets in securities below investment grade. Since the Fund’s investable universe is broader than the Index, the Fund’s duration may also differ from that of the Index. The Fund ended the reporting period with a longer duration posture than the Index. As of October 31, 2023, the Fund's modified duration to worst6 was 8.61 years, while the Index’s modified duration to worst was 7.13 years.
During the reporting period, which sectors were the strongest positive contributors to the Fund’s relative performance and which sectors were particularly weak?
During the reporting period, overweight positioning in the hospital and education sectors produced the largest relative outperformance; however underweight positioning in the special tax and transportation sectors offset some of those gains.
How did the Fund’s sector weighting change during the reporting period?
During the reporting period, there were no material changes to the weightings in the Fund. There was an increase to the Fund's position in the electric and water/sewer sectors. We added to the Fund’s positions in traditional municipal bonds, including bonds backed by the taxing power of general obligation issuers or secured by the revenues of essential service providers, due to their generally strong, resilient profiles. In addition, there was increased exposure to higher-quality AAA-rated credits. The Fund increased exposure to high-quality credits as they are in relatively strong financial condition and were available at much higher yields than had been available in the municipal market for many
| 1. | See "Investment and Performance Comparison" for other share class returns, which may be higher or lower than Class I share returns, and for more information on benchmark and peer group returns. |
| 2. | The yield curve is a line that plots the yields of various securities of similar quality—typically U.S. Treasury issues—across a range of maturities. The U.S. Treasury yield curve serves as a benchmark for other debt and is used in economic forecasting. |
| 3. | An obligation rated ‘AA’ by Standard & Poor’s (“S&P”) is deemed by S&P to differ from the highest-rated obligations only to a small degree. In the opinion of S&P, the obligor's capacity to meet its financial commitment on the obligation is very strong. When applied to Fund holdings, ratings are based solely on the creditworthiness of the bonds in the portfolio and are not meant to represent the security or safety of the Fund. |
| 4. | An obligation rated ‘AAA’ has the highest rating assigned by Standard & Poor’s (“S&P”), and in the opinion of S&P, the obligor’s capacity to meet its financial commitment on the obligation is extremely strong. When applied to Fund holdings, ratings are based solely on the creditworthiness of the bonds in the portfolio and are not meant to represent the security or safety of the Fund. |
| 5. | Duration is a measure of the price sensitivity of a fixed-income investment to changes in interest rates. Duration is expressed as a number of years and is considered a more accurate sensitivity gauge than average maturity. |
| 6. | Modified duration is inversely related to the approximate percentage change in price for a given change in yield. Duration to worst is the duration of a bond computed using the bond’s nearest call date or maturity. This measure ignores future cash flow fluctuations due to embedded optionality. |
years. Conversely, there was a decrease to the Fund’s exposure in the leasing and hospital sectors.
How was the Fund positioned at the end of the reporting period?
As of the end of the reporting period, the Fund continued to hold overweight exposure to the long end of the curve where municipal yields are more attractive. In addition, the Fund held an overweight allocation to the education and other revenue sectors. From a ratings perspective, the Fund held overweight exposure to BBB-rated7 bonds. Moreover, the Fund held overweight exposure to non-investment grade credits, and U.S. territories that are not held in Index. As of the same date, the Fund held underweight exposure to the special tax and transportation sectors, as well as AA-rated bonds.
| 7. | An obligation rated ‘BBB’ by S&P is deemed by S&P to exhibit adequate protection parameters. In the opinion of S&P, however, adverse economic conditions or changing circumstances are more likely to lead to a weakened capacity of the obligor to meet its financial commitment on the obligation. When applied to Fund holdings, ratings are based solely on the creditworthiness of the bonds in the portfolio and are not meant to represent the security or safety of the Fund. |
The opinions expressed are those of the portfolio managers as of the date of this report and are subject to change. There is no guarantee that any forecasts will come to pass. This material does not constitute investment advice and is not intended as an endorsement of any specific investment.
| 10 | MainStay MacKay New York Tax Free Opportunities Fund |
Portfolio of Investments October 31, 2023†^
| | Principal
Amount | Value |
| Municipal Bonds 96.0% |
| Long-Term Municipal Bonds 96.0% |
| Certificate of Participation/Lease 0.1% |
| Rensselaer City School District, Certificate of Participation | | |
| Insured: AGM State Aid Withholding | | |
| 4.00%, due 6/1/34 | $ 650,000 | $ 591,942 |
| Insured: AGM State Aid Withholding | | |
| 4.00%, due 6/1/35 | 850,000 | 773,747 |
| | | 1,365,689 |
| Education 13.7% |
| Albany Capital Resource Corp., Albany College of Pharmacy and Health Sciences, Revenue Bonds | | |
| Series A | | |
| 5.00%, due 12/1/33 | 150,000 | 149,941 |
| Albany Capital Resource Corp., Albany Leadership Charter High School For Girls Project, Revenue Bonds | | |
| 5.00%, due 6/1/49 | 2,380,000 | 1,950,305 |
| Albany Capital Resource Corp., Brighter Choice Elementary Charter Schools, Revenue Bonds | | |
| Series A | | |
| 4.00%, due 4/1/37 | 2,065,000 | 1,655,204 |
| Albany Capital Resource Corp., Equitable School Revolving Fund LLC, Revenue Bonds | | |
| Series D | | |
| 4.00%, due 11/1/46 | 3,000,000 | 2,416,288 |
| Amherst Development Corp., Daemen College Project, Revenue Bonds | | |
| 4.00%, due 10/1/37 | 1,000,000 | 827,242 |
| 5.00%, due 10/1/43 | 2,000,000 | 1,773,075 |
| 5.00%, due 10/1/48 | 2,000,000 | 1,710,864 |
| Buffalo & Erie County Industrial Land Development Corp., D'Youville College Project, Revenue Bonds | | |
| Series A | | |
| 4.00%, due 11/1/40 | 1,785,000 | 1,484,275 |
| Series A | | |
| 4.00%, due 11/1/45 | 4,000,000 | 3,125,870 |
| Series A | | |
| 4.00%, due 11/1/50 | 1,000,000 | 746,678 |
| | Principal
Amount | Value |
| |
| Education (continued) |
| Buffalo & Erie County Industrial Land Development Corp., Tapestry Charter School Project, Revenue Bonds | | |
| Series A | | |
| 5.00%, due 8/1/47 | $ 500,000 | $ 419,889 |
| Series A | | |
| 5.00%, due 8/1/52 | 3,995,000 | 3,281,564 |
| Build NYC Resource Corp., Brilla College Preparatory Charter Schools, Revenue Bonds (a) | | |
| Series A | | |
| 4.00%, due 11/1/41 | 1,000,000 | 753,509 |
| Series A | | |
| 4.00%, due 11/1/51 | 1,000,000 | 675,717 |
| Build NYC Resource Corp., Children's Aid Society Project, Revenue Bonds | | |
| 5.00%, due 7/1/45 | 1,120,000 | 1,034,490 |
| Build NYC Resource Corp., Grand Concourse Academy Charter School Project, Revenue Bonds | | |
| Series A | | |
| 5.00%, due 7/1/42 | 600,000 | 553,217 |
| Series A | | |
| 5.00%, due 7/1/56 | 550,000 | 472,875 |
| Build NYC Resource Corp., Inwood Academy Leadership Charter School Project, Revenue Bonds (a) | | |
| Series A | | |
| 5.125%, due 5/1/38 | 1,050,000 | 957,117 |
| Series A | | |
| 5.50%, due 5/1/48 | 1,500,000 | 1,352,924 |
| Build NYC Resource Corp., Kipp NYC Public Charter Schools, Revenue Bonds | | |
| 5.00%, due 7/1/42 | 1,000,000 | 945,110 |
| 5.25%, due 7/1/52 | 10,000,000 | 9,341,518 |
| Build NYC Resource Corp., Manhattan College Project, Revenue Bonds | | |
| 4.00%, due 8/1/42 | 1,500,000 | 1,235,296 |
| Build NYC Resource Corp., Metropolitan College of New York, Revenue Bonds | | |
| 5.50%, due 11/1/44 | 2,500,000 | 1,875,000 |
The notes to the financial statements are an integral part of, and should be read in conjunction with, the financial statements.
11
Portfolio of Investments October 31, 2023†^ (continued)
| | Principal
Amount | Value |
| Long-Term Municipal Bonds (continued) |
| Education (continued) |
| Build NYC Resource Corp., Metropolitan Lighthouse Charter School Project, Revenue Bonds (a) | | |
| Series A | | |
| 5.00%, due 6/1/32 | $ 1,000,000 | $ 1,000,931 |
| Series A | | |
| 5.00%, due 6/1/37 | 1,500,000 | 1,438,529 |
| Series A | | |
| 5.00%, due 6/1/47 | 3,100,000 | 2,750,594 |
| Build NYC Resource Corp., New World Preparatory Charter School Project, Revenue Bonds (a) | | |
| Series A | | |
| 4.00%, due 6/15/51 | 1,200,000 | 800,241 |
| Series A | | |
| 4.00%, due 6/15/56 | 1,640,000 | 1,059,089 |
| Build NYC Resource Corp., New York Law School Project, Revenue Bonds | | |
| 5.00%, due 7/1/30 | 3,865,000 | 3,821,969 |
| 5.00%, due 7/1/33 | 1,520,000 | 1,487,208 |
| Build NYC Resource Corp., Shefa School Project, Revenue Bonds | | |
| Series A | | |
| 5.00%, due 6/15/51 (a) | 2,500,000 | 1,899,684 |
| Build NYC Resource Corp., Unity Preparatory Charter School of Brooklyn, Revenue Bonds | | |
| Series A | | |
| 5.50%, due 6/15/63 (a) | 1,375,000 | 1,200,989 |
| City of New Rochelle, IONA College Project, Revenue Bonds | | |
| Series A | | |
| 5.00%, due 7/1/45 | 3,810,000 | 3,421,022 |
| County of Cattaraugus, St. Bonaventure University Project, Revenue Bonds | | |
| Series A | | |
| 5.00%, due 5/1/44 | 1,200,000 | 1,192,391 |
| Dutchess County Local Development Corp., Bard College Project, Revenue Bonds | | |
| Series A | | |
| 5.00%, due 7/1/40 | 1,100,000 | 1,042,352 |
| Series A | | |
| 5.00%, due 7/1/45 | 3,500,000 | 3,215,180 |
| | Principal
Amount | Value |
| |
| Education (continued) |
| Dutchess County Local Development Corp., Culinary Institute of America Project (The), Revenue Bonds | | |
| Series A-1 | | |
| 5.00%, due 7/1/31 | $ 375,000 | $ 377,060 |
| Series A-1 | | |
| 5.00%, due 7/1/33 | 700,000 | 700,868 |
| Dutchess County Local Development Corp., Marist College Project, Revenue Bonds | | |
| 5.00%, due 7/1/48 | 6,000,000 | 5,867,435 |
| Dutchess County Local Development Corp., Vassar College Project, Revenue Bonds | | |
| 5.00%, due 7/1/45 | 1,200,000 | 1,200,781 |
| Hempstead Town Local Development Corp., Evergreen Charter School, Inc., Revenue Bonds | | |
| Series A | | |
| 5.25%, due 6/15/52 | 5,000,000 | 4,331,143 |
| Hempstead Town Local Development Corp., Molloy College Project, Revenue Bonds | | |
| 5.00%, due 7/1/38 | 870,000 | 817,532 |
| 5.00%, due 7/1/43 | 1,020,000 | 926,932 |
| 5.00%, due 7/1/48 | 1,100,000 | 966,930 |
| Monroe County Industrial Development Corp., Nazareth College of Rochester, Revenue Bonds | | |
| Series A | | |
| 4.00%, due 10/1/47 | 1,695,000 | 1,289,197 |
| Monroe County Industrial Development Corp., St. John Fisher College, Revenue Bonds | | |
| Series A | | |
| 5.00%, due 6/1/24 | 330,000 | 330,178 |
| Monroe County Industrial Development Corp., University of Rochester Project, Revenue Bonds | | |
| Series C | | |
| 4.00%, due 7/1/43 | 3,000,000 | 2,589,660 |
| Nassau County Local Economic Assistance Corp., Roosevelt Children's Academy Charter School, Revenue Bonds | | |
| Series A | | |
| 5.00%, due 7/1/55 | 2,750,000 | 2,344,318 |
The notes to the financial statements are an integral part of, and should be read in conjunction with, the financial statements.
| 12 | MainStay MacKay New York Tax Free Opportunities Fund |
| | Principal
Amount | Value |
| Long-Term Municipal Bonds (continued) |
| Education (continued) |
| New York State Dormitory Authority, Brooklyn Law School, Revenue Bonds | | |
| Series A | | |
| 5.00%, due 7/1/33 | $ 1,650,000 | $ 1,646,507 |
| New York State Dormitory Authority, Cornell University, Revenue Bonds | | |
| Series A | | |
| 5.00%, due 7/1/50 | 3,245,000 | 3,269,585 |
| New York State Dormitory Authority, Fordham University, Revenue Bonds | | |
| Series A | | |
| 5.00%, due 7/1/41 | 1,075,000 | 1,078,490 |
| New York State Dormitory Authority, Friends of The Bay Shore-Brightwaters Public Library, Inc., Revenue Bonds | | |
| Insured: AMBAC | | |
| 4.625%, due 7/1/36 | 200,000 | 189,922 |
| New York State Dormitory Authority, Iona College, Revenue Bonds | | |
| Series A | | |
| 5.00%, due 7/1/51 | 1,850,000 | 1,608,760 |
| New York State Dormitory Authority, New School (The), Revenue Bonds | | |
| Series A | | |
| 5.00%, due 7/1/35 | 15,000 | 15,284 |
| Series A | | |
| 5.00%, due 7/1/35 | 195,000 | 195,159 |
| New York State Dormitory Authority, New York University, Revenue Bonds | | |
| Series A | | |
| 4.00%, due 7/1/46 | 4,370,000 | 3,662,958 |
| Series A | | |
| 5.00%, due 7/1/38 | 4,580,000 | 4,687,101 |
| New York State Dormitory Authority, Pace University, Revenue Bonds | | |
| Series A | | |
| 4.00%, due 5/1/33 | 400,000 | 365,077 |
| Series A | | |
| 4.25%, due 5/1/42 | 450,000 | 368,292 |
| | Principal
Amount | Value |
| |
| Education (continued) |
| New York State Dormitory Authority, Rockefeller University, Revenue Bonds | | |
| Series B | | |
| 5.00%, due 7/1/50 | $ 5,000,000 | $ 5,015,713 |
| New York State Dormitory Authority, School Districts Financing Program, Revenue Bonds | | |
| Series A, Insured: AGM State Aid Withholding | �� | |
| 5.00%, due 10/1/43 | 500,000 | 504,138 |
| Series A, Insured: AGM State Aid Withholding | | |
| 5.25%, due 10/1/50 | 5,000,000 | 5,082,492 |
| New York State Dormitory Authority, St. John's University, Revenue Bonds | | |
| 5.00%, due 7/1/38 | 5,740,000 | 5,896,536 |
| New York State Dormitory Authority, St. Joseph's College, Revenue Bonds | | |
| 4.00%, due 7/1/40 | 200,000 | 165,551 |
| Oneida County Local Development Corp., Utica College Project, Revenue Bonds | | |
| 5.00%, due 7/1/49 | 3,250,000 | 2,838,586 |
| Onondaga County Trust for Cultural Resources, Syracuse University Project, Revenue Bonds | | |
| 4.00%, due 12/1/49 | 3,080,000 | 2,547,602 |
| Orange County Funding Corp., Mount St. Mary College, Revenue Bonds | | |
| Series A | | |
| 5.00%, due 7/1/42 | 1,010,000 | 909,751 |
| Riverhead Industrial Development Agency, Riverhead Charter School, Revenue Bonds | | |
| Series A | | |
| 7.00%, due 8/1/43 | 925,000 | 926,206 |
| Series 2013A | | |
| 7.00%, due 8/1/48 | 730,000 | 730,904 |
| Saratoga County Capital Resource Corp., Skidmore College, Revenue Bonds | | |
| Series A | | |
| 5.00%, due 7/1/45 | 1,220,000 | 1,225,367 |
The notes to the financial statements are an integral part of, and should be read in conjunction with, the financial statements.
13
Portfolio of Investments October 31, 2023†^ (continued)
| | Principal
Amount | Value |
| Long-Term Municipal Bonds (continued) |
| Education (continued) |
| Schenectady County Capital Resource Corp., Union College Project, Revenue Bonds | | |
| 5.25%, due 7/1/52 | $ 1,000,000 | $ 1,018,347 |
| St. Lawrence County Industrial Development Agency, Clarkson University Project, Revenue Bonds | | |
| 5.00%, due 9/1/47 | 2,975,000 | 2,670,783 |
| Syracuse Industrial Development Agency, Syracuse City School District Project, Revenue Bonds | | |
| Series A, Insured: State Aid Withholding | | |
| 3.25%, due 5/1/34 | 1,000,000 | 884,435 |
| Troy Capital Resource Corp., Rensselaer Polytechnic Institute, Revenue Bonds | | |
| 5.00%, due 8/1/32 | 1,000,000 | 1,008,496 |
| Series A | | |
| 5.00%, due 9/1/39 | 2,000,000 | 1,979,152 |
| Yonkers Economic Development Corp., Charter School of Educational Excellence Project, Revenue Bonds | | |
| Series A | | |
| 4.00%, due 10/15/29 | 200,000 | 183,413 |
| Series A | | |
| 5.00%, due 10/15/39 | 1,330,000 | 1,169,726 |
| Series A | | |
| 5.00%, due 10/15/49 | 990,000 | 801,775 |
| Series A | | |
| 5.00%, due 10/15/50 | 1,350,000 | 1,086,723 |
| Yonkers Industrial Development Agency, New Community School Project, Revenue Bonds | | |
| Insured: State Aid Withholding | | |
| 4.00%, due 5/1/51 | 3,500,000 | 2,826,958 |
| | | 141,369,970 |
| General Obligation 12.0% |
| City of Glens Falls, Public Improvement, Limited General Obligation | | |
| Insured: AGM | | |
| 4.00%, due 1/15/31 | 500,000 | 497,496 |
| Insured: AGM | | |
| 4.00%, due 1/15/32 | 315,000 | 311,846 |
| | Principal
Amount | Value |
| |
| General Obligation (continued) |
| City of Glens Falls, Public Improvement, Limited General Obligation (continued) | | |
| Insured: AGM | | |
| 4.00%, due 1/15/33 | $ 250,000 | $ 245,298 |
| City of Middletown, Limited General Obligation | | |
| 4.50%, due 8/23/24 | 5,000,000 | 5,018,981 |
| City of New York, Unlimited General Obligation | | |
| Series E-1 | | |
| 4.00%, due 4/1/45 | 5,500,000 | 4,748,802 |
| Series A-1 | | |
| 4.00%, due 8/1/50 | 2,000,000 | 1,672,368 |
| Series F-1 | | |
| 5.00%, due 4/1/39 | 6,000,000 | 6,080,902 |
| Series A-1 | | |
| 5.00%, due 8/1/43 | 4,400,000 | 4,436,366 |
| Series B-1 | | |
| 5.25%, due 10/1/41 | 2,500,000 | 2,607,030 |
| Series D-1 | | |
| 5.25%, due 5/1/42 | 9,000,000 | 9,329,150 |
| Series A-1 | | |
| 5.25%, due 9/1/43 | 5,500,000 | 5,695,259 |
| Series B-1 | | |
| 5.25%, due 10/1/43 | 3,000,000 | 3,107,392 |
| Series E-1 | | |
| 5.25%, due 4/1/47 | 4,750,000 | 4,875,304 |
| City of Newburgh, Limited General Obligation | | |
| Series A, Insured: AGM | | |
| 3.50%, due 7/15/36 | 725,000 | 586,819 |
| City of Ogdensburg, Public Improvement, Limited General Obligation | | |
| 5.50%, due 4/15/24 | 45,000 | 44,789 |
| 5.50%, due 4/15/26 | 50,000 | 48,281 |
| 5.50%, due 4/15/28 | 55,000 | 51,087 |
| City of Poughkeepsie, Public Improvement, Limited General Obligation | | |
| 5.00%, due 6/1/31 | 600,000 | 593,842 |
| City of Yonkers, Limited General Obligation | | |
| Series A, Insured: BAM | | |
| 4.00%, due 9/1/31 | 1,500,000 | 1,485,021 |
| Series A, Insured: BAM | | |
| 4.00%, due 5/1/35 | 1,550,000 | 1,483,059 |
The notes to the financial statements are an integral part of, and should be read in conjunction with, the financial statements.
| 14 | MainStay MacKay New York Tax Free Opportunities Fund |
| | Principal
Amount | Value |
| Long-Term Municipal Bonds (continued) |
| General Obligation (continued) |
| City of Yonkers, Limited General Obligation (continued) | | |
| Series A, Insured: BAM | | |
| 4.00%, due 5/1/37 | $ 2,000,000 | $ 1,821,215 |
| Commonwealth of Puerto Rico, Unlimited General Obligation | | |
| Series A-1 | | |
| (zero coupon), due 7/1/33 | 1,351,801 | 774,305 |
| Series A-1 | | |
| 4.00%, due 7/1/33 | 2,000,000 | 1,743,127 |
| Series A-1 | | |
| 4.00%, due 7/1/35 | 5,029,180 | 4,227,481 |
| Series A-1 | | |
| 5.625%, due 7/1/27 | 1,170,000 | 1,191,179 |
| County of Clinton, Limited General Obligation | | |
| Insured: AGM | | |
| 4.00%, due 6/1/38 (b) | 1,500,000 | 1,280,403 |
| County of Nassau, Limited General Obligation | | |
| Series B, Insured: AGM | | |
| 5.00%, due 4/1/44 | 4,870,000 | 4,949,896 |
| County of Onondaga, Limited General Obligation | | |
| 3.00%, due 6/1/39 | 2,150,000 | 1,657,060 |
| 3.25%, due 4/15/34 | 1,250,000 | 1,111,078 |
| County of Rockland, Various Purpose, Limited General Obligation | | |
| Insured: AGM | | |
| 4.00%, due 5/1/44 | 915,000 | 771,449 |
| Insured: AGM | | |
| 4.00%, due 5/1/45 | 950,000 | 795,917 |
| Insured: AGM | | |
| 4.00%, due 5/1/46 | 985,000 | 818,377 |
| Insured: AGM | | |
| 4.00%, due 5/1/48 | 1,065,000 | 877,594 |
| County of Suffolk, Public Improvement, Limited General Obligation | | |
| Series B, Insured: AGM | | |
| 3.00%, due 10/15/32 | 5,480,000 | 4,845,213 |
| Series A, Insured: AGM | | |
| 3.25%, due 6/1/36 | 715,000 | 596,966 |
| Series A, Insured: AGM | | |
| 3.25%, due 6/1/37 | 725,000 | 585,949 |
| Series A, Insured: BAM | | |
| 4.00%, due 4/1/33 | 2,190,000 | 2,176,167 |
| | Principal
Amount | Value |
| |
| General Obligation (continued) |
| Harrison Central School District, Unlimited General Obligation | | |
| Insured: State Aid Withholding | | |
| 3.50%, due 3/15/44 | $ 1,015,000 | $ 824,573 |
| Insured: State Aid Withholding | | |
| 3.50%, due 3/15/45 | 1,055,000 | 847,717 |
| Insured: State Aid Withholding | | |
| 3.55%, due 3/15/47 | 1,130,000 | 905,575 |
| Lackawanna City School District, Unlimited General Obligation | | |
| Insured: BAM State Aid Withholding | | |
| 4.00%, due 6/15/32 | 745,000 | 732,813 |
| Oswego City School District, Unlimited General Obligation | | |
| Insured: State Aid Withholding | | |
| 4.75%, due 7/19/24 | 12,500,000 | 12,543,558 |
| Poughkeepsie School District, New York School District Refunding, Unlimited General Obligation | | |
| Insured: AGM State Aid Withholding | | |
| 3.00%, due 5/1/33 | 400,000 | 353,641 |
| Three Village Central School District, Brookhaven & Smithtown, Limited General Obligation | | |
| Insured: State Aid Withholding | | |
| 4.50%, due 6/24/24 | 3,005,000 | 3,014,667 |
| Town of Wallkill, Limited General Obligation | | |
| 5.00%, due 7/25/24 | 10,000,000 | 10,062,304 |
| Uniondale Union Free School District, Unlimited General Obligation | | |
| Insured: State Aid Withholding | | |
| 2.00%, due 5/1/38 | 3,115,000 | 2,016,272 |
| Insured: State Aid Withholding | | |
| 2.00%, due 5/1/39 | 3,195,000 | 2,015,046 |
| Insured: State Aid Withholding | | |
| 2.00%, due 5/1/40 | 3,500,000 | 2,141,452 |
| Insured: State Aid Withholding | | |
| 2.00%, due 5/1/41 | 3,500,000 | 2,086,228 |
| Village of Valley Stream, Various Purpose, Limited General Obligation | | |
| Insured: BAM | | |
| 4.00%, due 4/1/33 | 490,000 | 468,262 |
| Insured: BAM | | |
| 4.00%, due 4/1/34 | 510,000 | 489,947 |
| Insured: BAM | | |
| 4.00%, due 4/1/35 | 530,000 | 503,333 |
The notes to the financial statements are an integral part of, and should be read in conjunction with, the financial statements.
15
Portfolio of Investments October 31, 2023†^ (continued)
| | Principal
Amount | Value |
| Long-Term Municipal Bonds (continued) |
| General Obligation (continued) |
| Village of Valley Stream, Various Purpose, Limited General Obligation (continued) | | |
| Insured: BAM | | |
| 4.00%, due 4/1/36 | $ 550,000 | $ 508,719 |
| Insured: BAM | | |
| 4.00%, due 4/1/37 | 570,000 | 509,473 |
| | | 123,166,048 |
| Hospital 5.1% |
| Brookhaven Local Development Corp., Long Island Community Hospital Health Care Services Foundation, Revenue Bonds | | |
| Series A, Insured: AGM-CR | | |
| 3.375%, due 10/1/40 | 7,990,000 | 6,212,830 |
| Brookhaven Local Development Corp., Long Island Community Hospital Project, Revenue Bonds | | |
| Series A | | |
| 5.00%, due 10/1/35 | 1,000,000 | 1,017,829 |
| Series A | | |
| 5.00%, due 10/1/50 | 6,250,000 | 5,763,137 |
| Broome County Local Development Corp., United Health Services Hospitals Obligated Group, Revenue Bonds | | |
| Insured: AGM | | |
| 3.00%, due 4/1/50 | 6,835,000 | 4,409,146 |
| Build NYC Resource Corp., Children's Aid Society Project (The), Revenue Bonds | | |
| 4.00%, due 7/1/49 | 1,300,000 | 1,020,420 |
| Genesee County Funding Corp. (The), Rochester Regional Health Obligated Group, Revenue Bonds | | |
| Series A | | |
| 5.00%, due 12/1/24 | 200,000 | 200,548 |
| Series A | | |
| 5.00%, due 12/1/25 | 215,000 | 216,096 |
| Series A | | |
| 5.00%, due 12/1/26 | 340,000 | 343,403 |
| Series A | | |
| 5.00%, due 12/1/27 | 400,000 | 402,477 |
| Series A | | |
| 5.00%, due 12/1/28 | 600,000 | 605,302 |
| | Principal
Amount | Value |
| |
| Hospital (continued) |
| Jefferson County Civic Facility Development Corp., Samaritan Medical Center Project, Revenue Bonds | | |
| Series A | | |
| 4.00%, due 11/1/31 | $ 2,705,000 | $ 2,392,505 |
| Monroe County Industrial Development Corp., Highland Hospital, Revenue Bonds | | |
| 4.00%, due 7/1/40 | 2,500,000 | 2,105,050 |
| Monroe County Industrial Development Corp., Rochester General Hospital (The), Revenue Bonds | | |
| Series A | | |
| 5.00%, due 12/1/32 | 540,000 | 540,485 |
| Series A | | |
| 5.00%, due 12/1/42 | 1,000,000 | 906,658 |
| Nassau County Local Economic Assistance Corp., Catholic Health Services of Long Island Obligated Group, Revenue Bonds | | �� |
| 5.00%, due 7/1/34 | 250,000 | 250,176 |
| New York State Dormitory Authority, Garnet Health Medical Center Obligated Group, Revenue Bonds (a) | | |
| 5.00%, due 12/1/31 | 1,000,000 | 930,107 |
| 5.00%, due 12/1/32 | 3,000,000 | 2,768,261 |
| New York State Dormitory Authority, Memorial Sloan-Kettering Cancer Center, Revenue Bonds | | |
| Series 1 | | |
| 4.00%, due 7/1/37 | 470,000 | 437,946 |
| New York State Dormitory Authority, NYU Langone Hospitals Obligated Group, Revenue Bonds | | |
| Series A | | |
| 3.00%, due 7/1/48 | 2,375,000 | 1,575,599 |
| Series A | | |
| 4.00%, due 7/1/40 | 1,000,000 | 889,366 |
| Series A | | |
| 4.00%, due 7/1/50 | 3,005,000 | 2,417,751 |
| Series A | | |
| 4.00%, due 7/1/53 | 8,450,000 | 6,691,443 |
The notes to the financial statements are an integral part of, and should be read in conjunction with, the financial statements.
| 16 | MainStay MacKay New York Tax Free Opportunities Fund |
| | Principal
Amount | Value |
| Long-Term Municipal Bonds (continued) |
| Hospital (continued) |
| New York State Dormitory Authority, Orange Regional Medical Center Obligated Group, Revenue Bonds | | |
| 5.00%, due 12/1/35 (a) | $ 100,000 | $ 92,414 |
| Oneida County Local Development Corp., Mohawk Valley Health System Project, Revenue Bonds | | |
| Series A, Insured: AGM | | |
| 3.00%, due 12/1/44 | 4,150,000 | 2,789,147 |
| Series A, Insured: AGM | | |
| 4.00%, due 12/1/34 | 1,585,000 | 1,472,680 |
| Series A, Insured: AGM | | |
| 4.00%, due 12/1/49 | 7,940,000 | 6,181,709 |
| Suffolk County Economic Development Corp., Catholic Health Services of Long Island Obligated Group, Revenue Bonds | | |
| Series C | | |
| 5.00%, due 7/1/33 | 250,000 | 250,214 |
| | | 52,882,699 |
| Housing 1.0% |
| Albany Capital Resource Corp., Empire Commons Student Housing, Inc., Revenue Bonds | | |
| Series A | | |
| 5.00%, due 5/1/29 | 600,000 | 609,560 |
| Series A | | |
| 5.00%, due 5/1/30 | 350,000 | 355,494 |
| Amherst Development Corp., UBF Faculty-Student Housing Corp., Revenue Bonds | | |
| Series A, Insured: AGM | | |
| 5.00%, due 10/1/45 | 2,000,000 | 2,022,874 |
| New York City Housing Development Corp., College of Staten Island Residences, Revenue Bonds | | |
| Series A, Insured: AGM | | |
| 3.25%, due 7/1/27 | 2,395,000 | 2,339,857 |
| New York State Dormitory Authority, University Facilities, Revenue Bonds | | |
| Series A | | |
| 5.00%, due 7/1/43 | 1,500,000 | 1,510,930 |
| | Principal
Amount | Value |
| |
| Housing (continued) |
| Onondaga Civic Development Corp., Onondaga Community College Housing Development Corp., Revenue Bonds | | |
| Series A | | |
| 5.00%, due 10/1/24 | $ 400,000 | $ 394,390 |
| Series A | | |
| 5.00%, due 10/1/25 | 250,000 | 242,860 |
| Westchester County Local Development Corp., Purchase Housing Corp. II Project, Revenue Bonds | | |
| 5.00%, due 6/1/29 | 185,000 | 186,499 |
| 5.00%, due 6/1/30 | 330,000 | 332,566 |
| 5.00%, due 6/1/31 | 320,000 | 322,384 |
| 5.00%, due 6/1/37 | 1,000,000 | 970,228 |
| 5.00%, due 6/1/42 | 1,000,000 | 930,824 |
| | | 10,218,466 |
| Other Revenue 38.9% |
| Battery Park City Authority, Revenue Bonds, Senior Lien | | |
| Series A | | |
| 4.00%, due 11/1/44 | 10,635,000 | 9,322,098 |
| Series A | | |
| 5.00%, due 11/1/44 | 9,630,000 | 9,904,797 |
| Series A | | |
| 5.00%, due 11/1/53 | 12,500,000 | 12,665,514 |
| Brookhaven Local Development Corp., Jefferson's Ferry Project, Revenue Bonds | | |
| Series A | | |
| 4.00%, due 11/1/55 | 3,565,000 | 2,494,338 |
| 5.25%, due 11/1/36 | 1,130,000 | 1,098,901 |
| Broome County Local Development Corp., Good Shepherd Village at Endwell, Revenue Bonds | | |
| 4.00%, due 7/1/31 | 1,565,000 | 1,369,570 |
| 4.00%, due 7/1/36 | 2,100,000 | 1,662,303 |
| 4.00%, due 7/1/47 | 1,160,000 | 764,307 |
| Build NYC Resource Corp., Pratt Paper, Inc. Project, Revenue Bonds | | |
| 5.00%, due 1/1/35 (a)(b) | 4,305,000 | 4,200,443 |
| Build NYC Resource Corp., Royal Charter Properties, Inc., Revenue Bonds | | |
| Insured: AGM | | |
| 4.75%, due 12/15/32 | 2,000,000 | 1,906,124 |
The notes to the financial statements are an integral part of, and should be read in conjunction with, the financial statements.
17
Portfolio of Investments October 31, 2023†^ (continued)
| | Principal
Amount | Value |
| Long-Term Municipal Bonds (continued) |
| Other Revenue (continued) |
| Chautauqua Tobacco Asset Securitization Corp., Revenue Bonds | | |
| 5.00%, due 6/1/34 | $ 750,000 | $ 701,882 |
| Children's Trust Fund, Asset-Backed, Revenue Bonds | | |
| Series A | | |
| (zero coupon), due 5/15/50 | 2,500,000 | 403,772 |
| 5.625%, due 5/15/43 | 2,300,000 | 2,311,793 |
| City of New York, Lincoln Center for the Performing Arts, Inc., Revenue Bonds | | |
| Series A | | |
| 4.00%, due 12/1/33 | 5,350,000 | 5,194,980 |
| Development Authority of the North Country, Solid Waste Management System, Revenue Bonds | | |
| Insured: AGM | | |
| 3.25%, due 9/1/39 | 550,000 | 422,857 |
| Insured: AGM | | |
| 3.25%, due 9/1/40 | 570,000 | 430,704 |
| Dutchess County Local Development Corp., Health Quest Systems, Inc., Revenue Bonds | | |
| Series A | | |
| 5.00%, due 7/1/34 | 500,000 | 503,726 |
| Dutchess County Resource Recovery Agency, Solid Waste System, Revenue Bonds (b) | | |
| 5.00%, due 1/1/25 | 1,000,000 | 1,002,942 |
| 5.00%, due 1/1/26 | 1,000,000 | 1,004,795 |
| Erie Tobacco Asset Securitization Corp., Tobacco Settlement, Asset-Backed, Revenue Bonds | | |
| Series B | | |
| (zero coupon), due 6/1/47 | 18,000,000 | 3,034,154 |
| Hudson Yards Infrastructure Corp., Second Indenture, Revenue Bonds | | |
| Series A | | |
| 4.00%, due 2/15/40 | 3,250,000 | 2,896,532 |
| Series A | | |
| 5.00%, due 2/15/31 | 3,085,000 | 3,171,040 |
| Series A | | |
| 5.00%, due 2/15/35 | 3,470,000 | 3,542,239 |
| Series A | | |
| 5.00%, due 2/15/36 | 5,165,000 | 5,246,422 |
| | Principal
Amount | Value |
| |
| Other Revenue (continued) |
Hudson Yards Infrastructure Corp., Second Indenture, Revenue Bonds
(continued) | | |
| Series A | | |
| 5.00%, due 2/15/42 | $ 4,000,000 | $ 3,970,123 |
| Series A, Insured: BAM | | |
| 5.00%, due 2/15/42 | 7,500,000 | 7,443,981 |
| Huntington Local Development Corp., Fountaingate Gardens Project, Revenue Bonds | | |
| Series A | | |
| 5.00%, due 7/1/36 | 900,000 | 745,718 |
| Series A | | |
| 5.25%, due 7/1/56 | 1,745,000 | 1,249,250 |
| Long Island Power Authority, Electric System, Revenue Bonds | | |
| Series B | | |
| 5.00%, due 9/1/33 | 4,440,000 | 4,509,014 |
| Series B | | |
| 5.00%, due 9/1/35 | 2,500,000 | 2,530,231 |
| 5.00%, due 9/1/37 | 2,000,000 | 2,051,816 |
| 5.00%, due 9/1/38 | 2,500,000 | 2,554,887 |
| Series A | | |
| 5.00%, due 9/1/44 | 6,225,000 | 6,158,023 |
| Series B | | |
| 5.00%, due 9/1/45 | 2,000,000 | 1,994,638 |
| Matching Fund Special Purpose Securitization Corp., Revenue Bonds | | |
| Series A | | |
| 5.00%, due 10/1/30 | 3,140,000 | 3,108,127 |
| Series A | | |
| 5.00%, due 10/1/32 | 3,140,000 | 3,087,561 |
| Series A | | |
| 5.00%, due 10/1/39 | 10,915,000 | 10,351,739 |
| Metropolitan Transportation Authority, Dedicated Tax Fund, Revenue Bonds | | |
| Series B-2 | | |
| 4.00%, due 11/15/34 | 4,000,000 | 3,891,442 |
| Series A | | |
| 5.00%, due 11/15/49 | 2,000,000 | 1,982,873 |
| Monroe County Industrial Development Corp., St. Ann's Community Project, Revenue Bonds | | |
| 5.00%, due 1/1/50 | 1,630,000 | 1,214,627 |
The notes to the financial statements are an integral part of, and should be read in conjunction with, the financial statements.
| 18 | MainStay MacKay New York Tax Free Opportunities Fund |
| | Principal
Amount | Value |
| Long-Term Municipal Bonds (continued) |
| Other Revenue (continued) |
| Nassau County Tobacco Settlement Corp., Tobacco Settlement, Asset-Backed, Revenue Bonds | | |
| Series A-3 | | |
| 5.00%, due 6/1/35 | $ 750,000 | $ 658,284 |
| New York City Housing Development Corp., Multi-Family Housing, Sustainable Neighborhood, Revenue Bonds | | |
| Series F-2A, Insured: FHA 542(C) | | |
| 3.40%, due 11/1/62 (c) | 4,000,000 | 3,837,313 |
| Series G | | |
| 3.85%, due 11/1/45 | 595,000 | 468,959 |
| Series I-1-A | | |
| 4.05%, due 11/1/41 | 1,000,000 | 885,148 |
| Series F-1, Insured: FHA 542(C) | | |
| 4.30%, due 11/1/37 | 1,500,000 | 1,357,657 |
| New York City Housing Development Corp., Multi-Family Housing, Sustainable Neighborhood, Green Bond, Revenue Bonds | | |
| Series G-1 | | |
| 3.70%, due 11/1/47 | 1,000,000 | 769,886 |
| New York City Industrial Development Agency, Queens Baseball Stadium Project, Revenue Bonds | | |
| Series A, Insured: AGM | | |
| 3.00%, due 1/1/39 | 6,955,000 | 5,246,601 |
| Series A, Insured: AGM | | |
| 3.00%, due 1/1/40 | 8,315,000 | 6,153,684 |
| Series A, Insured: AGM | | |
| 3.00%, due 1/1/46 | 10,000,000 | 6,673,477 |
| New York City Industrial Development Agency, TrIPs Obligated Group, Revenue Bonds | | |
| Series A | | |
| 5.00%, due 7/1/28 | 1,295,000 | 1,271,708 |
| New York City Industrial Development Agency, Yankee Stadium Project, Revenue Bonds | | |
| Series A, Insured: AGC | | |
| (zero coupon), due 3/1/40 | 380,000 | 159,860 |
| Series A, Insured: AGC | | |
| (zero coupon), due 3/1/44 | 1,065,000 | 349,246 |
| Series A, Insured: AGC | | |
| (zero coupon), due 3/1/45 | 200,000 | 61,628 |
| | Principal
Amount | Value |
| |
| Other Revenue (continued) |
| New York City Industrial Development Agency, Yankee Stadium Project, Revenue Bonds (continued) | | |
| Series A, Insured: AGC | | |
| (zero coupon), due 3/1/46 | $ 4,080,000 | $ 1,180,523 |
| Series A, Insured: AGC | | |
| (zero coupon), due 3/1/47 | 1,115,000 | 303,470 |
| Series A, Insured: AGM-CR | | |
| 3.00%, due 3/1/49 | 10,980,000 | 7,099,930 |
| New York City Transitional Finance Authority, Building Aid, Revenue Bonds | | |
| Series S-1B, Insured: State Aid Withholding | | |
| 4.00%, due 7/15/40 | 6,000,000 | 5,366,593 |
| Series S-3, Insured: State Aid Withholding | | |
| 5.00%, due 7/15/43 | 2,500,000 | 2,511,031 |
| New York City Transitional Finance Authority, Future Tax Secured, Revenue Bonds | | |
| Series C-2 | | |
| 1.58%, due 5/1/24 | 345,000 | 338,113 |
| Series C-1 | | |
| 4.00%, due 5/1/44 | 4,000,000 | 3,476,252 |
| Series E-1 | | |
| 4.00%, due 2/1/46 | 5,440,000 | 4,665,417 |
| Series B-1 | | |
| 5.00%, due 11/1/36 | 19,585,000 | 20,260,434 |
| Series F-1 | | |
| 5.00%, due 2/1/47 | 5,000,000 | 5,017,625 |
| Series D-1 | | |
| 5.50%, due 11/1/45 | 2,500,000 | 2,634,924 |
| Series B | | |
| 5.50%, due 5/1/47 | 2,830,000 | 2,982,096 |
| New York Convention Center Development Corp., Hotel Unit Fee, Revenue Bonds | | |
| 5.00%, due 11/15/26 | 6,000,000 | 6,020,693 |
| 5.00%, due 11/15/40 | 1,620,000 | 1,584,882 |
| New York Convention Center Development Corp., Hotel Unit Fee, Revenue Bonds, Senior Lien | | |
| Series A | | |
| (zero coupon), due 11/15/47 | 6,500,000 | 1,611,857 |
The notes to the financial statements are an integral part of, and should be read in conjunction with, the financial statements.
19
Portfolio of Investments October 31, 2023†^ (continued)
| | Principal
Amount | Value |
| Long-Term Municipal Bonds (continued) |
| Other Revenue (continued) |
| New York Convention Center Development Corp., Hotel Unit Fee, Revenue Bonds, Sub. Lien | | |
| Series B, Insured: BAM | | |
| (zero coupon), due 11/15/41 | $ 2,320,000 | $ 836,430 |
| Series B, Insured: BAM | | |
| (zero coupon), due 11/15/43 | 4,800,000 | 1,517,111 |
| New York Counties Tobacco Trust IV, Settlement Pass Through, Revenue Bonds | | |
| Series A | | |
| 5.00%, due 6/1/42 | 1,000,000 | 876,649 |
| Series A | | |
| 5.00%, due 6/1/45 | 245,000 | 209,746 |
| Series A | | |
| 6.25%, due 6/1/41 (a) | 4,700,000 | 4,538,255 |
| New York Counties Tobacco Trust V, Pass Through, Capital Appreciation, Revenue Bonds | | |
| Series S-1 | | |
| (zero coupon), due 6/1/38 | 1,600,000 | 603,661 |
| New York Counties Tobacco Trust VI, Tobacco Settlement Pass Through, Revenue Bonds | | |
| Series B | | |
| 5.00%, due 6/1/30 | 135,000 | 137,061 |
| New York Liberty Development Corp., 1 World Trade Center, Revenue Bonds | | |
| Insured: BAM | | |
| 2.75%, due 2/15/44 | 8,000,000 | 5,359,798 |
| Insured: AGM-CR | | |
| 4.00%, due 2/15/43 | 6,665,000 | 5,655,135 |
| New York Liberty Development Corp., 3 World Trade Center LLC, Revenue Bonds | | |
| Class 1 | | |
| 5.00%, due 11/15/44 (a) | 5,660,000 | 5,069,381 |
| New York Liberty Development Corp., 4 World Trade Center LLC, Revenue Bonds | | |
| Series A | | |
| 2.75%, due 11/15/41 | 3,515,000 | 2,405,040 |
| | Principal
Amount | Value |
| |
| Other Revenue (continued) |
| New York Liberty Development Corp., 7 World Trade Center Project, Revenue Bonds | | |
| Series A | | |
| 3.00%, due 9/15/43 | $ 1,250,000 | $ 874,066 |
| New York Liberty Development Corp., Goldman Sachs Headquarters LLC, Revenue Bonds | | |
| 5.50%, due 10/1/37 | 700,000 | 727,687 |
| New York State Dormitory Authority, Personal Income Tax, Revenue Bonds | | |
| Series A | | |
| 5.00%, due 2/15/41 | 2,050,000 | 2,063,557 |
| New York State Dormitory Authority, Sales Tax, Revenue Bonds | | |
| Series A | | |
| 5.00%, due 3/15/35 | 3,000,000 | 2,989,916 |
| New York State Dormitory Authority, State Personal Income Tax, Revenue Bonds | | |
| Series A | | |
| 4.00%, due 3/15/39 | 8,000,000 | 7,203,645 |
| Series E | | |
| 4.00%, due 3/15/45 | 2,000,000 | 1,732,241 |
| New York State Energy Research & Development Authority, New York State Electric & Gas Corp., Revenue Bonds | | |
| Series D | | |
| 3.50%, due 10/1/29 | 2,500,000 | 2,314,431 |
| Series C | | |
| 4.00%, due 4/1/34 | 3,000,000 | 2,798,114 |
| New York State Energy Research & Development Authority, Revolving Loan Fund, Revenue Bonds | | |
| Series A | | |
| 6.096%, due 4/1/27 | 1,755,000 | 1,740,257 |
| Series A | | |
| 6.146%, due 4/1/28 | 1,350,000 | 1,332,679 |
| Series A | | |
| 6.205%, due 4/1/29 | 1,105,000 | 1,085,823 |
| Series A | | |
| 6.255%, due 4/1/30 | 1,050,000 | 1,027,091 |
| Series A | | |
| 6.308%, due 4/1/31 | 1,000,000 | 973,418 |
The notes to the financial statements are an integral part of, and should be read in conjunction with, the financial statements.
| 20 | MainStay MacKay New York Tax Free Opportunities Fund |
| | Principal
Amount | Value |
| Long-Term Municipal Bonds (continued) |
| Other Revenue (continued) |
| New York State Housing Finance Agency, Revenue Bonds | | |
| Series G-2, Insured: SONYMA HUD Sector 8 | | |
| 3.45%, due 5/1/62 (c) | $ 5,750,000 | $ 5,626,200 |
| Series C, Insured: FHA 542(C) | | |
| 4.15%, due 5/1/47 | 12,470,000 | 10,089,660 |
| New York State Urban Development Corp., Personal Income Tax, Revenue Bonds | | |
| Series E | | |
| 4.00%, due 3/15/43 | 2,885,000 | 2,520,172 |
| New York State Urban Development Corp., Sales Tax, Revenue Bonds | | |
| Series A | | |
| 4.00%, due 3/15/37 | 4,000,000 | 3,787,543 |
| New York Transportation Development Corp., American Airlines, Inc. John F. Kennedy International Airport Project, Revenue Bonds | | |
| 5.25%, due 8/1/31 (b) | 1,290,000 | 1,288,765 |
| New York Transportation Development Corp., Delta Air Lines, Inc. - LaGuardia Airport Terminals C&D Redevelopment Project, Revenue Bonds (b) | | |
| 4.375%, due 10/1/45 | 6,200,000 | 5,124,998 |
| 5.00%, due 10/1/35 | 3,000,000 | 2,852,770 |
| New York Transportation Development Corp., New York State Thruway Service Areas Project, Revenue Bonds (b) | | |
| 4.00%, due 10/31/46 | 2,595,000 | 2,058,519 |
| 4.00%, due 4/30/53 | 2,505,000 | 1,885,424 |
| Niagara Tobacco Asset Securitization Corp., Tobacco Settlement, Asset-Backed, Revenue Bonds | | |
| 5.25%, due 5/15/40 | 500,000 | 472,518 |
| Puerto Rico Sales Tax Financing Corp., Revenue Bonds | | |
| Series A-2 | | |
| 4.784%, due 7/1/58 | 15,807,000 | 13,295,323 |
| Series A-1 | | |
| 5.00%, due 7/1/58 | 1,189,000 | 1,040,979 |
| | Principal
Amount | Value |
| |
| Other Revenue (continued) |
| Rockland Tobacco Asset Securitization Corp., Tobacco Settlement, Asset-Backed, Revenue Bonds | | |
| Series B | | |
| (zero coupon), due 8/15/50 (a) | $ 13,000,000 | $ 2,021,571 |
| Southold Local Development Corp., Peconic Landing, Inc. Project, Revenue Bonds | | |
| 5.00%, due 12/1/45 | 1,625,000 | 1,385,147 |
| State of New York, Mortgage Agency, Revenue Bonds | | |
| Series 221 | | |
| 3.50%, due 10/1/32 (b) | 4,240,000 | 4,057,531 |
| Series 213 | | |
| 4.25%, due 10/1/47 | 455,000 | 447,136 |
| Suffolk County Economic Development Corp., Peconic Landing at Southold, Inc., Revenue Bonds | | |
| Series A | | |
| 5.00%, due 12/1/29 | 175,000 | 169,952 |
| Series A | | |
| 5.00%, due 12/1/34 | 165,000 | 153,896 |
| Series A | | |
| 5.00%, due 12/1/40 | 175,000 | 155,764 |
| Suffolk Tobacco Asset Securitization Corp., Tobacco Settlement, Asset Backed, Revenue Bonds | | |
| Series A-1 | | |
| 1.015%, due 6/1/24 | 1,000,000 | 973,832 |
| Territory of Guam, Business Privilege Tax, Revenue Bonds | | |
| Series F | | |
| 4.00%, due 1/1/36 | 2,000,000 | 1,799,279 |
| Series D | | |
| 4.00%, due 11/15/39 | 1,005,000 | 809,846 |
| Series D | | |
| 5.00%, due 11/15/27 | 2,825,000 | 2,815,636 |
| Territory of Guam, Section 30, Revenue Bonds | | |
| Series A | | |
| 5.00%, due 12/1/36 | 1,020,000 | 979,968 |
| Tompkins County Development Corp., Kendal at Ithaca Project, Revenue Bonds | | |
| Series 2014A | | |
| 5.00%, due 7/1/44 | 690,000 | 600,733 |
The notes to the financial statements are an integral part of, and should be read in conjunction with, the financial statements.
21
Portfolio of Investments October 31, 2023†^ (continued)
| | Principal
Amount | Value |
| Long-Term Municipal Bonds (continued) |
| Other Revenue (continued) |
| Triborough Bridge & Tunnel Authority, MTA Bridges & Tunnels, Revenue Bonds | | |
| Series A | | |
| 5.00%, due 5/15/48 | $ 5,000,000 | $ 5,030,061 |
| Series A | | |
| 5.50%, due 5/15/63 | 10,450,000 | 10,865,227 |
| Triborough Bridge & Tunnel Authority, MTA Bridges & Tunnels, Revenue Bonds, Senior Lien | | |
| Series C | | |
| 5.25%, due 11/15/40 | 9,500,000 | 9,981,545 |
| Series C | | |
| 5.25%, due 11/15/42 | 1,000,000 | 1,043,386 |
| Series C | | |
| 5.25%, due 5/15/52 | 9,885,000 | 10,055,231 |
| TSASC, Inc., Tobacco Settlement Bonds, Revenue Bonds | | |
| Series A | | |
| 5.00%, due 6/1/41 | 2,000,000 | 1,958,697 |
| Series B | | |
| 5.00%, due 6/1/48 | 9,890,000 | 8,314,491 |
| Virgin Islands Public Finance Authority, Gross Receipts Taxes Loan, Revenue Bonds | | |
| Series A | | |
| 5.00%, due 10/1/29 (a) | 1,000,000 | 919,650 |
| Series A | | |
| 5.00%, due 10/1/32 | 1,000,000 | 887,725 |
| Series A, Insured: AGM-CR | | |
| 5.00%, due 10/1/32 | 1,200,000 | 1,194,860 |
| Westchester County Local Development Corp., Kendal on Hudson Project, Revenue Bonds | | |
| Series B | | |
| 5.00%, due 1/1/51 | 2,500,000 | 2,134,173 |
| Westchester County Local Development Corp., Miriam Osborn Memorial Home Association Project, Revenue Bonds | | |
| 5.00%, due 7/1/27 | 270,000 | 272,357 |
| 5.00%, due 7/1/28 | 270,000 | 273,566 |
| 5.00%, due 7/1/29 | 100,000 | 101,335 |
| 5.00%, due 7/1/34 | 200,000 | 202,384 |
| | Principal
Amount | Value |
| |
| Other Revenue (continued) |
| Westchester Tobacco Asset Securitization Corp., Tobacco Settlement, Asset-Backed, Revenue Bonds, Senior Lien | | |
| Series B | | |
| 5.00%, due 6/1/41 | $ 250,000 | $ 248,170 |
| Yonkers Industrial Development Agency, New Community School Project, Revenue Bonds | | |
| Insured: State Aid Withholding | | |
| 5.25%, due 5/1/51 | 1,280,000 | 1,303,883 |
| | | 400,318,669 |
| Transportation 12.8% |
| Albany County Airport Authority, Revenue Bonds | | |
| 4.00%, due 12/15/44 | 835,000 | 711,253 |
| Series A | | |
| 5.00%, due 12/15/43 | 1,750,000 | 1,706,109 |
| Series A | | |
| 5.00%, due 12/15/48 | 2,585,000 | 2,509,287 |
| Buffalo & Fort Erie Public Bridge Authority, Revenue Bonds | | |
| 5.00%, due 1/1/47 | 2,095,000 | 2,059,220 |
| Metropolitan Transportation Authority, Revenue Bonds | | |
| Series D | | |
| 5.00%, due 11/15/29 | 550,000 | 560,839 |
| Series B | | |
| 5.00%, due 11/15/40 | 2,500,000 | 2,463,204 |
| Series A-2, Insured: AGM | | |
| 5.00%, due 11/15/44 | 9,000,000 | 8,895,852 |
| Series B, Insured: BAM | | |
| 5.00%, due 11/15/52 | 8,425,000 | 8,229,772 |
| Metropolitan Transportation Authority, Climate Certified Green Bond, Revenue Bonds | | |
| Series C, Insured: AGM | | |
| 4.00%, due 11/15/47 | 5,920,000 | 4,883,033 |
| Metropolitan Transportation Authority, Green Bond, Revenue Bonds | | |
| Series C-2, Insured: BAM | | |
| (zero coupon), due 11/15/40 | 9,325,000 | 3,735,211 |
| Series A-1, Insured: AGM | | |
| 4.00%, due 11/15/42 | 2,180,000 | 1,877,721 |
| Series C, Insured: AGM | | |
| 4.00%, due 11/15/46 | 1,600,000 | 1,329,380 |
The notes to the financial statements are an integral part of, and should be read in conjunction with, the financial statements.
| 22 | MainStay MacKay New York Tax Free Opportunities Fund |
| | Principal
Amount | Value |
| Long-Term Municipal Bonds (continued) |
| Transportation (continued) |
Metropolitan Transportation Authority, Green Bond, Revenue Bonds
(continued) | | |
| Series D | | |
| 4.00%, due 11/15/48 | $ 300,000 | $ 244,259 |
| New York State Thruway Authority, Revenue Bonds | | |
| Series L | | |
| 4.00%, due 1/1/36 | 2,500,000 | 2,353,657 |
| Series O | | |
| 4.00%, due 1/1/39 | 6,000,000 | 5,326,169 |
| Series B, Insured: AGM | | |
| 4.00%, due 1/1/45 | 4,450,000 | 3,743,141 |
| New York State Thruway Authority, General Revenue Junior Indebtedness Obligation, Revenue Bonds, Junior Lien | | |
| Series B, Insured: BAM | | |
| 4.00%, due 1/1/45 | 9,050,000 | 7,670,728 |
| New York Transportation Development Corp., LaGuardia Airport Terminal B Redevelopment Project, Revenue Bonds | | |
| Series A | | |
| 5.00%, due 7/1/41 (b) | 3,000,000 | 2,848,847 |
| New York Transportation Development Corp., Terminal 4 John F. Kennedy International Airport Project, Revenue Bonds (b) | | |
| Series A | | |
| 4.00%, due 12/1/41 | 1,300,000 | 1,067,024 |
| Series A | | |
| 5.00%, due 12/1/29 | 1,250,000 | 1,267,889 |
| Series A | | |
| 5.00%, due 12/1/36 | 1,600,000 | 1,593,504 |
| 5.00%, due 12/1/37 | 4,000,000 | 3,929,632 |
| Niagara Frontier Transportation Authority, Buffalo Niagara International Airport, Revenue Bonds (b) | | |
| Series A | | |
| 5.00%, due 4/1/24 | 490,000 | 490,720 |
| Series A | | |
| 5.00%, due 4/1/27 | 610,000 | 605,955 |
| Series A | | |
| 5.00%, due 4/1/29 | 325,000 | 321,803 |
| | Principal
Amount | Value |
| |
| Transportation (continued) |
| Niagara Frontier Transportation Authority, Buffalo Niagara International Airport, Revenue Bonds (b) (continued) | | |
| Series A | | |
| 5.00%, due 4/1/29 | $ 600,000 | $ 611,654 |
| Series A | | |
| 5.00%, due 4/1/30 | 375,000 | 379,283 |
| Series A | | |
| 5.00%, due 4/1/31 | 1,350,000 | 1,365,032 |
| Series A | | |
| 5.00%, due 4/1/32 | 400,000 | 404,353 |
| Series A | | |
| 5.00%, due 4/1/34 | 450,000 | 454,239 |
| Series A | | |
| 5.00%, due 4/1/35 | 400,000 | 401,634 |
| Series A | | |
| 5.00%, due 4/1/36 | 600,000 | 588,842 |
| Series A | | |
| 5.00%, due 4/1/38 | 375,000 | 364,186 |
| Ogdensburg Bridge and Port Authority, Revenue Bonds | | |
| 5.75%, due 7/1/47 (a)(b) | 1,985,000 | 1,601,539 |
| Port Authority of Guam, Revenue Bonds | | |
| Series B | | |
| 5.00%, due 7/1/36 (b) | 625,000 | 628,531 |
| Series B | | |
| 5.00%, due 7/1/37 (b) | 200,000 | 199,711 |
| Series A | | |
| 5.00%, due 7/1/48 | 1,235,000 | 1,139,573 |
| Port Authority of New York & New Jersey, Revenue Bonds (b) | | |
| Series 214 | | |
| 4.00%, due 9/1/43 | 3,000,000 | 2,508,121 |
| Series 223 | | |
| 4.00%, due 7/15/46 | 3,000,000 | 2,422,050 |
| Series 178 | | |
| 5.00%, due 12/1/31 | 16,745,000 | 16,762,737 |
| Series 231 | | |
| 5.50%, due 8/1/47 | 4,000,000 | 4,075,728 |
| Port Authority of New York & New Jersey, Revenue Bonds, Third Series | | |
| Series 193 | | |
| 5.00%, due 10/15/34 (b) | 5,775,000 | 5,827,783 |
The notes to the financial statements are an integral part of, and should be read in conjunction with, the financial statements.
23
Portfolio of Investments October 31, 2023†^ (continued)
| | Principal
Amount | Value |
| Long-Term Municipal Bonds (continued) |
| Transportation (continued) |
| Port Authority of New York & New Jersey, Consolidated 178th, Revenue Bonds | | |
| Series 178 | | |
| 5.00%, due 12/1/38 (b) | $ 1,500,000 | $ 1,501,589 |
| Port Authority of New York & New Jersey, Consolidated 1st, Revenue Bonds | | |
| Series 207 | | |
| 5.00%, due 9/15/48 (b) | 2,400,000 | 2,294,611 |
| Syracuse Regional Airport Authority, Revenue Bonds (b) | | |
| 5.00%, due 7/1/26 | 1,000,000 | 1,005,636 |
| 5.00%, due 7/1/31 | 1,000,000 | 1,013,577 |
| 5.00%, due 7/1/34 | 775,000 | 777,849 |
| Triborough Bridge & Tunnel Authority, MTA Bridges & Tunnels, Revenue Bonds | | |
| Series A | | |
| 4.00%, due 11/15/54 | 5,000,000 | 4,114,581 |
| Series C-2 | | |
| 5.00%, due 11/15/42 | 1,000,000 | 1,006,786 |
| Series A | | |
| 5.50%, due 11/15/57 | 10,000,000 | 10,314,691 |
| | | 132,188,525 |
| Utilities 3.4% |
| Guam Power Authority, Revenue Bonds | | |
| Series A | | |
| 5.00%, due 10/1/33 | 1,055,000 | 1,060,920 |
| Series A | | |
| 5.00%, due 10/1/40 | 3,600,000 | 3,396,145 |
| New York Power Authority, Revenue Bonds | | |
| Series A | | |
| 4.00%, due 11/15/50 | 3,500,000 | 2,900,023 |
| New York Power Authority, Green Transmission Project, Revenue Bonds | | |
| Series A, Insured: AGM | | |
| 4.00%, due 11/15/47 | 2,620,000 | 2,216,973 |
| Series A, Insured: AGM | | |
| 4.00%, due 11/15/52 | 8,175,000 | 6,735,075 |
| | Principal
Amount | Value |
| |
| Utilities (continued) |
| Puerto Rico Electric Power Authority, Revenue Bonds | | |
| Series UU, Insured: AGM | | |
| 4.31%, due 7/1/29 | $ 5,000,000 | $ 4,698,997 |
| Series TT, Insured: NATL-RE | | |
| 5.00%, due 7/1/26 | 215,000 | 215,113 |
| Series XX | | |
| 5.25%, due 7/1/40 (d)(e) | 5,630,000 | 1,421,575 |
| Utility Debt Securitization Authority, Revenue Bonds | | |
| 5.00%, due 12/15/38 | 10,210,000 | 10,381,090 |
| 5.00%, due 12/15/39 | 2,250,000 | 2,284,366 |
| | | 35,310,277 |
| Water & Sewer 9.0% |
| Albany Municipal Water Finance Authority, Revenue Bonds | | |
| Series A | | |
| 4.00%, due 12/1/50 | 5,670,000 | 4,720,593 |
| Buffalo Municipal Water Finance Authority, Revenue Bonds | | |
| Series A, Insured: AGM | | |
| 5.00%, due 7/1/44 | 1,500,000 | 1,547,795 |
| Guam Government Waterworks Authority, Water and Wastewater System, Revenue Bonds | | |
| Series A | | |
| 5.00%, due 7/1/35 | 4,000,000 | 3,973,872 |
| 5.00%, due 1/1/46 | 3,365,000 | 3,085,693 |
| Series A | | |
| 5.00%, due 1/1/50 | 9,975,000 | 8,962,965 |
| Monroe County Water Authority, Water System, Revenue Bonds | | |
| 3.50%, due 3/1/45 | 2,000,000 | 1,557,594 |
| 5.00%, due 8/1/37 | 750,000 | 750,785 |
| New York City Municipal Water Finance Authority, Water & Sewer System Second General Resolution, Revenue Bonds | | |
| Series EE | | |
| 4.00%, due 6/15/45 | 2,000,000 | 1,723,805 |
| Series AA | | |
| 5.00%, due 6/15/38 | 3,500,000 | 3,553,244 |
| Series HH | | |
| 5.00%, due 6/15/39 | 3,500,000 | 3,502,970 |
| Series AA | | |
| 5.00%, due 6/15/40 | 2,250,000 | 2,301,862 |
The notes to the financial statements are an integral part of, and should be read in conjunction with, the financial statements.
| 24 | MainStay MacKay New York Tax Free Opportunities Fund |
| | Principal
Amount | Value |
| Long-Term Municipal Bonds (continued) |
| Water & Sewer (continued) |
New York City Municipal Water Finance Authority, Water & Sewer System Second General Resolution, Revenue Bonds
(continued) | | |
| Series GG-1 | | |
| 5.00%, due 6/15/48 | $ 1,000,000 | $ 1,005,541 |
| Series DD-2 | | |
| 5.25%, due 6/15/47 | 6,435,000 | 6,657,515 |
| Series AA-1 | | |
| 5.25%, due 6/15/52 | 18,280,000 | 18,786,435 |
| New York State Environmental Facilities Corp., Revolving Loan Fund, Revenue Bonds | | |
| Series A | | |
| 5.00%, due 6/15/51 | 2,000,000 | 2,016,893 |
| New York State Environmental Facilities Corp., State Revolving Fund, Revenue Bonds | | |
| Series B | | |
| 5.00%, due 9/15/47 | 7,650,000 | 7,750,039 |
| Series A | | |
| 5.00%, due 2/15/49 | 6,500,000 | 6,558,183 |
| Series B | | |
| 5.25%, due 9/15/52 | 4,850,000 | 5,009,619 |
| Niagara Falls Public Water Authority, Water & Sewer System, Revenue Bonds | | |
| Series A | | |
| 5.00%, due 7/15/34 | 770,000 | 789,065 |
| Puerto Rico Commonwealth Aqueduct & Sewer Authority, Revenue Bonds | | |
| Series B | | |
| 5.00%, due 7/1/37 (a) | 545,000 | 513,975 |
| Puerto Rico Commonwealth Aqueduct & Sewer Authority, Revenue Bonds, Senior Lien (a) | | |
| Series 2020A | | |
| 5.00%, due 7/1/35 | 5,455,000 | 5,231,113 |
| Series A | | |
| 5.00%, due 7/1/47 | 2,500,000 | 2,223,542 |
| | | 92,223,098 |
Total Municipal Bonds
(Cost $1,077,703,777) | | 989,043,441 |
| |
| | Shares | | Value |
| Closed-End Funds 0.2% |
| New York 0.2% |
| BlackRock New York Municipal Income Trust | 12,602 | | $ 110,645 |
| Eaton Vance New York Municipal Bond Fund | 12,636 | | 99,319 |
| Nuveen New York AMT-Free Quality Municipal Income Fund | 171,267 | | 1,553,392 |
Total Closed-End Funds
(Cost $2,679,437) | | | 1,763,356 |
| Short-Term Investment 1.4% |
| Unaffiliated Investment Company 1.4% |
| BlackRock Liquidity Funds MuniCash, 3.821% (f) | 14,608,598 | | 14,608,598 |
Total Short-Term Investment
(Cost $14,608,598) | | | 14,608,598 |
Total Investments
(Cost $1,094,991,812) | 97.6% | | 1,005,415,395 |
| Other Assets, Less Liabilities | 2.4 | | 24,699,865 |
| Net Assets | 100.0% | | $ 1,030,115,260 |
| † | Percentages indicated are based on Fund net assets. |
| ^ | Industry classifications may be different than those used for compliance monitoring purposes. |
| (a) | May be sold to institutional investors only under Rule 144A or securities offered pursuant to Section 4(a)(2) of the Securities Act of 1933, as amended. |
| (b) | Interest on these securities was subject to alternative minimum tax. |
| (c) | Coupon rate may change based on changes of the underlying collateral or prepayments of principal. Rate shown was the rate in effect as of October 31, 2023. |
| (d) | Issue in default. |
| (e) | Issue in non-accrual status. |
| (f) | Current yield as of October 31, 2023. |
| Abbreviation(s): |
| AGC—Assured Guaranty Corp. |
| AGM—Assured Guaranty Municipal Corp. |
| AMBAC—Ambac Assurance Corp. |
| BAM—Build America Mutual Assurance Co. |
| CR—Custodial Receipts |
| FHA—Federal Housing Administration |
| HUD—Housing and Urban Development |
The notes to the financial statements are an integral part of, and should be read in conjunction with, the financial statements.
25
Portfolio of Investments October 31, 2023†^ (continued)
| MTA—Metropolitan Transportation Authority |
| NATL-RE—National Public Finance Guarantee Corp. |
| SONYMA—State of New York Mortgage Agency |
The following is a summary of the fair valuations according to the inputs used as of October 31, 2023, for valuing the Fund’s assets:
| Description | Quoted
Prices in
Active
Markets for
Identical
Assets
(Level 1) | | Significant
Other
Observable
Inputs
(Level 2) | | Significant
Unobservable
Inputs
(Level 3) | | Total |
| Asset Valuation Inputs | | | | | | | |
| Investments in Securities (a) | | | | | | | |
| Municipal Bonds | | | | | | | |
| Long-Term Municipal Bonds | $ — | | $ 989,043,441 | | $ — | | $ 989,043,441 |
| Closed-End Funds | 1,763,356 | | — | | — | | 1,763,356 |
| Short-Term Investment | | | | | | | |
| Unaffiliated Investment Company | 14,608,598 | | — | | — | | 14,608,598 |
| Total Investments in Securities | $ 16,371,954 | | $ 989,043,441 | | $ — | | $ 1,005,415,395 |
| (a) | For a complete listing of investments and their industries, see the Portfolio of Investments. |
The notes to the financial statements are an integral part of, and should be read in conjunction with, the financial statements.
| 26 | MainStay MacKay New York Tax Free Opportunities Fund |
Statement of Assets and Liabilities as of October 31, 2023
| Assets |
Investment in securities, at value
(identified cost $1,094,991,812) | $1,005,415,395 |
| Receivables: | |
| Dividends and interest | 15,382,727 |
| Investment securities sold | 11,499,637 |
| Fund shares sold | 7,305,497 |
| Other assets | 19,329 |
| Total assets | 1,039,622,585 |
| Liabilities |
| Payables: | |
| Fund shares redeemed | 4,826,734 |
| Investment securities purchased | 3,439,620 |
| Manager (See Note 3) | 414,962 |
| NYLIFE Distributors (See Note 3) | 172,104 |
| Transfer agent (See Note 3) | 58,286 |
| Custodian | 24,575 |
| Professional fees | 22,355 |
| Shareholder communication | 1,825 |
| Accrued expenses | 2,189 |
| Distributions payable | 544,675 |
| Total liabilities | 9,507,325 |
| Net assets | $1,030,115,260 |
| Composition of Net Assets |
| Shares of beneficial interest outstanding (par value of $.001 per share) unlimited number of shares authorized | $ 116,385 |
| Additional paid-in-capital | 1,256,109,015 |
| | 1,256,225,400 |
| Total distributable earnings (loss) | (226,110,140) |
| Net assets | $1,030,115,260 |
| Class A | |
| Net assets applicable to outstanding shares | $629,501,083 |
| Shares of beneficial interest outstanding | 71,129,709 |
| Net asset value per share outstanding | $ 8.85 |
| Maximum sales charge (3.00% of offering price) | 0.27 |
| Maximum offering price per share outstanding | $ 9.12 |
| Investor Class | |
| Net assets applicable to outstanding shares | $ 328,935 |
| Shares of beneficial interest outstanding | 37,165 |
| Net asset value per share outstanding | $ 8.85 |
| Maximum sales charge (2.50% of offering price) | 0.23 |
| Maximum offering price per share outstanding | $ 9.08 |
| Class C | |
| Net assets applicable to outstanding shares | $ 61,437,641 |
| Shares of beneficial interest outstanding | 6,941,298 |
| Net asset value and offering price per share outstanding | $ 8.85 |
| Class C2 | |
| Net assets applicable to outstanding shares | $ 1,476,266 |
| Shares of beneficial interest outstanding | 166,880 |
| Net asset value and offering price per share outstanding | $ 8.85 |
| Class I | |
| Net assets applicable to outstanding shares | $334,747,505 |
| Shares of beneficial interest outstanding | 37,813,624 |
| Net asset value and offering price per share outstanding | $ 8.85 |
| Class R6 | |
| Net assets applicable to outstanding shares | $ 2,623,830 |
| Shares of beneficial interest outstanding | 296,456 |
| Net asset value and offering price per share outstanding | $ 8.85 |
The notes to the financial statements are an integral part of, and should be read in conjunction with, the financial statements.
27
Statement of Operations for the year ended October 31, 2023
| Investment Income (Loss) |
| Income | |
| Interest | $ 44,794,895 |
| Dividends | 87,988 |
| Total income | 44,882,883 |
| Expenses | |
| Manager (See Note 3) | 5,066,237 |
| Distribution/Service—Class A (See Note 3) | 1,780,582 |
| Distribution/Service—Investor Class (See Note 3) | 853 |
| Distribution/Service—Class C (See Note 3) | 355,275 |
| Distribution/Service—Class C2 (See Note 3) | 10,889 |
| Transfer agent (See Note 3) | 353,146 |
| Professional fees | 139,930 |
| Custodian | 74,986 |
| Trustees | 29,114 |
| Registration | 24,953 |
| Shareholder communication | 16,873 |
| Miscellaneous | 36,380 |
| Total expenses before waiver/reimbursement | 7,889,218 |
| Expense waiver/reimbursement from Manager (See Note 3) | (66,483) |
| Reimbursement from prior custodian(a) | (2,177) |
| Net expenses | 7,820,558 |
| Net investment income (loss) | 37,062,325 |
| Realized and Unrealized Gain (Loss) |
| Net realized gain (loss) on: | |
| Unaffiliated investment transactions | (65,724,651) |
| Futures transactions | 5,733,026 |
| Net realized gain (loss) | (59,991,625) |
| Net change in unrealized appreciation (depreciation) on: | |
| Unaffiliated investments | 64,327,599 |
| Futures contracts | (11,466,015) |
| Net change in unrealized appreciation (depreciation) | 52,861,584 |
| Net realized and unrealized gain (loss) | (7,130,041) |
| Net increase (decrease) in net assets resulting from operations | $ 29,932,284 |
| (a) | Represents a refund for overbilling of custody fees. |
The notes to the financial statements are an integral part of, and should be read in conjunction with, the financial statements.
| 28 | MainStay MacKay New York Tax Free Opportunities Fund |
Statements of Changes in Net Assets
for the years ended October 31, 2023 and October 31, 2022
| | 2023 | 2022 |
| Increase (Decrease) in Net Assets |
| Operations: | | |
| Net investment income (loss) | $ 37,062,325 | $ 30,094,707 |
| Net realized gain (loss) | (59,991,625) | (37,856,201) |
| Net change in unrealized appreciation (depreciation) | 52,861,584 | (210,871,867) |
| Net increase (decrease) in net assets resulting from operations | 29,932,284 | (218,633,361) |
| Distributions to shareholders: | | |
| Class A | (25,441,676) | (23,036,677) |
| Investor Class | (12,102) | (9,823) |
| Class C | (2,343,374) | (2,420,147) |
| Class C2 | (52,746) | (46,357) |
| Class I | (13,154,264) | (10,162,463) |
| Class R6 | (66,162) | (24,025) |
| Total distributions to shareholders | (41,070,324) | (35,699,492) |
| Capital share transactions: | | |
| Net proceeds from sales of shares | 454,803,941 | 1,065,321,666 |
| Net asset value of shares issued to shareholders in reinvestment of distributions | 34,469,812 | 29,183,591 |
| Cost of shares redeemed | (508,992,997) | (1,155,538,985) |
| Increase (decrease) in net assets derived from capital share transactions | (19,719,244) | (61,033,728) |
| Net increase (decrease) in net assets | (30,857,284) | (315,366,581) |
| Net Assets |
| Beginning of year | 1,060,972,544 | 1,376,339,125 |
| End of year | $1,030,115,260 | $ 1,060,972,544 |
The notes to the financial statements are an integral part of, and should be read in conjunction with, the financial statements.
29
Financial Highlights selected per share data and ratios
| | Year Ended October 31, |
| Class A | 2023 | | 2022 | | 2021 | | 2020 | | 2019 |
| Net asset value at beginning of year | $ 8.89 | | $ 10.94 | | $ 10.63 | | $ 10.68 | | $ 10.12 |
| Net investment income (loss) | 0.30(a) | | 0.24(a) | | 0.22(a) | | 0.29 | | 0.32 |
| Net realized and unrealized gain (loss) | 0.00‡ | | (2.00) | | 0.34 | | (0.04) | | 0.56 |
| Total from investment operations | 0.30 | | (1.76) | | 0.56 | | 0.25 | | 0.88 |
| Less distributions: | | | | | | | | | |
| From net investment income | (0.34) | | (0.29) | | (0.25) | | (0.30) | | (0.32) |
| Net asset value at end of year | $ 8.85 | | $ 8.89 | | $ 10.94 | | $ 10.63 | | $ 10.68 |
| Total investment return (b) | 3.18% | | (16.36)% | | 5.32% | | 2.35% | | 8.84% |
| Ratios (to average net assets)/Supplemental Data: | | | | | | | | | |
| Net investment income (loss) | 3.22% | | 2.37% | | 2.02% | | 2.38% | | 3.00% |
| Net expenses (c) | 0.75% | | 0.75% | | 0.75% | | 0.75% | | 0.75% |
| Expenses (before waiver/reimbursement) (c) | 0.76% | | 0.76% | | 0.76% | | 0.80% | | 0.82% |
| Portfolio turnover rate | 69% | | 53%(d) | | 10%(d) | | 29%(d) | | 28%(d) |
| Net assets at end of year (in 000’s) | $ 629,501 | | $ 690,832 | | $ 907,662 | | $ 688,870 | | $ 462,499 |
| ‡ | Less than one cent per share. |
| (a) | Per share data based on average shares outstanding during the year. |
| (b) | Total investment return is calculated exclusive of sales charges and assumes the reinvestment of dividends and distributions. For periods of less than one year, total return is not annualized. |
| (c) | In addition to the fees and expenses which the Fund bears directly, it also indirectly bears a pro-rata share of the fees and expenses of the underlying funds in which it invests. Such indirect expenses are not included in the above expense ratios. |
| (d) | The portfolio turnover rate includes variable rate demand notes. |
| | Year Ended October 31, |
| Investor Class | 2023 | | 2022 | | 2021 | | 2020 | | 2019 |
| Net asset value at beginning of year | $ 8.89 | | $ 10.94 | | $ 10.63 | | $ 10.68 | | $ 10.13 |
| Net investment income (loss) | 0.30(a) | | 0.24(a) | | 0.22(a) | | 0.25 | | 0.32 |
| Net realized and unrealized gain (loss) | 0.00‡ | | (2.00) | | 0.34 | | 0.00‡ | | 0.55 |
| Total from investment operations | 0.30 | | (1.76) | | 0.56 | | 0.25 | | 0.87 |
| Less distributions: | | | | | | | | | |
| From net investment income | (0.34) | | (0.29) | | (0.25) | | (0.30) | | (0.32) |
| Net asset value at end of year | $ 8.85 | | $ 8.89 | | $ 10.94 | | $ 10.63 | | $ 10.68 |
| Total investment return (b) | 3.15% | | (16.37)% | | 5.32% | | 2.33% | | 8.72% |
| Ratios (to average net assets)/Supplemental Data: | | | | | | | | | |
| Net investment income (loss) | 3.19% | | 2.37% | | 2.03% | | 2.39% | | 3.06% |
| Net expenses (c) | 0.77% | | 0.76% | | 0.76% | | 0.77% | | 0.77% |
| Expenses (before waiver/reimbursement) (c) | 0.78% | | 0.77% | | 0.77% | | 0.82% | | 0.84% |
| Portfolio turnover rate | 69% | | 53%(d) | | 10%(d) | | 29%(d) | | 28%(d) |
| Net assets at end of year (in 000's) | $ 329 | | $ 301 | | $ 375 | | $ 414 | | $ 463 |
| ‡ | Less than one cent per share. |
| (a) | Per share data based on average shares outstanding during the year. |
| (b) | Total investment return is calculated exclusive of sales charges and assumes the reinvestment of dividends and distributions. For periods of less than one year, total return is not annualized. |
| (c) | In addition to the fees and expenses which the Fund bears directly, it also indirectly bears a pro-rata share of the fees and expenses of the underlying funds in which it invests. Such indirect expenses are not included in the above expense ratios. |
| (d) | The portfolio turnover rate includes variable rate demand notes. |
The notes to the financial statements are an integral part of, and should be read in conjunction with, the financial statements.
| 30 | MainStay MacKay New York Tax Free Opportunities Fund |
Financial Highlights selected per share data and ratios
| | Year Ended October 31, |
| Class C | 2023 | | 2022 | | 2021 | | 2020 | | 2019 |
| Net asset value at beginning of year | $ 8.89 | | $ 10.94 | | $ 10.63 | | $ 10.68 | | $ 10.12 |
| Net investment income (loss) | 0.28(a) | | 0.21(a) | | 0.19(a) | | 0.24 | | 0.30 |
| Net realized and unrealized gain (loss) | (0.01) | | (2.00) | | 0.35 | | (0.02) | | 0.56 |
| Total from investment operations | 0.27 | | (1.79) | | 0.54 | | 0.22 | | 0.86 |
| Less distributions: | | | | | | | | | |
| From net investment income | (0.31) | | (0.26) | | (0.23) | | (0.27) | | (0.30) |
| Net asset value at end of year | $ 8.85 | | $ 8.89 | | $ 10.94 | | $ 10.63 | | $ 10.68 |
| Total investment return (b) | 2.89% | | (16.58)% | | 5.05% | | 2.08% | | 8.55% |
| Ratios (to average net assets)/Supplemental Data: | | | | | | | | | |
| Net investment income (loss) | 2.94% | | 2.11% | | 1.77% | | 2.13% | | 2.77% |
| Net expenses (c) | 1.02% | | 1.01% | | 1.01% | | 1.02% | | 1.02% |
| Expenses (before waiver/reimbursement) (c) | 1.03% | | 1.02% | | 1.02% | | 1.07% | | 1.09% |
| Portfolio turnover rate | 69% | | 53%(d) | | 10%(d) | | 29%(d) | | 28%(d) |
| Net assets at end of year (in 000’s) | $ 61,438 | | $ 73,022 | | $ 111,681 | | $ 107,117 | | $ 90,553 |
| (a) | Per share data based on average shares outstanding during the year. |
| (b) | Total investment return is calculated exclusive of sales charges and assumes the reinvestment of dividends and distributions. For periods of less than one year, total return is not annualized. |
| (c) | In addition to the fees and expenses which the Fund bears directly, it also indirectly bears a pro-rata share of the fees and expenses of the underlying funds in which it invests. Such indirect expenses are not included in the above expense ratios. |
| (d) | The portfolio turnover rate includes variable rate demand notes. |
| | Year Ended October 31, | | August 31, 2020^ through
October 31, |
| Class C2 | 2023 | | 2022 | | 2021 | | 2020 |
| Net asset value at beginning of period | $ 8.88 | | $ 10.94 | | $ 10.63 | | $ 10.72 |
| Net investment income (loss) | 0.26(a) | | 0.20(a) | | 0.17(a) | | 0.04 |
| Net realized and unrealized gain (loss) | 0.01 | | (2.02) | | 0.35 | | (0.09) |
| Total from investment operations | 0.27 | | (1.82) | | 0.52 | | (0.05) |
| Less distributions: | | | | | | | |
| From net investment income | (0.30) | | (0.24) | | (0.21) | | (0.04) |
| Net asset value at end of period | $ 8.85 | | $ 8.88 | | $ 10.94 | | $ 10.63 |
| Total investment return (b) | 2.86% | | (16.80)% | | 4.89% | | (0.50)% |
| Ratios (to average net assets)/Supplemental Data: | | | | | | | |
| Net investment income (loss) | 2.79% | | 1.96% | | 1.55% | | 1.32%†† |
| Net expenses (c) | 1.17% | | 1.16% | | 1.15% | | 1.17%†† |
| Expenses (before waiver/reimbursement) (c) | 1.18% | | 1.17% | | 1.16% | | 1.22%†† |
| Portfolio turnover rate | 69% | | 53%(d) | | 10%(d) | | 29%(d) |
| Net assets at end of period (in 000’s) | $ 1,476 | | $ 1,638 | | $ 1,861 | | $ 315 |
| ^ | Inception date. |
| †† | Annualized. |
| (a) | Per share data based on average shares outstanding during the period. |
| (b) | Total investment return is calculated exclusive of sales charges and assumes the reinvestment of dividends and distributions. For periods of less than one year, total return is not annualized. |
| (c) | In addition to the fees and expenses which the Fund bears directly, it also indirectly bears a pro-rata share of the fees and expenses of the underlying funds in which it invests. Such indirect expenses are not included in the above expense ratios. |
| (d) | The portfolio turnover rate includes variable rate demand notes. |
The notes to the financial statements are an integral part of, and should be read in conjunction with, the financial statements.
31
Financial Highlights selected per share data and ratios
| | Year Ended October 31, |
| Class I | 2023 | | 2022 | | 2021 | | 2020 | | 2019 |
| Net asset value at beginning of year | $ 8.89 | | $ 10.94 | | $ 10.63 | | $ 10.68 | | $ 10.13 |
| Net investment income (loss) | 0.33(a) | | 0.26(a) | | 0.25(a) | | 0.32 | | 0.35 |
| Net realized and unrealized gain (loss) | (0.01) | | (2.00) | | 0.34 | | (0.05) | | 0.55 |
| Total from investment operations | 0.32 | | (1.74) | | 0.59 | | 0.27 | | 0.90 |
| Less distributions: | | | | | | | | | |
| From net investment income | (0.36) | | (0.31) | | (0.28) | | (0.32) | | (0.35) |
| Net asset value at end of year | $ 8.85 | | $ 8.89 | | $ 10.94 | | $ 10.63 | | $ 10.68 |
| Total investment return (b) | 3.43% | | (16.15)% | | 5.59% | | 2.61% | | 9.01% |
| Ratios (to average net assets)/Supplemental Data: | | | | | | | | | |
| Net investment income (loss) | 3.46% | | 2.63% | | 2.27% | | 2.64% | | 3.37% |
| Net expenses (c) | 0.50% | | 0.50% | | 0.50% | | 0.50% | | 0.50% |
| Expenses (before waiver/reimbursement) (c) | 0.51% | | 0.51% | | 0.51% | | 0.55% | | 0.57% |
| Portfolio turnover rate | 69% | | 53%(d) | | 10%(d) | | 29%(d) | | 28%(d) |
| Net assets at end of year (in 000’s) | $ 334,748 | | $ 294,456 | | $ 353,955 | | $ 261,819 | | $ 161,203 |
| (a) | Per share data based on average shares outstanding during the year. |
| (b) | Total investment return is calculated exclusive of sales charges and assumes the reinvestment of dividends and distributions. Class I shares are not subject to sales charges. For periods of less than one year, total return is not annualized. |
| (c) | In addition to the fees and expenses which the Fund bears directly, it also indirectly bears a pro-rata share of the fees and expenses of the underlying funds in which it invests. Such indirect expenses are not included in the above expense ratios. |
| (d) | The portfolio turnover rate includes variable rate demand notes. |
| | Year Ended October 31, | | November 1, 2019^ through
October 31, |
| Class R6 | 2023 | | 2022 | | 2021 | | 2020 |
| Net asset value at beginning of period | $ 8.89 | | $ 10.94 | | $ 10.63 | | $ 10.69 |
| Net investment income (loss) | 0.33(a) | | 0.27(a) | | 0.26(a) | | 0.29 |
| Net realized and unrealized gain (loss) | (0.01) | | (2.01) | | 0.33 | | (0.03) |
| Total from investment operations | 0.32 | | (1.74) | | 0.59 | | 0.26 |
| Less distributions: | | | | | | | |
| From net investment income | (0.36) | | (0.31) | | (0.28) | | (0.32) |
| Net asset value at end of period | $ 8.85 | | $ 8.89 | | $ 10.94 | | $ 10.63 |
| Total investment return (b) | 3.45% | | (16.14)% | | 5.61% | | 2.60% |
| Ratios (to average net assets)/Supplemental Data: | | | | | | | |
| Net investment income (loss) | 3.51% | | 2.67% | | 2.34% | | 2.39% |
| Net expenses (c) | 0.48% | | 0.48% | | 0.47% | | 0.48% |
| Expenses (before waiver/reimbursement) (c) | 0.48% | | 0.48% | | 0.49% | | 0.54% |
| Portfolio turnover rate | 69% | | 53%(d) | | 10%(d) | | 29%(d) |
| Net assets at end of period (in 000’s) | $ 2,624 | | $ 724 | | $ 806 | | $ 1,404 |
| ^ | Inception date. |
| (a) | Per share data based on average shares outstanding during the period. |
| (b) | Total investment return is calculated exclusive of sales charges and assumes the reinvestment of dividends and distributions. Class R6 shares are not subject to sales charges. For periods of less than one year, total return is not annualized. |
| (c) | In addition to the fees and expenses which the Fund bears directly, it also indirectly bears a pro-rata share of the fees and expenses of the underlying funds in which it invests. Such indirect expenses are not included in the above expense ratios. |
| (d) | The portfolio turnover rate includes variable rate demand notes. |
The notes to the financial statements are an integral part of, and should be read in conjunction with, the financial statements.
| 32 | MainStay MacKay New York Tax Free Opportunities Fund |
Notes to Financial Statements
Note 1-Organization and Business
MainStay Funds Trust (the “Trust”) was organized as a Delaware statutory trust on April 28, 2009. The Trust is registered under the Investment Company Act of 1940, as amended (the “1940 Act”), as an open-end management investment company, and is comprised of thirty-seven funds (collectively referred to as the “Funds”). These financial statements and notes relate to the MainStay MacKay New York Tax Free Opportunities Fund (the "Fund"), a “diversified” fund, as that term is defined in the 1940 Act, as interpreted or modified by regulatory authorities having jurisdiction, from time to time.
The following table lists the Fund's share classes that have been registered and commenced operations:
| Class | Commenced Operations |
| Class A | May 14, 2012 |
| Investor Class | May 14, 2012 |
| Class C | May 14, 2012 |
| Class C2 | August 31, 2020 |
| Class I | May 14, 2012 |
| Class R6 | November 1, 2019 |
Class A and Investor Class shares are offered at net asset value (“NAV”) per share plus an initial sales charge. No initial sales charge applies to investments of $250,000 or more (and certain other qualified purchases) in Class A and Investor Class shares. However, a contingent deferred sales charge (“CDSC”) of 1.00% may be imposed on certain redemptions made within 18 months of the date of purchase on shares that were purchased without an initial sales charge. Class C and Class C2 shares are offered at NAV without an initial sales charge, although a 1.00% CDSC may be imposed on certain redemptions of such shares made within one year of the date of purchase of Class C and Class C2 shares. Class I and Class R6 shares are offered at NAV without a sales charge. In addition, depending upon eligibility, Class C and Class C2 shares convert to either Class A or Investor Class shares at the end of the calendar quarter eight years after the date they were purchased. Additionally, Investor Class shares may convert automatically to Class A shares based on a shareholder’s account balance as described in the Fund’s prospectus. Under certain circumstances and as may be permitted by the Trust’s multiple class plan pursuant to Rule 18f-3 under the 1940 Act, specified share classes of the Fund may be converted to one or more other share classes of the Fund as disclosed in the capital share transactions within these Notes. The classes of shares have the same voting (except for issues that relate solely to one class), dividend, liquidation and other rights, and the same terms and conditions, except that under distribution plans pursuant to Rule 12b-1 under the 1940 Act, Class C and Class C2 shares are subject to higher distribution and/or service fees than Class A and Investor Class shares. Class I and Class R6 shares are not subject to a distribution and/or service fee.
The Fund's investment objective is to seek current income exempt from federal and New York state and, in some cases, New York local income taxes.
Note 2–Significant Accounting Policies
The Fund is an investment company and accordingly follows the investment company accounting and reporting guidance of the Financial Accounting Standards Board (“FASB”) Accounting Standards Codification Topic 946 Financial Services—Investment Companies. The Fund prepares its financial statements in accordance with generally accepted accounting principles (“GAAP”) in the United States of America and follows the significant accounting policies described below.
(A) Securities Valuation. Investments are usually valued as of the close of regular trading on the New York Stock Exchange (the "Exchange") (usually 4:00 p.m. Eastern time) on each day the Fund is open for business ("valuation date").
Pursuant to Rule 2a-5 under the 1940 Act, the Board of Trustees of the Trust (the "Board") has designated New York Life Investment Management LLC (“New York Life Investments” or the "Manager") as its Valuation Designee (the "Valuation Designee"). The Valuation Designee is responsible for performing fair valuations relating to all investments in the Fund’s portfolio for which market quotations are not readily available; periodically assessing and managing material valuation risks; establishing and applying fair value methodologies; testing fair valuation methodologies; evaluating and overseeing pricing services; ensuring appropriate segregation of valuation and portfolio management functions; providing quarterly, annual and prompt reporting to the Board, as appropriate; identifying potential conflicts of interest; and maintaining appropriate records. The Valuation Designee has established a valuation committee ("Valuation Committee") to assist in carrying out the Valuation Designee’s responsibilities and establish prices of securities for which market quotations are not readily available. The Fund's and the Valuation Designee's policies and procedures ("Valuation Procedures") govern the Valuation Designee’s selection and application of methodologies for determining and calculating the fair value of Fund investments. The Valuation Designee may value the Fund's portfolio securities for which market quotations are not readily available and other Fund assets utilizing inputs from pricing services and other third-party sources. The Valuation Committee meets (in person, via electronic mail or via teleconference) on an ad-hoc basis to determine fair valuations and on a quarterly basis to review fair value events with respect to certain securities for which market quotations are not readily available, including valuation risks and back-testing results, and preview reports to the Board.
The Valuation Committee establishes prices of securities for which market quotations are not readily available based on such methodologies and measurements on a regular basis after considering information that is reasonably available and deemed relevant by the Valuation Committee. The Board shall oversee the Valuation Designee and review fair valuation materials on a prompt, quarterly and annual basis and approve proposed revisions to the Valuation Procedures.
Investments for which market quotations are not readily available are valued at fair value as determined in good faith pursuant to the Valuation Procedures. A market quotation is readily available only when that
Notes to Financial Statements (continued)
quotation is a quoted price (unadjusted) in active markets for identical investments that the Fund can access at the measurement date, provided that a quotation will not be readily available if it is not reliable. "Fair value" is defined as the price the Fund would reasonably expect to receive upon selling an asset or liability in an orderly transaction to an independent buyer in the principal or most advantageous market for the asset or liability. Fair value measurements are determined within a framework that establishes a three-tier hierarchy that maximizes the use of observable market data and minimizes the use of unobservable inputs to establish a classification of fair value measurements for disclosure purposes. "Inputs" refer broadly to the assumptions that market participants would use in pricing the asset or liability, including assumptions about risk, such as the risk inherent in a particular valuation technique used to measure fair value using a pricing model and/or the risk inherent in the inputs for the valuation technique. Inputs may be observable or unobservable. Observable inputs reflect the assumptions market participants would use in pricing the asset or liability based on market data obtained from sources independent of the Fund. Unobservable inputs reflect the Fund’s own assumptions about the assumptions market participants would use in pricing the asset or liability based on the information available. The inputs or methodology used for valuing assets or liabilities may not be an indication of the risks associated with investing in those assets or liabilities. The three-tier hierarchy of inputs is summarized below.
| • | Level 1—quoted prices (unadjusted) in active markets for an identical asset or liability |
| • | Level 2—other significant observable inputs (including quoted prices for a similar asset or liability in active markets, interest rates and yield curves, prepayment speeds, credit risk, etc.) |
| • | Level 3—significant unobservable inputs (including the Fund's own assumptions about the assumptions that market participants would use in measuring fair value of an asset or liability) |
The level of an asset or liability within the fair value hierarchy is based on the lowest level of an input, both individually and in the aggregate, that is significant to the fair value measurement. The aggregate value by input level of the Fund’s assets and liabilities as of October 31, 2023, is included at the end of the Portfolio of Investments.
The Fund may use third-party vendor evaluations, whose prices may be derived from one or more of the following standard inputs, among others:
| • Benchmark yields | • Reported trades |
| • Broker/dealer quotes | • Issuer spreads |
| • Two-sided markets | • Benchmark securities |
| • Bids/offers | • Reference data (corporate actions or material event notices) |
| • Industry and economic events | • Comparable bonds |
| • Monthly payment information | |
An asset or liability for which a market quotation is not readily available is valued by methods deemed reasonable in good faith by the Valuation Committee, following the Valuation Procedures to represent fair value.
Under these procedures, the Valuation Designee generally uses a market-based approach which may use related or comparable assets or liabilities, recent transactions, market multiples, book values and other relevant information. The Valuation Designee may also use an income-based valuation approach in which the anticipated future cash flows of the asset or liability are discounted to calculate fair value. Discounts may also be applied due to the nature and/or duration of any restrictions on the disposition of the asset or liability. Fair value represents a good faith approximation of the value of a security. Fair value determinations involve the consideration of a number of subjective factors, an analysis of applicable facts and circumstances and the exercise of judgment. As a result, it is possible that the fair value for a security determined in good faith in accordance with the Valuation Procedures may differ from valuations for the same security determined for other funds using their own valuation procedures. Although the Valuation Procedures are designed to value a security at the price the Fund may reasonably expect to receive upon the security's sale in an orderly transaction, there can be no assurance that any fair value determination thereunder would, in fact, approximate the amount that the Fund would actually realize upon the sale of the security or the price at which the security would trade if a reliable market price were readily available. During the year ended October 31, 2023, there were no material changes to the fair value methodologies.
Securities which may be valued in this manner include, but are not limited to: (i) a security for which trading has been halted or suspended or otherwise does not have a readily available market quotation on a given day; (ii) a debt security that has recently gone into default and for which there is not a current market quotation; (iii) a security of an issuer that has entered into a restructuring; (iv) a security that has been delisted from a national exchange; (v) a security subject to trading collars for which no or limited trading takes place; and (vi) a security whose principal market has been temporarily closed at a time when, under normal conditions, it would be open. Securities valued in this manner are generally categorized as Level 2 or 3 in the hierarchy. No securities held by the Fund as of October 31, 2023, were fair valued in such a manner.
Investments in mutual funds, including money market funds, are valued at their respective NAVs at the close of business each day on the valuation date. These securities are generally categorized as Level 1 in the hierarchy.
Municipal debt securities are valued at the evaluated mean prices supplied by a pricing agent or broker selected by the Valuation Designee, in consultation with the Subadvisor. The evaluations are market-based measurements processed through a pricing application and represents the pricing agent's good faith determination as to what a holder may receive in an orderly transaction under market conditions. The rules-based logic utilizes valuation techniques that reflect participants' assumptions and vary by asset class and per methodology, maximizing the use of relevant observable data including quoted prices for similar assets, benchmark yield curves and market corroborated inputs. The evaluated bid or mean prices are deemed by the Valuation Designee, in consultation with the Subadvisor, to be representative of market values, at
| 34 | MainStay MacKay New York Tax Free Opportunities Fund |
the regular close of trading of the Exchange on each valuation date. Municipal debt securities purchased on a delayed delivery basis are marked to market daily until settlement at the forward settlement date. Municipal debt securities are generally categorized as Level 2 in the hierarchy.
In calculating NAV, each closed-end fund is valued at market value, which will generally be determined using the last reported official closing or last trading price on the exchange or market on which the security is primarily traded at the time of valuation. Price information on closed-end funds is taken from the exchange where the security is primarily traded. In addition, because closed-end funds and exchange-traded funds trade on a secondary market, their shares may trade at a premium or discount to the actual net asset value of their portfolio securities and their shares may have greater volatility because of the potential lack of liquidity. These closed-end funds are generally categorized as Level 1 in the hierarchy.
Temporary cash investments acquired in excess of 60 days to maturity at the time of purchase are valued using the latest bid prices or using valuations based on a matrix system (which considers such factors as security prices, yields, maturities and ratings), both as furnished by independent pricing services. Temporary cash investments that mature in 60 days or less at the time of purchase ("Short-Term Investments") are valued using the amortized cost method of valuation, unless the use of such method would be inappropriate. The amortized cost method involves valuing a security at its cost on the date of purchase and thereafter assuming a constant amortization to maturity of the difference between such cost and the value on maturity date. Amortized cost approximates the current fair value of a security. Securities valued using the amortized cost method are not valued using quoted prices in an active market and are generally categorized as Level 2 in the hierarchy.
The information above is not intended to reflect an exhaustive list of the methodologies that may be used to value portfolio investments. The Valuation Procedures permit the use of a variety of valuation methodologies in connection with valuing portfolio investments. The methodology used for a specific type of investment may vary based on the market data available or other considerations. The methodologies summarized above may not represent the specific means by which portfolio investments are valued on any particular business day.
(B) Income Taxes. The Fund's policy is to comply with the requirements of the Internal Revenue Code of 1986, as amended (the “Internal Revenue Code”), applicable to regulated investment companies and to distribute all of its taxable income to the shareholders of the Fund within the allowable time limits.
The Manager evaluates the Fund’s tax positions to determine if the tax positions taken meet the minimum recognition threshold in connection with accounting for uncertainties in income tax positions taken or expected to be taken for the purposes of measuring and recognizing tax liabilities in the financial statements. Recognition of tax benefits of an uncertain tax position is permitted only to the extent the position is “more likely than not” to be sustained assuming examination by taxing
authorities. The Manager analyzed the Fund's tax positions taken on federal, state and local income tax returns for all open tax years (for up to three tax years) and has concluded that no provisions for federal, state and local income tax are required in the Fund's financial statements. The Fund's federal, state and local income tax and federal excise tax returns for tax years for which the applicable statutes of limitations have not expired are subject to examination by the Internal Revenue Service and state and local departments of revenue.
(C) Dividends and Distributions to Shareholders. Dividends and distributions are recorded on the ex-dividend date. The Fund intends to declare dividends from net investment income, if any, daily and intends to pay them at least monthly and declares and pays distributions from net realized capital gains, if any, at least annually. Unless a shareholder elects otherwise, all dividends and distributions are reinvested at NAV in the same class of shares of the Fund. Dividends and distributions to shareholders are determined in accordance with federal income tax regulations and may differ from determinations using GAAP.
(D) Security Transactions and Investment Income. The Fund records security transactions on the trade date. Realized gains and losses on security transactions are determined using the identified cost method. Interest income is accrued as earned using the effective interest rate method. Discounts and premiums on securities purchased for the Fund are accreted and amortized, respectively, on the effective interest rate method over the life of the respective securities.
Investment income and realized and unrealized gains and losses on investments of the Fund are allocated pro rata to the separate classes of shares based upon their relative net assets on the date the income is earned or realized and unrealized gains and losses are incurred.
The Fund may place a debt security on non-accrual status and reduce related interest income by ceasing current accruals and writing off all or a portion of any interest receivables when the collection of all or a portion of such interest has become doubtful. A debt security is removed from non-accrual status when the issuer resumes interest payments or when collectability of interest is reasonably assured.
(E) Expenses. Expenses of the Trust are allocated to the individual Funds in proportion to the net assets of the respective Funds when the expenses are incurred, except where direct allocations of expenses can be made. Expenses (other than transfer agent expenses and fees incurred under the shareholder services plans and/or the distribution plans further discussed in Note 3(B)) are allocated to separate classes of shares pro rata based upon their relative net assets on the date the expenses are incurred. The expenses borne by the Fund, including those of related parties to the Fund, are shown in the Statement of Operations.
Additionally, the Fund may invest in mutual funds, which are subject to management fees and other fees that may cause the costs of investing in mutual funds to be greater than the costs of owning the underlying securities directly. These indirect expenses of mutual funds are not included in the amounts shown as expenses in the Statement of Operations or in the expense ratios included in the Financial Highlights.
Notes to Financial Statements (continued)
(F) Use of Estimates. In preparing financial statements in conformity with GAAP, the Manager makes estimates and assumptions that affect the reported amounts and disclosures in the financial statements. Actual results could differ from those estimates and assumptions.
(G) Futures Contracts. A futures contract is an agreement to purchase or sell a specified quantity of an underlying instrument at a specified future date and price, or to make or receive a cash payment based on the value of a financial instrument (e.g., foreign currency, interest rate, security or securities index). The Fund is subject to risks such as market price risk, leverage risk, liquidity risk, counterparty risk, operational risk, legal risk and/or interest rate risk in the normal course of investing in these contracts. Upon entering into a futures contract, the Fund is required to pledge to the broker or futures commission merchant an amount of cash and/or U.S. government securities equal to a certain percentage of the collateral amount, known as the “initial margin.” During the period the futures contract is open, changes in the value of the contract are recognized as unrealized appreciation or depreciation by marking to market such contract on a daily basis to reflect the market value of the contract at the end of each day’s trading. The Fund agrees to receive from or pay to the broker or futures commission merchant an amount of cash equal to the daily fluctuation in the value of the contract. Such receipts or payments are known as “variation margin.” When the futures contract is closed, the Fund records a realized gain or loss equal to the difference between the proceeds from (or cost of) the closing transaction and the Fund's basis in the contract.
The use of futures contracts involves, to varying degrees, elements of market risk in excess of the amount recognized in the Statement of Assets and Liabilities. The contract or notional amounts and variation margin reflect the extent of the Fund's involvement in open futures positions. There are several risks associated with the use of futures contracts as hedging techniques. There can be no assurance that a liquid market will exist at the time when the Fund seeks to close out a futures contract. If no liquid market exists, the Fund would remain obligated to meet margin requirements until the position is closed. Futures contracts may involve a small initial investment relative to the risk assumed, which could result in losses greater than if the Fund did not invest in futures contracts. Futures contracts may be more volatile than direct investments in the instrument underlying the futures and may not correlate to the underlying instrument, causing a given hedge not to achieve its objectives. The Fund's activities in futures contracts have minimal counterparty risk as they are conducted through regulated exchanges that guarantee the futures against default by the counterparty. In the event of a bankruptcy or insolvency of a futures commission merchant that holds margin on behalf of the Fund, the Fund may not be entitled to the return of the entire margin owed to the Fund, potentially resulting in a loss. The Fund may invest in futures contracts to seek enhanced returns or to reduce the risk of loss by hedging certain of its holdings. The Fund's investment in futures contracts and other derivatives may increase the volatility of the Fund's NAVs and may result in a loss to the Fund. As of October 31, 2023, the Fund did not hold any open futures contracts.
(H) Municipal Bond Risk. The Fund may invest more heavily in municipal bonds from certain cities, states, territories or regions than others, which may increase the Fund’s exposure to losses resulting from economic, political, regulatory occurrences, or declines in tax revenue impacting these particular cities, states, territories or regions. In addition, many state and municipal governments that issue securities are under significant economic and financial stress and may not be able to satisfy their obligations, and these events may be made worse due to economic challenges posed by COVID-19. The Fund may invest a substantial amount of its assets in municipal bonds whose interest is paid solely from revenues of similar projects, such as tobacco settlement bonds. If the Fund concentrates its investments in this manner, it assumes the legal and economic risks relating to such projects and this may have a significant impact on the Fund’s investment performance.
Certain of the issuers in which the Fund may invest have recently experienced, or may experience, significant financial difficulties and repeated credit rating downgrades. On May 3, 2017, the Commonwealth of Puerto Rico (the "Commonwealth") began proceedings pursuant to the Puerto Rico Oversight, Management, and Economic Stability Act (“PROMESA”) to seek bankruptcy-type protections from approximately $74 billion in debt and approximately $48 billion in unfunded pension obligations. In addition, the current economic environment and the resulting pressure on Puerto Rico’s budget have further contributed to its financial challenges. Following the outbreak of COVID-19, the federal government passed certain relief packages, including the Coronavirus Aid, Relief, and Economic Security Act and the American Rescue Plan, which included an aggregate of more than $7 billion in disaster relief funds for the U.S. territories, including Puerto Rico. However, there can be no assurances that the federal funds allocated to the Commonwealth will be sufficient to address the long-term economic challenges that arose from COVID-19.
As of October 31, 2023 PREPA has remained in Title III Bankruptcy for over 6 years. A significant number of net revenue bond creditors, the Oversight Board, and the Commonwealth have been unable to reach a consensual resolution on PREPA’s debt restructuring following the termination of the previous 2019 PREPA Restructuring Support Agreement by the Commonwealth of Puerto Rico in March of 2022. On December 16, 2022, the Oversight Board filed a proposed plan of adjustment to restructure more than $10 billion of debt and other claims against PREPA. The plan of adjustment, amended in March, proposed to cut PREPA’s unsustainable debt to approximately $5.68 billion.
Bankruptcy litigation has ensued between the Oversight Board and a group of net revenue bond creditors over the security provisions of PREPA’s $8.3 billion of net revenue bonds resulting in a ruling in March that PREPA’s net revenue bonds are unsecured.
In June of 2023, a claims estimation hearing resulted in a ruling that PREPA’s now asserted unsecured net revenue bond claim was valued at approximately 2.383 billion, which is only 28.3% of the full pre-petition claim asserted by net revenue bond holders. Due to the lower claims estimation ruling, at the end of August 2023 the Oversight Board filed a
| 36 | MainStay MacKay New York Tax Free Opportunities Fund |
new proposed plan of adjustment to reflect the March lien ruling and June estimation hearing with lower recovery amounts afforded to net revenue bond holders. In conjunction with the new proposed plan of adjustment, a subset of the original litigating PREPA creditors entered into Planned Support Agreements (”PSAs”) supporting the new proposed plan of adjustment.
However, following the new proposed plan of adjustment, a significant amount of creditors not previously involved in the PREPA bankruptcy have objected to the revised plan of adjustment, including the MainStay MacKay Municipal Bond Funds.
Objecting creditors are appealing several rulings, including the March net revenue bond lien ruling, the June net revenue bond claims estimation ruling, and the November disclosure statement approval ruling that provides for a plan with disparate recoveries for the same creditors. Objecting creditors believe the PREPA bankruptcy plan of adjustment is un-confirmable and these rulings will be overturned on appeal, but there is no certainty that objecting creditors will be successful in appealing these rulings, or if overturned, these creditors will receive the relief sought. The proposed PREPA August plan of adjustment provides 3.5% of cash recovery for objecting creditors to the plan as opposed to 12.5% of cash recovery for consenting creditors who have not previously settled. Bankruptcy plan confirmation hearings are currently scheduled to begin in March of 2024.
The Fund’s vulnerability to potential losses associated with such developments may be reduced through investing in municipal securities that feature credit enhancements (such as bond insurance). The bond insurance provider pays both principal and interest when due to the bond holder. The magnitude of Puerto Rico’s debt restructuring or other adverse economic developments could pose significant strains on the ability of municipal securities insurers to meet all future claims. As of October 31, 2023, the Fund's total Puerto Rico investments is 5.9% of total investments, with 14.3% of that amount insured.
(I) Indemnifications. Under the Trust’s organizational documents, its officers and trustees are indemnified against certain liabilities that may arise out of performance of their duties to the Trust. Additionally, in the normal course of business, the Fund enters into contracts with third-party service providers that contain a variety of representations and warranties and that may provide general indemnifications. The Fund's maximum exposure under these arrangements is unknown, as this would involve future claims that may be made against the Fund that have not yet occurred. The Manager believes that the risk of loss in connection with these potential indemnification obligations is remote. However, there can be no assurance that material liabilities related to such obligations will not arise in the future, which could adversely impact the Fund.
(J) Quantitative Disclosure of Derivative Holdings. The following tables show additional disclosures related to the Fund's derivative and hedging activities, including how such activities are accounted for and their effect on the Fund's financial positions, performance and cash flows.
The Fund entered into futures contracts to help manage the duration and yield curve positioning of the portfolio. These derivatives are not accounted for as hedging instruments.
The effect of derivative instruments on the Statement of Operations for the year ended October 31, 2023:
| Net Realized Gain (Loss) from: | Interest
Rate
Contracts
Risk | Total |
| Futures Transactions | $5,733,026 | $5,733,026 |
| Total Net Realized Gain (Loss) | $5,733,026 | $5,733,026 |
| Net Change in Unrealized Appreciation (Depreciation) | Interest
Rate
Contracts
Risk | Total |
| Futures Contracts | $(11,466,015) | $(11,466,015) |
| Total Net Change in Unrealized Appreciation (Depreciation) | $(11,466,015) | $(11,466,015) |
| Average Notional Amount | Total |
| Futures Contracts Short (a) | $(144,875,502) |
| (a) | Positions were open seven months during the reporting period. |
Note 3–Fees and Related Party Transactions
(A) Manager and Subadvisor. New York Life Investments, a registered investment adviser and an indirect, wholly-owned subsidiary of New York Life Insurance Company ("New York Life"), serves as the Fund's Manager, pursuant to an Amended and Restated Management Agreement ("Management Agreement"). The Manager provides offices, conducts clerical, recordkeeping and bookkeeping services and keeps most of the financial and accounting records required to be maintained by the Fund. Except for the portion of salaries and expenses that are the responsibility of the Fund, the Manager pays the salaries and expenses of all personnel affiliated with the Fund and certain operational expenses of the Fund. The Fund reimburses New York Life Investments in an amount equal to the portion of the compensation of the Chief Compliance Officer attributable to the Fund. MacKay Shields LLC ("MacKay Shields" or the "Subadvisor"), a registered investment adviser and an indirect, wholly-owned subsidiary of New York Life, serves as the Subadvisor to the Fund and is responsible for the day-to-day portfolio management of the Fund. Pursuant to the terms of an Amended and Restated Subadvisory Agreement ("Subadvisory Agreement") between New York Life Investments and MacKay Shields, New York Life Investments pays for the services of the Subadvisor.
Pursuant to the Management Agreement, the Fund pays the Manager a monthly fee for the services performed and the facilities furnished at an annual rate of the Fund’s average daily net assets as follows: 0.45% on assets up to $1 billion; 0.43% on assets from $1 billion to $3 billion; and
Notes to Financial Statements (continued)
0.42% on assets over $3 billion. During the year ended October 31, 2023, the effective management fee rate was 0.45% of the Fund’s average daily net assets, exclusive of any applicable waivers/reimbursements.
New York Life Investments has contractually agreed to waive fees and/or reimburse expenses so that Total Annual Fund Operating Expenses (excluding taxes, interest, litigation, extraordinary expenses, brokerage and other transaction expenses relating to the purchase or sale of portfolio investments and acquired (underlying) fund fees and expenses) of Class A shares do not exceed 0.75% of its average daily net assets. New York Life Investments will apply an equivalent waiver or reimbursement, in an equal number of basis points to Investor Class, Class C, Class C2 and Class I shares. New York Life Investments has contractually agreed to waive fees and/or reimburse expenses so that Total Annual Fund Operating Expenses (excluding taxes, interest, litigation, extraordinary expenses, brokerage and other transaction expenses relating to the purchase or sale of portfolio investments, and acquired (underlying) fund fees and expenses) of Class R6 do not exceed those of Class I. These agreements will remain in effect until February 28, 2024, and shall renew automatically for one-year terms unless New York Life Investments provides written notice of termination prior to the start of the next term or upon approval of the Board.
During the year ended October 31, 2023, New York Life Investments earned fees from the Fund in the amount of $5,066,237 and waived fees and/or reimbursed expenses in the amount of $66,483 and paid the Subadvisor fees of $2,499,877.
JPMorgan Chase Bank, N.A. ("JPMorgan") provides sub-administration and sub-accounting services to the Fund pursuant to an agreement with New York Life Investments. These services include calculating the daily NAVs of the Fund, maintaining the general ledger and sub-ledger accounts for the calculation of the Fund's NAVs, and assisting New York Life Investments in conducting various aspects of the Fund's administrative operations. For providing these services to the Fund, JPMorgan is compensated by New York Life Investments.
Pursuant to an agreement between the Trust and New York Life Investments, New York Life Investments is responsible for providing or procuring certain regulatory reporting services for the Fund. The Fund will reimburse New York Life Investments for the actual costs incurred by New York Life Investments in connection with providing or procuring these services for the Fund.
(B) Distribution and Service Fees. The Trust, on behalf of the Fund, has entered into a distribution agreement with NYLIFE Distributors LLC (the “Distributor”), an affiliate of New York Life Investments. The Fund has adopted distribution plans (the “Plans”) in accordance with the provisions of Rule 12b-1 under the 1940 Act.
Pursuant to the Class A and Investor Class Plans, the Distributor receives a monthly fee from the Class A and Investor Class shares at an annual rate of 0.25% of the average daily net assets of the Class A and Investor Class shares for distribution and/or service activities as designated by the
Distributor. Pursuant to the Class C Plan, Class C shares pay the Distributor a monthly distribution fee at an annual rate of 0.25% of the average daily net assets of the Class C shares along with a service fee at an annual rate of 0.25% of the average daily net assets of the Class C shares, for a total 12b-1 fee of 0.50%. Pursuant to the Class C2 Plan, Class C2 shares pay the Distributor a monthly distribution fee at an annual rate of 0.40% of the average daily net assets of the Class C2 shares, along with a service fee at an annual rate of 0.25% of the average daily net assets of the Class C shares, for a total 12b-1 fee of 0.65%. Class I and Class R6 shares are not subject to a distribution and/or service fee.
The Plans provide that the distribution and service fees are payable to the Distributor regardless of the amounts actually expended by the Distributor for distribution of the Fund's shares and service activities.
(C) Sales Charges. The Fund was advised by the Distributor that the amount of initial sales charges retained on sales of Class A and Investor Class shares during the year ended October 31, 2023, were $6,348 and $3, respectively.
The Fund was also advised that the Distributor retained CDSCs on redemptions of Class A and Class C shares during the year ended October 31, 2023, of $79,501 and $6,452, respectively.
(D) Transfer, Dividend Disbursing and Shareholder Servicing Agent. NYLIM Service Company LLC, an affiliate of New York Life Investments, is the Fund's transfer, dividend disbursing and shareholder servicing agent pursuant to an agreement between NYLIM Service Company LLC and the Trust. NYLIM Service Company LLC has entered into an agreement with SS&C Global Investor & Distribution Solutions, Inc. ("SS&C"), pursuant to which SS&C performs certain transfer agent services on behalf of NYLIM Service Company LLC. New York Life Investments has contractually agreed to limit the transfer agency expenses charged to the Fund’s share classes to a maximum of 0.35% of that share class’s average daily net assets on an annual basis after deducting any applicable Fund or class-level expense reimbursement or small account fees. This agreement will remain in effect until February 28, 2024, and shall renew automatically for one-year terms unless New York Life Investments provides written notice of termination prior to the start of the next term or upon approval of the Board. During the year ended October 31, 2023, transfer agent expenses incurred by the Fund and any reimbursements, pursuant to the aforementioned Transfer Agency expense limitation agreement, were as follows:
| Class | Expense | Waived |
| Class A | $211,811 | $— |
| Investor Class | 182 | — |
| Class C | 37,800 | — |
| Class C2 | 891 | — |
| Class I | 102,393 | — |
| Class R6 | 69 | — |
| 38 | MainStay MacKay New York Tax Free Opportunities Fund |
(E) Small Account Fee. Shareholders with small accounts adversely impact the cost of providing transfer agency services. In an effort to reduce total transfer agency expenses, the Fund has implemented a small account fee on certain types of accounts. As described in the Fund's prospectus, certain shareholders with an account balance of less than $1,000 ($5,000 for Class A share accounts) are charged an annual per account fee of $20 (assessed semi-annually), the proceeds from which offset transfer agent fees as reflected in the Statement of Operations. This small account fee will not apply to certain types of accounts as described further in the Fund’s prospectus.
(F) Capital. As of October 31, 2023, New York Life and its affiliates beneficially held shares of the Fund with the values and percentages of net assets as follows:
| Class C2 | $22,264 | 1.5% |
| Class R6 | 23,401 | 0.9 |
Note 4-Federal Income Tax
As of October 31, 2023, the cost and unrealized appreciation (depreciation) of the Fund’s investment portfolio, including applicable derivative contracts and other financial instruments, as determined on a federal income tax basis, were as follows:
| | Federal Tax
Cost | Gross
Unrealized
Appreciation | Gross
Unrealized
(Depreciation) | Net
Unrealized
Appreciation/
(Depreciation) |
| Investments in Securities | $1,104,402,372 | $389,388 | $(99,376,365) | $(98,986,977) |
As of October 31, 2023, the components of accumulated gain (loss) on a tax basis were as follows:
Ordinary
Income | Undistributed
Tax Exempt
Income | Accumulated
Capital
and Other
Gain (Loss) | Other
Temporary
Differences | Unrealized
Appreciation
(Depreciation) | Total
Accumulated
Gain (Loss) |
| $— | $527,956 | $(127,106,444) | $(544,675) | $(98,986,977) | $(226,110,140) |
The difference between book-basis and tax-basis unrealized appreciation (depreciation) is primarily due to wash sale and cumulative bond amortization adjustments.
As of October 31, 2023, for federal income tax purposes, capital loss carryforwards of $127,106,444, as shown in the table below, were available to the extent provided by the regulations to offset future realized gains of the Fund. Accordingly, no capital gains distributions are expected to be paid to shareholders until net gains have been realized in excess of such amounts.
Capital Loss
Available Through | Short-Term
Capital Loss
Amounts (000’s) | Long-Term
Capital Loss
Amounts (000’s) |
| Unlimited | $43,749 | $83,357 |
During the years ended October 31, 2023 and October 31, 2022, the tax character of distributions paid as reflected in the Statements of Changes in Net Assets was as follows:
| | 2023 | 2022 |
| Distributions paid from: | | |
| Ordinary Income | $ 1,334,393 | $ 811,027 |
| Exempt Interest Dividends | 39,735,931 | 34,888,465 |
| Total | $41,070,324 | $35,699,492 |
Note 5–Custodian
JPMorgan is the custodian of cash and securities held by the Fund. Custodial fees are charged to the Fund based on the Fund's net assets and/or the market value of securities held by the Fund and the number of certain transactions incurred by the Fund.
Note 6–Line of Credit
The Fund and certain other funds managed by New York Life Investments maintain a line of credit with a syndicate of banks in order to secure a source of funds for temporary purposes to meet unanticipated or excessive redemption requests.
Effective July 25, 2023, under the credit agreement (the “Credit Agreement”), the aggregate commitment amount is $600,000,000 with an additional uncommitted amount of $100,000,000. The commitment fee is an annual rate of 0.15% of the average commitment amount payable quarterly, regardless of usage, to JPMorgan, who serves as the agent to the syndicate. The commitment fee is allocated among the Fund and certain other funds managed by New York Life Investments based upon their respective net assets and other factors. Interest on any revolving credit loan is charged based upon the Federal Funds Rate, Daily Simple Secured Overnight Financing Rate ("SOFR") + 0.10%, or the Overnight Bank Funding Rate, whichever is higher. The Credit Agreement expires on July 23, 2024, although the Fund, certain other funds managed by New York Life Investments and the syndicate of banks may renew the Credit Agreement for an additional year on the same or different terms or enter into a credit agreement with a different syndicate of banks. Prior to July 25, 2023, the aggregate commitment amount and the commitment fee were the same as those under the current Credit Agreement. During the year ended October 31, 2023, there were no borrowings made or outstanding with respect to the Fund under the Credit Agreement.
Note 7–Interfund Lending Program
Pursuant to an exemptive order issued by the SEC, the Fund, along with certain other funds managed by New York Life Investments, may participate in an interfund lending program. The interfund lending program provides an alternative credit facility that permits the Fund and certain other funds managed by New York Life Investments to lend or borrow money for temporary purposes directly to or from one another, subject to the conditions of the exemptive order. During the year ended
Notes to Financial Statements (continued)
October 31, 2023, there were no interfund loans made or outstanding with respect to the Fund.
Note 8–Purchases and Sales of Securities (in 000’s)
During the year ended October 31, 2023, purchases and sales of securities, other than short-term securities, were $754,016 and $752,303, respectively.
Note 9–Capital Share Transactions
Transactions in capital shares for the years ended October 31, 2023 and October 31, 2022, were as follows:
| Class A | Shares | Amount |
| Year ended October 31, 2023: | | |
| Shares sold | 24,594,452 | $ 231,708,083 |
| Shares issued to shareholders in reinvestment of distributions | 2,381,105 | 22,420,239 |
| Shares redeemed | (33,582,116) | (310,328,269) |
| Net increase (decrease) in shares outstanding before conversion | (6,606,559) | (56,199,947) |
| Shares converted into Class A (See Note 1) | 35,928 | 340,496 |
| Shares converted from Class A (See Note 1) | (24,595) | (233,252) |
| Net increase (decrease) | (6,595,226) | $ (56,092,703) |
| Year ended October 31, 2022: | | |
| Shares sold | 87,298,953 | $ 844,637,242 |
| Shares issued to shareholders in reinvestment of distributions | 2,025,106 | 20,047,685 |
| Shares redeemed | (94,566,928) | (915,687,479) |
| Net increase (decrease) in shares outstanding before conversion | (5,242,869) | (51,002,552) |
| Shares converted into Class A (See Note 1) | 11,505 | 111,557 |
| Shares converted from Class A (See Note 1) | (7,371) | (74,414) |
| Net increase (decrease) | (5,238,735) | $ (50,965,409) |
| |
| Investor Class | Shares | Amount |
| Year ended October 31, 2023: | | |
| Shares sold | 18,441 | $ 174,014 |
| Shares issued to shareholders in reinvestment of distributions | 1,216 | 11,455 |
| Shares redeemed | (4,985) | (46,776) |
| Net increase (decrease) in shares outstanding before conversion | 14,672 | 138,693 |
| Shares converted from Investor Class (See Note 1) | (11,369) | (107,785) |
| Net increase (decrease) | 3,303 | $ 30,908 |
| Year ended October 31, 2022: | | |
| Shares sold | 30,048 | $ 300,879 |
| Shares issued to shareholders in reinvestment of distributions | 931 | 9,203 |
| Shares redeemed | (29,134) | (289,595) |
| Net increase (decrease) in shares outstanding before conversion | 1,845 | 20,487 |
| Shares converted into Investor Class (See Note 1) | 353 | 3,710 |
| Shares converted from Investor Class (See Note 1) | (2,575) | (26,300) |
| Net increase (decrease) | (377) | $ (2,103) |
| |
| Class C | Shares | Amount |
| Year ended October 31, 2023: | | |
| Shares sold | 1,088,019 | $ 10,336,076 |
| Shares issued to shareholders in reinvestment of distributions | 196,926 | 1,855,696 |
| Shares redeemed | (2,533,719) | (23,858,269) |
| Net increase (decrease) in shares outstanding before conversion | (1,248,774) | (11,666,497) |
| Shares converted from Class C (See Note 1) | (24,559) | (232,711) |
| Net increase (decrease) | (1,273,333) | $ (11,899,208) |
| Year ended October 31, 2022: | | |
| Shares sold | 915,604 | $ 9,185,855 |
| Shares issued to shareholders in reinvestment of distributions | 179,004 | 1,774,437 |
| Shares redeemed | (3,077,812) | (30,367,036) |
| Net increase (decrease) in shares outstanding before conversion | (1,983,204) | (19,406,744) |
| Shares converted from Class C (See Note 1) | (8,930) | (85,257) |
| Net increase (decrease) | (1,992,134) | $ (19,492,001) |
| |
| 40 | MainStay MacKay New York Tax Free Opportunities Fund |
| Class C2 | Shares | Amount |
| Year ended October 31, 2023: | | |
| Shares sold | 57,349 | $ 540,085 |
| Shares issued to shareholders in reinvestment of distributions | 5,598 | 52,746 |
| Shares redeemed | (80,372) | (760,924) |
| Net increase (decrease) | (17,425) | $ (168,093) |
| Year ended October 31, 2022: | | |
| Shares sold | 50,559 | $ 530,063 |
| Shares issued to shareholders in reinvestment of distributions | 4,690 | 46,357 |
| Shares redeemed | (41,066) | (396,237) |
| Net increase (decrease) | 14,183 | $ 180,183 |
| |
| Class I | Shares | Amount |
| Year ended October 31, 2023: | | |
| Shares sold | 22,253,554 | $ 209,879,388 |
| Shares issued to shareholders in reinvestment of distributions | 1,068,947 | 10,063,514 |
| Shares redeemed | (18,653,532) | (173,775,037) |
| Net increase (decrease) in shares outstanding before conversion | 4,668,969 | 46,167,865 |
| Shares converted into Class I (See Note 1) | 24,580 | 233,252 |
| Net increase (decrease) | 4,693,549 | $ 46,401,117 |
| Year ended October 31, 2022: | | |
| Shares sold | 21,497,011 | $ 210,615,126 |
| Shares issued to shareholders in reinvestment of distributions | 736,274 | 7,281,884 |
| Shares redeemed | (21,464,030) | (208,798,438) |
| Net increase (decrease) in shares outstanding before conversion | 769,255 | 9,098,572 |
| Shares converted into Class I (See Note 1) | 7,019 | 70,704 |
| Net increase (decrease) | 776,274 | $ 9,169,276 |
| |
| Class R6 | Shares | Amount |
| Year ended October 31, 2023: | | |
| Shares sold | 231,497 | $ 2,166,295 |
| Shares issued to shareholders in reinvestment of distributions | 7,053 | 66,162 |
| Shares redeemed | (23,520) | (223,722) |
| Net increase (decrease) | 215,030 | $ 2,008,735 |
| Year ended October 31, 2022: | | |
| Shares sold | 5,363 | $ 52,501 |
| Shares issued to shareholders in reinvestment of distributions | 2,433 | 24,025 |
| Shares redeemed | (18) | (200) |
| Net increase (decrease) | 7,778 | $ 76,326 |
Note 10–Other Matters
As of the date of this report, the Fund faces a heightened level of risk associated with current uncertainty, volatility and state of economies, financial markets, rising interest rates, and labor and health conditions around the world. Events such as war, acts of terrorism, recessions, rapid
inflation, the imposition of international sanctions, earthquakes, hurricanes, epidemics and pandemics and other unforeseen natural or human disasters may have broad adverse social, political and economic effects on the global economy, which could negatively impact the value of the Fund's investments. Developments that disrupt global economies and financial markets may magnify factors that affect the Fund's performance.
Note 11–Subsequent Events
In connection with the preparation of the financial statements of the Fund as of and for the year ended October 31, 2023, events and transactions subsequent to October 31, 2023, through the date the financial statements were issued, have been evaluated by the Manager for possible adjustment and/or disclosure. No subsequent events requiring financial statement adjustment or disclosure have been identified.
Report of Independent Registered Public Accounting Firm
To the Shareholders of the Fund and Board of Trustees
MainStay Funds Trust:
Opinion on the Financial Statements
We have audited the accompanying statement of assets and liabilities of MainStay MacKay New York Tax Free Opportunities Fund (the Fund), one of the funds constituting MainStay Funds Trust, including the portfolio of investments, as of October 31, 2023, the related statement of operations for the year then ended, the statements of changes in net assets for each of the years in the two-year period then ended, and the related notes (collectively, the financial statements) and the financial highlights for each of the years or periods in the five-year period then ended. In our opinion, the financial statements and financial highlights present fairly, in all material respects, the financial position of the Fund as of October 31, 2023, the results of its operations for the year then ended, the changes in its net assets for each of the years in the two-year period then ended, and the financial highlights for each of the years or periods in the five-year period then ended, in conformity with U.S. generally accepted accounting principles.
Basis for Opinion
These financial statements and financial highlights are the responsibility of the Fund's management. Our responsibility is to express an opinion on these financial statements and financial highlights based on our audits. We are a public accounting firm registered with the Public Company Accounting Oversight Board (United States) (PCAOB) and are required to be independent with respect to the Fund in accordance with the U.S. federal securities laws and the applicable rules and regulations of the Securities and Exchange Commission and the PCAOB.
We conducted our audits in accordance with the standards of the PCAOB. Those standards require that we plan and perform the audit to obtain reasonable assurance about whether the financial statements and financial highlights are free of material misstatement, whether due to error or fraud. Our audits included performing procedures to assess the risks of material misstatement of the financial statements and financial highlights, whether due to error or fraud, and performing procedures that respond to those risks. Such procedures included examining, on a test basis, evidence regarding the amounts and disclosures in the financial statements and financial highlights. Such procedures also included confirmation of securities owned as of October 31, 2023, by correspondence with the custodian, transfer agent, and brokers; when replies were not received from broker, we performed other auditing procedures. Our audits also included evaluating the accounting principles used and significant estimates made by management, as well as evaluating the overall presentation of the financial statements and financial highlights. We believe that our audits provide a reasonable basis for our opinion.

We have served as the auditor of one or more New York Life Investment Management investment companies since 2003.
Philadelphia, Pennsylvania
December 22, 2023
| 42 | MainStay MacKay New York Tax Free Opportunities Fund |
Federal Income Tax Information
(Unaudited)
The Fund is required under the Internal Revenue Code to advise shareholders in a written statement as to the federal tax status of dividends paid by the Fund during such fiscal years.
For Federal individual income tax purposes, the Fund designated 96.8% of the ordinary income dividends paid during its fiscal year ended October 31, 2023 as attributable to interest income from Tax Exempt Municipal Bonds. Such dividends are currently exempt from Federal income taxes under Section 103(a) of the Internal Revenue Code.
In February 2024, shareholders will receive an IRS Form 1099-DIV or substitute Form 1099, which will show the federal tax status of the distributions received by shareholders in calendar year 2023. The amounts that will be reported on such 1099-DIV or substitute Form 1099 will be the amounts you are to use on your federal income tax return and will differ from the amounts which we must report for the Fund's fiscal year ended October 31, 2023.
Proxy Voting Policies and Procedures and Proxy Voting Record
The Fund is required to file with the SEC its proxy voting record for the 12-month period ending June 30 on Form N-PX. A description of the policies and procedures that are used to vote proxies relating to portfolio securities of the Fund is available free of charge upon request by calling 800-624-6782 or visiting the SEC’s website at www.sec.gov. The most recent Form N-PX or proxy voting record is available free of charge upon request by calling 800-624-6782; visiting newyorklifeinvestments.com; or visiting the SEC’s website at www.sec.gov.
Shareholder Reports and Quarterly Portfolio Disclosure
The Fund is required to file its complete schedule of portfolio holdings with the SEC 60 days after its first and third fiscal quarter on Form N-PORT. The Fund's holdings report is available free of charge upon request by calling New York Life Investments at 800-624-6782.
Board of Trustees and Officers (Unaudited)
The Trustees and officers of the Fund are listed below. The Board oversees the MainStay Group of Funds (which consists of MainStay Funds and MainStay Funds Trust), MainStay VP Funds Trust, MainStay MacKay DefinedTerm Municipal Opportunities Fund, MainStay CBRE Global Infrastructure Megatrends Term Fund, the Manager and the Subadvisors, and elects the officers of the Funds who are responsible for the day-to-day operations of the Fund. Information pertaining to the Trustees and officers is set forth below. Each Trustee serves until his or her successor is elected and qualified or until his or her resignation, death or
removal. Under the Board’s retirement policy, unless an exception is made, a Trustee must tender his or her resignation by the end of the calendar year during which he or she reaches the age of 75. Officers are elected annually by the Board. The business address of each Trustee and officer listed below is 51 Madison Avenue, New York, New York 10010. A majority of the Trustees are not “interested persons” (as defined by the 1940 Act and rules adopted by the SEC thereunder) of the Fund (“Independent Trustees”).
| | Name and
Year of Birth | Term of Office,
Position(s) Held and
Length of Service | Principal Occupation(s)
During Past Five Years | Number of
Portfolios in
Fund Complex
Overseen by
Trustee | Other Directorships
Held by Trustee |
| | | | | | |
| | Naïm Abou-Jaoudé*
1966 | MainStay Funds: Trustee
since 2023
MainStay Funds Trust:
Trustee since 2023 | Chief Executive Officer of New York Life Investment Management LLC (since 2023). Chief Executive Officer of Candriam (an affiliate of New York Life Investment Management LLC) (2007 to 2023). | 81 | MainStay VP Funds Trust:
Trustee since 2023 (31 portfolios);
MainStay MacKay DefinedTerm Municipal Opportunities Fund: Trustee
since 2023;
MainStay CBRE Global Infrastructure Megatrends Term Fund: Trustee
since 2023; and
New York Life Investment Management International (Chair) since 2015 |
| * | This Trustee is considered to be an “interested person” of the MainStay Group of Funds, MainStay VP Funds Trust, MainStay CBRE Global Infrastructure Megatrends Term Fund and MainStay MacKay DefinedTerm Municipal Opportunities Fund, within the meaning of the 1940 Act because of his affiliation with New York Life Investment Management LLC and Candriam, as described in detail above in the column entitled “Principal Occupation(s) During Past Five Years.” |
| | |
| 44 | MainStay MacKay New York Tax Free Opportunities Fund |
| | Name and
Year of Birth | Term of Office,
Position(s) Held and
Length of Service | Principal Occupation(s)
During Past Five Years | Number of
Portfolios in
Fund Complex
Overseen by
Trustee | Other Directorships
Held by Trustee |
| | | | | | |
| | David H. Chow
1957 | MainStay Funds: Trustee since January 2016, Advisory Board Member (June 2015 to December 2015);MainStay Funds Trust:
Trustee since January 2016, Advisory Board Member (June 2015 to December 2015) | Founder and CEO, DanCourt Management, LLC (since 1999) | 81 | MainStay VP Funds Trust: Trustee since January 2016, Advisory Board Member (June 2015 to December 2015) (31 portfolios);
MainStay MacKay DefinedTerm Municipal Opportunities Fund: Trustee since January 2016, Advisory Board Member (June 2015 to December 2015);
MainStay CBRE Global Infrastructure Megatrends Term Fund: Trustee since 2021;
VanEck Vectors Group of Exchange-Traded Funds: Trustee since 2006 and Independent Chairman of the Board of Trustees from 2008 to 2022 (57 portfolios); and
Berea College of Kentucky: Trustee since 2009, Chair of the Investment Committee since 2018 |
| | Karen Hammond
1956 | MainStay Funds: Trustee since December 2021, Advisory Board Member (June 2021 to December 2021);MainStay Funds Trust:
Trustee since December 2021, Advisory Board Member (June 2021 to December 2021)
| Retired, Managing Director, Devonshire Investors (2007 to 2013); Senior Vice President, Fidelity Management & Research Co. (2005 to 2007); Senior Vice President and Corporate Treasurer, FMR Corp. (2003 to 2005); Chief Operating Officer, Fidelity Investments Japan (2001 to 2003) | 81 | MainStay VP Funds Trust: Trustee since December 2021, Advisory Board Member (June 2021 to December 2021) (31 portfolios);
MainStay MacKay DefinedTerm Municipal Opportunities Fund: Trustee since December 2021, Advisory Board Member (June 2021 to December 2021);
MainStay CBRE Global Infrastructure Megatrends Term Fund: Trustee since December 2021, Advisory Board Member (June 2021 to December 2021);
Two Harbors Investment Corp.: Director since 2018;
Rhode Island State Investment Commission: Member since 2017; and
Blue Cross Blue Shield of Rhode Island: Director since 2019 |
| | Susan B. Kerley
1951 | MainStay Funds: Chair since January 2017 and Trustee since 2007;MainStay Funds Trust:
Chair since January 2017 and Trustee since 1990*** | President, Strategic Management Advisors LLC (since 1990) | 81 | MainStay VP Funds Trust: Chair since January 2017 and Trustee since 2007 (31 portfolios)**;
MainStay MacKay DefinedTerm Municipal Opportunities Fund: Chair since January 2017 and Trustee since 2011;
MainStay CBRE Global Infrastructure Megatrends Term Fund: Trustee since June 2021; and
Legg Mason Partners Funds: Trustee since 1991 (45 portfolios) |
Board of Trustees and Officers (Unaudited) (continued)
| | Name and
Year of Birth | Term of Office,
Position(s) Held and
Length of Service | Principal Occupation(s)
During Past Five Years | Number of
Portfolios in
Fund Complex
Overseen by
Trustee | Other Directorships
Held by Trustee |
| | | | | | |
| | Alan R. Latshaw
1951 | MainStay Funds: Trusteesince 2006;MainStay Funds Trust:
Trustee since 2007*** | Retired; Partner, Ernst & Young LLP (2002 to 2003); Partner, Arthur Andersen LLP (1989 to 2002); Consultant to the MainStay Funds Audit and Compliance Committee (2004 to 2006) | 81 | MainStay VP Funds Trust: Trustee since 2007 (31 portfolios)**;
MainStay MacKay DefinedTerm Municipal Opportunities Fund: Trustee since 2011; and
MainStay CBRE Global Infrastructure Megatrends Term Fund: Trustee since June 2021 |
| | Jacques P. Perold
1958 | MainStay Funds: Trustee since January 2016, Advisory Board Member (June 2015to December 2015);MainStay Funds Trust:
Trustee since January 2016, Advisory Board Member (June 2015 to December 2015) | Founder and Chief Executive Officer, CapShift Advisors LLC (since 2018); President, Fidelity Management & Research Company (2009 to 2014); President and Chief Investment Officer, Geode Capital Management, LLC (2001 to 2009) | 81 | MainStay VP Funds Trust: Trustee since January 2016, Advisory Board Member (June 2015 to December 2015) (31 portfolios);
MainStay MacKay DefinedTerm Municipal Opportunities Fund: Trustee since January 2016, Advisory Board Member (June 2015 to December 2015);
MainStay CBRE Global Infrastructure Megatrends Term Fund: Trustee since June 2021;
Allstate Corporation: Director since 2015; and
MSCI Inc.: Director since 2017 |
| | Richard S. Trutanic
1952 | MainStay Funds: Trustee since 1994;MainStay Funds Trust:
Trustee since 2007*** | Chairman and Chief Executive Officer, Somerset & Company (financial advisory firm) (since 2004); Managing Director, The Carlyle Group (private investment firm) (2002 to 2004); Senior Managing Director, Partner and Board Member, Groupe Arnault S.A. (private investment firm) (1999 to 2002) | 81 | MainStay VP Funds Trust: Trustee since 2007 (31 portfolios)**;
MainStay MacKay DefinedTerm Municipal Opportunities Fund: Trustee since 2011; and
MainStay CBRE Global Infrastructure Megatrends Term Fund: Trustee since June 2021 |
| ** | Includes prior service as a Director of MainStay VP Series Fund, Inc., the predecessor to MainStay VP Funds Trust. |
| *** | Includes prior service as a Director/Trustee of certain predecessor entities to MainStay Funds Trust. |
| 46 | MainStay MacKay New York Tax Free Opportunities Fund |
| | Name and
Year of Birth | Position(s) Held and
Length of Service | Principal Occupation(s)
During Past Five Years | |
| | | | | |
| | Kirk C. Lehneis
1974 | President, MainStay Funds, MainStay Funds Trust (since 2017) | Chief Operating Officer and Senior Managing Director (since 2016), New York Life Investment Management LLC and New York Life Investment Management Holdings LLC; Member of the Board of Managers (since 2017) and Senior Managing Director (since 2018), NYLIFE Distributors LLC; Chairman of the Board and Senior Managing Director, NYLIM Service Company LLC (since 2017); Trustee, President and Principal Executive Officer of IndexIQ Trust, IndexIQ ETF Trust and IndexIQ Active ETF Trust (since 2018); President, MainStay CBRE Global Infrastructure Megatrends Term Fund (since 2021), MainStay MacKay DefinedTerm Municipal Opportunities Fund and MainStay VP Funds Trust (since 2017)**; Senior Managing Director, Global Product Development (2015 to 2016); Managing Director, Product Development (2010 to 2015), New York Life Investment Management LLC | |
| | Jack R. Benintende
1964 | Treasurer and Principal Financial and Accounting Officer, MainStay Funds (since 2007), MainStay Funds Trust (since 2009) | Managing Director, New York Life Investment Management LLC (since 2007); Treasurer and Principal Financial and Accounting Officer, MainStay CBRE Global Infrastructure Megatrends Term Fund (since 2021), MainStay MacKay DefinedTerm Municipal Opportunities Fund (since 2011) and MainStay VP Funds Trust (since 2007)**; and Assistant Treasurer, New York Life Investment Management Holdings LLC (2008 to 2012) | |
| | J. Kevin Gao
1967 | Secretary and Chief Legal Officer, MainStay Funds and MainStay Funds Trust (since 2010) | Managing Director and Associate General Counsel, New York Life Investment Management LLC (since 2010); Secretary and Chief Legal Officer, MainStay CBRE Global Infrastructure Megatrends Term Fund (since 2021), MainStay MacKay DefinedTerm Municipal Opportunities Fund (since 2011) and MainStay VP Funds Trust (since 2010)** | |
| | Kevin M. Gleason
1967 | Vice President and Chief Compliance Officer, MainStay Funds and MainStay Funds Trust (since June 2022) | Vice President and Chief Compliance Officer, IndexIQ Trust, IndexIQ ETF Trust and Index IQ Active ETF Trust (since June 2022); Vice President and Chief Compliance Officer, MainStay CBRE Global Infrastructure Megatrends Term Fund, MainStay VP Funds Trust and MainStay MacKay DefinedTerm Municipal Opportunities Fund (since June 2022); Senior Vice President, Voya Investment Management and Chief Compliance Officer, Voya Family of Funds (2012 to 2022) | |
| | Scott T. Harrington
1959 | Vice President— Administration, MainStay Funds (since 2005), MainStay Funds Trust (since 2009) | Managing Director, New York Life Investment Management LLC (including predecessor advisory organizations) (since 2000); Member of the Board of Directors, New York Life Trust Company (since 2009); Vice President—Administration, MainStay CBRE Global Infrastructure Megatrends Term Fund (since 2021), MainStay MacKay DefinedTerm Municipal Opportunities Fund (since 2011) and MainStay VP Funds Trust (since 2005)** | |
| * | The officers listed above are considered to be “interested persons” of the MainStay Group of Funds, MainStay VP Funds Trust, MainStay CBRE Global Infrastructure Megatrends Term Fund and MainStay MacKay DefinedTerm Municipal Opportunities Fund within the meaning of the 1940 Act because of their affiliation with the MainStay Group of Funds, New York Life Insurance Company and/or its affiliates, including New York Life Investment Management LLC, New York Life Insurance Company, NYLIM Service Company LLC, NYLIFE Securities LLC and/or NYLIFE Distributors LLC, as described in detail in the column captioned “Principal Occupation(s) During Past Five Years.” Officers are elected annually by the Board. |
| ** | Includes prior service as an Officer of MainStay VP Series Fund, Inc., the predecessor to MainStay VP Funds Trust. |
Officers of the Trust (Who are not Trustees)*
This page intentionally left blank.
This page intentionally left blank.
This page intentionally left blank.
Equity
U.S. Equity
MainStay Epoch U.S. Equity Yield Fund
MainStay Fiera SMID Growth Fund
MainStay PineStone U.S. Equity Fund
MainStay S&P 500 Index Fund
MainStay Winslow Large Cap Growth Fund
MainStay WMC Enduring Capital Fund
MainStay WMC Growth Fund
MainStay WMC Small Companies Fund
MainStay WMC Value Fund
International Equity
MainStay Epoch International Choice Fund
MainStay PineStone International Equity Fund
MainStay WMC International Research Equity Fund
Emerging Markets Equity
MainStay Candriam Emerging Markets Equity Fund
Global Equity
MainStay Epoch Capital Growth Fund
MainStay Epoch Global Equity Yield Fund
MainStay PineStone Global Equity Fund
Fixed Income
Taxable Income
MainStay Candriam Emerging Markets Debt Fund
MainStay Floating Rate Fund
MainStay MacKay High Yield Corporate Bond Fund
MainStay MacKay Short Duration High Yield Fund
MainStay MacKay Strategic Bond Fund
MainStay MacKay Total Return Bond Fund
MainStay MacKay U.S. Infrastructure Bond Fund
MainStay Short Term Bond Fund
Tax-Exempt Income
MainStay MacKay California Tax Free Opportunities Fund1
MainStay MacKay High Yield Municipal Bond Fund
MainStay MacKay New York Tax Free Opportunities Fund2
MainStay MacKay Short Term Municipal Fund
MainStay MacKay Strategic Municipal Allocation Fund
MainStay MacKay Tax Free Bond Fund
Money Market
MainStay Money Market Fund
Mixed Asset
MainStay Balanced Fund
MainStay Income Builder Fund
MainStay MacKay Convertible Fund
Speciality
MainStay CBRE Global Infrastructure Fund
MainStay CBRE Real Estate Fund
MainStay Cushing MLP Premier Fund
Asset Allocation
MainStay Conservative Allocation Fund
MainStay Conservative ETF Allocation Fund
MainStay Defensive ETF Allocation Fund
MainStay Equity Allocation Fund
MainStay Equity ETF Allocation Fund
MainStay ESG Multi-Asset Allocation Fund
MainStay Growth Allocation Fund
MainStay Growth ETF Allocation Fund
MainStay Moderate Allocation Fund
MainStay Moderate ETF Allocation Fund
Manager
New York Life Investment Management LLC
New York, New York
Subadvisors
Candriam3
Strassen, Luxembourg
CBRE Investment Management Listed Real Assets LLC
Radnor, Pennsylvania
Cushing Asset Management, LP
Dallas, Texas
Epoch Investment Partners, Inc.
New York, New York
Fiera Capital Inc.
New York, New York
IndexIQ Advisors LLC3
New York, New York
MacKay Shields LLC3
New York, New York
NYL Investors LLC3
New York, New York
PineStone Asset Management Inc.
Montreal, Québec
Wellington Management Company LLP
Boston, Massachusetts
Winslow Capital Management, LLC
Minneapolis, Minnesota
Legal Counsel
Dechert LLP
Washington, District of Columbia
Independent Registered Public Accounting Firm
KPMG LLP
Philadelphia, Pennsylvania
Distributor
NYLIFE Distributors LLC3
Jersey City, New Jersey
Custodian
JPMorgan Chase Bank, N.A.
New York, New York
1.
This Fund is registered for sale in AZ, CA, NV, OR, TX, UT, WA and MI (Class A and Class I shares only), and CO, FL, GA, HI, ID, MA, MD, NH, NJ and NY (Class I shares only).
| 2. | This Fund is registered for sale in CA, CT, DE, FL, MA, NJ, NY and VT. |
| 3. | An affiliate of New York Life Investment Management LLC. |
Not part of the Annual Report
For more information
800-624-6782
newyorklifeinvestments.com
“New York Life Investments” is both a service mark, and the common trade name, of certain investment advisors affiliated with New York Life Insurance Company. The MainStay Funds® are managed by New York Life Investment Management LLC and distributed by NYLIFE Distributors LLC, 30 Hudson Street, Jersey City, NJ 07302, a wholly owned subsidiary of New York Life Insurance Company. NYLIFE Distributors LLC is a Member FINRA/SIPC.
©2023 NYLIFE Distributors LLC. All rights reserved.
| 5013746 MS139-23 | MSNTF11-12/23 |
(NYLIM) NL222
MainStay S&P 500 Index Fund
Message from the President and Annual Report
October 31, 2023
Special Notice:
Beginning in July 2024, new regulations issued by the Securities and Exchange Commission (SEC) will take effect requiring open-end mutual fund companies and ETFs to (1) overhaul the content of their shareholder reports and (2) mail paper copies of the new tailored shareholder reports to shareholders who have not opted to receive these documents electronically.
If you have not yet elected to receive your shareholder reports electronically, please contact your financial intermediary or visit newyorklifeinvestments.com/accounts.
| Not FDIC/NCUA Insured | Not a Deposit | May Lose Value | No Bank Guarantee | Not Insured by Any Government Agency |
This page intentionally left blank
Message from the President
Volatile economic and geopolitical forces drove market behavior during the 12-month reporting period ended October 31, 2023. While equity markets generally gained ground, bond prices trended broadly lower.
Although the war in Ukraine, the outbreak of hostilities in the Middle East and several other notable events affected financial assets, inflation and interest rate trends stood at the forefront of market developments during most of the period. As the reporting period began, high levels of inflation already showed signs of easing in the face of aggressive rate hikes by the U.S. Federal Reserve (the “Fed”). From a peak of 9.1% in June 2022, the annualized U.S. inflation rate dropped to 7.1% in November 2022, and to 3.2% in October 2023. At the same time, the Fed increased the benchmark federal funds rate from 3.75%–4.00% at the beginning of the reporting period to 5.25%–5.50% as of October 31, 2023. As the pace of rate increases slowed during the period, investors hoped for an early shift to a looser monetary policy. However, comments from Fed members late in the period reinforced the central bank’s hawkish stance in response to surprisingly robust U.S. economic growth and rising wage pressures, thus increasing the likelihood that interest rates would stay higher for longer. International developed markets exhibited similar dynamics of elevated inflation and rising interest rates.
Despite the backdrop of high interest rates—along with political dysfunction in Washington D.C. and intensifying global geopolitical instability—equity markets managed to advance, supported by healthy consumer spending trends and persistent domestic economic growth. The S&P 500® Index, a widely regarded benchmark of large-cap U.S. market performance, gained ground, bolstered by the strong performance of energy stocks amid surging petroleum prices and mega-cap, growth-oriented, technology-related shares, which rose as investors flocked to companies creating the infrastructure for developments in artificial intelligence. Smaller-cap stocks and value-oriented shares produced milder returns. Among industry sectors, energy and
information technology posted the strongest gains. Real estate declined most sharply under pressure from rising mortgage rates and weak levels of office occupancy. Developed international markets outperformed U.S. markets, with Europe benefiting during the first half of the period from unexpected economic resilience in the face of rising energy prices and the ongoing war in Ukraine. Emerging markets posted positive results but lagged developed markets, largely due to slow economic growth in China despite the relaxation of pandemic-era lockdowns.
Bond prices were driven lower by rising yields and increasing expectations of high interest rates for an extended period of time. The U.S. yield curve steepened, with the 30-year Treasury yield exceeding 5% for the first time in more than a decade. The yield curve remained inverted, with the 10-year Treasury yield ending the period at 4.88%, compared with 5.07% for the 2-year Treasury yield. Corporate bonds outperformed long-term Treasury bonds, but still trended lower under pressure from rising yields and an uptick in default rates. Among corporates, lower-credit-quality instruments performed slightly better than their higher-credit-quality counterparts, while floating rate securities performed better still.
In the face of today’s uncertain market environment, New York Life Investments remains dedicated to providing the guidance, resources and investment solutions you need to pursue your financial goals.
Thank you for trusting us to help meet your investment needs.
Sincerely,
Kirk C. Lehneis
President
The opinions expressed are as of the date of this report and are subject to change. There is no guarantee that any forecast made will come to pass. This material does not constitute investment advice and is not intended as an endorsement of any specific investment. Past performance is no guarantee of future results.
Not part of the Annual Report
Investors should refer to the Fund’s Summary Prospectus and/or Prospectus and consider the Fund’s investment objectives, strategies, risks, charges and expenses carefully before investing. The Summary Prospectus and/or Prospectus contain this and other information about the Fund. You may obtain copies of the Fund’s Summary Prospectus, Prospectus and Statement of Additional Information, which includes information about the MainStay Funds Trust's Trustees, free of charge, upon request, by calling toll-free 800-624-6782, by writing to NYLIFE Distributors LLC, Attn: MainStay Marketing Department, 30 Hudson Street, Jersey City, NJ 07302 or by sending an e-mail to MainStayShareholderServices@nylim.com. These documents are also available via the MainStay Funds’ website at newyorklifeinvestments.com. Please read the Fund’s Summary Prospectus and/or Prospectus carefully before investing.
Investment and Performance Comparison (Unaudited)
Performance data quoted represents past performance. Past performance is no guarantee of future results. Because of market volatility and other factors, current performance may be lower or higher than the figures shown. Investment return and principal value will fluctuate, and as a result, when shares are redeemed, they may be worth more or less than their original cost. The graph below depicts the historical performance of Class I shares of the Fund. Performance will vary from class to class based on differences in class-specific expenses and sales charges. For performance information current to the most recent month-end, please call 800-624-6782 or visit newyorklifeinvestments.com.
The performance table and graph do not reflect the deduction of taxes that a shareholder would pay on distributions or Fund share redemptions. Total returns reflect maximum applicable sales charges as indicated in the table below, if any, changes in share price, and reinvestment of dividend and capital gain distributions. The graph assumes the initial investment amount shown below and reflects the deduction of all sales charges that would have applied for the period of investment. Performance figures may reflect certain fee waivers and/or expense limitations, without which total returns may have been lower. For more information on share classes and current fee waivers and/or expense limitations (if any), please refer to the Notes to Financial Statements.
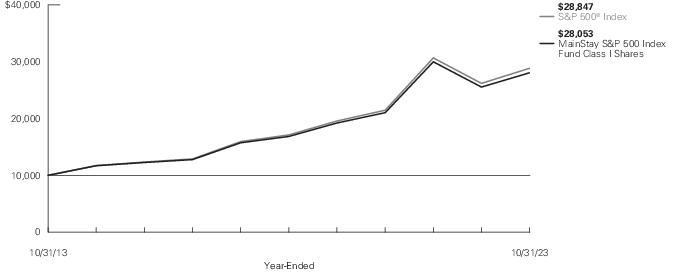
| Average Annual Total Returns for the Year-Ended October 31, 2023 |
| Class | Sales Charge | | Inception
Date | One
Year | Five
Years | Ten Years
or Since
Inception | Gross
Expense
Ratio1 |
| Class A Shares2 | Maximum 1.50% Initial Sales Charge | With sales charges | 1/2/2004 | 7.94% | 9.80% | 10.26% | 0.52% |
| | | Excluding sales charges | | 9.58 | 10.47 | 10.59 | 0.52 |
| Investor Class Shares2, 3 | Maximum 1.00% Initial Sales Charge | With sales charges | 2/28/2008 | 8.28 | 9.60 | 10.09 | 0.79 |
| | | Excluding sales charges | | 9.37 | 10.27 | 10.43 | 0.79 |
| Class I Shares | No Sales Charge | | 1/2/1991 | 9.84 | 10.74 | 10.87 | 0.26 |
| SIMPLE Class Shares | No Sales Charge | | 8/31/2020 | 9.24 | N/A | 6.56 | 0.90 |
| 1. | The gross expense ratios presented reflect the Fund’s “Total Annual Fund Operating Expenses” from the most recent Prospectus, as supplemented, and may differ from other expense ratios disclosed in this report. |
| 2. | Prior to March 19, 2020, the maximum initial sales charge for Class A Shares and Investor Class Shares was 3.00%, which is reflected in the applicable average annual total return figures shown. |
| 3. | Prior to June 30, 2020, the maximum initial sales charge was 1.50%, which is reflected in the applicable average annual total return figures shown. |
The footnotes on the next page are an integral part of the table and graph and should be carefully read in conjunction with them.
| Benchmark Performance* | One
Year | Five
Years | Ten
Years |
| S&P 500® Index1 | 10.14% | 11.01% | 11.18% |
| Morningstar Large Blend Category Average2 | 7.62 | 9.67 | 9.69 |
| * | Returns for indices reflect no deductions for fees, expenses or taxes, except for foreign withholding taxes where applicable. Results assume reinvestment of all dividends and capital gains. An investment cannot be made directly in an index. |
| 1. | The S&P 500® Index is the Fund's primary broad-based securities market index for comparison purposes. The S&P 500® Index is widely regarded as the standard index for measuring large-cap U.S. stock market performance. S&P® and S&P 500® are registered trademarks of Standard & Poor’s Financial Services LLC (“S&P”) and Dow Jones® is a registered trademark of Dow Jones Trademark Holdings LLC (“Dow Jones”). The foregoing trademarks have been licensed for use by S&P Dow Jones Indices LLC and sublicensed for certain purposes by New York Life Investment Management LLC. The S&P 500® Index is a product of S&P Dow Jones Indices LLC and has been licensed for use by New York Life Investment Management LLC. MainStay S&P 500 Index Fund is not sponsored, endorsed, sold or promoted by S&P Dow Jones Indices LLC, Dow Jones, S&P or their respective affiliates and neither S&P Dow Jones Indices LLC, Dow Jones, S&P nor their respective affiliates make any representation regarding the advisability of investing in such product(s). |
| 2. | The Morningstar Large Blend Category Average is representative of funds that represent the overall U.S. stock market in size, growth rates and price. Stocks in the top 70% of the capitalization of the U.S. equity market are defined as large cap. The blend style is assigned to funds where neither growth nor value characteristics predominate. These funds tend to invest across the spectrum of U.S. industries, and owing to their broad exposure, the funds' returns are often similar to those of the S&P 500® Index. Results are based on average total returns of similar funds with all dividends and capital gain distributions reinvested. |
The footnotes on the preceding page are an integral part of the table and graph and should be carefully read in conjunction with them.
| 6 | MainStay S&P 500 Index Fund |
Cost in Dollars of a $1,000 Investment in MainStay S&P 500 Index Fund (Unaudited)
The example below is intended to describe the fees and expenses borne by shareholders during the six-month period from May 1, 2023 to October 31, 2023, and the impact of those costs on your investment.
Example
As a shareholder of the Fund you incur two types of costs: (1) transaction costs, including exchange fees and sales charges (loads) on purchases (as applicable), and (2) ongoing costs, including management fees, distribution and/or service (12b-1) fees and other Fund expenses (as applicable). This example is intended to help you understand your ongoing costs (in dollars) of investing in the Fund and to compare these costs with the ongoing costs of investing in other mutual funds. The example is based on an investment of $1,000 made at the beginning of the six-month period and held for the entire period from May 1, 2023 to October 31, 2023.
This example illustrates your Fund’s ongoing costs in two ways:
Actual Expenses
The second and third data columns in the table below provide information about actual account values and actual expenses. You may use the information in these columns, together with the amount you invested, to estimate the expenses that you paid during the six months ended October 31, 2023. Simply divide your account value by $1,000 (for example, an
$8,600 account value divided by $1,000 = 8.6), then multiply the result by the number under the heading entitled “Expenses Paid During Period” to estimate the expenses you paid on your account during this period.
Hypothetical Example for Comparison Purposes
The fourth and fifth data columns in the table below provide information about hypothetical account values and hypothetical expenses based on the Fund’s actual expense ratio and an assumed rate of return of 5% per year before expenses, which is not the Fund’s actual return. The hypothetical account values and expenses may not be used to estimate the actual ending account balances or expenses you paid for the six-month period shown. You may use this information to compare the ongoing costs of investing in the Fund with the ongoing costs of investing in other mutual funds. To do so, compare this 5% hypothetical example with the 5% hypothetical examples that appear in the shareholder reports of the other mutual funds.
Please note that the expenses shown in the table are meant to highlight your ongoing costs only and do not reflect any transactional costs, such as exchange fees or sales charges (loads). Therefore, the fourth and fifth data columns of the table are useful in comparing ongoing costs only and will not help you determine the relative total costs of owning different funds. In addition, if these transactional costs were included, your costs would have been higher.
| Share Class | Beginning
Account
Value
5/1/23 | Ending Account
Value (Based
on Actual
Returns and
Expenses)
10/31/23 | Expenses
Paid
During
Period1 | Ending Account
Value (Based
on Hypothetical
5% Annualized
Return and
Actual Expenses)
10/31/23 | Expenses
Paid
During
Period1 | Net Expense
Ratio
During
Period2 |
| Class A Shares | $1,000.00 | $1,011.50 | $2.64 | $1,022.58 | $2.65 | 0.52% |
| Investor Class Shares | $1,000.00 | $1,010.50 | $3.55 | $1,021.68 | $3.57 | 0.70% |
| Class I Shares | $1,000.00 | $1,012.70 | $1.37 | $1,023.84 | $1.38 | 0.27% |
| SIMPLE Class Shares | $1,000.00 | $1,010.30 | $3.80 | $1,021.42 | $3.82 | 0.75% |
| 1. | Expenses are equal to the Fund’s annualized expense ratio of each class multiplied by the average account value over the period, divided by 365 and multiplied by 184 (to reflect the six-month period). The table above represents the actual expenses incurred during the six-month period. In addition to the fees and expenses which the Fund bears directly, it also indirectly bears a pro rata share of the fees and expenses of the underlying funds in which it invests. Such indirect expenses are not included in the above-reported expense figures. |
| 2. | Expenses are equal to the Fund's annualized expense ratio to reflect the six-month period. |
Industry Composition as of October 31, 2023 (Unaudited)
| Software | 10.8% |
| Technology Hardware, Storage & Peripherals | 7.4 |
| Semiconductors & Semiconductor Equipment | 7.2 |
| Interactive Media & Services | 5.8 |
| Financial Services | 4.3 |
| Oil, Gas & Consumable Fuels | 4.1 |
| Pharmaceuticals | 4.1 |
| Broadline Retail | 3.5 |
| Health Care Providers & Services | 3.2 |
| Banks | 2.9 |
| Capital Markets | 2.7 |
| Health Care Equipment & Supplies | 2.5 |
| Insurance | 2.3 |
| Hotels, Restaurants & Leisure | 2.1 |
| Biotechnology | 2.1 |
| Specialty Retail | 2.0 |
| Consumer Staples Distribution & Retail | 1.9 |
| Automobiles | 1.8 |
| Machinery | 1.7 |
| Chemicals | 1.7 |
| Aerospace & Defense | 1.7 |
| Electric Utilities | 1.7 |
| Beverages | 1.6 |
| Household Products | 1.4 |
| Life Sciences Tools & Services | 1.3 |
| IT Services | 1.2 |
| Entertainment | 1.2 |
| Specialized REITs | 1.1 |
| Food Products | 0.9 |
| Communications Equipment | 0.9 |
| Industrial Conglomerates | 0.8 |
| Ground Transportation | 0.8 |
| Media | 0.8 |
| Professional Services | 0.7 |
| Diversified Telecommunication Services | 0.7 |
| Multi–Utilities | 0.7 |
| Electrical Equipment | 0.6% |
| Tobacco | 0.6 |
| Electronic Equipment, Instruments & Components | 0.6 |
| Textiles, Apparel & Luxury Goods | 0.5 |
| Air Freight & Logistics | 0.5 |
| Commercial Services & Supplies | 0.5 |
| Consumer Finance | 0.4 |
| Energy Equipment & Services | 0.4 |
| Building Products | 0.4 |
| Metals & Mining | 0.4 |
| Household Durables | 0.3 |
| Residential REITs | 0.3 |
| Retail REITs | 0.3 |
| Trading Companies & Distributors | 0.3 |
| Industrial REITs | 0.3 |
| Containers & Packaging | 0.2 |
| Wireless Telecommunication Services | 0.2 |
| Health Care REITs | 0.2 |
| Personal Care Products | 0.2 |
| Passenger Airlines | 0.2 |
| Real Estate Management & Development | 0.1 |
| Construction Materials | 0.1 |
| Distributors | 0.1 |
| Water Utilities | 0.1 |
| Automobile Components | 0.1 |
| Construction & Engineering | 0.1 |
| Office REITs | 0.1 |
| Gas Utilities | 0.0‡ |
| Hotel & Resort REITs | 0.0‡ |
| Independent Power and Renewable Electricity Producers | 0.0‡ |
| Leisure Products | 0.0‡ |
| Short–Term Investments | 1.0 |
| Other Assets, Less Liabilities | –0.7 |
| | 100.0% |
| ‡ | Less than one–tenth of a percent. |
See Portfolio of Investments beginning on page 10 for specific holdings within these categories. The Fund's holdings are subject to change.
Top Ten Holdings and/or Issuers Held as of October 31, 2023 (excluding short-term investments) (Unaudited)
| 1. | Microsoft Corp. |
| 2. | Apple, Inc. |
| 3. | Alphabet, Inc. |
| 4. | Amazon.com, Inc. |
| 5. | NVIDIA Corp. |
| 6. | Meta Platforms, Inc., Class A |
| 7. | Berkshire Hathaway, Inc., Class B |
| 8. | Tesla, Inc. |
| 9. | UnitedHealth Group, Inc. |
| 10. | Eli Lilly & Co. |
| 8 | MainStay S&P 500 Index Fund |
Portfolio Management Discussion and Analysis (Unaudited)
Questions answered by portfolio managers Francis J. Ok and Greg Barrato of IndexIQ Advisors LLC, the Fund’s Subadvisor.
How did MainStay S&P 500 Index Fund perform relative to its benchmark and peer group during the 12 months ended October 31, 2023?
For the 12 months ended October 31, 2023, Class I shares of MainStay S&P 500 Index Fund returned 9.84%, underperforming the 10.14% return of the Fund’s primary benchmark, the S&P 500® Index (the “Index”). Over the same period, Class I shares outperformed the 7.62% return of the Morningstar Large Blend Category Average.1
What factors affected the Fund’s relative performance during the reporting period?
Although the Fund seeks investment results that correspond to the total return performance of common stocks in the aggregate, as represented by the Index, the Fund’s relative performance will typically lag that of the Index, as it did during the reporting period, because the Fund incurs operating expenses that the Index does not.
Were there any changes to the Fund during the reporting period?
Effective February 28, 2023, Greg Barrato was added as a portfolio manager of the Fund.
During the reporting period, how was the Fund’s performance materially affected by investments in derivatives?
The Fund invests in futures contracts to provide an efficient means of maintaining liquidity while remaining fully invested in the market.
During the reporting period, which S&P 500® Index industries had the highest total returns and which industries had the lowest total returns?
During the reporting period the strongest performing Index industry groups in terms of total returns included semiconductor & semiconductor equipment, interactive media & services and systems software. During the same period, the industry groups with the lowest total returns included alternative carriers, housewares & specialties and regional banks.
During the reporting period, which S&P 500® Index industries made the strongest positive contributions to the Fund’s absolute performance and which industries made the weakest contributions?
The industry groups that made the strongest positive contributions to the Fund’s absolute performance during the reporting period
included semiconductor & semiconductor equipment, systems software and interactive media & services. (Contributions take weightings and total returns into account.) During the same period, the industry groups that made the weakest contributions to the Fund’s absolute performance included regional banks, life sciences tools & services and automobile manufacturers.
During the reporting period, which individual stocks in the S&P 500® Index had the highest total returns and which stocks had the lowest total returns?
The Index stocks producing the highest total returns during the reporting period included Meta Platforms, NVIDIA and PulteGroup. Conversely, the Index stocks with the lowest total returns over the same period were First Republic Bank, Enphase Energy and SolarEdge Technologies.
During the reporting period, which S&P 500® Index stocks made the strongest positive contributions to the Fund’s absolute performance and which stocks made the weakest contributions?
The strongest positive contributors to the Fund’s absolute performance during the reporting period were Microsoft, NVIDIA and Meta Platforms. During the same period, the stocks that made the weakest contributions to the Fund’s absolute performance were Pfizer, Tesla and Bank of America.
Were there any changes in the S&P 500® Index during the reporting period?
During the reporting period, there were 17 additions and 18 deletions in the Index. Fortune Brand spun off into two companies, and both were deleted from the Index. Noteworthy additions included Blackstone and Palo Alto Networks. Notable deletions were SVB Financial Group, Signature Bank NY, and First Republic Bank.
| 1. | See "Investment and Performance Comparison" for other share class returns, which may be higher or lower than Class I share returns, and for more information on benchmark and peer group returns. |
The opinions expressed are those of the portfolio managers as of the date of this report and are subject to change. There is no guarantee that any forecasts will come to pass. This material does not constitute investment advice and is not intended as an endorsement of any specific investment.
Portfolio of Investments October 31, 2023†^
| | Shares | Value |
| Common Stocks 99.7% |
| Aerospace & Defense 1.7% |
| Axon Enterprise, Inc. (a) | 2,250 | $ 460,102 |
| Boeing Co. (The) (a) | 18,153 | 3,391,343 |
| General Dynamics Corp. | 7,256 | 1,750,945 |
| Howmet Aerospace, Inc. | 12,537 | 552,882 |
| Huntington Ingalls Industries, Inc. | 1,276 | 280,490 |
| L3Harris Technologies, Inc. | 6,055 | 1,086,328 |
| Lockheed Martin Corp. | 7,176 | 3,262,497 |
| Northrop Grumman Corp. | 4,553 | 2,146,421 |
| RTX Corp. | 46,600 | 3,792,774 |
| Textron, Inc. | 6,341 | 481,916 |
| TransDigm Group, Inc. (a) | 1,767 | 1,463,235 |
| | | 18,668,933 |
| Air Freight & Logistics 0.5% |
| CH Robinson Worldwide, Inc. | 3,728 | 305,062 |
| Expeditors International of Washington, Inc. | 4,735 | 517,299 |
| FedEx Corp. | 7,408 | 1,778,661 |
| United Parcel Service, Inc., Class B | 23,156 | 3,270,785 |
| | | 5,871,807 |
| Automobile Components 0.1% |
| Aptiv plc (a) | 9,055 | 789,596 |
| BorgWarner, Inc. | 7,526 | 277,709 |
| | | 1,067,305 |
| Automobiles 1.8% |
| Ford Motor Co. | 125,867 | 1,227,203 |
| General Motors Co. | 44,051 | 1,242,238 |
| Tesla, Inc. (a) | 88,408 | 17,755,863 |
| | | 20,225,304 |
| Banks 2.9% |
| Bank of America Corp. | 221,338 | 5,830,043 |
| Citigroup, Inc. | 61,653 | 2,434,677 |
| Citizens Financial Group, Inc. | 15,121 | 354,285 |
| Comerica, Inc. | 4,219 | 166,229 |
| Fifth Third Bancorp | 21,799 | 516,854 |
| Huntington Bancshares, Inc. | 46,356 | 447,335 |
| JPMorgan Chase & Co. | 93,041 | 12,938,282 |
| KeyCorp | 29,964 | 306,232 |
| M&T Bank Corp. | 5,311 | 598,815 |
| PNC Financial Services Group, Inc. (The) | 12,751 | 1,459,607 |
| Regions Financial Corp. | 30,043 | 436,525 |
| Truist Financial Corp. | 42,645 | 1,209,412 |
| U.S. Bancorp | 49,848 | 1,589,154 |
| Wells Fargo & Co. | 117,140 | 4,658,658 |
| | Shares | Value |
| |
| Banks (continued) |
| Zions Bancorp NA | 4,743 | $ 146,322 |
| | | 33,092,430 |
| Beverages 1.6% |
| Brown-Forman Corp., Class B | 5,858 | 328,985 |
| Coca-Cola Co. (The) | 124,604 | 7,038,880 |
| Constellation Brands, Inc., Class A | 5,164 | 1,209,151 |
| Keurig Dr Pepper, Inc. | 32,209 | 976,899 |
| Molson Coors Beverage Co., Class B | 5,943 | 343,327 |
| Monster Beverage Corp. (a) | 23,812 | 1,216,793 |
| PepsiCo, Inc. | 44,073 | 7,196,240 |
| | | 18,310,275 |
| Biotechnology 2.1% |
| AbbVie, Inc. | 56,510 | 7,978,082 |
| Amgen, Inc. | 17,125 | 4,378,862 |
| Biogen, Inc. (a) | 4,637 | 1,101,473 |
| Gilead Sciences, Inc. | 39,892 | 3,133,118 |
| Incyte Corp. (a) | 5,955 | 321,153 |
| Moderna, Inc. (a) | 10,601 | 805,252 |
| Regeneron Pharmaceuticals, Inc. (a) | 3,417 | 2,664,884 |
| Vertex Pharmaceuticals, Inc. (a) | 8,263 | 2,992,115 |
| | | 23,374,939 |
| Broadline Retail 3.5% |
| Amazon.com, Inc. (a) | 290,694 | 38,688,465 |
| eBay, Inc. | 17,038 | 668,401 |
| Etsy, Inc. (a) | 3,938 | 245,337 |
| | | 39,602,203 |
| Building Products 0.4% |
| A O Smith Corp. | 3,989 | 278,273 |
| Allegion plc | 2,810 | 276,391 |
| Carrier Global Corp. | 26,818 | 1,278,146 |
| Johnson Controls International plc | 21,781 | 1,067,705 |
| Masco Corp. | 7,201 | 375,100 |
| Trane Technologies plc | 7,312 | 1,391,547 |
| | | 4,667,162 |
| Capital Markets 2.7% |
| Ameriprise Financial, Inc. | 3,286 | 1,033,677 |
| Bank of New York Mellon Corp. (The) | 24,934 | 1,059,695 |
| BlackRock, Inc. | 4,493 | 2,750,974 |
| Blackstone, Inc. | 22,723 | 2,098,469 |
| Cboe Global Markets, Inc. | 3,378 | 553,620 |
| Charles Schwab Corp. (The) | 47,607 | 2,477,468 |
| CME Group, Inc. | 11,518 | 2,458,632 |
| FactSet Research Systems, Inc. | 1,221 | 527,338 |
| Franklin Resources, Inc. | 9,106 | 207,526 |
The notes to the financial statements are an integral part of, and should be read in conjunction with, the financial statements.
| 10 | MainStay S&P 500 Index Fund |
| | Shares | Value |
| Common Stocks (continued) |
| Capital Markets (continued) |
| Goldman Sachs Group, Inc. (The) | 10,555 | $ 3,204,604 |
| Intercontinental Exchange, Inc. | 18,324 | 1,968,731 |
| Invesco Ltd. | 14,363 | 186,288 |
| MarketAxess Holdings, Inc. | 1,206 | 257,782 |
| Moody's Corp. | 5,052 | 1,556,016 |
| Morgan Stanley | 40,848 | 2,892,855 |
| MSCI, Inc. | 2,532 | 1,193,965 |
| Nasdaq, Inc. | 10,854 | 538,358 |
| Northern Trust Corp. | 6,627 | 436,786 |
| Raymond James Financial, Inc. | 6,018 | 574,358 |
| S&P Global, Inc. | 10,418 | 3,639,112 |
| State Street Corp. | 10,202 | 659,355 |
| T. Rowe Price Group, Inc. | 7,181 | 649,880 |
| | | 30,925,489 |
| Chemicals 1.7% |
| Air Products and Chemicals, Inc. | 7,112 | 2,008,713 |
| Albemarle Corp. | 3,757 | 476,313 |
| Celanese Corp. | 3,204 | 366,890 |
| CF Industries Holdings, Inc. | 6,177 | 492,801 |
| Corteva, Inc. | 22,724 | 1,093,933 |
| Dow, Inc. | 22,510 | 1,088,133 |
| DuPont de Nemours, Inc. | 14,697 | 1,071,117 |
| Eastman Chemical Co. | 3,796 | 283,675 |
| Ecolab, Inc. | 8,122 | 1,362,384 |
| FMC Corp. | 3,993 | 212,428 |
| International Flavors & Fragrances, Inc. | 8,172 | 558,556 |
| Linde plc | 15,622 | 5,970,104 |
| LyondellBasell Industries NV, Class A | 8,200 | 739,968 |
| Mosaic Co. (The) | 10,638 | 345,522 |
| PPG Industries, Inc. | 7,540 | 925,686 |
| Sherwin-Williams Co. (The) | 7,574 | 1,804,203 |
| | | 18,800,426 |
| Commercial Services & Supplies 0.5% |
| Cintas Corp. | 2,769 | 1,404,215 |
| Copart, Inc. (a) | 27,820 | 1,210,727 |
| Republic Services, Inc. | 6,583 | 977,510 |
| Rollins, Inc. | 8,989 | 338,076 |
| Waste Management, Inc. | 11,801 | 1,939,258 |
| | | 5,869,786 |
| Communications Equipment 0.9% |
| Arista Networks, Inc. (a) | 8,028 | 1,608,570 |
| Cisco Systems, Inc. | 130,467 | 6,801,245 |
| F5, Inc. (a) | 1,899 | 287,869 |
| Juniper Networks, Inc. | 10,289 | 276,980 |
| | Shares | Value |
| |
| Communications Equipment (continued) |
| Motorola Solutions, Inc. | 5,347 | $ 1,488,926 |
| | | 10,463,590 |
| Construction & Engineering 0.1% |
| Quanta Services, Inc. | 4,649 | 776,941 |
| Construction Materials 0.1% |
| Martin Marietta Materials, Inc. | 1,979 | 809,292 |
| Vulcan Materials Co. | 4,254 | 835,869 |
| | | 1,645,161 |
| Consumer Finance 0.4% |
| American Express Co. | 18,627 | 2,720,101 |
| Capital One Financial Corp. | 12,212 | 1,236,954 |
| Discover Financial Services | 8,002 | 656,804 |
| Synchrony Financial | 13,389 | 375,561 |
| | | 4,989,420 |
| Consumer Staples Distribution & Retail 1.9% |
| Costco Wholesale Corp. | 14,188 | 7,838,019 |
| Dollar General Corp. | 7,022 | 835,899 |
| Dollar Tree, Inc. (a) | 6,703 | 744,636 |
| Kroger Co. (The) | 21,141 | 959,167 |
| Sysco Corp. | 16,172 | 1,075,276 |
| Target Corp. | 14,777 | 1,637,144 |
| Walgreens Boots Alliance, Inc. | 22,940 | 483,575 |
| Walmart, Inc. | 45,693 | 7,466,693 |
| | | 21,040,409 |
| Containers & Packaging 0.2% |
| Amcor plc | 47,110 | 418,808 |
| Avery Dennison Corp. | 2,580 | 449,100 |
| Ball Corp. | 10,087 | 485,689 |
| International Paper Co. | 11,078 | 373,661 |
| Packaging Corp. of America | 2,879 | 440,631 |
| Sealed Air Corp. | 4,623 | 142,342 |
| Westrock Co. | 8,205 | 294,806 |
| | | 2,605,037 |
| Distributors 0.1% |
| Genuine Parts Co. | 4,496 | 579,355 |
| LKQ Corp. | 8,566 | 376,219 |
| Pool Corp. | 1,250 | 394,712 |
| | | 1,350,286 |
| Diversified Telecommunication Services 0.7% |
| AT&T, Inc. | 228,883 | 3,524,798 |
| Verizon Communications, Inc. | 134,597 | 4,728,393 |
| | | 8,253,191 |
The notes to the financial statements are an integral part of, and should be read in conjunction with, the financial statements.
11
Portfolio of Investments October 31, 2023†^ (continued)
| | Shares | Value |
| Common Stocks (continued) |
| Electric Utilities 1.7% |
| Alliant Energy Corp. | 8,091 | $ 394,760 |
| American Electric Power Co., Inc. | 16,494 | 1,245,957 |
| Constellation Energy Corp. | 10,296 | 1,162,624 |
| Duke Energy Corp. | 24,675 | 2,193,361 |
| Edison International | 12,271 | 773,809 |
| Entergy Corp. | 6,770 | 647,144 |
| Evergy, Inc. | 7,354 | 361,376 |
| Eversource Energy | 11,176 | 601,157 |
| Exelon Corp. | 31,863 | 1,240,745 |
| FirstEnergy Corp. | 16,521 | 588,148 |
| NextEra Energy, Inc. | 64,791 | 3,777,315 |
| NRG Energy, Inc. | 7,335 | 310,857 |
| PG&E Corp. (a) | 66,953 | 1,091,334 |
| Pinnacle West Capital Corp. | 3,628 | 269,125 |
| PPL Corp. | 23,599 | 579,827 |
| Southern Co. (The) | 34,915 | 2,349,780 |
| Xcel Energy, Inc. | 17,658 | 1,046,590 |
| | | 18,633,909 |
| Electrical Equipment 0.6% |
| AMETEK, Inc. | 7,386 | 1,039,727 |
| Eaton Corp. plc | 12,774 | 2,655,842 |
| Emerson Electric Co. | 18,297 | 1,627,884 |
| Generac Holdings, Inc. (a) | 1,993 | 167,552 |
| Hubbell, Inc. | 1,716 | 463,492 |
| Rockwell Automation, Inc. | 3,677 | 966,352 |
| | | 6,920,849 |
| Electronic Equipment, Instruments & Components 0.6% |
| Amphenol Corp., Class A | 19,096 | 1,538,183 |
| CDW Corp. | 4,292 | 860,117 |
| Corning, Inc. | 24,578 | 657,707 |
| Keysight Technologies, Inc. (a) | 5,711 | 697,028 |
| TE Connectivity Ltd. | 10,051 | 1,184,510 |
| Teledyne Technologies, Inc. (a) | 1,507 | 564,507 |
| Trimble, Inc. (a) | 7,950 | 374,683 |
| Zebra Technologies Corp., Class A (a) | 1,644 | 344,303 |
| | | 6,221,038 |
| Energy Equipment & Services 0.4% |
| Baker Hughes Co. | 32,325 | 1,112,626 |
| Halliburton Co. | 28,768 | 1,131,733 |
| Schlumberger Ltd. | 45,501 | 2,532,586 |
| | | 4,776,945 |
| Entertainment 1.2% |
| Electronic Arts, Inc. | 7,893 | 977,074 |
| Live Nation Entertainment, Inc. (a) | 4,539 | 363,211 |
| | Shares | Value |
| |
| Entertainment (continued) |
| Netflix, Inc. (a) | 14,188 | $ 5,841,058 |
| Take-Two Interactive Software, Inc. (a) | 5,057 | 676,374 |
| Walt Disney Co. (The) (a) | 58,582 | 4,779,705 |
| Warner Bros Discovery, Inc. (a) | 71,012 | 705,859 |
| | | 13,343,281 |
| Financial Services 4.3% |
| Berkshire Hathaway, Inc., Class B (a) | 58,387 | 19,929,235 |
| Fidelity National Information Services, Inc. | 18,968 | 931,518 |
| Fiserv, Inc. (a) | 19,517 | 2,220,059 |
| FleetCor Technologies, Inc. (a) | 2,368 | 533,203 |
| Global Payments, Inc. | 8,324 | 884,175 |
| Jack Henry & Associates, Inc. | 2,333 | 328,930 |
| Mastercard, Inc., Class A | 26,638 | 10,025,211 |
| PayPal Holdings, Inc. (a) | 35,155 | 1,821,029 |
| Visa, Inc., Class A | 51,443 | 12,094,249 |
| | | 48,767,609 |
| Food Products 0.9% |
| Archer-Daniels-Midland Co. | 17,164 | 1,228,427 |
| Bunge Ltd. | 4,823 | 511,141 |
| Campbell Soup Co. | 6,299 | 254,543 |
| Conagra Brands, Inc. | 15,299 | 418,581 |
| General Mills, Inc. | 18,735 | 1,222,271 |
| Hershey Co. (The) | 4,798 | 898,905 |
| Hormel Foods Corp. | 9,269 | 301,706 |
| J M Smucker Co. (The) | 3,269 | 372,143 |
| Kellogg Co. | 8,440 | 425,967 |
| Kraft Heinz Co. (The) | 25,561 | 804,149 |
| Lamb Weston Holdings, Inc. | 4,668 | 419,186 |
| McCormick & Co., Inc. (Non-Voting) | 8,039 | 513,692 |
| Mondelez International, Inc., Class A | 43,555 | 2,883,777 |
| Tyson Foods, Inc., Class A | 9,142 | 423,732 |
| | | 10,678,220 |
| Gas Utilities 0.0% ‡ |
| Atmos Energy Corp. | 4,753 | 511,708 |
| Ground Transportation 0.8% |
| CSX Corp. | 64,235 | 1,917,415 |
| JB Hunt Transport Services, Inc. | 2,614 | 449,268 |
| Norfolk Southern Corp. | 7,268 | 1,386,662 |
| Old Dominion Freight Line, Inc. | 2,869 | 1,080,638 |
| Union Pacific Corp. | 19,512 | 4,050,886 |
| | | 8,884,869 |
| Health Care Equipment & Supplies 2.5% |
| Abbott Laboratories | 55,559 | 5,253,103 |
The notes to the financial statements are an integral part of, and should be read in conjunction with, the financial statements.
| 12 | MainStay S&P 500 Index Fund |
| | Shares | Value |
| Common Stocks (continued) |
| Health Care Equipment & Supplies (continued) |
| Align Technology, Inc. (a) | 2,279 | $ 420,681 |
| Baxter International, Inc. | 16,213 | 525,787 |
| Becton Dickinson & Co. | 9,288 | 2,347,821 |
| Boston Scientific Corp. (a) | 46,879 | 2,399,736 |
| Cooper Cos., Inc. (The) | 1,585 | 494,124 |
| Dentsply Sirona, Inc. | 6,778 | 206,119 |
| DexCom, Inc. (a) | 12,418 | 1,103,091 |
| Edwards Lifesciences Corp. (a) | 19,463 | 1,240,182 |
| GE HealthCare Technologies, Inc. | 12,523 | 833,656 |
| Hologic, Inc. (a) | 7,842 | 518,905 |
| IDEXX Laboratories, Inc. (a) | 2,658 | 1,061,791 |
| Insulet Corp. (a) | 2,235 | 296,294 |
| Intuitive Surgical, Inc. (a) | 11,249 | 2,949,713 |
| Medtronic plc | 42,618 | 3,007,126 |
| ResMed, Inc. | 4,704 | 664,299 |
| STERIS plc | 3,158 | 663,117 |
| Stryker Corp. | 10,822 | 2,924,321 |
| Teleflex, Inc. | 1,505 | 278,049 |
| Zimmer Biomet Holdings, Inc. | 6,690 | 698,503 |
| | | 27,886,418 |
| Health Care Providers & Services 3.2% |
| Cardinal Health, Inc. | 8,151 | 741,741 |
| Cencora, Inc. | 5,337 | 988,146 |
| Centene Corp. (a) | 17,336 | 1,195,837 |
| Cigna Group (The) | 9,476 | 2,929,979 |
| CVS Health Corp. | 41,121 | 2,837,760 |
| DaVita, Inc. (a) | 1,724 | 133,145 |
| Elevance Health, Inc. | 7,545 | 3,395,929 |
| HCA Healthcare, Inc. | 6,444 | 1,457,246 |
| Henry Schein, Inc. (a) | 4,181 | 271,682 |
| Humana, Inc. | 3,967 | 2,077,478 |
| Laboratory Corp. of America Holdings | 2,837 | 566,634 |
| McKesson Corp. | 4,319 | 1,966,700 |
| Molina Healthcare, Inc. (a) | 1,867 | 621,618 |
| Quest Diagnostics, Inc. | 3,593 | 467,449 |
| UnitedHealth Group, Inc. | 29,657 | 15,883,103 |
| Universal Health Services, Inc., Class B | 1,989 | 250,395 |
| | | 35,784,842 |
| Health Care REITs 0.2% |
| Healthpeak Properties, Inc. | 17,515 | 272,358 |
| Ventas, Inc. | 12,883 | 547,012 |
| Welltower, Inc. | 16,608 | 1,388,595 |
| | | 2,207,965 |
| Hotel & Resort REITs 0.0% ‡ |
| Host Hotels & Resorts, Inc. | 22,783 | 352,681 |
| | Shares | Value |
| |
| Hotels, Restaurants & Leisure 2.1% |
| Airbnb, Inc., Class A (a) | 13,650 | $ 1,614,658 |
| Booking Holdings, Inc. (a) | 1,143 | 3,188,467 |
| Caesars Entertainment, Inc. (a) | 6,893 | 274,962 |
| Carnival Corp. (a) | 32,251 | 369,596 |
| Chipotle Mexican Grill, Inc. (a) | 883 | 1,714,963 |
| Darden Restaurants, Inc. | 3,870 | 563,201 |
| Domino's Pizza, Inc. | 1,124 | 381,025 |
| Expedia Group, Inc. (a) | 4,413 | 420,515 |
| Hilton Worldwide Holdings, Inc. | 8,373 | 1,268,761 |
| Las Vegas Sands Corp. | 10,524 | 499,469 |
| Marriott International, Inc., Class A | 8,021 | 1,512,440 |
| McDonald's Corp. | 23,332 | 6,116,950 |
| MGM Resorts International | 8,987 | 313,826 |
| Norwegian Cruise Line Holdings Ltd. (a) | 13,620 | 185,232 |
| Royal Caribbean Cruises Ltd. (a) | 7,546 | 639,372 |
| Starbucks Corp. | 36,671 | 3,382,533 |
| Wynn Resorts Ltd. | 3,101 | 272,206 |
| Yum! Brands, Inc. | 8,971 | 1,084,235 |
| | | 23,802,411 |
| Household Durables 0.3% |
| DR Horton, Inc. | 9,748 | 1,017,691 |
| Garmin Ltd. | 4,904 | 502,807 |
| Lennar Corp., Class A | 8,085 | 862,508 |
| Mohawk Industries, Inc. (a) | 1,692 | 136,003 |
| NVR, Inc. (a) | 105 | 568,325 |
| PulteGroup, Inc. | 7,026 | 517,043 |
| Whirlpool Corp. | 1,755 | 183,503 |
| | | 3,787,880 |
| Household Products 1.4% |
| Church & Dwight Co., Inc. | 7,877 | 716,335 |
| Clorox Co. (The) | 3,964 | 466,563 |
| Colgate-Palmolive Co. | 26,467 | 1,988,201 |
| Kimberly-Clark Corp. | 10,827 | 1,295,342 |
| Procter & Gamble Co. (The) | 75,472 | 11,323,064 |
| | | 15,789,505 |
| Independent Power and Renewable Electricity Producers 0.0% ‡ |
| AES Corp. (The) | 21,439 | 319,441 |
| Industrial Conglomerates 0.8% |
| 3M Co. | 17,673 | 1,607,359 |
| General Electric Co. | 34,846 | 3,785,321 |
| Honeywell International, Inc. | 21,257 | 3,895,558 |
| | | 9,288,238 |
| Industrial REITs 0.3% |
| Prologis, Inc. | 29,578 | 2,979,983 |
The notes to the financial statements are an integral part of, and should be read in conjunction with, the financial statements.
13
Portfolio of Investments October 31, 2023†^ (continued)
| | Shares | Value |
| Common Stocks (continued) |
| Insurance 2.3% |
| Aflac, Inc. | 17,308 | $ 1,351,928 |
| Allstate Corp. (The) | 8,375 | 1,073,089 |
| American International Group, Inc. | 22,792 | 1,397,377 |
| Aon plc, Class A | 6,495 | 2,009,553 |
| Arch Capital Group Ltd. (a) | 11,941 | 1,035,046 |
| Arthur J. Gallagher & Co. | 6,900 | 1,624,881 |
| Assurant, Inc. | 1,698 | 252,832 |
| Brown & Brown, Inc. | 7,537 | 523,218 |
| Chubb Ltd. | 13,150 | 2,822,253 |
| Cincinnati Financial Corp. | 5,022 | 500,543 |
| Everest Group Ltd. | 1,390 | 549,912 |
| Globe Life, Inc. | 2,784 | 323,946 |
| Hartford Financial Services Group, Inc. (The) | 9,791 | 719,149 |
| Loews Corp. | 5,920 | 378,939 |
| Marsh & McLennan Cos., Inc. | 15,814 | 2,999,125 |
| MetLife, Inc. | 20,225 | 1,213,702 |
| Principal Financial Group, Inc. | 7,120 | 481,882 |
| Progressive Corp. (The) | 18,740 | 2,962,607 |
| Prudential Financial, Inc. | 11,622 | 1,062,716 |
| Travelers Cos., Inc. (The) | 7,330 | 1,227,335 |
| W R Berkley Corp. | 6,513 | 439,106 |
| Willis Towers Watson plc | 3,356 | 791,647 |
| | | 25,740,786 |
| Interactive Media & Services 5.8% |
| Alphabet, Inc. (a) | | |
| Class A | 189,951 | 23,569,120 |
| Class C | 161,581 | 20,246,099 |
| |
| Match Group, Inc. (a) | 8,903 | 308,044 |
| Meta Platforms, Inc., Class A (a) | 71,158 | 21,437,771 |
| | | 65,561,034 |
| IT Services 1.2% |
| Accenture plc, Class A | 20,196 | 6,000,030 |
| Akamai Technologies, Inc. (a) | 4,866 | 502,804 |
| Cognizant Technology Solutions Corp., Class A | 16,169 | 1,042,415 |
| EPAM Systems, Inc. (a) | 1,856 | 403,810 |
| Gartner, Inc. (a) | 2,524 | 838,069 |
| International Business Machines Corp. | 29,167 | 4,218,715 |
| VeriSign, Inc. (a) | 2,873 | 573,623 |
| | | 13,579,466 |
| Leisure Products 0.0% ‡ |
| Hasbro, Inc. | 4,175 | 188,501 |
| | Shares | Value |
| |
| Life Sciences Tools & Services 1.3% |
| Agilent Technologies, Inc. | 9,457 | $ 977,570 |
| Bio-Rad Laboratories, Inc., Class A (a) | 669 | 184,162 |
| Bio-Techne Corp. | 5,041 | 275,390 |
| Charles River Laboratories International, Inc. (a) | 1,641 | 276,279 |
| Danaher Corp. | 21,039 | 4,039,909 |
| Illumina, Inc. (a) | 5,068 | 554,540 |
| IQVIA Holdings, Inc. (a) | 5,863 | 1,060,206 |
| Mettler-Toledo International, Inc. (a) | 700 | 689,640 |
| Revvity, Inc. | 3,974 | 329,246 |
| Thermo Fisher Scientific, Inc. | 12,357 | 5,496,023 |
| Waters Corp. (a) | 1,892 | 451,299 |
| West Pharmaceutical Services, Inc. | 2,365 | 752,756 |
| | | 15,087,020 |
| Machinery 1.7% |
| Caterpillar, Inc. | 16,333 | 3,692,075 |
| Cummins, Inc. | 4,535 | 980,921 |
| Deere & Co. | 8,730 | 3,189,593 |
| Dover Corp. | 4,478 | 581,916 |
| Fortive Corp. | 11,270 | 735,706 |
| IDEX Corp. | 2,420 | 463,212 |
| Illinois Tool Works, Inc. | 8,810 | 1,974,497 |
| Ingersoll Rand, Inc. | 12,947 | 785,624 |
| Nordson Corp. | 1,733 | 368,419 |
| Otis Worldwide Corp. | 13,182 | 1,017,782 |
| PACCAR, Inc. | 16,738 | 1,381,387 |
| Parker-Hannifin Corp. | 4,108 | 1,515,482 |
| Pentair plc | 5,286 | 307,222 |
| Snap-on, Inc. | 1,694 | 436,950 |
| Stanley Black & Decker, Inc. | 4,906 | 417,255 |
| Westinghouse Air Brake Technologies Corp. | 5,735 | 608,025 |
| Xylem, Inc. | 7,710 | 721,193 |
| | | 19,177,259 |
| Media 0.8% |
| Charter Communications, Inc., Class A (a) | 3,258 | 1,312,322 |
| Comcast Corp., Class A | 131,768 | 5,440,701 |
| Fox Corp. | | |
| Class A | 8,122 | 246,828 |
| Class B | 4,224 | 117,892 |
| |
| Interpublic Group of Cos., Inc. (The) | 12,324 | 350,002 |
| News Corp. | | |
| Class A | 12,196 | 252,213 |
| Class B | 3,698 | 79,285 |
| |
| Omnicom Group, Inc. | 6,325 | 473,806 |
The notes to the financial statements are an integral part of, and should be read in conjunction with, the financial statements.
| 14 | MainStay S&P 500 Index Fund |
| | Shares | Value |
| Common Stocks (continued) |
| Media (continued) |
| |
| Paramount Global, Class B (b) | 15,439 | $ 167,976 |
| | | 8,441,025 |
| Metals & Mining 0.4% |
| Freeport-McMoRan, Inc. | 45,899 | 1,550,468 |
| Newmont Corp. | 30,354 | 1,137,365 |
| Nucor Corp. | 7,963 | 1,176,852 |
| Steel Dynamics, Inc. | 4,985 | 530,952 |
| | | 4,395,637 |
| Multi-Utilities 0.7% |
| Ameren Corp. | 8,412 | 636,872 |
| CenterPoint Energy, Inc. | 20,208 | 543,191 |
| CMS Energy Corp. | 9,340 | 507,536 |
| Consolidated Edison, Inc. | 11,043 | 969,465 |
| Dominion Energy, Inc. | 26,790 | 1,080,173 |
| DTE Energy Co. | 6,601 | 636,204 |
| NiSource, Inc. | 13,231 | 332,892 |
| Public Service Enterprise Group, Inc. | 15,980 | 985,167 |
| Sempra | 20,148 | 1,410,964 |
| WEC Energy Group, Inc. | 10,099 | 821,958 |
| | | 7,924,422 |
| Office REITs 0.1% |
| Alexandria Real Estate Equities, Inc. | 4,986 | 464,346 |
| Boston Properties, Inc. | 4,620 | 247,494 |
| | | 711,840 |
| Oil, Gas & Consumable Fuels 4.1% |
| APA Corp. | 9,837 | 390,726 |
| Chevron Corp. | 56,805 | 8,278,193 |
| ConocoPhillips | 38,339 | 4,554,673 |
| Coterra Energy, Inc. | 24,251 | 666,902 |
| Devon Energy Corp. | 20,513 | 955,290 |
| Diamondback Energy, Inc. | 5,725 | 917,832 |
| EOG Resources, Inc. | 18,642 | 2,353,552 |
| EQT Corp. | 11,579 | 490,718 |
| Exxon Mobil Corp. | 128,167 | 13,566,477 |
| Hess Corp. | 8,848 | 1,277,651 |
| Kinder Morgan, Inc. | 62,063 | 1,005,421 |
| Marathon Oil Corp. | 19,392 | 529,596 |
| Marathon Petroleum Corp. | 12,801 | 1,936,151 |
| Occidental Petroleum Corp. | 21,243 | 1,313,030 |
| ONEOK, Inc. | 18,648 | 1,215,850 |
| Phillips 66 | 14,256 | 1,626,182 |
| Pioneer Natural Resources Co. | 7,464 | 1,783,896 |
| Targa Resources Corp. | 7,162 | 598,815 |
| Valero Energy Corp. | 11,306 | 1,435,862 |
| | Shares | Value |
| |
| Oil, Gas & Consumable Fuels (continued) |
| Williams Cos., Inc. (The) | 38,945 | $ 1,339,708 |
| | | 46,236,525 |
| Passenger Airlines 0.2% |
| Alaska Air Group, Inc. (a) | 4,073 | 128,829 |
| American Airlines Group, Inc. (a)(b) | 20,918 | 233,236 |
| Delta Air Lines, Inc. | 20,600 | 643,750 |
| Southwest Airlines Co. | 19,070 | 423,926 |
| United Airlines Holdings, Inc. (a) | 10,501 | 367,640 |
| | | 1,797,381 |
| Personal Care Products 0.2% |
| Estee Lauder Cos., Inc. (The), Class A | 7,424 | 956,731 |
| Kenvue, Inc. | 55,177 | 1,026,292 |
| | | 1,983,023 |
| Pharmaceuticals 4.1% |
| Bristol-Myers Squibb Co. | 66,885 | 3,446,584 |
| Catalent, Inc. (a) | 5,772 | 198,499 |
| Eli Lilly & Co. | 25,530 | 14,141,833 |
| Johnson & Johnson | 77,095 | 11,436,272 |
| Merck & Co., Inc. | 81,242 | 8,343,553 |
| Pfizer, Inc. | 180,762 | 5,524,087 |
| Viatris, Inc. | 38,404 | 341,796 |
| Zoetis, Inc. | 14,738 | 2,313,866 |
| | | 45,746,490 |
| Professional Services 0.7% |
| Automatic Data Processing, Inc. | 13,190 | 2,878,322 |
| Broadridge Financial Solutions, Inc. | 3,782 | 645,360 |
| Ceridian HCM Holding, Inc. (a) | 4,982 | 318,898 |
| Equifax, Inc. | 3,929 | 666,240 |
| Jacobs Solutions, Inc. | 4,031 | 537,332 |
| Leidos Holdings, Inc. | 4,397 | 435,831 |
| Paychex, Inc. | 10,274 | 1,140,928 |
| Paycom Software, Inc. | 1,577 | 386,318 |
| Robert Half, Inc. | 3,428 | 256,312 |
| Verisk Analytics, Inc. | 4,643 | 1,055,632 |
| | | 8,321,173 |
| Real Estate Management & Development 0.1% |
| CBRE Group, Inc., Class A (a) | 9,920 | 687,853 |
| CoStar Group, Inc. (a) | 13,073 | 959,689 |
| | | 1,647,542 |
| Residential REITs 0.3% |
| AvalonBay Communities, Inc. | 4,547 | 753,620 |
| Camden Property Trust | 3,418 | 290,120 |
| Equity Residential | 11,043 | 611,009 |
| Essex Property Trust, Inc. | 2,055 | 439,606 |
The notes to the financial statements are an integral part of, and should be read in conjunction with, the financial statements.
15
Portfolio of Investments October 31, 2023†^ (continued)
| | Shares | Value |
| Common Stocks (continued) |
| Residential REITs (continued) |
| Invitation Homes, Inc. | 18,417 | $ 546,801 |
| Mid-America Apartment Communities, Inc. | 3,736 | 441,408 |
| UDR, Inc. | 9,705 | 308,716 |
| | | 3,391,280 |
| Retail REITs 0.3% |
| Federal Realty Investment Trust | 2,349 | 214,205 |
| Kimco Realty Corp. | 19,846 | 356,037 |
| Realty Income Corp. | 22,693 | 1,075,194 |
| Regency Centers Corp. | 5,261 | 317,028 |
| Simon Property Group, Inc. | 10,475 | 1,151,098 |
| | | 3,113,562 |
| Semiconductors & Semiconductor Equipment 7.2% |
| Advanced Micro Devices, Inc. (a) | 51,727 | 5,095,110 |
| Analog Devices, Inc. | 16,053 | 2,525,618 |
| Applied Materials, Inc. | 26,885 | 3,558,230 |
| Broadcom, Inc. | 13,570 | 11,417,391 |
| Enphase Energy, Inc. (a) | 4,366 | 347,446 |
| First Solar, Inc. (a) | 3,420 | 487,179 |
| Intel Corp. | 134,083 | 4,894,030 |
| KLA Corp. | 4,377 | 2,055,877 |
| Lam Research Corp. | 4,268 | 2,510,523 |
| Microchip Technology, Inc. | 17,427 | 1,242,371 |
| Micron Technology, Inc. | 35,067 | 2,344,930 |
| Monolithic Power Systems, Inc. | 1,530 | 675,862 |
| NVIDIA Corp. | 79,080 | 32,248,824 |
| NXP Semiconductors NV | 8,254 | 1,423,237 |
| ON Semiconductor Corp. (a) | 13,816 | 865,434 |
| Qorvo, Inc. (a) | 3,135 | 274,062 |
| QUALCOMM, Inc. | 35,730 | 3,894,213 |
| Skyworks Solutions, Inc. | 5,103 | 442,634 |
| SolarEdge Technologies, Inc. (a) | 1,811 | 137,545 |
| Teradyne, Inc. | 4,931 | 410,604 |
| Texas Instruments, Inc. | 29,070 | 4,128,231 |
| | | 80,979,351 |
| Software 10.8% |
| Adobe, Inc. (a) | 14,593 | 7,764,352 |
| ANSYS, Inc. (a) | 2,779 | 773,284 |
| Autodesk, Inc. (a) | 6,843 | 1,352,382 |
| Cadence Design Systems, Inc. (a) | 8,702 | 2,087,175 |
| Fair Isaac Corp. (a) | 796 | 673,312 |
| Fortinet, Inc. (a) | 20,869 | 1,193,081 |
| Gen Digital, Inc. | 18,016 | 300,146 |
| Intuit, Inc. | 8,966 | 4,437,722 |
| Microsoft Corp. | 237,872 | 80,426,902 |
| | Shares | Value |
| |
| Software (continued) |
| Oracle Corp. | 50,402 | $ 5,211,567 |
| Palo Alto Networks, Inc. (a) | 9,792 | 2,379,652 |
| PTC, Inc. (a) | 3,805 | 534,298 |
| Roper Technologies, Inc. | 3,416 | 1,668,955 |
| Salesforce, Inc. (a) | 31,184 | 6,262,683 |
| ServiceNow, Inc. (a) | 6,531 | 3,800,062 |
| Synopsys, Inc. (a) | 4,872 | 2,287,112 |
| Tyler Technologies, Inc. (a) | 1,347 | 502,296 |
| | | 121,654,981 |
| Specialized REITs 1.1% |
| American Tower Corp. | 14,924 | 2,659,308 |
| Crown Castle, Inc. | 13,885 | 1,291,027 |
| Digital Realty Trust, Inc. | 9,692 | 1,205,297 |
| Equinix, Inc. | 2,996 | 2,186,002 |
| Extra Space Storage, Inc. | 6,764 | 700,683 |
| Iron Mountain, Inc. | 9,344 | 551,950 |
| Public Storage | 5,066 | 1,209,305 |
| SBA Communications Corp. | 3,470 | 723,946 |
| VICI Properties, Inc. | 32,446 | 905,243 |
| Weyerhaeuser Co. | 23,396 | 671,231 |
| | | 12,103,992 |
| Specialty Retail 2.0% |
| AutoZone, Inc. (a) | 581 | 1,439,212 |
| Bath & Body Works, Inc. | 7,329 | 217,305 |
| Best Buy Co., Inc. | 6,218 | 415,487 |
| CarMax, Inc. (a) | 5,065 | 309,421 |
| Home Depot, Inc. (The) | 32,188 | 9,163,602 |
| Lowe's Cos., Inc. | 18,761 | 3,575,284 |
| O'Reilly Automotive, Inc. (a) | 1,934 | 1,799,471 |
| Ross Stores, Inc. | 10,906 | 1,264,769 |
| TJX Cos., Inc. (The) | 36,794 | 3,240,447 |
| Tractor Supply Co. | 3,484 | 670,879 |
| Ulta Beauty, Inc. (a) | 1,594 | 607,808 |
| | | 22,703,685 |
| Technology Hardware, Storage & Peripherals 7.4% |
| Apple, Inc. (c) | 470,514 | 80,349,676 |
| Hewlett Packard Enterprise Co. | 41,349 | 635,948 |
| HP, Inc. | 27,778 | 731,395 |
| NetApp, Inc. | 6,749 | 491,192 |
| Seagate Technology Holdings plc | 6,175 | 421,444 |
| Western Digital Corp. (a) | 10,243 | 411,256 |
| | | 83,040,911 |
| Textiles, Apparel & Luxury Goods 0.5% |
| Lululemon Athletica, Inc. (a) | 3,701 | 1,456,269 |
| NIKE, Inc., Class B | 39,222 | 4,030,845 |
The notes to the financial statements are an integral part of, and should be read in conjunction with, the financial statements.
| 16 | MainStay S&P 500 Index Fund |
| | Shares | Value |
| Common Stocks (continued) |
| Textiles, Apparel & Luxury Goods (continued) |
| Ralph Lauren Corp. | 1,293 | $ 145,501 |
| Tapestry, Inc. | 7,421 | 204,523 |
| VF Corp. | 10,583 | 155,888 |
| | | 5,993,026 |
| Tobacco 0.6% |
| Altria Group, Inc. | 56,816 | 2,282,299 |
| Philip Morris International, Inc. | 49,700 | 4,431,252 |
| | | 6,713,551 |
| Trading Companies & Distributors 0.3% |
| Fastenal Co. | 18,292 | 1,067,155 |
| United Rentals, Inc. | 2,186 | 888,106 |
| WW Grainger, Inc. | 1,425 | 1,040,008 |
| | | 2,995,269 |
| Water Utilities 0.1% |
| American Water Works Co., Inc. | 6,233 | 733,312 |
| Veralto Corp. (a) | 7,013 | 483,897 |
| | | 1,217,209 |
| Wireless Telecommunication Services 0.2% |
| T-Mobile USA, Inc. (a) | 16,573 | 2,384,192 |
Total Common Stocks (d)
(Cost $249,352,892) | | 1,125,368,019 |
| |
| | Number of
Rights | |
| |
| Rights 0.0% ‡ |
| Health Care Equipment & Supplies 0.0% ‡ |
| ABIOMED, Inc., CVR (a)(e) | 1,477 | 1,507 |
Total Rights
(Cost $1,506) | | 1,507 |
| |
| | Shares | |
| |
| Short-Term Investments 1.0% |
| Affiliated Investment Company 0.0% ‡ |
| MainStay U.S. Government Liquidity Fund, 5.275% (f) | 42,693 | 42,693 |
| | Shares | | Value |
| |
| Unaffiliated Investment Company 0.1% |
| Invesco Government & Agency Portfolio, 5.357% (f)(g) | 390,165 | | $ 390,165 |
| |
| | Principal
Amount | | |
| |
| U.S. Treasury Debt 0.9% |
| U.S. Treasury Bills | | | |
| 5.361%, due 12/19/23 (c)(h) | $ 10,200,000 | | 10,127,760 |
Total Short-Term Investments
(Cost $10,560,988) | | | 10,560,618 |
Total Investments
(Cost $259,915,386) | 100.7% | | 1,135,930,144 |
| Other Assets, Less Liabilities | (0.7) | | (7,349,958) |
| Net Assets | 100.0% | | $ 1,128,580,186 |
| † | Percentages indicated are based on Fund net assets. |
| ^ | Industry classifications may be different than those used for compliance monitoring purposes. |
| ‡ | Less than one-tenth of a percent. |
| (a) | Non-income producing security. |
| (b) | All or a portion of this security was held on loan. As of October 31, 2023, the aggregate market value of securities on loan was $377,864. The Fund received cash collateral with a value of $390,165. (See Note 2(H)) |
| (c) | Represents a security, or portion thereof, which was maintained at the broker as collateral for futures contracts. |
| (d) | The combined market value of common stocks and notional value of Standard & Poor’s 500 Index futures contracts represents 100.0% of the Fund’s net assets. |
| (e) | Illiquid security—As of October 31, 2023, the total market value deemed illiquid under procedures approved by the Board of Trustees was $1,507, which represented less than one-tenth of a percent of the Fund’s net assets. (Unaudited) |
| (f) | Current yield as of October 31, 2023. |
| (g) | Represents a security purchased with cash collateral received for securities on loan. |
| (h) | Interest rate shown represents yield to maturity. |
The notes to the financial statements are an integral part of, and should be read in conjunction with, the financial statements.
17
Portfolio of Investments October 31, 2023†^ (continued)
Investments in Affiliates (in 000's)
Investments in issuers considered to be affiliate(s) of the Fund during the year ended October 31, 2023 for purposes of Section 2(a)(3) of the Investment Company Act of 1940, as amended, were as follows:
| Affiliated Investment Companies | Value,
Beginning
of Year | Purchases
at Cost | Proceeds
from
Sales | Net
Realized
Gain/(Loss)
on Sales | Change in
Unrealized
Appreciation/
(Depreciation) | Value,
End of
Year | Dividend
Income | Other
Distributions | Shares
End of
Year |
| MainStay U.S. Government Liquidity Fund | $ 21 | $ 13,852 | $ (13,830) | $ — | $ — | $ 43 | $ 5 | $ — | 43 |
Futures Contracts
As of October 31, 2023, the Fund held the following futures contracts:
| Type | Number of
Contracts | Expiration
Date | Value at
Trade Date | Current
Notional
Amount | Unrealized
Appreciation
(Depreciation)1 |
| Long Contracts | | | | | |
| S&P 500 E-Mini Index | 13 | December 2023 | $ 2,853,566 | $ 2,737,963 | $ (115,603) |
| 1. | Represents the difference between the value of the contracts at the time they were opened and the value as of October 31, 2023. |
| Abbreviation(s): |
| REIT—Real Estate Investment Trust |
The following is a summary of the fair valuations according to the inputs used as of October 31, 2023, for valuing the Fund’s assets and liabilities:
| Description | Quoted
Prices in
Active
Markets for
Identical
Assets
(Level 1) | | Significant
Other
Observable
Inputs
(Level 2) | | Significant
Unobservable
Inputs
(Level 3) | | Total |
| Asset Valuation Inputs | | | | | | | |
| Investments in Securities (a) | | | | | | | |
| Common Stocks | $ 1,125,368,019 | | $ — | | $ — | | $ 1,125,368,019 |
| Rights | — | | 1,507 | | — | | 1,507 |
| Short-Term Investments | | | | | | | |
| Affiliated Investment Company | 42,693 | | — | | — | | 42,693 |
| Unaffiliated Investment Company | 390,165 | | — | | — | | 390,165 |
| U.S. Treasury Debt | — | | 10,127,760 | | — | | 10,127,760 |
| Total Short-Term Investments | 432,858 | | 10,127,760 | | — | | 10,560,618 |
| Total Investments in Securities | $ 1,125,800,877 | | $ 10,129,267 | | $ — | | $ 1,135,930,144 |
| Liability Valuation Inputs | | | | | | | |
| Other Financial Instruments | | | | | | | |
| Futures Contracts (b) | $ (115,603) | | $ — | | $ — | | $ (115,603) |
| (a) | For a complete listing of investments and their industries, see the Portfolio of Investments. |
| (b) | The value listed for these securities reflects unrealized appreciation (depreciation) as shown on the Portfolio of Investments. |
The notes to the financial statements are an integral part of, and should be read in conjunction with, the financial statements.
| 18 | MainStay S&P 500 Index Fund |
Statement of Assets and Liabilities as of October 31, 2023
| Assets |
Investment in unaffiliated securities, at value
(identified cost $259,872,693) including securities on loan of $377,864 | $1,135,887,451 |
Investment in affiliated investment companies, at value
(identified cost $42,693) | 42,693 |
| Receivables: | |
| Dividends | 837,776 |
| Fund shares sold | 633,428 |
| Variation margin on futures contracts | 63,566 |
| Securities lending | 626 |
| Other assets | 2,239 |
| Total assets | 1,137,467,779 |
| Liabilities |
| Cash collateral received for securities on loan | 390,165 |
| Due to custodian | 66 |
| Payables: | |
| Fund shares redeemed | 7,951,576 |
| NYLIFE Distributors (See Note 3) | 186,764 |
| Transfer agent (See Note 3) | 167,509 |
| Manager (See Note 3) | 156,280 |
| Professional fees | 22,152 |
| Custodian | 10,236 |
| Shareholder communication | 1,614 |
| Accrued expenses | 1,231 |
| Total liabilities | 8,887,593 |
| Net assets | $1,128,580,186 |
| Composition of Net Assets |
| Shares of beneficial interest outstanding (par value of $.001 per share) unlimited number of shares authorized | $ 23,231 |
| Additional paid-in-capital | 207,066,281 |
| | 207,089,512 |
| Total distributable earnings (loss) | 921,490,674 |
| Net assets | $1,128,580,186 |
| Class A | |
| Net assets applicable to outstanding shares | $819,686,999 |
| Shares of beneficial interest outstanding | 16,961,329 |
| Net asset value per share outstanding | $ 48.33 |
| Maximum sales charge (1.50% of offering price) | 0.74 |
| Maximum offering price per share outstanding | $ 49.07 |
| Investor Class | |
| Net assets applicable to outstanding shares | $ 43,008,862 |
| Shares of beneficial interest outstanding | 892,594 |
| Net asset value per share outstanding | $ 48.18 |
| Maximum sales charge (1.00% of offering price) | 0.49 |
| Maximum offering price per share outstanding | $ 48.67 |
| Class I | |
| Net assets applicable to outstanding shares | $265,489,257 |
| Shares of beneficial interest outstanding | 5,368,597 |
| Net asset value and offering price per share outstanding | $ 49.45 |
| SIMPLE Class | |
| Net assets applicable to outstanding shares | $ 395,068 |
| Shares of beneficial interest outstanding | 8,199 |
| Net asset value and offering price per share outstanding(a) | $ 48.19 |
| (a) | The difference between the calculated and stated NAV was caused by rounding. |
The notes to the financial statements are an integral part of, and should be read in conjunction with, the financial statements.
19
Statement of Operations for the year ended October 31, 2023
| Investment Income (Loss) |
| Income | |
| Dividends-unaffiliated (net of foreign tax withholding of $4,961) | $ 18,906,379 |
| Interest | 403,739 |
| Securities lending, net | 15,731 |
| Dividends-affiliated | 4,788 |
| Total income | 19,330,637 |
| Expenses | |
| Manager (See Note 3) | 1,841,906 |
| Distribution/Service—Class A (See Note 3) | 2,033,833 |
| Distribution/Service—Investor Class (See Note 3) | 112,637 |
| Distribution/Service—SIMPLE Class (See Note 3) | 1,513 |
| Transfer agent (See Note 3) | 973,224 |
| Professional fees | 137,541 |
| Registration | 79,889 |
| Trustees | 29,708 |
| Custodian | 26,954 |
| Shareholder communication | 23,130 |
| Miscellaneous | 155,929 |
| Total expenses before waiver/reimbursement | 5,416,264 |
| Expense waiver/reimbursement from Manager (See Note 3) | (63,041) |
| Reimbursement from prior custodian(a) | (2,174) |
| Net expenses | 5,351,049 |
| Net investment income (loss) | 13,979,588 |
| Realized and Unrealized Gain (Loss) |
| Net realized gain (loss) on: | |
| Unaffiliated investment transactions | 36,741,427 |
| Futures transactions | (416,985) |
| Foreign currency transactions | (59) |
| Net realized gain (loss) | 36,324,383 |
| Net change in unrealized appreciation (depreciation) on: | |
| Unaffiliated investments | 53,457,337 |
| Futures contracts | (250,082) |
| Net change in unrealized appreciation (depreciation) | 53,207,255 |
| Net realized and unrealized gain (loss) | 89,531,638 |
| Net increase (decrease) in net assets resulting from operations | $103,511,226 |
| (a) | Represents a refund for overbilling of custody fees. |
The notes to the financial statements are an integral part of, and should be read in conjunction with, the financial statements.
| 20 | MainStay S&P 500 Index Fund |
Statements of Changes in Net Assets
for the years ended October 31, 2023 and October 31, 2022
| | 2023 | 2022 |
| Increase (Decrease) in Net Assets |
| Operations: | | |
| Net investment income (loss) | $ 13,979,588 | $ 12,857,823 |
| Net realized gain (loss) | 36,324,383 | 95,503,240 |
| Net change in unrealized appreciation (depreciation) | 53,207,255 | (304,428,421) |
| Net increase (decrease) in net assets resulting from operations | 103,511,226 | (196,067,358) |
| Distributions to shareholders: | | |
| Class A | (70,919,309) | (39,561,389) |
| Investor Class | (3,958,067) | (2,447,460) |
| Class I | (25,518,452) | (21,892,265) |
| SIMPLE Class | (17,326) | (2,833) |
| Total distributions to shareholders | (100,413,154) | (63,903,947) |
| Capital share transactions: | | |
| Net proceeds from sales of shares | 116,334,052 | 141,247,690 |
| Net asset value of shares issued to shareholders in reinvestment of distributions | 98,862,685 | 62,992,377 |
| Cost of shares redeemed | (172,019,334) | (298,133,932) |
| Increase (decrease) in net assets derived from capital share transactions | 43,177,403 | (93,893,865) |
| Net increase (decrease) in net assets | 46,275,475 | (353,865,170) |
| Net Assets |
| Beginning of year | 1,082,304,711 | 1,436,169,881 |
| End of year | $1,128,580,186 | $1,082,304,711 |
The notes to the financial statements are an integral part of, and should be read in conjunction with, the financial statements.
21
Financial Highlights selected per share data and ratios
| | Year Ended October 31, |
| Class A | 2023 | | 2022 | | 2021 | | 2020 | | 2019 |
| Net asset value at beginning of year | $ 48.54 | | $ 59.77 | | $ 45.82 | | $ 49.60 | | $ 49.27 |
| Net investment income (loss) (a) | 0.56 | | 0.52 | | 0.49 | | 0.58 | | 0.67 |
| Net realized and unrealized gain (loss) | 3.75 | | (9.12) | | 17.71 | | 3.44 | | 5.52 |
| Total from investment operations | 4.31 | | (8.60) | | 18.20 | | 4.02 | | 6.19 |
| Less distributions: | | | | | | | | | |
| From net investment income | (0.57) | | (0.53) | | (0.55) | | (0.91) | | (0.77) |
| From net realized gain on investments | (3.95) | | (2.10) | | (3.70) | | (6.89) | | (5.09) |
| Total distributions | (4.52) | | (2.63) | | (4.25) | | (7.80) | | (5.86) |
| Net asset value at end of year | $ 48.33 | | $ 48.54 | | $ 59.77 | | $ 45.82 | | $ 49.60 |
| Total investment return (b) | 9.58% | | (15.03)% | | 42.19% | | 9.21% | | 13.80% |
| Ratios (to average net assets)/Supplemental Data: | | | | | | | | | |
| Net investment income (loss) | 1.16% | | 0.99% | | 0.92% | | 1.32% | | 1.44% |
| Net expenses (c) | 0.52% | | 0.52% | | 0.50% | | 0.54% | | 0.54% |
| Portfolio turnover rate | 2% | | 2% | | 5% | | 15% | | 3% |
| Net assets at end of year (in 000’s) | $ 819,687 | | $ 763,996 | | $ 894,565 | | $ 602,036 | | $ 559,780 |
| (a) | Per share data based on average shares outstanding during the year. |
| (b) | Total investment return is calculated exclusive of sales charges and assumes the reinvestment of dividends and distributions. For periods of less than one year, total return is not annualized. |
| (c) | In addition to the fees and expenses which the Fund bears directly, it also indirectly bears a pro-rata share of the fees and expenses of the underlying funds in which it invests. Such indirect expenses are not included in the above expense ratios. |
| | Year Ended October 31, |
| Investor Class | 2023 | | 2022 | | 2021 | | 2020 | | 2019 |
| Net asset value at beginning of year | $ 48.39 | | $ 59.55 | | $ 45.68 | | $ 49.50 | | $ 49.18 |
| Net investment income (loss) (a) | 0.47 | | 0.43 | | 0.40 | | 0.51 | | 0.59 |
| Net realized and unrealized gain (loss) | 3.74 | | (9.10) | | 17.63 | | 3.43 | | 5.52 |
| Total from investment operations | 4.21 | | (8.67) | | 18.03 | | 3.94 | | 6.11 |
| Less distributions: | | | | | | | | | |
| From net investment income | (0.47) | | (0.39) | | (0.46) | | (0.87) | | (0.70) |
| From net realized gain on investments | (3.95) | | (2.10) | | (3.70) | | (6.89) | | (5.09) |
| Total distributions | (4.42) | | (2.49) | | (4.16) | | (7.76) | | (5.79) |
| Net asset value at end of year | $ 48.18 | | $ 48.39 | | $ 59.55 | | $ 45.68 | | $ 49.50 |
| Total investment return (b) | 9.37% | | (15.18)% | | 41.89% | | 9.03% | | 13.62% |
| Ratios (to average net assets)/Supplemental Data: | | | | | | | | | |
| Net investment income (loss) | 0.99% | | 0.80% | | 0.75% | | 1.16% | | 1.26% |
| Net expenses (c) | 0.70% | | 0.70% | | 0.70% | | 0.70% | | 0.70% |
| Expenses (before waiver/reimbursement) (c) | 0.84% | | 0.79% | | 0.82% | | 0.88% | | 0.89% |
| Portfolio turnover rate | 2% | | 2% | | 5% | | 15% | | 3% |
| Net assets at end of year (in 000's) | $ 43,009 | | $ 45,102 | | $ 58,363 | | $ 55,546 | | $ 54,505 |
| (a) | Per share data based on average shares outstanding during the year. |
| (b) | Total investment return is calculated exclusive of sales charges and assumes the reinvestment of dividends and distributions. For periods of less than one year, total return is not annualized. |
| (c) | In addition to the fees and expenses which the Fund bears directly, it also indirectly bears a pro-rata share of the fees and expenses of the underlying funds in which it invests. Such indirect expenses are not included in the above expense ratios. |
The notes to the financial statements are an integral part of, and should be read in conjunction with, the financial statements.
| 22 | MainStay S&P 500 Index Fund |
Financial Highlights selected per share data and ratios
| | Year Ended October 31, |
| Class I | 2023 | | 2022 | | 2021 | | 2020 | | 2019 |
| Net asset value at beginning of year | $ 49.58 | | $ 60.97 | | $ 46.66 | | $ 50.38 | | $ 49.97 |
| Net investment income (loss) (a) | 0.70 | | 0.67 | | 0.64 | | 0.70 | | 0.81 |
| Net realized and unrealized gain (loss) | 3.82 | | (9.30) | | 18.03 | | 3.50 | | 5.59 |
| Total from investment operations | 4.52 | | (8.63) | | 18.67 | | 4.20 | | 6.40 |
| Less distributions: | | | | | | | | | |
| From net investment income | (0.70) | | (0.66) | | (0.66) | | (1.03) | | (0.90) |
| From net realized gain on investments | (3.95) | | (2.10) | | (3.70) | | (6.89) | | (5.09) |
| Total distributions | (4.65) | | (2.76) | | (4.36) | | (7.92) | | (5.99) |
| Net asset value at end of year | $ 49.45 | | $ 49.58 | | $ 60.97 | | $ 46.66 | | $ 50.38 |
| Total investment return (b) | 9.84% | | (14.82)% | | 42.56% | | 9.47% | | 14.08% |
| Ratios (to average net assets)/Supplemental Data: | | | | | | | | | |
| Net investment income (loss) | 1.41% | | 1.23% | | 1.19% | | 1.56% | | 1.74% |
| Net expenses (c) | 0.27% | | 0.26% | | 0.25% | | 0.29% | | 0.29% |
| Portfolio turnover rate | 2% | | 2% | | 5% | | 15% | | 3% |
| Net assets at end of year (in 000’s) | $ 265,489 | | $ 273,022 | | $ 483,174 | | $ 436,446 | | $ 399,842 |
| (a) | Per share data based on average shares outstanding during the year. |
| (b) | Total investment return is calculated exclusive of sales charges and assumes the reinvestment of dividends and distributions. Class I shares are not subject to sales charges. For periods of less than one year, total return is not annualized. |
| (c) | In addition to the fees and expenses which the Fund bears directly, it also indirectly bears a pro-rata share of the fees and expenses of the underlying funds in which it invests. Such indirect expenses are not included in the above expense ratios. |
| | Year Ended October 31, | | August 31, 2020^ through
October 31, |
| SIMPLE Class | 2023 | | 2022 | | 2021 | | 2020 |
| Net asset value at beginning of period | $ 48.43 | | $ 59.73 | | $ 45.65 | | $ 48.83* |
| Net investment income (loss) (a) | 0.40 | | 0.29 | | 0.21 | | 0.02 |
| Net realized and unrealized gain (loss) | 3.75 | | (9.11) | | 17.74 | | (3.20) |
| Total from investment operations | 4.15 | | (8.82) | | 17.95 | | (3.18) |
| Less distributions: | | | | | | | |
| From net investment income | (0.44) | | (0.38) | | (0.17) | | — |
| From net realized gain on investments | (3.95) | | (2.10) | | (3.70) | | — |
| Total distributions | (4.39) | | (2.48) | | (3.87) | | — |
| Net asset value at end of period | $ 48.19 | | $ 48.43 | | $ 59.73 | | $ 45.65 |
| Total investment return (b) | 9.24% | | (15.39)% | | 41.54% | | (6.51)% |
| Ratios (to average net assets)/Supplemental Data: | | | | | | | |
| Net investment income (loss) | 0.82% | | 0.56% | | 0.39% | | 0.30%†† |
| Net expenses (c) | 0.82%(d) | | 0.95% | | 0.95% | | 0.95%†† |
| Expenses (before waiver/reimbursement) (c) | 0.82% | | 1.04% | | 1.06% | | 1.15%†† |
| Portfolio turnover rate | 2% | | 2% | | 5% | | 15% |
| Net assets at end of period (in 000’s) | $ 395 | | $ 185 | | $ 68 | | $ 23 |
| ^ | Inception date. |
| * | Based on the net asset value of Investor Class as of August 31, 2020. |
| †† | Annualized. |
| (a) | Per share data based on average shares outstanding during the period. |
| (b) | Total investment return is calculated exclusive of sales charges and assumes the reinvestment of dividends and distributions. SIMPLE Class shares are not subject to sales charges. For periods of less than one year, total return is not annualized. |
| (c) | In addition to the fees and expenses which the Fund bears directly, it also indirectly bears a pro-rata share of the fees and expenses of the underlying funds in which it invests. Such indirect expenses are not included in the above expense ratios. |
| (d) | Expense waiver/reimbursement less than 0.01%. |
The notes to the financial statements are an integral part of, and should be read in conjunction with, the financial statements.
23
Notes to Financial Statements
Note 1-Organization and Business
MainStay Funds Trust (the “Trust”) was organized as a Delaware statutory trust on April 28, 2009. The Trust is registered under the Investment Company Act of 1940, as amended (the “1940 Act”), as an open-end management investment company, and is comprised of thirty-seven funds (collectively referred to as the “Funds”). These financial statements and notes relate to the MainStay S&P 500 Index Fund (formerly known as MainStay MacKay S&P 500 Index Fund) (the "Fund"), a “diversified” fund, as that term is defined in the 1940 Act, as interpreted or modified by regulatory authorities having jurisdiction, from time to time.
The following table lists the Fund's share classes that have been registered and commenced operations:
| Class | Commenced Operations |
| Class A | January 2, 2004 |
| Investor Class | February 28, 2008 |
| Class I | January 2, 1991 |
| SIMPLE Class | August 31, 2020 |
Class A and Investor Class shares are offered at net asset value (“NAV”) per share plus an initial sales charge. No initial sales charge applies to investments of $1 million or more (and certain other qualified purchases) in Class A and Investor Class shares. However, a contingent deferred sales charge (“CDSC”) of 1.00% may be imposed on certain redemptions made within 18 months of the date of purchase on shares that were purchased without an initial sales charge. Class I and SIMPLE Class shares are offered at NAV without a sales charge. Investor Class shares may convert automatically to Class A shares. SIMPLE Class shares convert to Class A shares, or Investor Class shares if you are not eligible to hold Class A shares, at the end of the calendar quarter, ten years after the date they were purchased. Share class conversions are based on the relevant NAVs of the two classes at the time of the conversion, and no sales load or other charge is imposed. Under certain circumstances and as may be permitted by the Trust’s multiple class plan pursuant to Rule 18f-3 under the 1940 Act, specified share classes of the Fund may be converted to one or more other share classes of the Fund as disclosed in the capital share transactions within these Notes. The classes of shares have the same voting (except for issues that relate solely to one class), dividend, liquidation and other rights, and the same terms and conditions, except that under distribution plans pursuant to Rule 12b-1 under the 1940 Act, Class A, Investor Class and SIMPLE Class shares are subject to a distribution and/or service fee. Class I shares are not subject to a distribution and/or service fee.
The Fund's investment objective is to seek investment results that correspond to the total return performance (reflecting reinvestment of dividends) of common stocks in the aggregate, as represented by the S&P 500® Index.
Note 2–Significant Accounting Policies
The Fund is an investment company and accordingly follows the investment company accounting and reporting guidance of the Financial Accounting Standards Board (“FASB”) Accounting Standards Codification Topic 946 Financial Services—Investment Companies. The Fund prepares its financial statements in accordance with generally accepted accounting principles (“GAAP”) in the United States of America and follows the significant accounting policies described below.
(A) Securities Valuation. Investments are usually valued as of the close of regular trading on the New York Stock Exchange (the "Exchange") (usually 4:00 p.m. Eastern time) on each day the Fund is open for business ("valuation date").
Pursuant to Rule 2a-5 under the 1940 Act, the Board of Trustees of the Trust (the "Board") has designated New York Life Investment Management LLC (“New York Life Investments” or the "Manager") as its Valuation Designee (the "Valuation Designee"). The Valuation Designee is responsible for performing fair valuations relating to all investments in the Fund’s portfolio for which market quotations are not readily available; periodically assessing and managing material valuation risks; establishing and applying fair value methodologies; testing fair valuation methodologies; evaluating and overseeing pricing services; ensuring appropriate segregation of valuation and portfolio management functions; providing quarterly, annual and prompt reporting to the Board, as appropriate; identifying potential conflicts of interest; and maintaining appropriate records. The Valuation Designee has established a valuation committee ("Valuation Committee") to assist in carrying out the Valuation Designee’s responsibilities and establish prices of securities for which market quotations are not readily available. The Fund's and the Valuation Designee's policies and procedures ("Valuation Procedures") govern the Valuation Designee’s selection and application of methodologies for determining and calculating the fair value of Fund investments. The Valuation Designee may value the Fund's portfolio securities for which market quotations are not readily available and other Fund assets utilizing inputs from pricing services and other third-party sources. The Valuation Committee meets (in person, via electronic mail or via teleconference) on an ad-hoc basis to determine fair valuations and on a quarterly basis to review fair value events with respect to certain securities for which market quotations are not readily available, including valuation risks and back-testing results, and preview reports to the Board.
The Valuation Committee establishes prices of securities for which market quotations are not readily available based on such methodologies and measurements on a regular basis after considering information that is reasonably available and deemed relevant by the Valuation Committee. The Board shall oversee the Valuation Designee and review fair valuation materials on a prompt, quarterly and annual basis and approve proposed revisions to the Valuation Procedures.
Investments for which market quotations are not readily available are valued at fair value as determined in good faith pursuant to the Valuation Procedures. A market quotation is readily available only when that
| 24 | MainStay S&P 500 Index Fund |
quotation is a quoted price (unadjusted) in active markets for identical investments that the Fund can access at the measurement date, provided that a quotation will not be readily available if it is not reliable. "Fair value" is defined as the price the Fund would reasonably expect to receive upon selling an asset or liability in an orderly transaction to an independent buyer in the principal or most advantageous market for the asset or liability. Fair value measurements are determined within a framework that establishes a three-tier hierarchy that maximizes the use of observable market data and minimizes the use of unobservable inputs to establish a classification of fair value measurements for disclosure purposes. "Inputs" refer broadly to the assumptions that market participants would use in pricing the asset or liability, including assumptions about risk, such as the risk inherent in a particular valuation technique used to measure fair value using a pricing model and/or the risk inherent in the inputs for the valuation technique. Inputs may be observable or unobservable. Observable inputs reflect the assumptions market participants would use in pricing the asset or liability based on market data obtained from sources independent of the Fund. Unobservable inputs reflect the Fund’s own assumptions about the assumptions market participants would use in pricing the asset or liability based on the information available. The inputs or methodology used for valuing assets or liabilities may not be an indication of the risks associated with investing in those assets or liabilities. The three-tier hierarchy of inputs is summarized below.
| • | Level 1—quoted prices (unadjusted) in active markets for an identical asset or liability |
| • | Level 2—other significant observable inputs (including quoted prices for a similar asset or liability in active markets, interest rates and yield curves, prepayment speeds, credit risk, etc.) |
| • | Level 3—significant unobservable inputs (including the Fund's own assumptions about the assumptions that market participants would use in measuring fair value of an asset or liability) |
The level of an asset or liability within the fair value hierarchy is based on the lowest level of an input, both individually and in the aggregate, that is significant to the fair value measurement. The aggregate value by input level of the Fund’s assets and liabilities as of October 31, 2023, is included at the end of the Portfolio of Investments.
The Fund may use third-party vendor evaluations, whose prices may be derived from one or more of the following standard inputs, among others:
| • Broker/dealer quotes | • Benchmark securities |
| • Two-sided markets | • Reference data (corporate actions or material event notices) |
| • Bids/offers | • Monthly payment information |
| • Industry and economic events | • Reported trades |
An asset or liability for which a market quotation is not readily available is valued by methods deemed reasonable in good faith by the Valuation Committee, following the Valuation Procedures to represent fair value. Under these procedures, the Valuation Designee generally uses a market-based approach which may use related or comparable assets or
liabilities, recent transactions, market multiples, book values and other relevant information. The Valuation Designee may also use an income-based valuation approach in which the anticipated future cash flows of the asset or liability are discounted to calculate fair value. Discounts may also be applied due to the nature and/or duration of any restrictions on the disposition of the asset or liability. Fair value represents a good faith approximation of the value of a security. Fair value determinations involve the consideration of a number of subjective factors, an analysis of applicable facts and circumstances and the exercise of judgment. As a result, it is possible that the fair value for a security determined in good faith in accordance with the Valuation Procedures may differ from valuations for the same security determined for other funds using their own valuation procedures. Although the Valuation Procedures are designed to value a security at the price the Fund may reasonably expect to receive upon the security's sale in an orderly transaction, there can be no assurance that any fair value determination thereunder would, in fact, approximate the amount that the Fund would actually realize upon the sale of the security or the price at which the security would trade if a reliable market price were readily available. During the year ended October 31, 2023, there were no material changes to the fair value methodologies.
Securities which may be valued in this manner include, but are not limited to: (i) a security for which trading has been halted or suspended or otherwise does not have a readily available market quotation on a given day; (ii) a debt security that has recently gone into default and for which there is not a current market quotation; (iii) a security of an issuer that has entered into a restructuring; (iv) a security that has been delisted from a national exchange; (v) a security subject to trading collars for which no or limited trading takes place; and (vi) a security whose principal market has been temporarily closed at a time when, under normal conditions, it would be open. Securities valued in this manner are generally categorized as Level 2 or 3 in the hierarchy. As of October 31, 2023, securities that were fair valued in such a manner are shown in the Portfolio of Investments.
Equity securities, rights and warrants, if applicable, are valued at the last quoted sales prices as of the close of regular trading on the relevant exchange on each valuation date. Securities that are not traded on the valuation date are valued at the mean of the last quoted bid and ask prices. Prices are normally taken from the principal market in which each security trades. These securities are generally categorized as Level 1 in the hierarchy.
Investments in mutual funds, including money market funds, are valued at their respective NAVs at the close of business each day on the valuation date. These securities are generally categorized as Level 1 in the hierarchy.
Futures contracts are valued at the last posted settlement price on the market where such futures are primarily traded. These securities are generally categorized as Level 1 in the hierarchy.
Temporary cash investments acquired in excess of 60 days to maturity at the time of purchase are valued using the latest bid prices or using
Notes to Financial Statements (continued)
valuations based on a matrix system (which considers such factors as security prices, yields, maturities and ratings), both as furnished by independent pricing services. Temporary cash investments that mature in 60 days or less at the time of purchase ("Short-Term Investments") are valued using the amortized cost method of valuation, unless the use of such method would be inappropriate. The amortized cost method involves valuing a security at its cost on the date of purchase and thereafter assuming a constant amortization to maturity of the difference between such cost and the value on maturity date. Amortized cost approximates the current fair value of a security. Securities valued using the amortized cost method are not valued using quoted prices in an active market and are generally categorized as Level 2 in the hierarchy.
The information above is not intended to reflect an exhaustive list of the methodologies that may be used to value portfolio investments. The Valuation Procedures permit the use of a variety of valuation methodologies in connection with valuing portfolio investments. The methodology used for a specific type of investment may vary based on the market data available or other considerations. The methodologies summarized above may not represent the specific means by which portfolio investments are valued on any particular business day.
A portfolio investment may be classified as an illiquid investment under the Trust's written liquidity risk management program and related procedures (“Liquidity Program”). Illiquidity of an investment might prevent the sale of such investment at a time when the Manager or the Subadvisor might wish to sell, and these investments could have the effect of decreasing the overall level of the Fund's liquidity. Further, the lack of an established secondary market may make it more difficult to value illiquid investments, requiring the Fund to rely on judgments that may be somewhat subjective in measuring value, which could vary materially from the amount that the Fund could realize upon disposition. Difficulty in selling illiquid investments may result in a loss or may be costly to the Fund. An illiquid investment is any investment that the Manager or Subadvisor reasonably expects cannot be sold or disposed of in current market conditions in seven calendar days or less without the sale or disposition significantly changing the market value of the investment. The liquidity classification of each investment will be made using information obtained after reasonable inquiry and taking into account, among other things, relevant market, trading and investment-specific considerations in accordance with the Liquidity Program. Illiquid investments are often fair valued in accordance with the Fund's procedures described above. The liquidity of the Fund's investments was determined as of October 31, 2023, and can change at any time. Illiquid investments as of October 31, 2023, are shown in the Portfolio of Investments.
(B) Income Taxes. The Fund's policy is to comply with the requirements of the Internal Revenue Code of 1986, as amended (the “Internal Revenue Code”), applicable to regulated investment companies and to distribute all of its taxable income to the shareholders of the Fund within the allowable time limits.
The Manager evaluates the Fund’s tax positions to determine if the tax positions taken meet the minimum recognition threshold in connection with accounting for uncertainties in income tax positions taken or expected to be taken for the purposes of measuring and recognizing tax liabilities in the financial statements. Recognition of tax benefits of an uncertain tax position is permitted only to the extent the position is “more likely than not” to be sustained assuming examination by taxing authorities. The Manager analyzed the Fund's tax positions taken on federal, state and local income tax returns for all open tax years (for up to three tax years) and has concluded that no provisions for federal, state and local income tax are required in the Fund's financial statements. The Fund's federal, state and local income tax and federal excise tax returns for tax years for which the applicable statutes of limitations have not expired are subject to examination by the Internal Revenue Service and state and local departments of revenue.
(C) Dividends and Distributions to Shareholders. Dividends and distributions are recorded on the ex-dividend date. The Fund intends to declare and pay dividends from net investment income and distributions from net realized capital and currency gains, if any, at least annually. Unless a shareholder elects otherwise, all dividends and distributions are reinvested at NAV in the same class of shares of the Fund. Dividends and distributions to shareholders are determined in accordance with federal income tax regulations and may differ from determinations using GAAP.
(D) Security Transactions and Investment Income. The Fund records security transactions on the trade date. Realized gains and losses on security transactions are determined using the identified cost method. Dividend income is recognized on the ex-dividend date, net of any foreign tax withheld at the source, and interest income is accrued as earned using the effective interest rate method. Distributions received from real estate investment trusts may be classified as dividends, capital gains and/or return of capital.
Investment income and realized and unrealized gains and losses on investments of the Fund are allocated pro rata to the separate classes of shares based upon their relative net assets on the date the income is earned or realized and unrealized gains and losses are incurred.
(E) Expenses. Expenses of the Trust are allocated to the individual Funds in proportion to the net assets of the respective Funds when the expenses are incurred, except where direct allocations of expenses can be made. Expenses (other than transfer agent expenses and fees incurred under the shareholder services plans and/or the distribution plans further discussed in Note 3(B)) are allocated to separate classes of shares pro rata based upon their relative net assets on the date the expenses are incurred. The expenses borne by the Fund, including those of related parties to the Fund, are shown in the Statement of Operations.
Additionally, the Fund may invest in mutual funds, which are subject to management fees and other fees that may cause the costs of investing in mutual funds to be greater than the costs of owning the underlying securities directly. These indirect expenses of mutual funds are not
| 26 | MainStay S&P 500 Index Fund |
included in the amounts shown as expenses in the Statement of Operations or in the expense ratios included in the Financial Highlights.
(F) Use of Estimates. In preparing financial statements in conformity with GAAP, the Manager makes estimates and assumptions that affect the reported amounts and disclosures in the financial statements. Actual results could differ from those estimates and assumptions.
(G) Futures Contracts. A futures contract is an agreement to purchase or sell a specified quantity of an underlying instrument at a specified future date and price, or to make or receive a cash payment based on the value of a financial instrument (e.g., foreign currency, interest rate, security or securities index). The Fund is subject to risks such as market price risk, leverage risk, liquidity risk, counterparty risk, operational risk, legal risk and/or interest rate risk in the normal course of investing in these contracts. Upon entering into a futures contract, the Fund is required to pledge to the broker or futures commission merchant an amount of cash and/or U.S. government securities equal to a certain percentage of the collateral amount, known as the “initial margin.” During the period the futures contract is open, changes in the value of the contract are recognized as unrealized appreciation or depreciation by marking to market such contract on a daily basis to reflect the market value of the contract at the end of each day’s trading. The Fund agrees to receive from or pay to the broker or futures commission merchant an amount of cash equal to the daily fluctuation in the value of the contract. Such receipts or payments are known as “variation margin.” When the futures contract is closed, the Fund records a realized gain or loss equal to the difference between the proceeds from (or cost of) the closing transaction and the Fund's basis in the contract.
The use of futures contracts involves, to varying degrees, elements of market risk in excess of the amount recognized in the Statement of Assets and Liabilities. The contract or notional amounts and variation margin reflect the extent of the Fund's involvement in open futures positions. There are several risks associated with the use of futures contracts as hedging techniques. There can be no assurance that a liquid market will exist at the time when the Fund seeks to close out a futures contract. If no liquid market exists, the Fund would remain obligated to meet margin requirements until the position is closed. Futures contracts may involve a small initial investment relative to the risk assumed, which could result in losses greater than if the Fund did not invest in futures contracts. Futures contracts may be more volatile than direct investments in the instrument underlying the futures and may not correlate to the underlying instrument, causing a given hedge not to achieve its objectives. The Fund's activities in futures contracts have minimal counterparty risk as they are conducted through regulated exchanges that guarantee the futures against default by the counterparty. In the event of a bankruptcy or insolvency of a futures commission merchant that holds margin on behalf of the Fund, the Fund may not be entitled to the return of the entire margin owed to the Fund, potentially resulting in a loss. The Fund may invest in futures contracts to seek enhanced returns or to reduce the risk of loss by hedging certain of its holdings. The Fund's investment in futures contracts and other derivatives may increase the
volatility of the Fund's NAVs and may result in a loss to the Fund. Open futures contracts as of October 31, 2023, are shown in the Portfolio of Investments.
(H) Securities Lending. In order to realize additional income, the Fund may engage in securities lending, subject to the limitations set forth in the 1940 Act and relevant guidance by the staff of the Securities and Exchange Commission (“SEC”). If the Fund engages in securities lending, the Fund will lend through its custodian, JPMorgan Chase Bank, N.A., ("JPMorgan"), acting as securities lending agent on behalf of the Fund. Under the current arrangement, JPMorgan will manage the Fund's collateral in accordance with the securities lending agency agreement between the Fund and JPMorgan, and indemnify the Fund against counterparty risk. The loans will be collateralized by cash (which may be invested in a money market fund) and/or non-cash collateral (which may include U.S. Treasury securities and/or U.S. government agency securities issued or guaranteed by the United States government or its agencies or instrumentalities) at least equal at all times to the market value of the securities loaned. Non-cash collateral held at year end is segregated and cannot be transferred by the Fund. The Fund bears the risk of delay in recovery of, or loss of rights in, the securities loaned. The Fund may also record a realized gain or loss on securities deemed sold due to a borrower’s inability to return securities on loan. The Fund bears the risk of any loss on investment of cash collateral. The Fund will receive compensation for lending its securities in the form of fees or it will retain a portion of interest earned on the investment of any cash collateral. The Fund will also continue to receive interest and dividends on the securities loaned and any gain or loss in the market price of the securities loaned that may occur during the term of the loan will be for the account of the Fund. Income earned from securities lending activities, if any, is reflected in the Statement of Operations. Securities on loan as of October 31, 2023, are shown in the Portfolio of Investments.
(I) Rights and Warrants. Rights are certificates that permit the holder to purchase a certain number of shares, or a fractional share, of a new stock from the issuer at a specific price. Warrants are instruments that entitle the holder to buy an equity security at a specific price for a specific period of time. These investments can provide a greater potential for profit or loss than an equivalent investment in the underlying security. Prices of these investments do not necessarily move in tandem with the prices of the underlying securities.
There is risk involved in the purchase of rights and warrants in that these investments are speculative investments. The Fund could also lose the entire value of its investment in warrants if such warrants are not exercised by the date of its expiration. The Fund is exposed to risk until the sale or exercise of each right or warrant is completed. Rights and Warrants as of October 31, 2023 are shown in the Portfolio of Investments.
(J) Securities Risk. The ability of issuers of debt securities held by the Fund to meet their obligations may be affected by, among other things, economic or political developments in a specific country, industry
Notes to Financial Statements (continued)
or region. Debt securities are also subject to the risks associated with changes in interest rates.
(K) Large Transaction Risks. From time to time, the Fund may receive large purchase or redemption orders from affiliated or unaffiliated mutual funds or other investors. Such large transactions could have adverse effects on the Fund’s performance if the Fund were required to sell securities or invest cash at times when it otherwise would not do so. This activity could also accelerate the realization of capital gains and increase the Fund’s transaction costs. The Fund has adopted procedures designed to mitigate the negative impacts of such large transactions, but there can be no assurance that these procedures will be effective.
(L) Indemnifications. Under the Trust’s organizational documents, its officers and trustees are indemnified against certain liabilities that may arise out of performance of their duties to the Trust. Additionally, in the normal course of business, the Fund enters into contracts with third-party service providers that contain a variety of representations and warranties and that may provide general indemnifications. The Fund's maximum exposure under these arrangements is unknown, as this would involve future claims that may be made against the Fund that have not yet occurred. The Manager believes that the risk of loss in connection with these potential indemnification obligations is remote. However, there can be no assurance that material liabilities related to such obligations will not arise in the future, which could adversely impact the Fund.
(M) Quantitative Disclosure of Derivative Holdings. The following tables show additional disclosures related to the Fund's derivative and hedging activities, including how such activities are accounted for and their effect on the Fund's financial positions, performance and cash flows.
The Fund entered into futures contracts to provide an efficient means of maintaining liquidity while remaining fully invested in the market. These derivatives are not accounted for as hedging instruments.
Fair value of derivative instruments as of October 31, 2023:
| Liability Derivatives | Equity
Contracts
Risk | Total |
| Futures Contracts - Net Assets—Net unrealized depreciation on futures contracts (a) | $(115,603) | $(115,603) |
| Total Fair Value | $(115,603) | $(115,603) |
| (a) | Includes cumulative appreciation (depreciation) of futures contracts as reported in the Portfolio of Investments. Only current day’s variation margin is reported within the Statement of Assets and Liabilities. |
The effect of derivative instruments on the Statement of Operations for the year ended October 31, 2023:
| Net Realized Gain (Loss) from: | Equity
Contracts
Risk | Total |
| Futures Transactions | $(416,985) | $(416,985) |
| Total Net Realized Gain (Loss) | $(416,985) | $(416,985) |
| Net Change in Unrealized Appreciation (Depreciation) | Equity
Contracts
Risk | Total |
| Futures Contracts | $(250,082) | $(250,082) |
| Total Net Change in Unrealized Appreciation (Depreciation) | $(250,082) | $(250,082) |
| Average Notional Amount | Total |
| Futures Contracts Long | $7,576,704 |
Note 3–Fees and Related Party Transactions
(A) Manager and Subadvisor. New York Life Investments, a registered investment adviser and an indirect, wholly-owned subsidiary of New York Life Insurance Company ("New York Life"), serves as the Fund's Manager, pursuant to an Amended and Restated Management Agreement ("Management Agreement"). The Manager provides offices, conducts clerical, recordkeeping and bookkeeping services and keeps most of the financial and accounting records required to be maintained by the Fund. Except for the portion of salaries and expenses that are the responsibility of the Fund, the Manager pays the salaries and expenses of all personnel affiliated with the Fund and certain operational expenses of the Fund. The Fund reimburses New York Life Investments in an amount equal to the portion of the compensation of the Chief Compliance Officer attributable to the Fund. IndexIQ Advisors LLC (“IndexIQ” or the “Subadvisor”), a registered investment adviser and an affiliate of New York Life Investments, is responsible for the day-to-day portfolio management of the Fund. Pursuant to the terms of an Amended and Restated Subadvisory Agreement ("Subadvisory Agreement") between New York Life Investments and IndexIQ, New York Life Investments pays for the services of the Subadvisor.
Pursuant to the Management Agreement, the Fund pays the Manager a monthly fee for the services performed and the facilities furnished at an annual rate of the Fund’s average daily net assets as follows: 0.16% up to $2.5 billion and 0.15% in excess of $2.5 billion. During the year ended October 31, 2023, the effective management fee rate was 0.16% of the Fund’s average daily net assets, exclusive of any applicable waivers/reimbursements.
New York Life Investments has contractually agreed to waive fees and/or reimburse expenses so that Total Annual Fund Operating Expenses (excluding taxes, interest, litigation, extraordinary expenses, brokerage and other transaction expenses relating to the purchase or sale of portfolio investments, and acquired (underlying) fund fees and expenses) for Class A shares do not exceed 0.60% of the Fund’s average daily net assets. New York Life Investments will apply an equivalent waiver or reimbursement, in an equal number of basis points, to the other share classes of the Fund. This agreement will remain in effect until February 28, 2024, and shall renew automatically for one-year terms unless New York Life Investments provides written notice of termination prior to the start of the next term or upon approval of the Board.
| 28 | MainStay S&P 500 Index Fund |
Additionally, New York Life Investments has agreed to further voluntarily waive fees and/or reimburse expenses of the appropriate class of the Fund so that Total Annual Fund Operating Expenses (excluding taxes, interest, litigation, extraordinary expenses, brokerage and other transaction expenses relating to the purchase and sale of portfolio investments, and acquired (underlying) fund fees and expenses) for Investor Class and SIMPLE Class shares of the Fund do not exceed 0.70% and 0.95%, respectively, of the Fund’s average daily net assets. These voluntary waivers or reimbursements may be discontinued at any time without notice.
During the year ended October 31, 2023, New York Life Investments earned fees from the Fund in the amount of $1,841,906 and waived fees and/or reimbursed expenses in the amount of $63,041 and paid the Subadvisor fees in the amount of $889,448.
JPMorgan provides sub-administration and sub-accounting services to the Fund pursuant to an agreement with New York Life Investments. These services include calculating the daily NAVs of the Fund, maintaining the general ledger and sub-ledger accounts for the calculation of the Fund's NAVs, and assisting New York Life Investments in conducting various aspects of the Fund's administrative operations. For providing these services to the Fund, JPMorgan is compensated by New York Life Investments.
Pursuant to an agreement between the Trust and New York Life Investments, New York Life Investments is responsible for providing or procuring certain regulatory reporting services for the Fund. The Fund will reimburse New York Life Investments for the actual costs incurred by New York Life Investments in connection with providing or procuring these services for the Fund.
(B) Distribution and Service Fees. The Trust, on behalf of the Fund, has entered into a distribution agreement with NYLIFE Distributors LLC (the “Distributor”), an affiliate of New York Life Investments. The Fund has adopted distribution plans (the “Plans”) in accordance with the provisions of Rule 12b-1 under the 1940 Act.
Pursuant to the Class A and Investor Class Plans, the Distributor receives a monthly fee from the Class A and Investor Class shares at an annual rate of 0.25% of the average daily net assets of the Class A and Investor Class shares for distribution and/or service activities as designated by the Distributor. Pursuant to the SIMPLE Class Plan, SIMPLE Class shares pay the Distributor a monthly distribution fee at an annual rate of 0.25% of the average daily net assets of the SIMPLE Class shares, along with a service fee at an annual rate of 0.25% of the average daily net assets of the SIMPLE Class shares, for a total 12b-1 fee of 0.50%. Class I shares are not subject to a distribution and/or service fee.
The Plans provide that the distribution and service fees are payable to the Distributor regardless of the amounts actually expended by the Distributor for distribution of the Fund's shares and service activities.
(C) Sales Charges. The Fund was advised by the Distributor that the amount of initial sales charges retained on sales of Class A and Investor Class shares during the year ended October 31, 2023, were $117,519 and $8,309, respectively.
The Fund was also advised that the Distributor retained CDSCs on redemptions of Class A and Investor Class shares during the year ended October 31, 2023, of $6,137 and $826, respectively.
(D) Transfer, Dividend Disbursing and Shareholder Servicing Agent. NYLIM Service Company LLC, an affiliate of New York Life Investments, is the Fund's transfer, dividend disbursing and shareholder servicing agent pursuant to an agreement between NYLIM Service Company LLC and the Trust. NYLIM Service Company LLC has entered into an agreement with SS&C Global Investor & Distribution Solutions, Inc. ("SS&C"), pursuant to which SS&C performs certain transfer agent services on behalf of NYLIM Service Company LLC. New York Life Investments has contractually agreed to limit the transfer agency expenses charged to the Fund’s share classes to a maximum of 0.35% of that share class’s average daily net assets on an annual basis after deducting any applicable Fund or class-level expense reimbursement or small account fees. This agreement will remain in effect until February 28, 2024, and shall renew automatically for one-year terms unless New York Life Investments provides written notice of termination prior to the start of the next term or upon approval of the Board. During the year ended October 31, 2023, transfer agent expenses incurred by the Fund and any reimbursements, pursuant to the aforementioned Transfer Agency expense limitation agreement, were as follows:
| Class | Expense | Waived |
| Class A | $586,079 | $— |
| Investor Class | 175,967 | — |
| Class I | 210,825 | — |
| SIMPLE Class | 353 | — |
(E) Small Account Fee. Shareholders with small accounts adversely impact the cost of providing transfer agency services. In an effort to reduce total transfer agency expenses, the Fund has implemented a small account fee on certain types of accounts. As described in the Fund's prospectus, certain shareholders with an account balance of less than $1,000 ($5,000 for Class A share accounts) are charged an annual per account fee of $20 (assessed semi-annually), the proceeds from which offset transfer agent fees as reflected in the Statement of Operations. This small account fee will not apply to certain types of accounts as described further in the Fund’s prospectus.
(F) Capital. As of October 31, 2023, New York Life and its affiliates beneficially held shares of the Fund with the values and percentages of net assets as follows:
| Class I | $8,055,532 | 3.0% |
| SIMPLE Class | 30,575 | 7.7 |
Notes to Financial Statements (continued)
Note 4-Federal Income Tax
As of October 31, 2023, the cost and unrealized appreciation (depreciation) of the Fund’s investment portfolio, including applicable derivative contracts and other financial instruments, as determined on a federal income tax basis, were as follows:
| | Federal Tax
Cost | Gross
Unrealized
Appreciation | Gross
Unrealized
(Depreciation) | Net
Unrealized
Appreciation/
(Depreciation) |
| Investments in Securities | $261,783,659 | $891,003,253 | $(16,856,768) | $874,146,485 |
As of October 31, 2023, the components of accumulated gain (loss) on a tax basis were as follows:
Ordinary
Income | Accumulated
Capital
and Other
Gain (Loss) | Other
Temporary
Differences | Unrealized
Appreciation
(Depreciation) | Total
Accumulated
Gain (Loss) |
| $11,298,006 | $36,046,183 | $— | $874,146,485 | $921,490,674 |
The difference between book-basis and tax-basis unrealized appreciation (depreciation) is primarily due to wash sale adjustments and mark to market of futures contracts.
During the years ended October 31, 2023 and October 31, 2022, the tax character of distributions paid as reflected in the Statements of Changes in Net Assets was as follows:
| | 2023 | 2022 |
| Distributions paid from: | | |
| Ordinary Income | $ 13,195,334 | $24,571,153 |
| Long-Term Capital Gains | 87,217,820 | 39,332,794 |
| Total | $100,413,154 | $63,903,947 |
Note 5–Custodian
JPMorgan is the custodian of cash and securities held by the Fund. Custodial fees are charged to the Fund based on the Fund's net assets and/or the market value of securities held by the Fund and the number of certain transactions incurred by the Fund.
Note 6–Line of Credit
The Fund and certain other funds managed by New York Life Investments maintain a line of credit with a syndicate of banks in order to secure a source of funds for temporary purposes to meet unanticipated or excessive redemption requests.
Effective July 25, 2023, under the credit agreement (the “Credit Agreement”), the aggregate commitment amount is $600,000,000 with an additional uncommitted amount of $100,000,000. The commitment fee is an annual rate of 0.15% of the average commitment amount payable quarterly, regardless of usage, to JPMorgan, who serves as the agent to the syndicate. The commitment fee is allocated among the Fund and certain other funds managed by New York Life Investments based upon their respective net assets and other factors. Interest on any revolving credit loan is charged based upon the Federal Funds Rate, Daily
Simple Secured Overnight Financing Rate ("SOFR") + 0.10%, or the Overnight Bank Funding Rate, whichever is higher. The Credit Agreement expires on July 23, 2024, although the Fund, certain other funds managed by New York Life Investments and the syndicate of banks may renew the Credit Agreement for an additional year on the same or different terms or enter into a credit agreement with a different syndicate of banks. Prior to July 25, 2023, the aggregate commitment amount and the commitment fee were the same as those under the current Credit Agreement. During the year ended October 31, 2023, there were no borrowings made or outstanding with respect to the Fund under the Credit Agreement.
Note 7–Interfund Lending Program
Pursuant to an exemptive order issued by the SEC, the Fund, along with certain other funds managed by New York Life Investments, may participate in an interfund lending program. The interfund lending program provides an alternative credit facility that permits the Fund and certain other funds managed by New York Life Investments to lend or borrow money for temporary purposes directly to or from one another, subject to the conditions of the exemptive order. During the year ended October 31, 2023, there were no interfund loans made or outstanding with respect to the Fund.
Note 8–Purchases and Sales of Securities (in 000’s)
During the year ended October 31, 2023, purchases and sales of securities, other than short-term securities, were $24,101 and $65,294, respectively.
Note 9–Capital Share Transactions
Transactions in capital shares for the years ended October 31, 2023 and October 31, 2022, were as follows:
| Class A | Shares | Amount |
| Year ended October 31, 2023: | | |
| Shares sold | 1,750,215 | $ 84,806,867 |
| Shares issued to shareholders in reinvestment of distributions | 1,548,312 | 69,503,695 |
| Shares redeemed | (2,189,982) | (104,877,067) |
| Net increase (decrease) in shares outstanding before conversion | 1,108,545 | 49,433,495 |
| Shares converted into Class A (See Note 1) | 117,163 | 5,675,110 |
| Shares converted from Class A (See Note 1) | (4,022) | (198,601) |
| Net increase (decrease) | 1,221,686 | $ 54,910,004 |
| Year ended October 31, 2022: | | |
| Shares sold | 1,934,863 | $ 103,966,523 |
| Shares issued to shareholders in reinvestment of distributions | 681,394 | 38,730,442 |
| Shares redeemed | (1,972,053) | (103,647,452) |
| Net increase (decrease) in shares outstanding before conversion | 644,204 | 39,049,513 |
| Shares converted into Class A (See Note 1) | 135,732 | 7,705,065 |
| Shares converted from Class A (See Note 1) | (7,302) | (391,955) |
| Net increase (decrease) | 772,634 | $ 46,362,623 |
| |
| 30 | MainStay S&P 500 Index Fund |
| Investor Class | Shares | Amount |
| Year ended October 31, 2023: | | |
| Shares sold | 125,647 | $ 6,021,419 |
| Shares issued to shareholders in reinvestment of distributions | 88,226 | 3,955,175 |
| Shares redeemed | (135,951) | (6,582,846) |
| Net increase (decrease) in shares outstanding before conversion | 77,922 | 3,393,748 |
| Shares converted into Investor Class (See Note 1) | 36 | 1,680 |
| Shares converted from Investor Class (See Note 1) | (117,425) | (5,675,110) |
| Net increase (decrease) | (39,467) | $ (2,279,682) |
| Year ended October 31, 2022: | | |
| Shares sold | 142,813 | $ 7,662,662 |
| Shares issued to shareholders in reinvestment of distributions | 43,087 | 2,445,630 |
| Shares redeemed | (99,249) | (5,308,943) |
| Net increase (decrease) in shares outstanding before conversion | 86,651 | 4,799,349 |
| Shares converted into Investor Class (See Note 1) | 1,364 | 74,345 |
| Shares converted from Investor Class (See Note 1) | (136,000) | (7,705,065) |
| Net increase (decrease) | (47,985) | $ (2,831,371) |
| |
| Class I | Shares | Amount |
| Year ended October 31, 2023: | | |
| Shares sold | 518,286 | $ 25,310,822 |
| Shares issued to shareholders in reinvestment of distributions | 553,927 | 25,386,489 |
| Shares redeemed | (1,214,488) | (60,554,095) |
| Net increase (decrease) in shares outstanding before conversion | (142,275) | (9,856,784) |
| Shares converted into Class I (See Note 1) | 3,900 | 196,921 |
| Net increase (decrease) | (138,375) | $ (9,659,863) |
| Year ended October 31, 2022: | | |
| Shares sold | 539,861 | $ 29,470,154 |
| Shares issued to shareholders in reinvestment of distributions | 376,549 | 21,813,472 |
| Shares redeemed | (3,339,414) | (189,167,876) |
| Net increase (decrease) in shares outstanding before conversion | (2,423,004) | (137,884,250) |
| Shares converted into Class I (See Note 1) | 5,825 | 317,610 |
| Net increase (decrease) | (2,417,179) | $(137,566,640) |
| |
| SIMPLE Class | Shares | Amount |
| Year ended October 31, 2023: | | |
| Shares sold | 4,100 | $ 194,944 |
| Shares issued to shareholders in reinvestment of distributions | 386 | 17,326 |
| Shares redeemed | (113) | (5,326) |
| Net increase (decrease) | 4,373 | $ 206,944 |
| Year ended October 31, 2022: | | |
| Shares sold | 2,829 | $ 148,351 |
| Shares issued to shareholders in reinvestment of distributions | 50 | 2,833 |
| Shares redeemed | (186) | (9,661) |
| Net increase (decrease) | 2,693 | $ 141,523 |
Note 10–Other Matters
As of the date of this report, the Fund faces a heightened level of risk associated with current uncertainty, volatility and state of economies, financial markets, rising interest rates, and labor and health conditions around the world. Events such as war, acts of terrorism, recessions, rapid inflation, the imposition of international sanctions, earthquakes, hurricanes, epidemics and pandemics and other unforeseen natural or human disasters may have broad adverse social, political and economic effects on the global economy, which could negatively impact the value of the Fund's investments. Developments that disrupt global economies and financial markets may magnify factors that affect the Fund's performance.
Note 11–Subsequent Events
In connection with the preparation of the financial statements of the Fund as of and for the year ended October 31, 2023, events and transactions subsequent to October 31, 2023, through the date the financial statements were issued, have been evaluated by the Manager for possible adjustment and/or disclosure. No subsequent events requiring financial statement adjustment or disclosure have been identified.
Report of Independent Registered Public Accounting Firm
To the Shareholders of the Fund and Board of Trustees
MainStay Funds Trust:
Opinion on the Financial Statements
We have audited the accompanying statement of assets and liabilities of MainStay S&P 500 Index Fund (formerly, MainStay MacKay S&P 500 Index Fund) (the Fund), one of the funds constituting MainStay Funds Trust, including the portfolio of investments, as of October 31, 2023, the related statement of operations for the year then ended, the statements of changes in net assets for each of the years in the two-year period then ended, and the related notes (collectively, the financial statements) and the financial highlights for each of the years or periods in the five-year period then ended. In our opinion, the financial statements and financial highlights present fairly, in all material respects, the financial position of the Fund as of October 31, 2023, the results of its operations for the year then ended, the changes in its net assets for each of the years in the two-year period then ended, and the financial highlights for each of the years or periods in the five-year period then ended, in conformity with U.S. generally accepted accounting principles.
Basis for Opinion
These financial statements and financial highlights are the responsibility of the Fund's management. Our responsibility is to express an opinion on these financial statements and financial highlights based on our audits. We are a public accounting firm registered with the Public Company Accounting Oversight Board (United States) (PCAOB) and are required to be independent with respect to the Fund in accordance with the U.S. federal securities laws and the applicable rules and regulations of the Securities and Exchange Commission and the PCAOB.
We conducted our audits in accordance with the standards of the PCAOB. Those standards require that we plan and perform the audit to obtain reasonable assurance about whether the financial statements and financial highlights are free of material misstatement, whether due to error or fraud. Our audits included performing procedures to assess the risks of material misstatement of the financial statements and financial highlights, whether due to error or fraud, and performing procedures that respond to those risks. Such procedures included examining, on a test basis, evidence regarding the amounts and disclosures in the financial statements and financial highlights. Such procedures also included confirmation of securities owned as of October 31, 2023, by correspondence with custodians, the transfer agent and broker; when replies were not received from the broker, we performed other auditing procedures. Our audits also included evaluating the accounting principles used and significant estimates made by management, as well as evaluating the overall presentation of the financial statements and financial highlights. We believe that our audits provide a reasonable basis for our opinion.

We have served as the auditor of one or more New York Life Investment Management investment companies since 2003.
Philadelphia, Pennsylvania
December 22, 2023
| 32 | MainStay S&P 500 Index Fund |
Federal Income Tax Information
(Unaudited)
The Fund is required under the Internal Revenue Code to advise shareholders in a written statement as to the federal tax status of dividends paid by the Fund during such fiscal years. Accordingly, the Fund paid $87,217,820 as long term capital gain distributions.
For the fiscal year ended October 31, 2023, the Fund designated approximately $13,195,334 under the Internal Revenue Code as qualified dividend income eligible for reduced tax rates.
The dividends paid by the Fund during the fiscal year ended October 31, 2023 should be multiplied by 100.00% to arrive at the amount eligible for the corporate dividend-received deduction.
In February 2024, shareholders will receive an IRS Form 1099-DIV or substitute Form 1099, which will show the federal tax status of the distributions received by shareholders in calendar year 2023. The amounts that will be reported on such 1099-DIV or substitute Form 1099 will be the amounts you are to use on your federal income tax return and will differ from the amounts which we must report for the Fund's fiscal year ended October 31, 2023.
Proxy Voting Policies and Procedures and Proxy Voting Record
The Fund is required to file with the SEC its proxy voting record for the 12-month period ending June 30 on Form N-PX. A description of the policies and procedures that are used to vote proxies relating to portfolio securities of the Fund is available free of charge upon request by calling 800-624-6782 or visiting the SEC’s website at www.sec.gov. The most recent Form N-PX or proxy voting record is available free of charge upon request by calling 800-624-6782; visiting newyorklifeinvestments.com; or visiting the SEC’s website at www.sec.gov.
Shareholder Reports and Quarterly Portfolio Disclosure
The Fund is required to file its complete schedule of portfolio holdings with the SEC 60 days after its first and third fiscal quarter on Form N-PORT. The Fund's holdings report is available free of charge upon request by calling New York Life Investments at 800-624-6782.
Board of Trustees and Officers (Unaudited)
The Trustees and officers of the Fund are listed below. The Board oversees the MainStay Group of Funds (which consists of MainStay Funds and MainStay Funds Trust), MainStay VP Funds Trust, MainStay MacKay DefinedTerm Municipal Opportunities Fund, MainStay CBRE Global Infrastructure Megatrends Term Fund, the Manager and the Subadvisors, and elects the officers of the Funds who are responsible for the day-to-day operations of the Fund. Information pertaining to the Trustees and officers is set forth below. Each Trustee serves until his or her successor is elected and qualified or until his or her resignation, death or
removal. Under the Board’s retirement policy, unless an exception is made, a Trustee must tender his or her resignation by the end of the calendar year during which he or she reaches the age of 75. Officers are elected annually by the Board. The business address of each Trustee and officer listed below is 51 Madison Avenue, New York, New York 10010. A majority of the Trustees are not “interested persons” (as defined by the 1940 Act and rules adopted by the SEC thereunder) of the Fund (“Independent Trustees”).
| | Name and
Year of Birth | Term of Office,
Position(s) Held and
Length of Service | Principal Occupation(s)
During Past Five Years | Number of
Portfolios in
Fund Complex
Overseen by
Trustee | Other Directorships
Held by Trustee |
| | | | | | |
| | Naïm Abou-Jaoudé*
1966 | MainStay Funds: Trustee
since 2023
MainStay Funds Trust:
Trustee since 2023 | Chief Executive Officer of New York Life Investment Management LLC (since 2023). Chief Executive Officer of Candriam (an affiliate of New York Life Investment Management LLC) (2007 to 2023). | 81 | MainStay VP Funds Trust:
Trustee since 2023 (31 portfolios);
MainStay MacKay DefinedTerm Municipal Opportunities Fund: Trustee
since 2023;
MainStay CBRE Global Infrastructure Megatrends Term Fund: Trustee
since 2023; and
New York Life Investment Management International (Chair) since 2015 |
| * | This Trustee is considered to be an “interested person” of the MainStay Group of Funds, MainStay VP Funds Trust, MainStay CBRE Global Infrastructure Megatrends Term Fund and MainStay MacKay DefinedTerm Municipal Opportunities Fund, within the meaning of the 1940 Act because of his affiliation with New York Life Investment Management LLC and Candriam, as described in detail above in the column entitled “Principal Occupation(s) During Past Five Years.” |
| | |
| 34 | MainStay S&P 500 Index Fund |
| | Name and
Year of Birth | Term of Office,
Position(s) Held and
Length of Service | Principal Occupation(s)
During Past Five Years | Number of
Portfolios in
Fund Complex
Overseen by
Trustee | Other Directorships
Held by Trustee |
| | | | | | |
| | David H. Chow
1957 | MainStay Funds: Trustee since January 2016, Advisory Board Member (June 2015 to December 2015);MainStay Funds Trust:
Trustee since January 2016, Advisory Board Member (June 2015 to December 2015) | Founder and CEO, DanCourt Management, LLC (since 1999) | 81 | MainStay VP Funds Trust: Trustee since January 2016, Advisory Board Member (June 2015 to December 2015) (31 portfolios);
MainStay MacKay DefinedTerm Municipal Opportunities Fund: Trustee since January 2016, Advisory Board Member (June 2015 to December 2015);
MainStay CBRE Global Infrastructure Megatrends Term Fund: Trustee since 2021;
VanEck Vectors Group of Exchange-Traded Funds: Trustee since 2006 and Independent Chairman of the Board of Trustees from 2008 to 2022 (57 portfolios); and
Berea College of Kentucky: Trustee since 2009, Chair of the Investment Committee since 2018 |
| | Karen Hammond
1956 | MainStay Funds: Trustee since December 2021, Advisory Board Member (June 2021 to December 2021);MainStay Funds Trust:
Trustee since December 2021, Advisory Board Member (June 2021 to December 2021)
| Retired, Managing Director, Devonshire Investors (2007 to 2013); Senior Vice President, Fidelity Management & Research Co. (2005 to 2007); Senior Vice President and Corporate Treasurer, FMR Corp. (2003 to 2005); Chief Operating Officer, Fidelity Investments Japan (2001 to 2003) | 81 | MainStay VP Funds Trust: Trustee since December 2021, Advisory Board Member (June 2021 to December 2021) (31 portfolios);
MainStay MacKay DefinedTerm Municipal Opportunities Fund: Trustee since December 2021, Advisory Board Member (June 2021 to December 2021);
MainStay CBRE Global Infrastructure Megatrends Term Fund: Trustee since December 2021, Advisory Board Member (June 2021 to December 2021);
Two Harbors Investment Corp.: Director since 2018;
Rhode Island State Investment Commission: Member since 2017; and
Blue Cross Blue Shield of Rhode Island: Director since 2019 |
| | Susan B. Kerley
1951 | MainStay Funds: Chair since January 2017 and Trustee since 2007;MainStay Funds Trust:
Chair since January 2017 and Trustee since 1990*** | President, Strategic Management Advisors LLC (since 1990) | 81 | MainStay VP Funds Trust: Chair since January 2017 and Trustee since 2007 (31 portfolios)**;
MainStay MacKay DefinedTerm Municipal Opportunities Fund: Chair since January 2017 and Trustee since 2011;
MainStay CBRE Global Infrastructure Megatrends Term Fund: Trustee since June 2021; and
Legg Mason Partners Funds: Trustee since 1991 (45 portfolios) |
| | Alan R. Latshaw
1951 | MainStay Funds: Trusteesince 2006;MainStay Funds Trust:
Trustee since 2007*** | Retired; Partner, Ernst & Young LLP (2002 to 2003); Partner, Arthur Andersen LLP (1989 to 2002); Consultant to the MainStay Funds Audit and Compliance Committee (2004 to 2006) | 81 | MainStay VP Funds Trust: Trustee since 2007 (31 portfolios)**;
MainStay MacKay DefinedTerm Municipal Opportunities Fund: Trustee since 2011; and
MainStay CBRE Global Infrastructure Megatrends Term Fund: Trustee since June 2021 |
Board of Trustees and Officers (Unaudited) (continued)
| | Name and
Year of Birth | Term of Office,
Position(s) Held and
Length of Service | Principal Occupation(s)
During Past Five Years | Number of
Portfolios in
Fund Complex
Overseen by
Trustee | Other Directorships
Held by Trustee |
| | | | | | |
| | Jacques P. Perold
1958 | MainStay Funds: Trustee since January 2016, Advisory Board Member (June 2015to December 2015);MainStay Funds Trust:
Trustee since January 2016, Advisory Board Member (June 2015 to December 2015) | Founder and Chief Executive Officer, CapShift Advisors LLC (since 2018); President, Fidelity Management & Research Company (2009 to 2014); President and Chief Investment Officer, Geode Capital Management, LLC (2001 to 2009) | 81 | MainStay VP Funds Trust: Trustee since January 2016, Advisory Board Member (June 2015 to December 2015) (31 portfolios);
MainStay MacKay DefinedTerm Municipal Opportunities Fund: Trustee since January 2016, Advisory Board Member (June 2015 to December 2015);
MainStay CBRE Global Infrastructure Megatrends Term Fund: Trustee since June 2021;
Allstate Corporation: Director since 2015; and
MSCI Inc.: Director since 2017 |
| | Richard S. Trutanic
1952 | MainStay Funds: Trustee since 1994;MainStay Funds Trust:
Trustee since 2007*** | Chairman and Chief Executive Officer, Somerset & Company (financial advisory firm) (since 2004); Managing Director, The Carlyle Group (private investment firm) (2002 to 2004); Senior Managing Director, Partner and Board Member, Groupe Arnault S.A. (private investment firm) (1999 to 2002) | 81 | MainStay VP Funds Trust: Trustee since 2007 (31 portfolios)**;
MainStay MacKay DefinedTerm Municipal Opportunities Fund: Trustee since 2011; and
MainStay CBRE Global Infrastructure Megatrends Term Fund: Trustee since June 2021 |
| ** | Includes prior service as a Director of MainStay VP Series Fund, Inc., the predecessor to MainStay VP Funds Trust. |
| *** | Includes prior service as a Director/Trustee of certain predecessor entities to MainStay Funds Trust. |
| 36 | MainStay S&P 500 Index Fund |
| | Name and
Year of Birth | Position(s) Held and
Length of Service | Principal Occupation(s)
During Past Five Years | |
| | | | | |
| | Kirk C. Lehneis
1974 | President, MainStay Funds, MainStay Funds Trust (since 2017) | Chief Operating Officer and Senior Managing Director (since 2016), New York Life Investment Management LLC and New York Life Investment Management Holdings LLC; Member of the Board of Managers (since 2017) and Senior Managing Director (since 2018), NYLIFE Distributors LLC; Chairman of the Board and Senior Managing Director, NYLIM Service Company LLC (since 2017); Trustee, President and Principal Executive Officer of IndexIQ Trust, IndexIQ ETF Trust and IndexIQ Active ETF Trust (since 2018); President, MainStay CBRE Global Infrastructure Megatrends Term Fund (since 2021), MainStay MacKay DefinedTerm Municipal Opportunities Fund and MainStay VP Funds Trust (since 2017)**; Senior Managing Director, Global Product Development (2015 to 2016); Managing Director, Product Development (2010 to 2015), New York Life Investment Management LLC | |
| | Jack R. Benintende
1964 | Treasurer and Principal Financial and Accounting Officer, MainStay Funds (since 2007), MainStay Funds Trust (since 2009) | Managing Director, New York Life Investment Management LLC (since 2007); Treasurer and Principal Financial and Accounting Officer, MainStay CBRE Global Infrastructure Megatrends Term Fund (since 2021), MainStay MacKay DefinedTerm Municipal Opportunities Fund (since 2011) and MainStay VP Funds Trust (since 2007)**; and Assistant Treasurer, New York Life Investment Management Holdings LLC (2008 to 2012) | |
| | J. Kevin Gao
1967 | Secretary and Chief Legal Officer, MainStay Funds and MainStay Funds Trust (since 2010) | Managing Director and Associate General Counsel, New York Life Investment Management LLC (since 2010); Secretary and Chief Legal Officer, MainStay CBRE Global Infrastructure Megatrends Term Fund (since 2021), MainStay MacKay DefinedTerm Municipal Opportunities Fund (since 2011) and MainStay VP Funds Trust (since 2010)** | |
| | Kevin M. Gleason
1967 | Vice President and Chief Compliance Officer, MainStay Funds and MainStay Funds Trust (since June 2022) | Vice President and Chief Compliance Officer, IndexIQ Trust, IndexIQ ETF Trust and Index IQ Active ETF Trust (since June 2022); Vice President and Chief Compliance Officer, MainStay CBRE Global Infrastructure Megatrends Term Fund, MainStay VP Funds Trust and MainStay MacKay DefinedTerm Municipal Opportunities Fund (since June 2022); Senior Vice President, Voya Investment Management and Chief Compliance Officer, Voya Family of Funds (2012 to 2022) | |
| | Scott T. Harrington
1959 | Vice President— Administration, MainStay Funds (since 2005), MainStay Funds Trust (since 2009) | Managing Director, New York Life Investment Management LLC (including predecessor advisory organizations) (since 2000); Member of the Board of Directors, New York Life Trust Company (since 2009); Vice President—Administration, MainStay CBRE Global Infrastructure Megatrends Term Fund (since 2021), MainStay MacKay DefinedTerm Municipal Opportunities Fund (since 2011) and MainStay VP Funds Trust (since 2005)** | |
| * | The officers listed above are considered to be “interested persons” of the MainStay Group of Funds, MainStay VP Funds Trust, MainStay CBRE Global Infrastructure Megatrends Term Fund and MainStay MacKay DefinedTerm Municipal Opportunities Fund within the meaning of the 1940 Act because of their affiliation with the MainStay Group of Funds, New York Life Insurance Company and/or its affiliates, including New York Life Investment Management LLC, New York Life Insurance Company, NYLIM Service Company LLC, NYLIFE Securities LLC and/or NYLIFE Distributors LLC, as described in detail in the column captioned “Principal Occupation(s) During Past Five Years.” Officers are elected annually by the Board. |
| ** | Includes prior service as an Officer of MainStay VP Series Fund, Inc., the predecessor to MainStay VP Funds Trust. |
Officers of the Trust (Who are not Trustees)*
This page intentionally left blank.
Equity
U.S. Equity
MainStay Epoch U.S. Equity Yield Fund
MainStay Fiera SMID Growth Fund
MainStay PineStone U.S. Equity Fund
MainStay S&P 500 Index Fund
MainStay Winslow Large Cap Growth Fund
MainStay WMC Enduring Capital Fund
MainStay WMC Growth Fund
MainStay WMC Small Companies Fund
MainStay WMC Value Fund
International Equity
MainStay Epoch International Choice Fund
MainStay PineStone International Equity Fund
MainStay WMC International Research Equity Fund
Emerging Markets Equity
MainStay Candriam Emerging Markets Equity Fund
Global Equity
MainStay Epoch Capital Growth Fund
MainStay Epoch Global Equity Yield Fund
MainStay PineStone Global Equity Fund
Fixed Income
Taxable Income
MainStay Candriam Emerging Markets Debt Fund
MainStay Floating Rate Fund
MainStay MacKay High Yield Corporate Bond Fund
MainStay MacKay Short Duration High Yield Fund
MainStay MacKay Strategic Bond Fund
MainStay MacKay Total Return Bond Fund
MainStay MacKay U.S. Infrastructure Bond Fund
MainStay Short Term Bond Fund
Tax-Exempt Income
MainStay MacKay California Tax Free Opportunities Fund1
MainStay MacKay High Yield Municipal Bond Fund
MainStay MacKay New York Tax Free Opportunities Fund2
MainStay MacKay Short Term Municipal Fund
MainStay MacKay Strategic Municipal Allocation Fund
MainStay MacKay Tax Free Bond Fund
Money Market
MainStay Money Market Fund
Mixed Asset
MainStay Balanced Fund
MainStay Income Builder Fund
MainStay MacKay Convertible Fund
Speciality
MainStay CBRE Global Infrastructure Fund
MainStay CBRE Real Estate Fund
MainStay Cushing MLP Premier Fund
Asset Allocation
MainStay Conservative Allocation Fund
MainStay Conservative ETF Allocation Fund
MainStay Defensive ETF Allocation Fund
MainStay Equity Allocation Fund
MainStay Equity ETF Allocation Fund
MainStay ESG Multi-Asset Allocation Fund
MainStay Growth Allocation Fund
MainStay Growth ETF Allocation Fund
MainStay Moderate Allocation Fund
MainStay Moderate ETF Allocation Fund
Manager
New York Life Investment Management LLC
New York, New York
Subadvisors
Candriam3
Strassen, Luxembourg
CBRE Investment Management Listed Real Assets LLC
Radnor, Pennsylvania
Cushing Asset Management, LP
Dallas, Texas
Epoch Investment Partners, Inc.
New York, New York
Fiera Capital Inc.
New York, New York
IndexIQ Advisors LLC3
New York, New York
MacKay Shields LLC3
New York, New York
NYL Investors LLC3
New York, New York
PineStone Asset Management Inc.
Montreal, Québec
Wellington Management Company LLP
Boston, Massachusetts
Winslow Capital Management, LLC
Minneapolis, Minnesota
Legal Counsel
Dechert LLP
Washington, District of Columbia
Independent Registered Public Accounting Firm
KPMG LLP
Philadelphia, Pennsylvania
Distributor
NYLIFE Distributors LLC3
Jersey City, New Jersey
Custodian
JPMorgan Chase Bank, N.A.
New York, New York
1.
This Fund is registered for sale in AZ, CA, NV, OR, TX, UT, WA and MI (Class A and Class I shares only), and CO, FL, GA, HI, ID, MA, MD, NH, NJ and NY (Class I shares only).
| 2. | This Fund is registered for sale in CA, CT, DE, FL, MA, NJ, NY and VT. |
| 3. | An affiliate of New York Life Investment Management LLC. |
Not part of the Annual Report
For more information
800-624-6782
newyorklifeinvestments.com
“New York Life Investments” is both a service mark, and the common trade name, of certain investment advisors affiliated with New York Life Insurance Company. The MainStay Funds® are managed by New York Life Investment Management LLC and distributed by NYLIFE Distributors LLC, 30 Hudson Street, Jersey City, NJ 07302, a wholly owned subsidiary of New York Life Insurance Company. NYLIFE Distributors LLC is a Member FINRA/SIPC.
©2023 NYLIFE Distributors LLC. All rights reserved.
| 5013946MS139-23 | MSSP11-12/23 |
(NYLIM) NL226
MainStay MacKay Short Duration High Yield Fund
Message from the President and Annual Report
October 31, 2023
Special Notice:
Beginning in July 2024, new regulations issued by the Securities and Exchange Commission (SEC) will take effect requiring open-end mutual fund companies and ETFs to (1) overhaul the content of their shareholder reports and (2) mail paper copies of the new tailored shareholder reports to shareholders who have not opted to receive these documents electronically.
If you have not yet elected to receive your shareholder reports electronically, please contact your financial intermediary or visit newyorklifeinvestments.com/accounts.
| Not FDIC/NCUA Insured | Not a Deposit | May Lose Value | No Bank Guarantee | Not Insured by Any Government Agency |
This page intentionally left blank
Message from the President
Volatile economic and geopolitical forces drove market behavior during the 12-month reporting period ended October 31, 2023. While equity markets generally gained ground, bond prices trended broadly lower.
Although the war in Ukraine, the outbreak of hostilities in the Middle East and several other notable events affected financial assets, inflation and interest rate trends stood at the forefront of market developments during most of the period. As the reporting period began, high levels of inflation already showed signs of easing in the face of aggressive rate hikes by the U.S. Federal Reserve (the “Fed”). From a peak of 9.1% in June 2022, the annualized U.S. inflation rate dropped to 7.1% in November 2022, and to 3.2% in October 2023. At the same time, the Fed increased the benchmark federal funds rate from 3.75%–4.00% at the beginning of the reporting period to 5.25%–5.50% as of October 31, 2023. As the pace of rate increases slowed during the period, investors hoped for an early shift to a looser monetary policy. However, comments from Fed members late in the period reinforced the central bank’s hawkish stance in response to surprisingly robust U.S. economic growth and rising wage pressures, thus increasing the likelihood that interest rates would stay higher for longer. International developed markets exhibited similar dynamics of elevated inflation and rising interest rates.
Despite the backdrop of high interest rates—along with political dysfunction in Washington D.C. and intensifying global geopolitical instability—equity markets managed to advance, supported by healthy consumer spending trends and persistent domestic economic growth. The S&P 500® Index, a widely regarded benchmark of large-cap U.S. market performance, gained ground, bolstered by the strong performance of energy stocks amid surging petroleum prices and mega-cap, growth-oriented, technology-related shares, which rose as investors flocked to companies creating the infrastructure for developments in artificial intelligence. Smaller-cap stocks and value-oriented shares produced milder returns. Among industry sectors, energy and
information technology posted the strongest gains. Real estate declined most sharply under pressure from rising mortgage rates and weak levels of office occupancy. Developed international markets outperformed U.S. markets, with Europe benefiting during the first half of the period from unexpected economic resilience in the face of rising energy prices and the ongoing war in Ukraine. Emerging markets posted positive results but lagged developed markets, largely due to slow economic growth in China despite the relaxation of pandemic-era lockdowns.
Bond prices were driven lower by rising yields and increasing expectations of high interest rates for an extended period of time. The U.S. yield curve steepened, with the 30-year Treasury yield exceeding 5% for the first time in more than a decade. The yield curve remained inverted, with the 10-year Treasury yield ending the period at 4.88%, compared with 5.07% for the 2-year Treasury yield. Corporate bonds outperformed long-term Treasury bonds, but still trended lower under pressure from rising yields and an uptick in default rates. Among corporates, lower-credit-quality instruments performed slightly better than their higher-credit-quality counterparts, while floating rate securities performed better still.
In the face of today’s uncertain market environment, New York Life Investments remains dedicated to providing the guidance, resources and investment solutions you need to pursue your financial goals.
Thank you for trusting us to help meet your investment needs.
Sincerely,
Kirk C. Lehneis
President
The opinions expressed are as of the date of this report and are subject to change. There is no guarantee that any forecast made will come to pass. This material does not constitute investment advice and is not intended as an endorsement of any specific investment. Past performance is no guarantee of future results.
Not part of the Annual Report
Investors should refer to the Fund’s Summary Prospectus and/or Prospectus and consider the Fund’s investment objectives, strategies, risks, charges and expenses carefully before investing. The Summary Prospectus and/or Prospectus contain this and other information about the Fund. You may obtain copies of the Fund’s Summary Prospectus, Prospectus and Statement of Additional Information, which includes information about the MainStay Funds Trust's Trustees, free of charge, upon request, by calling toll-free 800-624-6782, by writing to NYLIFE Distributors LLC, Attn: MainStay Marketing Department, 30 Hudson Street, Jersey City, NJ 07302 or by sending an e-mail to MainStayShareholderServices@nylim.com. These documents are also available via the MainStay Funds’ website at newyorklifeinvestments.com. Please read the Fund’s Summary Prospectus and/or Prospectus carefully before investing.
Investment and Performance Comparison (Unaudited)
Performance data quoted represents past performance. Past performance is no guarantee of future results. Because of market volatility and other factors, current performance may be lower or higher than the figures shown. Investment return and principal value will fluctuate, and as a result, when shares are redeemed, they may be worth more or less than their original cost. The graph below depicts the historical performance of Class I shares of the Fund. Performance will vary from class to class based on differences in class-specific expenses and sales charges. For performance information current to the most recent month-end, please call 800-624-6782 or visit newyorklifeinvestments.com.
The performance table and graph do not reflect the deduction of taxes that a shareholder would pay on distributions or Fund share redemptions. Total returns reflect maximum applicable sales charges as indicated in the table below, if any, changes in share price, and reinvestment of dividend and capital gain distributions. The graph assumes the initial investment amount shown below and reflects the deduction of all sales charges that would have applied for the period of investment. Performance figures may reflect certain fee waivers and/or expense limitations, without which total returns may have been lower. For more information on share classes and current fee waivers and/or expense limitations (if any), please refer to the Notes to Financial Statements.
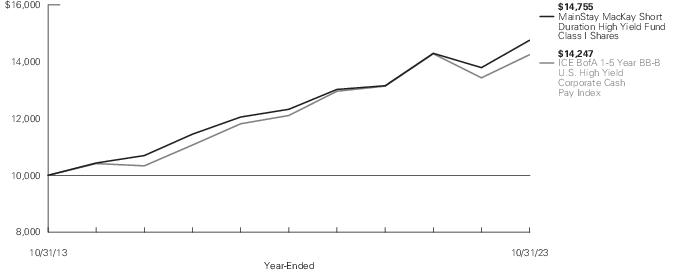
| Average Annual Total Returns for the Year-Ended October 31, 2023 |
| Class | Sales Charge | | Inception
Date | One
Year | Five
Years | Ten Years
or Since
Inception | Gross
Expense
Ratio1 |
| Class A Shares | Maximum 3.00% Initial Sales Charge | With sales charges | 12/17/2012 | 3.52% | 2.78% | 3.39% | 1.02% |
| | | Excluding sales charges | | 6.72 | 3.41 | 3.71 | 1.02 |
| Investor Class Shares2 | Maximum 2.50% Initial Sales Charge | With sales charges | 12/17/2012 | 3.96 | 2.69 | 3.30 | 1.10 |
| | | Excluding sales charges | | 6.63 | 3.32 | 3.62 | 1.10 |
| Class C Shares | Maximum 1.00% CDSC | With sales charges | 12/17/2012 | 4.84 | 2.55 | 2.85 | 1.85 |
| | if Redeemed Within 18 months of Purchase | Excluding sales charges | | 5.84 | 2.55 | 2.85 | 1.85 |
| Class I Shares | No Sales Charge | | 12/17/2012 | 6.98 | 3.66 | 3.97 | 0.77 |
| Class R2 Shares3 | No Sales Charge | | 12/17/2012 | 6.50 | 3.28 | 3.60 | 1.12 |
| Class R3 Shares3 | No Sales Charge | | 2/29/2016 | 6.35 | 3.05 | 4.17 | 1.37 |
| 1. | The gross expense ratios presented reflect the Fund’s “Total Annual Fund Operating Expenses” from the most recent Prospectus, as supplemented, and may differ from other expense ratios disclosed in this report. |
| 2. | Prior to June 30, 2020, the maximum initial sales charge was 3.00%, which is reflected in the applicable average annual total return figures shown. |
| 3. | As of October 31, 2023, Class R2 and Class R3 shares are closed to new investors and, upon the close of business on December 29, 2023, Class R2 and Class R3 shares are closed to additional investments by existing shareholders. Additionally, Class R2 and Class R3 shares will be liquidated on or about February 28, 2024 (the "Liquidation Date"). It is expected that the Fund will distribute to remaining shareholders invested in Class R2 or Class R3 shares, on or promptly after the Liquidation Date, a liquidating distribution in cash or cash equivalents equal to the net asset value of such shares. |
The footnotes on the next page are an integral part of the table and graph and should be carefully read in conjunction with them.
| Benchmark Performance* | One
Year | Five
Years | Ten
Years |
| ICE BofA 1-5 Year BB-B U.S. High Yield Corporate Cash Pay Index1 | 6.06% | 3.31% | 3.60% |
| Morningstar High Yield Bond Category Average2 | 5.72 | 2.58 | 3.03 |
| * | Returns for indices reflect no deductions for fees, expenses or taxes, except for foreign withholding taxes where applicable. Results assume reinvestment of all dividends and capital gains. An investment cannot be made directly in an index. |
| 1. | ICE BofA 1-5 Year BB-B U.S. High Yield Corporate Cash Pay Index is the Fund's primary broad-based securities market index for comparison purposes. The ICE BofA 1-5 Year BB-B U.S. High Yield Corporate Cash Pay Index generally tracks the performance of BB-B rated U.S. dollar-denominated corporate bonds publicly issued in the U.S. domestic market with maturities of 1 to 5 years. |
| 2. | The Morningstar High Yield Bond Category Average is representative of funds that concentrate on lower-quality bonds, which are riskier than those of higher-quality companies. These funds primarily invest in U.S. high-income debt securities where at least 65% or more of bond assets are not rated or are rated by a major agency such as Standard & Poor’s or Moody’s at the level of BB and below. Results are based on average total returns of similar funds with all dividends and capital gain distributions reinvested. |
The footnotes on the preceding page are an integral part of the table and graph and should be carefully read in conjunction with them.
| 6 | MainStay MacKay Short Duration High Yield Fund |
Cost in Dollars of a $1,000 Investment in MainStay MacKay Short Duration High Yield Fund (Unaudited)
The example below is intended to describe the fees and expenses borne by shareholders during the six-month period from May 1, 2023 to October 31, 2023, and the impact of those costs on your investment.
Example
As a shareholder of the Fund you incur two types of costs: (1) transaction costs, including exchange fees and sales charges (loads) on purchases (as applicable), and (2) ongoing costs, including management fees, distribution and/or service (12b-1) fees and other Fund expenses (as applicable). This example is intended to help you understand your ongoing costs (in dollars) of investing in the Fund and to compare these costs with the ongoing costs of investing in other mutual funds. The example is based on an investment of $1,000 made at the beginning of the six-month period and held for the entire period from May 1, 2023 to October 31, 2023.
This example illustrates your Fund’s ongoing costs in two ways:
Actual Expenses
The second and third data columns in the table below provide information about actual account values and actual expenses. You may use the information in these columns, together with the amount you invested, to estimate the expenses that you paid during the six months ended October 31, 2023. Simply divide your account value by $1,000 (for example, an
$8,600 account value divided by $1,000 = 8.6), then multiply the result by the number under the heading entitled “Expenses Paid During Period” to estimate the expenses you paid on your account during this period.
Hypothetical Example for Comparison Purposes
The fourth and fifth data columns in the table below provide information about hypothetical account values and hypothetical expenses based on the Fund’s actual expense ratio and an assumed rate of return of 5% per year before expenses, which is not the Fund’s actual return. The hypothetical account values and expenses may not be used to estimate the actual ending account balances or expenses you paid for the six-month period shown. You may use this information to compare the ongoing costs of investing in the Fund with the ongoing costs of investing in other mutual funds. To do so, compare this 5% hypothetical example with the 5% hypothetical examples that appear in the shareholder reports of the other mutual funds.
Please note that the expenses shown in the table are meant to highlight your ongoing costs only and do not reflect any transactional costs, such as exchange fees or sales charges (loads). Therefore, the fourth and fifth data columns of the table are useful in comparing ongoing costs only and will not help you determine the relative total costs of owning different funds. In addition, if these transactional costs were included, your costs would have been higher.
| Share Class | Beginning
Account
Value
5/1/23 | Ending Account
Value (Based
on Actual
Returns and
Expenses)
10/31/23 | Expenses
Paid
During
Period1 | Ending Account
Value (Based
on Hypothetical
5% Annualized
Return and
Actual Expenses)
10/31/23 | Expenses
Paid
During
Period1 | Net Expense
Ratio
During
Period2 |
| Class A Shares | $1,000.00 | $1,016.10 | $5.18 | $1,020.06 | $5.19 | 1.02% |
| Investor Class Shares | $1,000.00 | $1,015.70 | $5.64 | $1,019.61 | $5.65 | 1.11% |
| Class C Shares | $1,000.00 | $1,011.90 | $9.43 | $1,015.83 | $9.45 | 1.86% |
| Class I Shares | $1,000.00 | $1,017.30 | $3.97 | $1,021.27 | $3.97 | 0.78% |
| Class R2 Shares | $1,000.00 | $1,014.60 | $5.74 | $1,019.51 | $5.75 | 1.13% |
| Class R3 Shares | $1,000.00 | $1,014.20 | $7.01 | $1,018.25 | $7.02 | 1.38% |
| 1. | Expenses are equal to the Fund’s annualized expense ratio of each class multiplied by the average account value over the period, divided by 365 and multiplied by 184 (to reflect the six-month period). The table above represents the actual expenses incurred during the six-month period. In addition to the fees and expenses which the Fund bears directly, it also indirectly bears a pro rata share of the fees and expenses of the underlying funds in which it invests. Such indirect expenses are not included in the above-reported expense figures. |
| 2. | Expenses are equal to the Fund's annualized expense ratio to reflect the six-month period. |
Portfolio Composition as of October 31, 2023 (Unaudited)
See Portfolio of Investments beginning on page 10 for specific holdings within these categories. The Fund's holdings are subject to change.
Top Ten Holdings and/or Issuers Held as of October 31, 2023 (excluding short-term investments) (Unaudited)
| 1. | HCA, Inc., 5.375%-8.36%, due 12/15/23–2/15/26 |
| 2. | TransDigm, Inc., 5.50%-7.50%, due 3/15/26–8/15/28 |
| 3. | VICI Properties LP, 3.50%-5.625%, due 5/1/24–6/15/25 |
| 4. | Ford Motor Credit Co. LLC, 2.30%-7.35%, due 11/17/23–5/12/28 |
| 5. | T-Mobile USA, Inc., 2.25%-5.375%, due 2/15/26–2/1/28 |
| 6. | CCO Holdings LLC, 5.00%-5.50%, due 5/1/26–2/1/28 |
| 7. | IHO Verwaltungs GmbH, 4.75%-6.00%, due 9/15/26–5/15/27 |
| 8. | Great Outdoors Group LLC, 9.402%, due 3/6/28 |
| 9. | Churchill Downs, Inc., 4.75%-5.50%, due 4/1/27–1/15/28 |
| 10. | Carnival Corp., 4.00%-7.625%, due 3/1/26–8/1/28 |
| 8 | MainStay MacKay Short Duration High Yield Fund |
Portfolio Management Discussion and Analysis (Unaudited)
Questions answered by portfolio manager Andrew Susser of MacKay Shields LLC, the Fund’s Subadvisor.
How did MainStay MacKay Short Duration High Yield Fund perform relative to its benchmark and peer group during the 12 months ended October 31, 2023?
For the 12 months ended October 31, 2023, Class I shares of MainStay MacKay Short Duration High Yield Fund returned 6.98%, outperforming the 6.06% return of the Fund’s benchmark, the ICE BofA 1–5 Year BB-B U.S. High Yield Corporate Cash Pay Index (the "Index"). Over the same period, Class I shares also outperformed the 5.72% return of the Morningstar High Yield Bond Category Average.1
What factors affected the Fund’s relative performance during the reporting period?
The high-yield market finished 2022 on a strong note, up over 3.7% during the fourth quarter of 2022. The market’s positive sentiment continued into the new year, and by the end of the first quarter of 2023, the market was up an additional 3.7%. Although the market’s recovery was stalled by concerns over a banking crisis in early March, and sentiment was mixed heading into the second quarter of 2023, quick reaction to the banking crisis by regulators tempered the market’s jitters. Shortly thereafter, the debt ceiling impasse in Congress again elevated market volatility; however, the crisis was pushed down the road with a short-term fix approved by legislators on June 8th. The third quarter closed with mixed results, due in large part to a significant increase in Treasury yields. For the reporting period, high-yield instruments generally provided solid rates of return. Although CCC-rated2 bonds sold off at the end of the reporting period, they were the best performers by far, approximately doubling the return of the overall market.
During the reporting period, were there any market events that materially impacted the Fund’s performance or liquidity?
There were no market events that impacted the Funds liquidity during the reporting period. Performance for the market overall was driven primarily by the move in Treasury yields.
What was the Fund’s duration3 strategy during the reporting period?
The Fund’s duration is the result of our bottom-up fundamental analysis and is a residual of the investment process. However, the Fund did maintain a lower duration than the Index throughout the reporting period. As of the end of the reporting period, the Fund’s modified duration to worst4 was 2.67 years, while the modified duration to worst of the Index was 2.83 years.
During the reporting period, which sectors were the strongest positive contributors to the Fund’s relative performance and which sectors were particularly weak?
Security selection in, and overweight exposure to, the energy sector made the strongest contributions to the Fund’s performance relative to the Index. (Contributions take weightings and total returns into account.) Within energy, positions in exploration & production and gas distribution performed notably well. Overweight exposure to, and selection in, basic industry also contributed positively, as did selection in automotive and capital goods.
Selection in leisure was the Fund’s most significant detractor during the reporting period. Selection within financial services and real estate also detracted. Although selection within CCC-rated credits was strong, underweight exposure detracted from returns, as CCC’s were the best performers during the reporting period.
What were some of the Fund’s largest purchases and sales during the reporting period?
During the reporting period, the Fund initiated positions in offshore oil & gas driller Transocean, auto parts manufacturer Tenneco and auto dealer Asbury Automotive. During the same period, we closed out the Fund’s positions in food service provider Aramark Services, minerals producer Compass Minerals and energy company EQT. EQT was upgraded to investment grade during the reporting period.
How did the Fund’s sector weightings change during the reporting period?
There were no material changes to the Fund’s sector weightings during the reporting period. On the margin, we slightly increased the Fund’s exposure to the automotive, health care and capital goods sectors, while slightly trimming exposure to the telecom, energy and services sectors.
How was the Fund positioned at the end of the reporting period?
As of October 31, 2023, relative to the Index, the Fund held overweight exposure to the health care, energy and materials sectors, and underweight exposure to the media, services and capital goods sectors.
| 1. | See "Investment and Performance Comparison" for other share class returns, which may be higher or lower than Class I share returns, and for more information on benchmark and peer group returns. |
| 2. | An obligation rated ‘CCC’ by Standard & Poor’s (“S&P”) is deemed by S&P to be currently vulnerable to nonpayment and is dependent upon favorable business, financial and economic conditions for the obligor to meet its financial commitment on the obligation. It is the opinion of S&P that in the event of adverse business, financial or economic conditions, the obligor is not likely to have the capacity to meet its financial commitment on the obligation. When applied to Fund holdings, ratings are based solely on the creditworthiness of the bonds in the portfolio and are not meant to represent the security or safety of the Fund. |
| 3. | Duration is a measure of the price sensitivity of a fixed-income investment to changes in interest rates. Duration is expressed as a number of years and is considered a more accurate sensitivity gauge than average maturity. |
| 4. | Modified duration is inversely related to the approximate percentage change in price for a given change in yield. Duration to worst is the duration of a bond computed using the bond’s nearest call date or maturity. This measure ignores future cash flow fluctuations due to embedded optionality. |
The opinions expressed are those of the portfolio manager as of the date of this report and are subject to change. There is no guarantee that any forecasts will come to pass. This material does not constitute investment advice and is not intended as an endorsement of any specific investment.
Portfolio of Investments October 31, 2023†^
| | Principal
Amount | Value |
| Long-Term Bonds 94.8% |
| Convertible Bonds 1.7% |
| Energy-Alternate Sources 0.3% |
| NextEra Energy Partners LP | | |
| 2.50%, due 6/15/26 (a) | $ 5,000,000 | $ 4,335,000 |
| Investment Companies 0.1% |
| Ares Capital Corp. | | |
| 4.625%, due 3/1/24 | 1,500,000 | 1,507,500 |
| Media 1.2% |
| Cable One, Inc. | | |
| (zero coupon), due 3/15/26 | 4,125,000 | 3,384,562 |
| DISH Network Corp. | | |
| 2.375%, due 3/15/24 | 19,650,000 | 18,864,000 |
| | | 22,248,562 |
| Oil & Gas 0.1% |
| Gulfport Energy Operating Corp. | | |
| 10.00% (10.00% Cash or 15.00% PIK), due 12/29/49 (b)(c) | 269,000 | 2,347,913 |
Total Convertible Bonds
(Cost $28,942,872) | | 30,438,975 |
| Corporate Bonds 75.9% |
| Advertising 0.6% |
| Lamar Media Corp. | | |
| 3.75%, due 2/15/28 | 5,500,000 | 4,871,471 |
| 4.875%, due 1/15/29 | 3,000,000 | 2,750,580 |
| Outfront Media Capital LLC | | |
| 6.25%, due 6/15/25 (a) | 4,000,000 | 3,944,880 |
| | | 11,566,931 |
| Aerospace & Defense 2.2% |
| F-Brasile SpA | | |
| Series XR | | |
| 7.375%, due 8/15/26 (a) | 3,400,000 | 3,158,620 |
| TransDigm, Inc. | | |
| 5.50%, due 11/15/27 | 6,790,000 | 6,321,181 |
| 6.25%, due 3/15/26 (a) | 12,685,000 | 12,386,390 |
| 6.75%, due 8/15/28 (a) | 9,960,000 | 9,670,994 |
| 7.50%, due 3/15/27 | 10,000,000 | 9,987,759 |
| | | 41,524,944 |
| Airlines 0.6% |
| American Airlines, Inc. | | |
| 5.50%, due 4/20/26 (a) | 1,250,000 | 1,215,561 |
| | Principal
Amount | Value |
| |
| Airlines (continued) |
| Delta Air Lines, Inc. | | |
| 4.50%, due 10/20/25 (a) | $ 1,334,000 | $ 1,296,616 |
| 7.00%, due 5/1/25 (a) | 4,375,000 | 4,393,660 |
| 7.375%, due 1/15/26 | 1,500,000 | 1,514,925 |
| Mileage Plus Holdings LLC | | |
| 6.50%, due 6/20/27 (a) | 1,462,500 | 1,444,771 |
| Spirit Loyalty Cayman Ltd. | | |
| 8.00%, due 9/20/25 (a) | 2,000,000 | 1,475,000 |
| | | 11,340,533 |
| Auto Manufacturers 2.6% |
| Ford Motor Credit Co. LLC | | |
| 2.30%, due 2/10/25 | 5,000,000 | 4,721,548 |
| 3.37%, due 11/17/23 | 6,000,000 | 5,991,926 |
| 3.375%, due 11/13/25 | 1,000,000 | 933,203 |
| 3.664%, due 9/8/24 | 1,150,000 | 1,119,425 |
| 4.134%, due 8/4/25 | 1,000,000 | 953,136 |
| 4.389%, due 1/8/26 | 3,000,000 | 2,843,706 |
| 5.125%, due 6/16/25 | 2,000,000 | 1,946,027 |
| 5.584%, due 3/18/24 | 840,000 | 836,155 |
| 6.80%, due 5/12/28 | 2,010,000 | 2,004,256 |
| 6.95%, due 3/6/26 | 5,000,000 | 5,008,631 |
| 6.95%, due 6/10/26 | 1,500,000 | 1,503,750 |
| 7.35%, due 11/4/27 | 2,000,000 | 2,024,346 |
| JB Poindexter & Co., Inc. | | |
| 7.125%, due 4/15/26 (a) | 17,031,000 | 16,239,252 |
| PM General Purchaser LLC | | |
| 9.50%, due 10/1/28 (a) | 1,930,000 | 1,814,200 |
| | | 47,939,561 |
| Auto Parts & Equipment 2.4% |
| Adient Global Holdings Ltd. (a) | | |
| 4.875%, due 8/15/26 | 4,000,000 | 3,725,262 |
| 7.00%, due 4/15/28 | 650,000 | 639,795 |
| IHO Verwaltungs GmbH (a)(c) | | |
| 4.75% (4.75% Cash or 5.50% PIK), due 9/15/26 | 10,660,000 | 9,906,658 |
| 6.00% (6.00% Cash or 6.75% PIK), due 5/15/27 | 19,680,000 | 18,312,437 |
| Tenneco, Inc. | | |
| 8.00%, due 11/17/28 (a) | 4,750,000 | 3,811,875 |
| ZF North America Capital, Inc. | | |
| 6.875%, due 4/14/28 (a) | 8,350,000 | 8,091,551 |
| | | 44,487,578 |
| Building Materials 0.5% |
| James Hardie International Finance DAC | | |
| 5.00%, due 1/15/28 (a) | 3,750,000 | 3,461,256 |
The notes to the financial statements are an integral part of, and should be read in conjunction with, the financial statements.
| 10 | MainStay MacKay Short Duration High Yield Fund |
| | Principal
Amount | Value |
| Corporate Bonds (continued) |
| Building Materials (continued) |
| Summit Materials LLC (a) | | |
| 5.25%, due 1/15/29 | $ 1,000,000 | $ 905,470 |
| 6.50%, due 3/15/27 | 5,705,000 | 5,548,098 |
| | | 9,914,824 |
| Chemicals 2.3% |
| ASP Unifrax Holdings, Inc. | | |
| 5.25%, due 9/30/28 (a) | 2,400,000 | 1,621,073 |
| Avient Corp. | | |
| 5.75%, due 5/15/25 (a) | 8,600,000 | 8,427,109 |
| GPD Cos., Inc. | | |
| 10.125%, due 4/1/26 (a) | 8,900,000 | 8,015,632 |
| NOVA Chemicals Corp. (a) | | |
| 4.875%, due 6/1/24 | 3,150,000 | 3,095,580 |
| 5.25%, due 6/1/27 | 6,125,000 | 5,173,571 |
| Olympus Water US Holding Corp. (a) | | |
| 7.125%, due 10/1/27 | 2,356,000 | 2,169,211 |
| 9.75%, due 11/15/28 | 6,800,000 | 6,641,567 |
| SCIH Salt Holdings, Inc. | | |
| 4.875%, due 5/1/28 (a) | 1,500,000 | 1,295,066 |
| SCIL IV LLC | | |
| 5.375%, due 11/1/26 (a) | 6,500,000 | 5,765,669 |
| | | 42,204,478 |
| Coal 0.1% |
| Coronado Finance Pty. Ltd. | | |
| 10.75%, due 5/15/26 (a) | 2,486,000 | 2,569,449 |
| Commercial Services 2.0% |
| Alta Equipment Group, Inc. | | |
| 5.625%, due 4/15/26 (a) | 5,000,000 | 4,472,820 |
| Gartner, Inc. | | |
| 4.50%, due 7/1/28 (a) | 5,500,000 | 4,948,451 |
| Graham Holdings Co. | | |
| 5.75%, due 6/1/26 (a) | 9,400,000 | 9,047,500 |
| Herc Holdings, Inc. | | |
| 5.50%, due 7/15/27 (a) | 2,000,000 | 1,879,962 |
| Korn Ferry | | |
| 4.625%, due 12/15/27 (a) | 1,750,000 | 1,591,746 |
| Service Corp. International | | |
| 7.50%, due 4/1/27 | 3,150,000 | 3,167,738 |
| United Rentals North America, Inc. | | |
| 3.875%, due 11/15/27 | 875,000 | 803,152 |
| 4.875%, due 1/15/28 | 1,450,000 | 1,345,277 |
| | Principal
Amount | Value |
| |
| Commercial Services (continued) |
| Williams Scotsman, Inc. (a) | | |
| 4.625%, due 8/15/28 | $ 1,500,000 | $ 1,332,563 |
| 6.125%, due 6/15/25 | 8,219,000 | 8,075,582 |
| | | 36,664,791 |
| Cosmetics & Personal Care 0.5% |
| Edgewell Personal Care Co. | | |
| 5.50%, due 6/1/28 (a) | 10,810,000 | 9,865,909 |
| Distribution & Wholesale 0.4% |
| G-III Apparel Group Ltd. | | |
| 7.875%, due 8/15/25 (a) | 4,765,000 | 4,721,412 |
| Ritchie Bros Holdings, Inc. | | |
| 6.75%, due 3/15/28 (a) | 2,500,000 | 2,449,945 |
| | | 7,171,357 |
| Diversified Financial Services 1.5% |
| AG TTMT Escrow Issuer LLC | | |
| 8.625%, due 9/30/27 (a) | 7,950,000 | 7,986,053 |
| Credit Acceptance Corp. | | |
| 5.125%, due 12/31/24 (a) | 6,555,000 | 6,337,409 |
| Enact Holdings, Inc. | | |
| 6.50%, due 8/15/25 (a) | 7,200,000 | 7,072,273 |
| Jefferies Finance LLC | | |
| 5.00%, due 8/15/28 (a) | 2,110,000 | 1,683,962 |
| LPL Holdings, Inc. | | |
| 4.625%, due 11/15/27 (a) | 1,350,000 | 1,234,504 |
| StoneX Group, Inc. | | |
| 8.625%, due 6/15/25 (a) | 3,500,000 | 3,508,750 |
| | | 27,822,951 |
| Electric 1.4% |
| Clearway Energy Operating LLC | | |
| 4.75%, due 3/15/28 (a) | 6,000,000 | 5,355,888 |
| DPL, Inc. | | |
| 4.125%, due 7/1/25 | 3,650,000 | 3,434,823 |
| NextEra Energy Operating Partners LP (a) | | |
| 3.875%, due 10/15/26 | 3,500,000 | 3,182,267 |
| 4.25%, due 7/15/24 | 4,030,000 | 3,952,488 |
| 4.50%, due 9/15/27 | 4,200,000 | 3,760,658 |
| NRG Energy, Inc. | | |
| 6.625%, due 1/15/27 | 1,500,000 | 1,455,801 |
| PG&E Corp. | | |
| 5.00%, due 7/1/28 | 1,000,000 | 905,946 |
The notes to the financial statements are an integral part of, and should be read in conjunction with, the financial statements.
11
Portfolio of Investments October 31, 2023†^ (continued)
| | Principal
Amount | Value |
| Corporate Bonds (continued) |
| Electric (continued) |
| Vistra Corp. | | |
| 8.00% (5 Year Treasury Constant Maturity Rate + 6.93%), due 10/15/26 (a)(d)(e) | $ 4,100,000 | $ 3,895,000 |
| | | 25,942,871 |
| Electrical Components & Equipment 0.4% |
| EnerSys | | |
| 4.375%, due 12/15/27 (a) | 750,000 | 664,172 |
| WESCO Distribution, Inc. | | |
| 7.125%, due 6/15/25 (a) | 7,650,000 | 7,645,556 |
| | | 8,309,728 |
| Entertainment 4.0% |
| Affinity Interactive | | |
| 6.875%, due 12/15/27 (a) | 1,350,000 | 1,100,366 |
| Churchill Downs, Inc. (a) | | |
| 4.75%, due 1/15/28 | 6,395,000 | 5,726,883 |
| 5.50%, due 4/1/27 | 21,375,000 | 20,048,635 |
| International Game Technology plc (a) | | |
| 4.125%, due 4/15/26 | 9,950,000 | 9,362,850 |
| 6.25%, due 1/15/27 | 1,630,000 | 1,588,609 |
| 6.50%, due 2/15/25 | 963,000 | 956,570 |
| Jacobs Entertainment, Inc. | | |
| 6.75%, due 2/15/29 (a) | 1,365,000 | 1,160,250 |
| Light & Wonder International, Inc. | | |
| 7.00%, due 5/15/28 (a) | 6,010,000 | 5,858,478 |
| Live Nation Entertainment, Inc. (a) | | |
| 4.75%, due 10/15/27 | 4,150,000 | 3,792,312 |
| 6.50%, due 5/15/27 | 12,650,000 | 12,341,794 |
| Merlin Entertainments Ltd. | | |
| 5.75%, due 6/15/26 (a) | 1,500,000 | 1,402,948 |
| Vail Resorts, Inc. | | |
| 6.25%, due 5/15/25 (a) | 10,582,000 | 10,516,709 |
| | | 73,856,404 |
| Food 0.6% |
| B&G Foods, Inc. | | |
| 5.25%, due 4/1/25 | 1,754,000 | 1,683,602 |
| 8.00%, due 9/15/28 (a) | 2,325,000 | 2,265,693 |
| Land O'Lakes Capital Trust I | | |
| 7.45%, due 3/15/28 (a) | 2,605,000 | 2,396,600 |
| Simmons Foods, Inc. | | |
| 4.625%, due 3/1/29 (a) | 1,895,000 | 1,539,346 |
| United Natural Foods, Inc. | | |
| 6.75%, due 10/15/28 (a) | 5,000,000 | 3,934,400 |
| | | 11,819,641 |
| | Principal
Amount | Value |
| |
| Forest Products & Paper 0.8% |
| Mercer International, Inc. | | |
| 5.50%, due 1/15/26 | $ 8,000,000 | $ 7,440,000 |
| 12.875%, due 10/1/28 (a) | 6,325,000 | 6,387,586 |
| Smurfit Kappa Treasury Funding DAC | | |
| 7.50%, due 11/20/25 | 1,000,000 | 1,017,453 |
| | | 14,845,039 |
| Hand & Machine Tools 0.5% |
| Regal Rexnord Corp. (a) | | |
| 6.05%, due 2/15/26 | 2,875,000 | 2,827,864 |
| 6.05%, due 4/15/28 | 3,720,000 | 3,558,526 |
| Werner FinCo. LP | | |
| 11.50%, due 6/15/28 (a) | 3,000,000 | 3,029,190 |
| | | 9,415,580 |
| Healthcare-Products 1.0% |
| Bausch & Lomb Escrow Corp. | | |
| 8.375%, due 10/1/28 (a) | 6,720,000 | 6,674,640 |
| Hologic, Inc. | | |
| 4.625%, due 2/1/28 (a) | 5,800,000 | 5,274,531 |
| Teleflex, Inc. | | |
| 4.25%, due 6/1/28 (a) | 2,000,000 | 1,765,002 |
| 4.625%, due 11/15/27 | 1,000,000 | 915,000 |
| Varex Imaging Corp. | | |
| 7.875%, due 10/15/27 (a) | 4,700,000 | 4,606,654 |
| | | 19,235,827 |
| Healthcare-Services 3.8% |
| Acadia Healthcare Co., Inc. | | |
| 5.50%, due 7/1/28 (a) | 4,630,000 | 4,274,376 |
| Catalent Pharma Solutions, Inc. | | |
| 5.00%, due 7/15/27 (a) | 5,216,000 | 4,654,498 |
| Encompass Health Corp. | | |
| 4.50%, due 2/1/28 | 5,600,000 | 5,048,568 |
| 5.75%, due 9/15/25 | 4,335,000 | 4,214,092 |
| HCA, Inc. | | |
| 5.375%, due 2/1/25 | 13,100,000 | 12,960,995 |
| 5.875%, due 2/15/26 | 2,000,000 | 1,982,403 |
| 7.50%, due 12/15/23 | 10,000,000 | 10,015,472 |
| 7.58%, due 9/15/25 | 5,623,000 | 5,750,715 |
| 8.36%, due 4/15/24 | 10,000,000 | 10,077,959 |
| IQVIA, Inc. (a) | | |
| 5.00%, due 10/15/26 | 5,515,000 | 5,257,545 |
| 5.70%, due 5/15/28 | 3,000,000 | 2,880,000 |
| ModivCare, Inc. | | |
| 5.875%, due 11/15/25 (a) | 4,000,000 | 3,780,000 |
| | | 70,896,623 |
The notes to the financial statements are an integral part of, and should be read in conjunction with, the financial statements.
| 12 | MainStay MacKay Short Duration High Yield Fund |
| | Principal
Amount | Value |
| Corporate Bonds (continued) |
| Holding Companies-Diversified 1.3% |
| Benteler International AG | | |
| 10.50%, due 5/15/28 (a) | $ 10,540,000 | $ 10,616,243 |
| Stena International SA | | |
| 6.125%, due 2/1/25 (a) | 13,250,000 | 12,985,000 |
| | | 23,601,243 |
| Home Builders 1.1% |
| Adams Homes, Inc. | | |
| 7.50%, due 2/15/25 (a) | 2,234,000 | 2,186,504 |
| Century Communities, Inc. | | |
| 6.75%, due 6/1/27 | 5,000,000 | 4,826,789 |
| Installed Building Products, Inc. | | |
| 5.75%, due 2/1/28 (a) | 4,000,000 | 3,608,757 |
| Meritage Homes Corp. | | |
| 5.125%, due 6/6/27 | 1,500,000 | 1,417,500 |
| 6.00%, due 6/1/25 | 624,000 | 611,820 |
| STL Holding Co. LLC | | |
| 7.50%, due 2/15/26 (a) | 1,645,000 | 1,538,075 |
| Winnebago Industries, Inc. | | |
| 6.25%, due 7/15/28 (a) | 6,475,000 | 6,088,637 |
| | | 20,278,082 |
| Household Products & Wares 0.3% |
| Central Garden & Pet Co. | | |
| 5.125%, due 2/1/28 | 6,500,000 | 6,001,958 |
| Housewares 0.2% |
| Newell Brands, Inc. | | |
| 4.875%, due 6/1/25 | 1,750,000 | 1,679,252 |
| Scotts Miracle-Gro Co. (The) | | |
| 5.25%, due 12/15/26 | 1,650,000 | 1,530,375 |
| | | 3,209,627 |
| Insurance 0.5% |
| MGIC Investment Corp. | | |
| 5.25%, due 8/15/28 | 2,000,000 | 1,838,351 |
| NMI Holdings, Inc. | | |
| 7.375%, due 6/1/25 (a) | 6,485,000 | 6,491,708 |
| | | 8,330,059 |
| Internet 1.8% |
| Cars.com, Inc. | | |
| 6.375%, due 11/1/28 (a) | 3,500,000 | 3,115,000 |
| Gen Digital, Inc. (a) | | |
| 5.00%, due 4/15/25 | 7,175,000 | 6,946,404 |
| 6.75%, due 9/30/27 | 2,000,000 | 1,946,782 |
| | Principal
Amount | Value |
| |
| Internet (continued) |
| Go Daddy Operating Co. LLC | | |
| 5.25%, due 12/1/27 (a) | $ 4,500,000 | $ 4,217,095 |
| Match Group Holdings II LLC | | |
| 5.00%, due 12/15/27 (a) | 1,500,000 | 1,383,502 |
| Netflix, Inc. | | |
| 5.75%, due 3/1/24 | 4,980,000 | 4,970,040 |
| 5.875%, due 2/15/25 | 665,000 | 664,895 |
| Uber Technologies, Inc. (a) | | |
| 6.25%, due 1/15/28 | 665,000 | 640,063 |
| 7.50%, due 5/15/25 | 6,345,000 | 6,352,875 |
| 7.50%, due 9/15/27 | 3,500,000 | 3,508,792 |
| | | 33,745,448 |
| Investment Companies 0.6% |
| Icahn Enterprises LP | | |
| 4.75%, due 9/15/24 | 12,500,000 | 11,988,698 |
| Iron & Steel 1.5% |
| Allegheny Ludlum LLC | | |
| 6.95%, due 12/15/25 | 2,430,000 | 2,417,789 |
| Big River Steel LLC | | |
| 6.625%, due 1/31/29 (a) | 8,260,000 | 8,159,063 |
| Mineral Resources Ltd. (a) | | |
| 8.00%, due 11/1/27 | 2,300,000 | 2,222,467 |
| 8.125%, due 5/1/27 | 11,400,000 | 11,090,497 |
| 9.25%, due 10/1/28 | 4,740,000 | 4,740,000 |
| | | 28,629,816 |
| Leisure Time 2.4% |
| Carnival Corp. (a) | | |
| 4.00%, due 8/1/28 | 5,600,000 | 4,870,991 |
| 5.75%, due 3/1/27 | 10,560,000 | 9,428,622 |
| 7.625%, due 3/1/26 | 9,660,000 | 9,393,313 |
| Carnival Holdings Bermuda Ltd. | | |
| 10.375%, due 5/1/28 (a) | 14,310,000 | 15,257,525 |
| Lindblad Expeditions LLC | | |
| 6.75%, due 2/15/27 (a) | 975,000 | 888,547 |
| Royal Caribbean Cruises Ltd. | | |
| 9.25%, due 1/15/29 (a) | 4,125,000 | 4,305,836 |
| | | 44,144,834 |
| Lodging 1.6% |
| Boyd Gaming Corp. | | |
| 4.75%, due 12/1/27 | 13,350,000 | 12,148,435 |
| Genting New York LLC | | |
| 3.30%, due 2/15/26 (a) | 1,000,000 | 892,390 |
| Hilton Domestic Operating Co., Inc. (a) | | |
| 5.375%, due 5/1/25 | 5,590,000 | 5,495,260 |
| 5.75%, due 5/1/28 | 2,000,000 | 1,916,170 |
The notes to the financial statements are an integral part of, and should be read in conjunction with, the financial statements.
13
Portfolio of Investments October 31, 2023†^ (continued)
| | Principal
Amount | Value |
| Corporate Bonds (continued) |
| Lodging (continued) |
| Hilton Worldwide Finance LLC | | |
| 4.875%, due 4/1/27 | $ 2,690,000 | $ 2,537,026 |
| Marriott International, Inc. | | |
| Series Z | | |
| 4.15%, due 12/1/23 | 1,500,000 | 1,497,780 |
| Series EE | | |
| 5.75%, due 5/1/25 | 932,000 | 929,102 |
| Station Casinos LLC | | |
| 4.50%, due 2/15/28 (a) | 5,000,000 | 4,318,130 |
| | | 29,734,293 |
| Machinery—Construction & Mining 0.2% |
| Vertiv Group Corp. | | |
| 4.125%, due 11/15/28 (a) | 4,025,000 | 3,517,869 |
| Machinery-Diversified 0.8% |
| Briggs & Stratton Corp. Escrow Claim Shares | | |
| 6.875%, due 12/15/20 (f)(g)(h) | 3,425,000 | — |
| Maxim Crane Works Holdings Capital LLC | | |
| 11.50%, due 9/1/28 (a) | 2,000,000 | 1,951,800 |
| TK Elevator U.S. Newco, Inc. | | |
| 5.25%, due 7/15/27 (a) | 14,163,000 | 12,894,664 |
| | | 14,846,464 |
| Media 3.8% |
| Block Communications, Inc. | | |
| 4.875%, due 3/1/28 (a) | 1,500,000 | 1,231,665 |
| CCO Holdings LLC (a) | | |
| 5.00%, due 2/1/28 | 16,645,000 | 14,946,165 |
| 5.125%, due 5/1/27 | 1,500,000 | 1,381,045 |
| 5.50%, due 5/1/26 | 13,485,000 | 12,860,065 |
| CSC Holdings LLC | | |
| 5.25%, due 6/1/24 | 9,250,000 | 8,648,963 |
| 11.25%, due 5/15/28 (a) | 4,020,000 | 3,834,335 |
| DIRECTV Financing LLC | | |
| 5.875%, due 8/15/27 (a) | 9,250,000 | 8,105,174 |
| LCPR Senior Secured Financing DAC | | |
| 6.75%, due 10/15/27 (a) | 13,025,000 | 11,787,625 |
| Scripps Escrow II, Inc. | | |
| 3.875%, due 1/15/29 (a) | 1,670,000 | 1,267,730 |
| Sterling Entertainment Enterprises LLC | | |
| 10.25%, due 1/15/25 (b)(f)(h) | 3,000,000 | 2,707,200 |
| | Principal
Amount | Value |
| |
| Media (continued) |
| Videotron Ltd. | | |
| 5.125%, due 4/15/27 (a) | $ 3,500,000 | $ 3,257,450 |
| | | 70,027,417 |
| Metal Fabricate & Hardware 0.1% |
| Advanced Drainage Systems, Inc. | | |
| 5.00%, due 9/30/27 (a) | 1,500,000 | 1,398,750 |
| Mining 1.0% |
| Century Aluminum Co. | | |
| 7.50%, due 4/1/28 (a) | 8,115,000 | 7,657,009 |
| First Quantum Minerals Ltd. (a) | | |
| 6.875%, due 10/15/27 | 2,500,000 | 2,129,314 |
| 7.50%, due 4/1/25 | 3,300,000 | 3,095,034 |
| IAMGOLD Corp. | | |
| 5.75%, due 10/15/28 (a) | 5,816,000 | 4,581,438 |
| Novelis Corp. | | |
| 3.25%, due 11/15/26 (a) | 1,500,000 | 1,335,213 |
| | | 18,798,008 |
| Miscellaneous—Manufacturing 1.9% |
| Amsted Industries, Inc. | | |
| 5.625%, due 7/1/27 (a) | 6,550,000 | 6,027,218 |
| Calderys Financing LLC | | |
| 11.25%, due 6/1/28 (a) | 2,500,000 | 2,521,875 |
| EnPro Industries, Inc. | | |
| 5.75%, due 10/15/26 | 7,000,000 | 6,631,012 |
| Gates Global LLC | | |
| 6.25%, due 1/15/26 (a) | 4,635,000 | 4,539,519 |
| Hillenbrand, Inc. | | |
| 5.00%, due 9/15/26 (i) | 6,080,000 | 5,831,085 |
| 5.75%, due 6/15/25 | 3,515,000 | 3,444,466 |
| LSB Industries, Inc. | | |
| 6.25%, due 10/15/28 (a) | 3,000,000 | 2,661,335 |
| Trinity Industries, Inc. | | |
| 7.75%, due 7/15/28 (a) | 2,825,000 | 2,789,688 |
| | | 34,446,198 |
| Oil & Gas 6.1% |
| Ascent Resources Utica Holdings LLC (a) | | |
| 7.00%, due 11/1/26 | 3,900,000 | 3,766,186 |
| 9.00%, due 11/1/27 | 1,556,000 | 1,964,450 |
| California Resources Corp. | | |
| 7.125%, due 2/1/26 (a) | 4,520,000 | 4,536,950 |
| Chevron USA, Inc. | | |
| 3.90%, due 11/15/24 | 4,550,000 | 4,470,485 |
| Chord Energy Corp. | | |
| 6.375%, due 6/1/26 (a) | 3,280,000 | 3,220,107 |
The notes to the financial statements are an integral part of, and should be read in conjunction with, the financial statements.
| 14 | MainStay MacKay Short Duration High Yield Fund |
| | Principal
Amount | Value |
| Corporate Bonds (continued) |
| Oil & Gas (continued) |
| Civitas Resources, Inc. | | |
| 5.00%, due 10/15/26 (a) | $ 1,500,000 | $ 1,403,499 |
| Encino Acquisition Partners Holdings LLC | | |
| 8.50%, due 5/1/28 (a) | 6,925,000 | 6,751,875 |
| Gulfport Energy Corp. | | |
| 8.00%, due 5/17/26 | 88,094 | 87,943 |
| 8.00%, due 5/17/26 (a) | 4,510,560 | 4,502,802 |
| Gulfport Energy Operating Corp. Escrow Claim Shares (f)(g) | | |
| 6.00%, due 10/15/24 | 2,245,000 | — |
| 6.625%, due 5/1/23 | 4,452,000 | — |
| Hess Corp. | | |
| 3.50%, due 7/15/24 | 910,000 | 893,442 |
| Matador Resources Co. | | |
| 5.875%, due 9/15/26 | 9,120,000 | 8,787,976 |
| Occidental Petroleum Corp. | | |
| 5.50%, due 12/1/25 | 2,000,000 | 1,973,962 |
| 5.55%, due 3/15/26 | 1,000,000 | 986,570 |
| 5.875%, due 9/1/25 | 3,160,000 | 3,149,035 |
| Parkland Corp. | | |
| 5.875%, due 7/15/27 (a) | 9,115,000 | 8,727,196 |
| PDC Energy, Inc. | | |
| 5.75%, due 5/15/26 | 2,775,000 | 2,763,206 |
| Permian Resources Operating LLC (a) | | |
| 5.375%, due 1/15/26 | 6,100,000 | 5,856,500 |
| 7.75%, due 2/15/26 | 3,000,000 | 2,997,308 |
| Range Resources Corp. | | |
| 4.875%, due 5/15/25 | 3,900,000 | 3,792,750 |
| Southwestern Energy Co. | | |
| 5.70%, due 1/23/25 (i) | 2,199,000 | 2,172,532 |
| Talos Production, Inc. | | |
| 12.00%, due 1/15/26 | 11,410,000 | 11,855,161 |
| Transocean Aquila Ltd. | | |
| 8.00%, due 9/30/28 (a) | 5,200,000 | 5,123,872 |
| Transocean Poseidon Ltd. | | |
| 6.875%, due 2/1/27 (a) | 6,000,000 | 5,880,000 |
| Transocean Titan Financing Ltd. | | |
| 8.375%, due 2/1/28 (a) | 7,445,000 | 7,475,152 |
| Viper Energy Partners LP | | |
| 5.375%, due 11/1/27 (a) | 1,500,000 | 1,421,625 |
| Vital Energy, Inc. | | |
| 10.125%, due 1/15/28 | 7,410,000 | 7,429,530 |
| | | 111,990,114 |
| | Principal
Amount | Value |
| |
| Oil & Gas Services 0.7% |
| Bristow Group, Inc. | | |
| 6.875%, due 3/1/28 (a) | $ 5,000,000 | $ 4,631,250 |
| Nine Energy Service, Inc. | | |
| 13.00%, due 2/1/28 | 4,500,000 | 3,982,500 |
| Oceaneering International, Inc. | | |
| 6.00%, due 2/1/28 (a) | 3,000,000 | 2,752,500 |
| Weatherford International Ltd. | | |
| 6.50%, due 9/15/28 (a) | 832,000 | 836,287 |
| | | 12,202,537 |
| Packaging & Containers 0.4% |
| Cascades USA, Inc. | | |
| 5.125%, due 1/15/26 (a) | 4,831,000 | 4,585,225 |
| Owens-Brockway Glass Container, Inc. | | |
| 6.625%, due 5/13/27 (a) | 1,750,000 | 1,662,500 |
| Sealed Air Corp. | | |
| 6.125%, due 2/1/28 (a) | 935,000 | 889,951 |
| | | 7,137,676 |
| Pharmaceuticals 1.5% |
| 1375209 BC Ltd. | | |
| 9.00%, due 1/30/28 (a) | 3,600,000 | 3,489,789 |
| Bausch Health Cos., Inc. | | |
| 11.00%, due 9/30/28 (a) | 5,000,000 | 3,050,000 |
| Endo DAC | | |
| 5.875%, due 10/15/24 (a)(g)(j) | 13,150,000 | 8,810,500 |
| Prestige Brands, Inc. | | |
| 5.125%, due 1/15/28 (a) | 12,755,000 | 11,759,727 |
| | | 27,110,016 |
| Pipelines 6.2% |
| Antero Midstream Partners LP | | |
| 5.75%, due 3/1/27 (a) | 7,690,000 | 7,349,892 |
| EnLink Midstream LLC | | |
| 5.625%, due 1/15/28 (a) | 3,700,000 | 3,488,823 |
| EQM Midstream Partners LP | | |
| 4.125%, due 12/1/26 | 675,000 | 626,150 |
| 6.00%, due 7/1/25 (a) | 2,195,000 | 2,146,563 |
| FTAI Infra Escrow Holdings LLC | | |
| 10.50%, due 6/1/27 (a) | 7,110,000 | 6,910,646 |
| Genesis Energy LP | | |
| 6.25%, due 5/15/26 | 4,500,000 | 4,288,684 |
| 6.50%, due 10/1/25 | 4,140,000 | 4,044,544 |
| 8.00%, due 1/15/27 | 9,300,000 | 8,930,342 |
| Hess Midstream Operations LP | | |
| 5.625%, due 2/15/26 (a) | 7,224,000 | 6,996,004 |
| Holly Energy Partners LP | | |
| 6.375%, due 4/15/27 (a) | 3,538,000 | 3,425,095 |
The notes to the financial statements are an integral part of, and should be read in conjunction with, the financial statements.
15
Portfolio of Investments October 31, 2023†^ (continued)
| | Principal
Amount | Value |
| Corporate Bonds (continued) |
| Pipelines (continued) |
| New Fortress Energy, Inc. (a) | | |
| 6.50%, due 9/30/26 | $ 4,000,000 | $ 3,582,787 |
| 6.75%, due 9/15/25 | 1,000,000 | 927,734 |
| NuStar Logistics LP | | |
| 5.75%, due 10/1/25 | 1,500,000 | 1,451,680 |
| 6.00%, due 6/1/26 | 875,000 | 844,253 |
| Plains All American Pipeline LP | | |
| Series B | | |
| 9.736% (3 Month SOFR + 4.372%), due 11/15/71 (d)(e) | 18,663,000 | 17,537,867 |
| Rockies Express Pipeline LLC | | |
| 3.60%, due 5/15/25 (a) | 3,805,000 | 3,600,614 |
| Summit Midstream Holdings LLC | | |
| 9.00%, due 10/15/26 (a)(i) | 7,810,000 | 7,497,600 |
| Tallgrass Energy Partners LP (a) | | |
| 5.50%, due 1/15/28 | 1,000,000 | 876,050 |
| 6.00%, due 3/1/27 | 5,000,000 | 4,574,478 |
| 7.50%, due 10/1/25 | 835,000 | 822,601 |
| TransMontaigne Partners LP | | |
| 6.125%, due 2/15/26 | 4,600,000 | 3,921,500 |
| Venture Global LNG, Inc. (a) | | |
| 8.125%, due 6/1/28 | 13,240,000 | 12,853,671 |
| 9.50%, due 2/1/29 | 3,335,000 | 3,388,160 |
| Western Midstream Operating LP | | |
| 4.65%, due 7/1/26 | 4,315,000 | 4,125,587 |
| | | 114,211,325 |
| Real Estate 0.7% |
| Newmark Group, Inc. | | |
| 6.125%, due 11/15/23 | 12,225,000 | 12,194,438 |
| Real Estate Investment Trusts 3.3% |
| GLP Capital LP | | |
| 5.25%, due 6/1/25 | 2,500,000 | 2,438,486 |
| 5.375%, due 4/15/26 | 700,000 | 670,881 |
| MPT Operating Partnership LP | | |
| 5.00%, due 10/15/27 | 9,440,000 | 7,288,119 |
| 5.25%, due 8/1/26 | 8,700,000 | 7,490,814 |
| RHP Hotel Properties LP | | |
| 4.75%, due 10/15/27 | 7,905,000 | 7,182,483 |
| 7.25%, due 7/15/28 (a) | 2,220,000 | 2,151,976 |
| SBA Communications Corp. | | |
| 3.875%, due 2/15/27 | 2,000,000 | 1,821,390 |
| VICI Properties LP (a) | | |
| 3.50%, due 2/15/25 | 9,615,000 | 9,170,524 |
| | Principal
Amount | Value |
| |
| Real Estate Investment Trusts (continued) |
| VICI Properties LP (a) (continued) | | |
| 4.625%, due 6/15/25 | $ 2,985,000 | $ 2,867,033 |
| 5.625%, due 5/1/24 | 19,681,000 | 19,546,063 |
| | | 60,627,769 |
| Retail 3.5% |
| 1011778 B.C. Unlimited Liability Co. | | |
| 3.875%, due 1/15/28 (a) | 11,500,000 | 10,267,171 |
| Asbury Automotive Group, Inc. | | |
| 4.50%, due 3/1/28 | 9,410,000 | 8,337,825 |
| CEC Entertainment LLC | | |
| 6.75%, due 5/1/26 (a) | 2,830,000 | 2,643,024 |
| Dave & Buster's, Inc. | | |
| 7.625%, due 11/1/25 (a) | 2,160,000 | 2,143,800 |
| Group 1 Automotive, Inc. | | |
| 4.00%, due 8/15/28 (a) | 1,000,000 | 860,747 |
| Ken Garff Automotive LLC | | |
| 4.875%, due 9/15/28 (a) | 5,900,000 | 4,989,657 |
| KFC Holding Co. | | |
| 4.75%, due 6/1/27 (a) | 9,157,000 | 8,653,823 |
| Murphy Oil USA, Inc. | | |
| 5.625%, due 5/1/27 | 3,820,000 | 3,692,297 |
| NMG Holding Co., Inc. | | |
| 7.125%, due 4/1/26 (a) | 19,328,000 | 18,079,684 |
| Patrick Industries, Inc. | | |
| 7.50%, due 10/15/27 (a) | 3,292,000 | 3,135,630 |
| PetSmart, Inc. | | |
| 4.75%, due 2/15/28 (a) | 1,800,000 | 1,592,782 |
| | | 64,396,440 |
| Software 2.6% |
| ACI Worldwide, Inc. | | |
| 5.75%, due 8/15/26 (a) | 2,500,000 | 2,393,158 |
| Camelot Finance SA | | |
| 4.50%, due 11/1/26 (a) | 16,420,000 | 15,178,472 |
| Open Text Corp. (a) | | |
| 3.875%, due 2/15/28 | 2,000,000 | 1,738,150 |
| 6.90%, due 12/1/27 | 2,850,000 | 2,835,878 |
| PTC, Inc. (a) | | |
| 3.625%, due 2/15/25 | 10,320,000 | 9,948,146 |
| 4.00%, due 2/15/28 | 4,600,000 | 4,078,717 |
| SS&C Technologies, Inc. | | |
| 5.50%, due 9/30/27 (a) | 8,600,000 | 8,069,141 |
| Veritas US, Inc. | | |
| 7.50%, due 9/1/25 (a) | 4,740,000 | 3,880,271 |
| | | 48,121,933 |
The notes to the financial statements are an integral part of, and should be read in conjunction with, the financial statements.
| 16 | MainStay MacKay Short Duration High Yield Fund |
| | Principal
Amount | Value |
| Corporate Bonds (continued) |
| Telecommunications 2.5% |
| Connect Finco SARL | | |
| 6.75%, due 10/1/26 (a) | $ 7,170,000 | $ 6,686,284 |
| Frontier Communications Holdings LLC (a) | | |
| 5.00%, due 5/1/28 | 2,500,000 | 2,158,476 |
| 5.875%, due 10/15/27 | 4,235,000 | 3,860,915 |
| Sprint LLC | | |
| 7.625%, due 2/15/25 | 1,400,000 | 1,419,923 |
| T-Mobile USA, Inc. | | |
| 2.25%, due 2/15/26 | 24,000,000 | 22,076,539 |
| 4.75%, due 2/1/28 | 7,555,000 | 7,187,559 |
| 5.375%, due 4/15/27 | 570,000 | 560,721 |
| Viasat, Inc. | | |
| 5.625%, due 9/15/25 (a) | 1,525,000 | 1,416,710 |
| | | 45,367,127 |
| Toys, Games & Hobbies 0.5% |
| Mattel, Inc. (a) | | |
| 3.375%, due 4/1/26 | 5,469,000 | 5,051,562 |
| 5.875%, due 12/15/27 | 4,265,000 | 4,088,918 |
| | | 9,140,480 |
| Transportation 0.6% |
| RXO, Inc. | | |
| 7.50%, due 11/15/27 (a) | 1,500,000 | 1,499,595 |
| Watco Cos. LLC | | |
| 6.50%, due 6/15/27 (a) | 9,520,000 | 8,870,016 |
| | | 10,369,611 |
Total Corporate Bonds
(Cost $1,459,518,749) | | 1,402,963,249 |
| Loan Assignments 17.2% |
| Aerospace & Defense 0.2% |
| SkyMiles IP Ltd. | |
| Initial Term Loan | |
| 9.166% (3 Month SOFR + 3.75%), due 10/20/27 (d) | 3,600,000 | 3,679,877 |
| Automobile 0.4% |
| Dealer Tire Financial LLC | |
| Term Loan B2 | |
| 9.824% (1 Month SOFR + 4.50%), due 12/14/27 (d) | 3,473,750 | 3,469,408 |
| | Principal
Amount | Value |
| |
| Automobile (continued) |
| Tenneco, Inc. | |
| First Lien Term Loan B 10.476% - 10.49% | |
| (3 Month SOFR + 5.00%), due 11/17/28 (d) | $ 3,850,000 | $ 3,194,899 |
| | | 6,664,307 |
| Banking 0.1% |
| Jane Street Group LLC | |
| Dollar Term Loan | |
| 8.189% (1 Month SOFR + 2.75%), due 1/26/28 (d) | 2,449,622 | 2,441,458 |
| Beverage, Food & Tobacco 0.3% |
| B&G Foods, Inc. | |
| Tranche Term Loan B4 | |
| 7.827% (1 Month SOFR + 2.50%), due 10/10/26 (d) | 2,708,205 | 2,644,730 |
| United Natural Foods, Inc. | |
| Initial Term Loan | |
| 8.689% (1 Month SOFR + 3.25%), due 10/22/25 (d) | 3,666,877 | 3,650,453 |
| | | 6,295,183 |
| Capital Equipment 0.1% |
| DexKo Global, Inc. | |
| First Lien 2023 Incremental Term Loan | |
| 9.64% (3 Month SOFR + 4.25%), due 10/4/28 (d) | 2,500,000 | 2,408,595 |
| Cargo Transport 0.3% |
| Forward Air Corp.-Cov-Lite | |
| Senior Secured Term Loan B | |
| TBD, due 9/20/30 | 5,600,000 | 5,404,000 |
| Chemicals 0.2% |
| ASP Unifrax Holdings, Inc. | |
| First Lien USD Term Loan | |
| 9.29% (3 Month SOFR + 3.75%), due 12/12/25 (d) | 3,948,293 | 3,674,731 |
| Chemicals, Plastics & Rubber 1.6% |
| Innophos Holdings, Inc. | |
| Initial Term Loan | |
| 8.689% (1 Month SOFR + 3.25%), due 2/5/27 (d) | 8,123,767 | 8,024,250 |
The notes to the financial statements are an integral part of, and should be read in conjunction with, the financial statements.
17
Portfolio of Investments October 31, 2023†^ (continued)
| | Principal
Amount | Value |
| Loan Assignments (continued) |
| Chemicals, Plastics & Rubber (continued) |
| Jazz Pharmaceuticals plc | |
| Initial Dollar Term Loan | |
| 8.939% (1 Month SOFR + 3.50%), due 5/5/28 (d) | $ 16,425,449 | $ 16,418,600 |
| SCIH Salt Holdings, Inc. | |
| First Lien Incremental Term Loan B1 | |
| 9.439% (1 Month SOFR + 4.00%), due 3/16/27 (d) | 5,934,108 | 5,845,096 |
| | | 30,287,946 |
| Electronics 0.9% |
| Camelot U.S. Acquisition LLC (d) | |
| Initial Term Loan | |
| 8.439% (1 Month SOFR + 3.00%), due 10/30/26 | 7,636,624 | 7,622,986 |
| Amendment No. 2 Incremental Term Loan | |
| 8.439% (1 Month SOFR + 3.00%), due 10/30/26 | 4,353,176 | 4,344,626 |
| WEX, Inc. | |
| Term Loan B | |
| 7.689% (1 Month SOFR + 2.25%), due 3/31/28 (d) | 4,957,727 | 4,952,219 |
| | | 16,919,831 |
| Energy (Electricity) 0.6% |
| Talen Energy Supply LLC (d) | |
| Initial Term Loan B | |
| 9.876% (3 Month SOFR + 4.50%), due 5/17/30 | 6,599,888 | 6,590,265 |
| Initial Term Loan C | |
| 9.876% (3 Month SOFR + 4.50%), due 5/17/30 | 4,028,571 | 4,022,698 |
| | | 10,612,963 |
| Entertainment 0.3% |
| ECL Entertainment LLC | |
| Term Loan B | |
| 10.14% (3 Month SOFR + 4.75%), due 9/3/30 (d) | 2,500,000 | 2,489,582 |
| NAI Entertainment Holdings LLC | |
| Tranche Term Loan B | |
| 8.449% (1 Month SOFR + 3.00%), due 5/8/25 (d) | 2,927,979 | 2,814,520 |
| | | 5,304,102 |
| | Principal
Amount | Value |
| |
| Finance 1.1% |
| Mativ Holdings, Inc. | |
| Term Loan B | |
| 9.189% (1 Month SOFR + 3.75%), due 4/20/28 (d) | $ 3,274,625 | $ 3,217,319 |
| Mileage Plus Holdings LLC | |
| Initial Term Loan | |
| 10.798% (3 Month SOFR + 5.25%), due 6/21/27 (d) | 1,875,000 | 1,928,906 |
| Osaic Holdings, Inc. | |
| Term Loan B2 | |
| 9.824% (1 Month SOFR + 4.50%), due 8/17/28 (d) | 2,400,000 | 2,388,000 |
| RealTruck Group, Inc. (d) | |
| Initial Term Loan | |
| 9.189% (1 Month SOFR + 3.75%), due 1/31/28 | 8,724,249 | 8,292,129 |
| Second Amendment Incremental Term Loan | |
| 10.463% (1 Month SOFR + 5.00%), due 1/31/28 | 5,000,000 | 4,281,730 |
| | | 20,108,084 |
| Healthcare & Pharmaceuticals 0.3% |
| Bausch & Lomb Corp. | |
| First Incremental Term Loan | |
| 9.324% (1 Month SOFR + 4.00%), due 9/29/28 (d) | 2,700,000 | 2,608,875 |
| Owens & Minor, Inc. | |
| Term Loan B1 9.174% - 9.24% | |
| (1 Month SOFR + 3.75%, 3 Month SOFR + 3.75%), due 3/29/29 (d) | 3,320,750 | 3,316,599 |
| | | 5,925,474 |
| Healthcare, Education & Childcare 1.3% |
| LifePoint Health, Inc. | |
| 2023 Refinancing Term Loan | |
| 11.168% (3 Month SOFR + 5.50%), due 11/16/28 (d) | 16,000,000 | 15,872,000 |
| Organon & Co. | |
| Dollar Term Loan | |
| 8.45% (1 Month SOFR + 3.00%), due 6/2/28 (d) | 7,627,500 | 7,589,362 |
| | | 23,461,362 |
| High Tech Industries 0.6% |
| Central Parent LLC | |
| First Lien 2023 Refinancing Term Loan | |
| 9.406% (3 Month SOFR + 4.00%), due 7/6/29 (d) | 1,989,975 | 1,977,311 |
The notes to the financial statements are an integral part of, and should be read in conjunction with, the financial statements.
| 18 | MainStay MacKay Short Duration High Yield Fund |
| | Principal
Amount | Value |
| Loan Assignments (continued) |
| High Tech Industries (continued) |
| Open Text Corp. | |
| 2023 Replacement Term Loan | |
| 8.174% (1 Month SOFR + 2.75%), due 1/31/30 (d) | $ 9,861,532 | $ 9,856,246 |
| | | 11,833,557 |
| Hotels, Motels, Inns & Gaming 0.3% |
| Four Seasons Holdings, Inc. | |
| First Lien 2023 Repricing Term Loan | |
| 7.924% (1 Month SOFR + 2.50%), due 11/30/29 (d) | 5,288,857 | 5,285,917 |
| Insurance 0.5% |
| USI, Inc. | |
| 2022 Incremental Term Loan | |
| 9.14% (3 Month SOFR + 3.75%), due 11/22/29 (d) | 9,609,661 | 9,587,135 |
| Leisure, Amusement, Motion Pictures & Entertainment 0.3% |
| Carnival Corp. | |
| Initial Advance Term Loan | |
| 8.336% (1 Month SOFR + 3.00%), due 8/9/27 (d) | 5,586,000 | 5,474,280 |
| NASCAR Holdings LLC | |
| Initial Term Loan | |
| 7.939% (1 Month SOFR + 2.50%), due 10/19/26 (d) | 973,968 | 975,592 |
| | | 6,449,872 |
| Manufacturing 0.8% |
| Adient U.S. LLC | |
| Term Loan B1 | |
| 8.689% (1 Month SOFR + 3.25%), due 4/10/28 (d) | 6,032,500 | 6,024,959 |
| Chart Industries, Inc. | |
| Amendment No. 5 Term Loan | |
| 8.665% (1 Month SOFR + 3.25%), due 3/15/30 (d) | 5,970,005 | 5,947,618 |
| Summit Materials LLC | |
| Term Loan B1 | |
| 8.571% (6 Month SOFR + 3.00%), due 12/14/27 (d) | 1,985,000 | 1,990,582 |
| | | 13,963,159 |
| | Principal
Amount | Value |
| |
| Media 1.6% |
| Block Communications, Inc. | |
| Term Loan | |
| 7.902% (3 Month SOFR + 2.25%), due 2/25/27 (d) | $ 11,338,750 | $ 10,979,686 |
| DIRECTV Financing LLC | |
| Closing Date Term Loan | |
| 10.439% (1 Month SOFR + 5.00%), due 8/2/27 (d) | 13,299,734 | 12,918,550 |
| Lamar Media Corp. | |
| Term Loan B | |
| 6.927% (1 Month SOFR + 1.50%), due 2/5/27 (d) | 5,000,000 | 4,941,665 |
| | | 28,839,901 |
| Mining, Steel, Iron & Non-Precious Metals 0.2% |
| Gates Global LLC | |
| Initial Dollar Term Loan B3 | |
| 7.924% (1 Month SOFR + 2.50%), due 3/31/27 (d) | 2,969,466 | 2,961,733 |
| Oil & Gas 1.3% |
| Brazos Delaware II LLC | |
| Initial Term Loan | |
| 9.085% (1 Month SOFR + 3.75%), due 2/11/30 (d) | 2,873,000 | 2,860,431 |
| GIP III Stetson I LP | |
| Term Loan | |
| TBD, due 10/5/28 | 4,500,000 | 4,464,846 |
| GIP Pilot Acquisition Partners LP | |
| Initial Term Loan | |
| 8.388% (3 Month SOFR + 3.00%), due 10/4/30 (d) | 5,150,000 | 5,137,125 |
| New Fortress Energy, Inc. | |
| Initial Term Loan | |
| 10.39% (1 Month SOFR + 5.00%), due 10/30/28 (d) | 4,700,000 | 4,324,000 |
| PetroQuest Energy LLC (b)(f) | |
| Term Loan | |
| 15.00% (12.07% PIK), due 11/8/23 (c) | 4,180,339 | 3,218,861 |
| 2020 Term Loan | |
| 15.00% (15.00% PIK) (1 Month LIBOR + 6.50%), due 9/19/26 (c)(d) | 272,109 | 272,109 |
| Term Loan | |
| 15.00% (1 Month LIBOR + 6.50%), due 1/1/28 (d) | 354,265 | 354,265 |
The notes to the financial statements are an integral part of, and should be read in conjunction with, the financial statements.
19
Portfolio of Investments October 31, 2023†^ (continued)
| | Principal
Amount | Value |
| Loan Assignments (continued) |
| Oil & Gas (continued) |
| TransMontaigne Operating Co. LP | |
| Tranche Term Loan B 8.939% - 8.941% | |
| (1 Month SOFR + 3.50%), due 11/17/28 (d) | $ 2,947,500 | $ 2,909,274 |
| | | 23,540,911 |
| Personal, Food & Miscellaneous Services 0.5% |
| 1011778 B.C. Unlimited Liability Co. | |
| Term Loan B5 | |
| 7.574% (1 Month SOFR + 2.25%), due 9/23/30 (d) | 3,500,000 | 3,472,000 |
| KFC Holding Co. | |
| 2021 Term Loan B | |
| 7.199% (1 Month SOFR + 1.75%), due 3/15/28 (d) | 2,572,236 | 2,566,608 |
| WW International, Inc. | |
| Initial Term Loan | |
| 8.939% (1 Month SOFR + 3.50%), due 4/13/28 (d) | 5,043,625 | 3,587,278 |
| | | 9,625,886 |
| Retail 1.5% |
| Great Outdoors Group LLC | |
| Term Loan B2 | |
| 9.402% (3 Month SOFR + 3.75%), due 3/6/28 (d) | 27,199,613 | 26,944,617 |
| Services: Business 0.4% |
| Dun & Bradstreet Corp. (The) | |
| Refinancing Term Loan | |
| 8.176% (1 Month SOFR + 2.75%), due 2/6/26 (d) | 2,792,619 | 2,788,628 |
| GIP II Blue Holding LP | |
| Initial Term Loan | |
| 9.939% (1 Month SOFR + 4.50%), due 9/29/28 (d) | 5,168,853 | 5,166,429 |
| | | 7,955,057 |
| Software 0.4% |
| Cloud Software Group, Inc. | |
| First Lien Dollar Term Loan B | |
| 9.99% (3 Month SOFR + 4.50%), due 3/30/29 (d) | 7,903,473 | 7,497,432 |
| | Principal
Amount | Value |
| |
| Telecommunications 0.5% |
| Connect Finco SARL | |
| Amendement No.1 Refinancing Term Loan | |
| 8.824% (1 Month SOFR + 3.50%), due 12/11/26 (d) | $ 8,588,500 | $ 8,363,052 |
| Utilities 0.6% |
| Constellation Renewables LLC | |
| Term Loan | |
| 8.184% (3 Month SOFR + 2.50%), due 12/15/27 (d) | 2,609,840 | 2,595,702 |
| PG&E Corp. | |
| Term Loan | |
| 8.439% (1 Month SOFR + 3.00%), due 6/23/25 (d) | 9,157,045 | 9,134,153 |
| | | 11,729,855 |
Total Loan Assignments
(Cost $319,532,814) | | 317,765,997 |
Total Long-Term Bonds
(Cost $1,807,994,435) | | 1,751,168,221 |
| |
| | Shares | |
| |
| Common Stocks 0.6% |
| Electrical Equipment 0.0% ‡ |
| Energy Technologies, Inc. (b)(f)(k) | 2,021 | 683,098 |
| Energy Equipment & Services 0.0% ‡ |
| Nine Energy Service, Inc. (k) | 22,500 | 79,200 |
| Independent Power and Renewable Electricity Producers 0.1% |
| GenOn Energy, Inc. (h) | 20,915 | 1,599,998 |
| Oil, Gas & Consumable Fuels 0.5% |
| Gulfport Energy Corp. (k) | 69,290 | 8,564,937 |
| PetroQuest Energy, Inc. (b)(f)(k) | 11,867 | — |
| Talos Energy, Inc. (k) | 71,517 | 1,108,513 |
| | | 9,673,450 |
Total Common Stocks
(Cost $10,940,316) | | 12,035,746 |
The notes to the financial statements are an integral part of, and should be read in conjunction with, the financial statements.
| 20 | MainStay MacKay Short Duration High Yield Fund |
| | Shares | | Value |
| Preferred Stock 0.2% |
| Electrical Equipment 0.2% |
Energy Technologies Ltd. (b)(f)(k)
| 4,501 | | $ 3,488,275 |
Total Preferred Stock
(Cost $4,295,471) | | | 3,488,275 |
Total Investments
(Cost $1,823,230,222) | 95.6% | | 1,766,692,242 |
| Other Assets, Less Liabilities | 4.4 | | 80,673,208 |
| Net Assets | 100.0% | | $ 1,847,365,450 |
| † | Percentages indicated are based on Fund net assets. |
| ^ | Industry classifications may be different than those used for compliance monitoring purposes. |
| ‡ | Less than one-tenth of a percent. |
| (a) | May be sold to institutional investors only under Rule 144A or securities offered pursuant to Section 4(a)(2) of the Securities Act of 1933, as amended. |
| (b) | Illiquid security—As of October 31, 2023, the total market value deemed illiquid under procedures approved by the Board of Trustees was $13,071,721, which represented 0.7% of the Fund’s net assets. (Unaudited) |
| (c) | PIK ("Payment-in-Kind")—issuer may pay interest or dividends with additional securities and/or in cash. |
| (d) | Floating rate—Rate shown was the rate in effect as of October 31, 2023. |
| (e) | Security is perpetual and, thus, does not have a predetermined maturity date. The date shown, if applicable, reflects the next call date. |
| (f) | Security in which significant unobservable inputs (Level 3) were used in determining fair value. |
| (g) | Issue in non-accrual status. |
| (h) | Restricted security. (See Note 5) |
| (i) | Step coupon—Rate shown was the rate in effect as of October 31, 2023. |
| (j) | Issue in default. |
| (k) | Non-income producing security. |
| Abbreviation(s): |
| LIBOR—London Interbank Offered Rate |
| SOFR—Secured Overnight Financing Rate |
| TBD—To Be Determined |
| USD—United States Dollar |
The notes to the financial statements are an integral part of, and should be read in conjunction with, the financial statements.
21
Portfolio of Investments October 31, 2023†^ (continued)
The following is a summary of the fair valuations according to the inputs used as of October 31, 2023, for valuing the Fund’s assets:
| Description | Quoted
Prices in
Active
Markets for
Identical
Assets
(Level 1) | | Significant
Other
Observable
Inputs
(Level 2) | | Significant
Unobservable
Inputs
(Level 3) | | Total |
| Asset Valuation Inputs | | | | | | | |
| Investments in Securities (a) | | | | | | | |
| Long-Term Bonds | | | | | | | |
| Convertible Bonds | $ — | | $ 30,438,975 | | $ — | | $ 30,438,975 |
| Corporate Bonds | — | | 1,400,256,049 | | 2,707,200 | | 1,402,963,249 |
| Loan Assignments | — | | 313,920,762 | | 3,845,235 | | 317,765,997 |
| Total Long-Term Bonds | — | | 1,744,615,786 | | 6,552,435 | | 1,751,168,221 |
| Common Stocks | 9,752,650 | | 1,599,998 | | 683,098 | | 12,035,746 |
| Preferred Stock | — | | — | | 3,488,275 | | 3,488,275 |
| Total Investments in Securities | $ 9,752,650 | | $ 1,746,215,784 | | $ 10,723,808 | | $ 1,766,692,242 |
| (a) | For a complete listing of investments and their industries, see the Portfolio of Investments. |
The notes to the financial statements are an integral part of, and should be read in conjunction with, the financial statements.
| 22 | MainStay MacKay Short Duration High Yield Fund |
Statement of Assets and Liabilities as of October 31, 2023
| Assets |
Investment in securities, at value
(identified cost $1,823,230,222) | $1,766,692,242 |
| Cash | 71,270,363 |
| Receivables: | |
| Interest | 26,377,106 |
| Investment securities sold | 16,965,042 |
| Fund shares sold | 6,912,640 |
| Other assets | 430,619 |
| Total assets | 1,888,648,012 |
| Liabilities |
| Payables: | |
| Investment securities purchased | 34,262,012 |
| Fund shares redeemed | 4,512,508 |
| Manager (See Note 3) | 906,980 |
| Transfer agent (See Note 3) | 374,977 |
| NYLIFE Distributors (See Note 3) | 96,038 |
| Professional fees | 25,433 |
| Custodian | 14,920 |
| Shareholder communication | 10,535 |
| Accrued expenses | 730 |
| Distributions payable | 1,078,429 |
| Total liabilities | 41,282,562 |
| Net assets | $1,847,365,450 |
| Composition of Net Assets |
| Shares of beneficial interest outstanding (par value of $.001 per share) unlimited number of shares authorized | $ 201,240 |
| Additional paid-in-capital | 1,980,937,295 |
| | 1,981,138,535 |
| Total distributable earnings (loss) | (133,773,085) |
| Net assets | $1,847,365,450 |
| Class A | |
| Net assets applicable to outstanding shares | $ 327,715,989 |
| Shares of beneficial interest outstanding | 35,703,795 |
| Net asset value per share outstanding | $ 9.18 |
| Maximum sales charge (3.00% of offering price) | 0.28 |
| Maximum offering price per share outstanding | $ 9.46 |
| Investor Class | |
| Net assets applicable to outstanding shares | $ 5,299,214 |
| Shares of beneficial interest outstanding | 577,274 |
| Net asset value per share outstanding | $ 9.18 |
| Maximum sales charge (2.50% of offering price) | 0.24 |
| Maximum offering price per share outstanding | $ 9.42 |
| Class C | |
| Net assets applicable to outstanding shares | $ 29,903,055 |
| Shares of beneficial interest outstanding | 3,258,786 |
| Net asset value and offering price per share outstanding | $ 9.18 |
| Class I | |
| Net assets applicable to outstanding shares | $1,483,472,888 |
| Shares of beneficial interest outstanding | 161,594,287 |
| Net asset value and offering price per share outstanding | $ 9.18 |
| Class R2 | |
| Net assets applicable to outstanding shares | $ 754,793 |
| Shares of beneficial interest outstanding | 82,275 |
| Net asset value and offering price per share outstanding | $ 9.17 |
| Class R3 | |
| Net assets applicable to outstanding shares | $ 219,511 |
| Shares of beneficial interest outstanding | 23,918 |
| Net asset value and offering price per share outstanding | $ 9.18 |
The notes to the financial statements are an integral part of, and should be read in conjunction with, the financial statements.
23
Statement of Operations for the year ended October 31, 2023
| Investment Income (Loss) |
| Income | |
| Interest | $109,414,607 |
| Dividends | 548,726 |
| Total income | 109,963,333 |
| Expenses | |
| Manager (See Note 3) | 10,902,096 |
| Transfer agent (See Note 3) | 2,117,862 |
| Distribution/Service—Class A (See Note 3) | 784,223 |
| Distribution/Service—Investor Class (See Note 3) | 13,574 |
| Distribution/Service—Class C (See Note 3) | 275,272 |
| Distribution/Service—Class R2 (See Note 3) | 1,428 |
| Distribution/Service—Class R3 (See Note 3) | 1,050 |
| Professional fees | 186,058 |
| Registration | 156,532 |
| Shareholder communication | 72,202 |
| Trustees | 42,254 |
| Custodian | 41,172 |
| Shareholder service (See Note 3) | 781 |
| Miscellaneous | 49,177 |
| Total expenses before waiver/reimbursement | 14,643,681 |
| Expense waiver/reimbursement from Manager (See Note 3) | (490,517) |
| Reimbursement from prior custodian(a) | (2,986) |
| Net expenses | 14,150,178 |
| Net investment income (loss) | 95,813,155 |
| Realized and Unrealized Gain (Loss) |
| Net realized gain (loss) on investments | (17,516,270) |
| Net change in unrealized appreciation (depreciation) on investments | 27,342,387 |
| Net realized and unrealized gain (loss) | 9,826,117 |
| Net increase (decrease) in net assets resulting from operations | $105,639,272 |
| (a) | Represents a refund for overbilling of custody fees. |
The notes to the financial statements are an integral part of, and should be read in conjunction with, the financial statements.
| 24 | MainStay MacKay Short Duration High Yield Fund |
Statements of Changes in Net Assets
for the years ended October 31, 2023 and October 31, 2022
| | 2023 | 2022 |
| Increase (Decrease) in Net Assets |
| Operations: | | |
| Net investment income (loss) | $ 95,813,155 | $ 58,572,893 |
| Net realized gain (loss) | (17,516,270) | 1,650,212 |
| Net change in unrealized appreciation (depreciation) | 27,342,387 | (114,848,772) |
| Net increase (decrease) in net assets resulting from operations | 105,639,272 | (54,625,667) |
| Distributions to shareholders: | | |
| Class A | (17,419,336) | (12,418,690) |
| Investor Class | (294,090) | (224,189) |
| Class C | (1,298,778) | (955,093) |
| Class I | (77,891,562) | (46,971,570) |
| Class R2 | (32,277) | (19,878) |
| Class R3 | (10,945) | (6,002) |
| Total distributions to shareholders | (96,946,988) | (60,595,422) |
| Capital share transactions: | | |
| Net proceeds from sales of shares | 1,113,612,550 | 809,391,209 |
| Net asset value of shares issued to shareholders in reinvestment of distributions | 86,836,188 | 53,702,017 |
| Cost of shares redeemed | (729,398,889) | (873,263,765) |
| Increase (decrease) in net assets derived from capital share transactions | 471,049,849 | (10,170,539) |
| Net increase (decrease) in net assets | 479,742,133 | (125,391,628) |
| Net Assets |
| Beginning of year | 1,367,623,317 | 1,493,014,945 |
| End of year | $1,847,365,450 | $1,367,623,317 |
The notes to the financial statements are an integral part of, and should be read in conjunction with, the financial statements.
25
Financial Highlights selected per share data and ratios
| | Year Ended October 31, |
| Class A | 2023 | | 2022 | | 2021 | | 2020 | | 2019 |
| Net asset value at beginning of year | $ 9.09 | | $ 9.83 | | $ 9.45 | | $ 9.84 | | $ 9.76 |
| Net investment income (loss) | 0.51(a) | | 0.37(a) | | 0.37(a) | | 0.42 | | 0.44 |
| Net realized and unrealized gain (loss) | 0.09 | | (0.73) | | 0.42 | | (0.37) | | 0.08 |
| Total from investment operations | 0.60 | | (0.36) | | 0.79 | | 0.05 | | 0.52 |
| Less distributions: | | | | | | | | | |
| From net investment income | (0.51) | | (0.38) | | (0.41) | | (0.44) | | (0.44) |
| Return of capital | — | | — | | (0.00)‡ | | — | | — |
| Total distributions | (0.51) | | (0.38) | | (0.41) | | (0.44) | | (0.44) |
| Net asset value at end of year | $ 9.18 | | $ 9.09 | | $ 9.83 | | $ 9.45 | | $ 9.84 |
| Total investment return (b) | 6.72% | | (3.66)% | | 8.40% | | 0.65% | | 5.40% |
| Ratios (to average net assets)/Supplemental Data: | | | | | | | | | |
| Net investment income (loss) | 5.52% | | 3.92% | | 3.78% | | 4.46% | | 4.48% |
| Net expenses (c) | 1.02% | | 1.02% | | 1.01% | | 1.02% | | 1.04% |
| Expenses (before waiver/reimbursement) (c) | 1.06% | | 1.02% | | 1.01% | | 1.02% | | 1.04% |
| Portfolio turnover rate | 22% | | 30% | | 47% | | 64% | | 32% |
| Net assets at end of year (in 000’s) | $ 327,716 | | $ 300,909 | | $ 303,646 | | $ 252,753 | | $ 237,475 |
| ‡ | Less than one cent per share. |
| (a) | Per share data based on average shares outstanding during the year. |
| (b) | Total investment return is calculated exclusive of sales charges and assumes the reinvestment of dividends and distributions. For periods of less than one year, total return is not annualized. |
| (c) | In addition to the fees and expenses which the Fund bears directly, it also indirectly bears a pro-rata share of the fees and expenses of the underlying funds in which it invests. Such indirect expenses are not included in the above expense ratios. |
| | Year Ended October 31, |
| Investor Class | 2023 | | 2022 | | 2021 | | 2020 | | 2019 |
| Net asset value at beginning of year | $ 9.09 | | $ 9.83 | | $ 9.46 | | $ 9.84 | | $ 9.76 |
| Net investment income (loss) | 0.50(a) | | 0.36(a) | | 0.37(a) | | 0.42 | | 0.43 |
| Net realized and unrealized gain (loss) | 0.09 | | (0.72) | | 0.40 | | (0.36) | | 0.08 |
| Total from investment operations | 0.59 | | (0.36) | | 0.77 | | 0.06 | | 0.51 |
| Less distributions: | | | | | | | | | |
| From net investment income | (0.50) | | (0.38) | | (0.40) | | (0.44) | | (0.43) |
| Return of capital | — | | — | | (0.00)‡ | | — | | — |
| Total distributions | (0.50) | | (0.38) | | (0.40) | | (0.44) | | (0.43) |
| Net asset value at end of year | $ 9.18 | | $ 9.09 | | $ 9.83 | | $ 9.46 | | $ 9.84 |
| Total investment return (b) | 6.63% | | (3.73)% | | 8.18% | | 0.67% | | 5.33% |
| Ratios (to average net assets)/Supplemental Data: | | | | | | | | | |
| Net investment income (loss) | 5.43% | | 3.82% | | 3.72% | | 4.38% | | 4.40% |
| Net expenses (c) | 1.11% | | 1.10% | | 1.10% | | 1.11% | | 1.11% |
| Expenses (before waiver/reimbursement) (c) | 1.11% | | 1.10% | | 1.10% | | 1.11% | | 1.11% |
| Portfolio turnover rate | 22% | | 30% | | 47% | | 64% | | 32% |
| Net assets at end of year (in 000's) | $ 5,299 | | $ 5,400 | | $ 5,780 | | $ 6,278 | | $ 7,156 |
| ‡ | Less than one cent per share. |
| (a) | Per share data based on average shares outstanding during the year. |
| (b) | Total investment return is calculated exclusive of sales charges and assumes the reinvestment of dividends and distributions. For periods of less than one year, total return is not annualized. |
| (c) | In addition to the fees and expenses which the Fund bears directly, it also indirectly bears a pro-rata share of the fees and expenses of the underlying funds in which it invests. Such indirect expenses are not included in the above expense ratios. |
The notes to the financial statements are an integral part of, and should be read in conjunction with, the financial statements.
| 26 | MainStay MacKay Short Duration High Yield Fund |
Financial Highlights selected per share data and ratios
| | Year Ended October 31, |
| Class C | 2023 | | 2022 | | 2021 | | 2020 | | 2019 |
| Net asset value at beginning of year | $ 9.09 | | $ 9.83 | | $ 9.45 | | $ 9.84 | | $ 9.76 |
| Net investment income (loss) | 0.43(a) | | 0.29(a) | | 0.29(a) | | 0.34 | | 0.36 |
| Net realized and unrealized gain (loss) | 0.09 | | (0.72) | | 0.41 | | (0.37) | | 0.08 |
| Total from investment operations | 0.52 | | (0.43) | | 0.70 | | (0.03) | | 0.44 |
| Less distributions: | | | | | | | | | |
| From net investment income | (0.43) | | (0.31) | | (0.32) | | (0.36) | | (0.36) |
| Return of capital | — | | — | | (0.00)‡ | | — | | — |
| Total distributions | (0.43) | | (0.31) | | (0.32) | | (0.36) | | (0.36) |
| Net asset value at end of year | $ 9.18 | | $ 9.09 | | $ 9.83 | | $ 9.45 | | $ 9.84 |
| Total investment return (b) | 5.84% | | (4.46)% | | 7.48% | | (0.19)% | | 4.54% |
| Ratios (to average net assets)/Supplemental Data: | | | | | | | | | |
| Net investment income (loss) | 4.68% | | 3.05% | | 2.98% | | 3.64% | | 3.65% |
| Net expenses (c) | 1.86% | | 1.85% | | 1.85% | | 1.86% | | 1.86% |
| Expenses (before waiver/reimbursement) (c) | 1.86% | | 1.85% | | 1.85% | | 1.86% | | 1.86% |
| Portfolio turnover rate | 22% | | 30% | | 47% | | 64% | | 32% |
| Net assets at end of year (in 000’s) | $ 29,903 | | $ 25,772 | | $ 35,636 | | $ 40,948 | | $ 48,550 |
| ‡ | Less than one cent per share. |
| (a) | Per share data based on average shares outstanding during the year. |
| (b) | Total investment return is calculated exclusive of sales charges and assumes the reinvestment of dividends and distributions. For periods of less than one year, total return is not annualized. |
| (c) | In addition to the fees and expenses which the Fund bears directly, it also indirectly bears a pro-rata share of the fees and expenses of the underlying funds in which it invests. Such indirect expenses are not included in the above expense ratios. |
| | Year Ended October 31, |
| Class I | 2023 | | 2022 | | 2021 | | 2020 | | 2019 |
| Net asset value at beginning of year | $ 9.09 | | $ 9.84 | | $ 9.46 | | $ 9.84 | | $ 9.76 |
| Net investment income (loss) | 0.54(a) | | 0.39(a) | | 0.40(a) | | 0.45 | | 0.46 |
| Net realized and unrealized gain (loss) | 0.08 | | (0.73) | | 0.41 | | (0.36) | | 0.08 |
| Total from investment operations | 0.62 | | (0.34) | | 0.81 | | 0.09 | | 0.54 |
| Less distributions: | | | | | | | | | |
| From net investment income | (0.53) | | (0.41) | | (0.43) | | (0.47) | | (0.46) |
| Return of capital | — | | — | | (0.00)‡ | | — | | — |
| Total distributions | (0.53) | | (0.41) | | (0.43) | | (0.47) | | (0.46) |
| Net asset value at end of year | $ 9.18 | | $ 9.09 | | $ 9.84 | | $ 9.46 | | $ 9.84 |
| Total investment return (b) | 6.98% | | (3.52)% | | 8.66% | | 1.01% | | 5.67% |
| Ratios (to average net assets)/Supplemental Data: | | | | | | | | | |
| Net investment income (loss) | 5.78% | | 4.14% | | 4.05% | | 4.72% | | 4.73% |
| Net expenses (c) | 0.78% | | 0.77% | | 0.76% | | 0.77% | | 0.79% |
| Expenses (before waiver/reimbursement) (c) | 0.81% | | 0.77% | | 0.76% | | 0.77% | | 0.79% |
| Portfolio turnover rate | 22% | | 30% | | 47% | | 64% | | 32% |
| Net assets at end of year (in 000’s) | $ 1,483,473 | | $ 1,034,873 | | $ 1,147,287 | | $ 1,101,084 | | $ 1,268,856 |
| ‡ | Less than one cent per share. |
| (a) | Per share data based on average shares outstanding during the year. |
| (b) | Total investment return is calculated exclusive of sales charges and assumes the reinvestment of dividends and distributions. Class I shares are not subject to sales charges. For periods of less than one year, total return is not annualized. |
| (c) | In addition to the fees and expenses which the Fund bears directly, it also indirectly bears a pro-rata share of the fees and expenses of the underlying funds in which it invests. Such indirect expenses are not included in the above expense ratios. |
The notes to the financial statements are an integral part of, and should be read in conjunction with, the financial statements.
27
Financial Highlights selected per share data and ratios
| | Year Ended October 31, |
| Class R2 | 2023 | | 2022 | | 2021 | | 2020 | | 2019 |
| Net asset value at beginning of year | $ 9.09 | | $ 9.83 | | $ 9.45 | | $ 9.84 | | $ 9.76 |
| Net investment income (loss) | 0.50(a) | | 0.36(a) | | 0.36(a) | | 0.41 | | 0.40 |
| Net realized and unrealized gain (loss) | 0.08 | | (0.72) | | 0.41 | | (0.37) | | 0.11 |
| Total from investment operations | 0.58 | | (0.36) | | 0.77 | | 0.04 | | 0.51 |
| Less distributions: | | | | | | | | | |
| From net investment income | (0.50) | | (0.38) | | (0.39) | | (0.43) | | (0.43) |
| Return of capital | — | | — | | (0.00)‡ | | — | | — |
| Total distributions | (0.50) | | (0.38) | | (0.39) | | (0.43) | | (0.43) |
| Net asset value at end of year | $ 9.17 | | $ 9.09 | | $ 9.83 | | $ 9.45 | | $ 9.84 |
| Total investment return (b) | 6.50% | | (3.75)% | | 8.29% | | 0.55% | | 5.31% |
| Ratios (to average net assets)/Supplemental Data: | | | | | | | | | |
| Net investment income (loss) | 5.44% | | 3.82% | | 3.71% | | 4.36% | | 4.34% |
| Net expenses (c) | 1.13% | | 1.12% | | 1.11% | | 1.12% | | 1.14% |
| Expenses (before waiver/reimbursement) (c) | 1.16% | | 1.12% | | 1.11% | | 1.12% | | 1.14% |
| Portfolio turnover rate | 22% | | 30% | | 47% | | 64% | | 32% |
| Net assets at end of year (in 000’s) | $ 755 | | $ 495 | | $ 508 | | $ 523 | | $ 538 |
| ‡ | Less than one cent per share. |
| (a) | Per share data based on average shares outstanding during the year. |
| (b) | Total investment return is calculated exclusive of sales charges and assumes the reinvestment of dividends and distributions. Class R2 shares are not subject to sales charges. For periods of less than one year, total return is not annualized. |
| (c) | In addition to the fees and expenses which the Fund bears directly, it also indirectly bears a pro-rata share of the fees and expenses of the underlying funds in which it invests. Such indirect expenses are not included in the above expense ratios. |
| | Year Ended October 31, |
| Class R3 | 2023 | | 2022 | | 2021 | | 2020 | | 2019 |
| Net asset value at beginning of year | $ 9.09 | | $ 9.83 | | $ 9.46 | | $ 9.84 | | $ 9.76 |
| Net investment income (loss) | 0.48(a) | | 0.34(a) | | 0.34(a) | | 0.40 | | 0.39 |
| Net realized and unrealized gain (loss) | 0.09 | | (0.73) | | 0.40 | | (0.37) | | 0.09 |
| Total from investment operations | 0.57 | | (0.39) | | 0.74 | | 0.03 | | 0.48 |
| Less distributions: | | | | | | | | | |
| From net investment income | (0.48) | | (0.35) | | (0.37) | | (0.41) | | (0.40) |
| Return of capital | — | | — | | (0.00)‡ | | — | | — |
| Total distributions | (0.48) | | (0.35) | | (0.37) | | (0.41) | | (0.40) |
| Net asset value at end of year | $ 9.18 | | $ 9.09 | | $ 9.83 | | $ 9.46 | | $ 9.84 |
| Total investment return (b) | 6.35% | | (3.99)% | | 7.89% | | 0.41% | | 5.05% |
| Ratios (to average net assets)/Supplemental Data: | | | | | | | | | |
| Net investment income (loss) | 5.16% | | 3.59% | | 3.45% | | 4.13% | | 4.12% |
| Net expenses (c) | 1.38% | | 1.37% | | 1.36% | | 1.36% | | 1.39% |
| Expenses (before waiver/reimbursement) (c) | 1.41% | | 1.37% | | 1.36% | | 1.36% | | 1.39% |
| Portfolio turnover rate | 22% | | 30% | | 47% | | 64% | | 32% |
| Net assets at end of year (in 000’s) | $ 220 | | $ 174 | | $ 158 | | $ 154 | | $ 201 |
| ‡ | Less than one cent per share. |
| (a) | Per share data based on average shares outstanding during the year. |
| (b) | Total investment return is calculated exclusive of sales charges and assumes the reinvestment of dividends and distributions. Class R3 shares are not subject to sales charges. For periods of less than one year, total return is not annualized. |
| (c) | In addition to the fees and expenses which the Fund bears directly, it also indirectly bears a pro-rata share of the fees and expenses of the underlying funds in which it invests. Such indirect expenses are not included in the above expense ratios. |
The notes to the financial statements are an integral part of, and should be read in conjunction with, the financial statements.
| 28 | MainStay MacKay Short Duration High Yield Fund |
Notes to Financial Statements
Note 1-Organization and Business
MainStay Funds Trust (the “Trust”) was organized as a Delaware statutory trust on April 28, 2009. The Trust is registered under the Investment Company Act of 1940, as amended (the “1940 Act”), as an open-end management investment company, and is comprised of thirty-seven funds (collectively referred to as the “Funds”). These financial statements and notes relate to the MainStay MacKay Short Duration High Yield Fund (the "Fund"), a “diversified” fund, as that term is defined in the 1940 Act, as interpreted or modified by regulatory authorities having jurisdiction, from time to time.
The following table lists the Fund's share classes that have been registered and commenced operations:
| Class | Commenced Operations |
| Class A | December 17, 2012 |
| Investor Class | December 17, 2012 |
| Class C | December 17, 2012 |
| Class I | December 17, 2012 |
| Class R2* | December 17, 2012 |
| Class R3* | February 29, 2016 |
| * | As of October 31, 2023, Class R2 and Class R3 shares are closed to new investors and, upon the close of business on December 29, 2023, Class R2 and Class R3 shares are closed to additional investments by existing shareholders. Additionally, Class R2 and Class R3 shares will be liquidated on or about February 28, 2024 (the "Liquidation Date"). It is expected that the Fund will distribute to remaining shareholders invested in Class R2 or Class R3 shares, on or promptly after the Liquidation Date, a liquidating distribution in cash or cash equivalents equal to the net asset value of such shares. |
Class A and Investor Class shares are offered at net asset value (“NAV”) per share plus an initial sales charge. No initial sales charge applies to investments of $250,000 or more (and certain other qualified purchases) in Class A and Investor Class shares. Effective April 15, 2019, a contingent deferred sales charge (“CDSC”) of 1.00% may be imposed on certain redemptions of Class A and Investor Class shares made within 18 months of the date of purchase on shares that were purchased without an initial sales charge. For purchases of Class A and Investor Class shares made from August 1, 2017 through April 14, 2019, a CDSC of 1.00% may be imposed on certain redemptions (for investments of $500,000 which paid no initial sales charge) of such shares within 18 months of the date of purchase on shares that were purchased without an initial sales charge. Class C shares are offered at NAV without an initial sales charge and a 1.00% CDSC may be imposed on certain redemptions of such shares made within 18 months of the date of purchase of Class C shares. Investments in Class C shares are subject to a purchase maximum of $250,000. Class I, Class R2 and Class R3 shares are offered at NAV without a sales charge. Class R6 shares are expected to be offered at NAV without a sales charge if such shares are offered in the future. In addition, depending upon eligibility, Class C shares convert to either Class A or Investor Class shares at the end of the calendar quarter eight years after the date they were purchased. Additionally, Investor Class shares may convert automatically to Class A shares. Under certain circumstances and as may be permitted by the Trust’s multiple class plan
pursuant to Rule 18f-3 under the 1940 Act, specified share classes of the Fund may be converted to one or more other share classes of the Fund as disclosed in the capital share transactions within these Notes. The classes of shares have the same voting (except for issues that relate solely to one class), dividend, liquidation and other rights, and the same terms and conditions, except that under a distribution plan pursuant to Rule 12b-1 under the 1940 Act, Class C shares are subject to higher distribution and/or service fees than Class A, Investor Class, Class R2 and Class R3 shares. Class I and Class R6 shares are not subject to a distribution and/or service fee. Class R2 and Class R3 shares are subject to a shareholder service fee, which is in addition to fees paid under the distribution plans for Class R2 and Class R3 shares.
At a meeting held on September 25-26, 2023, the Board of Trustees (the “Board”) of the Trust, after careful consideration of a number of factors and upon the recommendation of the Fund's investment adviser, New York Life Investment Management LLC (“New York Life Investments” or the "Manager"), approved a proposal to liquidate Class R2 and Class R3 shares of the Fund on or about February 28, 2024, pursuant to the terms of a plan of liquidation.
The Fund's investment objective is to seek high current income. Capital appreciation is a secondary objective.
Note 2–Significant Accounting Policies
The Fund is an investment company and accordingly follows the investment company accounting and reporting guidance of the Financial Accounting Standards Board (“FASB”) Accounting Standards Codification Topic 946 Financial Services—Investment Companies. The Fund prepares its financial statements in accordance with generally accepted accounting principles (“GAAP”) in the United States of America and follows the significant accounting policies described below.
(A) Securities Valuation. Investments are usually valued as of the close of regular trading on the New York Stock Exchange (the "Exchange") (usually 4:00 p.m. Eastern time) on each day the Fund is open for business ("valuation date").
Pursuant to Rule 2a-5 under the 1940 Act, the Board has designated New York Life Investments as its Valuation Designee (the "Valuation Designee"). The Valuation Designee is responsible for performing fair valuations relating to all investments in the Fund’s portfolio for which market quotations are not readily available; periodically assessing and managing material valuation risks; establishing and applying fair value methodologies; testing fair valuation methodologies; evaluating and overseeing pricing services; ensuring appropriate segregation of valuation and portfolio management functions; providing quarterly, annual and prompt reporting to the Board, as appropriate; identifying potential conflicts of interest; and maintaining appropriate records. The Valuation Designee has established a valuation committee ("Valuation Committee") to assist in carrying out the Valuation Designee’s responsibilities and establish prices of securities for which market quotations are not readily available. The Fund's and the Valuation Designee's policies and
Notes to Financial Statements (continued)
procedures ("Valuation Procedures") govern the Valuation Designee’s selection and application of methodologies for determining and calculating the fair value of Fund investments. The Valuation Designee may value the Fund's portfolio securities for which market quotations are not readily available and other Fund assets utilizing inputs from pricing services and other third-party sources. The Valuation Committee meets (in person, via electronic mail or via teleconference) on an ad-hoc basis to determine fair valuations and on a quarterly basis to review fair value events with respect to certain securities for which market quotations are not readily available, including valuation risks and back-testing results, and preview reports to the Board.
The Valuation Committee establishes prices of securities for which market quotations are not readily available based on such methodologies and measurements on a regular basis after considering information that is reasonably available and deemed relevant by the Valuation Committee. The Board shall oversee the Valuation Designee and review fair valuation materials on a prompt, quarterly and annual basis and approve proposed revisions to the Valuation Procedures.
Investments for which market quotations are not readily available are valued at fair value as determined in good faith pursuant to the Valuation Procedures. A market quotation is readily available only when that quotation is a quoted price (unadjusted) in active markets for identical investments that the Fund can access at the measurement date, provided that a quotation will not be readily available if it is not reliable. "Fair value" is defined as the price the Fund would reasonably expect to receive upon selling an asset or liability in an orderly transaction to an independent buyer in the principal or most advantageous market for the asset or liability. Fair value measurements are determined within a framework that establishes a three-tier hierarchy that maximizes the use of observable market data and minimizes the use of unobservable inputs to establish a classification of fair value measurements for disclosure purposes. "Inputs" refer broadly to the assumptions that market participants would use in pricing the asset or liability, including assumptions about risk, such as the risk inherent in a particular valuation technique used to measure fair value using a pricing model and/or the risk inherent in the inputs for the valuation technique. Inputs may be observable or unobservable. Observable inputs reflect the assumptions market participants would use in pricing the asset or liability based on market data obtained from sources independent of the Fund. Unobservable inputs reflect the Fund’s own assumptions about the assumptions market participants would use in pricing the asset or liability based on the information available. The inputs or methodology used for valuing assets or liabilities may not be an indication of the risks associated with investing in those assets or liabilities. The three-tier hierarchy of inputs is summarized below.
| • | Level 1—quoted prices (unadjusted) in active markets for an identical asset or liability |
| • | Level 2—other significant observable inputs (including quoted prices for a similar asset or liability in active markets, interest rates and yield curves, prepayment speeds, credit risk, etc.) |
| • | Level 3—significant unobservable inputs (including the Fund's own assumptions about the assumptions that market participants would use in measuring fair value of an asset or liability) |
The level of an asset or liability within the fair value hierarchy is based on the lowest level of an input, both individually and in the aggregate, that is significant to the fair value measurement. The aggregate value by input level of the Fund’s assets and liabilities as of October 31, 2023, is included at the end of the Portfolio of Investments.
The Fund may use third-party vendor evaluations, whose prices may be derived from one or more of the following standard inputs, among others:
| • Benchmark yields | • Reported trades |
| • Broker/dealer quotes | • Issuer spreads |
| • Two-sided markets | • Benchmark securities |
| • Bids/offers | • Reference data (corporate actions or material event notices) |
| • Industry and economic events | • Comparable bonds |
| • Monthly payment information | |
An asset or liability for which a market quotation is not readily available is valued by methods deemed reasonable in good faith by the Valuation Committee, following the Valuation Procedures to represent fair value. Under these procedures, the Valuation Designee generally uses a market-based approach which may use related or comparable assets or liabilities, recent transactions, market multiples, book values and other relevant information. The Valuation Designee may also use an income-based valuation approach in which the anticipated future cash flows of the asset or liability are discounted to calculate fair value. Discounts may also be applied due to the nature and/or duration of any restrictions on the disposition of the asset or liability. Fair value represents a good faith approximation of the value of a security. Fair value determinations involve the consideration of a number of subjective factors, an analysis of applicable facts and circumstances and the exercise of judgment. As a result, it is possible that the fair value for a security determined in good faith in accordance with the Valuation Procedures may differ from valuations for the same security determined for other funds using their own valuation procedures. Although the Valuation Procedures are designed to value a security at the price the Fund may reasonably expect to receive upon the security's sale in an orderly transaction, there can be no assurance that any fair value determination thereunder would, in fact, approximate the amount that the Fund would actually realize upon the sale of the security or the price at which the security would trade if a reliable market price were readily available. During the year ended October 31, 2023, there were no material changes to the fair value methodologies.
Securities which may be valued in this manner include, but are not limited to: (i) a security for which trading has been halted or suspended or otherwise does not have a readily available market quotation on a given day; (ii) a debt security that has recently gone into default and for which there is not a current market quotation; (iii) a security of an issuer that has entered into a restructuring; (iv) a security that has been delisted
| 30 | MainStay MacKay Short Duration High Yield Fund |
from a national exchange; (v) a security subject to trading collars for which no or limited trading takes place; and (vi) a security whose principal market has been temporarily closed at a time when, under normal conditions, it would be open. Securities valued in this manner are generally categorized as Level 2 or 3 in the hierarchy. As of October 31, 2023, securities that were fair valued in such a manner are shown in the Portfolio of Investments.
Equity securities, rights and warrants, if applicable, are valued at the last quoted sales prices as of the close of regular trading on the relevant exchange on each valuation date. Securities that are not traded on the valuation date are valued at the mean of the last quoted bid and ask prices. Prices are normally taken from the principal market in which each security trades. These securities are generally categorized as Level 1 in the hierarchy.
Debt securities (other than convertible and municipal bonds) are valued at the evaluated bid prices (evaluated mean prices in the case of convertible and municipal bonds) supplied by a pricing agent or broker selected by the Valuation Designee, in consultation with the Subadvisor. The evaluations are market-based measurements processed through a pricing application and represents the pricing agent’s good faith determination as to what a holder may receive in an orderly transaction under market conditions. The rules-based logic utilizes valuation techniques that reflect participants’ assumptions and vary by asset class and per methodology, maximizing the use of relevant observable data including quoted prices for similar assets, benchmark yield curves and market corroborated inputs. The evaluated bid or mean prices are deemed by the Valuation Designee, in consultation with the Subadvisor, to be representative of market values at the regular close of trading of the Exchange on each valuation date. Debt securities purchased on a delayed delivery basis are marked to market daily until settlement at the forward settlement date. Debt securities, including corporate bonds, U.S. government and federal agency bonds, municipal bonds, foreign bonds, convertible bonds, asset-backed securities and mortgage-backed securities are generally categorized as Level 2 in the hierarchy.
Loan assignments, participations and commitments are valued at the average of bid quotations obtained from the engaged independent pricing service and are generally categorized as Level 2 in the hierarchy. Certain loan assignments, participations and commitments may be valued by utilizing significant unobservable inputs obtained from the pricing service and are generally categorized as Level 3 in the hierarchy. No securities held by the Fund as of October 31, 2023 were fair valued utilizing significant unobservable inputs obtained from the pricing service.
The information above is not intended to reflect an exhaustive list of the methodologies that may be used to value portfolio investments. The Valuation Procedures permit the use of a variety of valuation methodologies in connection with valuing portfolio investments. The methodology used for a specific type of investment may vary based on the market data available or other considerations. The methodologies summarized above may not represent the specific means by which portfolio investments are valued on any particular business day.
A portfolio investment may be classified as an illiquid investment under the Trust's written liquidity risk management program and related procedures (“Liquidity Program”). Illiquidity of an investment might prevent the sale of such investment at a time when the Manager or the Subadvisor might wish to sell, and these investments could have the effect of decreasing the overall level of the Fund's liquidity. Further, the lack of an established secondary market may make it more difficult to value illiquid investments, requiring the Fund to rely on judgments that may be somewhat subjective in measuring value, which could vary materially from the amount that the Fund could realize upon disposition. Difficulty in selling illiquid investments may result in a loss or may be costly to the Fund. An illiquid investment is any investment that the Manager or Subadvisor reasonably expects cannot be sold or disposed of in current market conditions in seven calendar days or less without the sale or disposition significantly changing the market value of the investment. The liquidity classification of each investment will be made using information obtained after reasonable inquiry and taking into account, among other things, relevant market, trading and investment-specific considerations in accordance with the Liquidity Program. Illiquid investments are often fair valued in accordance with the Fund's procedures described above. The liquidity of the Fund's investments was determined as of October 31, 2023, and can change at any time. Illiquid investments as of October 31, 2023, are shown in the Portfolio of Investments.
(B) Income Taxes. The Fund's policy is to comply with the requirements of the Internal Revenue Code of 1986, as amended (the “Internal Revenue Code”), applicable to regulated investment companies and to distribute all of its taxable income to the shareholders of the Fund within the allowable time limits.
The Manager evaluates the Fund’s tax positions to determine if the tax positions taken meet the minimum recognition threshold in connection with accounting for uncertainties in income tax positions taken or expected to be taken for the purposes of measuring and recognizing tax liabilities in the financial statements. Recognition of tax benefits of an uncertain tax position is permitted only to the extent the position is “more likely than not” to be sustained assuming examination by taxing authorities. The Manager analyzed the Fund's tax positions taken on federal, state and local income tax returns for all open tax years (for up to three tax years) and has concluded that no provisions for federal, state and local income tax are required in the Fund's financial statements. The Fund's federal, state and local income tax and federal excise tax returns for tax years for which the applicable statutes of limitations have not expired are subject to examination by the Internal Revenue Service and state and local departments of revenue.
(C) Dividends and Distributions to Shareholders. Dividends and distributions are recorded on the ex-dividend date. The Fund intends to declare and pay dividends from net investment income, if any, at least monthly and distributions from net realized capital and currency gains, if any, at least annually. Unless a shareholder elects otherwise, all dividends and distributions are reinvested at NAV in the same class of shares of the
Notes to Financial Statements (continued)
Fund. Dividends and distributions to shareholders are determined in accordance with federal income tax regulations and may differ from determinations using GAAP.
(D) Security Transactions and Investment Income. The Fund records security transactions on the trade date. Realized gains and losses on security transactions are determined using the identified cost method. Dividend income is recognized on the ex-dividend date, net of any foreign tax withheld at the source, and interest income is accrued as earned using the effective interest rate method. Distributions received from real estate investment trusts may be classified as dividends, capital gains and/or return of capital. Discounts and premiums on securities purchased for the Fund are accreted and amortized, respectively, on the effective interest rate method. Income from payment-in-kind securities is accreted daily based on the effective interest method.
Investment income and realized and unrealized gains and losses on investments of the Fund are allocated pro rata to the separate classes of shares based upon their relative net assets on the date the income is earned or realized and unrealized gains and losses are incurred.
The Fund may place a debt security on non-accrual status and reduce related interest income by ceasing current accruals and writing off all or a portion of any interest receivables when the collection of all or a portion of such interest has become doubtful. A debt security is removed from non-accrual status when the issuer resumes interest payments or when collectability of interest is reasonably assured.
(E) Expenses. Expenses of the Trust are allocated to the individual Funds in proportion to the net assets of the respective Funds when the expenses are incurred, except where direct allocations of expenses can be made. Expenses (other than transfer agent expenses and fees incurred under the shareholder services plans and/or the distribution plans further discussed in Note 3(B)) are allocated to separate classes of shares pro rata based upon their relative net assets on the date the expenses are incurred. The expenses borne by the Fund, including those of related parties to the Fund, are shown in the Statement of Operations.
(F) Use of Estimates. In preparing financial statements in conformity with GAAP, the Manager makes estimates and assumptions that affect the reported amounts and disclosures in the financial statements. Actual results could differ from those estimates and assumptions.
(G) Loan Assignments, Participations and Commitments. The Fund may invest in loan assignments and participations ("loans"). Commitments are agreements to make money available to a borrower in a specified amount, at a specified rate and within a specified time. The Fund records an investment when the borrower withdraws money on a commitment or when a funded loan is purchased (trade date) and records interest as earned. These loans pay interest at rates that are periodically reset by reference to a base lending rate plus a spread. These base lending rates are generally the prime rate offered by a designated U.S. bank, the Secured Overnight Financing Rate ("SOFR") or an alternative reference rate.
The loans in which the Fund may invest are generally readily marketable, but may be subject to some restrictions on resale. For example, the Fund may be contractually obligated to receive approval from the agent bank and/or borrower prior to the sale of these investments. If the Fund purchases an assignment from a lender, the Fund will generally have direct contractual rights against the borrower in favor of the lender. If the Fund purchases a participation interest either from a lender or a participant, the Fund typically will have established a direct contractual relationship with the seller of the participation interest, but not with the borrower. Consequently, the Fund is subject to the credit risk of the lender or participant who sold the participation interest to the Fund, in addition to the usual credit risk of the borrower. In the event that the borrower, selling participant or intermediate participants become insolvent or enter into bankruptcy, the Fund may incur certain costs and delays in realizing payment, or may suffer a loss of principal and/or interest.
Unfunded commitments represent the remaining obligation of the Fund to the borrower. At any point in time, up to the maturity date of the issue, the borrower may demand the unfunded portion. Unfunded amounts, if any, are marked to market and any unrealized gains or losses are recorded in the Statement of Assets and Liabilities. As of October 31, 2023, the Fund did not hold any unfunded commitments.
(H) Debt Securities Risk. The ability of issuers of debt securities held by the Fund to meet their obligations may be affected by, among other things, economic or political developments in a specific country, industry or region. Debt securities are also subject to the risks associated with changes in interest rates. The Fund primarily invests in high-yield debt securities (commonly referred to as “junk bonds”), which are considered speculative because they present a greater risk of loss, including default, than higher rated debt securities. These securities pay investors a premium—a higher interest rate or yield than investment grade debt securities—because of the increased risk of loss. These securities can also be subject to greater price volatility. In times of unusual or adverse market, economic or political conditions, these securities may experience higher than normal default rates.
The loans in which the Fund invests are usually rated below investment grade, or if unrated, determined by the Subadvisor to be of comparable quality (commonly referred to as “junk bonds”) and are generally considered speculative because they present a greater risk of loss, including default, than higher quality debt securities. Moreover, such securities may, under certain circumstances, be particularly susceptible to liquidity and valuation risks.
Although certain loans are collateralized, there is no guarantee that the value of the collateral will be sufficient to repay the loan. In a recession or serious credit event, the value of these investments could decline significantly. As a result, the Fund’s NAVs could go down and you could lose money.
In addition, loans generally are subject to extended settlement periods that may be longer than seven days. As a result, the Fund may be adversely affected by selling other investments at an unfavorable time
| 32 | MainStay MacKay Short Duration High Yield Fund |
and/or under unfavorable conditions or engaging in borrowing transactions, such as borrowing against its credit facility, to raise cash to meet redemption obligations or pursue other investment opportunities.
In certain circumstances, loans may not be deemed to be securities. As a result, the Fund may not have the protection of the anti-fraud provisions of the federal securities laws. In such cases, the Fund generally must rely on the contractual provisions in the loan agreement and common-law fraud protections under applicable state law.
(I) LIBOR Replacement Risk. The Fund may invest in certain debt securities, derivatives or other financial instruments that have relied or continue to rely on LIBOR, as a “benchmark” or “reference rate” for various interest rate calculations. As of January 1, 2022, the United Kingdom Financial Conduct Authority ("FCA"), which regulates LIBOR, ceased its active encouragement of banks to provide the quotations needed to sustain most LIBOR rates due to the absence of an active market for interbank unsecured lending and other reasons. In connection with supervisory guidance from U.S. regulators, certain U.S. regulated entities have generally ceased to enter into certain new LIBOR contracts after January 1, 2022. On March 15, 2022, the Adjustable Interest Rate (LIBOR) Act was signed into law. This law provides a statutory fallback mechanism on a nationwide basis to replace LIBOR with a benchmark rate that is selected by the Board of Governors of the Federal Reserve System and based on Secured Overnight Financing Rate ("SOFR") (which measures the cost of overnight borrowings through repurchase agreement transactions collateralized with U.S. Treasury securities) for tough legacy contracts. On February 27, 2023, the Federal Reserve System’s final rule in connection with this law became effective, establishing benchmark replacements based on SOFR and Term SOFR (a forward-looking measurement of market expectations of SOFR implied from certain derivatives markets) for applicable tough legacy contracts governed by U.S. law. In addition, the FCA has announced that it will require the publication of synthetic LIBOR for the one-month, three-month and six-month U.S. Dollar LIBOR settings after June 30, 2023 through at least September 30, 2024. Certain of the Fund's investments may involve individual tough legacy contracts which may be subject to the Adjustable Interest Rate (LIBOR) Act or synthetic LIBOR and no assurances can be given that these measures will have had the intended effects. Although the transition process away from LIBOR for many instruments has been completed, some LIBOR use is continuing and there are potential effects related to the transition away from LIBOR or continued use of LIBOR on the Fund.
The elimination of LIBOR or changes to other reference rates or any other changes or reforms to the determination or supervision of reference rates could have an adverse impact on the market for, or value of, any securities or payments linked to those reference rates, which may adversely affect the Fund's performance and/or net asset value. It could also lead to a reduction in the interest rates on, and the value of, some LIBOR-based investments and reduce the effectiveness of hedges mitigating risk in connection with LIBOR-based investments. Uncertainty and risk also remain regarding the willingness and ability of issuers and
lenders to include enhanced provisions in new and existing contracts or instruments. Consequently, the transition away from LIBOR to other reference rates may lead to increased volatility and illiquidity in markets that are tied to LIBOR, fluctuations in values of LIBOR-related investments or investments in issuers that utilize LIBOR, increased difficulty in borrowing or refinancing and diminished effectiveness of hedging strategies, adversely affecting the Fund's performance. Furthermore, the risks associated with the expected discontinuation of LIBOR and transition may be exacerbated if the work necessary to effect an orderly transition to an alternative reference rate is not completed in a timely manner. The usefulness of LIBOR as a benchmark could deteriorate anytime during this transition period. Any such effects of the transition process, including unforeseen effects, could result in losses to the Fund.
(J) Indemnifications. Under the Trust’s organizational documents, its officers and trustees are indemnified against certain liabilities that may arise out of performance of their duties to the Trust. Additionally, in the normal course of business, the Fund enters into contracts with third-party service providers that contain a variety of representations and warranties and that may provide general indemnifications. The Fund's maximum exposure under these arrangements is unknown, as this would involve future claims that may be made against the Fund that have not yet occurred. The Manager believes that the risk of loss in connection with these potential indemnification obligations is remote. However, there can be no assurance that material liabilities related to such obligations will not arise in the future, which could adversely impact the Fund.
Note 3–Fees and Related Party Transactions
(A) Manager and Subadvisor. New York Life Investments, a registered investment adviser and an indirect, wholly-owned subsidiary of New York Life Insurance Company ("New York Life"), serves as the Fund's Manager, pursuant to an Amended and Restated Management Agreement ("Management Agreement"). The Manager provides offices, conducts clerical, recordkeeping and bookkeeping services and keeps most of the financial and accounting records required to be maintained by the Fund. Except for the portion of salaries and expenses that are the responsibility of the Fund, the Manager pays the salaries and expenses of all personnel affiliated with the Fund and certain operational expenses of the Fund. The Fund reimburses New York Life Investments in an amount equal to the portion of the compensation of the Chief Compliance Officer attributable to the Fund. MacKay Shields LLC ("MacKay Shields" or the "Subadvisor"), a registered investment adviser and an indirect, wholly-owned subsidiary of New York Life, serves as the Subadvisor to the Fund and is responsible for the day-to-day portfolio management of the Fund. Pursuant to the terms of an Amended and Restated Subadvisory Agreement ("Subadvisory Agreement") between New York Life Investments and MacKay Shields, New York Life Investments pays for the services of the Subadvisor.
Pursuant to the Management Agreement, the Fund pays the Manager a monthly fee for the services performed and the facilities furnished at an annual rate of 0.65% of the Fund's average daily net assets.
Notes to Financial Statements (continued)
New York Life Investments has contractually agreed to waive fees and/or reimburse expenses so that the Total Annual Operating Expenses (excluding taxes, interest, litigation, extraordinary expenses, brokerage and other transaction expenses relating to the purchase or sale of portfolio investments and acquired (underlying) fund fees and expenses) do not exceed the following percentages of average daily net assets: Class A, 1.02%; Investor Class, 1.13%; Class C, 1.88%; Class I, 0.78%; Class R2, 1.13% and Class R3, 1.38%. This agreement will remain in effect until February 28, 2024, and shall renew automatically for one-year terms unless New York Life Investments provides written notice of termination prior to the start of the next term or upon approval of the Board.
During the year ended October 31, 2023, New York Life Investments earned fees from the Fund in the amount of $10,902,096 and waived fees and/or reimbursed certain class specific expenses in the amount of $490,517 and paid the Subadvisor fees in the amount of $5,205,790.
JPMorgan provides sub-administration and sub-accounting services to the Fund pursuant to an agreement with New York Life Investments. These services include calculating the daily NAVs of the Fund, maintaining the general ledger and sub-ledger accounts for the calculation of the Fund's NAVs, and assisting New York Life Investments in conducting various aspects of the Fund's administrative operations. For providing these services to the Fund, JPMorgan is compensated by New York Life Investments.
Pursuant to an agreement between the Trust and New York Life Investments, New York Life Investments is responsible for providing or procuring certain regulatory reporting services for the Fund. The Fund will reimburse New York Life Investments for the actual costs incurred by New York Life Investments in connection with providing or procuring these services for the Fund.
(B) Distribution and Service Fees. The Trust, on behalf of the Fund, has entered into a distribution agreement with NYLIFE Distributors LLC (the “Distributor”), an affiliate of New York Life Investments. The Fund has adopted distribution plans (the “Plans”) in accordance with the provisions of Rule 12b-1 under the 1940 Act.
Pursuant to the Class A, Investor Class and Class R2 Plans, the Distributor receives a monthly fee from the Class A, Investor Class and Class R2 shares at an annual rate of 0.25% of the average daily net assets of the Class A, Investor Class and Class R2 shares for distribution and/or service activities as designated by the Distributor. Pursuant to the Class C Plan, Class C shares pay the Distributor a monthly distribution fee at an annual rate of 0.75% of the average daily net assets of the Class C shares, along with a service fee at an annual rate of 0.25% of the average daily net assets of the Class C shares, for a total 12b-1 fee of 1.00%. Pursuant to the Class R3 Plan, Class R3 shares pay the Distributor a monthly distribution fee at an annual rate of 0.25% of the average daily net assets of the Class R3 shares, along with a service fee at an annual rate of 0.25% of the average daily net assets of the
Class R3 shares, for a total 12b-1 fee of 0.50%. Class I shares are not subject to a distribution and/or service fee.
The Plans provide that the distribution and service fees are payable to the Distributor regardless of the amounts actually expended by the Distributor for distribution of the Fund's shares and service activities.
In accordance with the Shareholder Services Plans for the Class R2 and Class R3 shares, the Manager has agreed to provide, through its affiliates or independent third parties, various shareholder and administrative support services to shareholders of the Class R2 and Class R3 shares. For its services, the Manager, its affiliates or independent third-party service providers are entitled to a shareholder service fee accrued daily and paid monthly at an annual rate of 0.10% of the average daily net assets of the Class R2 and Class R3 shares. This is in addition to any fees paid under the Class R2 and Class R3 Plans.
During the year ended October 31, 2023, shareholder service fees incurred by the Fund were as follows:
(C) Sales Charges. The Fund was advised by the Distributor that the amount of initial sales charges retained on sales of Class A and Investor Class shares during the year ended October 31, 2023, were $23,695 and $508, respectively.
The Fund was also advised that the Distributor retained CDSCs on redemptions of Class A and Class C shares during the year ended October 31, 2023, of $24,649 and $7,380, respectively.
(D) Transfer, Dividend Disbursing and Shareholder Servicing Agent. NYLIM Service Company LLC, an affiliate of New York Life Investments, is the Fund's transfer, dividend disbursing and shareholder servicing agent pursuant to an agreement between NYLIM Service Company LLC and the Trust. NYLIM Service Company LLC has entered into an agreement with SS&C Global Investor & Distribution Solutions, Inc. ("SS&C"), pursuant to which SS&C performs certain transfer agent services on behalf of NYLIM Service Company LLC. New York Life Investments has contractually agreed to limit the transfer agency expenses charged to the Fund’s share classes to a maximum of 0.35% of that share class’s average daily net assets on an annual basis after deducting any applicable Fund or class-level expense reimbursement or small account fees. This agreement will remain in effect until February 28, 2024, and shall renew automatically for one-year terms unless New York Life Investments provides written notice of termination prior to the start of the next term or upon approval of the Board. During the year ended October 31, 2023, transfer agent expenses incurred by the Fund
| 34 | MainStay MacKay Short Duration High Yield Fund |
and any reimbursements, pursuant to the aforementioned Transfer Agency expense limitation agreement, were as follows:
| Class | Expense | Waived |
| Class A | $ 388,176 | $— |
| Investor Class | 9,538 | — |
| Class C | 48,272 | — |
| Class I | 1,670,890 | — |
| Class R2 | 726 | — |
| Class R3 | 260 | — |
(E) Small Account Fee. Shareholders with small accounts adversely impact the cost of providing transfer agency services. In an effort to reduce total transfer agency expenses, the Fund has implemented a small account fee on certain types of accounts. As described in the Fund's prospectus, certain shareholders with an account balance of less than $1,000 ($5,000 for Class A share accounts) are charged an annual per account fee of $20 (assessed semi-annually), the proceeds from which offset transfer agent fees as reflected in the Statement of Operations. This small account fee will not apply to certain types of accounts as described further in the Fund’s prospectus.
(F) Capital. As of October 31, 2023, New York Life and its affiliates beneficially held shares of the Fund with the values and percentages of net assets as follows:
| Class A | $6,012,519 | 1.8% |
| Class I | 5,929,839 | 0.4 |
| Class R2 | 36,956 | 4.9 |
| Class R3 | 34,027 | 15.5 |
Note 4-Federal Income Tax
As of October 31, 2023, the cost and unrealized appreciation (depreciation) of the Fund’s investment portfolio, including applicable derivative contracts and other financial instruments, as determined on a federal income tax basis, were as follows:
| | Federal Tax
Cost | Gross
Unrealized
Appreciation | Gross
Unrealized
(Depreciation) | Net
Unrealized
Appreciation/
(Depreciation) |
| Investments in Securities | $1,825,985,073 | $11,881,590 | $(71,174,421) | $(59,292,831) |
As of October 31, 2023, the components of accumulated gain (loss) on a tax basis were as follows:
Ordinary
Income | Accumulated
Capital
and Other
Gain (Loss) | Other
Temporary
Differences | Unrealized
Appreciation
(Depreciation) | Total
Accumulated
Gain (Loss) |
| $1,735,737 | $(75,137,122) | $(1,078,869) | $(59,292,831) | $(133,773,085) |
The difference between book-basis and tax-basis unrealized appreciation (depreciation) is primarily due to distributions payable.
As of October 31, 2023, for federal income tax purposes, capital loss carryforwards of $75,137,122, as shown in the table below, were available to the extent provided by the regulations to offset future realized gains of the Fund. Accordingly, no capital gains distributions are expected to be paid to shareholders until net gains have been realized in excess of such amounts.
Capital Loss
Available Through | Short-Term
Capital Loss
Amounts (000’s) | Long-Term
Capital Loss
Amounts (000’s) |
| Unlimited | $22,986 | $52,151 |
During the years ended October 31, 2023 and October 31, 2022, the tax character of distributions paid as reflected in the Statements of Changes in Net Assets was as follows:
| | 2023 | 2022 |
| Distributions paid from: | | |
| Ordinary Income | $96,946,988 | $60,595,422 |
Note 5–Restricted Securities
Restricted securities are subject to legal or contractual restrictions on resale. Private placement securities are generally considered to be restricted except for those securities traded between qualified institutional investors under the provisions of Rule 144A of the Securities Act of 1933, as amended. Disposal of restricted securities may involve time consuming negotiations and expenses, and prompt sale at an acceptable price may be difficult to achieve.
Notes to Financial Statements (continued)
As of October 31, 2023, restricted securities held by the Fund were as follows:
| Security | Date(s) of
Acquisition | Principal
Amount/
Shares | Cost | 10/31/23
Value | Percent of
Net Assets |
| Briggs & Stratton Corp. Escrow Claim Shares |
Corporate Bond
6.875%, due 12/15/20 | 2/26/21 | $ 3,425,000 | $ 3,724,482 | $ — | 0.0% |
| GenOn Energy, Inc. |
| Common Stock | 12/14/18 | 20,915 | 2,342,005 | 1,599,998 | 0.1 |
| Sterling Entertainment Enterprises LLC |
Corporate Bond
10.25%, due 1/15/25 | 12/28/17 | $ 3,000,000 | 2,989,837 | 2,707,200 | 0.1 |
| Total | | | $ 9,056,324 | $ 4,307,198 | 0.2% |
Note 6–Custodian
JPMorgan is the custodian of cash and securities held by the Fund. Custodial fees are charged to the Fund based on the Fund's net assets and/or the market value of securities held by the Fund and the number of certain transactions incurred by the Fund.
Note 7–Line of Credit
The Fund and certain other funds managed by New York Life Investments maintain a line of credit with a syndicate of banks in order to secure a source of funds for temporary purposes to meet unanticipated or excessive redemption requests.
Effective July 25, 2023, under the credit agreement (the “Credit Agreement”), the aggregate commitment amount is $600,000,000 with an additional uncommitted amount of $100,000,000. The commitment fee is an annual rate of 0.15% of the average commitment amount payable quarterly, regardless of usage, to JPMorgan, who serves as the agent to the syndicate. The commitment fee is allocated among the Fund and certain other funds managed by New York Life Investments based upon their respective net assets and other factors. Interest on any revolving credit loan is charged based upon the Federal Funds Rate, Daily Simple SOFR + 0.10%, or the Overnight Bank Funding Rate, whichever is higher. The Credit Agreement expires on July 23, 2024, although the Fund, certain other funds managed by New York Life Investments and the syndicate of banks may renew the Credit Agreement for an additional year on the same or different terms or enter into a credit agreement with a different syndicate of banks. Prior to July 25, 2023, the aggregate commitment amount and the commitment fee were the same as those under the current Credit Agreement. During the year ended October 31, 2023, there were no borrowings made or outstanding with respect to the Fund under the Credit Agreement.
Note 8–Interfund Lending Program
Pursuant to an exemptive order issued by the SEC, the Fund, along with certain other funds managed by New York Life Investments, may participate in an interfund lending program. The interfund lending program provides an alternative credit facility that permits the Fund and
certain other funds managed by New York Life Investments to lend or borrow money for temporary purposes directly to or from one another, subject to the conditions of the exemptive order. During the year ended October 31, 2023, there were no interfund loans made or outstanding with respect to the Fund.
Note 9–Purchases and Sales of Securities (in 000’s)
During the year ended October 31, 2023, purchases and sales of securities, other than short-term securities, were $825,426 and $345,710, respectively.
Note 10–Capital Share Transactions
Transactions in capital shares for the years ended October 31, 2023 and October 31, 2022, were as follows:
| Class A | Shares | Amount |
| Year ended October 31, 2023: | | |
| Shares sold | 11,152,609 | $ 103,171,985 |
| Shares issued to shareholders in reinvestment of distributions | 1,700,212 | 15,715,196 |
| Shares redeemed | (10,382,531) | (95,962,463) |
| Net increase (decrease) in shares outstanding before conversion | 2,470,290 | 22,924,718 |
| Shares converted into Class A (See Note 1) | 141,358 | 1,307,397 |
| Shares converted from Class A (See Note 1) | (11,736) | (108,177) |
| Net increase (decrease) | 2,599,912 | $ 24,123,938 |
| Year ended October 31, 2022: | | |
| Shares sold | 10,759,390 | $ 102,085,502 |
| Shares issued to shareholders in reinvestment of distributions | 1,197,905 | 11,220,427 |
| Shares redeemed | (9,890,216) | (93,600,874) |
| Net increase (decrease) in shares outstanding before conversion | 2,067,079 | 19,705,055 |
| Shares converted into Class A (See Note 1) | 204,711 | 1,935,164 |
| Shares converted from Class A (See Note 1) | (47,057) | (443,280) |
| Net increase (decrease) | 2,224,733 | $ 21,196,939 |
| |
| 36 | MainStay MacKay Short Duration High Yield Fund |
| Investor Class | Shares | Amount |
| Year ended October 31, 2023: | | |
| Shares sold | 67,150 | $ 621,181 |
| Shares issued to shareholders in reinvestment of distributions | 30,998 | 286,556 |
| Shares redeemed | (96,228) | (889,274) |
| Net increase (decrease) in shares outstanding before conversion | 1,920 | 18,463 |
| Shares converted into Investor Class (See Note 1) | 26,620 | 246,344 |
| Shares converted from Investor Class (See Note 1) | (45,322) | (418,984) |
| Net increase (decrease) | (16,782) | $ (154,177) |
| Year ended October 31, 2022: | | |
| Shares sold | 158,271 | $ 1,508,923 |
| Shares issued to shareholders in reinvestment of distributions | 23,312 | 218,463 |
| Shares redeemed | (91,983) | (868,082) |
| Net increase (decrease) in shares outstanding before conversion | 89,600 | 859,304 |
| Shares converted into Investor Class (See Note 1) | 31,348 | 295,183 |
| Shares converted from Investor Class (See Note 1) | (114,600) | (1,084,877) |
| Net increase (decrease) | 6,348 | $ 69,610 |
| |
| Class C | Shares | Amount |
| Year ended October 31, 2023: | | |
| Shares sold | 1,475,489 | $ 13,628,109 |
| Shares issued to shareholders in reinvestment of distributions | 119,409 | 1,103,667 |
| Shares redeemed | (1,058,198) | (9,773,443) |
| Net increase (decrease) in shares outstanding before conversion | 536,700 | 4,958,333 |
| Shares converted from Class C (See Note 1) | (113,708) | (1,051,200) |
| Net increase (decrease) | 422,992 | $ 3,907,133 |
| Year ended October 31, 2022: | | |
| Shares sold | 484,002 | $ 4,528,538 |
| Shares issued to shareholders in reinvestment of distributions | 84,579 | 793,895 |
| Shares redeemed | (1,240,110) | (11,709,219) |
| Net increase (decrease) in shares outstanding before conversion | (671,529) | (6,386,786) |
| Shares converted from Class C (See Note 1) | (117,521) | (1,109,859) |
| Net increase (decrease) | (789,050) | $ (7,496,645) |
| |
| Class I | Shares | Amount |
| Year ended October 31, 2023: | | |
| Shares sold | 107,578,702 | $ 995,906,069 |
| Shares issued to shareholders in reinvestment of distributions | 7,535,877 | 69,688,085 |
| Shares redeemed | (67,346,456) | (622,749,207) |
| Net increase (decrease) in shares outstanding before conversion | 47,768,123 | 442,844,947 |
| Shares converted into Class I (See Note 1) | 11,944 | 110,187 |
| Shares converted from Class I (See Note 1) | (9,206) | (85,567) |
| Net increase (decrease) | 47,770,861 | $ 442,869,567 |
| Year ended October 31, 2022: | | |
| Shares sold | 74,265,593 | $ 701,221,844 |
| Shares issued to shareholders in reinvestment of distributions | 4,416,935 | 41,443,426 |
| Shares redeemed | (81,546,049) | (767,067,867) |
| Net increase (decrease) in shares outstanding before conversion | (2,863,521) | (24,402,597) |
| Shares converted into Class I (See Note 1) | 46,364 | 437,491 |
| Shares converted from Class I (See Note 1) | (3,295) | (29,822) |
| Net increase (decrease) | (2,820,452) | $ (23,994,928) |
| |
| Class R2 | Shares | Amount |
| Year ended October 31, 2023: | | |
| Shares sold | 26,857 | $ 250,837 |
| Shares issued to shareholders in reinvestment of distributions | 3,492 | 32,277 |
| Shares redeemed | (2,509) | (23,182) |
| Net increase (decrease) | 27,840 | $ 259,932 |
| Year ended October 31, 2022: | | |
| Shares sold | 2,492 | $ 23,414 |
| Shares issued to shareholders in reinvestment of distributions | 2,123 | 19,878 |
| Shares redeemed | (1,892) | (17,723) |
| Net increase (decrease) | 2,723 | $ 25,569 |
| |
| Class R3 | Shares | Amount |
| Year ended October 31, 2023: | | |
| Shares sold | 3,737 | $ 34,369 |
| Shares issued to shareholders in reinvestment of distributions | 1,126 | 10,407 |
| Shares redeemed | (142) | (1,320) |
| Net increase (decrease) | 4,721 | $ 43,456 |
| Year ended October 31, 2022: | | |
| Shares sold | 2,515 | $ 22,988 |
| Shares issued to shareholders in reinvestment of distributions | 633 | 5,928 |
| Net increase (decrease) | 3,148 | $ 28,916 |
Note 11–Other Matters
As of the date of this report, the Fund faces a heightened level of risk associated with current uncertainty, volatility and state of economies, financial markets, rising interest rates, and labor and health conditions
Notes to Financial Statements (continued)
around the world. Events such as war, acts of terrorism, recessions, rapid inflation, the imposition of international sanctions, earthquakes, hurricanes, epidemics and pandemics and other unforeseen natural or human disasters may have broad adverse social, political and economic effects on the global economy, which could negatively impact the value of the Fund's investments. Developments that disrupt global economies and financial markets may magnify factors that affect the Fund's performance.
Note 12–Subsequent Events
In connection with the preparation of the financial statements of the Fund as of and for the year ended October 31, 2023, events and transactions subsequent to October 31, 2023, through the date the financial statements were issued, have been evaluated by the Manager for possible adjustment and/or disclosure. No subsequent events requiring financial statement adjustment or disclosure have been identified.
| 38 | MainStay MacKay Short Duration High Yield Fund |
Report of Independent Registered Public Accounting Firm
To the Shareholders of the Fund and Board of Trustees
MainStay Funds Trust:
Opinion on the Financial Statements
We have audited the accompanying statement of assets and liabilities of MainStay MacKay Short Duration High Yield Fund (the Fund), one of the funds constituting MainStay Funds Trust, including the portfolio of investments, as of October 31, 2023, the related statement of operations for the year then ended, the statements of changes in net assets for each of the years in the two-year period then ended, and the related notes (collectively, the financial statements) and the financial highlights for each of the years in the five-year period then ended. In our opinion, the financial statements and financial highlights present fairly, in all material respects, the financial position of the Fund as of October 31, 2023, the results of its operations for the year then ended, the changes in its net assets for each of the years in the two-year period then ended, and the financial highlights for each of the years in the five-year period then ended, in conformity with U.S. generally accepted accounting principles.
Basis for Opinion
These financial statements and financial highlights are the responsibility of the Fund's management. Our responsibility is to express an opinion on these financial statements and financial highlights based on our audits. We are a public accounting firm registered with the Public Company Accounting Oversight Board (United States) (PCAOB) and are required to be independent with respect to the Fund in accordance with the U.S. federal securities laws and the applicable rules and regulations of the Securities and Exchange Commission and the PCAOB.
We conducted our audits in accordance with the standards of the PCAOB. Those standards require that we plan and perform the audit to obtain reasonable assurance about whether the financial statements and financial highlights are free of material misstatement, whether due to error or fraud. Our audits included performing procedures to assess the risks of material misstatement of the financial statements and financial highlights, whether due to error or fraud, and performing procedures that respond to those risks. Such procedures included examining, on a test basis, evidence regarding the amounts and disclosures in the financial statements and financial highlights. Such procedures also included confirmation of securities owned as of October 31, 2023, by correspondence with custodians, agent banks, and brokers; when replies were not received from agent banks or brokers, we performed other auditing procedures. Our audits also included evaluating the accounting principles used and significant estimates made by management, as well as evaluating the overall presentation of the financial statements and financial highlights. We believe that our audits provide a reasonable basis for our opinion.

We have served as the auditor of one or more New York Life Investment Management investment companies since 2003.
Philadelphia, Pennsylvania
December 22, 2023
Federal Income Tax Information
(Unaudited)
The Fund is required under the Internal Revenue Code to advise shareholders in a written statement as to the federal tax status of dividends paid by the Fund during such fiscal years.
For the fiscal year ended October 31, 2023, the Fund designated approximately $331,558 under the Internal Revenue Code as qualified dividend income eligible for reduced tax rates.
The dividends paid by the Fund during the fiscal year ended October 31, 2023 should be multiplied by 0.34% to arrive at the amount eligible for the corporate dividend-received deduction.
In February 2024, shareholders will receive an IRS Form 1099-DIV or substitute Form 1099, which will show the federal tax status of the distributions received by shareholders in calendar year 2023. The amounts that will be reported on such 1099-DIV or substitute Form 1099 will be the amounts you are to use on your federal income tax return and will differ from the amounts which we must report for the Fund's fiscal year ended October 31, 2023.
Proxy Voting Policies and Procedures and Proxy Voting Record
The Fund is required to file with the SEC its proxy voting record for the 12-month period ending June 30 on Form N-PX. A description of the policies and procedures that are used to vote proxies relating to portfolio securities of the Fund is available free of charge upon request by calling 800-624-6782 or visiting the SEC’s website at www.sec.gov. The most recent Form N-PX or proxy voting record is available free of charge upon request by calling 800-624-6782; visiting newyorklifeinvestments.com; or visiting the SEC’s website at www.sec.gov.
Shareholder Reports and Quarterly Portfolio Disclosure
The Fund is required to file its complete schedule of portfolio holdings with the SEC 60 days after its first and third fiscal quarter on Form N-PORT. The Fund's holdings report is available free of charge upon request by calling New York Life Investments at 800-624-6782.
| 40 | MainStay MacKay Short Duration High Yield Fund |
Board of Trustees and Officers (Unaudited)
The Trustees and officers of the Fund are listed below. The Board oversees the MainStay Group of Funds (which consists of MainStay Funds and MainStay Funds Trust), MainStay VP Funds Trust, MainStay MacKay DefinedTerm Municipal Opportunities Fund, MainStay CBRE Global Infrastructure Megatrends Term Fund, the Manager and the Subadvisors, and elects the officers of the Funds who are responsible for the day-to-day operations of the Fund. Information pertaining to the Trustees and officers is set forth below. Each Trustee serves until his or her successor is elected and qualified or until his or her resignation, death or
removal. Under the Board’s retirement policy, unless an exception is made, a Trustee must tender his or her resignation by the end of the calendar year during which he or she reaches the age of 75. Officers are elected annually by the Board. The business address of each Trustee and officer listed below is 51 Madison Avenue, New York, New York 10010. A majority of the Trustees are not “interested persons” (as defined by the 1940 Act and rules adopted by the SEC thereunder) of the Fund (“Independent Trustees”).
| | Name and
Year of Birth | Term of Office,
Position(s) Held and
Length of Service | Principal Occupation(s)
During Past Five Years | Number of
Portfolios in
Fund Complex
Overseen by
Trustee | Other Directorships
Held by Trustee |
| | | | | | |
| | Naïm Abou-Jaoudé*
1966 | MainStay Funds: Trustee
since 2023
MainStay Funds Trust:
Trustee since 2023 | Chief Executive Officer of New York Life Investment Management LLC (since 2023). Chief Executive Officer of Candriam (an affiliate of New York Life Investment Management LLC) (2007 to 2023). | 81 | MainStay VP Funds Trust:
Trustee since 2023 (31 portfolios);
MainStay MacKay DefinedTerm Municipal Opportunities Fund: Trustee
since 2023;
MainStay CBRE Global Infrastructure Megatrends Term Fund: Trustee
since 2023; and
New York Life Investment Management International (Chair) since 2015 |
| * | This Trustee is considered to be an “interested person” of the MainStay Group of Funds, MainStay VP Funds Trust, MainStay CBRE Global Infrastructure Megatrends Term Fund and MainStay MacKay DefinedTerm Municipal Opportunities Fund, within the meaning of the 1940 Act because of his affiliation with New York Life Investment Management LLC and Candriam, as described in detail above in the column entitled “Principal Occupation(s) During Past Five Years.” |
| | |
Board of Trustees and Officers (Unaudited) (continued)
| | Name and
Year of Birth | Term of Office,
Position(s) Held and
Length of Service | Principal Occupation(s)
During Past Five Years | Number of
Portfolios in
Fund Complex
Overseen by
Trustee | Other Directorships
Held by Trustee |
| | | | | | |
| | David H. Chow
1957 | MainStay Funds: Trustee since January 2016, Advisory Board Member (June 2015 to December 2015);MainStay Funds Trust:
Trustee since January 2016, Advisory Board Member (June 2015 to December 2015) | Founder and CEO, DanCourt Management, LLC (since 1999) | 81 | MainStay VP Funds Trust: Trustee since January 2016, Advisory Board Member (June 2015 to December 2015) (31 portfolios);
MainStay MacKay DefinedTerm Municipal Opportunities Fund: Trustee since January 2016, Advisory Board Member (June 2015 to December 2015);
MainStay CBRE Global Infrastructure Megatrends Term Fund: Trustee since 2021;
VanEck Vectors Group of Exchange-Traded Funds: Trustee since 2006 and Independent Chairman of the Board of Trustees from 2008 to 2022 (57 portfolios); and
Berea College of Kentucky: Trustee since 2009, Chair of the Investment Committee since 2018 |
| | Karen Hammond
1956 | MainStay Funds: Trustee since December 2021, Advisory Board Member (June 2021 to December 2021);MainStay Funds Trust:
Trustee since December 2021, Advisory Board Member (June 2021 to December 2021)
| Retired, Managing Director, Devonshire Investors (2007 to 2013); Senior Vice President, Fidelity Management & Research Co. (2005 to 2007); Senior Vice President and Corporate Treasurer, FMR Corp. (2003 to 2005); Chief Operating Officer, Fidelity Investments Japan (2001 to 2003) | 81 | MainStay VP Funds Trust: Trustee since December 2021, Advisory Board Member (June 2021 to December 2021) (31 portfolios);
MainStay MacKay DefinedTerm Municipal Opportunities Fund: Trustee since December 2021, Advisory Board Member (June 2021 to December 2021);
MainStay CBRE Global Infrastructure Megatrends Term Fund: Trustee since December 2021, Advisory Board Member (June 2021 to December 2021);
Two Harbors Investment Corp.: Director since 2018;
Rhode Island State Investment Commission: Member since 2017; and
Blue Cross Blue Shield of Rhode Island: Director since 2019 |
| | Susan B. Kerley
1951 | MainStay Funds: Chair since January 2017 and Trustee since 2007;MainStay Funds Trust:
Chair since January 2017 and Trustee since 1990*** | President, Strategic Management Advisors LLC (since 1990) | 81 | MainStay VP Funds Trust: Chair since January 2017 and Trustee since 2007 (31 portfolios)**;
MainStay MacKay DefinedTerm Municipal Opportunities Fund: Chair since January 2017 and Trustee since 2011;
MainStay CBRE Global Infrastructure Megatrends Term Fund: Trustee since June 2021; and
Legg Mason Partners Funds: Trustee since 1991 (45 portfolios) |
| 42 | MainStay MacKay Short Duration High Yield Fund |
| | Name and
Year of Birth | Term of Office,
Position(s) Held and
Length of Service | Principal Occupation(s)
During Past Five Years | Number of
Portfolios in
Fund Complex
Overseen by
Trustee | Other Directorships
Held by Trustee |
| | | | | | |
| | Alan R. Latshaw
1951 | MainStay Funds: Trusteesince 2006;MainStay Funds Trust:
Trustee since 2007*** | Retired; Partner, Ernst & Young LLP (2002 to 2003); Partner, Arthur Andersen LLP (1989 to 2002); Consultant to the MainStay Funds Audit and Compliance Committee (2004 to 2006) | 81 | MainStay VP Funds Trust: Trustee since 2007 (31 portfolios)**;
MainStay MacKay DefinedTerm Municipal Opportunities Fund: Trustee since 2011; and
MainStay CBRE Global Infrastructure Megatrends Term Fund: Trustee since June 2021 |
| | Jacques P. Perold
1958 | MainStay Funds: Trustee since January 2016, Advisory Board Member (June 2015to December 2015);MainStay Funds Trust:
Trustee since January 2016, Advisory Board Member (June 2015 to December 2015) | Founder and Chief Executive Officer, CapShift Advisors LLC (since 2018); President, Fidelity Management & Research Company (2009 to 2014); President and Chief Investment Officer, Geode Capital Management, LLC (2001 to 2009) | 81 | MainStay VP Funds Trust: Trustee since January 2016, Advisory Board Member (June 2015 to December 2015) (31 portfolios);
MainStay MacKay DefinedTerm Municipal Opportunities Fund: Trustee since January 2016, Advisory Board Member (June 2015 to December 2015);
MainStay CBRE Global Infrastructure Megatrends Term Fund: Trustee since June 2021;
Allstate Corporation: Director since 2015; and
MSCI Inc.: Director since 2017 |
| | Richard S. Trutanic
1952 | MainStay Funds: Trustee since 1994;MainStay Funds Trust:
Trustee since 2007*** | Chairman and Chief Executive Officer, Somerset & Company (financial advisory firm) (since 2004); Managing Director, The Carlyle Group (private investment firm) (2002 to 2004); Senior Managing Director, Partner and Board Member, Groupe Arnault S.A. (private investment firm) (1999 to 2002) | 81 | MainStay VP Funds Trust: Trustee since 2007 (31 portfolios)**;
MainStay MacKay DefinedTerm Municipal Opportunities Fund: Trustee since 2011; and
MainStay CBRE Global Infrastructure Megatrends Term Fund: Trustee since June 2021 |
| ** | Includes prior service as a Director of MainStay VP Series Fund, Inc., the predecessor to MainStay VP Funds Trust. |
| *** | Includes prior service as a Director/Trustee of certain predecessor entities to MainStay Funds Trust. |
Board of Trustees and Officers (Unaudited) (continued)
| | Name and
Year of Birth | Position(s) Held and
Length of Service | Principal Occupation(s)
During Past Five Years | |
| | | | | |
| | Kirk C. Lehneis
1974 | President, MainStay Funds, MainStay Funds Trust (since 2017) | Chief Operating Officer and Senior Managing Director (since 2016), New York Life Investment Management LLC and New York Life Investment Management Holdings LLC; Member of the Board of Managers (since 2017) and Senior Managing Director (since 2018), NYLIFE Distributors LLC; Chairman of the Board and Senior Managing Director, NYLIM Service Company LLC (since 2017); Trustee, President and Principal Executive Officer of IndexIQ Trust, IndexIQ ETF Trust and IndexIQ Active ETF Trust (since 2018); President, MainStay CBRE Global Infrastructure Megatrends Term Fund (since 2021), MainStay MacKay DefinedTerm Municipal Opportunities Fund and MainStay VP Funds Trust (since 2017)**; Senior Managing Director, Global Product Development (2015 to 2016); Managing Director, Product Development (2010 to 2015), New York Life Investment Management LLC | |
| | Jack R. Benintende
1964 | Treasurer and Principal Financial and Accounting Officer, MainStay Funds (since 2007), MainStay Funds Trust (since 2009) | Managing Director, New York Life Investment Management LLC (since 2007); Treasurer and Principal Financial and Accounting Officer, MainStay CBRE Global Infrastructure Megatrends Term Fund (since 2021), MainStay MacKay DefinedTerm Municipal Opportunities Fund (since 2011) and MainStay VP Funds Trust (since 2007)**; and Assistant Treasurer, New York Life Investment Management Holdings LLC (2008 to 2012) | |
| | J. Kevin Gao
1967 | Secretary and Chief Legal Officer, MainStay Funds and MainStay Funds Trust (since 2010) | Managing Director and Associate General Counsel, New York Life Investment Management LLC (since 2010); Secretary and Chief Legal Officer, MainStay CBRE Global Infrastructure Megatrends Term Fund (since 2021), MainStay MacKay DefinedTerm Municipal Opportunities Fund (since 2011) and MainStay VP Funds Trust (since 2010)** | |
| | Kevin M. Gleason
1967 | Vice President and Chief Compliance Officer, MainStay Funds and MainStay Funds Trust (since June 2022) | Vice President and Chief Compliance Officer, IndexIQ Trust, IndexIQ ETF Trust and Index IQ Active ETF Trust (since June 2022); Vice President and Chief Compliance Officer, MainStay CBRE Global Infrastructure Megatrends Term Fund, MainStay VP Funds Trust and MainStay MacKay DefinedTerm Municipal Opportunities Fund (since June 2022); Senior Vice President, Voya Investment Management and Chief Compliance Officer, Voya Family of Funds (2012 to 2022) | |
| | Scott T. Harrington
1959 | Vice President— Administration, MainStay Funds (since 2005), MainStay Funds Trust (since 2009) | Managing Director, New York Life Investment Management LLC (including predecessor advisory organizations) (since 2000); Member of the Board of Directors, New York Life Trust Company (since 2009); Vice President—Administration, MainStay CBRE Global Infrastructure Megatrends Term Fund (since 2021), MainStay MacKay DefinedTerm Municipal Opportunities Fund (since 2011) and MainStay VP Funds Trust (since 2005)** | |
| * | The officers listed above are considered to be “interested persons” of the MainStay Group of Funds, MainStay VP Funds Trust, MainStay CBRE Global Infrastructure Megatrends Term Fund and MainStay MacKay DefinedTerm Municipal Opportunities Fund within the meaning of the 1940 Act because of their affiliation with the MainStay Group of Funds, New York Life Insurance Company and/or its affiliates, including New York Life Investment Management LLC, New York Life Insurance Company, NYLIM Service Company LLC, NYLIFE Securities LLC and/or NYLIFE Distributors LLC, as described in detail in the column captioned “Principal Occupation(s) During Past Five Years.” Officers are elected annually by the Board. |
| ** | Includes prior service as an Officer of MainStay VP Series Fund, Inc., the predecessor to MainStay VP Funds Trust. |
Officers of the Trust (Who are not Trustees)*
| 44 | MainStay MacKay Short Duration High Yield Fund |
This page intentionally left blank.
This page intentionally left blank.
Equity
U.S. Equity
MainStay Epoch U.S. Equity Yield Fund
MainStay Fiera SMID Growth Fund
MainStay PineStone U.S. Equity Fund
MainStay S&P 500 Index Fund
MainStay Winslow Large Cap Growth Fund
MainStay WMC Enduring Capital Fund
MainStay WMC Growth Fund
MainStay WMC Small Companies Fund
MainStay WMC Value Fund
International Equity
MainStay Epoch International Choice Fund
MainStay PineStone International Equity Fund
MainStay WMC International Research Equity Fund
Emerging Markets Equity
MainStay Candriam Emerging Markets Equity Fund
Global Equity
MainStay Epoch Capital Growth Fund
MainStay Epoch Global Equity Yield Fund
MainStay PineStone Global Equity Fund
Fixed Income
Taxable Income
MainStay Candriam Emerging Markets Debt Fund
MainStay Floating Rate Fund
MainStay MacKay High Yield Corporate Bond Fund
MainStay MacKay Short Duration High Yield Fund
MainStay MacKay Strategic Bond Fund
MainStay MacKay Total Return Bond Fund
MainStay MacKay U.S. Infrastructure Bond Fund
MainStay Short Term Bond Fund
Tax-Exempt Income
MainStay MacKay California Tax Free Opportunities Fund1
MainStay MacKay High Yield Municipal Bond Fund
MainStay MacKay New York Tax Free Opportunities Fund2
MainStay MacKay Short Term Municipal Fund
MainStay MacKay Strategic Municipal Allocation Fund
MainStay MacKay Tax Free Bond Fund
Money Market
MainStay Money Market Fund
Mixed Asset
MainStay Balanced Fund
MainStay Income Builder Fund
MainStay MacKay Convertible Fund
Speciality
MainStay CBRE Global Infrastructure Fund
MainStay CBRE Real Estate Fund
MainStay Cushing MLP Premier Fund
Asset Allocation
MainStay Conservative Allocation Fund
MainStay Conservative ETF Allocation Fund
MainStay Defensive ETF Allocation Fund
MainStay Equity Allocation Fund
MainStay Equity ETF Allocation Fund
MainStay ESG Multi-Asset Allocation Fund
MainStay Growth Allocation Fund
MainStay Growth ETF Allocation Fund
MainStay Moderate Allocation Fund
MainStay Moderate ETF Allocation Fund
Manager
New York Life Investment Management LLC
New York, New York
Subadvisors
Candriam3
Strassen, Luxembourg
CBRE Investment Management Listed Real Assets LLC
Radnor, Pennsylvania
Cushing Asset Management, LP
Dallas, Texas
Epoch Investment Partners, Inc.
New York, New York
Fiera Capital Inc.
New York, New York
IndexIQ Advisors LLC3
New York, New York
MacKay Shields LLC3
New York, New York
NYL Investors LLC3
New York, New York
PineStone Asset Management Inc.
Montreal, Québec
Wellington Management Company LLP
Boston, Massachusetts
Winslow Capital Management, LLC
Minneapolis, Minnesota
Legal Counsel
Dechert LLP
Washington, District of Columbia
Independent Registered Public Accounting Firm
KPMG LLP
Philadelphia, Pennsylvania
Distributor
NYLIFE Distributors LLC3
Jersey City, New Jersey
Custodian
JPMorgan Chase Bank, N.A.
New York, New York
1.
This Fund is registered for sale in AZ, CA, NV, OR, TX, UT, WA and MI (Class A and Class I shares only), and CO, FL, GA, HI, ID, MA, MD, NH, NJ and NY (Class I shares only).
| 2. | This Fund is registered for sale in CA, CT, DE, FL, MA, NJ, NY and VT. |
| 3. | An affiliate of New York Life Investment Management LLC. |
Not part of the Annual Report
For more information
800-624-6782
newyorklifeinvestments.com
“New York Life Investments” is both a service mark, and the common trade name, of certain investment advisors affiliated with New York Life Insurance Company. The MainStay Funds® are managed by New York Life Investment Management LLC and distributed by NYLIFE Distributors LLC, 30 Hudson Street, Jersey City, NJ 07302, a wholly owned subsidiary of New York Life Insurance Company. NYLIFE Distributors LLC is a Member FINRA/SIPC.
©2023 NYLIFE Distributors LLC. All rights reserved.
| 5013766MS139-23 | MSSHY11-12/23 |
(NYLIM) NL232
MainStay MacKay Total Return Bond Fund
Message from the President and Annual Report
October 31, 2023
Special Notice:
Beginning in July 2024, new regulations issued by the Securities and Exchange Commission (SEC) will take effect requiring open-end mutual fund companies and ETFs to (1) overhaul the content of their shareholder reports and (2) mail paper copies of the new tailored shareholder reports to shareholders who have not opted to receive these documents electronically.
If you have not yet elected to receive your shareholder reports electronically, please contact your financial intermediary or visit newyorklifeinvestments.com/accounts.
| Not FDIC/NCUA Insured | Not a Deposit | May Lose Value | No Bank Guarantee | Not Insured by Any Government Agency |
This page intentionally left blank
Message from the President
Volatile economic and geopolitical forces drove market behavior during the 12-month reporting period ended October 31, 2023. While equity markets generally gained ground, bond prices trended broadly lower.
Although the war in Ukraine, the outbreak of hostilities in the Middle East and several other notable events affected financial assets, inflation and interest rate trends stood at the forefront of market developments during most of the period. As the reporting period began, high levels of inflation already showed signs of easing in the face of aggressive rate hikes by the U.S. Federal Reserve (the “Fed”). From a peak of 9.1% in June 2022, the annualized U.S. inflation rate dropped to 7.1% in November 2022, and to 3.2% in October 2023. At the same time, the Fed increased the benchmark federal funds rate from 3.75%–4.00% at the beginning of the reporting period to 5.25%–5.50% as of October 31, 2023. As the pace of rate increases slowed during the period, investors hoped for an early shift to a looser monetary policy. However, comments from Fed members late in the period reinforced the central bank’s hawkish stance in response to surprisingly robust U.S. economic growth and rising wage pressures, thus increasing the likelihood that interest rates would stay higher for longer. International developed markets exhibited similar dynamics of elevated inflation and rising interest rates.
Despite the backdrop of high interest rates—along with political dysfunction in Washington D.C. and intensifying global geopolitical instability—equity markets managed to advance, supported by healthy consumer spending trends and persistent domestic economic growth. The S&P 500® Index, a widely regarded benchmark of large-cap U.S. market performance, gained ground, bolstered by the strong performance of energy stocks amid surging petroleum prices and mega-cap, growth-oriented, technology-related shares, which rose as investors flocked to companies creating the infrastructure for developments in artificial intelligence. Smaller-cap stocks and value-oriented shares produced milder returns. Among industry sectors, energy and
information technology posted the strongest gains. Real estate declined most sharply under pressure from rising mortgage rates and weak levels of office occupancy. Developed international markets outperformed U.S. markets, with Europe benefiting during the first half of the period from unexpected economic resilience in the face of rising energy prices and the ongoing war in Ukraine. Emerging markets posted positive results but lagged developed markets, largely due to slow economic growth in China despite the relaxation of pandemic-era lockdowns.
Bond prices were driven lower by rising yields and increasing expectations of high interest rates for an extended period of time. The U.S. yield curve steepened, with the 30-year Treasury yield exceeding 5% for the first time in more than a decade. The yield curve remained inverted, with the 10-year Treasury yield ending the period at 4.88%, compared with 5.07% for the 2-year Treasury yield. Corporate bonds outperformed long-term Treasury bonds, but still trended lower under pressure from rising yields and an uptick in default rates. Among corporates, lower-credit-quality instruments performed slightly better than their higher-credit-quality counterparts, while floating rate securities performed better still.
In the face of today’s uncertain market environment, New York Life Investments remains dedicated to providing the guidance, resources and investment solutions you need to pursue your financial goals.
Thank you for trusting us to help meet your investment needs.
Sincerely,
Kirk C. Lehneis
President
The opinions expressed are as of the date of this report and are subject to change. There is no guarantee that any forecast made will come to pass. This material does not constitute investment advice and is not intended as an endorsement of any specific investment. Past performance is no guarantee of future results.
Not part of the Annual Report
Investors should refer to the Fund’s Summary Prospectus and/or Prospectus and consider the Fund’s investment objectives, strategies, risks, charges and expenses carefully before investing. The Summary Prospectus and/or Prospectus contain this and other information about the Fund. You may obtain copies of the Fund’s Summary Prospectus, Prospectus and Statement of Additional Information, which includes information about the MainStay Funds Trust's Trustees, free of charge, upon request, by calling toll-free 800-624-6782, by writing to NYLIFE Distributors LLC, Attn: MainStay Marketing Department, 30 Hudson Street, Jersey City, NJ 07302 or by sending an e-mail to MainStayShareholderServices@nylim.com. These documents are also available via the MainStay Funds’ website at newyorklifeinvestments.com. Please read the Fund’s Summary Prospectus and/or Prospectus carefully before investing.
Investment and Performance Comparison (Unaudited)
Performance data quoted represents past performance. Past performance is no guarantee of future results. Because of market volatility and other factors, current performance may be lower or higher than the figures shown. Investment return and principal value will fluctuate, and as a result, when shares are redeemed, they may be worth more or less than their original cost. The graph below depicts the historical performance of Class I shares of the Fund. Performance will vary from class to class based on differences in class-specific expenses and sales charges. For performance information current to the most recent month-end, please call 800-624-6782 or visit newyorklifeinvestments.com.
The performance table and graph do not reflect the deduction of taxes that a shareholder would pay on distributions or Fund share redemptions. Total returns reflect maximum applicable sales charges as indicated in the table below, if any, changes in share price, and reinvestment of dividend and capital gain distributions. The graph assumes the initial investment amount shown below and reflects the deduction of all sales charges that would have applied for the period of investment. Performance figures may reflect certain fee waivers and/or expense limitations, without which total returns may have been lower. For more information on share classes and current fee waivers and/or expense limitations (if any), please refer to the Notes to Financial Statements.
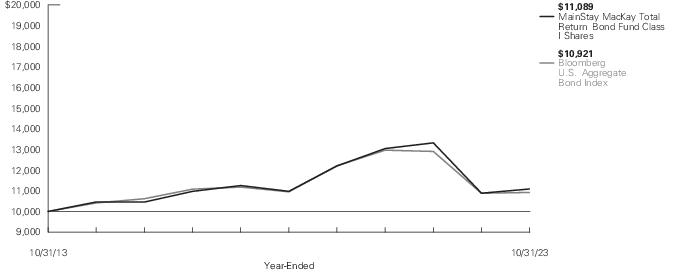
| Average Annual Total Returns for the Year-Ended October 31, 2023 |
| Class | Sales Charge | | Inception
Date | One
Year | Five
Years | Ten Years
or Since
Inception | Gross
Expense
Ratio1 |
| Class A Shares | Maximum 4.50% Initial Sales Charge | With sales charges | 1/2/2004 | -3.07% | -0.99% | 0.27% | 0.81% |
| | | Excluding sales charges | | 1.50 | -0.08 | 0.73 | 0.81 |
| Investor Class Shares2 | Maximum 4.00% Initial Sales Charge | With sales charges | 2/28/2008 | -2.85 | -1.21 | 0.13 | 1.07 |
| | | Excluding sales charges | | 1.20 | -0.30 | 0.59 | 1.07 |
| Class B Shares3 | Maximum 5.00% CDSC | With sales charges | 1/2/2004 | -4.43 | -1.41 | -0.16 | 1.82 |
| | if Redeemed Within the First Six Years of Purchase | Excluding sales charges | | 0.44 | -1.06 | -0.16 | 1.82 |
| Class C Shares | Maximum 1.00% CDSC | With sales charges | 1/2/2004 | -0.42 | -1.03 | -0.15 | 1.82 |
| | if Redeemed Within One Year of Purchase | Excluding sales charges | | 0.56 | -1.03 | -0.15 | 1.82 |
| Class I Shares | No Sales Charge | | 1/2/1991 | 1.88 | 0.21 | 1.04 | 0.56 |
| Class R1 Shares4 | No Sales Charge | | 6/29/2012 | 1.65 | 0.08 | 0.93 | 0.65 |
| Class R2 Shares4 | No Sales Charge | | 6/29/2012 | 1.39 | -0.15 | 0.67 | 0.91 |
| Class R3 Shares4 | No Sales Charge | | 2/29/2016 | 1.15 | -0.41 | 0.21 | 1.15 |
| Class R6 Shares | No Sales Charge | | 12/29/2014 | 1.89 | 0.25 | 0.74 | 0.52 |
| SIMPLE Class Shares | No Sales Charge | | 8/31/2020 | 1.21 | N/A | -5.82 | 1.21 |
| 1. | The gross expense ratios presented reflect the Fund’s “Total Annual Fund Operating Expenses” from the most recent Prospectus, as supplemented, and may differ from other expense ratios disclosed in this report. |
| 2. | Prior to June 30, 2020, the maximum initial sales charge was 4.50%, which is reflected in the applicable average annual total return figures shown. |
| 3. | Class B shares are closed to all new purchases as well as additional investments by existing Class B shareholders and will be converted into Class A or Investor Class shares based on shareholder eligibility on or about February 28, 2024. |
| 4. | As of October 31, 2023, Class R1, Class R2 and Class R3 shares are closed to new investors and, upon the close of business on December 29, 2023, Class R1, Class R2 and Class R3 shares are closed to additional investments by existing shareholders. Additionally, Class R1, Class R2 and Class R3 shares will be liquidated on or about February 28, 2024 (the "Liquidation Date"). It is expected that the Fund will distribute to remaining shareholders invested in Class R1, Class R2 or Class R3 shares, on or promptly after the Liquidation Date, a liquidating distribution in cash or cash equivalents equal to the net asset value of such shares. |
The footnotes on the next page are an integral part of the table and graph and should be carefully read in conjunction with them.
| Benchmark Performance* | One
Year | Five
Years | Ten
Years |
| Bloomberg U.S. Aggregate Bond Index1 | 0.36% | -0.06% | 0.88% |
| Morningstar Intermediate Core-Plus Bond Category Average2 | 0.92 | 0.07 | 1.01 |
| * | Returns for indices reflect no deductions for fees, expenses or taxes, except for foreign withholding taxes where applicable. Results assume reinvestment of all dividends and capital gains. An investment cannot be made directly in an index. |
| 1. | The Bloomberg U.S. Aggregate Bond Index is a broad-based benchmark that measures performance of the investment-grade, U.S. dollar denominated, fixed-rate taxable bond market, including Treasuries, government-related and corporate securities, mortgage-backed securities (agency fixed-rate and hybrid adjustable-rate mortgage pass-throughs), asset-backed securities and commercial mortgage-backed securities. |
| 2. | The Morningstar Intermediate Core-Plus Bond Category Average is representative of funds that invest primarily in investment-grade U.S. fixed-income issues including government, corporate, and securitized debt, but generally have greater flexibility than core offerings to hold non-core sectors such as corporate high yield, bank loan, emerging-markets debt, and non-U.S. currency exposures. Their durations (a measure of interest-rate sensitivity) typically range between 75% and 125% of the three-year average of the effective duration of the Morningstar Core Bond Index. Results are based on average total returns of similar funds with all dividends and capital gain distributions reinvested. |
The footnotes on the preceding page are an integral part of the table and graph and should be carefully read in conjunction with them.
| 6 | MainStay MacKay Total Return Bond Fund |
Cost in Dollars of a $1,000 Investment in MainStay MacKay Total Return Bond Fund (Unaudited)
The example below is intended to describe the fees and expenses borne by shareholders during the six-month period from May 1, 2023 to October 31, 2023, and the impact of those costs on your investment.
Example
As a shareholder of the Fund you incur two types of costs: (1) transaction costs, including exchange fees and sales charges (loads) on purchases (as applicable), and (2) ongoing costs, including management fees, distribution and/or service (12b-1) fees and other Fund expenses (as applicable). This example is intended to help you understand your ongoing costs (in dollars) of investing in the Fund and to compare these costs with the ongoing costs of investing in other mutual funds. The example is based on an investment of $1,000 made at the beginning of the six-month period and held for the entire period from May 1, 2023 to October 31, 2023.
This example illustrates your Fund’s ongoing costs in two ways:
Actual Expenses
The second and third data columns in the table below provide information about actual account values and actual expenses. You may use the information in these columns, together with the amount you invested, to estimate the expenses that you paid during the six months ended October 31, 2023. Simply divide your account value by $1,000 (for example, an
$8,600 account value divided by $1,000 = 8.6), then multiply the result by the number under the heading entitled “Expenses Paid During Period” to estimate the expenses you paid on your account during this period.
Hypothetical Example for Comparison Purposes
The fourth and fifth data columns in the table below provide information about hypothetical account values and hypothetical expenses based on the Fund’s actual expense ratio and an assumed rate of return of 5% per year before expenses, which is not the Fund’s actual return. The hypothetical account values and expenses may not be used to estimate the actual ending account balances or expenses you paid for the six-month period shown. You may use this information to compare the ongoing costs of investing in the Fund with the ongoing costs of investing in other mutual funds. To do so, compare this 5% hypothetical example with the 5% hypothetical examples that appear in the shareholder reports of the other mutual funds.
Please note that the expenses shown in the table are meant to highlight your ongoing costs only and do not reflect any transactional costs, such as exchange fees or sales charges (loads). Therefore, the fourth and fifth data columns of the table are useful in comparing ongoing costs only and will not help you determine the relative total costs of owning different funds. In addition, if these transactional costs were included, your costs would have been higher.
| Share Class | Beginning
Account
Value
5/1/23 | Ending Account
Value (Based
on Actual
Returns and
Expenses)
10/31/23 | Expenses
Paid
During
Period1 | Ending Account
Value (Based
on Hypothetical
5% Annualized
Return and
Actual Expenses)
10/31/23 | Expenses
Paid
During
Period1 | Net Expense
Ratio
During
Period2 |
| Class A Shares | $1,000.00 | $940.30 | $4.11 | $1,020.97 | $4.28 | 0.84% |
| Investor Class Shares | $1,000.00 | $938.30 | $5.52 | $1,019.51 | $5.75 | 1.13% |
| Class B Shares | $1,000.00 | $934.50 | $9.17 | $1,015.73 | $9.55 | 1.88% |
| Class C Shares | $1,000.00 | $935.70 | $9.17 | $1,015.73 | $9.55 | 1.88% |
| Class I Shares | $1,000.00 | $941.20 | $2.20 | $1,022.94 | $2.29 | 0.45% |
| Class R1 Shares | $1,000.00 | $941.10 | $3.38 | $1,021.73 | $3.52 | 0.69% |
| Class R2 Shares | $1,000.00 | $939.80 | $4.64 | $1,020.42 | $4.84 | 0.95% |
| Class R3 Shares | $1,000.00 | $938.70 | $5.82 | $1,019.21 | $6.06 | 1.19% |
| Class R6 Shares | $1,000.00 | $942.20 | $2.20 | $1,022.94 | $2.29 | 0.45% |
| SIMPLE Class Shares | $1,000.00 | $938.80 | $4.94 | $1,020.11 | $5.14 | 1.01% |
| 1. | Expenses are equal to the Fund’s annualized expense ratio of each class multiplied by the average account value over the period, divided by 365 and multiplied by 184 (to reflect the six-month period). The table above represents the actual expenses incurred during the six-month period. In addition to the fees and expenses which the Fund bears directly, it also indirectly bears a pro rata share of the fees and expenses of the underlying funds in which it invests. Such indirect expenses are not included in the above-reported expense figures. |
| 2. | Expenses are equal to the Fund's annualized expense ratio to reflect the six-month period. |
Portfolio Composition as of October 31, 2023 (Unaudited)
‡ Less than one-tenth of a percent
See Portfolio of Investments beginning on page 11 for specific holdings within these categories. The Fund's holdings are subject to change.
Top Ten Holdings and/or Issuers Held as of October 31, 2023 (excluding short-term investments) (Unaudited)
| 1. | GNMA, (zero coupon)-9.674%, due 7/20/49–10/16/63 |
| 2. | UMBS Pool, 30 Year, 2.50%-6.50%, due 7/1/51–11/1/53 |
| 3. | FNMA, (zero coupon)-8.621%, due 11/25/41–7/25/54 |
| 4. | UMBS, 30 Year, 3.00%-6.50%, due 7/1/39–10/1/53 |
| 5. | FHLMC, (zero coupon)-4.50%, due 1/15/41–1/25/55 |
| 6. | Bank of America Corp., 2.087%-4.30%, due 1/28/25–2/13/31 |
| 7. | CF Hippolyta Issuer LLC, 1.53%-1.98%, due 7/15/60–3/15/61 |
| 8. | Connecticut Avenue Securities Trust, 8.421%-11.321%, due 10/25/41 |
| 9. | FHLMC STACR REMIC Trust, 7.821%-8.721%, due 1/25/42 |
| 10. | Hertz Vehicle Financing III LP, 2.12%-4.34%, due 12/27/27 |
| 8 | MainStay MacKay Total Return Bond Fund |
Portfolio Management Discussion and Analysis (Unaudited)
Questions answered by portfolio managers Neil Moriarty III, Michael DePalma, Tom Musmanno and Lesya Paisley, CFA, of MacKay Shields LLC, the Fund’s Subadvisor.
How did MainStay MacKay Total Return Bond Fund perform relative to its benchmark and peer group during the 12 months ended October 31, 2023?
For the 12 months ended October 31, 2023, Class I shares of MainStay MacKay Total Return Bond Fund returned 1.88%, outperforming the 0.36% return of the Fund’s benchmark, the Bloomberg U.S. Aggregate Bond Index (the “Index”). Over the same period, Class I shares also outperformed the 0.92% return of the Morningstar Intermediate Core-Plus Bond Category Average.1
Were there any changes to the Fund during the reporting period?
Effective May 9, 2023, Michael DePalma and Tom Musmanno were added as portfolio managers of the Fund, and Stephen R. Cianci was removed. Please see the supplement dated May 9, 2023, for more information.
What factors affected the Fund’s relative performance during the reporting period?
Relative to the Index, the Fund’s performance benefited from overweight exposure to securitized products, high-grade and high-yield corporates, and emerging-markets credit. Performance varied across the ratings spectrum, term structure and asset type. Generally speaking, longer-duration2assets underperformed shorter-duration assets, lower quality outperformed higher quality within the investment-grade segment of the market, and securitized assets outperformed unsecured credit. Conversely, the Fund’s underweight allocation to U.S. Treasury securities detracted from relative performance. The Fund’s relatively long duration profile during the reporting period also detracted slightly from relative returns.
During the reporting period, were there any market events that materially impacted the Fund’s performance or liquidity?
Although volatility was prevalent throughout the reporting period, there was no event that affected liquidity during the period. Total returns were impacted by U.S. Federal Reserve ("Fed") policy and a large move in Treasury yields.
During the reporting period, how was the Fund’s performance materially affected by investments in derivatives?
During the reporting period, the Fund used U.S. Treasury futures to hedge its duration. This position detracted from returns.
What was the Fund’s duration strategy during the reporting period?
As mentioned above, during the reporting period, the Fund maintained a longer duration than that of the Index. This position detracted from relative returns. As of the end of the reporting period, the Fund’s duration was 6.2 years versus 6.0 years for the Index.
During the reporting period, which sectors were the strongest positive contributors to the Fund’s relative performance and which sectors were particularly weak?
During the reporting period, the strongest positive contributions to the Fund’s relative outperformance came from securitized products, high-grade corporates, high-yield bonds and emerging market credit. (Contributions take weightings and total returns into account.) Within the Fund’s corporate exposure, financials, utilities and midstream were among the most significant positive contributors relative performance. Conversely, an underweight to Treasury securities and residential mortgage-backed securities (“RMBS”) were among the most significant laggards.
What were some of the Fund’s largest purchases and sales during the reporting period?
The Fund added exposure to Georgia Power, a fully regulated utility, because we saw attractive value on a risk-adjusted basis. Georgia Power benefits from stable and predictable cash flow generation and strong relationships with its regulators. Overall, we’ve been favoring utilities exposure in the Fund due to the defensive and predictable credit nature of these issuers and their ability to perform well, particularly in a recessionary scenario. The Fund also added a position in Charter Communications, based on attractive valuation. We consider Charter a core high-yield holding, as one of the largest cable and telecommunications providers in the United States, with solid fundamentals and relatively non-cyclical operations.
We sold the Fund’s position in Howmet Aerospace for relative value reasons as valuations became full. Although Howmet is a
| 1. | See "Investment and Performance Comparison" for other share class returns, which may be higher or lower than Class I share returns, and for more information on benchmark and peer group returns. |
| 2. | Duration is a measure of the price sensitivity of a fixed-income investment to changes in interest rates. Duration is expressed as a number of years and is considered a more accurate sensitivity gauge than average maturity. |
strong high-yield credit rated BB+3 on an improving trajectory, in our opinion, the valuation already fully reflected any potential future improvement. At the time of sale, Howmet traded in line with, or better than, many low-BBB-rated4 investment-grade corporates. We also sold the Fund’s QVC holdings following a periodic credit review of the issuer. We concluded that, in light of worsening earnings trends, coupled with our cautious outlook on cyclical consumer spending, a stress event may materialize for the issuer in 2024, and likely in 2025.
From a sector positioning perspective, we increased the Fund’s mortgage-backed securities exposure and trimmed exposure to high-grade and high-yield corporate bonds.
How did the Fund’s sector weightings change during the reporting period?
During the reporting period, the Fund decreased its exposure to U.S. Treasury bonds and to high-grade and high-yield corporates. The Fund increased its exposure to agency mortgages and non-agency RMBS.
How was the Fund positioned at the end of the reporting period?
As of October 31, 2023, relative to the Index, the Fund held overweight exposure to commercial mortgage-backed securities, asset-backed securities and RMBS. As of the same date, the Fund held underweight exposure to U.S. Treasury securities.
| 3. | An obligation rated ‘BB’ by Standard & Poor’s (“S&P”) is deemed by S&P to be less vulnerable to nonpayment than other speculative issues. In the opinion of S&P, however, the obligor faces major ongoing uncertainties or exposure to adverse business, financial or economic conditions which could lead to the obligor’s inadequate capacity to meet its financial commitment on the obligation. When applied to Fund holdings, ratings are based solely on the creditworthiness of the bonds in the portfolio and are not meant to represent the security or safety of the Fund. Ratings from ‘AA’ to ‘CCC’ may be modified by the addition of a plus (+) or minus (–) sign to show relative standing within the major rating categories. |
| 4. | An obligation rated ‘BBB’ by S&P is deemed by S&P to exhibit adequate protection parameters. In the opinion of S&P, however, adverse economic conditions or changing circumstances are more likely to lead to a weakened capacity of the obligor to meet its financial commitment on the obligation. When applied to Fund holdings, ratings are based solely on the creditworthiness of the bonds in the portfolio and are not meant to represent the security or safety of the Fund. |
The opinions expressed are those of the portfolio managers as of the date of this report and are subject to change. There is no guarantee that any forecasts will come to pass. This material does not constitute investment advice and is not intended as an endorsement of any specific investment.
| 10 | MainStay MacKay Total Return Bond Fund |
Portfolio of Investments October 31, 2023†^
| | Principal
Amount | Value |
| Long-Term Bonds 98.2% |
| Asset-Backed Securities 12.6% |
| Automobile Asset-Backed Securities 6.8% |
| American Credit Acceptance Receivables Trust | |
| Series 2022-1, Class D | | |
| 2.46%, due 3/13/28 (a) | $ 2,265,000 | $ 2,148,831 |
| CPS Auto Receivables Trust | |
| Series 2021-C, Class E | | |
| 3.21%, due 9/15/28 (a) | 1,535,000 | 1,421,296 |
| Drive Auto Receivables Trust | |
| Series 2021-2, Class D | | |
| 1.39%, due 3/15/29 | 1,990,000 | 1,863,757 |
| Exeter Automobile Receivables Trust | |
| Series 2021-3A, Class D | | |
| 1.55%, due 6/15/27 | 1,565,000 | 1,434,279 |
| Series 2021-2A, Class E | | |
| 2.90%, due 7/17/28 (a) | 1,040,000 | 949,921 |
| Series 2021-3A, Class E | | |
| 3.04%, due 12/15/28 (a) | 2,090,000 | 1,872,565 |
| Flagship Credit Auto Trust (a) | |
| Series 2020-1, Class E | | |
| 3.52%, due 6/15/27 | 1,950,000 | 1,796,205 |
| Series 2019-2, Class E | | |
| 4.52%, due 12/15/26 | 1,910,000 | 1,844,965 |
| Ford Credit Auto Owner Trust (a) | |
| Series 2021-2, Class D | | |
| 2.60%, due 5/15/34 | 230,000 | 198,323 |
| Series 2023-2, Class B | | |
| 5.92%, due 2/15/36 | 500,000 | 485,145 |
| Series 2023-1, Class D | | |
| 6.26%, due 8/15/35 | 755,000 | 721,828 |
| GLS Auto Receivables Issuer Trust (a) | |
| Series 2021-3A, Class C | | |
| 1.11%, due 9/15/26 | 930,000 | 899,970 |
| Series 2021-2A, Class E | | |
| 2.87%, due 5/15/28 | 1,895,000 | 1,730,034 |
| Series 2021-3A, Class E | | |
| 3.20%, due 10/16/28 | 1,685,000 | 1,531,839 |
| Series 2020-1A, Class D | | |
| 3.68%, due 11/16/26 | 440,000 | 428,213 |
| Hertz Vehicle Financing III LP (a) | |
| Series 2021-2A, Class B | | |
| 2.12%, due 12/27/27 | 1,215,000 | 1,064,148 |
| Series 2021-2A, Class D | | |
| 4.34%, due 12/27/27 | 2,910,000 | 2,520,818 |
| Hertz Vehicle Financing LLC (a) | |
| Series 2021-1A, Class B | | |
| 1.56%, due 12/26/25 | 870,000 | 827,849 |
| | Principal
Amount | Value |
| |
| Automobile Asset-Backed Securities (continued) |
| Hertz Vehicle Financing LLC (a) (continued) | |
| Series 2021-1A, Class C | | |
| 2.05%, due 12/26/25 | $ 890,000 | $ 846,739 |
| | | 24,586,725 |
| Other Asset-Backed Securities 5.8% |
| American Airlines Pass-Through Trust | |
| Series 2019-1, Class AA | | |
| 3.15%, due 2/15/32 | 1,093,692 | 911,442 |
| Series 2016-2, Class A | | |
| 3.65%, due 6/15/28 | 1,394,000 | 1,211,498 |
| Series 2019-1, Class B | | |
| 3.85%, due 2/15/28 | 849,283 | 738,492 |
| British Airways Pass-Through Trust | |
| Series 2021-1, Class A | | |
| 2.90%, due 3/15/35 (a) | 1,752,893 | 1,444,199 |
| CF Hippolyta Issuer LLC (a) | |
| Series 2021-1A, Class A1 | | |
| 1.53%, due 3/15/61 | 2,082,809 | 1,823,494 |
| Series 2020-1, Class A1 | | |
| 1.69%, due 7/15/60 | 1,401,346 | 1,270,973 |
| Series 2021-1A, Class B1 | | |
| 1.98%, due 3/15/61 | 2,012,125 | 1,728,908 |
| CVS Pass-Through Trust | |
| 5.789%, due 1/10/26 (a) | 18,153 | 17,879 |
| DB Master Finance LLC | |
| Series 2021-1A, Class A23 | | |
| 2.791%, due 11/20/51 (a) | 938,287 | 708,580 |
| JetBlue Pass-Through Trust | |
| Series 2019-1, Class AA | | |
| 2.75%, due 5/15/32 | 2,192,089 | 1,835,351 |
| Mosaic Solar Loan Trust | |
| Series 2021-2A, Class B | | |
| 2.09%, due 4/22/47 (a) | 1,043,397 | 750,054 |
| Navient Private Education Refi Loan Trust | |
| Series 2020-HA, Class B | | |
| 2.78%, due 1/15/69 (a) | 2,580,000 | 1,987,612 |
| New Economy Assets Phase 1 Sponsor LLC (a) | |
| Series 2021-1, Class A1 | | |
| 1.91%, due 10/20/61 | 2,500,000 | 2,137,855 |
| Series 2021-1, Class B1 | | |
| 2.41%, due 10/20/61 | 1,345,000 | 1,120,711 |
| Progress Residential Trust | |
| Series 2021-SFR4, Class B | | |
| 1.808%, due 5/17/38 (a) | 1,215,000 | 1,074,389 |
| Taco Bell Funding LLC | |
| Series 2021-1A, Class A23 | | |
| 2.542%, due 8/25/51 (a) | 977,587 | 734,364 |
The notes to the financial statements are an integral part of, and should be read in conjunction with, the financial statements.
11
Portfolio of Investments October 31, 2023†^ (continued)
| | Principal
Amount | Value |
| Asset-Backed Securities (continued) |
| Other Asset-Backed Securities (continued) |
| United Airlines Pass-Through Trust | |
| Series 2020-1, Class A | | |
| 5.875%, due 10/15/27 | $ 1,289,438 | $ 1,269,504 |
| | | 20,765,305 |
Total Asset-Backed Securities
(Cost $50,031,590) | | 45,352,030 |
| Corporate Bonds 32.7% |
| Agriculture 0.6% |
| Altria Group, Inc. | | |
| 2.45%, due 2/4/32 | 1,850,000 | 1,350,028 |
| 4.80%, due 2/14/29 | 285,000 | 266,928 |
| BAT Capital Corp. | | |
| 3.734%, due 9/25/40 | 720,000 | 456,589 |
| BAT International Finance plc | | |
| 4.448%, due 3/16/28 | 65,000 | 59,890 |
| | | 2,133,435 |
| Airlines 1.6% |
| American Airlines, Inc. (a) | | |
| 5.50%, due 4/20/26 | 1,204,167 | 1,170,990 |
| 5.75%, due 4/20/29 | 860,000 | 775,767 |
| Delta Air Lines, Inc. (a) | | |
| 4.50%, due 10/20/25 | 743,008 | 722,186 |
| 4.75%, due 10/20/28 | 1,855,000 | 1,743,666 |
| Mileage Plus Holdings LLC | | |
| 6.50%, due 6/20/27 (a) | 1,350,000 | 1,333,635 |
| | | 5,746,244 |
| Auto Manufacturers 2.5% |
| Ford Motor Credit Co. LLC | | |
| 2.30%, due 2/10/25 | 755,000 | 712,954 |
| 4.125%, due 8/17/27 | 610,000 | 553,824 |
| 6.80%, due 5/12/28 (b) | 700,000 | 698,000 |
| 6.95%, due 3/6/26 | 670,000 | 671,156 |
| 7.20%, due 6/10/30 | 555,000 | 554,622 |
| General Motors Co. | | |
| 5.60%, due 10/15/32 | 410,000 | 374,386 |
| General Motors Financial Co., Inc. | | |
| 2.70%, due 6/10/31 | 1,335,000 | 1,003,954 |
| 4.30%, due 4/6/29 | 940,000 | 835,240 |
| Nissan Motor Acceptance Co. LLC (a) | | |
| 1.125%, due 9/16/24 | 1,015,000 | 968,430 |
| 1.85%, due 9/16/26 | 2,670,000 | 2,311,271 |
| | Principal
Amount | Value |
| |
| Auto Manufacturers (continued) |
| Volkswagen Group of America Finance LLC | | |
| 4.60%, due 6/8/29 (a)(b) | $ 440,000 | $ 404,455 |
| | | 9,088,292 |
| Banks 11.7% |
| Banco Santander SA | | |
| 5.294%, due 8/18/27 | 1,400,000 | 1,335,955 |
| Bank of America Corp. | | |
| 2.087%, due 6/14/29 (c) | 540,000 | 445,849 |
| 2.496%, due 2/13/31 (c) | 755,000 | 595,090 |
| 3.593%, due 7/21/28 (c) | 935,000 | 846,130 |
| 3.705%, due 4/24/28 (c) | 830,000 | 758,196 |
| 4.25%, due 10/22/26 | 1,550,000 | 1,462,730 |
| Series MM | | |
| 4.30%, due 1/28/25 (c)(d) | 910,000 | 817,657 |
| Barclays plc (d)(e) | | |
| 4.375% (5 Year Treasury Constant Maturity Rate + 3.41%), due 3/15/28 | 2,135,000 | 1,459,206 |
| 8.00% (5 Year Treasury Constant Maturity Rate + 5.431%), due 3/15/29 | 370,000 | 327,265 |
| BNP Paribas SA (a)(d)(e) | | |
| 4.625% (5 Year Treasury Constant Maturity Rate + 3.34%), due 2/25/31 | 1,825,000 | 1,265,589 |
| 7.75% (5 Year Treasury Constant Maturity Rate + 4.899%), due 8/16/29 | 440,000 | 407,956 |
| BPCE SA (a) | | |
| 5.125%, due 1/18/28 | 345,000 | 328,811 |
| 6.714%, due 10/19/29 (c) | 410,000 | 404,220 |
| Citigroup, Inc. | | |
| 3.887%, due 1/10/28 (c) | 1,234,000 | 1,144,015 |
| Series Y | | |
| 4.15% (5 Year Treasury Constant Maturity Rate + 3.00%), due 11/15/26 (d)(e) | 765,000 | 595,640 |
| 5.30%, due 5/6/44 | 774,000 | 630,836 |
| Citizens Bank NA | | |
| 6.064%, due 10/24/25 (c) | 860,000 | 822,393 |
| Credit Agricole SA | | |
| 4.75% (5 Year Treasury Constant Maturity Rate + 3.237%), due 3/23/29 (a)(d)(e) | 1,780,000 | 1,317,568 |
| Deutsche Bank AG | | |
| 3.035%, due 5/28/32 (c) | 890,000 | 662,967 |
The notes to the financial statements are an integral part of, and should be read in conjunction with, the financial statements.
| 12 | MainStay MacKay Total Return Bond Fund |
| | Principal
Amount | Value |
| Corporate Bonds (continued) |
| Banks (continued) |
| Deutsche Bank AG (continued) | | |
| 6.589% (SOFR + 1.219%), due 11/16/27 (e) | $ 1,515,000 | $ 1,454,287 |
| First Horizon Bank | | |
| 5.75%, due 5/1/30 | 1,606,000 | 1,359,248 |
| First Horizon Corp. | | |
| 4.00%, due 5/26/25 | 2,115,000 | 1,967,373 |
| Goldman Sachs Group, Inc. (The) | | |
| 1.948%, due 10/21/27 (c) | 1,305,000 | 1,144,505 |
| 1.992%, due 1/27/32 (c) | 740,000 | 542,870 |
| 6.75%, due 10/1/37 | 770,000 | 752,188 |
| HSBC Holdings plc | | |
| 3.973%, due 5/22/30 (c) | 800,000 | 691,185 |
| Intesa Sanpaolo SpA | | |
| 7.00%, due 11/21/25 (a) | 435,000 | 436,845 |
| JPMorgan Chase & Co. (c) | | |
| 2.182%, due 6/1/28 | 1,030,000 | 895,373 |
| 4.005%, due 4/23/29 | 1,030,000 | 938,053 |
| Series HH | | |
| 4.60%, due 2/1/25 (d) | 222,000 | 206,829 |
| Lloyds Banking Group plc | | |
| 4.582%, due 12/10/25 | 2,643,000 | 2,513,668 |
| 4.976% (1 Year Treasury Constant Maturity Rate + 2.30%), due 8/11/33 (e) | 680,000 | 590,281 |
| Macquarie Group Ltd. | | |
| 2.871%, due 1/14/33 (a)(c) | 1,770,000 | 1,308,076 |
| Mizuho Financial Group, Inc. | | |
| 3.261% (1 Year Treasury Constant Maturity Rate + 1.25%), due 5/22/30 (b)(e) | 610,000 | 518,758 |
| Morgan Stanley (c) | | |
| 2.484%, due 9/16/36 | 2,195,000 | 1,552,775 |
| 2.511%, due 10/20/32 | 510,000 | 381,462 |
| NatWest Group plc | | |
| 3.073% (1 Year Treasury Constant Maturity Rate + 2.55%), due 5/22/28 (e) | 1,985,000 | 1,755,830 |
| Santander Holdings USA, Inc. | | |
| 6.499%, due 3/9/29 (c) | 630,000 | 609,320 |
| Societe Generale SA (a)(d)(e) | | |
| 4.75% (5 Year Treasury Constant Maturity Rate + 3.931%), due 5/26/26 | 395,000 | 316,696 |
| 5.375% (5 Year Treasury Constant Maturity Rate + 4.514%), due 11/18/30 | 1,515,000 | 1,086,567 |
| | Principal
Amount | Value |
| |
| Banks (continued) |
| UBS Group AG (a) | | |
| 3.091%, due 5/14/32 (c) | $ 1,070,000 | $ 822,996 |
| 4.375% (5 Year Treasury Constant Maturity Rate + 3.313%), due 2/10/31 (d)(e) | 1,520,000 | 1,055,266 |
| 4.751% (1 Year Treasury Constant Maturity Rate + 1.75%), due 5/12/28 (e) | 340,000 | 319,418 |
| Wells Fargo & Co. (c) | | |
| 3.35%, due 3/2/33 | 700,000 | 551,157 |
| 3.526%, due 3/24/28 | 1,430,000 | 1,303,838 |
| Wells Fargo Bank NA | | |
| 5.85%, due 2/1/37 | 175,000 | 161,393 |
| Westpac Banking Corp. | | |
| 3.02% (5 Year Treasury Constant Maturity Rate + 1.53%), due 11/18/36 (e) | 2,013,000 | 1,447,946 |
| | | 42,312,276 |
| Biotechnology 0.1% |
| Amgen, Inc. | | |
| 5.75%, due 3/2/63 | 450,000 | 389,754 |
| Chemicals 0.8% |
| Braskem Netherlands Finance BV | | |
| 4.50%, due 1/10/28 (a) | 1,135,000 | 957,649 |
| Huntsman International LLC | | |
| 4.50%, due 5/1/29 | 1,964,000 | 1,756,670 |
| | | 2,714,319 |
| Commercial Services 0.3% |
| Ashtead Capital, Inc. | | |
| 4.00%, due 5/1/28 (a) | 640,000 | 572,100 |
| California Institute of Technology | | |
| 3.65%, due 9/1/2119 | 772,000 | 446,471 |
| | | 1,018,571 |
| Computers 0.6% |
| Dell International LLC | | |
| 3.375%, due 12/15/41 | 1,145,000 | 737,603 |
| 5.30%, due 10/1/29 | 765,000 | 729,784 |
| 8.10%, due 7/15/36 | 215,000 | 233,178 |
| NCR Voyix Corp. | | |
| 5.00%, due 10/1/28 (a) | 603,000 | 520,630 |
| | | 2,221,195 |
| Diversified Financial Services 3.0% |
| AerCap Ireland Capital DAC | | |
| 2.45%, due 10/29/26 | 2,300,000 | 2,045,917 |
The notes to the financial statements are an integral part of, and should be read in conjunction with, the financial statements.
13
Portfolio of Investments October 31, 2023†^ (continued)
| | Principal
Amount | Value |
| Corporate Bonds (continued) |
| Diversified Financial Services (continued) |
| Aircastle Ltd. | | |
| 5.25% (5 Year Treasury Constant Maturity Rate + 4.41%), due 6/15/26 (a)(d)(e) | $ 965,000 | $ 756,702 |
| Ally Financial, Inc. | | |
| 6.992%, due 6/13/29 (c) | 270,000 | 258,078 |
| 8.00%, due 11/1/31 | 1,205,000 | 1,176,132 |
| American Express Co. | | |
| 5.625%, due 7/28/34 (b)(c) | 480,000 | 437,467 |
| Aviation Capital Group LLC | | |
| 1.95%, due 1/30/26 (a) | 1,330,000 | 1,195,952 |
| Avolon Holdings Funding Ltd. (a) | | |
| 2.125%, due 2/21/26 | 1,385,000 | 1,235,280 |
| 3.25%, due 2/15/27 | 1,740,000 | 1,532,024 |
| Banco BTG Pactual SA | | |
| 2.75%, due 1/11/26 (a) | 880,000 | 809,606 |
| Capital One Financial Corp. | | |
| 6.312%, due 6/8/29 (c) | 905,000 | 866,513 |
| OneMain Finance Corp. | | |
| 3.50%, due 1/15/27 | 575,000 | 485,875 |
| | | 10,799,546 |
| Electric 3.5% |
| AEP Texas, Inc. | | |
| 4.70%, due 5/15/32 | 915,000 | 812,142 |
| Alabama Power Co. | | |
| 3.00%, due 3/15/52 | 1,015,000 | 572,426 |
| Arizona Public Service Co. | | |
| 2.20%, due 12/15/31 | 1,500,000 | 1,108,880 |
| 3.35%, due 5/15/50 | 1,320,000 | 775,856 |
| Calpine Corp. | | |
| 5.125%, due 3/15/28 (a) | 495,000 | 442,991 |
| Duquesne Light Holdings, Inc. | | |
| 3.616%, due 8/1/27 (a) | 990,000 | 879,211 |
| Edison International | | |
| Series B | | |
| 5.00% (5 Year Treasury Constant Maturity Rate + 3.901%), due 12/15/26 (d)(e) | 1,960,000 | 1,744,325 |
| Ohio Power Co. | | |
| Series R | | |
| 2.90%, due 10/1/51 | 585,000 | 326,714 |
| Pacific Gas and Electric Co. | | |
| 3.50%, due 8/1/50 | 2,235,000 | 1,243,804 |
| Public Service Co. of Oklahoma | | |
| 5.25%, due 1/15/33 | 340,000 | 312,986 |
| | Principal
Amount | Value |
| |
| Electric (continued) |
| Sempra | | |
| 5.50%, due 8/1/33 | $ 740,000 | $ 688,187 |
| Southern California Edison Co. | | |
| 4.00%, due 4/1/47 | 975,000 | 667,373 |
| 5.70%, due 3/1/53 | 685,000 | 595,448 |
| Southwestern Electric Power Co. | | |
| 3.25%, due 11/1/51 | 1,060,000 | 597,285 |
| Virginia Electric and Power Co. | | |
| 5.45%, due 4/1/53 | 415,000 | 353,731 |
| 5.70%, due 8/15/53 | 545,000 | 482,360 |
| Xcel Energy, Inc. | | |
| 5.45%, due 8/15/33 | 935,000 | 871,196 |
| | | 12,474,915 |
| Entertainment 0.2% |
| Warnermedia Holdings, Inc. | | |
| 4.279%, due 3/15/32 | 810,000 | 671,583 |
| Food 1.1% |
| J M Smucker Co. (The) | | |
| 6.50%, due 11/15/53 | 315,000 | 297,005 |
| JBS USA LUX SA | | |
| 5.75%, due 4/1/33 | 1,395,000 | 1,232,090 |
| MARB BondCo plc | | |
| 3.95%, due 1/29/31 (a) | 1,240,000 | 910,268 |
| Smithfield Foods, Inc. (a) | | |
| 4.25%, due 2/1/27 | 965,000 | 885,945 |
| 5.20%, due 4/1/29 | 580,000 | 523,265 |
| | | 3,848,573 |
| Gas 0.7% |
| Brooklyn Union Gas Co. (The) | | |
| 6.388%, due 9/15/33 (a) | 725,000 | 692,225 |
| National Fuel Gas Co. | | |
| 2.95%, due 3/1/31 | 1,820,000 | 1,383,498 |
| Piedmont Natural Gas Co., Inc. | | |
| 5.05%, due 5/15/52 | 620,000 | 483,681 |
| | | 2,559,404 |
| Insurance 0.5% |
| Liberty Mutual Group, Inc. | | |
| 3.951%, due 10/15/50 (a) | 1,610,000 | 1,017,611 |
| Nippon Life Insurance Co. | | |
| 3.40% (5 Year Treasury Constant Maturity Rate + 2.612%), due 1/23/50 (a)(b)(e) | 290,000 | 240,086 |
The notes to the financial statements are an integral part of, and should be read in conjunction with, the financial statements.
| 14 | MainStay MacKay Total Return Bond Fund |
| | Principal
Amount | Value |
| Corporate Bonds (continued) |
| Insurance (continued) |
| Willis North America, Inc. | | |
| 2.95%, due 9/15/29 | $ 700,000 | $ 586,900 |
| | | 1,844,597 |
| Media 0.2% |
| CCO Holdings LLC | | |
| 4.75%, due 3/1/30 (a) | 495,000 | 408,337 |
| DISH DBS Corp. | | |
| 5.75%, due 12/1/28 (a) | 635,000 | 461,169 |
| | | 869,506 |
| Miscellaneous—Manufacturing 0.4% |
| Textron Financial Corp. | | |
| 7.361% (3 Month SOFR + 1.997%), due 2/15/42 (a)(e) | 1,685,000 | 1,314,351 |
| Oil & Gas 0.3% |
| Gazprom PJSC Via Gaz Capital SA | | |
| 4.95%, due 2/6/28 (a)(f) | 1,521,000 | 1,038,082 |
| Packaging & Containers 0.1% |
| Owens-Brockway Glass Container, Inc. | | |
| 6.625%, due 5/13/27 (a) | 571,000 | 542,450 |
| Pharmaceuticals 0.4% |
| Teva Pharmaceutical Finance Netherlands III BV | | |
| 3.15%, due 10/1/26 | 1,653,000 | 1,455,342 |
| Pipelines 2.9% |
| Cheniere Corpus Christi Holdings LLC | | |
| 2.742%, due 12/31/39 | 1,385,000 | 998,500 |
| Columbia Pipelines Operating Co. LLC | | |
| 6.544%, due 11/15/53 (a) | 625,000 | 574,080 |
| DT Midstream, Inc. | | |
| 4.30%, due 4/15/32 (a) | 1,125,000 | 947,678 |
| Enbridge, Inc. | | |
| 5.70%, due 3/8/33 | 915,000 | 855,556 |
| Energy Transfer LP | | |
| 5.35%, due 5/15/45 | 940,000 | 738,666 |
| EnLink Midstream LLC | | |
| 5.625%, due 1/15/28 (a) | 475,000 | 447,889 |
| Flex Intermediate Holdco LLC | | |
| 3.363%, due 6/30/31 (a) | 2,120,000 | 1,597,762 |
| Hess Midstream Operations LP (a) | | |
| 4.25%, due 2/15/30 | 565,000 | 483,457 |
| | Principal
Amount | Value |
| |
| Pipelines (continued) |
Hess Midstream Operations LP (a)
(continued) | | |
| 5.625%, due 2/15/26 | $ 726,000 | $ 703,087 |
| MPLX LP | | |
| 5.65%, due 3/1/53 | 460,000 | 378,373 |
| Targa Resources Corp. | | |
| 4.20%, due 2/1/33 | 640,000 | 530,472 |
| Venture Global LNG, Inc. | | |
| 9.875%, due 2/1/32 (a) | 535,000 | 542,484 |
| Western Midstream Operating LP | | |
| 5.25%, due 2/1/50 (g) | 1,240,000 | 916,310 |
| Williams Cos., Inc. (The) | | |
| 3.50%, due 10/15/51 | 1,095,000 | 661,801 |
| | | 10,376,115 |
| Real Estate Investment Trusts 0.4% |
| Alexandria Real Estate Equities, Inc. | | |
| 3.375%, due 8/15/31 | 415,000 | 336,743 |
| Invitation Homes Operating Partnership LP | | |
| 2.00%, due 8/15/31 | 1,490,000 | 1,072,842 |
| Iron Mountain, Inc. | | |
| 4.875%, due 9/15/29 (a) | 185,000 | 161,146 |
| | | 1,570,731 |
| Retail 0.3% |
| AutoNation, Inc. | | |
| 4.75%, due 6/1/30 | 756,000 | 662,161 |
| Nordstrom, Inc. | | |
| 4.25%, due 8/1/31 | 625,000 | 457,863 |
| | | 1,120,024 |
| Telecommunications 0.3% |
| Altice France SA | | |
| 5.125%, due 7/15/29 (a) | 1,060,000 | 725,741 |
| AT&T, Inc. | | |
| 5.40%, due 2/15/34 | 400,000 | 367,532 |
| | | 1,093,273 |
| Trucking & Leasing 0.2% |
| Penske Truck Leasing Co. LP | | |
| 6.05%, due 8/1/28 (a) | 710,000 | 696,572 |
Total Corporate Bonds
(Cost $141,873,846) | | 117,899,150 |
The notes to the financial statements are an integral part of, and should be read in conjunction with, the financial statements.
15
Portfolio of Investments October 31, 2023†^ (continued)
| | Principal
Amount | Value |
| Foreign Government Bonds 2.0% |
| Chile 0.4% |
| Empresa Nacional del Petroleo | | |
| 3.45%, due 9/16/31 (a) | $ 1,615,000 | $ 1,252,845 |
| Colombia 0.3% |
| Colombia Government Bond | | |
| 3.25%, due 4/22/32 (b) | 1,485,000 | 1,062,408 |
| Mexico 1.3% |
| Comision Federal de Electricidad | | |
| 3.875%, due 7/26/33 (a) | 2,445,000 | 1,772,262 |
| Petroleos Mexicanos | | |
| 6.50%, due 3/13/27 | 2,730,000 | 2,408,135 |
| 6.75%, due 9/21/47 | 1,080,000 | 611,715 |
| | | 4,792,112 |
Total Foreign Government Bonds
(Cost $9,393,744) | | 7,107,365 |
| Loan Assignments 0.2% |
| Diversified/Conglomerate Service 0.2% |
| TruGreen LP | |
| First Lien Second Refinancing Term Loan | |
| 9.424% (1 Month SOFR + 4.00%), due 11/2/27 (e) | 596,302 | 558,139 |
Total Loan Assignments
(Cost $592,823) | | 558,139 |
| Mortgage-Backed Securities 41.1% |
| Agency (Collateralized Mortgage Obligations) 19.0% |
| FHLMC | |
| REMIC, Series 5326, Class QO | | |
| (zero coupon), due 9/25/50 | 1,413,872 | 923,918 |
| REMIC, Series 5021, Class SA | | |
| (zero coupon) (SOFR 30A + 3.55%), due 10/25/50 (e)(h) | 2,292,167 | 23,054 |
| REMIC, Series 5200, Class SA | | |
| (zero coupon) (SOFR 30A + 3.50%), due 2/25/52 (e)(h) | 336,858 | 3,075 |
| REMIC, Series 5326 | | |
| (zero coupon), due 8/25/53 | 437,335 | 304,469 |
| REMIC, Series 5351, Class DO | | |
| (zero coupon), due 9/25/53 | 835,000 | 559,737 |
| REMIC, Series 5315, Class OQ | | |
| (zero coupon), due 1/25/55 | 699,391 | 543,711 |
| | Principal
Amount | Value |
| |
| Agency (Collateralized Mortgage Obligations) (continued) |
| FHLMC (continued) | |
| REMIC, Series 5328, Class JY | | |
| 0.25%, due 9/25/50 | $ 1,307,758 | $ 805,578 |
| REMIC, Series 4993, Class KS | | |
| 0.615% (SOFR 30A + 5.936%), due 7/25/50 (e)(h) | 3,101,887 | 299,910 |
| REMIC, Series 4994, Class TS | | |
| 0.665% (SOFR 30A + 5.986%), due 7/25/50 (e)(h) | 1,558,452 | 140,935 |
| REMIC, Series 5092, Class XA | | |
| 1.00%, due 1/15/41 | 996,090 | 792,203 |
| REMIC, Series 4988, Class BA | | |
| 1.50%, due 6/25/50 | 350,393 | 233,637 |
| REMIC, Series 4120, Class ZA | | |
| 3.00%, due 10/15/42 | 695,198 | 582,028 |
| REMIC, Series 4913, Class UA | | |
| 3.00%, due 3/15/49 | 1,135,331 | 948,123 |
| REMIC, Series 5070, Class PI | | |
| 3.00%, due 8/25/50 (h) | 1,487,525 | 263,831 |
| REMIC, Series 5011, Class MI | | |
| 3.00%, due 9/25/50 (h) | 1,336,043 | 207,801 |
| REMIC, Series 5094, Class IP | | |
| 3.00%, due 4/25/51 (h) | 1,161,944 | 180,841 |
| REMIC, Series 5160 | | |
| 3.00%, due 10/25/51 (h) | 1,270,767 | 156,076 |
| REMIC, Series 4710, Class WZ | | |
| 3.50%, due 8/15/47 | 862,152 | 715,905 |
| REMIC, Series 4725, Class WZ | | |
| 3.50%, due 11/15/47 | 1,547,793 | 1,279,661 |
| REMIC, Series 5304, Class UB | | |
| 4.00%, due 2/25/52 | 1,186,430 | 1,031,744 |
| REMIC, Series 5268, Class B | | |
| 4.50%, due 10/25/52 | 816,614 | 735,843 |
| FHLMC, Strips | |
| Series 272 | | |
| (zero coupon), due 8/15/42 | 938,519 | 663,675 |
| Series 311 | | |
| (zero coupon), due 8/15/43 | 531,329 | 371,963 |
| Series 402 | | |
| (zero coupon), due 9/25/53 | 999,862 | 744,006 |
| Series 311, Class S1 | | |
| 0.515% (SOFR 30A + 5.836%), due 8/15/43 (e)(h) | 1,471,435 | 114,502 |
| Series 389, Class C35 | | |
| 2.00%, due 6/15/52 (h) | 2,329,429 | 282,443 |
The notes to the financial statements are an integral part of, and should be read in conjunction with, the financial statements.
| 16 | MainStay MacKay Total Return Bond Fund |
| | Principal
Amount | Value |
| Mortgage-Backed Securities (continued) |
| Agency (Collateralized Mortgage Obligations) (continued) |
| FNMA | |
| REMIC, Series 2022-3, Class YS | | |
| (zero coupon) (SOFR 30A + 2.55%), due 2/25/52 (e)(h) | $ 8,060,833 | $ 14,988 |
| REMIC, Series 2022-5, Class SN | | |
| (zero coupon) (SOFR 30A + 1.80%), due 2/25/52 (e)(h) | 1,004,687 | 418 |
| REMIC, Series 2023-45 | | |
| (zero coupon), due 10/25/53 | 828,100 | 574,016 |
| REMIC, Series 2023-24, Class OQ | | |
| (zero coupon), due 7/25/54 | 899,860 | 702,186 |
| REMIC, Series 2022-10, Class SA | | |
| 0.429% (SOFR 30A + 5.75%), due 2/25/52 (e)(h) | 2,208,783 | 199,754 |
| REMIC, Series 2021-40, Class SI | | |
| 0.515% (SOFR 30A + 5.836%), due 9/25/47 (e)(h) | 1,764,553 | 126,080 |
| REMIC, Series 2016-57, Class SN | | |
| 0.615% (SOFR 30A + 5.936%), due 6/25/46 (e)(h) | 1,462,003 | 107,796 |
| REMIC, Series 2020-70, Class SD | | |
| 0.815% (SOFR 30A + 6.136%), due 10/25/50 (e)(h) | 1,549,188 | 148,510 |
| REMIC, Series 2020-47, Class BD | | |
| 1.50%, due 7/25/50 | 302,738 | 200,872 |
| REMIC, Series 2020-70, Class AD | | |
| 1.50%, due 10/25/50 | 1,788,582 | 1,307,632 |
| REMIC, Series 2020-49, Class PB | | |
| 1.75%, due 7/25/50 | 407,004 | 292,936 |
| REMIC, Series 2021-10, Class LI | | |
| 2.50%, due 3/25/51 (h) | 678,554 | 95,843 |
| REMIC, Series 2021-12, Class JI | | |
| 2.50%, due 3/25/51 (h) | 1,013,541 | 160,187 |
| REMIC, Series 2021-34, Class MI | | |
| 2.50%, due 3/25/51 (h) | 6,200,430 | 701,817 |
| REMIC, Series 2021-54, Class HI | | |
| 2.50%, due 6/25/51 (h) | 466,014 | 60,572 |
| REMIC, Series 2013-77, Class CY | | |
| 3.00%, due 7/25/43 | 1,975,259 | 1,616,948 |
| REMIC, Series 2017-83, Class CZ | | |
| 3.00%, due 10/25/47 | 1,439,929 | 1,176,986 |
| REMIC, Series 2021-53, Class GI | | |
| 3.00%, due 7/25/48 (h) | 7,596,082 | 1,171,701 |
| REMIC, Series 2019-13, Class PE | | |
| 3.00%, due 3/25/49 | 1,107,295 | 935,623 |
| REMIC, Series 2021-85, Class BI | | |
| 3.00%, due 12/25/51 (h) | 2,759,031 | 453,399 |
| | Principal
Amount | Value |
| |
| Agency (Collateralized Mortgage Obligations) (continued) |
| FNMA (continued) | |
| REMIC, Series 2021-12, Class GC | | |
| 3.50%, due 7/25/50 | $ 1,488,635 | $ 1,248,167 |
| REMIC, Series 2021-8, Class ID | | |
| 3.50%, due 3/25/51 (h) | 1,797,325 | 356,979 |
| FNMA, Strips (h) | |
| REMIC, Series 426, Class C32 | | |
| 1.50%, due 2/25/52 | 3,515,250 | 327,857 |
| REMIC, Series 427, Class C77 | | |
| 2.50%, due 9/25/51 | 2,822,116 | 409,573 |
| REMIC, Series 429, Class C5 | | |
| 3.00%, due 10/25/52 | 3,748,465 | 657,330 |
| GNMA | |
| Series 2020-1, Class YS | | |
| (zero coupon) (1 Month SOFR + 2.716%), due 1/20/50 (e)(h) | 2,433,633 | 8,282 |
| Series 2020-129, Class SB | | |
| (zero coupon) (1 Month SOFR + 3.086%), due 9/20/50 (e)(h) | 3,402,422 | 16,219 |
| Series 2023-101, Class KO | | |
| (zero coupon), due 1/20/51 | 2,023,400 | 1,265,696 |
| Series 2021-77, Class SN | | |
| (zero coupon) (1 Month SOFR + 2.486%), due 5/20/51 (e)(h) | 5,641,909 | 16,046 |
| Series 2021-97, Class SA | | |
| (zero coupon) (SOFR 30A + 2.60%), due 6/20/51 (e)(h) | 4,669,351 | 12,994 |
| Series 2021-158, Class SB | | |
| (zero coupon) (SOFR 30A + 3.70%), due 9/20/51 (e)(h) | 2,784,925 | 37,286 |
| Series 2021-205, Class DS | | |
| (zero coupon) (SOFR 30A + 3.20%), due 11/20/51 (e)(h) | 5,590,001 | 27,724 |
| Series 2021-213, Class ES | | |
| (zero coupon) (SOFR 30A + 1.70%), due 12/20/51 (e)(h) | 12,940,133 | 4,629 |
| Series 2022-19, Class SG | | |
| (zero coupon) (SOFR 30A + 2.45%), due 1/20/52 (e)(h) | 4,365,578 | 8,252 |
| Series 2022-24, Class SC | | |
| (zero coupon) (SOFR 30A + 2.37%), due 2/20/52 (e)(h) | 22,502,638 | 32,575 |
| Series 2022-34, Class HS | | |
| (zero coupon) (SOFR 30A + 4.10%), due 2/20/52 (e)(h) | 4,375,495 | 103,796 |
| Series 2023-56 | | |
| (zero coupon), due 7/20/52 | 1,249,269 | 1,108,217 |
The notes to the financial statements are an integral part of, and should be read in conjunction with, the financial statements.
17
Portfolio of Investments October 31, 2023†^ (continued)
| | Principal
Amount | Value |
| Mortgage-Backed Securities (continued) |
| Agency (Collateralized Mortgage Obligations) (continued) |
| GNMA (continued) | |
| Series 2023-66, Class OQ | | |
| (zero coupon), due 7/20/52 | $ 1,242,725 | $ 909,666 |
| Series 2023-53 | | |
| (zero coupon), due 4/20/53 | 577,055 | 394,326 |
| Series 2023-80, Class SA | | |
| (zero coupon) (SOFR 30A + 5.25%), due 6/20/53 (e)(h) | 5,114,100 | 148,874 |
| Series 2023-60, Class ES | | |
| 0.557% (SOFR 30A + 11.20%), due 4/20/53 (e) | 1,344,472 | 1,163,403 |
| Series 2020-146, Class SA | | |
| 0.846% (1 Month SOFR + 6.186%), due 10/20/50 (e)(h) | 1,759,603 | 173,922 |
| Series 2020-167, Class SN | | |
| 0.846% (1 Month SOFR + 6.186%), due 11/20/50 (e)(h) | 868,015 | 80,662 |
| Series 2021-179, Class SA | | |
| 0.846% (1 Month SOFR + 6.186%), due 11/20/50 (e)(h) | 2,572,573 | 243,966 |
| Series 2020-189, Class SU | | |
| 0.846% (1 Month SOFR + 6.186%), due 12/20/50 (e)(h) | 577,247 | 55,827 |
| Series 2021-46, Class QS | | |
| 0.846% (1 Month SOFR + 6.186%), due 3/20/51 (e)(h) | 1,037,442 | 101,580 |
| Series 2021-46, Class TS | | |
| 0.846% (1 Month SOFR + 6.186%), due 3/20/51 (e)(h) | 1,253,839 | 123,437 |
| Series 2021-57, Class SA | | |
| 0.846% (1 Month SOFR + 6.186%), due 3/20/51 (e)(h) | 2,045,976 | 199,293 |
| Series 2021-57, Class SD | | |
| 0.846% (1 Month SOFR + 6.186%), due 3/20/51 (e)(h) | 2,536,010 | 244,860 |
| Series 2021-96, Class NS | | |
| 0.846% (1 Month SOFR + 6.186%), due 6/20/51 (e)(h) | 3,357,531 | 322,885 |
| Series 2021-96, Class SN | | |
| 0.846% (1 Month SOFR + 6.186%), due 6/20/51 (e)(h) | 2,294,078 | 213,125 |
| Series 2021-97, Class SM | | |
| 0.846% (1 Month SOFR + 6.186%), due 6/20/51 (e)(h) | 2,471,660 | 240,399 |
| Series 2021-122, Class HS | | |
| 0.846% (1 Month SOFR + 6.186%), due 7/20/51 (e)(h) | 2,052,162 | 215,682 |
| | Principal
Amount | Value |
| |
| Agency (Collateralized Mortgage Obligations) (continued) |
| GNMA (continued) | |
| Series 2022-137, Class S | | |
| 0.846% (1 Month SOFR + 6.186%), due 7/20/51 (e)(h) | $ 2,337,517 | $ 223,963 |
| Series 2021-96, Class JS | | |
| 0.896% (1 Month SOFR + 6.236%), due 6/20/51 (e)(h) | 1,813,374 | 149,362 |
| Series 2020-97, Class HB | | |
| 1.00%, due 7/20/50 | 547,190 | 375,776 |
| Series 2020-146, Class YK | | |
| 1.00%, due 10/20/50 | 1,129,672 | 787,578 |
| Series 2020-166, Class CA | | |
| 1.00%, due 11/20/50 | 1,296,596 | 889,896 |
| Series 2023-86, Class SE | | |
| 1.329% (SOFR 30A + 6.65%), due 9/20/50 (e)(h) | 1,594,163 | 169,862 |
| Series 2020-165, Class UD | | |
| 1.50%, due 11/20/50 | 481,989 | 339,747 |
| Series 2023-66, Class MP | | |
| 1.657% (SOFR 30A + 12.30%), due 5/20/53 (e) | 1,306,708 | 1,119,513 |
| Series 2021-41, Class FS | | |
| 2.00% (SOFR 30A + 0.20%), due 10/20/50 (e)(h) | 2,692,676 | 293,515 |
| Series 2020-166, Class IC | | |
| 2.00%, due 11/20/50 (h) | 1,239,446 | 123,753 |
| Series 2020-185, Class BI | | |
| 2.00%, due 12/20/50 (h) | 1,350,262 | 147,283 |
| Series 2022-10, Class IC | | |
| 2.00%, due 11/20/51 (h) | 1,949,162 | 225,936 |
| Series 2021-97, Class IN | | |
| 2.50%, due 8/20/49 (h) | 3,079,878 | 327,578 |
| Series 2022-1, Class IA | | |
| 2.50%, due 6/20/50 (h) | 471,589 | 63,683 |
| Series 2020-122, Class IW | | |
| 2.50%, due 7/20/50 (h) | 1,613,758 | 207,859 |
| Series 2020-151, Class TI | | |
| 2.50%, due 10/20/50 (h) | 1,509,257 | 195,261 |
| Series 2020-173, Class EI | | |
| 2.50%, due 11/20/50 (h) | 1,705,849 | 230,338 |
| Series 2021-1, Class PI | | |
| 2.50%, due 12/20/50 (h) | 809,889 | 102,934 |
| Series 2021-83, Class FM | | |
| 2.50% (SOFR 30A + 0.51%), due 5/20/51 (e) | 2,421,551 | 1,792,010 |
| Series 2021-140, Class GF | | |
| 2.50% (1 Month SOFR + 0.764%), due 8/20/51 (e) | 908,382 | 672,028 |
The notes to the financial statements are an integral part of, and should be read in conjunction with, the financial statements.
| 18 | MainStay MacKay Total Return Bond Fund |
| | Principal
Amount | Value |
| Mortgage-Backed Securities (continued) |
| Agency (Collateralized Mortgage Obligations) (continued) |
| GNMA (continued) | |
| Series 2021-177, Class CI | | |
| 2.50%, due 10/20/51 (h) | $ 1,749,145 | $ 226,650 |
| Series 2021-188 | | |
| 2.50%, due 10/20/51 (h) | 2,920,943 | 418,634 |
| Series 2022-83 | | |
| 2.50%, due 11/20/51 (h) | 2,132,505 | 278,779 |
| Series 2022-1, Class CF | | |
| 2.50% (SOFR 30A + 0.80%), due 1/20/52 (e) | 1,804,799 | 1,332,672 |
| Series 2021-1, Class IT | | |
| 3.00%, due 1/20/51 (h) | 1,883,031 | 281,099 |
| Series 2021-44, Class IQ | | |
| 3.00%, due 3/20/51 (h) | 2,739,444 | 410,235 |
| Series 2021-74, Class HI | | |
| 3.00%, due 4/20/51 (h) | 333,712 | 49,404 |
| Series 2021-97, Class FA | | |
| 3.00% (SOFR 30A + 0.40%), due 6/20/51 (e) | 590,630 | 476,238 |
| Series 2021-98, Class IN | | |
| 3.00%, due 6/20/51 (h) | 1,103,862 | 195,763 |
| Series 2021-98, Class KI | | |
| 3.00%, due 6/20/51 (h) | 5,961,037 | 968,787 |
| Series 2022-189, Class AT | | |
| 3.00%, due 7/20/51 | 1,378,446 | 1,122,256 |
| Series 2021-139, Class IA | | |
| 3.00%, due 8/20/51 (h) | 7,700,231 | 1,215,302 |
| Series 2022-207 | | |
| 3.00%, due 8/20/51 (h) | 1,736,189 | 274,481 |
| Series 2023-19, Class CI | | |
| 3.00%, due 11/20/51 (h) | 2,251,756 | 347,516 |
| Series 2022-207, Class NA | | |
| 3.00%, due 1/20/52 | 2,194,444 | 1,759,424 |
| Series 2022-206, Class CN | | |
| 3.00%, due 2/20/52 | 738,122 | 597,379 |
| Series 2019-92, Class GF | | |
| 3.50% (1 Month SOFR + 0.804%), due 7/20/49 (e) | 594,607 | 483,721 |
| Series 2019-97, Class FG | | |
| 3.50% (1 Month SOFR + 0.804%), due 8/20/49 (e) | 1,236,863 | 1,005,964 |
| Series 2019-110, Class FG | | |
| 3.50% (1 Month SOFR + 0.764%), due 9/20/49 (e) | 429,008 | 348,630 |
| Series 2019-128, Class KF | | |
| 3.50% (1 Month SOFR + 0.764%), due 10/20/49 (e) | 651,253 | 528,841 |
| | Principal
Amount | Value |
| |
| Agency (Collateralized Mortgage Obligations) (continued) |
| GNMA (continued) | |
| Series 2019-128, Class YF | | |
| 3.50% (1 Month SOFR + 0.764%), due 10/20/49 (e) | $ 847,347 | $ 689,938 |
| Series 2020-5, Class FA | | |
| 3.50% (1 Month SOFR + 0.814%), due 1/20/50 (e) | 1,128,134 | 916,539 |
| Series 2023-63, Class MA | | |
| 3.50%, due 5/20/50 | 2,666,633 | 2,271,725 |
| Series 2021-125, Class AF | | |
| 3.50% (SOFR 30A + 0.25%), due 7/20/51 (e) | 1,300,803 | 1,068,007 |
| Series 2021-146, Class IN | | |
| 3.50%, due 8/20/51 (h) | 1,972,524 | 357,732 |
| Series 2023-1, Class HD | | |
| 3.50%, due 1/20/52 | 2,080,004 | 1,766,253 |
| Series 2022-206, Class WN | | |
| 4.00%, due 10/20/49 | 910,392 | 789,550 |
| Series 2022-69, Class FA | | |
| 4.50% (SOFR 30A + 0.75%), due 4/20/52 (e) | 721,221 | 639,794 |
| Series 2023-81, Class LA | | |
| 5.00%, due 6/20/52 | 837,407 | 792,542 |
| Series 2023-38, Class WT | | |
| 6.768%, due 12/20/51 (i) | 549,998 | 552,824 |
| Series 2023-59, Class YC | | |
| 6.954%, due 9/20/51 (i) | 1,392,505 | 1,434,763 |
| Series 2023-55, Class CG | | |
| 7.496%, due 7/20/51 (i) | 1,341,637 | 1,399,975 |
| Series 2023-55, Class LB | | |
| 7.917%, due 11/20/51 (i) | 1,618,573 | 1,764,503 |
| Series 2019-136, Class YS | | |
| 9.674% (1 Month SOFR + 2.716%), due 11/20/49 (e)(h) | 781,410 | 2,452 |
| | | 68,636,709 |
| Commercial Mortgage Loans (Collateralized Mortgage Obligations) 7.8% |
| BAMLL Commercial Mortgage Securities Trust (a)(e) | |
| Series 2022-DKLX, Class D | | |
| 8.335% (1 Month SOFR + 3.00%), due 1/15/39 | 400,000 | 385,763 |
| Series 2022-DKLX, Class F | | |
| 10.292% (1 Month SOFR + 4.957%), due 1/15/39 | 800,000 | 762,961 |
The notes to the financial statements are an integral part of, and should be read in conjunction with, the financial statements.
19
Portfolio of Investments October 31, 2023†^ (continued)
| | Principal
Amount | Value |
| Mortgage-Backed Securities (continued) |
| Commercial Mortgage Loans (Collateralized Mortgage Obligations) (continued) |
| Bayview Commercial Asset Trust | |
| Series 2006-4A, Class A1 | | |
| 5.784% (1 Month SOFR + 0.459%), due 12/25/36 (a)(e) | $ 20,667 | $ 18,842 |
| BBCMS Mortgage Trust (a)(e) | |
| Series 2018-TALL, Class B | | |
| 6.503% (1 Month SOFR + 1.168%), due 3/15/37 | 185,000 | 160,487 |
| Series 2018-TALL, Class C | | |
| 6.653% (1 Month SOFR + 1.318%), due 3/15/37 | 575,000 | 461,438 |
| Series 2018-TALL, Class D | | |
| 6.981% (1 Month SOFR + 1.646%), due 3/15/37 | 700,000 | 531,641 |
| BX Commercial Mortgage Trust (a) | |
| Series 2020-VIVA, Class D | | |
| 3.549%, due 3/11/44 (j) | 805,000 | 622,013 |
| Series 2021-VOLT, Class C | | |
| 6.549% (1 Month SOFR + 1.214%), due 9/15/36 (e) | 970,000 | 931,833 |
| BX Trust (a) | |
| Series 2019-OC11, Class C | | |
| 3.856%, due 12/9/41 | 1,709,000 | 1,402,586 |
| Series 2019-OC11, Class E | | |
| 3.944%, due 12/9/41 (j) | 1,159,000 | 899,883 |
| Series 2023-LIFE, Class A | | |
| 5.045%, due 2/15/28 | 450,000 | 416,703 |
| Series 2023-LIFE, Class B | | |
| 5.391%, due 2/15/28 | 535,000 | 495,181 |
| Series 2022-PSB, Class B | | |
| 8.283% (1 Month SOFR + 2.949%), due 8/15/39 (e) | 327,734 | 327,719 |
| Series 2022-PSB, Class C | | |
| 9.032% (1 Month SOFR + 3.697%), due 8/15/39 (e) | 584,607 | 584,541 |
| BXHPP Trust (a)(e) | |
| Series 2021-FILM, Class A | | |
| 6.098% (1 Month SOFR + 0.764%), due 8/15/36 | 870,000 | 819,231 |
| Series 2021-FILM, Class B | | |
| 6.348% (1 Month SOFR + 1.014%), due 8/15/36 | 500,000 | 456,268 |
| Citigroup Commercial Mortgage Trust | |
| Series 2023-SMRT, Class A | | |
| 5.82%, due 10/12/40 (a)(i) | 855,000 | 823,565 |
| | Principal
Amount | Value |
| |
| Commercial Mortgage Loans (Collateralized Mortgage Obligations) (continued) |
| Commercial Mortgage Trust | |
| Series 2015-LC21, Class A4 | | |
| 3.708%, due 7/10/48 | $ 245,000 | $ 234,017 |
| CSMC WEST Trust | |
| Series 2020-WEST, Class A | | |
| 3.04%, due 2/15/35 (a) | 1,685,000 | 1,176,839 |
| FREMF Mortgage Trust (a)(j) | |
| Series 2015-K42, Class B | | |
| 3.848%, due 1/25/48 | 400,000 | 386,849 |
| Series 2018-K78, Class C | | |
| 4.129%, due 6/25/51 | 355,000 | 320,432 |
| GNMA (h)(j) | |
| Series 2020-177 | | |
| 0.817%, due 6/16/62 | 4,254,885 | 243,820 |
| Series 2021-164 | | |
| 0.948%, due 10/16/63 | 3,290,667 | 223,845 |
| Series 2021-108 | | |
| 0.967%, due 6/16/61 | 4,808,231 | 322,684 |
| Series 2020-168, Class IA | | |
| 0.978%, due 12/16/62 | 2,472,597 | 169,980 |
| Series 2021-47 | | |
| 0.992%, due 3/16/61 | 5,790,048 | 395,632 |
| J.P. Morgan Chase Commercial Mortgage Securities Trust | |
| Series 2021-2NU, Class A | | |
| 1.974%, due 1/5/40 (a) | 1,500,000 | 1,130,420 |
| Manhattan West Mortgage Trust | |
| Series 2020-1MW, Class A | | |
| 2.13%, due 9/10/39 (a) | 100,000 | 84,816 |
| Morgan Stanley Bank of America Merrill Lynch Trust | |
| Series 2017-C34, Class A4 | | |
| 3.536%, due 11/15/52 | 475,000 | 428,390 |
| Multifamily Connecticut Avenue Securities Trust (a)(e) | |
| Series 2019-01, Class M10 | | |
| 8.685% (SOFR 30A + 3.364%), due 10/25/49 | 2,253,515 | 2,169,942 |
| Series 2020-01, Class M10 | | |
| 9.185% (SOFR 30A + 3.864%), due 3/25/50 | 1,669,159 | 1,594,158 |
| One Bryant Park Trust | |
| Series 2019-OBP, Class A | | |
| 2.516%, due 9/15/54 (a) | 1,505,000 | 1,178,523 |
| One Market Plaza Trust | |
| Series 2017-1MKT, Class A | | |
| 3.614%, due 2/10/32 (a) | 1,120,000 | 1,019,200 |
The notes to the financial statements are an integral part of, and should be read in conjunction with, the financial statements.
| 20 | MainStay MacKay Total Return Bond Fund |
| | Principal
Amount | Value |
| Mortgage-Backed Securities (continued) |
| Commercial Mortgage Loans (Collateralized Mortgage Obligations) (continued) |
| ORL Trust (a)(e) | |
| Series 2023-GLKS, Class C | | |
| 8.985% (1 Month SOFR + 3.651%), due 10/15/28 | $ 1,060,000 | $ 1,055,795 |
| Series 2023-GLKS, Class D | | |
| 9.636% (1 Month SOFR + 4.301%), due 10/15/28 | 625,000 | 622,374 |
| SLG Office Trust (a) | |
| Series 2021-OVA, Class A | | |
| 2.585%, due 7/15/41 | 1,065,000 | 807,813 |
| Series 2021-OVA, Class F | | |
| 2.851%, due 7/15/41 | 660,000 | 428,976 |
| SMRT | |
| Series 2022-MINI, Class D | | |
| 7.285% (1 Month SOFR + 1.95%), due 1/15/39 (a)(e) | 1,155,000 | 1,092,783 |
| Wells Fargo Commercial Mortgage Trust | |
| Series 2018-AUS, Class A | | |
| 4.058%, due 8/17/36 (a)(j) | 1,250,000 | 1,103,262 |
| WFRBS Commercial Mortgage Trust | |
| Series 2014-C21, Class AS | | |
| 3.891%, due 8/15/47 | 1,815,000 | 1,719,536 |
| | | 28,010,741 |
| Whole Loan (Collateralized Mortgage Obligations) 14.3% |
| American Home Mortgage Investment Trust | |
| Series 2005-4, Class 3A1 | | |
| 6.039% (1 Month SOFR + 0.714%), due 11/25/45 (e) | 641,957 | 432,577 |
| CIM Trust | |
| Series 2021-J2, Class AS | | |
| 0.21%, due 4/25/51 (a)(h)(i) | 31,353,207 | 333,423 |
| Connecticut Avenue Securities Trust (a)(e) | |
| Series 2022-R01, Class 1M2 | | |
| 7.221% (SOFR 30A + 1.90%), due 12/25/41 | 405,000 | 398,930 |
| Series 2020-R02, Class 2M2 | | |
| 7.435% (SOFR 30A + 2.114%), due 1/25/40 | 227,970 | 228,254 |
| Series 2021-R03, Class 1B1 | | |
| 8.071% (SOFR 30A + 2.75%), due 12/25/41 | 1,725,000 | 1,705,973 |
| Series 2021-R01, Class 1B1 | | |
| 8.421% (SOFR 30A + 3.10%), due 10/25/41 | 2,285,000 | 2,277,885 |
| | Principal
Amount | Value |
| |
| Whole Loan (Collateralized Mortgage Obligations) (continued) |
| Connecticut Avenue Securities Trust (a)(e) (continued) | |
| Series 2022-R01, Class 1B1 | | |
| 8.471% (SOFR 30A + 3.15%), due 12/25/41 | $ 815,000 | $ 812,458 |
| Series 2022-R02, Class 2B1 | | |
| 9.821% (SOFR 30A + 4.50%), due 1/25/42 | 1,720,000 | 1,754,096 |
| Series 2021-R03, Class 1B2 | | |
| 10.821% (SOFR 30A + 5.50%), due 12/25/41 | 805,000 | 788,561 |
| Series 2022-R08, Class 1B1 | | |
| 10.921% (SOFR 30A + 5.60%), due 7/25/42 | 380,000 | 407,446 |
| Series 2021-R01, Class 1B2 | | |
| 11.321% (SOFR 30A + 6.00%), due 10/25/41 | 1,765,000 | 1,753,969 |
| Series 2022-R01, Class 1B2 | | |
| 11.321% (SOFR 30A + 6.00%), due 12/25/41 | 700,000 | 696,251 |
| FHLMC STACR REMIC Trust (a)(e) | |
| Series 2021-HQA2, Class M2 | | |
| 7.371% (SOFR 30A + 2.05%), due 12/25/33 | 2,048,000 | 2,019,755 |
| Series 2021-HQA4, Class M2 | | |
| 7.671% (SOFR 30A + 2.35%), due 12/25/41 | 2,220,000 | 2,150,625 |
| Series 2020-DNA1, Class B1 | | |
| 7.735% (SOFR 30A + 2.414%), due 1/25/50 | 1,000,000 | 1,003,737 |
| Series 2022-DNA1, Class M2 | | |
| 7.821% (SOFR 30A + 2.50%), due 1/25/42 | 1,635,000 | 1,598,212 |
| Series 2020-DNA6, Class B1 | | |
| 8.321% (SOFR 30A + 3.00%), due 12/25/50 | 440,000 | 441,645 |
| Series 2021-DNA5, Class B1 | | |
| 8.371% (SOFR 30A + 3.05%), due 1/25/34 | 2,010,000 | 2,010,000 |
| Series 2021-HQA2, Class B1 | | |
| 8.471% (SOFR 30A + 3.15%), due 12/25/33 | 1,200,000 | 1,185,000 |
| Series 2021-HQA3, Class B1 | | |
| 8.671% (SOFR 30A + 3.35%), due 9/25/41 | 865,000 | 858,513 |
| Series 2021-DNA6, Class B1 | | |
| 8.721% (SOFR 30A + 3.40%), due 10/25/41 | 1,500,000 | 1,507,500 |
The notes to the financial statements are an integral part of, and should be read in conjunction with, the financial statements.
21
Portfolio of Investments October 31, 2023†^ (continued)
| | Principal
Amount | Value |
| Mortgage-Backed Securities (continued) |
| Whole Loan (Collateralized Mortgage Obligations) (continued) |
| FHLMC STACR REMIC Trust (a)(e) (continued) | |
| Series 2022-DNA1, Class B1 | | |
| 8.721% (SOFR 30A + 3.40%), due 1/25/42 | $ 2,250,000 | $ 2,227,500 |
| Series 2021-DNA7, Class B1 | | |
| 8.971% (SOFR 30A + 3.65%), due 11/25/41 | 1,230,000 | 1,245,531 |
| Series 2021-HQA4, Class B1 | | |
| 9.071% (SOFR 30A + 3.75%), due 12/25/41 | 1,055,000 | 1,049,085 |
| Series 2022-DNA2, Class M2 | | |
| 9.071% (SOFR 30A + 3.75%), due 2/25/42 | 1,480,000 | 1,500,350 |
| Series 2022-DNA3, Class M2 | | |
| 9.671% (SOFR 30A + 4.35%), due 4/25/42 | 2,115,000 | 2,193,319 |
| Series 2020-HQA1, Class B2 | | |
| 10.535% (SOFR 30A + 5.214%), due 1/25/50 | 1,142,000 | 1,132,877 |
| Series 2022-HQA3, Class M2 | | |
| 10.671% (SOFR 30A + 5.35%), due 8/25/42 | 2,170,000 | 2,291,986 |
| Series 2022-DNA6, Class M2 | | |
| 11.071% (SOFR 30A + 5.75%), due 9/25/42 | 1,515,000 | 1,645,169 |
| Series 2021-DNA3, Class B2 | | |
| 11.571% (SOFR 30A + 6.25%), due 10/25/33 | 730,000 | 763,733 |
| FHLMC STACR Trust | |
| Series 2018-HQA2, Class B2 | | |
| 16.435% (SOFR 30A + 11.114%), due 10/25/48 (a)(e) | 1,395,000 | 1,687,452 |
| FHLMC Structured Agency Credit Risk Debt Notes | |
| Series 2022-HQA2, Class M2 | | |
| 11.321% (SOFR 30A + 6.00%), due 7/25/42 (a)(e) | 1,015,000 | 1,097,721 |
| FNMA | |
| Series 2021-R02, Class 2B1 | | |
| 8.621% (SOFR 30A + 3.30%), due 11/25/41 (a)(e) | 335,000 | 332,488 |
| HarborView Mortgage Loan Trust | |
| Series 2007-3, Class 2A1A | | |
| 5.848% (1 Month SOFR + 0.514%), due 5/19/47 (e) | 693,596 | 628,045 |
| J.P. Morgan Mortgage Trust | |
| Series 2021-LTV2, Class A1 | | |
| 2.519%, due 5/25/52 (a)(i) | 768,569 | 578,452 |
| | Principal
Amount | Value |
| |
| Whole Loan (Collateralized Mortgage Obligations) (continued) |
| New Residential Mortgage Loan Trust (a) | |
| Series 2019-5A, Class B7 | | |
| 4.325%, due 8/25/59 (j) | $ 4,486,003 | $ 2,451,725 |
| Series 2019-4A, Class B6 | | |
| 4.621%, due 12/25/58 (i) | 4,256,265 | 2,330,893 |
| Series 2019-2A, Class B6 | | |
| 4.832%, due 12/25/57 (i) | 1,596,029 | 941,478 |
| OBX Trust | |
| Series 2022-NQM1, Class A1 | | |
| 2.305%, due 11/25/61 (a)(i) | 537,096 | 436,855 |
| Onslow Bay Mortgage Loan Trust | |
| Series 2021-NQM4, Class A1 | | |
| 1.957%, due 10/25/61 (a)(i) | 700,012 | 540,255 |
| Sequoia Mortgage Trust | |
| Series 2021-4, Class A1 | | |
| 0.167%, due 6/25/51 (a)(h)(j) | 26,140,372 | 209,418 |
| STACR Trust | |
| Series 2018-HRP2, Class B1 | | |
| 9.635% (SOFR 30A + 4.314%), due 2/25/47 (a)(e) | 1,765,000 | 1,887,932 |
| | | 51,537,074 |
Total Mortgage-Backed Securities
(Cost $159,397,335) | | 148,184,524 |
| U.S. Government & Federal Agencies 9.6% |
| Federal Home Loan Mortgage Corporation (Mortgage Pass-Through Securities) 4.5% |
| FHLMC Gold Pools, 30 Year | | |
| 6.50%, due 4/1/37 | 31,973 | 32,881 |
| FHLMC Gold Pools, Other | | |
| 4.00%, due 6/1/42 | 889,137 | 791,862 |
| UMBS Pool, 20 Year | | |
| 5.00%, due 7/1/43 | 1,581,775 | 1,482,481 |
| UMBS Pool, 30 Year | | |
| 2.50%, due 7/1/51 | 1,360,782 | 1,048,003 |
| 2.50%, due 3/1/52 | 2,538,430 | 1,952,181 |
| 3.00%, due 1/1/52 | 1,043,126 | 836,758 |
| 3.00%, due 2/1/52 | 734,634 | 591,403 |
| 3.50%, due 4/1/52 | 717,240 | 600,258 |
| 4.50%, due 5/1/53 | 889,268 | 794,837 |
| 5.50%, due 7/1/53 | 1,455,264 | 1,380,786 |
| 5.50%, due 7/1/53 | 758,697 | 720,431 |
| 6.00%, due 1/1/53 | 2,166,517 | 2,117,401 |
| 6.50%, due 10/1/53 | 1,946,943 | 1,936,780 |
| 6.50%, due 11/1/53 | 2,010,000 | 1,998,883 |
| | | 16,284,945 |
The notes to the financial statements are an integral part of, and should be read in conjunction with, the financial statements.
| 22 | MainStay MacKay Total Return Bond Fund |
| | Principal
Amount | Value |
| U.S. Government & Federal Agencies (continued) |
| Federal National Mortgage Association (Mortgage Pass-Through Securities) 4.2% |
| FNMA, Other | | |
| 4.00%, due 3/1/42 | $ 503,207 | $ 444,371 |
| 4.00%, due 1/1/43 | 916,079 | 821,475 |
| 4.38%, due 7/1/28 | 1,000,000 | 951,338 |
| 6.00%, due 4/1/37 | 3,749 | 3,756 |
| UMBS, 20 Year | | |
| 5.00%, due 5/1/43 | 1,791,530 | 1,679,809 |
| UMBS, 30 Year | | |
| 3.00%, due 12/1/47 | 160,433 | 132,645 |
| 3.50%, due 12/1/44 | 660,486 | 574,239 |
| 3.50%, due 11/1/50 | 393,045 | 331,829 |
| 3.50%, due 7/1/52 | 780,071 | 650,538 |
| 5.00%, due 3/1/53 | 4,276,677 | 3,944,498 |
| 5.50%, due 8/1/53 | 944,797 | 897,449 |
| 6.00%, due 7/1/39 | 214,704 | 215,348 |
| 6.00%, due 3/1/53 | 191,129 | 186,739 |
| 6.00%, due 8/1/53 | 842,424 | 820,484 |
| 6.00%, due 9/1/53 | 569,301 | 554,441 |
| 6.00%, due 9/1/53 | 1,987,118 | 1,935,089 |
| 6.50%, due 10/1/39 | 209,966 | 212,091 |
| 6.50%, due 10/1/53 | 825,000 | 822,221 |
| | | 15,178,360 |
| United States Treasury Bonds 0.6% |
| U.S. Treasury Bonds | | |
| 4.125%, due 8/15/53 | 2,590,000 | 2,215,664 |
| United States Treasury Inflation - Indexed Notes 0.2% |
| U.S. Treasury Inflation Linked Notes (k) | | |
| 0.125%, due 1/15/30 | 161,101 | 139,082 |
| 0.875%, due 1/15/29 | 383,018 | 352,653 |
| | | 491,735 |
| United States Treasury Notes 0.1% |
| U.S. Treasury Notes | | |
| 4.875%, due 10/31/28 | 465,000 | 465,981 |
Total U.S. Government & Federal Agencies
(Cost $36,253,331) | | 34,636,685 |
Total Long-Term Bonds
(Cost $397,542,669) | | 353,737,893 |
| |
| | Shares | | Value |
| |
| Common Stocks 0.0% ‡ |
| Commercial Services & Supplies 0.0% ‡ |
| Quad/Graphics, Inc. (l) | 1 | | $ 5 |
Total Common Stocks
(Cost $0) | | | 5 |
| Short-Term Investments 1.3% |
| Affiliated Investment Company 1.0% |
| MainStay U.S. Government Liquidity Fund, 5.275% (m) | 3,806,469 | | 3,806,469 |
| Unaffiliated Investment Company 0.3% |
| Invesco Government & Agency Portfolio, 5.357% (m)(n) | 983,889 | | 983,889 |
Total Short-Term Investments
(Cost $4,790,358) | | | 4,790,358 |
Total Investments
(Cost $402,333,027) | 99.5% | | 358,528,256 |
| Other Assets, Less Liabilities | 0.5 | | 1,878,434 |
| Net Assets | 100.0% | | $ 360,406,690 |
| † | Percentages indicated are based on Fund net assets. |
| ^ | Industry classifications may be different than those used for compliance monitoring purposes. |
| ‡ | Less than one-tenth of a percent. |
| (a) | May be sold to institutional investors only under Rule 144A or securities offered pursuant to Section 4(a)(2) of the Securities Act of 1933, as amended. |
| (b) | All or a portion of this security was held on loan. As of October 31, 2023, the aggregate market value of securities on loan was $944,348. The Fund received cash collateral with a value of $983,889. (See Note 2(J)) |
| (c) | Fixed to floating rate—Rate shown was the rate in effect as of October 31, 2023. |
| (d) | Security is perpetual and, thus, does not have a predetermined maturity date. The date shown, if applicable, reflects the next call date. |
| (e) | Floating rate—Rate shown was the rate in effect as of October 31, 2023. |
| (f) | Illiquid security—As of October 31, 2023, the total market value deemed illiquid under procedures approved by the Board of Trustees was $1,038,082, which represented 0.3% of the Fund’s net assets. (Unaudited) |
| (g) | Step coupon—Rate shown was the rate in effect as of October 31, 2023. |
The notes to the financial statements are an integral part of, and should be read in conjunction with, the financial statements.
23
Portfolio of Investments October 31, 2023†^ (continued)
| (h) | Collateralized Mortgage Obligation Interest Only Strip—Pays a fixed or variable rate of interest based on mortgage loans or mortgage pass-through securities. The principal amount of the underlying pool represents the notional amount on which the current interest was calculated. The value of these stripped securities may be particularly sensitive to changes in prevailing interest rates and are typically more sensitive to changes in prepayment rates than traditional mortgage-backed securities. |
| (i) | Coupon rate may change based on changes of the underlying collateral or prepayments of principal. Rate shown was the rate in effect as of October 31, 2023. |
| (j) | Collateral strip rate—A bond whose interest was based on the weighted net interest rate of the collateral. The coupon rate adjusts periodically based on a predetermined schedule. Rate shown was the rate in effect as of October 31, 2023. |
| (k) | Treasury Inflation Protected Security—Pays a fixed rate of interest on a principal amount that is continuously adjusted for inflation based on the Consumer Price Index-Urban Consumers. |
| (l) | Non-income producing security. |
| (m) | Current yield as of October 31, 2023. |
| (n) | Represents a security purchased with cash collateral received for securities on loan. |
Investments in Affiliates (in 000's)
Investments in issuers considered to be affiliate(s) of the Fund during the year ended October 31, 2023 for purposes of Section 2(a)(3) of the Investment Company Act of 1940, as amended, were as follows:
| Affiliated Investment Companies | Value,
Beginning
of Year | Purchases
at Cost | Proceeds
from
Sales | Net
Realized
Gain/(Loss)
on Sales | Change in
Unrealized
Appreciation/
(Depreciation) | Value,
End of
Year | Dividend
Income | Other
Distributions | Shares
End of
Year |
| MainStay U.S. Government Liquidity Fund | $ 8,162 | $ 164,651 | $ (169,007) | $ — | $ — | $ 3,806 | $ 214 | $ — | 3,806 |
Futures Contracts
As of October 31, 2023, the Fund held the following futures contracts1:
| Type | Number of
Contracts | Expiration
Date | Value at
Trade Date | Current
Notional
Amount | Unrealized
Appreciation
(Depreciation)2 |
| Long Contracts | | | | | |
| U.S. Treasury 10 Year Notes | 114 | December 2023 | $ 12,450,486 | $ 12,103,594 | $ (346,892) |
| U.S. Treasury 10 Year Ultra Bonds | 194 | December 2023 | 22,057,915 | 21,112,656 | (945,259) |
| U.S. Treasury Long Bonds | 221 | December 2023 | 26,266,086 | 24,185,687 | (2,080,399) |
| U.S. Treasury Ultra Bonds | 115 | December 2023 | 13,954,339 | 12,944,688 | (1,009,651) |
| Total Long Contracts | | | | | (4,382,201) |
| Short Contracts | | | | | |
| U.S. Treasury 5 Year Notes | (86) | December 2023 | (9,116,428) | (8,984,984) | 131,444 |
| Net Unrealized Depreciation | | | | | $ (4,250,757) |
| 1. | As of October 31, 2023, cash in the amount of $2,249,033 was on deposit with a broker or futures commission merchant for futures transactions. |
| 2. | Represents the difference between the value of the contracts at the time they were opened and the value as of October 31, 2023. |
The notes to the financial statements are an integral part of, and should be read in conjunction with, the financial statements.
| 24 | MainStay MacKay Total Return Bond Fund |
| Abbreviation(s): |
| FHLMC—Federal Home Loan Mortgage Corp. |
| FNMA—Federal National Mortgage Association |
| FREMF—Freddie Mac Multifamily |
| GNMA—Government National Mortgage Association |
| REMIC—Real Estate Mortgage Investment Conduit |
| SOFR—Secured Overnight Financing Rate |
| STACR—Structured Agency Credit Risk |
| UMBS—Uniform Mortgage Backed Securities |
The following is a summary of the fair valuations according to the inputs used as of October 31, 2023, for valuing the Fund’s assets and liabilities:
| Description | Quoted
Prices in
Active
Markets for
Identical
Assets
(Level 1) | | Significant
Other
Observable
Inputs
(Level 2) | | Significant
Unobservable
Inputs
(Level 3) | | Total |
| Asset Valuation Inputs | | | | | | | |
| Investments in Securities (a) | | | | | | | |
| Long-Term Bonds | | | | | | | |
| Asset-Backed Securities | $ — | | $ 45,352,030 | | $ — | | $ 45,352,030 |
| Corporate Bonds | — | | 117,899,150 | | — | | 117,899,150 |
| Foreign Government Bonds | — | | 7,107,365 | | — | | 7,107,365 |
| Loan Assignments | — | | 558,139 | | — | | 558,139 |
| Mortgage-Backed Securities | — | | 148,184,524 | | — | | 148,184,524 |
| U.S. Government & Federal Agencies | — | | 34,636,685 | | — | | 34,636,685 |
| Total Long-Term Bonds | — | | 353,737,893 | | — | | 353,737,893 |
| Common Stocks | 5 | | — | | — | | 5 |
| Short-Term Investments | | | | | | | |
| Affiliated Investment Company | 3,806,469 | | — | | — | | 3,806,469 |
| Unaffiliated Investment Company | 983,889 | | — | | — | | 983,889 |
| Total Short-Term Investments | 4,790,358 | | — | | — | | 4,790,358 |
| Total Investments in Securities | 4,790,363 | | 353,737,893 | | — | | 358,528,256 |
| Other Financial Instruments | | | | | | | |
| Futures Contracts (b) | 131,444 | | — | | — | | 131,444 |
| Total Investments in Securities and Other Financial Instruments | $ 4,921,807 | | $ 353,737,893 | | $ — | | $ 358,659,700 |
| Liability Valuation Inputs | | | | | | | |
| Other Financial Instruments | | | | | | | |
| Futures Contracts (b) | $ (4,382,201) | | $ — | | $ — | | $ (4,382,201) |
| (a) | For a complete listing of investments and their industries, see the Portfolio of Investments. |
| (b) | The value listed for these securities reflects unrealized appreciation (depreciation) as shown on the Portfolio of Investments. |
The notes to the financial statements are an integral part of, and should be read in conjunction with, the financial statements.
25
Statement of Assets and Liabilities as of October 31, 2023
| Assets |
Investment in unaffiliated securities, at value
(identified cost $398,526,558) including securities on loan of $944,348 | $ 354,721,787 |
Investment in affiliated investment companies, at value
(identified cost $3,806,469) | 3,806,469 |
| Cash | 23,258 |
Cash denominated in foreign currencies
(identified cost $500) | 491 |
| Cash collateral on deposit at broker for futures contracts | 2,249,033 |
| Receivables: | |
| Investment securities sold | 3,119,301 |
| Interest | 2,332,678 |
| Variation margin on futures contracts | 60,010 |
| Fund shares sold | 25,721 |
| Securities lending | 614 |
| Other assets | 36,299 |
| Total assets | 366,375,661 |
| Liabilities |
| Cash collateral received for securities on loan | 983,889 |
| Payables: | |
| Investment securities purchased | 4,661,944 |
| Manager (See Note 3) | 105,036 |
| Fund shares redeemed | 82,706 |
| Transfer agent (See Note 3) | 41,653 |
| Shareholder communication | 17,840 |
| Custodian | 16,779 |
| Professional fees | 15,550 |
| NYLIFE Distributors (See Note 3) | 14,429 |
| Trustees | 109 |
| Accrued expenses | 15,952 |
| Distributions payable | 13,084 |
| Total liabilities | 5,968,971 |
| Net assets | $ 360,406,690 |
| Composition of Net Assets |
| Shares of beneficial interest outstanding (par value of $.001 per share) unlimited number of shares authorized | $ 43,167 |
| Additional paid-in-capital | 467,892,152 |
| | 467,935,319 |
| Total distributable earnings (loss) | (107,528,629) |
| Net assets | $ 360,406,690 |
| Class A | |
| Net assets applicable to outstanding shares | $ 46,425,993 |
| Shares of beneficial interest outstanding | 5,560,654 |
| Net asset value per share outstanding | $ 8.35 |
| Maximum sales charge (4.50% of offering price) | 0.39 |
| Maximum offering price per share outstanding | $ 8.74 |
| Investor Class | |
| Net assets applicable to outstanding shares | $ 4,109,098 |
| Shares of beneficial interest outstanding | 489,135 |
| Net asset value per share outstanding | $ 8.40 |
| Maximum sales charge (4.00% of offering price) | 0.35 |
| Maximum offering price per share outstanding | $ 8.75 |
| Class B | |
| Net assets applicable to outstanding shares | $ 416,313 |
| Shares of beneficial interest outstanding | 49,774 |
| Net asset value and offering price per share outstanding | $ 8.36 |
| Class C | |
| Net assets applicable to outstanding shares | $ 3,348,436 |
| Shares of beneficial interest outstanding | 399,755 |
| Net asset value and offering price per share outstanding | $ 8.38 |
| Class I | |
| Net assets applicable to outstanding shares | $ 61,667,480 |
| Shares of beneficial interest outstanding | 7,382,806 |
| Net asset value and offering price per share outstanding | $ 8.35 |
| Class R1 | |
| Net assets applicable to outstanding shares | $ 24,375 |
| Shares of beneficial interest outstanding | 2,920 |
| Net asset value and offering price per share outstanding | $ 8.35 |
| Class R2 | |
| Net assets applicable to outstanding shares | $ 27,541 |
| Shares of beneficial interest outstanding | 3,299 |
| Net asset value and offering price per share outstanding | $ 8.35 |
| Class R3 | |
| Net assets applicable to outstanding shares | $ 458,279 |
| Shares of beneficial interest outstanding | 54,907 |
| Net asset value and offering price per share outstanding | $ 8.35 |
| Class R6 | |
| Net assets applicable to outstanding shares | $243,908,501 |
| Shares of beneficial interest outstanding | 29,221,712 |
| Net asset value and offering price per share outstanding | $ 8.35 |
| SIMPLE Class | |
| Net assets applicable to outstanding shares | $ 20,674 |
| Shares of beneficial interest outstanding | 2,462 |
| Net asset value and offering price per share outstanding | $ 8.40 |
The notes to the financial statements are an integral part of, and should be read in conjunction with, the financial statements.
| 26 | MainStay MacKay Total Return Bond Fund |
Statement of Operations for the year ended October 31, 2023
| Investment Income (Loss) |
| Income | |
| Interest | $ 20,134,936 |
| Dividends-affiliated | 214,284 |
| Securities lending, net | 56,641 |
| Total income | 20,405,861 |
| Expenses | |
| Manager (See Note 3) | 1,878,427 |
| Transfer agent (See Note 3) | 239,581 |
| Distribution/Service—Class A (See Note 3) | 133,012 |
| Distribution/Service—Investor Class (See Note 3) | 11,522 |
| Distribution/Service—Class B (See Note 3) | 5,081 |
| Distribution/Service—Class C (See Note 3) | 40,624 |
| Distribution/Service—Class R2 (See Note 3) | 72 |
| Distribution/Service—Class R3 (See Note 3) | 2,507 |
| Distribution/Service—SIMPLE Class (See Note 3) | 108 |
| Registration | 138,839 |
| Professional fees | 92,778 |
| Custodian | 48,155 |
| Trustees | 6,035 |
| Shareholder communication | 626 |
| Shareholder service (See Note 3) | 556 |
| Miscellaneous | 12,668 |
| Total expenses before waiver/reimbursement | 2,610,591 |
| Expense waiver/reimbursement from Manager (See Note 3) | (428,398) |
| Reimbursement from prior custodian(a) | (872) |
| Net expenses | 2,181,321 |
| Net investment income (loss) | 18,224,540 |
| Realized and Unrealized Gain (Loss) |
| Net realized gain (loss) on: | |
| Unaffiliated investment transactions | (27,136,894) |
| Futures transactions | (7,265,832) |
| Foreign currency transactions | (5) |
| Net realized gain (loss) | (34,402,731) |
| Net change in unrealized appreciation (depreciation) on: | |
| Unaffiliated investments | 27,838,094 |
| Futures contracts | (887,588) |
| Translation of other assets and liabilities in foreign currencies | 13 |
| Net change in unrealized appreciation (depreciation) | 26,950,519 |
| Net realized and unrealized gain (loss) | (7,452,212) |
| Net increase (decrease) in net assets resulting from operations | $ 10,772,328 |
| (a) | Represents a refund for overbilling of custody fees. |
The notes to the financial statements are an integral part of, and should be read in conjunction with, the financial statements.
27
Statements of Changes in Net Assets
for the years ended October 31, 2023 and October 31, 2022
| | 2023 | 2022 |
| Increase (Decrease) in Net Assets |
| Operations: | | |
| Net investment income (loss) | $ 18,224,540 | $ 18,747,064 |
| Net realized gain (loss) | (34,402,731) | (19,683,509) |
| Net change in unrealized appreciation (depreciation) | 26,950,519 | (113,380,287) |
| Net increase (decrease) in net assets resulting from operations | 10,772,328 | (114,316,732) |
| Distributions to shareholders: | | |
| Class A | (2,153,236) | (4,775,382) |
| Investor Class | (172,568) | (357,428) |
| Class B | (15,184) | (47,409) |
| Class C | (121,103) | (435,071) |
| Class I | (3,929,623) | (8,345,013) |
| Class R1 | (1,072) | (1,751) |
| Class R2 | (1,140) | (1,910) |
| Class R3 | (18,820) | (28,420) |
| Class R6 | (11,688,445) | (28,552,302) |
| SIMPLE Class | (814) | (1,336) |
| | (18,102,005) | (42,546,022) |
| Distributions to shareholders from return of capital: | | |
| Class A | — | (19,314) |
| Investor Class | — | (1,446) |
| Class B | — | (192) |
| Class C | — | (1,760) |
| Class I | — | (33,752) |
| Class R1 | — | (7) |
| Class R2 | — | (8) |
| Class R3 | — | (115) |
| Class R6 | — | (115,483) |
| SIMPLE Class | — | (5) |
| | — | (172,082) |
| Total distributions to shareholders | (18,102,005) | (42,718,104) |
| Capital share transactions: | | |
| Net proceeds from sales of shares | 49,031,695 | 60,162,268 |
| Net asset value of shares issued to shareholders in reinvestment of distributions | 17,923,251 | 42,385,916 |
| Cost of shares redeemed | (130,355,676) | (883,780,161) |
| Increase (decrease) in net assets derived from capital share transactions | (63,400,730) | (781,231,977) |
| Net increase (decrease) in net assets | (70,730,407) | (938,266,813) |
| Net Assets |
| Beginning of year | 431,137,097 | 1,369,403,910 |
| End of year | $ 360,406,690 | $ 431,137,097 |
The notes to the financial statements are an integral part of, and should be read in conjunction with, the financial statements.
| 28 | MainStay MacKay Total Return Bond Fund |
Financial Highlights selected per share data and ratios
| | Year Ended October 31, |
| Class A | 2023 | | 2022 | | 2021 | | 2020 | | 2019 |
| Net asset value at beginning of year | $ 8.57 | | $ 11.18 | | $ 11.35 | | $ 10.91 | | $ 10.10 |
| Net investment income (loss) | 0.36(a) | | 0.29(a) | | 0.24(a) | | 0.24 | | 0.27 |
| Net realized and unrealized gain (loss) | (0.22) | | (2.26) | | (0.03) | | 0.47 | | 0.82 |
| Total from investment operations | 0.14 | | (1.97) | | 0.21 | | 0.71 | | 1.09 |
| Less distributions: | | | | | | | | | |
| From net investment income | (0.36) | | (0.31) | | (0.25) | | (0.27) | | (0.28) |
| From net realized gain on investments | — | | (0.33) | | (0.13) | | — | | — |
| Return of capital | — | | (0.00)‡ | | — | | — | | — |
| Total distributions | (0.36) | | (0.64) | | (0.38) | | (0.27) | | (0.28) |
| Net asset value at end of year | $ 8.35 | | $ 8.57 | | $ 11.18 | | $ 11.35 | | $ 10.91 |
| Total investment return (b) | 1.50% | | (18.43)% | | 1.86% | | 6.55% | | 10.88% |
| Ratios (to average net assets)/Supplemental Data: | | | | | | | | | |
| Net investment income (loss) | 4.06% | | 2.89% | | 2.14% | | 2.30% | | 2.63% |
| Net expenses (c) | 0.83% | | 0.78% | | 0.83% | | 0.85% | | 0.88% |
| Expenses (before waiver/reimbursement) (c) | 0.91% | | 0.83% | | 0.83% | | 0.85% | | 0.89% |
| Portfolio turnover rate | 119% | | 98%(d) | | 111%(d) | | 123% | | 100%(d) |
| Net assets at end of year (in 000’s) | $ 46,426 | | $ 54,484 | | $ 87,764 | | $ 92,997 | | $ 56,473 |
| ‡ | Less than one cent per share. |
| (a) | Per share data based on average shares outstanding during the year. |
| (b) | Total investment return is calculated exclusive of sales charges and assumes the reinvestment of dividends and distributions. For periods of less than one year, total return is not annualized. |
| (c) | In addition to the fees and expenses which the Fund bears directly, it also indirectly bears a pro-rata share of the fees and expenses of the underlying funds in which it invests. Such indirect expenses are not included in the above expense ratios. |
| (d) | The portfolio turnover rates not including mortgage dollar rolls were 96%, 108%, 96% and 63% for the years ended October 31, 2022, 2021, 2020 and 2019, respectively. |
| | Year Ended October 31, |
| Investor Class | 2023 | | 2022 | | 2021 | | 2020 | | 2019 |
| Net asset value at beginning of year | $ 8.62 | | $ 11.24 | | $ 11.42 | | $ 10.97 | | $ 10.15 |
| Net investment income (loss) | 0.34(a) | | 0.26(a) | | 0.22(a) | | 0.24 | | 0.26 |
| Net realized and unrealized gain (loss) | (0.22) | | (2.27) | | (0.04) | | 0.46 | | 0.82 |
| Total from investment operations | 0.12 | | (2.01) | | 0.18 | | 0.70 | | 1.08 |
| Less distributions: | | | | | | | | | |
| From net investment income | (0.34) | | (0.28) | | (0.23) | | (0.25) | | (0.26) |
| From net realized gain on investments | — | | (0.33) | | (0.13) | | — | | — |
| Return of capital | — | | (0.00)‡ | | — | | — | | — |
| Total distributions | (0.34) | | (0.61) | | (0.36) | | (0.25) | | (0.26) |
| Net asset value at end of year | $ 8.40 | | $ 8.62 | | $ 11.24 | | $ 11.42 | | $ 10.97 |
| Total investment return (b) | 1.20% | | (18.65)% | | 1.54% | | 6.40% | | 10.74% |
| Ratios (to average net assets)/Supplemental Data: | | | | | | | | | |
| Net investment income (loss) | 3.77% | | 2.65% | | 1.93% | | 2.11% | | 2.46% |
| Net expenses (c) | 1.12% | | 1.04% | | 1.04% | | 1.05% | | 1.05% |
| Expenses (before waiver/reimbursement) (c) | 1.18% | | 1.09% | | 1.04% | | 1.05% | | 1.06% |
| Portfolio turnover rate | 119% | | 98%(d) | | 111%(d) | | 123% | | 100%(d) |
| Net assets at end of year (in 000's) | $ 4,109 | | $ 4,663 | | $ 6,894 | | $ 7,558 | | $ 6,557 |
| ‡ | Less than one cent per share. |
| (a) | Per share data based on average shares outstanding during the year. |
| (b) | Total investment return is calculated exclusive of sales charges and assumes the reinvestment of dividends and distributions. For periods of less than one year, total return is not annualized. |
| (c) | In addition to the fees and expenses which the Fund bears directly, it also indirectly bears a pro-rata share of the fees and expenses of the underlying funds in which it invests. Such indirect expenses are not included in the above expense ratios. |
| (d) | The portfolio turnover rates not including mortgage dollar rolls were 96%, 108%, 96% and 63% for the years ended October 31, 2022, 2021, 2020 and 2019, respectively. |
The notes to the financial statements are an integral part of, and should be read in conjunction with, the financial statements.
29
Financial Highlights selected per share data and ratios
| | Year Ended October 31, |
| Class B | 2023 | | 2022 | | 2021 | | 2020 | | 2019 |
| Net asset value at beginning of year | $ 8.58 | | $ 11.20 | | $ 11.37 | | $ 10.92 | | $ 10.11 |
| Net investment income (loss) | 0.27(a) | | 0.19(a) | | 0.13(a) | | 0.18 | | 0.20 |
| Net realized and unrealized gain (loss) | (0.22) | | (2.28) | | (0.03) | | 0.43 | | 0.79 |
| Total from investment operations | 0.05 | | (2.09) | | 0.10 | | 0.61 | | 0.99 |
| Less distributions: | | | | | | | | | |
| From net investment income | (0.27) | | (0.20) | | (0.14) | | (0.16) | | (0.18) |
| From net realized gain on investments | — | | (0.33) | | (0.13) | | — | | — |
| Return of capital | — | | (0.00)‡ | | — | | — | | — |
| Total distributions | (0.27) | | (0.53) | | (0.27) | | (0.16) | | (0.18) |
| Net asset value at end of year | $ 8.36 | | $ 8.58 | | $ 11.20 | | $ 11.37 | | $ 10.92 |
| Total investment return (b) | 0.44% | | (19.34)% | | 0.85% | | 5.64% | | 9.85% |
| Ratios (to average net assets)/Supplemental Data: | | | | | | | | | |
| Net investment income (loss) | 3.01% | | 1.88% | | 1.17% | | 1.36% | | 1.73% |
| Net expenses (c) | 1.87% | | 1.79% | | 1.79% | | 1.80% | | 1.80% |
| Expenses (before waiver/reimbursement) (c) | 1.93% | | 1.84% | | 1.79% | | 1.80% | | 1.81% |
| Portfolio turnover rate | 119% | | 98%(d) | | 111%(d) | | 123% | | 100%(d) |
| Net assets at end of year (in 000’s) | $ 416 | | $ 606 | | $ 1,087 | | $ 1,838 | | $ 2,515 |
| ‡ | Less than one cent per share. |
| (a) | Per share data based on average shares outstanding during the year. |
| (b) | Total investment return is calculated exclusive of sales charges and assumes the reinvestment of dividends and distributions. For periods of less than one year, total return is not annualized. |
| (c) | In addition to the fees and expenses which the Fund bears directly, it also indirectly bears a pro-rata share of the fees and expenses of the underlying funds in which it invests. Such indirect expenses are not included in the above expense ratios. |
| (d) | The portfolio turnover rates not including mortgage dollar rolls were 96%, 108%, 96% and 63% for the years ended October 31, 2022, 2021, 2020 and 2019, respectively. |
| | Year Ended October 31, |
| Class C | 2023 | | 2022 | | 2021 | | 2020 | | 2019 |
| Net asset value at beginning of year | $ 8.59 | | $ 11.21 | | $ 11.38 | | $ 10.93 | | $ 10.12 |
| Net investment income (loss) | 0.27(a) | | 0.18(a) | | 0.13(a) | | 0.14 | | 0.20 |
| Net realized and unrealized gain (loss) | (0.21) | | (2.27) | | (0.03) | | 0.47 | | 0.79 |
| Total from investment operations | 0.06 | | (2.09) | | 0.10 | | 0.61 | | 0.99 |
| Less distributions: | | | | | | | | | |
| From net investment income | (0.27) | | (0.20) | | (0.14) | | (0.16) | | (0.18) |
| From net realized gain on investments | — | | (0.33) | | (0.13) | | — | | — |
| Return of capital | — | | (0.00)‡ | | — | | — | | — |
| Total distributions | (0.27) | | (0.53) | | (0.27) | | (0.16) | | (0.18) |
| Net asset value at end of year | $ 8.38 | | $ 8.59 | | $ 11.21 | | $ 11.38 | | $ 10.93 |
| Total investment return (b) | 0.56% | | (19.32)% | | 0.85% | | 5.64% | | 9.84% |
| Ratios (to average net assets)/Supplemental Data: | | | | | | | | | |
| Net investment income (loss) | 3.01% | | 1.83% | | 1.17% | | 1.35% | | 1.74% |
| Net expenses (c) | 1.87% | | 1.79% | | 1.79% | | 1.80% | | 1.80% |
| Expenses (before waiver/reimbursement) (c) | 1.93% | | 1.84% | | 1.79% | | 1.80% | | 1.81% |
| Portfolio turnover rate | 119% | | 98%(d) | | 111%(d) | | 123% | | 100%(d) |
| Net assets at end of year (in 000’s) | $ 3,348 | | $ 4,480 | | $ 10,449 | | $ 18,434 | | $ 11,916 |
| ‡ | Less than one cent per share. |
| (a) | Per share data based on average shares outstanding during the year. |
| (b) | Total investment return is calculated exclusive of sales charges and assumes the reinvestment of dividends and distributions. For periods of less than one year, total return is not annualized. |
| (c) | In addition to the fees and expenses which the Fund bears directly, it also indirectly bears a pro-rata share of the fees and expenses of the underlying funds in which it invests. Such indirect expenses are not included in the above expense ratios. |
| (d) | The portfolio turnover rates not including mortgage dollar rolls were 96%, 108%, 96% and 63% for the years ended October 31, 2022, 2021, 2020 and 2019, respectively. |
The notes to the financial statements are an integral part of, and should be read in conjunction with, the financial statements.
| 30 | MainStay MacKay Total Return Bond Fund |
Financial Highlights selected per share data and ratios
| | Year Ended October 31, |
| Class I | 2023 | | 2022 | | 2021 | | 2020 | | 2019 |
| Net asset value at beginning of year | $ 8.57 | | $ 11.18 | | $ 11.36 | | $ 10.91 | | $ 10.10 |
| Net investment income (loss) | 0.39(a) | | 0.30(a) | | 0.27(a) | | 0.29 | | 0.31 |
| Net realized and unrealized gain (loss) | (0.21) | | (2.25) | | (0.04) | | 0.45 | | 0.81 |
| Total from investment operations | 0.18 | | (1.95) | | 0.23 | | 0.74 | | 1.12 |
| Less distributions: | | | | | | | | | |
| From net investment income | (0.40) | | (0.33) | | (0.28) | | (0.29) | | (0.31) |
| From net realized gain on investments | — | | (0.33) | | (0.13) | | — | | — |
| Return of capital | — | | (0.00)‡ | | — | | — | | — |
| Total distributions | (0.40) | | (0.66) | | (0.41) | | (0.29) | | (0.31) |
| Net asset value at end of year | $ 8.35 | | $ 8.57 | | $ 11.18 | | $ 11.36 | | $ 10.91 |
| Total investment return (b) | 1.88% | | (18.30)% | | 2.11% | | 6.91% | | 11.20% |
| Ratios (to average net assets)/Supplemental Data: | | | | | | | | | |
| Net investment income (loss) | 4.43% | | 3.01% | | 2.39% | | 2.56% | | 2.93% |
| Net expenses (c) | 0.45% | | 0.53% | | 0.58% | | 0.60% | | 0.60% |
| Expenses (before waiver/reimbursement) (c) | 0.65% | | 0.58% | | 0.58% | | 0.60% | | 0.64% |
| Portfolio turnover rate | 119% | | 98%(d) | | 111%(d) | | 123% | | 100%(d) |
| Net assets at end of year (in 000’s) | $ 61,667 | | $ 94,122 | | $ 720,466 | | $ 686,829 | | $ 1,056,594 |
| ‡ | Less than one cent per share. |
| (a) | Per share data based on average shares outstanding during the year. |
| (b) | Total investment return is calculated exclusive of sales charges and assumes the reinvestment of dividends and distributions. Class I shares are not subject to sales charges. For periods of less than one year, total return is not annualized. |
| (c) | In addition to the fees and expenses which the Fund bears directly, it also indirectly bears a pro-rata share of the fees and expenses of the underlying funds in which it invests. Such indirect expenses are not included in the above expense ratios. |
| (d) | The portfolio turnover rates not including mortgage dollar rolls were 96%, 108%, 96% and 63% for the years ended October 31, 2022, 2021, 2020 and 2019, respectively. |
| | Year Ended October 31, |
| Class R1 | 2023 | | 2022 | | 2021 | | 2020 | | 2019 |
| Net asset value at beginning of year | $ 8.57 | | $ 11.18 | | $ 11.35 | | $ 10.90 | | $ 10.10 |
| Net investment income (loss) | 0.37(a) | | 0.31(a) | | 0.26(a) | | 0.26 | | 0.29 |
| Net realized and unrealized gain (loss) | (0.21) | | (2.27) | | (0.03) | | 0.47 | | 0.80 |
| Total from investment operations | 0.16 | | (1.96) | | 0.23 | | 0.73 | | 1.09 |
| Less distributions: | | | | | | | | | |
| From net investment income | (0.38) | | (0.32) | | (0.27) | | (0.28) | | (0.29) |
| From net realized gain on investments | — | | (0.33) | | (0.13) | | — | | — |
| Return of capital | — | | (0.00)‡ | | — | | — | | — |
| Total distributions | (0.38) | | (0.65) | | (0.40) | | (0.28) | | (0.29) |
| Net asset value at end of year | $ 8.35 | | $ 8.57 | | $ 11.18 | | $ 11.35 | | $ 10.90 |
| Total investment return (b) | 1.65% | | (18.31)% | | 2.01% | | 6.81% | | 10.98% |
| Ratios (to average net assets)/Supplemental Data: | | | | | | | | | |
| Net investment income (loss) | 4.21% | | 3.10% | | 2.29% | | 2.47% | | 2.97% |
| Net expenses (c) | 0.68% | | 0.61% | | 0.68% | | 0.70% | | 0.70% |
| Expenses (before waiver/reimbursement) (c) | 0.76% | | 0.67% | | 0.68% | | 0.70% | | 0.74% |
| Portfolio turnover rate | 119% | | 98%(d) | | 111%(d) | | 123% | | 100%(d) |
| Net assets at end of year (in 000’s) | $ 24 | | $ 24 | | $ 29 | | $ 29 | | $ 27 |
| ‡ | Less than one cent per share. |
| (a) | Per share data based on average shares outstanding during the year. |
| (b) | Total investment return is calculated exclusive of sales charges and assumes the reinvestment of dividends and distributions. Class R1 shares are not subject to sales charges. For periods of less than one year, total return is not annualized. |
| (c) | In addition to the fees and expenses which the Fund bears directly, it also indirectly bears a pro-rata share of the fees and expenses of the underlying funds in which it invests. Such indirect expenses are not included in the above expense ratios. |
| (d) | The portfolio turnover rates not including mortgage dollar rolls were 96%, 108%, 96% and 63% for the years ended October 31, 2022, 2021, 2020 and 2019, respectively. |
The notes to the financial statements are an integral part of, and should be read in conjunction with, the financial statements.
31
Financial Highlights selected per share data and ratios
| | Year Ended October 31, |
| Class R2 | 2023 | | 2022 | | 2021 | | 2020 | | 2019 |
| Net asset value at beginning of year | $ 8.57 | | $ 11.18 | | $ 11.35 | | $ 10.90 | | $ 10.09 |
| Net investment income (loss) | 0.35(a) | | 0.28(a) | | 0.23(a) | | 0.25 | | 0.27 |
| Net realized and unrealized gain (loss) | (0.22) | | (2.26) | | (0.03) | | 0.46 | | 0.81 |
| Total from investment operations | 0.13 | | (1.98) | | 0.20 | | 0.71 | | 1.08 |
| Less distributions: | | | | | | | | | |
| From net investment income | (0.35) | | (0.30) | | (0.24) | | (0.26) | | (0.27) |
| From net realized gain on investments | — | | (0.33) | | (0.13) | | — | | — |
| Return of capital | — | | (0.00)‡ | | — | | — | | — |
| Total distributions | (0.35) | | (0.63) | | (0.37) | | (0.26) | | (0.27) |
| Net asset value at end of year | $ 8.35 | | $ 8.57 | | $ 11.18 | | $ 11.35 | | $ 10.90 |
| Total investment return (b) | 1.39% | | (18.52)% | | 1.75% | | 6.54% | | 10.82% |
| Ratios (to average net assets)/Supplemental Data: | | | | | | | | | |
| Net investment income (loss) | 3.96% | | 2.85% | | 2.02% | | 2.21% | | 2.57% |
| Net expenses (c) | 0.93% | | 0.87% | | 0.93% | | 0.95% | | 0.95% |
| Expenses (before waiver/reimbursement) (c) | 1.01% | | 0.93% | | 0.93% | | 0.95% | | 0.99% |
| Portfolio turnover rate | 119% | | 98%(d) | | 111%(d) | | 123% | | 100%(d) |
| Net assets at end of year (in 000’s) | $ 28 | | $ 27 | | $ 33 | | $ 87 | | $ 81 |
| ‡ | Less than one cent per share. |
| (a) | Per share data based on average shares outstanding during the year. |
| (b) | Total investment return is calculated exclusive of sales charges and assumes the reinvestment of dividends and distributions. Class R2 shares are not subject to sales charges. For periods of less than one year, total return is not annualized. |
| (c) | In addition to the fees and expenses which the Fund bears directly, it also indirectly bears a pro-rata share of the fees and expenses of the underlying funds in which it invests. Such indirect expenses are not included in the above expense ratios. |
| (d) | The portfolio turnover rates not including mortgage dollar rolls were 96%, 108%, 96% and 63% for the years ended October 31, 2022, 2021, 2020 and 2019, respectively. |
| | Year Ended October 31, |
| Class R3 | 2023 | | 2022 | | 2021 | | 2020 | | 2019 |
| Net asset value at beginning of year | $ 8.57 | | $ 11.18 | | $ 11.35 | | $ 10.90 | | $ 10.10 |
| Net investment income (loss) | 0.33(a) | | 0.26(a) | | 0.20(a) | | 0.22 | | 0.24 |
| Net realized and unrealized gain (loss) | (0.22) | | (2.27) | | (0.03) | | 0.46 | | 0.80 |
| Total from investment operations | 0.11 | | (2.01) | | 0.17 | | 0.68 | | 1.04 |
| Less distributions: | | | | | | | | | |
| From net investment income | (0.33) | | (0.27) | | (0.21) | | (0.23) | | (0.24) |
| From net realized gain on investments | — | | (0.33) | | (0.13) | | — | | — |
| Return of capital | — | | (0.00)‡ | | — | | — | | — |
| Total distributions | (0.33) | | (0.60) | | (0.34) | | (0.23) | | (0.24) |
| Net asset value at end of year | $ 8.35 | | $ 8.57 | | $ 11.18 | | $ 11.35 | | $ 10.90 |
| Total investment return (b) | 1.15% | | (18.71)% | | 1.50% | | 6.28% | | 10.44% |
| Ratios (to average net assets)/Supplemental Data: | | | | | | | | | |
| Net investment income (loss) | 3.71% | | 2.62% | | 1.79% | | 1.96% | | 2.30% |
| Net expenses (c) | 1.18% | | 1.11% | | 1.18% | | 1.20% | | 1.20% |
| Expenses (before waiver/reimbursement) (c) | 1.26% | | 1.17% | | 1.18% | | 1.20% | | 1.24% |
| Portfolio turnover rate | 119% | | 98%(d) | | 111%(d) | | 123% | | 100%(d) |
| Net assets at end of year (in 000’s) | $ 458 | | $ 483 | | $ 509 | | $ 329 | | $ 251 |
| ‡ | Less than one cent per share. |
| (a) | Per share data based on average shares outstanding during the year. |
| (b) | Total investment return is calculated exclusive of sales charges and assumes the reinvestment of dividends and distributions. Class R3 shares are not subject to sales charges. For periods of less than one year, total return is not annualized. |
| (c) | In addition to the fees and expenses which the Fund bears directly, it also indirectly bears a pro-rata share of the fees and expenses of the underlying funds in which it invests. Such indirect expenses are not included in the above expense ratios. |
| (d) | The portfolio turnover rates not including mortgage dollar rolls were 96%, 108%, 96% and 63% for the years ended October 31, 2022, 2021, 2020 and 2019, respectively. |
The notes to the financial statements are an integral part of, and should be read in conjunction with, the financial statements.
| 32 | MainStay MacKay Total Return Bond Fund |
Financial Highlights selected per share data and ratios
| | Year Ended October 31, |
| Class R6 | 2023 | | 2022 | | 2021 | | 2020 | | 2019 |
| Net asset value at beginning of year | $ 8.57 | | $ 11.18 | | $ 11.35 | | $ 10.91 | | $ 10.10 |
| Net investment income (loss) | 0.39(a) | | 0.31(a) | | 0.27(a) | | 0.28 | | 0.30 |
| Net realized and unrealized gain (loss) | (0.21) | | (2.26) | | (0.02) | | 0.46 | | 0.82 |
| Total from investment operations | 0.18 | | (1.95) | | 0.25 | | 0.74 | | 1.12 |
| Less distributions: | | | | | | | | | |
| From net investment income | (0.40) | | (0.33) | | (0.29) | | (0.30) | | (0.31) |
| From net realized gain on investments | — | | (0.33) | | (0.13) | | — | | — |
| Return of capital | — | | (0.00)‡ | | — | | — | | — |
| Total distributions | (0.40) | | (0.66) | | (0.42) | | (0.30) | | (0.31) |
| Net asset value at end of year | $ 8.35 | | $ 8.57 | | $ 11.18 | | $ 11.35 | | $ 10.91 |
| Total investment return (b) | 1.89% | | (18.20)% | | 2.16% | | 6.89% | | 11.27% |
| Ratios (to average net assets)/Supplemental Data: | | | | | | | | | |
| Net investment income (loss) | 4.44% | | 3.13% | | 2.43% | | 2.61% | | 2.98% |
| Net expenses (c) | 0.45% | | 0.50% | | 0.53% | | 0.53% | | 0.53% |
| Expenses (before waiver/reimbursement) (c) | 0.53% | | 0.54% | | 0.53% | | 0.53% | | 0.53% |
| Portfolio turnover rate | 119% | | 98%(d) | | 111%(d) | | 123% | | 100%(d) |
| Net assets at end of year (in 000’s) | $ 243,909 | | $ 272,227 | | $ 542,147 | | $ 716,703 | | $ 185,733 |
| ‡ | Less than one cent per share. |
| (a) | Per share data based on average shares outstanding during the year. |
| (b) | Total investment return is calculated exclusive of sales charges and assumes the reinvestment of dividends and distributions. Class R6 shares are not subject to sales charges. For periods of less than one year, total return is not annualized. |
| (c) | In addition to the fees and expenses which the Fund bears directly, it also indirectly bears a pro-rata share of the fees and expenses of the underlying funds in which it invests. Such indirect expenses are not included in the above expense ratios. |
| (d) | The portfolio turnover rates not including mortgage dollar rolls were 96%, 108%, 96% and 63% for the years ended October 31, 2022, 2021, 2020 and 2019, respectively. |
The notes to the financial statements are an integral part of, and should be read in conjunction with, the financial statements.
33
Financial Highlights selected per share data and ratios
| | Year Ended October 31, | | August 31, 2020^ through
October 31, |
| SIMPLE Class | 2023 | | 2022 | | 2021 | | 2020 |
| Net asset value at beginning of year | $ 8.62 | | $ 11.24 | | $ 11.41 | | $ 11.52* |
| Net investment income (loss) | 0.34 | | 0.24(a) | | 0.19(a) | | 0.03 |
| Net realized and unrealized gain (loss) | (0.22) | | (2.28) | | (0.03) | | (0.11) |
| Total from investment operations | 0.12 | | (2.04) | | 0.16 | | (0.08) |
| Less distributions: | | | | | | | |
| From net investment income | (0.34) | | (0.25) | | (0.20) | | (0.03) |
| From net realized gain on investments | — | | (0.33) | | (0.13) | | — |
| Return of capital | — | | (0.00)‡ | | — | | — |
| Total distributions | (0.34) | | (0.58) | | (0.33) | | (0.03) |
| Net asset value at end of year | $ 8.40 | | $ 8.62 | | $ 11.24 | | $ 11.41 |
| Total investment return (b) | 1.21% | | (18.85)% | | 1.39% | | (0.66)% |
| Ratios (to average net assets)/Supplemental Data: | | | | | | | |
| Net investment income (loss) | 3.79% | | 2.43% | | 1.69% | | 1.80%†† |
| Net expenses (c) | 1.10% | | 1.28% | | 1.29% | | 1.26%†† |
| Expenses (before waiver/reimbursement) (c) | 1.18% | | 1.33% | | 1.29% | | 1.26%†† |
| Portfolio turnover rate | 119% | | 98%(d) | | 111%(d) | | 123% |
| Net assets at end of year (in 000’s) | $ 21 | | $ 20 | | $ 25 | | $ 25 |
| ^ | Inception date. |
| ‡ | Less than one cent per share. |
| * | Based on the net asset value of Investor Class as of August 31, 2020. |
| †† | Annualized. |
| (a) | Per share data based on average shares outstanding during the period. |
| (b) | Total investment return is calculated exclusive of sales charges and assumes the reinvestment of dividends and distributions. SIMPLE Class shares are not subject to sales charges. For periods of less than one year, total return is not annualized. |
| (c) | In addition to the fees and expenses which the Fund bears directly, it also indirectly bears a pro-rata share of the fees and expenses of the underlying funds in which it invests. Such indirect expenses are not included in the above expense ratios. |
| (d) | The portfolio turnover rate not including mortgage dollar rolls was 96% and 108% for the years ended October 31, 2022 and 2021 respectively. |
The notes to the financial statements are an integral part of, and should be read in conjunction with, the financial statements.
| 34 | MainStay MacKay Total Return Bond Fund |
Notes to Financial Statements
Note 1-Organization and Business
MainStay Funds Trust (the “Trust”) was organized as a Delaware statutory trust on April 28, 2009. The Trust is registered under the Investment Company Act of 1940, as amended (the “1940 Act”), as an open-end management investment company, and is comprised of thirty-seven funds (collectively referred to as the “Funds”). These financial statements and notes relate to the MainStay MacKay Total Return Bond Fund (the "Fund"), a “diversified” fund, as that term is defined in the 1940 Act, as interpreted or modified by regulatory authorities having jurisdiction, from time to time.
The following table lists the Fund's share classes that have been registered and commenced operations:
| Class | Commenced Operations |
| Class A | January 2, 2004 |
| Investor Class | February 28, 2008 |
| Class B^ | January 2, 2004 |
| Class C | January 2, 2004 |
| Class I | January 2, 1991 |
| Class R1* | June 29, 2012 |
| Class R2* | June 29, 2012 |
| Class R3* | February 29, 2016 |
| Class R6 | December 29, 2014 |
| SIMPLE Class | August 31, 2020 |
| ^ | Class B shares are closed to all new purchases as well as additional investments by existing Class B shareholders and will be converted into Class A or Investor Class shares based on shareholder eligibility on or about February 28, 2024. |
| * | As of October 31, 2023, Class R1, Class R2 and Class R3 shares are closed to new investors and, upon the close of business on December 29, 2023, Class R1, Class R2 and Class R3 shares are closed to additional investments by existing shareholders. Additionally, Class R1, Class R2 and Class R3 shares will be liquidated on or about February 28, 2024 (the "Liquidation Date"). It is expected that the Fund will distribute to remaining shareholders invested in Class R1, Class R2 or Class R3 shares, on or promptly after the Liquidation Date, a liquidating distribution in cash or cash equivalents equal to the net asset value of such shares. |
Class B shares of the MainStay Group of Funds are closed to all new purchases as well as additional investments by existing Class B shareholders. Existing Class B shareholders may continue to reinvest dividends and capital gains distributions, as well as exchange their Class B shares for Class B shares of other funds in the MainStay Group of Funds as permitted by the current exchange privileges. Class B shareholders continue to be subject to any applicable contingent deferred sales charge ("CDSC") at the time of redemption. All other features of the Class B shares, including but not limited to the fees and expenses applicable to Class B shares, remain unchanged. Unless redeemed, Class B shareholders will remain in Class B shares of their respective fund until the Class B shares are converted to Class A or Investor Class shares pursuant to the applicable conversion schedule.
Class A and Investor Class shares are offered at net asset value (“NAV”) per share plus an initial sales charge. No initial sales charge applies to
investments of $1 million or more (and certain other qualified purchases) in Class A and Investor Class shares. However, a CDSC of 1.00% may be imposed on certain redemptions made within 18 months of the date of purchase on shares that were purchased without an initial sales charge. Class C shares are offered at NAV without an initial sales charge, although a 1.00% CDSC may be imposed on certain redemptions of such shares made within one year of the date of purchase of Class C shares. When Class B shares were offered, they were offered at NAV without an initial sales charge, although a CDSC that declines depending on the number of years a shareholder held its Class B shares may be imposed on certain redemptions of such shares made within six years of the date of purchase of such shares. Class I, Class R1, Class R2, Class R3, Class R6 and SIMPLE Class shares are offered at NAV without a sales charge. Depending upon eligibility, Class B shares convert to either Class A or Investor Class shares at the end of the calendar quarter eight years after the date they were purchased. In addition, depending upon eligibility, Class C shares convert to either Class A or Investor Class shares at the end of the calendar quarter eight years after the date they were purchased. Additionally, Investor Class shares may convert automatically to Class A shares. SIMPLE Class shares convert to Class A shares, or Investor Class shares if you are not eligible to hold Class A shares, at the end of the calendar quarter, ten years after the date they were purchased. Share class conversions are based on the relevant NAVs of the two classes at the time of the conversion, and no sales load or other charge is imposed. Under certain circumstances and as may be permitted by the Trust’s multiple class plan pursuant to Rule 18f-3 under the 1940 Act, specified share classes of the Fund may be converted to one or more other share classes of the Fund as disclosed in the capital share transactions within these Notes. The classes of shares have the same voting (except for issues that relate solely to one class), dividend, liquidation and other rights, and the same terms and conditions, except that under distribution plans pursuant to Rule 12b-1 under the 1940 Act, Class B and Class C shares are subject to higher distribution and/or service fees than Class A, Investor Class, Class R2, Class R3 and SIMPLE Class shares. Class I, Class R1 and Class R6 shares are not subject to a distribution and/or service fee. Class R1, Class R2 and Class R3 shares are subject to a shareholder service fee, which is in addition to fees paid under the distribution plans for Class R2 and Class R3 shares.
At a meeting held on September 25-26, 2023, the Board of Trustees (the “Board”) of the Trust, after careful consideration of a number of factors and upon the recommendation of the Fund’s investment adviser, New York Life Investment Management LLC (“New York Life Investments” or the "Manager"), approved a proposal to liquidate Class R1, Class R2 and Class R3 shares of the Fund on or about February 28, 2024, pursuant to the terms of a plan of liquidation.
In addition, the Board approved a proposal to accelerate the conversion of the Fund’s Class B shares into Class A shares, or Investor Class shares, based on shareholder eligibility. Class B shareholders of the Fund will receive Class A shares of the Fund if they hold at least $15,000 of
Notes to Financial Statements (continued)
Class B shares of the Fund on or around February 28, 2024; otherwise, Class B shareholders of the Fund will receive Investor Class shares of the Fund.
The Fund's investment objective is to seek total return.
Note 2–Significant Accounting Policies
The Fund is an investment company and accordingly follows the investment company accounting and reporting guidance of the Financial Accounting Standards Board (“FASB”) Accounting Standards Codification Topic 946 Financial Services—Investment Companies. The Fund prepares its financial statements in accordance with generally accepted accounting principles (“GAAP”) in the United States of America and follows the significant accounting policies described below.
(A) Securities Valuation. Investments are usually valued as of the close of regular trading on the New York Stock Exchange (the "Exchange") (usually 4:00 p.m. Eastern time) on each day the Fund is open for business ("valuation date").
Pursuant to Rule 2a-5 under the 1940 Act, the Board has designated New York Life Investments as its Valuation Designee (the "Valuation Designee"). The Valuation Designee is responsible for performing fair valuations relating to all investments in the Fund’s portfolio for which market quotations are not readily available; periodically assessing and managing material valuation risks; establishing and applying fair value methodologies; testing fair valuation methodologies; evaluating and overseeing pricing services; ensuring appropriate segregation of valuation and portfolio management functions; providing quarterly, annual and prompt reporting to the Board, as appropriate; identifying potential conflicts of interest; and maintaining appropriate records. The Valuation Designee has established a valuation committee ("Valuation Committee") to assist in carrying out the Valuation Designee’s responsibilities and establish prices of securities for which market quotations are not readily available. The Fund's and the Valuation Designee's policies and procedures ("Valuation Procedures") govern the Valuation Designee’s selection and application of methodologies for determining and calculating the fair value of Fund investments. The Valuation Designee may value the Fund's portfolio securities for which market quotations are not readily available and other Fund assets utilizing inputs from pricing services and other third-party sources. The Valuation Committee meets (in person, via electronic mail or via teleconference) on an ad-hoc basis to determine fair valuations and on a quarterly basis to review fair value events with respect to certain securities for which market quotations are not readily available, including valuation risks and back-testing results, and preview reports to the Board.
The Valuation Committee establishes prices of securities for which market quotations are not readily available based on such methodologies and measurements on a regular basis after considering information that is reasonably available and deemed relevant by the Valuation Committee. The Board shall oversee the Valuation Designee and review fair valuation
materials on a prompt, quarterly and annual basis and approve proposed revisions to the Valuation Procedures.
Investments for which market quotations are not readily available are valued at fair value as determined in good faith pursuant to the Valuation Procedures. A market quotation is readily available only when that quotation is a quoted price (unadjusted) in active markets for identical investments that the Fund can access at the measurement date, provided that a quotation will not be readily available if it is not reliable. "Fair value" is defined as the price the Fund would reasonably expect to receive upon selling an asset or liability in an orderly transaction to an independent buyer in the principal or most advantageous market for the asset or liability. Fair value measurements are determined within a framework that establishes a three-tier hierarchy that maximizes the use of observable market data and minimizes the use of unobservable inputs to establish a classification of fair value measurements for disclosure purposes. "Inputs" refer broadly to the assumptions that market participants would use in pricing the asset or liability, including assumptions about risk, such as the risk inherent in a particular valuation technique used to measure fair value using a pricing model and/or the risk inherent in the inputs for the valuation technique. Inputs may be observable or unobservable. Observable inputs reflect the assumptions market participants would use in pricing the asset or liability based on market data obtained from sources independent of the Fund. Unobservable inputs reflect the Fund’s own assumptions about the assumptions market participants would use in pricing the asset or liability based on the information available. The inputs or methodology used for valuing assets or liabilities may not be an indication of the risks associated with investing in those assets or liabilities. The three-tier hierarchy of inputs is summarized below.
| • | Level 1—quoted prices (unadjusted) in active markets for an identical asset or liability |
| • | Level 2—other significant observable inputs (including quoted prices for a similar asset or liability in active markets, interest rates and yield curves, prepayment speeds, credit risk, etc.) |
| • | Level 3—significant unobservable inputs (including the Fund's own assumptions about the assumptions that market participants would use in measuring fair value of an asset or liability) |
The level of an asset or liability within the fair value hierarchy is based on the lowest level of an input, both individually and in the aggregate, that is significant to the fair value measurement. The aggregate value by input level of the Fund’s assets and liabilities as of October 31, 2023, is included at the end of the Portfolio of Investments.
| 36 | MainStay MacKay Total Return Bond Fund |
The Fund may use third-party vendor evaluations, whose prices may be derived from one or more of the following standard inputs, among others:
| • Benchmark yields | • Reported trades |
| • Broker/dealer quotes | • Issuer spreads |
| • Two-sided markets | • Benchmark securities |
| • Bids/offers | • Reference data (corporate actions or material event notices) |
| • Industry and economic events | • Comparable bonds |
| • Monthly payment information | |
An asset or liability for which a market quotation is not readily available is valued by methods deemed reasonable in good faith by the Valuation Committee, following the Valuation Procedures to represent fair value. Under these procedures, the Valuation Designee generally uses a market-based approach which may use related or comparable assets or liabilities, recent transactions, market multiples, book values and other relevant information. The Valuation Designee may also use an income-based valuation approach in which the anticipated future cash flows of the asset or liability are discounted to calculate fair value. Discounts may also be applied due to the nature and/or duration of any restrictions on the disposition of the asset or liability. Fair value represents a good faith approximation of the value of a security. Fair value determinations involve the consideration of a number of subjective factors, an analysis of applicable facts and circumstances and the exercise of judgment. As a result, it is possible that the fair value for a security determined in good faith in accordance with the Valuation Procedures may differ from valuations for the same security determined for other funds using their own valuation procedures. Although the Valuation Procedures are designed to value a security at the price the Fund may reasonably expect to receive upon the security's sale in an orderly transaction, there can be no assurance that any fair value determination thereunder would, in fact, approximate the amount that the Fund would actually realize upon the sale of the security or the price at which the security would trade if a reliable market price were readily available. During the year ended October 31, 2023, there were no material changes to the fair value methodologies.
Securities which may be valued in this manner include, but are not limited to: (i) a security for which trading has been halted or suspended or otherwise does not have a readily available market quotation on a given day; (ii) a debt security that has recently gone into default and for which there is not a current market quotation; (iii) a security of an issuer that has entered into a restructuring; (iv) a security that has been delisted from a national exchange; (v) a security subject to trading collars for which no or limited trading takes place; and (vi) a security whose principal market has been temporarily closed at a time when, under normal conditions, it would be open. Securities valued in this manner are generally categorized as Level 2 or 3 in the hierarchy. No securities held by the Fund as of October 31, 2023, were fair valued in such a manner.
Equity securities, rights and warrants, if applicable, are valued at the last quoted sales prices as of the close of regular trading on the relevant
exchange on each valuation date. Securities that are not traded on the valuation date are valued at the mean of the last quoted bid and ask prices. Prices are normally taken from the principal market in which each security trades. These securities are generally categorized as Level 1 in the hierarchy.
Investments in mutual funds, including money market funds, are valued at their respective NAVs at the close of business each day on the valuation date. These securities are generally categorized as Level 1 in the hierarchy.
Futures contracts are valued at the last posted settlement price on the market where such futures are primarily traded. These securities are generally categorized as Level 1 in the hierarchy.
Debt securities (other than convertible and municipal bonds) are valued at the evaluated bid prices (evaluated mean prices in the case of convertible and municipal bonds) supplied by a pricing agent or broker selected by the Valuation Designee, in consultation with the Subadvisor. The evaluations are market-based measurements processed through a pricing application and represents the pricing agent’s good faith determination as to what a holder may receive in an orderly transaction under market conditions. The rules-based logic utilizes valuation techniques that reflect participants’ assumptions and vary by asset class and per methodology, maximizing the use of relevant observable data including quoted prices for similar assets, benchmark yield curves and market corroborated inputs. The evaluated bid or mean prices are deemed by the Valuation Designee, in consultation with the Subadvisor, to be representative of market values at the regular close of trading of the Exchange on each valuation date. Debt securities purchased on a delayed delivery basis are marked to market daily until settlement at the forward settlement date. Debt securities, including corporate bonds, U.S. government and federal agency bonds, municipal bonds, foreign bonds, convertible bonds, asset-backed securities and mortgage-backed securities are generally categorized as Level 2 in the hierarchy.
Loan assignments, participations and commitments are valued at the average of bid quotations obtained from the engaged independent pricing service and are generally categorized as Level 2 in the hierarchy. Certain loan assignments, participations and commitments may be valued by utilizing significant unobservable inputs obtained from the pricing service and are generally categorized as Level 3 in the hierarchy. No securities held by the Fund as of October 31, 2023 were fair valued utilizing significant unobservable inputs obtained from the pricing service.
Temporary cash investments acquired in excess of 60 days to maturity at the time of purchase are valued using the latest bid prices or using valuations based on a matrix system (which considers such factors as security prices, yields, maturities and ratings), both as furnished by independent pricing services. Temporary cash investments that mature in 60 days or less at the time of purchase ("Short-Term Investments") are valued using the amortized cost method of valuation, unless the use of such method would be inappropriate. The amortized cost method involves valuing a security at its cost on the date of purchase and thereafter assuming a constant amortization to maturity of the difference between
Notes to Financial Statements (continued)
such cost and the value on maturity date. Amortized cost approximates the current fair value of a security. Securities valued using the amortized cost method are not valued using quoted prices in an active market and are generally categorized as Level 2 in the hierarchy.
The information above is not intended to reflect an exhaustive list of the methodologies that may be used to value portfolio investments. The Valuation Procedures permit the use of a variety of valuation methodologies in connection with valuing portfolio investments. The methodology used for a specific type of investment may vary based on the market data available or other considerations. The methodologies summarized above may not represent the specific means by which portfolio investments are valued on any particular business day.
A portfolio investment may be classified as an illiquid investment under the Trust's written liquidity risk management program and related procedures (“Liquidity Program”). Illiquidity of an investment might prevent the sale of such investment at a time when the Manager or the Subadvisor might wish to sell, and these investments could have the effect of decreasing the overall level of the Fund's liquidity. Further, the lack of an established secondary market may make it more difficult to value illiquid investments, requiring the Fund to rely on judgments that may be somewhat subjective in measuring value, which could vary materially from the amount that the Fund could realize upon disposition. Difficulty in selling illiquid investments may result in a loss or may be costly to the Fund. An illiquid investment is any investment that the Manager or Subadvisor reasonably expects cannot be sold or disposed of in current market conditions in seven calendar days or less without the sale or disposition significantly changing the market value of the investment. The liquidity classification of each investment will be made using information obtained after reasonable inquiry and taking into account, among other things, relevant market, trading and investment-specific considerations in accordance with the Liquidity Program. Illiquid investments are often fair valued in accordance with the Fund's procedures described above. The liquidity of the Fund's investments was determined as of October 31, 2023, and can change at any time. Illiquid investments as of October 31, 2023, are shown in the Portfolio of Investments.
(B) Income Taxes. The Fund's policy is to comply with the requirements of the Internal Revenue Code of 1986, as amended (the “Internal Revenue Code”), applicable to regulated investment companies and to distribute all of its taxable income to the shareholders of the Fund within the allowable time limits.
The Manager evaluates the Fund’s tax positions to determine if the tax positions taken meet the minimum recognition threshold in connection with accounting for uncertainties in income tax positions taken or expected to be taken for the purposes of measuring and recognizing tax liabilities in the financial statements. Recognition of tax benefits of an uncertain tax position is permitted only to the extent the position is “more likely than not” to be sustained assuming examination by taxing authorities. The Manager analyzed the Fund's tax positions taken on federal, state and local income tax returns for all open tax years (for up to
three tax years) and has concluded that no provisions for federal, state and local income tax are required in the Fund's financial statements. The Fund's federal, state and local income tax and federal excise tax returns for tax years for which the applicable statutes of limitations have not expired are subject to examination by the Internal Revenue Service and state and local departments of revenue.
(C) Dividends and Distributions to Shareholders. Dividends and distributions are recorded on the ex-dividend date. The Fund intends to declare and pay dividends from net investment income, if any, at least monthly and distributions from net realized capital and currency gains, if any, at least annually. Unless a shareholder elects otherwise, all dividends and distributions are reinvested at NAV in the same class of shares of the Fund. Dividends and distributions to shareholders are determined in accordance with federal income tax regulations and may differ from determinations using GAAP.
(D) Security Transactions and Investment Income. The Fund records security transactions on the trade date. Realized gains and losses on security transactions are determined using the identified cost method. Interest income is accrued as earned using the effective interest rate method and includes any realized gains and losses from repayments of principal on mortgage-backed securities. Distributions received from real estate investment trusts may be classified as dividends, capital gains and/or return of capital. Discounts and premiums on securities purchased for the Fund are accreted and amortized, respectively. Income from payment-in-kind securities is accreted daily based on the effective interest method.
Investment income and realized and unrealized gains and losses on investments of the Fund are allocated pro rata to the separate classes of shares based upon their relative net assets on the date the income is earned or realized and unrealized gains and losses are incurred.
The Fund may place a debt security on non-accrual status and reduce related interest income by ceasing current accruals and writing off all or a portion of any interest receivables when the collection of all or a portion of such interest has become doubtful. A debt security is removed from non-accrual status when the issuer resumes interest payments or when collectability of interest is reasonably assured.
(E) Expenses. Expenses of the Trust are allocated to the individual Funds in proportion to the net assets of the respective Funds when the expenses are incurred, except where direct allocations of expenses can be made. Expenses (other than transfer agent expenses and fees incurred under the shareholder services plans and/or the distribution plans further discussed in Note 3(B)) are allocated to separate classes of shares pro rata based upon their relative net assets on the date the expenses are incurred. The expenses borne by the Fund, including those of related parties to the Fund, are shown in the Statement of Operations.
Additionally, the Fund may invest in mutual funds, which are subject to management fees and other fees that may cause the costs of investing in mutual funds to be greater than the costs of owning the underlying securities directly. These indirect expenses of mutual funds are not
| 38 | MainStay MacKay Total Return Bond Fund |
included in the amounts shown as expenses in the Statement of Operations or in the expense ratios included in the Financial Highlights.
(F) Use of Estimates. In preparing financial statements in conformity with GAAP, the Manager makes estimates and assumptions that affect the reported amounts and disclosures in the financial statements. Actual results could differ from those estimates and assumptions.
(G) Futures Contracts. A futures contract is an agreement to purchase or sell a specified quantity of an underlying instrument at a specified future date and price, or to make or receive a cash payment based on the value of a financial instrument (e.g., foreign currency, interest rate, security or securities index). The Fund is subject to risks such as market price risk, leverage risk, liquidity risk, counterparty risk, operational risk, legal risk and/or interest rate risk in the normal course of investing in these contracts. Upon entering into a futures contract, the Fund is required to pledge to the broker or futures commission merchant an amount of cash and/or U.S. government securities equal to a certain percentage of the collateral amount, known as the “initial margin.” During the period the futures contract is open, changes in the value of the contract are recognized as unrealized appreciation or depreciation by marking to market such contract on a daily basis to reflect the market value of the contract at the end of each day’s trading. The Fund agrees to receive from or pay to the broker or futures commission merchant an amount of cash equal to the daily fluctuation in the value of the contract. Such receipts or payments are known as “variation margin.” When the futures contract is closed, the Fund records a realized gain or loss equal to the difference between the proceeds from (or cost of) the closing transaction and the Fund's basis in the contract.
The use of futures contracts involves, to varying degrees, elements of market risk in excess of the amount recognized in the Statement of Assets and Liabilities. The contract or notional amounts and variation margin reflect the extent of the Fund's involvement in open futures positions. There are several risks associated with the use of futures contracts as hedging techniques. There can be no assurance that a liquid market will exist at the time when the Fund seeks to close out a futures contract. If no liquid market exists, the Fund would remain obligated to meet margin requirements until the position is closed. Futures contracts may involve a small initial investment relative to the risk assumed, which could result in losses greater than if the Fund did not invest in futures contracts. Futures contracts may be more volatile than direct investments in the instrument underlying the futures and may not correlate to the underlying instrument, causing a given hedge not to achieve its objectives. The Fund's activities in futures contracts have minimal counterparty risk as they are conducted through regulated exchanges that guarantee the futures against default by the counterparty. In the event of a bankruptcy or insolvency of a futures commission merchant that holds margin on behalf of the Fund, the Fund may not be entitled to the return of the entire margin owed to the Fund, potentially resulting in a loss. The Fund may invest in futures contracts to seek enhanced returns or to reduce the risk of loss by hedging certain of its holdings. The Fund's investment in futures contracts and other derivatives may increase the
volatility of the Fund's NAVs and may result in a loss to the Fund. Open futures contracts as of October 31, 2023, are shown in the Portfolio of Investments.
(H) Loan Assignments, Participations and Commitments. The Fund may invest in loan assignments and participations ("loans"). Commitments are agreements to make money available to a borrower in a specified amount, at a specified rate and within a specified time. The Fund records an investment when the borrower withdraws money on a commitment or when a funded loan is purchased (trade date) and records interest as earned. These loans pay interest at rates that are periodically reset by reference to a base lending rate plus a spread. These base lending rates are generally the prime rate offered by a designated U.S. bank, the Secured Overnight Financing Rate ("SOFR") or an alternative reference rate.
The loans in which the Fund may invest are generally readily marketable, but may be subject to some restrictions on resale. For example, the Fund may be contractually obligated to receive approval from the agent bank and/or borrower prior to the sale of these investments. If the Fund purchases an assignment from a lender, the Fund will generally have direct contractual rights against the borrower in favor of the lender. If the Fund purchases a participation interest either from a lender or a participant, the Fund typically will have established a direct contractual relationship with the seller of the participation interest, but not with the borrower. Consequently, the Fund is subject to the credit risk of the lender or participant who sold the participation interest to the Fund, in addition to the usual credit risk of the borrower. In the event that the borrower, selling participant or intermediate participants become insolvent or enter into bankruptcy, the Fund may incur certain costs and delays in realizing payment, or may suffer a loss of principal and/or interest.
Unfunded commitments represent the remaining obligation of the Fund to the borrower. At any point in time, up to the maturity date of the issue, the borrower may demand the unfunded portion. Unfunded amounts, if any, are marked to market and any unrealized gains or losses are recorded in the Statement of Assets and Liabilities. As of October 31, 2023, the Fund did not hold any unfunded commitments.
(I) Foreign Currency Transactions. The Fund's books and records are maintained in U.S. dollars. Prices of securities denominated in foreign currency amounts are translated into U.S. dollars at the mean between the buying and selling rates last quoted by any major U.S. bank at the following dates:
(i) market value of investment securities, other assets and liabilities— at the valuation date; and
(ii) purchases and sales of investment securities, income and expenses—at the date of such transactions.
The assets and liabilities that are denominated in foreign currency amounts are presented at the exchange rates and market values at the close of the period. The realized and unrealized changes in net assets
Notes to Financial Statements (continued)
arising from fluctuations in exchange rates and market prices of securities are not separately presented.
Net realized gain (loss) on foreign currency transactions represents net currency gains or losses realized as a result of differences between the amounts of securities sale proceeds or purchase cost, dividends, interest and withholding taxes as recorded on the Fund's books, and the U.S. dollar equivalent amount actually received or paid. Net currency gains or losses from valuing such foreign currency denominated assets and liabilities, other than investments at valuation date exchange rates, are reflected in unrealized foreign exchange gains or losses.
(J) Securities Lending. In order to realize additional income, the Fund may engage in securities lending, subject to the limitations set forth in the 1940 Act and relevant guidance by the staff of the Securities and Exchange Commission (“SEC”). If the Fund engages in securities lending, the Fund will lend through its custodian, JPMorgan Chase Bank, N.A., ("JPMorgan"), acting as securities lending agent on behalf of the Fund. Under the current arrangement, JPMorgan will manage the Fund's collateral in accordance with the securities lending agency agreement between the Fund and JPMorgan, and indemnify the Fund against counterparty risk. The loans will be collateralized by cash (which may be invested in a money market fund) and/or non-cash collateral (which may include U.S. Treasury securities and/or U.S. government agency securities issued or guaranteed by the United States government or its agencies or instrumentalities) at least equal at all times to the market value of the securities loaned. Non-cash collateral held at year end is segregated and cannot be transferred by the Fund. The Fund bears the risk of delay in recovery of, or loss of rights in, the securities loaned. The Fund may also record a realized gain or loss on securities deemed sold due to a borrower’s inability to return securities on loan. The Fund bears the risk of any loss on investment of cash collateral. The Fund will receive compensation for lending its securities in the form of fees or it will retain a portion of interest earned on the investment of any cash collateral. The Fund will also continue to receive interest and dividends on the securities loaned and any gain or loss in the market price of the securities loaned that may occur during the term of the loan will be for the account of the Fund. Income earned from securities lending activities, if any, is reflected in the Statement of Operations. Securities on loan as of October 31, 2023, are shown in the Portfolio of Investments.
(K) Dollar Rolls. The Fund may enter into dollar roll transactions in which it sells mortgage-backed securities ("MBS") from its portfolio to a counterparty from whom it simultaneously agrees to buy a similar security on a delayed delivery basis. The Fund generally transfers MBS where the MBS are "to be announced," therefore, the Fund accounts for these transactions as purchases and sales.
When accounted for as purchase and sales, the securities sold in connection with the dollar rolls are removed from the portfolio and a realized gain or loss is recognized. The securities the Fund has agreed to acquire are included at market value in the Portfolio of Investments and liabilities for such purchase commitments are included as payables for investments purchased. During the roll period, the Fund foregoes
principal and interest paid on the securities. The Fund is compensated by the difference between the current sales price and the forward price for the future as well as by the earnings on the cash proceeds of the initial sale. Dollar rolls may be renewed without physical delivery of the securities subject to the contract. Dollar roll transactions involve certain risks, including the risk that the securities returned to the Fund at the end of the roll period, while substantially similar, could be inferior to what was initially sold to the counterparty. During the year ended October 31, 2023, the Fund did not invest in Dollar Rolls.
(L) Foreign Securities Risk. The ability of issuers of debt securities held by the Fund to meet their obligations may be affected by, among other things, economic or political developments in a specific country, industry or region. Debt securities are also subject to the risks associated with changes in interest rates. The Fund may invest in foreign securities, which carry certain risks that are in addition to the usual risks inherent in domestic securities. Foreign regulatory regimes and securities markets can have less stringent investor protections and disclosure standards and less liquid trading markets than U.S. regulatory regimes and securities markets, and can experience political, social and economic developments that may affect the value of investments in foreign securities. These risks include those resulting from currency fluctuations, future adverse political or economic developments and possible imposition of currency exchange blockages or other foreign governmental laws or restrictions. Economic sanctions and other similar governmental actions or developments could, among other things, effectively restrict or eliminate the Fund’s ability to purchase or sell certain foreign securities or groups of foreign securities, and thus may make the Fund’s investments in such securities less liquid or more difficult to value. These risks are likely to be greater in emerging markets than in developed markets. The ability of issuers of debt securities held by the Fund to meet their obligations may be affected by, among other things, economic or political developments in a specific country, industry or region.
(M) LIBOR Replacement Risk. The Fund may invest in certain debt securities, derivatives or other financial instruments that have relied or continue to rely on the London Interbank Offered Rate ("LIBOR"), as a “benchmark” or “reference rate” for various interest rate calculations. As of January 1, 2022, the United Kingdom Financial Conduct Authority ("FCA"), which regulates LIBOR, ceased its active encouragement of banks to provide the quotations needed to sustain most LIBOR rates due to the absence of an active market for interbank unsecured lending and other reasons. In connection with supervisory guidance from U.S. regulators, certain U.S. regulated entities have generally ceased to enter into certain new LIBOR contracts after January 1, 2022. On March 15, 2022, the Adjustable Interest Rate (LIBOR) Act was signed into law. This law provides a statutory fallback mechanism on a nationwide basis to replace LIBOR with a benchmark rate that is selected by the Board of Governors of the Federal Reserve System and based on Secured Overnight Financing Rate ("SOFR") (which measures the cost of overnight borrowings through repurchase agreement transactions collateralized with U.S. Treasury securities) for tough legacy contracts. On February 27, 2023, the Federal Reserve System’s final rule in connection with this law
| 40 | MainStay MacKay Total Return Bond Fund |
became effective, establishing benchmark replacements based on SOFR and Term SOFR (a forward-looking measurement of market expectations of SOFR implied from certain derivatives markets) for applicable tough legacy contracts governed by U.S. law. In addition, the FCA has announced that it will require the publication of synthetic LIBOR for the one-month, three-month and six-month U.S. Dollar LIBOR settings after June 30, 2023 through at least September 30, 2024. Certain of the Fund's investments may involve individual tough legacy contracts which may be subject to the Adjustable Interest Rate (LIBOR) Act or synthetic LIBOR and no assurances can be given that these measures will have had the intended effects. Although the transition process away from LIBOR for many instruments has been completed, some LIBOR use is continuing and there are potential effects related to the transition away from LIBOR or continued use of LIBOR on the Fund.
The elimination of LIBOR or changes to other reference rates or any other changes or reforms to the determination or supervision of reference rates could have an adverse impact on the market for, or value of, any securities or payments linked to those reference rates, which may adversely affect the Fund's performance and/or net asset value. It could also lead to a reduction in the interest rates on, and the value of, some LIBOR-based investments and reduce the effectiveness of hedges mitigating risk in connection with LIBOR-based investments. Uncertainty and risk also remain regarding the willingness and ability of issuers and lenders to include enhanced provisions in new and existing contracts or instruments. Consequently, the transition away from LIBOR to other reference rates may lead to increased volatility and illiquidity in markets that are tied to LIBOR, fluctuations in values of LIBOR-related investments or investments in issuers that utilize LIBOR, increased difficulty in borrowing or refinancing and diminished effectiveness of hedging strategies, adversely affecting the Fund's performance. Furthermore, the risks associated with the expected discontinuation of LIBOR and transition may be exacerbated if the work necessary to effect an orderly transition to an alternative reference rate is not completed in a timely manner. The usefulness of LIBOR as a benchmark could deteriorate anytime during this transition period. Any such effects of the transition process, including unforeseen effects, could result in losses to the Fund.
(N) Large Transaction Risks. From time to time, the Fund may receive large purchase or redemption orders from affiliated or unaffiliated mutual funds or other investors. Such large transactions could have adverse effects on the Fund’s performance if the Fund were required to sell securities or invest cash at times when it otherwise would not do so. This activity could also accelerate the realization of capital gains and increase the Fund’s transaction costs. The Fund has adopted procedures designed to mitigate the negative impacts of such large transactions, but there can be no assurance that these procedures will be effective.
(O) Indemnifications. Under the Trust’s organizational documents, its officers and trustees are indemnified against certain liabilities that may arise out of performance of their duties to the Trust. Additionally, in the normal course of business, the Fund enters into contracts with third-party service providers that contain a variety of representations and warranties
and that may provide general indemnifications. The Fund's maximum exposure under these arrangements is unknown, as this would involve future claims that may be made against the Fund that have not yet occurred. The Manager believes that the risk of loss in connection with these potential indemnification obligations is remote. However, there can be no assurance that material liabilities related to such obligations will not arise in the future, which could adversely impact the Fund.
(P) Quantitative Disclosure of Derivative Holdings. The following tables show additional disclosures related to the Fund's derivative and hedging activities, including how such activities are accounted for and their effect on the Fund's financial positions, performance and cash flows.
The Fund entered into futures contracts to help manage the duration and yield curve positioning of the portfolio while minimizing the exposure to wider bid/ask spreads in traditional bonds. These derivatives are not accounted for as hedging instruments.
Fair value of derivative instruments as of October 31, 2023:
| Asset Derivatives | Interest
Rate
Contracts
Risk | Total |
| Futures Contracts - Net Assets—Net unrealized appreciation on futures contracts (a) | $131,444 | $131,444 |
| Total Fair Value | $131,444 | $131,444 |
| (a) | Includes cumulative appreciation (depreciation) of futures contracts as reported in the Portfolio of Investments. Only current day’s variation margin is reported within the Statement of Assets and Liabilities. |
| Liability Derivatives | Interest
Rate
Contracts
Risk | Total |
| Futures Contracts - Net Assets—Net unrealized depreciation on futures contracts (a) | $(4,382,201) | $(4,382,201) |
| Total Fair Value | $(4,382,201) | $(4,382,201) |
| (a) | Includes cumulative appreciation (depreciation) of futures contracts as reported in the Portfolio of Investments. Only current day’s variation margin is reported within the Statement of Assets and Liabilities. |
The effect of derivative instruments on the Statement of Operations for the year ended October 31, 2023:
| Net Realized Gain (Loss) from: | Interest
Rate
Contracts
Risk | Total |
| Futures Transactions | $(7,265,832) | $(7,265,832) |
| Total Net Realized Gain (Loss) | $(7,265,832) | $(7,265,832) |
Notes to Financial Statements (continued)
| Net Change in Unrealized Appreciation (Depreciation) | Interest
Rate
Contracts
Risk | Total |
| Futures Contracts | $(887,588) | $(887,588) |
| Total Net Change in Unrealized Appreciation (Depreciation) | $(887,588) | $(887,588) |
| Average Notional Amount | Total |
| Futures Contracts Long | $107,922,119 |
| Futures Contracts Short | $ (8,513,819) |
Note 3–Fees and Related Party Transactions
(A) Manager and Subadvisor. New York Life Investments, a registered investment adviser and an indirect, wholly-owned subsidiary of New York Life Insurance Company ("New York Life"), serves as the Fund's Manager, pursuant to an Amended and Restated Management Agreement ("Management Agreement"). The Manager provides offices, conducts clerical, recordkeeping and bookkeeping services and keeps most of the financial and accounting records required to be maintained by the Fund. Except for the portion of salaries and expenses that are the responsibility of the Fund, the Manager pays the salaries and expenses of all personnel affiliated with the Fund and certain operational expenses of the Fund. The Fund reimburses New York Life Investments in an amount equal to the portion of the compensation of the Chief Compliance Officer attributable to the Fund. MacKay Shields LLC ("MacKay Shields" or the "Subadvisor"), a registered investment adviser and an indirect, wholly-owned subsidiary of New York Life, serves as the Subadvisor to the Fund and is responsible for the day-to-day portfolio management of the Fund. Pursuant to the terms of an Amended and Restated Subadvisory Agreement ("Subadvisory Agreement") between New York Life Investments and MacKay Shields, New York Life Investments pays for the services of the Subadvisor.
Pursuant to the Management Agreement, the Fund pays the Manager a monthly fee for the services performed and the facilities furnished at an annual rate of the Fund’s average daily net assets as follows: 0.45% up to $1 billion; 0.44% from $1 billion to $3 billion; and 0.43% in excess of $3 billion. During the year ended October 31, 2023, the effective management fee rate was 0.45% of the Fund’s average daily net assets, exclusive of any applicable waivers/reimbursements.
New York Life Investments has contractually agreed to waive fees and/or reimburse expenses so that Total Annual Fund Operating Expenses (excluding taxes, interest, litigation, extraordinary expenses, brokerage and other transaction expenses relating to the purchase or sale of portfolio investments and acquired (underlying) fund fees and expenses) do not exceed the following percentages of daily net assets: 0.88% for Class A shares and 0.45% for Class I shares. New York Life Investments will apply an equivalent waiver or reimbursement, in an equal number of basis points of the Class A shares waiver/reimbursement to Investor Class shares, Class B shares, Class C shares, Class R1 shares, Class R2
shares, Class R3 shares and SIMPLE Class shares. New York Life Investments has also contractually agreed to waive fees and/or reimburse expenses so that Total Annual Fund Operating Expenses (excluding taxes, interest, litigation, extraordinary expenses, brokerage and other transaction expenses relating to the purchase or sale of portfolio investments, and acquired (underlying) fund fees and expenses) of Class R6 do not exceed those of Class I. These agreements will remain in effect until February 28, 2024, and shall renew automatically for one-year terms unless New York Life Investments provides written notice of termination prior to the start of the next term or upon approval of the Board.
Additionally, New York Life Investments has agreed to further voluntarily waive fees and/or reimburse expenses of the appropriate class of the Fund so that Total Annual Fund Operating Expenses (excluding taxes, interest, litigation, extraordinary expenses, brokerage and other transaction expenses relating to the purchase and sale of portfolio investments, and acquired (underlying) fund fees and expenses) of Class R1, Class R2 and Class R3 shares of the Fund do not exceed 0.70%, 0.95% and 1.20%, respectively, of the Fund’s average daily net assets. These voluntary waivers or reimbursements may be discontinued at any time without notice.
During the year ended October 31, 2023, New York Life Investments earned fees from the Fund in the amount of $1,878,427 and waived fees and/or reimbursed expenses in the amount of $428,398 and paid the Subadvisor fees in the amount of $725,014.
JPMorgan provides sub-administration and sub-accounting services to the Fund pursuant to an agreement with New York Life Investments. These services include calculating the daily NAVs of the Fund, maintaining the general ledger and sub-ledger accounts for the calculation of the Fund's NAVs, and assisting New York Life Investments in conducting various aspects of the Fund's administrative operations. For providing these services to the Fund, JPMorgan is compensated by New York Life Investments.
Pursuant to an agreement between the Trust and New York Life Investments, New York Life Investments is responsible for providing or procuring certain regulatory reporting services for the Fund. The Fund will reimburse New York Life Investments for the actual costs incurred by New York Life Investments in connection with providing or procuring these services for the Fund.
(B) Distribution and Service Fees. The Trust, on behalf of the Fund, has entered into a distribution agreement with NYLIFE Distributors LLC (the “Distributor”), an affiliate of New York Life Investments. The Fund has adopted distribution plans (the “Plans”) in accordance with the provisions of Rule 12b-1 under the 1940 Act.
Pursuant to the Class A, Investor Class and Class R2 Plans, the Distributor receives a monthly fee from the Class A, Investor Class and Class R2 shares at an annual rate of 0.25% of the average daily net assets of the Class A, Investor Class and Class R2 shares for distribution and/or service activities as designated by the Distributor. Pursuant to the
| 42 | MainStay MacKay Total Return Bond Fund |
Class B and Class C Plans, Class B and Class C shares pay the Distributor a monthly distribution fee at an annual rate of 0.75% of the average daily net assets of the Class B and Class C shares, along with a service fee at an annual rate of 0.25% of the average daily net assets of the Class B and Class C shares, for a total 12b-1 fee of 1.00%. Pursuant to the Class R3 and SIMPLE Class Plans, Class R3 and SIMPLE Class shares pay the Distributor a monthly distribution fee at an annual rate of 0.25% of the average daily net assets of the Class R3 and SIMPLE Class shares, along with a service fee at an annual rate of 0.25% of the average daily net assets of the Class R3 and SIMPLE Class shares, for a total 12b-1 fee of 0.50%. Class I, Class R1 and Class R6 shares are not subject to a distribution and/or service fee.
The Plans provide that the distribution and service fees are payable to the Distributor regardless of the amounts actually expended by the Distributor for distribution of the Fund's shares and service activities.
In accordance with the Shareholder Services Plans for the Class R1, Class R2 and Class R3 shares, the Manager has agreed to provide, through its affiliates or independent third parties, various shareholder and administrative support services to shareholders of the Class R1, Class R2 and Class R3 shares. For its services, the Manager, its affiliates or independent third-party service providers are entitled to a shareholder service fee accrued daily and paid monthly at an annual rate of 0.10% of the average daily net assets of the Class R1, Class R2 and Class R3 shares. This is in addition to any fees paid under the Class R2 and Class R3 Plans.
During the year ended October 31, 2023, shareholder service fees incurred by the Fund were as follows:
| |
| Class R1 | $ 26 |
| Class R2 | 29 |
| Class R3 | 501 |
(C) Sales Charges. The Fund was advised by the Distributor that the amount of initial sales charges retained on sales of Class A and Investor Class shares during the year ended October 31, 2023, were $5,430 and $674, respectively.
The Fund was also advised that the Distributor retained CDSCs on redemptions of Class A, Class B and Class C shares during the year ended October 31, 2023, of $423, $82 and $82, respectively.
(D) Transfer, Dividend Disbursing and Shareholder Servicing Agent. NYLIM Service Company LLC, an affiliate of New York Life Investments, is the Fund's transfer, dividend disbursing and shareholder servicing agent pursuant to an agreement between NYLIM Service Company LLC and the Trust. NYLIM Service Company LLC has entered into an agreement with SS&C Global Investor & Distribution Solutions, Inc. ("SS&C"), pursuant to which SS&C performs certain transfer agent services on behalf of NYLIM Service Company LLC. New York Life Investments has contractually agreed to limit the transfer agency expenses charged to the Fund’s share classes to a maximum of 0.35% of
that share class’s average daily net assets on an annual basis after deducting any applicable Fund or class-level expense reimbursement or small account fees. This agreement will remain in effect until February 28, 2024, and shall renew automatically for one-year terms unless New York Life Investments provides written notice of termination prior to the start of the next term or upon approval of the Board. During the year ended October 31, 2023, transfer agent expenses incurred by the Fund and any reimbursements, pursuant to the aforementioned Transfer Agency expense limitation agreement, were as follows:
| Class | Expense | Waived |
| Class A | $ 70,979 | $— |
| Investor Class | 18,998 | — |
| Class B | 2,094 | — |
| Class C | 16,753 | — |
| Class I | 119,413 | — |
| Class R1 | 34 | — |
| Class R2 | 39 | — |
| Class R3 | 669 | — |
| Class R6 | 10,570 | — |
| SIMPLE Class | 32 | — |
(E) Small Account Fee. Shareholders with small accounts adversely impact the cost of providing transfer agency services. In an effort to reduce total transfer agency expenses, the Fund has implemented a small account fee on certain types of accounts. As described in the Fund's prospectus, certain shareholders with an account balance of less than $1,000 ($5,000 for Class A share accounts) are charged an annual per account fee of $20 (assessed semi-annually), the proceeds from which offset transfer agent fees as reflected in the Statement of Operations. This small account fee will not apply to certain types of accounts as described further in the Fund’s prospectus.
(F) Capital. As of October 31, 2023, New York Life and its affiliates beneficially held shares of the Fund with the values and percentages of net assets as follows:
| Class I | $374,661 | 0.6% |
| Class R1 | 24,292 | 99.7 |
| Class R2 | 27,457 | 99.7 |
| Class R3 | 25,317 | 5.5 |
| Class R6 | 26,584 | 0.0‡ |
| SIMPLE Class | 20,611 | 99.7 |
| ‡ | Less than one-tenth of a percent. |
Notes to Financial Statements (continued)
Note 4-Federal Income Tax
As of October 31, 2023, the cost and unrealized appreciation (depreciation) of the Fund’s investment portfolio, including applicable derivative contracts and other financial instruments, as determined on a federal income tax basis, were as follows:
| | Federal Tax
Cost | Gross
Unrealized
Appreciation | Gross
Unrealized
(Depreciation) | Net
Unrealized
Appreciation/
(Depreciation) |
| Investments in Securities | $402,584,551 | $1,433,335 | $(45,489,630) | $(44,056,295) |
As of October 31, 2023, the components of accumulated gain (loss) on a tax basis were as follows:
Ordinary
Income | Accumulated
Capital
and Other
Gain (Loss) | Other
Temporary
Differences | Unrealized
Appreciation
(Depreciation) | Total
Accumulated
Gain (Loss) |
| $134,777 | $(63,495,657) | $(13,084) | $(44,154,665) | $(107,528,629) |
The difference between book-basis and tax-basis unrealized appreciation (depreciation) is primarily due to wash sale adjustments and mark to market on futures contracts.
As of October 31, 2023, for federal income tax purposes, capital loss carryforwards of $63,495,657, as shown in the table below, were available to the extent provided by the regulations to offset future realized gains of the Fund. Accordingly, no capital gains distributions are expected to be paid to shareholders until net gains have been realized in excess of such amounts.
Capital Loss
Available Through | Short-Term
Capital Loss
Amounts (000’s) | Long-Term
Capital Loss
Amounts (000’s) |
| Unlimited | $26,683 | $36,812 |
During the years ended October 31, 2023 and October 31, 2022, the tax character of distributions paid as reflected in the Statements of Changes in Net Assets was as follows:
| | 2023 | 2022 |
| Distributions paid from: | | |
| Ordinary Income | $18,102,005 | $23,740,154 |
| Long-Term Capital Gains | — | 18,805,868 |
| Return of Capital | — | 172,082 |
| Total | $18,102,005 | $42,718,104 |
Note 5–Custodian
JPMorgan is the custodian of cash and securities held by the Fund. Custodial fees are charged to the Fund based on the Fund's net assets and/or the market value of securities held by the Fund and the number of certain transactions incurred by the Fund.
Note 6–Line of Credit
The Fund and certain other funds managed by New York Life Investments maintain a line of credit with a syndicate of banks in order to secure a source of funds for temporary purposes to meet unanticipated or excessive redemption requests.
Effective July 25, 2023, under the credit agreement (the “Credit Agreement”), the aggregate commitment amount is $600,000,000 with an additional uncommitted amount of $100,000,000. The commitment fee is an annual rate of 0.15% of the average commitment amount payable quarterly, regardless of usage, to JPMorgan, who serves as the agent to the syndicate. The commitment fee is allocated among the Fund and certain other funds managed by New York Life Investments based upon their respective net assets and other factors. Interest on any revolving credit loan is charged based upon the Federal Funds Rate, Daily Simple SOFR + 0.10%, or the Overnight Bank Funding Rate, whichever is higher. The Credit Agreement expires on July 23, 2024, although the Fund, certain other funds managed by New York Life Investments and the syndicate of banks may renew the Credit Agreement for an additional year on the same or different terms or enter into a credit agreement with a different syndicate of banks. Prior to July 25, 2023, the aggregate commitment amount and the commitment fee were the same as those under the current Credit Agreement. During the year ended October 31, 2023, there were no borrowings made or outstanding with respect to the Fund under the Credit Agreement.
Note 7–Interfund Lending Program
Pursuant to an exemptive order issued by the SEC, the Fund, along with certain other funds managed by New York Life Investments, may participate in an interfund lending program. The interfund lending program provides an alternative credit facility that permits the Fund and certain other funds managed by New York Life Investments to lend or borrow money for temporary purposes directly to or from one another, subject to the conditions of the exemptive order. During the year ended October 31, 2023, there were no interfund loans made or outstanding with respect to the Fund.
Note 8–Purchases and Sales of Securities (in 000’s)
During the year ended October 31, 2023, purchases and sales of U.S. government securities were $238,410 and $288,321, respectively. Purchases and sales of securities, other than U.S. government securities and short-term securities, were $246,170 and $261,552, respectively.
Note 9–Capital Share Transactions
Transactions in capital shares for the years ended October 31, 2023 and October 31, 2022, were as follows:
| 44 | MainStay MacKay Total Return Bond Fund |
| Class A | Shares | Amount |
| Year ended October 31, 2023: | | |
| Shares sold | 1,336,524 | $ 12,009,159 |
| Shares issued to shareholders in reinvestment of distributions | 225,233 | 1,995,767 |
| Shares redeemed | (2,404,821) | (21,340,980) |
| Net increase (decrease) in shares outstanding before conversion | (843,064) | (7,336,054) |
| Shares converted into Class A (See Note 1) | 45,479 | 403,871 |
| Shares converted from Class A (See Note 1) | (790) | (6,740) |
| Net increase (decrease) | (798,375) | $ (6,938,923) |
| Year ended October 31, 2022: | | |
| Shares sold | 789,544 | $ 8,073,585 |
| Shares issued to shareholders in reinvestment of distributions | 437,720 | 4,500,205 |
| Shares redeemed | (2,750,861) | (27,384,604) |
| Net increase (decrease) in shares outstanding before conversion | (1,523,597) | (14,810,814) |
| Shares converted into Class A (See Note 1) | 33,307 | 341,580 |
| Net increase (decrease) | (1,490,290) | $ (14,469,234) |
| |
| Investor Class | Shares | Amount |
| Year ended October 31, 2023: | | |
| Shares sold | 21,347 | $ 190,107 |
| Shares issued to shareholders in reinvestment of distributions | 19,166 | 170,877 |
| Shares redeemed | (86,094) | (765,645) |
| Net increase (decrease) in shares outstanding before conversion | (45,581) | (404,661) |
| Shares converted into Investor Class (See Note 1) | 22,716 | 202,510 |
| Shares converted from Investor Class (See Note 1) | (28,987) | (258,759) |
| Net increase (decrease) | (51,852) | $ (460,910) |
| Year ended October 31, 2022: | | |
| Shares sold | 18,401 | $ 187,043 |
| Shares issued to shareholders in reinvestment of distributions | 34,395 | 355,385 |
| Shares redeemed | (116,449) | (1,174,918) |
| Net increase (decrease) in shares outstanding before conversion | (63,653) | (632,490) |
| Shares converted into Investor Class (See Note 1) | 11,696 | 117,451 |
| Shares converted from Investor Class (See Note 1) | (20,166) | (213,878) |
| Net increase (decrease) | (72,123) | $ (728,917) |
| |
| Class B | Shares | Amount |
| Year ended October 31, 2023: | | |
| Shares sold | 9 | $ 91 |
| Shares issued to shareholders in reinvestment of distributions | 1,659 | 14,733 |
| Shares redeemed | (12,098) | (107,511) |
| Net increase (decrease) in shares outstanding before conversion | (10,430) | (92,687) |
| Shares converted from Class B (See Note 1) | (10,455) | (92,850) |
| Net increase (decrease) | (20,885) | $ (185,537) |
| Year ended October 31, 2022: | | |
| Shares sold | 215 | $ 2,273 |
| Shares issued to shareholders in reinvestment of distributions | 4,337 | 45,048 |
| Shares redeemed | (21,775) | (214,657) |
| Net increase (decrease) in shares outstanding before conversion | (17,223) | (167,336) |
| Shares converted from Class B (See Note 1) | (9,185) | (91,192) |
| Net increase (decrease) | (26,408) | $ (258,528) |
| |
| Class C | Shares | Amount |
| Year ended October 31, 2023: | | |
| Shares sold | 28,064 | $ 251,509 |
| Shares issued to shareholders in reinvestment of distributions | 13,540 | 120,424 |
| Shares redeemed | (135,149) | (1,207,734) |
| Net increase (decrease) in shares outstanding before conversion | (93,545) | (835,801) |
| Shares converted from Class C (See Note 1) | (27,977) | (249,422) |
| Net increase (decrease) | (121,522) | $ (1,085,223) |
| Year ended October 31, 2022: | | |
| Shares sold | 43,235 | $ 437,164 |
| Shares issued to shareholders in reinvestment of distributions | 41,654 | 435,954 |
| Shares redeemed | (476,819) | (4,733,579) |
| Net increase (decrease) in shares outstanding before conversion | (391,930) | (3,860,461) |
| Shares converted from Class C (See Note 1) | (18,813) | (184,493) |
| Net increase (decrease) | (410,743) | $ (4,044,954) |
| |
Notes to Financial Statements (continued)
| Class I | Shares | Amount |
| Year ended October 31, 2023: | | |
| Shares sold | 1,328,814 | $ 11,845,018 |
| Shares issued to shareholders in reinvestment of distributions | 441,739 | 3,925,913 |
| Shares redeemed | (5,368,675) | (47,194,900) |
| Net increase (decrease) in shares outstanding before conversion | (3,598,122) | (31,423,969) |
| Shares converted into Class I (See Note 1) | 158 | 1,390 |
| Net increase (decrease) | (3,597,964) | $ (31,422,579) |
| Year ended October 31, 2022: | | |
| Shares sold | 2,135,672 | $ 21,568,533 |
| Shares issued to shareholders in reinvestment of distributions | 815,917 | 8,370,485 |
| Shares redeemed | (56,387,869) | (623,435,691) |
| Net increase (decrease) in shares outstanding before conversion | (53,436,280) | (593,496,673) |
| Shares converted into Class I (See Note 1) | 3,262 | 30,532 |
| Net increase (decrease) | (53,433,018) | $(593,466,141) |
| |
| Class R1 | Shares | Amount |
| Year ended October 31, 2023: | | |
| Shares issued to shareholders in reinvestment of distributions | 121 | $ 1,072 |
| Net increase (decrease) | 121 | $ 1,072 |
| Year ended October 31, 2022: | | |
| Shares issued to shareholders in reinvestment of distributions | 173 | $ 1,758 |
| Net increase (decrease) | 173 | $ 1,758 |
| |
| Class R2 | Shares | Amount |
| Year ended October 31, 2023: | | |
| Shares issued to shareholders in reinvestment of distributions | 128 | $ 1,140 |
| Net increase (decrease) | 128 | $ 1,140 |
| Year ended October 31, 2022: | | |
| Shares issued to shareholders in reinvestment of distributions | 188 | $ 1,917 |
| Net increase (decrease) | 188 | $ 1,917 |
| |
| Class R3 | Shares | Amount |
| Year ended October 31, 2023: | | |
| Shares sold | 6,133 | $ 53,842 |
| Shares issued to shareholders in reinvestment of distributions | 460 | 4,066 |
| Shares redeemed | (8,063) | (71,558) |
| Net increase (decrease) | (1,470) | $ (13,650) |
| Year ended October 31, 2022: | | |
| Shares sold | 12,519 | $ 120,023 |
| Shares issued to shareholders in reinvestment of distributions | 591 | 6,037 |
| Shares redeemed | (2,289) | (23,247) |
| Net increase (decrease) | 10,821 | $ 102,813 |
| |
| Class R6 | Shares | Amount |
| Year ended October 31, 2023: | | |
| Shares sold | 2,791,732 | $ 24,681,969 |
| Shares issued to shareholders in reinvestment of distributions | 1,319,851 | 11,688,445 |
| Shares redeemed | (6,668,713) | (59,667,348) |
| Net increase (decrease) | (2,557,130) | $ (23,296,934) |
| Year ended October 31, 2022: | | |
| Shares sold | 3,239,611 | $ 29,773,647 |
| Shares issued to shareholders in reinvestment of distributions | 2,775,072 | 28,667,785 |
| Shares redeemed | (22,728,520) | (226,813,465) |
| Net increase (decrease) | (16,713,837) | $(168,372,033) |
| |
| SIMPLE Class | Shares | Amount |
| Year ended October 31, 2023: | | |
| Shares issued to shareholders in reinvestment of distributions | 92 | $ 814 |
| Net increase (decrease) | 92 | $ 814 |
| Year ended October 31, 2022: | | |
| Shares issued to shareholders in reinvestment of distributions | 130 | $ 1,342 |
| Net increase (decrease) | 130 | $ 1,342 |
Note 10–Other Matters
As of the date of this report, the Fund faces a heightened level of risk associated with current uncertainty, volatility and state of economies, financial markets, rising interest rates, and labor and health conditions around the world. Events such as war, acts of terrorism, recessions, rapid inflation, the imposition of international sanctions, earthquakes, hurricanes, epidemics and pandemics and other unforeseen natural or human disasters may have broad adverse social, political and economic effects on the global economy, which could negatively impact the value of the Fund's investments. Developments that disrupt global economies and financial markets may magnify factors that affect the Fund's performance.
| 46 | MainStay MacKay Total Return Bond Fund |
Note 11–Subsequent Events
In connection with the preparation of the financial statements of the Fund as of and for the year ended October 31, 2023, events and transactions subsequent to October 31, 2023, through the date the financial statements were issued, have been evaluated by the Manager for possible adjustment and/or disclosure. No subsequent events requiring financial statement adjustment or disclosure have been identified.
Report of Independent Registered Public Accounting Firm
To the Shareholders of the Fund and Board of Trustees
MainStay Funds Trust:
Opinion on the Financial Statements
We have audited the accompanying statement of assets and liabilities of MainStay MacKay Total Return Bond Fund (the Fund), one of the funds constituting MainStay Funds Trust, including the portfolio of investments, as of October 31, 2023, the related statement of operations for the year then ended, the statements of changes in net assets for each of the years in the two-year period then ended, and the related notes (collectively, the financial statements) and the financial highlights for each of the years or periods in the five-year period then ended. In our opinion, the financial statements and financial highlights present fairly, in all material respects, the financial position of the Fund as of October 31, 2023, the results of its operations for the year then ended, the changes in its net assets for each of the years in the two-year period then ended, and the financial highlights for each of the years or periods in the five-year period then ended, in conformity with U.S. generally accepted accounting principles.
Basis for Opinion
These financial statements and financial highlights are the responsibility of the Fund's management. Our responsibility is to express an opinion on these financial statements and financial highlights based on our audits. We are a public accounting firm registered with the Public Company Accounting Oversight Board (United States) (PCAOB) and are required to be independent with respect to the Fund in accordance with the U.S. federal securities laws and the applicable rules and regulations of the Securities and Exchange Commission and the PCAOB.
We conducted our audits in accordance with the standards of the PCAOB. Those standards require that we plan and perform the audit to obtain reasonable assurance about whether the financial statements and financial highlights are free of material misstatement, whether due to error or fraud. Our audits included performing procedures to assess the risks of material misstatement of the financial statements and financial highlights, whether due to error or fraud, and performing procedures that respond to those risks. Such procedures included examining, on a test basis, evidence regarding the amounts and disclosures in the financial statements and financial highlights. Such procedures also included confirmation of securities owned as of October 31, 2023, by correspondence with custodians, the transfer agent, agent banks and brokers; when replies were not received from agent banks and brokers, we performed other auditing procedures. Our audits also included evaluating the accounting principles used and significant estimates made by management, as well as evaluating the overall presentation of the financial statements and financial highlights. We believe that our audits provide a reasonable basis for our opinion.

We have served as the auditor of one or more New York Life Investment Management investment companies since 2003.
Philadelphia, Pennsylvania
December 22, 2023
| 48 | MainStay MacKay Total Return Bond Fund |
Federal Income Tax Information
(Unaudited)
The Fund is required under the Internal Revenue Code to advise shareholders in a written statement as to the federal tax status of dividends paid by the Fund during such fiscal years.
In February 2024, shareholders will receive an IRS Form 1099-DIV or substitute Form 1099, which will show the federal tax status of the distributions received by shareholders in calendar year 2023. The amounts that will be reported on such 1099-DIV or substitute Form 1099 will be the amounts you are to use on your federal income tax return and will differ from the amounts which we must report for the Fund's fiscal year ended October 31, 2023.
Proxy Voting Policies and Procedures and Proxy Voting Record
The Fund is required to file with the SEC its proxy voting record for the 12-month period ending June 30 on Form N-PX. A description of the policies and procedures that are used to vote proxies relating to portfolio securities of the Fund is available free of charge upon request by calling 800-624-6782 or visiting the SEC’s website at www.sec.gov. The most recent Form N-PX or proxy voting record is available free of charge upon request by calling 800-624-6782; visiting newyorklifeinvestments.com; or visiting the SEC’s website at www.sec.gov.
Shareholder Reports and Quarterly Portfolio Disclosure
The Fund is required to file its complete schedule of portfolio holdings with the SEC 60 days after its first and third fiscal quarter on Form N-PORT. The Fund's holdings report is available free of charge upon request by calling New York Life Investments at 800-624-6782.
Board of Trustees and Officers (Unaudited)
The Trustees and officers of the Fund are listed below. The Board oversees the MainStay Group of Funds (which consists of MainStay Funds and MainStay Funds Trust), MainStay VP Funds Trust, MainStay MacKay DefinedTerm Municipal Opportunities Fund, MainStay CBRE Global Infrastructure Megatrends Term Fund, the Manager and the Subadvisors, and elects the officers of the Funds who are responsible for the day-to-day operations of the Fund. Information pertaining to the Trustees and officers is set forth below. Each Trustee serves until his or her successor is elected and qualified or until his or her resignation, death or
removal. Under the Board’s retirement policy, unless an exception is made, a Trustee must tender his or her resignation by the end of the calendar year during which he or she reaches the age of 75. Officers are elected annually by the Board. The business address of each Trustee and officer listed below is 51 Madison Avenue, New York, New York 10010. A majority of the Trustees are not “interested persons” (as defined by the 1940 Act and rules adopted by the SEC thereunder) of the Fund (“Independent Trustees”).
| | Name and
Year of Birth | Term of Office,
Position(s) Held and
Length of Service | Principal Occupation(s)
During Past Five Years | Number of
Portfolios in
Fund Complex
Overseen by
Trustee | Other Directorships
Held by Trustee |
| | | | | | |
| | Naïm Abou-Jaoudé*
1966 | MainStay Funds: Trustee
since 2023
MainStay Funds Trust:
Trustee since 2023 | Chief Executive Officer of New York Life Investment Management LLC (since 2023). Chief Executive Officer of Candriam (an affiliate of New York Life Investment Management LLC) (2007 to 2023). | 81 | MainStay VP Funds Trust:
Trustee since 2023 (31 portfolios);
MainStay MacKay DefinedTerm Municipal Opportunities Fund: Trustee
since 2023;
MainStay CBRE Global Infrastructure Megatrends Term Fund: Trustee
since 2023; and
New York Life Investment Management International (Chair) since 2015 |
| * | This Trustee is considered to be an “interested person” of the MainStay Group of Funds, MainStay VP Funds Trust, MainStay CBRE Global Infrastructure Megatrends Term Fund and MainStay MacKay DefinedTerm Municipal Opportunities Fund, within the meaning of the 1940 Act because of his affiliation with New York Life Investment Management LLC and Candriam, as described in detail above in the column entitled “Principal Occupation(s) During Past Five Years.” |
| | |
| 50 | MainStay MacKay Total Return Bond Fund |
| | Name and
Year of Birth | Term of Office,
Position(s) Held and
Length of Service | Principal Occupation(s)
During Past Five Years | Number of
Portfolios in
Fund Complex
Overseen by
Trustee | Other Directorships
Held by Trustee |
| | | | | | |
| | David H. Chow
1957 | MainStay Funds: Trustee since January 2016, Advisory Board Member (June 2015 to December 2015);MainStay Funds Trust:
Trustee since January 2016, Advisory Board Member (June 2015 to December 2015) | Founder and CEO, DanCourt Management, LLC (since 1999) | 81 | MainStay VP Funds Trust: Trustee since January 2016, Advisory Board Member (June 2015 to December 2015) (31 portfolios);
MainStay MacKay DefinedTerm Municipal Opportunities Fund: Trustee since January 2016, Advisory Board Member (June 2015 to December 2015);
MainStay CBRE Global Infrastructure Megatrends Term Fund: Trustee since 2021;
VanEck Vectors Group of Exchange-Traded Funds: Trustee since 2006 and Independent Chairman of the Board of Trustees from 2008 to 2022 (57 portfolios); and
Berea College of Kentucky: Trustee since 2009, Chair of the Investment Committee since 2018 |
| | Karen Hammond
1956 | MainStay Funds: Trustee since December 2021, Advisory Board Member (June 2021 to December 2021);MainStay Funds Trust:
Trustee since December 2021, Advisory Board Member (June 2021 to December 2021)
| Retired, Managing Director, Devonshire Investors (2007 to 2013); Senior Vice President, Fidelity Management & Research Co. (2005 to 2007); Senior Vice President and Corporate Treasurer, FMR Corp. (2003 to 2005); Chief Operating Officer, Fidelity Investments Japan (2001 to 2003) | 81 | MainStay VP Funds Trust: Trustee since December 2021, Advisory Board Member (June 2021 to December 2021) (31 portfolios);
MainStay MacKay DefinedTerm Municipal Opportunities Fund: Trustee since December 2021, Advisory Board Member (June 2021 to December 2021);
MainStay CBRE Global Infrastructure Megatrends Term Fund: Trustee since December 2021, Advisory Board Member (June 2021 to December 2021);
Two Harbors Investment Corp.: Director since 2018;
Rhode Island State Investment Commission: Member since 2017; and
Blue Cross Blue Shield of Rhode Island: Director since 2019 |
| | Susan B. Kerley
1951 | MainStay Funds: Chair since January 2017 and Trustee since 2007;MainStay Funds Trust:
Chair since January 2017 and Trustee since 1990*** | President, Strategic Management Advisors LLC (since 1990) | 81 | MainStay VP Funds Trust: Chair since January 2017 and Trustee since 2007 (31 portfolios)**;
MainStay MacKay DefinedTerm Municipal Opportunities Fund: Chair since January 2017 and Trustee since 2011;
MainStay CBRE Global Infrastructure Megatrends Term Fund: Trustee since June 2021; and
Legg Mason Partners Funds: Trustee since 1991 (45 portfolios) |
Board of Trustees and Officers (Unaudited) (continued)
| | Name and
Year of Birth | Term of Office,
Position(s) Held and
Length of Service | Principal Occupation(s)
During Past Five Years | Number of
Portfolios in
Fund Complex
Overseen by
Trustee | Other Directorships
Held by Trustee |
| | | | | | |
| | Alan R. Latshaw
1951 | MainStay Funds: Trusteesince 2006;MainStay Funds Trust:
Trustee since 2007*** | Retired; Partner, Ernst & Young LLP (2002 to 2003); Partner, Arthur Andersen LLP (1989 to 2002); Consultant to the MainStay Funds Audit and Compliance Committee (2004 to 2006) | 81 | MainStay VP Funds Trust: Trustee since 2007 (31 portfolios)**;
MainStay MacKay DefinedTerm Municipal Opportunities Fund: Trustee since 2011; and
MainStay CBRE Global Infrastructure Megatrends Term Fund: Trustee since June 2021 |
| | Jacques P. Perold
1958 | MainStay Funds: Trustee since January 2016, Advisory Board Member (June 2015to December 2015);MainStay Funds Trust:
Trustee since January 2016, Advisory Board Member (June 2015 to December 2015) | Founder and Chief Executive Officer, CapShift Advisors LLC (since 2018); President, Fidelity Management & Research Company (2009 to 2014); President and Chief Investment Officer, Geode Capital Management, LLC (2001 to 2009) | 81 | MainStay VP Funds Trust: Trustee since January 2016, Advisory Board Member (June 2015 to December 2015) (31 portfolios);
MainStay MacKay DefinedTerm Municipal Opportunities Fund: Trustee since January 2016, Advisory Board Member (June 2015 to December 2015);
MainStay CBRE Global Infrastructure Megatrends Term Fund: Trustee since June 2021;
Allstate Corporation: Director since 2015; and
MSCI Inc.: Director since 2017 |
| | Richard S. Trutanic
1952 | MainStay Funds: Trustee since 1994;MainStay Funds Trust:
Trustee since 2007*** | Chairman and Chief Executive Officer, Somerset & Company (financial advisory firm) (since 2004); Managing Director, The Carlyle Group (private investment firm) (2002 to 2004); Senior Managing Director, Partner and Board Member, Groupe Arnault S.A. (private investment firm) (1999 to 2002) | 81 | MainStay VP Funds Trust: Trustee since 2007 (31 portfolios)**;
MainStay MacKay DefinedTerm Municipal Opportunities Fund: Trustee since 2011; and
MainStay CBRE Global Infrastructure Megatrends Term Fund: Trustee since June 2021 |
| ** | Includes prior service as a Director of MainStay VP Series Fund, Inc., the predecessor to MainStay VP Funds Trust. |
| *** | Includes prior service as a Director/Trustee of certain predecessor entities to MainStay Funds Trust. |
| 52 | MainStay MacKay Total Return Bond Fund |
| | Name and
Year of Birth | Position(s) Held and
Length of Service | Principal Occupation(s)
During Past Five Years | |
| | | | | |
| | Kirk C. Lehneis
1974 | President, MainStay Funds, MainStay Funds Trust (since 2017) | Chief Operating Officer and Senior Managing Director (since 2016), New York Life Investment Management LLC and New York Life Investment Management Holdings LLC; Member of the Board of Managers (since 2017) and Senior Managing Director (since 2018), NYLIFE Distributors LLC; Chairman of the Board and Senior Managing Director, NYLIM Service Company LLC (since 2017); Trustee, President and Principal Executive Officer of IndexIQ Trust, IndexIQ ETF Trust and IndexIQ Active ETF Trust (since 2018); President, MainStay CBRE Global Infrastructure Megatrends Term Fund (since 2021), MainStay MacKay DefinedTerm Municipal Opportunities Fund and MainStay VP Funds Trust (since 2017)**; Senior Managing Director, Global Product Development (2015 to 2016); Managing Director, Product Development (2010 to 2015), New York Life Investment Management LLC | |
| | Jack R. Benintende
1964 | Treasurer and Principal Financial and Accounting Officer, MainStay Funds (since 2007), MainStay Funds Trust (since 2009) | Managing Director, New York Life Investment Management LLC (since 2007); Treasurer and Principal Financial and Accounting Officer, MainStay CBRE Global Infrastructure Megatrends Term Fund (since 2021), MainStay MacKay DefinedTerm Municipal Opportunities Fund (since 2011) and MainStay VP Funds Trust (since 2007)**; and Assistant Treasurer, New York Life Investment Management Holdings LLC (2008 to 2012) | |
| | J. Kevin Gao
1967 | Secretary and Chief Legal Officer, MainStay Funds and MainStay Funds Trust (since 2010) | Managing Director and Associate General Counsel, New York Life Investment Management LLC (since 2010); Secretary and Chief Legal Officer, MainStay CBRE Global Infrastructure Megatrends Term Fund (since 2021), MainStay MacKay DefinedTerm Municipal Opportunities Fund (since 2011) and MainStay VP Funds Trust (since 2010)** | |
| | Kevin M. Gleason
1967 | Vice President and Chief Compliance Officer, MainStay Funds and MainStay Funds Trust (since June 2022) | Vice President and Chief Compliance Officer, IndexIQ Trust, IndexIQ ETF Trust and Index IQ Active ETF Trust (since June 2022); Vice President and Chief Compliance Officer, MainStay CBRE Global Infrastructure Megatrends Term Fund, MainStay VP Funds Trust and MainStay MacKay DefinedTerm Municipal Opportunities Fund (since June 2022); Senior Vice President, Voya Investment Management and Chief Compliance Officer, Voya Family of Funds (2012 to 2022) | |
| | Scott T. Harrington
1959 | Vice President— Administration, MainStay Funds (since 2005), MainStay Funds Trust (since 2009) | Managing Director, New York Life Investment Management LLC (including predecessor advisory organizations) (since 2000); Member of the Board of Directors, New York Life Trust Company (since 2009); Vice President—Administration, MainStay CBRE Global Infrastructure Megatrends Term Fund (since 2021), MainStay MacKay DefinedTerm Municipal Opportunities Fund (since 2011) and MainStay VP Funds Trust (since 2005)** | |
| * | The officers listed above are considered to be “interested persons” of the MainStay Group of Funds, MainStay VP Funds Trust, MainStay CBRE Global Infrastructure Megatrends Term Fund and MainStay MacKay DefinedTerm Municipal Opportunities Fund within the meaning of the 1940 Act because of their affiliation with the MainStay Group of Funds, New York Life Insurance Company and/or its affiliates, including New York Life Investment Management LLC, New York Life Insurance Company, NYLIM Service Company LLC, NYLIFE Securities LLC and/or NYLIFE Distributors LLC, as described in detail in the column captioned “Principal Occupation(s) During Past Five Years.” Officers are elected annually by the Board. |
| ** | Includes prior service as an Officer of MainStay VP Series Fund, Inc., the predecessor to MainStay VP Funds Trust. |
Officers of the Trust (Who are not Trustees)*
This page intentionally left blank.
Equity
U.S. Equity
MainStay Epoch U.S. Equity Yield Fund
MainStay Fiera SMID Growth Fund
MainStay PineStone U.S. Equity Fund
MainStay S&P 500 Index Fund
MainStay Winslow Large Cap Growth Fund
MainStay WMC Enduring Capital Fund
MainStay WMC Growth Fund
MainStay WMC Small Companies Fund
MainStay WMC Value Fund
International Equity
MainStay Epoch International Choice Fund
MainStay PineStone International Equity Fund
MainStay WMC International Research Equity Fund
Emerging Markets Equity
MainStay Candriam Emerging Markets Equity Fund
Global Equity
MainStay Epoch Capital Growth Fund
MainStay Epoch Global Equity Yield Fund
MainStay PineStone Global Equity Fund
Fixed Income
Taxable Income
MainStay Candriam Emerging Markets Debt Fund
MainStay Floating Rate Fund
MainStay MacKay High Yield Corporate Bond Fund
MainStay MacKay Short Duration High Yield Fund
MainStay MacKay Strategic Bond Fund
MainStay MacKay Total Return Bond Fund
MainStay MacKay U.S. Infrastructure Bond Fund
MainStay Short Term Bond Fund
Tax-Exempt Income
MainStay MacKay California Tax Free Opportunities Fund1
MainStay MacKay High Yield Municipal Bond Fund
MainStay MacKay New York Tax Free Opportunities Fund2
MainStay MacKay Short Term Municipal Fund
MainStay MacKay Strategic Municipal Allocation Fund
MainStay MacKay Tax Free Bond Fund
Money Market
MainStay Money Market Fund
Mixed Asset
MainStay Balanced Fund
MainStay Income Builder Fund
MainStay MacKay Convertible Fund
Speciality
MainStay CBRE Global Infrastructure Fund
MainStay CBRE Real Estate Fund
MainStay Cushing MLP Premier Fund
Asset Allocation
MainStay Conservative Allocation Fund
MainStay Conservative ETF Allocation Fund
MainStay Defensive ETF Allocation Fund
MainStay Equity Allocation Fund
MainStay Equity ETF Allocation Fund
MainStay ESG Multi-Asset Allocation Fund
MainStay Growth Allocation Fund
MainStay Growth ETF Allocation Fund
MainStay Moderate Allocation Fund
MainStay Moderate ETF Allocation Fund
Manager
New York Life Investment Management LLC
New York, New York
Subadvisors
Candriam3
Strassen, Luxembourg
CBRE Investment Management Listed Real Assets LLC
Radnor, Pennsylvania
Cushing Asset Management, LP
Dallas, Texas
Epoch Investment Partners, Inc.
New York, New York
Fiera Capital Inc.
New York, New York
IndexIQ Advisors LLC3
New York, New York
MacKay Shields LLC3
New York, New York
NYL Investors LLC3
New York, New York
PineStone Asset Management Inc.
Montreal, Québec
Wellington Management Company LLP
Boston, Massachusetts
Winslow Capital Management, LLC
Minneapolis, Minnesota
Legal Counsel
Dechert LLP
Washington, District of Columbia
Independent Registered Public Accounting Firm
KPMG LLP
Philadelphia, Pennsylvania
Distributor
NYLIFE Distributors LLC3
Jersey City, New Jersey
Custodian
JPMorgan Chase Bank, N.A.
New York, New York
1.
This Fund is registered for sale in AZ, CA, NV, OR, TX, UT, WA and MI (Class A and Class I shares only), and CO, FL, GA, HI, ID, MA, MD, NH, NJ and NY (Class I shares only).
| 2. | This Fund is registered for sale in CA, CT, DE, FL, MA, NJ, NY and VT. |
| 3. | An affiliate of New York Life Investment Management LLC. |
Not part of the Annual Report
For more information
800-624-6782
newyorklifeinvestments.com
“New York Life Investments” is both a service mark, and the common trade name, of certain investment advisors affiliated with New York Life Insurance Company. The MainStay Funds® are managed by New York Life Investment Management LLC and distributed by NYLIFE Distributors LLC, 30 Hudson Street, Jersey City, NJ 07302, a wholly owned subsidiary of New York Life Insurance Company. NYLIFE Distributors LLC is a Member FINRA/SIPC.
©2023 NYLIFE Distributors LLC. All rights reserved.
| 5013953MS139-23 | MSTRB11-12/23 |
(NYLIM) NL229
MainStay Short Term Bond Fund
Message from the President and Annual Report
October 31, 2023
Special Notice:
Beginning in July 2024, new regulations issued by the Securities and Exchange Commission (SEC) will take effect requiring open-end mutual fund companies and ETFs to (1) overhaul the content of their shareholder reports and (2) mail paper copies of the new tailored shareholder reports to shareholders who have not opted to receive these documents electronically.
If you have not yet elected to receive your shareholder reports electronically, please contact your financial intermediary or visit newyorklifeinvestments.com/accounts.
| Not FDIC/NCUA Insured | Not a Deposit | May Lose Value | No Bank Guarantee | Not Insured by Any Government Agency |
This page intentionally left blank
Message from the President
Volatile economic and geopolitical forces drove market behavior during the 12-month reporting period ended October 31, 2023. While equity markets generally gained ground, bond prices trended broadly lower.
Although the war in Ukraine, the outbreak of hostilities in the Middle East and several other notable events affected financial assets, inflation and interest rate trends stood at the forefront of market developments during most of the period. As the reporting period began, high levels of inflation already showed signs of easing in the face of aggressive rate hikes by the U.S. Federal Reserve (the “Fed”). From a peak of 9.1% in June 2022, the annualized U.S. inflation rate dropped to 7.1% in November 2022, and to 3.2% in October 2023. At the same time, the Fed increased the benchmark federal funds rate from 3.75%–4.00% at the beginning of the reporting period to 5.25%–5.50% as of October 31, 2023. As the pace of rate increases slowed during the period, investors hoped for an early shift to a looser monetary policy. However, comments from Fed members late in the period reinforced the central bank’s hawkish stance in response to surprisingly robust U.S. economic growth and rising wage pressures, thus increasing the likelihood that interest rates would stay higher for longer. International developed markets exhibited similar dynamics of elevated inflation and rising interest rates.
Despite the backdrop of high interest rates—along with political dysfunction in Washington D.C. and intensifying global geopolitical instability—equity markets managed to advance, supported by healthy consumer spending trends and persistent domestic economic growth. The S&P 500® Index, a widely regarded benchmark of large-cap U.S. market performance, gained ground, bolstered by the strong performance of energy stocks amid surging petroleum prices and mega-cap, growth-oriented, technology-related shares, which rose as investors flocked to companies creating the infrastructure for developments in artificial intelligence. Smaller-cap stocks and value-oriented shares produced milder returns. Among industry sectors, energy and
information technology posted the strongest gains. Real estate declined most sharply under pressure from rising mortgage rates and weak levels of office occupancy. Developed international markets outperformed U.S. markets, with Europe benefiting during the first half of the period from unexpected economic resilience in the face of rising energy prices and the ongoing war in Ukraine. Emerging markets posted positive results but lagged developed markets, largely due to slow economic growth in China despite the relaxation of pandemic-era lockdowns.
Bond prices were driven lower by rising yields and increasing expectations of high interest rates for an extended period of time. The U.S. yield curve steepened, with the 30-year Treasury yield exceeding 5% for the first time in more than a decade. The yield curve remained inverted, with the 10-year Treasury yield ending the period at 4.88%, compared with 5.07% for the 2-year Treasury yield. Corporate bonds outperformed long-term Treasury bonds, but still trended lower under pressure from rising yields and an uptick in default rates. Among corporates, lower-credit-quality instruments performed slightly better than their higher-credit-quality counterparts, while floating rate securities performed better still.
In the face of today’s uncertain market environment, New York Life Investments remains dedicated to providing the guidance, resources and investment solutions you need to pursue your financial goals.
Thank you for trusting us to help meet your investment needs.
Sincerely,
Kirk C. Lehneis
President
The opinions expressed are as of the date of this report and are subject to change. There is no guarantee that any forecast made will come to pass. This material does not constitute investment advice and is not intended as an endorsement of any specific investment. Past performance is no guarantee of future results.
Not part of the Annual Report
Investors should refer to the Fund’s Summary Prospectus and/or Prospectus and consider the Fund’s investment objectives, strategies, risks, charges and expenses carefully before investing. The Summary Prospectus and/or Prospectus contain this and other information about the Fund. You may obtain copies of the Fund’s Summary Prospectus, Prospectus and Statement of Additional Information, which includes information about the MainStay Funds Trust's Trustees, free of charge, upon request, by calling toll-free 800-624-6782, by writing to NYLIFE Distributors LLC, Attn: MainStay Marketing Department, 30 Hudson Street, Jersey City, NJ 07302 or by sending an e-mail to MainStayShareholderServices@nylim.com. These documents are also available via the MainStay Funds’ website at newyorklifeinvestments.com. Please read the Fund’s Summary Prospectus and/or Prospectus carefully before investing.
Investment and Performance Comparison (Unaudited)
Performance data quoted represents past performance. Past performance is no guarantee of future results. Because of market volatility and other factors, current performance may be lower or higher than the figures shown. Investment return and principal value will fluctuate, and as a result, when shares are redeemed, they may be worth more or less than their original cost. The graph below depicts the historical performance of Class I shares of the Fund. Performance will vary from class to class based on differences in class-specific expenses and sales charges. For performance information current to the most recent month-end, please call 800-624-6782 or visit newyorklifeinvestments.com.
The performance table and graph do not reflect the deduction of taxes that a shareholder would pay on distributions or Fund share redemptions. Total returns reflect maximum applicable sales charges as indicated in the table below, if any, changes in share price, and reinvestment of dividend and capital gain distributions. The graph assumes the initial investment amount shown below and reflects the deduction of all sales charges that would have applied for the period of investment. Performance figures may reflect certain fee waivers and/or expense limitations, without which total returns may have been lower. For more information on share classes and current fee waivers and/or expense limitations (if any), please refer to the Notes to Financial Statements.
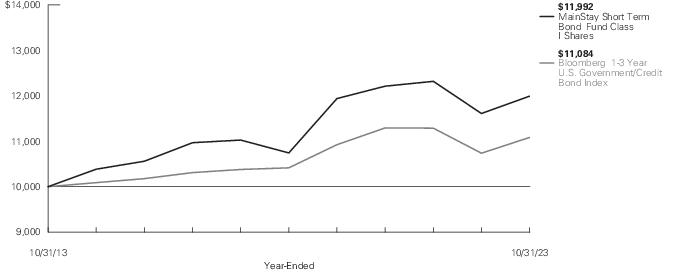
| Average Annual Total Returns for the Year-Ended October 31, 2023 |
| Class | Sales Charge | | Inception
Date | One
Year | Five
Years | Ten Years
or Since
Inception | Gross
Expense
Ratio1 |
| Class A Shares2 | Maximum 1.00% Initial Sales Charge | With sales charges | 1/2/2004 | 1.89% | 1.28% | 1.20% | 0.88% |
| | | Excluding sales charges | | 2.92 | 1.90 | 1.51 | 0.88 |
| Investor Class Shares2, 3 | Maximum 0.50% Initial Sales Charge | With sales charges | 2/28/2008 | 2.32 | 1.08 | 1.00 | 1.32 |
| | | Excluding sales charges | | 2.83 | 1.70 | 1.31 | 1.32 |
| Class I Shares | No Sales Charge | | 1/2/1991 | 3.27 | 2.22 | 1.83 | 0.60 |
| SIMPLE Class Shares | No Sales Charge | | 8/31/2020 | 2.56 | N/A | -1.31 | 1.23 |
| 1. | The gross expense ratios presented reflect the Fund’s “Total Annual Fund Operating Expenses” from the most recent Prospectus, as supplemented, and may differ from other expense ratios disclosed in this report. |
| 2. | Prior to February 28, 2020, the maximum initial sales charge applicable was 3.00%, which is reflected in the average annual total return figures shown. |
| 3. | Prior to June 30, 2020, the maximum initial sales charge was 1.00%, which is reflected in the average annual total return figures shown. |
The footnotes on the next page are an integral part of the table and graph and should be carefully read in conjunction with them.
| Benchmark Performance* | One
Year | Five
Years | Ten
Years |
| Bloomberg 1-3 Year U.S. Government/Credit Bond Index1 | 3.23% | 1.25% | 1.03% |
| Morningstar U.S. Fund Short-Term Bond Category Average2 | 3.84 | 1.33 | 1.23 |
| * | Returns for indices reflect no deductions for fees, expenses or taxes, except for foreign withholding taxes where applicable. Results assume reinvestment of all dividends and capital gains. An investment cannot be made directly in an index. |
| 1. | The Bloomberg 1-3 Year U.S. Government/Credit Bond Index is the Fund's primary broad-based securities market index for comparison purposes. The Bloomberg 1-3 Year U.S. Government/Credit Bond Index is an unmanaged index comprised of investment grade, U.S. dollar-denominated, fixed-rate Treasuries, government-related and corporate securities, with maturities of one to three years. Results assume reinvestment of all income. |
| 2. | The Morningstar U.S. Fund Short-Term Bond Category Average is representative of funds that invest primarily in corporate and other investment-grade U.S. fixed-income issues and typically have durations of 1.0 to 3.5 years. These funds are attractive to fairly conservative investors, because they are less sensitive to interest rates than funds with longer durations. Morningstar calculates monthly breakpoints using the effective duration of the Morningstar Core Bond Index in determining duration assignment. Short-term is defined as 25% to 75% of the three-year average effective duration of the MCBI. Results are based on average total returns of similar funds with all dividends and capital gain distributions reinvested. |
The footnotes on the preceding page are an integral part of the table and graph and should be carefully read in conjunction with them.
| 6 | MainStay Short Term Bond Fund |
Cost in Dollars of a $1,000 Investment in MainStay Short Term Bond Fund (Unaudited)
The example below is intended to describe the fees and expenses borne by shareholders during the six-month period from May 1, 2023 to October 31, 2023, and the impact of those costs on your investment.
Example
As a shareholder of the Fund you incur two types of costs: (1) transaction costs, including exchange fees and sales charges (loads) on purchases (as applicable), and (2) ongoing costs, including management fees, distribution and/or service (12b-1) fees and other Fund expenses (as applicable). This example is intended to help you understand your ongoing costs (in dollars) of investing in the Fund and to compare these costs with the ongoing costs of investing in other mutual funds. The example is based on an investment of $1,000 made at the beginning of the six-month period and held for the entire period from May 1, 2023 to October 31, 2023.
This example illustrates your Fund’s ongoing costs in two ways:
Actual Expenses
The second and third data columns in the table below provide information about actual account values and actual expenses. You may use the information in these columns, together with the amount you invested, to estimate the expenses that you paid during the six months ended October 31, 2023. Simply divide your account value by $1,000 (for example, an
$8,600 account value divided by $1,000 = 8.6), then multiply the result by the number under the heading entitled “Expenses Paid During Period” to estimate the expenses you paid on your account during this period.
Hypothetical Example for Comparison Purposes
The fourth and fifth data columns in the table below provide information about hypothetical account values and hypothetical expenses based on the Fund’s actual expense ratio and an assumed rate of return of 5% per year before expenses, which is not the Fund’s actual return. The hypothetical account values and expenses may not be used to estimate the actual ending account balances or expenses you paid for the six-month period shown. You may use this information to compare the ongoing costs of investing in the Fund with the ongoing costs of investing in other mutual funds. To do so, compare this 5% hypothetical example with the 5% hypothetical examples that appear in the shareholder reports of the other mutual funds.
Please note that the expenses shown in the table are meant to highlight your ongoing costs only and do not reflect any transactional costs, such as exchange fees or sales charges (loads). Therefore, the fourth and fifth data columns of the table are useful in comparing ongoing costs only and will not help you determine the relative total costs of owning different funds. In addition, if these transactional costs were included, your costs would have been higher.
| Share Class | Beginning
Account
Value
5/1/23 | Ending Account
Value (Based
on Actual
Returns and
Expenses)
10/31/23 | Expenses
Paid
During
Period1 | Ending Account
Value (Based
on Hypothetical
5% Annualized
Return and
Actual Expenses)
10/31/23 | Expenses
Paid
During
Period1 | Net Expense
Ratio
During
Period2 |
| Class A Shares | $1,000.00 | $1,001.80 | $3.73 | $1,021.47 | $3.77 | 0.74% |
| Investor Class Shares | $1,000.00 | $1,000.80 | $4.64 | $1,020.57 | $4.69 | 0.92% |
| Class I Shares | $1,000.00 | $1,003.50 | $2.02 | $1,023.19 | $2.04 | 0.40% |
| SIMPLE Class Shares | $1,000.00 | $1,000.10 | $5.39 | $1,019.81 | $5.45 | 1.07% |
| 1. | Expenses are equal to the Fund’s annualized expense ratio of each class multiplied by the average account value over the period, divided by 365 and multiplied by 184 (to reflect the six-month period). The table above represents the actual expenses incurred during the six-month period. In addition to the fees and expenses which the Fund bears directly, it also indirectly bears a pro rata share of the fees and expenses of the underlying funds in which it invests. Such indirect expenses are not included in the above-reported expense figures. |
| 2. | Expenses are equal to the Fund's annualized expense ratio to reflect the six-month period. |
Portfolio Composition as of October 31, 2023 (Unaudited)
See Portfolio of Investments beginning on page 11 for specific holdings within these categories. The Fund's holdings are subject to change.
Top Ten Holdings and/or Issuers Held as of October 31, 2023 (excluding short-term investments) (Unaudited)
| 1. | U.S. Treasury Notes, 0.25%-5.00%, due 12/31/23–8/15/33 |
| 2. | iShares 1-5 Year Investment Grade Corporate Bond ETF |
| 3. | Bank of America Corp., 4.20%-5.202%, due 8/26/24–4/25/29 |
| 4. | Morgan Stanley, 4.679%-6.138%, due 7/17/26–4/20/29 |
| 5. | GNMA, 0.43%-5.00%, due 9/20/48–4/16/63 |
| 6. | Deutsche Bank AG, 6.119%, due 7/14/26 |
| 7. | Pacific Gas and Electric Co., 3.25%-6.10%, due 2/16/24–3/1/29 |
| 8. | Barclays plc, 3.65%-7.385%, due 3/16/25–11/2/28 |
| 9. | FNMA, 1.972%-2.50%, due 2/25/51–8/1/51 |
| 10. | Invesco US CLO Ltd., 7.212%-7.412%, due 4/22/35–4/21/36 |
| 8 | MainStay Short Term Bond Fund |
Portfolio Management Discussion and Analysis (Unaudited)
Questions answered by portfolio managers Kenneth Sommer and Matthew Downs of NYL Investors LLC, the Fund’s Subadvisor.
How did MainStay Short Term Bond Fund perform relative to its benchmark and peer group during the 12 months ended October 31, 2023?
For the 12 months ended October 31, 2023, Class I shares of MainStay Short Term Bond Fund returned 3.27%, outperforming the 3.23% return of the Fund’s benchmark, the Bloomberg 1–3 Year U.S. Government/Credit Bond Index (the “Index”). Over the same period, Class I shares underperformed the 3.84% return of the Morningstar U.S. Fund Short-Term Bond Category Average.1
Were there any changes to the Fund during the reporting period?
Effective June 30, 2023, AJ Rzad was removed as a portfolio manager of the Fund. Please see the supplement dated March 3, 2023, for more information. Effective February 28, 2023, Matthew Downs was added as a portfolio manager of the Fund.
What factors affected the Fund’s relative performance during the reporting period?
Relative to the Index, the Fund held overweight positions in corporate securities, asset-backed securities (“ABS”) and commercial mortgage-backed securities (“CMBS”) throughout the reporting period. To facilitate these overweight positions, the Fund maintained underweight exposure to the U.S. Treasury sector. Option-adjusted spreads2 (OAS) on the Index tightened one basis point during the reporting period. (A basis point is one one-hundredth of a percentage point.) Overweight exposure to ABS, both fixed rate and floating rate, made the strongest positive contribution to the Fund’s relative performance during the reporting period. (Contributions take weightings and total returns into account.) The corporate sector was the second-best performing sector. Overweight positions in CMBS also added to performance. Underweight positions in Treasury securities detracted from performance during the reporting period.
During the reporting period, how was the Fund’s performance materially affected by investments in derivatives?
During the reporting period, the Fund’s investment in derivatives was limited to interest rate derivatives used to keep the duration3 of the Fund in line with the portfolio managers’ target. Generally
speaking, these interest rate derivatives had a negative impact on performance.
What was the Fund’s duration strategy during the reporting period?
During the first half of the reporting period, the Fund largely maintained a duration shorter than that of the Index in the front end of the yield curve4 (0–2 year) and a duration longer than the Index in the 7–10 year part of the yield curve. This yield curve positioning detracted from performance as interest rates moved higher throughout the reporting period. During the second half of the reporting period, the Fund maintained a duration longer than the Index in the 5–year part of the yield curve. This positioning detracted from performance as interest rates moved higher throughout the reporting period. As of October 31, 2023, the Fund’s duration was 1.95 years, compared to a duration of 1.85 years for the Index.
During the reporting period, which sectors were the strongest positive contributors to the Fund’s relative performance and which sectors were particularly weak?
During the reporting period, the Fund maintained overweight exposure relative to the Index in the financial and utility subsectors, which was accretive to the Fund’s relative performance. Among financials, overweight exposure to the finance company and banking subsectors had the most positive impact on relative performance, particularly holdings in Deutsche Bank, Standard Chartered plc and UBS Group AG. Among utilities, overweight exposure to the electric subsector had the most positive impact on relative performance, specifically holdings in Nextera Energy Capital Holdings Inc. and Southern California Edison Company. Among industrials, which was at benchmark weight, performance in the media & entertainment, energy and automotive subsectors was especially strong.
Within securitized products, ABS was the best performing sector. Within the floating-rate subcomponent of the ABS sector, AAA and AA-rated collateralized loan obligations were accretive to relative performance.5 Within the fixed-rate subcomponent of the ABS sector, equipment, student loan and specialty finance securities added to relative performance. Within the CMBS sector, the Fund’s overweight position in the non-agency subcomponent detracted
| 1. | See "Investment and Performance Comparison" for other share class returns, which may be higher or lower than Class I share returns, and for more information on benchmark and peer group returns. |
| 2. | The terms “spread” and “yield spread” may refer to the difference in yield between a security or type of security and comparable U.S. Treasury issues. The terms may also refer to the difference in yield between two specific securities or types of securities at a given time. |
| 3. | Duration is a measure of the price sensitivity of a fixed-income investment to changes in interest rates. Duration is expressed as a number of years and is considered a more accurate sensitivity gauge than average maturity. |
| 4. | The yield curve is a line that plots the yields of various securities of similar quality—typically U.S. Treasury issues—across a range of maturities. The U.S. Treasury yield curve serves as a benchmark for other debt and is used in economic forecasting. |
| 5. | An obligation rated ‘AAA’ has the highest rating assigned by Standard & Poor’s (“S&P”), and in the opinion of S&P, the obligor’s capacity to meet its financial commitment on the obligation is extremely strong. An obligation rated ‘AA’ by S&P is deemed by S&P to differ from the highest-rated obligations only to a small degree. In the opinion of S&P, the obligor's capacity to meet its financial commitment on the obligation is very strong. When applied to Fund holdings, ratings are based solely on the creditworthiness of the bonds in the portfolio and are not meant to represent the security or safety of the Fund. |
from performance. Underweight exposure to the U.S. Treasury sector also detracted from relative performance.
What were some of the Fund’s largest purchases and sales during the reporting period?
The largest additions to the Fund during the reporting period included shares of iShares 1–5 Year Investment Grade Corporate Bond ETF and bonds issued by Deutsche Bank AG (New York branch), Barclays plc, Bank of America Corp. and Danske Bank A/S. The largest reductions during the same period included bonds issued by Sumitomo Mitsui Financial Group, Banco Santander SA, Charter Communications Operating LLC, Standard Chartered plc and Virginia Electric and Power Co.
How did the Fund’s weightings change during the reporting period?
Throughout the reporting period, we increased the Fund’s allocation to the non-agency subcomponent of the mortgage-backed sector. This sector offered a superior yield compared to other similar duration asset classes. We also reduced the Fund’s U.S. government agency exposure, particularly in the callable agency subcomponent. With the expectation of interest rates continuing to rise, we reduced the Fund’s exposure to negatively convex6 assets that would underperform in a rising rate environment. Toward the middle of the reporting period, we increased the Fund’s allocation to agency MBS, as the OAS being offered in the sector reached the widest levels in over a decade. Toward the end of the reporting period, we increased the Fund’s allocation to U.S. regional banks. We concentrated specifically on the U.S. super and U.S. mid-tier subcomponents, as regional banks issued near OAS levels not seen since the regional banking crisis in March 2023.
How was the Fund positioned at the end of the reporting period?
As of October 31, 2023, the Fund held its most significantly overweight exposure relative to the Index in ABS. Within the corporate sector, the Fund held overweight positions in financials and utilities. The Fund also held overweight positions in MBS and CMBS. As of the same date, the Fund held relatively underweight positions in the sovereign, supranational, foreign agency and foreign local government sectors, as well as in U.S. Treasury securities.
| 6. | Convexity is a mathematical measure of the sensitivity of an interest-bearing bond to changes in interest rates. |
The opinions expressed are those of the portfolio managers as of the date of this report and are subject to change. There is no guarantee that any forecasts will come to pass. This material does not constitute investment advice and is not intended as an endorsement of any specific investment.
| 10 | MainStay Short Term Bond Fund |
Portfolio of Investments October 31, 2023†^
| | Principal
Amount | Value |
| Long-Term Bonds 95.3% |
| Asset-Backed Securities 10.9% |
| Automobile Asset-Backed Securities 1.9% |
| BOF URSA VI Funding Trust I | |
| Series 2023-CAR2, Class A2 | | |
| 5.542%, due 10/27/31 (a) | $ 558,597 | $ 550,164 |
| BOF VII AL Funding Trust I | |
| Series 2023-CAR3, Class A2 | | |
| 6.291%, due 7/26/32 (a) | 868,076 | 861,743 |
| Carvana Auto Receivables Trust | |
| Series 2022-P3, Class A3 | | |
| 4.61%, due 11/10/27 | 500,000 | 489,284 |
| GM Financial Automobile Leasing Trust | |
| Series 2023-1, Class A2A | | |
| 5.27%, due 6/20/25 | 1,489,816 | 1,485,293 |
| | | 3,386,484 |
| Other Asset-Backed Securities 9.0% |
| 522 Funding CLO Ltd. | |
| Series 2019-4A, Class BR | | |
| 7.277% (3 Month SOFR + 1.862%), due 4/20/30 (a)(b) | 1,000,000 | 986,858 |
| ALLO Issuer LLC | |
| Series 2023-1A, Class A2 | | |
| 6.20%, due 6/20/53 (a) | 800,000 | 744,068 |
| Apidos CLO XXX | |
| Series XXXA, Class A2 | | |
| 7.257% (3 Month SOFR + 1.862%), due 10/18/31 (a)(b) | 500,000 | 492,876 |
| ARES XXXVIII CLO Ltd. | |
| Series 2015-38A, Class BR | | |
| 7.077% (3 Month SOFR + 1.662%), due 4/20/30 (a)(b) | 500,000 | 488,152 |
| Ballyrock CLO 23 Ltd. | |
| Series 2023-23A, Class A1 | | |
| 7.358% (3 Month SOFR + 1.98%), due 4/25/36 (a)(b) | 500,000 | 500,201 |
| Benefit Street Partners CLO XXX Ltd. | |
| Series 2023-30A, Class A | | |
| 7.478% (3 Month SOFR + 2.10%), due 4/25/36 (a)(b) | 400,000 | 401,408 |
| Cook Park CLO Ltd. | |
| Series 2018-1A, Class B | | |
| 7.064% (3 Month SOFR + 1.662%), due 4/17/30 (a)(b) | 500,000 | 490,964 |
| CyrusOne Data Centers Issuer I LLC | |
| Series 2023-1A, Class A2 | | |
| 4.30%, due 4/20/48 (a) | 500,000 | 437,987 |
| | Principal
Amount | Value |
| |
| Other Asset-Backed Securities (continued) |
| EDvestinU Private Education Loan Issue No. 3 LLC | |
| Series 2021-A, Class A | | |
| 1.80%, due 11/25/45 (a) | $ 303,100 | $ 260,027 |
| Empower CLO Ltd. | |
| Series 2023-2A, Class A1 | | |
| 7.54% (3 Month SOFR + 2.20%), due 7/15/36 (a)(b) | 1,000,000 | 1,004,932 |
| Invesco US CLO Ltd. (a)(b) | |
| Series 2023-2A, Class A | | |
| 7.212% (3 Month SOFR + 1.80%), due 4/21/36 | 1,000,000 | 998,032 |
| Series 2023-1A, Class A1 | | |
| 7.412% (3 Month SOFR + 2.00%), due 4/22/35 | 750,000 | 751,182 |
| Juniper Valley Park CLO LLC | |
| Series 2023-1A, Class B | | |
| 7.966% (3 Month SOFR + 2.55%), due 7/20/35 (a)(b) | 750,000 | 750,872 |
| MetroNet Infrastructure Issuer LLC (a) | |
| Series 2022-1A, Class A2 | | |
| 6.35%, due 10/20/52 | 800,000 | 764,384 |
| Series 2023-1A, Class A2 | | |
| 6.56%, due 4/20/53 | 500,000 | 479,486 |
| Octagon 67 Ltd. | |
| Series 2023-1A, Class A1 | | |
| 7.178% (3 Month SOFR + 1.80%), due 4/25/36 (a)(b) | 1,000,000 | 1,000,831 |
| Palmer Square CLO Ltd. | |
| Series 2015-2A, Class A2R2 | | |
| 7.227% (3 Month SOFR + 1.812%), due 7/20/30 (a)(b) | 500,000 | 494,133 |
| SMB Private Education Loan Trust | |
| Series 2021-A, Class B | | |
| 2.31%, due 1/15/53 (a) | 770,000 | 702,491 |
| Store Master Funding I-VII XIV XIX XX XXIV | |
| Series 2023-1A, Class A1 | | |
| 6.19%, due 6/20/53 (a) | 997,917 | 954,211 |
| Sunnova Helios XI Issuer LLC | |
| Series 2023-A, Class A | | |
| 5.30%, due 5/20/50 (a) | 733,226 | 694,142 |
| SVC ABS LLC | |
| Series 2023-1A, Class A | | |
| 5.15%, due 2/20/53 (a) | 782,383 | 724,922 |
| Texas Debt Capital CLO Ltd. | |
| Series 2023-2A, Class A | | |
| 7.362% (3 Month SOFR + 1.95%), due 7/21/35 (a)(b) | 750,000 | 750,642 |
The notes to the financial statements are an integral part of, and should be read in conjunction with, the financial statements.
11
Portfolio of Investments October 31, 2023†^ (continued)
| | Principal
Amount | Value |
| Asset-Backed Securities (continued) |
| Other Asset-Backed Securities (continued) |
| Vibrant CLO X Ltd. | |
| Series 2018-10A, Class A1 | | |
| 6.877% (3 Month SOFR + 1.462%), due 10/20/31 (a)(b) | $ 490,780 | $ 487,165 |
| Voya CLO Ltd. (a)(b) | |
| Series 2022-4A, Class A | | |
| 7.566% (3 Month SOFR + 2.15%), due 10/20/33 | 250,000 | 250,144 |
| Series 2022-4A, Class B | | |
| 8.716% (3 Month SOFR + 3.30%), due 10/20/33 | 250,000 | 250,424 |
| | | 15,860,534 |
Total Asset-Backed Securities
(Cost $19,448,542) | | 19,247,018 |
| Corporate Bonds 34.0% |
| Auto Manufacturers 2.0% |
| American Honda Finance Corp. | | |
| 0.55%, due 7/12/24 | 825,000 | 795,918 |
| Ford Motor Credit Co. LLC | | |
| 3.664%, due 9/8/24 | 900,000 | 876,072 |
| 6.80%, due 5/12/28 | 455,000 | 453,700 |
| General Motors Financial Co., Inc. | | |
| 6.05%, due 10/10/25 | 735,000 | 731,977 |
| Hyundai Capital America | | |
| 5.65%, due 6/26/26 (a) | 565,000 | 557,630 |
| Nissan Motor Acceptance Co. LLC (a) | | |
| 6.95%, due 9/15/26 | 60,000 | 60,165 |
| 7.05%, due 9/15/28 | 140,000 | 138,268 |
| | | 3,613,730 |
| Banks 19.1% |
| ABN AMRO Bank NV | | |
| 6.339% (1 Year Treasury Constant Maturity Rate + 1.65%), due 9/18/27 (a)(b) | 455,000 | 450,016 |
| Bank of America Corp. | | |
| 4.20%, due 8/26/24 | 1,240,000 | 1,219,970 |
| 5.08%, due 1/20/27 (c) | 1,535,000 | 1,494,269 |
| 5.202%, due 4/25/29 (c) | 380,000 | 361,291 |
| Bank of New York Mellon Corp. (The) (c) | | |
| 4.543%, due 2/1/29 | 590,000 | 553,568 |
| 4.947%, due 4/26/27 | 435,000 | 422,773 |
| Barclays plc | | |
| 3.65%, due 3/16/25 | 400,000 | 384,662 |
| 5.829%, due 5/9/27 (c) | 210,000 | 205,202 |
| | Principal
Amount | Value |
| |
| Banks (continued) |
| Barclays plc (continued) | | |
| 7.385% (1 Year Treasury Constant Maturity Rate + 3.30%), due 11/2/28 (b) | $ 1,330,000 | $ 1,344,570 |
| Citigroup, Inc. | | |
| 5.61%, due 9/29/26 (c) | 1,040,000 | 1,026,646 |
| Citizens Bank NA | | |
| 6.064%, due 10/24/25 (c) | 1,055,000 | 1,008,866 |
| Cooperatieve Rabobank UA | | |
| 4.655% (1 Year Treasury Constant Maturity Rate + 1.75%), due 8/22/28 (a)(b) | 310,000 | 290,763 |
| Credit Suisse AG | | |
| 7.95%, due 1/9/25 | 1,010,000 | 1,024,405 |
| Danske Bank A/S | | |
| 6.466% (1 Year Treasury Constant Maturity Rate + 2.10%), due 1/9/26 (a)(b) | 1,625,000 | 1,618,304 |
| Deutsche Bank AG | | |
| 6.119%, due 7/14/26 (c) | 2,090,000 | 2,057,523 |
| Fifth Third Bank NA | | |
| 5.852%, due 10/27/25 (c) | 1,040,000 | 1,013,145 |
| Goldman Sachs Group, Inc. (The) | | |
| 5.70%, due 11/1/24 | 280,000 | 278,945 |
| HSBC Holdings plc | | |
| 7.336%, due 11/3/26 (c) | 840,000 | 854,498 |
| HSBC USA, Inc. | | |
| 5.625%, due 3/17/25 | 1,165,000 | 1,157,422 |
| Huntington National Bank (The) (c) | | |
| 4.008%, due 5/16/25 | 580,000 | 563,300 |
| 5.699%, due 11/18/25 | 295,000 | 286,420 |
| ING Groep NV | | |
| 6.083%, due 9/11/27 (c) | 635,000 | 628,941 |
| JPMorgan Chase & Co. (c) | | |
| 3.54%, due 5/1/28 | 650,000 | 594,969 |
| 5.546%, due 12/15/25 | 525,000 | 521,056 |
| KeyBank NA | | |
| 3.30%, due 6/1/25 | 526,000 | 487,869 |
| 4.15%, due 8/8/25 | 540,000 | 502,205 |
| 4.70%, due 1/26/26 | 250,000 | 232,187 |
| Lloyds Banking Group plc | | |
| 3.75%, due 1/11/27 | 835,000 | 767,718 |
| Manufacturers & Traders Trust Co. | | |
| 4.70%, due 1/27/28 | 485,000 | 439,496 |
| 5.40%, due 11/21/25 | 915,000 | 885,418 |
The notes to the financial statements are an integral part of, and should be read in conjunction with, the financial statements.
| 12 | MainStay Short Term Bond Fund |
| | Principal
Amount | Value |
| Corporate Bonds (continued) |
| Banks (continued) |
| Mitsubishi UFJ Financial Group, Inc. | | |
| 5.354% (1 Year Treasury Constant Maturity Rate + 1.90%), due 9/13/28 (b) | $ 205,000 | $ 198,448 |
| Morgan Stanley (c) | | |
| 4.679%, due 7/17/26 | 450,000 | 437,246 |
| 5.164%, due 4/20/29 | 1,040,000 | 989,485 |
| 6.138%, due 10/16/26 | 1,000,000 | 997,213 |
| Morgan Stanley Bank NA | | |
| 4.754%, due 4/21/26 | 620,000 | 603,907 |
| National Securities Clearing Corp. | | |
| 5.15%, due 5/30/25 (a) | 250,000 | 248,190 |
| PNC Financial Services Group, Inc. (The) (c) | | |
| 4.758%, due 1/26/27 | 260,000 | 250,229 |
| 5.582%, due 6/12/29 | 225,000 | 215,428 |
| 5.812%, due 6/12/26 | 475,000 | 468,701 |
| 6.615%, due 10/20/27 | 610,000 | 611,516 |
| Royal Bank of Canada | | |
| 5.66%, due 10/25/24 | 430,000 | 428,592 |
| Societe Generale SA | | |
| 6.446% (1 Year Treasury Constant Maturity Rate + 2.55%), due 1/10/29 (a)(b) | 745,000 | 727,895 |
| State Street Corp. | | |
| 4.857%, due 1/26/26 (c) | 180,000 | 176,930 |
| Toronto-Dominion Bank (The) | | |
| 4.285%, due 9/13/24 | 350,000 | 345,042 |
| Truist Financial Corp. | | |
| 7.161%, due 10/30/29 (c) | 300,000 | 301,769 |
| U.S. Bancorp (c) | | |
| 4.653%, due 2/1/29 | 430,000 | 396,920 |
| 5.775%, due 6/12/29 | 845,000 | 812,519 |
| 6.787%, due 10/26/27 | 440,000 | 443,291 |
| UBS Group AG | | |
| 6.327% (1 Year Treasury Constant Maturity Rate + 1.60%), due 12/22/27 (a)(b) | 625,000 | 618,703 |
| Wells Fargo & Co. (c) | | |
| 4.54%, due 8/15/26 | 1,045,000 | 1,012,711 |
| 6.303%, due 10/23/29 | 700,000 | 694,211 |
| | | 33,655,363 |
| Biotechnology 0.4% |
| Amgen, Inc. | | |
| 5.15%, due 3/2/28 | 665,000 | 649,027 |
| | Principal
Amount | Value |
| |
| Chemicals 0.4% |
| Celanese US Holdings LLC | | |
| 6.33%, due 7/15/29 | $ 395,000 | $ 380,755 |
| 6.55%, due 11/15/30 | 260,000 | 250,081 |
| | | 630,836 |
| Diversified Financial Services 3.3% |
| AerCap Ireland Capital DAC | | |
| 1.65%, due 10/29/24 | 1,190,000 | 1,134,720 |
| Air Lease Corp. | | |
| 0.80%, due 8/18/24 | 1,005,000 | 961,012 |
| American Express Co. | | |
| 6.489%, due 10/30/31 (c) | 440,000 | 440,661 |
| Antares Holdings LP (a) | | |
| 3.75%, due 7/15/27 | 250,000 | 212,359 |
| 3.95%, due 7/15/26 | 250,000 | 224,874 |
| 7.95%, due 8/11/28 | 500,000 | 489,081 |
| Blackstone Holdings Finance Co. LLC | | |
| 5.90%, due 11/3/27 (a) | 475,000 | 470,462 |
| Capital One Financial Corp. | | |
| 4.985%, due 7/24/26 (c) | 345,000 | 332,619 |
| Intercontinental Exchange, Inc. | | |
| 3.65%, due 5/23/25 | 1,040,000 | 1,005,534 |
| 4.00%, due 9/15/27 | 545,000 | 510,392 |
| | | 5,781,714 |
| Electric 3.6% |
| Duke Energy Corp. | | |
| 2.45%, due 6/1/30 | 320,000 | 255,010 |
| Enel Finance America LLC | | |
| 7.10%, due 10/14/27 (a) | 200,000 | 204,505 |
| Florida Power & Light Co. | | |
| 5.05%, due 4/1/28 | 595,000 | 582,154 |
| National Rural Utilities Cooperative Finance Corp. | | |
| 5.05%, due 9/15/28 | 375,000 | 364,222 |
| NextEra Energy Capital Holdings, Inc. | | |
| 5.78% (SOFR + 0.40%), due 11/3/23 (b) | 1,285,000 | 1,285,000 |
| 6.051%, due 3/1/25 | 360,000 | 359,794 |
| Pacific Gas and Electric Co. | | |
| 3.25%, due 2/16/24 | 1,145,000 | 1,134,982 |
| 4.20%, due 3/1/29 | 246,000 | 214,322 |
| 5.45%, due 6/15/27 | 290,000 | 277,088 |
| 6.10%, due 1/15/29 | 395,000 | 380,046 |
| Southern California Edison Co. | | |
| 5.30%, due 3/1/28 | 355,000 | 347,071 |
| 5.85%, due 11/1/27 | 555,000 | 554,196 |
The notes to the financial statements are an integral part of, and should be read in conjunction with, the financial statements.
13
Portfolio of Investments October 31, 2023†^ (continued)
| | Principal
Amount | Value |
| Corporate Bonds (continued) |
| Electric (continued) |
| Southern Co. (The) | | |
| 5.15%, due 10/6/25 | $ 370,000 | $ 365,606 |
| | | 6,323,996 |
| Entertainment 0.2% |
| Warnermedia Holdings, Inc. | | |
| 3.755%, due 3/15/27 | 305,000 | 280,783 |
| Healthcare-Products 0.1% |
| Baxter International, Inc. | | |
| 2.272%, due 12/1/28 | 170,000 | 140,678 |
| Healthcare-Services 0.2% |
| HCA, Inc. | | |
| 5.20%, due 6/1/28 | 435,000 | 414,169 |
| Insurance 0.1% |
| Corebridge Financial, Inc. | | |
| 3.50%, due 4/4/25 | 240,000 | 230,749 |
| Internet 0.2% |
| Meta Platforms, Inc. | | |
| 3.50%, due 8/15/27 | 450,000 | 423,076 |
| Investment Companies 0.1% |
| Blackstone Private Credit Fund | | |
| 7.05%, due 9/29/25 | 275,000 | 273,950 |
| Media 0.3% |
| Charter Communications Operating LLC | | |
| 4.908%, due 7/23/25 | 305,000 | 298,222 |
| Paramount Global | | |
| 4.00%, due 1/15/26 | 165,000 | 156,617 |
| | | 454,839 |
| Packaging & Containers 0.1% |
| Berry Global, Inc. | | |
| 5.50%, due 4/15/28 (a) | 155,000 | 148,330 |
| Pharmaceuticals 0.2% |
| Becton Dickinson & Co. | | |
| 4.693%, due 2/13/28 | 185,000 | 177,085 |
| CVS Health Corp. | | |
| 4.30%, due 3/25/28 | 115,000 | 107,742 |
| | | 284,827 |
| | Principal
Amount | Value |
| |
| Pipelines 1.5% |
| Cheniere Energy, Inc. | | |
| 4.625%, due 10/15/28 | $ 655,000 | $ 598,470 |
| Energy Transfer LP | | |
| 5.55%, due 2/15/28 | 385,000 | 373,758 |
| Kinder Morgan Energy Partners LP | | |
| 4.15%, due 2/1/24 | 745,000 | 741,053 |
| ONEOK, Inc. | | |
| 5.55%, due 11/1/26 | 265,000 | 261,799 |
| 5.85%, due 1/15/26 | 275,000 | 274,727 |
| Plains All American Pipeline LP | | |
| 4.50%, due 12/15/26 | 390,000 | 371,676 |
| | | 2,621,483 |
| Semiconductors 0.6% |
| Broadcom Corp. | | |
| 3.875%, due 1/15/27 | 500,000 | 467,331 |
| Intel Corp. | | |
| 4.875%, due 2/10/28 | 425,000 | 413,724 |
| Micron Technology, Inc. | | |
| 4.975%, due 2/6/26 | 265,000 | 258,249 |
| | | 1,139,304 |
| Software 0.6% |
| Oracle Corp. | | |
| 1.65%, due 3/25/26 | 1,140,000 | 1,033,967 |
| Telecommunications 0.7% |
| AT&T, Inc. | | |
| 1.70%, due 3/25/26 | 780,000 | 707,975 |
| T-Mobile USA, Inc. | | |
| 2.625%, due 4/15/26 | 500,000 | 462,114 |
| | | 1,170,089 |
| Trucking & Leasing 0.3% |
| Penske Truck Leasing Co. LP (a) | | |
| 5.75%, due 5/24/26 | 330,000 | 324,613 |
| 6.05%, due 8/1/28 | 185,000 | 181,501 |
| | | 506,114 |
Total Corporate Bonds
(Cost $60,930,428) | | 59,777,024 |
| Mortgage-Backed Securities 8.1% |
| Agency (Collateralized Mortgage Obligations) 2.8% |
| FHLMC, Strips (d) | |
| Series 390, Class C22 | | |
| 2.00%, due 4/15/37 | 4,639,138 | 357,073 |
The notes to the financial statements are an integral part of, and should be read in conjunction with, the financial statements.
| 14 | MainStay Short Term Bond Fund |
| | Principal
Amount | Value |
| Mortgage-Backed Securities (continued) |
| Agency (Collateralized Mortgage Obligations) (continued) |
| FHLMC, Strips (d) (continued) | |
| Series 390, Class C5 | | |
| 2.00%, due 4/15/42 | $ 4,743,919 | $ 427,012 |
| FNMA (d) | |
| REMIC, Series 2023-2, Class DI | | |
| 2.00%, due 5/25/51 | 4,325,002 | 559,363 |
| REMIC, Series 2021-3, Class TI | | |
| 2.50%, due 2/25/51 | 4,310,431 | 690,868 |
| FNMA, Strips | |
| REMIC, Series 432, Class C2 | | |
| 2.00%, due 7/25/37 (d) | 12,990,726 | 950,936 |
| GNMA | |
| Series 2023-66, Class BC | | |
| 5.00%, due 9/20/48 | 989,271 | 942,130 |
| UMBS, Single Family, 30 Year (e) | |
| 5.50%, due 11/25/53 TBA | 500,000 | 474,219 |
| 6.50%, due 11/25/53 TBA | 500,000 | 496,951 |
| | | 4,898,552 |
| Commercial Mortgage Loans (Collateralized Mortgage Obligations) 2.2% |
| BWAY Mortgage Trust | |
| Series 2013-1515, Class A2 | | |
| 3.454%, due 3/10/33 (a) | 775,000 | 726,386 |
| CENT Trust | |
| Series 2023-CITY, Class A | | |
| 7.954% (1 Month SOFR + 2.62%), due 9/15/28 (a)(b) | 750,000 | 752,346 |
| FHLMC, Multifamily Structured Pass-Through Certificates | |
| Series K112, Class X1 | | |
| 1.433%, due 5/25/30 (d)(f) | 3,609,970 | 260,791 |
| FNMA, ACES | |
| REMIC, Series 2019-M12, Class X3 | | |
| 0.602%, due 6/25/29 (d)(f) | 13,000,000 | 372,836 |
| GNMA (d)(f) | |
| Series 2023-127 | | |
| 0.43%, due 7/16/57 | 19,678,838 | 310,727 |
| Series 2023-108 | | |
| 0.70%, due 8/16/59 | 17,004,656 | 589,039 |
| Series 2021-106 | | |
| 0.859%, due 4/16/63 | 8,101,197 | 521,624 |
| Houston Galleria Mall Trust | |
| Series 2015-HGLR, Class A1A2 | | |
| 3.087%, due 3/5/37 (a) | 500,000 | 469,505 |
| | | 4,003,254 |
| | Principal
Amount | Value |
| |
| Whole Loan (Collateralized Mortgage Obligations) 3.1% |
| A&D Mortgage Trust (a)(g) | |
| Series 2023-NQM3, Class A1 | | |
| 6.733%, due 7/25/68 | $ 982,512 | $ 975,966 |
| Series 2023-NQM4, Class A1 | | |
| 7.472%, due 9/25/68 | 750,000 | 749,699 |
| BRAVO Residential Funding Trust | |
| Series 2023-NQM4, Class A1 | | |
| 6.435%, due 5/25/63 (a)(g) | 930,655 | 919,211 |
| COLT Mortgage Loan Trust | |
| Series 2023-3, Class A1 | | |
| 7.18%, due 9/25/68 (a)(g) | 743,920 | 745,551 |
| GCAT Trust | |
| Series 2023-NQM3, Class A1 | | |
| 6.889%, due 8/25/68 (a)(h) | 746,596 | 745,088 |
| HOMES Trust | |
| Series 2023-NQM2, Class A1 | | |
| 6.456%, due 2/25/68 (a)(g) | 945,014 | 935,440 |
| OBX Trust | |
| Series 2023-NQM2, Class A1 | | |
| 6.319%, due 1/25/62 (a)(g) | 365,818 | 361,790 |
| | | 5,432,745 |
Total Mortgage-Backed Securities
(Cost $14,522,405) | | 14,334,551 |
| U.S. Government & Federal Agencies 42.3% |
| Federal Home Loan Mortgage Corporation (Mortgage Pass-Through Security) 0.3% |
| FHLB | | |
| 5.75%, due 3/9/28 | 525,000 | 518,032 |
| Federal National Mortgage Association (Mortgage Pass-Through Securities) 0.6% |
| FNMA | | |
| 1.972% (SOFR 30A + 2.076%), due 8/1/51 (b) | 740,244 | 619,856 |
| UMBS, 30 Year | | |
| 6.00%, due 9/1/53 | 541,635 | 531,253 |
| | | 1,151,109 |
| United States Treasury Notes 41.4% |
| U.S. Treasury Notes | | |
| 0.25%, due 5/15/24 | 5,300,000 | 5,152,594 |
| 2.25%, due 12/31/23 | 1,070,000 | 1,064,346 |
| 2.25%, due 4/30/24 | 3,000,000 | 2,952,070 |
| 2.50%, due 5/15/24 | 20,000,000 | 19,682,031 |
| 2.625%, due 12/31/23 | 2,355,000 | 2,343,957 |
| 3.875%, due 8/15/33 | 3,105,000 | 2,858,056 |
The notes to the financial statements are an integral part of, and should be read in conjunction with, the financial statements.
15
Portfolio of Investments October 31, 2023†^ (continued)
| | Principal
Amount | | Value |
| U.S. Government & Federal Agencies (continued) |
| United States Treasury Notes (continued) |
| U.S. Treasury Notes (continued) | | | |
| 4.25%, due 9/30/24 | $ 2,500,000 | | $ 2,473,047 |
| 4.625%, due 10/15/26 | 3,005,000 | | 2,982,697 |
| 4.875%, due 10/31/28 | 1,460,000 | | 1,463,080 |
| 5.00%, due 10/31/25 | 31,925,000 | | 31,886,341 |
| | | | 72,858,219 |
Total U.S. Government & Federal Agencies
(Cost $74,802,020) | | | 74,527,360 |
Total Long-Term Bonds
(Cost $169,703,395) | | | 167,885,953 |
| |
| | Shares | | |
| |
| Exchange-Traded Fund 2.3% |
| iShares 1-5 Year Investment Grade Corporate Bond ETF | 80,301 | | 3,988,551 |
Total Exchange-Traded Fund
(Cost $4,041,019) | | | 3,988,551 |
| Short-Term Investment 1.6% |
| Unaffiliated Investment Company 1.6% |
| JPMorgan U.S. Government Money Market Fund, IM Class, 5.283% (i) | 2,775,321 | | 2,775,321 |
Total Short-Term Investment
(Cost $2,775,321) | | | 2,775,321 |
Total Investments
(Cost $176,519,735) | 99.2% | | 174,649,825 |
| Other Assets, Less Liabilities | 0.8 | | 1,430,242 |
| Net Assets | 100.0% | | $ 176,080,067 |
| † | Percentages indicated are based on Fund net assets. |
| ^ | Industry classifications may be different than those used for compliance monitoring purposes. |
| (a) | May be sold to institutional investors only under Rule 144A or securities offered pursuant to Section 4(a)(2) of the Securities Act of 1933, as amended. |
| (b) | Floating rate—Rate shown was the rate in effect as of October 31, 2023. |
| (c) | Fixed to floating rate—Rate shown was the rate in effect as of October 31, 2023. |
| (d) | Collateralized Mortgage Obligation Interest Only Strip—Pays a fixed or variable rate of interest based on mortgage loans or mortgage pass-through securities. The principal amount of the underlying pool represents the notional amount on which the current interest was calculated. The value of these stripped securities may be particularly sensitive to changes in prevailing interest rates and are typically more sensitive to changes in prepayment rates than traditional mortgage-backed securities. |
| (e) | TBA—Security purchased on a forward commitment basis with an approximate principal amount and maturity date. The actual principal amount and maturity date will be determined upon settlement. As of October 31, 2023, the total net market value was $971,170, which represented 0.6% of the Fund’s net assets. All or a portion of this security is a part of a mortgage dollar roll agreement. |
| (f) | Collateral strip rate—A bond whose interest was based on the weighted net interest rate of the collateral. The coupon rate adjusts periodically based on a predetermined schedule. Rate shown was the rate in effect as of October 31, 2023. |
| (g) | Step coupon—Rate shown was the rate in effect as of October 31, 2023. |
| (h) | Coupon rate may change based on changes of the underlying collateral or prepayments of principal. Rate shown was the rate in effect as of October 31, 2023. |
| (i) | Current yield as of October 31, 2023. |
Futures Contracts
As of October 31, 2023, the Fund held the following futures contracts1:
| Type | Number of
Contracts | Expiration
Date | Value at
Trade Date | Current
Notional
Amount | Unrealized
Appreciation
(Depreciation)2 |
| Long Contracts | | | | | |
| U.S. Treasury 2 Year Notes | 224 | December 2023 | $ 45,559,564 | $ 45,342,500 | $ (217,064) |
| Short Contracts | | | | | |
| U.S. Treasury 5 Year Notes | (56) | December 2023 | (5,894,414) | (5,850,687) | 43,727 |
| U.S. Treasury 10 Year Notes | (16) | December 2023 | (1,764,540) | (1,698,750) | 65,790 |
| U.S. Treasury 10 Year Ultra Bonds | (29) | December 2023 | (3,337,666) | (3,156,016) | 181,650 |
| U.S. Treasury Long Bonds | (4) | December 2023 | (433,742) | (437,750) | (4,008) |
The notes to the financial statements are an integral part of, and should be read in conjunction with, the financial statements.
| 16 | MainStay Short Term Bond Fund |
| Type | Number of
Contracts | Expiration
Date | Value at
Trade Date | Current
Notional
Amount | Unrealized
Appreciation
(Depreciation)2 |
| U.S. Treasury Ultra Bonds | (1) | December 2023 | $ (115,748) | $ (112,562) | $ 3,186 |
| Total Short Contracts | | | | | 290,345 |
| Net Unrealized Appreciation | | | | | $ 73,281 |
| 1. | As of October 31, 2023, cash in the amount of $235,102 was on deposit with a broker or futures commission merchant for futures transactions. |
| 2. | Represents the difference between the value of the contracts at the time they were opened and the value as of October 31, 2023. |
| Abbreviation(s): |
| ACES—Alternative Credit Enhancement Securities |
| CLO—Collateralized Loan Obligation |
| ETF—Exchange-Traded Fund |
| FHLB—Federal Home Loan Bank |
| FHLMC—Federal Home Loan Mortgage Corp. |
| FNMA—Federal National Mortgage Association |
| GNMA—Government National Mortgage Association |
| REMIC—Real Estate Mortgage Investment Conduit |
| SOFR—Secured Overnight Financing Rate |
| SVC—El Salvador Colon |
| TBA—To Be Announced |
| UMBS—Uniform Mortgage Backed Securities |
The notes to the financial statements are an integral part of, and should be read in conjunction with, the financial statements.
17
Portfolio of Investments October 31, 2023†^ (continued)
The following is a summary of the fair valuations according to the inputs used as of October 31, 2023, for valuing the Fund’s assets and liabilities:
| Description | Quoted
Prices in
Active
Markets for
Identical
Assets
(Level 1) | | Significant
Other
Observable
Inputs
(Level 2) | | Significant
Unobservable
Inputs
(Level 3) | | Total |
| Asset Valuation Inputs | | | | | | | |
| Investments in Securities (a) | | | | | | | |
| Long-Term Bonds | | | | | | | |
| Asset-Backed Securities | $ — | | $ 19,247,018 | | $ — | | $ 19,247,018 |
| Corporate Bonds | — | | 59,777,024 | | — | | 59,777,024 |
| Mortgage-Backed Securities | — | | 14,334,551 | | — | | 14,334,551 |
| U.S. Government & Federal Agencies | — | | 74,527,360 | | — | | 74,527,360 |
| Total Long-Term Bonds | — | | 167,885,953 | | — | | 167,885,953 |
| Exchange-Traded Fund | 3,988,551 | | — | | — | | 3,988,551 |
| Short-Term Investment | | | | | | | |
| Unaffiliated Investment Company | 2,775,321 | | — | | — | | 2,775,321 |
| Total Investments in Securities | 6,763,872 | | 167,885,953 | | — | | 174,649,825 |
| Other Financial Instruments | | | | | | | |
| Futures Contracts (b) | 294,353 | | — | | — | | 294,353 |
| Total Investments in Securities and Other Financial Instruments | $ 7,058,225 | | $ 167,885,953 | | $ — | | $ 174,944,178 |
| Liability Valuation Inputs | | | | | | | |
| Other Financial Instruments | | | | | | | |
| Futures Contracts (b) | $ (221,072) | | $ — | | $ — | | $ (221,072) |
| (a) | For a complete listing of investments and their industries, see the Portfolio of Investments. |
| (b) | The value listed for these securities reflects unrealized appreciation (depreciation) as shown on the Portfolio of Investments. |
The notes to the financial statements are an integral part of, and should be read in conjunction with, the financial statements.
| 18 | MainStay Short Term Bond Fund |
Statement of Assets and Liabilities as of October 31, 2023
| Assets |
Investment in securities, at value
(identified cost $176,519,735) | $174,649,825 |
| Cash | 3,000,000 |
| Cash collateral on deposit at broker for futures contracts | 235,102 |
| Receivables: | |
| Investment securities sold | 1,552,883 |
| Interest | 1,212,038 |
| Fund shares sold | 492,553 |
| Other assets | 42,815 |
| Total assets | 181,185,216 |
| Liabilities |
| Payables: | |
| Investment securities purchased | 4,736,516 |
| Fund shares redeemed | 247,717 |
| Transfer agent (See Note 3) | 28,488 |
| Variation margin on futures contracts | 25,897 |
| Manager (See Note 3) | 24,990 |
| NYLIFE Distributors (See Note 3) | 11,943 |
| Professional fees | 10,959 |
| Custodian | 10,498 |
| Shareholder communication | 1,043 |
| Trustees | 28 |
| Accrued expenses | 1,359 |
| Distributions payable | 5,711 |
| Total liabilities | 5,105,149 |
| Net assets | $176,080,067 |
| Composition of Net Assets |
| Shares of beneficial interest outstanding (par value of $.001 per share) unlimited number of shares authorized | $ 19,670 |
| Additional paid-in-capital | 184,531,036 |
| | 184,550,706 |
| Total distributable earnings (loss) | (8,470,639) |
| Net assets | $176,080,067 |
| Class A | |
| Net assets applicable to outstanding shares | $ 54,946,391 |
| Shares of beneficial interest outstanding | 6,143,144 |
| Net asset value per share outstanding | $ 8.94 |
| Maximum sales charge (1.00% of offering price) | 0.09 |
| Maximum offering price per share outstanding | $ 9.03 |
| Investor Class | |
| Net assets applicable to outstanding shares | $ 2,108,165 |
| Shares of beneficial interest outstanding | 234,038 |
| Net asset value per share outstanding | $ 9.01 |
| Maximum sales charge (0.50% of offering price) | 0.05 |
| Maximum offering price per share outstanding | $ 9.06 |
| Class I | |
| Net assets applicable to outstanding shares | $118,981,154 |
| Shares of beneficial interest outstanding | 13,287,953 |
| Net asset value and offering price per share outstanding | $ 8.95 |
| SIMPLE Class | |
| Net assets applicable to outstanding shares | $ 44,357 |
| Shares of beneficial interest outstanding | 4,926 |
| Net asset value and offering price per share outstanding | $ 9.00 |
The notes to the financial statements are an integral part of, and should be read in conjunction with, the financial statements.
19
Statement of Operations for the year ended October 31, 2023
| Investment Income (Loss) |
| Income | |
| Interest | $ 6,720,802 |
| Dividends | 83,502 |
| Total income | 6,804,304 |
| Expenses | |
| Manager (See Note 3) | 353,110 |
| Transfer agent (See Note 3) | 148,705 |
| Distribution/Service—Class A (See Note 3) | 136,571 |
| Distribution/Service—Investor Class (See Note 3) | 5,644 |
| Distribution/Service—SIMPLE Class (See Note 3) | 193 |
| Professional fees | 86,529 |
| Registration | 67,877 |
| Custodian | 33,396 |
| Shareholder communication | 6,269 |
| Trustees | 3,671 |
| Miscellaneous | 2,809 |
| Total expenses before waiver/reimbursement | 844,774 |
| Expense waiver/reimbursement from Manager (See Note 3) | (76,274) |
| Reimbursement from prior custodian(a) | (197) |
| Net expenses | 768,303 |
| Net investment income (loss) | 6,036,001 |
| Realized and Unrealized Gain (Loss) |
| Net realized gain (loss) on: | |
| Investment transactions | (3,237,960) |
| Futures transactions | (476,339) |
| Net realized gain (loss) | (3,714,299) |
| Net change in unrealized appreciation (depreciation) on: | |
| Investments | 1,117,090 |
| Futures contracts | 26,493 |
| Net change in unrealized appreciation (depreciation) | 1,143,583 |
| Net realized and unrealized gain (loss) | (2,570,716) |
| Net increase (decrease) in net assets resulting from operations | $ 3,465,285 |
| (a) | Represents a refund for overbilling of custody fees. |
The notes to the financial statements are an integral part of, and should be read in conjunction with, the financial statements.
| 20 | MainStay Short Term Bond Fund |
Statements of Changes in Net Assets
for the years ended October 31, 2023 and October 31, 2022
| | 2023 | 2022 |
| Increase (Decrease) in Net Assets |
| Operations: | | |
| Net investment income (loss) | $ 6,036,001 | $ 1,165,967 |
| Net realized gain (loss) | (3,714,299) | (2,819,854) |
| Net change in unrealized appreciation (depreciation) | 1,143,583 | (3,121,019) |
| Net increase (decrease) in net assets resulting from operations | 3,465,285 | (4,774,906) |
| Distributions to shareholders: | | |
| Class A | (2,107,106) | (962,450) |
| Investor Class | (82,020) | (39,806) |
| Class I | (3,851,715) | (477,164) |
| SIMPLE Class | (1,393) | (375) |
| Total distributions to shareholders | (6,042,234) | (1,479,795) |
| Capital share transactions: | | |
| Net proceeds from sales of shares | 162,985,768 | 60,298,526 |
| Net asset value of shares issued to shareholders in reinvestment of distributions | 5,982,196 | 1,347,322 |
| Cost of shares redeemed | (80,460,861) | (74,124,094) |
| Increase (decrease) in net assets derived from capital share transactions | 88,507,103 | (12,478,246) |
| Net increase (decrease) in net assets | 85,930,154 | (18,732,947) |
| Net Assets |
| Beginning of year | 90,149,913 | 108,882,860 |
| End of year | $176,080,067 | $ 90,149,913 |
The notes to the financial statements are an integral part of, and should be read in conjunction with, the financial statements.
21
Financial Highlights selected per share data and ratios
| | Year Ended October 31, |
| Class A | 2023 | | 2022 | | 2021 | | 2020 | | 2019 |
| Net asset value at beginning of year | $ 9.03 | | $ 9.78 | | $ 10.72 | | $ 10.91 | | $ 10.09 |
| Net investment income (loss) | 0.36(a) | | 0.14(a) | | 0.07(a) | | 0.15 | | 0.27 |
| Net realized and unrealized gain (loss) | (0.10) | | (0.74) | | (0.01) | | 0.05 | | 0.82 |
| Total from investment operations | 0.26 | | (0.60) | | 0.06 | | 0.20 | | 1.09 |
| Less distributions: | | | | | | | | | |
| From net investment income | (0.35) | | (0.13) | | (0.08) | | (0.17) | | (0.27) |
| From net realized gain on investments | — | | (0.02) | | (0.92) | | (0.22) | | — |
| Total distributions | (0.35) | | (0.15) | | (1.00) | | (0.39) | | (0.27) |
| Net asset value at end of year | $ 8.94 | | $ 9.03 | | $ 9.78 | | $ 10.72 | | $ 10.91 |
| Total investment return (b) | 2.92% | | (6.08)% | | 0.59% | | 2.00% | | 10.77% |
| Ratios (to average net assets)/Supplemental Data: | | | | | | | | | |
| Net investment income (loss) | 3.94% | | 1.45% | | 0.70% | | 1.32% | | 2.50% |
| Net expenses (c) | 0.75% | | 0.76% | | 0.72% | | 0.72% | | 0.60% |
| Expenses (before waiver/reimbursement) (c) | 0.75% | | 0.88% | | 0.77% | | 0.75% | | 0.60% |
| Portfolio turnover rate | 495%(d) | | 279%(d) | | 236% | | 299%(d) | | 75%(d) |
| Net assets at end of year (in 000’s) | $ 54,946 | | $ 54,971 | | $ 60,444 | | $ 43,452 | | $ 23,771 |
| (a) | Per share data based on average shares outstanding during the year. |
| (b) | Total investment return is calculated exclusive of sales charges and assumes the reinvestment of dividends and distributions. For periods of less than one year, total return is not annualized. |
| (c) | In addition to the fees and expenses which the Fund bears directly, it also indirectly bears a pro-rata share of the fees and expenses of the underlying funds in which it invests. Such indirect expenses are not included in the above expense ratios. |
| (d) | The portfolio turnover rates not including mortgage dollar rolls were 495%, 271%, 298%, and 72% for the years ended October 31, 2023, 2022, 2020 and 2019, respectively. |
| | Year Ended October 31, |
| Investor Class | 2023 | | 2022 | | 2021 | | 2020 | | 2019 |
| Net asset value at beginning of year | $ 9.09 | | $ 9.85 | | $ 10.79 | | $ 10.97 | | $ 10.15 |
| Net investment income (loss) | 0.34(a) | | 0.12(a) | | 0.05(a) | | 0.13 | | 0.23 |
| Net realized and unrealized gain (loss) | (0.08) | | (0.74) | | — | | 0.06 | | 0.82 |
| Total from investment operations | 0.26 | | (0.62) | | 0.05 | | 0.19 | | 1.05 |
| Less distributions: | | | | | | | | | |
| From net investment income | (0.34) | | (0.12) | | (0.07) | | (0.15) | | (0.23) |
| From net realized gain on investments | — | | (0.02) | | (0.92) | | (0.22) | | — |
| Total distributions | (0.34) | | (0.14) | | (0.99) | | (0.37) | | (0.23) |
| Net asset value at end of year | $ 9.01 | | $ 9.09 | | $ 9.85 | | $ 10.79 | | $ 10.97 |
| Total investment return (b) | 2.83% | | (6.28)% | | 0.44% | | 1.76% | | 10.46% |
| Ratios (to average net assets)/Supplemental Data: | | | | | | | | | |
| Net investment income (loss) | 3.76% | | 1.27% | | 0.51% | | 1.18% | | 2.18% |
| Net expenses (c) | 0.92% | | 0.92% | | 0.92% | | 0.92% | | 0.92% |
| Expenses (before waiver/reimbursement) (c) | 1.27% | | 1.32% | | 1.29% | | 1.22% | | 1.12% |
| Portfolio turnover rate | 495%(d) | | 279%(d) | | 236% | | 299%(d) | | 75%(d) |
| Net assets at end of year (in 000's) | $ 2,108 | | $ 2,396 | | $ 3,124 | | $ 3,376 | | $ 3,433 |
| (a) | Per share data based on average shares outstanding during the year. |
| (b) | Total investment return is calculated exclusive of sales charges and assumes the reinvestment of dividends and distributions. For periods of less than one year, total return is not annualized. |
| (c) | In addition to the fees and expenses which the Fund bears directly, it also indirectly bears a pro-rata share of the fees and expenses of the underlying funds in which it invests. Such indirect expenses are not included in the above expense ratios. |
| (d) | The portfolio turnover rates not including mortgage dollar rolls were 495%, 271%, 298%, and 72% for the years ended October 31, 2023, 2022, 2020 and 2019, respectively. |
The notes to the financial statements are an integral part of, and should be read in conjunction with, the financial statements.
| 22 | MainStay Short Term Bond Fund |
Financial Highlights selected per share data and ratios
| | Year Ended October 31, |
| Class I | 2023 | | 2022 | | 2021 | | 2020 | | 2019 |
| Net asset value at beginning of year | $ 9.04 | | $ 9.79 | | $ 10.74 | | $ 10.92 | | $ 10.10 |
| Net investment income (loss) | 0.41(a) | | 0.16(a) | | 0.10(a) | | 0.25 | | 0.29 |
| Net realized and unrealized gain (loss) | (0.12) | | (0.72) | | (0.01) | | (0.01) | | 0.82 |
| Total from investment operations | 0.29 | | (0.56) | | 0.09 | | 0.24 | | 1.11 |
| Less distributions: | | | | | | | | | |
| From net investment income | (0.38) | | (0.17) | | (0.12) | | (0.20) | | (0.29) |
| From net realized gain on investments | — | | (0.02) | | (0.92) | | (0.22) | | — |
| Total distributions | (0.38) | | (0.19) | | (1.04) | | (0.42) | | (0.29) |
| Net asset value at end of year | $ 8.95 | | $ 9.04 | | $ 9.79 | | $ 10.74 | | $ 10.92 |
| Total investment return (b) | 3.27% | | (5.74)% | | 0.87% | | 2.29% | | 11.14% |
| Ratios (to average net assets)/Supplemental Data: | | | | | | | | | |
| Net investment income (loss) | 4.50% | | 1.64% | | 1.02% | | 1.78% | | 2.77% |
| Net expenses (c) | 0.40% | | 0.40% | | 0.40% | | 0.40% | | 0.35% |
| Expenses (before waiver/reimbursement) (c) | 0.48% | | 0.60% | | 0.52% | | 0.48% | | 0.35% |
| Portfolio turnover rate | 495%(d) | | 279%(d) | | 236% | | 299%(d) | | 75%(d) |
| Net assets at end of year (in 000’s) | $ 118,981 | | $ 32,750 | | $ 45,291 | | $ 33,330 | | $ 290,411 |
| (a) | Per share data based on average shares outstanding during the year. |
| (b) | Total investment return is calculated exclusive of sales charges and assumes the reinvestment of dividends and distributions. Class I shares are not subject to sales charges. For periods of less than one year, total return is not annualized. |
| (c) | In addition to the fees and expenses which the Fund bears directly, it also indirectly bears a pro-rata share of the fees and expenses of the underlying funds in which it invests. Such indirect expenses are not included in the above expense ratios. |
| (d) | The portfolio turnover rates not including mortgage dollar rolls were 495%, 271%, 298%, and 72% for the years ended October 31, 2023, 2022, 2020 and 2019, respectively. |
The notes to the financial statements are an integral part of, and should be read in conjunction with, the financial statements.
23
Financial Highlights selected per share data and ratios
| | Year Ended October 31, | | August 31, 2020^ through
October 31, |
| SIMPLE Class | 2023 | | 2022 | | 2021 | | 2020 |
| Net asset value at beginning of period | $ 9.09 | | $ 9.85 | | $ 10.79 | | $ 10.82* |
| Net investment income (loss) (a) | 0.33 | | 0.11 | | 0.03 | | 0.01 |
| Net realized and unrealized gain (loss) | (0.10) | | (0.75) | | (0.01) | | (0.03) |
| Total from investment operations | 0.23 | | (0.64) | | 0.02 | | (0.02) |
| Less distributions: | | | | | | | |
| From net investment income | (0.32) | | (0.10) | | (0.04) | | (0.01) |
| From net realized gain on investments | — | | (0.02) | | (0.92) | | — |
| Total distributions | (0.32) | | (0.12) | | (0.96) | | (0.01) |
| Net asset value at end of period | $ 9.00 | | $ 9.09 | | $ 9.85 | | $ 10.79 |
| Total investment return (b) | 2.56% | | (6.49)% | | 0.18% | | (0.17)% |
| Ratios (to average net assets)/Supplemental Data: | | | | | | | |
| Net investment income (loss) | 3.65% | | 1.16% | | 0.27% | | 0.38%†† |
| Net expenses (c) | 1.08% | | 1.17% | | 1.17% | | 1.17%†† |
| Expenses (before waiver/reimbursement) (c) | 1.08% | | 1.56% | | 1.54% | | 1.55%†† |
| Portfolio turnover rate | 495%(d) | | 279%(d) | | 236% | | 299%(d) |
| Net assets at end of period (in 000’s) | $ 44 | | $ 32 | | $ 25 | | $ 25 |
| ^ | Inception date. |
| * | Based on the net asset value of Investor Class as of August 31, 2020. |
| †† | Annualized. |
| (a) | Per share data based on average shares outstanding during the period. |
| (b) | Total investment return is calculated exclusive of sales charges and assumes the reinvestment of dividends and distributions. SIMPLE Class shares are not subject to sales charges. For periods of less than one year, total return is not annualized. |
| (c) | In addition to the fees and expenses which the Fund bears directly, it also indirectly bears a pro-rata share of the fees and expenses of the underlying funds in which it invests. Such indirect expenses are not included in the above expense ratios. |
| (d) | The portfolio turnover rate not including mortgage dollar rolls was 495%, 271% and 298% for the year ended October 31, 2023, 2022 and 2020. |
The notes to the financial statements are an integral part of, and should be read in conjunction with, the financial statements.
| 24 | MainStay Short Term Bond Fund |
Notes to Financial Statements
Note 1-Organization and Business
MainStay Funds Trust (the “Trust”) was organized as a Delaware statutory trust on April 28, 2009. The Trust is registered under the Investment Company Act of 1940, as amended (the “1940 Act”), as an open-end management investment company, and is comprised of thirty-seven funds (collectively referred to as the “Funds”). These financial statements and notes relate to the MainStay Short Term Bond Fund (the "Fund"), a “diversified” fund, as that term is defined in the 1940 Act, as interpreted or modified by regulatory authorities having jurisdiction, from time to time.
The following table lists the Fund's share classes that have been registered and commenced operations:
| Class | Commenced Operations |
| Class A | January 2, 2004 |
| Investor Class | February 28, 2008 |
| Class I | January 2, 1991 |
| SIMPLE Class | August 31, 2020 |
Class A and Investor Class shares are offered at net asset value (“NAV”) per share plus an initial sales charge. No initial sales charge applies to investments of $250,000 or more (and certain other qualified purchases) in Class A and Investor Class shares. However, a contingent deferred sales charge (“CDSC”) of 0.50% may be imposed on certain redemptions made within 12 months of the date of purchase on shares that were purchased without an initial sales charge. Class I and SIMPLE Class shares are offered at NAV without a sales charge. Additionally, Investor Class shares may convert automatically to Class A shares. SIMPLE Class shares convert to Class A shares, or Investor Class shares if you are not eligible to hold Class A shares, at the end of the calendar quarter, ten years after the date they were purchased. Share class conversions are based on the relevant NAVs of the two classes at the time of the conversion, and no sales load or other charge is imposed. Under certain circumstances and as may be permitted by the Trust’s multiple class plan pursuant to Rule 18f-3 under the 1940 Act, specified share classes of the Fund may be converted to one or more other share classes of the Fund as disclosed in the capital share transactions within these Notes. The classes of shares have the same voting (except for issues that relate solely to one class), dividend, liquidation and other rights, and the same terms and conditions, except that under distribution plans pursuant to Rule 12b-1 under the 1940 Act, Class A, Investor Class and SIMPLE Class shares are subject to a distribution and/or service fee. Class I shares are not subject to a distribution and/or service fee.
The Fund's investment objective is to seek current income consistent with capital preservation.
Note 2–Significant Accounting Policies
The Fund is an investment company and accordingly follows the investment company accounting and reporting guidance of the Financial Accounting Standards Board (“FASB”) Accounting Standards Codification Topic 946 Financial Services—Investment Companies. The Fund
prepares its financial statements in accordance with generally accepted accounting principles (“GAAP”) in the United States of America and follows the significant accounting policies described below.
(A) Securities Valuation. Investments are usually valued as of the close of regular trading on the New York Stock Exchange (the "Exchange") (usually 4:00 p.m. Eastern time) on each day the Fund is open for business ("valuation date").
Pursuant to Rule 2a-5 under the 1940 Act, the Board of Trustees of the Trust (the "Board") has designated New York Life Investment Management LLC (“New York Life Investments” or the "Manager") as its Valuation Designee (the "Valuation Designee"). The Valuation Designee is responsible for performing fair valuations relating to all investments in the Fund’s portfolio for which market quotations are not readily available; periodically assessing and managing material valuation risks; establishing and applying fair value methodologies; testing fair valuation methodologies; evaluating and overseeing pricing services; ensuring appropriate segregation of valuation and portfolio management functions; providing quarterly, annual and prompt reporting to the Board, as appropriate; identifying potential conflicts of interest; and maintaining appropriate records. The Valuation Designee has established a valuation committee ("Valuation Committee") to assist in carrying out the Valuation Designee’s responsibilities and establish prices of securities for which market quotations are not readily available. The Fund's and the Valuation Designee's policies and procedures ("Valuation Procedures") govern the Valuation Designee’s selection and application of methodologies for determining and calculating the fair value of Fund investments. The Valuation Designee may value the Fund's portfolio securities for which market quotations are not readily available and other Fund assets utilizing inputs from pricing services and other third-party sources. The Valuation Committee meets (in person, via electronic mail or via teleconference) on an ad-hoc basis to determine fair valuations and on a quarterly basis to review fair value events with respect to certain securities for which market quotations are not readily available, including valuation risks and back-testing results, and preview reports to the Board.
The Valuation Committee establishes prices of securities for which market quotations are not readily available based on such methodologies and measurements on a regular basis after considering information that is reasonably available and deemed relevant by the Valuation Committee. The Board shall oversee the Valuation Designee and review fair valuation materials on a prompt, quarterly and annual basis and approve proposed revisions to the Valuation Procedures.
Investments for which market quotations are not readily available are valued at fair value as determined in good faith pursuant to the Valuation Procedures. A market quotation is readily available only when that quotation is a quoted price (unadjusted) in active markets for identical investments that the Fund can access at the measurement date, provided that a quotation will not be readily available if it is not reliable. "Fair value" is defined as the price the Fund would reasonably expect to receive upon selling an asset or liability in an orderly transaction to an independent buyer in the principal or most advantageous market for the asset or
Notes to Financial Statements (continued)
liability. Fair value measurements are determined within a framework that establishes a three-tier hierarchy that maximizes the use of observable market data and minimizes the use of unobservable inputs to establish a classification of fair value measurements for disclosure purposes. "Inputs" refer broadly to the assumptions that market participants would use in pricing the asset or liability, including assumptions about risk, such as the risk inherent in a particular valuation technique used to measure fair value using a pricing model and/or the risk inherent in the inputs for the valuation technique. Inputs may be observable or unobservable. Observable inputs reflect the assumptions market participants would use in pricing the asset or liability based on market data obtained from sources independent of the Fund. Unobservable inputs reflect the Fund’s own assumptions about the assumptions market participants would use in pricing the asset or liability based on the information available. The inputs or methodology used for valuing assets or liabilities may not be an indication of the risks associated with investing in those assets or liabilities. The three-tier hierarchy of inputs is summarized below.
| • | Level 1—quoted prices (unadjusted) in active markets for an identical asset or liability |
| • | Level 2—other significant observable inputs (including quoted prices for a similar asset or liability in active markets, interest rates and yield curves, prepayment speeds, credit risk, etc.) |
| • | Level 3—significant unobservable inputs (including the Fund's own assumptions about the assumptions that market participants would use in measuring fair value of an asset or liability) |
The level of an asset or liability within the fair value hierarchy is based on the lowest level of an input, both individually and in the aggregate, that is significant to the fair value measurement. The aggregate value by input level of the Fund’s assets and liabilities as of October 31, 2023, is included at the end of the Portfolio of Investments.
The Fund may use third-party vendor evaluations, whose prices may be derived from one or more of the following standard inputs, among others:
| • Benchmark yields | • Reported trades |
| • Broker/dealer quotes | • Issuer spreads |
| • Two-sided markets | • Benchmark securities |
| • Bids/offers | • Reference data (corporate actions or material event notices) |
| • Industry and economic events | • Comparable bonds |
| • Monthly payment information | |
An asset or liability for which a market quotation is not readily available is valued by methods deemed reasonable in good faith by the Valuation Committee, following the Valuation Procedures to represent fair value. Under these procedures, the Valuation Designee generally uses a market-based approach which may use related or comparable assets or liabilities, recent transactions, market multiples, book values and other relevant information. The Valuation Designee may also use an income-based valuation approach in which the anticipated future cash flows of the asset or liability are discounted to calculate fair value.
Discounts may also be applied due to the nature and/or duration of any restrictions on the disposition of the asset or liability. Fair value represents a good faith approximation of the value of a security. Fair value determinations involve the consideration of a number of subjective factors, an analysis of applicable facts and circumstances and the exercise of judgment. As a result, it is possible that the fair value for a security determined in good faith in accordance with the Valuation Procedures may differ from valuations for the same security determined for other funds using their own valuation procedures. Although the Valuation Procedures are designed to value a security at the price the Fund may reasonably expect to receive upon the security's sale in an orderly transaction, there can be no assurance that any fair value determination thereunder would, in fact, approximate the amount that the Fund would actually realize upon the sale of the security or the price at which the security would trade if a reliable market price were readily available. During the year ended October 31, 2023, there were no material changes to the fair value methodologies.
Securities which may be valued in this manner include, but are not limited to: (i) a security for which trading has been halted or suspended or otherwise does not have a readily available market quotation on a given day; (ii) a debt security that has recently gone into default and for which there is not a current market quotation; (iii) a security of an issuer that has entered into a restructuring; (iv) a security that has been delisted from a national exchange; (v) a security subject to trading collars for which no or limited trading takes place; and (vi) a security whose principal market has been temporarily closed at a time when, under normal conditions, it would be open. Securities valued in this manner are generally categorized as Level 2 or 3 in the hierarchy. No securities held by the Fund as of October 31, 2023, were fair valued in such a manner.
Exchange-traded funds (“ETFs”) are valued at the last quoted sales prices as of the close of regular trading on the relevant exchange on each valuation date. Securities that are not traded on the valuation date are valued at the mean of the last quoted bid and ask prices. Prices are normally taken from the principal market in which each security trades. These securities are generally categorized as Level 1 in the hierarchy.
Investments in mutual funds, including money market funds, are valued at their respective NAVs at the close of business each day on the valuation date. These securities are generally categorized as Level 1 in the hierarchy.
Futures contracts are valued at the last posted settlement price on the market where such futures are primarily traded. These securities are generally categorized as Level 1 in the hierarchy.
Debt securities (other than convertible and municipal bonds) are valued at the evaluated bid prices (evaluated mean prices in the case of convertible and municipal bonds) supplied by a pricing agent or broker selected by the Valuation Designee, in consultation with the Subadvisor. The evaluations are market-based measurements processed through a pricing application and represents the pricing agent’s good faith determination as to what a holder may receive in an orderly transaction under market conditions. The rules-based logic utilizes valuation techniques that reflect
| 26 | MainStay Short Term Bond Fund |
participants’ assumptions and vary by asset class and per methodology, maximizing the use of relevant observable data including quoted prices for similar assets, benchmark yield curves and market corroborated inputs. The evaluated bid or mean prices are deemed by the Valuation Designee, in consultation with the Subadvisor, to be representative of market values at the regular close of trading of the Exchange on each valuation date. Debt securities purchased on a delayed delivery basis are marked to market daily until settlement at the forward settlement date. Debt securities, including corporate bonds, U.S. government and federal agency bonds, municipal bonds, foreign bonds, convertible bonds, asset-backed securities and mortgage-backed securities are generally categorized as Level 2 in the hierarchy.
Temporary cash investments acquired in excess of 60 days to maturity at the time of purchase are valued using the latest bid prices or using valuations based on a matrix system (which considers such factors as security prices, yields, maturities and ratings), both as furnished by independent pricing services. Temporary cash investments that mature in 60 days or less at the time of purchase ("Short-Term Investments") are valued using the amortized cost method of valuation, unless the use of such method would be inappropriate. The amortized cost method involves valuing a security at its cost on the date of purchase and thereafter assuming a constant amortization to maturity of the difference between such cost and the value on maturity date. Amortized cost approximates the current fair value of a security. Securities valued using the amortized cost method are not valued using quoted prices in an active market and are generally categorized as Level 2 in the hierarchy.
The information above is not intended to reflect an exhaustive list of the methodologies that may be used to value portfolio investments. The Valuation Procedures permit the use of a variety of valuation methodologies in connection with valuing portfolio investments. The methodology used for a specific type of investment may vary based on the market data available or other considerations. The methodologies summarized above may not represent the specific means by which portfolio investments are valued on any particular business day.
(B) Income Taxes. The Fund's policy is to comply with the requirements of the Internal Revenue Code of 1986, as amended (the “Internal Revenue Code”), applicable to regulated investment companies and to distribute all of its taxable income to the shareholders of the Fund within the allowable time limits.
The Manager evaluates the Fund’s tax positions to determine if the tax positions taken meet the minimum recognition threshold in connection with accounting for uncertainties in income tax positions taken or expected to be taken for the purposes of measuring and recognizing tax liabilities in the financial statements. Recognition of tax benefits of an uncertain tax position is permitted only to the extent the position is “more likely than not” to be sustained assuming examination by taxing authorities. The Manager analyzed the Fund's tax positions taken on federal, state and local income tax returns for all open tax years (for up to three tax years) and has concluded that no provisions for federal, state and local income tax are required in the Fund's financial statements. The
Fund's federal, state and local income tax and federal excise tax returns for tax years for which the applicable statutes of limitations have not expired are subject to examination by the Internal Revenue Service and state and local departments of revenue.
(C) Dividends and Distributions to Shareholders. Dividends and distributions are recorded on the ex-dividend date. The Fund intends to declare and pay dividends from net investment income, if any, at least monthly and distributions from net realized capital and currency gains, if any, at least annually. Unless a shareholder elects otherwise, all dividends and distributions are reinvested at NAV in the same class of shares of the Fund. Dividends and distributions to shareholders are determined in accordance with federal income tax regulations and may differ from determinations using GAAP.
(D) Security Transactions and Investment Income. The Fund records security transactions on the trade date. Realized gains and losses on security transactions are determined using the identified cost method. Interest income is accrued as earned using the effective interest rate method and includes any realized gains and losses from repayments of principal on mortgage-backed securities. Distributions received from real estate investment trusts may be classified as dividends, capital gains and/or return of capital. Discounts and premiums on securities purchased, other than temporary cash investments that mature in 60 days or less at the time of purchase, for the Fund are accreted and amortized, respectively, on the effective interest rate method.
Investment income and realized and unrealized gains and losses on investments of the Fund are allocated pro rata to the separate classes of shares based upon their relative net assets on the date the income is earned or realized and unrealized gains and losses are incurred.
The Fund may place a debt security on non-accrual status and reduce related interest income by ceasing current accruals and writing off all or a portion of any interest receivables when the collection of all or a portion of such interest has become doubtful. A debt security is removed from non-accrual status when the issuer resumes interest payments or when collectability of interest is reasonably assured.
(E) Expenses. Expenses of the Trust are allocated to the individual Funds in proportion to the net assets of the respective Funds when the expenses are incurred, except where direct allocations of expenses can be made. Expenses (other than transfer agent expenses and fees incurred under the shareholder services plans and/or the distribution plans further discussed in Note 3(B)) are allocated to separate classes of shares pro rata based upon their relative net assets on the date the expenses are incurred. The expenses borne by the Fund, including those of related parties to the Fund, are shown in the Statement of Operations.
Additionally, the Fund may invest in mutual funds, which are subject to management fees and other fees that may cause the costs of investing in mutual funds to be greater than the costs of owning the underlying securities directly. These indirect expenses of mutual funds are not included in the amounts shown as expenses in the Statement of Operations or in the expense ratios included in the Financial Highlights.
Notes to Financial Statements (continued)
(F) Use of Estimates. In preparing financial statements in conformity with GAAP, the Manager makes estimates and assumptions that affect the reported amounts and disclosures in the financial statements. Actual results could differ from those estimates and assumptions.
(G) Futures Contracts. A futures contract is an agreement to purchase or sell a specified quantity of an underlying instrument at a specified future date and price, or to make or receive a cash payment based on the value of a financial instrument (e.g., foreign currency, interest rate, security or securities index). The Fund is subject to risks such as market price risk, leverage risk, liquidity risk, counterparty risk, operational risk, legal risk and/or interest rate risk in the normal course of investing in these contracts. Upon entering into a futures contract, the Fund is required to pledge to the broker or futures commission merchant an amount of cash and/or U.S. government securities equal to a certain percentage of the collateral amount, known as the “initial margin.” During the period the futures contract is open, changes in the value of the contract are recognized as unrealized appreciation or depreciation by marking to market such contract on a daily basis to reflect the market value of the contract at the end of each day’s trading. The Fund agrees to receive from or pay to the broker or futures commission merchant an amount of cash equal to the daily fluctuation in the value of the contract. Such receipts or payments are known as “variation margin.” When the futures contract is closed, the Fund records a realized gain or loss equal to the difference between the proceeds from (or cost of) the closing transaction and the Fund's basis in the contract.
The use of futures contracts involves, to varying degrees, elements of market risk in excess of the amount recognized in the Statement of Assets and Liabilities. The contract or notional amounts and variation margin reflect the extent of the Fund's involvement in open futures positions. There are several risks associated with the use of futures contracts as hedging techniques. There can be no assurance that a liquid market will exist at the time when the Fund seeks to close out a futures contract. If no liquid market exists, the Fund would remain obligated to meet margin requirements until the position is closed. Futures contracts may involve a small initial investment relative to the risk assumed, which could result in losses greater than if the Fund did not invest in futures contracts. Futures contracts may be more volatile than direct investments in the instrument underlying the futures and may not correlate to the underlying instrument, causing a given hedge not to achieve its objectives. The Fund's activities in futures contracts have minimal counterparty risk as they are conducted through regulated exchanges that guarantee the futures against default by the counterparty. In the event of a bankruptcy or insolvency of a futures commission merchant that holds margin on behalf of the Fund, the Fund may not be entitled to the return of the entire margin owed to the Fund, potentially resulting in a loss. The Fund may invest in futures contracts to seek enhanced returns or to reduce the risk of loss by hedging certain of its holdings. The Fund's investment in futures contracts and other derivatives may increase the volatility of the Fund's NAVs and may result in a loss to the Fund. Open futures contracts as of October 31, 2023, are shown in the Portfolio of Investments.
(H) Securities Lending. In order to realize additional income, the Fund may engage in securities lending, subject to the limitations set forth in the 1940 Act and relevant guidance by the staff of the Securities and Exchange Commission (“SEC”). If the Fund engages in securities lending, the Fund will lend through its custodian, JPMorgan Chase Bank, N.A., ("JPMorgan"), acting as securities lending agent on behalf of the Fund. Under the current arrangement, JPMorgan will manage the Fund's collateral in accordance with the securities lending agency agreement between the Fund and JPMorgan, and indemnify the Fund against counterparty risk. The loans will be collateralized by cash (which may be invested in a money market fund) and/or non-cash collateral (which may include U.S. Treasury securities and/or U.S. government agency securities issued or guaranteed by the United States government or its agencies or instrumentalities) at least equal at all times to the market value of the securities loaned. Non-cash collateral held at year end is segregated and cannot be transferred by the Fund. The Fund bears the risk of delay in recovery of, or loss of rights in, the securities loaned. The Fund may also record a realized gain or loss on securities deemed sold due to a borrower’s inability to return securities on loan. The Fund bears the risk of any loss on investment of cash collateral. The Fund will receive compensation for lending its securities in the form of fees or it will retain a portion of interest earned on the investment of any cash collateral. The Fund will also continue to receive interest and dividends on the securities loaned and any gain or loss in the market price of the securities loaned that may occur during the term of the loan will be for the account of the Fund. Income earned from securities lending activities, if any, is reflected in the Statement of Operations. As of October 31, 2023, the Fund did not have any portfolio securities on loan.
(I) Dollar Rolls. The Fund may enter into dollar roll transactions in which it sells mortgage-backed securities ("MBS") from its portfolio to a counterparty from whom it simultaneously agrees to buy a similar security on a delayed delivery basis. The Fund generally transfers MBS where the MBS are "to be announced," therefore, the Fund accounts for these transactions as purchases and sales.
When accounted for as purchase and sales, the securities sold in connection with the dollar rolls are removed from the portfolio and a realized gain or loss is recognized. The securities the Fund has agreed to acquire are included at market value in the Portfolio of Investments and liabilities for such purchase commitments are included as payables for investments purchased. During the roll period, the Fund foregoes principal and interest paid on the securities. The Fund is compensated by the difference between the current sales price and the forward price for the future as well as by the earnings on the cash proceeds of the initial sale. Dollar rolls may be renewed without physical delivery of the securities subject to the contract. Dollar roll transactions involve certain risks, including the risk that the securities returned to the Fund at the end of the roll period, while substantially similar, could be inferior to what was initially sold to the counterparty. During the year ended October 31, 2023, the Fund invested in Dollar Rolls.
| 28 | MainStay Short Term Bond Fund |
(J) Debt Securities Risk. Investments in the Fund are not guaranteed, even though some of the Fund’s underlying investments are guaranteed by the U.S. government or its agencies or instrumentalities. The principal risk of mortgage-related and asset-backed securities is that the underlying debt may be prepaid ahead of schedule, if interest rates fall, thereby reducing the value of the Fund’s investment. If interest rates rise, less of the debt may be prepaid and the Fund may lose money. The Fund is subject to interest-rate risk and its holdings in bonds can lose principal value when interest rates rise. Bonds are also subject to credit risk, in which the bond issuer may fail to pay interest and principal in a timely manner.
The Fund may invest in foreign debt securities, which carry certain risks that are in addition to the usual risks inherent in domestic debt securities. Foreign regulatory regimes and securities markets can have less stringent investor protections and disclosure standards and less liquid trading markets than U.S. regulatory regimes and securities markets, and can experience political, social and economic developments that may affect the value of investments in foreign securities. These risks include those resulting from currency fluctuations, future adverse political or economic developments and possible imposition of currency exchange blockages or other foreign governmental laws or restrictions. Economic sanctions and other similar governmental actions or developments could, among other things, effectively restrict or eliminate the Fund's ability to purchase or sell certain foreign securities or groups of foreign securities, and thus may make the Fund's investments in such securities less liquid or more difficult in value. These risks are likely to be greater in emerging markets than in developed markets. The ability of issuers of securities held by the Fund to meet their obligations may be affected by, among other things, economic or political developments in a specific country, industry or region.
(K) LIBOR Replacement Risk. The Fund may invest in certain debt securities, derivatives or other financial instruments that have relied or continue to rely on the London Interbank Offered Rate ("LIBOR"), as a “benchmark” or “reference rate” for various interest rate calculations. As of January 1, 2022, the United Kingdom Financial Conduct Authority ("FCA"), which regulates LIBOR, ceased its active encouragement of banks to provide the quotations needed to sustain most LIBOR rates due to the absence of an active market for interbank unsecured lending and other reasons. In connection with supervisory guidance from U.S. regulators, certain U.S. regulated entities have generally ceased to enter into certain new LIBOR contracts after January 1, 2022. On March 15, 2022, the Adjustable Interest Rate (LIBOR) Act was signed into law. This law provides a statutory fallback mechanism on a nationwide basis to replace LIBOR with a benchmark rate that is selected by the Board of Governors of the Federal Reserve System and based on Secured Overnight Financing Rate ("SOFR") (which measures the cost of overnight borrowings through repurchase agreement transactions collateralized with U.S. Treasury securities) for tough legacy contracts. On February 27, 2023, the Federal Reserve System’s final rule in connection with this law became effective, establishing benchmark replacements based on SOFR and Term SOFR (a forward-looking measurement of market expectations
of SOFR implied from certain derivatives markets) for applicable tough legacy contracts governed by U.S. law. In addition, the FCA has announced that it will require the publication of synthetic LIBOR for the one-month, three-month and six-month U.S. Dollar LIBOR settings after June 30, 2023 through at least September 30, 2024. Certain of the Fund's investments may involve individual tough legacy contracts which may be subject to the Adjustable Interest Rate (LIBOR) Act or synthetic LIBOR and no assurances can be given that these measures will have had the intended effects. Although the transition process away from LIBOR for many instruments has been completed, some LIBOR use is continuing and there are potential effects related to the transition away from LIBOR or continued use of LIBOR on the Fund.
The elimination of LIBOR or changes to other reference rates or any other changes or reforms to the determination or supervision of reference rates could have an adverse impact on the market for, or value of, any securities or payments linked to those reference rates, which may adversely affect the Fund's performance and/or net asset value. It could also lead to a reduction in the interest rates on, and the value of, some LIBOR-based investments and reduce the effectiveness of hedges mitigating risk in connection with LIBOR-based investments. Uncertainty and risk also remain regarding the willingness and ability of issuers and lenders to include enhanced provisions in new and existing contracts or instruments. Consequently, the transition away from LIBOR to other reference rates may lead to increased volatility and illiquidity in markets that are tied to LIBOR, fluctuations in values of LIBOR-related investments or investments in issuers that utilize LIBOR, increased difficulty in borrowing or refinancing and diminished effectiveness of hedging strategies, adversely affecting the Fund's performance. Furthermore, the risks associated with the expected discontinuation of LIBOR and transition may be exacerbated if the work necessary to effect an orderly transition to an alternative reference rate is not completed in a timely manner. The usefulness of LIBOR as a benchmark could deteriorate anytime during this transition period. Any such effects of the transition process, including unforeseen effects, could result in losses to the Fund.
(L) Indemnifications. Under the Trust’s organizational documents, its officers and trustees are indemnified against certain liabilities that may arise out of performance of their duties to the Trust. Additionally, in the normal course of business, the Fund enters into contracts with third-party service providers that contain a variety of representations and warranties and that may provide general indemnifications. The Fund's maximum exposure under these arrangements is unknown, as this would involve future claims that may be made against the Fund that have not yet occurred. The Manager believes that the risk of loss in connection with these potential indemnification obligations is remote. However, there can be no assurance that material liabilities related to such obligations will not arise in the future, which could adversely impact the Fund.
(M) Quantitative Disclosure of Derivative Holdings. The following tables show additional disclosures related to the Fund's derivative and hedging activities, including how such activities are
Notes to Financial Statements (continued)
accounted for and their effect on the Fund's financial positions, performance and cash flows.
The Fund entered into futures contracts to hedge against anticipated changes in interest rates that might otherwise have an adverse effect upon the value of the Fund's securities as well as help manage the duration and yield curve positioning of the portfolio. These derivatives are not accounted for as hedging instruments.
Fair value of derivative instruments as of October 31, 2023:
| Asset Derivatives | Interest
Rate
Contracts
Risk | Total |
| Futures Contracts - Net Assets—Net unrealized appreciation on futures contracts (a) | $294,353 | $294,353 |
| Total Fair Value | $294,353 | $294,353 |
| (a) | Includes cumulative appreciation (depreciation) of futures contracts as reported in the Portfolio of Investments. Only current day’s variation margin is reported within the Statement of Assets and Liabilities. |
| Liability Derivatives | Interest
Rate
Contracts
Risk | Total |
| Futures Contracts - Net Assets—Net unrealized depreciation on futures contracts (a) | $(221,072) | $(221,072) |
| Total Fair Value | $(221,072) | $(221,072) |
| (a) | Includes cumulative appreciation (depreciation) of futures contracts as reported in the Portfolio of Investments. Only current day’s variation margin is reported within the Statement of Assets and Liabilities. |
The effect of derivative instruments on the Statement of Operations for the year ended October 31, 2023:
| Net Realized Gain (Loss) from: | Interest
Rate
Contracts
Risk | Total |
| Futures Transactions | $(476,339) | $(476,339) |
| Total Net Realized Gain (Loss) | $(476,339) | $(476,339) |
| Net Change in Unrealized Appreciation (Depreciation) | Interest
Rate
Contracts
Risk | Total |
| Futures Contracts | $26,493 | $26,493 |
| Total Net Change in Unrealized Appreciation (Depreciation) | $26,493 | $26,493 |
| Average Notional Amount | Total |
| Futures Contracts Long | $ 29,890,917 |
| Futures Contracts Short | $(11,498,206) |
Note 3–Fees and Related Party Transactions
(A) Manager and Subadvisor. New York Life Investments, a registered investment adviser and an indirect, wholly-owned subsidiary of New York Life Insurance Company ("New York Life"), serves as the Fund's Manager pursuant to an Amended and Restated Management Agreement ("Management Agreement"). The Manager provides offices, conducts clerical, recordkeeping and bookkeeping services and keeps most of the financial and accounting records required to be maintained by the Fund. Except for the portion of salaries and expenses that are the responsibility of the Fund, the Manager pays the salaries and expenses of all personnel affiliated with the Fund and certain operational expenses of the Fund. The Fund reimburses New York Life Investments in an amount equal to the portion of the compensation of the Chief Compliance Officer attributable to the Fund. NYL Investors LLC ("NYL Investors" or ''Subadvisor''), a registered investment adviser and a direct, wholly-owned subsidiary of New York Life, serves as the Subadvisor to the Fund and is responsible for the day-to-day portfolio management of the Fund. Pursuant to the terms of a Subadvisory Agreement ("Subadvisory Agreement") between New York Life Investments and NYL Investors, New York Life Investments pays for the services of the Subadvisor.
Pursuant to the Management Agreement, the Fund pays the Manager a monthly fee for the services performed and the facilities furnished at an annual rate of the Fund’s average daily net assets as follows: 0.25% up to $1 billion and 0.20% in excess of $1 billion. During the year ended October 31, 2023, the effective management fee rate was 0.25% of the Fund’s average daily net assets, exclusive of any applicable waivers/reimbursements.
New York Life Investments has contractually agreed to waive fees and/or reimburse expenses so that Total Annual Fund Operating Expenses (excluding taxes, interest, litigation, extraordinary expenses, brokerage and other transaction expenses relating to the purchase or sale of portfolio investments and acquired (underlying) fund fees and expenses) do not exceed the following percentages of average daily net assets: Class A, 0.82%; Investor Class, 0.92%; Class I, 0.40% and SIMPLE Class, 1.17%. This agreement will remain in effect until February 28, 2024, and shall renew automatically for one-year terms unless New York Life Investments provides written notice of termination prior to the start of the next term or upon approval of the Board.
During the year ended October 31, 2023, New York Life Investments earned fees from the Fund in the amount of $353,110 and waived fees and/or reimbursed expenses in the amount of $76,274 and paid the Subadvisor fees of $142,406.
JPMorgan provides sub-administration and sub-accounting services to the Fund pursuant to an agreement with New York Life Investments. These services include calculating the daily NAVs of the Fund, maintaining the general ledger and sub-ledger accounts for the calculation of the Fund's NAVs, and assisting New York Life Investments in conducting various aspects of the Fund's administrative operations. For
| 30 | MainStay Short Term Bond Fund |
providing these services to the Fund, JPMorgan is compensated by New York Life Investments.
Pursuant to an agreement between the Trust and New York Life Investments, New York Life Investments is responsible for providing or procuring certain regulatory reporting services for the Fund. The Fund will reimburse New York Life Investments for the actual costs incurred by New York Life Investments in connection with providing or procuring these services for the Fund.
(B) Distribution and Service Fees. The Trust, on behalf of the Fund, has entered into a distribution agreement with NYLIFE Distributors LLC (the “Distributor”), an affiliate of New York Life Investments. The Fund has adopted distribution plans (the “Plans”) in accordance with the provisions of Rule 12b-1 under the 1940 Act.
Pursuant to the Class A and Investor Class Plans, the Distributor receives a monthly fee from the Class A and Investor Class shares at an annual rate of 0.25% of the average daily net assets of the Class A and Investor Class shares for distribution and/or service activities as designated by the Distributor. Pursuant to the SIMPLE Class Plan, SIMPLE Class shares pay the Distributor a monthly distribution fee at an annual rate of 0.25% of the average daily net assets of the SIMPLE Class shares, along with a service fee at an annual rate of 0.25% of the average daily net assets of the SIMPLE Class shares, for a total 12b-1 fee of 0.50%. Class I shares are not subject to a distribution and/or service fee.
The Plans provide that the distribution and service fees are payable to the Distributor regardless of the amounts actually expended by the Distributor for distribution of the Fund's shares and service activities.
(C) Sales Charges. The Fund was advised by the Distributor that the amount of initial sales charges retained on sales of Investor Class shares during the year ended October 31, 2023, was $88.
The Fund was also advised that the Distributor retained CDSCs on redemptions of Class A shares during the year ended October 31, 2023, of $4,171.
(D) Transfer, Dividend Disbursing and Shareholder Servicing Agent. NYLIM Service Company LLC, an affiliate of New York Life Investments, is the Fund's transfer, dividend disbursing and shareholder servicing agent pursuant to an agreement between NYLIM Service Company LLC and the Trust. NYLIM Service Company LLC has entered into an agreement with SS&C Global Investor & Distribution Solutions, Inc. ("SS&C"), pursuant to which SS&C performs certain transfer agent services on behalf of NYLIM Service Company LLC. New York Life Investments has contractually agreed to limit the transfer agency expenses charged to the Fund’s share classes to a maximum of 0.35% of that share class’s average daily net assets on an annual basis after deducting any applicable Fund or class-level expense reimbursement or small account fees. This agreement will remain in effect until February 28, 2024, and shall renew automatically for one-year terms unless New York Life Investments provides written notice of termination prior to the start of the next term or upon approval of the Board. During the year
ended October 31, 2023, transfer agent expenses incurred by the Fund and any reimbursements, pursuant to the aforementioned Transfer Agency expense limitation agreement, were as follows:
| Class | Expense | Waived |
| Class A | $53,044 | $— |
| Investor Class | 13,947 | — |
| Class I | 81,642 | — |
| SIMPLE Class | 72 | — |
(E) Small Account Fee. Shareholders with small accounts adversely impact the cost of providing transfer agency services. In an effort to reduce total transfer agency expenses, the Fund has implemented a small account fee on certain types of accounts. As described in the Fund's prospectus, certain shareholders with an account balance of less than $1,000 ($5,000 for Class A share accounts) are charged an annual per account fee of $20 (assessed semi-annually), the proceeds from which offset transfer agent fees as reflected in the Statement of Operations. This small account fee will not apply to certain types of accounts as described further in the Fund’s prospectus.
(F) Capital. As of October 31, 2023, New York Life and its affiliates beneficially held shares of the Fund with the values and percentages of net assets as follows:
Note 4-Federal Income Tax
As of October 31, 2023, the cost and unrealized appreciation (depreciation) of the Fund’s investment portfolio, including applicable derivative contracts and other financial instruments, as determined on a federal income tax basis, were as follows:
| | Federal Tax
Cost | Gross
Unrealized
Appreciation | Gross
Unrealized
(Depreciation) | Net
Unrealized
Appreciation/
(Depreciation) |
| Investments in Securities | $176,576,754 | $109,001 | $(2,045,708) | $(1,936,707) |
As of October 31, 2023, the components of accumulated gain (loss) on a tax basis were as follows:
Ordinary
Income | Accumulated
Capital
and Other
Gain (Loss) | Other
Temporary
Differences | Unrealized
Appreciation
(Depreciation) | Total
Accumulated
Gain (Loss) |
| $3,366 | $(6,541,364) | $(5,711) | $(1,926,930) | $(8,470,639) |
The difference between book-basis and tax-basis unrealized appreciation (depreciation) is primarily due to mark to market of futures contracts.
As of October 31, 2023, for federal income tax purposes, capital loss carryforwards of $6,531,586, as shown in the table below, were available to the extent provided by the regulations to offset future realized gains of
Notes to Financial Statements (continued)
the Fund. Accordingly, no capital gains distributions are expected to be paid to shareholders until net gains have been realized in excess of such amounts.
Capital Loss
Available Through | Short-Term
Capital Loss
Amounts (000’s) | Long-Term
Capital Loss
Amounts (000’s) |
| Unlimited | $2,263 | $4,269 |
During the years ended October 31, 2023 and October 31, 2022, the tax character of distributions paid as reflected in the Statements of Changes in Net Assets was as follows:
| | 2023 | 2022 |
| Distributions paid from: | | |
| Ordinary Income | $6,042,234 | $1,203,524 |
| Long-Term Capital Gains | — | 276,271 |
| Total | $6,042,234 | $1,479,795 |
Note 5–Custodian
JPMorgan is the custodian of cash and securities held by the Fund. Custodial fees are charged to the Fund based on the Fund's net assets and/or the market value of securities held by the Fund and the number of certain transactions incurred by the Fund.
Note 6–Line of Credit
The Fund and certain other funds managed by New York Life Investments maintain a line of credit with a syndicate of banks in order to secure a source of funds for temporary purposes to meet unanticipated or excessive redemption requests.
Effective July 25, 2023, under the credit agreement (the “Credit Agreement”), the aggregate commitment amount is $600,000,000 with an additional uncommitted amount of $100,000,000. The commitment fee is an annual rate of 0.15% of the average commitment amount payable quarterly, regardless of usage, to JPMorgan, who serves as the agent to the syndicate. The commitment fee is allocated among the Fund and certain other funds managed by New York Life Investments based upon their respective net assets and other factors. Interest on any revolving credit loan is charged based upon the Federal Funds Rate, Daily Simple Secured Overnight Financing Rate ("SOFR") + 0.10%, or the Overnight Bank Funding Rate, whichever is higher. The Credit Agreement expires on July 23, 2024, although the Fund, certain other funds managed by New York Life Investments and the syndicate of banks may renew the Credit Agreement for an additional year on the same or different terms or enter into a credit agreement with a different syndicate of banks. Prior to July 25, 2023, the aggregate commitment amount and the commitment fee were the same as those under the current Credit Agreement. During the year ended October 31, 2023, there were no borrowings made or outstanding with respect to the Fund under the Credit Agreement.
Note 7–Interfund Lending Program
Pursuant to an exemptive order issued by the SEC, the Fund, along with certain other funds managed by New York Life Investments, may participate in an interfund lending program. The interfund lending program provides an alternative credit facility that permits the Fund and certain other funds managed by New York Life Investments to lend or borrow money for temporary purposes directly to or from one another, subject to the conditions of the exemptive order. During the year ended October 31, 2023, there were no interfund loans made or outstanding with respect to the Fund.
Note 8–Purchases and Sales of Securities (in 000’s)
During the year ended October 31, 2023, purchases and sales of U.S. government securities were $525,134 and $511,474, respectively. Purchases and sales of securities, other than U.S. government securities and short-term securities, were $129,439 and $80,225, respectively.
Note 9–Capital Share Transactions
Transactions in capital shares for the years ended October 31, 2023 and October 31, 2022, were as follows:
| Class A | Shares | Amount |
| Year ended October 31, 2023: | | |
| Shares sold | 3,939,187 | $ 35,697,507 |
| Shares issued to shareholders in reinvestment of distributions | 229,448 | 2,076,463 |
| Shares redeemed | (4,130,887) | (37,468,141) |
| Net increase (decrease) in shares outstanding before conversion | 37,748 | 305,829 |
| Shares converted into Class A (See Note 1) | 16,580 | 150,532 |
| Net increase (decrease) | 54,328 | $ 456,361 |
| Year ended October 31, 2022: | | |
| Shares sold | 3,689,130 | $ 34,875,937 |
| Shares issued to shareholders in reinvestment of distributions | 102,112 | 953,061 |
| Shares redeemed | (3,903,521) | (36,945,586) |
| Net increase (decrease) in shares outstanding before conversion | (112,279) | (1,116,588) |
| Shares converted into Class A (See Note 1) | 21,538 | 200,420 |
| Net increase (decrease) | (90,741) | $ (916,168) |
| |
| 32 | MainStay Short Term Bond Fund |
| Investor Class | Shares | Amount |
| Year ended October 31, 2023: | | |
| Shares sold | 35,097 | $ 320,914 |
| Shares issued to shareholders in reinvestment of distributions | 8,804 | 80,253 |
| Shares redeemed | (56,997) | (521,066) |
| Net increase (decrease) in shares outstanding before conversion | (13,096) | (119,899) |
| Shares converted from Investor Class (See Note 1) | (16,468) | (150,532) |
| Net increase (decrease) | (29,564) | $ (270,431) |
| Year ended October 31, 2022: | | |
| Shares sold | 45,619 | $ 432,794 |
| Shares issued to shareholders in reinvestment of distributions | 4,154 | 39,036 |
| Shares redeemed | (81,996) | (788,606) |
| Net increase (decrease) in shares outstanding before conversion | (32,223) | (316,776) |
| Shares converted from Investor Class (See Note 1) | (21,390) | (200,420) |
| Net increase (decrease) | (53,613) | $ (517,196) |
| |
| Class I | Shares | Amount |
| Year ended October 31, 2023: | | |
| Shares sold | 13,917,702 | $126,956,359 |
| Shares issued to shareholders in reinvestment of distributions | 423,006 | 3,824,087 |
| Shares redeemed | (4,676,682) | (42,471,634) |
| Net increase (decrease) | 9,664,026 | $ 88,308,812 |
| Year ended October 31, 2022: | | |
| Shares sold | 2,731,378 | $ 24,980,514 |
| Shares issued to shareholders in reinvestment of distributions | 38,073 | 354,850 |
| Shares redeemed | (3,771,982) | (36,389,902) |
| Net increase (decrease) | (1,002,531) | $ (11,054,538) |
| |
| SIMPLE Class | Shares | Amount |
| Year ended October 31, 2023: | | |
| Shares sold | 1,204 | $ 10,988 |
| Shares issued to shareholders in reinvestment of distributions | 153 | 1,393 |
| Shares redeemed | (2) | (20) |
| Net increase (decrease) | 1,355 | $ 12,361 |
| Year ended October 31, 2022: | | |
| Shares sold | 993 | $ 9,281 |
| Shares issued to shareholders in reinvestment of distributions | 40 | 375 |
| Net increase (decrease) | 1,033 | $ 9,656 |
Note 10–Other Matters
As of the date of this report, the Fund faces a heightened level of risk associated with current uncertainty, volatility and state of economies, financial markets, rising interest rates, and labor and health conditions
around the world. Events such as war, acts of terrorism, recessions, rapid inflation, the imposition of international sanctions, earthquakes, hurricanes, epidemics and pandemics and other unforeseen natural or human disasters may have broad adverse social, political and economic effects on the global economy, which could negatively impact the value of the Fund's investments. Developments that disrupt global economies and financial markets may magnify factors that affect the Fund's performance.
Note 11–Subsequent Events
In connection with the preparation of the financial statements of the Fund as of and for the year ended October 31, 2023, events and transactions subsequent to October 31, 2023, through the date the financial statements were issued, have been evaluated by the Manager for possible adjustment and/or disclosure. No subsequent events requiring financial statement adjustment or disclosure have been identified.
Report of Independent Registered Public Accounting Firm
To the Shareholders of the Fund and Board of Trustees
MainStay Funds Trust:
Opinion on the Financial Statements
We have audited the accompanying statement of assets and liabilities of MainStay Short Term Bond Fund (the Fund), including the portfolio of investments, one of the funds constituting MainStay Funds Trust, as of October 31, 2023, the related statement of operations for the year then ended, the statements of changes in net assets for each of the years in the two-year period then ended, and the related notes (collectively, the financial statements) and the financial highlights for each of the years or periods in the five-year period then ended. In our opinion, the financial statements and financial highlights present fairly, in all material respects, the financial position of the Fund as of October 31, 2023, the results of its operations for the year then ended, the changes in its net assets for each of the years in the two-year period then ended, and the financial highlights for each of the years or periods in the five-year period then ended, in conformity with U.S. generally accepted accounting principles.
Basis for Opinion
These financial statements and financial highlights are the responsibility of the Fund's management. Our responsibility is to express an opinion on these financial statements and financial highlights based on our audits. We are a public accounting firm registered with the Public Company Accounting Oversight Board (United States) (PCAOB) and are required to be independent with respect to the Fund in accordance with the U.S. federal securities laws and the applicable rules and regulations of the Securities and Exchange Commission and the PCAOB.
We conducted our audits in accordance with the standards of the PCAOB. Those standards require that we plan and perform the audit to obtain reasonable assurance about whether the financial statements and financial highlights are free of material misstatement, whether due to error or fraud. Our audits included performing procedures to assess the risks of material misstatement of the financial statements and financial highlights, whether due to error or fraud, and performing procedures that respond to those risks. Such procedures included examining, on a test basis, evidence regarding the amounts and disclosures in the financial statements and financial highlights. Such procedures also included confirmation of securities owned as of October 31, 2023, by correspondence with the custodians and brokers; when replies were not received from brokers, we performed other auditing procedures. Our audits also included evaluating the accounting principles used and significant estimates made by management, as well as evaluating the overall presentation of the financial statements and financial highlights. We believe that our audits provide a reasonable basis for our opinion.

We have served as the auditor of one or more New York Life Investment Management investment companies since 2003.
Philadelphia, Pennsylvania
December 22, 2023
| 34 | MainStay Short Term Bond Fund |
Federal Income Tax Information
(Unaudited)
The Fund is required under the Internal Revenue Code to advise shareholders in a written statement as to the federal tax status of dividends paid by the Fund during such fiscal years.
For the fiscal year ended October 31, 2023, the Fund designated approximately $83,456 under the Internal Revenue Code as qualified dividend income eligible for reduced tax rates.
The dividends paid by the Fund during the fiscal year ended October 31, 2023 should be multiplied by 1.38% to arrive at the amount eligible for the corporate dividend-received deduction.
In February 2024, shareholders will receive an IRS Form 1099-DIV or substitute Form 1099, which will show the federal tax status of the distributions received by shareholders in calendar year 2023. The amounts that will be reported on such 1099-DIV or substitute Form 1099 will be the amounts you are to use on your federal income tax return and will differ from the amounts which we must report for the Fund's fiscal year ended October 31, 2023.
Proxy Voting Policies and Procedures and Proxy Voting Record
The Fund is required to file with the SEC its proxy voting record for the 12-month period ending June 30 on Form N-PX. A description of the policies and procedures that are used to vote proxies relating to portfolio securities of the Fund is available free of charge upon request by calling 800-624-6782 or visiting the SEC’s website at www.sec.gov. The most recent Form N-PX or proxy voting record is available free of charge upon request by calling 800-624-6782; visiting newyorklifeinvestments.com; or visiting the SEC’s website at www.sec.gov.
Shareholder Reports and Quarterly Portfolio Disclosure
The Fund is required to file its complete schedule of portfolio holdings with the SEC 60 days after its first and third fiscal quarter on Form N-PORT. The Fund's holdings report is available free of charge upon request by calling New York Life Investments at 800-624-6782.
Board of Trustees and Officers (Unaudited)
The Trustees and officers of the Fund are listed below. The Board oversees the MainStay Group of Funds (which consists of MainStay Funds and MainStay Funds Trust), MainStay VP Funds Trust, MainStay MacKay DefinedTerm Municipal Opportunities Fund, MainStay CBRE Global Infrastructure Megatrends Term Fund, the Manager and the Subadvisors, and elects the officers of the Funds who are responsible for the day-to-day operations of the Fund. Information pertaining to the Trustees and officers is set forth below. Each Trustee serves until his or her successor is elected and qualified or until his or her resignation, death or
removal. Under the Board’s retirement policy, unless an exception is made, a Trustee must tender his or her resignation by the end of the calendar year during which he or she reaches the age of 75. Officers are elected annually by the Board. The business address of each Trustee and officer listed below is 51 Madison Avenue, New York, New York 10010. A majority of the Trustees are not “interested persons” (as defined by the 1940 Act and rules adopted by the SEC thereunder) of the Fund (“Independent Trustees”).
| | Name and
Year of Birth | Term of Office,
Position(s) Held and
Length of Service | Principal Occupation(s)
During Past Five Years | Number of
Portfolios in
Fund Complex
Overseen by
Trustee | Other Directorships
Held by Trustee |
| | | | | | |
| | Naïm Abou-Jaoudé*
1966 | MainStay Funds: Trustee
since 2023
MainStay Funds Trust:
Trustee since 2023 | Chief Executive Officer of New York Life Investment Management LLC (since 2023). Chief Executive Officer of Candriam (an affiliate of New York Life Investment Management LLC) (2007 to 2023). | 81 | MainStay VP Funds Trust:
Trustee since 2023 (31 portfolios);
MainStay MacKay DefinedTerm Municipal Opportunities Fund: Trustee
since 2023;
MainStay CBRE Global Infrastructure Megatrends Term Fund: Trustee
since 2023; and
New York Life Investment Management International (Chair) since 2015 |
| * | This Trustee is considered to be an “interested person” of the MainStay Group of Funds, MainStay VP Funds Trust, MainStay CBRE Global Infrastructure Megatrends Term Fund and MainStay MacKay DefinedTerm Municipal Opportunities Fund, within the meaning of the 1940 Act because of his affiliation with New York Life Investment Management LLC and Candriam, as described in detail above in the column entitled “Principal Occupation(s) During Past Five Years.” |
| | |
| 36 | MainStay Short Term Bond Fund |
| | Name and
Year of Birth | Term of Office,
Position(s) Held and
Length of Service | Principal Occupation(s)
During Past Five Years | Number of
Portfolios in
Fund Complex
Overseen by
Trustee | Other Directorships
Held by Trustee |
| | | | | | |
| | David H. Chow
1957 | MainStay Funds: Trustee since January 2016, Advisory Board Member (June 2015 to December 2015);MainStay Funds Trust:
Trustee since January 2016, Advisory Board Member (June 2015 to December 2015) | Founder and CEO, DanCourt Management, LLC (since 1999) | 81 | MainStay VP Funds Trust: Trustee since January 2016, Advisory Board Member (June 2015 to December 2015) (31 portfolios);
MainStay MacKay DefinedTerm Municipal Opportunities Fund: Trustee since January 2016, Advisory Board Member (June 2015 to December 2015);
MainStay CBRE Global Infrastructure Megatrends Term Fund: Trustee since 2021;
VanEck Vectors Group of Exchange-Traded Funds: Trustee since 2006 and Independent Chairman of the Board of Trustees from 2008 to 2022 (57 portfolios); and
Berea College of Kentucky: Trustee since 2009, Chair of the Investment Committee since 2018 |
| | Karen Hammond
1956 | MainStay Funds: Trustee since December 2021, Advisory Board Member (June 2021 to December 2021);MainStay Funds Trust:
Trustee since December 2021, Advisory Board Member (June 2021 to December 2021)
| Retired, Managing Director, Devonshire Investors (2007 to 2013); Senior Vice President, Fidelity Management & Research Co. (2005 to 2007); Senior Vice President and Corporate Treasurer, FMR Corp. (2003 to 2005); Chief Operating Officer, Fidelity Investments Japan (2001 to 2003) | 81 | MainStay VP Funds Trust: Trustee since December 2021, Advisory Board Member (June 2021 to December 2021) (31 portfolios);
MainStay MacKay DefinedTerm Municipal Opportunities Fund: Trustee since December 2021, Advisory Board Member (June 2021 to December 2021);
MainStay CBRE Global Infrastructure Megatrends Term Fund: Trustee since December 2021, Advisory Board Member (June 2021 to December 2021);
Two Harbors Investment Corp.: Director since 2018;
Rhode Island State Investment Commission: Member since 2017; and
Blue Cross Blue Shield of Rhode Island: Director since 2019 |
| | Susan B. Kerley
1951 | MainStay Funds: Chair since January 2017 and Trustee since 2007;MainStay Funds Trust:
Chair since January 2017 and Trustee since 1990*** | President, Strategic Management Advisors LLC (since 1990) | 81 | MainStay VP Funds Trust: Chair since January 2017 and Trustee since 2007 (31 portfolios)**;
MainStay MacKay DefinedTerm Municipal Opportunities Fund: Chair since January 2017 and Trustee since 2011;
MainStay CBRE Global Infrastructure Megatrends Term Fund: Trustee since June 2021; and
Legg Mason Partners Funds: Trustee since 1991 (45 portfolios) |
Board of Trustees and Officers (Unaudited) (continued)
| | Name and
Year of Birth | Term of Office,
Position(s) Held and
Length of Service | Principal Occupation(s)
During Past Five Years | Number of
Portfolios in
Fund Complex
Overseen by
Trustee | Other Directorships
Held by Trustee |
| | | | | | |
| | Alan R. Latshaw
1951 | MainStay Funds: Trusteesince 2006;MainStay Funds Trust:
Trustee since 2007*** | Retired; Partner, Ernst & Young LLP (2002 to 2003); Partner, Arthur Andersen LLP (1989 to 2002); Consultant to the MainStay Funds Audit and Compliance Committee (2004 to 2006) | 81 | MainStay VP Funds Trust: Trustee since 2007 (31 portfolios)**;
MainStay MacKay DefinedTerm Municipal Opportunities Fund: Trustee since 2011; and
MainStay CBRE Global Infrastructure Megatrends Term Fund: Trustee since June 2021 |
| | Jacques P. Perold
1958 | MainStay Funds: Trustee since January 2016, Advisory Board Member (June 2015to December 2015);MainStay Funds Trust:
Trustee since January 2016, Advisory Board Member (June 2015 to December 2015) | Founder and Chief Executive Officer, CapShift Advisors LLC (since 2018); President, Fidelity Management & Research Company (2009 to 2014); President and Chief Investment Officer, Geode Capital Management, LLC (2001 to 2009) | 81 | MainStay VP Funds Trust: Trustee since January 2016, Advisory Board Member (June 2015 to December 2015) (31 portfolios);
MainStay MacKay DefinedTerm Municipal Opportunities Fund: Trustee since January 2016, Advisory Board Member (June 2015 to December 2015);
MainStay CBRE Global Infrastructure Megatrends Term Fund: Trustee since June 2021;
Allstate Corporation: Director since 2015; and
MSCI Inc.: Director since 2017 |
| | Richard S. Trutanic
1952 | MainStay Funds: Trustee since 1994;MainStay Funds Trust:
Trustee since 2007*** | Chairman and Chief Executive Officer, Somerset & Company (financial advisory firm) (since 2004); Managing Director, The Carlyle Group (private investment firm) (2002 to 2004); Senior Managing Director, Partner and Board Member, Groupe Arnault S.A. (private investment firm) (1999 to 2002) | 81 | MainStay VP Funds Trust: Trustee since 2007 (31 portfolios)**;
MainStay MacKay DefinedTerm Municipal Opportunities Fund: Trustee since 2011; and
MainStay CBRE Global Infrastructure Megatrends Term Fund: Trustee since June 2021 |
| ** | Includes prior service as a Director of MainStay VP Series Fund, Inc., the predecessor to MainStay VP Funds Trust. |
| *** | Includes prior service as a Director/Trustee of certain predecessor entities to MainStay Funds Trust. |
| 38 | MainStay Short Term Bond Fund |
| | Name and
Year of Birth | Position(s) Held and
Length of Service | Principal Occupation(s)
During Past Five Years | |
| | | | | |
| | Kirk C. Lehneis
1974 | President, MainStay Funds, MainStay Funds Trust (since 2017) | Chief Operating Officer and Senior Managing Director (since 2016), New York Life Investment Management LLC and New York Life Investment Management Holdings LLC; Member of the Board of Managers (since 2017) and Senior Managing Director (since 2018), NYLIFE Distributors LLC; Chairman of the Board and Senior Managing Director, NYLIM Service Company LLC (since 2017); Trustee, President and Principal Executive Officer of IndexIQ Trust, IndexIQ ETF Trust and IndexIQ Active ETF Trust (since 2018); President, MainStay CBRE Global Infrastructure Megatrends Term Fund (since 2021), MainStay MacKay DefinedTerm Municipal Opportunities Fund and MainStay VP Funds Trust (since 2017)**; Senior Managing Director, Global Product Development (2015 to 2016); Managing Director, Product Development (2010 to 2015), New York Life Investment Management LLC | |
| | Jack R. Benintende
1964 | Treasurer and Principal Financial and Accounting Officer, MainStay Funds (since 2007), MainStay Funds Trust (since 2009) | Managing Director, New York Life Investment Management LLC (since 2007); Treasurer and Principal Financial and Accounting Officer, MainStay CBRE Global Infrastructure Megatrends Term Fund (since 2021), MainStay MacKay DefinedTerm Municipal Opportunities Fund (since 2011) and MainStay VP Funds Trust (since 2007)**; and Assistant Treasurer, New York Life Investment Management Holdings LLC (2008 to 2012) | |
| | J. Kevin Gao
1967 | Secretary and Chief Legal Officer, MainStay Funds and MainStay Funds Trust (since 2010) | Managing Director and Associate General Counsel, New York Life Investment Management LLC (since 2010); Secretary and Chief Legal Officer, MainStay CBRE Global Infrastructure Megatrends Term Fund (since 2021), MainStay MacKay DefinedTerm Municipal Opportunities Fund (since 2011) and MainStay VP Funds Trust (since 2010)** | |
| | Kevin M. Gleason
1967 | Vice President and Chief Compliance Officer, MainStay Funds and MainStay Funds Trust (since June 2022) | Vice President and Chief Compliance Officer, IndexIQ Trust, IndexIQ ETF Trust and Index IQ Active ETF Trust (since June 2022); Vice President and Chief Compliance Officer, MainStay CBRE Global Infrastructure Megatrends Term Fund, MainStay VP Funds Trust and MainStay MacKay DefinedTerm Municipal Opportunities Fund (since June 2022); Senior Vice President, Voya Investment Management and Chief Compliance Officer, Voya Family of Funds (2012 to 2022) | |
| | Scott T. Harrington
1959 | Vice President— Administration, MainStay Funds (since 2005), MainStay Funds Trust (since 2009) | Managing Director, New York Life Investment Management LLC (including predecessor advisory organizations) (since 2000); Member of the Board of Directors, New York Life Trust Company (since 2009); Vice President—Administration, MainStay CBRE Global Infrastructure Megatrends Term Fund (since 2021), MainStay MacKay DefinedTerm Municipal Opportunities Fund (since 2011) and MainStay VP Funds Trust (since 2005)** | |
| * | The officers listed above are considered to be “interested persons” of the MainStay Group of Funds, MainStay VP Funds Trust, MainStay CBRE Global Infrastructure Megatrends Term Fund and MainStay MacKay DefinedTerm Municipal Opportunities Fund within the meaning of the 1940 Act because of their affiliation with the MainStay Group of Funds, New York Life Insurance Company and/or its affiliates, including New York Life Investment Management LLC, New York Life Insurance Company, NYLIM Service Company LLC, NYLIFE Securities LLC and/or NYLIFE Distributors LLC, as described in detail in the column captioned “Principal Occupation(s) During Past Five Years.” Officers are elected annually by the Board. |
| ** | Includes prior service as an Officer of MainStay VP Series Fund, Inc., the predecessor to MainStay VP Funds Trust. |
Officers of the Trust (Who are not Trustees)*
This page intentionally left blank.
This page intentionally left blank.
This page intentionally left blank.
Equity
U.S. Equity
MainStay Epoch U.S. Equity Yield Fund
MainStay Fiera SMID Growth Fund
MainStay PineStone U.S. Equity Fund
MainStay S&P 500 Index Fund
MainStay Winslow Large Cap Growth Fund
MainStay WMC Enduring Capital Fund
MainStay WMC Growth Fund
MainStay WMC Small Companies Fund
MainStay WMC Value Fund
International Equity
MainStay Epoch International Choice Fund
MainStay PineStone International Equity Fund
MainStay WMC International Research Equity Fund
Emerging Markets Equity
MainStay Candriam Emerging Markets Equity Fund
Global Equity
MainStay Epoch Capital Growth Fund
MainStay Epoch Global Equity Yield Fund
MainStay PineStone Global Equity Fund
Fixed Income
Taxable Income
MainStay Candriam Emerging Markets Debt Fund
MainStay Floating Rate Fund
MainStay MacKay High Yield Corporate Bond Fund
MainStay MacKay Short Duration High Yield Fund
MainStay MacKay Strategic Bond Fund
MainStay MacKay Total Return Bond Fund
MainStay MacKay U.S. Infrastructure Bond Fund
MainStay Short Term Bond Fund
Tax-Exempt Income
MainStay MacKay California Tax Free Opportunities Fund1
MainStay MacKay High Yield Municipal Bond Fund
MainStay MacKay New York Tax Free Opportunities Fund2
MainStay MacKay Short Term Municipal Fund
MainStay MacKay Strategic Municipal Allocation Fund
MainStay MacKay Tax Free Bond Fund
Money Market
MainStay Money Market Fund
Mixed Asset
MainStay Balanced Fund
MainStay Income Builder Fund
MainStay MacKay Convertible Fund
Speciality
MainStay CBRE Global Infrastructure Fund
MainStay CBRE Real Estate Fund
MainStay Cushing MLP Premier Fund
Asset Allocation
MainStay Conservative Allocation Fund
MainStay Conservative ETF Allocation Fund
MainStay Defensive ETF Allocation Fund
MainStay Equity Allocation Fund
MainStay Equity ETF Allocation Fund
MainStay ESG Multi-Asset Allocation Fund
MainStay Growth Allocation Fund
MainStay Growth ETF Allocation Fund
MainStay Moderate Allocation Fund
MainStay Moderate ETF Allocation Fund
Manager
New York Life Investment Management LLC
New York, New York
Subadvisors
Candriam3
Strassen, Luxembourg
CBRE Investment Management Listed Real Assets LLC
Radnor, Pennsylvania
Cushing Asset Management, LP
Dallas, Texas
Epoch Investment Partners, Inc.
New York, New York
Fiera Capital Inc.
New York, New York
IndexIQ Advisors LLC3
New York, New York
MacKay Shields LLC3
New York, New York
NYL Investors LLC3
New York, New York
PineStone Asset Management Inc.
Montreal, Québec
Wellington Management Company LLP
Boston, Massachusetts
Winslow Capital Management, LLC
Minneapolis, Minnesota
Legal Counsel
Dechert LLP
Washington, District of Columbia
Independent Registered Public Accounting Firm
KPMG LLP
Philadelphia, Pennsylvania
Distributor
NYLIFE Distributors LLC3
Jersey City, New Jersey
Custodian
JPMorgan Chase Bank, N.A.
New York, New York
1.
This Fund is registered for sale in AZ, CA, NV, OR, TX, UT, WA and MI (Class A and Class I shares only), and CO, FL, GA, HI, ID, MA, MD, NH, NJ and NY (Class I shares only).
| 2. | This Fund is registered for sale in CA, CT, DE, FL, MA, NJ, NY and VT. |
| 3. | An affiliate of New York Life Investment Management LLC. |
Not part of the Annual Report
For more information
800-624-6782
newyorklifeinvestments.com
“New York Life Investments” is both a service mark, and the common trade name, of certain investment advisors affiliated with New York Life Insurance Company. The MainStay Funds® are managed by New York Life Investment Management LLC and distributed by NYLIFE Distributors LLC, 30 Hudson Street, Jersey City, NJ 07302, a wholly owned subsidiary of New York Life Insurance Company. NYLIFE Distributors LLC is a Member FINRA/SIPC.
©2023 NYLIFE Distributors LLC. All rights reserved.
| 5013897MS139-23 | MSSTB11-12/23 |
(NYLIM) NL228
MainStay U.S. Government Liquidity Fund
Annual Report
October 31, 2023
Special Notice:
Beginning in July 2024, new regulations issued by the Securities and Exchange Commission (SEC) will take effect requiring open-end mutual fund companies and ETFs to (1) overhaul the content of their shareholder reports and (2) mail paper copies of the new tailored shareholder reports to shareholders who have not opted to receive these documents electronically.
If you have not yet elected to receive your shareholder reports electronically, please contact your financial intermediary or visit newyorklifeinvestments.com/accounts.
| Not FDIC/NCUA Insured | Not a Deposit | May Lose Value | No Bank Guarantee | Not Insured by Any Government Agency |
This page intentionally left blank
Investors should refer to the Fund’s Summary Prospectus and/or Prospectus and consider the Fund’s investment objectives, strategies, risks, charges and expenses carefully before investing. The Summary Prospectus and/or Prospectus contain this and other information about the Fund. You may obtain copies of the Fund’s Summary Prospectus, Prospectus and Statement of Additional Information, which includes information about the MainStay Funds Trust's Trustees, free of charge, upon request, by calling toll-free 800-624-6782, by writing to NYLIFE Distributors LLC, Attn: MainStay Marketing Department, 30 Hudson Street, Jersey City, NJ 07302 or by sending an e-mail to MainStayShareholderServices@nylim.com. These documents are also available via the MainStay Funds’ website at newyorklifeinvestments.com. Please read the Fund’s Summary Prospectus and/or Prospectus carefully before investing.
Cost in Dollars of a $1,000 Investment in MainStay U.S. Government Liquidity Fund (Unaudited)
The example below is intended to describe the fees and expenses borne by shareholders during the six-month period from May 1, 2023 to October 31, 2023, and the impact of those costs on your investment.
Example
As a shareholder of the Fund you incur two types of costs: (1) transaction costs, including exchange fees and sales charges (loads) on purchases (as applicable), and (2) ongoing costs, including management fees, distribution and/or service (12b-1) fees and other Fund expenses (as applicable). This example is intended to help you understand your ongoing costs (in dollars) of investing in the Fund and to compare these costs with the ongoing costs of investing in other mutual funds. The example is based on an investment of $1,000 made at the beginning of the six-month period and held for the entire period from May 1, 2023 to October 31, 2023.
This example illustrates your Fund’s ongoing costs in two ways:
Actual Expenses
The second and third data columns in the table below provide information about actual account values and actual expenses. You may use the information in these columns, together with the amount you invested, to estimate the expenses that you paid during the six months ended October 31, 2023. Simply divide your account value by $1,000 (for example, an $8,600 account value divided by $1,000 = 8.6), then
multiply the result by the number under the heading entitled “Expenses Paid During Period” to estimate the expenses you paid on your account during this period.
Hypothetical Example for Comparison Purposes
The fourth and fifth data columns in the table below provide information about hypothetical account values and hypothetical expenses based on the Fund’s actual expense ratio and an assumed rate of return of 5% per year before expenses, which is not the Fund’s actual return. The hypothetical account values and expenses may not be used to estimate the actual ending account balances or expenses you paid for the six-month period shown. You may use this information to compare the ongoing costs of investing in the Fund with the ongoing costs of investing in other mutual funds. To do so, compare this 5% hypothetical example with the 5% hypothetical examples that appear in the shareholder reports of the other mutual funds.
Please note that the expenses shown in the table are meant to highlight your ongoing costs only and do not reflect any transactional costs, such as exchange fees or sales charges (loads). Therefore, the fourth and fifth data columns of the table are useful in comparing ongoing costs only and will not help you determine the relative total costs of owning different funds. In addition, if these transactional costs were included, your costs would have been higher.
| Share Class | Beginning
Account
Value
5/1/23 | Ending Account
Value (Based
on Actual
Returns and
Expenses)
10/31/23 | Expenses
Paid
During
Period1 | Ending Account
Value (Based
on Hypothetical
5% Annualized
Return and
Actual Expenses)
10/31/23 | Expenses
Paid
During
Period1 | Net Expense
Ratio
During
Period2 |
| Class I Shares | $1,000.00 | $1,025.70 | $0.71 | $1,024.50 | $0.71 | 0.14% |
| 1. | Expenses are equal to the Fund’s annualized expense ratio of each class multiplied by the average account value over the period, divided by 365 and multiplied by 184 (to reflect the six-month period). The table above represents the actual expenses incurred during the six-month period. In addition to the fees and expenses which the Fund bears directly, it also indirectly bears a pro rata share of the fees and expenses of the underlying funds in which it invests. Such indirect expenses are not included in the above-reported expense figures. |
| 2. | Expenses are equal to the Fund's annualized expense ratio to reflect the six-month period. |
| 4 | MainStay U.S. Government Liquidity Fund |
Portfolio Composition as of October 31, 2023 (Unaudited)
| Other Assets, Less Liabilities | 0.0‡ |
| ‡ | Less than one-tenth of a percent. |
See Portfolio of Investments beginning on page 6 for specific holdings within these categories. The Fund's holdings are subject to change.
Portfolio of Investments October 31, 2023†^
| | Principal
Amount | | Value |
| Short-Term Investments 100.0% |
| U.S. Treasury Debt 100.0% |
| U.S. Treasury Bills (a) | | | |
| 5.312%, due 11/14/23 | $ 342,050,000 | | $ 341,396,524 |
| 5.335%, due 11/7/23 | 373,500,000 | | 373,169,270 |
| 5.351%, due 11/16/23 | 74,213,000 | | 74,048,435 |
| 5.356%, due 12/19/23 | 105,167,000 | | 104,422,207 |
| 5.365%, due 12/12/23 | 116,000,000 | | 115,297,103 |
Total Short-Term Investments
(Cost $1,008,333,539) | 100.0% | | 1,008,333,539 |
| Other Assets, Less Liabilities | 0.0‡ | | 488,037 |
| Net Assets | 100.0% | | $ 1,008,821,576 |
| † | Percentages indicated are based on Fund net assets. |
| ^ | Industry classifications may be different than those used for compliance monitoring purposes. |
| ‡ | Less than one-tenth of a percent. |
| (a) | Interest rate shown represents yield to maturity. |
The following is a summary of the fair valuations according to the inputs used as of October 31, 2023, for valuing the Fund’s assets:
| Description | Quoted
Prices in
Active
Markets for
Identical
Assets
(Level 1) | | Significant
Other
Observable
Inputs
(Level 2) | | Significant
Unobservable
Inputs
(Level 3) | | Total |
| Asset Valuation Inputs | | | | | | | |
| Investments in Securities (a) | | | | | | | |
| Short-Term Investments | | | | | | | |
| U.S. Treasury Debt | $ — | | $ 1,008,333,539 | | $ — | | $ 1,008,333,539 |
| (a) | For a complete listing of investments and their industries, see the Portfolio of Investments. |
The notes to the financial statements are an integral part of, and should be read in conjunction with, the financial statements.
| 6 | MainStay U.S. Government Liquidity Fund |
Statement of Assets and Liabilities as of October 31, 2023
| Assets |
Investment in securities, at value
(amortized cost $1,008,333,539) | $1,008,333,539 |
| Cash | 639,362 |
| Other assets | 2,672 |
| Total assets | 1,008,975,573 |
| Liabilities |
| Payables: | |
| Manager (See Note 3) | 108,184 |
| Professional fees | 23,496 |
| Custodian | 7,207 |
| Shareholder communication | 1,954 |
| Accrued expenses | 13,156 |
| Total liabilities | 153,997 |
| Net assets | $1,008,821,576 |
| Composition of Net Assets |
| Shares of beneficial interest outstanding (par value of $.001 per share) unlimited number of shares authorized | $ 1,008,750 |
| Additional paid-in-capital | 1,007,839,771 |
| | 1,008,848,521 |
| Total distributable earnings (loss) | (26,945) |
| Net assets | $1,008,821,576 |
| Class I | |
| Net assets applicable to outstanding shares | $1,008,821,576 |
| Shares of beneficial interest outstanding | 1,008,750,430 |
| Net asset value per share outstanding | $ 1.00 |
The notes to the financial statements are an integral part of, and should be read in conjunction with, the financial statements.
7
Statement of Operations for the year ended October 31, 2023
| Investment Income (Loss) |
| Income | |
| Interest | $53,033,997 |
| Expenses | |
| Manager (See Note 3) | 1,379,174 |
| Professional fees | 131,505 |
| Custodian | 41,712 |
| Trustees | 30,396 |
| Registration | 7,795 |
| Shareholder communication | 658 |
| Miscellaneous | 13,930 |
| Total expenses | 1,605,170 |
| Net investment income (loss) | 51,428,827 |
| Realized Gain (Loss) |
| Net realized gain (loss) on investments | (16,485) |
| Net increase (decrease) in net assets resulting from operations | $51,412,342 |
The notes to the financial statements are an integral part of, and should be read in conjunction with, the financial statements.
| 8 | MainStay U.S. Government Liquidity Fund |
Statements of Changes in Net Assets
for the years ended October 31, 2023 and October 31, 2022
| | 2023 | 2022 |
| Increase (Decrease) in Net Assets |
| Operations: | | |
| Net investment income (loss) | $ 51,428,827 | $ 9,334,714 |
| Net realized gain (loss) | (16,485) | (65,853) |
| Net increase (decrease) in net assets resulting from operations | 51,412,342 | 9,268,861 |
| Distributions to shareholders | (51,428,827) | (9,334,713) |
| Capital share transactions: | | |
| Net proceeds from sales of shares | 10,295,597,780 | 13,330,125,923 |
| Net asset value of shares issued to shareholders in reinvestment of distributions | 50,676,607 | 9,256,470 |
| Cost of shares redeemed | (10,673,093,594) | (14,523,717,926) |
| Increase (decrease) in net assets derived from capital share transactions | (326,819,207) | (1,184,335,533) |
| Net increase (decrease) in net assets | (326,835,692) | (1,184,401,385) |
| Net Assets |
| Beginning of year | 1,335,657,268 | 2,520,058,653 |
| End of year | $ 1,008,821,576 | $ 1,335,657,268 |
The notes to the financial statements are an integral part of, and should be read in conjunction with, the financial statements.
9
Financial Highlights selected per share data and ratios
| | Year Ended October 31, |
| Class I | 2023 | | 2022 | | 2021 | | 2020 | | 2019 |
| Net asset value at beginning of year | $ 1.00 | | $ 1.00 | | $ 1.00 | | $ 1.00 | | $ 1.00 |
| Net investment income (loss) | 0.04 | | 0.01 | | 0.00‡ | | 0.01 | | 0.02 |
| Total from investment operations | 0.04 | | 0.01 | | 0.00‡ | | 0.01 | | 0.02 |
| Less distributions: | | | | | | | | | |
| From net investment income | (0.04) | | (0.01) | | (0.00)‡ | | (0.01) | | (0.02) |
| Net asset value at end of year | $ 1.00 | | $ 1.00 | | $ 1.00 | | $ 1.00 | | $ 1.00 |
| Total investment return (a) | 4.59% | | 0.76% | | 0.01% | | 0.55% | | 2.14% |
| Ratios (to average net assets)/Supplemental Data: | | | | | | | | | |
| Net investment income (loss) | 4.47% | | 0.72% | | 0.01% | | 0.62% | | 2.11% |
| Net expenses | 0.14% | | 0.11% | | 0.03% | | 0.13% | | 0.15% |
| Expenses (before waiver/reimbursement) | 0.14% | | 0.14% | | 0.14% | | 0.13% | | 0.15% |
| Net assets at end of year (in 000’s) | $ 1,008,822 | | $ 1,335,657 | | $ 2,520,059 | | $ 639,101 | | $ 914,477 |
| ‡ | Less than one cent per share. |
| (a) | Total investment return is calculated exclusive of sales charges and assumes the reinvestment of distributions. For periods of less than one year, total return is not annualized. |
The notes to the financial statements are an integral part of, and should be read in conjunction with, the financial statements.
| 10 | MainStay U.S. Government Liquidity Fund |
Notes to Financial Statements
Note 1-Organization and Business
MainStay Funds Trust (the “Trust”) was organized as a Delaware statutory trust on April 28, 2009. The Trust is registered under the Investment Company Act of 1940, as amended (the “1940 Act”), as an open-end management investment company, and is comprised of thirty-seven funds (collectively referred to as the “Funds”). These financial statements and notes relate to the MainStay U.S. Government Liquidity Fund (the "Fund"), a “diversified” fund, as that term is defined in the 1940 Act, as interpreted or modified by regulatory authorities having jurisdiction, from time to time.
The following table lists the Fund's share classes that have been registered and commenced operations:
| Class | Commenced Operations |
| Class I | July 2, 2018 |
Shares of the Fund are offered and are redeemed at a price equal to their net asset value (“NAV”) per share. No sales or redemption charge is applicable to the purchase or redemption of the Fund’s shares.
The Fund's investment objective is to seek a high level of current income while preserving capital and maintaining liquidity.
Note 2–Significant Accounting Policies
The Fund is an investment company and accordingly follows the investment company accounting and reporting guidance of the Financial Accounting Standards Board (“FASB”) Accounting Standards Codification Topic 946 Financial Services—Investment Companies. The Fund prepares its financial statements in accordance with generally accepted accounting principles (“GAAP”) in the United States of America and follows the significant accounting policies described below.
(A) Valuation of Shares. You could lose money by investing in the Fund. Although the Fund seeks to preserve the value of your investment at $1.00 per share by using the amortized cost method of valuation, it cannot guarantee it will do so. The Fund may impose a fee upon the sale of your shares or may temporarily suspend your ability to sell shares if the Fund's liquidity falls below required minimums because of market conditions or other factors. An investment in the Fund is not insured or guaranteed by the Federal Deposit Insurance Corporation or any other government agency. The Fund's sponsor has no legal obligation to provide financial support to the Fund, and you should not expect that the sponsor will provide financial support to the Fund at any time.
(B) Securities Valuation. Securities are valued using the amortized cost method of valuation, unless the use of such method would be inappropriate per the requirements of Rule 2a-7 under the 1940 Act. The amortized cost method involves valuing a security at its cost on the date of purchase and thereafter assuming a constant amortization to maturity of the difference between such cost and the value on maturity date. Amortized cost approximates the current fair value of a security.
Pursuant to Rule 2a-5 under the 1940 Act, the Board of Trustees of the Trust (the "Board") has designated New York Life Investment Management LLC (“New York Life Investments” or the "Manager") as its Valuation Designee (the "Valuation Designee"). The Valuation Designee is responsible for performing fair valuations relating to all investments in the Fund’s portfolio for which market quotations are not readily available; periodically assessing and managing material valuation risks; establishing and applying fair value methodologies; testing fair valuation methodologies; evaluating and overseeing pricing services; ensuring appropriate segregation of valuation and portfolio management functions; providing quarterly, annual and prompt reporting to the Board, as appropriate; identifying potential conflicts of interest; and maintaining appropriate records. The Valuation Designee has established a valuation committee ("Valuation Committee") to assist in carrying out the Valuation Designee’s responsibilities and establish prices of securities for which market quotations are not readily available. The Fund's and the Valuation Designee's policies and procedures ("Valuation Procedures") govern the Valuation Designee’s selection and application of methodologies for determining and calculating the fair value of Fund investments. The Valuation Designee may value the Fund's portfolio securities for which market quotations are not readily available and other Fund assets utilizing inputs from pricing services and other third-party sources. The Valuation Committee meets (in person, via electronic mail or via teleconference) on an ad-hoc basis to determine fair valuations and on a quarterly basis to review fair value events with respect to certain securities for which market quotations are not readily available, including valuation risks and back-testing results, and preview reports to the Board.
The Valuation Committee establishes prices of securities for which market quotations are not readily available based on such methodologies and measurements on a regular basis after considering information that is reasonably available and deemed relevant by the Valuation Committee. The Board shall oversee the Valuation Designee and review fair valuation materials on a prompt, quarterly and annual basis and approve proposed revisions to the Valuation Procedures.
Investments for which market quotations are not readily available are valued at fair value as determined in good faith pursuant to the Valuation Procedures. A market quotation is readily available only when that quotation is a quoted price (unadjusted) in active markets for identical investments that the Fund can access at the measurement date, provided that a quotation will not be readily available if it is not reliable. "Fair value" is defined as the price the Fund would reasonably expect to receive upon selling an asset or liability in an orderly transaction to an independent buyer in the principal or most advantageous market for the asset or liability. Fair value measurements are determined within a framework that establishes a three-tier hierarchy that maximizes the use of observable market data and minimizes the use of unobservable inputs to establish a classification of fair value measurements for disclosure purposes. "Inputs" refer broadly to the assumptions that market participants would use in pricing the asset or liability, including assumptions about risk, such as the risk inherent in a particular valuation technique used to measure fair value using a pricing model and/or the risk inherent in the inputs for
Notes to Financial Statements (continued)
the valuation technique. Inputs may be observable or unobservable. Observable inputs reflect the assumptions market participants would use in pricing the asset or liability based on market data obtained from sources independent of the Fund. Unobservable inputs reflect the Fund’s own assumptions about the assumptions market participants would use in pricing the asset or liability based on the information available. The inputs or methodology used for valuing assets or liabilities may not be an indication of the risks associated with investing in those assets or liabilities. The three-tier hierarchy of inputs is summarized below.
| • | Level 1—quoted prices (unadjusted) in active markets for an identical asset or liability |
| • | Level 2—other significant observable inputs (including quoted prices for a similar asset or liability in active markets, interest rates and yield curves, prepayment speeds, credit risk, etc.) |
| • | Level 3—significant unobservable inputs (including the Fund's own assumptions about the assumptions that market participants would use in measuring fair value of an asset or liability) |
Securities valued at amortized cost are not obtained from a quoted price in an active market and are generally categorized as Level 2 in the hierarchy. The level of an asset or liability within the fair value hierarchy is based on the lowest level of an input, both individually and in the aggregate, that is significant to the fair value measurement. As of October 31, 2023, the aggregate value by input level of the Fund’s assets and liabilities is included at the end of the Portfolio of Investments.
The Fund may use third-party vendor evaluations, whose prices may be derived from one or more of the following standard inputs, among others:
| • Benchmark yields | • Reported trades |
| • Broker/dealer quotes | • Issuer spreads |
| • Two-sided markets | • Benchmark securities |
| • Bids/offers | • Reference data (corporate actions or material event notices) |
| • Industry and economic events | • Comparable bonds |
| • Monthly payment information | |
An asset or liability for which a market quotation is not readily available is valued by methods deemed reasonable in good faith by the Valuation Committee, following the Valuation Procedures to represent fair value. Under these procedures, the Valuation Designee generally uses a market-based approach which may use related or comparable assets or liabilities, recent transactions, market multiples, book values and other relevant information. The Valuation Designee may also use an income-based valuation approach in which the anticipated future cash flows of the asset or liability are discounted to calculate fair value. Discounts may also be applied due to the nature and/or duration of any restrictions on the disposition of the asset or liability. Fair value represents a good faith approximation of the value of a security. Fair value determinations involve the consideration of a number of subjective factors, an analysis of applicable facts and circumstances and the exercise of judgment. As a result, it is possible that the fair value for a
security determined in good faith in accordance with the Valuation Procedures may differ from valuations for the same security determined for other funds using their own valuation procedures. Although the Valuation Procedures are designed to value a security at the price the Fund may reasonably expect to receive upon the security's sale in an orderly transaction, there can be no assurance that any fair value determination thereunder would, in fact, approximate the amount that the Fund would actually realize upon the sale of the security or the price at which the security would trade if a reliable market price were readily available. During the year ended October 31, 2023, there were no material changes to the fair value methodologies.
Securities which may be valued in this manner include, but are not limited to: (i) a security for which trading has been halted or suspended or otherwise does not have a readily available market quotation on a given day; (ii) a debt security that has recently gone into default and for which there is not a current market quotation; (iii) a security of an issuer that has entered into a restructuring; (iv) a security that has been delisted from a national exchange; (v) a security subject to trading collars for which no or limited trading takes place; and (vi) a security whose principal market has been temporarily closed at a time when, under normal conditions, it would be open. Securities valued in this manner are generally categorized as Level 2 or 3 in the hierarchy. No securities held by the Fund as of October 31, 2023, were fair valued in such a manner.
The information above is not intended to reflect an exhaustive list of the methodologies that may be used to value portfolio investments. The Valuation Procedures permit the use of a variety of valuation methodologies in connection with valuing portfolio investments. The methodology used for a specific type of investment may vary based on the market data available or other considerations. The methodologies summarized above may not represent the specific means by which portfolio investments are valued on any particular business day.
(C) Income Taxes. The Fund's policy is to comply with the requirements of the Internal Revenue Code of 1986, as amended (the “Internal Revenue Code”), applicable to regulated investment companies and to distribute all of its taxable income to the shareholders of the Fund within the allowable time limits.
The Manager evaluates the Fund’s tax positions to determine if the tax positions taken meet the minimum recognition threshold in connection with accounting for uncertainties in income tax positions taken or expected to be taken for the purposes of measuring and recognizing tax liabilities in the financial statements. Recognition of tax benefits of an uncertain tax position is permitted only to the extent the position is “more likely than not” to be sustained assuming examination by taxing authorities. The Manager analyzed the Fund's tax positions taken on federal, state and local income tax returns for all open tax years (for up to three tax years) and has concluded that no provisions for federal, state and local income tax are required in the Fund's financial statements. The Fund's federal, state and local income tax and federal excise tax returns for tax years for which the applicable statutes of limitations have not
| 12 | MainStay U.S. Government Liquidity Fund |
expired are subject to examination by the Internal Revenue Service and state and local departments of revenue.
(D) Dividends and Distributions to Shareholders. Dividends and distributions are recorded on the ex-dividend date. The Fund intends to declare dividends from net investment income, if any, daily and intends to pay them at least monthly and declares and pays distributions from net realized capital and currency gains, if any, at least annually. Unless a shareholder elects otherwise, all dividends and distributions are reinvested at NAV in the same class of shares of the Fund. Dividends and distributions to shareholders are determined in accordance with federal income tax regulations and may differ from determinations using GAAP.
(E) Security Transactions and Investment Income. The Fund records security transactions on the trade date. Realized gains and losses on security transactions are determined using the identified cost method. Interest income is accrued daily and discounts and premiums on securities purchased for the Fund are accreted and amortized, respectively, on the straight-line method. The straight-line method approximates the effective interest rate for short-term investments.
The Fund may place a debt security on non-accrual status and reduce related interest income by ceasing current accruals and writing off all or a portion of any interest receivables when the collection of all or a portion of such interest has become doubtful. A debt security is removed from non-accrual status when the issuer resumes interest payments or when collectability of interest is reasonably assured.
(F) Expenses. Expenses of the Trust are allocated to the individual Funds in proportion to the net assets of the respective Funds when the expenses are incurred, except where direct allocations of expenses can be made. Expenses (other than transfer agent expenses) are allocated to separate classes of shares pro rata based upon their relative net assets on the date the expenses are incurred.The expenses borne by the Fund, including those of related parties to the Fund, are shown in the Statement of Operations.
(G) Use of Estimates. In preparing financial statements in conformity with GAAP, the Manager makes estimates and assumptions that affect the reported amounts and disclosures in the financial statements. Actual results could differ from those estimates and assumptions.
(H) Debt Securities Risk. The Fund’s investments may include securities such as variable rate notes and floaters. If expectations about changes in interest rates, or assessments of an issuer’s credit worthiness or market conditions are incorrect, investments in these types of securities could lose money for the Fund. The ability of issuers of debt securities, including the U.S. government, held by the Fund to meet their obligations may be affected by, among other things, economic or political developments in a specific country, industry or region.
(I) LIBOR Replacement Risk. The Fund may invest in certain debt securities, derivatives or other financial instruments that have relied or continue to rely on the London Interbank Offered Rate ("LIBOR"), as a “benchmark” or “reference rate” for various interest rate calculations. As
of January 1, 2022, the United Kingdom Financial Conduct Authority ("FCA"), which regulates LIBOR, ceased its active encouragement of banks to provide the quotations needed to sustain most LIBOR rates due to the absence of an active market for interbank unsecured lending and other reasons. In connection with supervisory guidance from U.S. regulators, certain U.S. regulated entities have generally ceased to enter into certain new LIBOR contracts after January 1, 2022. On March 15, 2022, the Adjustable Interest Rate (LIBOR) Act was signed into law. This law provides a statutory fallback mechanism on a nationwide basis to replace LIBOR with a benchmark rate that is selected by the Board of Governors of the Federal Reserve System and based on Secured Overnight Financing Rate ("SOFR") (which measures the cost of overnight borrowings through repurchase agreement transactions collateralized with U.S. Treasury securities) for tough legacy contracts. On February 27, 2023, the Federal Reserve System’s final rule in connection with this law became effective, establishing benchmark replacements based on SOFR and Term SOFR (a forward-looking measurement of market expectations of SOFR implied from certain derivatives markets) for applicable tough legacy contracts governed by U.S. law. In addition, the FCA has announced that it will require the publication of synthetic LIBOR for the one-month, three-month and six-month U.S. Dollar LIBOR settings after June 30, 2023 through at least September 30, 2024. Certain of the Fund's investments may involve individual tough legacy contracts which may be subject to the Adjustable Interest Rate (LIBOR) Act or synthetic LIBOR and no assurances can be given that these measures will have had the intended effects. Although the transition process away from LIBOR for many instruments has been completed, some LIBOR use is continuing and there are potential effects related to the transition away from LIBOR or continued use of LIBOR on the Fund.
The elimination of LIBOR or changes to other reference rates or any other changes or reforms to the determination or supervision of reference rates could have an adverse impact on the market for, or value of, any securities or payments linked to those reference rates, which may adversely affect the Fund's performance and/or net asset value. It could also lead to a reduction in the interest rates on, and the value of, some LIBOR-based investments and reduce the effectiveness of hedges mitigating risk in connection with LIBOR-based investments. Uncertainty and risk also remain regarding the willingness and ability of issuers and lenders to include enhanced provisions in new and existing contracts or instruments. Consequently, the transition away from LIBOR to other reference rates may lead to increased volatility and illiquidity in markets that are tied to LIBOR, fluctuations in values of LIBOR-related investments or investments in issuers that utilize LIBOR, increased difficulty in borrowing or refinancing and diminished effectiveness of hedging strategies, adversely affecting the Fund's performance. Furthermore, the risks associated with the expected discontinuation of LIBOR and transition may be exacerbated if the work necessary to effect an orderly transition to an alternative reference rate is not completed in a timely manner. The usefulness of LIBOR as a benchmark could deteriorate anytime during this transition period. Any such effects of the transition process, including unforeseen effects, could result in losses to the Fund.
Notes to Financial Statements (continued)
(J) Indemnifications. Under the Trust’s organizational documents, its officers and trustees are indemnified against certain liabilities that may arise out of performance of their duties to the Trust. Additionally, in the normal course of business, the Fund enters into contracts with third-party service providers that contain a variety of representations and warranties and that may provide general indemnifications. The Fund's maximum exposure under these arrangements is unknown, as this would involve future claims that may be made against the Fund that have not yet occurred. The Manager believes that the risk of loss in connection with these potential indemnification obligations is remote. However, there can be no assurance that material liabilities related to such obligations will not arise in the future, which could adversely impact the Fund.
Note 3–Fees and Related Party Transactions
(A) Manager and Subadvisor. New York Life Investments, a registered investment adviser and an indirect, wholly-owned subsidiary of New York Life Insurance Company ("New York Life"), serves as the Fund's Manager pursuant to a Management Agreement ("Management Agreement"). The Manager provides offices, conducts clerical, recordkeeping and bookkeeping services and keeps most of the financial and accounting records required to be maintained by the Fund. Except for the portion of salaries and expenses that are the responsibility of the Fund, the Manager pays the salaries and expenses of all personnel affiliated with the Fund and certain operational expenses of the Fund. The Fund reimburses New York Life Investments in an amount equal to the portion of the compensation of the Chief Compliance Officer attributable to the Fund. NYL Investors LLC ("NYL Investors" or ''Subadvisor''), a registered investment adviser and a direct, wholly-owned subsidiary of New York Life, serves as the Subadvisor to the Fund and is responsible for the day-to-day portfolio management of the Fund. Pursuant to the terms of a Subadvisory Agreement ("Subadvisory Agreement") between New York Life Investments and NYL Investors, New York Life Investments pays for the services of the Subadvisor.
Pursuant to the Management Agreement, the Fund pays the Manager a monthly fee for the services performed and the facilities furnished at an annual rate of 0.12% of the Fund's average daily net assets.
New York Life Investments has contractually agreed to waive fees and/or reimburse expenses so that Total Annual Fund Operating Expenses (excluding taxes, interest, litigation, extraordinary expenses, brokerage and other transaction expenses relating to the purchase or sale of portfolio investments and acquired (underlying) fund fees and expenses) for Class I shares do not exceed 0.15% of average daily net assets. This agreement will remain in effect until February 28, 2024, and shall renew automatically for one-year terms unless New York Life Investments provides written notice of termination prior to the start of the next term or upon approval of the Board.
New York Life Investments may voluntarily waive fees or reimburse expenses of the Fund to the extent it deems appropriate to enhance the yield of the Fund’s during periods when expenses have a significant impact on the yield of the Fund, as applicable, because of low interest
rates. This expense limitation policy is voluntary and in addition to any contractual arrangements that may be in place with respect to the Fund and described in the Fund’s prospectus.
During the year ended October 31, 2023, New York Life Investments earned fees from the Fund in the amount of $1,379,174 and paid the Subadvisor fees of $689,703.
JPMorgan Chase Bank, N.A. ("JPMorgan") provides sub-administration and sub-accounting services to the Fund pursuant to an agreement with New York Life Investments. These services include calculating the daily NAVs of the Fund, maintaining the general ledger and sub-ledger accounts for the calculation of the Fund's NAVs, and assisting New York Life Investments in conducting various aspects of the Fund's administrative operations. For providing these services to the Fund, JPMorgan is compensated by New York Life Investments.
Pursuant to an agreement between the Trust and New York Life Investments, New York Life Investments is responsible for providing or procuring certain regulatory reporting services for the Fund. The Fund will reimburse New York Life Investments for the actual costs incurred by New York Life Investments in connection with providing or procuring these services for the Fund.
(B) Transfer, Dividend Disbursing and Shareholder Servicing Agent. NYLIM Service Company LLC, an affiliate of New York Life Investments, is the Fund's transfer, dividend disbursing and shareholder servicing agent pursuant to an agreement between NYLIM Service Company LLC and the Trust. NYLIM Service Company LLC has entered into an agreement with SS&C Global Investor & Distributor Solutions, Inc. ("SS&C"), pursuant to which SS&C performs certain transfer agent services on behalf of NYLIM Service Company LLC. New York Life Investments has contractually agreed to limit the transfer agency expenses charged to the Fund’s share classes to a maximum of 0.35% of that share class’s average daily net assets on an annual basis after deducting any applicable Fund or class-level expense reimbursement or small account fees. This agreement will remain in effect until February 28, 2024 and shall renew automatically for one-year terms unless New York Life Investments provides written notice of termination prior to the start of the next term or upon approval of the Board. During the year ended October 31, 2023, the Fund did not record any transfer agent expenses.
| 14 | MainStay U.S. Government Liquidity Fund |
Note 4-Federal Income Tax
The amortized cost also represents the aggregate cost for federal income tax purposes.
As of October 31, 2023, the components of accumulated gain (loss) on a tax basis were as follows:
Ordinary
Income | Accumulated
Capital
and Other
Gain (Loss) | Other
Temporary
Differences | Unrealized
Appreciation
(Depreciation) | Total
Accumulated
Gain (Loss) |
| $69,368 | $(82,338) | $(13,975) | $— | $(26,945) |
The difference between book-basis and tax-basis unrealized appreciation (depreciation) is primarily due to amortization of organizational costs.
As of October 31, 2023, for federal income tax purposes, capital loss carryforwards of $82,338, as shown in the table below, were available to the extent provided by the regulations to offset future realized gains of the Fund. Accordingly, no capital gains distributions are expected to be paid to shareholders until net gains have been realized in excess of such amounts.
Capital Loss
Available Through | Short-Term
Capital Loss
Amounts (000’s) | Long-Term
Capital Loss
Amounts (000’s) |
| Unlimited | $82 | $— |
During the years ended October 31, 2023 and October 31, 2022, the tax character of distributions paid as reflected in the Statements of Changes in Net Assets was as follows:
| | 2023 | 2022 |
| Distributions paid from: | | |
| Ordinary Income | $51,428,827 | $9,334,713 |
Note 5–Custodian
JPMorgan is the custodian of cash and securities held by the Fund. Custodial fees are charged to the Fund based on the Fund's net assets and/or the market value of securities held by the Fund and the number of certain transactions incurred by the Fund.
Note 6–Capital Share Transactions
Transactions in capital shares for the years ended October 31, 2023 and October 31, 2022, were as follows:
| Class I (at $1 per share) | Shares |
| Year ended October 31, 2023: | |
| Shares sold | 10,295,597,780 |
| Shares issued to shareholders in reinvestment of distributions | 50,676,607 |
| Shares redeemed | (10,673,093,594) |
| Net increase (decrease) | (326,819,207) |
| Year ended October 31, 2022: | |
| Shares sold | 13,330,125,923 |
| Shares issued to shareholders in reinvestment of distributions | 9,256,470 |
| Shares redeemed | (14,523,717,926) |
| Net increase (decrease) | (1,184,335,533) |
Note 7–Other Matters
As of the date of this report, the Fund faces a heightened level of risk associated with current uncertainty, volatility and state of economies, financial markets, rising interest rates, and labor and health conditions around the world. Events such as war, acts of terrorism, recessions, rapid inflation, the imposition of international sanctions, earthquakes, hurricanes, epidemics and pandemics and other unforeseen natural or human disasters may have broad adverse social, political and economic effects on the global economy, which could negatively impact the value of the Fund's investments. Developments that disrupt global economies and financial markets may magnify factors that affect the Fund's performance.
Note 8–Subsequent Events
In connection with the preparation of the financial statements of the Fund as of and for the year ended October 31, 2023, events and transactions subsequent to October 31, 2023, through the date the financial statements were issued, have been evaluated by the Manager for possible adjustment and/or disclosure. No subsequent events requiring financial statement adjustment or disclosure have been identified.
Report of Independent Registered Public Accounting Firm
To the Shareholders of the Fund and Board of Trustees
MainStay Funds Trust:
Opinion on the Financial Statements
We have audited the accompanying statement of assets and liabilities of MainStay U.S. Government Liquidity Fund (the Fund), one of the funds constituting MainStay Funds Trust, including the portfolio of investments, as of October 31, 2023, the related statement of operations for the year then ended, the statements of changes in net assets for each of the years in the two-year period then ended, and the related notes (collectively, the financial statements) and the financial highlights for each of the years in the five-year period then ended. In our opinion, the financial statements and financial highlights present fairly, in all material respects, the financial position of the Fund as of October 31, 2023, the results of its operations for the year then ended, the changes in its net assets for each of the years in the two-year period then ended, and the financial highlights for each of the years in the five-year period then ended, in conformity with U.S. generally accepted accounting principles.
Basis for Opinion
These financial statements and financial highlights are the responsibility of the Fund's management. Our responsibility is to express an opinion on these financial statements and financial highlights based on our audits. We are a public accounting firm registered with the Public Company Accounting Oversight Board (United States) (PCAOB) and are required to be independent with respect to the Fund in accordance with the U.S. federal securities laws and the applicable rules and regulations of the Securities and Exchange Commission and the PCAOB.
We conducted our audits in accordance with the standards of the PCAOB. Those standards require that we plan and perform the audit to obtain reasonable assurance about whether the financial statements and financial highlights are free of material misstatement, whether due to error or fraud. Our audits included performing procedures to assess the risks of material misstatement of the financial statements and financial highlights, whether due to error or fraud, and performing procedures that respond to those risks. Such procedures included examining, on a test basis, evidence regarding the amounts and disclosures in the financial statements and financial highlights. Such procedures also included confirmation of securities owned as of October 31, 2023 by correspondence with the custodian. Our audits also included evaluating the accounting principles used and significant estimates made by management, as well as evaluating the overall presentation of the financial statements and financial highlights. We believe that our audits provide a reasonable basis for our opinion.

We have served as the auditor of one or more New York Life Investment Management investment companies since 2003.
Philadelphia, Pennsylvania
December 22, 2023
| 16 | MainStay U.S. Government Liquidity Fund |
Federal Income Tax Information
(Unaudited)
In February 2024, shareholders will receive an IRS Form 1099-DIV or substitute Form 1099, which will show the federal tax status of the distributions received by shareholders in calendar year 2023. The amounts that will be reported on such 1099-DIV or substitute Form 1099 will be the amounts you are to use on your federal income tax return and will differ from the amounts which we must report for the Fund's fiscal year ended October 31, 2023.
Proxy Voting Policies and Procedures and Proxy Voting Record
The Fund is required to file with the SEC its proxy voting record for the 12-month period ending June 30 on Form N-PX. A description of the policies and procedures that are used to vote proxies relating to portfolio securities of the Fund is available free of charge upon request by calling 800-624-6782 or visiting the SEC’s website at www.sec.gov. The most recent Form N-PX or proxy voting record is available free of charge upon request by calling 800-624-6782; visiting newyorklifeinvestments.com; or visiting the SEC’s website at www.sec.gov.
Shareholder Reports and Quarterly Portfolio Disclosure
The Fund is required to file a Form N-MFP every month disclosing its portfolio holdings. The Fund's Form N-MFP is available free of charge upon request by calling New York Life Investments at 800-624-6782.
Board of Trustees and Officers (Unaudited)
The Trustees and officers of the Fund are listed below. The Board oversees the MainStay Group of Funds (which consists of MainStay Funds and MainStay Funds Trust), MainStay VP Funds Trust, MainStay MacKay DefinedTerm Municipal Opportunities Fund, MainStay CBRE Global Infrastructure Megatrends Term Fund, the Manager and the Subadvisors, and elects the officers of the Funds who are responsible for the day-to-day operations of the Fund. Information pertaining to the Trustees and officers is set forth below. Each Trustee serves until his or her successor is elected and qualified or until his or her resignation, death or
removal. Under the Board’s retirement policy, unless an exception is made, a Trustee must tender his or her resignation by the end of the calendar year during which he or she reaches the age of 75. Officers are elected annually by the Board. The business address of each Trustee and officer listed below is 51 Madison Avenue, New York, New York 10010. A majority of the Trustees are not “interested persons” (as defined by the 1940 Act and rules adopted by the SEC thereunder) of the Fund (“Independent Trustees”).
| | Name and
Year of Birth | Term of Office,
Position(s) Held and
Length of Service | Principal Occupation(s)
During Past Five Years | Number of
Portfolios in
Fund Complex
Overseen by
Trustee | Other Directorships
Held by Trustee |
| | | | | | |
| | Naïm Abou-Jaoudé*
1966 | MainStay Funds: Trustee
since 2023
MainStay Funds Trust:
Trustee since 2023 | Chief Executive Officer of New York Life Investment Management LLC (since 2023). Chief Executive Officer of Candriam (an affiliate of New York Life Investment Management LLC) (2007 to 2023). | 81 | MainStay VP Funds Trust:
Trustee since 2023 (31 portfolios);
MainStay MacKay DefinedTerm Municipal Opportunities Fund: Trustee
since 2023;
MainStay CBRE Global Infrastructure Megatrends Term Fund: Trustee
since 2023; and
New York Life Investment Management International (Chair) since 2015 |
| * | This Trustee is considered to be an “interested person” of the MainStay Group of Funds, MainStay VP Funds Trust, MainStay CBRE Global Infrastructure Megatrends Term Fund and MainStay MacKay DefinedTerm Municipal Opportunities Fund, within the meaning of the 1940 Act because of his affiliation with New York Life Investment Management LLC and Candriam, as described in detail above in the column entitled “Principal Occupation(s) During Past Five Years.” |
| | |
| 18 | MainStay U.S. Government Liquidity Fund |
| | Name and
Year of Birth | Term of Office,
Position(s) Held and
Length of Service | Principal Occupation(s)
During Past Five Years | Number of
Portfolios in
Fund Complex
Overseen by
Trustee | Other Directorships
Held by Trustee |
| | | | | | |
| | David H. Chow
1957 | MainStay Funds: Trustee since January 2016, Advisory Board Member (June 2015 to December 2015);MainStay Funds Trust:
Trustee since January 2016, Advisory Board Member (June 2015 to December 2015) | Founder and CEO, DanCourt Management, LLC (since 1999) | 81 | MainStay VP Funds Trust: Trustee since January 2016, Advisory Board Member (June 2015 to December 2015) (31 portfolios);
MainStay MacKay DefinedTerm Municipal Opportunities Fund: Trustee since January 2016, Advisory Board Member (June 2015 to December 2015);
MainStay CBRE Global Infrastructure Megatrends Term Fund: Trustee since 2021;
VanEck Vectors Group of Exchange-Traded Funds: Trustee since 2006 and Independent Chairman of the Board of Trustees from 2008 to 2022 (57 portfolios); and
Berea College of Kentucky: Trustee since 2009, Chair of the Investment Committee since 2018 |
| | Karen Hammond
1956 | MainStay Funds: Trustee since December 2021, Advisory Board Member (June 2021 to December 2021);MainStay Funds Trust:
Trustee since December 2021, Advisory Board Member (June 2021 to December 2021)
| Retired, Managing Director, Devonshire Investors (2007 to 2013); Senior Vice President, Fidelity Management & Research Co. (2005 to 2007); Senior Vice President and Corporate Treasurer, FMR Corp. (2003 to 2005); Chief Operating Officer, Fidelity Investments Japan (2001 to 2003) | 81 | MainStay VP Funds Trust: Trustee since December 2021, Advisory Board Member (June 2021 to December 2021) (31 portfolios);
MainStay MacKay DefinedTerm Municipal Opportunities Fund: Trustee since December 2021, Advisory Board Member (June 2021 to December 2021);
MainStay CBRE Global Infrastructure Megatrends Term Fund: Trustee since December 2021, Advisory Board Member (June 2021 to December 2021);
Two Harbors Investment Corp.: Director since 2018;
Rhode Island State Investment Commission: Member since 2017; and
Blue Cross Blue Shield of Rhode Island: Director since 2019 |
| | Susan B. Kerley
1951 | MainStay Funds: Chair since January 2017 and Trustee since 2007;MainStay Funds Trust:
Chair since January 2017 and Trustee since 1990*** | President, Strategic Management Advisors LLC (since 1990) | 81 | MainStay VP Funds Trust: Chair since January 2017 and Trustee since 2007 (31 portfolios)**;
MainStay MacKay DefinedTerm Municipal Opportunities Fund: Chair since January 2017 and Trustee since 2011;
MainStay CBRE Global Infrastructure Megatrends Term Fund: Trustee since June 2021; and
Legg Mason Partners Funds: Trustee since 1991 (45 portfolios) |
Board of Trustees and Officers (Unaudited) (continued)
| | Name and
Year of Birth | Term of Office,
Position(s) Held and
Length of Service | Principal Occupation(s)
During Past Five Years | Number of
Portfolios in
Fund Complex
Overseen by
Trustee | Other Directorships
Held by Trustee |
| | | | | | |
| | Alan R. Latshaw
1951 | MainStay Funds: Trusteesince 2006;MainStay Funds Trust:
Trustee since 2007*** | Retired; Partner, Ernst & Young LLP (2002 to 2003); Partner, Arthur Andersen LLP (1989 to 2002); Consultant to the MainStay Funds Audit and Compliance Committee (2004 to 2006) | 81 | MainStay VP Funds Trust: Trustee since 2007 (31 portfolios)**;
MainStay MacKay DefinedTerm Municipal Opportunities Fund: Trustee since 2011; and
MainStay CBRE Global Infrastructure Megatrends Term Fund: Trustee since June 2021 |
| | Jacques P. Perold
1958 | MainStay Funds: Trustee since January 2016, Advisory Board Member (June 2015to December 2015);MainStay Funds Trust:
Trustee since January 2016, Advisory Board Member (June 2015 to December 2015) | Founder and Chief Executive Officer, CapShift Advisors LLC (since 2018); President, Fidelity Management & Research Company (2009 to 2014); President and Chief Investment Officer, Geode Capital Management, LLC (2001 to 2009) | 81 | MainStay VP Funds Trust: Trustee since January 2016, Advisory Board Member (June 2015 to December 2015) (31 portfolios);
MainStay MacKay DefinedTerm Municipal Opportunities Fund: Trustee since January 2016, Advisory Board Member (June 2015 to December 2015);
MainStay CBRE Global Infrastructure Megatrends Term Fund: Trustee since June 2021;
Allstate Corporation: Director since 2015; and
MSCI Inc.: Director since 2017 |
| | Richard S. Trutanic
1952 | MainStay Funds: Trustee since 1994;MainStay Funds Trust:
Trustee since 2007*** | Chairman and Chief Executive Officer, Somerset & Company (financial advisory firm) (since 2004); Managing Director, The Carlyle Group (private investment firm) (2002 to 2004); Senior Managing Director, Partner and Board Member, Groupe Arnault S.A. (private investment firm) (1999 to 2002) | 81 | MainStay VP Funds Trust: Trustee since 2007 (31 portfolios)**;
MainStay MacKay DefinedTerm Municipal Opportunities Fund: Trustee since 2011; and
MainStay CBRE Global Infrastructure Megatrends Term Fund: Trustee since June 2021 |
| ** | Includes prior service as a Director of MainStay VP Series Fund, Inc., the predecessor to MainStay VP Funds Trust. |
| *** | Includes prior service as a Director/Trustee of certain predecessor entities to MainStay Funds Trust. |
| 20 | MainStay U.S. Government Liquidity Fund |
| | Name and
Year of Birth | Position(s) Held and
Length of Service | Principal Occupation(s)
During Past Five Years | |
| | | | | |
| | Kirk C. Lehneis
1974 | President, MainStay Funds, MainStay Funds Trust (since 2017) | Chief Operating Officer and Senior Managing Director (since 2016), New York Life Investment Management LLC and New York Life Investment Management Holdings LLC; Member of the Board of Managers (since 2017) and Senior Managing Director (since 2018), NYLIFE Distributors LLC; Chairman of the Board and Senior Managing Director, NYLIM Service Company LLC (since 2017); Trustee, President and Principal Executive Officer of IndexIQ Trust, IndexIQ ETF Trust and IndexIQ Active ETF Trust (since 2018); President, MainStay CBRE Global Infrastructure Megatrends Term Fund (since 2021), MainStay MacKay DefinedTerm Municipal Opportunities Fund and MainStay VP Funds Trust (since 2017)**; Senior Managing Director, Global Product Development (2015 to 2016); Managing Director, Product Development (2010 to 2015), New York Life Investment Management LLC | |
| | Jack R. Benintende
1964 | Treasurer and Principal Financial and Accounting Officer, MainStay Funds (since 2007), MainStay Funds Trust (since 2009) | Managing Director, New York Life Investment Management LLC (since 2007); Treasurer and Principal Financial and Accounting Officer, MainStay CBRE Global Infrastructure Megatrends Term Fund (since 2021), MainStay MacKay DefinedTerm Municipal Opportunities Fund (since 2011) and MainStay VP Funds Trust (since 2007)**; and Assistant Treasurer, New York Life Investment Management Holdings LLC (2008 to 2012) | |
| | J. Kevin Gao
1967 | Secretary and Chief Legal Officer, MainStay Funds and MainStay Funds Trust (since 2010) | Managing Director and Associate General Counsel, New York Life Investment Management LLC (since 2010); Secretary and Chief Legal Officer, MainStay CBRE Global Infrastructure Megatrends Term Fund (since 2021), MainStay MacKay DefinedTerm Municipal Opportunities Fund (since 2011) and MainStay VP Funds Trust (since 2010)** | |
| | Kevin M. Gleason
1967 | Vice President and Chief Compliance Officer, MainStay Funds and MainStay Funds Trust (since June 2022) | Vice President and Chief Compliance Officer, IndexIQ Trust, IndexIQ ETF Trust and Index IQ Active ETF Trust (since June 2022); Vice President and Chief Compliance Officer, MainStay CBRE Global Infrastructure Megatrends Term Fund, MainStay VP Funds Trust and MainStay MacKay DefinedTerm Municipal Opportunities Fund (since June 2022); Senior Vice President, Voya Investment Management and Chief Compliance Officer, Voya Family of Funds (2012 to 2022) | |
| | Scott T. Harrington
1959 | Vice President— Administration, MainStay Funds (since 2005), MainStay Funds Trust (since 2009) | Managing Director, New York Life Investment Management LLC (including predecessor advisory organizations) (since 2000); Member of the Board of Directors, New York Life Trust Company (since 2009); Vice President—Administration, MainStay CBRE Global Infrastructure Megatrends Term Fund (since 2021), MainStay MacKay DefinedTerm Municipal Opportunities Fund (since 2011) and MainStay VP Funds Trust (since 2005)** | |
| * | The officers listed above are considered to be “interested persons” of the MainStay Group of Funds, MainStay VP Funds Trust, MainStay CBRE Global Infrastructure Megatrends Term Fund and MainStay MacKay DefinedTerm Municipal Opportunities Fund within the meaning of the 1940 Act because of their affiliation with the MainStay Group of Funds, New York Life Insurance Company and/or its affiliates, including New York Life Investment Management LLC, New York Life Insurance Company, NYLIM Service Company LLC, NYLIFE Securities LLC and/or NYLIFE Distributors LLC, as described in detail in the column captioned “Principal Occupation(s) During Past Five Years.” Officers are elected annually by the Board. |
| ** | Includes prior service as an Officer of MainStay VP Series Fund, Inc., the predecessor to MainStay VP Funds Trust. |
Officers of the Trust (Who are not Trustees)*
This page intentionally left blank.
Equity
U.S. Equity
MainStay Epoch U.S. Equity Yield Fund
MainStay Fiera SMID Growth Fund
MainStay PineStone U.S. Equity Fund
MainStay S&P 500 Index Fund
MainStay Winslow Large Cap Growth Fund
MainStay WMC Enduring Capital Fund
MainStay WMC Growth Fund
MainStay WMC Small Companies Fund
MainStay WMC Value Fund
International Equity
MainStay Epoch International Choice Fund
MainStay PineStone International Equity Fund
MainStay WMC International Research Equity Fund
Emerging Markets Equity
MainStay Candriam Emerging Markets Equity Fund
Global Equity
MainStay Epoch Capital Growth Fund
MainStay Epoch Global Equity Yield Fund
MainStay PineStone Global Equity Fund
Fixed Income
Taxable Income
MainStay Candriam Emerging Markets Debt Fund
MainStay Floating Rate Fund
MainStay MacKay High Yield Corporate Bond Fund
MainStay MacKay Short Duration High Yield Fund
MainStay MacKay Strategic Bond Fund
MainStay MacKay Total Return Bond Fund
MainStay MacKay U.S. Infrastructure Bond Fund
MainStay Short Term Bond Fund
Tax-Exempt Income
MainStay MacKay California Tax Free Opportunities Fund1
MainStay MacKay High Yield Municipal Bond Fund
MainStay MacKay New York Tax Free Opportunities Fund2
MainStay MacKay Short Term Municipal Fund
MainStay MacKay Strategic Municipal Allocation Fund
MainStay MacKay Tax Free Bond Fund
Money Market
MainStay Money Market Fund
Mixed Asset
MainStay Balanced Fund
MainStay Income Builder Fund
MainStay MacKay Convertible Fund
Speciality
MainStay CBRE Global Infrastructure Fund
MainStay CBRE Real Estate Fund
MainStay Cushing MLP Premier Fund
Asset Allocation
MainStay Conservative Allocation Fund
MainStay Conservative ETF Allocation Fund
MainStay Defensive ETF Allocation Fund
MainStay Equity Allocation Fund
MainStay Equity ETF Allocation Fund
MainStay ESG Multi-Asset Allocation Fund
MainStay Growth Allocation Fund
MainStay Growth ETF Allocation Fund
MainStay Moderate Allocation Fund
MainStay Moderate ETF Allocation Fund
Manager
New York Life Investment Management LLC
New York, New York
Subadvisors
Candriam3
Strassen, Luxembourg
CBRE Investment Management Listed Real Assets LLC
Radnor, Pennsylvania
Cushing Asset Management, LP
Dallas, Texas
Epoch Investment Partners, Inc.
New York, New York
Fiera Capital Inc.
New York, New York
IndexIQ Advisors LLC3
New York, New York
MacKay Shields LLC3
New York, New York
NYL Investors LLC3
New York, New York
PineStone Asset Management Inc.
Montreal, Québec
Wellington Management Company LLP
Boston, Massachusetts
Winslow Capital Management, LLC
Minneapolis, Minnesota
Legal Counsel
Dechert LLP
Washington, District of Columbia
Independent Registered Public Accounting Firm
KPMG LLP
Philadelphia, Pennsylvania
Distributor
NYLIFE Distributors LLC3
Jersey City, New Jersey
Custodian
JPMorgan Chase Bank, N.A.
New York, New York
1.
This Fund is registered for sale in AZ, CA, NV, OR, TX, UT, WA and MI (Class A and Class I shares only), and CO, FL, GA, HI, ID, MA, MD, NH, NJ and NY (Class I shares only).
| 2. | This Fund is registered for sale in CA, CT, DE, FL, MA, NJ, NY and VT. |
| 3. | An affiliate of New York Life Investment Management LLC. |
Not part of the Annual Report
For more information
800-624-6782
newyorklifeinvestments.com
“New York Life Investments” is both a service mark, and the common trade name, of certain investment advisors affiliated with New York Life Insurance Company. The MainStay Funds® are managed by New York Life Investment Management LLC and distributed by NYLIFE Distributors LLC, 30 Hudson Street, Jersey City, NJ 07302, a wholly owned subsidiary of New York Life Insurance Company. NYLIFE Distributors LLC is a Member FINRA/SIPC.
| ©2023 NYLIFE Distributors LLC. All rights reserved. | MSUGL11a-12/23 |
MainStay WMC Growth Fund
Message from the President and Annual Report
October 31, 2023
Special Notice:
Beginning in July 2024, new regulations issued by the Securities and Exchange Commission (SEC) will take effect requiring open-end mutual fund companies and ETFs to (1) overhaul the content of their shareholder reports and (2) mail paper copies of the new tailored shareholder reports to shareholders who have not opted to receive these documents electronically.
If you have not yet elected to receive your shareholder reports electronically, please contact your financial intermediary or visit newyorklifeinvestments.com/accounts.
| Not FDIC/NCUA Insured | Not a Deposit | May Lose Value | No Bank Guarantee | Not Insured by Any Government Agency |
This page intentionally left blank
Message from the President
Volatile economic and geopolitical forces drove market behavior during the 12-month reporting period ended October 31, 2023. While equity markets generally gained ground, bond prices trended broadly lower.
Although the war in Ukraine, the outbreak of hostilities in the Middle East and several other notable events affected financial assets, inflation and interest rate trends stood at the forefront of market developments during most of the period. As the reporting period began, high levels of inflation already showed signs of easing in the face of aggressive rate hikes by the U.S. Federal Reserve (the “Fed”). From a peak of 9.1% in June 2022, the annualized U.S. inflation rate dropped to 7.1% in November 2022, and to 3.2% in October 2023. At the same time, the Fed increased the benchmark federal funds rate from 3.75%–4.00% at the beginning of the reporting period to 5.25%–5.50% as of October 31, 2023. As the pace of rate increases slowed during the period, investors hoped for an early shift to a looser monetary policy. However, comments from Fed members late in the period reinforced the central bank’s hawkish stance in response to surprisingly robust U.S. economic growth and rising wage pressures, thus increasing the likelihood that interest rates would stay higher for longer. International developed markets exhibited similar dynamics of elevated inflation and rising interest rates.
Despite the backdrop of high interest rates—along with political dysfunction in Washington D.C. and intensifying global geopolitical instability—equity markets managed to advance, supported by healthy consumer spending trends and persistent domestic economic growth. The S&P 500® Index, a widely regarded benchmark of large-cap U.S. market performance, gained ground, bolstered by the strong performance of energy stocks amid surging petroleum prices and mega-cap, growth-oriented, technology-related shares, which rose as investors flocked to companies creating the infrastructure for developments in artificial intelligence. Smaller-cap stocks and value-oriented shares produced milder returns. Among industry sectors, energy and
information technology posted the strongest gains. Real estate declined most sharply under pressure from rising mortgage rates and weak levels of office occupancy. Developed international markets outperformed U.S. markets, with Europe benefiting during the first half of the period from unexpected economic resilience in the face of rising energy prices and the ongoing war in Ukraine. Emerging markets posted positive results but lagged developed markets, largely due to slow economic growth in China despite the relaxation of pandemic-era lockdowns.
Bond prices were driven lower by rising yields and increasing expectations of high interest rates for an extended period of time. The U.S. yield curve steepened, with the 30-year Treasury yield exceeding 5% for the first time in more than a decade. The yield curve remained inverted, with the 10-year Treasury yield ending the period at 4.88%, compared with 5.07% for the 2-year Treasury yield. Corporate bonds outperformed long-term Treasury bonds, but still trended lower under pressure from rising yields and an uptick in default rates. Among corporates, lower-credit-quality instruments performed slightly better than their higher-credit-quality counterparts, while floating rate securities performed better still.
In the face of today’s uncertain market environment, New York Life Investments remains dedicated to providing the guidance, resources and investment solutions you need to pursue your financial goals.
Thank you for trusting us to help meet your investment needs.
Sincerely,
Kirk C. Lehneis
President
The opinions expressed are as of the date of this report and are subject to change. There is no guarantee that any forecast made will come to pass. This material does not constitute investment advice and is not intended as an endorsement of any specific investment. Past performance is no guarantee of future results.
Not part of the Annual Report
Investors should refer to the Fund’s Summary Prospectus and/or Prospectus and consider the Fund’s investment objectives, strategies, risks, charges and expenses carefully before investing. The Summary Prospectus and/or Prospectus contain this and other information about the Fund. You may obtain copies of the Fund’s Summary Prospectus, Prospectus and Statement of Additional Information, which includes information about the MainStay Funds Trust's Trustees, free of charge, upon request, by calling toll-free 800-624-6782, by writing to NYLIFE Distributors LLC, Attn: MainStay Marketing Department, 30 Hudson Street, Jersey City, NJ 07302 or by sending an e-mail to MainStayShareholderServices@nylim.com. These documents are also available via the MainStay Funds’ website at newyorklifeinvestments.com. Please read the Fund’s Summary Prospectus and/or Prospectus carefully before investing.
Investment and Performance Comparison (Unaudited)
Performance data quoted represents past performance. Past performance is no guarantee of future results. Because of market volatility and other factors, current performance may be lower or higher than the figures shown. Investment return and principal value will fluctuate, and as a result, when shares are redeemed, they may be worth more or less than their original cost. The graph below depicts the historical performance of Class I shares of the Fund. Performance will vary from class to class based on differences in class-specific expenses and sales charges. For performance information current to the most recent month-end, please call 800-624-6782 or visit newyorklifeinvestments.com.
The performance table and graph do not reflect the deduction of taxes that a shareholder would pay on distributions or Fund share redemptions. Total returns reflect maximum applicable sales charges as indicated in the table below, if any, changes in share price, and reinvestment of dividend and capital gain distributions. The graph assumes the initial investment amount shown below and reflects the deduction of all sales charges that would have applied for the period of investment. Performance figures may reflect certain fee waivers and/or expense limitations, without which total returns may have been lower. For more information on share classes and current fee waivers and/or expense limitations (if any), please refer to the Notes to Financial Statements.
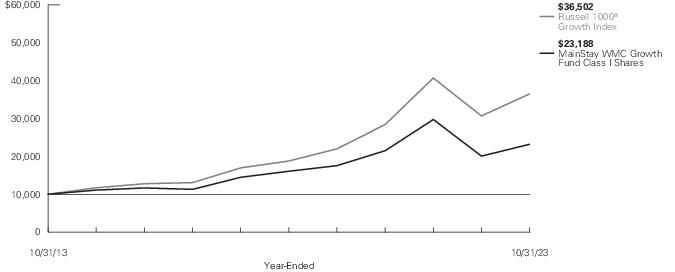
| Average Annual Total Returns for the Year-Ended October 31, 2023 |
| Class | Sales Charge | | Inception
Date1 | One
Year | Five
Years | Ten Years
or Since
Inception | Gross
Expense
Ratio2 |
| Class A Shares | Maximum 5.50% Initial Sales Charge | With sales charges | 8/7/2006 | 8.80% | 6.09% | 7.88% | 1.04% |
| | | Excluding sales charges | | 15.13 | 7.30 | 8.49 | 1.04 |
| Investor Class Shares3 | Maximum 5.00% Initial Sales Charge | With sales charges | 1/18/2013 | 9.09 | 5.79 | 7.62 | 1.36 |
| | | Excluding sales charges | | 14.84 | 7.00 | 8.23 | 1.36 |
| Class B Shares4 | Maximum 5.00% CDSC | With sales charges | 1/18/2013 | 8.94 | 5.92 | 7.43 | 2.11 |
| | if Redeemed Within First Six Years of Purchase | Excluding sales charges | | 13.94 | 6.19 | 7.43 | 2.11 |
| Class C Shares | Maximum 1.00% CDSC | With sales charges | 1/18/2013 | 12.99 | 6.20 | 7.42 | 2.11 |
| | if Redeemed Within One Year of Purchase | Excluding sales charges | | 13.99 | 6.20 | 7.42 | 2.11 |
| Class I Shares | No Sales Charge | | 11/2/2009 | 15.47 | 7.60 | 8.77 | 0.79 |
| Class R2 Shares5 | No Sales Charge | | 1/18/2013 | 15.02 | 7.19 | 8.38 | 1.14 |
| Class R6 Shares | No Sales Charge | | 4/26/2021 | 15.50 | N/A | -6.22 | 0.72 |
| 1. | Effective March 5, 2021, the Fund replaced its subadvisor and modified its principal investment strategies. The performance information in the graph and table from April 1, 2019 through March 5, 2021 reflects that of the Fund's prior subadvisor and principal investment strategies. Performance information shown in this report prior to April 1, 2019 reflects that of a different previous subadvisor to the fund, investment objective and principal investment strategies. |
| 2. | The gross expense ratios presented reflect the Fund’s “Total Annual Fund Operating Expenses” from the most recent Prospectus, as supplemented, and may differ from other expense ratios disclosed in this report. |
| 3. | Prior to June 30, 2020, the maximum initial sales charge was 5.50%, which is reflected in the applicable average annual total return figures shown. |
| 4. | Class B shares are closed to all new purchases as well as additional investments by existing Class B shareholders. |
| 5. | As of October 31, 2023, Class R2 shares are closed to new investors and, upon the close of business on December 29, 2023, Class R2 shares are closed to additional investments by existing shareholders. Additionally, Class R2 shares will be liquidated on or about February 28, 2024 (the "Liquidation Date"). It is expected that the Fund will distribute to remaining shareholders invested in Class R2 shares, on or promptly after the Liquidation Date, a liquidating distribution in cash or cash equivalents equal to the net asset value of such shares. |
The footnotes on the next page are an integral part of the table and graph and should be carefully read in conjunction with them.
| Benchmark Performance* | One
Year | Five
Years | Ten
Years |
| Russell 1000® Growth Index1 | 18.95% | 14.22% | 13.82% |
| Morningstar Large Growth Category Average2 | 14.19 | 10.68 | 10.98 |
| * | Returns for indices reflect no deductions for fees, expenses or taxes, except for foreign withholding taxes where applicable. Results assume reinvestment of all dividends and capital gains. An investment cannot be made directly in an index. |
| 1. | The Russell 1000® Growth Index is the Fund's primary benchmark. The Russell 1000® Growth Index is a broad-based benchmark that measures the performance of the large-cap growth segment of the U.S. equity universe. It includes those Russell 1000® Index companies with higher price-to-book ratios and higher forecasted growth values. |
| 2. | The Morningstar Large Growth Category Average is representative of funds that invest primarily in big U.S. companies that are projected to grow faster than other large-cap stocks. Stocks in the top 70% of the capitalization of the U.S. equity market are defined as large cap. Growth is defined based on fast growth and high valuations. Most of these funds focus on companies in rapidly expanding industries. Results are based on average total returns of similar funds with all dividends and capital gain distributions reinvested. |
The footnotes on the preceding page are an integral part of the table and graph and should be carefully read in conjunction with them.
| 6 | MainStay WMC Growth Fund |
Cost in Dollars of a $1,000 Investment in MainStay WMC Growth Fund (Unaudited)
The example below is intended to describe the fees and expenses borne by shareholders during the six-month period from May 1, 2023 to October 31, 2023, and the impact of those costs on your investment.
Example
As a shareholder of the Fund you incur two types of costs: (1) transaction costs, including exchange fees and sales charges (loads) on purchases (as applicable), and (2) ongoing costs, including management fees, distribution and/or service (12b-1) fees and other Fund expenses (as applicable). This example is intended to help you understand your ongoing costs (in dollars) of investing in the Fund and to compare these costs with the ongoing costs of investing in other mutual funds. The example is based on an investment of $1,000 made at the beginning of the six-month period and held for the entire period from May 1, 2023 to October 31, 2023.
This example illustrates your Fund’s ongoing costs in two ways:
Actual Expenses
The second and third data columns in the table below provide information about actual account values and actual expenses. You may use the information in these columns, together with the amount you invested, to estimate the expenses that you paid during the six months ended October 31, 2023. Simply divide your account value by $1,000 (for example, an
$8,600 account value divided by $1,000 = 8.6), then multiply the result by the number under the heading entitled “Expenses Paid During Period” to estimate the expenses you paid on your account during this period.
Hypothetical Example for Comparison Purposes
The fourth and fifth data columns in the table below provide information about hypothetical account values and hypothetical expenses based on the Fund’s actual expense ratio and an assumed rate of return of 5% per year before expenses, which is not the Fund’s actual return. The hypothetical account values and expenses may not be used to estimate the actual ending account balances or expenses you paid for the six-month period shown. You may use this information to compare the ongoing costs of investing in the Fund with the ongoing costs of investing in other mutual funds. To do so, compare this 5% hypothetical example with the 5% hypothetical examples that appear in the shareholder reports of the other mutual funds.
Please note that the expenses shown in the table are meant to highlight your ongoing costs only and do not reflect any transactional costs, such as exchange fees or sales charges (loads). Therefore, the fourth and fifth data columns of the table are useful in comparing ongoing costs only and will not help you determine the relative total costs of owning different funds. In addition, if these transactional costs were included, your costs would have been higher.
| Share Class | Beginning
Account
Value
5/1/23 | Ending Account
Value (Based
on Actual
Returns and
Expenses)
10/31/23 | Expenses
Paid
During
Period1 | Ending Account
Value (Based
on Hypothetical
5% Annualized
Return and
Actual Expenses)
10/31/23 | Expenses
Paid
During
Period1 | Net Expense
Ratio
During
Period2 |
| Class A Shares | $1,000.00 | $1,037.30 | $ 5.34 | $1,019.96 | $ 5.30 | 1.04% |
| Investor Class Shares | $1,000.00 | $1,035.90 | $ 6.77 | $1,018.55 | $ 6.72 | 1.32% |
| Class B Shares | $1,000.00 | $1,032.10 | $10.60 | $1,014.77 | $10.51 | 2.07% |
| Class C Shares | $1,000.00 | $1,032.10 | $10.60 | $1,014.77 | $10.51 | 2.07% |
| Class I Shares | $1,000.00 | $1,038.90 | $ 3.85 | $1,021.42 | $ 3.82 | 0.75% |
| Class R2 Shares | $1,000.00 | $1,036.60 | $ 5.85 | $1,019.46 | $ 5.80 | 1.14% |
| Class R6 Shares | $1,000.00 | $1,038.90 | $ 3.75 | $1,021.53 | $ 3.72 | 0.73% |
| 1. | Expenses are equal to the Fund’s annualized expense ratio of each class multiplied by the average account value over the period, divided by 365 and multiplied by 184 (to reflect the six-month period). The table above represents the actual expenses incurred during the six-month period. In addition to the fees and expenses which the Fund bears directly, it also indirectly bears a pro rata share of the fees and expenses of the underlying funds in which it invests. Such indirect expenses are not included in the above-reported expense figures. |
| 2. | Expenses are equal to the Fund's annualized expense ratio to reflect the six-month period. |
Industry Composition as of October 31, 2023 (Unaudited)
| Software | 18.7% |
| Interactive Media & Services | 10.9 |
| Financial Services | 8.8 |
| Semiconductors & Semiconductor Equipment | 7.8 |
| Technology Hardware, Storage & Peripherals | 7.4 |
| Broadline Retail | 4.9 |
| Capital Markets | 4.5 |
| Pharmaceuticals | 4.2 |
| Health Care Providers & Services | 3.4 |
| Insurance | 3.1 |
| IT Services | 2.9 |
| Hotels, Restaurants & Leisure | 2.7 |
| Specialized REITs | 2.7 |
| Life Sciences Tools & Services | 1.9 |
| Ground Transportation | 1.9 |
| Aerospace & Defense | 1.6 |
| Specialty Retail | 1.6 |
| Entertainment | 1.2% |
| Health Care Equipment & Supplies | 1.1 |
| Energy Equipment & Services | 1.1 |
| Commercial Services & Supplies | 1.0 |
| Professional Services | 0.9 |
| Health Care REITs | 0.9 |
| Biotechnology | 0.6 |
| Textiles, Apparel & Luxury Goods | 0.5 |
| Automobiles | 0.5 |
| Machinery | 0.3 |
| Personal Care Products | 0.2 |
| Water Utilities | 0.1 |
| Short–Term Investment | 3.4 |
| Other Assets, Less Liabilities | –0.8 |
| | 100.0% |
See Portfolio of Investments beginning on page 10 for specific holdings within these categories. The Fund's holdings are subject to change.
Top Ten Holdings and/or Issuers Held as of October 31, 2023 (excluding short-term investments) (Unaudited)
| 1. | Microsoft Corp. |
| 2. | Apple, Inc. |
| 3. | Alphabet, Inc., Class C |
| 4. | Amazon.com, Inc. |
| 5. | Mastercard, Inc., Class A |
| 6. | NVIDIA Corp. |
| 7. | Meta Platforms, Inc., Class A |
| 8. | UnitedHealth Group, Inc. |
| 9. | Eli Lilly & Co. |
| 10. | Progressive Corp. (The) |
| 8 | MainStay WMC Growth Fund |
Portfolio Management Discussion and Analysis (Unaudited)
Questions answered by portfolio managers Andrew J. Shilling and Clark R. Shields of Wellington Management Company LLP, the Fund’s Subadvisor.
How did MainStay WMC Growth Fund perform relative to its benchmark and peer group during the 12 months ended October 31, 2023?
For the 12 months ended October 31, 2023, Class I shares of MainStay WMC Growth Fund returned 15.47%, underperforming the 18.95% return of the Fund’s benchmark, the Russell 1000® Growth Index (the “Index”). Over the same period, Class I shares outperformed the 14.19% return of the Morningstar Large Growth Category Average.1
Were there any changes to the Fund during the reporting period?
Effective February 28, 2023, Clark R. Shields was added as a portfolio manager of the Fund.
What factors affected the Fund’s relative performance during the reporting period?
The Fund underperformed the Index during the reporting period primarily due to security selection. Selection in communication services and information technology detracted most from relative results, while selection in consumer discretionary, real estate and energy made positive contributions. (Contributions take weightings and total returns into account.) Sector allocation, as a result of our bottom-up stock selection process, made a modestly positive contribution to relative performance. This was driven by the Fund’s underweight exposure to consumer staples, as well as overweight exposure to information technology. The negative impact of overweight exposure to financials partly offset positive allocation effects.
During the reporting period, which sectors were the strongest positive contributors to the Fund’s relative performance and which sectors were particularly weak?
During the reporting period, the consumer discretionary sector provided the strongest positive contribution to relative performance, while communication services detracted most.
During the reporting period, which individual stocks made the strongest positive contributions to the Fund’s absolute performance and which stocks detracted the most?
At the issuer level, the strongest contributions to the Fund’s absolute performance included global software and consumer electronics company Microsoft and graphics semiconductor maker NVIDIA. Microsoft shares rose after the company’s third-quarter 2023 results beat revenue and earnings expectations. The company’s intelligent cloud and productivity & business processes segments each produced double digit revenue growth year-over-year. In addition, Microsoft’s alliance with OpenAI led to the announcement of new product releases, including Copilot, an artificial intelligence (“AI”) assistant designed to help navigate search engine Bing and the Office 365 product suite. Shares of NVIDIA rose after the chipmaker reported multiple quarters of better-than-expected revenue and earnings, driving strong demand tailwinds from the company’s A100 chip, viewed as a critical input in the AI industry.
The most significant detractors from the Fund’s absolute performance were sales and marketing support provider ZoomInfo Technologies and electric vehicle manufacturer Tesla. ZoomInfo shares declined due to macroeconomic pressures which caused a slowdown in spending and hiring at software as a service (“SaaS”) companies. We believe the slowdown is temporary, and expect to see an uptick in demand in early 2024. The stock price reflects a long-term negative view on company prospects we believe to be flawed. Tesla shares fell due to concerns about changing competitive dynamics within the EV industry and the lack of a demand response to price decreases. We believe that, despite a recent selloff, the share price continues to reflect justifiable optimism for the future of the company, although the Fund holds an underweight position for risk control purposes.
What were some of the Fund’s largest purchases and sales during the reporting period?
The Fund initiated a position in social media company Meta Platforms. The company has begun to monetize their video-sharing reels platform, which we anticipate will be a strong contributor to earnings and is likely to benefit from increased regulatory and government scrutiny of competitor TikTok. In addition, we’re encouraged by the increased focus on cost efficiency we see at Meta Platforms.
The Fund’s largest sale during the reporting period was in consumer electronic company Apple. We believe Apple’s valuation reflects an overly positive view on the company’s ability to continue to grow revenue and earnings per share, and we see more attractive opportunities elsewhere. Accordingly, we are maintaining the Fund’s underweight position in the stock.
How did the Fund’s sector and weightings change during the reporting period?
The Fund’s largest increase in sector exposure relative to the Index was in the financials sector, while the most significant decrease was in information technology.
How was the Fund positioned at the end of the reporting period?
As of October 31, 2023, the Fund held its largest overweight positions in financials and real estate. As of the same date, the Fund’s most significantly underweight exposures were in information technology and consumer discretionary.
| 1. | See "Investment and Performance Comparison" for other share class returns, which may be higher or lower than Class I share returns, and for more information on benchmark and peer group returns. |
The opinions expressed are those of the portfolio managers as of the date of this report and are subject to change. There is no guarantee that any forecasts will come to pass. This material does not constitute investment advice and is not intended as an endorsement of any specific investment.
Portfolio of Investments October 31, 2023†^
| | Shares | Value |
| Common Stocks 97.4% |
| Aerospace & Defense 1.6% |
| Airbus SE, ADR | 150,722 | $ 5,031,100 |
| General Dynamics Corp. | 27,637 | 6,669,085 |
| | | 11,700,185 |
| Automobiles 0.5% |
| Tesla, Inc. (a) | 17,790 | 3,572,944 |
| Biotechnology 0.6% |
| Vertex Pharmaceuticals, Inc. (a) | 12,601 | 4,562,948 |
| Broadline Retail 4.9% |
| Amazon.com, Inc. (a) | 263,306 | 35,043,396 |
| Capital Markets 4.5% |
| Ares Management Corp. | 38,968 | 3,841,855 |
| Blackstone, Inc. | 89,607 | 8,275,206 |
| MSCI, Inc. | 17,043 | 8,036,627 |
| S&P Global, Inc. | 33,578 | 11,729,131 |
| | | 31,882,819 |
| Commercial Services & Supplies 1.0% |
| Copart, Inc. (a) | 168,235 | 7,321,587 |
| Energy Equipment & Services 1.1% |
| Schlumberger Ltd. | 141,131 | 7,855,352 |
| Entertainment 1.2% |
| Netflix, Inc. (a) | 20,995 | 8,643,432 |
| Financial Services 8.8% |
| FleetCor Technologies, Inc. (a) | 53,853 | 12,126,080 |
| Global Payments, Inc. | 58,118 | 6,173,294 |
| Mastercard, Inc., Class A | 87,308 | 32,858,365 |
| Visa, Inc., Class A | 49,522 | 11,642,622 |
| | | 62,800,361 |
| Ground Transportation 1.9% |
| Uber Technologies, Inc. (a) | 311,392 | 13,477,046 |
| Health Care Equipment & Supplies 1.1% |
| Boston Scientific Corp. (a) | 86,360 | 4,420,768 |
| Stryker Corp. | 13,682 | 3,697,150 |
| | | 8,117,918 |
| | Shares | Value |
| |
| Health Care Providers & Services 3.4% |
| UnitedHealth Group, Inc. | 45,686 | $ 24,467,594 |
| Health Care REITs 0.9% |
| Welltower, Inc. | 79,010 | 6,606,026 |
| Hotels, Restaurants & Leisure 2.7% |
| Airbnb, Inc., Class A (a) | 85,501 | 10,113,913 |
| Hilton Worldwide Holdings, Inc. | 59,527 | 9,020,127 |
| | | 19,134,040 |
| Insurance 3.1% |
| Marsh & McLennan Cos., Inc. | 41,080 | 7,790,822 |
| Progressive Corp. (The) | 88,584 | 14,004,245 |
| | | 21,795,067 |
| Interactive Media & Services 10.9% |
| Alphabet, Inc., Class C (a) | 347,365 | 43,524,835 |
| Meta Platforms, Inc., Class A (a) | 95,883 | 28,886,671 |
| ZoomInfo Technologies, Inc. (a) | 425,974 | 5,520,623 |
| | | 77,932,129 |
| IT Services 2.9% |
| MongoDB, Inc. (a) | 24,120 | 8,311,511 |
| Okta, Inc. (a) | 80,849 | 5,450,031 |
| Shopify, Inc., Class A (a) | 81,779 | 3,859,151 |
| VeriSign, Inc. (a) | 16,851 | 3,364,471 |
| | | 20,985,164 |
| Life Sciences Tools & Services 1.9% |
| Danaher Corp. | 50,557 | 9,707,955 |
| Illumina, Inc. (a) | 14,773 | 1,616,462 |
| Mettler-Toledo International, Inc. (a) | 2,243 | 2,209,803 |
| | | 13,534,220 |
| Machinery 0.3% |
| IDEX Corp. | 9,864 | 1,888,068 |
| Personal Care Products 0.2% |
| Estee Lauder Cos., Inc. (The), Class A | 10,845 | 1,397,595 |
| Pharmaceuticals 4.2% |
| Eli Lilly & Co. | 34,546 | 19,136,066 |
| Zoetis, Inc. | 67,578 | 10,609,746 |
| | | 29,745,812 |
| Professional Services 0.9% |
| TransUnion | 153,431 | 6,732,552 |
The notes to the financial statements are an integral part of, and should be read in conjunction with, the financial statements.
| 10 | MainStay WMC Growth Fund |
| | Shares | Value |
| Common Stocks (continued) |
| Semiconductors & Semiconductor Equipment 7.8% |
| ARM Holdings plc, ADR (a) | 20,367 | $ 1,003,889 |
| ASML Holding NV (Registered) | 12,895 | 7,721,655 |
| Microchip Technology, Inc. | 85,888 | 6,122,956 |
| Monolithic Power Systems, Inc. | 21,898 | 9,673,222 |
| NVIDIA Corp. | 77,000 | 31,400,600 |
| | | 55,922,322 |
| Software 18.7% |
| ANSYS, Inc. (a) | 19,858 | 5,525,687 |
| Atlassian Corp., Class A (a) | 47,685 | 8,613,818 |
| Cadence Design Systems, Inc. (a) | 22,516 | 5,400,463 |
| HubSpot, Inc. (a) | 11,950 | 5,064,052 |
| Intuit, Inc. | 23,517 | 11,639,739 |
| Microsoft Corp. | 240,274 | 81,239,042 |
| Salesforce, Inc. (a) | 29,168 | 5,857,809 |
| ServiceNow, Inc. (a) | 17,867 | 10,395,914 |
| | | 133,736,524 |
| Specialized REITs 2.7% |
| American Tower Corp. | 62,880 | 11,204,587 |
| Equinix, Inc. | 10,609 | 7,740,751 |
| | | 18,945,338 |
| Specialty Retail 1.6% |
| TJX Cos., Inc. (The) | 132,363 | 11,657,209 |
| Technology Hardware, Storage & Peripherals 7.4% |
| Apple, Inc. | 309,602 | 52,870,734 |
| | Shares | | Value |
| |
| Textiles, Apparel & Luxury Goods 0.5% |
| Lululemon Athletica, Inc. (a) | 9,705 | | $ 3,818,723 |
| Water Utilities 0.1% |
| Veralto Corp. (a) | 12,575 | | 867,675 |
Total Common Stocks
(Cost $484,847,037) | | | 697,014,780 |
| Short-Term Investment 3.4% |
| Affiliated Investment Company 3.4% |
| MainStay U.S. Government Liquidity Fund, 5.275% (b) | 24,210,948 | | 24,210,948 |
Total Short-Term Investment
(Cost $24,210,948) | | | 24,210,948 |
Total Investments
(Cost $509,057,985) | 100.8% | | 721,225,728 |
| Other Assets, Less Liabilities | (0.8) | | (5,985,881) |
| Net Assets | 100.0% | | $ 715,239,847 |
| † | Percentages indicated are based on Fund net assets. |
| ^ | Industry classifications may be different than those used for compliance monitoring purposes. |
| (a) | Non-income producing security. |
| (b) | Current yield as of October 31, 2023. |
Investments in Affiliates (in 000's)
Investments in issuers considered to be affiliate(s) of the Fund during the year ended October 31, 2023 for purposes of Section 2(a)(3) of the Investment Company Act of 1940, as amended, were as follows:
| Affiliated Investment Companies | Value,
Beginning
of Year | Purchases
at Cost | Proceeds
from
Sales | Net
Realized
Gain/(Loss)
on Sales | Change in
Unrealized
Appreciation/
(Depreciation) | Value,
End of
Year | Dividend
Income | Other
Distributions | Shares
End of
Year |
| MainStay U.S. Government Liquidity Fund | $ 19,516 | $ 173,059 | $ (168,364) | $ — | $ — | $ 24,211 | $ 671 | $ — | 24,211 |
| Abbreviation(s): |
| ADR—American Depositary Receipt |
| REIT—Real Estate Investment Trust |
The notes to the financial statements are an integral part of, and should be read in conjunction with, the financial statements.
11
Portfolio of Investments October 31, 2023†^ (continued)
The following is a summary of the fair valuations according to the inputs used as of October 31, 2023, for valuing the Fund’s assets:
| Description | Quoted
Prices in
Active
Markets for
Identical
Assets
(Level 1) | | Significant
Other
Observable
Inputs
(Level 2) | | Significant
Unobservable
Inputs
(Level 3) | | Total |
| Asset Valuation Inputs | | | | | | | |
| Investments in Securities (a) | | | | | | | |
| Common Stocks | $ 697,014,780 | | $ — | | $ — | | $ 697,014,780 |
| Short-Term Investment | | | | | | | |
| Affiliated Investment Company | 24,210,948 | | — | | — | | 24,210,948 |
| Total Investments in Securities | $ 721,225,728 | | $ — | | $ — | | $ 721,225,728 |
| (a) | For a complete listing of investments and their industries, see the Portfolio of Investments. |
The notes to the financial statements are an integral part of, and should be read in conjunction with, the financial statements.
| 12 | MainStay WMC Growth Fund |
Statement of Assets and Liabilities as of October 31, 2023
| Assets |
Investment in unaffiliated securities, at value
(identified cost $484,847,037) | $697,014,780 |
Investment in affiliated investment companies, at value
(identified cost $24,210,948) | 24,210,948 |
| Receivables: | |
| Investment securities sold | 6,735,461 |
| Dividends | 338,355 |
| Fund shares sold | 107,538 |
| Securities lending | 180 |
| Other assets | 44,872 |
| Total assets | 728,452,134 |
| Liabilities |
| Payables: | |
| Investment securities purchased | 12,323,746 |
| Manager (See Note 3) | 427,905 |
| Fund shares redeemed | 155,551 |
| Transfer agent (See Note 3) | 143,828 |
| NYLIFE Distributors (See Note 3) | 124,230 |
| Professional fees | 18,684 |
| Custodian | 8,957 |
| Shareholder communication | 8,435 |
| Trustees | 115 |
| Accrued expenses | 836 |
| Total liabilities | 13,212,287 |
| Net assets | $715,239,847 |
| Composition of Net Assets |
| Shares of beneficial interest outstanding (par value of $.001 per share) unlimited number of shares authorized | $ 20,623 |
| Additional paid-in-capital | 578,174,329 |
| | 578,194,952 |
| Total distributable earnings (loss) | 137,044,895 |
| Net assets | $715,239,847 |
| Class A | |
| Net assets applicable to outstanding shares | $478,877,643 |
| Shares of beneficial interest outstanding | 13,892,358 |
| Net asset value per share outstanding | $ 34.47 |
| Maximum sales charge (5.50% of offering price) | 2.01 |
| Maximum offering price per share outstanding | $ 36.48 |
| Investor Class | |
| Net assets applicable to outstanding shares | $ 63,643,590 |
| Shares of beneficial interest outstanding | 1,903,285 |
| Net asset value per share outstanding | $ 33.44 |
| Maximum sales charge (5.00% of offering price) | 1.76 |
| Maximum offering price per share outstanding | $ 35.20 |
| Class B | |
| Net assets applicable to outstanding shares | $ 4,485,639 |
| Shares of beneficial interest outstanding | 151,628 |
| Net asset value and offering price per share outstanding | $ 29.58 |
| Class C | |
| Net assets applicable to outstanding shares | $ 1,656,946 |
| Shares of beneficial interest outstanding | 56,037 |
| Net asset value and offering price per share outstanding | $ 29.57 |
| Class I | |
| Net assets applicable to outstanding shares | $ 44,832,843 |
| Shares of beneficial interest outstanding | 1,243,543 |
| Net asset value and offering price per share outstanding | $ 36.05 |
| Class R2 | |
| Net assets applicable to outstanding shares | $ 98,639 |
| Shares of beneficial interest outstanding | 2,900 |
| Net asset value and offering price per share outstanding(a) | $ 34.02 |
| Class R6 | |
| Net assets applicable to outstanding shares | $121,644,547 |
| Shares of beneficial interest outstanding | 3,373,150 |
| Net asset value and offering price per share outstanding | $ 36.06 |
| (a) | The difference between the calculated and stated NAV was caused by rounding. |
The notes to the financial statements are an integral part of, and should be read in conjunction with, the financial statements.
13
Statement of Operations for the year ended October 31, 2023
| Investment Income (Loss) |
| Income | |
| Dividends-unaffiliated (net of foreign tax withholding of $20,025) | $ 4,578,116 |
| Dividends-affiliated | 671,388 |
| Securities lending, net | 1,687 |
| Total income | 5,251,191 |
| Expenses | |
| Manager (See Note 3) | 5,071,297 |
| Distribution/Service—Class A (See Note 3) | 1,210,111 |
| Distribution/Service—Investor Class (See Note 3) | 160,131 |
| Distribution/Service—Class B (See Note 3) | 59,481 |
| Distribution/Service—Class C (See Note 3) | 16,732 |
| Distribution/Service—Class R2 (See Note 3) | 215 |
| Transfer agent (See Note 3) | 790,270 |
| Registration | 115,175 |
| Professional fees | 111,203 |
| Custodian | 25,085 |
| Trustees | 19,317 |
| Shareholder communication | 12,091 |
| Shareholder service (See Note 3) | 86 |
| Miscellaneous | 22,258 |
| Total expenses before waiver/reimbursement | 7,613,452 |
| Expense waiver/reimbursement from Manager (See Note 3) | (150,104) |
| Reimbursement from prior custodian(a) | (1,406) |
| Net expenses | 7,461,942 |
| Net investment income (loss) | (2,210,751) |
| Realized and Unrealized Gain (Loss) |
| Net realized gain (loss) on unaffiliated investments | (23,916,618) |
| Net change in unrealized appreciation (depreciation) on unaffiliated investments | 131,428,262 |
| Net realized and unrealized gain (loss) | 107,511,644 |
| Net increase (decrease) in net assets resulting from operations | $105,300,893 |
| (a) | Represents a refund for overbilling of custody fees. |
The notes to the financial statements are an integral part of, and should be read in conjunction with, the financial statements.
| 14 | MainStay WMC Growth Fund |
Statements of Changes in Net Assets
for the years ended October 31, 2023 and October 31, 2022
| | 2023 | 2022 |
| Increase (Decrease) in Net Assets |
| Operations: | | |
| Net investment income (loss) | $ (2,210,751) | $ (4,066,150) |
| Net realized gain (loss) | (23,916,618) | (48,101,981) |
| Net change in unrealized appreciation (depreciation) | 131,428,262 | (275,635,718) |
| Net increase (decrease) in net assets resulting from operations | 105,300,893 | (327,803,849) |
| Distributions to shareholders: | | |
| Class A | — | (148,562,186) |
| Investor Class | — | (19,547,990) |
| Class B | — | (3,546,291) |
| Class C | — | (629,845) |
| Class I | — | (2,803,527) |
| Class R2 | — | (29,799) |
| Class R6 | — | (30,350,578) |
| Total distributions to shareholders | — | (205,470,216) |
| Capital share transactions: | | |
| Net proceeds from sales of shares | 34,714,414 | 100,778,400 |
| Net asset value of shares issued to shareholders in reinvestment of distributions | — | 204,082,226 |
| Cost of shares redeemed | (118,279,399) | (81,836,017) |
| Increase (decrease) in net assets derived from capital share transactions | (83,564,985) | 223,024,609 |
| Net increase (decrease) in net assets | 21,735,908 | (310,249,456) |
| Net Assets |
| Beginning of year | 693,503,939 | 1,003,753,395 |
| End of year | $ 715,239,847 | $ 693,503,939 |
The notes to the financial statements are an integral part of, and should be read in conjunction with, the financial statements.
15
Financial Highlights selected per share data and ratios
| | Year Ended October 31, |
| Class A | 2023 | | 2022 | | 2021 | | 2020 | | 2019 |
| Net asset value at beginning of year | $ 29.94 | | $ 56.51 | | $ 42.56 | | $ 36.07 | | $ 36.41 |
| Net investment income (loss) (a) | (0.12) | | (0.19) | | (0.23) | | (0.00)‡ | | 0.10 |
| Net realized and unrealized gain (loss) | 4.65 | | (14.75) | | 15.93 | | 7.78 | | 2.87 |
| Total from investment operations | 4.53 | | (14.94) | | 15.70 | | 7.78 | | 2.97 |
| Less distributions: | | | | | | | | | |
| From net investment income | — | | — | | — | | (0.16) | | (0.06) |
| From net realized gain on investments | — | | (11.63) | | (1.75) | | (1.13) | | (3.25) |
| Total distributions | — | | (11.63) | | (1.75) | | (1.29) | | (3.31) |
| Net asset value at end of year | $ 34.47 | | $ 29.94 | | $ 56.51 | | $ 42.56 | | $ 36.07 |
| Total investment return (b) | 15.13% | | (32.66)% | | 37.87% | | 22.21% | | 8.90% |
| Ratios (to average net assets)/Supplemental Data: | | | | | | | | | |
| Net investment income (loss) | (0.34)% | | (0.53)% | | (0.46)% | | 0.01% | | 0.30% |
| Net expenses (c) | 1.05% | | 1.04% | | 1.02% | | 1.04% | | 1.06% |
| Portfolio turnover rate | 42% | | 42% | | 53% | | 150% | | 153% |
| Net assets at end of year (in 000’s) | $ 478,878 | | $ 453,405 | | $ 725,468 | | $ 531,715 | | $ 436,508 |
| ‡ | Less than one cent per share. |
| (a) | Per share data based on average shares outstanding during the year. |
| (b) | Total investment return is calculated exclusive of sales charges and assumes the reinvestment of dividends and distributions. For periods of less than one year, total return is not annualized. |
| (c) | In addition to the fees and expenses which the Fund bears directly, it also indirectly bears a pro-rata share of the fees and expenses of the underlying funds in which it invests. Such indirect expenses are not included in the above expense ratios. |
| | Year Ended October 31, |
| Investor Class | 2023 | | 2022 | | 2021 | | 2020 | | 2019 |
| Net asset value at beginning of year | $ 29.12 | | $ 55.42 | | $ 41.89 | | $ 35.53 | | $ 35.94 |
| Net investment income (loss) (a) | (0.20) | | (0.29) | | (0.35) | | (0.10) | | 0.01 |
| Net realized and unrealized gain (loss) | 4.52 | | (14.38) | | 15.63 | | 7.65 | | 2.83 |
| Total from investment operations | 4.32 | | (14.67) | | 15.28 | | 7.55 | | 2.84 |
| Less distributions: | | | | | | | | | |
| From net investment income | — | | — | | — | | (0.06) | | — |
| From net realized gain on investments | — | | (11.63) | | (1.75) | | (1.13) | | (3.25) |
| Total distributions | — | | (11.63) | | (1.75) | | (1.19) | | (3.25) |
| Net asset value at end of year | $ 33.44 | | $ 29.12 | | $ 55.42 | | $ 41.89 | | $ 35.53 |
| Total investment return (b) | 14.84% | | (32.86)% | | 37.46% | | 21.84% | | 8.61% |
| Ratios (to average net assets)/Supplemental Data: | | | | | | | | | |
| Net investment income (loss) | (0.62)% | | (0.81)% | | (0.71)% | | (0.26)% | | 0.03% |
| Net expenses (c) | 1.32% | | 1.33% | | 1.32% | | 1.34% | | 1.33% |
| Expenses (before waiver/reimbursement) (c) | 1.50% | | 1.36% | | 1.40% | | 1.41% | | 1.42% |
| Portfolio turnover rate | 42% | | 42% | | 53% | | 150% | | 153% |
| Net assets at end of year (in 000's) | $ 63,644 | | $ 59,377 | | $ 93,624 | | $ 97,709 | | $ 110,762 |
| (a) | Per share data based on average shares outstanding during the year. |
| (b) | Total investment return is calculated exclusive of sales charges and assumes the reinvestment of dividends and distributions. For periods of less than one year, total return is not annualized. |
| (c) | In addition to the fees and expenses which the Fund bears directly, it also indirectly bears a pro-rata share of the fees and expenses of the underlying funds in which it invests. Such indirect expenses are not included in the above expense ratios. |
The notes to the financial statements are an integral part of, and should be read in conjunction with, the financial statements.
| 16 | MainStay WMC Growth Fund |
Financial Highlights selected per share data and ratios
| | Year Ended October 31, |
| Class B | 2023 | | 2022 | | 2021 | | 2020 | | 2019 |
| Net asset value at beginning of year | $ 25.96 | | $ 51.01 | | $ 38.96 | | $ 33.31 | | $ 34.13 |
| Net investment income (loss) (a) | (0.39) | | (0.51) | | (0.67) | | (0.36) | | (0.22) |
| Net realized and unrealized gain (loss) | 4.01 | | (12.91) | | 14.47 | | 7.14 | | 2.65 |
| Total from investment operations | 3.62 | | (13.42) | | 13.80 | | 6.78 | | 2.43 |
| Less distributions: | | | | | | | | | |
| From net realized gain on investments | — | | (11.63) | | (1.75) | | (1.13) | | (3.25) |
| Net asset value at end of year | $ 29.58 | | $ 25.96 | | $ 51.01 | | $ 38.96 | | $ 33.31 |
| Total investment return (b) | 13.94% | | (33.36)% | | 36.44% | | 20.93% | | 7.79% |
| Ratios (to average net assets)/Supplemental Data: | | | | | | | | | |
| Net investment income (loss) | (1.35)% | | (1.57)% | | (1.46)% | | (1.01)% | | (0.69)% |
| Net expenses (c) | 2.07% | | 2.08% | | 2.07% | | 2.08% | | 2.08% |
| Expenses (before waiver/reimbursement) (c) | 2.25% | | 2.11% | | 2.15% | | 2.15% | | 2.18% |
| Portfolio turnover rate | 42% | | 42% | | 53% | | 150% | | 153% |
| Net assets at end of year (in 000’s) | $ 4,486 | | $ 6,967 | | $ 15,574 | | $ 16,382 | | $ 18,749 |
| (a) | Per share data based on average shares outstanding during the year. |
| (b) | Total investment return is calculated exclusive of sales charges and assumes the reinvestment of dividends and distributions. For periods of less than one year, total return is not annualized. |
| (c) | In addition to the fees and expenses which the Fund bears directly, it also indirectly bears a pro-rata share of the fees and expenses of the underlying funds in which it invests. Such indirect expenses are not included in the above expense ratios. |
| | Year Ended October 31, |
| Class C | 2023 | | 2022 | | 2021 | | 2020 | | 2019 |
| Net asset value at beginning of year | $ 25.94 | | $ 50.99 | | $ 38.95 | | $ 33.30 | | $ 34.12 |
| Net investment income (loss) (a) | (0.40) | | (0.51) | | (0.67) | | (0.36) | | (0.21) |
| Net realized and unrealized gain (loss) | 4.03 | | (12.91) | | 14.46 | | 7.14 | | 2.64 |
| Total from investment operations | 3.63 | | (13.42) | | 13.79 | | 6.78 | | 2.43 |
| Less distributions: | | | | | | | | | |
| From net realized gain on investments | — | | (11.63) | | (1.75) | | (1.13) | | (3.25) |
| Net asset value at end of year | $ 29.57 | | $ 25.94 | | $ 50.99 | | $ 38.95 | | $ 33.30 |
| Total investment return (b) | 13.99% | | (33.37)% | | 36.42% | | 20.94% | | 7.80% |
| Ratios (to average net assets)/Supplemental Data: | | | | | | | | | |
| Net investment income (loss) | (1.37)% | | (1.56)% | | (1.46)% | | (1.02)% | | (0.67)% |
| Net expenses (c) | 2.07% | | 2.08% | | 2.07% | | 2.08% | | 2.08% |
| Expenses (before waiver/reimbursement) (c) | 2.25% | | 2.11% | | 2.15% | | 2.15% | | 2.18% |
| Portfolio turnover rate | 42% | | 42% | | 53% | | 150% | | 153% |
| Net assets at end of year (in 000’s) | $ 1,657 | | $ 1,318 | | $ 2,880 | | $ 3,068 | | $ 3,144 |
| (a) | Per share data based on average shares outstanding during the year. |
| (b) | Total investment return is calculated exclusive of sales charges and assumes the reinvestment of dividends and distributions. For periods of less than one year, total return is not annualized. |
| (c) | In addition to the fees and expenses which the Fund bears directly, it also indirectly bears a pro-rata share of the fees and expenses of the underlying funds in which it invests. Such indirect expenses are not included in the above expense ratios. |
The notes to the financial statements are an integral part of, and should be read in conjunction with, the financial statements.
17
Financial Highlights selected per share data and ratios
| | Year Ended October 31, |
| Class I | 2023 | | 2022 | | 2021 | | 2020 | | 2019 |
| Net asset value at beginning of year | $ 31.22 | | $ 58.27 | | $ 43.72 | | $ 37.01 | | $ 37.28 |
| Net investment income (loss) (a) | (0.02) | | (0.07) | | 0.02 | | 0.11 | | 0.19 |
| Net realized and unrealized gain (loss) | 4.85 | | (15.35) | | 16.28 | | 7.97 | | 2.95 |
| Total from investment operations | 4.83 | | (15.42) | | 16.30 | | 8.08 | | 3.14 |
| Less distributions: | | | | | | | | | |
| From net investment income | — | | — | | — | | (0.24) | | (0.16) |
| From net realized gain on investments | — | | (11.63) | | (1.75) | | (1.13) | | (3.25) |
| Total distributions | — | | (11.63) | | (1.75) | | (1.37) | | (3.41) |
| Net asset value at end of year | $ 36.05 | | $ 31.22 | | $ 58.27 | | $ 43.72 | | $ 37.01 |
| Total investment return (b) | 15.47% | | (32.46)% | | 38.25% | | 22.53% | | 9.18% |
| Ratios (to average net assets)/Supplemental Data: | | | | | | | | | |
| Net investment income (loss) | (0.04)% | | (0.20)% | | 0.04% | | 0.28% | | 0.53% |
| Net expenses (c) | 0.75% | | 0.75% | | 0.77% | | 0.79% | | 0.81% |
| Expenses (before waiver/reimbursement) (c) | 0.80% | | 0.79% | | 0.78% | | 0.79% | | 0.81% |
| Portfolio turnover rate | 42% | | 42% | | 53% | | 150% | | 153% |
| Net assets at end of year (in 000’s) | $ 44,833 | | $ 38,498 | | $ 14,025 | | $ 102,290 | | $ 139,588 |
| (a) | Per share data based on average shares outstanding during the year. |
| (b) | Total investment return is calculated exclusive of sales charges and assumes the reinvestment of dividends and distributions. Class I shares are not subject to sales charges. For periods of less than one year, total return is not annualized. |
| (c) | In addition to the fees and expenses which the Fund bears directly, it also indirectly bears a pro-rata share of the fees and expenses of the underlying funds in which it invests. Such indirect expenses are not included in the above expense ratios. |
| | Year Ended October 31, |
| Class R2 | 2023 | | 2022 | | 2021 | | 2020 | | 2019 |
| Net asset value at beginning of year | $ 29.57 | | $ 56.01 | | $ 42.24 | | $ 35.81 | | $ 36.16 |
| Net investment income (loss) (a) | (0.15) | | (0.23) | | (0.28) | | (0.04) | | 0.07 |
| Net realized and unrealized gain (loss) | 4.60 | | (14.58) | | 15.80 | | 7.72 | | 2.86 |
| Total from investment operations | 4.45 | | (14.81) | | 15.52 | | 7.68 | | 2.93 |
| Less distributions: | | | | | | | | | |
| From net investment income | — | | — | | — | | (0.12) | | (0.03) |
| From net realized gain on investments | — | | (11.63) | | (1.75) | | (1.13) | | (3.25) |
| Total distributions | — | | (11.63) | | (1.75) | | (1.25) | | (3.28) |
| Net asset value at end of year | $ 34.02 | | $ 29.57 | | $ 56.01 | | $ 42.24 | | $ 35.81 |
| Total investment return (b) | 15.05%(c) | | (32.74)% | | 37.72% | | 22.08% | | 8.81% |
| Ratios (to average net assets)/Supplemental Data: | | | | | | | | | |
| Net investment income (loss) | (0.45)% | | (0.63)% | | (0.55)% | | (0.11)% | | 0.21% |
| Net expenses (d) | 1.15% | | 1.14% | | 1.12% | | 1.14% | | 1.16% |
| Portfolio turnover rate | 42% | | 42% | | 53% | | 150% | | 153% |
| Net assets at end of year (in 000’s) | $ 99 | | $ 72 | | $ 143 | | $ 109 | | $ 59 |
| (a) | Per share data based on average shares outstanding during the year. |
| (b) | Total investment return is calculated exclusive of sales charges and assumes the reinvestment of dividends and distributions. Class R2 shares are not subject to sales charges. For periods of less than one year, total return is not annualized. |
| (c) | Total investment return may reflect adjustments to conform to generally accepted accounting principles. |
| (d) | In addition to the fees and expenses which the Fund bears directly, it also indirectly bears a pro-rata share of the fees and expenses of the underlying funds in which it invests. Such indirect expenses are not included in the above expense ratios. |
The notes to the financial statements are an integral part of, and should be read in conjunction with, the financial statements.
| 18 | MainStay WMC Growth Fund |
Financial Highlights selected per share data and ratios
| | Year Ended October 31, | | April 26, 2021^ through
October 31, |
| Class R6 | 2023 | | 2022 | | 2021 |
| Net asset value at beginning of period | $ 31.22 | | $ 58.27 | | $ 53.43 |
| Net investment income (loss) (a) | (0.01) | | (0.08) | | (0.19) |
| Net realized and unrealized gain (loss) | 4.85 | | (15.34) | | 5.03 |
| Total from investment operations | 4.84 | | (15.42) | | 4.84 |
| Less distributions: | | | | | |
| From net realized gain on investments | — | | (11.63) | | — |
| Net asset value at end of period | $ 36.06 | | $ 31.22 | | $ 58.27 |
| Total investment return (b) | 15.50% | | (32.46)% | | 9.06% |
| Ratios (to average net assets)/Supplemental Data: | | | | | |
| Net investment income (loss) | (0.02)% | | (0.20)% | | (0.37)%†† |
| Net expenses (c) | 0.73% | | 0.72% | | 0.71%†† |
| Expenses (before waiver/reimbursement) (c) | 0.73% | | 0.72% | | 0.72%†† |
| Portfolio turnover rate | 42% | | 42% | | 53% |
| Net assets at end of period (in 000’s) | $ 121,645 | | $ 133,867 | | $ 152,039 |
| ^ | Inception date. |
| †† | Annualized. |
| (a) | Per share data based on average shares outstanding during the period. |
| (b) | Total investment return is calculated exclusive of sales charges and assumes the reinvestment of dividends and distributions. Class R6 shares are not subject to sales charges. For periods of less than one year, total return is not annualized. |
| (c) | In addition to the fees and expenses which the Fund bears directly, it also indirectly bears a pro-rata share of the fees and expenses of the underlying funds in which it invests. Such indirect expenses are not included in the above expense ratios. |
The notes to the financial statements are an integral part of, and should be read in conjunction with, the financial statements.
19
Notes to Financial Statements
Note 1-Organization and Business
MainStay Funds Trust (the “Trust”) was organized as a Delaware statutory trust on April 28, 2009. The Trust is registered under the Investment Company Act of 1940, as amended (the “1940 Act”), as an open-end management investment company, and is comprised of thirty-seven funds (collectively referred to as the “Funds”). These financial statements and notes relate to the MainStay WMC Growth Fund (the "Fund"), a “diversified” fund, as that term is defined in the 1940 Act, as interpreted or modified by regulatory authorities having jurisdiction, from time to time.
The following table lists the Fund's share classes that have been registered and commenced operations:
| Class | Commenced Operations |
| Class A | August 7, 2006 |
| Investor Class | January 18, 2013 |
| Class B | January 18, 2013 |
| Class C | January 18, 2013 |
| Class I | November 2, 2009 |
| Class R2* | January 18, 2013 |
| Class R6 | April 26, 2021 |
| * | As of October 31, 2023, Class R2 shares are closed to new investors and, upon the close of business on December 29, 2023, Class R2 shares are closed to additional investments by existing shareholders. Additionally, Class R2 shares will be liquidated on or about February 28, 2024 (the "Liquidation Date"). It is expected that the Fund will distribute to remaining shareholders invested in Class R2 shares, on or promptly after the Liquidation Date, a liquidating distribution in cash or cash equivalents equal to the net asset value of such shares. |
Class B shares of the MainStay Group of Funds are closed to all new purchases as well as additional investments by existing Class B shareholders. Existing Class B shareholders may continue to reinvest dividends and capital gains distributions, as well as exchange their Class B shares for Class B shares of other funds in the MainStay Group of Funds as permitted by the current exchange privileges. Class B shareholders continue to be subject to any applicable contingent deferred sales charge ("CDSC") at the time of redemption. All other features of the Class B shares, including but not limited to the fees and expenses applicable to Class B shares, remain unchanged. Unless redeemed, Class B shareholders will remain in Class B shares of their respective fund until the Class B shares are converted to Class A or Investor Class shares pursuant to the applicable conversion schedule.
Class A and Investor Class shares are offered at net asset value (“NAV”) per share plus an initial sales charge. No initial sales charge applies to investments of $1 million or more (and certain other qualified purchases) in Class A and Investor Class shares. However, a CDSC of 1.00% may be imposed on certain redemptions made within 18 months of the date of purchase on shares that were purchased without an initial sales charge. Class C shares are offered at NAV without an initial sales charge, although a 1.00% CDSC may be imposed on certain redemptions of such shares made within one year of the date of purchase of Class C shares. When Class B shares were offered, they were offered at NAV without an
initial sales charge, although a CDSC that declines depending on the number of years a shareholder held its Class B shares may be imposed on certain redemptions of such shares made within six years of the date of purchase of such shares. Class I, Class R2 and Class R6 shares are offered at NAV without a sales charge. Depending upon eligibility, Class B shares convert to either Class A or Investor Class shares at the end of the calendar quarter eight years after the date they were purchased. In addition, depending upon eligibility, Class C shares convert to either Class A or Investor Class shares at the end of the calendar quarter eight years after the date they were purchased. Additionally, Investor Class shares may convert automatically to Class A shares. Under certain circumstances and as may be permitted by the Trust’s multiple class plan pursuant to Rule 18f-3 under the 1940 Act, specified share classes of the Fund may be converted to one or more other share classes of the Fund as disclosed in the capital share transactions within these Notes. The classes of shares have the same voting (except for issues that relate solely to one class), dividend, liquidation and other rights, and the same terms and conditions, except that under a distribution plan pursuant to Rule 12b-1 under the 1940 Act, Class B and Class C shares are subject to higher distribution and/or service fees than Class A, Investor Class and Class R2 shares. Class I and Class R6 shares are not subject to a distribution and/or service fee. Class R2 shares are subject to a shareholder service fee. This is in addition to any fees paid under a distribution plan, where applicable.
At a meeting held on September 25-26, 2023, the Board of Trustees (the “Board”) of the Trust, after careful consideration of a number of factors and upon the recommendation of the Fund's investment adviser, New York Life Investment Management LLC (“New York Life Investments” or the "Manager"), approved a proposal to liquidate Class R2 shares of the Fund on or about February 28, 2024, pursuant to the terms of a plan of liquidation.
The Fund's investment objective is to seek long-term growth of capital.
Note 2–Significant Accounting Policies
The Fund is an investment company and accordingly follows the investment company accounting and reporting guidance of the Financial Accounting Standards Board (“FASB”) Accounting Standards Codification Topic 946 Financial Services—Investment Companies. The Fund prepares its financial statements in accordance with generally accepted accounting principles (“GAAP”) in the United States of America and follows the significant accounting policies described below.
(A) Securities Valuation. Investments are usually valued as of the close of regular trading on the New York Stock Exchange (the "Exchange") (usually 4:00 p.m. Eastern time) on each day the Fund is open for business ("valuation date").
Pursuant to Rule 2a-5 under the 1940 Act, the Board has designated New York Life Investments as its Valuation Designee (the "Valuation Designee"). The Valuation Designee is responsible for performing fair valuations relating to all investments in the Fund’s portfolio for which
| 20 | MainStay WMC Growth Fund |
market quotations are not readily available; periodically assessing and managing material valuation risks; establishing and applying fair value methodologies; testing fair valuation methodologies; evaluating and overseeing pricing services; ensuring appropriate segregation of valuation and portfolio management functions; providing quarterly, annual and prompt reporting to the Board, as appropriate; identifying potential conflicts of interest; and maintaining appropriate records. The Valuation Designee has established a valuation committee ("Valuation Committee") to assist in carrying out the Valuation Designee’s responsibilities and establish prices of securities for which market quotations are not readily available. The Fund's and the Valuation Designee's policies and procedures ("Valuation Procedures") govern the Valuation Designee’s selection and application of methodologies for determining and calculating the fair value of Fund investments. The Valuation Designee may value the Fund's portfolio securities for which market quotations are not readily available and other Fund assets utilizing inputs from pricing services and other third-party sources. The Valuation Committee meets (in person, via electronic mail or via teleconference) on an ad-hoc basis to determine fair valuations and on a quarterly basis to review fair value events with respect to certain securities for which market quotations are not readily available, including valuation risks and back-testing results, and preview reports to the Board.
The Valuation Committee establishes prices of securities for which market quotations are not readily available based on such methodologies and measurements on a regular basis after considering information that is reasonably available and deemed relevant by the Valuation Committee. The Board shall oversee the Valuation Designee and review fair valuation materials on a prompt, quarterly and annual basis and approve proposed revisions to the Valuation Procedures.
Investments for which market quotations are not readily available are valued at fair value as determined in good faith pursuant to the Valuation Procedures. A market quotation is readily available only when that quotation is a quoted price (unadjusted) in active markets for identical investments that the Fund can access at the measurement date, provided that a quotation will not be readily available if it is not reliable. "Fair value" is defined as the price the Fund would reasonably expect to receive upon selling an asset or liability in an orderly transaction to an independent buyer in the principal or most advantageous market for the asset or liability. Fair value measurements are determined within a framework that establishes a three-tier hierarchy that maximizes the use of observable market data and minimizes the use of unobservable inputs to establish a classification of fair value measurements for disclosure purposes. "Inputs" refer broadly to the assumptions that market participants would use in pricing the asset or liability, including assumptions about risk, such as the risk inherent in a particular valuation technique used to measure fair value using a pricing model and/or the risk inherent in the inputs for the valuation technique. Inputs may be observable or unobservable. Observable inputs reflect the assumptions market participants would use in pricing the asset or liability based on market data obtained from sources independent of the Fund. Unobservable inputs reflect the Fund’s own assumptions about the assumptions market participants would use
in pricing the asset or liability based on the information available. The inputs or methodology used for valuing assets or liabilities may not be an indication of the risks associated with investing in those assets or liabilities. The three-tier hierarchy of inputs is summarized below.
| • | Level 1—quoted prices (unadjusted) in active markets for an identical asset or liability |
| • | Level 2—other significant observable inputs (including quoted prices for a similar asset or liability in active markets, interest rates and yield curves, prepayment speeds, credit risk, etc.) |
| • | Level 3—significant unobservable inputs (including the Fund's own assumptions about the assumptions that market participants would use in measuring fair value of an asset or liability) |
The level of an asset or liability within the fair value hierarchy is based on the lowest level of an input, both individually and in the aggregate, that is significant to the fair value measurement. The aggregate value by input level of the Fund’s assets and liabilities as of October 31, 2023, is included at the end of the Portfolio of Investments.
The Fund may use third-party vendor evaluations, whose prices may be derived from one or more of the following standard inputs, among others:
| • Broker/dealer quotes | • Benchmark securities |
| • Two-sided markets | • Reference data (corporate actions or material event notices) |
| • Bids/offers | • Monthly payment information |
| • Industry and economic events | • Reported trades |
An asset or liability for which a market quotation is not readily available is valued by methods deemed reasonable in good faith by the Valuation Committee, following the Valuation Procedures to represent fair value. Under these procedures, the Valuation Designee generally uses a market-based approach which may use related or comparable assets or liabilities, recent transactions, market multiples, book values and other relevant information. The Valuation Designee may also use an income-based valuation approach in which the anticipated future cash flows of the asset or liability are discounted to calculate fair value. Discounts may also be applied due to the nature and/or duration of any restrictions on the disposition of the asset or liability. Fair value represents a good faith approximation of the value of a security. Fair value determinations involve the consideration of a number of subjective factors, an analysis of applicable facts and circumstances and the exercise of judgment. As a result, it is possible that the fair value for a security determined in good faith in accordance with the Valuation Procedures may differ from valuations for the same security determined for other funds using their own valuation procedures. Although the Valuation Procedures are designed to value a security at the price the Fund may reasonably expect to receive upon the security's sale in an orderly transaction, there can be no assurance that any fair value determination thereunder would, in fact, approximate the amount that the Fund would actually realize upon the sale of the security or the price at which the security would trade if a reliable market price were readily
Notes to Financial Statements (continued)
available. During the year ended October 31, 2023, there were no material changes to the fair value methodologies.
Securities which may be valued in this manner include, but are not limited to: (i) a security for which trading has been halted or suspended or otherwise does not have a readily available market quotation on a given day; (ii) a debt security that has recently gone into default and for which there is not a current market quotation; (iii) a security of an issuer that has entered into a restructuring; (iv) a security that has been delisted from a national exchange; (v) a security subject to trading collars for which no or limited trading takes place; and (vi) a security whose principal market has been temporarily closed at a time when, under normal conditions, it would be open. Securities valued in this manner are generally categorized as Level 2 or 3 in the hierarchy. No securities held by the Fund as of October 31, 2023, were fair valued in such a manner.
Equity securities, rights and warrants, if applicable, are valued at the last quoted sales prices as of the close of regular trading on the relevant exchange on each valuation date. Securities that are not traded on the valuation date are valued at the mean of the last quoted bid and ask prices. Prices are normally taken from the principal market in which each security trades. These securities are generally categorized as Level 1 in the hierarchy.
Investments in mutual funds, including money market funds, are valued at their respective NAVs at the close of business each day on the valuation date. These securities are generally categorized as Level 1 in the hierarchy.
Temporary cash investments acquired in excess of 60 days to maturity at the time of purchase are valued using the latest bid prices or using valuations based on a matrix system (which considers such factors as security prices, yields, maturities and ratings), both as furnished by independent pricing services. Temporary cash investments that mature in 60 days or less at the time of purchase ("Short-Term Investments") are valued using the amortized cost method of valuation, unless the use of such method would be inappropriate. The amortized cost method involves valuing a security at its cost on the date of purchase and thereafter assuming a constant amortization to maturity of the difference between such cost and the value on maturity date. Amortized cost approximates the current fair value of a security. Securities valued using the amortized cost method are not valued using quoted prices in an active market and are generally categorized as Level 2 in the hierarchy.
The information above is not intended to reflect an exhaustive list of the methodologies that may be used to value portfolio investments. The Valuation Procedures permit the use of a variety of valuation methodologies in connection with valuing portfolio investments. The methodology used for a specific type of investment may vary based on the market data available or other considerations. The methodologies summarized above may not represent the specific means by which portfolio investments are valued on any particular business day.
(B) Income Taxes. The Fund's policy is to comply with the requirements of the Internal Revenue Code of 1986, as amended (the “Internal Revenue Code”), applicable to regulated investment companies and to distribute all of its taxable income to the shareholders of the Fund within the allowable time limits.
The Manager evaluates the Fund’s tax positions to determine if the tax positions taken meet the minimum recognition threshold in connection with accounting for uncertainties in income tax positions taken or expected to be taken for the purposes of measuring and recognizing tax liabilities in the financial statements. Recognition of tax benefits of an uncertain tax position is permitted only to the extent the position is “more likely than not” to be sustained assuming examination by taxing authorities. The Manager analyzed the Fund's tax positions taken on federal, state and local income tax returns for all open tax years (for up to three tax years) and has concluded that no provisions for federal, state and local income tax are required in the Fund's financial statements. The Fund's federal, state and local income tax and federal excise tax returns for tax years for which the applicable statutes of limitations have not expired are subject to examination by the Internal Revenue Service and state and local departments of revenue.
(C) Dividends and Distributions to Shareholders. Dividends and distributions are recorded on the ex-dividend date. The Fund intends to declare and pay dividends from net investment income and distributions from net realized capital and currency gains, if any, at least annually. Unless a shareholder elects otherwise, all dividends and distributions are reinvested at NAV in the same class of shares of the Fund. Dividends and distributions to shareholders are determined in accordance with federal income tax regulations and may differ from determinations using GAAP.
(D) Security Transactions and Investment Income. The Fund records security transactions on the trade date. Realized gains and losses on security transactions are determined using the identified cost method. Dividend income is recognized on the ex-dividend date, net of any foreign tax withheld at the source, and interest income is accrued as earned using the effective interest rate method. Distributions received from real estate investment trusts may be classified as dividends, capital gains and/or return of capital.
Investment income and realized and unrealized gains and losses on investments of the Fund are allocated pro rata to the separate classes of shares based upon their relative net assets on the date the income is earned or realized and unrealized gains and losses are incurred.
(E) Expenses. Expenses of the Trust are allocated to the individual Funds in proportion to the net assets of the respective Funds when the expenses are incurred, except where direct allocations of expenses can be made. Expenses (other than transfer agent expenses and fees incurred under the shareholder services plans and/or the distribution plans further discussed in Note 3(B)) are allocated to separate classes of shares pro rata based upon their relative net assets on the date the expenses are incurred. The expenses borne by the Fund, including those of related parties to the Fund, are shown in the Statement of Operations.
| 22 | MainStay WMC Growth Fund |
Additionally, the Fund may invest in mutual funds, which are subject to management fees and other fees that may cause the costs of investing in mutual funds to be greater than the costs of owning the underlying securities directly. These indirect expenses of mutual funds are not included in the amounts shown as expenses in the Statement of Operations or in the expense ratios included in the Financial Highlights.
(F) Use of Estimates. In preparing financial statements in conformity with GAAP, the Manager makes estimates and assumptions that affect the reported amounts and disclosures in the financial statements. Actual results could differ from those estimates and assumptions.
(G) Securities Lending. In order to realize additional income, the Fund may engage in securities lending, subject to the limitations set forth in the 1940 Act and relevant guidance by the staff of the Securities and Exchange Commission (“SEC”). If the Fund engages in securities lending, the Fund will lend through its custodian, JPMorgan Chase Bank, N.A., ("JPMorgan"), acting as securities lending agent on behalf of the Fund. Under the current arrangement, JPMorgan will manage the Fund's collateral in accordance with the securities lending agency agreement between the Fund and JPMorgan, and indemnify the Fund against counterparty risk. The loans will be collateralized by cash (which may be invested in a money market fund) and/or non-cash collateral (which may include U.S. Treasury securities and/or U.S. government agency securities issued or guaranteed by the United States government or its agencies or instrumentalities) at least equal at all times to the market value of the securities loaned. Non-cash collateral held at year end is segregated and cannot be transferred by the Fund. The Fund bears the risk of delay in recovery of, or loss of rights in, the securities loaned. The Fund may also record a realized gain or loss on securities deemed sold due to a borrower’s inability to return securities on loan. The Fund bears the risk of any loss on investment of cash collateral. The Fund will receive compensation for lending its securities in the form of fees or it will retain a portion of interest earned on the investment of any cash collateral. The Fund will also continue to receive interest and dividends on the securities loaned and any gain or loss in the market price of the securities loaned that may occur during the term of the loan will be for the account of the Fund. Income earned from securities lending activities, if any, is reflected in the Statement of Operations. As of October 31, 2023, the Fund did not have any portfolio securities on loan.
(H) Indemnifications. Under the Trust’s organizational documents, its officers and trustees are indemnified against certain liabilities that may arise out of performance of their duties to the Trust. Additionally, in the normal course of business, the Fund enters into contracts with third-party service providers that contain a variety of representations and warranties and that may provide general indemnifications. The Fund's maximum exposure under these arrangements is unknown, as this would involve future claims that may be made against the Fund that have not yet occurred. The Manager believes that the risk of loss in connection with these potential indemnification obligations is remote. However, there can be no assurance that material liabilities related to such obligations will not arise in the future, which could adversely impact the Fund.
Note 3–Fees and Related Party Transactions
(A) Manager and Subadvisor. New York Life Investments, a registered investment adviser and an indirect, wholly-owned subsidiary of New York Life Insurance Company ("New York Life"), serves as the Fund's Manager, pursuant to an Amended and Restated Management Agreement ("Management Agreement"). The Manager provides offices, conducts clerical, recordkeeping and bookkeeping services and keeps most of the financial and accounting records required to be maintained by the Fund. Except for the portion of salaries and expenses that are the responsibility of the Fund, the Manager pays the salaries and expenses of all personnel affiliated with the Fund and certain operational expenses of the Fund. The Fund reimburses New York Life Investments in an amount equal to the portion of the compensation of the Chief Compliance Officer attributable to the Fund. Wellington Management Company LLP ("Wellington" or the "Subadvisor"), a registered investment adviser, serves as the Subadvisor to the Fund and is responsible for the day-to-day portfolio management of the Fund. Pursuant to the terms of a Subadvisory Agreement ("Subadvisory Agreement") between New York Life Investments and Wellington, New York Life Investments pays for the services of the Subadvisor.
Pursuant to the Management Agreement, the Fund pays the Manager a monthly fee for the services performed and the facilities furnished at an annual rate of the Fund’s average daily net assets as follows: 0.70% up to $500 million; 0.65% from $500 million to $1 billion; 0.625% from $1 billion to $2 billion; and 0.60% in excess of $2 billion. During the year ended October 31, 2023, the effective management fee rate was 0.68% of the Fund’s average daily net assets, exclusive of any applicable waivers/reimbursements.
New York Life Investments has contractually agreed to waive fees and/or reimburse expenses so that Total Annual Fund Operating Expenses (excluding taxes, interest, litigation, extraordinary expenses, brokerage and other transaction expenses relating to the purchase or sale of portfolio investments, and acquired (underlying) fund fees and expenses) for Class I shares do not exceed 0.75% of its average daily net assets. In addition, New York Life Investments will waive fees and/or reimburse expenses so that Total Annual Fund Operating Expenses (excluding taxes, interest, litigation, extraordinary expenses, brokerage and other transaction expenses relating to the purchase or sale of portfolio investments, and acquired (underlying) fund fees and expenses) for Class R6 do not exceed those of Class I. This agreement will remain in effect until February 28, 2024, and shall renew automatically for one-year terms unless New York Life Investments provides written notice of termination prior to the start of the next term or upon approval of the Board.
Additionally, New York Life Investments has agreed to further voluntarily waive fees and/or reimburse expenses of the appropriate class of the Fund so that Total Annual Fund Operating Expenses (excluding taxes, interest, litigation, extraordinary expenses, brokerage and other transaction expenses relating to the purchase and sale of portfolio investments, and acquired (underlying) fund fees and expenses) of Class I
Notes to Financial Statements (continued)
shares do not exceed 0.92%. These voluntary waivers or reimbursements may be discontinued at any time without notice.
During the year ended October 31, 2023, New York Life Investments earned fees from the Fund in the amount of $5,071,297 and waived fees and/or reimbursed expenses, including the waiver/reimbursement of certain class specific expenses in the amount of $150,104 and paid the Subadvisor fees in the amount of $2,080,485.
JPMorgan provides sub-administration and sub-accounting services to the Fund pursuant to an agreement with New York Life Investments. These services include calculating the daily NAVs of the Fund, maintaining the general ledger and sub-ledger accounts for the calculation of the Fund's NAVs, and assisting New York Life Investments in conducting various aspects of the Fund's administrative operations. For providing these services to the Fund, JPMorgan is compensated by New York Life Investments.
Pursuant to an agreement between the Trust and New York Life Investments, New York Life Investments is responsible for providing or procuring certain regulatory reporting services for the Fund. The Fund will reimburse New York Life Investments for the actual costs incurred by New York Life Investments in connection with providing or procuring these services for the Fund.
(B) Distribution and Service Fees. The Trust, on behalf of the Fund, has entered into a distribution agreement with NYLIFE Distributors LLC (the “Distributor”), an affiliate of New York Life Investments. The Fund has adopted distribution plans (the “Plans”) in accordance with the provisions of Rule 12b-1 under the 1940 Act.
Pursuant to the Class A, Investor Class and Class R2 Plans, the Distributor receives a monthly fee from the Class A, Investor Class and Class R2 shares at an annual rate of 0.25% of the average daily net assets of the Class A, Investor Class and Class R2 shares for distribution and/or service activities as designated by the Distributor. Pursuant to the Class B and Class C Plans, Class B and Class C shares pay the Distributor a monthly distribution fee at an annual rate of 0.75% of the average daily net assets of the Class B and Class C shares, along with a service fee at an annual rate of 0.25% of the average daily net assets of the Class B and Class C shares, for a total 12b-1 fee of 1.00%. Class I and Class R6 shares are not subject to a distribution and/or service fee.
The Plans provide that the distribution and service fees are payable to the Distributor regardless of the amounts actually expended by the Distributor for distribution of the Fund's shares and service activities.
In accordance with the Shareholder Services Plans for the Class R2 shares, the Manager has agreed to provide, through its affiliates or independent third parties, various shareholder and administrative support services to shareholders of the Class R2 shares. For its services, the Manager, its affiliates or independent third-party service providers are entitled to a shareholder service fee accrued daily and paid monthly at an annual rate of 0.10% of the average daily net assets of the Class R2 shares. This is in addition to any fees paid under the Class R2 Plan.
During the year ended October 31, 2023, shareholder service fees incurred by the Fund were as follows:
(C) Sales Charges. The Fund was advised by the Distributor that the amount of initial sales charges retained on sales of Class A and Investor Class shares during the year ended October 31, 2023, were $20,601 and $4,563, respectively.
The Fund was also advised that the Distributor retained CDSCs on redemptions of Class A, Class B and Class C shares during the year ended October 31, 2023, of $1,702, $74 and $143, respectively.
(D) Transfer, Dividend Disbursing and Shareholder Servicing Agent. NYLIM Service Company LLC, an affiliate of New York Life Investments, is the Fund's transfer, dividend disbursing and shareholder servicing agent pursuant to an agreement between NYLIM Service Company LLC and the Trust. NYLIM Service Company LLC has entered into an agreement with SS&C Global Investor & Distribution Solutions, Inc. ("SS&C"), pursuant to which SS&C performs certain transfer agent services on behalf of NYLIM Service Company LLC. New York Life Investments has contractually agreed to limit the transfer agency expenses charged to the Fund’s share classes to a maximum of 0.35% of that share class’s average daily net assets on an annual basis after deducting any applicable Fund or class-level expense reimbursement or small account fees. This agreement will remain in effect until February 28, 2024, and shall renew automatically for one-year terms unless New York Life Investments provides written notice of termination prior to the start of the next term or upon approval of the Board. During the year ended October 31, 2023, transfer agent expenses incurred by the Fund and any reimbursements, pursuant to the aforementioned Transfer Agency expense limitation agreement, were as follows:
| Class | Expense | Waived |
| Class A | $373,827 | $ — |
| Investor Class | 336,922 | (113,921) |
| Class B | 31,469 | (10,734) |
| Class C | 8,803 | (2,977) |
| Class I | 33,485 | — |
| Class R2 | 66 | — |
| Class R6 | 5,698 | — |
(E) Small Account Fee. Shareholders with small accounts adversely impact the cost of providing transfer agency services. In an effort to reduce total transfer agency expenses, the Fund has implemented a small account fee on certain types of accounts. As described in the Fund's prospectus, certain shareholders with an account balance of less than $1,000 ($5,000 for Class A share accounts) are charged an annual per account fee of $20 (assessed semi-annually), the proceeds from which offset transfer agent fees as reflected in the Statement of Operations. This small account fee will not apply to certain types of accounts as described further in the Fund’s prospectus.
| 24 | MainStay WMC Growth Fund |
(F) Capital. As of October 31, 2023, New York Life and its affiliates beneficially held shares of the Fund with the values and percentages of net assets as follows:
| Class R2 | $64,428 | 65.3% |
| Class R6 | 21,269 | 0.0‡ |
| ‡ | Less than one-tenth of a percent. |
Note 4-Federal Income Tax
As of October 31, 2023, the cost and unrealized appreciation (depreciation) of the Fund’s investment portfolio, including applicable derivative contracts and other financial instruments, as determined on a federal income tax basis, were as follows:
| | Federal Tax
Cost | Gross
Unrealized
Appreciation | Gross
Unrealized
(Depreciation) | Net
Unrealized
Appreciation/
(Depreciation) |
| Investments in Securities | $518,355,145 | $237,134,702 | $(34,264,119) | $202,870,583 |
As of October 31, 2023, the components of accumulated gain (loss) on a tax basis were as follows:
Ordinary
Income | Accumulated
Capital
and Other
Gain (Loss) | Other
Temporary
Differences | Unrealized
Appreciation
(Depreciation) | Total
Accumulated
Gain (Loss) |
| $— | $(65,825,688) | $— | $202,870,583 | $137,044,895 |
The difference between book-basis and tax-basis unrealized appreciation (depreciation) is primarily due to wash sale adjustments.
The following table discloses the current year reclassifications between total distributable earnings (loss) and additional paid-in capital arising from permanent differences; net assets as of October 31, 2023 were not affected.
| | Total
Distributable
Earnings (Loss) | Additional
Paid-In
Capital |
| | $3,098,401 | $(3,098,401) |
The reclassifications for the Fund are primarily due to net operating losses.
As of October 31, 2023, for federal income tax purposes, capital loss carryforwards of $63,962,057, as shown in the table below, were available to the extent provided by the regulations to offset future realized gains of the Fund. Accordingly, no capital gains distributions are expected to be paid to shareholders until net gains have been realized in excess of such amounts.
Capital Loss
Available Through | Short-Term
Capital Loss
Amounts (000’s) | Long-Term
Capital Loss
Amounts (000’s) |
| Unlimited | $43,133 | $20,829 |
During the years ended October 31, 2023 and October 31, 2022, the tax character of distributions paid as reflected in the Statements of Changes in Net Assets was as follows:
| | 2023 | 2022 |
| Distributions paid from: | | |
| Ordinary Income | $— | $ 74,525,288 |
| Long-Term Capital Gains | — | 130,944,928 |
| Total | $— | $205,470,216 |
Note 5–Custodian
JPMorgan is the custodian of cash and securities held by the Fund. Custodial fees are charged to the Fund based on the Fund's net assets and/or the market value of securities held by the Fund and the number of certain transactions incurred by the Fund.
Note 6–Line of Credit
The Fund and certain other funds managed by New York Life Investments maintain a line of credit with a syndicate of banks in order to secure a source of funds for temporary purposes to meet unanticipated or excessive redemption requests.
Effective July 25, 2023, under the credit agreement (the “Credit Agreement”), the aggregate commitment amount is $600,000,000 with an additional uncommitted amount of $100,000,000. The commitment fee is an annual rate of 0.15% of the average commitment amount payable quarterly, regardless of usage, to JPMorgan, who serves as the agent to the syndicate. The commitment fee is allocated among the Fund and certain other funds managed by New York Life Investments based upon their respective net assets and other factors. Interest on any revolving credit loan is charged based upon the Federal Funds Rate, Daily Simple Secured Overnight Financing Rate ("SOFR") + 0.10%, or the Overnight Bank Funding Rate, whichever is higher. The Credit Agreement expires on July 23, 2024, although the Fund, certain other funds managed by New York Life Investments and the syndicate of banks may renew the Credit Agreement for an additional year on the same or different terms or enter into a credit agreement with a different syndicate of banks. Prior to July 25, 2023, the aggregate commitment amount and the commitment fee were the same as those under the current Credit Agreement. During the year ended October 31, 2023, there were no borrowings made or outstanding with respect to the Fund under the Credit Agreement.
Note 7–Interfund Lending Program
Pursuant to an exemptive order issued by the SEC, the Fund, along with certain other funds managed by New York Life Investments, may participate in an interfund lending program. The interfund lending program provides an alternative credit facility that permits the Fund and certain other funds managed by New York Life Investments to lend or borrow money for temporary purposes directly to or from one another, subject to the conditions of the exemptive order. During the year ended
Notes to Financial Statements (continued)
October 31, 2023, there were no interfund loans made or outstanding with respect to the Fund.
Note 8–Purchases and Sales of Securities (in 000’s)
During the year ended October 31, 2023, purchases and sales of securities, other than short-term securities, were $302,567 and $386,602, respectively.
The Fund may purchase securities from or sell securities to other portfolios managed by the Subadvisor. These interportfolio transactions are primarily used for cash management purposes and are made pursuant to Rule 17a-7 under the 1940 Act. During the year ended October 31, 2023, such purchases were $1,033.
Note 9–Capital Share Transactions
Transactions in capital shares for the years ended October 31, 2023 and October 31, 2022, were as follows:
| Class A | Shares | Amount |
| Year ended October 31, 2023: | | |
| Shares sold | 419,872 | $ 13,446,001 |
| Shares redeemed | (1,789,046) | (58,865,219) |
| Net increase (decrease) in shares outstanding before conversion | (1,369,174) | (45,419,218) |
| Shares converted into Class A (See Note 1) | 120,716 | 4,071,859 |
| Shares converted from Class A (See Note 1) | (3,618) | (116,866) |
| Net increase (decrease) | (1,252,076) | $ (41,464,225) |
| Year ended October 31, 2022: | | |
| Shares sold | 333,429 | $ 13,175,004 |
| Shares issued to shareholders in reinvestment of distributions | 3,431,447 | 147,312,452 |
| Shares redeemed | (1,572,361) | (57,271,433) |
| Net increase (decrease) in shares outstanding before conversion | 2,192,515 | 103,216,023 |
| Shares converted into Class A (See Note 1) | 116,622 | 4,283,183 |
| Shares converted from Class A (See Note 1) | (2,162) | (66,808) |
| Net increase (decrease) | 2,306,975 | $107,432,398 |
| |
| Investor Class | Shares | Amount |
| Year ended October 31, 2023: | | |
| Shares sold | 29,171 | $ 946,431 |
| Shares redeemed | (129,167) | (4,190,513) |
| Net increase (decrease) in shares outstanding before conversion | (99,996) | (3,244,082) |
| Shares converted into Investor Class (See Note 1) | 13,946 | 454,580 |
| Shares converted from Investor Class (See Note 1) | (49,643) | (1,638,559) |
| Net increase (decrease) | (135,693) | $ (4,428,061) |
| Year ended October 31, 2022: | | |
| Shares sold | 29,527 | $ 1,064,009 |
| Shares issued to shareholders in reinvestment of distributions | 465,396 | 19,486,115 |
| Shares redeemed | (125,946) | (4,520,015) |
| Net increase (decrease) in shares outstanding before conversion | 368,977 | 16,030,109 |
| Shares converted into Investor Class (See Note 1) | 13,285 | 458,733 |
| Shares converted from Investor Class (See Note 1) | (32,562) | (1,254,984) |
| Net increase (decrease) | 349,700 | $ 15,233,858 |
| |
| Class B | Shares | Amount |
| Year ended October 31, 2023: | | |
| Shares sold | 49 | $ 1,270 |
| Shares redeemed | (21,654) | (621,026) |
| Net increase (decrease) in shares outstanding before conversion | (21,605) | (619,756) |
| Shares converted from Class B (See Note 1) | (95,174) | (2,753,858) |
| Net increase (decrease) | (116,779) | $ (3,373,614) |
| Year ended October 31, 2022: | | |
| Shares sold | 4,388 | $ 151,833 |
| Shares issued to shareholders in reinvestment of distributions | 94,215 | 3,540,609 |
| Shares redeemed | (27,830) | (875,537) |
| Net increase (decrease) in shares outstanding before conversion | 70,773 | 2,816,905 |
| Shares converted from Class B (See Note 1) | (107,659) | (3,344,032) |
| Net increase (decrease) | (36,886) | $ (527,127) |
| |
| 26 | MainStay WMC Growth Fund |
| Class C | Shares | Amount |
| Year ended October 31, 2023: | | |
| Shares sold | 19,078 | $ 520,016 |
| Shares redeemed | (10,631) | (302,982) |
| Net increase (decrease) in shares outstanding before conversion | 8,447 | 217,034 |
| Shares converted from Class C (See Note 1) | (3,198) | (93,497) |
| Net increase (decrease) | 5,249 | $ 123,537 |
| Year ended October 31, 2022: | | |
| Shares sold | 6,189 | $ 204,515 |
| Shares issued to shareholders in reinvestment of distributions | 16,769 | 629,845 |
| Shares redeemed | (24,068) | (767,826) |
| Net increase (decrease) in shares outstanding before conversion | (1,110) | 66,534 |
| Shares converted from Class C (See Note 1) | (4,580) | (142,901) |
| Net increase (decrease) | (5,690) | $ (76,367) |
| |
| Class I | Shares | Amount |
| Year ended October 31, 2023: | | |
| Shares sold | 239,818 | $ 8,164,955 |
| Shares redeemed | (231,842) | (8,076,153) |
| Net increase (decrease) in shares outstanding before conversion | 7,976 | 88,802 |
| Shares converted into Class I (See Note 1) | 3,544 | 119,369 |
| Shares converted from Class I (See Note 1) | (1,196) | (43,028) |
| Net increase (decrease) | 10,324 | $ 165,143 |
| Year ended October 31, 2022: | | |
| Shares sold | 1,027,421 | $ 31,447,404 |
| Shares issued to shareholders in reinvestment of distributions | 61,206 | 2,732,828 |
| Shares redeemed | (98,160) | (3,645,210) |
| Net increase (decrease) in shares outstanding before conversion | 990,467 | 30,535,022 |
| Shares converted into Class I (See Note 1) | 2,074 | 66,809 |
| Net increase (decrease) | 992,541 | $ 30,601,831 |
| |
| Class R2 | Shares | Amount |
| Year ended October 31, 2023: | | |
| Shares sold | 462 | $ 16,205 |
| Net increase (decrease) | 462 | $ 16,205 |
| Year ended October 31, 2022: | | |
| Shares sold | 585 | $ 21,669 |
| Shares issued to shareholders in reinvestment of distributions | 702 | 29,799 |
| Shares redeemed | (1,405) | (46,338) |
| Net increase (decrease) | (118) | $ 5,130 |
| |
| Class R6 | Shares | Amount |
| Year ended October 31, 2023: | | |
| Shares sold | 355,853 | $ 11,619,536 |
| Shares redeemed | (1,270,504) | (46,223,506) |
| Net increase (decrease) | (914,651) | $ (34,603,970) |
| Year ended October 31, 2022: | | |
| Shares sold | 1,420,681 | $ 54,713,966 |
| Shares issued to shareholders in reinvestment of distributions | 679,896 | 30,350,578 |
| Shares redeemed | (422,178) | (14,709,658) |
| Net increase (decrease) | 1,678,399 | $ 70,354,886 |
Note 10–Other Matters
As of the date of this report, the Fund faces a heightened level of risk associated with current uncertainty, volatility and state of economies, financial markets, rising interest rates, and labor and health conditions around the world. Events such as war, acts of terrorism, recessions, rapid inflation, the imposition of international sanctions, earthquakes, hurricanes, epidemics and pandemics and other unforeseen natural or human disasters may have broad adverse social, political and economic effects on the global economy, which could negatively impact the value of the Fund's investments. Developments that disrupt global economies and financial markets may magnify factors that affect the Fund's performance.
Note 11–Subsequent Events
In connection with the preparation of the financial statements of the Fund as of and for the year ended October 31, 2023, events and transactions subsequent to October 31, 2023, through the date the financial statements were issued, have been evaluated by the Manager for possible adjustment and/or disclosure. No subsequent events requiring financial statement adjustment or disclosure have been identified.
Report of Independent Registered Public Accounting Firm
To the Shareholders of the Fund and Board of Trustees
MainStay Funds Trust:
Opinion on the Financial Statements
We have audited the accompanying statement of assets and liabilities of MainStay WMC Growth Fund (the Fund), one of the funds constituting MainStay Funds Trust, including the portfolio of investments, as of October 31, 2023, the related statement of operations for the year then ended, the statements of changes in net assets for each of the years in the two-year period then ended, and the related notes (collectively, the financial statements) and the financial highlights for each of the years or periods in the five-year period then ended. In our opinion, the financial statements and financial highlights present fairly, in all material respects, the financial position of the Fund as of October 31, 2023, the results of its operations for the year then ended, the changes in its net assets for each of the years in the two-year period then ended, and the financial highlights for each of the years or periods in the five-year period then ended, in conformity with U.S. generally accepted accounting principles.
Basis for Opinion
These financial statements and financial highlights are the responsibility of the Fund's management. Our responsibility is to express an opinion on these financial statements and financial highlights based on our audits. We are a public accounting firm registered with the Public Company Accounting Oversight Board (United States) (PCAOB) and are required to be independent with respect to the Fund in accordance with the U.S. federal securities laws and the applicable rules and regulations of the Securities and Exchange Commission and the PCAOB.
We conducted our audits in accordance with the standards of the PCAOB. Those standards require that we plan and perform the audit to obtain reasonable assurance about whether the financial statements and financial highlights are free of material misstatement, whether due to error or fraud. Our audits included performing procedures to assess the risks of material misstatement of the financial statements and financial highlights, whether due to error or fraud, and performing procedures that respond to those risks. Such procedures included examining, on a test basis, evidence regarding the amounts and disclosures in the financial statements and financial highlights. Such procedures also included confirmation of securities owned as of October 31, 2023, by correspondence with the custodian, the transfer agent and brokers; when replies were not received from brokers, we performed other auditing procedures. Our audits also included evaluating the accounting principles used and significant estimates made by management, as well as evaluating the overall presentation of the financial statements and financial highlights. We believe that our audits provide a reasonable basis for our opinion.

We have served as the auditor of one or more New York Life Investment Management investment companies since 2003.
Philadelphia, Pennsylvania
December 22, 2023
| 28 | MainStay WMC Growth Fund |
Federal Income Tax Information
(Unaudited)
The Fund is required under the Internal Revenue Code to advise shareholders in a written statement as to the federal tax status of dividends paid by the Fund during such fiscal years.
In February 2024, shareholders will receive an IRS Form 1099-DIV or substitute Form 1099, which will show the federal tax status of the distributions received by shareholders in calendar year 2023. The amounts that will be reported on such 1099-DIV or substitute Form 1099 will be the amounts you are to use on your federal income tax return and will differ from the amounts which we must report for the Fund's fiscal year ended October 31, 2023.
Proxy Voting Policies and Procedures and Proxy Voting Record
The Fund is required to file with the SEC its proxy voting record for the 12-month period ending June 30 on Form N-PX. A description of the policies and procedures that are used to vote proxies relating to portfolio securities of the Fund is available free of charge upon request by calling 800-624-6782 or visiting the SEC’s website at www.sec.gov. The most recent Form N-PX or proxy voting record is available free of charge upon request by calling 800-624-6782; visiting newyorklifeinvestments.com; or visiting the SEC’s website at www.sec.gov.
Shareholder Reports and Quarterly Portfolio Disclosure
The Fund is required to file its complete schedule of portfolio holdings with the SEC 60 days after its first and third fiscal quarter on Form N-PORT. The Fund's holdings report is available free of charge upon request by calling New York Life Investments at 800-624-6782.
Board of Trustees and Officers (Unaudited)
The Trustees and officers of the Fund are listed below. The Board oversees the MainStay Group of Funds (which consists of MainStay Funds and MainStay Funds Trust), MainStay VP Funds Trust, MainStay MacKay DefinedTerm Municipal Opportunities Fund, MainStay CBRE Global Infrastructure Megatrends Term Fund, the Manager and the Subadvisors, and elects the officers of the Funds who are responsible for the day-to-day operations of the Fund. Information pertaining to the Trustees and officers is set forth below. Each Trustee serves until his or her successor is elected and qualified or until his or her resignation, death or
removal. Under the Board’s retirement policy, unless an exception is made, a Trustee must tender his or her resignation by the end of the calendar year during which he or she reaches the age of 75. Officers are elected annually by the Board. The business address of each Trustee and officer listed below is 51 Madison Avenue, New York, New York 10010. A majority of the Trustees are not “interested persons” (as defined by the 1940 Act and rules adopted by the SEC thereunder) of the Fund (“Independent Trustees”).
| | Name and
Year of Birth | Term of Office,
Position(s) Held and
Length of Service | Principal Occupation(s)
During Past Five Years | Number of
Portfolios in
Fund Complex
Overseen by
Trustee | Other Directorships
Held by Trustee |
| | | | | | |
| | Naïm Abou-Jaoudé*
1966 | MainStay Funds: Trustee
since 2023
MainStay Funds Trust:
Trustee since 2023 | Chief Executive Officer of New York Life Investment Management LLC (since 2023). Chief Executive Officer of Candriam (an affiliate of New York Life Investment Management LLC) (2007 to 2023). | 81 | MainStay VP Funds Trust:
Trustee since 2023 (31 portfolios);
MainStay MacKay DefinedTerm Municipal Opportunities Fund: Trustee
since 2023;
MainStay CBRE Global Infrastructure Megatrends Term Fund: Trustee
since 2023; and
New York Life Investment Management International (Chair) since 2015 |
| * | This Trustee is considered to be an “interested person” of the MainStay Group of Funds, MainStay VP Funds Trust, MainStay CBRE Global Infrastructure Megatrends Term Fund and MainStay MacKay DefinedTerm Municipal Opportunities Fund, within the meaning of the 1940 Act because of his affiliation with New York Life Investment Management LLC and Candriam, as described in detail above in the column entitled “Principal Occupation(s) During Past Five Years.” |
| | |
| 30 | MainStay WMC Growth Fund |
| | Name and
Year of Birth | Term of Office,
Position(s) Held and
Length of Service | Principal Occupation(s)
During Past Five Years | Number of
Portfolios in
Fund Complex
Overseen by
Trustee | Other Directorships
Held by Trustee |
| | | | | | |
| | David H. Chow
1957 | MainStay Funds: Trustee since January 2016, Advisory Board Member (June 2015 to December 2015);MainStay Funds Trust:
Trustee since January 2016, Advisory Board Member (June 2015 to December 2015) | Founder and CEO, DanCourt Management, LLC (since 1999) | 81 | MainStay VP Funds Trust: Trustee since January 2016, Advisory Board Member (June 2015 to December 2015) (31 portfolios);
MainStay MacKay DefinedTerm Municipal Opportunities Fund: Trustee since January 2016, Advisory Board Member (June 2015 to December 2015);
MainStay CBRE Global Infrastructure Megatrends Term Fund: Trustee since 2021;
VanEck Vectors Group of Exchange-Traded Funds: Trustee since 2006 and Independent Chairman of the Board of Trustees from 2008 to 2022 (57 portfolios); and
Berea College of Kentucky: Trustee since 2009, Chair of the Investment Committee since 2018 |
| | Karen Hammond
1956 | MainStay Funds: Trustee since December 2021, Advisory Board Member (June 2021 to December 2021);MainStay Funds Trust:
Trustee since December 2021, Advisory Board Member (June 2021 to December 2021)
| Retired, Managing Director, Devonshire Investors (2007 to 2013); Senior Vice President, Fidelity Management & Research Co. (2005 to 2007); Senior Vice President and Corporate Treasurer, FMR Corp. (2003 to 2005); Chief Operating Officer, Fidelity Investments Japan (2001 to 2003) | 81 | MainStay VP Funds Trust: Trustee since December 2021, Advisory Board Member (June 2021 to December 2021) (31 portfolios);
MainStay MacKay DefinedTerm Municipal Opportunities Fund: Trustee since December 2021, Advisory Board Member (June 2021 to December 2021);
MainStay CBRE Global Infrastructure Megatrends Term Fund: Trustee since December 2021, Advisory Board Member (June 2021 to December 2021);
Two Harbors Investment Corp.: Director since 2018;
Rhode Island State Investment Commission: Member since 2017; and
Blue Cross Blue Shield of Rhode Island: Director since 2019 |
| | Susan B. Kerley
1951 | MainStay Funds: Chair since January 2017 and Trustee since 2007;MainStay Funds Trust:
Chair since January 2017 and Trustee since 1990*** | President, Strategic Management Advisors LLC (since 1990) | 81 | MainStay VP Funds Trust: Chair since January 2017 and Trustee since 2007 (31 portfolios)**;
MainStay MacKay DefinedTerm Municipal Opportunities Fund: Chair since January 2017 and Trustee since 2011;
MainStay CBRE Global Infrastructure Megatrends Term Fund: Trustee since June 2021; and
Legg Mason Partners Funds: Trustee since 1991 (45 portfolios) |
Board of Trustees and Officers (Unaudited) (continued)
| | Name and
Year of Birth | Term of Office,
Position(s) Held and
Length of Service | Principal Occupation(s)
During Past Five Years | Number of
Portfolios in
Fund Complex
Overseen by
Trustee | Other Directorships
Held by Trustee |
| | | | | | |
| | Alan R. Latshaw
1951 | MainStay Funds: Trusteesince 2006;MainStay Funds Trust:
Trustee since 2007*** | Retired; Partner, Ernst & Young LLP (2002 to 2003); Partner, Arthur Andersen LLP (1989 to 2002); Consultant to the MainStay Funds Audit and Compliance Committee (2004 to 2006) | 81 | MainStay VP Funds Trust: Trustee since 2007 (31 portfolios)**;
MainStay MacKay DefinedTerm Municipal Opportunities Fund: Trustee since 2011; and
MainStay CBRE Global Infrastructure Megatrends Term Fund: Trustee since June 2021 |
| | Jacques P. Perold
1958 | MainStay Funds: Trustee since January 2016, Advisory Board Member (June 2015to December 2015);MainStay Funds Trust:
Trustee since January 2016, Advisory Board Member (June 2015 to December 2015) | Founder and Chief Executive Officer, CapShift Advisors LLC (since 2018); President, Fidelity Management & Research Company (2009 to 2014); President and Chief Investment Officer, Geode Capital Management, LLC (2001 to 2009) | 81 | MainStay VP Funds Trust: Trustee since January 2016, Advisory Board Member (June 2015 to December 2015) (31 portfolios);
MainStay MacKay DefinedTerm Municipal Opportunities Fund: Trustee since January 2016, Advisory Board Member (June 2015 to December 2015);
MainStay CBRE Global Infrastructure Megatrends Term Fund: Trustee since June 2021;
Allstate Corporation: Director since 2015; and
MSCI Inc.: Director since 2017 |
| | Richard S. Trutanic
1952 | MainStay Funds: Trustee since 1994;MainStay Funds Trust:
Trustee since 2007*** | Chairman and Chief Executive Officer, Somerset & Company (financial advisory firm) (since 2004); Managing Director, The Carlyle Group (private investment firm) (2002 to 2004); Senior Managing Director, Partner and Board Member, Groupe Arnault S.A. (private investment firm) (1999 to 2002) | 81 | MainStay VP Funds Trust: Trustee since 2007 (31 portfolios)**;
MainStay MacKay DefinedTerm Municipal Opportunities Fund: Trustee since 2011; and
MainStay CBRE Global Infrastructure Megatrends Term Fund: Trustee since June 2021 |
| ** | Includes prior service as a Director of MainStay VP Series Fund, Inc., the predecessor to MainStay VP Funds Trust. |
| *** | Includes prior service as a Director/Trustee of certain predecessor entities to MainStay Funds Trust. |
| 32 | MainStay WMC Growth Fund |
| | Name and
Year of Birth | Position(s) Held and
Length of Service | Principal Occupation(s)
During Past Five Years | |
| | | | | |
| | Kirk C. Lehneis
1974 | President, MainStay Funds, MainStay Funds Trust (since 2017) | Chief Operating Officer and Senior Managing Director (since 2016), New York Life Investment Management LLC and New York Life Investment Management Holdings LLC; Member of the Board of Managers (since 2017) and Senior Managing Director (since 2018), NYLIFE Distributors LLC; Chairman of the Board and Senior Managing Director, NYLIM Service Company LLC (since 2017); Trustee, President and Principal Executive Officer of IndexIQ Trust, IndexIQ ETF Trust and IndexIQ Active ETF Trust (since 2018); President, MainStay CBRE Global Infrastructure Megatrends Term Fund (since 2021), MainStay MacKay DefinedTerm Municipal Opportunities Fund and MainStay VP Funds Trust (since 2017)**; Senior Managing Director, Global Product Development (2015 to 2016); Managing Director, Product Development (2010 to 2015), New York Life Investment Management LLC | |
| | Jack R. Benintende
1964 | Treasurer and Principal Financial and Accounting Officer, MainStay Funds (since 2007), MainStay Funds Trust (since 2009) | Managing Director, New York Life Investment Management LLC (since 2007); Treasurer and Principal Financial and Accounting Officer, MainStay CBRE Global Infrastructure Megatrends Term Fund (since 2021), MainStay MacKay DefinedTerm Municipal Opportunities Fund (since 2011) and MainStay VP Funds Trust (since 2007)**; and Assistant Treasurer, New York Life Investment Management Holdings LLC (2008 to 2012) | |
| | J. Kevin Gao
1967 | Secretary and Chief Legal Officer, MainStay Funds and MainStay Funds Trust (since 2010) | Managing Director and Associate General Counsel, New York Life Investment Management LLC (since 2010); Secretary and Chief Legal Officer, MainStay CBRE Global Infrastructure Megatrends Term Fund (since 2021), MainStay MacKay DefinedTerm Municipal Opportunities Fund (since 2011) and MainStay VP Funds Trust (since 2010)** | |
| | Kevin M. Gleason
1967 | Vice President and Chief Compliance Officer, MainStay Funds and MainStay Funds Trust (since June 2022) | Vice President and Chief Compliance Officer, IndexIQ Trust, IndexIQ ETF Trust and Index IQ Active ETF Trust (since June 2022); Vice President and Chief Compliance Officer, MainStay CBRE Global Infrastructure Megatrends Term Fund, MainStay VP Funds Trust and MainStay MacKay DefinedTerm Municipal Opportunities Fund (since June 2022); Senior Vice President, Voya Investment Management and Chief Compliance Officer, Voya Family of Funds (2012 to 2022) | |
| | Scott T. Harrington
1959 | Vice President— Administration, MainStay Funds (since 2005), MainStay Funds Trust (since 2009) | Managing Director, New York Life Investment Management LLC (including predecessor advisory organizations) (since 2000); Member of the Board of Directors, New York Life Trust Company (since 2009); Vice President—Administration, MainStay CBRE Global Infrastructure Megatrends Term Fund (since 2021), MainStay MacKay DefinedTerm Municipal Opportunities Fund (since 2011) and MainStay VP Funds Trust (since 2005)** | |
| * | The officers listed above are considered to be “interested persons” of the MainStay Group of Funds, MainStay VP Funds Trust, MainStay CBRE Global Infrastructure Megatrends Term Fund and MainStay MacKay DefinedTerm Municipal Opportunities Fund within the meaning of the 1940 Act because of their affiliation with the MainStay Group of Funds, New York Life Insurance Company and/or its affiliates, including New York Life Investment Management LLC, New York Life Insurance Company, NYLIM Service Company LLC, NYLIFE Securities LLC and/or NYLIFE Distributors LLC, as described in detail in the column captioned “Principal Occupation(s) During Past Five Years.” Officers are elected annually by the Board. |
| ** | Includes prior service as an Officer of MainStay VP Series Fund, Inc., the predecessor to MainStay VP Funds Trust. |
Officers of the Trust (Who are not Trustees)*
This page intentionally left blank.
Equity
U.S. Equity
MainStay Epoch U.S. Equity Yield Fund
MainStay Fiera SMID Growth Fund
MainStay PineStone U.S. Equity Fund
MainStay S&P 500 Index Fund
MainStay Winslow Large Cap Growth Fund
MainStay WMC Enduring Capital Fund
MainStay WMC Growth Fund
MainStay WMC Small Companies Fund
MainStay WMC Value Fund
International Equity
MainStay Epoch International Choice Fund
MainStay PineStone International Equity Fund
MainStay WMC International Research Equity Fund
Emerging Markets Equity
MainStay Candriam Emerging Markets Equity Fund
Global Equity
MainStay Epoch Capital Growth Fund
MainStay Epoch Global Equity Yield Fund
MainStay PineStone Global Equity Fund
Fixed Income
Taxable Income
MainStay Candriam Emerging Markets Debt Fund
MainStay Floating Rate Fund
MainStay MacKay High Yield Corporate Bond Fund
MainStay MacKay Short Duration High Yield Fund
MainStay MacKay Strategic Bond Fund
MainStay MacKay Total Return Bond Fund
MainStay MacKay U.S. Infrastructure Bond Fund
MainStay Short Term Bond Fund
Tax-Exempt Income
MainStay MacKay California Tax Free Opportunities Fund1
MainStay MacKay High Yield Municipal Bond Fund
MainStay MacKay New York Tax Free Opportunities Fund2
MainStay MacKay Short Term Municipal Fund
MainStay MacKay Strategic Municipal Allocation Fund
MainStay MacKay Tax Free Bond Fund
Money Market
MainStay Money Market Fund
Mixed Asset
MainStay Balanced Fund
MainStay Income Builder Fund
MainStay MacKay Convertible Fund
Speciality
MainStay CBRE Global Infrastructure Fund
MainStay CBRE Real Estate Fund
MainStay Cushing MLP Premier Fund
Asset Allocation
MainStay Conservative Allocation Fund
MainStay Conservative ETF Allocation Fund
MainStay Defensive ETF Allocation Fund
MainStay Equity Allocation Fund
MainStay Equity ETF Allocation Fund
MainStay ESG Multi-Asset Allocation Fund
MainStay Growth Allocation Fund
MainStay Growth ETF Allocation Fund
MainStay Moderate Allocation Fund
MainStay Moderate ETF Allocation Fund
Manager
New York Life Investment Management LLC
New York, New York
Subadvisors
Candriam3
Strassen, Luxembourg
CBRE Investment Management Listed Real Assets LLC
Radnor, Pennsylvania
Cushing Asset Management, LP
Dallas, Texas
Epoch Investment Partners, Inc.
New York, New York
Fiera Capital Inc.
New York, New York
IndexIQ Advisors LLC3
New York, New York
MacKay Shields LLC3
New York, New York
NYL Investors LLC3
New York, New York
PineStone Asset Management Inc.
Montreal, Québec
Wellington Management Company LLP
Boston, Massachusetts
Winslow Capital Management, LLC
Minneapolis, Minnesota
Legal Counsel
Dechert LLP
Washington, District of Columbia
Independent Registered Public Accounting Firm
KPMG LLP
Philadelphia, Pennsylvania
Distributor
NYLIFE Distributors LLC3
Jersey City, New Jersey
Custodian
JPMorgan Chase Bank, N.A.
New York, New York
1.
This Fund is registered for sale in AZ, CA, NV, OR, TX, UT, WA and MI (Class A and Class I shares only), and CO, FL, GA, HI, ID, MA, MD, NH, NJ and NY (Class I shares only).
| 2. | This Fund is registered for sale in CA, CT, DE, FL, MA, NJ, NY and VT. |
| 3. | An affiliate of New York Life Investment Management LLC. |
Not part of the Annual Report
For more information
800-624-6782
newyorklifeinvestments.com
“New York Life Investments” is both a service mark, and the common trade name, of certain investment advisors affiliated with New York Life Insurance Company. The MainStay Funds® are managed by New York Life Investment Management LLC and distributed by NYLIFE Distributors LLC, 30 Hudson Street, Jersey City, NJ 07302, a wholly owned subsidiary of New York Life Insurance Company. NYLIFE Distributors LLC is a Member FINRA/SIPC.
©2023 NYLIFE Distributors LLC. All rights reserved.
| 5013886MS139-23 | MSWG11-12/23 |
(NYLIM) NL529
MainStay WMC International Research Equity Fund
Message from the President and Annual Report
October 31, 2023
Special Notice:
Beginning in July 2024, new regulations issued by the Securities and Exchange Commission (SEC) will take effect requiring open-end mutual fund companies and ETFs to (1) overhaul the content of their shareholder reports and (2) mail paper copies of the new tailored shareholder reports to shareholders who have not opted to receive these documents electronically.
If you have not yet elected to receive your shareholder reports electronically, please contact your financial intermediary or visit newyorklifeinvestments.com/accounts.
| Not FDIC/NCUA Insured | Not a Deposit | May Lose Value | No Bank Guarantee | Not Insured by Any Government Agency |
This page intentionally left blank
Message from the President
Volatile economic and geopolitical forces drove market behavior during the 12-month reporting period ended October 31, 2023. While equity markets generally gained ground, bond prices trended broadly lower.
Although the war in Ukraine, the outbreak of hostilities in the Middle East and several other notable events affected financial assets, inflation and interest rate trends stood at the forefront of market developments during most of the period. As the reporting period began, high levels of inflation already showed signs of easing in the face of aggressive rate hikes by the U.S. Federal Reserve (the “Fed”). From a peak of 9.1% in June 2022, the annualized U.S. inflation rate dropped to 7.1% in November 2022, and to 3.2% in October 2023. At the same time, the Fed increased the benchmark federal funds rate from 3.75%–4.00% at the beginning of the reporting period to 5.25%–5.50% as of October 31, 2023. As the pace of rate increases slowed during the period, investors hoped for an early shift to a looser monetary policy. However, comments from Fed members late in the period reinforced the central bank’s hawkish stance in response to surprisingly robust U.S. economic growth and rising wage pressures, thus increasing the likelihood that interest rates would stay higher for longer. International developed markets exhibited similar dynamics of elevated inflation and rising interest rates.
Despite the backdrop of high interest rates—along with political dysfunction in Washington D.C. and intensifying global geopolitical instability—equity markets managed to advance, supported by healthy consumer spending trends and persistent domestic economic growth. The S&P 500® Index, a widely regarded benchmark of large-cap U.S. market performance, gained ground, bolstered by the strong performance of energy stocks amid surging petroleum prices and mega-cap, growth-oriented, technology-related shares, which rose as investors flocked to companies creating the infrastructure for developments in artificial intelligence. Smaller-cap stocks and value-oriented shares produced milder returns. Among industry sectors, energy and
information technology posted the strongest gains. Real estate declined most sharply under pressure from rising mortgage rates and weak levels of office occupancy. Developed international markets outperformed U.S. markets, with Europe benefiting during the first half of the period from unexpected economic resilience in the face of rising energy prices and the ongoing war in Ukraine. Emerging markets posted positive results but lagged developed markets, largely due to slow economic growth in China despite the relaxation of pandemic-era lockdowns.
Bond prices were driven lower by rising yields and increasing expectations of high interest rates for an extended period of time. The U.S. yield curve steepened, with the 30-year Treasury yield exceeding 5% for the first time in more than a decade. The yield curve remained inverted, with the 10-year Treasury yield ending the period at 4.88%, compared with 5.07% for the 2-year Treasury yield. Corporate bonds outperformed long-term Treasury bonds, but still trended lower under pressure from rising yields and an uptick in default rates. Among corporates, lower-credit-quality instruments performed slightly better than their higher-credit-quality counterparts, while floating rate securities performed better still.
In the face of today’s uncertain market environment, New York Life Investments remains dedicated to providing the guidance, resources and investment solutions you need to pursue your financial goals.
Thank you for trusting us to help meet your investment needs.
Sincerely,
Kirk C. Lehneis
President
The opinions expressed are as of the date of this report and are subject to change. There is no guarantee that any forecast made will come to pass. This material does not constitute investment advice and is not intended as an endorsement of any specific investment. Past performance is no guarantee of future results.
Not part of the Annual Report
Investors should refer to the Fund’s Summary Prospectus and/or Prospectus and consider the Fund’s investment objectives, strategies, risks, charges and expenses carefully before investing. The Summary Prospectus and/or Prospectus contain this and other information about the Fund. You may obtain copies of the Fund’s Summary Prospectus, Prospectus and Statement of Additional Information, which includes information about the MainStay Funds Trust's Trustees, free of charge, upon request, by calling toll-free 800-624-6782, by writing to NYLIFE Distributors LLC, Attn: MainStay Marketing Department, 30 Hudson Street, Jersey City, NJ 07302 or by sending an e-mail to MainStayShareholderServices@nylim.com. These documents are also available via the MainStay Funds’ website at newyorklifeinvestments.com. Please read the Fund’s Summary Prospectus and/or Prospectus carefully before investing.
Investment and Performance Comparison (Unaudited)
Performance data quoted represents past performance. Past performance is no guarantee of future results. Because of market volatility and other factors, current performance may be lower or higher than the figures shown. Investment return and principal value will fluctuate, and as a result, when shares are redeemed, they may be worth more or less than their original cost. The graph below depicts the historical performance of Class I shares of the Fund. Performance will vary from class to class based on differences in class-specific expenses and sales charges. For performance information current to the most recent month-end, please call 800-624-6782 or visit newyorklifeinvestments.com.
The performance table and graph do not reflect the deduction of taxes that a shareholder would pay on distributions or Fund share redemptions. Total returns reflect maximum applicable sales charges as indicated in the table below, if any, changes in share price, and reinvestment of dividend and capital gain distributions. The graph assumes the initial investment amount shown below and reflects the deduction of all sales charges that would have applied for the period of investment. Performance figures may reflect certain fee waivers and/or expense limitations, without which total returns may have been lower. For more information on share classes and current fee waivers and/or expense limitations (if any), please refer to the Notes to Financial Statements.
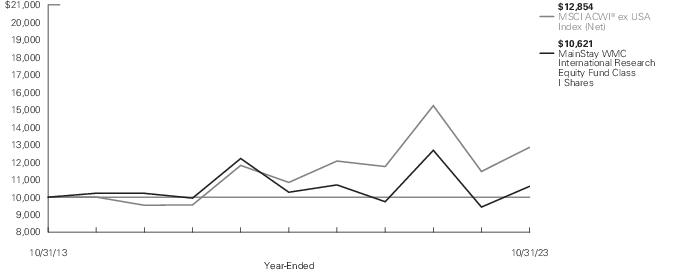
| Average Annual Total Returns for the Year-Ended October 31, 2023 |
| Class | Sales Charge | | Inception
Date1 | One
Year | Five
Years | Ten
Years | Gross
Expense
Ratio2 |
| Class A Shares | Maximum 5.50% Initial Sales Charge | With sales charges | 9/28/2007 | 6.16% | -0.74% | -0.22% | 1.19% |
| | | Excluding sales charges | | 12.34 | 0.39 | 0.34 | 1.19 |
| Investor Class Shares3 | Maximum 5.00% Initial Sales Charge | With sales charges | 2/28/2008 | 6.25 | -1.03 | -0.42 | 1.50 |
| | | Excluding sales charges | | 11.84 | 0.10 | 0.14 | 1.50 |
| Class C Shares | Maximum 1.00% CDSC | With sales charges | 9/28/2007 | 10.10 | -0.64 | -0.60 | 2.25 |
| | If Redeemed Within One Year of Purchase | Excluding sales charges | | 11.10 | -0.64 | -0.60 | 2.25 |
| Class I Shares | No Sales Charge | | 9/28/2007 | 12.58 | 0.65 | 0.60 | 0.94 |
| 1. | Effective March 5, 2021, the Fund replaced its subadvisor and modified its principal investment strategies. The past performance in the graph and table prior to March 5, 2021 reflects the Fund's prior subadvisor and principal investment strategies. |
| 2. | The gross expense ratios presented reflect the Fund’s “Total Annual Fund Operating Expenses” from the most recent Prospectus, as supplemented, and may differ from other expense ratios disclosed in this report. |
| 3. | Prior to June 30, 2020, the maximum initial sales charge was 5.50%, which is reflected in the applicable average annual total return figures shown. |
The footnotes on the next page are an integral part of the table and graph and should be carefully read in conjunction with them.
| Benchmark Performance* | One
Year | Five
Years | Ten
Years |
| MSCI ACWI® ex USA Index (Net)1 | 12.07% | 3.46% | 2.54% |
| Morningstar Foreign Large Blend Category Average2 | 13.03 | 3.87 | 2.92 |
| * | Returns for indices reflect no deductions for fees, expenses or taxes, except for foreign withholding taxes where applicable. Results assume reinvestment of all dividends and capital gains. An investment cannot be made directly in an index. |
| 1. | The Fund has selected the MSCI ACWI® (All Country World Index) ex USA Index (Net) as its primary benchmark. The MSCI ACWI® ex USA Index (Net) is a free
float-adjusted market capitalization weighted index that is designed to measure the equity market performance of developed and emerging markets, excluding the U.S. |
| 2. | The Morningstar Foreign Large Blend Category Average is representative of funds that invest in a variety of big international stocks. Most of these funds divide their assets among a dozen or more developed markets, including Japan, Britain, France, and Germany. These funds primarily invest in stocks that have market caps in the top 70% of each economically integrated market (such as Europe or Asia ex-Japan). The blend style is assigned to funds where neither growth nor value characteristics predominate. These funds typically will have less than 20% of assets invested in U.S. stocks. Results are based on average total returns of similar funds with all dividends and capital gain distributions reinvested. |
The footnotes on the preceding page are an integral part of the table and graph and should be carefully read in conjunction with them.
| 6 | MainStay WMC International Research Equity Fund |
Cost in Dollars of a $1,000 Investment in MainStay WMC International Research Equity Fund (Unaudited)
The example below is intended to describe the fees and expenses borne by shareholders during the six-month period from May 1, 2023 to October 31, 2023, and the impact of those costs on your investment.
Example
As a shareholder of the Fund you incur two types of costs: (1) transaction costs, including exchange fees and sales charges (loads) on purchases (as applicable), and (2) ongoing costs, including management fees, distribution and/or service (12b-1) fees and other Fund expenses (as applicable). This example is intended to help you understand your ongoing costs (in dollars) of investing in the Fund and to compare these costs with the ongoing costs of investing in other mutual funds. The example is based on an investment of $1,000 made at the beginning of the six-month period and held for the entire period from May 1, 2023 to October 31, 2023.
This example illustrates your Fund’s ongoing costs in two ways:
Actual Expenses
The second and third data columns in the table below provide information about actual account values and actual expenses. You may use the information in these columns, together with the amount you invested, to estimate the expenses that you paid during the six months ended October 31, 2023. Simply divide your account value by $1,000 (for example, an
$8,600 account value divided by $1,000 = 8.6), then multiply the result by the number under the heading entitled “Expenses Paid During Period” to estimate the expenses you paid on your account during this period.
Hypothetical Example for Comparison Purposes
The fourth and fifth data columns in the table below provide information about hypothetical account values and hypothetical expenses based on the Fund’s actual expense ratio and an assumed rate of return of 5% per year before expenses, which is not the Fund’s actual return. The hypothetical account values and expenses may not be used to estimate the actual ending account balances or expenses you paid for the six-month period shown. You may use this information to compare the ongoing costs of investing in the Fund with the ongoing costs of investing in other mutual funds. To do so, compare this 5% hypothetical example with the 5% hypothetical examples that appear in the shareholder reports of the other mutual funds.
Please note that the expenses shown in the table are meant to highlight your ongoing costs only and do not reflect any transactional costs, such as exchange fees or sales charges (loads). Therefore, the fourth and fifth data columns of the table are useful in comparing ongoing costs only and will not help you determine the relative total costs of owning different funds. In addition, if these transactional costs were included, your costs would have been higher.
| Share Class | Beginning
Account
Value
5/1/23 | Ending Account
Value (Based
on Actual
Returns and
Expenses)
10/31/23 | Expenses
Paid
During
Period1 | Ending Account
Value (Based
on Hypothetical
5% Annualized
Return and
Actual Expenses)
10/31/23 | Expenses
Paid
During
Period1 | Net Expense
Ratio
During
Period2 |
| Class A Shares | $1,000.00 | $923.50 | $ 5.58 | $1,019.41 | $ 5.85 | 1.15% |
| Investor Class Shares | $1,000.00 | $921.80 | $ 7.41 | $1,017.49 | $ 7.78 | 1.53% |
| Class C Shares | $1,000.00 | $918.60 | $11.03 | $1,013.71 | $11.57 | 2.28% |
| Class I Shares | $1,000.00 | $924.10 | $ 4.17 | $1,020.87 | $ 4.38 | 0.86% |
| 1. | Expenses are equal to the Fund’s annualized expense ratio of each class multiplied by the average account value over the period, divided by 365 and multiplied by 184 (to reflect the six-month period). The table above represents the actual expenses incurred during the six-month period. In addition to the fees and expenses which the Fund bears directly, it also indirectly bears a pro rata share of the fees and expenses of the underlying funds in which it invests. Such indirect expenses are not included in the above-reported expense figures. |
| 2. | Expenses are equal to the Fund's annualized expense ratio to reflect the six-month period. |
Country Composition as of October 31, 2023 (Unaudited)
| United Kingdom | 14.9% |
| Japan | 13.2 |
| France | 11.4 |
| Germany | 7.5 |
| China | 7.2 |
| Netherlands | 5.9 |
| United States | 5.4 |
| Canada | 4.7 |
| Taiwan | 3.5 |
| Australia | 3.5 |
| Republic of Korea | 3.3 |
| Brazil | 2.9 |
| Switzerland | 2.9 |
| Italy | 2.8 |
| India | 2.4 |
| Denmark | 2.2 |
| Hong Kong | 1.7 |
| Belgium | 0.8 |
| Austria | 0.7% |
| Thailand | 0.6 |
| Ireland | 0.5 |
| South Africa | 0.5 |
| Mexico | 0.4 |
| Indonesia | 0.4 |
| Portugal | 0.3 |
| Israel | 0.2 |
| Sweden | 0.2 |
| Nigeria | 0.2 |
| Finland | 0.1 |
| Spain | 0.1 |
| Russia | 0.0‡ |
| Other Assets, Less Liabilities | –0.4 |
| Investments Sold Short | –0.0‡ |
| | 100.0% |
| ‡ | Less than one–tenth of a percent. |
See Portfolio of Investments beginning on page 11 for specific holdings within these categories. The Fund's holdings are subject to change.
Top Ten Holdings and/or Issuers Held as of October 31, 2023 (excluding short-term investments) (Unaudited)
| 1. | Taiwan Semiconductor Manufacturing Co. Ltd., Sponsored ADR |
| 2. | Shell plc |
| 3. | Unilever plc |
| 4. | Tencent Holdings Ltd. |
| 5. | BP plc |
| 6. | Pernod Ricard SA |
| 7. | Haleon plc |
| 8. | Vale SA |
| 9. | ASML Holding NV |
| 10. | Reckitt Benckiser Group plc |
| 8 | MainStay WMC International Research Equity Fund |
Portfolio Management Discussion and Analysis (Unaudited)
Questions answered by portfolio managers Jonathan G. White and Mary L. Pryshlak, CFA, of Wellington Management Company LLP, the Fund’s Subadvisor.
How did MainStay WMC International Research Equity Fund perform relative to its benchmark and peer group during the 12 months ended October 31, 2023?
For the 12 months ended October 31, 2023, Class I shares of MainStay WMC International Research Equity Fund returned 12.58%, outperforming the 12.07% return of the Fund’s benchmark, the MSCI ACWI® (All Country World Index) ex USA Index (Net) (the “Index”). Over the same period, Class I shares underperformed the 13.03% return of the Morningstar Foreign Large Blend Category Average.1
What factors affected the Fund’s relative performance during the reporting period?
The Fund outperformed the Index during the reporting period primarily due to security selection. Positive selection in financials, industrials and energy drove the Fund’s relatively strong performance, partially offset by weaker selection in consumer discretionary, consumer staples and materials. Sector allocation, a result of our bottom-up stock selection process, detracted slightly from relative results. Underweight exposure to consumer discretionary and energy, as well as overweight exposure to health care, undermined relative returns, although this was partially offset by the positive impact of the Fund’s underweight exposure to materials and its overweight exposure to financials and communication services.
During the reporting period, which sectors were the strongest positive contributors to the Fund’s relative performance and which sectors were particularly weak?
During the reporting period, the financials, industrials and communication services sectors provided the strongest positive contributions to the Fund’s performance relative to the Index. (Contributions take weightings and total returns into account.) Over the same period, the consumer discretionary, consumer staples and utilities sectors detracted most from the Fund’s relative performance.
During the reporting period, which individual stocks made the strongest positive contributions to the Fund’s absolute performance and which stocks detracted the most?
The individual stocks that contributed most to the Fund’s absolute performance included Taiwan Semiconductor Manufacturing (“TSMC”) and Tencent. TSMC shares climbed higher on rising demand for semiconductor chips used for artificial intelligence (“AI”) functions. The company is seen as a key beneficiary of the emerging generative AI market, given that it manufactures advanced AI semiconductors for industry leader NVIDIA. Chinese multinational technology conglomerate Tencent benefited from
easing COVID-19-related restrictions at the end of 2022. Chinese regulators granted new licenses for games made by the technology group, signaling that Beijing was easing its crackdown on the sector.
The holdings that detracted most significantly from absolute performance included Air France-KLM and Adyen. Air France-KLM reported higher-than-expected second-quarter earnings, although results were overshadowed by the airline's upward revision of unit costs due to inflationary pressures from higher fuel, labor, and material costs, as well as increased airport fees. Additionally, the rebound in business travel after the end of the pandemic proved slower than expected. Shares of Adyen, a payment solutions provider, declined when the company reported earnings for the first half of 2023 that significantly missed consensus estimates, with operating income falling 10% year-over-year. Management cited headwinds from a slowdown in sales, industry-wide pricing pressures and higher inflation.
What were some of the Fund’s largest purchases and sales during the reporting period?
During the reporting period, the Fund initiated positions in British multinational consumer health care company Haleon and global pharmaceutical and biotechnology company Novo Nordisk. Haleon remains one of the few consumer staples companies to continue to post positive volume growth, with management reiterating their organic revenue growth guidance for fiscal year 2023. In our view, Haleon has a strong and under-appreciated consumer health franchise, which we believe is at relatively low risk from private label competition. We expect Novo Nordisk to benefit from positive sales trajectories for its GLP-1 medications for both obesity (Wegovy) and diabetes (Ozempic) for the next few years. We believe that the growth prospects of the obesity market, where there is large patient population, are not fully captured by market expectations.
During the same period, the Fund eliminated its positions in global spirits company Diageo and tobacco and nicotine company British-American Tobacco, both based in the U.K. Diageo faces a challenging period as the company embarks on a large capital investment program at a time of negative revisions from peak earnings as demand normalizes. U.S. market growth has declined to 3% from 10% over the last two years, versus the company’s long-term trend of 4–5%. Tequila, which drove roughly two thirds of the company’s organic sales growth over the past three years, is normalizing faster and deeper than management expected. While British-American Tobacco has established a well-positioned product portfolio in all relevant risk-reduced product categories (heated tobacco, vaping, and modern oral), we eliminated the Fund’s position in favor of more attractive risk/reward opportunities.
| 1. | See "Investment and Performance Comparison" for other share class returns, which may be higher or lower than Class I share returns, and for more information on benchmark and peer group returns. |
How did the Fund’s sector and/or country weightings change during the reporting period?
During the reporting period, we increased the Fund’s active weights primarily in the consumer discretionary, financials and utilities sectors, while decreasing exposure most significantly in information technology, industrials and health care.
How was the Fund positioned at the end of the reporting period?
As of October 31, 2023, the Fund held its largest overweight exposures relative to the Index in the health care and real estate sectors. As of the same date, the Fund held its most significantly underweight exposures in consumer discretionary and materials.
The opinions expressed are those of the portfolio managers as of the date of this report and are subject to change. There is no guarantee that any forecasts will come to pass. This material does not constitute investment advice and is not intended as an endorsement of any specific investment.
| 10 | MainStay WMC International Research Equity Fund |
Portfolio of Investments October 31, 2023†^
| | Shares | Value |
| Common Stocks 96.2% |
| Australia 3.5% |
| ANZ Group Holdings Ltd. (Banks) | 71,521 | $ 1,121,077 |
| Brambles Ltd. (Commercial Services & Supplies) | 489 | 4,067 |
| De Grey Mining Ltd. (Metals & Mining) (a) | 173,260 | 131,339 |
| Glencore plc (Metals & Mining) | 257,146 | 1,360,053 |
| Goodman Group (Industrial REITs) | 63,167 | 831,051 |
| Orora Ltd. (Containers & Packaging) | 105,979 | 165,380 |
| Rio Tinto plc (Metals & Mining) | 14,289 | 912,666 |
| Stockland (Diversified REITs) | 179,662 | 403,449 |
| Whitehaven Coal Ltd. (Oil, Gas & Consumable Fuels) | 23,249 | 109,135 |
| | | 5,038,217 |
| Austria 0.7% |
| BAWAG Group AG (Banks) (b) | 13,092 | 580,980 |
| Erste Group Bank AG (Banks) | 11,889 | 424,567 |
| | | 1,005,547 |
| Belgium 0.8% |
| KBC Group NV (Banks) | 14,392 | 790,342 |
| UCB SA (Pharmaceuticals) | 5,195 | 379,611 |
| | | 1,169,953 |
| Brazil 2.5% |
| Cia de Saneamento Basico do Estado de Sao Paulo SABESP (Water Utilities) | 61,600 | 713,164 |
| Petroleo Brasileiro SA (Oil, Gas & Consumable Fuels) | 49,000 | 367,761 |
| Rumo SA (Ground Transportation) | 80,650 | 356,880 |
| Vale SA (Metals & Mining) | 162,154 | 2,219,195 |
| | | 3,657,000 |
| Canada 4.7% |
| Alimentation Couche-Tard, Inc. (Consumer Staples Distribution & Retail) | 26,391 | 1,436,637 |
| Barrick Gold Corp. (Metals & Mining) | 58,965 | 941,824 |
| Boat Rocker Media, Inc. (Entertainment) (a) | 42,890 | 53,816 |
| Cenovus Energy, Inc. (Oil, Gas & Consumable Fuels) | 49,137 | 936,145 |
| Constellation Software, Inc. (Software) | 419 | 839,967 |
| Hydro One Ltd. (Electric Utilities) (b) | 7,525 | 195,132 |
| Intact Financial Corp. (Insurance) | 4,477 | 629,024 |
| Lightspeed Commerce, Inc. (Software) (a) | 24,468 | 304,871 |
| Methanex Corp. (Chemicals) | 9,815 | 405,269 |
| Shopify, Inc., Class A (IT Services) (a) | 16,538 | 780,972 |
| Teck Resources Ltd., Class B (Metals & Mining) | 9,500 | 335,677 |
| | | 6,859,334 |
| | Shares | Value |
| |
| China 7.2% |
| Anhui Conch Cement Co. Ltd., Class H (Construction Materials) | 63,000 | $ 157,153 |
| BYD Co. Ltd., Class H (Automobiles) | 21,053 | 638,699 |
| China Longyuan Power Group Corp. Ltd., Class H (Independent Power and Renewable Electricity Producers) | 648,877 | 549,766 |
| China Merchants Bank Co. Ltd., Class H (Banks) | 258,097 | 982,881 |
| ENN Energy Holdings Ltd. (Gas Utilities) | 67,300 | 513,872 |
| KE Holdings, Inc., ADR (Real Estate Management & Development) | 71,504 | 1,051,824 |
| Meituan (Hotels, Restaurants & Leisure) (a)(b) | 94,721 | 1,338,761 |
| Minth Group Ltd. (Automobile Components) | 156,000 | 347,674 |
| PICC Property & Casualty Co. Ltd., Class H (Insurance) | 726,000 | 829,423 |
| Prosus NV (Broadline Retail) (a) | 7,276 | 203,478 |
| Tencent Holdings Ltd. (Interactive Media & Services) | 78,239 | 2,891,501 |
| Trip.com Group Ltd. (Hotels, Restaurants & Leisure) (a) | 24,032 | 825,507 |
| WuXi AppTec Co. Ltd., Class H (Life Sciences Tools & Services) (b)(c) | 17,000 | 204,211 |
| | | 10,534,750 |
| Denmark 2.2% |
| Ascendis Pharma A/S, ADR (Biotechnology) (a) | 4,404 | 393,321 |
| Genmab A/S (Biotechnology) (a) | 2,236 | 630,819 |
| Novo Nordisk A/S, Class B (Pharmaceuticals) | 22,581 | 2,167,264 |
| | | 3,191,404 |
| Finland 0.1% |
| Nokian Renkaat OYJ (Automobile Components) | 27,417 | 206,783 |
| France 11.4% |
| Air France-KLM (Passenger Airlines) (a) | 80,737 | 910,148 |
| Airbus SE (Aerospace & Defense) | 6,187 | 826,688 |
| ALD SA (Ground Transportation) (b) | 31,521 | 211,287 |
| Arkema SA (Chemicals) | 3,764 | 351,990 |
| AXA SA (Insurance) | 57,749 | 1,708,168 |
| BNP Paribas SA (Banks) | 21,039 | 1,208,570 |
| Bureau Veritas SA (Professional Services) | 28,401 | 645,798 |
| Capgemini SE (IT Services) | 2,915 | 513,546 |
| Edenred SE (Financial Services) | 5,957 | 316,668 |
| Engie SA (Multi-Utilities) | 72,476 | 1,150,610 |
The notes to the financial statements are an integral part of, and should be read in conjunction with, the financial statements.
11
Portfolio of Investments October 31, 2023†^ (continued)
| | Shares | Value |
| Common Stocks (continued) |
| France (continued) |
| JCDecaux SE (Media) (a) | 24,335 | $ 380,053 |
| Klepierre SA (Retail REITs) | 30,171 | 731,058 |
| Legrand SA (Electrical Equipment) | 8,248 | 711,093 |
| LVMH Moet Hennessy Louis Vuitton SE (Textiles, Apparel & Luxury Goods) | 2,328 | 1,661,467 |
| Pernod Ricard SA (Beverages) | 14,116 | 2,501,803 |
| Renault SA (Automobiles) | 15,584 | 544,976 |
| Safran SA (Aerospace & Defense) | 3,526 | 548,511 |
| TotalEnergies SE (Oil, Gas & Consumable Fuels) | 9,851 | 658,755 |
| Valeo SE (Automobile Components) | 26,082 | 343,311 |
| Vinci SA (Construction & Engineering) | 6,985 | 772,194 |
| | | 16,696,694 |
| Germany 7.4% |
| adidas AG (Textiles, Apparel & Luxury Goods) | 7,566 | 1,338,534 |
| Beiersdorf AG (Personal Care Products) | 10,830 | 1,421,517 |
| Brenntag SE (Trading Companies & Distributors) | 7,263 | 538,871 |
| Commerzbank AG (Banks) | 42,346 | 454,784 |
| Daimler Truck Holding AG (Machinery) | 44,227 | 1,386,115 |
| Deutsche Post AG (Air Freight & Logistics) | 19,536 | 759,867 |
| Deutsche Telekom AG (Registered) (Diversified Telecommunication Services) | 39,460 | 854,885 |
| MTU Aero Engines AG (Aerospace & Defense) | 676 | 126,604 |
| Rheinmetall AG (Aerospace & Defense) | 1,100 | 314,721 |
| RWE AG (Independent Power and Renewable Electricity Producers) | 20,772 | 794,096 |
| Siemens AG (Registered) (Industrial Conglomerates) | 8,239 | 1,089,362 |
| Siemens Healthineers AG (Health Care Equipment & Supplies) (b) | 5,182 | 253,976 |
| Talanx AG (Insurance) | 15,593 | 980,863 |
| United Internet AG (Registered), Class G (Diversified Telecommunication Services) | 26,073 | 542,101 |
| | | 10,856,296 |
| Hong Kong 1.7% |
| AIA Group Ltd. (Insurance) | 234,108 | 2,029,868 |
| Techtronic Industries Co. Ltd. (Machinery) | 56,000 | 510,246 |
| | | 2,540,114 |
| India 2.4% |
| Axis Bank Ltd. (Banks) | 73,153 | 862,675 |
| | Shares | Value |
| |
| India (continued) |
| Bharti Airtel Ltd. (Wireless Telecommunication Services) | 82,128 | $ 901,981 |
| Kotak Mahindra Bank Ltd. (Banks) | 49,728 | 1,038,893 |
| SBI Life Insurance Co. Ltd. (Insurance) (b) | 42,520 | 698,557 |
| | | 3,502,106 |
| Indonesia 0.4% |
| Bank Rakyat Indonesia Persero Tbk. PT (Banks) | 1,749,310 | 546,212 |
| Ireland 0.5% |
| AIB Group plc (Banks) | 181,542 | 786,415 |
| Israel 0.2% |
| Wix.com Ltd. (IT Services) (a) | 4,120 | 329,188 |
| Italy 2.8% |
| DiaSorin SpA (Health Care Equipment & Supplies) | 3,277 | 292,995 |
| Enel SpA (Electric Utilities) | 107,691 | 682,320 |
| Eurogroup Laminations SpA (Electrical Equipment) (a) | 59,591 | 195,717 |
| Ferrari NV (Automobiles) | 2,454 | 741,323 |
| FinecoBank Banca Fineco SpA (Banks) | 54,558 | 641,645 |
| Stevanato Group SpA (Life Sciences Tools & Services) | 10,489 | 293,167 |
| UniCredit SpA (Banks) | 50,074 | 1,251,730 |
| | | 4,098,897 |
| Japan 13.2% |
| Chugai Pharmaceutical Co. Ltd. (Pharmaceuticals) | 24,200 | 712,070 |
| Daiichi Sankyo Co. Ltd. (Pharmaceuticals) | 37,400 | 951,933 |
| Daikin Industries Ltd. (Building Products) | 1,600 | 228,323 |
| Daito Trust Construction Co. Ltd. (Real Estate Management & Development) | 8,674 | 924,197 |
| Eisai Co. Ltd. (Pharmaceuticals) | 7,800 | 409,670 |
| Hakuhodo DY Holdings, Inc. (Media) | 20,900 | 167,324 |
| Ibiden Co. Ltd. (Electronic Equipment, Instruments & Components) | 19,045 | 796,730 |
| Isuzu Motors Ltd. (Automobiles) | 49,570 | 543,038 |
| ITOCHU Corp. (Trading Companies & Distributors) | 16,500 | 584,889 |
| Kansai Electric Power Co., Inc. (The) (Electric Utilities) | 27,700 | 352,064 |
| KDDI Corp. (Wireless Telecommunication Services) | 30,506 | 903,054 |
The notes to the financial statements are an integral part of, and should be read in conjunction with, the financial statements.
| 12 | MainStay WMC International Research Equity Fund |
| | Shares | Value |
| Common Stocks (continued) |
| Japan (continued) |
| Keyence Corp. (Electronic Equipment, Instruments & Components) | 795 | $ 304,992 |
| Koito Manufacturing Co. Ltd. (Automobile Components) | 12,170 | 179,810 |
| Kyushu Electric Power Co., Inc. (Electric Utilities) (a) | 10,800 | 68,672 |
| Makita Corp. (Machinery) | 27,500 | 700,495 |
| Mitsubishi Corp. (Trading Companies & Distributors) | 15,400 | 706,627 |
| Mitsubishi Electric Corp. (Electrical Equipment) | 14,300 | 158,260 |
| Mitsubishi UFJ Financial Group, Inc. (Banks) | 151,800 | 1,258,866 |
| Mitsui & Co. Ltd. (Trading Companies & Distributors) | 18,100 | 646,859 |
| Musashi Seimitsu Industry Co. Ltd. (Automobile Components) | 19,000 | 179,878 |
| Nippon Telegraph & Telephone Corp. (Diversified Telecommunication Services) | 574,950 | 670,633 |
| Nomura Real Estate Holdings, Inc. (Real Estate Management & Development) | 15,670 | 362,351 |
| Oriental Land Co. Ltd. (Hotels, Restaurants & Leisure) | 22,000 | 704,958 |
| Recruit Holdings Co. Ltd. (Professional Services) | 20,425 | 583,879 |
| Sony Group Corp. (Household Durables) | 18,656 | 1,529,281 |
| Sumitomo Mitsui Trust Holdings, Inc. (Banks) | 19,900 | 736,526 |
| T&D Holdings, Inc. (Insurance) | 68,800 | 1,213,050 |
| Terumo Corp. (Health Care Equipment & Supplies) | 16,800 | 453,542 |
| Tokyo Electron Ltd. (Semiconductors & Semiconductor Equipment) | 11,058 | 1,441,206 |
| Yamaha Motor Co. Ltd. (Automobiles) (c) | 34,493 | 827,650 |
| | | 19,300,827 |
| Mexico 0.4% |
| Corp. Inmobiliaria Vesta SAB de CV (Real Estate Management & Development) (c) | 199,900 | 626,787 |
| Netherlands 5.9% |
| Adyen NV (Financial Services) (a)(b) | 331 | 222,012 |
| Akzo Nobel NV (Chemicals) | 3,724 | 249,267 |
| Argenx SE (Biotechnology) (a) | 1,426 | 670,080 |
| ASML Holding NV (Semiconductors & Semiconductor Equipment) | 3,700 | 2,213,133 |
| | Shares | Value |
| |
| Netherlands (continued) |
| IMCD NV (Trading Companies & Distributors) | 2,624 | $ 315,128 |
| Koninklijke Ahold Delhaize NV (Consumer Staples Distribution & Retail) | 31,062 | 920,268 |
| Shell plc (Oil, Gas & Consumable Fuels) | 105,847 | 3,404,768 |
| Wolters Kluwer NV (Professional Services) | 4,439 | 568,795 |
| | | 8,563,451 |
| Nigeria 0.2% |
| Airtel Africa plc (Wireless Telecommunication Services) (b) | 202,346 | 278,652 |
| Portugal 0.3% |
| EDP - Energias de Portugal SA (Electric Utilities) | 110,427 | 463,866 |
| Republic of Korea 1.8% |
| Coupang, Inc. (Broadline Retail) (a) | 63,725 | 1,083,325 |
| LG Chem Ltd. (Chemicals) | 824 | 268,454 |
| Samsung SDI Co. Ltd. (Electronic Equipment, Instruments & Components) | 1,101 | 346,877 |
| Shinhan Financial Group Co. Ltd. (Banks) | 24,122 | 620,665 |
| SK Telecom Co. Ltd. (Wireless Telecommunication Services) | 8,507 | 309,592 |
| | | 2,628,913 |
| Russia 0.0% ‡ |
| LUKOIL PJSC, Sponsored ADR (Oil, Gas & Consumable Fuels) (a)(d)(e) | 11,171 | 27,760 |
| Mobile TeleSystems PJSC (Wireless Telecommunication Services) (d)(e) | 80,528 | — |
| | | 27,760 |
| South Africa 0.5% |
| Anglo American plc (Metals & Mining) | 21,729 | 553,696 |
| Thungela Resources Ltd. (Oil, Gas & Consumable Fuels) | 12,106 | 107,061 |
| | | 660,757 |
| Spain 0.1% |
| Aena SME SA (Transportation Infrastructure) | 1,382 | 199,969 |
| Sweden 0.2% |
| Assa Abloy AB, Class B (Building Products) | 15,367 | 326,959 |
The notes to the financial statements are an integral part of, and should be read in conjunction with, the financial statements.
13
Portfolio of Investments October 31, 2023†^ (continued)
| | Shares | Value |
| Common Stocks (continued) |
| Switzerland 2.9% |
| Alcon, Inc. (Health Care Equipment & Supplies) | 14,078 | $ 1,003,173 |
| DSM-Firmenich AG (Chemicals) | 1,893 | 171,435 |
| Novartis AG (Registered) (Pharmaceuticals) | 23,018 | 2,139,220 |
| Partners Group Holding AG (Capital Markets) | 290 | 305,032 |
| Sandoz Group AG (Pharmaceuticals) (a) | 5,204 | 135,299 |
| Tecan Group AG (Registered) (Life Sciences Tools & Services) | 1,786 | 511,267 |
| | | 4,265,426 |
| Taiwan 3.5% |
| ASPEED Technology, Inc. (Semiconductors & Semiconductor Equipment) | 5,945 | 471,054 |
| E Ink Holdings, Inc. (Electronic Equipment, Instruments & Components) | 149,548 | 774,597 |
| Taiwan Semiconductor Manufacturing Co. Ltd., Sponsored ADR (Semiconductors & Semiconductor Equipment) | 44,363 | 3,828,972 |
| | | 5,074,623 |
| Thailand 0.6% |
| Kasikornbank PCL | | |
| (Banks) | 37,900 | 138,661 |
| NVDR (Banks) | 172,920 | 632,649 |
| |
| PTT Global Chemical PCL (Chemicals) | 45,700 | 43,866 |
| | | 815,176 |
| United Kingdom 14.9% |
| Admiral Group plc (Insurance) | 30,382 | 902,146 |
| Allfunds Group plc (Capital Markets) | 37,924 | 193,334 |
| AstraZeneca plc (Pharmaceuticals) | 16,499 | 2,055,505 |
| BAE Systems plc (Aerospace & Defense) | 50,972 | 683,971 |
| Beazley plc (Insurance) | 169,952 | 1,062,793 |
| BP plc (Oil, Gas & Consumable Fuels) | 434,551 | 2,654,608 |
| BT Group plc (Diversified Telecommunication Services) | 216,365 | 296,511 |
| ConvaTec Group plc (Health Care Equipment & Supplies) (b) | 166,435 | 413,083 |
| Croda International plc (Chemicals) | 4,157 | 221,204 |
| HSBC Holdings plc (Banks) | 291,637 | 2,099,527 |
| IMI plc (Machinery) | 17,294 | 307,943 |
| InterContinental Hotels Group plc (Hotels, Restaurants & Leisure) | 7,208 | 509,012 |
| London Stock Exchange Group plc (Capital Markets) | 13,432 | 1,351,786 |
| National Grid plc (Multi-Utilities) | 27,425 | 326,204 |
| | Shares | Value |
| |
| United Kingdom (continued) |
| Reckitt Benckiser Group plc (Household Products) | 32,931 | $ 2,202,230 |
| Rolls-Royce Holdings plc (Aerospace & Defense) (a) | 101,193 | 264,931 |
| Rotork plc (Machinery) | 104,182 | 370,767 |
| Smith & Nephew plc (Health Care Equipment & Supplies) | 26,771 | 299,617 |
| Standard Chartered plc (Banks) | 148,107 | 1,134,105 |
| Trainline plc (Hotels, Restaurants & Leisure) (a)(b) | 47,573 | 150,570 |
| Unilever plc (Personal Care Products) | 66,467 | 3,141,819 |
| Whitbread plc (Hotels, Restaurants & Leisure) | 13,345 | 539,808 |
| Wise plc, Class A (Financial Services) (a) | 43,105 | 348,721 |
| WPP plc (Media) | 30,701 | 263,671 |
| | | 21,793,866 |
| United States 3.2% |
| CRH plc (Construction Materials) | 6,281 | 337,510 |
| Experian plc (Professional Services) | 10,098 | 305,736 |
| GSK plc (Pharmaceuticals) | 55,349 | 980,450 |
| Haleon plc (Personal Care Products) | 561,195 | 2,247,534 |
| QIAGEN NV (Life Sciences Tools & Services) (a) | 15,248 | 566,623 |
| Schneider Electric SE (Electrical Equipment) | 1,988 | 304,966 |
| | | 4,742,819 |
Total Common Stocks
(Cost $152,217,201) | | 140,788,761 |
| Preferred Stocks 2.0% |
| Brazil 0.4% |
| Banco Bradesco SA (Banks) | 221,100 | 613,515 |
| Germany 0.1% |
| Volkswagen AG (Automobiles) 2.91% | 922 | 97,391 |
| Republic of Korea 1.5% |
| Samsung Electronics Co. Ltd. (Technology Hardware, Storage & Peripherals) 1.88% | 55,411 | 2,199,126 |
Total Preferred Stocks
(Cost $3,723,529) | | 2,910,032 |
The notes to the financial statements are an integral part of, and should be read in conjunction with, the financial statements.
| 14 | MainStay WMC International Research Equity Fund |
| | Shares | Value |
| Exchange-Traded Fund 0.7% |
| United States 0.7% |
| iShares MSCI ACWI ex U.S. ETF (c) | 22,034 | $ 1,003,428 |
Total Exchange-Traded Fund
(Cost $1,034,521) | | 1,003,428 |
| |
| | Number of
Warrants | |
| |
| Warrants 0.0% ‡ |
| Canada 0.0% ‡ |
| Constellation Software, Inc. (Software) | | |
| Expires 3/31/40 (a)(d)(e) | 442 | — |
Total Warrants
(Cost $0) | | — |
| |
| | Shares | |
| |
| Short-Term Investments 1.5% |
| Affiliated Investment Company 0.9% |
| United States 0.9% |
| MainStay U.S. Government Liquidity Fund, 5.275% (f) | 1,287,657 | 1,287,657 |
| Unaffiliated Investment Companies 0.6% |
| United States 0.6% |
| Invesco Government & Agency Portfolio, 5.357% (f)(g) | 927,426 | 927,426 |
| RBC U.S. Government Money Market Fund, 5.399% (f)(g) | 50,000 | 50,000 |
| | | 977,426 |
Total Short-Term Investments
(Cost $2,265,083) | | 2,265,083 |
Total Investments, Before Investments Sold Short
(Cost $159,240,334) | 100.4% | 146,967,304 |
| Investments Sold Short (0.0)% ‡ |
| Common Stock Sold Short (0.0)% ‡ |
| Australia (0.0)% ‡ |
| Virgin Australia Airlines Holdings Pty. Ltd. (Passenger Airlines) (a)(d)(e) | (444,108) | (28) |
Total Common Stock Sold Short
(Proceeds $0) | | (28) |
| |
| | Number of
Rights | | Value |
| |
| Rights Sold Short (0.0)% ‡ |
| United States (0.0)% ‡ |
Intercell (Biotechnology)
Expires 12/31/49 (a)(d)(e) | (19,159) | | $ (2) |
Total Rights Sold Short
(Proceeds $0) | | | (2) |
Total Investments Sold Short
(Proceeds $0) | | | (30) |
Total Investments, Net of Investments Sold Short
(Cost $159,240,334) | 100.4% | | 146,967,274 |
| Other Assets, Less Liabilities | (0.4) | | (652,452) |
| Net Assets | 100.0% | | $ 146,314,822 |
| † | Percentages indicated are based on Fund net assets. |
| ^ | Industry and country classifications may be different than those used for compliance monitoring purposes. |
| ‡ | Less than one-tenth of a percent. |
| (a) | Non-income producing security. |
| (b) | May be sold to institutional investors only under Rule 144A or securities offered pursuant to Section 4(a)(2) of the Securities Act of 1933, as amended. |
| (c) | All or a portion of this security was held on loan. As of October 31, 2023, the aggregate market value of securities on loan was $1,742,263; the total market value of collateral held by the Fund was $1,847,015. The market value of the collateral held included non-cash collateral in the form of U.S. Treasury securities with a value of $869,589. The Fund received cash collateral with a value of $977,426. (See Note 2(J)) |
| (d) | Illiquid security—As of October 31, 2023, the total market value deemed illiquid under procedures approved by the Board of Trustees was $27,730, which represented less than one-tenth of a percent of the Fund’s net assets. (Unaudited) |
| (e) | Security in which significant unobservable inputs (Level 3) were used in determining fair value. |
| (f) | Current yield as of October 31, 2023. |
| (g) | Represents a security purchased with cash collateral received for securities on loan. |
The notes to the financial statements are an integral part of, and should be read in conjunction with, the financial statements.
15
Portfolio of Investments October 31, 2023†^ (continued)
Investments in Affiliates (in 000's)
Investments in issuers considered to be affiliate(s) of the Fund during the year ended October 31, 2023 for purposes of Section 2(a)(3) of the Investment Company Act of 1940, as amended, were as follows:
| Affiliated Investment Companies | Value,
Beginning
of Year | Purchases
at Cost | Proceeds
from
Sales | Net
Realized
Gain/(Loss)
on Sales | Change in
Unrealized
Appreciation/
(Depreciation) | Value,
End of
Year | Dividend
Income | Other
Distributions | Shares
End of
Year |
| MainStay U.S. Government Liquidity Fund | $ 557 | $ 36,261 | $ (35,530) | $ — | $ — | $ 1,288 | $ 32 | $ — | 1,288 |
| Abbreviation(s): |
| ACWI—All Country World Index |
| ADR—American Depositary Receipt |
| ETF—Exchange-Traded Fund |
| MSCI—Morgan Stanley Capital International |
| NVDR—Non-Voting Depositary Receipt |
| PCL—Provision for Credit Losses |
| REIT—Real Estate Investment Trust |
The following is a summary of the fair valuations according to the inputs used as of October 31, 2023, for valuing the Fund’s assets and liabilities:
| Description | Quoted
Prices in
Active
Markets for
Identical
Assets
(Level 1) | | Significant
Other
Observable
Inputs
(Level 2) | | Significant
Unobservable
Inputs
(Level 3) | | Total |
| Asset Valuation Inputs | | | | | | | |
| Investments in Securities (a) | | | | | | | |
| Common Stocks | $ 140,761,001 | | $ — | | $ 27,760 | | $ 140,788,761 |
| Preferred Stocks | 2,910,032 | | — | | — | | 2,910,032 |
| Exchange-Traded Fund | 1,003,428 | | — | | — | | 1,003,428 |
| Warrants | — | | — | | — | | — |
| Short-Term Investments | | | | | | | |
| Affiliated Investment Company | 1,287,657 | | — | | — | | 1,287,657 |
| Unaffiliated Investment Companies | 977,426 | | — | | — | | 977,426 |
| Total Short-Term Investments | 2,265,083 | | — | | — | | 2,265,083 |
| Total Investments in Securities | $ 146,939,544 | | $ — | | $ 27,760 | | $ 146,967,304 |
| Liability Valuation Inputs | | | | | | | |
| Common Stock Sold Short | $ — | | $ — | | $ (28) | | $ (28) |
| Rights Sold Short | — | | — | | (2) | | (2) |
| Total Investments in Securities Sold Short | $ — | | $ — | | $ (30) | | $ (30) |
| (a) | For a complete listing of investments and their industries, see the Portfolio of Investments. |
The notes to the financial statements are an integral part of, and should be read in conjunction with, the financial statements.
| 16 | MainStay WMC International Research Equity Fund |
The table below sets forth the diversification of the Fund’s investments by industry.
Industry Diversification
| | Value | Percent †^ |
| Aerospace & Defense | $ 2,765,426 | 1.9% |
| Air Freight & Logistics | 759,867 | 0.5 |
| Automobile Components | 1,257,456 | 0.9 |
| Automobiles | 3,393,077 | 2.3 |
| Banks | 17,925,285 | 12.3 |
| Beverages | 2,501,803 | 1.7 |
| Biotechnology | 1,694,220 | 1.2 |
| Broadline Retail | 1,286,803 | 0.9 |
| Building Products | 555,282 | 0.4 |
| Capital Markets | 1,850,152 | 1.3 |
| Chemicals | 1,711,485 | 1.2 |
| Commercial Services & Supplies | 4,067 | 0.0‡ |
| Construction & Engineering | 772,194 | 0.5 |
| Construction Materials | 494,663 | 0.3 |
| Consumer Staples Distribution & Retail | 2,356,905 | 1.6 |
| Containers & Packaging | 165,380 | 0.1 |
| Diversified REITs | 403,449 | 0.3 |
| Diversified Telecommunication Services | 2,364,130 | 1.6 |
| Electric Utilities | 1,762,054 | 1.2 |
| Electrical Equipment | 1,370,036 | 0.9 |
| Electronic Equipment, Instruments & Components | 2,223,196 | 1.5 |
| Entertainment | 53,816 | 0.0‡ |
| Exchange-Traded Fund | 1,003,428 | 0.7 |
| Financial Services | 887,401 | 0.6 |
| Gas Utilities | 513,872 | 0.4 |
| Ground Transportation | 568,167 | 0.4 |
| Health Care Equipment & Supplies | 2,716,386 | 1.9 |
| Hotels, Restaurants & Leisure | 4,068,616 | 2.8 |
| Household Durables | 1,529,281 | 1.0 |
| Household Products | 2,202,230 | 1.5 |
| Independent Power and Renewable Electricity Producers | 1,343,862 | 0.9 |
| Industrial Conglomerates | 1,089,362 | 0.7 |
| Industrial REITs | 831,051 | 0.6 |
| Insurance | 10,053,892 | 6.9 |
| Interactive Media & Services | 2,891,501 | 2.0 |
| IT Services | 1,623,706 | 1.1 |
| Life Sciences Tools & Services | 1,575,268 | 1.1 |
| Machinery | 3,275,566 | 2.2 |
| Media | 811,048 | 0.6 |
| Metals & Mining | 6,454,450 | 4.4 |
| Multi-Utilities | 1,476,814 | 1.0 |
| Oil, Gas & Consumable Fuels | 8,265,993 | 5.6 |
| Passenger Airlines | 910,148 | 0.6 |
| | Value | | Percent †^ |
| Personal Care Products | $ 6,810,870 | | 4.7% |
| Pharmaceuticals | 9,931,022 | | 6.8 |
| Professional Services | 2,104,208 | | 1.4 |
| Real Estate Management & Development | 2,965,159 | | 2.0 |
| Retail REITs | 731,058 | | 0.5 |
| Semiconductors & Semiconductor Equipment | 7,954,365 | | 5.4 |
| Software | 1,144,838 | | 0.8 |
| Technology Hardware, Storage & Peripherals | 2,199,126 | | 1.5 |
| Textiles, Apparel & Luxury Goods | 3,000,001 | | 2.1 |
| Trading Companies & Distributors | 2,792,374 | | 1.9 |
| Transportation Infrastructure | 199,969 | | 0.1 |
| Water Utilities | 713,164 | | 0.5 |
| Wireless Telecommunication Services | 2,393,279 | | 1.6 |
| | 144,702,221 | | 98.9 |
| Short-Term Investments | 2,265,083 | | 1.5 |
| Other Assets, Less Liabilities* | (652,482) | | (0.4) |
| Net Assets | $146,314,822 | | 100.0% |
| * | Includes Investments sold short (details are shown below). |
The table below sets forth the diversification of the Fund's investments sold short by industry.
| | Value | | Percent †^ |
| Biotechnology | $ (2) | | (0.0)%‡ |
| Passenger Airlines | (28) | | (0.0)‡ |
| | $(30) | | (0.0)%‡ |
| † | Percentages indicated are based on Fund net assets. |
| ^ | Industry and country classifications may be different than those used for compliance monitoring purposes. |
| ‡ | Less than one-tenth of a percent. |
The notes to the financial statements are an integral part of, and should be read in conjunction with, the financial statements.
17
Statement of Assets and Liabilities as of October 31, 2023
| Assets |
Investment in unaffiliated securities before investments sold short, at value
(identified cost $157,952,677) including securities on loan of $1,742,263 | $ 145,679,647 |
Investment in affiliated investment companies, at value
(identified cost $1,287,657) | 1,287,657 |
Cash denominated in foreign currencies
(identified cost $113,374) | 113,022 |
| Cash collateral on deposit for short positions | 25,338 |
| Receivables: | |
| Investment securities sold | 1,362,413 |
| Dividends | 670,792 |
| Fund shares sold | 1,437 |
| Securities lending | 630 |
| Other assets | 24,158 |
| Total assets | 149,165,094 |
| Liabilities |
| Investments sold short (proceeds $0) | 30 |
| Cash collateral received for securities on loan | 977,426 |
| Due to custodian | 3,499 |
| Payables: | |
| Investment securities purchased | 1,612,168 |
| Fund shares redeemed | 102,921 |
| Manager (See Note 3) | 83,939 |
| Custodian | 39,775 |
| Transfer agent (See Note 3) | 10,498 |
| Shareholder communication | 9,838 |
| Professional fees | 4,783 |
| NYLIFE Distributors (See Note 3) | 3,678 |
| Trustees | 20 |
| Accrued expenses | 1,697 |
| Total liabilities | 2,850,272 |
| Net assets | $ 146,314,822 |
| Composition of Net Assets |
| Shares of beneficial interest outstanding (par value of $.001 per share) unlimited number of shares authorized | $ 22,283 |
| Additional paid-in-capital | 261,152,250 |
| | 261,174,533 |
| Total distributable earnings (loss) | (114,859,711) |
| Net assets | $ 146,314,822 |
| Class A | |
| Net assets applicable to outstanding shares | $ 9,865,726 |
| Shares of beneficial interest outstanding | 1,512,773 |
| Net asset value per share outstanding | $ 6.52 |
| Maximum sales charge (5.50% of offering price) | 0.38 |
| Maximum offering price per share outstanding | $ 6.90 |
| Investor Class | |
| Net assets applicable to outstanding shares | $ 1,596,802 |
| Shares of beneficial interest outstanding | 246,413 |
| Net asset value per share outstanding | $ 6.48 |
| Maximum sales charge (5.00% of offering price) | 0.34 |
| Maximum offering price per share outstanding | $ 6.82 |
| Class C | |
| Net assets applicable to outstanding shares | $ 1,325,001 |
| Shares of beneficial interest outstanding | 209,726 |
| Net asset value and offering price per share outstanding | $ 6.32 |
| Class I | |
| Net assets applicable to outstanding shares | $133,527,293 |
| Shares of beneficial interest outstanding | 20,313,828 |
| Net asset value and offering price per share outstanding | $ 6.57 |
The notes to the financial statements are an integral part of, and should be read in conjunction with, the financial statements.
| 18 | MainStay WMC International Research Equity Fund |
Statement of Operations for the year ended October 31, 2023
| Investment Income (Loss) |
| Income | |
| Dividends-unaffiliated (net of foreign tax withholding of $378,276) | $ 4,433,575 |
| Dividends-affiliated | 31,945 |
| Securities lending, net | 16,329 |
| Total income | 4,481,849 |
| Expenses | |
| Manager (See Note 3) | 1,232,469 |
| Custodian | 121,616 |
| Professional fees | 94,007 |
| Transfer agent (See Note 3) | 73,648 |
| Registration | 57,831 |
| Distribution/Service—Class A (See Note 3) | 27,843 |
| Distribution/Service—Investor Class (See Note 3) | 4,502 |
| Distribution/Service—Class C (See Note 3) | 20,327 |
| Shareholder communication | 4,667 |
| Trustees | 4,173 |
| Miscellaneous | 5,060 |
| Total expenses before waiver/reimbursement | 1,646,143 |
| Expense waiver/reimbursement from Manager (See Note 3) | (160,615) |
| Reimbursement from prior custodian(a) | (1,007) |
| Net expenses | 1,484,521 |
| Net investment income (loss) | 2,997,328 |
| Realized and Unrealized Gain (Loss) |
| Net realized gain (loss) on: | |
| Unaffiliated investment transactions | (1,384,913) |
| Foreign currency transactions | (65,093) |
| Net realized gain (loss) | (1,450,006) |
| Net change in unrealized appreciation (depreciation) on: | |
| Unaffiliated investments | 19,862,686 |
| Translation of other assets and liabilities in foreign currencies | 55,805 |
| Net change in unrealized appreciation (depreciation) | 19,918,491 |
| Net realized and unrealized gain (loss) | 18,468,485 |
| Net increase (decrease) in net assets resulting from operations | $21,465,813 |
| (a) | Represents a refund for overbilling of custody fees. |
The notes to the financial statements are an integral part of, and should be read in conjunction with, the financial statements.
19
Statements of Changes in Net Assets
for the years ended October 31, 2023 and October 31, 2022
| | 2023 | 2022 |
| Increase (Decrease) in Net Assets |
| Operations: | | |
| Net investment income (loss) | $ 2,997,328 | $ 3,679,800 |
| Net realized gain (loss) | (1,450,006) | (12,425,693) |
| Net change in unrealized appreciation (depreciation) | 19,918,491 | (47,901,780) |
| Net increase (decrease) in net assets resulting from operations | 21,465,813 | (56,647,673) |
| Distributions to shareholders: | | |
| Class A | (185,367) | (367,003) |
| Investor Class | (23,565) | (50,882) |
| Class C | (5,091) | (64,267) |
| Class I | (3,101,573) | (5,440,803) |
| Total distributions to shareholders | (3,315,596) | (5,922,955) |
| Capital share transactions: | | |
| Net proceeds from sales of shares | 4,867,268 | 16,096,804 |
| Net asset value of shares issued to shareholders in reinvestment of distributions | 3,308,751 | 5,906,186 |
| Cost of shares redeemed | (42,023,793) | (28,091,409) |
| Increase (decrease) in net assets derived from capital share transactions | (33,847,774) | (6,088,419) |
| Net increase (decrease) in net assets | (15,697,557) | (68,659,047) |
| Net Assets |
| Beginning of year | 162,012,379 | 230,671,426 |
| End of year | $146,314,822 | $162,012,379 |
The notes to the financial statements are an integral part of, and should be read in conjunction with, the financial statements.
| 20 | MainStay WMC International Research Equity Fund |
Financial Highlights selected per share data and ratios
| | Year Ended October 31, |
| Class A | 2023 | | 2022 | | 2021 | | 2020 | | 2019 |
| Net asset value at beginning of year | $ 5.90 | | $ 8.16 | | $ 6.40 | | $ 7.77 | | $ 7.93 |
| Net investment income (loss) (a) | 0.11 | | 0.12 | | 0.09 | | 0.06 | | 0.15 |
| Net realized and unrealized gain (loss) | 0.62 | | (2.18) | | 1.81 | | (0.70) | | 0.10 |
| Total from investment operations | 0.73 | | (2.06) | | 1.90 | | (0.64) | | 0.25 |
| Less distributions: | | | | | | | | | |
| From net investment income | (0.11) | | (0.20) | | (0.14) | | (0.73) | | (0.41) |
| Net asset value at end of year | $ 6.52 | | $ 5.90 | | $ 8.16 | | $ 6.40 | | $ 7.77 |
| Total investment return (b) | 12.34% | | (25.89)% | | 29.93% | | (9.21)% | | 3.83% |
| Ratios (to average net assets)/Supplemental Data: | | | | | | | | | |
| Net investment income (loss) | 1.60% | | 1.67% | | 1.09% | | 0.89% | | 2.04% |
| Net expenses (c) | 1.15% | | 1.15%(d) | | 1.31%(d) | | 1.63%(d) | | 1.75%(d) |
| Expenses (before waiver/reimbursement) (c) | 1.21% | | 1.19%(d) | | 1.31%(d) | | 1.63%(d) | | 1.75%(d) |
| Portfolio turnover rate | 85% | | 65% | | 117% | | 136% | | 182% |
| Net assets at end of year (in 000’s) | $ 9,866 | | $ 10,371 | | $ 15,492 | | $ 12,373 | | $ 19,557 |
| (a) | Per share data based on average shares outstanding during the year. |
| (b) | Total investment return is calculated exclusive of sales charges and assumes the reinvestment of dividends and distributions. For periods of less than one year, total return is not annualized. |
| (c) | In addition to the fees and expenses which the Fund bears directly, it also indirectly bears a pro-rata share of the fees and expenses of the underlying funds in which it invests. Such indirect expenses are not included in the above expense ratios. |
| (d) | The expense ratios presented below show the impact of short sales expense: |
| Year Ended | | Net Expenses
(excluding short
sale expenses) | | Short Sales
Expenses |
| October 31, 2022 | | 1.15% | | 0.00%(e) |
| October 31, 2021 | | 1.30% | | 0.01% |
| October 31, 2020 | | 1.60% | | 0.03% |
| October 31, 2019 | | 1.64% | | 0.11% |
The notes to the financial statements are an integral part of, and should be read in conjunction with, the financial statements.
21
Financial Highlights selected per share data and ratios
| | Year Ended October 31, |
| Investor Class | 2023 | | 2022 | | 2021 | | 2020 | | 2019 |
| Net asset value at beginning of year | $ 5.87 | | $ 8.11 | | $ 6.36 | | $ 7.73 | | $ 7.90 |
| Net investment income (loss) (a) | 0.08 | | 0.09 | | 0.05 | | 0.04 | | 0.15 |
| Net realized and unrealized gain (loss) | 0.62 | | (2.16) | | 1.82 | | (0.70) | | 0.08 |
| Total from investment operations | 0.70 | | (2.07) | | 1.87 | | (0.66) | | 0.23 |
| Less distributions: | | | | | | | | | |
| From net investment income | (0.09) | | (0.17) | | (0.12) | | (0.71) | | (0.40) |
| Net asset value at end of year | $ 6.48 | | $ 5.87 | | $ 8.11 | | $ 6.36 | | $ 7.73 |
| Total investment return (b) | 11.84% | | (26.07)% | | 29.66% | | (9.47)% | | 3.54% |
| Ratios (to average net assets)/Supplemental Data: | | | | | | | | | |
| Net investment income (loss) | 1.23% | | 1.35% | | 0.64% | | 0.66% | | 2.00% |
| Net expenses (c) | 1.52% | | 1.46%(d) | | 1.63%(d) | | 1.89%(d) | | 1.93%(d) |
| Expenses (before waiver/reimbursement) (c) | 1.59% | | 1.50%(d) | | 1.63%(d) | | 1.89%(d) | | 1.93%(d) |
| Portfolio turnover rate | 85% | | 65% | | 117% | | 136% | | 182% |
| Net assets at end of year (in 000's) | $ 1,597 | | $ 1,624 | | $ 2,487 | | $ 2,731 | | $ 3,690 |
| (a) | Per share data based on average shares outstanding during the year. |
| (b) | Total investment return is calculated exclusive of sales charges and assumes the reinvestment of dividends and distributions. For periods of less than one year, total return is not annualized. |
| (c) | In addition to the fees and expenses which the Fund bears directly, it also indirectly bears a pro-rata share of the fees and expenses of the underlying funds in which it invests. Such indirect expenses are not included in the above expense ratios. |
| (d) | The expense ratios presented below show the impact of short sales expense: |
| Year Ended | | Net Expenses
(excluding short
sale expenses) | | Short Sales
Expenses |
| October 31, 2022 | | 1.46% | | 0.00%(e) |
| October 31, 2021 | | 1.62% | | 0.01% |
| October 31, 2020 | | 1.86% | | 0.03% |
| October 31, 2019 | | 1.81% | | 0.12% |
The notes to the financial statements are an integral part of, and should be read in conjunction with, the financial statements.
| 22 | MainStay WMC International Research Equity Fund |
Financial Highlights selected per share data and ratios
| | Year Ended October 31, |
| Class C | 2023 | | 2022 | | 2021 | | 2020 | | 2019 |
| Net asset value at beginning of year | $ 5.70 | | $ 7.87 | | $ 6.16 | | $ 7.49 | | $ 7.63 |
| Net investment income (loss) (a) | 0.03 | | 0.04 | | 0.00‡ | | (0.01) | | 0.08 |
| Net realized and unrealized gain (loss) | 0.60 | | (2.11) | | 1.76 | | (0.68) | | 0.10 |
| Total from investment operations | 0.63 | | (2.07) | | 1.76 | | (0.69) | | 0.18 |
| Less distributions: | | | | | | | | | |
| From net investment income | (0.01) | | (0.10) | | (0.05) | | (0.64) | | (0.32) |
| Net asset value at end of year | $ 6.32 | | $ 5.70 | | $ 7.87 | | $ 6.16 | | $ 7.49 |
| Total investment return (b) | 11.10% | | (26.65)% | | 28.66% | | (10.16)% | | 2.81% |
| Ratios (to average net assets)/Supplemental Data: | | | | | | | | | |
| Net investment income (loss) | 0.49% | | 0.56% | | 0.01% | | (0.22)% | | 1.14% |
| Net expenses (c) | 2.27% | | 2.21%(d) | | 2.38%(d) | | 2.64%(d) | | 2.66%(d) |
| Expenses (before waiver/reimbursement) (c) | 2.34% | | 2.25%(d) | | 2.38%(d) | | 2.64%(d) | | 2.66%(d) |
| Portfolio turnover rate | 85% | | 65% | | 117% | | 136% | | 182% |
| Net assets at end of year (in 000’s) | $ 1,325 | | $ 2,458 | | $ 5,340 | | $ 6,229 | | $ 14,203 |
| ‡ | Less than one cent per share. |
| (a) | Per share data based on average shares outstanding during the year. |
| (b) | Total investment return is calculated exclusive of sales charges and assumes the reinvestment of dividends and distributions. For periods of less than one year, total return is not annualized. |
| (c) | In addition to the fees and expenses which the Fund bears directly, it also indirectly bears a pro-rata share of the fees and expenses of the underlying funds in which it invests. Such indirect expenses are not included in the above expense ratios. |
| (d) | The expense ratios presented below show the impact of short sales expense: |
| Year Ended | | Net Expenses
(excluding short
sale expenses) | | Short Sales
Expenses |
| October 31, 2022 | | 2.21% | | 0.00%(e) |
| October 31, 2021 | | 2.37% | | 0.01% |
| October 31, 2020 | | 2.61% | | 0.03% |
| October 31, 2019 | | 2.55% | | 0.11% |
The notes to the financial statements are an integral part of, and should be read in conjunction with, the financial statements.
23
Financial Highlights selected per share data and ratios
| | Year Ended October 31, |
| Class I | 2023 | | 2022 | | 2021 | | 2020 | | 2019 |
| Net asset value at beginning of year | $ 5.95 | | $ 8.22 | | $ 6.45 | | $ 7.83 | | $ 8.00 |
| Net investment income (loss) (a) | 0.13 | | 0.14 | | 0.10 | | 0.08 | | 0.17 |
| Net realized and unrealized gain (loss) | 0.62 | | (2.19) | | 1.83 | | (0.71) | | 0.10 |
| Total from investment operations | 0.75 | | (2.05) | | 1.93 | | (0.63) | | 0.27 |
| Less distributions: | | | | | | | | | |
| From net investment income | (0.13) | | (0.22) | | (0.16) | | (0.75) | | (0.44) |
| Net asset value at end of year | $ 6.57 | | $ 5.95 | | $ 8.22 | | $ 6.45 | | $ 7.83 |
| Total investment return (b) | 12.58% | | (25.61)% | | 30.21% | | (8.98)% | | 4.08% |
| Ratios (to average net assets)/Supplemental Data: | | | | | | | | | |
| Net investment income (loss) | 1.87% | | 1.95% | | 1.26% | | 1.19% | | 2.20% |
| Net expenses (c) | 0.86% | | 0.86%(d) | | 1.06%(d) | | 1.38%(d) | | 1.50%(d) |
| Expenses (before waiver/reimbursement) (c) | 0.96% | | 0.94%(d) | | 1.08%(d) | | 1.38%(d) | | 1.50%(d) |
| Portfolio turnover rate | 85% | | 65% | | 117% | | 136% | | 182% |
| Net assets at end of year (in 000’s) | $ 133,527 | | $ 147,559 | | $ 207,352 | | $ 230,100 | | $ 281,279 |
| (a) | Per share data based on average shares outstanding during the year. |
| (b) | Total investment return is calculated exclusive of sales charges and assumes the reinvestment of dividends and distributions. Class I shares are not subject to sales charges. For periods of less than one year, total return is not annualized. |
| (c) | In addition to the fees and expenses which the Fund bears directly, it also indirectly bears a pro-rata share of the fees and expenses of the underlying funds in which it invests. Such indirect expenses are not included in the above expense ratios. |
| (d) | The expense ratios presented below show the impact of short sales expense: |
| Year Ended | | Net Expenses
(excluding short
sale expenses) | | Short Sales
Expenses |
| October 31, 2022 | | 0.86% | | 0.00%(e) |
| October 31, 2021 | | 1.05% | | 0.01% |
| October 31, 2020 | | 1.35% | | 0.03% |
| October 31, 2019 | | 1.40% | | 0.10% |
The notes to the financial statements are an integral part of, and should be read in conjunction with, the financial statements.
| 24 | MainStay WMC International Research Equity Fund |
Notes to Financial Statements
Note 1-Organization and Business
MainStay Funds Trust (the “Trust”) was organized as a Delaware statutory trust on April 28, 2009. The Trust is registered under the Investment Company Act of 1940, as amended (the “1940 Act”), as an open-end management investment company, and is comprised of thirty-seven funds (collectively referred to as the “Funds”). These financial statements and notes relate to the MainStay WMC International Research Equity Fund (the "Fund"), a “diversified” fund, as that term is defined in the 1940 Act, as interpreted or modified by regulatory authorities having jurisdiction, from time to time.
The following table lists the Fund's share classes that have been registered and commenced operations:
| Class | Commenced Operations |
| Class A | September 28, 2007 |
| Investor Class | February 28, 2008 |
| Class C | September 28, 2007 |
| Class I | September 28, 2007 |
Class A and Investor Class shares are offered at net asset value (“NAV”) per share plus an initial sales charge. No initial sales charge applies to investments of $1 million or more (and certain other qualified purchases) in Class A and Investor Class shares. However, a contingent deferred sales charge (“CDSC”) of 1.00% may be imposed on certain redemptions made within 18 months of the date of purchase on shares that were purchased without an initial sales charge. Class C shares are offered at NAV without an initial sales charge, although a 1.00% CDSC may be imposed on certain redemptions of such shares made within one year of the date of purchase of Class C shares. Class I shares are offered at NAV without a sales charge. Depending upon eligibility, Class C shares convert to either Class A or Investor Class shares at the end of the calendar quarter eight years after the date they were purchased. Additionally, Investor Class shares may convert automatically to Class A shares. Under certain circumstances and as may be permitted by the Trust’s multiple class plan pursuant to Rule 18f-3 under the 1940 Act, specified share classes of the Fund may be converted to one or more other share classes of the Fund as disclosed in the capital share transactions within these Notes. The classes of shares have the same voting (except for issues that relate solely to one class), dividend, liquidation and other rights, and the same terms and conditions, except that under distribution plans pursuant to Rule 12b-1 under the 1940 Act, Class C shares are subject to higher distribution and/or service fees than Class A and Investor Class shares. Class I shares are not subject to a distribution and/or service fee.
The Fund's investment objective is to seek long-term growth of capital.
Note 2–Significant Accounting Policies
The Fund is an investment company and accordingly follows the investment company accounting and reporting guidance of the Financial Accounting Standards Board (“FASB”) Accounting Standards Codification Topic 946 Financial Services—Investment Companies. The Fund prepares its financial statements in accordance with generally accepted
accounting principles (“GAAP”) in the United States of America and follows the significant accounting policies described below.
(A) Securities Valuation. Investments are usually valued as of the close of regular trading on the New York Stock Exchange (the "Exchange") (usually 4:00 p.m. Eastern time) on each day the Fund is open for business ("valuation date").
Pursuant to Rule 2a-5 under the 1940 Act, the Board of Trustees of the Trust (the "Board") has designated New York Life Investment Management LLC (“New York Life Investments” or the "Manager") as its Valuation Designee (the "Valuation Designee"). The Valuation Designee is responsible for performing fair valuations relating to all investments in the Fund’s portfolio for which market quotations are not readily available; periodically assessing and managing material valuation risks; establishing and applying fair value methodologies; testing fair valuation methodologies; evaluating and overseeing pricing services; ensuring appropriate segregation of valuation and portfolio management functions; providing quarterly, annual and prompt reporting to the Board, as appropriate; identifying potential conflicts of interest; and maintaining appropriate records. The Valuation Designee has established a valuation committee ("Valuation Committee") to assist in carrying out the Valuation Designee’s responsibilities and establish prices of securities for which market quotations are not readily available. The Fund's and the Valuation Designee's policies and procedures ("Valuation Procedures") govern the Valuation Designee’s selection and application of methodologies for determining and calculating the fair value of Fund investments. The Valuation Designee may value the Fund's portfolio securities for which market quotations are not readily available and other Fund assets utilizing inputs from pricing services and other third-party sources. The Valuation Committee meets (in person, via electronic mail or via teleconference) on an ad-hoc basis to determine fair valuations and on a quarterly basis to review fair value events with respect to certain securities for which market quotations are not readily available, including valuation risks and back-testing results, and preview reports to the Board.
The Valuation Committee establishes prices of securities for which market quotations are not readily available based on such methodologies and measurements on a regular basis after considering information that is reasonably available and deemed relevant by the Valuation Committee. The Board shall oversee the Valuation Designee and review fair valuation materials on a prompt, quarterly and annual basis and approve proposed revisions to the Valuation Procedures.
Investments for which market quotations are not readily available are valued at fair value as determined in good faith pursuant to the Valuation Procedures. A market quotation is readily available only when that quotation is a quoted price (unadjusted) in active markets for identical investments that the Fund can access at the measurement date, provided that a quotation will not be readily available if it is not reliable. "Fair value" is defined as the price the Fund would reasonably expect to receive upon selling an asset or liability in an orderly transaction to an independent buyer in the principal or most advantageous market for the asset or liability. Fair value measurements are determined within a framework that
Notes to Financial Statements (continued)
establishes a three-tier hierarchy that maximizes the use of observable market data and minimizes the use of unobservable inputs to establish a classification of fair value measurements for disclosure purposes. "Inputs" refer broadly to the assumptions that market participants would use in pricing the asset or liability, including assumptions about risk, such as the risk inherent in a particular valuation technique used to measure fair value using a pricing model and/or the risk inherent in the inputs for the valuation technique. Inputs may be observable or unobservable. Observable inputs reflect the assumptions market participants would use in pricing the asset or liability based on market data obtained from sources independent of the Fund. Unobservable inputs reflect the Fund’s own assumptions about the assumptions market participants would use in pricing the asset or liability based on the information available. The inputs or methodology used for valuing assets or liabilities may not be an indication of the risks associated with investing in those assets or liabilities. The three-tier hierarchy of inputs is summarized below.
| • | Level 1—quoted prices (unadjusted) in active markets for an identical asset or liability |
| • | Level 2—other significant observable inputs (including quoted prices for a similar asset or liability in active markets, interest rates and yield curves, prepayment speeds, credit risk, etc.) |
| • | Level 3—significant unobservable inputs (including the Fund's own assumptions about the assumptions that market participants would use in measuring fair value of an asset or liability) |
The level of an asset or liability within the fair value hierarchy is based on the lowest level of an input, both individually and in the aggregate, that is significant to the fair value measurement. The aggregate value by input level of the Fund’s assets and liabilities as of October 31, 2023, is included at the end of the Portfolio of Investments.
The Fund may use third-party vendor evaluations, whose prices may be derived from one or more of the following standard inputs, among others:
| • Broker/dealer quotes | • Benchmark securities |
| • Two-sided markets | • Reference data (corporate actions or material event notices) |
| • Bids/offers | • Monthly payment information |
| • Industry and economic events | • Reported trades |
An asset or liability for which a market quotation is not readily available is valued by methods deemed reasonable in good faith by the Valuation Committee, following the Valuation Procedures to represent fair value. Under these procedures, the Valuation Designee generally uses a market-based approach which may use related or comparable assets or liabilities, recent transactions, market multiples, book values and other relevant information. The Valuation Designee may also use an income-based valuation approach in which the anticipated future cash flows of the asset or liability are discounted to calculate fair value. Discounts may also be applied due to the nature and/or duration of any restrictions on the disposition of the asset or liability. Fair value represents a good faith approximation of the value of a security. Fair value
determinations involve the consideration of a number of subjective factors, an analysis of applicable facts and circumstances and the exercise of judgment. As a result, it is possible that the fair value for a security determined in good faith in accordance with the Valuation Procedures may differ from valuations for the same security determined for other funds using their own valuation procedures. Although the Valuation Procedures are designed to value a security at the price the Fund may reasonably expect to receive upon the security's sale in an orderly transaction, there can be no assurance that any fair value determination thereunder would, in fact, approximate the amount that the Fund would actually realize upon the sale of the security or the price at which the security would trade if a reliable market price were readily available. During the year ended October 31, 2023, there were no material changes to the fair value methodologies.
Securities which may be valued in this manner include, but are not limited to: (i) a security for which trading has been halted or suspended or otherwise does not have a readily available market quotation on a given day; (ii) a debt security that has recently gone into default and for which there is not a current market quotation; (iii) a security of an issuer that has entered into a restructuring; (iv) a security that has been delisted from a national exchange; (v) a security subject to trading collars for which no or limited trading takes place; and (vi) a security whose principal market has been temporarily closed at a time when, under normal conditions, it would be open. Securities valued in this manner are generally categorized as Level 2 or 3 in the hierarchy. As of October 31, 2023, securities that were fair valued in such a manner are shown in the Portfolio of Investments.
Certain securities held by the Fund may principally trade in foreign markets. Events may occur between the time the foreign markets close and the time at which the Fund's NAVs are calculated. These events may include, but are not limited to, situations relating to a single issuer in a market sector, significant fluctuations in U.S. or foreign markets, natural disasters, armed conflicts, governmental actions or other developments not tied directly to the securities markets. Should the Valuation Designee conclude that such events may have affected the accuracy of the last price of such securities reported on the local foreign market, the Valuation Designee may, pursuant to the Valuation Procedures, adjust the value of the local price to reflect the estimated impact on the price of such securities as a result of such events. In this instance, securities are generally categorized as Level 3 in the hierarchy. Additionally, certain foreign equity securities are also fair valued whenever the movement of a particular index exceeds certain thresholds. In such cases, the securities are fair valued by applying factors provided by a third-party vendor in accordance with the Valuation Procedures and are generally categorized as Level 2 in the hierarchy. No foreign equity securities held by the Fund as of October 31, 2023 were fair valued in such a manner.
If the principal market of certain foreign equity securities is closed in observance of a local foreign holiday, these securities are valued using the last closing price of regular trading on the relevant exchange and fair valued by applying factors provided by a third-party vendor in accordance with the Valuation Procedures. These securities are generally categorized
| 26 | MainStay WMC International Research Equity Fund |
as Level 2 in the hierarchy. No securities held by the Fund as of October 31, 2023, were fair valued in such a manner.
Equity securities, rights and warrants, if applicable, are valued at the last quoted sales prices as of the close of regular trading on the relevant exchange on each valuation date. Securities that are not traded on the valuation date are valued at the mean of the last quoted bid and ask prices. Prices are normally taken from the principal market in which each security trades. These securities are generally categorized as Level 1 in the hierarchy.
Exchange-traded funds (“ETFs”) are valued at the last quoted sales prices as of the close of regular trading on the relevant exchange on each valuation date. Securities that are not traded on the valuation date are valued at the mean of the last quoted bid and ask prices. Prices are normally taken from the principal market in which each security trades. These securities are generally categorized as Level 1 in the hierarchy.
Investments in mutual funds, including money market funds, are valued at their respective NAVs at the close of business each day on the valuation date. These securities are generally categorized as Level 1 in the hierarchy.
Temporary cash investments acquired in excess of 60 days to maturity at the time of purchase are valued using the latest bid prices or using valuations based on a matrix system (which considers such factors as security prices, yields, maturities and ratings), both as furnished by independent pricing services. Temporary cash investments that mature in 60 days or less at the time of purchase ("Short-Term Investments") are valued using the amortized cost method of valuation, unless the use of such method would be inappropriate. The amortized cost method involves valuing a security at its cost on the date of purchase and thereafter assuming a constant amortization to maturity of the difference between such cost and the value on maturity date. Amortized cost approximates the current fair value of a security. Securities valued using the amortized cost method are not valued using quoted prices in an active market and are generally categorized as Level 2 in the hierarchy.
The information above is not intended to reflect an exhaustive list of the methodologies that may be used to value portfolio investments. The Valuation Procedures permit the use of a variety of valuation methodologies in connection with valuing portfolio investments. The methodology used for a specific type of investment may vary based on the market data available or other considerations. The methodologies summarized above may not represent the specific means by which portfolio investments are valued on any particular business day.
A portfolio investment may be classified as an illiquid investment under the Trust's written liquidity risk management program and related procedures (“Liquidity Program”). Illiquidity of an investment might prevent the sale of such investment at a time when the Manager or the Subadvisor might wish to sell, and these investments could have the effect of decreasing the overall level of the Fund's liquidity. Further, the lack of an established secondary market may make it more difficult to value illiquid investments, requiring the Fund to rely on judgments that
may be somewhat subjective in measuring value, which could vary materially from the amount that the Fund could realize upon disposition. Difficulty in selling illiquid investments may result in a loss or may be costly to the Fund. An illiquid investment is any investment that the Manager or Subadvisor reasonably expects cannot be sold or disposed of in current market conditions in seven calendar days or less without the sale or disposition significantly changing the market value of the investment. The liquidity classification of each investment will be made using information obtained after reasonable inquiry and taking into account, among other things, relevant market, trading and investment-specific considerations in accordance with the Liquidity Program. Illiquid investments are often fair valued in accordance with the Fund's procedures described above. The liquidity of the Fund's investments was determined as of October 31, 2023, and can change at any time. Illiquid investments as of October 31, 2023, are shown in the Portfolio of Investments.
(B) Income Taxes. The Fund's policy is to comply with the requirements of the Internal Revenue Code of 1986, as amended (the “Internal Revenue Code”), applicable to regulated investment companies and to distribute all of its taxable income to the shareholders of the Fund within the allowable time limits.
The Manager evaluates the Fund’s tax positions to determine if the tax positions taken meet the minimum recognition threshold in connection with accounting for uncertainties in income tax positions taken or expected to be taken for the purposes of measuring and recognizing tax liabilities in the financial statements. Recognition of tax benefits of an uncertain tax position is permitted only to the extent the position is “more likely than not” to be sustained assuming examination by taxing authorities. The Manager analyzed the Fund's tax positions taken on federal, state and local income tax returns for all open tax years (for up to three tax years) and has concluded that no provisions for federal, state and local income tax are required in the Fund's financial statements. The Fund's federal, state and local income tax and federal excise tax returns for tax years for which the applicable statutes of limitations have not expired are subject to examination by the Internal Revenue Service and state and local departments of revenue.
(C) Foreign Taxes. The Fund may be subject to foreign taxes on income and other transaction-based taxes imposed by certain countries in which it invests. A portion of the taxes on gains on investments or currency purchases/repatriation may be reclaimable. The Fund will accrue such taxes and reclaims as applicable, based upon its current interpretation of tax rules and regulations that exist in the markets in which it invests.
The Fund may be subject to taxation on realized capital gains, repatriation proceeds and other transaction-based taxes imposed by certain countries in which it invests. The Fund will accrue such taxes as applicable based upon its current interpretation of tax rules and regulations that exist in the market in which it invests. Capital gains taxes relating to positions still held are reflected as a liability in the Statement of Assets and Liabilities, as well as an adjustment to the Fund's net unrealized appreciation
Notes to Financial Statements (continued)
(depreciation). Taxes related to capital gains realized, if any, are reflected as part of net realized gain (loss) in the Statement of Operations. Changes in tax liabilities related to capital gains taxes on unrealized investment gains, if any, are reflected as part of the change in net unrealized appreciation (depreciation) on investments in the Statement of Operations. Transaction-based charges are generally assessed as a percentage of the transaction amount.
(D) Dividends and Distributions to Shareholders. Dividends and distributions are recorded on the ex-dividend date. The Fund intends to declare and pay dividends from net investment income and distributions from net realized capital and currency gains, if any, at least annually. Unless a shareholder elects otherwise, all dividends and distributions are reinvested at NAV in the same class of shares of the Fund. Dividends and distributions to shareholders are determined in accordance with federal income tax regulations and may differ from determinations using GAAP.
(E) Security Transactions and Investment Income. The Fund records security transactions on the trade date. Realized gains and losses on security transactions are determined using the identified cost method. Dividend income is recognized on the ex-dividend date, net of any foreign tax withheld at the source, and interest income is accrued as earned using the effective interest rate method. Distributions received from real estate investment trusts may be classified as dividends, capital gains and/or return of capital.
Investment income and realized and unrealized gains and losses on investments of the Fund are allocated pro rata to the separate classes of shares based upon their relative net assets on the date the income is earned or realized and unrealized gains and losses are incurred.
(F) Expenses. Expenses of the Trust are allocated to the individual Funds in proportion to the net assets of the respective Funds when the expenses are incurred, except where direct allocations of expenses can be made. Expenses (other than transfer agent expenses and fees incurred under the shareholder services plans and/or the distribution plans further discussed in Note 3(B)) are allocated to separate classes of shares pro rata based upon their relative net assets on the date the expenses are incurred. The expenses borne by the Fund, including those of related parties to the Fund, are shown in the Statement of Operations.
Additionally, the Fund may invest in ETFs and mutual funds, which are subject to management fees and other fees that may cause the costs of investing in ETFs and mutual funds to be greater than the costs of owning the underlying securities directly. These indirect expenses of ETFs and mutual funds are not included in the amounts shown as expenses in the Statement of Operations or in the expense ratios included in the Financial Highlights.
(G) Use of Estimates. In preparing financial statements in conformity with GAAP, the Manager makes estimates and assumptions that affect the reported amounts and disclosures in the financial statements. Actual results could differ from those estimates and assumptions.
(H) Foreign Currency Transactions. The Fund's books and records are maintained in U.S. dollars. Prices of securities denominated in foreign currency amounts are translated into U.S. dollars at the mean between the buying and selling rates last quoted by any major U.S. bank at the following dates:
(i) market value of investment securities, other assets and liabilities— at the valuation date; and
(ii) purchases and sales of investment securities, income and expenses—at the date of such transactions.
The assets and liabilities that are denominated in foreign currency amounts are presented at the exchange rates and market values at the close of the period. The realized and unrealized changes in net assets arising from fluctuations in exchange rates and market prices of securities are not separately presented.
Net realized gain (loss) on foreign currency transactions represents net currency gains or losses realized as a result of differences between the amounts of securities sale proceeds or purchase cost, dividends, interest and withholding taxes as recorded on the Fund's books, and the U.S. dollar equivalent amount actually received or paid. Net currency gains or losses from valuing such foreign currency denominated assets and liabilities, other than investments at valuation date exchange rates, are reflected in unrealized foreign exchange gains or losses.
(I) Securities Sold Short. During the period a short position is open, depending on the nature and type of security, a short position is reflected as a liability and is marked to market in accordance with the valuation methodologies previously detailed (See Note 2(A)). Liabilities for securities sold short are closed out by purchasing the applicable securities for delivery to the counterparty broker. A gain, limited to the price at which the Fund sold the security short, or a loss, unlimited as to dollar amount, will be recognized upon termination of a short sale if the market price on the date the short position is closed out is less or greater, respectively, than the proceeds originally received. Any such gain or loss may be offset, completely or in part, by the change in the value of the hedged investments. Interest on short positions held is accrued daily, while dividends declared on short positions existing on the record date are recorded on the ex-dividend date as a dividend expense in the Statement of Operations. Broker fees and other expenses related to securities sold short are disclosed in the Statement of Operations. Short sales involve risk of loss in excess of the related amounts reflected in the Statement of Assets and Liabilities. As of October 31, 2023, the securities sold short are shown in the Portfolio of Investments.
(J) Securities Lending. In order to realize additional income, the Fund may engage in securities lending, subject to the limitations set forth in the 1940 Act and relevant guidance by the staff of the Securities and Exchange Commission (“SEC”). If the Fund engages in securities lending, the Fund will lend through its custodian, JPMorgan Chase Bank, N.A., ("JPMorgan"), acting as securities lending agent on behalf of the Fund. Under the current arrangement, JPMorgan will manage the Fund's collateral in accordance with the securities lending agency agreement
| 28 | MainStay WMC International Research Equity Fund |
between the Fund and JPMorgan, and indemnify the Fund against counterparty risk. The loans will be collateralized by cash (which may be invested in a money market fund) and/or non-cash collateral (which may include U.S. Treasury securities and/or U.S. government agency securities issued or guaranteed by the United States government or its agencies or instrumentalities) at least equal at all times to the market value of the securities loaned. Non-cash collateral held at year end is segregated and cannot be transferred by the Fund. The Fund bears the risk of delay in recovery of, or loss of rights in, the securities loaned. The Fund may also record a realized gain or loss on securities deemed sold due to a borrower’s inability to return securities on loan. The Fund bears the risk of any loss on investment of cash collateral. The Fund will receive compensation for lending its securities in the form of fees or it will retain a portion of interest earned on the investment of any cash collateral. The Fund will also continue to receive interest and dividends on the securities loaned and any gain or loss in the market price of the securities loaned that may occur during the term of the loan will be for the account of the Fund. Income earned from securities lending activities, if any, is reflected in the Statement of Operations. Securities on loan as of October 31, 2023, are shown in the Portfolio of Investments.
(K) Rights and Warrants. Rights are certificates that permit the holder to purchase a certain number of shares, or a fractional share, of a new stock from the issuer at a specific price. Warrants are instruments that entitle the holder to buy an equity security at a specific price for a specific period of time. These investments can provide a greater potential for profit or loss than an equivalent investment in the underlying security. Prices of these investments do not necessarily move in tandem with the prices of the underlying securities.
There is risk involved in the purchase of rights and warrants in that these investments are speculative investments. The Fund could also lose the entire value of its investment in warrants if such warrants are not exercised by the date of its expiration. The Fund is exposed to risk until the sale or exercise of each right or warrant is completed. Rights and Warrants as of October 31, 2023 are shown in the Portfolio of Investments.
(L) Foreign Securities Risk. The Fund invests in foreign securities, which carry certain risks that are in addition to the usual risks inherent in domestic securities. Foreign regulatory regimes and securities markets can have less stringent investor protections and disclosure standards and less liquid trading markets than U.S. regulatory regimes and securities markets, and can experience political, social and economic developments that may affect the value of investments in foreign securities. These risks include those resulting from currency fluctuations, future adverse political or economic developments and possible imposition of currency exchange blockages or other foreign governmental laws or restrictions. Economic sanctions and other similar governmental actions or developments could, among other things, effectively restrict or eliminate the Fund's ability to purchase or sell certain foreign securities or groups of foreign securities, and thus may make the Fund's investments in such securities less liquid or more difficult to value. These risks are likely to be greater in emerging
markets than in developed markets. The ability of issuers of debt securities held by the Fund to meet their obligations may be affected by, among other things, economic or political developments in a specific country, industry or region.
(M) Indemnifications. Under the Trust’s organizational documents, its officers and trustees are indemnified against certain liabilities that may arise out of performance of their duties to the Trust. Additionally, in the normal course of business, the Fund enters into contracts with third-party service providers that contain a variety of representations and warranties and that may provide general indemnifications. The Fund's maximum exposure under these arrangements is unknown, as this would involve future claims that may be made against the Fund that have not yet occurred. The Manager believes that the risk of loss in connection with these potential indemnification obligations is remote. However, there can be no assurance that material liabilities related to such obligations will not arise in the future, which could adversely impact the Fund.
Note 3–Fees and Related Party Transactions
(A) Manager and Subadvisor. New York Life Investments, a registered investment adviser and an indirect, wholly-owned subsidiary of New York Life Insurance Company ("New York Life"), serves as the Fund's Manager, pursuant to an Amended and Restated Management Agreement ("Management Agreement"). The Manager provides offices, conducts clerical, recordkeeping and bookkeeping services and keeps most of the financial and accounting records required to be maintained by the Fund. Except for the portion of salaries and expenses that are the responsibility of the Fund, the Manager pays the salaries and expenses of all personnel affiliated with the Fund and certain operational expenses of the Fund. The Fund reimburses New York Life Investments in an amount equal to the portion of the compensation of the Chief Compliance Officer attributable to the Fund. Wellington Management Company LLP ("Wellington" or the "Subadvisor"), a registered investment adviser, serves as the Subadvisor to the Fund and is responsible for the day-to-day portfolio management of the Fund. Pursuant to the terms of a Subadvisory Agreement ("Subadvisory Agreement") between New York Life Investments and Wellington, New York Life Investments pays for the services of the Subadvisor.
Pursuant to the Management Agreement, the Fund pays the Manager a monthly fee for the services performed and the facilities furnished at an annual rate of 0.75% of average daily net assets of the Fund.
New York Life Investments has contractually agreed to waive fees and/or reimburse expenses so that Total Annual Fund Operating Expenses (excluding taxes, interest, litigation, extraordinary expenses, brokerage and other transaction expenses relating to the purchase or sale of portfolio investments and acquired (underlying) fund fees and expenses) do not exceed the following percentages of average daily net assets: 1.18% for Class A shares and 0.86% for Class I shares. This agreement will remain in effect until February 28, 2024, and shall renew automatically for one-year terms unless New York Life Investments
Notes to Financial Statements (continued)
provides written notice of termination prior to the start of the next term or upon approval of the Board.
New York Life Investments has agreed to voluntarily waive fees and/or reimburse expenses of the appropriate class of the Fund so that Total Annual Fund Operating Expenses (excluding taxes, interest, litigation, extraordinary expenses, brokerage and other transaction expenses relating to the purchase and sale of portfolio investments, and acquired (underlying) fund fees and expenses) of a class do not exceed the following percentages of average daily net assets: 1.95% for Investor Class shares and 2.70% for Class C shares. These voluntary waivers or reimbursements may be discontinued at any time without notice.
During the year ended October 31, 2023, New York Life Investments earned fees from the Fund in the amount of $1,232,469 and waived fees and/or reimbursed expenses, including the waiver/reimbursement of certain class specific expenses in the amount of $160,615 and paid the Subadvisor fees in the amount of $479,482.
JPMorgan provides sub-administration and sub-accounting services to the Fund pursuant to an agreement with New York Life Investments. These services include calculating the daily NAVs of the Fund, maintaining the general ledger and sub-ledger accounts for the calculation of the Fund's NAVs, and assisting New York Life Investments in conducting various aspects of the Fund's administrative operations. For providing these services to the Fund, JPMorgan is compensated by New York Life Investments.
Pursuant to an agreement between the Trust and New York Life Investments, New York Life Investments is responsible for providing or procuring certain regulatory reporting services for the Fund. The Fund will reimburse New York Life Investments for the actual costs incurred by New York Life Investments in connection with providing or procuring these services for the Fund.
(B) Distribution and Service Fees. The Trust, on behalf of the Fund, has entered into a distribution agreement with NYLIFE Distributors LLC (the “Distributor”), an affiliate of New York Life Investments. The Fund has adopted distribution plans (the “Plans”) in accordance with the provisions of Rule 12b-1 under the 1940 Act.
Pursuant to the Class A and Investor Class Plans, the Distributor receives a monthly fee from the Class A and Investor Class shares at an annual rate of 0.25% of the average daily net assets of the Class A and Investor Class shares for distribution and/or service activities as designated by the Distributor. Pursuant to the Class C Plan, Class C shares pay the Distributor a monthly distribution fee at an annual rate of 0.75% of the average daily net assets of the Class C shares, along with a service fee at an annual rate of 0.25% of the average daily net assets of the Class C shares, for a total 12b-1 fee of 1.00%. Class I shares are not subject to a distribution and/or service fee.
The Plans provide that the distribution and service fees are payable to the Distributor regardless of the amounts actually expended by the Distributor for distribution of the Fund's shares and service activities.
(C) Sales Charges. The Fund was advised by the Distributor that the amount of initial sales charges retained on sales of Class A and Investor Class shares during the year ended October 31, 2023, were $409 and $175, respectively.
(D) Transfer, Dividend Disbursing and Shareholder Servicing Agent. NYLIM Service Company LLC, an affiliate of New York Life Investments, is the Fund's transfer, dividend disbursing and shareholder servicing agent pursuant to an agreement between NYLIM Service Company LLC and the Trust. NYLIM Service Company LLC has entered into an agreement with SS&C Global Investor & Distribution Solutions, Inc. ("SS&C"), pursuant to which SS&C performs certain transfer agent services on behalf of NYLIM Service Company LLC. New York Life Investments has contractually agreed to limit the transfer agency expenses charged to the Fund’s share classes to a maximum of 0.35% of that share class’s average daily net assets on an annual basis after deducting any applicable Fund or class-level expense reimbursement or small account fees. This agreement will remain in effect until February 28, 2024, and shall renew automatically for one-year terms unless New York Life Investments provides written notice of termination prior to the start of the next term or upon approval of the Board. During the year ended October 31, 2023, transfer agent expenses incurred by the Fund and any reimbursements, pursuant to the aforementioned Transfer Agency expense limitation agreement, were as follows:
| Class | Expense | Waived |
| Class A | $ 3,995 | $ — |
| Investor Class | 7,459 | (1,264) |
| Class C | 8,552 | (1,526) |
| Class I | 53,642 | — |
(E) Small Account Fee. Shareholders with small accounts adversely impact the cost of providing transfer agency services. In an effort to reduce total transfer agency expenses, the Fund has implemented a small account fee on certain types of accounts. As described in the Fund's prospectus, certain shareholders with an account balance of less than $1,000 ($5,000 for Class A share accounts) are charged an annual per account fee of $20 (assessed semi-annually), the proceeds from which offset transfer agent fees as reflected in the Statement of Operations. This small account fee will not apply to certain types of accounts as described further in the Fund’s prospectus.
| 30 | MainStay WMC International Research Equity Fund |
Note 4-Federal Income Tax
As of October 31, 2023, the cost and unrealized appreciation (depreciation) of the Fund’s investment portfolio, including applicable derivative contracts and other financial instruments, as determined on a federal income tax basis, were as follows:
| | Federal Tax
Cost | Gross
Unrealized
Appreciation | Gross
Unrealized
(Depreciation) | Net
Unrealized
Appreciation/
(Depreciation) |
| Investments in Securities | $160,196,814 | $7,920,995 | $(21,150,535) | $(13,229,540) |
As of October 31, 2023, the components of accumulated gain (loss) on a tax basis were as follows:
Ordinary
Income | Accumulated
Capital
and Other
Gain (Loss) | Other
Temporary
Differences | Unrealized
Appreciation
(Depreciation) | Total
Accumulated
Gain (Loss) |
| $2,836,930 | $(104,421,629) | $— | $(13,275,012) | $(114,859,711) |
The difference between book-basis and tax-basis unrealized appreciation (depreciation) is primarily due to wash sale adjustments and passive foreign investment company (“PFIC”).
As of October 31, 2023, for federal income tax purposes, capital loss carryforwards of $104,421,629, as shown in the table below, were available to the extent provided by the regulations to offset future realized gains of the Fund. Accordingly, no capital gains distributions are expected to be paid to shareholders until net gains have been realized in excess of such amounts.
Capital Loss
Available Through | Short-Term
Capital Loss
Amounts (000’s) | Long-Term
Capital Loss
Amounts (000’s) |
| Unlimited | $95,295 | $9,127 |
During the years ended October 31, 2023 and October 31, 2022, the tax character of distributions paid as reflected in the Statements of Changes in Net Assets was as follows:
| | 2023 | 2022 |
| Distributions paid from: | | |
| Ordinary Income | $3,315,596 | $5,922,955 |
Note 5–Custodian
JPMorgan is the custodian of cash and securities held by the Fund. Custodial fees are charged to the Fund based on the Fund's net assets and/or the market value of securities held by the Fund and the number of certain transactions incurred by the Fund.
Note 6–Line of Credit
The Fund and certain other funds managed by New York Life Investments maintain a line of credit with a syndicate of banks in order to secure a source of funds for temporary purposes to meet unanticipated or excessive redemption requests.
Effective July 25, 2023, under the credit agreement (the “Credit Agreement”), the aggregate commitment amount is $600,000,000 with an additional uncommitted amount of $100,000,000. The commitment fee is an annual rate of 0.15% of the average commitment amount payable quarterly, regardless of usage, to JPMorgan, who serves as the agent to the syndicate. The commitment fee is allocated among the Fund and certain other funds managed by New York Life Investments based upon their respective net assets and other factors. Interest on any revolving credit loan is charged based upon the Federal Funds Rate, Daily Simple Secured Overnight Financing Rate ("SOFR") + 0.10%, or the Overnight Bank Funding Rate, whichever is higher. The Credit Agreement expires on July 23, 2024, although the Fund, certain other funds managed by New York Life Investments and the syndicate of banks may renew the Credit Agreement for an additional year on the same or different terms or enter into a credit agreement with a different syndicate of banks. Prior to July 25, 2023, the aggregate commitment amount and the commitment fee were the same as those under the current Credit Agreement. During the year ended October 31, 2023, there were no borrowings made or outstanding with respect to the Fund under the Credit Agreement.
Note 7–Interfund Lending Program
Pursuant to an exemptive order issued by the SEC, the Fund, along with certain other funds managed by New York Life Investments, may participate in an interfund lending program. The interfund lending program provides an alternative credit facility that permits the Fund and certain other funds managed by New York Life Investments to lend or borrow money for temporary purposes directly to or from one another, subject to the conditions of the exemptive order. During the year ended October 31, 2023, there were no interfund loans made or outstanding with respect to the Fund.
Note 8–Purchases and Sales of Securities (in 000’s)
During the year ended October 31, 2023, purchases and sales of securities, other than short-term securities, were $138,155 and $171,377, respectively.
The Fund may purchase securities from or sell securities to other portfolios managed by the Subadvisor. These interportfolio transactions are primarily used for cash management purposes and are made
Notes to Financial Statements (continued)
pursuant to Rule 17a-7 under the 1940 Act. The Rule 17a-7 transactions during the year ended October 31, 2023, were as follows:
Sales
(000's) | Realized
Gain / (Loss)
(000's) |
| $53 | $(125) |
Note 9–Capital Share Transactions
Transactions in capital shares for the years ended October 31, 2023 and October 31, 2022, were as follows:
| Class A | Shares | Amount |
| Year ended October 31, 2023: | | |
| Shares sold | 151,460 | $ 1,033,866 |
| Shares issued to shareholders in reinvestment of distributions | 27,569 | 180,852 |
| Shares redeemed | (435,884) | (2,976,755) |
| Net increase (decrease) in shares outstanding before conversion | (256,855) | (1,762,037) |
| Shares converted into Class A (See Note 1) | 13,637 | 92,922 |
| Shares converted from Class A (See Note 1) | (1,063) | (7,142) |
| Net increase (decrease) | (244,281) | $ (1,676,257) |
| Year ended October 31, 2022: | | |
| Shares sold | 381,741 | $ 2,732,536 |
| Shares issued to shareholders in reinvestment of distributions | 45,770 | 357,008 |
| Shares redeemed | (579,197) | (3,997,262) |
| Net increase (decrease) in shares outstanding before conversion | (151,686) | (907,718) |
| Shares converted into Class A (See Note 1) | 9,711 | 68,614 |
| Net increase (decrease) | (141,975) | $ (839,104) |
| |
| Investor Class | Shares | Amount |
| Year ended October 31, 2023: | | |
| Shares sold | 7,994 | $ 55,445 |
| Shares issued to shareholders in reinvestment of distributions | 3,565 | 23,315 |
| Shares redeemed | (38,082) | (262,287) |
| Net increase (decrease) in shares outstanding before conversion | (26,523) | (183,527) |
| Shares converted into Investor Class (See Note 1) | 5,089 | 34,768 |
| Shares converted from Investor Class (See Note 1) | (8,923) | (61,321) |
| Net increase (decrease) | (30,357) | $ (210,080) |
| Year ended October 31, 2022: | | |
| Shares sold | 8,861 | $ 61,330 |
| Shares issued to shareholders in reinvestment of distributions | 6,470 | 50,334 |
| Shares redeemed | (39,740) | (266,279) |
| Net increase (decrease) in shares outstanding before conversion | (24,409) | (154,615) |
| Shares converted into Investor Class (See Note 1) | 2,258 | 15,133 |
| Shares converted from Investor Class (See Note 1) | (7,927) | (56,148) |
| Net increase (decrease) | (30,078) | $ (195,630) |
| |
| Class C | Shares | Amount |
| Year ended October 31, 2023: | | |
| Shares sold | 12,510 | $ 85,290 |
| Shares issued to shareholders in reinvestment of distributions | 793 | 5,091 |
| Shares redeemed | (229,803) | (1,512,804) |
| Net increase (decrease) in shares outstanding before conversion | (216,500) | (1,422,423) |
| Shares converted from Class C (See Note 1) | (5,037) | (33,657) |
| Net increase (decrease) | (221,537) | $ (1,456,080) |
| Year ended October 31, 2022: | | |
| Shares sold | 11,524 | $ 79,421 |
| Shares issued to shareholders in reinvestment of distributions | 8,412 | 64,017 |
| Shares redeemed | (263,222) | (1,734,461) |
| Net increase (decrease) in shares outstanding before conversion | (243,286) | (1,591,023) |
| Shares converted from Class C (See Note 1) | (4,187) | (27,599) |
| Net increase (decrease) | (247,473) | $ (1,618,622) |
| |
| 32 | MainStay WMC International Research Equity Fund |
| Class I | Shares | Amount |
| Year ended October 31, 2023: | | |
| Shares sold | 522,048 | $ 3,692,667 |
| Shares issued to shareholders in reinvestment of distributions | 469,620 | 3,099,493 |
| Shares redeemed | (5,473,111) | (37,271,947) |
| Net increase (decrease) in shares outstanding before conversion | (4,481,443) | (30,479,787) |
| Shares converted from Class I (See Note 1) | (3,834) | (25,570) |
| Net increase (decrease) | (4,485,277) | $(30,505,357) |
| Year ended October 31, 2022: | | |
| Shares sold | 2,007,742 | $ 13,223,517 |
| Shares issued to shareholders in reinvestment of distributions | 693,218 | 5,434,827 |
| Shares redeemed | (3,122,136) | (22,093,407) |
| Net increase (decrease) | (421,176) | $ (3,435,063) |
Note 10–Other Matters
As of the date of this report, the Fund faces a heightened level of risk associated with current uncertainty, volatility and state of economies, financial markets, rising interest rates, and labor and health conditions around the world. Events such as war, acts of terrorism, recessions, rapid inflation, the imposition of international sanctions, earthquakes, hurricanes, epidemics and pandemics and other unforeseen natural or human disasters may have broad adverse social, political and economic effects on the global economy, which could negatively impact the value of the Fund's investments. Developments that disrupt global economies and financial markets may magnify factors that affect the Fund's performance.
Note 11–Subsequent Events
In connection with the preparation of the financial statements of the Fund as of and for the year ended October 31, 2023, events and transactions subsequent to October 31, 2023, through the date the financial statements were issued, have been evaluated by the Manager for possible adjustment and/or disclosure. No subsequent events requiring financial statement adjustment or disclosure have been identified.
Report of Independent Registered Public Accounting Firm
To the Shareholders of the Fund and Board of Trustees
MainStay Funds Trust:
Opinion on the Financial Statements
We have audited the accompanying statement of assets and liabilities of MainStay WMC International Research Equity Fund (the Fund), one of the funds constituting MainStay Funds Trust, including the portfolio of investments, as of October 31, 2023, the related statement of operations for the year then ended, the statements of changes in net assets for each of the years in the two-year period then ended, and the related notes (collectively, the financial statements) and the financial highlights for each of the years in the five-year period then ended. In our opinion, the financial statements and financial highlights present fairly, in all material respects, the financial position of the Fund as of October 31, 2023, the results of its operations for the year then ended, the changes in its net assets for each of the years in the two-year period then ended, and the financial highlights for each of the years in the five-year period then ended, in conformity with U.S. generally accepted accounting principles.
Basis for Opinion
These financial statements and financial highlights are the responsibility of the Fund's management. Our responsibility is to express an opinion on these financial statements and financial highlights based on our audits. We are a public accounting firm registered with the Public Company Accounting Oversight Board (United States) (PCAOB) and are required to be independent with respect to the Fund in accordance with the U.S. federal securities laws and the applicable rules and regulations of the Securities and Exchange Commission and the PCAOB.
We conducted our audits in accordance with the standards of the PCAOB. Those standards require that we plan and perform the audit to obtain reasonable assurance about whether the financial statements and financial highlights are free of material misstatement, whether due to error or fraud. Our audits included performing procedures to assess the risks of material misstatement of the financial statements and financial highlights, whether due to error or fraud, and performing procedures that respond to those risks. Such procedures included examining, on a test basis, evidence regarding the amounts and disclosures in the financial statements and financial highlights. Such procedures also included confirmation of securities owned as of October 31, 2023, by correspondence with custodians, the transfer agent and brokers; when replies were not received from brokers, we performed other auditing procedures. Our audits also included evaluating the accounting principles used and significant estimates made by management, as well as evaluating the overall presentation of the financial statements and financial highlights. We believe that our audits provide a reasonable basis for our opinion.

We have served as the auditor of one or more New York Life Investment Management investment companies since 2003.
Philadelphia, Pennsylvania
December 22, 2023
| 34 | MainStay WMC International Research Equity Fund |
Federal Income Tax Information
(Unaudited)
The Fund is required under the Internal Revenue Code to advise shareholders in a written statement as to the federal tax status of dividends paid by the Fund during such fiscal years.
For the fiscal year ended October 31, 2023, the Fund designated approximately $3,666,377 under the Internal Revenue Code as qualified dividend income eligible for reduced tax rates.
The dividends paid by the Fund during the fiscal year ended October 31, 2023 should be multiplied by 0.48% to arrive at the amount eligible for the corporate dividend-received deduction.
In accordance with federal tax law, the Fund elected to provide each shareholder with their portion of the Fund’s foreign taxes paid and the income sourced from foreign countries. Accordingly, the Fund made the following designations regarding its fiscal year ended October 31, 2023:
• the total amount of taxes credited to foreign countries was $350,781.
• the total amount of income sourced from foreign countries was $3,289,393.
In February 2024, shareholders will receive an IRS Form 1099-DIV or substitute Form 1099, which will show the federal tax status of the distributions received by shareholders in calendar year 2023. The amounts that will be reported on such 1099-DIV or substitute Form 1099 will be the amounts you are to use on your federal income tax return and will differ from the amounts which we must report for the Fund's fiscal year ended October 31, 2023.
Proxy Voting Policies and Procedures and Proxy Voting Record
The Fund is required to file with the SEC its proxy voting record for the 12-month period ending June 30 on Form N-PX. A description of the policies and procedures that are used to vote proxies relating to portfolio securities of the Fund is available free of charge upon request by calling 800-624-6782 or visiting the SEC’s website at www.sec.gov. The most recent Form N-PX or proxy voting record is available free of charge upon request by calling 800-624-6782; visiting newyorklifeinvestments.com; or visiting the SEC’s website at www.sec.gov.
Shareholder Reports and Quarterly Portfolio Disclosure
The Fund is required to file its complete schedule of portfolio holdings with the SEC 60 days after its first and third fiscal quarter on Form N-PORT. The Fund's holdings report is available free of charge upon request by calling New York Life Investments at 800-624-6782.
Board of Trustees and Officers (Unaudited)
The Trustees and officers of the Fund are listed below. The Board oversees the MainStay Group of Funds (which consists of MainStay Funds and MainStay Funds Trust), MainStay VP Funds Trust, MainStay MacKay DefinedTerm Municipal Opportunities Fund, MainStay CBRE Global Infrastructure Megatrends Term Fund, the Manager and the Subadvisors, and elects the officers of the Funds who are responsible for the day-to-day operations of the Fund. Information pertaining to the Trustees and officers is set forth below. Each Trustee serves until his or her successor is elected and qualified or until his or her resignation, death or
removal. Under the Board’s retirement policy, unless an exception is made, a Trustee must tender his or her resignation by the end of the calendar year during which he or she reaches the age of 75. Officers are elected annually by the Board. The business address of each Trustee and officer listed below is 51 Madison Avenue, New York, New York 10010. A majority of the Trustees are not “interested persons” (as defined by the 1940 Act and rules adopted by the SEC thereunder) of the Fund (“Independent Trustees”).
| | Name and
Year of Birth | Term of Office,
Position(s) Held and
Length of Service | Principal Occupation(s)
During Past Five Years | Number of
Portfolios in
Fund Complex
Overseen by
Trustee | Other Directorships
Held by Trustee |
| | | | | | |
| | Naïm Abou-Jaoudé*
1966 | MainStay Funds: Trustee
since 2023
MainStay Funds Trust:
Trustee since 2023 | Chief Executive Officer of New York Life Investment Management LLC (since 2023). Chief Executive Officer of Candriam (an affiliate of New York Life Investment Management LLC) (2007 to 2023). | 81 | MainStay VP Funds Trust:
Trustee since 2023 (31 portfolios);
MainStay MacKay DefinedTerm Municipal Opportunities Fund: Trustee
since 2023;
MainStay CBRE Global Infrastructure Megatrends Term Fund: Trustee
since 2023; and
New York Life Investment Management International (Chair) since 2015 |
| * | This Trustee is considered to be an “interested person” of the MainStay Group of Funds, MainStay VP Funds Trust, MainStay CBRE Global Infrastructure Megatrends Term Fund and MainStay MacKay DefinedTerm Municipal Opportunities Fund, within the meaning of the 1940 Act because of his affiliation with New York Life Investment Management LLC and Candriam, as described in detail above in the column entitled “Principal Occupation(s) During Past Five Years.” |
| | |
| 36 | MainStay WMC International Research Equity Fund |
| | Name and
Year of Birth | Term of Office,
Position(s) Held and
Length of Service | Principal Occupation(s)
During Past Five Years | Number of
Portfolios in
Fund Complex
Overseen by
Trustee | Other Directorships
Held by Trustee |
| | | | | | |
| | David H. Chow
1957 | MainStay Funds: Trustee since January 2016, Advisory Board Member (June 2015 to December 2015);MainStay Funds Trust:
Trustee since January 2016, Advisory Board Member (June 2015 to December 2015) | Founder and CEO, DanCourt Management, LLC (since 1999) | 81 | MainStay VP Funds Trust: Trustee since January 2016, Advisory Board Member (June 2015 to December 2015) (31 portfolios);
MainStay MacKay DefinedTerm Municipal Opportunities Fund: Trustee since January 2016, Advisory Board Member (June 2015 to December 2015);
MainStay CBRE Global Infrastructure Megatrends Term Fund: Trustee since 2021;
VanEck Vectors Group of Exchange-Traded Funds: Trustee since 2006 and Independent Chairman of the Board of Trustees from 2008 to 2022 (57 portfolios); and
Berea College of Kentucky: Trustee since 2009, Chair of the Investment Committee since 2018 |
| | Karen Hammond
1956 | MainStay Funds: Trustee since December 2021, Advisory Board Member (June 2021 to December 2021);MainStay Funds Trust:
Trustee since December 2021, Advisory Board Member (June 2021 to December 2021)
| Retired, Managing Director, Devonshire Investors (2007 to 2013); Senior Vice President, Fidelity Management & Research Co. (2005 to 2007); Senior Vice President and Corporate Treasurer, FMR Corp. (2003 to 2005); Chief Operating Officer, Fidelity Investments Japan (2001 to 2003) | 81 | MainStay VP Funds Trust: Trustee since December 2021, Advisory Board Member (June 2021 to December 2021) (31 portfolios);
MainStay MacKay DefinedTerm Municipal Opportunities Fund: Trustee since December 2021, Advisory Board Member (June 2021 to December 2021);
MainStay CBRE Global Infrastructure Megatrends Term Fund: Trustee since December 2021, Advisory Board Member (June 2021 to December 2021);
Two Harbors Investment Corp.: Director since 2018;
Rhode Island State Investment Commission: Member since 2017; and
Blue Cross Blue Shield of Rhode Island: Director since 2019 |
| | Susan B. Kerley
1951 | MainStay Funds: Chair since January 2017 and Trustee since 2007;MainStay Funds Trust:
Chair since January 2017 and Trustee since 1990*** | President, Strategic Management Advisors LLC (since 1990) | 81 | MainStay VP Funds Trust: Chair since January 2017 and Trustee since 2007 (31 portfolios)**;
MainStay MacKay DefinedTerm Municipal Opportunities Fund: Chair since January 2017 and Trustee since 2011;
MainStay CBRE Global Infrastructure Megatrends Term Fund: Trustee since June 2021; and
Legg Mason Partners Funds: Trustee since 1991 (45 portfolios) |
Board of Trustees and Officers (Unaudited) (continued)
| | Name and
Year of Birth | Term of Office,
Position(s) Held and
Length of Service | Principal Occupation(s)
During Past Five Years | Number of
Portfolios in
Fund Complex
Overseen by
Trustee | Other Directorships
Held by Trustee |
| | | | | | |
| | Alan R. Latshaw
1951 | MainStay Funds: Trusteesince 2006;MainStay Funds Trust:
Trustee since 2007*** | Retired; Partner, Ernst & Young LLP (2002 to 2003); Partner, Arthur Andersen LLP (1989 to 2002); Consultant to the MainStay Funds Audit and Compliance Committee (2004 to 2006) | 81 | MainStay VP Funds Trust: Trustee since 2007 (31 portfolios)**;
MainStay MacKay DefinedTerm Municipal Opportunities Fund: Trustee since 2011; and
MainStay CBRE Global Infrastructure Megatrends Term Fund: Trustee since June 2021 |
| | Jacques P. Perold
1958 | MainStay Funds: Trustee since January 2016, Advisory Board Member (June 2015to December 2015);MainStay Funds Trust:
Trustee since January 2016, Advisory Board Member (June 2015 to December 2015) | Founder and Chief Executive Officer, CapShift Advisors LLC (since 2018); President, Fidelity Management & Research Company (2009 to 2014); President and Chief Investment Officer, Geode Capital Management, LLC (2001 to 2009) | 81 | MainStay VP Funds Trust: Trustee since January 2016, Advisory Board Member (June 2015 to December 2015) (31 portfolios);
MainStay MacKay DefinedTerm Municipal Opportunities Fund: Trustee since January 2016, Advisory Board Member (June 2015 to December 2015);
MainStay CBRE Global Infrastructure Megatrends Term Fund: Trustee since June 2021;
Allstate Corporation: Director since 2015; and
MSCI Inc.: Director since 2017 |
| | Richard S. Trutanic
1952 | MainStay Funds: Trustee since 1994;MainStay Funds Trust:
Trustee since 2007*** | Chairman and Chief Executive Officer, Somerset & Company (financial advisory firm) (since 2004); Managing Director, The Carlyle Group (private investment firm) (2002 to 2004); Senior Managing Director, Partner and Board Member, Groupe Arnault S.A. (private investment firm) (1999 to 2002) | 81 | MainStay VP Funds Trust: Trustee since 2007 (31 portfolios)**;
MainStay MacKay DefinedTerm Municipal Opportunities Fund: Trustee since 2011; and
MainStay CBRE Global Infrastructure Megatrends Term Fund: Trustee since June 2021 |
| ** | Includes prior service as a Director of MainStay VP Series Fund, Inc., the predecessor to MainStay VP Funds Trust. |
| *** | Includes prior service as a Director/Trustee of certain predecessor entities to MainStay Funds Trust. |
| 38 | MainStay WMC International Research Equity Fund |
| | Name and
Year of Birth | Position(s) Held and
Length of Service | Principal Occupation(s)
During Past Five Years | |
| | | | | |
| | Kirk C. Lehneis
1974 | President, MainStay Funds, MainStay Funds Trust (since 2017) | Chief Operating Officer and Senior Managing Director (since 2016), New York Life Investment Management LLC and New York Life Investment Management Holdings LLC; Member of the Board of Managers (since 2017) and Senior Managing Director (since 2018), NYLIFE Distributors LLC; Chairman of the Board and Senior Managing Director, NYLIM Service Company LLC (since 2017); Trustee, President and Principal Executive Officer of IndexIQ Trust, IndexIQ ETF Trust and IndexIQ Active ETF Trust (since 2018); President, MainStay CBRE Global Infrastructure Megatrends Term Fund (since 2021), MainStay MacKay DefinedTerm Municipal Opportunities Fund and MainStay VP Funds Trust (since 2017)**; Senior Managing Director, Global Product Development (2015 to 2016); Managing Director, Product Development (2010 to 2015), New York Life Investment Management LLC | |
| | Jack R. Benintende
1964 | Treasurer and Principal Financial and Accounting Officer, MainStay Funds (since 2007), MainStay Funds Trust (since 2009) | Managing Director, New York Life Investment Management LLC (since 2007); Treasurer and Principal Financial and Accounting Officer, MainStay CBRE Global Infrastructure Megatrends Term Fund (since 2021), MainStay MacKay DefinedTerm Municipal Opportunities Fund (since 2011) and MainStay VP Funds Trust (since 2007)**; and Assistant Treasurer, New York Life Investment Management Holdings LLC (2008 to 2012) | |
| | J. Kevin Gao
1967 | Secretary and Chief Legal Officer, MainStay Funds and MainStay Funds Trust (since 2010) | Managing Director and Associate General Counsel, New York Life Investment Management LLC (since 2010); Secretary and Chief Legal Officer, MainStay CBRE Global Infrastructure Megatrends Term Fund (since 2021), MainStay MacKay DefinedTerm Municipal Opportunities Fund (since 2011) and MainStay VP Funds Trust (since 2010)** | |
| | Kevin M. Gleason
1967 | Vice President and Chief Compliance Officer, MainStay Funds and MainStay Funds Trust (since June 2022) | Vice President and Chief Compliance Officer, IndexIQ Trust, IndexIQ ETF Trust and Index IQ Active ETF Trust (since June 2022); Vice President and Chief Compliance Officer, MainStay CBRE Global Infrastructure Megatrends Term Fund, MainStay VP Funds Trust and MainStay MacKay DefinedTerm Municipal Opportunities Fund (since June 2022); Senior Vice President, Voya Investment Management and Chief Compliance Officer, Voya Family of Funds (2012 to 2022) | |
| | Scott T. Harrington
1959 | Vice President— Administration, MainStay Funds (since 2005), MainStay Funds Trust (since 2009) | Managing Director, New York Life Investment Management LLC (including predecessor advisory organizations) (since 2000); Member of the Board of Directors, New York Life Trust Company (since 2009); Vice President—Administration, MainStay CBRE Global Infrastructure Megatrends Term Fund (since 2021), MainStay MacKay DefinedTerm Municipal Opportunities Fund (since 2011) and MainStay VP Funds Trust (since 2005)** | |
| * | The officers listed above are considered to be “interested persons” of the MainStay Group of Funds, MainStay VP Funds Trust, MainStay CBRE Global Infrastructure Megatrends Term Fund and MainStay MacKay DefinedTerm Municipal Opportunities Fund within the meaning of the 1940 Act because of their affiliation with the MainStay Group of Funds, New York Life Insurance Company and/or its affiliates, including New York Life Investment Management LLC, New York Life Insurance Company, NYLIM Service Company LLC, NYLIFE Securities LLC and/or NYLIFE Distributors LLC, as described in detail in the column captioned “Principal Occupation(s) During Past Five Years.” Officers are elected annually by the Board. |
| ** | Includes prior service as an Officer of MainStay VP Series Fund, Inc., the predecessor to MainStay VP Funds Trust. |
Officers of the Trust (Who are not Trustees)*
This page intentionally left blank.
This page intentionally left blank.
This page intentionally left blank.
Equity
U.S. Equity
MainStay Epoch U.S. Equity Yield Fund
MainStay Fiera SMID Growth Fund
MainStay PineStone U.S. Equity Fund
MainStay S&P 500 Index Fund
MainStay Winslow Large Cap Growth Fund
MainStay WMC Enduring Capital Fund
MainStay WMC Growth Fund
MainStay WMC Small Companies Fund
MainStay WMC Value Fund
International Equity
MainStay Epoch International Choice Fund
MainStay PineStone International Equity Fund
MainStay WMC International Research Equity Fund
Emerging Markets Equity
MainStay Candriam Emerging Markets Equity Fund
Global Equity
MainStay Epoch Capital Growth Fund
MainStay Epoch Global Equity Yield Fund
MainStay PineStone Global Equity Fund
Fixed Income
Taxable Income
MainStay Candriam Emerging Markets Debt Fund
MainStay Floating Rate Fund
MainStay MacKay High Yield Corporate Bond Fund
MainStay MacKay Short Duration High Yield Fund
MainStay MacKay Strategic Bond Fund
MainStay MacKay Total Return Bond Fund
MainStay MacKay U.S. Infrastructure Bond Fund
MainStay Short Term Bond Fund
Tax-Exempt Income
MainStay MacKay California Tax Free Opportunities Fund1
MainStay MacKay High Yield Municipal Bond Fund
MainStay MacKay New York Tax Free Opportunities Fund2
MainStay MacKay Short Term Municipal Fund
MainStay MacKay Strategic Municipal Allocation Fund
MainStay MacKay Tax Free Bond Fund
Money Market
MainStay Money Market Fund
Mixed Asset
MainStay Balanced Fund
MainStay Income Builder Fund
MainStay MacKay Convertible Fund
Speciality
MainStay CBRE Global Infrastructure Fund
MainStay CBRE Real Estate Fund
MainStay Cushing MLP Premier Fund
Asset Allocation
MainStay Conservative Allocation Fund
MainStay Conservative ETF Allocation Fund
MainStay Defensive ETF Allocation Fund
MainStay Equity Allocation Fund
MainStay Equity ETF Allocation Fund
MainStay ESG Multi-Asset Allocation Fund
MainStay Growth Allocation Fund
MainStay Growth ETF Allocation Fund
MainStay Moderate Allocation Fund
MainStay Moderate ETF Allocation Fund
Manager
New York Life Investment Management LLC
New York, New York
Subadvisors
Candriam3
Strassen, Luxembourg
CBRE Investment Management Listed Real Assets LLC
Radnor, Pennsylvania
Cushing Asset Management, LP
Dallas, Texas
Epoch Investment Partners, Inc.
New York, New York
Fiera Capital Inc.
New York, New York
IndexIQ Advisors LLC3
New York, New York
MacKay Shields LLC3
New York, New York
NYL Investors LLC3
New York, New York
PineStone Asset Management Inc.
Montreal, Québec
Wellington Management Company LLP
Boston, Massachusetts
Winslow Capital Management, LLC
Minneapolis, Minnesota
Legal Counsel
Dechert LLP
Washington, District of Columbia
Independent Registered Public Accounting Firm
KPMG LLP
Philadelphia, Pennsylvania
Distributor
NYLIFE Distributors LLC3
Jersey City, New Jersey
Custodian
JPMorgan Chase Bank, N.A.
New York, New York
1.
This Fund is registered for sale in AZ, CA, NV, OR, TX, UT, WA and MI (Class A and Class I shares only), and CO, FL, GA, HI, ID, MA, MD, NH, NJ and NY (Class I shares only).
| 2. | This Fund is registered for sale in CA, CT, DE, FL, MA, NJ, NY and VT. |
| 3. | An affiliate of New York Life Investment Management LLC. |
Not part of the Annual Report
For more information
800-624-6782
newyorklifeinvestments.com
“New York Life Investments” is both a service mark, and the common trade name, of certain investment advisors affiliated with New York Life Insurance Company. The MainStay Funds® are managed by New York Life Investment Management LLC and distributed by NYLIFE Distributors LLC, 30 Hudson Street, Jersey City, NJ 07302, a wholly owned subsidiary of New York Life Insurance Company. NYLIFE Distributors LLC is a Member FINRA/SIPC.
©2023 NYLIFE Distributors LLC. All rights reserved.
| 5013744MS139-23 | MSWIRE11-12/23 |
(NYLIM) NL530
MainStay WMC Small Companies Fund
Message from the President and Annual Report
October 31, 2023
Special Notice:
Beginning in July 2024, new regulations issued by the Securities and Exchange Commission (SEC) will take effect requiring open-end mutual fund companies and ETFs to (1) overhaul the content of their shareholder reports and (2) mail paper copies of the new tailored shareholder reports to shareholders who have not opted to receive these documents electronically.
If you have not yet elected to receive your shareholder reports electronically, please contact your financial intermediary or visit newyorklifeinvestments.com/accounts.
| Not FDIC/NCUA Insured | Not a Deposit | May Lose Value | No Bank Guarantee | Not Insured by Any Government Agency |
This page intentionally left blank
Message from the President
Volatile economic and geopolitical forces drove market behavior during the 12-month reporting period ended October 31, 2023. While equity markets generally gained ground, bond prices trended broadly lower.
Although the war in Ukraine, the outbreak of hostilities in the Middle East and several other notable events affected financial assets, inflation and interest rate trends stood at the forefront of market developments during most of the period. As the reporting period began, high levels of inflation already showed signs of easing in the face of aggressive rate hikes by the U.S. Federal Reserve (the “Fed”). From a peak of 9.1% in June 2022, the annualized U.S. inflation rate dropped to 7.1% in November 2022, and to 3.2% in October 2023. At the same time, the Fed increased the benchmark federal funds rate from 3.75%–4.00% at the beginning of the reporting period to 5.25%–5.50% as of October 31, 2023. As the pace of rate increases slowed during the period, investors hoped for an early shift to a looser monetary policy. However, comments from Fed members late in the period reinforced the central bank’s hawkish stance in response to surprisingly robust U.S. economic growth and rising wage pressures, thus increasing the likelihood that interest rates would stay higher for longer. International developed markets exhibited similar dynamics of elevated inflation and rising interest rates.
Despite the backdrop of high interest rates—along with political dysfunction in Washington D.C. and intensifying global geopolitical instability—equity markets managed to advance, supported by healthy consumer spending trends and persistent domestic economic growth. The S&P 500® Index, a widely regarded benchmark of large-cap U.S. market performance, gained ground, bolstered by the strong performance of energy stocks amid surging petroleum prices and mega-cap, growth-oriented, technology-related shares, which rose as investors flocked to companies creating the infrastructure for developments in artificial intelligence. Smaller-cap stocks and value-oriented shares produced milder returns. Among industry sectors, energy and
information technology posted the strongest gains. Real estate declined most sharply under pressure from rising mortgage rates and weak levels of office occupancy. Developed international markets outperformed U.S. markets, with Europe benefiting during the first half of the period from unexpected economic resilience in the face of rising energy prices and the ongoing war in Ukraine. Emerging markets posted positive results but lagged developed markets, largely due to slow economic growth in China despite the relaxation of pandemic-era lockdowns.
Bond prices were driven lower by rising yields and increasing expectations of high interest rates for an extended period of time. The U.S. yield curve steepened, with the 30-year Treasury yield exceeding 5% for the first time in more than a decade. The yield curve remained inverted, with the 10-year Treasury yield ending the period at 4.88%, compared with 5.07% for the 2-year Treasury yield. Corporate bonds outperformed long-term Treasury bonds, but still trended lower under pressure from rising yields and an uptick in default rates. Among corporates, lower-credit-quality instruments performed slightly better than their higher-credit-quality counterparts, while floating rate securities performed better still.
In the face of today’s uncertain market environment, New York Life Investments remains dedicated to providing the guidance, resources and investment solutions you need to pursue your financial goals.
Thank you for trusting us to help meet your investment needs.
Sincerely,
Kirk C. Lehneis
President
The opinions expressed are as of the date of this report and are subject to change. There is no guarantee that any forecast made will come to pass. This material does not constitute investment advice and is not intended as an endorsement of any specific investment. Past performance is no guarantee of future results.
Not part of the Annual Report
Investors should refer to the Fund’s Summary Prospectus and/or Prospectus and consider the Fund’s investment objectives, strategies, risks, charges and expenses carefully before investing. The Summary Prospectus and/or Prospectus contain this and other information about the Fund. You may obtain copies of the Fund’s Summary Prospectus, Prospectus and Statement of Additional Information, which includes information about the MainStay Funds Trust's Trustees, free of charge, upon request, by calling toll-free 800-624-6782, by writing to NYLIFE Distributors LLC, Attn: MainStay Marketing Department, 30 Hudson Street, Jersey City, NJ 07302 or by sending an e-mail to MainStayShareholderServices@nylim.com. These documents are also available via the MainStay Funds’ website at newyorklifeinvestments.com. Please read the Fund’s Summary Prospectus and/or Prospectus carefully before investing.
Investment and Performance Comparison (Unaudited)
Performance data quoted represents past performance. Past performance is no guarantee of future results. Because of market volatility and other factors, current performance may be lower or higher than the figures shown. Investment return and principal value will fluctuate, and as a result, when shares are redeemed, they may be worth more or less than their original cost. The graph below depicts the historical performance of Class I shares of the Fund. Performance will vary from class to class based on differences in class-specific expenses and sales charges. For performance information current to the most recent month-end, please call 800-624-6782 or visit newyorklifeinvestments.com.
The performance table and graph do not reflect the deduction of taxes that a shareholder would pay on distributions or Fund share redemptions. Total returns reflect maximum applicable sales charges as indicated in the table below, if any, changes in share price, and reinvestment of dividend and capital gain distributions. The graph assumes the initial investment amount shown below and reflects the deduction of all sales charges that would have applied for the period of investment. Performance figures may reflect certain fee waivers and/or expense limitations, without which total returns may have been lower. For more information on share classes and current fee waivers and/or expense limitations (if any), please refer to the Notes to Financial Statements.
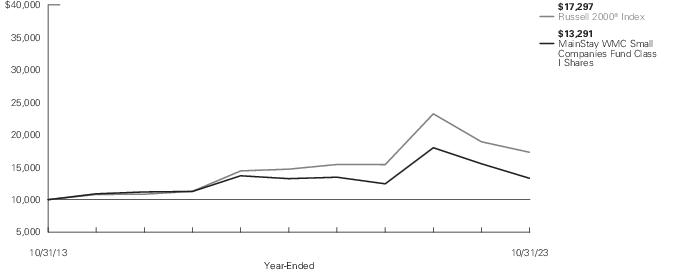
| Average Annual Total Returns for the Year-Ended October 31, 2023 |
| Class | Sales Charge | | Inception
Date1 | One
Year | Five
Years | Ten Years
or Since
Inception | Gross
Expense
Ratio2 |
| Class A Shares | Maximum 5.50% Initial Sales Charge | With sales charges | 1/2/2004 | -19.36% | -1.29% | 2.05% | 1.23% |
| | | Excluding sales charges | | -14.66 | -0.17 | 2.63 | 1.23 |
| Investor Class Shares3 | Maximum 5.00% Initial Sales Charge | With sales charges | 2/28/2008 | -19.17 | -1.57 | 1.77 | 1.58 |
| | | Excluding sales charges | | -14.92 | -0.45 | 2.35 | 1.58 |
| Class B Shares4 | Maximum 5.00% CDSC | With sales charges | 1/2/2004 | -19.65 | -1.42 | 1.59 | 2.33 |
| | if Redeemed Within the First Six Years of Purchase | Excluding sales charges | | -15.48 | -1.19 | 1.59 | 2.33 |
| Class C Shares | Maximum 1.00% CDSC | With sales charges | 12/30/2002 | -16.37 | -1.18 | 1.59 | 2.33 |
| | if Redeemed Within One Year of Purchase | Excluding sales charges | | -15.54 | -1.18 | 1.59 | 2.33 |
| Class I Shares | No Sales Charge | | 1/12/1987 | -14.42 | 0.08 | 2.89 | 0.98 |
| Class R1 Shares5 | No Sales Charge | | 7/31/2012 | -14.54 | -0.03 | 2.78 | 1.08 |
| Class R2 Shares5 | No Sales Charge | | 7/31/2012 | -14.73 | -0.27 | 2.53 | 1.33 |
| Class R3 Shares5 | No Sales Charge | | 2/29/2016 | -14.95 | -0.52 | 2.94 | 1.58 |
| 1. | Effective March 5, 2021, the Fund replaced its subadvisor and modified its principal investment strategies. The performance information in the graph and table from April 1, 2019 through March 5, 2021 reflects that of the Fund's prior subadvisor and principal investment strategies. Performance information shown in this report prior to April 1, 2019 reflects that of a different previous subadvisor to the fund, investment objective and principal investment strategies. |
| 2. | The gross expense ratios presented reflect the Fund’s “Total Annual Fund Operating Expenses” from the most recent Prospectus, as supplemented, and may differ from other expense ratios disclosed in this report. |
| 3. | Prior to June 30, 2020, the maximum initial sales charge was 5.50%, which is reflected in the applicable average annual total return figures shown. |
| 4. | Class B shares are closed to all new purchases as well as additional investments by existing Class B shareholders. |
| 5. | As of October 31, 2023, Class R1, Class R2 and Class R3 shares are closed to new investors and, upon the close of business on December 29, 2023, Class R1, Class R2 and Class R3 shares are closed to additional investments by existing shareholders. Additionally, Class R1, Class R2 and Class R3 shares will be liquidated on or about February 28, 2024 (the "Liquidation Date"). It is expected that the Fund will distribute to remaining shareholders invested in Class R1, Class R2 or Class R3 shares, on or promptly after the Liquidation Date, a liquidating distribution in cash or cash equivalents equal to the net asset value of such shares. |
The footnotes on the next page are an integral part of the table and graph and should be carefully read in conjunction with them.
| Benchmark Performance* | One
Year | Five
Years | Ten
Years |
| Russell 2000® Index1 | -8.56% | 3.31% | 5.63% |
| Morningstar Small Blend Category Average2 | -4.86 | 4.61 | 5.83 |
| * | Returns for indices reflect no deductions for fees, expenses or taxes, except for foreign withholding taxes where applicable. Results assume reinvestment of all dividends and capital gains. An investment cannot be made directly in an index. |
| 1. | The Fund has selected the Russell 2000® Index as its primary benchmark. The Russell 2000® Index measures the performance of the small-cap segment of the U.S. equity universe. It is a subset of the Russell 3000® Index and includes approximately 2,000 of the smallest securities based on a combination of their market cap and current index membership. |
| 2. | The Morningstar Small Blend Category Average is representative of funds that favor U.S. firms at the smaller end of the market-capitalization range. Some aim to own an array of value and growth stocks while others employ a discipline that leads to holdings with valuations and growth rates close to the small-cap averages. Stocks in the bottom 10% of the capitalization of the U.S. equity market are defined as small cap. The blend style is assigned to funds where neither growth nor value characteristics predominate. Results are based on average total returns of similar funds with all dividends and capital gain distributions reinvested. |
The footnotes on the preceding page are an integral part of the table and graph and should be carefully read in conjunction with them.
| 6 | MainStay WMC Small Companies Fund |
Cost in Dollars of a $1,000 Investment in MainStay WMC Small Companies Fund (Unaudited)
The example below is intended to describe the fees and expenses borne by shareholders during the six-month period from May 1, 2023 to October 31, 2023, and the impact of those costs on your investment.
Example
As a shareholder of the Fund you incur two types of costs: (1) transaction costs, including exchange fees and sales charges (loads) on purchases (as applicable), and (2) ongoing costs, including management fees, distribution and/or service (12b-1) fees and other Fund expenses (as applicable). This example is intended to help you understand your ongoing costs (in dollars) of investing in the Fund and to compare these costs with the ongoing costs of investing in other mutual funds. The example is based on an investment of $1,000 made at the beginning of the six-month period and held for the entire period from May 1, 2023 to October 31, 2023.
This example illustrates your Fund’s ongoing costs in two ways:
Actual Expenses
The second and third data columns in the table below provide information about actual account values and actual expenses. You may use the information in these columns, together with the amount you invested, to estimate the expenses that you paid during the six months ended October 31, 2023. Simply divide your account value by $1,000 (for example, an
$8,600 account value divided by $1,000 = 8.6), then multiply the result by the number under the heading entitled “Expenses Paid During Period” to estimate the expenses you paid on your account during this period.
Hypothetical Example for Comparison Purposes
The fourth and fifth data columns in the table below provide information about hypothetical account values and hypothetical expenses based on the Fund’s actual expense ratio and an assumed rate of return of 5% per year before expenses, which is not the Fund’s actual return. The hypothetical account values and expenses may not be used to estimate the actual ending account balances or expenses you paid for the six-month period shown. You may use this information to compare the ongoing costs of investing in the Fund with the ongoing costs of investing in other mutual funds. To do so, compare this 5% hypothetical example with the 5% hypothetical examples that appear in the shareholder reports of the other mutual funds.
Please note that the expenses shown in the table are meant to highlight your ongoing costs only and do not reflect any transactional costs, such as exchange fees or sales charges (loads). Therefore, the fourth and fifth data columns of the table are useful in comparing ongoing costs only and will not help you determine the relative total costs of owning different funds. In addition, if these transactional costs were included, your costs would have been higher.
| Share Class | Beginning
Account
Value
5/1/23 | Ending Account
Value (Based
on Actual
Returns and
Expenses)
10/31/23 | Expenses
Paid
During
Period1 | Ending Account
Value (Based
on Hypothetical
5% Annualized
Return and
Actual Expenses)
10/31/23 | Expenses
Paid
During
Period1 | Net Expense
Ratio
During
Period2 |
| Class A Shares | $1,000.00 | $914.30 | $ 5.93 | $1,019.00 | $ 6.26 | 1.23% |
| Investor Class Shares | $1,000.00 | $913.00 | $ 7.14 | $1,017.74 | $ 7.53 | 1.48% |
| Class B Shares | $1,000.00 | $909.80 | $10.73 | $1,013.96 | $11.32 | 2.23% |
| Class C Shares | $1,000.00 | $909.80 | $10.73 | $1,013.96 | $11.32 | 2.23% |
| Class I Shares | $1,000.00 | $915.60 | $ 4.73 | $1,020.26 | $ 4.99 | 0.98% |
| Class R1 Shares | $1,000.00 | $914.50 | $ 5.21 | $1,019.76 | $ 5.50 | 1.08% |
| Class R2 Shares | $1,000.00 | $913.60 | $ 6.42 | $1,018.50 | $ 6.77 | 1.33% |
| Class R3 Shares | $1,000.00 | $912.40 | $ 7.62 | $1,017.24 | $ 8.03 | 1.58% |
| 1. | Expenses are equal to the Fund’s annualized expense ratio of each class multiplied by the average account value over the period, divided by 365 and multiplied by 184 (to reflect the six-month period). The table above represents the actual expenses incurred during the six-month period. In addition to the fees and expenses which the Fund bears directly, it also indirectly bears a pro rata share of the fees and expenses of the underlying funds in which it invests. Such indirect expenses are not included in the above-reported expense figures. |
| 2. | Expenses are equal to the Fund's annualized expense ratio to reflect the six-month period. |
Industry Composition as of October 31, 2023 (Unaudited)
| Banks | 7.7% |
| Biotechnology | 6.8 |
| Financial Services | 6.5 |
| Software | 5.4 |
| Health Care Equipment & Supplies | 4.6 |
| Energy Equipment & Services | 4.4 |
| Exchange–Traded Fund | 4.0 |
| Machinery | 3.6 |
| Commercial Services & Supplies | 3.4 |
| Chemicals | 3.2 |
| Ground Transportation | 3.1 |
| Metals & Mining | 2.9 |
| Real Estate Management & Development | 2.7 |
| Electronic Equipment, Instruments & Components | 2.6 |
| Trading Companies & Distributors | 2.5 |
| Semiconductors & Semiconductor Equipment | 2.4 |
| Automobile Components | 2.4 |
| Interactive Media & Services | 2.2 |
| Household Durables | 2.2 |
| Diversified Consumer Services | 2.1 |
| Aerospace & Defense | 2.0% |
| Oil, Gas & Consumable Fuels | 2.0 |
| Health Care REITs | 1.9 |
| Food Products | 1.9 |
| Hotels, Restaurants & Leisure | 1.9 |
| Gas Utilities | 1.8 |
| Capital Markets | 1.8 |
| Mortgage Real Estate Investment Trusts | 1.6 |
| Consumer Finance | 1.6 |
| Specialized REITs | 1.5 |
| Health Care Providers & Services | 1.4 |
| Media | 1.4 |
| Building Products | 1.4 |
| Electric Utilities | 1.3 |
| Pharmaceuticals | 0.8 |
| Insurance | 0.0‡ |
| Short–Term Investment | 5.6 |
| Other Assets, Less Liabilities | –4.6 |
| | 100.0% |
| ‡ | Less than one–tenth of a percent. |
See Portfolio of Investments beginning on page 10 for specific holdings within these categories. The Fund's holdings are subject to change.
Top Ten Holdings and/or Issuers Held as of October 31, 2023 (excluding short-term investments) (Unaudited)
| 1. | iShares Russell 2000 ETF |
| 2. | MRC Global, Inc. |
| 3. | Taboola.com Ltd. |
| 4. | Skyline Champion Corp. |
| 5. | Carpenter Technology Corp. |
| 6. | Laureate Education, Inc. |
| 7. | BWX Technologies, Inc. |
| 8. | PBF Energy, Inc., Class A |
| 9. | CareTrust REIT, Inc. |
| 10. | Agilysys, Inc. |
| 8 | MainStay WMC Small Companies Fund |
Portfolio Management Discussion and Analysis (Unaudited)
Questions answered by portfolio managers Peter W. Carpi, CFA, and David B. Dubard, CFA, of Wellington Management Company LLP, the Fund’s Subadvisor.
How did MainStay WMC Small Companies Fund perform relative to its benchmark and peer group during the 12 months ended October 31, 2023?
For the 12 months ended October 31, 2023, Class I shares of MainStay WMC Small Companies Fund returned −14.42%, underperforming the −8.56% return of the Fund’s benchmark, the Russell 2000® Index (the “Index”). Over the same period, Class I shares also underperformed the −4.86% return of the Morningstar Small Blend Category Average.1
Were there any changes to the Fund during the reporting period?
Effective February 28, 2023, David B. Dubard, CFA, was added as a portfolio manager of the Fund.
What factors affected the Fund’s relative performance during the reporting period?
The Fund underperformed the Index primarily due to security selection. Relatively weak selection in consumer discretionary, health care and energy more than offset relatively strong selection in the financials and communication services sectors. Sector allocation, a result of our bottom-up stock selection process, also detracted from relative results. Overweight exposure to financials and underweight exposure to energy drove the negative allocation effect.
During the reporting period, which sectors were the strongest positive contributors to the Fund’s relative performance and which sectors were particularly weak?
During the reporting period, the strongest contributions to the Fund’s performance relative to the Index came from the financials, communication services and utilities sectors. (Contributions take weightings and total returns into account.) Conversely, consumer discretionary, health care and energy detracted most significantly from relative returns.
During the reporting period, which individual stocks made the strongest positive contributions to the Fund’s absolute performance and which stocks detracted the most?
The stocks making the strongest contributions to the Fund’s absolute performance included wood products and building materials manufacturer Boise Cascade, and specialty metals producer for the aerospace and defense industries Carpenter Technology. Boise Cascade shares rose after the company reported first-quarter 2023 sales that matched estimates, despite a weaker operating environment due to lower new single-family housing starts. We exited the Fund’s position in Boise Cascade during the reporting period. Carpenter Technology shares were driven higher by the company’s strong results in the second quarter of fiscal year 2023. Management reported that the business made strides toward returning to pre-pandemic business levels and reestablishing long-term growth trends. Management also announced that they were seeing strong demand, and
expected accelerating sales and improving margins. We maintained the Fund’s position in Carpenter Technology as of the end of the reporting period.
The most significant detractors from absolute performance included global oil and gas drilling contractor Nabors Industries, and direct-to-student online learning company Chegg. Nabors’ shares declined in response to lower oil prices early in the reporting period, despite the company’s solid financial results. Chegg shares lost ground after the company announced lower-than-expected revenue guidance, citing emerging large language models that were expected to undermine new customer growth rates. Despite the anticipated headwinds, management reported earnings above expectations for both revenue and earnings per share for the first quarter of 2023. As of the end of the reporting period, we maintained the Fund’s position in Nabors industries, while eliminating the position in Chegg in favor of other investment opportunities.
What were some of the Fund’s largest purchases and sales during the reporting period?
During the reporting period, the Fund initiated positions in advertising services company Taboola.com and real estate investment trust Redwood Trust. Taboola operates an AI-based platform that recommends web-based editorial content and advertisements. Redwood Trust provides specialty finance services to the mortgage and loan industry. During the same period, the Fund eliminated its positions in Boise Cascade, described above, and in Kirby, the largest tank barge operator in the United States.
How did the Fund’s sector and/or country weightings change during the reporting period?
The Fund seeks to keep sector and industry exposures close to those of the Index so that stock selection remains the primary driver of returns. Changes in sector and industry exposures tend to be modest. The largest increases in active weight during the reporting period occurred in the communication services and consumer discretionary sectors, while the most significant decreases were in the materials and health care sectors.
How was the Fund positioned at the end of the reporting period?
As of October 31, 2023, the Fund held its largest overweight exposures relative to the Index in the financials and materials sectors. As of the same date, the Fund held its most significantly underweight exposures to information technology and energy.
| 1. | See "Investment and Performance Comparison" for other share class returns, which may be higher or lower than Class I share returns, and for more information on benchmark and peer group returns. |
The opinions expressed are those of the portfolio managers as of the date of this report and are subject to change. There is no guarantee that any forecasts will come to pass. This material does not constitute investment advice and is not intended as an endorsement of any specific investment.
Portfolio of Investments October 31, 2023†^
| | Shares | Value |
| Common Stocks 94.9% |
| Aerospace & Defense 2.0% |
| BWX Technologies, Inc. | 62,603 | $ 4,650,151 |
| Automobile Components 2.4% |
| Dana, Inc. | 163,576 | 1,877,852 |
| Gentherm, Inc. (a) | 13,862 | 557,530 |
| XPEL, Inc. (a) | 62,623 | 2,899,445 |
| | | 5,334,827 |
| Banks 7.7% |
| Banner Corp. | 43,748 | 1,846,603 |
| OFG Bancorp | 82,545 | 2,444,983 |
| Old National Bancorp | 240,871 | 3,299,933 |
| Stellar Bancorp, Inc. | 126,362 | 2,747,110 |
| United Community Banks, Inc. | 112,357 | 2,481,966 |
| Veritex Holdings, Inc. | 137,389 | 2,365,838 |
| WSFS Financial Corp. | 62,255 | 2,203,827 |
| | | 17,390,260 |
| Biotechnology 6.8% |
| Celldex Therapeutics, Inc. (a) | 106,700 | 2,509,584 |
| Cytokinetics, Inc. (a) | 55,900 | 1,948,674 |
| Kymera Therapeutics, Inc. (a) | 74,138 | 865,190 |
| Merus NV (a) | 105,654 | 2,124,702 |
| Nuvalent, Inc., Class A (a) | 62,195 | 3,239,738 |
| REVOLUTION Medicines, Inc. (a) | 70,403 | 1,393,979 |
| Sage Therapeutics, Inc. (a) | 46,746 | 875,553 |
| Vaxcyte, Inc. (a) | 49,624 | 2,386,914 |
| | | 15,344,334 |
| Building Products 1.4% |
| Masonite International Corp. (a) | 39,415 | 3,119,303 |
| Capital Markets 1.8% |
| Hamilton Lane, Inc., Class A | 48,031 | 4,040,368 |
| Chemicals 3.2% |
| Minerals Technologies, Inc. | 69,456 | 3,754,791 |
| Quaker Chemical Corp. | 24,075 | 3,460,059 |
| | | 7,214,850 |
| Commercial Services & Supplies 3.4% |
| Brady Corp., Class A | 81,350 | 4,186,271 |
| Interface, Inc. | 389,227 | 3,460,228 |
| | | 7,646,499 |
| Consumer Finance 1.6% |
| Enova International, Inc. (a) | 92,944 | 3,706,607 |
| | Shares | Value |
| |
| Diversified Consumer Services 2.1% |
| Laureate Education, Inc. | 335,289 | $ 4,740,987 |
| Electric Utilities 1.3% |
| Portland General Electric Co. | 73,789 | 2,953,036 |
| Electronic Equipment, Instruments & Components 2.6% |
| CTS Corp. | 68,926 | 2,578,522 |
| TTM Technologies, Inc. (a) | 280,346 | 3,221,175 |
| | | 5,799,697 |
| Energy Equipment & Services 4.3% |
| Liberty Energy, Inc. | 212,104 | 4,178,449 |
| Nabors Industries Ltd. (a) | 28,239 | 2,757,256 |
| Patterson-UTI Energy, Inc. | 223,250 | 2,835,275 |
| | | 9,770,980 |
| Financial Services 6.5% |
| Federal Agricultural Mortgage Corp., Class C | 25,938 | 3,853,349 |
| NMI Holdings, Inc., Class A (a) | 150,746 | 4,122,903 |
| Remitly Global, Inc. (a) | 147,887 | 3,982,597 |
| Shift4 Payments, Inc., Class A (a) | 65,273 | 2,905,954 |
| | | 14,864,803 |
| Food Products 1.9% |
| Freshpet, Inc. (a)(b) | 73,869 | 4,240,081 |
| Gas Utilities 1.8% |
| New Jersey Resources Corp. | 103,104 | 4,183,960 |
| Ground Transportation 3.1% |
| Marten Transport Ltd. | 181,146 | 3,184,547 |
| Ryder System, Inc. | 38,608 | 3,765,824 |
| | | 6,950,371 |
| Health Care Equipment & Supplies 4.6% |
| Artivion, Inc. (a) | 258,412 | 3,292,169 |
| Lantheus Holdings, Inc. (a) | 37,941 | 2,450,988 |
| Omnicell, Inc. (a) | 51,407 | 1,827,005 |
| SI-BONE, Inc. (a) | 167,590 | 2,850,706 |
| | | 10,420,868 |
| Health Care Providers & Services 1.4% |
| AMN Healthcare Services, Inc. (a) | 43,001 | 3,262,056 |
| Health Care REITs 1.9% |
| CareTrust REIT, Inc. | 204,544 | 4,401,787 |
The notes to the financial statements are an integral part of, and should be read in conjunction with, the financial statements.
| 10 | MainStay WMC Small Companies Fund |
| | Shares | Value |
| Common Stocks (continued) |
| Hotels, Restaurants & Leisure 1.9% |
| Hilton Grand Vacations, Inc. (a) | 116,880 | $ 4,201,836 |
| Household Durables 2.2% |
| Skyline Champion Corp. (a) | 83,411 | 4,890,387 |
| Insurance 0.0% ‡ |
| SiriusPoint Ltd. (a) | 8,379 | 82,533 |
| Interactive Media & Services 2.2% |
| Taboola.com Ltd. (a) | 1,340,877 | 4,921,019 |
| Machinery 3.6% |
| Astec Industries, Inc. | 76,618 | 3,067,785 |
| Blue Bird Corp. (a) | 178,327 | 3,247,335 |
| Greenbrier Cos., Inc. (The) | 56,653 | 1,959,627 |
| | | 8,274,747 |
| Media 1.4% |
| Magnite, Inc. (a) | 481,324 | 3,195,991 |
| Metals & Mining 2.9% |
| Carpenter Technology Corp. | 77,684 | 4,872,340 |
| MP Materials Corp. (a)(b) | 111,132 | 1,822,565 |
| | | 6,694,905 |
| Mortgage Real Estate Investment Trusts 1.6% |
| Redwood Trust, Inc. (b) | 595,574 | 3,740,205 |
| Oil, Gas & Consumable Fuels 2.0% |
| PBF Energy, Inc., Class A | 94,637 | 4,498,097 |
| Pharmaceuticals 0.8% |
| Aclaris Therapeutics, Inc. (a) | 354,244 | 1,764,135 |
| Real Estate Management & Development 2.7% |
| Marcus & Millichap, Inc. | 110,744 | 3,178,353 |
| Tricon Residential, Inc. | 460,147 | 3,050,774 |
| | | 6,229,127 |
| Semiconductors & Semiconductor Equipment 2.4% |
| Semtech Corp. (a) | 164,621 | 2,298,109 |
| Tower Semiconductor Ltd. (a) | 138,206 | 3,181,502 |
| | | 5,479,611 |
| | Shares | | Value |
| |
| Software 5.4% |
| Agilysys, Inc. (a) | 50,581 | | $ 4,339,344 |
| Altair Engineering, Inc., Class A (a) | 60,382 | | 3,750,930 |
| SolarWinds Corp. (a) | 447,806 | | 4,124,293 |
| | | | 12,214,567 |
| Specialized REITs 1.5% |
| Uniti Group, Inc. (b) | 751,579 | | 3,457,263 |
| Trading Companies & Distributors 2.5% |
| MRC Global, Inc. (a) | 534,803 | | 5,620,780 |
Total Common Stocks
(Cost $243,107,798) | | | 215,301,028 |
| Exchange-Traded Fund 4.0% |
| iShares Russell 2000 ETF (b) | 55,164 | | 9,075,581 |
Total Exchange-Traded Fund
(Cost $9,794,496) | | | 9,075,581 |
| |
| | Number of
Warrants | | |
| |
| Warrants 0.1% |
| Energy Equipment & Services 0.1% |
| Nabors Industries Ltd. | | | |
| Expires 6/11/26 (a) | 17,484 | | 260,949 |
Total Warrants
(Cost $5,002) | | | 260,949 |
| |
| | Shares | | |
| |
| Short-Term Investment 5.6% |
| Unaffiliated Investment Company 5.6% |
| Invesco Government & Agency Portfolio, 5.357% (c)(d) | 12,759,487 | | 12,759,487 |
Total Short-Term Investment
(Cost $12,759,487) | | | 12,759,487 |
Total Investments
(Cost $265,666,783) | 104.6% | | 237,397,045 |
| Other Assets, Less Liabilities | (4.6) | | (10,455,615) |
| Net Assets | 100.0% | | $ 226,941,430 |
| † | Percentages indicated are based on Fund net assets. |
| ^ | Industry classifications may be different than those used for compliance monitoring purposes. |
| ‡ | Less than one-tenth of a percent. |
The notes to the financial statements are an integral part of, and should be read in conjunction with, the financial statements.
11
Portfolio of Investments October 31, 2023†^ (continued)
| (a) | Non-income producing security. |
| (b) | All or a portion of this security was held on loan. As of October 31, 2023, the aggregate market value of securities on loan was $12,543,200. The Fund received cash collateral with a value of $12,759,487. (See Note 2(G)) |
| (c) | Current yield as of October 31, 2023. |
| (d) | Represents a security purchased with cash collateral received for securities on loan. |
Investments in Affiliates (in 000's)
Investments in issuers considered to be affiliate(s) of the Fund during the year ended October 31, 2023 for purposes of Section 2(a)(3) of the Investment Company Act of 1940, as amended, were as follows:
| Affiliated Investment Companies | Value,
Beginning
of Year | Purchases
at Cost | Proceeds
from
Sales | Net
Realized
Gain/(Loss)
on Sales | Change in
Unrealized
Appreciation/
(Depreciation) | Value,
End of
Year | Dividend
Income | Other
Distributions | Shares
End of
Year |
| MainStay U.S. Government Liquidity Fund | $ 4,059 | $ 89,557 | $ (93,616) | $ — | $ — | $ — | $ 107 | $ — | — |
| Abbreviation(s): |
| ETF—Exchange-Traded Fund |
| REIT—Real Estate Investment Trust |
The following is a summary of the fair valuations according to the inputs used as of October 31, 2023, for valuing the Fund’s assets:
| Description | Quoted
Prices in
Active
Markets for
Identical
Assets
(Level 1) | | Significant
Other
Observable
Inputs
(Level 2) | | Significant
Unobservable
Inputs
(Level 3) | | Total |
| Asset Valuation Inputs | | | | | | | |
| Investments in Securities (a) | | | | | | | |
| Common Stocks | $ 215,301,028 | | $ — | | $ — | | $ 215,301,028 |
| Exchange-Traded Fund | 9,075,581 | | — | | — | | 9,075,581 |
| Warrants | 260,949 | | — | | — | | 260,949 |
| Short-Term Investment | | | | | | | |
| Unaffiliated Investment Company | 12,759,487 | | — | | — | | 12,759,487 |
| Total Investments in Securities | $ 237,397,045 | | $ — | | $ — | | $ 237,397,045 |
| (a) | For a complete listing of investments and their industries, see the Portfolio of Investments. |
The notes to the financial statements are an integral part of, and should be read in conjunction with, the financial statements.
| 12 | MainStay WMC Small Companies Fund |
Statement of Assets and Liabilities as of October 31, 2023
| Assets |
Investment in securities, at value
(identified cost $265,666,783) including securities on loan of $12,543,200 | $237,397,045 |
| Receivables: | |
| Investment securities sold | 4,701,409 |
| Fund shares sold | 78,079 |
| Dividends and interest | 27,992 |
| Securities lending | 1,710 |
| Other assets | 184,090 |
| Total assets | 242,390,325 |
| Liabilities |
| Cash collateral received for securities on loan | 12,759,487 |
| Due to custodian | 131,847 |
| Payables: | |
| Investment securities purchased | 2,135,860 |
| Manager (See Note 3) | 163,759 |
| Fund shares redeemed | 81,607 |
| Transfer agent (See Note 3) | 74,687 |
| NYLIFE Distributors (See Note 3) | 31,603 |
| Shareholder communication | 25,279 |
| Professional fees | 15,667 |
| Custodian | 8,551 |
| Trustees | 138 |
| Accrued expenses | 20,410 |
| Total liabilities | 15,448,895 |
| Net assets | $226,941,430 |
| Composition of Net Assets |
| Shares of beneficial interest outstanding (par value of $.001 per share) unlimited number of shares authorized | $ 12,568 |
| Additional paid-in-capital | 315,510,555 |
| | 315,523,123 |
| Total distributable earnings (loss) | (88,581,693) |
| Net assets | $226,941,430 |
| Class A | |
| Net assets applicable to outstanding shares | $103,460,199 |
| Shares of beneficial interest outstanding | 5,805,393 |
| Net asset value per share outstanding | $ 17.82 |
| Maximum sales charge (5.50% of offering price) | 1.04 |
| Maximum offering price per share outstanding | $ 18.86 |
| Investor Class | |
| Net assets applicable to outstanding shares | $ 28,292,370 |
| Shares of beneficial interest outstanding | 1,644,643 |
| Net asset value per share outstanding | $ 17.20 |
| Maximum sales charge (5.00% of offering price) | 0.91 |
| Maximum offering price per share outstanding | $ 18.11 |
| Class B | |
| Net assets applicable to outstanding shares | $ 828,325 |
| Shares of beneficial interest outstanding | 60,387 |
| Net asset value and offering price per share outstanding | $ 13.72 |
| Class C | |
| Net assets applicable to outstanding shares | $ 1,279,785 |
| Shares of beneficial interest outstanding | 93,336 |
| Net asset value and offering price per share outstanding | $ 13.71 |
| Class I | |
| Net assets applicable to outstanding shares | $ 92,498,289 |
| Shares of beneficial interest outstanding | 4,931,387 |
| Net asset value and offering price per share outstanding | $ 18.76 |
| Class R1 | |
| Net assets applicable to outstanding shares | $ 46,889 |
| Shares of beneficial interest outstanding | 2,519 |
| Net asset value and offering price per share outstanding | $ 18.61 |
| Class R2 | |
| Net assets applicable to outstanding shares | $ 85,522 |
| Shares of beneficial interest outstanding | 4,845 |
| Net asset value and offering price per share outstanding | $ 17.65 |
| Class R3 | |
| Net assets applicable to outstanding shares | $ 450,051 |
| Shares of beneficial interest outstanding | 25,878 |
| Net asset value and offering price per share outstanding | $ 17.39 |
The notes to the financial statements are an integral part of, and should be read in conjunction with, the financial statements.
13
Statement of Operations for the year ended October 31, 2023
| Investment Income (Loss) |
| Income | |
| Dividends-unaffiliated (net of foreign tax withholding of $36,026) | $ 3,765,559 |
| Dividends-affiliated | 106,604 |
| Securities lending, net | 67,765 |
| Total income | 3,939,928 |
| Expenses | |
| Manager (See Note 3) | 2,402,987 |
| Transfer agent (See Note 3) | 439,507 |
| Distribution/Service—Class A (See Note 3) | 309,628 |
| Distribution/Service—Investor Class (See Note 3) | 83,882 |
| Distribution/Service—Class B (See Note 3) | 14,695 |
| Distribution/Service—Class C (See Note 3) | 19,131 |
| Distribution/Service—Class R2 (See Note 3) | 259 |
| Distribution/Service—Class R3 (See Note 3) | 2,433 |
| Registration | 102,522 |
| Professional fees | 91,365 |
| Custodian | 20,521 |
| Trustees | 7,755 |
| Shareholder service (See Note 3) | 643 |
| Shareholder communication | 264 |
| Miscellaneous | 38,608 |
| Total expenses before waiver/reimbursement | 3,534,200 |
| Expense waiver/reimbursement from Manager (See Note 3) | (80,654) |
| Reimbursement from prior custodian(a) | (663) |
| Net expenses | 3,452,883 |
| Net investment income (loss) | 487,045 |
| Realized and Unrealized Gain (Loss) |
| Net realized gain (loss) on: | |
| Unaffiliated investment transactions | (33,180,055) |
| Foreign currency transactions | 246 |
| Net realized gain (loss) | (33,179,809) |
| Net change in unrealized appreciation (depreciation) on: | |
| Unaffiliated investments | (7,769,411) |
| Translation of other assets and liabilities in foreign currencies | 74 |
| Net change in unrealized appreciation (depreciation) | (7,769,337) |
| Net realized and unrealized gain (loss) | (40,949,146) |
| Net increase (decrease) in net assets resulting from operations | $(40,462,101) |
| (a) | Represents a refund for overbilling of custody fees. |
The notes to the financial statements are an integral part of, and should be read in conjunction with, the financial statements.
| 14 | MainStay WMC Small Companies Fund |
Statements of Changes in Net Assets
for the years ended October 31, 2023 and October 31, 2022
| | 2023 | 2022 |
| Increase (Decrease) in Net Assets |
| Operations: | | |
| Net investment income (loss) | $ 487,045 | $ 5,954,969 |
| Net realized gain (loss) | (33,179,809) | (26,170,624) |
| Net change in unrealized appreciation (depreciation) | (7,769,337) | (31,631,451) |
| Net increase (decrease) in net assets resulting from operations | (40,462,101) | (51,847,106) |
| Distributions to shareholders: | | |
| Class A | (2,695,102) | (42,316,711) |
| Investor Class | (654,688) | (11,028,249) |
| Class B | (26,215) | (1,147,348) |
| Class C | (30,249) | (1,158,831) |
| Class I | (3,293,739) | (37,368,289) |
| Class R1 | (1,147) | (14,689) |
| Class R2 | (2,109) | (30,236) |
| Class R3 | (8,221) | (118,773) |
| Total distributions to shareholders | (6,711,470) | (93,183,126) |
| Capital share transactions: | | |
| Net proceeds from sales of shares | 31,953,890 | 51,298,006 |
| Net asset value of shares issued to shareholders in reinvestment of distributions | 6,604,900 | 91,619,894 |
| Cost of shares redeemed | (92,443,616) | (71,828,689) |
| Increase (decrease) in net assets derived from capital share transactions | (53,884,826) | 71,089,211 |
| Net increase (decrease) in net assets | (101,058,397) | (73,941,021) |
| Net Assets |
| Beginning of year | 327,999,827 | 401,940,848 |
| End of year | $ 226,941,430 | $327,999,827 |
The notes to the financial statements are an integral part of, and should be read in conjunction with, the financial statements.
15
Financial Highlights selected per share data and ratios
| | Year Ended October 31, |
| Class A | 2023 | | 2022 | | 2021 | | 2020 | | 2019 |
| Net asset value at beginning of year | $ 21.32 | | $ 32.63 | | $ 22.62 | | $ 24.59 | | $ 28.34 |
| Net investment income (loss) (a) | 0.02 | | 0.39 | | (0.10) | | (0.07) | | 0.07 |
| Net realized and unrealized gain (loss) | (3.09) | | (3.93) | | 10.11 | | (1.83) | | 0.24 |
| Total from investment operations | (3.07) | | (3.54) | | 10.01 | | (1.90) | | 0.31 |
| Less distributions: | | | | | | | | | |
| From net investment income | (0.43) | | — | | — | | (0.05) | | (0.05) |
| From net realized gain on investments | — | | (7.77) | | — | | — | | (4.01) |
| Return of capital | — | | — | | — | | (0.02) | | — |
| Total distributions | (0.43) | | (7.77) | | — | | (0.07) | | (4.06) |
| Net asset value at end of year | $ 17.82 | | $ 21.32 | | $ 32.63 | | $ 22.62 | | $ 24.59 |
| Total investment return (b) | (14.66)% | | (13.90)% | | 44.25% | | (7.76)% | | 1.41% |
| Ratios (to average net assets)/Supplemental Data: | | | | | | | | | |
| Net investment income (loss) | 0.09% | | 1.69% | | (0.32)% | | (0.30)% | | 0.27% |
| Net expenses (c) | 1.22% | | 1.23% | | 1.21% | | 1.25% | | 1.25% |
| Expenses (before waiver/reimbursement) | 1.22%(c) | | 1.23%(c) | | 1.22%(c) | | 1.25% | | 1.25% |
| Portfolio turnover rate | 86% | | 75% | | 108% | | 208% | | 205% |
| Net assets at end of year (in 000’s) | $ 103,460 | | $ 135,890 | | $ 178,454 | | $ 115,403 | | $ 141,548 |
| (a) | Per share data based on average shares outstanding during the year. |
| (b) | Total investment return is calculated exclusive of sales charges and assumes the reinvestment of dividends and distributions. For periods of less than one year, total return is not annualized. |
| (c) | In addition to the fees and expenses which the Fund bears directly, it also indirectly bears a pro-rata share of the fees and expenses of the underlying funds in which it invests. Such indirect expenses are not included in the above expense ratios. |
| | Year Ended October 31, |
| Investor Class | 2023 | | 2022 | | 2021 | | 2020 | | 2019 |
| Net asset value at beginning of year | $ 20.60 | | $ 31.86 | | $ 22.14 | | $ 24.07 | | $ 27.85 |
| Net investment income (loss) (a) | (0.03) | | 0.32 | | (0.17) | | (0.13) | | (0.01) |
| Net realized and unrealized gain (loss) | (2.99) | | (3.81) | | 9.89 | | (1.80) | | 0.24 |
| Total from investment operations | (3.02) | | (3.49) | | 9.72 | | (1.93) | | 0.23 |
| Less distributions: | | | | | | | | | |
| From net investment income | (0.38) | | — | | — | | (0.00)‡ | | — |
| From net realized gain on investments | — | | (7.77) | | — | | — | | (4.01) |
| Return of capital | — | | — | | — | | (0.00)‡ | | — |
| Total distributions | (0.38) | | (7.77) | | — | | (0.00)‡ | | (4.01) |
| Net asset value at end of year | $ 17.20 | | $ 20.60 | | $ 31.86 | | $ 22.14 | | $ 24.07 |
| Total investment return (b) | (14.92)% | | (14.13)% | | 43.90% | | (8.02)% | | 1.09% |
| Ratios (to average net assets)/Supplemental Data: | | | | | | | | | |
| Net investment income (loss) | (0.18)% | | 1.43% | | (0.57)% | | (0.57)% | | (0.05)% |
| Net expenses (c) | 1.49% | | 1.50% | | 1.49% | | 1.52% | | 1.55% |
| Expenses (before waiver/reimbursement) (c) | 1.70% | | 1.58% | | 1.66% | | 1.70% | | 1.64% |
| Portfolio turnover rate | 86% | | 75% | | 108% | | 208% | | 205% |
| Net assets at end of year (in 000's) | $ 28,292 | | $ 35,985 | | $ 45,382 | | $ 41,547 | | $ 49,342 |
| ‡ | Less than one cent per share. |
| (a) | Per share data based on average shares outstanding during the year. |
| (b) | Total investment return is calculated exclusive of sales charges and assumes the reinvestment of dividends and distributions. For periods of less than one year, total return is not annualized. |
| (c) | In addition to the fees and expenses which the Fund bears directly, it also indirectly bears a pro-rata share of the fees and expenses of the underlying funds in which it invests. Such indirect expenses are not included in the above expense ratios. |
The notes to the financial statements are an integral part of, and should be read in conjunction with, the financial statements.
| 16 | MainStay WMC Small Companies Fund |
Financial Highlights selected per share data and ratios
| | Year Ended October 31, |
| Class B | 2023 | | 2022 | | 2021 | | 2020 | | 2019 |
| Net asset value at beginning of year | $ 16.46 | | $ 27.20 | | $ 19.04 | | $ 20.86 | | $ 24.83 |
| Net investment income (loss) (a) | (0.14) | | 0.15 | | (0.34) | | (0.25) | | (0.16) |
| Net realized and unrealized gain (loss) | (2.38) | | (3.12) | | 8.50 | | (1.57) | | 0.20 |
| Total from investment operations | (2.52) | | (2.97) | | 8.16 | | (1.82) | | 0.04 |
| Less distributions: | | | | | | | | | |
| From net investment income | (0.22) | | — | | — | | — | | — |
| From net realized gain on investments | — | | (7.77) | | — | | — | | (4.01) |
| Total distributions | (0.22) | | (7.77) | | — | | — | | (4.01) |
| Net asset value at end of year | $ 13.72 | | $ 16.46 | | $ 27.20 | | $ 19.04 | | $ 20.86 |
| Total investment return (b) | (15.48)% | | (14.81)% | | 42.86% | | (8.72)% | | 0.35% |
| Ratios (to average net assets)/Supplemental Data: | | | | | | | | | |
| Net investment income (loss) | (0.92)% | | 0.88% | | (1.31)% | | (1.30)% | | (0.74)% |
| Net expenses (c) | 2.24% | | 2.24% | | 2.24% | | 2.27% | | 2.30% |
| Expenses (before waiver/reimbursement) (c) | 2.46% | | 2.33% | | 2.41% | | 2.45% | | 2.39% |
| Portfolio turnover rate | 86% | | 75% | | 108% | | 208% | | 205% |
| Net assets at end of year (in 000’s) | $ 828 | | $ 2,036 | | $ 4,021 | | $ 4,447 | | $ 7,442 |
| (a) | Per share data based on average shares outstanding during the year. |
| (b) | Total investment return is calculated exclusive of sales charges and assumes the reinvestment of dividends and distributions. For periods of less than one year, total return is not annualized. |
| (c) | In addition to the fees and expenses which the Fund bears directly, it also indirectly bears a pro-rata share of the fees and expenses of the underlying funds in which it invests. Such indirect expenses are not included in the above expense ratios. |
| | Year Ended October 31, |
| Class C | 2023 | | 2022 | | 2021 | | 2020 | | 2019 |
| Net asset value at beginning of year | $ 16.46 | | $ 27.19 | | $ 19.03 | | $ 20.84 | | $ 24.81 |
| Net investment income (loss) (a) | (0.15) | | 0.15 | | (0.34) | | (0.25) | | (0.13) |
| Net realized and unrealized gain (loss) | (2.38) | | (3.11) | | 8.50 | | (1.56) | | 0.17 |
| Total from investment operations | (2.53) | | (2.96) | | 8.16 | | (1.81) | | 0.04 |
| Less distributions: | | | | | | | | | |
| From net investment income | (0.22) | | — | | — | | — | | — |
| From net realized gain on investments | — | | (7.77) | | — | | — | | (4.01) |
| Total distributions | (0.22) | | (7.77) | | — | | — | | (4.01) |
| Net asset value at end of year | $ 13.71 | | $ 16.46 | | $ 27.19 | | $ 19.03 | | $ 20.84 |
| Total investment return (b) | (15.54)% | | (14.74)% | | 42.88%(c) | | (8.69)% | | 0.35% |
| Ratios (to average net assets)/Supplemental Data: | | | | | | | | | |
| Net investment income (loss) | (0.92)% | | 0.83% | | (1.32)% | | (1.30)% | | (0.60)% |
| Net expenses (d) | 2.24% | | 2.24% | | 2.24% | | 2.27% | | 2.30% |
| Expenses (before waiver/reimbursement) (d) | 2.46% | | 2.33% | | 2.41% | | 2.45% | | 2.39% |
| Portfolio turnover rate | 86% | | 75% | | 108% | | 208% | | 205% |
| Net assets at end of year (in 000’s) | $ 1,280 | | $ 2,415 | | $ 4,129 | | $ 3,201 | | $ 5,469 |
| (a) | Per share data based on average shares outstanding during the year. |
| (b) | Total investment return is calculated exclusive of sales charges and assumes the reinvestment of dividends and distributions. For periods of less than one year, total return is not annualized. |
| (c) | Total investment return may reflect adjustments to conform to generally accepted accounting principles. |
| (d) | In addition to the fees and expenses which the Fund bears directly, it also indirectly bears a pro-rata share of the fees and expenses of the underlying funds in which it invests. Such indirect expenses are not included in the above expense ratios. |
The notes to the financial statements are an integral part of, and should be read in conjunction with, the financial statements.
17
Financial Highlights selected per share data and ratios
| | Year Ended October 31, |
| Class I | 2023 | | 2022 | | 2021 | | 2020 | | 2019 |
| Net asset value at beginning of year | $ 22.43 | | $ 33.85 | | $ 23.40 | | $ 25.44 | | $ 29.19 |
| Net investment income (loss) (a) | 0.07 | | 0.45 | | (0.02) | | (0.01) | | 0.17 |
| Net realized and unrealized gain (loss) | (3.25) | | (4.10) | | 10.47 | | (1.90) | | 0.22 |
| Total from investment operations | (3.18) | | (3.65) | | 10.45 | | (1.91) | | 0.39 |
| Less distributions: | | | | | | | | | |
| From net investment income | (0.49) | | — | | — | | (0.09) | | (0.13) |
| From net realized gain on investments | — | | (7.77) | | — | | — | | (4.01) |
| Return of capital | — | | — | | — | | (0.04) | | — |
| Total distributions | (0.49) | | (7.77) | | — | | (0.13) | | (4.14) |
| Net asset value at end of year | $ 18.76 | | $ 22.43 | | $ 33.85 | | $ 23.40 | | $ 25.44 |
| Total investment return (b) | (14.42)% | | (13.71)% | | 44.66% | | (7.55)% | | 1.67% |
| Ratios (to average net assets)/Supplemental Data: | | | | | | | | | |
| Net investment income (loss) | 0.34% | | 1.85% | | (0.05)% | | (0.06)% | | 0.66% |
| Net expenses (c) | 0.97% | | 0.98% | | 0.96% | | 1.00% | | 1.00% |
| Expenses (before waiver/reimbursement) | 0.97%(c) | | 0.98%(c) | | 0.97%(c) | | 1.00% | | 1.00% |
| Portfolio turnover rate | 86% | | 75% | | 108% | | 208% | | 205% |
| Net assets at end of year (in 000’s) | $ 92,498 | | $ 151,035 | | $ 169,281 | | $ 127,115 | | $ 146,525 |
| (a) | Per share data based on average shares outstanding during the year. |
| (b) | Total investment return is calculated exclusive of sales charges and assumes the reinvestment of dividends and distributions. Class I shares are not subject to sales charges. For periods of less than one year, total return is not annualized. |
| (c) | In addition to the fees and expenses which the Fund bears directly, it also indirectly bears a pro-rata share of the fees and expenses of the underlying funds in which it invests. Such indirect expenses are not included in the above expense ratios. |
| | Year Ended October 31, |
| Class R1 | 2023 | | 2022 | | 2021 | | 2020 | | 2019 |
| Net asset value at beginning of year | $ 22.26 | | $ 33.69 | | $ 23.31 | | $ 25.34 | | $ 29.09 |
| Net investment income (loss) (a) | 0.05 | | 0.43 | | (0.05) | | (0.04) | | 0.10 |
| Net realized and unrealized gain (loss) | (3.23) | | (4.09) | | 10.43 | | (1.88) | | 0.26 |
| Total from investment operations | (3.18) | | (3.66) | | 10.38 | | (1.92) | | 0.36 |
| Less distributions: | | | | | | | | | |
| From net investment income | (0.47) | | — | | — | | (0.08) | | (0.10) |
| From net realized gain on investments | — | | (7.77) | | — | | — | | (4.01) |
| Return of capital | — | | — | | — | | (0.03) | | — |
| Total distributions | (0.47) | | (7.77) | | — | | (0.11) | | (4.11) |
| Net asset value at end of year | $ 18.61 | | $ 22.26 | | $ 33.69 | | $ 23.31 | | $ 25.34 |
| Total investment return (b) | (14.54)% | | (13.80)% | | 44.53%(c) | | (7.62)% | | 1.57% |
| Ratios (to average net assets)/Supplemental Data: | | | | | | | | | |
| Net investment income (loss) | 0.23% | | 1.77% | | (0.16)% | | (0.18)% | | 0.41% |
| Net expenses (d) | 1.08% | | 1.08% | | 1.06% | | 1.10% | | 1.10% |
| Expenses (before waiver/reimbursement) | 1.08%(d) | | 1.08%(d) | | 1.07%(d) | | 1.10% | | 1.10% |
| Portfolio turnover rate | 86% | | 75% | | 108% | | 208% | | 205% |
| Net assets at end of year (in 000’s) | $ 47 | | $ 55 | | $ 64 | | $ 44 | | $ 65 |
| (a) | Per share data based on average shares outstanding during the year. |
| (b) | Total investment return is calculated exclusive of sales charges and assumes the reinvestment of dividends and distributions. Class R1 shares are not subject to sales charges. For periods of less than one year, total return is not annualized. |
| (c) | Total investment return may reflect adjustments to conform to generally accepted accounting principles. |
| (d) | In addition to the fees and expenses which the Fund bears directly, it also indirectly bears a pro-rata share of the fees and expenses of the underlying funds in which it invests. Such indirect expenses are not included in the above expense ratios. |
The notes to the financial statements are an integral part of, and should be read in conjunction with, the financial statements.
| 18 | MainStay WMC Small Companies Fund |
Financial Highlights selected per share data and ratios
| | Year Ended October 31, |
| Class R2 | 2023 | | 2022 | | 2021 | | 2020 | | 2019 |
| Net asset value at beginning of year | $ 21.12 | | $ 32.43 | | $ 22.50 | | $ 24.47 | | $ 28.21 |
| Net investment income (loss) (a) | (0.00)‡ | | 0.35 | | (0.13) | | (0.09) | | 0.04 |
| Net realized and unrealized gain (loss) | (3.06) | | (3.89) | | 10.06 | | (1.83) | | 0.25 |
| Total from investment operations | (3.06) | | (3.54) | | 9.93 | | (1.92) | | 0.29 |
| Less distributions: | | | | | | | | | |
| From net investment income | (0.41) | | — | | — | | (0.04) | | (0.02) |
| From net realized gain on investments | — | | (7.77) | | — | | — | | (4.01) |
| Return of capital | — | | — | | — | | (0.01) | | — |
| Total distributions | (0.41) | | (7.77) | | — | | (0.05) | | (4.03) |
| Net asset value at end of year | $ 17.65 | | $ 21.12 | | $ 32.43 | | $ 22.50 | | $ 24.47 |
| Total investment return (b) | (14.73)% | | (14.01)% | | 44.13% | | (7.84)% | | 1.30% |
| Ratios (to average net assets)/Supplemental Data: | | | | | | | | | |
| Net investment income (loss) | (0.02)% | | 1.51% | | (0.41)% | | (0.40)% | | 0.18% |
| Net expenses (c) | 1.32% | | 1.33% | | 1.31% | | 1.35% | | 1.35% |
| Expenses (before waiver/reimbursement) | 1.32%(c) | | 1.33%(c) | | 1.32%(c) | | 1.35% | | 1.35% |
| Portfolio turnover rate | 86% | | 75% | | 108% | | 208% | | 205% |
| Net assets at end of year (in 000’s) | $ 86 | | $ 108 | | $ 126 | | $ 88 | | $ 111 |
| ‡ | Less than one cent per share. |
| (a) | Per share data based on average shares outstanding during the year. |
| (b) | Total investment return is calculated exclusive of sales charges and assumes the reinvestment of dividends and distributions. Class R2 shares are not subject to sales charges. For periods of less than one year, total return is not annualized. |
| (c) | In addition to the fees and expenses which the Fund bears directly, it also indirectly bears a pro-rata share of the fees and expenses of the underlying funds in which it invests. Such indirect expenses are not included in the above expense ratios. |
| | Year Ended October 31, |
| Class R3 | 2023 | | 2022 | | 2021 | | 2020 | | 2019 |
| Net asset value at beginning of year | $ 20.82 | | $ 32.14 | | $ 22.35 | | $ 24.32 | | $ 28.11 |
| Net investment income (loss) (a) | (0.05) | | 0.27 | | (0.20) | | (0.15) | | (0.04) |
| Net realized and unrealized gain (loss) | (3.01) | | (3.82) | | 9.99 | | (1.82) | | 0.26 |
| Total from investment operations | (3.06) | | (3.55) | | 9.79 | | (1.97) | | 0.22 |
| Less distributions: | | | | | | | | | |
| From net investment income | (0.37) | | — | | — | | — | | — |
| From net realized gain on investments | — | | (7.77) | | — | | — | | (4.01) |
| Total distributions | (0.37) | | (7.77) | | — | | — | | (4.01) |
| Net asset value at end of year | $ 17.39 | | $ 20.82 | | $ 32.14 | | $ 22.35 | | $ 24.32 |
| Total investment return (b) | (14.95)% | | (14.22)% | | 43.80% | | (8.10)% | | 1.04% |
| Ratios (to average net assets)/Supplemental Data: | | | | | | | | | |
| Net investment income (loss) | (0.27)% | | 1.19% | | (0.66)% | | (0.67)% | | (0.15)% |
| Net expenses (c) | 1.57% | | 1.58% | | 1.56% | | 1.60% | | 1.60% |
| Expenses (before waiver/reimbursement) | 1.57%(c) | | 1.58%(c) | | 1.57%(c) | | 1.60% | | 1.60% |
| Portfolio turnover rate | 86% | | 75% | | 108% | | 208% | | 205% |
| Net assets at end of year (in 000’s) | $ 450 | | $ 476 | | $ 484 | | $ 343 | | $ 342 |
| (a) | Per share data based on average shares outstanding during the year. |
| (b) | Total investment return is calculated exclusive of sales charges and assumes the reinvestment of dividends and distributions. Class R3 shares are not subject to sales charges. For periods of less than one year, total return is not annualized. |
| (c) | In addition to the fees and expenses which the Fund bears directly, it also indirectly bears a pro-rata share of the fees and expenses of the underlying funds in which it invests. Such indirect expenses are not included in the above expense ratios. |
The notes to the financial statements are an integral part of, and should be read in conjunction with, the financial statements.
19
Notes to Financial Statements
Note 1-Organization and Business
MainStay Funds Trust (the “Trust”) was organized as a Delaware statutory trust on April 28, 2009. The Trust is registered under the Investment Company Act of 1940, as amended (the “1940 Act”), as an open-end management investment company, and is comprised of thirty-seven funds (collectively referred to as the “Funds”). These financial statements and notes relate to the MainStay WMC Small Companies Fund (the "Fund"), a “diversified” fund, as that term is defined in the 1940 Act, as interpreted or modified by regulatory authorities having jurisdiction, from time to time.
The following table lists the Fund's share classes that have been registered and commenced operations:
| Class | Commenced Operations |
| Class A | January 2, 2004 |
| Investor Class | February 28, 2008 |
| Class B | January 2, 2004 |
| Class C | December 30, 2002 |
| Class I | January 12, 1987 |
| Class R1* | July 31, 2012 |
| Class R2* | July 31, 2012 |
| Class R3* | February 29, 2016 |
| * | As of October 31, 2023, Class R1, Class R2 and Class R3 shares are closed to new investors and, upon the close of business on December 29, 2023, Class R1, Class R2 and Class R3 shares are closed to additional investments by existing shareholders. Additionally, Class R1, Class R2 and Class R3 shares will be liquidated on or about February 28, 2024 (the "Liquidation Date"). It is expected that the Fund will distribute to remaining shareholders invested in Class R1, Class R2 or Class R3 shares, on or promptly after the Liquidation Date, a liquidating distribution in cash or cash equivalents equal to the net asset value of such shares. |
Class B shares of the MainStay Group of Funds are closed to all new purchases as well as additional investments by existing Class B shareholders. Existing Class B shareholders may continue to reinvest dividends and capital gains distributions, as well as exchange their Class B shares for Class B shares of other funds in the MainStay Group of Funds as permitted by the current exchange privileges. Class B shareholders continue to be subject to any applicable contingent deferred sales charge ("CDSC") at the time of redemption. All other features of the Class B shares, including but not limited to the fees and expenses applicable to Class B shares, remain unchanged. Unless redeemed, Class B shareholders will remain in Class B shares of their respective fund until the Class B shares are converted to Class A or Investor Class shares pursuant to the applicable conversion schedule.
Class A and Investor Class shares are offered at net asset value (“NAV”) per share plus an initial sales charge. No initial sales charge applies to investments of $1 million or more (and certain other qualified purchases) in Class A and Investor Class shares. However, a CDSC of 1.00% may be imposed on certain redemptions made within 18 months of the date of purchase on shares that were purchased without an initial sales charge. Class C shares are offered at NAV without an initial sales charge, although a 1.00% CDSC may be imposed on certain redemptions of such
shares made within one year of the date of purchase of Class C shares. When Class B shares were offered, they were offered at NAV without an initial sales charge, although a CDSC that declines depending on the number of years a shareholder held its Class B shares may be imposed on certain redemptions of such shares made within six years of the date of purchase of such shares. Class I, Class R1, Class R2 and Class R3 shares are offered at NAV without a sales charge. Depending upon eligibility, Class B shares convert to either Class A or Investor Class shares at the end of the calendar quarter eight years after the date they were purchased. In addition, depending upon eligibility, Class C shares convert to either Class A or Investor Class shares at the end of the calendar quarter eight years after the date they were purchased. Additionally, Investor Class shares may convert automatically to Class A shares. Under certain circumstances and as may be permitted by the Trust’s multiple class plan pursuant to Rule 18f-3 under the 1940 Act, specified share classes of the Fund may be converted to one or more other share classes of the Fund as disclosed in the capital share transactions within these Notes. The classes of shares have the same voting (except for issues that relate solely to one class), dividend, liquidation and other rights, and the same terms and conditions, except that under distribution plans pursuant to Rule 12b-1 under the 1940 Act, Class B and Class C shares are subject to higher distribution and/or service fees than Class A, Investor Class, Class R2 and Class R3 shares. Class I and Class R1 shares are not subject to a distribution and/or service fee. Class R1, Class R2 and Class R3 shares are subject to a shareholder service fee, which is in addition to fees paid under the distribution plans for Class R2 and Class R3 shares.
At a meeting held on September 25-26, 2023, the Board of Trustees (the “Board”) of the Trust, after careful consideration of a number of factors and upon the recommendation of the Fund’s investment adviser, New York Life Investment Management LLC (“New York Life Investments” or the "Manager"), approved a proposal to liquidate Class R1, Class R2 and Class R3 shares of the Fund on or about February 28, 2024, pursuant to the terms of a plan of liquidation.
The Fund's investment objective is to seek long-term growth of capital.
Note 2–Significant Accounting Policies
The Fund is an investment company and accordingly follows the investment company accounting and reporting guidance of the Financial Accounting Standards Board (“FASB”) Accounting Standards Codification Topic 946 Financial Services—Investment Companies. The Fund prepares its financial statements in accordance with generally accepted accounting principles (“GAAP”) in the United States of America and follows the significant accounting policies described below.
(A) Securities Valuation. Investments are usually valued as of the close of regular trading on the New York Stock Exchange (the "Exchange") (usually 4:00 p.m. Eastern time) on each day the Fund is open for business ("valuation date").
| 20 | MainStay WMC Small Companies Fund |
Pursuant to Rule 2a-5 under the 1940 Act, the Board has designated New York Life Investments as its Valuation Designee (the "Valuation Designee"). The Valuation Designee is responsible for performing fair valuations relating to all investments in the Fund’s portfolio for which market quotations are not readily available; periodically assessing and managing material valuation risks; establishing and applying fair value methodologies; testing fair valuation methodologies; evaluating and overseeing pricing services; ensuring appropriate segregation of valuation and portfolio management functions; providing quarterly, annual and prompt reporting to the Board, as appropriate; identifying potential conflicts of interest; and maintaining appropriate records. The Valuation Designee has established a valuation committee ("Valuation Committee") to assist in carrying out the Valuation Designee’s responsibilities and establish prices of securities for which market quotations are not readily available. The Fund's and the Valuation Designee's policies and procedures ("Valuation Procedures") govern the Valuation Designee’s selection and application of methodologies for determining and calculating the fair value of Fund investments. The Valuation Designee may value the Fund's portfolio securities for which market quotations are not readily available and other Fund assets utilizing inputs from pricing services and other third-party sources. The Valuation Committee meets (in person, via electronic mail or via teleconference) on an ad-hoc basis to determine fair valuations and on a quarterly basis to review fair value events with respect to certain securities for which market quotations are not readily available, including valuation risks and back-testing results, and preview reports to the Board.
The Valuation Committee establishes prices of securities for which market quotations are not readily available based on such methodologies and measurements on a regular basis after considering information that is reasonably available and deemed relevant by the Valuation Committee. The Board shall oversee the Valuation Designee and review fair valuation materials on a prompt, quarterly and annual basis and approve proposed revisions to the Valuation Procedures.
Investments for which market quotations are not readily available are valued at fair value as determined in good faith pursuant to the Valuation Procedures. A market quotation is readily available only when that quotation is a quoted price (unadjusted) in active markets for identical investments that the Fund can access at the measurement date, provided that a quotation will not be readily available if it is not reliable. "Fair value" is defined as the price the Fund would reasonably expect to receive upon selling an asset or liability in an orderly transaction to an independent buyer in the principal or most advantageous market for the asset or liability. Fair value measurements are determined within a framework that establishes a three-tier hierarchy that maximizes the use of observable market data and minimizes the use of unobservable inputs to establish a classification of fair value measurements for disclosure purposes. "Inputs" refer broadly to the assumptions that market participants would use in pricing the asset or liability, including assumptions about risk, such as the risk inherent in a particular valuation technique used to measure fair value using a pricing model and/or the risk inherent in the inputs for the valuation technique. Inputs may be observable or unobservable.
Observable inputs reflect the assumptions market participants would use in pricing the asset or liability based on market data obtained from sources independent of the Fund. Unobservable inputs reflect the Fund’s own assumptions about the assumptions market participants would use in pricing the asset or liability based on the information available. The inputs or methodology used for valuing assets or liabilities may not be an indication of the risks associated with investing in those assets or liabilities. The three-tier hierarchy of inputs is summarized below.
| • | Level 1—quoted prices (unadjusted) in active markets for an identical asset or liability |
| • | Level 2—other significant observable inputs (including quoted prices for a similar asset or liability in active markets, interest rates and yield curves, prepayment speeds, credit risk, etc.) |
| • | Level 3—significant unobservable inputs (including the Fund's own assumptions about the assumptions that market participants would use in measuring fair value of an asset or liability) |
The level of an asset or liability within the fair value hierarchy is based on the lowest level of an input, both individually and in the aggregate, that is significant to the fair value measurement. The aggregate value by input level of the Fund’s assets and liabilities as of October 31, 2023, is included at the end of the Portfolio of Investments.
The Fund may use third-party vendor evaluations, whose prices may be derived from one or more of the following standard inputs, among others:
| • Broker/dealer quotes | • Benchmark securities |
| • Two-sided markets | • Reference data (corporate actions or material event notices) |
| • Bids/offers | • Monthly payment information |
| • Industry and economic events | • Reported trades |
An asset or liability for which a market quotation is not readily available is valued by methods deemed reasonable in good faith by the Valuation Committee, following the Valuation Procedures to represent fair value. Under these procedures, the Valuation Designee generally uses a market-based approach which may use related or comparable assets or liabilities, recent transactions, market multiples, book values and other relevant information. The Valuation Designee may also use an income-based valuation approach in which the anticipated future cash flows of the asset or liability are discounted to calculate fair value. Discounts may also be applied due to the nature and/or duration of any restrictions on the disposition of the asset or liability. Fair value represents a good faith approximation of the value of a security. Fair value determinations involve the consideration of a number of subjective factors, an analysis of applicable facts and circumstances and the exercise of judgment. As a result, it is possible that the fair value for a security determined in good faith in accordance with the Valuation Procedures may differ from valuations for the same security determined for other funds using their own valuation procedures. Although the Valuation Procedures are designed to value a security at the price the Fund may reasonably expect to receive upon the security's sale in an
Notes to Financial Statements (continued)
orderly transaction, there can be no assurance that any fair value determination thereunder would, in fact, approximate the amount that the Fund would actually realize upon the sale of the security or the price at which the security would trade if a reliable market price were readily available. During the year ended October 31, 2023, there were no material changes to the fair value methodologies.
Securities which may be valued in this manner include, but are not limited to: (i) a security for which trading has been halted or suspended or otherwise does not have a readily available market quotation on a given day; (ii) a debt security that has recently gone into default and for which there is not a current market quotation; (iii) a security of an issuer that has entered into a restructuring; (iv) a security that has been delisted from a national exchange; (v) a security subject to trading collars for which no or limited trading takes place; and (vi) a security whose principal market has been temporarily closed at a time when, under normal conditions, it would be open. Securities valued in this manner are generally categorized as Level 2 or 3 in the hierarchy. No securities held by the Fund as of October 31, 2023, were fair valued in such a manner.
Equity securities, rights and warrants, if applicable, are valued at the last quoted sales prices as of the close of regular trading on the relevant exchange on each valuation date. Securities that are not traded on the valuation date are valued at the mean of the last quoted bid and ask prices. Prices are normally taken from the principal market in which each security trades. These securities are generally categorized as Level 1 in the hierarchy.
Exchange-traded funds (“ETFs”) are valued at the last quoted sales prices as of the close of regular trading on the relevant exchange on each valuation date. Securities that are not traded on the valuation date are valued at the mean of the last quoted bid and ask prices. Prices are normally taken from the principal market in which each security trades. These securities are generally categorized as Level 1 in the hierarchy.
Investments in mutual funds, including money market funds, are valued at their respective NAVs at the close of business each day on the valuation date. These securities are generally categorized as Level 1 in the hierarchy.
Temporary cash investments acquired in excess of 60 days to maturity at the time of purchase are valued using the latest bid prices or using valuations based on a matrix system (which considers such factors as security prices, yields, maturities and ratings), both as furnished by independent pricing services. Temporary cash investments that mature in 60 days or less at the time of purchase ("Short-Term Investments") are valued using the amortized cost method of valuation, unless the use of such method would be inappropriate. The amortized cost method involves valuing a security at its cost on the date of purchase and thereafter assuming a constant amortization to maturity of the difference between such cost and the value on maturity date. Amortized cost approximates the current fair value of a security. Securities valued using the amortized cost method are not valued using quoted prices in an active market and are generally categorized as Level 2 in the hierarchy.
The information above is not intended to reflect an exhaustive list of the methodologies that may be used to value portfolio investments. The Valuation Procedures permit the use of a variety of valuation methodologies in connection with valuing portfolio investments. The methodology used for a specific type of investment may vary based on the market data available or other considerations. The methodologies summarized above may not represent the specific means by which portfolio investments are valued on any particular business day.
(B) Income Taxes. The Fund's policy is to comply with the requirements of the Internal Revenue Code of 1986, as amended (the “Internal Revenue Code”), applicable to regulated investment companies and to distribute all of its taxable income to the shareholders of the Fund within the allowable time limits.
The Manager evaluates the Fund’s tax positions to determine if the tax positions taken meet the minimum recognition threshold in connection with accounting for uncertainties in income tax positions taken or expected to be taken for the purposes of measuring and recognizing tax liabilities in the financial statements. Recognition of tax benefits of an uncertain tax position is permitted only to the extent the position is “more likely than not” to be sustained assuming examination by taxing authorities. The Manager analyzed the Fund's tax positions taken on federal, state and local income tax returns for all open tax years (for up to three tax years) and has concluded that no provisions for federal, state and local income tax are required in the Fund's financial statements. The Fund's federal, state and local income tax and federal excise tax returns for tax years for which the applicable statutes of limitations have not expired are subject to examination by the Internal Revenue Service and state and local departments of revenue.
(C) Dividends and Distributions to Shareholders. Dividends and distributions are recorded on the ex-dividend date. The Fund intends to declare and pay dividends from net investment income and distributions from net realized capital and currency gains, if any, at least annually. Unless a shareholder elects otherwise, all dividends and distributions are reinvested at NAV in the same class of shares of the Fund. Dividends and distributions to shareholders are determined in accordance with federal income tax regulations and may differ from determinations using GAAP.
(D) Security Transactions and Investment Income. The Fund records security transactions on the trade date. Realized gains and losses on security transactions are determined using the identified cost method. Dividend income is recognized on the ex-dividend date, net of any foreign tax withheld at the source, and interest income is accrued as earned using the effective interest rate method. Distributions received from real estate investment trusts may be classified as dividends, capital gains and/or return of capital.
Investment income and realized and unrealized gains and losses on investments of the Fund are allocated pro rata to the separate classes of shares based upon their relative net assets on the date the income is earned or realized and unrealized gains and losses are incurred.
| 22 | MainStay WMC Small Companies Fund |
(E) Expenses. Expenses of the Trust are allocated to the individual Funds in proportion to the net assets of the respective Funds when the expenses are incurred, except where direct allocations of expenses can be made. Expenses (other than transfer agent expenses and fees incurred under the shareholder services plans and/or the distribution plans further discussed in Note 3(B)) are allocated to separate classes of shares pro rata based upon their relative net assets on the date the expenses are incurred. The expenses borne by the Fund, including those of related parties to the Fund, are shown in the Statement of Operations.
Additionally, the Fund may invest in ETFs and mutual funds, which are subject to management fees and other fees that may cause the costs of investing in ETFs and mutual funds to be greater than the costs of owning the underlying securities directly. These indirect expenses of ETFs and mutual funds are not included in the amounts shown as expenses in the Statement of Operations or in the expense ratios included in the Financial Highlights.
(F) Use of Estimates. In preparing financial statements in conformity with GAAP, the Manager makes estimates and assumptions that affect the reported amounts and disclosures in the financial statements. Actual results could differ from those estimates and assumptions.
(G) Securities Lending. In order to realize additional income, the Fund may engage in securities lending, subject to the limitations set forth in the 1940 Act and relevant guidance by the staff of the Securities and Exchange Commission (“SEC”). If the Fund engages in securities lending, the Fund will lend through its custodian, JPMorgan Chase Bank, N.A., ("JPMorgan"), acting as securities lending agent on behalf of the Fund. Under the current arrangement, JPMorgan will manage the Fund's collateral in accordance with the securities lending agency agreement between the Fund and JPMorgan, and indemnify the Fund against counterparty risk. The loans will be collateralized by cash (which may be invested in a money market fund) and/or non-cash collateral (which may include U.S. Treasury securities and/or U.S. government agency securities issued or guaranteed by the United States government or its agencies or instrumentalities) at least equal at all times to the market value of the securities loaned. Non-cash collateral held at year end is segregated and cannot be transferred by the Fund. The Fund bears the risk of delay in recovery of, or loss of rights in, the securities loaned. The Fund may also record a realized gain or loss on securities deemed sold due to a borrower’s inability to return securities on loan. The Fund bears the risk of any loss on investment of cash collateral. The Fund will receive compensation for lending its securities in the form of fees or it will retain a portion of interest earned on the investment of any cash collateral. The Fund will also continue to receive interest and dividends on the securities loaned and any gain or loss in the market price of the securities loaned that may occur during the term of the loan will be for the account of the Fund. Income earned from securities lending activities, if any, is reflected in the Statement of Operations. Securities on loan as of October 31, 2023, are shown in the Portfolio of Investments.
(H) Rights and Warrants. Rights are certificates that permit the holder to purchase a certain number of shares, or a fractional share, of a new stock from the issuer at a specific price. Warrants are instruments that entitle the holder to buy an equity security at a specific price for a specific period of time. These investments can provide a greater potential for profit or loss than an equivalent investment in the underlying security. Prices of these investments do not necessarily move in tandem with the prices of the underlying securities.
There is risk involved in the purchase of rights and warrants in that these investments are speculative investments. The Fund could also lose the entire value of its investment in warrants if such warrants are not exercised by the date of its expiration. The Fund is exposed to risk until the sale or exercise of each right or warrant is completed. Rights and Warrants as of October 31, 2023 are shown in the Portfolio of Investments.
(I) Large Transaction Risks. From time to time, the Fund may receive large purchase or redemption orders from affiliated or unaffiliated mutual funds or other investors. Such large transactions could have adverse effects on the Fund’s performance if the Fund were required to sell securities or invest cash at times when it otherwise would not do so. This activity could also accelerate the realization of capital gains and increase the Fund’s transaction costs. The Fund has adopted procedures designed to mitigate the negative impacts of such large transactions, but there can be no assurance that these procedures will be effective.
(J) Indemnifications. Under the Trust’s organizational documents, its officers and trustees are indemnified against certain liabilities that may arise out of performance of their duties to the Trust. Additionally, in the normal course of business, the Fund enters into contracts with third-party service providers that contain a variety of representations and warranties and that may provide general indemnifications. The Fund's maximum exposure under these arrangements is unknown, as this would involve future claims that may be made against the Fund that have not yet occurred. The Manager believes that the risk of loss in connection with these potential indemnification obligations is remote. However, there can be no assurance that material liabilities related to such obligations will not arise in the future, which could adversely impact the Fund.
Note 3–Fees and Related Party Transactions
(A) Manager and Subadvisor. New York Life Investments, a registered investment adviser and an indirect, wholly-owned subsidiary of New York Life Insurance Company ("New York Life"), serves as the Fund's Manager, pursuant to an Amended and Restated Management Agreement ("Management Agreement"). The Manager provides offices, conducts clerical, recordkeeping and bookkeeping services and keeps most of the financial and accounting records required to be maintained by the Fund. Except for the portion of salaries and expenses that are the responsibility of the Fund, the Manager pays the salaries and expenses of all personnel affiliated with the Fund and certain operational expenses of the Fund. The Fund reimburses New York Life Investments in an amount equal to the portion of the compensation of the Chief Compliance Officer attributable
Notes to Financial Statements (continued)
to the Fund. Wellington Management Company LLP ("Wellington" or the "Subadvisor"), a registered investment adviser, serves as the Subadvisor to the Fund and is responsible for the day-to-day portfolio management of the Fund. Pursuant to the terms of a Subadvisory Agreement ("Subadvisory Agreement") between New York Life Investments and Wellington, New York Life Investments pays for the services of the Subadvisor.
Pursuant to the Management Agreement, the Fund pays the Manager a monthly fee for the services performed and the facilities furnished at an annual rate of the Fund’s average daily net assets as follows: 0.80% up to $1 billion, 0.775% from $1 billion to $2 billion and 0.75% in excess of $2 billion. During the year ended October 31, 2023, the effective management fee rate was 0.80% of the Fund’s average daily net assets, exclusive of any applicable waivers/reimbursements.
During the year ended October 31, 2023, New York Life Investments earned fees from the Fund in the amount of $2,402,987 and waived fees and/or reimbursed expenses in the amount of $80,654 and paid the Subadvisor fees in the amount of $1,126,399.
JPMorgan provides sub-administration and sub-accounting services to the Fund pursuant to an agreement with New York Life Investments. These services include calculating the daily NAVs of the Fund, maintaining the general ledger and sub-ledger accounts for the calculation of the Fund's NAVs, and assisting New York Life Investments in conducting various aspects of the Fund's administrative operations. For providing these services to the Fund, JPMorgan is compensated by New York Life Investments.
Pursuant to an agreement between the Trust and New York Life Investments, New York Life Investments is responsible for providing or procuring certain regulatory reporting services for the Fund. The Fund will reimburse New York Life Investments for the actual costs incurred by New York Life Investments in connection with providing or procuring these services for the Fund.
(B) Distribution and Service Fees. The Trust, on behalf of the Fund, has entered into a distribution agreement with NYLIFE Distributors LLC (the “Distributor”), an affiliate of New York Life Investments. The Fund has adopted distribution plans (the “Plans”) in accordance with the provisions of Rule 12b-1 under the 1940 Act.
Pursuant to the Class A, Investor Class and Class R2 Plans, the Distributor receives a monthly fee from the Class A, Investor Class and Class R2 shares at an annual rate of 0.25% of the average daily net assets of the Class A, Investor Class and Class R2 shares for distribution and/or service activities as designated by the Distributor. Pursuant to the Class B and Class C Plans, Class B and Class C shares pay the Distributor a monthly distribution fee at an annual rate of 0.75% of the average daily net assets of the Class B and Class C shares, along with a service fee at an annual rate of 0.25% of the average daily net assets of the Class B and Class C shares, for a total 12b-1 fee of 1.00%. Pursuant to the Class R3 Plan, Class R3 shares pay the Distributor a monthly distribution fee at an annual rate of 0.25% of the average daily net assets
of the Class R3 shares, along with a service fee at an annual rate of 0.25% of the average daily net assets of the Class R3 shares, for a total 12b-1 fee of 0.50%. Class I and Class R1 shares are not subject to a distribution and/or service fee.
The Plans provide that the distribution and service fees are payable to the Distributor regardless of the amounts actually expended by the Distributor for distribution of the Fund's shares and service activities.
In accordance with the Shareholder Services Plans for the Class R1, Class R2 and Class R3 shares, the Manager has agreed to provide, through its affiliates or independent third parties, various shareholder and administrative support services to shareholders of the Class R1, Class R2 and Class R3 shares. For its services, the Manager, its affiliates or independent third-party service providers are entitled to a shareholder service fee accrued daily and paid monthly at an annual rate of 0.10% of the average daily net assets of the Class R1, Class R2 and Class R3 shares. This is in addition to any fees paid under the Class R2 and Class R3 Plans.
During the year ended October 31, 2023, shareholder service fees incurred by the Fund were as follows:
| |
| Class R1 | $ 53 |
| Class R2 | 104 |
| Class R3 | 486 |
(C) Sales Charges. The Fund was advised by the Distributor that the amount of initial sales charges retained on sales of Class A and Investor Class shares during the year ended October 31, 2023, were $7,622 and $3,966, respectively.
The Fund was also advised that the Distributor retained CDSCs on redemptions of Class A, Class B and Class C shares during the year ended October 31, 2023, of $383, $125 and $67, respectively.
(D) Transfer, Dividend Disbursing and Shareholder Servicing Agent. NYLIM Service Company LLC, an affiliate of New York Life Investments, is the Fund's transfer, dividend disbursing and shareholder servicing agent pursuant to an agreement between NYLIM Service Company LLC and the Trust. NYLIM Service Company LLC has entered into an agreement with SS&C Global Investor & Distribution Solutions, Inc. ("SS&C"), pursuant to which SS&C performs certain transfer agent services on behalf of NYLIM Service Company LLC. New York Life Investments has contractually agreed to limit the transfer agency expenses charged to the Fund’s share classes to a maximum of 0.35% of that share class’s average daily net assets on an annual basis after deducting any applicable Fund or class-level expense reimbursement or small account fees. This agreement will remain in effect until February 28, 2024, and shall renew automatically for one-year terms unless New York Life Investments provides written notice of termination prior to the start of the next term or upon approval of the Board. During the year ended October 31, 2023, transfer agent expenses incurred by the Fund
| 24 | MainStay WMC Small Companies Fund |
and any reimbursements, pursuant to the aforementioned Transfer Agency expense limitation agreement, were as follows:
| Class | Expense | Waived |
| Class A | $108,516 | $ — |
| Investor Class | 190,403 | (73,158) |
| Class B | 8,418 | (3,280) |
| Class C | 10,902 | (4,216) |
| Class I | 120,702 | — |
| Class R1 | 47 | — |
| Class R2 | 91 | — |
| Class R3 | 428 | — |
(E) Small Account Fee. Shareholders with small accounts adversely impact the cost of providing transfer agency services. In an effort to reduce total transfer agency expenses, the Fund has implemented a small account fee on certain types of accounts. As described in the Fund's prospectus, certain shareholders with an account balance of less than $1,000 ($5,000 for Class A share accounts) are charged an annual per account fee of $20 (assessed semi-annually), the proceeds from which offset transfer agent fees as reflected in the Statement of Operations. This small account fee will not apply to certain types of accounts as described further in the Fund’s prospectus.
(F) Capital. As of October 31, 2023, New York Life and its affiliates beneficially held shares of the Fund with the values and percentages of net assets as follows:
| Class R1 | $46,889 | 100.0% |
| Class R2 | 45,582 | 53.3 |
| Class R3 | 31,234 | 6.9 |
Note 4-Federal Income Tax
As of October 31, 2023, the cost and unrealized appreciation (depreciation) of the Fund’s investment portfolio, including applicable derivative contracts and other financial instruments, as determined on a federal income tax basis, were as follows:
| | Federal Tax
Cost | Gross
Unrealized
Appreciation | Gross
Unrealized
(Depreciation) | Net
Unrealized
Appreciation/
(Depreciation) |
| Investments in Securities | $266,964,099 | $17,503,169 | $(47,070,223) | $(29,567,054) |
As of October 31, 2023, the components of accumulated gain (loss) on a tax basis were as follows:
Ordinary
Income | Accumulated
Capital
and Other
Gain (Loss) | Other
Temporary
Differences | Unrealized
Appreciation
(Depreciation) | Total
Accumulated
Gain (Loss) |
| $539,023 | $(59,553,662) | $— | $(29,567,054) | $(88,581,693) |
The difference between book-basis and tax-basis unrealized appreciation (depreciation) is primarily due to wash sale adjustments.
As of October 31, 2023, for federal income tax purposes, capital loss carryforwards of $59,553,662, as shown in the table below, were available to the extent provided by the regulations to offset future realized gains of the Fund. Accordingly, no capital gains distributions are expected to be paid to shareholders until net gains have been realized in excess of such amounts.
Capital Loss
Available Through | Short-Term
Capital Loss
Amounts (000’s) | Long-Term
Capital Loss
Amounts (000’s) |
| Unlimited | $36,562 | $22,991 |
During the years ended October 31, 2023 and October 31, 2022, the tax character of distributions paid as reflected in the Statements of Changes in Net Assets was as follows:
| | 2023 | 2022 |
| Distributions paid from: | | |
| Ordinary Income | $6,711,470 | $66,488,654 |
| Long-Term Capital Gains | — | 26,694,472 |
| Total | $6,711,470 | $93,183,126 |
Note 5–Custodian
JPMorgan is the custodian of cash and securities held by the Fund. Custodial fees are charged to the Fund based on the Fund's net assets and/or the market value of securities held by the Fund and the number of certain transactions incurred by the Fund.
Note 6–Line of Credit
The Fund and certain other funds managed by New York Life Investments maintain a line of credit with a syndicate of banks in order to secure a source of funds for temporary purposes to meet unanticipated or excessive redemption requests.
Effective July 25, 2023, under the credit agreement (the “Credit Agreement”), the aggregate commitment amount is $600,000,000 with an additional uncommitted amount of $100,000,000. The commitment fee is an annual rate of 0.15% of the average commitment amount payable quarterly, regardless of usage, to JPMorgan, who serves as the agent to the syndicate. The commitment fee is allocated among the Fund and certain other funds managed by New York Life Investments based upon their respective net assets and other factors. Interest on any revolving credit loan is charged based upon the Federal Funds Rate, Daily Simple Secured Overnight Financing Rate ("SOFR") + 0.10%, or the Overnight Bank Funding Rate, whichever is higher. The Credit Agreement expires on July 23, 2024, although the Fund, certain other funds managed by New York Life Investments and the syndicate of banks may renew the Credit Agreement for an additional year on the same or different terms or enter into a credit agreement with a different syndicate of banks. Prior to July 25, 2023, the aggregate commitment amount and the commitment fee were the same as those under the current Credit
Notes to Financial Statements (continued)
Agreement. During the year ended October 31, 2023, there were no borrowings made or outstanding with respect to the Fund under the Credit Agreement.
Note 7–Interfund Lending Program
Pursuant to an exemptive order issued by the SEC, the Fund, along with certain other funds managed by New York Life Investments, may participate in an interfund lending program. The interfund lending program provides an alternative credit facility that permits the Fund and certain other funds managed by New York Life Investments to lend or borrow money for temporary purposes directly to or from one another, subject to the conditions of the exemptive order. During the year ended October 31, 2023, there were no interfund loans made or outstanding with respect to the Fund.
Note 8–Purchases and Sales of Securities (in 000’s)
During the year ended October 31, 2023, purchases and sales of securities, other than short-term securities, were $255,313 and $312,165, respectively.
Note 9–Capital Share Transactions
Transactions in capital shares for the years ended October 31, 2023 and October 31, 2022, were as follows:
| Class A | Shares | Amount |
| Year ended October 31, 2023: | | |
| Shares sold | 179,482 | $ 3,701,988 |
| Shares issued to shareholders in reinvestment of distributions | 129,424 | 2,648,022 |
| Shares redeemed | (952,509) | (19,262,672) |
| Net increase (decrease) in shares outstanding before conversion | (643,603) | (12,912,662) |
| Shares converted into Class A (See Note 1) | 76,200 | 1,526,234 |
| Shares converted from Class A (See Note 1) | (1,151) | (21,412) |
| Net increase (decrease) | (568,554) | $(11,407,840) |
| Year ended October 31, 2022: | | |
| Shares sold | 329,365 | $ 7,991,655 |
| Shares issued to shareholders in reinvestment of distributions | 1,699,563 | 41,588,303 |
| Shares redeemed | (1,217,496) | (28,241,658) |
| Net increase (decrease) in shares outstanding before conversion | 811,432 | 21,338,300 |
| Shares converted into Class A (See Note 1) | 94,728 | 2,285,527 |
| Shares converted from Class A (See Note 1) | (458) | (11,247) |
| Net increase (decrease) | 905,702 | $ 23,612,580 |
| |
| Investor Class | Shares | Amount |
| Year ended October 31, 2023: | | |
| Shares sold | 39,579 | $ 773,245 |
| Shares issued to shareholders in reinvestment of distributions | 32,975 | 652,901 |
| Shares redeemed | (140,269) | (2,747,740) |
| Net increase (decrease) in shares outstanding before conversion | (67,715) | (1,321,594) |
| Shares converted into Investor Class (See Note 1) | 20,748 | 416,248 |
| Shares converted from Investor Class (See Note 1) | (55,525) | (1,072,506) |
| Net increase (decrease) | (102,492) | $ (1,977,852) |
| Year ended October 31, 2022: | | |
| Shares sold | 45,425 | $ 1,037,118 |
| Shares issued to shareholders in reinvestment of distributions | 464,342 | 11,004,918 |
| Shares redeemed | (145,837) | (3,241,545) |
| Net increase (decrease) in shares outstanding before conversion | 363,930 | 8,800,491 |
| Shares converted into Investor Class (See Note 1) | 26,892 | 591,576 |
| Shares converted from Investor Class (See Note 1) | (68,134) | (1,626,377) |
| Net increase (decrease) | 322,688 | $ 7,765,690 |
| |
| Class B | Shares | Amount |
| Year ended October 31, 2023: | | |
| Shares sold | 141 | $ 2,216 |
| Shares issued to shareholders in reinvestment of distributions | 1,624 | 25,812 |
| Shares redeemed | (18,236) | (283,465) |
| Net increase (decrease) in shares outstanding before conversion | (16,471) | (255,437) |
| Shares converted from Class B (See Note 1) | (46,813) | (738,418) |
| Net increase (decrease) | (63,284) | $ (993,855) |
| Year ended October 31, 2022: | | |
| Shares sold | 3,500 | $ 70,421 |
| Shares issued to shareholders in reinvestment of distributions | 58,503 | 1,115,648 |
| Shares redeemed | (28,537) | (518,983) |
| Net increase (decrease) in shares outstanding before conversion | 33,466 | 667,086 |
| Shares converted from Class B (See Note 1) | (57,645) | (1,020,393) |
| Net increase (decrease) | (24,179) | $ (353,307) |
| |
| 26 | MainStay WMC Small Companies Fund |
| Class C | Shares | Amount |
| Year ended October 31, 2023: | | |
| Shares sold | 9,911 | $ 154,126 |
| Shares issued to shareholders in reinvestment of distributions | 1,903 | 30,219 |
| Shares redeemed | (57,727) | (885,731) |
| Net increase (decrease) in shares outstanding before conversion | (45,913) | (701,386) |
| Shares converted from Class C (See Note 1) | (7,515) | (119,731) |
| Net increase (decrease) | (53,428) | $ (821,117) |
| Year ended October 31, 2022: | | |
| Shares sold | 8,614 | $ 157,446 |
| Shares issued to shareholders in reinvestment of distributions | 60,799 | 1,158,831 |
| Shares redeemed | (61,647) | (1,096,860) |
| Net increase (decrease) in shares outstanding before conversion | 7,766 | 219,417 |
| Shares converted from Class C (See Note 1) | (12,898) | (230,333) |
| Net increase (decrease) | (5,132) | $ (10,916) |
| |
| Class I | Shares | Amount |
| Year ended October 31, 2023: | | |
| Shares sold | 1,270,184 | $ 27,218,467 |
| Shares issued to shareholders in reinvestment of distributions | 150,611 | 3,236,629 |
| Shares redeemed | (3,225,001) | (69,203,429) |
| Net increase (decrease) in shares outstanding before conversion | (1,804,206) | (38,748,333) |
| Shares converted into Class I (See Note 1) | 1,094 | 21,412 |
| Shares converted from Class I (See Note 1) | (563) | (11,827) |
| Net increase (decrease) | (1,803,675) | $(38,738,748) |
| Year ended October 31, 2022: | | |
| Shares sold | 1,799,769 | $ 41,934,850 |
| Shares issued to shareholders in reinvestment of distributions | 1,424,883 | 36,590,999 |
| Shares redeemed | (1,490,542) | (38,692,716) |
| Net increase (decrease) in shares outstanding before conversion | 1,734,110 | 39,833,133 |
| Shares converted into Class I (See Note 1) | 436 | 11,247 |
| Net increase (decrease) | 1,734,546 | $ 39,844,380 |
| |
| Class R1 | Shares | Amount |
| Year ended October 31, 2023: | | |
| Shares issued to shareholders in reinvestment of distributions | 54 | $ 1,147 |
| Net increase (decrease) | 54 | $ 1,147 |
| Year ended October 31, 2022: | | |
| Shares issued to shareholders in reinvestment of distributions | 576 | $ 14,689 |
| Net increase (decrease) | 576 | $ 14,689 |
| |
| Class R2 | Shares | Amount |
| Year ended October 31, 2023: | | |
| Shares sold | 224 | $ 4,376 |
| Shares issued to shareholders in reinvestment of distributions | 104 | 2,109 |
| Shares redeemed | (587) | (12,187) |
| Net increase (decrease) | (259) | $ (5,702) |
| Year ended October 31, 2022: | | |
| Shares sold | 135 | $ 3,044 |
| Shares issued to shareholders in reinvestment of distributions | 1,246 | 30,236 |
| Shares redeemed | (160) | (3,306) |
| Net increase (decrease) | 1,221 | $ 29,974 |
| |
| Class R3 | Shares | Amount |
| Year ended October 31, 2023: | | |
| Shares sold | 5,042 | $ 99,472 |
| Shares issued to shareholders in reinvestment of distributions | 403 | 8,061 |
| Shares redeemed | (2,424) | (48,392) |
| Net increase (decrease) | 3,021 | $ 59,141 |
| Year ended October 31, 2022: | | |
| Shares sold | 4,588 | $ 103,472 |
| Shares issued to shareholders in reinvestment of distributions | 4,849 | 116,270 |
| Shares redeemed | (1,630) | (33,621) |
| Net increase (decrease) | 7,807 | $ 186,121 |
Note 10–Other Matters
As of the date of this report, the Fund faces a heightened level of risk associated with current uncertainty, volatility and state of economies, financial markets, rising interest rates, and labor and health conditions around the world. Events such as war, acts of terrorism, recessions, rapid inflation, the imposition of international sanctions, earthquakes, hurricanes, epidemics and pandemics and other unforeseen natural or human disasters may have broad adverse social, political and economic effects on the global economy, which could negatively impact the value of the Fund's investments. Developments that disrupt global economies and financial markets may magnify factors that affect the Fund's performance.
Note 11–Subsequent Events
In connection with the preparation of the financial statements of the Fund as of and for the year ended October 31, 2023, events and transactions subsequent to October 31, 2023, through the date the financial statements were issued, have been evaluated by the Manager for possible adjustment and/or disclosure. No subsequent events requiring financial statement adjustment or disclosure have been identified.
Report of Independent Registered Public Accounting Firm
To the Shareholders of the Fund and Board of Trustees
MainStay Funds Trust:
Opinion on the Financial Statements
We have audited the accompanying statement of assets and liabilities of MainStay WMC Small Companies Fund (the Fund), one of the funds constituting MainStay Funds Trust, including the portfolio of investments, as of October 31, 2023, the related statement of operations for the year then ended, the statements of changes in net assets for each of the years in the two-year period then ended, and the related notes (collectively, the financial statements) and the financial highlights for each of the years in the five-year period then ended. In our opinion, the financial statements and financial highlights present fairly, in all material respects, the financial position of the Fund as of October 31, 2023, the results of its operations for the year then ended, the changes in its net assets for each of the years in the two-year period then ended, and the financial highlights for each of the years in the five-year period then ended, in conformity with U.S. generally accepted accounting principles.
Basis for Opinion
These financial statements and financial highlights are the responsibility of the Fund's management. Our responsibility is to express an opinion on these financial statements and financial highlights based on our audits. We are a public accounting firm registered with the Public Company Accounting Oversight Board (United States) (PCAOB) and are required to be independent with respect to the Fund in accordance with the U.S. federal securities laws and the applicable rules and regulations of the Securities and Exchange Commission and the PCAOB.
We conducted our audits in accordance with the standards of the PCAOB. Those standards require that we plan and perform the audit to obtain reasonable assurance about whether the financial statements and financial highlights are free of material misstatement, whether due to error or fraud. Our audits included performing procedures to assess the risks of material misstatement of the financial statements and financial highlights, whether due to error or fraud, and performing procedures that respond to those risks. Such procedures included examining, on a test basis, evidence regarding the amounts and disclosures in the financial statements and financial highlights. Such procedures also included confirmation of securities owned as of October 31, 2023, by correspondence with custodians, the transfer agent and brokers; when replies were not received from brokers, we performed other auditing procedures. Our audits also included evaluating the accounting principles used and significant estimates made by management, as well as evaluating the overall presentation of the financial statements and financial highlights. We believe that our audits provide a reasonable basis for our opinion.

We have served as the auditor of one or more New York Life Investment Management investment companies since 2003.
Philadelphia, Pennsylvania
December 22, 2023
| 28 | MainStay WMC Small Companies Fund |
Federal Income Tax Information
(Unaudited)
The Fund is required under the Internal Revenue Code to advise shareholders in a written statement as to the federal tax status of dividends paid by the Fund during such fiscal years.
For the fiscal year ended October 31, 2023, the Fund designated approximately $4,150,664 under the Internal Revenue Code as qualified dividend income eligible for reduced tax rates.
The dividends paid by the Fund during the fiscal year ended October 31, 2023 should be multiplied by 58.62% to arrive at the amount eligible for the corporate dividend-received deduction.
In February 2024, shareholders will receive an IRS Form 1099-DIV or substitute Form 1099, which will show the federal tax status of the distributions received by shareholders in calendar year 2023. The amounts that will be reported on such 1099-DIV or substitute Form 1099 will be the amounts you are to use on your federal income tax return and will differ from the amounts which we must report for the Fund's fiscal year ended October 31, 2023.
Proxy Voting Policies and Procedures and Proxy Voting Record
The Fund is required to file with the SEC its proxy voting record for the 12-month period ending June 30 on Form N-PX. A description of the policies and procedures that are used to vote proxies relating to portfolio securities of the Fund is available free of charge upon request by calling 800-624-6782 or visiting the SEC’s website at www.sec.gov. The most recent Form N-PX or proxy voting record is available free of charge upon request by calling 800-624-6782; visiting newyorklifeinvestments.com; or visiting the SEC’s website at www.sec.gov.
Shareholder Reports and Quarterly Portfolio Disclosure
The Fund is required to file its complete schedule of portfolio holdings with the SEC 60 days after its first and third fiscal quarter on Form N-PORT. The Fund's holdings report is available free of charge upon request by calling New York Life Investments at 800-624-6782.
Board of Trustees and Officers (Unaudited)
The Trustees and officers of the Fund are listed below. The Board oversees the MainStay Group of Funds (which consists of MainStay Funds and MainStay Funds Trust), MainStay VP Funds Trust, MainStay MacKay DefinedTerm Municipal Opportunities Fund, MainStay CBRE Global Infrastructure Megatrends Term Fund, the Manager and the Subadvisors, and elects the officers of the Funds who are responsible for the day-to-day operations of the Fund. Information pertaining to the Trustees and officers is set forth below. Each Trustee serves until his or her successor is elected and qualified or until his or her resignation, death or
removal. Under the Board’s retirement policy, unless an exception is made, a Trustee must tender his or her resignation by the end of the calendar year during which he or she reaches the age of 75. Officers are elected annually by the Board. The business address of each Trustee and officer listed below is 51 Madison Avenue, New York, New York 10010. A majority of the Trustees are not “interested persons” (as defined by the 1940 Act and rules adopted by the SEC thereunder) of the Fund (“Independent Trustees”).
| | Name and
Year of Birth | Term of Office,
Position(s) Held and
Length of Service | Principal Occupation(s)
During Past Five Years | Number of
Portfolios in
Fund Complex
Overseen by
Trustee | Other Directorships
Held by Trustee |
| | | | | | |
| | Naïm Abou-Jaoudé*
1966 | MainStay Funds: Trustee
since 2023
MainStay Funds Trust:
Trustee since 2023 | Chief Executive Officer of New York Life Investment Management LLC (since 2023). Chief Executive Officer of Candriam (an affiliate of New York Life Investment Management LLC) (2007 to 2023). | 81 | MainStay VP Funds Trust:
Trustee since 2023 (31 portfolios);
MainStay MacKay DefinedTerm Municipal Opportunities Fund: Trustee
since 2023;
MainStay CBRE Global Infrastructure Megatrends Term Fund: Trustee
since 2023; and
New York Life Investment Management International (Chair) since 2015 |
| * | This Trustee is considered to be an “interested person” of the MainStay Group of Funds, MainStay VP Funds Trust, MainStay CBRE Global Infrastructure Megatrends Term Fund and MainStay MacKay DefinedTerm Municipal Opportunities Fund, within the meaning of the 1940 Act because of his affiliation with New York Life Investment Management LLC and Candriam, as described in detail above in the column entitled “Principal Occupation(s) During Past Five Years.” |
| | |
| 30 | MainStay WMC Small Companies Fund |
| | Name and
Year of Birth | Term of Office,
Position(s) Held and
Length of Service | Principal Occupation(s)
During Past Five Years | Number of
Portfolios in
Fund Complex
Overseen by
Trustee | Other Directorships
Held by Trustee |
| | | | | | |
| | David H. Chow
1957 | MainStay Funds: Trustee since January 2016, Advisory Board Member (June 2015 to December 2015);MainStay Funds Trust:
Trustee since January 2016, Advisory Board Member (June 2015 to December 2015) | Founder and CEO, DanCourt Management, LLC (since 1999) | 81 | MainStay VP Funds Trust: Trustee since January 2016, Advisory Board Member (June 2015 to December 2015) (31 portfolios);
MainStay MacKay DefinedTerm Municipal Opportunities Fund: Trustee since January 2016, Advisory Board Member (June 2015 to December 2015);
MainStay CBRE Global Infrastructure Megatrends Term Fund: Trustee since 2021;
VanEck Vectors Group of Exchange-Traded Funds: Trustee since 2006 and Independent Chairman of the Board of Trustees from 2008 to 2022 (57 portfolios); and
Berea College of Kentucky: Trustee since 2009, Chair of the Investment Committee since 2018 |
| | Karen Hammond
1956 | MainStay Funds: Trustee since December 2021, Advisory Board Member (June 2021 to December 2021);MainStay Funds Trust:
Trustee since December 2021, Advisory Board Member (June 2021 to December 2021)
| Retired, Managing Director, Devonshire Investors (2007 to 2013); Senior Vice President, Fidelity Management & Research Co. (2005 to 2007); Senior Vice President and Corporate Treasurer, FMR Corp. (2003 to 2005); Chief Operating Officer, Fidelity Investments Japan (2001 to 2003) | 81 | MainStay VP Funds Trust: Trustee since December 2021, Advisory Board Member (June 2021 to December 2021) (31 portfolios);
MainStay MacKay DefinedTerm Municipal Opportunities Fund: Trustee since December 2021, Advisory Board Member (June 2021 to December 2021);
MainStay CBRE Global Infrastructure Megatrends Term Fund: Trustee since December 2021, Advisory Board Member (June 2021 to December 2021);
Two Harbors Investment Corp.: Director since 2018;
Rhode Island State Investment Commission: Member since 2017; and
Blue Cross Blue Shield of Rhode Island: Director since 2019 |
| | Susan B. Kerley
1951 | MainStay Funds: Chair since January 2017 and Trustee since 2007;MainStay Funds Trust:
Chair since January 2017 and Trustee since 1990*** | President, Strategic Management Advisors LLC (since 1990) | 81 | MainStay VP Funds Trust: Chair since January 2017 and Trustee since 2007 (31 portfolios)**;
MainStay MacKay DefinedTerm Municipal Opportunities Fund: Chair since January 2017 and Trustee since 2011;
MainStay CBRE Global Infrastructure Megatrends Term Fund: Trustee since June 2021; and
Legg Mason Partners Funds: Trustee since 1991 (45 portfolios) |
Board of Trustees and Officers (Unaudited) (continued)
| | Name and
Year of Birth | Term of Office,
Position(s) Held and
Length of Service | Principal Occupation(s)
During Past Five Years | Number of
Portfolios in
Fund Complex
Overseen by
Trustee | Other Directorships
Held by Trustee |
| | | | | | |
| | Alan R. Latshaw
1951 | MainStay Funds: Trusteesince 2006;MainStay Funds Trust:
Trustee since 2007*** | Retired; Partner, Ernst & Young LLP (2002 to 2003); Partner, Arthur Andersen LLP (1989 to 2002); Consultant to the MainStay Funds Audit and Compliance Committee (2004 to 2006) | 81 | MainStay VP Funds Trust: Trustee since 2007 (31 portfolios)**;
MainStay MacKay DefinedTerm Municipal Opportunities Fund: Trustee since 2011; and
MainStay CBRE Global Infrastructure Megatrends Term Fund: Trustee since June 2021 |
| | Jacques P. Perold
1958 | MainStay Funds: Trustee since January 2016, Advisory Board Member (June 2015to December 2015);MainStay Funds Trust:
Trustee since January 2016, Advisory Board Member (June 2015 to December 2015) | Founder and Chief Executive Officer, CapShift Advisors LLC (since 2018); President, Fidelity Management & Research Company (2009 to 2014); President and Chief Investment Officer, Geode Capital Management, LLC (2001 to 2009) | 81 | MainStay VP Funds Trust: Trustee since January 2016, Advisory Board Member (June 2015 to December 2015) (31 portfolios);
MainStay MacKay DefinedTerm Municipal Opportunities Fund: Trustee since January 2016, Advisory Board Member (June 2015 to December 2015);
MainStay CBRE Global Infrastructure Megatrends Term Fund: Trustee since June 2021;
Allstate Corporation: Director since 2015; and
MSCI Inc.: Director since 2017 |
| | Richard S. Trutanic
1952 | MainStay Funds: Trustee since 1994;MainStay Funds Trust:
Trustee since 2007*** | Chairman and Chief Executive Officer, Somerset & Company (financial advisory firm) (since 2004); Managing Director, The Carlyle Group (private investment firm) (2002 to 2004); Senior Managing Director, Partner and Board Member, Groupe Arnault S.A. (private investment firm) (1999 to 2002) | 81 | MainStay VP Funds Trust: Trustee since 2007 (31 portfolios)**;
MainStay MacKay DefinedTerm Municipal Opportunities Fund: Trustee since 2011; and
MainStay CBRE Global Infrastructure Megatrends Term Fund: Trustee since June 2021 |
| ** | Includes prior service as a Director of MainStay VP Series Fund, Inc., the predecessor to MainStay VP Funds Trust. |
| *** | Includes prior service as a Director/Trustee of certain predecessor entities to MainStay Funds Trust. |
| 32 | MainStay WMC Small Companies Fund |
| | Name and
Year of Birth | Position(s) Held and
Length of Service | Principal Occupation(s)
During Past Five Years | |
| | | | | |
| | Kirk C. Lehneis
1974 | President, MainStay Funds, MainStay Funds Trust (since 2017) | Chief Operating Officer and Senior Managing Director (since 2016), New York Life Investment Management LLC and New York Life Investment Management Holdings LLC; Member of the Board of Managers (since 2017) and Senior Managing Director (since 2018), NYLIFE Distributors LLC; Chairman of the Board and Senior Managing Director, NYLIM Service Company LLC (since 2017); Trustee, President and Principal Executive Officer of IndexIQ Trust, IndexIQ ETF Trust and IndexIQ Active ETF Trust (since 2018); President, MainStay CBRE Global Infrastructure Megatrends Term Fund (since 2021), MainStay MacKay DefinedTerm Municipal Opportunities Fund and MainStay VP Funds Trust (since 2017)**; Senior Managing Director, Global Product Development (2015 to 2016); Managing Director, Product Development (2010 to 2015), New York Life Investment Management LLC | |
| | Jack R. Benintende
1964 | Treasurer and Principal Financial and Accounting Officer, MainStay Funds (since 2007), MainStay Funds Trust (since 2009) | Managing Director, New York Life Investment Management LLC (since 2007); Treasurer and Principal Financial and Accounting Officer, MainStay CBRE Global Infrastructure Megatrends Term Fund (since 2021), MainStay MacKay DefinedTerm Municipal Opportunities Fund (since 2011) and MainStay VP Funds Trust (since 2007)**; and Assistant Treasurer, New York Life Investment Management Holdings LLC (2008 to 2012) | |
| | J. Kevin Gao
1967 | Secretary and Chief Legal Officer, MainStay Funds and MainStay Funds Trust (since 2010) | Managing Director and Associate General Counsel, New York Life Investment Management LLC (since 2010); Secretary and Chief Legal Officer, MainStay CBRE Global Infrastructure Megatrends Term Fund (since 2021), MainStay MacKay DefinedTerm Municipal Opportunities Fund (since 2011) and MainStay VP Funds Trust (since 2010)** | |
| | Kevin M. Gleason
1967 | Vice President and Chief Compliance Officer, MainStay Funds and MainStay Funds Trust (since June 2022) | Vice President and Chief Compliance Officer, IndexIQ Trust, IndexIQ ETF Trust and Index IQ Active ETF Trust (since June 2022); Vice President and Chief Compliance Officer, MainStay CBRE Global Infrastructure Megatrends Term Fund, MainStay VP Funds Trust and MainStay MacKay DefinedTerm Municipal Opportunities Fund (since June 2022); Senior Vice President, Voya Investment Management and Chief Compliance Officer, Voya Family of Funds (2012 to 2022) | |
| | Scott T. Harrington
1959 | Vice President— Administration, MainStay Funds (since 2005), MainStay Funds Trust (since 2009) | Managing Director, New York Life Investment Management LLC (including predecessor advisory organizations) (since 2000); Member of the Board of Directors, New York Life Trust Company (since 2009); Vice President—Administration, MainStay CBRE Global Infrastructure Megatrends Term Fund (since 2021), MainStay MacKay DefinedTerm Municipal Opportunities Fund (since 2011) and MainStay VP Funds Trust (since 2005)** | |
| * | The officers listed above are considered to be “interested persons” of the MainStay Group of Funds, MainStay VP Funds Trust, MainStay CBRE Global Infrastructure Megatrends Term Fund and MainStay MacKay DefinedTerm Municipal Opportunities Fund within the meaning of the 1940 Act because of their affiliation with the MainStay Group of Funds, New York Life Insurance Company and/or its affiliates, including New York Life Investment Management LLC, New York Life Insurance Company, NYLIM Service Company LLC, NYLIFE Securities LLC and/or NYLIFE Distributors LLC, as described in detail in the column captioned “Principal Occupation(s) During Past Five Years.” Officers are elected annually by the Board. |
| ** | Includes prior service as an Officer of MainStay VP Series Fund, Inc., the predecessor to MainStay VP Funds Trust. |
Officers of the Trust (Who are not Trustees)*
This page intentionally left blank.
Equity
U.S. Equity
MainStay Epoch U.S. Equity Yield Fund
MainStay Fiera SMID Growth Fund
MainStay PineStone U.S. Equity Fund
MainStay S&P 500 Index Fund
MainStay Winslow Large Cap Growth Fund
MainStay WMC Enduring Capital Fund
MainStay WMC Growth Fund
MainStay WMC Small Companies Fund
MainStay WMC Value Fund
International Equity
MainStay Epoch International Choice Fund
MainStay PineStone International Equity Fund
MainStay WMC International Research Equity Fund
Emerging Markets Equity
MainStay Candriam Emerging Markets Equity Fund
Global Equity
MainStay Epoch Capital Growth Fund
MainStay Epoch Global Equity Yield Fund
MainStay PineStone Global Equity Fund
Fixed Income
Taxable Income
MainStay Candriam Emerging Markets Debt Fund
MainStay Floating Rate Fund
MainStay MacKay High Yield Corporate Bond Fund
MainStay MacKay Short Duration High Yield Fund
MainStay MacKay Strategic Bond Fund
MainStay MacKay Total Return Bond Fund
MainStay MacKay U.S. Infrastructure Bond Fund
MainStay Short Term Bond Fund
Tax-Exempt Income
MainStay MacKay California Tax Free Opportunities Fund1
MainStay MacKay High Yield Municipal Bond Fund
MainStay MacKay New York Tax Free Opportunities Fund2
MainStay MacKay Short Term Municipal Fund
MainStay MacKay Strategic Municipal Allocation Fund
MainStay MacKay Tax Free Bond Fund
Money Market
MainStay Money Market Fund
Mixed Asset
MainStay Balanced Fund
MainStay Income Builder Fund
MainStay MacKay Convertible Fund
Speciality
MainStay CBRE Global Infrastructure Fund
MainStay CBRE Real Estate Fund
MainStay Cushing MLP Premier Fund
Asset Allocation
MainStay Conservative Allocation Fund
MainStay Conservative ETF Allocation Fund
MainStay Defensive ETF Allocation Fund
MainStay Equity Allocation Fund
MainStay Equity ETF Allocation Fund
MainStay ESG Multi-Asset Allocation Fund
MainStay Growth Allocation Fund
MainStay Growth ETF Allocation Fund
MainStay Moderate Allocation Fund
MainStay Moderate ETF Allocation Fund
Manager
New York Life Investment Management LLC
New York, New York
Subadvisors
Candriam3
Strassen, Luxembourg
CBRE Investment Management Listed Real Assets LLC
Radnor, Pennsylvania
Cushing Asset Management, LP
Dallas, Texas
Epoch Investment Partners, Inc.
New York, New York
Fiera Capital Inc.
New York, New York
IndexIQ Advisors LLC3
New York, New York
MacKay Shields LLC3
New York, New York
NYL Investors LLC3
New York, New York
PineStone Asset Management Inc.
Montreal, Québec
Wellington Management Company LLP
Boston, Massachusetts
Winslow Capital Management, LLC
Minneapolis, Minnesota
Legal Counsel
Dechert LLP
Washington, District of Columbia
Independent Registered Public Accounting Firm
KPMG LLP
Philadelphia, Pennsylvania
Distributor
NYLIFE Distributors LLC3
Jersey City, New Jersey
Custodian
JPMorgan Chase Bank, N.A.
New York, New York
1.
This Fund is registered for sale in AZ, CA, NV, OR, TX, UT, WA and MI (Class A and Class I shares only), and CO, FL, GA, HI, ID, MA, MD, NH, NJ and NY (Class I shares only).
| 2. | This Fund is registered for sale in CA, CT, DE, FL, MA, NJ, NY and VT. |
| 3. | An affiliate of New York Life Investment Management LLC. |
Not part of the Annual Report
For more information
800-624-6782
newyorklifeinvestments.com
“New York Life Investments” is both a service mark, and the common trade name, of certain investment advisors affiliated with New York Life Insurance Company. The MainStay Funds® are managed by New York Life Investment Management LLC and distributed by NYLIFE Distributors LLC, 30 Hudson Street, Jersey City, NJ 07302, a wholly owned subsidiary of New York Life Insurance Company. NYLIFE Distributors LLC is a Member FINRA/SIPC.
©2023 NYLIFE Distributors LLC. All rights reserved.
| 5013935MS139-23 | MSWSC11-12/23 |
(NYLIM) NL531
MainStay MacKay Short Term Municipal Fund
Message from the President and Annual Report
October 31, 2023
Special Notice:
Beginning in July 2024, new regulations issued by the Securities and Exchange Commission (SEC) will take effect requiring open-end mutual fund companies and ETFs to (1) overhaul the content of their shareholder reports and (2) mail paper copies of the new tailored shareholder reports to shareholders who have not opted to receive these documents electronically.
If you have not yet elected to receive your shareholder reports electronically, please contact your financial intermediary or visit newyorklifeinvestments.com/accounts.
| Not FDIC/NCUA Insured | Not a Deposit | May Lose Value | No Bank Guarantee | Not Insured by Any Government Agency |
This page intentionally left blank
Message from the President
Interest rates and inflation were the primary forces driving market behavior during the six-month reporting period ended October 31, 2023, with equity indices delivering mixed performance while bond indices generally declined.
U.S. inflation levels, as measured by the Consumer Price Index, ranged between 3.0% and 4.0% throughout the reporting period, down from the peak of 9.1% in June 2022, although well above the 2.0% target set by the U.S. Federal Reserve (the “Fed”). At the same time, the benchmark federal funds rate climbed to over 5%, its highest level since the financial crisis of 2007, as the Fed attempted to drive inflation still lower. Comments from Fed members reinforced the central bank’s hawkish stance in response to surprisingly robust U.S. economic growth and rising wage pressures, thus increasing the likelihood that interest rates would stay higher for longer. International developed markets exhibited similar dynamics of persistently elevated inflation and rising interest rates.
Against a backdrop of high interest rates, political dysfunction in Washington D.C. and intensifying global geopolitical instability—including the ongoing war in Ukraine and the outbreak of hostilities in the Middle East—equity markets struggled to advance. The S&P 500® Index, a widely regarded benchmark of large-cap U.S. market performance, eked out a slight gain, bolstered by the strong performance of mega-cap, growth-oriented, technology-related shares as investors flocked to companies creating the infrastructure for developments in artificial intelligence. However, smaller-cap stocks and value-oriented shares trended lower. Among industry sectors, information technology posted the strongest gains, followed by consumer discretionary, which rose in response to healthy consumer spending trends, while energy shares benefited from rising petroleum prices. All other sectors lost ground. Utilities declined most sharply as rising interest rates undermined the appeal of high-yielding stocks, while real estate came under pressure from
rising mortgage rates and weak levels of office occupancy, and consumer staples declined as market sentiment turned away from defensive, value-oriented businesses. International equities broadly trailed their U.S. counterparts as economic growth in the rest of world generally lagged that of the United States, and as the U.S. dollar rose in value compared to most other global currencies.
Bond prices were driven lower by rising yields and increasing expectations of high interest rates for an extended period of time. The U.S. yield curve steepened, with the 30-year Treasury yield exceeding 5% for the first time in more than a decade. The yield curve remained inverted, with the 10-year Treasury yield ending the period at 4.88%, compared with 5.07% for the 2-year Treasury yield. Corporate bonds outperformed long-term Treasury bonds, but still trended lower under pressure from rising yields and an uptick in default rates. Among corporates, lower-credit-quality instruments performed relatively well compared to their higher-credit-quality counterparts, while floating rate securities performed better still.
In the face of today’s uncertain market environment, New York Life Investments remains dedicated to providing the guidance, resources and investment solutions you need to pursue your financial goals.
Thank you for trusting us to help meet your investment needs.
Sincerely,
Kirk C. Lehneis
President
The opinions expressed are as of the date of this report and are subject to change. There is no guarantee that any forecast made will come to pass. This material does not constitute investment advice and is not intended as an endorsement of any specific investment. Past performance is no guarantee of future results.
Not part of the Annual Report
Investors should refer to the Fund’s Summary Prospectus and/or Prospectus and consider the Fund’s investment objectives, strategies, risks, charges and expenses carefully before investing. The Summary Prospectus and/or Prospectus contain this and other information about the Fund. You may obtain copies of the Fund’s Summary Prospectus, Prospectus and Statement of Additional Information, which includes information about the MainStay Funds Trust's Trustees, free of charge, upon request, by calling toll-free 800-624-6782, by writing to NYLIFE Distributors LLC, Attn: MainStay Marketing Department, 30 Hudson Street, Jersey City, NJ 07302 or by sending an e-mail to MainStayShareholderServices@nylim.com. These documents are also available via the MainStay Funds’ website at newyorklifeinvestments.com. Please read the Fund’s Summary Prospectus and/or Prospectus carefully before investing.
Investment and Performance Comparison (Unaudited)
Performance data quoted represents past performance. Past performance is no guarantee of future results. Because of market volatility and other factors, current performance may be lower or higher than the figures shown. Investment return and principal value will fluctuate, and as a result, when shares are redeemed, they may be worth more or less than their original cost. The graph below depicts the historical performance of Class I shares of the Fund. Performance will vary from class to class based on differences in class-specific expenses and sales charges. For performance information current to the most recent month-end, please call 800-624-6782 or visit newyorklifeinvestments.com.
The performance table and graph do not reflect the deduction of taxes that a shareholder would pay on distributions or Fund share redemptions. Total returns reflect maximum applicable sales charges as indicated in the table below, if any, changes in share price, and reinvestment of dividend and capital gain distributions. The graph assumes the initial investment amount shown below and reflects the deduction of all sales charges that would have applied for the period of investment. Performance figures may reflect certain fee waivers and/or expense limitations, without which total returns may have been lower. For more information on share classes and current fee waivers and/or expense limitations (if any), please refer to the Notes to Financial Statements.
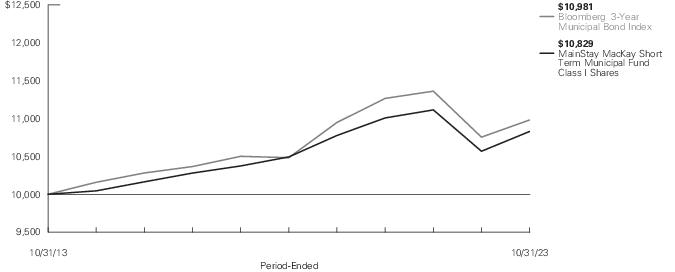
| Average Annual Total Returns for the Period-Ended October 31, 2023 |
| Class | Sales Charge | | Inception
Date1 | Six
Months2 | One
Year | Five
Years | Ten Years
or Since
Inception | Gross
Expense
Ratio3 |
| Class A Shares | Maximum 1.00% Initial Sales Charge | With sales charges | 1/2/2004 | -1.73% | 1.16% | 0.15% | 0.21% | 0.68% |
| | | Excluding sales charges | | -0.73 | 2.18 | 0.35 | 0.51 | 0.68 |
| Class A2 Shares | Maximum 2.00% Initial Sales Charge | With sales charges | 9/30/2020 | -2.72 | 0.02 | N/A | -1.46 | 0.68 |
| | | Excluding sales charges | | -0.73 | 2.06 | N/A | -0.81 | 0.68 |
| Investor Class Shares4, 5 | Maximum 0.50% Initial Sales Charge | With sales charges | 2/28/2008 | -1.38 | 1.23 | -0.20 | -0.16 | 1.30 |
| | | Excluding sales charges | | -0.89 | 1.74 | 0.00 | 0.15 | 1.30 |
| Class I Shares | No Sales Charge | | 1/2/1991 | -0.59 | 2.47 | 0.63 | 0.80 | 0.43 |
| Class R6 Shares | No Sales Charge | | 5/2/2022 | -0.59 | 2.36 | N/A | 0.67 | 0.40 |
| 1. | Effective June 1, 2015, the Fund changed, among other things, its investment objective and principal investment strategies. Effective May 22, 2018, the Fund made further changes to, among other things, its principal investment strategies. Effective February 28, 2019, the Fund further changed its investment objective. The performance information shown in this report reflects the Fund’s prior investment objectives and principal investment strategies, as applicable. Effective at the close of business on May 1, 2023, the Fund changed its fiscal and tax year end from April 30 to October 31. |
| 2. | Not annualized. |
| 3. | The gross expense ratios presented reflect the Fund’s “Total Annual Fund Operating Expenses” from the most recent Prospectus, as supplemented, and may differ from other expense ratios disclosed in this report. |
| 4. | Prior to June 1, 2015, the maximum initial sales charge was 3.00%, which is reflected in the average annual total return figures shown. |
| 5. | From June 1, 2015 to June 30, 2020, the maximum initial sales charge was 1.00%, which is reflected in the applicable average annual total return figures shown. |
The footnotes on the next page are an integral part of the table and graph and should be carefully read in conjunction with them.
| Benchmark Performance* | Six
Months1 | One
Year | Five
Years | Ten
Years |
| Bloomberg 3-Year Municipal Bond Index2 | -0.87% | 2.11% | 0.93% | 0.94% |
| Morningstar Muni National Short Category Average3 | -0.41 | 2.42 | 0.88 | 0.82 |
| * | Returns for indices reflect no deductions for fees, expenses or taxes, except for foreign withholding taxes where applicable. Results assume reinvestment of all dividends and capital gains. An investment cannot be made directly in an index. |
| 1. | Not annualized. |
| 2. | The Bloomberg 3-Year Municipal Bond Index is the Fund's primary broad-based securities-market index for comparison purposes. The Bloomberg 3-Year Municipal Bond Index is considered representative of the broad market for investment-grade, tax-exempt bonds with a maturity range of 2-4 years. |
| 3. | The Morningstar Muni National Short Category Average is representative of funds that invest in bonds issued by state and local governments to fund public projects. The income from these bonds is generally free from federal taxes and/or from state taxes in the issuing state. To lower risk, some of these funds spread their assets across many states and sectors. Other funds buy bonds from only one state in order to get the state-tax benefit. These funds have durations of less than 4.5 years. Results are based on average total returns of similar funds with all dividends and capital gain distributions reinvested. |
The footnotes on the preceding page are an integral part of the table and graph and should be carefully read in conjunction with them.
| 6 | MainStay MacKay Short Term Municipal Fund |
Cost in Dollars of a $1,000 Investment in MainStay MacKay Short Term Municipal Fund (Unaudited)
The example below is intended to describe the fees and expenses borne by shareholders during the six-month period from May 1, 2023 to October 31, 2023, and the impact of those costs on your investment.
Example
As a shareholder of the Fund you incur two types of costs: (1) transaction costs, including exchange fees and sales charges (loads) on purchases (as applicable), and (2) ongoing costs, including management fees, distribution and/or service (12b-1) fees and other Fund expenses (as applicable). This example is intended to help you understand your ongoing costs (in dollars) of investing in the Fund and to compare these costs with the ongoing costs of investing in other mutual funds. The example is based on an investment of $1,000 made at the beginning of the six-month period and held for the entire period from May 1, 2023 to October 31, 2023.
This example illustrates your Fund’s ongoing costs in two ways:
Actual Expenses
The second and third data columns in the table below provide information about actual account values and actual expenses. You may use the information in these columns, together with the amount you invested, to estimate the expenses that you paid during the six months ended October 31, 2023. Simply divide your account value by $1,000 (for example, an
$8,600 account value divided by $1,000 = 8.6), then multiply the result by the number under the heading entitled “Expenses Paid During Period” to estimate the expenses you paid on your account during this period.
Hypothetical Example for Comparison Purposes
The fourth and fifth data columns in the table below provide information about hypothetical account values and hypothetical expenses based on the Fund’s actual expense ratio and an assumed rate of return of 5% per year before expenses, which is not the Fund’s actual return. The hypothetical account values and expenses may not be used to estimate the actual ending account balances or expenses you paid for the six-month period shown. You may use this information to compare the ongoing costs of investing in the Fund with the ongoing costs of investing in other mutual funds. To do so, compare this 5% hypothetical example with the 5% hypothetical examples that appear in the shareholder reports of the other mutual funds.
Please note that the expenses shown in the table are meant to highlight your ongoing costs only and do not reflect any transactional costs, such as exchange fees or sales charges (loads). Therefore, the fourth and fifth data columns of the table are useful in comparing ongoing costs only and will not help you determine the relative total costs of owning different funds. In addition, if these transactional costs were included, your costs would have been higher.
| Share Class | Beginning
Account
Value
5/1/23 | Ending Account
Value (Based
on Actual
Returns and
Expenses)
10/31/23 | Expenses
Paid
During
Period1 | Ending Account
Value (Based
on Hypothetical
5% Annualized
Return and
Actual Expenses)
10/31/23 | Expenses
Paid
During
Period1 | Net Expense
Ratio
During
Period2 |
| Class A Shares | $1,000.00 | $992.70 | $3.47 | $1,021.73 | $3.52 | 0.69% |
| Class A2 Shares | $1,000.00 | $992.70 | $3.47 | $1,021.73 | $3.52 | 0.69% |
| Investor Class Shares | $1,000.00 | $991.10 | $4.97 | $1,020.21 | $5.04 | 0.99% |
| Class I Shares | $1,000.00 | $994.10 | $2.01 | $1,023.19 | $2.04 | 0.40% |
| Class R6 Shares | $1,000.00 | $994.10 | $2.01 | $1,023.19 | $2.04 | 0.40% |
| 1. | Expenses are equal to the Fund’s annualized expense ratio of each class multiplied by the average account value over the period, divided by 365 and multiplied by 184 (to reflect the six-month period). The table above represents the actual expenses incurred during the six-month period. In addition to the fees and expenses which the Fund bears directly, it also indirectly bears a pro rata share of the fees and expenses of the underlying funds in which it invests. Such indirect expenses are not included in the above-reported expense figures. |
| 2. | Expenses are equal to the Fund's annualized expense ratio to reflect the six-month period. |
Portfolio Composition as of October 31, 2023 (Unaudited)
See Portfolio of Investments beginning on page 11 for specific holdings within these categories. The Fund's holdings are subject to change.
Top Ten Holdings and/or Issuers Held as of October 31, 2023 (excluding short-term investments) (Unaudited)
| 1. | Black Belt Energy Gas District, 4.00%-5.50%, due 12/1/23–11/1/53 |
| 2. | State of Illinois, 3.50%-6.00%, due 11/1/24–6/1/31 |
| 3. | Matching Fund Special Purpose Securitization Corp., 5.00%, due 10/1/25–10/1/26 |
| 4. | Pennsylvania Economic Development Financing Authority, 0.95%-4.49%, due 12/1/33–6/1/41 |
| 5. | County of King, 0.625%-4.32%, due 1/1/32–1/1/40 |
| 6. | Arizona Health Facilities Authority, 4.34%, due 1/1/46 |
| 7. | Louisiana Local Government Environmental Facilities & Community Development Authority, 3.615%-5.081%, due 2/1/29–6/1/31 |
| 8. | New Jersey Transportation Trust Fund Authority, (zero coupon)-5.00%, due 6/15/24–6/15/27 |
| 9. | State of Minnesota, 3.25%-5.00%, due 8/1/26–8/1/29 |
| 10. | Texas Municipal Gas Acquisition & Supply Corp. II, 4.433%, due 9/15/27 |
| 8 | MainStay MacKay Short Term Municipal Fund |
Portfolio Management Discussion and Analysis (Unaudited)
Questions answered by portfolio managers Robert DiMella, CFA, David Dowden, Scott Sprauer, Frances Lewis, John Lawlor and Sanjit Gill, CFA, of MacKay Shields LLC, the Fund’s Subadvisor.
How did MainStay MacKay Short Term Municipal Fund perform relative to its benchmark and peer group during the six months ended October 31, 2023?
For the six months ended October 31, 2023, Class I shares of MainStay MacKay Short Term Municipal Fund returned −0.59%, outperforming the −0.87% return of the Fund’s benchmark, the Bloomberg 3-Year Municipal Bond Index (the “Index”). Over the same period, Class I shares underperformed the −0.41% return of the Morningstar Muni National Short Category Average.1
Were there any changes to the Fund during the reporting period?
Effective August 28, 2023, Sanjit Gill was added as a portfolio manager of the Fund, and John Loffredo and Michael Petty were removed as portfolio managers of the Fund.
What factors affected the Fund’s relative performance during the reporting period?
During the reporting period, the Fund outperformed the Index due to its underweight allocation to AA-rated2 bonds, which made a positive contribution to relative performance. (Contributions take weightings and total returns into account.) Across the geographic landscape, overweight exposure to holdings from Pennsylvania and Ohio added on a relative basis, but overweight exposure to Minnesota credits offset some of these results. In addition, underweight exposure to 5% coupon bonds was additive to relative returns, while overweight exposure to bonds with remaining maturities between 4 and 8 years weakened performance on a relative basis. Also, the Fund engaged in significant tax-loss harvesting. This created losses that can be carried forward to offset future gains in the Fund. This activity also resulted in creating a higher book yield for the Fund.
During the reporting period, how was the Fund’s performance materially affected by investments in derivatives?
The Fund’s performance was not materially affected by investments in derivatives during the reporting period.
What was the Fund’s duration3 strategy during the reporting period?
As relative value investors, the management team aims to keep the Fund’s duration within a neutral range relative to that of the Index. As of October 31, 2023, the Fund's modified duration to worst4 was 2.04 years while the Index’s modified duration to worst was 2.44 years.
During the reporting period, which sectors were the strongest positive contributors to the Fund’s relative performance and which sectors were particularly weak?
Across sectors, underweight exposure to education and hospital, as well as overweight exposure to prerefunded/ETM (escrowed to maturity) holdings contributed positively to relative results. Conversely, security selection among local general obligation holdings and overweight exposure to the electric sector weakened relative results.
What were some of the Fund’s significant purchases and sales during the reporting period?
As the Fund remains focused on diversification and liquidity, no individual purchase or sale would have been considered significant, although sector overweights or security structure, in their entirety, did have an impact.
How did the Fund’s sector weighting change during the reporting period?
During the reporting period, there were no material changes to the weightings in the Fund. There was an increase in exposure to the state general obligation and housing sectors. We added to the Fund’s holdings of traditional municipal bonds, including bonds backed by the taxing power of general obligation issuers or secured by the revenues of essential service providers, due to their generally strong, resilient profiles. In addition, there was an increase in exposure to AAA-rated5 bonds during the reporting period. We increased the Fund’s exposure to high-quality credits as we believe they are in relatively strong financial condition and were available at much higher yields. Conversely, there was a
| 1. | See "Investment and Performance Comparison" for other share class returns, which may be higher or lower than Class I share returns, and for more information on benchmark and peer group returns. |
| 2. | An obligation rated ‘AA’ by Standard & Poor’s (“S&P”) is deemed by S&P to differ from the highest-rated obligations only to a small degree. In the opinion of S&P, the obligor's capacity to meet its financial commitment on the obligation is very strong. When applied to Fund holdings, ratings are based solely on the creditworthiness of the bonds in the portfolio and are not meant to represent the security or safety of the Fund. |
| 3. | Duration is a measure of the price sensitivity of a fixed-income investment to changes in interest rates. Duration is expressed as a number of years and is considered a more accurate sensitivity gauge than average maturity. |
| 4. | Modified duration is inversely related to the approximate percentage change in price for a given change in yield. Duration to worst is the duration of a bond computed using the bond’s nearest call date or maturity. This measure ignores future cash flow fluctuations due to embedded optionality. |
| 5. | An obligation rated ‘AAA’ has the highest rating assigned by S&P, and in the opinion of S&P, the obligor’s capacity to meet its financial commitment on the obligation is extremely strong. When applied to Fund holdings, ratings are based solely on the creditworthiness of the bonds in the portfolio and are not meant to represent the security or safety of the Fund. |
decrease in the Fund’s sector exposure to education and transportation.
How was the Fund positioned at the end of the reporting period?
As of October 31, 2023, the Fund held overweight positions relative to the Index in the IDR/PCR (industry development revenue/pollution control revenue), and housing sectors, as well as to bonds rated AAA. From a geographic perspective, the Fund held overweight exposure to bonds from Alabama. Despite increasing exposure to the state general obligation sector over the reporting period, the Fund still held an underweight exposure to the sector at the end of the reporting period. As of the same date, the Fund held underweight exposure to the prerefunded/ETM and state general obligation sectors, bonds from California and AA-rated bonds.
The opinions expressed are those of the portfolio managers as of the date of this report and are subject to change. There is no guarantee that any forecasts will come to pass. This material does not constitute investment advice and is not intended as an endorsement of any specific investment.
| 10 | MainStay MacKay Short Term Municipal Fund |
Portfolio of Investments October 31, 2023†^
| | Principal
Amount | Value |
| Municipal Bonds 98.4% |
| Long-Term Municipal Bonds 97.1% |
| Alabama 7.1% |
| Alabama Community College System, Coastal Alabama Community College, Revenue Bonds | | |
| Insured: BAM | | |
| 4.00%, due 10/1/27 | $ 500,000 | $ 498,223 |
| Alabama Housing Finance Authority, Capstone at Kinsey Cove LP, Revenue Bonds | | |
| Series A | | |
| 3.875%, due 12/1/23 | 1,000,000 | 999,243 |
| Black Belt Energy Gas District, Gas Project, Revenue Bonds | | |
| Series B-1 | | |
| 4.00%, due 4/1/53 (a) | 3,920,000 | 3,757,683 |
| Series B | | |
| 4.74%, due 4/1/53 | 15,195,000 | 14,914,921 |
| Series C-1 | | |
| 5.25%, due 12/1/23 | 530,000 | 530,250 |
| Series C-1 | | |
| 5.25%, due 6/1/25 | 615,000 | 620,040 |
| Series C-1 | | |
| 5.25%, due 12/1/25 | 880,000 | 889,662 |
| Series F | | |
| 5.50%, due 11/1/53 (a) | 10,000,000 | 10,122,443 |
| Black Belt Energy Gas District, Gas Project No.7, Revenue Bonds | | |
| Series C-2 | | |
| 4.44%, due 10/1/52 | 1,305,000 | 1,271,706 |
| City of Decatur, Limited General Obligation | | |
| Series A | | |
| 2.00%, due 10/1/26 | 1,900,000 | 1,744,648 |
| Energy Southeast, A Cooperative District, Revenue Bonds | | |
| Series A-1 | | |
| 5.50%, due 11/1/53 (a) | 1,510,000 | 1,536,561 |
| Southeast Alabama Gas Supply District (The), Project No. 1, Revenue Bonds | | |
| Series B | | |
| 4.538%, due 4/1/49 | 3,500,000 | 3,497,397 |
| Series C | | |
| 4.74%, due 4/1/49 | 3,000,000 | 2,999,999 |
| Series A | | |
| 5.00%, due 4/1/24 | 1,500,000 | 1,500,859 |
| | Principal
Amount | Value |
| |
| Alabama (continued) |
| Southeast Energy Authority, A Cooperative District, Project No. 4, Revenue Bonds | | |
| Series B-1 | | |
| 5.00%, due 5/1/53 (a) | $ 1,870,000 | $ 1,852,638 |
| Southeast Energy Authority, A Cooperative District, Project No. 3, Revenue Bonds | | |
| Series A-1 | | |
| 5.50%, due 1/1/53 (a) | 10,000,000 | 10,153,473 |
| State of Alabama, Unlimited General Obligation | | |
| Series A | | |
| 3.00%, due 8/1/26 | 5,000,000 | 4,817,075 |
| | | 61,706,821 |
| Arizona 2.6% |
| Arizona Health Facilities Authority, Banner Health, Revenue Bonds | | |
| Series B | | |
| 4.34%, due 1/1/46 | 12,600,000 | 12,380,513 |
| City of Phoenix Civic Improvement Corp., Airport, Revenue Bonds, Junior Lien | | |
| Series B | | |
| 5.00%, due 7/1/26 (b) | 3,500,000 | 3,550,319 |
| City of Phoenix Civic Improvement Corp., Airport, Revenue Bonds, Senior Lien | | |
| 5.00%, due 7/1/29 (b) | 6,210,000 | 6,376,925 |
| | | 22,307,757 |
| Arkansas 0.2% |
| City of Fort Smith, Water & Sewer, Revenue Bonds | | |
| 3.00%, due 10/1/25 | 1,400,000 | 1,360,088 |
| California 7.1% |
| Antelope Valley Community College District, Unlimited General Obligation | | |
| (zero coupon), due 8/1/35 | 3,990,000 | 2,431,646 |
| California Community Choice Financing Authority, Clean Energy Project, Revenue Bonds | | |
| Series C | | |
| 5.25%, due 1/1/54 (a) | 4,500,000 | 4,405,403 |
The notes to the financial statements are an integral part of, and should be read in conjunction with, the financial statements.
11
Portfolio of Investments October 31, 2023†^ (continued)
| | Principal
Amount | Value |
| Long-Term Municipal Bonds (continued) |
| California (continued) |
| California Infrastructure & Economic Development Bank, Brightline West Passenger Rail Project, Revenue Bonds | | |
| Series A | | |
| 3.65%, due 1/1/50 (a)(b)(c) | $ 8,600,000 | $ 8,552,116 |
| California Municipal Finance Authority, Waste Management, Inc., Revenue Bonds | | |
| Series A | | |
| 4.125%, due 10/1/41 (a)(b) | 5,000,000 | 4,942,433 |
| California Statewide Communities Development Authority, Southern California Edison Co., Revenue Bonds | | |
| Series A | | |
| 1.75%, due 9/1/29 | 10,500,000 | 8,268,481 |
| City of Sacramento, North Natomas Community Facilities District No. 4, Special Tax | | |
| Series G, Insured: AGM | | |
| 5.00%, due 9/1/28 | 2,245,000 | 2,369,416 |
| Series G, Insured: AGM | | |
| 5.00%, due 9/1/29 | 2,215,000 | 2,352,615 |
| Clovis Unified School District, Unlimited General Obligation | | |
| Series A, Insured: NATL-RE | | |
| (zero coupon), due 8/1/25 | 2,500,000 | 2,327,154 |
| Corona-Norco Unified School District, Unlimited General Obligation | | |
| Series A | | |
| 5.00%, due 8/1/44 | 960,000 | 980,712 |
| Eastern Municipal Water District, Revenue Bonds | | |
| Series A | | |
| 3.00%, due 7/1/25 | 4,095,000 | 4,031,148 |
| San Diego County Regional Airport Authority, Revenue Bonds, Senior Lien (b) | | |
| Series B | | |
| 5.00%, due 7/1/28 | 1,500,000 | 1,533,045 |
| Series B | | |
| 5.00%, due 7/1/29 | 1,750,000 | 1,795,281 |
| San Diego Public Facilities Financing Authority, Water Utility, Revenue Bonds | | |
| Series B | | |
| 1.903%, due 8/1/26 | 4,640,000 | 4,239,264 |
| | Principal
Amount | Value |
| |
| California (continued) |
| San Jose Evergreen Community College District, Unlimited General Obligation | | |
| Series B | | |
| 6.649%, due 7/1/43 | $ 5,000,000 | $ 4,930,352 |
| Saratoga Union School District, Unlimited General Obligation | | |
| Insured: NATL-RE | | |
| (zero coupon), due 9/1/26 | 6,500,000 | 5,813,484 |
| State of California, Various Purpose, Unlimited General Obligation | | |
| 1.75%, due 11/1/30 | 1,375,000 | 1,079,455 |
| Tobacco Securitization Authority of Southern California, San Diego County Tobacco Asset Securitization Corp., Asset-Backed, Revenue Bonds | | |
| Series A, Class 1 | | |
| 5.00%, due 6/1/24 | 1,710,000 | 1,717,619 |
| | | 61,769,624 |
| Colorado 1.6% |
| Arapahoe County School District No. 5, Cherry Creek, Unlimited General Obligation | | |
| Series B, Insured: State Aid Withholding | | |
| 2.00%, due 12/15/26 | 5,000,000 | 4,565,083 |
| Colorado Bridge Enterprise, Central 70 Project, Revenue Bonds | | |
| 4.00%, due 6/30/27 (b) | 4,475,000 | 4,329,801 |
| Colorado Health Facilities Authority, Liberty Heights, Revenue Bonds | | |
| Series B | | |
| (zero coupon), due 7/15/24 | 1,050,000 | 1,020,373 |
| E-470 Public Highway Authority, Revenue Bonds | | |
| Series B, Insured: NATL-RE | | |
| (zero coupon), due 9/1/25 | 4,500,000 | 4,160,733 |
| | | 14,075,990 |
| Connecticut 1.1% |
| City of Hartford, Unlimited General Obligation | | |
| Series B, Insured: AGM State Guaranteed | | |
| 5.00%, due 10/1/24 | 1,380,000 | 1,394,320 |
The notes to the financial statements are an integral part of, and should be read in conjunction with, the financial statements.
| 12 | MainStay MacKay Short Term Municipal Fund |
| | Principal
Amount | Value |
| Long-Term Municipal Bonds (continued) |
| Connecticut (continued) |
| Connecticut State Health & Educational Facilities Authority, Yale University, Revenue Bonds | | |
| Series A | | |
| 0.375%, due 7/1/35 (a) | $ 8,125,000 | $ 7,873,589 |
| | | 9,267,909 |
| District of Columbia 1.1% |
| District of Columbia, Gallery Place Project, Tax Allocation | | |
| 5.00%, due 6/1/27 | 1,720,000 | 1,720,968 |
| District of Columbia Housing Finance Agency, Cascade Park Apartments II Project, Revenue Bonds | | |
| 0.70%, due 8/1/42 (a) | 4,500,000 | 4,347,108 |
| Metropolitan Washington Airports Authority, Revenue Bonds (b) | | |
| Series A | | |
| 5.00%, due 10/1/27 | 2,160,000 | 2,202,283 |
| Series A | | |
| 5.00%, due 10/1/28 | 1,020,000 | 1,043,959 |
| | | 9,314,318 |
| Florida 3.1% |
| City of Tampa, Water & Wastewater System, Revenue Bonds | | |
| Series B | | |
| 1.141%, due 10/1/27 | 4,000,000 | 3,436,041 |
| County of Broward, Port Facilities, Revenue Bonds | | |
| 5.00%, due 9/1/27 (b) | 1,995,000 | 2,049,097 |
| County of Monroe, Airport, Revenue Bonds | | |
| Series 202 | | |
| 5.00%, due 10/1/27 (b) | 200,000 | 201,983 |
| County of Pasco, State of Florida Cigarette Tax Revenue, Revenue Bonds | | |
| Series A, Insured: AGM | | |
| 5.25%, due 9/1/25 | 1,680,000 | 1,713,989 |
| Series A, Insured: AGM | | |
| 5.25%, due 9/1/26 | 1,875,000 | 1,931,168 |
| Series A, Insured: AGM | | |
| 5.25%, due 9/1/27 | 2,000,000 | 2,076,040 |
| | Principal
Amount | Value |
| |
| Florida (continued) |
| Greater Orlando Aviation Authority, Revenue Bonds | | |
| Series A | | |
| 5.00%, due 10/1/26 (b) | $ 4,225,000 | $ 4,293,592 |
| State of Florida, Unlimited General Obligation | | |
| Series B | | |
| 5.00%, due 7/1/25 | 9,665,000 | 9,869,931 |
| Village Community Development District No. 12, Special Assessment | | |
| 3.25%, due 5/1/26 | 1,435,000 | 1,397,975 |
| | | 26,969,816 |
| Georgia 1.7% |
| City of Atlanta, Department of Aviation, Revenue Bonds | | |
| Series B | | |
| 5.00%, due 7/1/27 (b) | 2,185,000 | 2,223,922 |
| Development Authority of Monroe County (The), Georgia Power Co. Scherer, Revenue Bonds | | |
| Series 1 | | |
| 1.00%, due 7/1/49 (a) | 1,590,000 | 1,385,864 |
| Main Street Natural Gas, Inc., Revenue Bonds | | |
| Series A | | |
| 4.00%, due 7/1/52 (a) | 7,490,000 | 7,208,831 |
| Municipal Electric Authority of Georgia, Project One Subordinated Bonds, Revenue Bonds | | |
| Series A | | |
| 5.00%, due 1/1/26 | 970,000 | 984,814 |
| State of Georgia, Unlimited General Obligation | | |
| Series A | | |
| 5.00%, due 7/1/25 | 3,170,000 | 3,235,671 |
| | | 15,039,102 |
| Guam 0.3% |
| Guam Government Waterworks Authority, Water and Wastewater System, Revenue Bonds | | |
| 5.00%, due 7/1/24 | 400,000 | 400,868 |
| Guam Power Authority, Revenue Bonds | | |
| Series A | | |
| 5.00%, due 10/1/25 | 2,500,000 | 2,514,990 |
| | | 2,915,858 |
The notes to the financial statements are an integral part of, and should be read in conjunction with, the financial statements.
13
Portfolio of Investments October 31, 2023†^ (continued)
| | Principal
Amount | Value |
| Long-Term Municipal Bonds (continued) |
| Hawaii 0.6% |
| State of Hawaii, Airports System, Revenue Bonds | | |
| Series A | | |
| 5.00%, due 7/1/28 (b) | $ 1,000,000 | $ 1,020,764 |
| State of Hawaii, Unlimited General Obligation | | |
| Series FH | | |
| 5.00%, due 10/1/28 | 3,620,000 | 3,723,972 |
| | | 4,744,736 |
| Illinois 5.1% |
| Chicago O'Hare International Airport, Passenger Facility Charge, Revenue Bonds | | |
| Series B | | |
| 5.00%, due 1/1/25 (b) | 835,000 | 834,929 |
| City of Calumet City, Unlimited General Obligation | | |
| Series A, Insured: AGM | | |
| 5.50%, due 3/1/27 | 640,000 | 661,570 |
| City of Chicago, Wastewater Transmission Project, Revenue Bonds | | |
| Series A, Insured: NATL-RE | | |
| (zero coupon), due 1/1/26 | 2,090,000 | 1,895,280 |
| City of Chicago, Unlimited General Obligation | | |
| Series A | | |
| 5.00%, due 1/1/30 | 1,000,000 | 1,021,195 |
| Series A | | |
| 5.25%, due 1/1/30 | 500,000 | 500,945 |
| City of Chicago, Neighborhoods Alive, Unlimited General Obligation | | |
| Series B | | |
| 5.25%, due 1/1/28 | 60,000 | 60,929 |
| Series B | | |
| 5.25%, due 1/1/28 | 90,000 | 90,512 |
| City of Country Club Hills, Unlimited General Obligation | | |
| Insured: BAM | | |
| 4.00%, due 12/1/25 | 1,230,000 | 1,211,922 |
| Cook County Township High School District No. 225, Unlimited General Obligation | | |
| 5.00%, due 12/1/26 | 1,230,000 | 1,273,713 |
| Illinois Finance Authority, American Water Capital Corp., Revenue Bonds | | |
| 2.45%, due 10/1/39 (a) | 2,250,000 | 1,973,329 |
| | Principal
Amount | Value |
| |
| Illinois (continued) |
| Illinois Finance Authority, Presbyterian Homes Obligated Group, Revenue Bonds | | |
| Series B | | |
| 4.79%, due 5/1/42 | $ 1,125,000 | $ 1,100,436 |
| Illinois Housing Development Authority, Revenue Bonds | | |
| Series G, Insured: GNMA / FNMA / FHLMC | | |
| 5.50%, due 10/1/26 | 275,000 | 285,013 |
| Series G, Insured: GNMA / FNMA / FHLMC | | |
| 5.50%, due 4/1/27 | 275,000 | 286,844 |
| Series G, Insured: GNMA / FNMA / FHLMC | | |
| 5.50%, due 10/1/27 | 285,000 | 298,878 |
| Kane & DeKalb Counties Community Unit School District No. 302, Unlimited General Obligation | | |
| Series B, Insured: AGC | | |
| (zero coupon), due 2/1/27 | 475,000 | 409,076 |
| State of Illinois, Unlimited General Obligation | | |
| 3.50%, due 6/1/31 | 1,700,000 | 1,544,914 |
| Series D | | |
| 5.00%, due 11/1/24 | 10,000,000 | 10,059,900 |
| Series D | | |
| 5.00%, due 11/1/25 | 5,000,000 | 5,062,713 |
| Series A | | |
| 5.00%, due 3/1/29 | 3,745,000 | 3,861,683 |
| Series B | | |
| 5.00%, due 10/1/29 | 800,000 | 826,472 |
| Series C | | |
| 5.00%, due 11/1/29 | 5,920,000 | 6,042,047 |
| Series 1, Insured: NATL-RE | | |
| 6.00%, due 11/1/26 | 4,115,000 | 4,166,759 |
| Upper Illinois River Valley Development Authority, Morris Hospital Obligated Group, Revenue Bonds | | |
| 5.00%, due 12/1/27 | 1,145,000 | 1,150,407 |
| | | 44,619,466 |
| Indiana 2.0% |
| Avon Community School Building Corp., Limited General Obligation | | |
| Insured: State Intercept | | |
| 4.00%, due 1/15/24 | 2,635,000 | 2,630,797 |
The notes to the financial statements are an integral part of, and should be read in conjunction with, the financial statements.
| 14 | MainStay MacKay Short Term Municipal Fund |
| | Principal
Amount | Value |
| Long-Term Municipal Bonds (continued) |
| Indiana (continued) |
| Center Grove Community School Corp., Limited General Obligation (d) | | |
| Insured: State Intercept | | |
| 5.00%, due 1/1/25 | $ 1,240,000 | $ 1,246,302 |
| Insured: State Intercept | | |
| 5.00%, due 7/1/25 | 1,760,000 | 1,772,947 |
| Insured: State Intercept | �� | |
| 5.00%, due 1/1/26 | 1,805,000 | 1,822,316 |
| Indiana Finance Authority, Indianapolis Power & Light Co. Project, Revenue Bonds | | |
| Series B | | |
| 0.65%, due 8/1/25 | 1,500,000 | 1,366,738 |
| Series A | | |
| 0.75%, due 12/1/38 (a) | 2,000,000 | 1,742,653 |
| Series A | | |
| 1.40%, due 8/1/29 (a) | 1,095,000 | 889,595 |
| Indiana Finance Authority, BHI Senior Living, Inc., Revenue Bonds | | |
| Series B | | |
| 2.45%, due 11/15/25 | 355,000 | 329,395 |
| Series B | | |
| 2.52%, due 11/15/26 | 515,000 | 462,622 |
| Series B | | |
| 2.92%, due 11/15/27 | 655,000 | 577,435 |
| Indiana Finance Authority, Deaconess Health System, Revenue Bonds | | |
| Series B | | |
| 4.39%, due 3/1/39 | 1,845,000 | 1,785,400 |
| Indianapolis Local Public Improvement Bond Bank, Revenue Bonds | | |
| Series D | | |
| 5.00%, due 1/1/26 (b) | 2,495,000 | 2,519,222 |
| | | 17,145,422 |
| Iowa 0.4% |
| City of West Des Moines, Urban Renewal, Unlimited General Obligation | | |
| Series D | | |
| 2.70%, due 6/1/28 | 1,145,000 | 1,041,975 |
| Iowa Finance Authority, Renewable Natural Gas Project, Green Bond, Revenue Bonds | | |
| 1.50%, due 1/1/42 (a)(b) | 2,000,000 | 1,969,099 |
| | | 3,011,074 |
| | Principal
Amount | Value |
| |
| Kansas 1.6% |
| City of Wichita, Wichita Senior Housing, Revenue Bonds | | |
| Series IV, Insured: FHA 221(D4) | | |
| 0.51%, due 11/1/25 (a) | $ 10,300,000 | $ 9,823,539 |
| Pottawatomie County Unified School District No. 320, Wamego, Unlimited General Obligation | | |
| Series A | | |
| 5.00%, due 9/1/36 | 2,430,000 | 2,485,419 |
| Reno County Unified School District No. 309, Nickerson, Unlimited General Obligation | | |
| Insured: AGM | | |
| 5.00%, due 9/1/27 | 775,000 | 800,445 |
| Insured: AGM | | |
| 5.00%, due 9/1/28 | 840,000 | 875,234 |
| | | 13,984,637 |
| Kentucky 1.5% |
| County of Owen, American Water Capital Corp., Revenue Bonds | | |
| Series A | | |
| 2.45%, due 6/1/39 (a) | 3,000,000 | 2,626,863 |
| Kentucky Economic Development Finance Authority, Next Generation Information Highway Project, Revenue Bonds, Senior Lien | | |
| Series A | | |
| 5.00%, due 7/1/27 | 4,245,000 | 4,244,114 |
| Kentucky Public Energy Authority, Gas Supply, Revenue Bonds | | |
| Series A | | |
| 4.00%, due 4/1/48 (a) | 6,500,000 | 6,469,241 |
| | | 13,340,218 |
| Louisiana 1.7% |
| Jefferson Sales Tax District, Revenue Bonds | | |
| Series A, Insured: AGM | | |
| 5.00%, due 12/1/26 | 1,500,000 | 1,544,065 |
The notes to the financial statements are an integral part of, and should be read in conjunction with, the financial statements.
15
Portfolio of Investments October 31, 2023†^ (continued)
| | Principal
Amount | Value |
| Long-Term Municipal Bonds (continued) |
| Louisiana (continued) |
| Louisiana Local Government Environmental Facilities & Community Development Authority, Utilities Restoration Corp. Project, Revenue Bonds | | |
| Series A | | |
| 3.615%, due 2/1/29 | $ 3,347,853 | $ 3,230,961 |
| 5.081%, due 6/1/31 | 10,500,000 | 10,355,943 |
| | | 15,130,969 |
| Maine 0.2% |
| Finance Authority of Maine, Supplemental Education Loan Program, Revenue Bonds | | |
| Series A-1, Insured: AGM | | |
| 5.00%, due 12/1/28 (b) | 1,000,000 | 1,017,023 |
| Maine Health & Higher Educational Facilities Authority, Northern Light Health Obligated Group, Revenue Bonds | | |
| Series C, Insured: AGM State Aid Withholding | | |
| 5.00%, due 7/1/26 | 200,000 | 204,642 |
| Series C, Insured: AGM State Aid Withholding | | |
| 5.00%, due 7/1/27 | 200,000 | 206,703 |
| | | 1,428,368 |
| Maryland 0.6% |
| County of Harford, Unlimited General Obligation | | |
| Series A | | |
| 3.00%, due 2/1/28 | 1,160,000 | 1,099,027 |
| Maryland Economic Development Corp., Terminal Project, Revenue Bonds | | |
| Series B | | |
| 3.70%, due 6/1/25 | 1,000,000 | 958,246 |
| Washington Suburban Sanitary Commission, Revenue Bonds | | |
| Insured: County Guaranteed | | |
| 3.00%, due 6/1/28 | 3,305,000 | 3,287,483 |
| | | 5,344,756 |
| | Principal
Amount | Value |
| |
| Massachusetts 0.8% |
| Commonwealth of Massachusetts, Consolidated Loan, Limited General Obligation | | |
| Series D | | |
| 3.00%, due 9/1/27 | $ 2,580,000 | $ 2,459,637 |
| Commonwealth of Massachusetts, Revenue Bonds | | |
| Insured: NATL-RE | | |
| 5.50%, due 1/1/25 | 689,000 | 700,744 |
| Massachusetts Housing Finance Agency, Revenue Bonds | | |
| Series B-2 | | |
| 0.80%, due 12/1/25 | 1,820,000 | 1,665,398 |
| Town of Sutton, Unlimited General Obligation | | |
| 2.05%, due 6/1/26 | 1,950,000 | 1,810,714 |
| | | 6,636,493 |
| Michigan 2.1% |
| City of Detroit, Water Sewage Disposal System, Revenue Bonds | | |
| Series D, Insured: AGM | | |
| 4.39%, due 7/1/32 | 13,500,000 | 12,538,237 |
| Michigan Finance Authority, Revenue Bonds, Senior Lien | | |
| Series A-1 | | |
| 2.326%, due 6/1/30 | 2,009,714 | 1,873,838 |
| Michigan State Housing Development Authority, Revenue Bonds | | |
| Series A | | |
| 3.25%, due 6/1/29 | 1,000,000 | 922,669 |
| Series A | | |
| 3.30%, due 12/1/29 | 1,000,000 | 906,004 |
| Series A | | |
| 3.35%, due 6/1/30 | 1,780,000 | 1,603,760 |
| | | 17,844,508 |
| Minnesota 4.6% |
| Brooklyn Center Independent School District No. 286, Unlimited General Obligation | | |
| Series C, Insured: SD CRED PROG | | |
| 5.00%, due 9/30/24 | 3,200,000 | 3,213,717 |
| City of Minneapolis, Unlimited General Obligation | | |
| 4.00%, due 12/1/25 | 5,500,000 | 5,530,635 |
The notes to the financial statements are an integral part of, and should be read in conjunction with, the financial statements.
| 16 | MainStay MacKay Short Term Municipal Fund |
| | Principal
Amount | Value |
| Long-Term Municipal Bonds (continued) |
| Minnesota (continued) |
| City of St. Paul, Unlimited General Obligation | | |
| Series B | | |
| 0.50%, due 3/1/24 | $ 3,850,000 | $ 3,783,427 |
| Shakopee Independent School District No. 720, Unlimited General Obligation | | |
| Series C, Insured: SD CRED PROG | | |
| (zero coupon), due 2/1/29 | 5,155,000 | 4,038,696 |
| South Washington County Independent School District No. 833, School Building, Unlimited General Obligation | | |
| Series B, Insured: SD CRED PROG | | |
| 3.00%, due 2/1/27 | 8,040,000 | 7,601,262 |
| Southern Minnesota Municipal Power Agency, Revenue Bonds | | |
| Series A, Insured: NATL-RE | | |
| (zero coupon), due 1/1/25 | 2,070,000 | 1,969,739 |
| State of Minnesota, Unlimited General Obligation | | |
| Series B | | |
| 3.25%, due 8/1/29 | 3,000,000 | 2,824,137 |
| Series D | | |
| 5.00%, due 8/1/26 | 10,000,000 | 10,343,299 |
| Watertown-Mayer Independent School District No. 111, Unlimited General Obligation | | |
| Series A, Insured: SD CRED PROG | | |
| (zero coupon), due 2/1/29 | 1,000,000 | 783,051 |
| | | 40,087,963 |
| Mississippi 0.5% |
| State of Mississippi, Unlimited General Obligation | | |
| Series C | | |
| 4.053%, due 10/1/27 | 4,470,000 | 4,368,758 |
| Missouri 0.2% |
| Kansas City Municipal Assistance Corp., Leasehold, Revenue Bonds | | |
| Series B-1, Insured: AMBAC | | |
| (zero coupon), due 4/15/26 | 2,000,000 | 1,804,553 |
| | Principal
Amount | Value |
| |
| Montana 0.5% |
| City of Forsyth, NorthWestern Corp., Revenue Bonds | | |
| 3.875%, due 7/1/28 | $ 3,060,000 | $ 2,925,522 |
| Montana Facility Finance Authority, Kalispell Regional Medical Center, Revenue Bonds | | |
| Series B | | |
| 5.00%, due 7/1/29 | 1,270,000 | 1,271,142 |
| | | 4,196,664 |
| Nebraska 0.2% |
| Central Plains Energy Project, Revenue Bonds | | |
| 2.50%, due 12/1/49 (a) | 2,050,000 | 1,952,392 |
| Nevada 2.9% |
| Clark County School District, Limited General Obligation | | |
| Series A, Insured: AGM | | |
| 5.00%, due 6/15/25 | 3,780,000 | 3,846,122 |
| County of Clark, Department of Aviation, Revenue Bonds, Sub. Lien | | |
| Series B | | |
| 5.00%, due 7/1/26 (b) | 3,000,000 | 3,039,368 |
| Las Vegas Convention & Visitors Authority, Convention Center Expansion, Revenue Bonds | | |
| Series C | | |
| 5.00%, due 7/1/25 | 1,050,000 | 1,065,473 |
| State of Nevada, Limited General Obligation | | |
| Series A | | |
| 5.00%, due 5/1/25 | 10,000,000 | 10,184,017 |
| State of Nevada Highway Improvement, Motor Vehicle, Revenue Bonds | | |
| 3.00%, due 12/1/26 | 7,500,000 | 7,179,684 |
| | | 25,314,664 |
| New Jersey 4.7% |
| County of Morris, Unlimited General Obligation | | |
| 2.00%, due 2/1/25 | 2,830,000 | 2,741,229 |
| Essex County Improvement Authority, North Star Academy Charter School of Newark, Inc., Revenue Bonds | | |
| Series B | | |
| 3.00%, due 8/1/25 (c) | 700,000 | 649,964 |
The notes to the financial statements are an integral part of, and should be read in conjunction with, the financial statements.
17
Portfolio of Investments October 31, 2023†^ (continued)
| | Principal
Amount | Value |
| Long-Term Municipal Bonds (continued) |
| New Jersey (continued) |
| Maywood School District, Unlimited General Obligation | | |
| Insured: BAM SCH BD RES FD | | |
| 3.00%, due 7/15/25 | $ 660,000 | $ 644,700 |
| Insured: BAM SCH BD RES FD | | |
| 3.00%, due 7/15/26 | 550,000 | 528,629 |
| New Jersey Economic Development Authority, New Jersey-American Water Co., Inc., Revenue Bonds | | |
| Series A | | |
| 2.20%, due 10/1/39 (a)(b) | 3,500,000 | 2,849,887 |
| New Jersey Economic Development Authority, Liberty State Park Project, Revenue Bonds | | |
| Series A | | |
| 4.125%, due 6/15/27 | 2,900,000 | 2,877,275 |
| New Jersey Higher Education Student Assistance Authority, Revenue Bonds, Senior Lien | | |
| Series B | | |
| 5.00%, due 12/1/24 (b) | 1,210,000 | 1,215,086 |
| New Jersey Housing & Mortgage Finance Agency, Amity Heights Apartments, Revenue Bonds | | |
| Series A, Insured: HUD Sector 8 | | |
| 3.50%, due 7/1/25 (a) | 4,117,000 | 4,085,304 |
| New Jersey Transportation Trust Fund Authority, Transportation System, Revenue Bonds | | |
| Series C, Insured: AMBAC | | |
| (zero coupon), due 12/15/24 | 1,130,000 | 1,078,835 |
| Series A | | |
| 5.00%, due 6/15/24 | 1,100,000 | 1,106,839 |
| Series D | | |
| 5.00%, due 12/15/24 | 960,000 | 969,921 |
| New Jersey Transportation Trust Fund Authority, Federal Highway Reimbursement, Revenue Bonds | | |
| Series A-1 | | |
| 5.00%, due 6/15/27 | 10,000,000 | 10,186,042 |
| New Jersey Turnpike Authority, Revenue Bonds | | |
| Series C-4 | | |
| 4.50%, due 1/1/24 | 3,200,000 | 3,199,311 |
| Series D-1 | | |
| 4.50%, due 1/1/24 | 2,600,000 | 2,599,573 |
| | Principal
Amount | Value |
| |
| New Jersey (continued) |
| State of New Jersey, COVID-19 General Obligation Emergency Bonds, Unlimited General Obligation | | |
| Series A | | |
| 5.00%, due 6/1/26 | $ 5,000,000 | $ 5,143,966 |
| Weehawken Township Board of Education, Unlimited General Obligation | | |
| Insured: AGM SCH BD RES FD | | |
| 3.00%, due 7/15/25 | 590,000 | 577,592 |
| Insured: AGM SCH BD RES FD | | |
| 3.00%, due 7/15/26 | 345,000 | 332,710 |
| | | 40,786,863 |
| New York 5.2% |
| City of New York, Unlimited General Obligation | | |
| Series B-2 | | |
| 2.90%, due 10/1/27 | 8,600,000 | 7,845,877 |
| Series D | | |
| 5.00%, due 8/1/25 | 3,000,000 | 3,061,153 |
| Marcellus Central School District, Unlimited General Obligation | | |
| Insured: State Aid Withholding | | |
| 4.75%, due 7/2/24 | 8,400,000 | 8,437,658 |
| Metropolitan Transportation Authority, Green Bond, Revenue Bonds | | |
| Series B | | |
| 5.00%, due 11/15/23 | 1,245,000 | 1,245,190 |
| New York City Industrial Development Agency, Yankee Stadium Project, Revenue Bonds | | |
| Insured: NATL-RE | | |
| 4.525%, due 3/1/24 (e) | 500,000 | 501,128 |
| New York State Energy Research & Development Authority, New York State Electric & Gas Corp., Revenue Bonds | | |
| Series D | | |
| 3.50%, due 10/1/29 | 4,400,000 | 4,073,399 |
| New York State Housing Finance Agency, Revenue Bonds | | |
| Series A, Insured: SONYMA HUD Sector 8 | | |
| 0.75%, due 11/1/25 | 960,000 | 863,359 |
| Series E | | |
| 0.95%, due 5/1/25 | 5,050,000 | 4,673,222 |
The notes to the financial statements are an integral part of, and should be read in conjunction with, the financial statements.
| 18 | MainStay MacKay Short Term Municipal Fund |
| | Principal
Amount | Value |
| Long-Term Municipal Bonds (continued) |
| New York (continued) |
| New York Transportation Development Corp., Terminal 4 John F. Kennedy International Airport Project, Revenue Bonds (b) | | |
| Insured: AGM-CR | | |
| 5.00%, due 12/1/26 | $ 5,000,000 | $ 5,126,462 |
| Insured: AGM-CR | | |
| 5.00%, due 12/1/29 | 4,000,000 | 4,101,857 |
| 5.00%, due 12/1/30 | 1,000,000 | 1,012,995 |
| Triborough Bridge & Tunnel Authority, MTA Bridges & Tunnels, Revenue Bonds | | |
| Series B-4A | | |
| 3.938%, due 1/1/32 | 4,405,000 | 4,392,039 |
| | | 45,334,339 |
| North Carolina 2.0% |
| County of Wake, Unlimited General Obligation | | |
| Series A | | |
| 5.00%, due 5/1/25 | 4,010,000 | 4,086,135 |
| Greater Asheville Regional Airport Authority, Revenue Bonds (b) | | |
| Insured: AGM | | |
| 5.00%, due 7/1/28 | 1,000,000 | 1,018,658 |
| Insured: AGM | | |
| 5.00%, due 7/1/29 | 1,165,000 | 1,190,466 |
| Insured: AGM | | |
| 5.00%, due 7/1/30 | 1,100,000 | 1,124,398 |
| North Carolina Turnpike Authority, Triangle Expressway System, Revenue Bonds, Senior Lien | | |
| 5.00%, due 2/1/24 | 10,000,000 | 10,021,641 |
| | | 17,441,298 |
| Ohio 3.4% |
| City of Dayton, Airport, Revenue Bonds | | |
| Series A, Insured: AGM | | |
| 5.00%, due 12/1/23 (b) | 1,155,000 | 1,155,394 |
| County of Lorain, Limited General Obligation | | |
| 4.125%, due 5/2/24 | 4,450,000 | 4,442,327 |
| County of Lucas, Revenue Notes | | |
| 6.25%, due 10/11/24 | 3,500,000 | 3,505,945 |
| | Principal
Amount | Value |
| |
| Ohio (continued) |
| Ohio Air Quality Development Authority, American Electric Power Co. Project, Revenue Bonds (a)(b) | | |
| Series C | | |
| 2.10%, due 12/1/27 | $ 2,210,000 | $ 2,136,857 |
| Series B | | |
| 2.10%, due 7/1/28 | 5,000,000 | 4,834,518 |
| Ohio Higher Educational Facility Commission, Case Western Reserve University, Revenue Bonds | | |
| Series B | | |
| 4.32%, due 12/1/42 | 3,995,000 | 3,919,792 |
| Ohio Turnpike & Infrastructure Commission, Revenue Bonds, Junior Lien | | |
| Series A | | |
| 5.00%, due 2/15/26 | 2,000,000 | 2,045,780 |
| Springboro Community City School District, Unlimited General Obligation | | |
| Insured: AGM | | |
| 5.25%, due 12/1/25 | 2,000,000 | 2,049,049 |
| State of Ohio, Unlimited General Obligation | | |
| Series A | | |
| 5.00%, due 3/1/26 | 1,275,000 | 1,311,990 |
| Series U | | |
| 5.00%, due 5/1/27 | 2,580,000 | 2,693,616 |
| State of Ohio, Portsmouth Bypass Project, Revenue Bonds | | |
| Insured: AGM | | |
| 5.00%, due 12/31/28 (b) | 1,275,000 | 1,278,304 |
| | | 29,373,572 |
| Oregon 0.9% |
| City of Portland, Sewer System, Revenue Bonds, First Lien | | |
| Series A | | |
| 3.00%, due 6/1/27 | 8,475,000 | 8,025,384 |
| Pennsylvania 6.4% |
| City of Philadelphia, Airport, Revenue Bonds | | |
| 5.00%, due 7/1/25 (b) | 1,750,000 | 1,761,773 |
| City of Philadelphia, Unlimited General Obligation | | |
| Series A | | |
| 5.00%, due 8/1/25 | 4,000,000 | 4,067,294 |
The notes to the financial statements are an integral part of, and should be read in conjunction with, the financial statements.
19
Portfolio of Investments October 31, 2023†^ (continued)
| | Principal
Amount | Value |
| Long-Term Municipal Bonds (continued) |
| Pennsylvania (continued) |
| Coatesville School District, Limited General Obligation | | |
| Insured: AGM State Aid Withholding | | |
| 5.00%, due 8/1/24 | $ 625,000 | $ 629,891 |
| Lehigh County General Purpose Authority, Muhlenberg College Project, Revenue Bonds | | |
| 4.67%, due 11/1/37 | 12,445,000 | 12,439,522 |
| Montgomery County Industrial Development Authority, Albert Einstein Healthcare Network, Revenue Bonds | | |
| Series A | | |
| 5.25%, due 1/15/45 | 11,385,000 | 11,560,322 |
| Pennsylvania Economic Development Financing Authority, Waste Management, Inc. Project, Revenue Bonds | | |
| 0.95%, due 12/1/33 (a) | 8,000,000 | 7,114,932 |
| Series A | | |
| 4.49%, due 6/1/41 (b) | 9,000,000 | 8,929,842 |
| Pennsylvania Higher Educational Facilities Authority, Indiana University, Revenue Bonds | | |
| Series A, Insured: AGC | | |
| 4.39%, due 7/1/27 | 1,820,000 | 1,794,854 |
| Reading School District, Limited General Obligation | | |
| Series C, Insured: BAM State Aid Withholding | | |
| 5.00%, due 4/1/24 | 3,325,000 | 3,334,649 |
| Sports & Exhibition Authority of Pittsburgh and Allegheny County, Revenue Bonds | | |
| Insured: AGM | | |
| 4.00%, due 2/1/25 | 1,630,000 | 1,622,550 |
| University of Pittsburgh-of the Commonwealth System of Higher Education, Revenue Bonds | | |
| 4.45%, due 2/15/24 | 2,000,000 | 2,000,070 |
| | | 55,255,699 |
| | Principal
Amount | Value |
| |
| Rhode Island 0.4% |
| Rhode Island Health and Educational Building Corp., City of Providence, Revenue Bonds | | |
| Series D, Insured: BAM State Aid Withholding | | |
| 5.00%, due 5/15/26 | $ 1,100,000 | $ 1,130,271 |
| State of Rhode Island, Unlimited General Obligation | | |
| Series A | | |
| 5.00%, due 5/1/25 | 2,435,000 | 2,478,741 |
| | | 3,609,012 |
| South Carolina 1.4% |
| Patriots Energy Group Financing Agency, Revenue Bonds | | |
| Series B | | |
| 4.498%, due 10/1/48 | 2,180,000 | 2,179,999 |
| Richland County School District No. 1, Unlimited General Obligation | | |
| Series C, Insured: SCSDE | | |
| 3.00%, due 3/1/26 | 8,900,000 | 8,606,919 |
| South Carolina State Housing Finance & Development Authority, Dillon School Senior LP, Revenue Bonds | | |
| Insured: HUD SECT 202 | | |
| 5.00%, due 10/1/26 (a) | 1,000,000 | 1,005,269 |
| | | 11,792,187 |
| Tennessee 1.0% |
| County of Knox, Unlimited General Obligation | | |
| Series B | | |
| 2.375%, due 6/1/29 | 1,000,000 | 877,371 |
| Tennessee Energy Acquisition Corp., Revenue Bonds | | |
| 4.00%, due 11/1/49 (a) | 7,650,000 | 7,485,107 |
| | | 8,362,478 |
| Texas 9.1% |
| Capital Area Housing Finance Corp., Grand Avenue Flats Ltd., Revenue Bonds | | |
| 0.29%, due 8/1/39 (a) | 13,000,000 | 12,533,546 |
| Central Texas Turnpike System, Revenue Bonds, First Tier | | |
| Series A, Insured: AMBAC | | |
| (zero coupon), due 8/15/25 | 6,750,000 | 6,251,803 |
The notes to the financial statements are an integral part of, and should be read in conjunction with, the financial statements.
| 20 | MainStay MacKay Short Term Municipal Fund |
| | Principal
Amount | Value |
| Long-Term Municipal Bonds (continued) |
| Texas (continued) |
| Central Texas Turnpike System, Revenue Bonds | | |
| Series C | | |
| 5.00%, due 8/15/24 | $ 775,000 | $ 778,226 |
| City of Austin, Airport System, Revenue Bonds | | |
| 5.00%, due 11/15/25 (b) | 1,630,000 | 1,641,833 |
| City of Beeville, Limited General Obligation | | |
| Insured: BAM | | |
| 4.00%, due 8/15/27 | 2,215,000 | 2,228,343 |
| City of Georgetown, Utility System, Revenue Bonds | | |
| Insured: BAM | | |
| 5.00%, due 8/15/25 | 520,000 | 528,496 |
| Insured: BAM | | |
| 5.00%, due 8/15/26 | 400,000 | 410,643 |
| Insured: BAM | | |
| 5.00%, due 8/15/27 | 1,110,000 | 1,150,265 |
| City of Houston, Hotel Occupancy Tax & Special Tax, Revenue Bonds | | |
| 5.00%, due 9/1/25 | 1,000,000 | 1,006,936 |
| 5.00%, due 9/1/25 | 1,520,000 | 1,542,778 |
| City of Houston, Combined Utility System, Revenue Bonds, First Lien | | |
| Series B | | |
| 5.00%, due 11/15/26 | 2,000,000 | 2,070,554 |
| City of Mesquite, Waterworks & Sewer System, Revenue Bonds | | |
| 5.00%, due 3/1/26 | 1,035,000 | 1,057,591 |
| 5.00%, due 3/1/27 | 1,085,000 | 1,121,236 |
| Decatur Hospital Authority, Wise Health System, Revenue Bonds | | |
| Series B | | |
| 5.00%, due 9/1/28 | 845,000 | 818,036 |
| Series B | | |
| 5.00%, due 9/1/29 | 1,070,000 | 1,029,050 |
| Ennis Independent School District, Unlimited General Obligation | | |
| Insured: PSF-GTD | | |
| (zero coupon), due 8/25/30 | 800,000 | 589,201 |
| Fort Bend County Municipal Utility District No. 134B, Unlimited General Obligation | | |
| Insured: AGM | | |
| 6.50%, due 3/1/27 | 390,000 | 416,970 |
| | Principal
Amount | Value |
| |
| Texas (continued) |
| Harris County Municipal Utility District No. 171, Unlimited General Obligation | | |
| Insured: BAM | | |
| 7.00%, due 12/1/26 | $ 930,000 | $ 999,012 |
| Insured: BAM | | |
| 7.00%, due 12/1/27 | 800,000 | 877,511 |
| Harris County Municipal Utility District No. 489, Unlimited General Obligation | | |
| Insured: BAM | | |
| 6.00%, due 9/1/24 | 680,000 | 689,708 |
| Insured: BAM | | |
| 6.00%, due 9/1/25 | 980,000 | 1,010,733 |
| Insured: BAM | | |
| 6.00%, due 9/1/26 | 980,000 | 1,025,331 |
| Harris County Municipal Utility District No. 490, Unlimited General Obligation | | |
| Insured: AGM | | |
| 7.50%, due 9/1/29 | 1,420,000 | 1,575,954 |
| Harris County Water Control & Improvement District No. 158, Unlimited General Obligation | | |
| Insured: BAM | | |
| 7.00%, due 9/1/25 | 310,000 | 323,622 |
| Insured: BAM | | |
| 7.00%, due 9/1/26 | 325,000 | 347,002 |
| Matagorda County Navigation District No. 1, Central Power and Light Company Project, Revenue Bonds | | |
| Series A | | |
| 2.60%, due 11/1/29 | 4,260,000 | 3,637,029 |
| Montgomery County Municipal Utility District No. 138, Unlimited General Obligation | | |
| Insured: AGM | | |
| 6.375%, due 9/1/30 (d) | 1,850,000 | 2,007,260 |
| Pasadena Independent School District, Unlimited General Obligation | | |
| Insured: PSF-GTD | | |
| 5.00%, due 2/15/25 | 3,120,000 | 3,163,680 |
| Pecos Barstow Toyah Independent School District, Unlimited General Obligation | | |
| Insured: PSF-GTD | | |
| 5.00%, due 2/15/27 | 1,000,000 | 1,035,699 |
The notes to the financial statements are an integral part of, and should be read in conjunction with, the financial statements.
21
Portfolio of Investments October 31, 2023†^ (continued)
| | Principal
Amount | Value |
| Long-Term Municipal Bonds (continued) |
| Texas (continued) |
| Port of Corpus Christi Authority of Nueces County, Revenue Bonds | | |
| 3.737%, due 12/1/26 | $ 3,000,000 | $ 2,851,882 |
| State of Texas, Public Finance Authority, Unlimited General Obligation | | |
| 2.326%, due 10/1/29 | 3,000,000 | 2,573,480 |
| State of Texas, College Student Loan, Unlimited General Obligation | | |
| Series A | | |
| 5.25%, due 8/1/28 (b) | 2,360,000 | 2,456,507 |
| Texas Municipal Gas Acquisition & Supply Corp. II, Revenue Bonds | | |
| Series C | | |
| 4.433%, due 9/15/27 | 13,330,000 | 13,038,963 |
| Texas Natural Gas Securitization Finance Corp., Revenue Bonds | | |
| Series A-1 | | |
| 5.102%, due 4/1/35 | 5,000,000 | 4,843,294 |
| Texas Public Finance Authority, Financing System-Texas Southern University, Revenue Bonds | | |
| Insured: BAM | | |
| 5.00%, due 5/1/25 | 480,000 | 484,788 |
| Insured: BAM | | |
| 5.00%, due 5/1/26 | 500,000 | 507,690 |
| Insured: BAM | | |
| 5.00%, due 5/1/27 | 620,000 | 633,805 |
| | | 79,258,457 |
| U.S. Virgin Islands 2.3% |
| Matching Fund Special Purpose Securitization Corp., Revenue Bonds | | |
| Series A | | |
| 5.00%, due 10/1/25 | 4,200,000 | 4,217,295 |
| Series A | | |
| 5.00%, due 10/1/26 | 15,430,000 | 15,450,027 |
| Virgin Islands Public Finance Authority, Gross Receipts Taxes Loan, Revenue Bonds | | |
| Insured: NATL-RE | | |
| 5.00%, due 10/1/24 | 395,000 | 399,164 |
| | | 20,066,486 |
| | Principal
Amount | Value |
| |
| Utah 1.2% |
| City of Salt Lake City, Airport, Revenue Bonds (b) | | |
| Series A | | |
| 5.00%, due 7/1/25 | $ 875,000 | $ 882,282 |
| Series A | | |
| 5.00%, due 7/1/26 | 1,290,000 | 1,305,312 |
| Series A | | |
| 5.00%, due 7/1/27 | 1,535,000 | 1,560,786 |
| County of Salt Lake, Convention Hotel, Unlimited General Obligation | | |
| Series B | | |
| 2.00%, due 12/15/25 | 2,000,000 | 1,886,778 |
| Series B | | |
| 2.30%, due 12/15/28 | 1,000,000 | 891,888 |
| Series B | | |
| 2.60%, due 12/15/30 | 1,425,000 | 1,235,832 |
| State of Utah, Build America Bonds, Unlimited General Obligation | | |
| Series B | | |
| 3.539%, due 7/1/25 | 1,811,921 | 1,778,127 |
| Utah Infrastructure Agency, Telecommunication, Revenue Bonds | | |
| 5.00%, due 10/15/26 | 1,265,000 | 1,267,871 |
| | | 10,808,876 |
| Virginia 1.2% |
| County of Loudoun, Public Improvement, Unlimited General Obligation | | |
| Series A, Insured: State Aid Withholding | | |
| 3.00%, due 12/1/28 | 5,475,000 | 5,093,603 |
| Virginia College Building Authority, 21st Century College & Equipment Programs, Revenue Bonds | | |
| Series D, Insured: State Intercept | | |
| 3.00%, due 2/1/26 | 3,000,000 | 2,911,136 |
| Wise County Industrial Development Authority, Virginia Electric and Power Co. Project, Revenue Bonds | | |
| Series A | | |
| 0.75%, due 10/1/40 (a) | 3,000,000 | 2,748,877 |
| | | 10,753,616 |
| Washington 3.5% |
| County of King, Sewer, Revenue Bonds, Junior Lien | | |
| Series A | | |
| 0.625%, due 1/1/32 (a) | 5,845,000 | 5,812,631 |
The notes to the financial statements are an integral part of, and should be read in conjunction with, the financial statements.
| 22 | MainStay MacKay Short Term Municipal Fund |
| | Principal
Amount | Value |
| Long-Term Municipal Bonds (continued) |
| Washington (continued) |
| County of King, Sewer, Revenue Bonds, Junior Lien (continued) | | |
| Series A | | |
| 4.32%, due 1/1/40 | $ 10,000,000 | $ 9,775,877 |
| King County School District No. 411, Issaquah, Unlimited General Obligation | | |
| Insured: School Bond Guaranty | | |
| 3.00%, due 12/1/30 | 2,050,000 | 1,875,582 |
| Port of Seattle, Revenue Bonds | | |
| Series B | | |
| 5.00%, due 3/1/25 | 1,500,000 | 1,512,931 |
| Port of Seattle, Revenue Bonds, First Lien | | |
| Series B | | |
| 5.00%, due 10/1/25 (b) | 4,000,000 | 4,059,099 |
| Seattle Housing Authority, Revenue Bonds | | |
| 1.00%, due 6/1/26 | 895,000 | 809,996 |
| State of Washington, Motor Vehicle Fuel Tax, Unlimited General Obligation | | |
| Series F, Insured: AMBAC | | |
| (zero coupon), due 12/1/26 | 2,000,000 | 1,777,456 |
| Series F, Insured: NATL-RE | | |
| (zero coupon), due 12/1/26 | 5,720,000 | 5,083,536 |
| | | 30,707,108 |
| Wisconsin 3.0% |
| City of Madison, Unlimited General Obligation | | |
| Series A | | |
| 2.10%, due 10/1/26 | 6,690,000 | 6,152,394 |
| Series A | | |
| 2.15%, due 10/1/27 | 6,690,000 | 6,018,248 |
| County of Dane, Unlimited General Obligation | | |
| Series A | | |
| 2.00%, due 6/1/26 | 3,000,000 | 2,760,410 |
| County of Waushara, Revenue Notes | | |
| Series A | | |
| 4.75%, due 12/1/23 | 3,600,000 | 3,602,200 |
| Public Finance Authority, Northwest Nazarene University, Revenue Bonds | | |
| 5.00%, due 10/1/25 | 500,000 | 499,288 |
| | Principal
Amount | | Value |
| |
| Wisconsin (continued) |
| Racine Unified School District, Revenue Bonds | | | |
| Series B | | | |
| 4.125%, due 4/1/25 | $ 4,500,000 | | $ 4,467,871 |
| State of Wisconsin, Unlimited General Obligation | | | |
| Series 3 | | | |
| 0.80%, due 5/1/26 | 2,375,000 | | 2,131,484 |
| Wisconsin Housing & Economic Development Authority, Revenue Bonds | | | |
| Series B, Insured: HUD Sector 8 | | | |
| 0.50%, due 11/1/50 (a) | 750,000 | | 713,918 |
| | | | 26,345,813 |
Total Long-Term Municipal Bonds
(Cost $857,369,778) | | | 843,604,112 |
| Short-Term Municipal Notes 1.3% |
| Arizona 0.3% |
| Arizona Health Facilities Authority, Banner Health, Revenue Bonds | | | |
| Series B | | | |
| 4.34%, due 1/1/46 (f) | 2,400,000 | | 2,400,000 |
| Utah 1.0% |
| City of Murray, Intermountain Healthcare, Revenue Bonds | | | |
| Series B | | | |
| 3.87%, due 5/15/37 (f) | 9,000,000 | | 9,000,000 |
Total Short-Term Municipal Notes
(Cost $11,373,200) | | | 11,400,000 |
Total Investments
(Cost $868,742,978) | 98.4% | | 855,004,112 |
| Other Assets, Less Liabilities | 1.6 | | 13,950,224 |
| Net Assets | 100.0% | | $ 868,954,336 |
| † | Percentages indicated are based on Fund net assets. |
| ^ | Industry classifications may be different than those used for compliance monitoring purposes. |
| (a) | Coupon rate may change based on changes of the underlying collateral or prepayments of principal. Rate shown was the rate in effect as of October 31, 2023. |
| (b) | Interest on these securities was subject to alternative minimum tax. |
| (c) | May be sold to institutional investors only under Rule 144A or securities offered pursuant to Section 4(a)(2) of the Securities Act of 1933, as amended. |
The notes to the financial statements are an integral part of, and should be read in conjunction with, the financial statements.
23
Portfolio of Investments October 31, 2023†^ (continued)
| (d) | Delayed delivery security. |
| (e) | Floating rate—Rate shown was the rate in effect as of October 31, 2023. |
| (f) | Variable-rate demand notes (VRDNs)—Provide the right to sell the security at face value on either that day or within the rate-reset period. VRDNs will normally trade as if the maturity is the earlier put date, even though stated maturity is longer. The interest rate is reset on the put date at a stipulated daily, weekly, monthly, quarterly, or other specified time interval to reflect current market conditions. These securities do not indicate a reference rate and spread in their description. The maturity date shown is the final maturity. |
| Abbreviation(s): |
| AGC—Assured Guaranty Corp. |
| AGM—Assured Guaranty Municipal Corp. |
| AMBAC—Ambac Assurance Corp. |
| BAM—Build America Mutual Assurance Co. |
| CR—Custodial Receipts |
| FHA—Federal Housing Administration |
| FHLMC—Federal Home Loan Mortgage Corp. |
| FNMA—Federal National Mortgage Association |
| GNMA—Government National Mortgage Association |
| HUD—Housing and Urban Development |
| MTA—Metropolitan Transportation Authority |
| NATL-RE—National Public Finance Guarantee Corp. |
| PSF-GTD—Permanent School Fund Guaranteed |
| SCSDE—South Carolina State Department of Education |
| SD CRED PROG—School District Credit Enhancement Program |
| SONYMA—State of New York Mortgage Agency |
The following is a summary of the fair valuations according to the inputs used as of October 31, 2023, for valuing the Fund’s assets:
| Description | Quoted
Prices in
Active
Markets for
Identical
Assets
(Level 1) | | Significant
Other
Observable
Inputs
(Level 2) | | Significant
Unobservable
Inputs
(Level 3) | | Total |
| Asset Valuation Inputs | | | | | | | |
| Investments in Securities (a) | | | | | | | |
| Municipal Bonds | | | | | | | |
| Long-Term Municipal Bonds | $ — | | $ 843,604,112 | | $ — | | $ 843,604,112 |
| Short-Term Municipal Notes | — | | 11,400,000 | | — | | 11,400,000 |
| Total Municipal Bonds | — | | 855,004,112 | | — | | 855,004,112 |
| Total Investments in Securities | $ — | | $ 855,004,112 | | $ — | | $ 855,004,112 |
| (a) | For a complete listing of investments and their industries, see the Portfolio of Investments. |
The notes to the financial statements are an integral part of, and should be read in conjunction with, the financial statements.
| 24 | MainStay MacKay Short Term Municipal Fund |
Statement of Assets and Liabilities as of October 31, 2023
| Assets |
Investment in securities, at value
(identified cost $868,742,978) | $855,004,112 |
| Cash | 33,190,337 |
| Receivables: | |
| Investment securities sold | 20,499,672 |
| Interest | 8,149,816 |
| Fund shares sold | 933,319 |
| Other assets | 62,065 |
| Total assets | 917,839,321 |
| Liabilities |
| Payables: | |
| Investment securities purchased | 41,243,291 |
| Fund shares redeemed | 6,215,684 |
| Manager (See Note 3) | 253,353 |
| Custodian | 102,565 |
| NYLIFE Distributors (See Note 3) | 65,278 |
| Transfer agent (See Note 3) | 65,091 |
| Professional fees | 30,045 |
| Shareholder communication | 15,570 |
| Trustees | 731 |
| Accrued expenses | 57,072 |
| Distributions payable | 836,305 |
| Total liabilities | 48,884,985 |
| Net assets | $868,954,336 |
| Composition of Net Assets |
| Shares of beneficial interest outstanding (par value of $.001 per share) unlimited number of shares authorized | $ 95,919 |
| Additional paid-in-capital | 966,852,773 |
| | 966,948,692 |
| Total distributable earnings (loss) | (97,994,356) |
| Net assets | $868,954,336 |
| Class A | |
| Net assets applicable to outstanding shares | $250,092,238 |
| Shares of beneficial interest outstanding | 27,605,518 |
| Net asset value per share outstanding | $ 9.06 |
| Maximum sales charge (1.00% of offering price) | 0.09 |
| Maximum offering price per share outstanding | $ 9.15 |
| Class A2 | |
| Net assets applicable to outstanding shares | $ 48,197,199 |
| Shares of beneficial interest outstanding | 5,313,562 |
| Net asset value per share outstanding | $ 9.07 |
| Maximum sales charge (2.00% of offering price) | 0.19 |
| Maximum offering price per share outstanding | $ 9.26 |
| Investor Class | |
| Net assets applicable to outstanding shares | $ 2,229,920 |
| Shares of beneficial interest outstanding | 245,467 |
| Net asset value per share outstanding | $ 9.08 |
| Maximum sales charge (0.50% of offering price) | 0.05 |
| Maximum offering price per share outstanding | $ 9.13 |
| Class I | |
| Net assets applicable to outstanding shares | $514,457,014 |
| Shares of beneficial interest outstanding | 56,791,624 |
| Net asset value and offering price per share outstanding | $ 9.06 |
| Class R6 | |
| Net assets applicable to outstanding shares | $ 53,977,965 |
| Shares of beneficial interest outstanding | 5,962,498 |
| Net asset value and offering price per share outstanding | $ 9.05 |
The notes to the financial statements are an integral part of, and should be read in conjunction with, the financial statements.
25
Statements of Operations for the period May 1, 2023 through October 31, 2023 and the year ended April 30, 2023
| | Period May 1,
2023
through
October 31,
2023(a) | Year Ended
April 30,
2023 |
| Investment Income (Loss) |
| Income | | |
| Interest | $ 17,646,100 | $ 32,193,048 |
| Expenses | | |
| Manager (See Note 3) | 1,747,703 | 4,799,723 |
| Distribution/Service—Class A (See Note 3) | 352,085 | 935,547 |
| Distribution/Service—Class A2 (See Note 3) | 65,508 | 190,927 |
| Distribution/Service—Investor Class (See Note 3) | 3,003 | 6,840 |
| Transfer agent (See Note 3) | 185,336 | 423,800 |
| Registration | 60,316 | 154,870 |
| Shareholder communication | 151 | 48,693 |
| Professional fees | 107,516 | 152,217 |
| Custodian | 61,875 | 330,841 |
| Trustees | 13,064 | 34,625 |
| Miscellaneous | 23,595 | 56,357 |
| Total expenses before waiver/reimbursement | 2,620,152 | 7,134,440 |
| Expense waiver/reimbursement from Manager (See Note 3) | (127,038) | (272,071) |
| Reimbursement from prior custodian | — | (2,332) (b) |
| Net expenses | 2,493,114 | 6,860,037 |
| Net investment income (loss) | 15,152,986 | 25,333,011 |
| Realized and Unrealized Gain (Loss) |
| Net realized gain (loss) on investments | (7,724,927) | (59,327,437) |
| Net change in unrealized appreciation (depreciation) on investments | (12,955,835) | 51,945,156 |
| Net realized and unrealized gain (loss) | (20,680,762) | (7,382,281) |
| Net increase (decrease) in net assets resulting from operations | $ (5,527,776) | $ 17,950,730 |
| (a) | The Fund changed its fiscal year end from April 30 to October 31. |
| (b) | Represents a refund for overbilling of custody fees. |
The notes to the financial statements are an integral part of, and should be read in conjunction with, the financial statements.
| 26 | MainStay MacKay Short Term Municipal Fund |
Statements of Changes in Net Assets
for the period May 1, 2023 through October 31, 2023 and the years ended April 30, 2023 and April 30, 2022
| | Period May 1,
2023
through
October 31,
2023(a) | Year Ended
April 30,
2023 | Year Ended
April 30,
2022 |
| Increase (Decrease) in Net Assets |
| Operations: | | | |
| Net investment income (loss) | $ 15,152,986 | $ 25,333,011 | $ 11,016,224 |
| Net realized gain (loss) | (7,724,927) | (59,327,437) | (9,580,898) |
| Net change in unrealized appreciation (depreciation) | (12,955,835) | 51,945,156 | (72,063,429) |
| Net increase (decrease) in net assets resulting from operations | (5,527,776) | 17,950,730 | (70,628,103) |
| Distributions to shareholders: |
| Class A | (4,037,568) | (6,648,263) | (2,489,358) |
| Class A2 | (750,087) | (1,288,784) | (604,316) |
| Investor Class | (30,656) | (40,583) | (7,453) |
| Class I | (9,376,547) | (17,108,080) | (11,061,272) |
| Class R6 | (1,091,968) | (1,910,732) | — |
| Total distributions to shareholders | (15,286,826) | (26,996,442) | (14,162,399) |
| Capital share transactions: | | | |
| Net proceeds from sales of shares | 79,500,074 | 876,229,496 | 1,461,111,895 |
| Net asset value of shares issued to shareholders in reinvestment of distributions | 9,539,301 | 16,530,565 | 9,157,948 |
| Cost of shares redeemed | (311,321,448) | (1,409,052,393) | (1,744,044,217) |
| Increase (decrease) in net assets derived from capital share transactions | (222,282,073) | (516,292,332) | (273,774,374) |
| Net increase (decrease) in net assets | (243,096,675) | (525,338,044) | (358,564,876) |
| Net Assets |
| Beginning of period | 1,112,051,011 | 1,637,389,055 | 1,995,953,931 |
| End of period | $ 868,954,336 | $ 1,112,051,011 | $ 1,637,389,055 |
| (a) | The Fund changed its fiscal year end from April 30 to October 31. |
The notes to the financial statements are an integral part of, and should be read in conjunction with, the financial statements.
27
Financial Highlights selected per share data and ratios
| | May 1,
2023 through
October 31, | | Year Ended April 30, |
| Class A | 2023 # | | 2023 | | 2022 | | 2021 | | 2020 | | 2019 |
| Net asset value at beginning of period | $ 9.26 | | $ 9.31 | | $ 9.73 | | $ 9.54 | | $ 9.58 | | $ 9.51 |
| Net investment income (loss) (a) | 0.13 | | 0.15 | | 0.04 | | 0.06 | | 0.13 | | 0.12 |
| Net realized and unrealized gain (loss) | (0.20) | | (0.03) | | (0.41) | | 0.21 | | (0.03) | | 0.07 |
| Total from investment operations | (0.07) | | 0.12 | | (0.37) | | 0.27 | | 0.10 | | 0.19 |
| Less distributions: | | | | | | | | | | | |
| From net investment income | (0.13) | | (0.17) | | (0.05) | | (0.08) | | (0.14) | | (0.12) |
| Net asset value at end of period | $ 9.06 | | $ 9.26 | | $ 9.31 | | $ 9.73 | | $ 9.54 | | $ 9.58 |
| Total investment return (b) | (0.73)% | | 1.32% | | (3.81)% | | 2.85% | | 1.05% | | 2.04%(c) |
| Ratios (to average net assets)/Supplemental Data: | | | | | | | | | | | |
| Net investment income (loss) | 2.84%†† | | 1.66% | | 0.36% | �� | 0.63% | | 1.30% | | 1.28% |
| Net expenses | 0.69%†† | | 0.68% | | 0.67% | | 0.65% | | 0.69% | | 0.71% |
| Expenses (before waiver/reimbursement) | 0.69%†† | | 0.68% | | 0.67% | | 0.65% | | 0.70% | | 0.71% |
| Portfolio turnover rate | 61%(d) | | 99%(d) | | 62%(d) | | 28%(d) | | 94%(d) | | 96% |
| Net assets at end of period (in 000's) | $ 250,092 | | $ 306,828 | | $ 409,722 | | $ 503,769 | | $ 152,614 | | $ 113,023 |
| # | The Fund changed its fiscal year end from April 30 to October 31. |
| †† | Annualized. |
| (a) | Per share data based on average shares outstanding during the period. |
| (b) | Total investment return is calculated exclusive of sales charges and assumes the reinvestment of dividends and distributions. For periods of less than one year, total return is not annualized. |
| (c) | Total investment return may reflect adjustments to conform to generally accepted accounting principles. |
| (d) | The portfolio turnover rate includes variable rate demand notes. |
| | May 1,
2023
through
October 31, | | Year Ended April 30, | | September 30,
2020^ through April 30,
2021 |
| Class A2 | 2023 # | | 2023 | | 2022 | |
| Net asset value at beginning of period | $ 9.27 | | $ 9.32 | | $ 9.75 | | $ 9.70** |
| Net investment income (loss) (a) | 0.13 | | 0.15 | | 0.03 | | 0.02 |
| Net realized and unrealized gain (loss) | (0.20) | | (0.03) | | (0.41) | | 0.07 |
| Total from investment operations | (0.07) | | 0.12 | | (0.38) | | 0.09 |
| Less distributions: | | | | | | | |
| From net investment income | (0.13) | | (0.17) | | (0.05) | | (0.04) |
| Net asset value at end of period | $ 9.07 | | $ 9.27 | | $ 9.32 | | $ 9.75 |
| Total investment return (b) | (0.73)% | | 1.32% | | (3.91)% | | 0.90% |
| Ratios (to average net assets)/Supplemental Data: | | | | | | | |
| Net investment income (loss) | 2.84%†† | | 1.57% | | 0.36% | | 0.40%†† |
| Net expenses | 0.69%†† | | 0.68% | | 0.67% | | 0.65%†† |
| Portfolio turnover rate (c) | 61% | | 99% | | 62% | | 28% |
| Net assets at end of period (in 000's) | $ 48,197 | | $ 54,326 | | $ 98,890 | | $ 88,248 |
| # | The Fund changed its fiscal year end from April 30 to October 31. |
| ** | Based on the net asset value of Class A as of September 30, 2020. |
| ^ | Inception date. |
| †† | Annualized. |
| (a) | Per share data based on average shares outstanding during the period. |
| (b) | Total investment return is calculated exclusive of sales charges and assumes the reinvestment of dividends and distributions. For periods of less than one year, total return is not annualized. |
| (c) | The portfolio turnover rate includes variable rate demand notes. |
The notes to the financial statements are an integral part of, and should be read in conjunction with, the financial statements.
| 28 | MainStay MacKay Short Term Municipal Fund |
Financial Highlights selected per share data and ratios
| | May 1,
2023 through
October 31,
2023# | | Year Ended April 30, |
| Investor Class | 2023 | | 2022 | | 2021 | | 2020 | | 2019 |
| Net asset value at beginning of period | $ 9.28 | | $ 9.33 | | $ 9.76 | | $ 9.57 | | $ 9.61 | | $ 9.54 |
| Net investment income (loss) (a) | 0.12 | | 0.13 | | 0.01 | | 0.04 | | 0.09 | | 0.08 |
| Net realized and unrealized gain (loss) | (0.20) | | (0.04) | | (0.42) | | 0.20 | | (0.02) | | 0.07 |
| Total from investment operations | (0.08) | | 0.09 | | (0.41) | | 0.24 | | 0.07 | | 0.15 |
| Less distributions: | | | | | | | | | | | |
| From net investment income | (0.12) | | (0.14) | | (0.02) | | (0.05) | | (0.11) | | (0.08) |
| Net asset value at end of period | $ 9.08 | | $ 9.28 | | $ 9.33 | | $ 9.76 | | $ 9.57 | | $ 9.61 |
| Total investment return (b) | (0.89)% | | 0.99% | | (4.19)% | | 2.64% | | 0.61% | | 1.56% |
| Ratios (to average net assets)/Supplemental Data: | | | | | | | | | | | |
| Net investment income (loss) | 2.53%†† | | 1.37% | | 0.06% | | 0.41% | | 0.98% | | 0.81% |
| Net expenses | 0.99%†† | | 1.00% | | 0.99% | | 0.98% | | 1.09% | | 1.18% |
| Expenses (before waiver/reimbursement) | 1.32%†† | | 1.30% | | 1.24% | | 1.25% | | 1.28% | | 1.30% |
| Portfolio turnover rate | 61%(c) | | 99%(c) | | 62%(c) | | 28%(c) | | 94%(c) | | 96% |
| Net assets at end of period (in 000's) | $ 2,230 | | $ 2,511 | | $ 2,884 | | $ 3,608 | | $ 4,158 | | $ 3,834 |
| # | The Fund changed its fiscal year end from April 30 to October 31. |
| †† | Annualized. |
| (a) | Per share data based on average shares outstanding during the period. |
| (b) | Total investment return is calculated exclusive of sales charges and assumes the reinvestment of dividends and distributions. For periods of less than one year, total return is not annualized. |
| (c) | The portfolio turnover rate includes variable rate demand notes. |
| | May 1,
2023 through
October 31, | | Year Ended April 30, |
| Class I | 2023 # | | 2023 | | 2022 | | 2021 | | 2020 | | 2019 |
| Net asset value at beginning of period | $ 9.26 | | $ 9.31 | | $ 9.73 | | $ 9.54 | | $ 9.58 | | $ 9.51 |
| Net investment income (loss) (a) | 0.14 | | 0.18 | | 0.06 | | 0.09 | | 0.15 | | 0.15 |
| Net realized and unrealized gain (loss) | (0.19) | | (0.03) | | (0.40) | | 0.21 | | (0.02) | | 0.07 |
| Total from investment operations | (0.05) | | 0.15 | | (0.34) | | 0.30 | | 0.13 | | 0.22 |
| Less distributions: | | | | | | | | | | | |
| From net investment income | (0.15) | | (0.20) | | (0.08) | | (0.11) | | (0.17) | | (0.15) |
| Net asset value at end of period | $ 9.06 | | $ 9.26 | | $ 9.31 | | $ 9.73 | | $ 9.54 | | $ 9.58 |
| Total investment return (b) | (0.59)% | | 1.60% | | (3.55)% | | 3.12% | | 1.34% | | 2.34% |
| Ratios (to average net assets)/Supplemental Data: | | | | | | | | | | | |
| Net investment income (loss) | 3.13%†† | | 1.89% | | 0.63% | | 0.89% | | 1.58% | | 1.61% |
| Net expenses | 0.40%†† | | 0.40% | | 0.40% | | 0.40% | | 0.40% | | 0.40% |
| Expenses (before waiver/reimbursement) | 0.44%†† | | 0.43% | | 0.42% | | 0.40% | | 0.45% | | 0.45% |
| Portfolio turnover rate | 61%(c) | | 99%(c) | | 62%(c) | | 28%(c) | | 94%(c) | | 96% |
| Net assets at end of period (in 000's) | $ 514,457 | | $ 663,175 | | $ 1,125,893 | | $ 1,400,328 | | $ 412,193 | | $ 337,116 |
| # | The Fund changed its fiscal year end from April 30 to October 31. |
| †† | Annualized. |
| (a) | Per share data based on average shares outstanding during the period. |
| (b) | Total investment return is calculated exclusive of sales charges and assumes the reinvestment of dividends and distributions. For periods of less than one year, total return is not annualized. |
| (c) | The portfolio turnover rate includes variable rate demand notes. |
The notes to the financial statements are an integral part of, and should be read in conjunction with, the financial statements.
29
Financial Highlights selected per share data and ratios
| | May 1,
2023 through
October 31, | | May 2, 2022^ through
April 30, |
| Class R6 | 2023 # | | 2023 |
| Net asset value at beginning of period | $ 9.25 | | $ 9.30** |
| Net investment income (loss) (a) | 0.14 | | 0.18 |
| Net realized and unrealized gain (loss) | (0.19) | | (0.03) |
| Total from investment operations | (0.05) | | 0.15 |
| Less distributions: | | | |
| From net investment income | (0.15) | | (0.20) |
| Net asset value at end of period | $ 9.05 | | $ 9.25 |
| Total investment return (b) | (0.59)% | | 1.60% |
| Ratios (to average net assets)/Supplemental Data: | | | |
| Net investment income (loss)†† | 3.12% | | 2.00% |
| Net expenses†† | 0.40% | | 0.40%(c) |
| Expenses (before waiver/reimbursement)†† | 0.41% | | 0.40% |
| Portfolio turnover rate (d) | 61% | | 99% |
| Net assets at end of period (in 000's) | $ 53,978 | | $ 85,211 |
| # | The Fund changed its fiscal year end from April 30 to October 31. |
| ** | Based on the net asset value of Class I as of May 2, 2022. |
| ^ | Inception date. |
| †† | Annualized. |
| (a) | Per share data based on average shares outstanding during the period. |
| (b) | Total investment return is calculated exclusive of sales charges and assumes the reinvestment of dividends and distributions. For periods of less than one year, total return is not annualized. |
| (c) | Expense waiver/reimbursement less than 0.01%. |
| (d) | The portfolio turnover rate includes variable rate demand notes. |
The notes to the financial statements are an integral part of, and should be read in conjunction with, the financial statements.
| 30 | MainStay MacKay Short Term Municipal Fund |
Notes to Financial Statements
Note 1-Organization and Business
MainStay Funds Trust (the “Trust”) was organized as a Delaware statutory trust on April 28, 2009. The Trust is registered under the Investment Company Act of 1940, as amended (the “1940 Act”), as an open-end management investment company, and is comprised of thirty-seven funds (collectively referred to as the “Funds”). These financial statements and notes relate to the MainStay MacKay Short Term Municipal Fund (the "Fund"), a “diversified” fund, as that term is defined in the 1940 Act, as interpreted or modified by regulatory authorities having jurisdiction, from time to time.
The following table lists the Fund's share classes that have been registered and commenced operations:
| Class | Commenced Operations |
| Class A | January 2, 2004 |
| Class A2 | September 30, 2020 |
| Investor Class | February 28, 2008 |
| Class I | January 2, 1991 |
| Class R6 | May 2, 2022 |
Class A and Investor Class shares are offered at net asset value (“NAV”) per share plus an initial sales charge. No initial sales charge applies to investments of $250,000 or more (and certain other qualified purchases) in Class A and Investor Class shares. However, a contingent deferred sales charge (“CDSC”) of 0.50% may be imposed on certain redemptions made within 12 months of the date of purchase on shares that were purchased without an initial sales charge. Class A2 shares are offered at NAV without an initial sales charge, although a 0.50% CDSC may be imposed on certain redemptions of such shares made within one year of the date of purchase of Class A2 shares. Class I shares are offered at NAV without a sales charge. Class R6 shares are currently expected to be offered at NAV without a sales charge. Additionally, Investor Class shares may convert automatically to Class A shares. Under certain circumstances and as may be permitted by the Trust’s multiple class plan pursuant to Rule 18f-3 under the 1940 Act, specified share classes of the Fund may be converted to one or more other share classes of the Fund as disclosed in the capital share transactions within these Notes. The classes of shares have the same voting (except for issues that relate solely to one class), dividend, liquidation and other rights, and the same terms and conditions, except that under distribution plans pursuant to Rule 12b-1 under the 1940 Act, Class A and Investor Class shares are subject to a distribution and/or service fee. Class I and Class R6 shares are not subject to a distribution and/or service fee.
The Fund's investment objective is to seek current income exempt from regular federal income tax.
Effective at the close of business on May 1, 2023, the Fund changed its fiscal and tax year end from April 30 to October 31.
Note 2–Significant Accounting Policies
The Fund is an investment company and accordingly follows the investment company accounting and reporting guidance of the Financial Accounting Standards Board (“FASB”) Accounting Standards Codification Topic 946 Financial Services—Investment Companies. The Fund prepares its financial statements in accordance with generally accepted accounting principles (“GAAP”) in the United States of America and follows the significant accounting policies described below.
(A) Securities Valuation. Investments are usually valued as of the close of regular trading on the New York Stock Exchange (the "Exchange") (usually 4:00 p.m. Eastern time) on each day the Fund is open for business ("valuation date").
Pursuant to Rule 2a-5 under the 1940 Act, the Board of Trustees of the Trust (the "Board") has designated New York Life Investment Management LLC (“New York Life Investments” or the "Manager") as its Valuation Designee (the "Valuation Designee"). The Valuation Designee is responsible for performing fair valuations relating to all investments in the Fund’s portfolio for which market quotations are not readily available; periodically assessing and managing material valuation risks; establishing and applying fair value methodologies; testing fair valuation methodologies; evaluating and overseeing pricing services; ensuring appropriate segregation of valuation and portfolio management functions; providing quarterly, annual and prompt reporting to the Board, as appropriate; identifying potential conflicts of interest; and maintaining appropriate records. The Valuation Designee has established a valuation committee ("Valuation Committee") to assist in carrying out the Valuation Designee’s responsibilities and establish prices of securities for which market quotations are not readily available. The Fund's and the Valuation Designee's policies and procedures ("Valuation Procedures") govern the Valuation Designee’s selection and application of methodologies for determining and calculating the fair value of Fund investments. The Valuation Designee may value the Fund's portfolio securities for which market quotations are not readily available and other Fund assets utilizing inputs from pricing services and other third-party sources. The Valuation Committee meets (in person, via electronic mail or via teleconference) on an ad-hoc basis to determine fair valuations and on a quarterly basis to review fair value events with respect to certain securities for which market quotations are not readily available, including valuation risks and back-testing results, and preview reports to the Board.
The Valuation Committee establishes prices of securities for which market quotations are not readily available based on such methodologies and measurements on a regular basis after considering information that is reasonably available and deemed relevant by the Valuation Committee. The Board shall oversee the Valuation Designee and review fair valuation materials on a prompt, quarterly and annual basis and approve proposed revisions to the Valuation Procedures.
Investments for which market quotations are not readily available are valued at fair value as determined in good faith pursuant to the Valuation Procedures. A market quotation is readily available only when that
Notes to Financial Statements (continued)
quotation is a quoted price (unadjusted) in active markets for identical investments that the Fund can access at the measurement date, provided that a quotation will not be readily available if it is not reliable. "Fair value" is defined as the price the Fund would reasonably expect to receive upon selling an asset or liability in an orderly transaction to an independent buyer in the principal or most advantageous market for the asset or liability. Fair value measurements are determined within a framework that establishes a three-tier hierarchy that maximizes the use of observable market data and minimizes the use of unobservable inputs to establish a classification of fair value measurements for disclosure purposes. "Inputs" refer broadly to the assumptions that market participants would use in pricing the asset or liability, including assumptions about risk, such as the risk inherent in a particular valuation technique used to measure fair value using a pricing model and/or the risk inherent in the inputs for the valuation technique. Inputs may be observable or unobservable. Observable inputs reflect the assumptions market participants would use in pricing the asset or liability based on market data obtained from sources independent of the Fund. Unobservable inputs reflect the Fund’s own assumptions about the assumptions market participants would use in pricing the asset or liability based on the information available. The inputs or methodology used for valuing assets or liabilities may not be an indication of the risks associated with investing in those assets or liabilities. The three-tier hierarchy of inputs is summarized below.
| • | Level 1—quoted prices (unadjusted) in active markets for an identical asset or liability |
| • | Level 2—other significant observable inputs (including quoted prices for a similar asset or liability in active markets, interest rates and yield curves, prepayment speeds, credit risk, etc.) |
| • | Level 3—significant unobservable inputs (including the Fund's own assumptions about the assumptions that market participants would use in measuring fair value of an asset or liability) |
The level of an asset or liability within the fair value hierarchy is based on the lowest level of an input, both individually and in the aggregate, that is significant to the fair value measurement. The aggregate value by input level of the Fund’s assets and liabilities as of October 31, 2023, is included at the end of the Portfolio of Investments.
The Fund may use third-party vendor evaluations, whose prices may be derived from one or more of the following standard inputs, among others:
| • Benchmark yields | • Reported trades |
| • Broker/dealer quotes | • Issuer spreads |
| • Two-sided markets | • Benchmark securities |
| • Bids/offers | • Reference data (corporate actions or material event notices) |
| • Industry and economic events | • Comparable bonds |
| • Monthly payment information | |
An asset or liability for which a market quotation is not readily available is valued by methods deemed reasonable in good faith by the Valuation Committee, following the Valuation Procedures to represent fair value.
Under these procedures, the Valuation Designee generally uses a market-based approach which may use related or comparable assets or liabilities, recent transactions, market multiples, book values and other relevant information. The Valuation Designee may also use an income-based valuation approach in which the anticipated future cash flows of the asset or liability are discounted to calculate fair value. Discounts may also be applied due to the nature and/or duration of any restrictions on the disposition of the asset or liability. Fair value represents a good faith approximation of the value of a security. Fair value determinations involve the consideration of a number of subjective factors, an analysis of applicable facts and circumstances and the exercise of judgment. As a result, it is possible that the fair value for a security determined in good faith in accordance with the Valuation Procedures may differ from valuations for the same security determined for other funds using their own valuation procedures. Although the Valuation Procedures are designed to value a security at the price the Fund may reasonably expect to receive upon the security's sale in an orderly transaction, there can be no assurance that any fair value determination thereunder would, in fact, approximate the amount that the Fund would actually realize upon the sale of the security or the price at which the security would trade if a reliable market price were readily available. During the period May 1, 2023 through October 31, 2023, there were no material changes to the fair value methodologies.
Securities which may be valued in this manner include, but are not limited to: (i) a security for which trading has been halted or suspended or otherwise does not have a readily available market quotation on a given day; (ii) a debt security that has recently gone into default and for which there is not a current market quotation; (iii) a security of an issuer that has entered into a restructuring; (iv) a security that has been delisted from a national exchange; (v) a security subject to trading collars for which no or limited trading takes place; and (vi) a security whose principal market has been temporarily closed at a time when, under normal conditions, it would be open. Securities valued in this manner are generally categorized as Level 2 or 3 in the hierarchy. No securities held by the Fund as of October 31, 2023, were fair valued in such a manner.
Municipal debt securities are valued at the evaluated mean prices supplied by a pricing agent or broker selected by the Valuation Designee, in consultation with the Subadvisor. The evaluations are market-based measurements processed through a pricing application and represents the pricing agent's good faith determination as to what a holder may receive in an orderly transaction under market conditions. The rules-based logic utilizes valuation techniques that reflect participants' assumptions and vary by asset class and per methodology, maximizing the use of relevant observable data including quoted prices for similar assets, benchmark yield curves and market corroborated inputs. The evaluated bid or mean prices are deemed by the Valuation Designee, in consultation with the Subadvisor, to be representative of market values, at the regular close of trading of the Exchange on each valuation date. Municipal debt securities purchased on a delayed delivery basis are
| 32 | MainStay MacKay Short Term Municipal Fund |
marked to market daily until settlement at the forward settlement date. Municipal debt securities are generally categorized as Level 2 in the hierarchy.
The information above is not intended to reflect an exhaustive list of the methodologies that may be used to value portfolio investments. The Valuation Procedures permit the use of a variety of valuation methodologies in connection with valuing portfolio investments. The methodology used for a specific type of investment may vary based on the market data available or other considerations. The methodologies summarized above may not represent the specific means by which portfolio investments are valued on any particular business day.
(B) Income Taxes. The Fund's policy is to comply with the requirements of the Internal Revenue Code of 1986, as amended (the “Internal Revenue Code”), applicable to regulated investment companies and to distribute all of its taxable income to the shareholders of the Fund within the allowable time limits.
The Manager evaluates the Fund’s tax positions to determine if the tax positions taken meet the minimum recognition threshold in connection with accounting for uncertainties in income tax positions taken or expected to be taken for the purposes of measuring and recognizing tax liabilities in the financial statements. Recognition of tax benefits of an uncertain tax position is permitted only to the extent the position is “more likely than not” to be sustained assuming examination by taxing authorities. The Manager analyzed the Fund's tax positions taken on federal, state and local income tax returns for all open tax years (for up to three tax years) and has concluded that no provisions for federal, state and local income tax are required in the Fund's financial statements. The Fund's federal, state and local income tax and federal excise tax returns for tax years for which the applicable statutes of limitations have not expired are subject to examination by the Internal Revenue Service and state and local departments of revenue.
(C) Dividends and Distributions to Shareholders. Dividends and distributions are recorded on the ex-dividend date. The Fund intends to declare dividends from net investment income, if any, daily and intends to pay them at least monthly and distributions from net realized capital and currency gains, if any, at least annually. Unless a shareholder elects otherwise, all dividends and distributions are reinvested at NAV in the same class of shares of the Fund. Dividends and distributions to shareholders are determined in accordance with federal income tax regulations and may differ from determinations using GAAP.
(D) Security Transactions and Investment Income. The Fund records security transactions on the trade date. Realized gains and losses on security transactions are determined using the identified cost method. Interest income is accrued as earned using the effective interest rate method. Discounts and premiums on securities purchased, other than temporary cash investments that mature in 60 days or less at the time of purchase, for the Fund are accreted and amortized, respectively, on the effective interest rate method.
Investment income and realized and unrealized gains and losses on investments of the Fund are allocated pro rata to the separate classes of shares based upon their relative net assets on the date the income is earned or realized and unrealized gains and losses are incurred.
The Fund may place a debt security on non-accrual status and reduce related interest income by ceasing current accruals and writing off all or a portion of any interest receivables when the collection of all or a portion of such interest has become doubtful. A debt security is removed from non-accrual status when the issuer resumes interest payments or when collectability of interest is reasonably assured.
(E) Expenses. Expenses of the Trust are allocated to the individual Funds in proportion to the net assets of the respective Funds when the expenses are incurred, except where direct allocations of expenses can be made. Expenses (other than transfer agent expenses and fees incurred under the shareholder services plans and/or the distribution plans further discussed in Note 3(B)) are allocated to separate classes of shares pro rata based upon their relative net assets on the date the expenses are incurred. The expenses borne by the Fund, including those of related parties to the Fund, are shown in the Statement of Operations.
(F) Use of Estimates. In preparing financial statements in conformity with GAAP, the Manager makes estimates and assumptions that affect the reported amounts and disclosures in the financial statements. Actual results could differ from those estimates and assumptions.
(G) Delayed Delivery Transactions. The Fund may purchase or sell securities on a delayed delivery basis. These transactions involve a commitment by the Fund to purchase or sell securities for a predetermined price or yield, with payment and delivery taking place beyond the customary settlement period. When delayed delivery purchases are outstanding, the Fund will designate liquid assets in an amount sufficient to meet the purchase price. When purchasing a security on a delayed delivery basis, the Fund assumes the rights and risks of ownership of the security, including the risk of price and yield fluctuations, and takes such fluctuations into account when determining its NAV. The Fund may dispose of or renegotiate a delayed delivery transaction after it is entered into, and may sell delayed delivery securities before they are delivered, which may result in a realized gain or loss. When the Fund has sold a security it owns on a delayed delivery basis, the Fund does not participate in future gains and losses with respect to the security. Delayed delivery transactions as of October 31, 2023, are shown in the Portfolio of Investments.
(H) Debt Securities Risk. The Fund's investments may include securities such as variable rate notes, floaters and mortgage-related and asset-backed securities. If expectations about changes in interest rates or assessments of an issuer's credit worthiness or market conditions are incorrect, investments in these types of securities could lose money for the Fund.
(I) Municipal Bond Risk. The Fund may invest more heavily in municipal bonds from certain cities, states, territories or regions than others, which may increase the Fund’s exposure to losses resulting from
Notes to Financial Statements (continued)
economic, political, regulatory occurrences, or declines in tax revenue impacting these particular cities, states, territories or regions. In addition, many state and municipal governments that issue securities are under significant economic and financial stress and may not be able to satisfy their obligations, and these events may be made worse due to economic challenges posed by COVID-19. The Fund may invest a substantial amount of its assets in municipal bonds whose interest is paid solely from revenues of similar projects, such as tobacco settlement bonds. If the Fund concentrates its investments in this manner, it assumes the legal and economic risks relating to such projects and this may have a significant impact on the Fund’s investment performance.
Certain of the issuers in which the Fund may invest have recently experienced, or may experience, significant financial difficulties and repeated credit rating downgrades. On May 3, 2017, the Commonwealth of Puerto Rico (the "Commonwealth") began proceedings pursuant to the Puerto Rico Oversight, Management, and Economic Stability Act (“PROMESA”) to seek bankruptcy-type protections from approximately $74 billion in debt and approximately $48 billion in unfunded pension obligations. In addition, the economic downturn following the outbreak of COVID-19 and the resulting pressure on Puerto Rico’s budget have further contributed to its financial challenges. The federal government has passed certain relief packages, including the Coronavirus Aid, Relief, and Economic Security Act and the American Rescue Plan, which included an aggregate of more than $7 billion in disaster relief funds for the U.S. territories, including Puerto Rico. However, there can be no assurances that the federal funds allocated to the Commonwealth will be sufficient to address the long-term economic challenges that arose from COVID-19.
As of October 31, 2023 PREPA remains in Title III Bankruptcy after over 6 years. A significant number of net revenue bond creditors, the Oversight Board, and the Commonwealth have been unable to reach a consensual resolution on PREPA’s debt restructuring following the termination of the previous 2019 PREPA Restructuring Support Agreement by the Commonwealth of Puerto Rico in March of 2022. Further bankruptcy litigation has ensued between the Oversight Board and a group of net revenue bond creditors over the security provisions of PREPA’s $8.3 billion of net revenue bonds resulting in a ruling in March 2023 from Judge Swain that PREPA’s net revenue bonds are unsecured.
Furthermore, in June of 2023 Judge Swain ruled through a claims estimation hearing that PREPA’s now asserted unsecured net revenue bond claim was only valued at approximately 2.383 billion or 28.3% of the full pre-petition claim asserted by net revenue bond holders. Due to the lower claims estimation ruling, at the end of August 2023 the Oversight Board filed a new proposed plan of adjustment to reflect the March lien ruling and June estimation hearing with lower recovery amounts afforded to net revenue bond holders. In conjunction with the new proposed plan of adjustment a subset of the original litigating PREPA Ad Hoc Creditor Group members including BlackRock, Nuveen, and Franklin entered into a Planned Support Agreement (”PSA”) supporting the new proposed plan of adjustment representing ~28.5% of total net revenue bond claims.
Furthermore, National Public Finance Guarantee Corporation also entered into an Amended Planned Support Agreement (“Amended PSA”) at the end of August re-affirming their support for the new August proposed plan of adjustment with ~9.91% of net revenue bond claims. Combined with second settling bond holders approving the plan at the end of November 2023, approximately 43% of PREPA’s net revenue creditors now support the new August proposed plan of adjustment. However, subsequent to the new proposed plan of adjustment, a significant amount of creditors not previously involved in the PREPA bankruptcy formed a new PREPA Ad Hoc Group to object to the plan including the MainStay MacKay Municipal Bond Funds. Combined, objecting holders now represent over 50% of total PREPA net revenue bond claims including the newly constituted PREPA Ad Hoc Group, Golden Tree Asset Management, and Assured Guaranty Corporation.
Furthermore, National Public Finance Guarantee Corporation also entered into an Amended Planned Support Agreement (“Amended PSA”) at the end of August re-affirming their support for the new August proposed plan of adjustment with ~9.91% of net revenue bond claims. Combined with second settling bond holders approving the plan at the end of November 2023, approximately 43% of PREPA’s net revenue creditors now support the new August proposed plan of adjustment. However, subsequent to the new proposed plan of adjustment, a significant amount of creditors not previously involved in the PREPA bankruptcy formed a new PREPA Ad Hoc Group to object to the plan including the MainStay MacKay Municipal Bond Funds. Combined, objecting holders now represent over 50% of total PREPA net revenue bond claims including the newly constituted PREPA Ad Hoc Group, Golden Tree Asset Management, and Assured Guaranty Corporation.
Objecting creditors are appealing several of Judge Swain’s rulings including the March net revenue bond lien ruling, the June net revenue bond claims estimation ruling, and the November disclosure statement approval ruling that provides for a plan with drastically disparate recoveries for the same creditors. While objecting creditors believe the PREPA bankruptcy plan of adjustment is patently un-confirmable and Judge Swain’s rulings will be overturned on appeal, there is no certainty that objecting creditors will be successful in appealing Judge Swain’s rulings, or if overturned, will receive adequate relief from those rulings being overturned. The proposed PREPA August plan of adjustment only provides 3.5 cents of cash recovery for objecting creditors to the plan. Bankruptcy plan confirmation hearings are currently scheduled to begin in March of 2024.
The Fund’s vulnerability to potential losses associated with such developments may be reduced through investing in municipal securities that feature credit enhancements (such as bond insurance). The bond insurance provider pays both principal and interest when due to the bond holder. The magnitude of Puerto Rico’s debt restructuring or other adverse economic developments could pose significant strains on the ability of municipal securities insurers to meet all future claims. As of October 31, 2023, none of the the Puerto Rico municipal securities held by the Fund were insured.
| 34 | MainStay MacKay Short Term Municipal Fund |
(J) Indemnifications. Under the Trust’s organizational documents, its officers and trustees are indemnified against certain liabilities that may arise out of performance of their duties to the Trust. Additionally, in the normal course of business, the Fund enters into contracts with third-party service providers that contain a variety of representations and warranties and that may provide general indemnifications. The Fund's maximum exposure under these arrangements is unknown, as this would involve future claims that may be made against the Fund that have not yet occurred. The Manager believes that the risk of loss in connection with these potential indemnification obligations is remote. However, there can be no assurance that material liabilities related to such obligations will not arise in the future, which could adversely impact the Fund.
Note 3–Fees and Related Party Transactions
(A) Manager and Subadvisor. New York Life Investments, a registered investment adviser and an indirect, wholly-owned subsidiary of New York Life Insurance Company ("New York Life"), serves as the Fund's Manager, pursuant to an Amended and Restated Management Agreement ("Management Agreement"). The Manager provides offices, conducts clerical, recordkeeping and bookkeeping services and keeps most of the financial and accounting records required to be maintained by the Fund. Except for the portion of salaries and expenses that are the responsibility of the Fund, the Manager pays the salaries and expenses of all personnel affiliated with the Fund and certain operational expenses of the Fund. The Fund reimburses New York Life Investments in an amount equal to the portion of the compensation of the Chief Compliance Officer attributable to the Fund. MacKay Shields LLC ("MacKay Shields" or the "Subadvisor"), a registered investment adviser and an indirect, wholly-owned subsidiary of New York Life, serves as the Subadvisor to the Fund and is responsible for the day-to-day portfolio management of the Fund. Pursuant to the terms of an Amended and Restated Subadvisory Agreement ("Subadvisory Agreement") between New York Life Investments and MacKay Shields, New York Life Investments pays for the services of the Subadvisor.
Pursuant to the Management Agreement, the Fund pays the Manager a monthly fee for the services performed and the facilities furnished at an annual rate of the Fund’s average daily net assets as follows: 0.35% on assets up to $ 1 billion; and 0.33% on assets from $1 billion up to $5 billion; and 0.32% on assets over $5 billion. During the period May 1, 2023 through October 31, 2023, the effective management fee rate was 0.35% of the Fund’s average daily net assets, exclusive of any applicable waivers/reimbursements.
New York Life Investments has contractually agreed to waive fees and/or reimburse expenses so that Total Annual Fund Operating Expenses (excluding taxes, interest, litigation, extraordinary expenses, brokerage and other transaction expenses relating to the purchase or sale of portfolio investments and acquired (underlying) fund fees and expenses) do not exceed the following percentages of daily net assets: Class A, 0.70%, Class A2, 0.70% and Class I, 0.40%. New York Life Investments will apply an equivalent waiver or reimbursement, in an equal number of
basis points of the Class A shares waiver/reimbursement to Investor Class shares. In addition, New York Life Investments has also contractually agreed to waive fees and/or reimburse expenses so that Total Annual Fund Operating Expenses (excluding taxes, interest, litigation, extraordinary expenses, brokerage and other transaction expenses relating to the purchase or sale of portfolio investments, and acquired (underlying) fund fees and expenses) for Class R6 shares do not exceed those of Class I. This agreement will remain in effect until August 31, 2024, and shall renew automatically for one-year terms unless New York Life Investments provides written notice of termination prior to the start of the next term or upon approval of the Board.
During the period May 1, 2023 through October 31, 2023, New York Life Investments earned fees from the Fund in the amount of $1,747,703 and waived fees and/or reimbursed expenses in the amount of $127,038 and paid the Subadvisor fees in the amount of $810,332.
JPMorgan Chase Bank, N.A. ("JPMorgan") provides sub-administration and sub-accounting services to the Fund pursuant to an agreement with New York Life Investments. These services include calculating the daily NAVs of the Fund, maintaining the general ledger and sub-ledger accounts for the calculation of the Fund's NAVs, and assisting New York Life Investments in conducting various aspects of the Fund's administrative operations. For providing these services to the Fund, JPMorgan is compensated by New York Life Investments.
Pursuant to an agreement between the Trust and New York Life Investments, New York Life Investments is responsible for providing or procuring certain regulatory reporting services for the Fund. The Fund will reimburse New York Life Investments for the actual costs incurred by New York Life Investments in connection with providing or procuring these services for the Fund.
(B) Distribution and Service Fees. The Trust, on behalf of the Fund, has entered into a distribution agreement with NYLIFE Distributors LLC (the “Distributor”), an affiliate of New York Life Investments. The Fund has adopted distribution plans (the “Plans”) in accordance with the provisions of Rule 12b-1 under the 1940 Act.
Pursuant to the Class A, Class A2 and Investor Class Plans, the Distributor receives a monthly fee from Class A, Class A2 and Investor Class shares at an annual rate of 0.25% of the average daily net assets of the Class A, Class A2 and Investor Class shares for distribution and/or service activities as designated by the Distributor. Class I shares are not subject to a distribution and/or service fee.
The Plans provide that the distribution and service fees are payable to the Distributor regardless of the amounts actually expended by the Distributor for distribution of the Fund's shares and service activities.
(C) Sales Charges. The Fund was advised by the Distributor that the amount of initial sales charges retained on sales of Class A and Investor Class shares during the period May 1, 2023 through October 31, 2023, were $48 and $50, respectively.
Notes to Financial Statements (continued)
The Fund was also advised that the Distributor retained CDSCs on redemptions of Class A shares during the period May 1, 2023 through October 31, 2023, of $1,592.
(D) Transfer, Dividend Disbursing and Shareholder Servicing Agent. NYLIM Service Company LLC, an affiliate of New York Life Investments, is the Fund's transfer, dividend disbursing and shareholder servicing agent pursuant to an agreement between NYLIM Service Company LLC and the Trust. NYLIM Service Company LLC has entered into an agreement with SS&C Global Investor & Distribution Solutions, Inc. ("SS&C"), pursuant to which SS&C performs certain transfer agent services on behalf of NYLIM Service Company LLC. New York Life Investments has contractually agreed to limit the transfer agency expenses charged to the Fund’s share classes to a maximum of 0.35% of that share class’s average daily net assets on an annual basis after deducting any applicable Fund or class-level expense reimbursement or small account fees. This agreement will remain in effect until August 31, 2024, and shall renew automatically for one-year terms unless New York Life Investments provides written notice of termination prior to the start of the next term or upon approval of the Board. During the period May 1, 2023 through October 31, 2023, transfer agent expenses incurred by the Fund and any reimbursements, pursuant to the aforementioned Transfer Agency expense limitation agreement, were as follows:
| Class | Expense | Waived |
| Class A | $ 53,321 | $ — |
| Class A2 | 9,904 | — |
| Investor Class | 8,023 | (3,902) |
| Class I | 112,703 | — |
| Class R6 | 1,385 | — |
(E) Small Account Fee. Shareholders with small accounts adversely impact the cost of providing transfer agency services. In an effort to reduce total transfer agency expenses, the Fund has implemented a small account fee on certain types of accounts. As described in the Fund's prospectus, certain shareholders with an account balance of less than $1,000 ($5,000 for Class A share accounts) are charged an annual per account fee of $20 (assessed semi-annually), the proceeds from which offset transfer agent fees as reflected in the Statement of Operations. This small account fee will not apply to certain types of accounts as described further in the Fund’s prospectus.
(F) Capital. As of October 31, 2023, New York Life and its affiliates beneficially held shares of the Fund with the values and percentages of net assets as follows:
| Class A | $15,904,213 | 6.4% |
| Class A2 | 24,318 | 0.1 |
| Class R6 | 25,182 | 0.0‡ |
| ‡ | Less than one-tenth of a percent. |
Note 4-Federal Income Tax
As of October 31, 2023, the cost and unrealized appreciation (depreciation) of the Fund’s investment portfolio, including applicable derivative contracts and other financial instruments, as determined on a federal income tax basis, were as follows:
| | Federal Tax
Cost | Gross
Unrealized
Appreciation | Gross
Unrealized
(Depreciation) | Net
Unrealized
Appreciation/
(Depreciation) |
| Investments in Securities | $869,142,521 | $1,141,653 | $(15,280,062) | $(14,138,409) |
As of October 31, 2023, the components of accumulated gain (loss) on a tax basis were as follows:
Ordinary
Income | Undistributed
Tax Exempt
Income | Accumulated
Capital
and Other
Gain (Loss) | Other
Temporary
Differences | Unrealized
Appreciation
(Depreciation) | Total
Accumulated
Gain (Loss) |
| $— | $832,524 | $(83,852,166) | $(836,305) | $(14,138,409) | $(97,994,356) |
The difference between book-basis and tax-basis unrealized appreciation (depreciation) is primarily due to cumulative bond amortization adjustment.
As of October 31, 2023, for federal income tax purposes, capital loss carryforwards of $83,852,166, as shown in the table below, were available to the extent provided by the regulations to offset future realized gains of the Fund. Accordingly, no capital gains distributions are expected to be paid to shareholders until net gains have been realized in excess of such amounts.
Capital Loss
Available Through | Short-Term
Capital Loss
Amounts (000’s) | Long-Term
Capital Loss
Amounts (000’s) |
| Unlimited | $34,175 | $49,677 |
During the period from May 1, 2023 through October 31, 2023 and the years ended April 30, 2023 and April 30, 2022, the tax character of distributions paid as reflected in the Statements of Changes in Net Assets was as follows:
| | 2023 (a) | 2023 | 2022 |
| Distributions paid from: | | | |
| Ordinary Income | $ 2,601,361 | $ 2,442,564 | $ 1,474,609 |
| Exempt Interest Dividends | 12,685,465 | 24,553,878 | 12,687,790 |
| Total | $15,286,826 | $26,996,442 | $14,162,399 |
| (a) | The Fund changed its fiscal year end from April 30 to October 31. |
| 36 | MainStay MacKay Short Term Municipal Fund |
Note 5–Custodian
JPMorgan is the custodian of cash and securities held by the Fund. Custodial fees are charged to the Fund based on the Fund's net assets and/or the market value of securities held by the Fund and the number of certain transactions incurred by the Fund.
Note 6–Line of Credit
The Fund and certain other funds managed by New York Life Investments maintain a line of credit with a syndicate of banks in order to secure a source of funds for temporary purposes to meet unanticipated or excessive redemption requests.
Effective July 25, 2023, under the credit agreement (the “Credit Agreement”), the aggregate commitment amount is $600,000,000 with an additional uncommitted amount of $100,000,000. The commitment fee is an annual rate of 0.15% of the average commitment amount payable quarterly, regardless of usage, to JPMorgan, who serves as the agent to the syndicate. The commitment fee is allocated among the Fund and certain other funds managed by New York Life Investments based upon their respective net assets and other factors. Interest on any revolving credit loan is charged based upon the Federal Funds Rate, Daily Simple Secured Overnight Financing Rate ("SOFR") + 0.10%, or the Overnight Bank Funding Rate, whichever is higher. The Credit Agreement expires on July 23, 2024, although the Fund, certain other funds managed by New York Life Investments and the syndicate of banks may renew the Credit Agreement for an additional year on the same or different terms or enter into a credit agreement with a different syndicate of banks. Prior to July 25, 2023, the aggregate commitment amount and the commitment fee were the same as those under the current Credit Agreement. During the period May 1, 2023 through October 31, 2023, there were no borrowings made or outstanding with respect to the Fund under the Credit Agreement.
Note 7–Interfund Lending Program
Pursuant to an exemptive order issued by the SEC, the Fund, along with certain other funds managed by New York Life Investments, may participate in an interfund lending program. The interfund lending program provides an alternative credit facility that permits the Fund and certain other funds managed by New York Life Investments to lend or borrow money for temporary purposes directly to or from one another, subject to the conditions of the exemptive order. During the period May 1, 2023 through October 31, 2023, there were no interfund loans made or outstanding with respect to the Fund.
Note 8–Purchases and Sales of Securities (in 000’s)
During the period May 1, 2023 through October 31, 2023, purchases and sales of securities, other than short-term securities, were $575,791 and $747,554, respectively.
Note 9–Capital Share Transactions
Transactions in capital shares for the period May 1, 2023 through October 31, 2023, and years ended April 30, 2023 and April 30, 2022, were as follows:
| Class A | Shares | Amount |
| Period ended October 31, 2023:(a) | | |
| Shares sold | 1,870,237 | $ 17,187,666 |
| Shares issued to shareholders in reinvestment of distributions | 263,992 | 2,420,096 |
| Shares redeemed | (7,553,491) | (69,379,606) |
| Net increase (decrease) in shares outstanding before conversion | (5,419,262) | (49,771,844) |
| Shares converted into Class A (See Note 1) | 13,312 | 122,864 |
| Shares converted from Class A (See Note 1) | (126,704) | (1,157,314) |
| Net increase (decrease) | (5,532,654) | $ (50,806,294) |
| Year ended April 30, 2023: | | |
| Shares sold | 14,755,906 | $ 136,977,313 |
| Shares issued to shareholders in reinvestment of distributions | 417,462 | 3,867,588 |
| Shares redeemed | (26,092,382) | (241,951,367) |
| Net increase (decrease) in shares outstanding before conversion | (10,919,014) | (101,106,466) |
| Shares converted into Class A (See Note 1) | 112,523 | 1,047,020 |
| Shares converted from Class A (See Note 1) | (66,834) | (614,825) |
| Net increase (decrease) | (10,873,325) | $ (100,674,271) |
| Year ended April 30, 2022: | | |
| Shares sold | 25,468,868 | $ 246,761,379 |
| Shares issued to shareholders in reinvestment of distributions | 157,184 | 1,513,215 |
| Shares redeemed | (33,406,373) | (322,275,514) |
| Net increase (decrease) in shares outstanding before conversion | (7,780,321) | (74,000,920) |
| Shares converted into Class A (See Note 1) | 41,919 | 402,782 |
| Shares converted from Class A (See Note 1) | (261) | (2,536) |
| Net increase (decrease) | (7,738,663) | $ (73,600,674) |
| |
Notes to Financial Statements (continued)
| Class A2 | Shares | Amount |
| Period ended October 31, 2023:(a) | | |
| Shares sold | 344,203 | $ 3,175,535 |
| Shares issued to shareholders in reinvestment of distributions | 81,724 | 750,087 |
| Shares redeemed | (972,402) | (8,934,549) |
| Net increase (decrease) | (546,475) | $ (5,008,927) |
| Year ended April 30, 2023: | | |
| Shares sold | 1,728,867 | $ 16,042,719 |
| Shares issued to shareholders in reinvestment of distributions | 138,904 | 1,288,714 |
| Shares redeemed | (6,577,094) | (60,995,488) |
| Net increase (decrease) in shares outstanding before conversion | (4,709,323) | (43,664,055) |
| Shares converted from Class A2 (See Note 1) | (41,230) | (384,679) |
| Net increase (decrease) | (4,750,553) | $ (44,048,734) |
| Year ended April 30, 2022: | | |
| Shares sold | 8,256,657 | $ 80,252,982 |
| Shares issued to shareholders in reinvestment of distributions | 62,731 | 604,025 |
| Shares redeemed | (6,763,650) | (64,920,522) |
| Net increase (decrease) | 1,555,738 | $ 15,936,485 |
| |
| Investor Class | Shares | Amount |
| Period ended October 31, 2023:(a) | | |
| Shares sold | 14,082 | $ 129,864 |
| Shares issued to shareholders in reinvestment of distributions | 3,207 | 29,475 |
| Shares redeemed | (32,530) | (299,121) |
| Net increase (decrease) in shares outstanding before conversion | (15,241) | (139,782) |
| Shares converted into Investor Class (See Note 1) | 114 | 1,056 |
| Shares converted from Investor Class (See Note 1) | (9,877) | (91,304) |
| Net increase (decrease) | (25,004) | $ (230,030) |
| Year ended April 30, 2023: | | |
| Shares sold | 97,897 | $ 913,758 |
| Shares issued to shareholders in reinvestment of distributions | 4,211 | 39,108 |
| Shares redeemed | (104,885) | (974,735) |
| Net increase (decrease) in shares outstanding before conversion | (2,777) | (21,869) |
| Shares converted into Investor Class (See Note 1) | 114 | 1,056 |
| Shares converted from Investor Class (See Note 1) | (35,836) | (333,994) |
| Net increase (decrease) | (38,499) | $ (354,807) |
| Year ended April 30, 2022: | | |
| Shares sold | 125,760 | $ 1,214,335 |
| Shares issued to shareholders in reinvestment of distributions | 750 | 7,255 |
| Shares redeemed | (145,542) | (1,409,867) |
| Net increase (decrease) in shares outstanding before conversion | (19,032) | (188,277) |
| Shares converted into Investor Class (See Note 1) | 261 | 2,536 |
| Shares converted from Investor Class (See Note 1) | (41,789) | (402,782) |
| Net increase (decrease) | (60,560) | $ (588,523) |
| |
| 38 | MainStay MacKay Short Term Municipal Fund |
| Class I | Shares | Amount |
| Period ended October 31, 2023:(a) | | |
| Shares sold | 5,753,903 | $ 52,875,155 |
| Shares issued to shareholders in reinvestment of distributions | 684,624 | 6,276,707 |
| Shares redeemed | (21,765,106) | (200,002,409) |
| Net increase (decrease) in shares outstanding before conversion | (15,326,579) | (140,850,547) |
| Shares converted into Class I (See Note 1) | 499,718 | 4,603,963 |
| Shares converted from Class I (See Note 1) | (9,503) | (88,069) |
| Net increase (decrease) | (14,836,364) | $ (136,334,653) |
| Year ended April 30, 2023: | | |
| Shares sold | 70,614,891 | $ 654,927,375 |
| Shares issued to shareholders in reinvestment of distributions | 1,213,482 | 11,244,993 |
| Shares redeemed | (109,796,158) | (1,017,816,790) |
| Net increase (decrease) in shares outstanding before conversion | (37,967,785) | (351,644,422) |
| Shares converted into Class I (See Note 1) | 66,720 | 613,769 |
| Shares converted from Class I (See Note 1) | (11,419,110) | (105,855,146) |
| Net increase (decrease) | (49,320,175) | $ (456,885,799) |
| Year ended April 30, 2022: | | |
| Shares sold | 117,202,202 | $ 1,132,883,199 |
| Shares issued to shareholders in reinvestment of distributions | 730,370 | 7,033,453 |
| Shares redeemed | (140,847,545) | (1,355,438,314) |
| Net increase (decrease) | (22,914,973) | $ (215,521,662) |
| |
| Class R6 | Shares | Amount |
| Period ended October 31, 2023:(a) | | |
| Shares sold | 670,855 | $ 6,131,854 |
| Shares issued to shareholders in reinvestment of distributions | 6,860 | 62,936 |
| Shares redeemed | (3,557,734) | (32,705,763) |
| Net increase (decrease) in shares outstanding before conversion | (2,880,019) | (26,510,973) |
| Shares converted into Class R6 (See Note 1) | 8,091 | 74,919 |
| Shares converted from Class R6 (See Note 1) | (375,523) | (3,466,115) |
| Net increase (decrease) | (3,247,451) | $ (29,902,169) |
| Period ended April 30, 2023:(b) | | |
| Shares sold | 7,275,651 | $ 67,368,331 |
| Shares issued to shareholders in reinvestment of distributions | 9,739 | 90,162 |
| Shares redeemed | (9,471,562) | (87,314,013) |
| Net increase (decrease) in shares outstanding before conversion | (2,186,172) | (19,855,520) |
| Shares converted into Class R6 (See Note 1) | 11,431,231 | 105,853,196 |
| Shares converted from Class R6 (See Note 1) | (35,110) | (326,397) |
| Net increase (decrease) | 9,209,949 | $ 85,671,279 |
| (a) | The Fund changed its fiscal year end from April 30 to October 31. |
| (b) | The inception date of the class was May 2, 2022. |
Note 10–Other Matters
As of the date of this report, the Fund faces a heightened level of risk associated with current uncertainty, volatility and state of economies, financial markets, rising interest rates, and labor and health conditions around the world. Events such as war, acts of terrorism, recessions, rapid inflation, the imposition of international sanctions, earthquakes, hurricanes, epidemics and pandemics and other unforeseen natural or human disasters may have broad adverse social, political and economic effects on the global economy, which could negatively impact the value of the Fund's investments. Developments that disrupt global economies and financial markets may magnify factors that affect the Fund's performance.
Note 11–Subsequent Events
In connection with the preparation of the financial statements of the Fund as of and for the period May 1, 2023 through October 31, 2023, events and transactions subsequent to October 31, 2023, through the date the financial statements were issued have been evaluated by the Manager for possible adjustment and/or disclosure. No subsequent events requiring financial statement adjustment or disclosure have been identified.
Report of Independent Registered Public Accounting Firm
To the Shareholders of the Fund and Board of Trustees
MainStay Funds Trust:
Opinion on the Financial Statements
We have audited the accompanying statement of assets and liabilities of MainStay MacKay Short Term Municipal Fund (the Fund), one of the funds constituting MainStay Funds Trust, including the portfolio of investments, as of October 31, 2023, the related statements of operations for the period May 1, 2023 through October 31, 2023 and the year ended April 30, 2023, the statements of changes in net assets for the period May 1, 2023 through October 1, 2023 and the years ended April 30, 2023 and April 30, 2022, and the related notes (collectively, the financial statements) and the financial highlights for the period May 1, 2023 through October 1, 2023 and for each of the years or periods in the five-year period ended April 30, 2023. In our opinion, the financial statements and financial highlights present fairly, in all material respects, the financial position of the Fund as of October 31, 2023, the results of its operations for the period May 1, 2023 through October 31, 2023 and the year ended April 30, 2023, the changes in its net assets for the period May 1, 2023 through October 1, 2023 and the years ended April 30, 2023 and April 30, 2022, and the financial highlights for the period May 1, 2023 through October 1, 2023 and for each of the years or periods in the five-year period ended April 30, 2023, in conformity with U.S. generally accepted accounting principles.
Basis for Opinion
These financial statements and financial highlights are the responsibility of the Fund's management. Our responsibility is to express an opinion on these financial statements and financial highlights based on our audits. We are a public accounting firm registered with the Public Company Accounting Oversight Board (United States) (PCAOB) and are required to be independent with respect to the Fund in accordance with the U.S. federal securities laws and the applicable rules and regulations of the Securities and Exchange Commission and the PCAOB.
We conducted our audits in accordance with the standards of the PCAOB. Those standards require that we plan and perform the audit to obtain reasonable assurance about whether the financial statements and financial highlights are free of material misstatement, whether due to error or fraud. Our audits included performing procedures to assess the risks of material misstatement of the financial statements and financial highlights, whether due to error or fraud, and performing procedures that respond to those risks. Such procedures included examining, on a test basis, evidence regarding the amounts and disclosures in the financial statements and financial highlights. Such procedures also included confirmation of securities owned as of October 31, 2023, by correspondence with the custodian and brokers; when replies were not received from brokers, we performed other auditing procedures.. Our audits also included evaluating the accounting principles used and significant estimates made by management, as well as evaluating the overall presentation of the financial statements and financial highlights. We believe that our audits provide a reasonable basis for our opinion.

We have served as the auditor of one or more New York Life Investment Management investment companies since 2003.
Philadelphia, Pennsylvania
December 22, 2023
| 40 | MainStay MacKay Short Term Municipal Fund |
Federal Income Tax Information
(Unaudited)
The Fund is required under the Internal Revenue Code to advise shareholders in a written statement as to the federal tax status of dividends paid by the Fund during such fiscal years.
For Federal individual income tax purposes, the Fund designated 83.0% of the ordinary income dividends paid during its fiscal year ended October 31, 2023 as attributable to interest income from Tax Exempt Municipal Bonds. Such dividends are currently exempt from Federal income taxes under Section 103(a) of the Internal Revenue Code.
In February 2024, shareholders will receive an IRS Form 1099-DIV or substitute Form 1099, which will show the federal tax status of the distributions received by shareholders in calendar year 2023. The amounts that will be reported on such 1099-DIV or substitute Form 1099 will be the amounts you are to use on your federal income tax return and will differ from the amounts which we must report for the Fund's fiscal year ended October 31, 2023.
Proxy Voting Policies and Procedures and Proxy Voting Record
The Fund is required to file with the SEC its proxy voting record for the 12-month period ending June 30 on Form N-PX. A description of the policies and procedures that are used to vote proxies relating to portfolio securities of the Fund is available free of charge upon request by calling 800-624-6782 or visiting the SEC’s website at www.sec.gov. The most recent Form N-PX or proxy voting record is available free of charge upon request by calling 800-624-6782; visiting newyorklifeinvestments.com; or visiting the SEC’s website at www.sec.gov.
Shareholder Reports and Quarterly Portfolio Disclosure
The Fund is required to file its complete schedule of portfolio holdings with the SEC 60 days after its first and third fiscal quarter on Form N-PORT. The Fund's holdings report is available free of charge upon request by calling New York Life Investments at 800-624-6782.
Board of Trustees and Officers (Unaudited)
The Trustees and officers of the Fund are listed below. The Board oversees the MainStay Group of Funds (which consists of MainStay Funds and MainStay Funds Trust), MainStay VP Funds Trust, MainStay MacKay DefinedTerm Municipal Opportunities Fund, MainStay CBRE Global Infrastructure Megatrends Term Fund, the Manager and the Subadvisors, and elects the officers of the Funds who are responsible for the day-to-day operations of the Fund. Information pertaining to the Trustees and officers is set forth below. Each Trustee serves until his or her successor is elected and qualified or until his or her resignation, death or
removal. Under the Board’s retirement policy, unless an exception is made, a Trustee must tender his or her resignation by the end of the calendar year during which he or she reaches the age of 75. Officers are elected annually by the Board. The business address of each Trustee and officer listed below is 51 Madison Avenue, New York, New York 10010. A majority of the Trustees are not “interested persons” (as defined by the 1940 Act and rules adopted by the SEC thereunder) of the Fund (“Independent Trustees”).
| | Name and
Year of Birth | Term of Office,
Position(s) Held and
Length of Service | Principal Occupation(s)
During Past Five Years | Number of
Portfolios in
Fund Complex
Overseen by
Trustee | Other Directorships
Held by Trustee |
| | | | | | |
| | Naïm Abou-Jaoudé*
1966 | MainStay Funds: Trustee
since 2023
MainStay Funds Trust:
Trustee since 2023 | Chief Executive Officer of New York Life Investment Management LLC (since 2023). Chief Executive Officer of Candriam (an affiliate of New York Life Investment Management LLC) (2007 to 2023). | 81 | MainStay VP Funds Trust:
Trustee since 2023 (31 portfolios);
MainStay MacKay DefinedTerm Municipal Opportunities Fund: Trustee
since 2023;
MainStay CBRE Global Infrastructure Megatrends Term Fund: Trustee
since 2023; and
New York Life Investment Management International (Chair) since 2015 |
| * | This Trustee is considered to be an “interested person” of the MainStay Group of Funds, MainStay VP Funds Trust, MainStay CBRE Global Infrastructure Megatrends Term Fund and MainStay MacKay DefinedTerm Municipal Opportunities Fund, within the meaning of the 1940 Act because of his affiliation with New York Life Investment Management LLC and Candriam, as described in detail above in the column entitled “Principal Occupation(s) During Past Five Years.” |
| | |
| 42 | MainStay MacKay Short Term Municipal Fund |
| | Name and
Year of Birth | Term of Office,
Position(s) Held and
Length of Service | Principal Occupation(s)
During Past Five Years | Number of
Portfolios in
Fund Complex
Overseen by
Trustee | Other Directorships
Held by Trustee |
| | | | | | |
| | David H. Chow
1957 | MainStay Funds: Trustee since January 2016, Advisory Board Member (June 2015 to December 2015);MainStay Funds Trust:
Trustee since January 2016, Advisory Board Member (June 2015 to December 2015) | Founder and CEO, DanCourt Management, LLC (since 1999) | 81 | MainStay VP Funds Trust: Trustee since January 2016, Advisory Board Member (June 2015 to December 2015) (31 portfolios);
MainStay MacKay DefinedTerm Municipal Opportunities Fund: Trustee since January 2016, Advisory Board Member (June 2015 to December 2015);
MainStay CBRE Global Infrastructure Megatrends Term Fund: Trustee since 2021;
VanEck Vectors Group of Exchange-Traded Funds: Trustee since 2006 and Independent Chairman of the Board of Trustees from 2008 to 2022 (57 portfolios); and
Berea College of Kentucky: Trustee since 2009, Chair of the Investment Committee since 2018 |
| | Karen Hammond
1956 | MainStay Funds: Trustee since December 2021, Advisory Board Member (June 2021 to December 2021);MainStay Funds Trust:
Trustee since December 2021, Advisory Board Member (June 2021 to December 2021)
| Retired, Managing Director, Devonshire Investors (2007 to 2013); Senior Vice President, Fidelity Management & Research Co. (2005 to 2007); Senior Vice President and Corporate Treasurer, FMR Corp. (2003 to 2005); Chief Operating Officer, Fidelity Investments Japan (2001 to 2003) | 81 | MainStay VP Funds Trust: Trustee since December 2021, Advisory Board Member (June 2021 to December 2021) (31 portfolios);
MainStay MacKay DefinedTerm Municipal Opportunities Fund: Trustee since December 2021, Advisory Board Member (June 2021 to December 2021);
MainStay CBRE Global Infrastructure Megatrends Term Fund: Trustee since December 2021, Advisory Board Member (June 2021 to December 2021);
Two Harbors Investment Corp.: Director since 2018;
Rhode Island State Investment Commission: Member since 2017; and
Blue Cross Blue Shield of Rhode Island: Director since 2019 |
| | Susan B. Kerley
1951 | MainStay Funds: Chair since January 2017 and Trustee since 2007;MainStay Funds Trust:
Chair since January 2017 and Trustee since 1990*** | President, Strategic Management Advisors LLC (since 1990) | 81 | MainStay VP Funds Trust: Chair since January 2017 and Trustee since 2007 (31 portfolios)**;
MainStay MacKay DefinedTerm Municipal Opportunities Fund: Chair since January 2017 and Trustee since 2011;
MainStay CBRE Global Infrastructure Megatrends Term Fund: Trustee since June 2021; and
Legg Mason Partners Funds: Trustee since 1991 (45 portfolios) |
Board of Trustees and Officers (Unaudited) (continued)
| | Name and
Year of Birth | Term of Office,
Position(s) Held and
Length of Service | Principal Occupation(s)
During Past Five Years | Number of
Portfolios in
Fund Complex
Overseen by
Trustee | Other Directorships
Held by Trustee |
| | | | | | |
| | Alan R. Latshaw
1951 | MainStay Funds: Trusteesince 2006;MainStay Funds Trust:
Trustee since 2007*** | Retired; Partner, Ernst & Young LLP (2002 to 2003); Partner, Arthur Andersen LLP (1989 to 2002); Consultant to the MainStay Funds Audit and Compliance Committee (2004 to 2006) | 81 | MainStay VP Funds Trust: Trustee since 2007 (31 portfolios)**;
MainStay MacKay DefinedTerm Municipal Opportunities Fund: Trustee since 2011; and
MainStay CBRE Global Infrastructure Megatrends Term Fund: Trustee since June 2021 |
| | Jacques P. Perold
1958 | MainStay Funds: Trustee since January 2016, Advisory Board Member (June 2015to December 2015);MainStay Funds Trust:
Trustee since January 2016, Advisory Board Member (June 2015 to December 2015) | Founder and Chief Executive Officer, CapShift Advisors LLC (since 2018); President, Fidelity Management & Research Company (2009 to 2014); President and Chief Investment Officer, Geode Capital Management, LLC (2001 to 2009) | 81 | MainStay VP Funds Trust: Trustee since January 2016, Advisory Board Member (June 2015 to December 2015) (31 portfolios);
MainStay MacKay DefinedTerm Municipal Opportunities Fund: Trustee since January 2016, Advisory Board Member (June 2015 to December 2015);
MainStay CBRE Global Infrastructure Megatrends Term Fund: Trustee since June 2021;
Allstate Corporation: Director since 2015; and
MSCI Inc.: Director since 2017 |
| | Richard S. Trutanic
1952 | MainStay Funds: Trustee since 1994;MainStay Funds Trust:
Trustee since 2007*** | Chairman and Chief Executive Officer, Somerset & Company (financial advisory firm) (since 2004); Managing Director, The Carlyle Group (private investment firm) (2002 to 2004); Senior Managing Director, Partner and Board Member, Groupe Arnault S.A. (private investment firm) (1999 to 2002) | 81 | MainStay VP Funds Trust: Trustee since 2007 (31 portfolios)**;
MainStay MacKay DefinedTerm Municipal Opportunities Fund: Trustee since 2011; and
MainStay CBRE Global Infrastructure Megatrends Term Fund: Trustee since June 2021 |
| ** | Includes prior service as a Director of MainStay VP Series Fund, Inc., the predecessor to MainStay VP Funds Trust. |
| *** | Includes prior service as a Director/Trustee of certain predecessor entities to MainStay Funds Trust. |
| 44 | MainStay MacKay Short Term Municipal Fund |
| | Name and
Year of Birth | Position(s) Held and
Length of Service | Principal Occupation(s)
During Past Five Years | |
| | | | | |
| | Kirk C. Lehneis
1974 | President, MainStay Funds, MainStay Funds Trust (since 2017) | Chief Operating Officer and Senior Managing Director (since 2016), New York Life Investment Management LLC and New York Life Investment Management Holdings LLC; Member of the Board of Managers (since 2017) and Senior Managing Director (since 2018), NYLIFE Distributors LLC; Chairman of the Board and Senior Managing Director, NYLIM Service Company LLC (since 2017); Trustee, President and Principal Executive Officer of IndexIQ Trust, IndexIQ ETF Trust and IndexIQ Active ETF Trust (since 2018); President, MainStay CBRE Global Infrastructure Megatrends Term Fund (since 2021), MainStay MacKay DefinedTerm Municipal Opportunities Fund and MainStay VP Funds Trust (since 2017)**; Senior Managing Director, Global Product Development (2015 to 2016); Managing Director, Product Development (2010 to 2015), New York Life Investment Management LLC | |
| | Jack R. Benintende
1964 | Treasurer and Principal Financial and Accounting Officer, MainStay Funds (since 2007), MainStay Funds Trust (since 2009) | Managing Director, New York Life Investment Management LLC (since 2007); Treasurer and Principal Financial and Accounting Officer, MainStay CBRE Global Infrastructure Megatrends Term Fund (since 2021), MainStay MacKay DefinedTerm Municipal Opportunities Fund (since 2011) and MainStay VP Funds Trust (since 2007)**; and Assistant Treasurer, New York Life Investment Management Holdings LLC (2008 to 2012) | |
| | J. Kevin Gao
1967 | Secretary and Chief Legal Officer, MainStay Funds and MainStay Funds Trust (since 2010) | Managing Director and Associate General Counsel, New York Life Investment Management LLC (since 2010); Secretary and Chief Legal Officer, MainStay CBRE Global Infrastructure Megatrends Term Fund (since 2021), MainStay MacKay DefinedTerm Municipal Opportunities Fund (since 2011) and MainStay VP Funds Trust (since 2010)** | |
| | Kevin M. Gleason
1967 | Vice President and Chief Compliance Officer, MainStay Funds and MainStay Funds Trust (since June 2022) | Vice President and Chief Compliance Officer, IndexIQ Trust, IndexIQ ETF Trust and Index IQ Active ETF Trust (since June 2022); Vice President and Chief Compliance Officer, MainStay CBRE Global Infrastructure Megatrends Term Fund, MainStay VP Funds Trust and MainStay MacKay DefinedTerm Municipal Opportunities Fund (since June 2022); Senior Vice President, Voya Investment Management and Chief Compliance Officer, Voya Family of Funds (2012 to 2022) | |
| | Scott T. Harrington
1959 | Vice President— Administration, MainStay Funds (since 2005), MainStay Funds Trust (since 2009) | Managing Director, New York Life Investment Management LLC (including predecessor advisory organizations) (since 2000); Member of the Board of Directors, New York Life Trust Company (since 2009); Vice President—Administration, MainStay CBRE Global Infrastructure Megatrends Term Fund (since 2021), MainStay MacKay DefinedTerm Municipal Opportunities Fund (since 2011) and MainStay VP Funds Trust (since 2005)** | |
| * | The officers listed above are considered to be “interested persons” of the MainStay Group of Funds, MainStay VP Funds Trust, MainStay CBRE Global Infrastructure Megatrends Term Fund and MainStay MacKay DefinedTerm Municipal Opportunities Fund within the meaning of the 1940 Act because of their affiliation with the MainStay Group of Funds, New York Life Insurance Company and/or its affiliates, including New York Life Investment Management LLC, New York Life Insurance Company, NYLIM Service Company LLC, NYLIFE Securities LLC and/or NYLIFE Distributors LLC, as described in detail in the column captioned “Principal Occupation(s) During Past Five Years.” Officers are elected annually by the Board. |
| ** | Includes prior service as an Officer of MainStay VP Series Fund, Inc., the predecessor to MainStay VP Funds Trust. |
Officers of the Trust (Who are not Trustees)*
This page intentionally left blank.
Equity
U.S. Equity
MainStay Epoch U.S. Equity Yield Fund
MainStay Fiera SMID Growth Fund
MainStay PineStone U.S. Equity Fund
MainStay S&P 500 Index Fund
MainStay Winslow Large Cap Growth Fund
MainStay WMC Enduring Capital Fund
MainStay WMC Growth Fund
MainStay WMC Small Companies Fund
MainStay WMC Value Fund
International Equity
MainStay Epoch International Choice Fund
MainStay PineStone International Equity Fund
MainStay WMC International Research Equity Fund
Emerging Markets Equity
MainStay Candriam Emerging Markets Equity Fund
Global Equity
MainStay Epoch Capital Growth Fund
MainStay Epoch Global Equity Yield Fund
MainStay PineStone Global Equity Fund
Fixed Income
Taxable Income
MainStay Candriam Emerging Markets Debt Fund
MainStay Floating Rate Fund
MainStay MacKay High Yield Corporate Bond Fund
MainStay MacKay Short Duration High Yield Fund
MainStay MacKay Strategic Bond Fund
MainStay MacKay Total Return Bond Fund
MainStay MacKay U.S. Infrastructure Bond Fund
MainStay Short Term Bond Fund
Tax-Exempt Income
MainStay MacKay California Tax Free Opportunities Fund1
MainStay MacKay High Yield Municipal Bond Fund
MainStay MacKay New York Tax Free Opportunities Fund2
MainStay MacKay Short Term Municipal Fund
MainStay MacKay Strategic Municipal Allocation Fund
MainStay MacKay Tax Free Bond Fund
Money Market
MainStay Money Market Fund
Mixed Asset
MainStay Balanced Fund
MainStay Income Builder Fund
MainStay MacKay Convertible Fund
Speciality
MainStay CBRE Global Infrastructure Fund
MainStay CBRE Real Estate Fund
MainStay Cushing MLP Premier Fund
Asset Allocation
MainStay Conservative Allocation Fund
MainStay Conservative ETF Allocation Fund
MainStay Defensive ETF Allocation Fund
MainStay Equity Allocation Fund
MainStay Equity ETF Allocation Fund
MainStay ESG Multi-Asset Allocation Fund
MainStay Growth Allocation Fund
MainStay Growth ETF Allocation Fund
MainStay Moderate Allocation Fund
MainStay Moderate ETF Allocation Fund
Manager
New York Life Investment Management LLC
New York, New York
Subadvisors
Candriam3
Strassen, Luxembourg
CBRE Investment Management Listed Real Assets LLC
Radnor, Pennsylvania
Cushing Asset Management, LP
Dallas, Texas
Epoch Investment Partners, Inc.
New York, New York
Fiera Capital Inc.
New York, New York
IndexIQ Advisors LLC3
New York, New York
MacKay Shields LLC3
New York, New York
NYL Investors LLC3
New York, New York
PineStone Asset Management Inc.
Montreal, Québec
Wellington Management Company LLP
Boston, Massachusetts
Winslow Capital Management, LLC
Minneapolis, Minnesota
Legal Counsel
Dechert LLP
Washington, District of Columbia
Independent Registered Public Accounting Firm
KPMG LLP
Philadelphia, Pennsylvania
Distributor
NYLIFE Distributors LLC3
Jersey City, New Jersey
Custodian
JPMorgan Chase Bank, N.A.
New York, New York
1.
This Fund is registered for sale in AZ, CA, NV, OR, TX, UT, WA and MI (Class A and Class I shares only), and CO, FL, GA, HI, ID, MA, MD, NH, NJ and NY (Class I shares only).
| 2. | This Fund is registered for sale in CA, CT, DE, FL, MA, NJ, NY and VT. |
| 3. | An affiliate of New York Life Investment Management LLC. |
Not part of the Annual Report
For more information
800-624-6782
newyorklifeinvestments.com
“New York Life Investments” is both a service mark, and the common trade name, of certain investment advisors affiliated with New York Life Insurance Company. The MainStay Funds® are managed by New York Life Investment Management LLC and distributed by NYLIFE Distributors LLC, 30 Hudson Street, Jersey City, NJ 07302, a wholly owned subsidiary of New York Life Insurance Company. NYLIFE Distributors LLC is a Member FINRA/SIPC.
©2023 NYLIFE Distributors LLC. All rights reserved.
| 5013757MS139-23 | MSSTM11-12/23 |
(NYLIM) NL230
MainStay MacKay Strategic Municipal Allocation Fund
Message from the President and Annual Report
October 31, 2023
Special Notice:
Beginning in July 2024, new regulations issued by the Securities and Exchange Commission (SEC) will take effect requiring open-end mutual fund companies and ETFs to (1) overhaul the content of their shareholder reports and (2) mail paper copies of the new tailored shareholder reports to shareholders who have not opted to receive these documents electronically.
If you have not yet elected to receive your shareholder reports electronically, please contact your financial intermediary or visit newyorklifeinvestments.com/accounts.
| Not FDIC/NCUA Insured | Not a Deposit | May Lose Value | No Bank Guarantee | Not Insured by Any Government Agency |
This page intentionally left blank
Message from the President
Interest rates and inflation were the primary forces driving market behavior during the six-month reporting period ended October 31, 2023, with equity indices delivering mixed performance while bond indices generally declined.
U.S. inflation levels, as measured by the Consumer Price Index, ranged between 3.0% and 4.0% throughout the reporting period, down from the peak of 9.1% in June 2022, although well above the 2.0% target set by the U.S. Federal Reserve (the “Fed”). At the same time, the benchmark federal funds rate climbed to over 5%, its highest level since the financial crisis of 2007, as the Fed attempted to drive inflation still lower. Comments from Fed members reinforced the central bank’s hawkish stance in response to surprisingly robust U.S. economic growth and rising wage pressures, thus increasing the likelihood that interest rates would stay higher for longer. International developed markets exhibited similar dynamics of persistently elevated inflation and rising interest rates.
Against a backdrop of high interest rates, political dysfunction in Washington D.C. and intensifying global geopolitical instability—including the ongoing war in Ukraine and the outbreak of hostilities in the Middle East—equity markets struggled to advance. The S&P 500® Index, a widely regarded benchmark of large-cap U.S. market performance, eked out a slight gain, bolstered by the strong performance of mega-cap, growth-oriented, technology-related shares as investors flocked to companies creating the infrastructure for developments in artificial intelligence. However, smaller-cap stocks and value-oriented shares trended lower. Among industry sectors, information technology posted the strongest gains, followed by consumer discretionary, which rose in response to healthy consumer spending trends, while energy shares benefited from rising petroleum prices. All other sectors lost ground. Utilities declined most sharply as rising interest rates undermined the appeal of high-yielding stocks, while real estate came under pressure from
rising mortgage rates and weak levels of office occupancy, and consumer staples declined as market sentiment turned away from defensive, value-oriented businesses. International equities broadly trailed their U.S. counterparts as economic growth in the rest of world generally lagged that of the United States, and as the U.S. dollar rose in value compared to most other global currencies.
Bond prices were driven lower by rising yields and increasing expectations of high interest rates for an extended period of time. The U.S. yield curve steepened, with the 30-year Treasury yield exceeding 5% for the first time in more than a decade. The yield curve remained inverted, with the 10-year Treasury yield ending the period at 4.88%, compared with 5.07% for the 2-year Treasury yield. Corporate bonds outperformed long-term Treasury bonds, but still trended lower under pressure from rising yields and an uptick in default rates. Among corporates, lower-credit-quality instruments performed relatively well compared to their higher-credit-quality counterparts, while floating rate securities performed better still.
In the face of today’s uncertain market environment, New York Life Investments remains dedicated to providing the guidance, resources and investment solutions you need to pursue your financial goals.
Thank you for trusting us to help meet your investment needs.
Sincerely,
Kirk C. Lehneis
President
The opinions expressed are as of the date of this report and are subject to change. There is no guarantee that any forecast made will come to pass. This material does not constitute investment advice and is not intended as an endorsement of any specific investment. Past performance is no guarantee of future results.
Not part of the Annual Report
Investors should refer to the Fund’s Summary Prospectus and/or Prospectus and consider the Fund’s investment objectives, strategies, risks, charges and expenses carefully before investing. The Summary Prospectus and/or Prospectus contain this and other information about the Fund. You may obtain copies of the Fund’s Summary Prospectus, Prospectus and Statement of Additional Information, which includes information about the MainStay Funds Trust's Trustees, free of charge, upon request, by calling toll-free 800-624-6782, by writing to NYLIFE Distributors LLC, Attn: MainStay Marketing Department, 30 Hudson Street, Jersey City, NJ 07302 or by sending an e-mail to MainStayShareholderServices@nylim.com. These documents are also available via the MainStay Funds’ website at newyorklifeinvestments.com. Please read the Fund’s Summary Prospectus and/or Prospectus carefully before investing.
Investment and Performance Comparison (Unaudited)
Performance data quoted represents past performance. Past performance is no guarantee of future results. Because of market volatility and other factors, current performance may be lower or higher than the figures shown. Investment return and principal value will fluctuate, and as a result, when shares are redeemed, they may be worth more or less than their original cost. The graph below depicts the historical performance of Class I shares of the Fund. Performance will vary from class to class based on differences in class-specific expenses and sales charges. For performance information current to the most recent month-end, please call 800-624-6782 or visit newyorklifeinvestments.com.
The performance table and graph do not reflect the deduction of taxes that a shareholder would pay on distributions or Fund share redemptions. Total returns reflect maximum applicable sales charges as indicated in the table below, if any, changes in share price, and reinvestment of dividend and capital gain distributions. The graph assumes the initial investment amount shown below and reflects the deduction of all sales charges that would have applied for the period of investment. Performance figures may reflect certain fee waivers and/or expense limitations, without which total returns may have been lower. For more information on share classes and current fee waivers and/or expense limitations (if any), please refer to the Notes to Financial Statements.
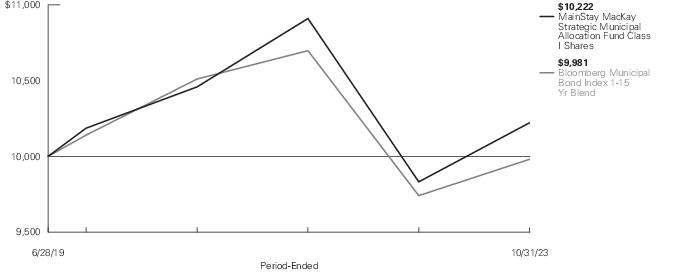
| Average Annual Total Returns for the Period-Ended October 31, 2023 |
| Class | Sales Charge | | Inception
Date1 | Six
Months2 | One
Year | Since
Inception | Gross
Expense
Ratio3 |
| Class A Shares4 | Maximum 3.00% Initial Sales Charge | With sales charges | 6/28/2019 | -5.55% | 0.70% | -0.75% | 0.84% |
| | | Excluding sales charges | | -2.63 | 3.81 | 0.31 | 0.84 |
| Investor Class Shares5, 6 | Maximum 2.50% Initial Sales Charge | With sales charges | 6/28/2019 | -5.12 | 1.09 | -0.93 | 0.99 |
| | | Excluding sales charges | | -2.69 | 3.68 | 0.12 | 0.99 |
| Class C Shares | Maximum 1.00% CDSC | With sales charges | 6/28/2019 | -3.77 | 2.42 | -0.16 | 1.25 |
| | if Redeemed Within 18 Months of Purchase | Excluding sales charges | | -2.82 | 3.42 | -0.16 | 1.25 |
| Class C2 Shares | Maximum 1.00% CDSC | With sales charges | 12/13/2022 | -3.85 | N/A | -2.60 | 1.41 |
| | if Redeemed Within One Year of Purchase | Excluding sales charges | | -2.89 | N/A | -1.64 | 1.41 |
| Class I Shares | No Sales Charge | | 6/28/2019 | -2.52 | 3.96 | 0.51 | 0.59 |
| Class R6 Shares | No Sales Charge | | 6/28/2019 | -2.50 | 4.11 | 0.52 | 0.55 |
| 1. | Effective at the close of business on May 1, 2023, the Fund changed its fiscal and tax year end from April 30 to October 31. |
| 2. | Not annualized. |
| 3. | The gross expense ratios presented reflect the Fund’s “Total Annual Fund Operating Expenses” from the most recent Prospectus, as supplemented, and may differ from other expense ratios disclosed in this report. |
| 4. | Prior to August 10, 2022, the maximum initial sales charge was 4.50%, which is reflected in the applicable average annual total return figures shown. |
| 5. | Prior to June 30, 2020, the maximum initial sales charge was 4.50%, which is reflected in the applicable average annual total return figures shown. |
| 6. | Prior to August 10, 2022, the maximum initial sales charge was 4.00%, which is reflected in the applicable average annual total return figures shown. |
The footnotes on the next page are an integral part of the table and graph and should be carefully read in conjunction with them.
| Benchmark Performance* | Six
Months1 | One
Year | Since
Inception |
| Bloomberg Municipal Bond Index 1-15 Yr Blend2 | -3.38% | 2.47% | -0.04% |
| Morningstar Muni National Intermediate Category Average3 | -3.86 | 2.24 | -0.56 |
| * | Returns for indices reflect no deductions for fees, expenses or taxes, except for foreign withholding taxes where applicable. Results assume reinvestment of all dividends and capital gains. An investment cannot be made directly in an index. |
| 1. | Not annualized. |
| 2. | The Bloomberg Municipal Bond Index 1-15 Yr Blend is the Fund's primary broad-based securities-market index for comparison purposes. The index has four main sectors: state and local general obligations, revenue bonds, and insured bonds. |
| 3. | The Morningstar Municipal National Intermediate Category Average is representative of funds that invest in bonds issued by various state and local governments to fund public projects. The income from these bonds is generally free from federal taxes. To lower risk, these funds spread their assets across many states and sectors. These funds have durations of 4.0 to 6.0 years (or average maturities of five to 12 years). Results are based on average total returns of similar funds with all dividends and capital gain distributions reinvested. |
The footnotes on the preceding page are an integral part of the table and graph and should be carefully read in conjunction with them.
| 6 | MainStay MacKay Strategic Municipal Allocation Fund |
Cost in Dollars of a $1,000 Investment in MainStay MacKay Strategic Municipal Allocation Fund (Unaudited)
The example below is intended to describe the fees and expenses borne by shareholders during the six-month period from May 1, 2023 to October 31, 2023, and the impact of those costs on your investment.
Example
As a shareholder of the Fund you incur two types of costs: (1) transaction costs, including exchange fees and sales charges (loads) on purchases (as applicable), and (2) ongoing costs, including management fees, distribution and/or service (12b-1) fees and other Fund expenses (as applicable). This example is intended to help you understand your ongoing costs (in dollars) of investing in the Fund and to compare these costs with the ongoing costs of investing in other mutual funds. The example is based on an investment of $1,000 made at the beginning of the six-month period and held for the entire period from May 1, 2023 to October 31, 2023.
This example illustrates your Fund’s ongoing costs in two ways:
Actual Expenses
The second and third data columns in the table below provide information about actual account values and actual expenses. You may use the information in these columns, together with the amount you invested, to estimate the expenses that you paid during the six months ended October 31, 2023. Simply divide your account value by $1,000 (for example, an
$8,600 account value divided by $1,000 = 8.6), then multiply the result by the number under the heading entitled “Expenses Paid During Period” to estimate the expenses you paid on your account during this period.
Hypothetical Example for Comparison Purposes
The fourth and fifth data columns in the table below provide information about hypothetical account values and hypothetical expenses based on the Fund’s actual expense ratio and an assumed rate of return of 5% per year before expenses, which is not the Fund’s actual return. The hypothetical account values and expenses may not be used to estimate the actual ending account balances or expenses you paid for the six-month period shown. You may use this information to compare the ongoing costs of investing in the Fund with the ongoing costs of investing in other mutual funds. To do so, compare this 5% hypothetical example with the 5% hypothetical examples that appear in the shareholder reports of the other mutual funds.
Please note that the expenses shown in the table are meant to highlight your ongoing costs only and do not reflect any transactional costs, such as exchange fees or sales charges (loads). Therefore, the fourth and fifth data columns of the table are useful in comparing ongoing costs only and will not help you determine the relative total costs of owning different funds. In addition, if these transactional costs were included, your costs would have been higher.
| Share Class | Beginning
Account
Value
5/1/23 | Ending Account
Value (Based
on Actual
Returns and
Expenses)
10/31/23 | Expenses
Paid
During
Period1 | Ending Account
Value (Based
on Hypothetical
5% Annualized
Return and
Actual Expenses)
10/31/23 | Expenses
Paid
During
Period1 | Net Expense
Ratio
During
Period2 |
| Class A Shares | $1,000.00 | $973.70 | $3.83 | $1,021.32 | $3.92 | 0.77% |
| Investor Class Shares | $1,000.00 | $973.10 | $4.43 | $1,020.72 | $4.53 | 0.89% |
| Class C Shares | $1,000.00 | $971.80 | $5.62 | $1,019.51 | $5.75 | 1.13% |
| Class C2 Shares | $1,000.00 | $971.10 | $6.36 | $1,018.75 | $6.51 | 1.28% |
| Class I Shares | $1,000.00 | $974.80 | $2.59 | $1,022.58 | $2.65 | 0.52% |
| Class R6 Shares | $1,000.00 | $975.00 | $2.49 | $1,022.68 | $2.55 | 0.50% |
| 1. | Expenses are equal to the Fund’s annualized expense ratio of each class multiplied by the average account value over the period, divided by 365 and multiplied by 184 (to reflect the six-month period). The table above represents the actual expenses incurred during the six-month period. In addition to the fees and expenses which the Fund bears directly, it also indirectly bears a pro rata share of the fees and expenses of the underlying funds in which it invests. Such indirect expenses are not included in the above-reported expense figures. |
| 2. | Expenses are equal to the Fund's annualized expense ratio to reflect the six-month period. |
Portfolio Composition as of October 31, 2023 (Unaudited)
| Texas | 11.2% |
| New York | 9.3 |
| California | 8.6 |
| Illinois | 8.5 |
| Florida | 4.5 |
| Pennsylvania | 4.0 |
| Alabama | 3.8 |
| Michigan | 3.4 |
| Colorado | 2.8 |
| Indiana | 2.6 |
| New Jersey | 2.6 |
| Utah | 2.5 |
| Georgia | 2.3 |
| Ohio | 2.2 |
| Connecticut | 2.0 |
| Washington | 1.9 |
| Louisiana | 1.9 |
| Virginia | 1.7 |
| Tennessee | 1.7 |
| North Carolina | 1.4 |
| Missouri | 1.3 |
| Arizona | 1.3 |
| Puerto Rico | 1.2 |
| Wisconsin | 1.2 |
| Nebraska | 1.1 |
| District of Columbia | 1.0 |
| Kentucky | 0.9% |
| Guam | 0.9 |
| Maryland | 0.9 |
| North Dakota | 0.6 |
| Wyoming | 0.6 |
| Massachusetts | 0.5 |
| U.S. Virgin Islands | 0.5 |
| Hawaii | 0.5 |
| West Virginia | 0.5 |
| Rhode Island | 0.4 |
| South Carolina | 0.4 |
| Vermont | 0.3 |
| Iowa | 0.3 |
| Arkansas | 0.2 |
| Maine | 0.2 |
| Nevada | 0.2 |
| Idaho | 0.1 |
| Mississippi | 0.1 |
| New Hampshire | 0.1 |
| Montana | 0.1 |
| South Dakota | 0.1 |
| Alaska | 0.0‡ |
| Minnesota | 0.0‡ |
| Other Assets, Less Liabilities | 5.6 |
| | 100.0% |
| ‡ | Less than one–tenth of a percent. |
See Portfolio of Investments beginning on page 10 for specific holdings within these categories. The Fund's holdings are subject to change.
Top Ten Holdings and/or Issuers Held as of October 31, 2023 (excluding short-term investments) (Unaudited)
| 1. | City of Chicago, 5.00%-6.00%, due 11/1/26–1/1/44 |
| 2. | New York City Transitional Finance Authority, 3.95%-5.50%, due 11/1/29–11/1/45 |
| 3. | Black Belt Energy Gas District, 4.00%-5.50%, due 12/1/26–12/1/53 |
| 4. | State of Connecticut, 3.13%-5.77%, due 1/15/24–7/1/40 |
| 5. | County of Miami-Dade, 5.00%, due 10/1/33–7/1/43 |
| 6. | New Jersey Economic Development Authority, 4.914%-5.625%, due 3/1/24–11/1/44 |
| 7. | San Joaquin Hills Transportation Corridor Agency, 5.25%, due 1/15/44–1/15/49 |
| 8. | Main Street Natural Gas, Inc., 4.00%-5.258%, due 8/1/49–12/1/53 |
| 9. | State of California, 5.00%, due 9/1/35–4/1/38 |
| 10. | New York State Dormitory Authority, 3.00%-5.00%, due 2/15/40–3/15/45 |
| 8 | MainStay MacKay Strategic Municipal Allocation Fund |
Portfolio Management Discussion and Analysis (Unaudited)
Questions answered by portfolio managers John Loffredo, CFA, Robert DiMella, CFA, Michael Petty, Frances Lewis, David Dowden, John Lawlor, Michael Denlinger, CFA, and Sanjit Gill, CFA, of MacKay Shields LLC, the Fund’s Subadvisor.
How did MainStay MacKay Strategic Municipal Allocation Fund perform relative to its benchmark and peer group during the six months ended October 31, 2023?
For the six months ended October 31, 2023, Class I shares of MainStay MacKay Strategic Municipal Allocation Fund returned −2.52%, outperforming the −3.38% return of the Fund’s benchmark, the Bloomberg Municipal Bond Index 1–15 Year Blend (the “Index”). Over the same period, Class I shares also outperformed the −3.86% return of the Morningstar Muni National Intermediate Category Average.1
Were there any changes to the Fund during the reporting period?
Effective August 28, 2023, Sanjit Gill was added as a portfolio manager of the Fund, and Scott Sprauer was removed as a portfolio manager of the Fund.
What factors affected the Fund’s relative performance during the reporting period?
During the reporting period, the Fund outperformed the Index partly due to strong security selection. In addition, underweight exposure to bonds maturing 12 years or less added on a relative basis. By comparison, overweight exposure to bonds maturing 15+ years detracted from relative performance. Across the ratings spectrum, the Fund’s underweight exposure to higher-quality, higher-rated bonds made a positive contribution to relative performance. (Contributions take weightings and total returns into account.) From a geographic perspective, underweight exposure to bonds from California and New York contributed to the relative results, while overweight exposure to Illinois bonds offset some of those gains. Also, the Fund engaged in significant tax-loss harvesting. This created losses that can be carried forward to offset future gains in the Fund. This activity also resulted in creating a higher book yield for the Fund.
During the reporting period, how was the Fund’s performance materially affected by investments in derivatives?
The Fund will employ Treasury futures hedges at times, typically as a paired strategy with longer maturity bonds, to dampen duration2 and interest rate sensitivity. During the reporting period, the Fund’s use of Treasury futures was minimal, but the contribution to return was positive.
What was the Fund’s duration strategy during the reporting period?
As relative value investors, we aim to keep the Fund’s duration within a neutral range relative to that of the Index. At the end of the reporting period, the Fund's modified duration to worst3 was 5.31 years while the modified duration to worst of the Index was 4.82 years.
During the reporting period, which sectors were the strongest positive contributors to the Fund’s relative performance and which sectors were particularly weak?
Relative to the Index, the Fund’s underweight exposure to the state general obligation and education sectors contributed positively to relative results. Meanwhile, overweight exposure to electric and transportation weakened relative performance.
What were some of the Fund’s significant purchases and sales during the reporting period?
As the Fund remained focused on diversification and liquidity, no individual purchase or sale would have been considered significant, although sector overweights and security structure, in their entirety, did have an impact.
How did the Fund’s sector weighting change during the reporting period?
During the reporting period, there were no material changes to the weightings in the Fund. At the margin, the Fund increased sector exposure to state general obligation and transportation. From a ratings perspective, there was an increased exposure to higher-quality-credit AAA-rated4 bonds, as we believe they are in relatively strong financial condition and were available at much higher yields. In addition, we increased the Fund’s exposure to bonds maturing beyond 17 years, where we believe municipal yields were more attractive. Conversely, the Fund decreased sector exposure to hospital and education, and to 4+% coupon bonds.
How was the Fund positioned at the end of the reporting period?
As of October 31, 2023, the Fund held overweight positions relative to the Index in the housing, transportation and electric sectors, as well as holdings from the state of Illinois. As of the same date, the Fund held underweight exposure to the state general obligation and prerefunded/ETM (escrowed to maturity) sectors, as well as the states of California and New York. The Fund also held overweight exposure to bonds maturing 17 years and beyond, and underweight exposure to bonds maturing between 1 and 12 years.
| 1. | See "Investment and Performance Comparison" for other share class returns, which may be higher or lower than Class I share returns, and for more information on benchmark and peer group returns. |
| 2. | Duration is a measure of the price sensitivity of a fixed-income investment to changes in interest rates. Duration is expressed as a number of years and is considered a more accurate sensitivity gauge than average maturity. |
| 3. | Modified duration is inversely related to the approximate percentage change in price for a given change in yield. Duration to worst is the duration of a bond computed using the bond’s nearest call date or maturity. This measure ignores future cash flow fluctuations due to embedded optionality. |
| 4. | An obligation rated ‘AAA’ by Standard & Poor’s (“S&P”) has the highest rating assigned by S&P, and in the opinion of S&P, the obligor’s capacity to meet its financial commitment on the obligation is extremely strong. When applied to Fund holdings, ratings are based solely on the creditworthiness of the bonds in the portfolio and are not meant to represent the security or safety of the Fund. |
The opinions expressed are those of the portfolio managers as of the date of this report and are subject to change. There is no guarantee that any forecasts will come to pass. This material does not constitute investment advice and is not intended as an endorsement of any specific investment.
Portfolio of Investments October 31, 2023†^
| | Principal
Amount | Value |
| Municipal Bonds 94.4% |
| Long-Term Municipal Bonds 93.9% |
| Alabama 3.8% |
| Alabama Housing Finance Authority, Capstone at Kinsey Cove LP, Revenue Bonds | | |
| Series A | | |
| 3.875%, due 12/1/23 | $ 1,500,000 | $ 1,498,865 |
| Alabama Housing Finance Authority, ECG Dry Creek LP, Revenue Bonds | | |
| Series H | | |
| 5.00%, due 6/1/26 (a) | 500,000 | 501,234 |
| Black Belt Energy Gas District, Gas Project No.4, Revenue Bonds | | |
| Series A-1 | | |
| 4.00%, due 12/1/49 (a) | 1,480,000 | 1,446,788 |
| Black Belt Energy Gas District, Gas Project No.6, Revenue Bonds | | |
| Series B | | |
| 4.00%, due 10/1/52 (a) | 1,760,000 | 1,695,718 |
| Black Belt Energy Gas District, Gas Project, Revenue Bonds | | |
| Series B-1 | | |
| 4.00%, due 4/1/53 (a) | 640,000 | 613,499 |
| Series B | | |
| 4.74%, due 4/1/53 | 700,000 | 687,097 |
| Series C-1 | | |
| 5.25%, due 12/1/26 | 1,850,000 | 1,878,462 |
| Series B-2 | | |
| 5.25%, due 12/1/53 (a) | 3,800,000 | 3,830,788 |
| Series F | | |
| 5.50%, due 11/1/53 (a) | 1,600,000 | 1,619,591 |
| County of Jefferson, Sewer, Revenue Bonds, Sub. Lien | | |
| Series D | | |
| 6.00%, due 10/1/42 | 3,000,000 | 3,086,712 |
| Prichard Water Works & Sewer Board, Revenue Bonds | | |
| 2.375%, due 11/1/28 | 205,000 | 154,868 |
| Southeast Energy Authority, A Cooperative District, Project No. 4, Revenue Bonds | | |
| Series B-1 | | |
| 5.00%, due 5/1/53 (a) | 760,000 | 752,944 |
| Southeast Energy Authority, A Cooperative District, Project No. 3, Revenue Bonds | | |
| Series A-1 | | |
| 5.50%, due 1/1/53 (a) | 1,600,000 | 1,624,556 |
| | Principal
Amount | Value |
| |
| Alabama (continued) |
| State of Alabama, Unlimited General Obligation | | |
| Series A | | |
| 3.00%, due 8/1/26 | $ 1,000,000 | $ 963,415 |
| Town of Pike Road, Limited General Obligation | | |
| 5.00%, due 3/1/40 | 845,000 | 876,651 |
| | | 21,231,188 |
| Alaska 0.0% ‡ |
| Alaska Industrial Development & Export Authority, Interior Gas Utility Project, Revenue Bonds | | |
| Series A | | |
| 5.00%, due 6/1/28 | 250,000 | 243,973 |
| Arizona 1.0% |
| Arizona Industrial Development Authority, Ball Charter Schools Project, Revenue Bonds | | |
| 2.65%, due 7/1/26 | 65,000 | 60,878 |
| Arizona Industrial Development Authority, Glendale Senior Project, Revenue Bonds | | |
| Series A, Insured: HUD Sector 8 | | |
| 5.00%, due 10/1/44 (a) | 2,000,000 | 2,022,737 |
| City of Mesa, Utility System, Revenue Bonds, Junior Lien | | |
| Series A, Insured: BAM | | |
| 5.00%, due 7/1/30 | 1,050,000 | 1,113,448 |
| City of Phoenix Civic Improvement Corp., Water System, Revenue Bonds, Junior Lien | | |
| 5.00%, due 7/1/39 | 1,000,000 | 1,011,452 |
| Glendale Industrial Development Authority, Royal Oaks Life Care Community, Revenue Bonds | | |
| 4.00%, due 5/15/28 | 620,000 | 566,994 |
| University of Arizona (The), Revenue Bonds | | |
| Series B | | |
| 5.00%, due 6/1/46 | 1,000,000 | 1,004,281 |
| | | 5,779,790 |
| Arkansas 0.2% |
| Arkansas Development Finance Authority, Big River Steel Project, Revenue Bonds | | |
| 4.50%, due 9/1/49 (b)(c) | 1,135,000 | 1,007,965 |
The notes to the financial statements are an integral part of, and should be read in conjunction with, the financial statements.
| 10 | MainStay MacKay Strategic Municipal Allocation Fund |
| | Principal
Amount | Value |
| Long-Term Municipal Bonds (continued) |
| California 8.6% |
| California Community Choice Financing Authority, Clean Energy Project, Revenue Bonds | | |
| Series C | | |
| 5.25%, due 1/1/54 (a) | $ 1,345,000 | $ 1,316,726 |
| California Municipal Finance Authority, Waste Management, Inc., Revenue Bonds | | |
| Series A | | |
| 4.125%, due 10/1/41 (a)(c) | 1,500,000 | 1,482,730 |
| California Municipal Finance Authority, LINXS APM Project, Revenue Bonds, Senior Lien | | |
| Series A | | |
| 5.00%, due 12/31/31 (c) | 1,240,000 | 1,254,393 |
| California Municipal Finance Authority, Palomar Health Obligated Group, Certificate of Participation | | |
| Series A, Insured: AGM | | |
| 5.25%, due 11/1/36 | 1,300,000 | 1,390,276 |
| California Municipal Finance Authority, Aldersly Project, Revenue Bonds | | |
| Series C, Insured: California Mortgage Insurance | | |
| 5.50%, due 11/15/27 | 500,000 | 483,930 |
| California Public Finance Authority, Enso Village Project, Revenue Bonds | | |
| Series B-3 | | |
| 2.125%, due 11/15/27 (b) | 250,000 | 237,436 |
| California School Finance Authority, Classical Academies Oceanside Project, Revenue Bonds | | |
| Series A | | |
| 4.00%, due 10/1/27 (b) | 455,000 | 439,015 |
| California School Finance Authority, Sonoma County Junior College District Project, Revenue Bonds | | |
| Series A | | |
| 4.00%, due 11/1/41 (b) | 240,000 | 192,826 |
| California Statewide Communities Development Authority, Community Infrastructure Program, Special Assessment | | |
| Series A | | |
| 4.00%, due 9/2/26 | 260,000 | 251,496 |
| Series D | | |
| 4.75%, due 9/2/33 | 250,000 | 236,270 |
| | Principal
Amount | Value |
| |
| California (continued) |
| City of Long Beach, Airport System, Revenue Bonds | | |
| Series A, Insured: AGM | | |
| 5.00%, due 6/1/31 | $ 250,000 | $ 272,260 |
| City of San Jose, Unlimited General Obligation | | |
| Series A-1 | | |
| 5.00%, due 9/1/41 | 1,500,000 | 1,548,865 |
| City of San Mateo, Community Facilities District No. 2008-1, Special Tax | | |
| Series 1, Insured: BAM | | |
| 5.25%, due 9/1/35 | 1,000,000 | 1,048,249 |
| City of Vernon, Electric System, Revenue Bonds | | |
| Series A | | |
| 5.00%, due 10/1/27 | 250,000 | 250,443 |
| Corona Community Facilities District, Community Facilities District No. 2018-2, Special Tax | | |
| Series A | | |
| 5.00%, due 9/1/29 | 100,000 | 102,374 |
| County of Los Angeles Community Facilities District No. 2021-01, Improvement Area No. 1, Special Tax | | |
| 5.00%, due 9/1/27 | 100,000 | 102,003 |
| 5.00%, due 9/1/30 | 175,000 | 178,442 |
| 5.00%, due 9/1/32 | 175,000 | 178,627 |
| County of Sacramento, Airport System, Revenue Bonds | | |
| Series B | | |
| 5.00%, due 7/1/41 | 1,000,000 | 1,004,953 |
| Foothill-De Anza Community College District, Unlimited General Obligation | | |
| Series B, Insured: NATL-RE FGIC | | |
| (zero coupon), due 8/1/29 | 1,045,000 | 833,740 |
| Hercules Redevelopment Agency Successor Agency, Tax Allocation | | |
| Series A, Insured: AGM | | |
| 5.00%, due 8/1/37 | 500,000 | 518,768 |
| Kern Community College District, Election of 2016, Unlimited General Obligation | | |
| Series D | | |
| 5.25%, due 8/1/37 | 1,500,000 | 1,650,435 |
| Madera Unified School District, Unlimited General Obligation | | |
| 4.00%, due 8/1/44 | 100,000 | 88,764 |
The notes to the financial statements are an integral part of, and should be read in conjunction with, the financial statements.
11
Portfolio of Investments October 31, 2023†^ (continued)
| | Principal
Amount | Value |
| Long-Term Municipal Bonds (continued) |
| California (continued) |
| Metropolitan Water District of Southern California, Waterworks, Revenue Bonds | | |
| Series E | | |
| 4.23%, due 7/1/37 | $ 500,000 | $ 498,978 |
| Oakland Unified School District, Election of 2020, Unlimited General Obligation | | |
| Series A, Insured: BAM | | |
| 4.00%, due 8/1/46 | 500,000 | 432,307 |
| Sacramento City Financing Authority, Capital Appreciation, Tax Allocation | | |
| Series A-1, Insured: NATL-RE | | |
| (zero coupon), due 12/1/23 | 735,000 | 732,415 |
| San Diego County Regional Airport Authority, Revenue Bonds | | |
| Series B | | |
| 5.00%, due 7/1/33 (c) | 4,500,000 | 4,621,595 |
| San Diego County Regional Airport Authority, Revenue Bonds, Senior Lien | | |
| Series B | | |
| 5.25%, due 7/1/38 (c) | 1,000,000 | 1,015,995 |
| San Diego Unified School District, Election of 2012, Unlimited General Obligation | | |
| Series I | | |
| 5.00%, due 7/1/47 | 1,000,000 | 1,013,013 |
| San Francisco City & County Airport Commission, San Francisco International Airport, Revenue Bonds, Second Series | | |
| Series C | | |
| 5.00%, due 5/1/33 (c)(d) | 6,000,000 | 6,152,112 |
| San Joaquin Hills Transportation Corridor Agency, Revenue Bonds, Junior Lien | | |
| Series B | | |
| 5.25%, due 1/15/44 | 5,000,000 | 5,015,763 |
| Series B | | |
| 5.25%, due 1/15/49 | 2,000,000 | 2,003,773 |
| Saratoga Union School District, Unlimited General Obligation | | |
| Insured: NATL-RE | | |
| (zero coupon), due 9/1/26 | 1,925,000 | 1,721,686 |
| | Principal
Amount | Value |
| |
| California (continued) |
| Southern California Public Power Authority, Southern Transmissional System Renewal Project, Revenue Bonds | | |
| Series A-1 | | |
| 5.00%, due 7/1/40 | $ 1,000,000 | $ 1,066,796 |
| State of California, Various Purpose, Unlimited General Obligation | | |
| Insured: BAM | | |
| 5.00%, due 9/1/35 | 4,000,000 | 4,079,127 |
| 5.00%, due 4/1/38 | 2,455,000 | 2,455,505 |
| University of California, Revenue Bonds | | |
| Series BN | | |
| 5.50%, due 5/15/40 | 1,400,000 | 1,544,895 |
| | | 47,416,981 |
| Colorado 2.8% |
| Arapahoe County School District No. 5, Cherry Creek, Unlimited General Obligation | | |
| Series B, Insured: State Aid Withholding | | |
| 2.00%, due 12/15/26 | 500,000 | 456,508 |
| Arapahoe County School District No. 6 Littleton, Unlimited General Obligation | | |
| Series A, Insured: State Aid Withholding | | |
| 5.50%, due 12/1/43 | 750,000 | 781,466 |
| Arkansas River Power Authority, Revenue Bonds | | |
| Series A | | |
| 5.00%, due 10/1/38 | 2,000,000 | 1,913,162 |
| City & County of Denver, Pledged Excise Tax, Revenue Bonds | | |
| Series A | | |
| 5.00%, due 8/1/42 | 1,000,000 | 991,059 |
| Series A | | |
| 5.00%, due 8/1/44 | 1,000,000 | 975,265 |
| City & County of Denver, Airport System, Revenue Bonds (c) | | |
| Series A | | |
| 5.00%, due 12/1/43 | 1,000,000 | 962,903 |
| Series D | | |
| 5.75%, due 11/15/41 | 1,715,000 | 1,818,174 |
| City of Colorado Springs, Utilities System, Revenue Bonds | | |
| Series A | | |
| 5.00%, due 11/15/40 | 3,000,000 | 3,019,938 |
The notes to the financial statements are an integral part of, and should be read in conjunction with, the financial statements.
| 12 | MainStay MacKay Strategic Municipal Allocation Fund |
| | Principal
Amount | Value |
| Long-Term Municipal Bonds (continued) |
| Colorado (continued) |
| Colorado Health Facilities Authority, Aberdeen Ridge, Inc. Obligated Group, Revenue Bonds | | |
| Series B-3 | | |
| 2.125%, due 5/15/28 | $ 250,000 | $ 224,733 |
| Colorado Health Facilities Authority, CommonSpirit Health, Revenue Bonds | | |
| Series A-1 | | |
| 4.00%, due 8/1/44 | 250,000 | 201,512 |
| Series A-1, Insured: BAM | | |
| 5.00%, due 8/1/35 | 180,000 | 182,780 |
| Series A | | |
| 5.25%, due 11/1/37 | 1,450,000 | 1,470,691 |
| Fiddlers Business Improvement District, Unlimited General Obligation | | |
| 5.00%, due 12/1/32 (b) | 200,000 | 193,220 |
| Ground Water Management Subdistrict of Central Colorado, Water Conservancy District, Limited General Obligation | | |
| Insured: BAM | | |
| 4.00%, due 12/1/40 | 250,000 | 212,076 |
| VDW Metropolitan District No. 2, Limited General Obligation | | |
| Series A-2, Insured: BAM | | |
| 4.00%, due 12/1/45 | 580,000 | 467,760 |
| Weld County School District No. RE-2, Unlimited General Obligation | | |
| Insured: State Aid Withholding | | |
| 5.00%, due 12/1/36 | 1,425,000 | 1,484,545 |
| | | 15,355,792 |
| Connecticut 2.0% |
| City of New Haven, Unlimited General Obligation | | |
| Series A, Insured: BAM | | |
| 5.00%, due 8/1/31 | 1,200,000 | 1,252,707 |
| Hartford Stadium Authority, Stadium Authority Lease, Revenue Bonds | | |
| Series A | | |
| 5.00%, due 2/1/36 | 230,000 | 219,435 |
| State of Connecticut, Unlimited General Obligation | | |
| Series A | | |
| 3.13%, due 1/15/24 | 4,000,000 | 3,979,777 |
| Series A | | |
| 5.77%, due 3/15/25 | 500,000 | 500,944 |
| | Principal
Amount | Value |
| |
| Connecticut (continued) |
| State of Connecticut, Transportation Infrastructure, Special Tax, Revenue Bonds | | |
| Series A | | |
| 4.00%, due 5/1/36 | $ 1,040,000 | $ 997,823 |
| Series A | | |
| 5.25%, due 7/1/40 | 1,500,000 | 1,593,692 |
| Series A | | |
| 5.25%, due 7/1/40 | 2,500,000 | 2,669,726 |
| | | 11,214,104 |
| District of Columbia 1.0% |
| District of Columbia, Unlimited General Obligation | | |
| Series C | | |
| 5.00%, due 6/1/38 | 2,610,000 | 2,589,108 |
| District of Columbia Housing Finance Agency, Lisner Senior Independent Owner LP, Revenue Bonds | | |
| 5.00%, due 10/1/41 (a) | 3,000,000 | 3,029,865 |
| | | 5,618,973 |
| Florida 4.5% |
| Ave Maria Stewardship Community District, Phase 4 Master Improvement Project Area, Special Assessment | | |
| 4.50%, due 5/1/33 (b) | 250,000 | 234,513 |
| Capital Trust Agency, Inc., Advantage Academy of Hillsborough, Inc., Revenue Bonds | | |
| Series A | | |
| 5.00%, due 12/15/39 | 500,000 | 451,762 |
| CFM Community Development District, Capital Improvement, Special Assessment | | |
| 2.875%, due 5/1/31 | 100,000 | 83,431 |
| City of Gainesville, Utilities System, Revenue Bonds | | |
| Series A | | |
| 5.00%, due 10/1/44 | 635,000 | 639,244 |
| City of Palmetto, Renaissance Arts and Education, Inc., Revenue Bonds | | |
| Series A | | |
| 4.25%, due 6/1/27 | 130,000 | 127,328 |
| Series A | | |
| 5.00%, due 6/1/32 | 100,000 | 100,502 |
The notes to the financial statements are an integral part of, and should be read in conjunction with, the financial statements.
13
Portfolio of Investments October 31, 2023†^ (continued)
| | Principal
Amount | Value |
| Long-Term Municipal Bonds (continued) |
| Florida (continued) |
| City of West Palm Beach, Utility System, Revenue Bonds | | |
| Series A | | |
| 5.00%, due 10/1/42 | $ 2,500,000 | $ 2,520,597 |
| Cobblestone Community Development District, Assessment Area Two, Special Assessment | | |
| Series 2 | | |
| 3.40%, due 5/1/27 (b) | 160,000 | 150,917 |
| Collier County Educational Facilities Authority, Ave Maria University, Inc., Revenue Bonds | | |
| 5.00%, due 6/1/29 | 1,065,000 | 1,057,072 |
| County of Miami-Dade, Aviation, Revenue Bonds | | |
| Series A | | |
| 5.00%, due 10/1/33 (c) | 6,500,000 | 6,385,333 |
| County of Miami-Dade, Transit System, Revenue Bonds | | |
| 5.00%, due 7/1/43 | 2,300,000 | 2,330,143 |
| County of Pasco, State of Florida Cigarette Tax Revenue, Revenue Bonds | | |
| Series A, Insured: AGM | | |
| 5.50%, due 9/1/37 | 2,040,000 | 2,178,289 |
| Florida Development Finance Corp., Mater Academy Project, Revenue Bonds | | |
| Series A | | |
| 5.00%, due 6/15/31 | 515,000 | 519,635 |
| Fort Pierce Utilities Authority, Revenue Bonds | | |
| Series A, Insured: AGM | | |
| 5.00%, due 10/1/30 | 350,000 | 371,386 |
| Series A, Insured: AGM | | |
| 5.00%, due 10/1/32 | 150,000 | 160,109 |
| Series A, Insured: AGM | | |
| 5.00%, due 10/1/34 | 325,000 | 345,368 |
| Harbor Bay Community Development District, Special Assessment | | |
| Series A-1 | | |
| 3.10%, due 5/1/24 | 100,000 | 99,003 |
| Series A-2 | | |
| 3.10%, due 5/1/24 | 100,000 | 99,003 |
| | Principal
Amount | Value |
| |
| Florida (continued) |
| Hilltop Point Community Development District, Assessment Area One, Special Assessment | | |
| Series 1 | | |
| 4.60%, due 5/1/27 | $ 100,000 | $ 97,141 |
| Hilltop Point Community Development District, Assessment Area Two, Special Assessment | | |
| Series 2 | | |
| 4.75%, due 5/1/27 | 200,000 | 194,915 |
| Laurel Road Community Development District, Special Assessment | | |
| Series A-2 | | |
| 3.125%, due 5/1/31 | 235,000 | 199,398 |
| Mid-Bay Bridge Authority, Revenue Bonds | | |
| Series A | | |
| 5.00%, due 10/1/40 | 500,000 | 471,465 |
| Palm Beach County Housing Finance Authority, Everglades Townhomes LP, Revenue Bonds | | |
| 5.00%, due 2/1/27 (a) | 994,000 | 1,002,241 |
| Palm Coast Park Community Development District, Spring Lake Tracts 2 and 3, Special Assessment | | |
| 2.40%, due 5/1/26 | 100,000 | 93,341 |
| Palm Coast Park Community Development District, Sawmill Branch Phase 2, Special Assessment | | |
| 4.15%, due 5/1/27 | 300,000 | 290,649 |
| Preston Cove Community Development District, Special Assessment | | |
| 3.25%, due 5/1/27 | 100,000 | 93,697 |
| Reunion East Community Development District, Series 2021 Project, Special Assessment | | |
| 2.85%, due 5/1/31 | 100,000 | 84,443 |
| Reunion West Community Development District, Special Assessment | | |
| 3.00%, due 5/1/36 | 100,000 | 78,004 |
| Rolling Hills Community Development District, Special Assessment | | |
| Series A-2 | | |
| 3.65%, due 5/1/32 | 200,000 | 172,932 |
| Seminole Improvement District, Revenue Bonds | | |
| 5.00%, due 10/1/32 | 250,000 | 238,225 |
The notes to the financial statements are an integral part of, and should be read in conjunction with, the financial statements.
| 14 | MainStay MacKay Strategic Municipal Allocation Fund |
| | Principal
Amount | Value |
| Long-Term Municipal Bonds (continued) |
| Florida (continued) |
| Southshore Bay Community Development District, District Assessment Area One, Special Assessment | | |
| 3.00%, due 5/1/33 (b) | $ 105,000 | $ 84,352 |
| Sunbridge Stewardship District, Weslyn Park Project Assessment, Special Assessment | | |
| 4.60%, due 5/1/32 | 460,000 | 429,231 |
| Tampa Bay Water, Revenue Bonds | | |
| 5.00%, due 10/1/40 | 1,580,000 | 1,634,162 |
| Verano No. 3 Community Development District, Special Assessment | | |
| 2.375%, due 5/1/26 | 30,000 | 28,082 |
| Village Community Development District No. 13, Phase III, Special Assessment | | |
| 2.85%, due 5/1/36 | 1,495,000 | 1,148,013 |
| Village Community Development District No. 15, Special Assessment | | |
| 4.375%, due 5/1/33 (b) | 100,000 | 95,612 |
| Watergrass Community Development District II, Phase 2, Special Assessment | | |
| 2.50%, due 5/1/31 | 100,000 | 81,162 |
| Windward at Lakewood Ranch Community Development District, Phase 2 Project, Special Assessment | | |
| 3.625%, due 5/1/32 | 135,000 | 116,842 |
| Wiregrass II Community Development District, Assessment Area Two, Special Assessment | | |
| 4.80%, due 5/1/32 | 100,000 | 94,430 |
| | | 24,581,972 |
| Georgia 2.3% |
| Atlanta Urban Redevelopment Agency, Atlanta BeltLine Special Service District, Revenue Bonds | | |
| Insured: BAM | | |
| 2.875%, due 7/1/31 (b) | 665,000 | 574,560 |
| City of Atlanta, Department of Aviation, Revenue Bonds | | |
| Series B | | |
| 5.00%, due 7/1/34 (c) | 450,000 | 457,862 |
| | Principal
Amount | Value |
| |
| Georgia (continued) |
| DeKalb Private Hospital Authority, Children's Healthcare of Atlanta, Revenue Bonds | | |
| Series B | | |
| 4.00%, due 7/1/38 | $ 820,000 | $ 759,436 |
| Main Street Natural Gas, Inc., Revenue Bonds | | |
| Series B | | |
| 4.00%, due 8/1/49 (a) | 2,000,000 | 1,980,969 |
| Series E-2 | | |
| 5.258%, due 12/1/53 | 5,000,000 | 4,987,379 |
| Municipal Electric Authority of Georgia, Project One Subordinated Bonds, Revenue Bonds | | |
| Series A | | |
| 5.00%, due 1/1/38 | 500,000 | 500,012 |
| Municipal Electric Authority of Georgia, Plant Vogtle Units 3&4 Project, Revenue Bonds | | |
| Series A | | |
| 5.00%, due 1/1/39 | 2,000,000 | 1,950,579 |
| Walton County Water & Sewer Authority, Walton-Hard Labor Creek Reservoir Water Treatment Facility Project, Revenue Bonds | | |
| 5.25%, due 2/1/47 | 1,700,000 | 1,766,760 |
| | | 12,977,557 |
| Guam 0.9% |
| Guam Government Waterworks Authority, Water and Wastewater System, Revenue Bonds | | |
| 5.25%, due 7/1/24 | 590,000 | 590,209 |
| Guam Power Authority, Revenue Bonds | | |
| Series A | | |
| 5.00%, due 10/1/34 | 500,000 | 506,366 |
| Territory of Guam, Business Privilege Tax, Revenue Bonds | | |
| Series F | | |
| 4.00%, due 1/1/36 | 400,000 | 359,856 |
| Series D | | |
| 5.00%, due 11/15/27 | 365,000 | 363,790 |
| Territory of Guam, Revenue Bonds | | |
| Series F | | |
| 4.00%, due 1/1/42 | 335,000 | 278,311 |
The notes to the financial statements are an integral part of, and should be read in conjunction with, the financial statements.
15
Portfolio of Investments October 31, 2023†^ (continued)
| | Principal
Amount | Value |
| Long-Term Municipal Bonds (continued) |
| Guam (continued) |
| Territory of Guam, Section 30, Revenue Bonds | | |
| Series A | | |
| 5.00%, due 12/1/32 | $ 1,000,000 | $ 1,000,502 |
| Series A | | |
| 5.00%, due 12/1/34 | 1,750,000 | 1,734,793 |
| | | 4,833,827 |
| Hawaii 0.5% |
| Kauai County Community Facilities District, Kukui'ula Development Project, Special Tax | | |
| 4.00%, due 5/15/26 | 80,000 | 78,208 |
| State of Hawaii Airports System, Airports System, Revenue Bonds | | |
| Series A | | |
| 5.00%, due 7/1/45 (c) | 2,905,000 | 2,787,639 |
| | | 2,865,847 |
| Idaho 0.1% |
| Idaho Health Facilities Authority, Madison Memorial Hospital, Revenue Bonds | | |
| 5.00%, due 9/1/37 | 370,000 | 333,465 |
| Illinois 8.5% |
| Chicago Board of Education, Unlimited General Obligation | | |
| Series B | | |
| 5.00%, due 12/1/31 | 1,000,000 | 986,250 |
| Series A | | |
| 5.00%, due 12/1/33 | 500,000 | 490,290 |
| Series B | | |
| 5.00%, due 12/1/33 | 500,000 | 476,365 |
| Series A | | |
| 5.00%, due 12/1/37 | 1,085,000 | 1,020,099 |
| Series C | | |
| 5.25%, due 12/1/39 | 1,000,000 | 926,176 |
| Chicago Board of Education, Dedicated Capital Improvement, Revenue Bonds | | |
| 6.00%, due 4/1/46 | 1,000,000 | 1,006,017 |
| Chicago Midway International Airport, Revenue Bonds, Second Lien | | |
| Series A | | |
| 5.00%, due 1/1/31 (c) | 700,000 | 689,553 |
| | Principal
Amount | Value |
| |
| Illinois (continued) |
| Chicago O'Hare International Airport, General, Revenue Bonds, Senior Lien | | |
| Series D | | |
| 5.00%, due 1/1/36 | $ 1,000,000 | $ 1,048,556 |
| Series D | | |
| 5.00%, due 1/1/37 | 1,000,000 | 1,036,276 |
| Series B | | |
| 5.00%, due 1/1/39 | 1,350,000 | 1,348,845 |
| Chicago O'Hare International Airport, Passenger Facility Charge, Revenue Bonds, Senior Lien | | |
| Insured: BAM | | |
| 5.25%, due 1/1/39 | 1,195,000 | 1,227,499 |
| City of Chicago, Grace Manor LP, Revenue Bonds | | |
| Insured: HUD Sector 8 | | |
| 5.00%, due 11/1/26 (a) | 5,000,000 | 5,027,819 |
| City of Chicago, Unlimited General Obligation | | |
| Series A | | |
| 5.00%, due 1/1/32 | 1,500,000 | 1,525,242 |
| Series A | | |
| 6.00%, due 1/1/38 | 2,500,000 | 2,561,312 |
| City of Chicago, Wastewater Transmission Project, Revenue Bonds, Second Lien | | |
| 5.00%, due 1/1/44 | 3,000,000 | 2,853,445 |
| Series A, Insured: AGM | | |
| 5.25%, due 1/1/42 | 450,000 | 454,666 |
| City of Joliet, Rock Run Crossing Project, Unlimited General Obligation | | |
| Insured: BAM | | |
| 5.50%, due 12/15/42 | 2,000,000 | 2,075,928 |
| City of Joliet, Unlimited General Obligation | | |
| Insured: BAM | | |
| 5.50%, due 12/15/44 | 1,000,000 | 1,036,699 |
| Illinois Finance Authority, Washington and Jane Smith Home (The), Revenue Bonds | | |
| 4.00%, due 10/15/24 | 215,000 | 208,861 |
| Illinois Finance Authority, Acero Charter Schools, Inc., Revenue Bonds | | |
| 4.00%, due 10/1/33 (b) | 250,000 | 216,934 |
| Illinois Finance Authority, Carle Foundation, Revenue Bonds | | |
| Series A | | |
| 5.00%, due 8/15/34 | 250,000 | 259,378 |
The notes to the financial statements are an integral part of, and should be read in conjunction with, the financial statements.
| 16 | MainStay MacKay Strategic Municipal Allocation Fund |
| | Principal
Amount | Value |
| Long-Term Municipal Bonds (continued) |
| Illinois (continued) |
| Illinois Municipal Electric Agency, Revenue Bonds | | |
| Series A | | |
| 4.00%, due 2/1/34 | $ 1,500,000 | $ 1,387,074 |
| Illinois Sports Facilities Authority (The), Revenue Bonds | | |
| 5.00%, due 6/15/30 | 1,000,000 | 980,346 |
| Illinois State Toll Highway Authority, Revenue Bonds | | |
| Series A | | |
| 5.00%, due 1/1/40 | 1,000,000 | 998,076 |
| Series B | | |
| 5.00%, due 1/1/40 | 1,000,000 | 998,076 |
| Lake County Consolidated High School District No. 120 Mundelein, Limited General Obligation | | |
| Series A | | |
| 5.50%, due 12/1/38 | 825,000 | 864,349 |
| Metropolitan Pier & Exposition Authority, McCormick Place Expansion Project, Revenue Bonds | | |
| Series A | | |
| 5.00%, due 12/15/28 | 2,000,000 | 2,052,844 |
| Metropolitan Water Reclamation District of Greater Chicago, Green Bond, Unlimited General Obligation | | |
| Series E | | |
| 5.00%, due 12/1/41 | 1,000,000 | 1,004,473 |
| Sales Tax Securitization Corp., Revenue Bonds, Second Lien | | |
| Series A, Insured: BAM | | |
| 5.00%, due 1/1/37 | 1,285,000 | 1,304,379 |
| Sales Tax Securitization Corp., Revenue Bonds | | |
| Series C | | |
| 5.50%, due 1/1/36 | 2,000,000 | 2,071,733 |
| Sangamon & Morgan Counties Community Unit School District No. 16 New Berlin, Unlimited General Obligation | | |
| Series A, Insured: AGM | | |
| 5.50%, due 12/1/36 | 350,000 | 371,473 |
| | Principal
Amount | Value |
| |
| Illinois (continued) |
| Southwestern Illinois Development Authority, Madison County Community Unit School District No. 7 Edwardsville, Revenue Bonds | | |
| Series A, Insured: BAM | | |
| 5.50%, due 12/1/35 | $ 1,500,000 | $ 1,626,351 |
| State of Illinois, Unlimited General Obligation | | |
| Series D | | |
| 5.00%, due 11/1/28 | 1,000,000 | 1,022,658 |
| 5.00%, due 2/1/39 | 1,370,000 | 1,305,171 |
| Insured: AGM-CR | | |
| 5.25%, due 2/1/34 | 1,975,000 | 1,965,516 |
| 5.50%, due 5/1/39 | 500,000 | 511,796 |
| Will County School District No. 114, Manhattan, Unlimited General Obligation | | |
| Insured: BAM | | |
| 5.25%, due 1/1/39 | 175,000 | 180,513 |
| Insured: BAM | | |
| 5.50%, due 1/1/43 | 1,825,000 | 1,898,442 |
| | | 47,019,480 |
| Indiana 2.6% |
| Brownsburg 1999 School Building Corp., Revenue Bonds | | |
| Insured: State Intercept | | |
| 5.50%, due 7/15/42 (d) | 1,000,000 | 1,037,459 |
| Center Grove Community School Corp., Limited General Obligation | | |
| Insured: State Intercept | | |
| 5.00%, due 1/1/24 | 1,500,000 | 1,500,942 |
| City of Bloomington, Waterworks, Revenue Bonds | | |
| Insured: BAM | | |
| 5.00%, due 7/1/30 | 225,000 | 238,731 |
| Insured: BAM | | |
| 5.00%, due 7/1/31 | 250,000 | 264,905 |
| Insured: BAM | | |
| 5.00%, due 7/1/32 | 300,000 | 318,056 |
| Insured: BAM | | |
| 5.00%, due 7/1/36 | 1,495,000 | 1,563,370 |
| Indiana Finance Authority, Indiana University Health, Revenue Bonds | | |
| Series L | | |
| 0.70%, due 12/1/46 (a) | 655,000 | 593,270 |
| Series A | | |
| 5.00%, due 12/1/40 | 1,500,000 | 1,502,019 |
The notes to the financial statements are an integral part of, and should be read in conjunction with, the financial statements.
17
Portfolio of Investments October 31, 2023†^ (continued)
| | Principal
Amount | Value |
| Long-Term Municipal Bonds (continued) |
| Indiana (continued) |
| Indiana Finance Authority, Indianapolis Power & Light Co. Project, Revenue Bonds | | |
| Series A | | |
| 1.40%, due 8/1/29 (a) | $ 250,000 | $ 203,104 |
| Indiana Finance Authority, Republic Services, Inc., Revenue Bonds | | |
| Series B | | |
| 3.95%, due 5/1/28 (a) | 1,000,000 | 999,778 |
| Indiana Housing & Community Development Authority, Revenue Bonds | | |
| Insured: FHA 223(F) | | |
| 5.00%, due 10/1/26 (a) | 1,500,000 | 1,501,109 |
| IPS Multi-School Building Corp., Indianapolis Board of School Commissioners, Revenue Bonds | | |
| Insured: State Intercept | | |
| 5.25%, due 7/15/40 | 1,850,000 | 1,918,129 |
| Tippecanoe County School Building Corp., Revenue Bonds | | |
| Series B, Insured: State Intercept | | |
| 6.00%, due 1/15/43 | 500,000 | 547,606 |
| Tri-Creek 2002 High School Building Corp., Revenue Bonds | | |
| Insured: State Intercept | | |
| 5.50%, due 7/15/43 | 2,000,000 | 2,105,512 |
| | | 14,293,990 |
| Iowa 0.3% |
| City of Des Moines, Unlimited General Obligation | | |
| Series D | | |
| 1.75%, due 6/1/38 | 540,000 | 330,509 |
| Iowa City Community School District, Unlimited General Obligation | | |
| 2.50%, due 6/1/38 | 565,000 | 387,947 |
| 2.50%, due 6/1/39 | 1,035,000 | 692,144 |
| | | 1,410,600 |
| Kentucky 0.9% |
| City of Ashland, Ashland Hospital Corp., Revenue Bonds | | |
| Series A | | |
| 5.00%, due 2/1/40 | 500,000 | 468,575 |
| | Principal
Amount | Value |
| |
| Kentucky (continued) |
| City of Henderson, Pratt Paper LLC Project, Revenue Bonds | | |
| Series B | | |
| 3.70%, due 1/1/32 (b)(c) | $ 350,000 | $ 323,783 |
| Kentucky Bond Development Corp., Revenue Bonds | | |
| Insured: BAM | | |
| 5.00%, due 9/1/38 | 1,000,000 | 1,016,001 |
| Kentucky Economic Development Finance Authority, Next Generation Information Highway Project, Revenue Bonds, Senior Lien | | |
| Series A | | |
| 5.00%, due 1/1/45 | 1,000,000 | 907,861 |
| Kentucky Public Energy Authority, Gas Supply, Revenue Bonds | | |
| Series C | | |
| 4.00%, due 2/1/50 (a) | 2,600,000 | 2,467,626 |
| | | 5,183,846 |
| Louisiana 1.9% |
| City of New Orleans, Unlimited General Obligation | | |
| Series A, Insured: BAM | | |
| 5.00%, due 12/1/33 | 1,250,000 | 1,310,244 |
| Greater New Orleans Expressway Commission, Revenue Bonds | | |
| Insured: AGM | | |
| 5.00%, due 11/1/42 | 1,500,000 | 1,504,942 |
| Jefferson Davis Parish Road Sales Tax District No. 1, Revenue Bonds | | |
| Insured: AGM | | |
| 4.00%, due 2/1/26 | 915,000 | 912,154 |
| Jefferson Parish Consolidated Sewerage District No. 1, Revenue Bonds | | |
| Insured: BAM | | |
| 4.00%, due 2/1/42 | 260,000 | 224,107 |
| State of Louisiana, Gasoline & Fuels Tax, Revenue Bonds, Second Lien | | |
| Series C | | |
| 5.00%, due 5/1/40 | 6,250,000 | 6,298,258 |
| | | 10,249,705 |
The notes to the financial statements are an integral part of, and should be read in conjunction with, the financial statements.
| 18 | MainStay MacKay Strategic Municipal Allocation Fund |
| | Principal
Amount | Value |
| Long-Term Municipal Bonds (continued) |
| Maine 0.2% |
| Maine Health & Higher Educational Facilities Authority, Northern Light Health Obligated Group, Revenue Bonds | | |
| Series C, Insured: AGM State Aid Withholding | | |
| 5.50%, due 7/1/38 | $ 1,000,000 | $ 1,049,866 |
| Maryland 0.9% |
| City of Baltimore, Harbor Point Project, Revenue Bonds | | |
| 4.50%, due 6/1/33 | 100,000 | 93,283 |
| County of Charles, Consolidated Public Improvement, Unlimited General Obligation | | |
| 1.75%, due 10/1/35 | 1,000,000 | 718,897 |
| Maryland Community Development Administration, Revenue Bonds | | |
| Series A, Insured: GNMA / FNMA / FHLMC | | |
| 5.00%, due 9/1/42 | 1,000,000 | 992,884 |
| Maryland Economic Development Corp., Morgan View & Thurgood Marshall Student Housing, Revenue Bonds | | |
| Series A | | |
| 5.25%, due 7/1/32 | 465,000 | 489,083 |
| Maryland Stadium Authority, Baltimore City Public School Construction Financing Fund, Revenue Bonds | | |
| Insured: State Intercept | | |
| 5.00%, due 5/1/36 | 1,000,000 | 1,015,531 |
| Series A, Insured: State Intercept | | |
| 5.00%, due 5/1/42 | 1,820,000 | 1,835,852 |
| | | 5,145,530 |
| Massachusetts 0.5% |
| Massachusetts Bay Transportation Authority, Sales Tax, Revenue Bonds | | |
| Series A | | |
| (zero coupon), due 7/1/31 | 1,000,000 | 686,168 |
| Massachusetts Development Finance Agency, Provident Commonwealth Education Resources, Inc., Revenue Bonds | | |
| 5.00%, due 10/1/30 | 1,200,000 | 1,199,253 |
| 5.00%, due 10/1/34 | 500,000 | 491,728 |
| | Principal
Amount | Value |
| |
| Massachusetts (continued) |
| Massachusetts Development Finance Agency, UMass Dartmouth Student Housing Project, Revenue Bonds | | |
| 5.00%, due 10/1/34 | $ 500,000 | $ 471,047 |
| | | 2,848,196 |
| Michigan 3.4% |
| Calhoun County Hospital Finance Authority, Oaklawn Hospital, Revenue Bonds | | |
| 5.00%, due 2/15/28 | 240,000 | 237,227 |
| City of Detroit, Unlimited General Obligation | | |
| Series A | | |
| 5.00%, due 4/1/34 | 275,000 | 275,673 |
| Ferndale Public Schools, Unlimited General Obligation | | |
| Insured: Q-SBLF | | |
| 5.00%, due 5/1/42 | 1,090,000 | 1,091,431 |
| Great Lakes Water Authority, Sewage Disposal System, Revenue Bonds, Second Lien | | |
| Series C | | |
| 5.00%, due 7/1/36 | 1,000,000 | 1,009,486 |
| Great Lakes Water Authority, Water Supply System, Revenue Bonds, Senior Lien | | |
| Series A | | |
| 5.00%, due 7/1/46 | 1,000,000 | 973,109 |
| Series C | | |
| 5.25%, due 7/1/33 | 1,500,000 | 1,527,458 |
| Michigan Finance Authority, Tobacco Settlement Asset-Backed, Revenue Bonds, Senior Lien | | |
| Series A, Class 1 | | |
| 4.00%, due 6/1/34 | 500,000 | 473,868 |
| Michigan Finance Authority, BHSH System Obligated Group, Revenue Bonds | | |
| Series A | | |
| 5.00%, due 4/15/29 | 1,000,000 | 1,045,497 |
| Michigan Finance Authority, Beaumont Health Obligated Group, Revenue Bonds | | |
| Series A | | |
| 5.00%, due 11/1/44 | 1,000,000 | 950,113 |
The notes to the financial statements are an integral part of, and should be read in conjunction with, the financial statements.
19
Portfolio of Investments October 31, 2023†^ (continued)
| | Principal
Amount | Value |
| Long-Term Municipal Bonds (continued) |
| Michigan (continued) |
| Michigan Finance Authority, Universal Learning Academy, Revenue Bonds | | |
| 6.00%, due 11/1/32 | $ 500,000 | $ 498,284 |
| Michigan State Housing Development Authority, New Baltimore Place Apartments Project, Revenue Bonds | | |
| Insured: HUD Sector 8 | | |
| 5.00%, due 12/1/25 (a) | 1,097,000 | 1,098,289 |
| Michigan State Housing Development Authority, Traditions of Holland Apartments Ltd. Dividend Housing Association LLC, Revenue Bonds | | |
| 5.00%, due 11/1/26 (a) | 2,000,000 | 2,017,572 |
| Richmond Community Schools, School Building and Site, Unlimited General Obligation | | |
| Series I, Insured: Q-SBLF | | |
| 4.00%, due 5/1/36 | 750,000 | 716,960 |
| State of Michigan, Unlimited General Obligation | | |
| Series A | | |
| 3.625%, due 5/15/24 | 1,000,000 | 989,438 |
| State of Michigan, Trunk Line, Revenue Bonds | | |
| 5.50%, due 11/15/44 | 2,000,000 | 2,146,682 |
| Summit Academy North, Michigan Public School Academy, Revenue Bonds | | |
| 2.25%, due 11/1/26 | 205,000 | 186,185 |
| Wayne County Airport Authority, Detroit Metropolitan Wayne County Airport, Revenue Bonds (c) | | |
| Series C | | |
| 5.00%, due 12/1/39 | 1,475,000 | 1,434,056 |
| Series B, Insured: AGM | | |
| 5.50%, due 12/1/40 | 1,595,000 | 1,654,522 |
| Wyoming Public Schools, Unlimited General Obligation | | |
| Series III, Insured: AGM | | |
| 4.00%, due 5/1/41 | 500,000 | 443,262 |
| | | 18,769,112 |
| Minnesota 0.0% ‡ |
| City of Independence, Global Academy Project, Revenue Bonds | | |
| Series A | | |
| 4.00%, due 7/1/41 | 280,000 | 209,149 |
| | Principal
Amount | Value |
| |
| Mississippi 0.1% |
| Mississippi Hospital Equipment & Facilities Authority, Forrest County General Hospital Project, Revenue Bonds | | |
| Series A | | |
| 5.00%, due 1/1/34 | $ 810,000 | $ 825,792 |
| Missouri 1.3% |
| Hickman Mills C-1 School District, Unlimited General Obligation | | |
| Series C-1, Insured: BAM | | |
| 5.75%, due 3/1/42 | 2,000,000 | 2,104,019 |
| Missouri Joint Municipal Electric Utility Commission, Iatan 2 Project, Revenue Bonds | | |
| Series A | | |
| 5.00%, due 12/1/36 | 2,190,000 | 2,200,195 |
| Missouri Joint Municipal Electric Utility Commission, Prairie State Project, Revenue Bonds | | |
| Series A | | |
| 5.00%, due 12/1/40 | 1,450,000 | 1,448,521 |
| Pattonville R-3 School District, Unlimited General Obligation | | |
| Insured: State Aid Direct Deposit | | |
| 5.50%, due 3/1/39 | 500,000 | 534,392 |
| Wright City R-II School District, Unlimited General Obligation | | |
| Insured: AGM | | |
| 6.00%, due 3/1/30 | 350,000 | 391,338 |
| Insured: AGM | | |
| 6.00%, due 3/1/32 | 415,000 | 476,821 |
| | | 7,155,286 |
| Montana 0.1% |
| County of Gallatin, Bozeman Fiber Project, Revenue Bonds (b) | | |
| Series A | | |
| 4.00%, due 10/15/32 | 300,000 | 257,962 |
| Series A | | |
| 4.00%, due 10/15/36 | 300,000 | 240,329 |
| | | 498,291 |
| Nebraska 1.1% |
| Central Plains Energy, Nebraska Gas Project No. 4, Revenue Bonds | | |
| Series A | | |
| 5.00%, due 3/1/50 (a) | 1,500,000 | 1,504,606 |
The notes to the financial statements are an integral part of, and should be read in conjunction with, the financial statements.
| 20 | MainStay MacKay Strategic Municipal Allocation Fund |
| | Principal
Amount | Value |
| Long-Term Municipal Bonds (continued) |
| Nebraska (continued) |
| Nebraska Public Power District, Revenue Bonds | | |
| Series D | | |
| 5.00%, due 1/1/41 | $ 2,275,000 | $ 2,278,566 |
| Omaha Public Power District, Nebraska City Station Unit 2, Revenue Bonds | | |
| Series A | | |
| 5.00%, due 2/1/46 | 700,000 | 702,798 |
| Series A | | |
| 5.25%, due 2/1/42 | 1,500,000 | 1,506,429 |
| | | 5,992,399 |
| Nevada 0.2% |
| Henderson Local Improvement District No. T-22, Rainbow Canyon Phase II, Special Assessment | | |
| 5.00%, due 3/1/24 | 100,000 | 100,095 |
| 5.00%, due 3/1/25 | 200,000 | 200,802 |
| 5.00%, due 3/1/26 | 300,000 | 301,813 |
| Tahoe-Douglas Visitors Authority, Revenue Bonds | | |
| 5.00%, due 7/1/33 | 500,000 | 489,953 |
| | | 1,092,663 |
| New Hampshire 0.1% |
| New Hampshire Business Finance Authority, Pennichuck Water Works, Inc. Project, Revenue Bonds | | |
| Series A | | |
| 4.00%, due 4/1/30 (c) | 495,000 | 466,255 |
| New Jersey 2.6% |
| Essex County Improvement Authority, North Star Academy Charter School of Newark, Inc., Revenue Bonds | | |
| 4.00%, due 7/15/30 (b) | 250,000 | 237,691 |
| New Jersey Economic Development Authority, Revenue Bonds | | |
| Series A | | |
| 4.914%, due 3/1/24 | 1,000,000 | 996,580 |
| New Jersey Economic Development Authority, Port Newark Container Terminal LLC, Revenue Bonds | | |
| 5.00%, due 10/1/37 (c) | 1,500,000 | 1,444,598 |
| | Principal
Amount | Value |
| |
| New Jersey (continued) |
| New Jersey Economic Development Authority, School Facilities Construction, Revenue Bonds | | |
| Series UU | | |
| 5.00%, due 6/15/40 | $ 470,000 | $ 472,257 |
| Series WW | | |
| 5.25%, due 6/15/33 | 2,500,000 | 2,557,759 |
| New Jersey Economic Development Authority, New Jersey Transit Transportation Project, Revenue Bonds | | |
| Series A | | |
| 5.00%, due 11/1/44 | 3,000,000 | 2,970,504 |
| New Jersey Economic Development Authority, Continental Airlines, Inc. Project, Revenue Bonds | | |
| Series B | | |
| 5.625%, due 11/15/30 (c) | 250,000 | 249,995 |
| New Jersey Housing & Mortgage Finance Agency, Amity Heights Apartments, Revenue Bonds | | |
| Series A, Insured: HUD Sector 8 | | |
| 3.50%, due 7/1/25 (a) | 815,000 | 808,725 |
| New Jersey Transportation Trust Fund Authority, Transportation Program, Revenue Bonds | | |
| Series CC | | |
| 5.25%, due 6/15/32 | 2,000,000 | 2,150,432 |
| New Jersey Turnpike Authority, Revenue Bonds | | |
| Series B | | |
| 5.00%, due 1/1/42 | 1,000,000 | 1,018,222 |
| State of New Jersey, Unlimited General Obligation | | |
| 5.00%, due 6/1/39 | 500,000 | 511,318 |
| Tobacco Settlement Financing Corp., Revenue Bonds | | |
| Series B | | |
| 5.00%, due 6/1/46 | 1,000,000 | 928,429 |
| | | 14,346,510 |
| New York 9.1% |
| Albany Capital Resource Corp., Albany Leadership Charter High School For Girls Project, Revenue Bonds | | |
| 4.00%, due 6/1/29 | 315,000 | 289,412 |
The notes to the financial statements are an integral part of, and should be read in conjunction with, the financial statements.
21
Portfolio of Investments October 31, 2023†^ (continued)
| | Principal
Amount | Value |
| Long-Term Municipal Bonds (continued) |
| New York (continued) |
| City of New York, Unlimited General Obligation | | |
| Series F-1 | | |
| 5.00%, due 6/1/35 | $ 1,000,000 | $ 1,006,739 |
| Series F-1 | | |
| 5.00%, due 8/1/38 | 500,000 | 521,203 |
| Series B-1 | | |
| 5.25%, due 10/1/47 | 1,500,000 | 1,537,887 |
| Hudson Yards Infrastructure Corp., Second Indenture, Revenue Bonds | | |
| Series A, Insured: AGM | | |
| 4.00%, due 2/15/47 | 540,000 | 459,241 |
| Long Island Power Authority, Electric System, Revenue Bonds | | |
| Series A | | |
| 5.00%, due 9/1/39 | 1,000,000 | 999,271 |
| Series E | | |
| 5.00%, due 9/1/40 | 250,000 | 255,986 |
| Series E | | |
| 5.00%, due 9/1/41 | 250,000 | 254,718 |
| Metropolitan Transportation Authority, Revenue Bonds | | |
| Series B | | |
| 4.00%, due 11/15/36 | 750,000 | 685,824 |
| Series C | | |
| 5.00%, due 11/15/38 | 250,000 | 250,464 |
| Series C | | |
| 5.00%, due 11/15/42 | 500,000 | 500,929 |
| Metropolitan Transportation Authority, Green Bond, Revenue Bonds | | |
| Series A-1 | | |
| 5.00%, due 11/15/29 | 500,000 | 504,963 |
| Series A-1 | | |
| 5.00%, due 11/15/32 | 1,295,000 | 1,305,695 |
| Nassau County Local Economic Assistance Corp., Roosevelt Children's Academy Charter School, Revenue Bonds | | |
| Series A | | |
| 4.00%, due 7/1/33 | 750,000 | 692,108 |
| New York City Housing Development Corp., Multi-Family Housing, Sustainable Neighborhood, Revenue Bonds | | |
| Series F-2A, Insured: FHA 542(C) | | |
| 3.40%, due 11/1/62 (a) | 500,000 | 479,664 |
| | Principal
Amount | Value |
| |
| New York (continued) |
| New York City Municipal Water Finance Authority, Water & Sewer System Second General Resolution, Revenue Bonds | | |
| Series HH | | |
| 5.00%, due 6/15/37 | $ 2,000,000 | $ 2,004,781 |
| Series HH | | |
| 5.00%, due 6/15/39 | 1,000,000 | 1,000,849 |
| Series DD-2 | | |
| 5.00%, due 6/15/40 | 1,000,000 | 1,014,314 |
| Series DD-1 | | |
| 5.00%, due 6/15/49 | 305,000 | 304,134 |
| New York City Transitional Finance Authority, Future Tax Secured, Revenue Bonds | | |
| Series B-1 | | |
| 5.00%, due 11/1/38 | 3,000,000 | 3,002,543 |
| Series F-1 | | |
| 5.00%, due 5/1/42 | 750,000 | 750,178 |
| Series C | | |
| 5.50%, due 5/1/41 | 2,000,000 | 2,150,082 |
| Series D-1 | | |
| 5.50%, due 11/1/45 | 2,000,000 | 2,107,939 |
| New York City Transitional Finance Authority, Building Aid, Revenue Bonds | | |
| Series S-2, Insured: State Aid Withholding | | |
| 5.00%, due 7/15/40 | 1,500,000 | 1,486,994 |
| Series S-1, Insured: State Aid Withholding | | |
| 5.00%, due 7/15/43 | 1,555,000 | 1,549,790 |
| New York Liberty Development Corp., Bank of America Tower at One Bryant Park Project, Revenue Bonds | | |
| 2.45%, due 9/15/69 | 500,000 | 428,643 |
| New York Liberty Development Corp., Green Bond, Revenue Bonds | | |
| Series A, Insured: AGM-CR | | |
| 2.75%, due 11/15/41 | 370,000 | 256,245 |
| New York Liberty Development Corp., 1 World Trade Center, Revenue Bonds | | |
| Insured: BAM | | |
| 4.00%, due 2/15/43 | 1,500,000 | 1,272,724 |
| New York Liberty Development Corp., 3 World Trade Center LLC, Revenue Bonds | | |
| Class 1 | | |
| 5.00%, due 11/15/44 (b) | 1,250,000 | 1,119,563 |
The notes to the financial statements are an integral part of, and should be read in conjunction with, the financial statements.
| 22 | MainStay MacKay Strategic Municipal Allocation Fund |
| | Principal
Amount | Value |
| Long-Term Municipal Bonds (continued) |
| New York (continued) |
| New York State Dormitory Authority, State Personal Income Tax, Revenue Bonds | | |
| Series E | | |
| 3.00%, due 3/15/41 | $ 250,000 | $ 185,518 |
| Series E | | |
| 4.00%, due 3/15/45 | 1,950,000 | 1,688,935 |
| Series B | | |
| 5.00%, due 2/15/40 | 1,300,000 | 1,307,778 |
| Series C | | |
| 5.00%, due 3/15/41 | 1,700,000 | 1,692,662 |
| New York State Dormitory Authority, Sales tax, Revenue Bonds | | |
| Series E-3 | | |
| 5.00%, due 3/15/41 | 1,500,000 | 1,517,539 |
| New York State Thruway Authority, Revenue Bonds, Junior Lien | | |
| Series A | | |
| 5.00%, due 1/1/41 | 1,000,000 | 992,659 |
| New York Transportation Development Corp., John F. kennedy International Airport Project, Revenue Bonds | | |
| Series A | | |
| 5.00%, due 12/1/25 (c) | 1,400,000 | 1,404,934 |
| New York Transportation Development Corp., LaGuardia Airport Terminal B Redevelopment Project, Revenue Bonds | | |
| Series A | | |
| 5.00%, due 7/1/46 (c) | 4,000,000 | 3,683,405 |
| Port Authority of New York & New Jersey, Consolidated 234th, Revenue Bonds | | |
| Series 234 | | |
| 5.00%, due 8/1/38 (c) | 3,500,000 | 3,500,232 |
| Triborough Bridge & Tunnel Authority, MTA Bridges & Tunnels, Revenue Bonds, Senior Lien | | |
| Series A-2, Insured: AGM-CR | | |
| 2.00%, due 5/15/45 (a) | 250,000 | 221,820 |
| Series C | | |
| 5.25%, due 11/15/40 | 1,000,000 | 1,050,689 |
| Triborough Bridge & Tunnel Authority, MTA Bridges & Tunnels, Revenue Bonds | | |
| Series C | | |
| 5.00%, due 11/15/37 | 1,000,000 | 1,016,710 |
| Series B-3 | | |
| 5.00%, due 11/15/38 | 640,000 | 636,574 |
| | Principal
Amount | Value |
| |
| New York (continued) |
| Triborough Bridge & Tunnel Authority, MTA Bridges & Tunnels, Revenue Bonds (continued) | | |
| Series A | | |
| 5.00%, due 11/15/40 | $ 3,005,000 | $ 2,992,841 |
| | | 50,085,179 |
| North Carolina 1.4% |
| City of Fayetteville, Public Works Commission, Revenue Bonds | | |
| 2.25%, due 3/1/41 | 3,760,000 | 2,384,972 |
| Greater Asheville Regional Airport Authority, Revenue Bonds (c) | | |
| Series A, Insured: AGM | | |
| 5.00%, due 7/1/30 | 1,500,000 | 1,533,270 |
| Insured: AGM | | |
| 5.25%, due 7/1/40 | 500,000 | 505,894 |
| Insured: AGM | | |
| 5.25%, due 7/1/43 | 500,000 | 500,636 |
| North Carolina Turnpike Authority, Triangle Expressway System, Revenue Bonds, Senior Lien | | |
| Insured: AGM | | |
| 5.00%, due 1/1/36 | 1,545,000 | 1,583,875 |
| Insured: AGM | | |
| 5.00%, due 1/1/49 | 1,000,000 | 984,531 |
| | | 7,493,178 |
| North Dakota 0.6% |
| City of Grand Forks, Altru Health System, Revenue Bonds | | |
| Insured: AGM-CR | | |
| 4.00%, due 12/1/37 | 310,000 | 264,906 |
| Series A, Insured: AGM | | |
| 5.00%, due 12/1/30 | 700,000 | 730,012 |
| Series A, Insured: AGM | | |
| 5.00%, due 12/1/31 | 650,000 | 678,595 |
| Series A, Insured: AGM | | |
| 5.00%, due 12/1/32 | 800,000 | 835,539 |
| Series A, Insured: AGM | | |
| 5.00%, due 12/1/33 | 1,000,000 | 1,042,231 |
| | | 3,551,283 |
| Ohio 2.2% |
| American Municipal Power, Inc., Hydroelectric Projects, Revenue Bonds | | |
| Series A | | |
| 5.00%, due 2/15/41 | 3,000,000 | 2,934,528 |
The notes to the financial statements are an integral part of, and should be read in conjunction with, the financial statements.
23
Portfolio of Investments October 31, 2023†^ (continued)
| | Principal
Amount | Value |
| Long-Term Municipal Bonds (continued) |
| Ohio (continued) |
| City of Toledo, Various Purpose Improvement, Limited General Obligation | | |
| Insured: AGM | | |
| 5.25%, due 12/1/35 | $ 1,000,000 | $ 1,071,807 |
| Insured: AGM | | |
| 5.25%, due 12/1/37 | 750,000 | 787,647 |
| City of Upper Arlington, Various Purpose, Limited General Obligation | | |
| 5.75%, due 12/1/38 | 700,000 | 719,283 |
| Cloverleaf Local School District, Certificate of Participation | | |
| Insured: BAM | | |
| 5.375%, due 12/1/37 | 750,000 | 769,618 |
| Euclid City School District, Unlimited General Obligation | | |
| Series A, Insured: SD CRED PROG | | |
| 5.25%, due 1/15/44 | 2,000,000 | 2,021,533 |
| Forest Hills Local School District, Unlimited General Obligation | | |
| 5.00%, due 12/1/44 | 490,000 | 490,563 |
| Ohio Air Quality Development Authority, American Electric Power Co. Project, Revenue Bonds (a)(c) | | |
| Series D | | |
| 2.10%, due 10/1/28 | 1,000,000 | 966,904 |
| Series B | | |
| 2.50%, due 11/1/42 | 1,000,000 | 828,169 |
| Ohio Air Quality Development Authority, Ohio Valley Electric Corp. Project, Revenue Bonds | | |
| Series D | | |
| 2.875%, due 2/1/26 | 250,000 | 234,665 |
| Ohio Air Quality Development Authority, Pratt Paper LLC Project, Revenue Bonds | | |
| 4.50%, due 1/15/48 (b)(c) | 250,000 | 213,480 |
| State of Ohio, Portsmouth Bypass Project, Revenue Bonds | | |
| Insured: AGM | | |
| 5.00%, due 12/31/35 (c) | 1,000,000 | 993,667 |
| | | 12,031,864 |
| | Principal
Amount | Value |
| |
| Pennsylvania 4.0% |
| Allegheny County Airport Authority, Revenue Bonds (c) | | |
| Series A, Insured: AGM | | |
| 5.50%, due 1/1/42 | $ 2,000,000 | $ 2,051,580 |
| Series A, Insured: AGM | | |
| 5.50%, due 1/1/43 | 1,500,000 | 1,535,425 |
| Allentown Neighborhood Improvement Zone Development Authority, City Center Project, Revenue Bonds | | |
| 5.00%, due 5/1/27 (b) | 270,000 | 269,614 |
| Allentown Neighborhood Improvement Zone Development Authority, Revenue Bonds | | |
| 6.00%, due 5/1/42 (b) | 500,000 | 488,010 |
| Bucks County Industrial Development Authority, Grand View Hospital Project, Revenue Bonds | | |
| 5.00%, due 7/1/34 | 300,000 | 259,262 |
| 5.00%, due 7/1/35 | 300,000 | 256,011 |
| Chester County Industrial Development Authority, Collegium Charter School, Revenue Bonds | | |
| 5.00%, due 10/15/32 (b) | 250,000 | 239,204 |
| Coatesville School District, Limited General Obligation | | |
| Insured: BAM State Aid Withholding | | |
| 5.25%, due 11/15/37 | 5,000,000 | 5,119,635 |
| Dauphin County General Authority, Harrisburg University Science Technology Project (The), Revenue Bonds (b) | | |
| 4.25%, due 10/15/26 | 100,000 | 92,050 |
| 5.00%, due 10/15/30 | 1,000,000 | 876,774 |
| Indiana County Industrial Development Authority, Foundation for Indiana University of Pennsylvania (The), Revenue Bonds | | |
| Insured: BAM | | |
| 5.00%, due 5/1/29 | 250,000 | 255,636 |
| Lancaster Industrial Development Authority, Landis Homes Retirement Community, Revenue Bonds | | |
| 4.00%, due 7/1/37 | 100,000 | 79,284 |
| Pennsylvania Economic Development Financing Authority, Penndot Major Bridges Project, Revenue Bonds (c) | | |
| 5.25%, due 6/30/35 | 1,800,000 | 1,849,955 |
| 5.50%, due 6/30/37 | 250,000 | 258,895 |
The notes to the financial statements are an integral part of, and should be read in conjunction with, the financial statements.
| 24 | MainStay MacKay Strategic Municipal Allocation Fund |
| | Principal
Amount | Value |
| Long-Term Municipal Bonds (continued) |
| Pennsylvania (continued) |
Pennsylvania Economic Development Financing Authority, Penndot Major Bridges Project, Revenue Bonds (c)
(continued) | | |
| 5.50%, due 6/30/38 | $ 500,000 | $ 512,690 |
| Pennsylvania Higher Educational Facilities Authority, Bryn Mawr College, Revenue Bonds | | |
| 5.00%, due 12/1/38 | 1,000,000 | 1,002,817 |
| Pennsylvania Housing Finance Agency, Revenue Bonds | | |
| Series A-141 | | |
| 5.75%, due 10/1/53 | 650,000 | 667,240 |
| Pennsylvania Turnpike Commission, Revenue Bonds | | |
| Series B | | |
| 4.00%, due 12/1/42 | 250,000 | 213,249 |
| Series A-1 | | |
| 5.00%, due 12/1/41 | 1,000,000 | 991,320 |
| Series B | | |
| 5.25%, due 12/1/39 | 785,000 | 785,843 |
| Series A | | |
| 5.50%, due 12/1/46 | 1,155,000 | 1,167,193 |
| Pennsylvania Turnpike Commission, Oil Franchise, Revenue Bonds | | |
| Series A | | |
| 5.25%, due 12/1/44 | 500,000 | 510,193 |
| Philadelphia Authority for Industrial Development, Philadelphia Performing Arts Charter School Project, Revenue Bonds | | |
| 5.00%, due 6/15/30 (b) | 435,000 | 431,594 |
| Pittsburgh Water & Sewer Authority, Revenue Bonds, First Lien | | |
| Series A, Insured: AGM | | |
| 5.00%, due 9/1/35 | 1,200,000 | 1,283,986 |
| West Shore School District, Limited General Obligation | | |
| Insured: State Aid Withholding | | |
| 5.00%, due 11/15/43 | 1,000,000 | 1,002,762 |
| | | 22,200,222 |
| Puerto Rico 1.2% |
| Commonwealth of Puerto Rico | | |
| (zero coupon), due 11/1/43 | 98,097 | 48,926 |
| | Principal
Amount | Value |
| |
| Puerto Rico (continued) |
| Commonwealth of Puerto Rico, Unlimited General Obligation | | |
| Series A-1 | | |
| 4.00%, due 7/1/35 | $ 518,717 | $ 436,029 |
| Series A-1 | | |
| 5.625%, due 7/1/27 | 625,000 | 636,314 |
| Series A-1 | | |
| 5.75%, due 7/1/31 | 265,000 | 273,082 |
| Puerto Rico Commonwealth Aqueduct & Sewer Authority, Revenue Bonds | | |
| Series B | | |
| 5.00%, due 7/1/28 (b) | 1,000,000 | 1,003,231 |
| Puerto Rico Commonwealth Aqueduct & Sewer Authority, Revenue Bonds, Senior Lien | | |
| Series A | | |
| 5.00%, due 7/1/33 (b) | 1,000,000 | 979,686 |
| Puerto Rico Sales Tax Financing Corp., Revenue Bonds | | |
| Series A-2 | | |
| 4.329%, due 7/1/40 | 2,500,000 | 2,165,814 |
| Series A-1 | | |
| 4.55%, due 7/1/40 | 1,000,000 | 890,115 |
| | | 6,433,197 |
| Rhode Island 0.4% |
| Rhode Island Health and Educational Building Corp., Public Schools Financing Program, Revenue Bonds | | |
| Series F | | |
| 5.50%, due 5/15/47 | 1,500,000 | 1,560,556 |
| Rhode Island Housing and Mortgage Finance Corp., Revenue Bonds | | |
| Series A-77 | | |
| 5.00%, due 4/1/27 | 555,000 | 568,023 |
| | | 2,128,579 |
| South Carolina 0.4% |
| City of Spartanburg, Water System, Revenue Bonds | | |
| Series A | | |
| 5.00%, due 12/1/34 | 1,000,000 | 1,011,112 |
| South Carolina State Housing Finance & Development Authority, Dillon School Senior LP, Revenue Bonds | | |
| Insured: HUD SECT 202 | | |
| 5.00%, due 10/1/26 (a) | 1,335,000 | 1,342,034 |
| | | 2,353,146 |
The notes to the financial statements are an integral part of, and should be read in conjunction with, the financial statements.
25
Portfolio of Investments October 31, 2023†^ (continued)
| | Principal
Amount | Value |
| Long-Term Municipal Bonds (continued) |
| South Dakota 0.1% |
| Baltic School District No. 49-1, Unlimited General Obligation | | |
| Insured: AGM | | |
| 4.50%, due 12/1/40 | $ 575,000 | $ 533,655 |
| Tennessee 1.7% |
| Health Educational and Housing Facility Board of the City of Memphis (The), Strategies LP, Revenue Bonds | | |
| Insured: HUD Sector 8 FHA 221(D4) | | |
| 5.00%, due 7/1/27 (a) | 500,000 | 502,074 |
| Health Educational and Housing Facility Board of the City of Memphis (The), Strategies II LP, Revenue Bonds | | |
| Insured: HUD Sector 8 FHA 221(D4) | | |
| 5.00%, due 7/1/27 (a) | 500,000 | 502,198 |
| Knox County Health Educational & Housing Facility Board, Revenue Bonds | | |
| 4.05%, due 12/1/27 (a) | 3,000,000 | 2,998,754 |
| Metropolitan Government Nashville & Davidson County Health & Educational Facilities Board, 619 at Old Stone Bridge Crossings LP, Revenue Bonds | | |
| Series B | | |
| 4.00%, due 4/1/26 (a) | 1,511,000 | 1,489,756 |
| Metropolitan Nashville Airport Authority (The), Revenue Bonds | | |
| Series B | | |
| 5.00%, due 7/1/36 (c) | 3,500,000 | 3,434,905 |
| Tennessee Energy Acquisition Corp., Revenue Bonds | | |
| Series B | | |
| 5.625%, due 9/1/26 | 500,000 | 500,076 |
| | | 9,427,763 |
| Texas 11.2% |
| Alamito Public Facility Corp., EP WH Mesa Franklin LLC, Revenue Bonds | | |
| Insured: FHA 221(D4) | | |
| 3.50%, due 9/1/25 (a) | 1,003,000 | 992,508 |
| Alamito Public Facility Corp., EP WH Cien Palmas LLC, Revenue Bonds | | |
| Insured: HUD Sector 8 FHA 221(D4) | | |
| 3.50%, due 9/1/25 (a) | 1,008,000 | 1,000,281 |
| | Principal
Amount | Value |
| |
| Texas (continued) |
| Alamito Public Facility Corp., EP Salazar LP, Revenue Bonds | | |
| Insured: HUD Sector 8 | | |
| 5.00%, due 8/1/44 (a) | $ 1,000,000 | $ 1,008,798 |
| Allen Independent School District, Unlimited General Obligation | | |
| Insured: PSF-GTD | | |
| 5.00%, due 2/15/35 | 2,000,000 | 2,048,290 |
| Arlington Higher Education Finance Corp., Trinity Basin Preparatory, Inc., Revenue Bonds | | |
| Insured: PSF-GTD | | |
| 5.00%, due 8/15/41 | 1,115,000 | 1,130,687 |
| Barbers Hill Independent School District, Unlimited General Obligation | | |
| Insured: PSF-GTD | | |
| 4.00%, due 2/15/41 | 1,000,000 | 888,689 |
| Belmont Fresh Water Supply District No. 1, Unlimited General Obligation | | |
| Insured: BAM | | |
| 5.00%, due 3/1/30 | 440,000 | 453,763 |
| Central Texas Regional Mobility Authority, Revenue Bonds | | |
| (zero coupon), due 1/1/27 | 1,900,000 | 1,652,488 |
| Central Texas Regional Mobility Authority, Revenue Bonds, Sub. Lien | | |
| Series C | | |
| 5.00%, due 1/1/27 | 1,145,000 | 1,163,684 |
| Central Texas Turnpike System, Revenue Bonds, First Tier | | |
| Series A | | |
| 5.00%, due 8/15/39 | 1,185,000 | 1,190,116 |
| City of Arlington, Special Tax, Special Tax, Senior Lien | | |
| Series A, Insured: AGM | | |
| 5.00%, due 2/15/43 | 250,000 | 250,188 |
| City of College Station, Limited General Obligation | | |
| 2.00%, due 2/15/36 | 1,000,000 | 711,948 |
| City of Georgetown, Utility System, Revenue Bonds | | |
| Insured: AGM | | |
| 5.00%, due 8/15/28 | 1,035,000 | 1,080,268 |
| City of Houston, Hotel Occupancy Tax & Special Tax, Revenue Bonds | | |
| 5.00%, due 9/1/28 | 365,000 | 379,335 |
The notes to the financial statements are an integral part of, and should be read in conjunction with, the financial statements.
| 26 | MainStay MacKay Strategic Municipal Allocation Fund |
| | Principal
Amount | Value |
| Long-Term Municipal Bonds (continued) |
| Texas (continued) |
| City of Houston, Combined Utility System, Revenue Bonds, First Lien | | |
| Series B | | |
| 5.00%, due 11/15/35 | $ 2,000,000 | $ 2,029,183 |
| County of Parker, Unlimited General Obligation | | |
| 5.00%, due 2/15/42 | 6,000,000 | 6,021,268 |
| Dallas Fort Worth International Airport, Revenue Bonds | | |
| Series A | | |
| 4.00%, due 11/1/46 | 250,000 | 211,172 |
| Series B | | |
| 5.00%, due 11/1/36 | 1,000,000 | 1,046,404 |
| Dallas Independent School District, Unlimited General Obligation | | |
| Insured: PSF-GTD | | |
| 5.00%, due 2/15/48 | 845,000 | 860,239 |
| Forney Independent School District, Unlimited General Obligation | | |
| Insured: BAM | | |
| (zero coupon), due 8/15/41 | 255,000 | 83,756 |
| Harris County Municipal Utility District No. 423, Unlimited General Obligation | | |
| Series A, Insured: BAM | | |
| 7.25%, due 4/1/26 | 300,000 | 319,502 |
| Series A, Insured: BAM | | |
| 7.25%, due 4/1/27 | 300,000 | 327,378 |
| Harris County Municipal Utility District No. 489, Unlimited General Obligation | | |
| Series A, Insured: AGM | | |
| 6.50%, due 9/1/29 | 1,000,000 | 1,096,428 |
| Harris County Toll Road, Revenue Bonds, Senior Lien | | |
| Series A | | |
| 5.00%, due 8/15/43 | 2,290,000 | 2,304,918 |
| Harris County Water Control & Improvement District No. 159, Unlimited General Obligation | | |
| Insured: BAM | | |
| 6.375%, due 9/1/30 (d) | 2,000,000 | 2,203,138 |
| Houston Higher Education Finance Corp., KIPP, Inc., Revenue Bonds | | |
| Series A, Insured: PSF-GTD | | |
| 4.00%, due 2/15/39 | 1,000,000 | 892,449 |
| | Principal
Amount | Value |
| |
| Texas (continued) |
| Matagorda County Navigation District No. 1, Central Power and Light Company Project, Revenue Bonds | | |
| Series A | | |
| 2.60%, due 11/1/29 | $ 1,500,000 | $ 1,280,644 |
| 4.25%, due 5/1/30 (c) | 1,000,000 | 943,574 |
| Mesquite Independent School District, Unlimited General Obligation | | |
| Series A, Insured: PSF-GTD | | |
| 4.00%, due 8/15/35 | 1,530,000 | 1,533,596 |
| Series A, Insured: PSF-GTD | | |
| 4.00%, due 8/15/37 | 1,655,000 | 1,658,889 |
| Midlothian Independent School District, Unlimited General Obligation | | |
| Insured: PSF-GTD | | |
| 5.00%, due 2/15/43 | 3,460,000 | 3,481,779 |
| New Hope Cultural Education Facilities Finance Corp., Jubilee Academic Center, Inc., Revenue Bonds | | |
| 4.00%, due 8/15/29 (b) | 1,240,000 | 1,130,950 |
| New Hope Cultural Education Facilities Finance Corp., Outlook at Windhaven Forefront Living, Revenue Bonds | | |
| Series B-3 | | |
| 4.25%, due 10/1/26 | 1,100,000 | 1,062,537 |
| North Texas Tollway Authority, Revenue Bonds | | |
| Series B | | |
| 5.00%, due 1/1/45 | 1,000,000 | 990,352 |
| North Texas Tollway Authority, Revenue Bonds, First Tier | | |
| Series A | | |
| 5.25%, due 1/1/38 | 1,000,000 | 1,050,342 |
| Northwest Independent School District, Unlimited General Obligation | | |
| Insured: PSF-GTD | | |
| 5.00%, due 2/15/40 | 325,000 | 336,708 |
| Insured: PSF-GTD | | |
| 5.00%, due 2/15/41 | 350,000 | 361,257 |
| Pecos Barstow Toyah Independent School District, Unlimited General Obligation | | |
| Insured: PSF-GTD | | |
| 5.00%, due 2/15/37 | 1,000,000 | 1,030,794 |
| Insured: PSF-GTD | | |
| 5.00%, due 2/15/39 | 515,000 | 516,247 |
| Insured: PSF-GTD | | |
| 5.00%, due 2/15/40 | 2,500,000 | 2,494,026 |
The notes to the financial statements are an integral part of, and should be read in conjunction with, the financial statements.
27
Portfolio of Investments October 31, 2023†^ (continued)
| | Principal
Amount | Value |
| Long-Term Municipal Bonds (continued) |
| Texas (continued) |
Pecos Barstow Toyah Independent School District, Unlimited General Obligation
(continued) | | |
| Insured: PSF-GTD | | |
| 5.00%, due 2/15/41 | $ 1,500,000 | $ 1,494,879 |
| Sabine-Neches Navigation District, Waterway Project, Limited General Obligation | | |
| 5.25%, due 2/15/39 | 1,500,000 | 1,560,745 |
| State of Texas, Mobility Fund, Unlimited General Obligation | | |
| Series B | | |
| 5.00%, due 10/1/36 | 5,000,000 | 5,044,631 |
| State of Texas, Transportation Commission, Highway Improvement, Unlimited General Obligation | | |
| Series A | | |
| 5.00%, due 4/1/37 | 750,000 | 760,780 |
| Texas Department of Housing & Community Affairs, Revenue Bonds | | |
| Series A, Insured: GNMA | | |
| 3.50%, due 7/1/52 | 625,000 | 591,058 |
| Texas Private Activity Bond Surface Transportation Corp., Blueridge Transportation Group LLC, Revenue Bonds, Senior Lien | �� | |
| 5.00%, due 12/31/45 (c) | 1,000,000 | 904,798 |
| Texas Public Finance Authority, Financing System-Texas Southern University, Revenue Bonds | | |
| Insured: BAM | | |
| 5.00%, due 5/1/32 | 1,000,000 | 1,031,504 |
| Trinity River Authority, Tarrant County Water System, Revenue Bonds | | |
| 5.00%, due 2/1/37 | 1,250,000 | 1,320,434 |
| | | 61,927,402 |
| U.S. Virgin Islands 0.5% |
| Matching Fund Special Purpose Securitization Corp., Revenue Bonds | | |
| Series A | | |
| 5.00%, due 10/1/26 | 860,000 | 861,116 |
| Series A | | |
| 5.00%, due 10/1/30 | 2,000,000 | 1,979,699 |
| | Principal
Amount | Value |
| |
| U.S. Virgin Islands (continued) |
| Virgin Islands Public Finance Authority, Gross Receipts Taxes Loan, Revenue Bonds | | |
| Series C, Insured: AGM-CR | | |
| 5.00%, due 10/1/30 | $ 100,000 | $ 98,790 |
| | | 2,939,605 |
| Utah 2.5% |
| Central Utah Water Conservancy District, Revenue Bonds | | |
| Series B | | |
| 4.00%, due 10/1/39 | 1,000,000 | 898,800 |
| City of Salt Lake City, Airport, Revenue Bonds (c) | | |
| Series A | | |
| 5.25%, due 7/1/42 | 1,000,000 | 997,277 |
| Series A | | |
| 5.25%, due 7/1/43 | 1,000,000 | 997,242 |
| County of Utah, Intermountain Healthcare, Revenue Bonds | | |
| Series B | | |
| 5.00%, due 5/15/46 | 1,390,000 | 1,371,541 |
| Intermountain Power Agency, Revenue Bonds | | |
| Series A | | |
| 5.00%, due 7/1/41 | 880,000 | 908,437 |
| Series A | | |
| 5.25%, due 7/1/43 | 3,125,000 | 3,281,750 |
| State of Utah, Build America Bonds, Unlimited General Obligation | | |
| Series B | | |
| 3.539%, due 7/1/25 | 1,991,250 | 1,954,111 |
| UIPA Crossroads Public Infrastructure District, Tax Allocation | | |
| 4.125%, due 6/1/41 (b) | 500,000 | 407,990 |
| Utah Charter School Finance Authority, Spectrum Academy Project, Revenue Bonds | | |
| Insured: BAM UT CSCE | | |
| 4.00%, due 4/15/40 | 250,000 | 214,530 |
| Utah Charter School Finance Authority, Summit Academy, Inc. Project, Revenue Bonds | | |
| Series A, Insured: UT CSCE | | |
| 5.00%, due 4/15/28 | 200,000 | 204,418 |
| Series A, Insured: UT CSCE | | |
| 5.00%, due 4/15/29 | 185,000 | 189,595 |
The notes to the financial statements are an integral part of, and should be read in conjunction with, the financial statements.
| 28 | MainStay MacKay Strategic Municipal Allocation Fund |
| | Principal
Amount | Value |
| Long-Term Municipal Bonds (continued) |
| Utah (continued) |
| Utah Infrastructure Agency, Telecommunication, Revenue Bonds | | |
| 4.00%, due 10/15/35 | $ 700,000 | $ 615,650 |
| Series A | | |
| 5.00%, due 10/15/28 | 460,000 | 461,620 |
| 5.50%, due 10/15/33 | 1,000,000 | 1,030,874 |
| | | 13,533,835 |
| Vermont 0.3% |
| University of Vermont and State Agricultural College, Revenue Bonds | | |
| 5.00%, due 10/1/40 | 1,500,000 | 1,503,888 |
| Virginia 1.7% |
| Chesapeake Bay Bridge & Tunnel District, First Tier General Resolution, Revenue Bonds, First Tier | | |
| Insured: AGM | | |
| 5.00%, due 7/1/41 | 1,000,000 | 986,425 |
| Chesapeake Redevelopment & Housing Authority, ENV-Mill Creek LP, Revenue Bonds | | |
| Insured: FHA 221(D4) | | |
| 5.00%, due 6/1/26 (a) | 1,001,000 | 1,006,192 |
| City of Harrisonburg, Unlimited General Obligation | | |
| Series A, Insured: State Aid Withholding | | |
| 1.75%, due 7/15/35 | 3,000,000 | 2,089,025 |
| City of Richmond, Public Utility, Revenue Bonds | | |
| Series A | | |
| 5.00%, due 1/15/33 | 1,720,000 | 1,765,287 |
| James City County Economic Development Authority, Blaine Landing Phase II LP, Revenue Bonds | | |
| Insured: FHA 221(D4) | | |
| 5.00%, due 2/1/26 (a) | 1,000,000 | 1,002,082 |
| Virginia Port Authority, Revenue Bonds | | |
| Series B | | |
| 5.00%, due 7/1/41 (c) | 500,000 | 482,567 |
| Williamsburg Economic Development Authority, William & Mary Project, Revenue Bonds | | |
| Series A, Insured: AGM | | |
| 4.00%, due 7/1/42 | 1,000,000 | 866,626 |
| | Principal
Amount | Value |
| |
| Virginia (continued) |
| Wise County Industrial Development Authority, Virginia Electric and Power Co. Project, Revenue Bonds | | |
| Series A | | |
| 0.75%, due 10/1/40 (a) | $ 1,500,000 | $ 1,374,439 |
| | | 9,572,643 |
| Washington 1.9% |
| County of King, Sewer, Revenue Bonds, Junior Lien | | |
| Series A | | |
| 4.32%, due 1/1/40 | 655,000 | 640,320 |
| Energy Northwest, Bonneville Power Administration, Revenue Bonds | | |
| Series A | | |
| 5.00%, due 7/1/36 | 1,000,000 | 1,044,255 |
| Franklin County School District No. 1, Pasco, Unlimited General Obligation | | |
| Insured: School Bond Guaranty | | |
| 5.50%, due 12/1/40 | 2,000,000 | 2,155,306 |
| Port of Seattle, Revenue Bonds | | |
| Series A | | |
| 5.00%, due 4/1/31 | 1,000,000 | 1,005,592 |
| Port of Tacoma, Revenue Bonds | | |
| Series B | | |
| 5.00%, due 12/1/43 (c) | 925,000 | 888,307 |
| Snohomish County Public Utility District No. 1, Electric System, Revenue Bonds | | |
| 5.00%, due 12/1/40 | 1,500,000 | 1,493,506 |
| State of Washington, Various Purpose, Unlimited General Obligation | | |
| Series D | | |
| 5.00%, due 2/1/35 | 500,000 | 499,942 |
| Series A | | |
| 5.00%, due 8/1/42 | 655,000 | 667,514 |
| State of Washington, Motor Vehicle Fuel Tax, Unlimited General Obligation | | |
| Series R-2021A | | |
| 5.00%, due 6/1/38 | 1,000,000 | 1,038,215 |
| Washington State Convention Center Public Facilities District, Lodging Tax, Revenue Bonds | | |
| Series B | | |
| 4.00%, due 7/1/36 | 1,000,000 | 908,571 |
The notes to the financial statements are an integral part of, and should be read in conjunction with, the financial statements.
29
Portfolio of Investments October 31, 2023†^ (continued)
| | Principal
Amount | Value |
| Long-Term Municipal Bonds (continued) |
| Washington (continued) |
| Washington State Housing Finance Commission, Eliseo Project, Revenue Bonds | | |
| Series B-2 | | |
| 2.125%, due 7/1/27 (b) | $ 250,000 | $ 221,572 |
| | | 10,563,100 |
| West Virginia 0.5% |
| State of West Virginia, Unlimited General Obligation | | |
| Series A | | |
| 5.00%, due 12/1/35 | 470,000 | 493,827 |
| West Virginia Hospital Finance Authority, Charleston Area Medical Center, Inc. Obligated Group, Revenue Bonds | | |
| Series A | | |
| 5.00%, due 9/1/39 | 1,125,000 | 1,050,460 |
| West Virginia Hospital Finance Authority, Vandalia Health, Inc., Revenue Bonds | | |
| Series B, Insured: AGM | | |
| 5.125%, due 9/1/42 | 1,250,000 | 1,238,372 |
| | | 2,782,659 |
| Wisconsin 1.2% |
| County of Waushara, Revenue Notes | | |
| Series A | | |
| 4.75%, due 12/1/23 | 1,000,000 | 1,000,611 |
| Hudson School District, Unlimited General Obligation | | |
| 2.25%, due 3/1/27 | 500,000 | 453,568 |
| Public Finance Authority, Roseman University of Health Sciences, Revenue Bonds | | |
| 4.00%, due 4/1/32 (b) | 215,000 | 195,397 |
| Public Finance Authority, University of Kansas, Revenue Bonds | | |
| 5.00%, due 3/1/41 | 3,400,000 | 3,307,108 |
| Wisconsin Health & Educational Facilities Authority, Milwaukee Science Education Consortium, Inc. (The), Revenue Bonds | | |
| Series A | | |
| 4.50%, due 3/15/33 | 400,000 | 381,019 |
| | Principal
Amount | | Value |
| |
| Wisconsin (continued) |
| Wisconsin Health & Educational Facilities Authority, Milwaukee Regional Medical Center (The), Revenue Bonds | | | |
| 5.00%, due 4/1/37 | $ 1,150,000 | | $ 1,126,496 |
| | | | 6,464,199 |
| Wyoming 0.6% |
| Sweetwater County 2023 Specific Purpose Tax Joint Powers Board, Revenue Bonds | | | |
| Insured: AGM-CR | | | |
| 5.00%, due 6/15/28 | 3,000,000 | | 3,141,832 |
Total Long-Term Municipal Bonds
(Cost $535,006,945) | | | 518,685,333 |
| Short-Term Municipal Notes 0.5% |
| Arizona 0.3% |
| Arizona Industrial Development Authority, Phoenix Children's Hospital, Revenue Bonds | | | |
| Series A | | | |
| 3.87%, due 2/1/48 (e) | 1,700,000 | | 1,700,000 |
| New York 0.2% |
| New York City Transitional Finance Authority, Future Tax Secured, Revenue Bonds | | | |
| Series A-4 | | | |
| 3.95%, due 11/1/29 (e) | 900,000 | | 900,000 |
Total Short-Term Municipal Notes
(Cost $2,600,000) | | | 2,600,000 |
Total Investments
(Cost $537,606,945) | 94.4% | | 521,285,333 |
| Other Assets, Less Liabilities | 5.6 | | 31,039,516 |
| Net Assets | 100.0% | | $ 552,324,849 |
| † | Percentages indicated are based on Fund net assets. |
| ^ | Industry classifications may be different than those used for compliance monitoring purposes. |
| ‡ | Less than one-tenth of a percent. |
| (a) | Coupon rate may change based on changes of the underlying collateral or prepayments of principal. Rate shown was the rate in effect as of October 31, 2023. |
| (b) | May be sold to institutional investors only under Rule 144A or securities offered pursuant to Section 4(a)(2) of the Securities Act of 1933, as amended. |
The notes to the financial statements are an integral part of, and should be read in conjunction with, the financial statements.
| 30 | MainStay MacKay Strategic Municipal Allocation Fund |
| (c) | Interest on these securities was subject to alternative minimum tax. |
| (d) | Delayed delivery security. |
| (e) | Variable-rate demand notes (VRDNs)—Provide the right to sell the security at face value on either that day or within the rate-reset period. VRDNs will normally trade as if the maturity is the earlier put date, even though stated maturity is longer. The interest rate is reset on the put date at a stipulated daily, weekly, monthly, quarterly, or other specified time interval to reflect current market conditions. These securities do not indicate a reference rate and spread in their description. The maturity date shown is the final maturity. |
Futures Contracts
As of October 31, 2023, the Fund held the following futures contracts1:
| Type | Number of
Contracts | Expiration
Date | Value at
Trade Date | Current
Notional
Amount | Unrealized
Appreciation
(Depreciation)2 |
| Short Contracts | | | | | |
| U.S. Treasury 10 Year Ultra Bonds | (90) | December 2023 | $ (10,353,855) | $ (9,794,531) | $ 559,324 |
| 1. | As of October 31, 2023, cash in the amount of $252,000 was on deposit with a broker or futures commission merchant for futures transactions. |
| 2. | Represents the difference between the value of the contracts at the time they were opened and the value as of October 31, 2023. |
| Abbreviation(s): |
| AGM—Assured Guaranty Municipal Corp. |
| BAM—Build America Mutual Assurance Co. |
| CR—Custodial Receipts |
| FGIC—Financial Guaranty Insurance Company |
| FHA—Federal Housing Administration |
| FHLMC—Federal Home Loan Mortgage Corp. |
| FNMA—Federal National Mortgage Association |
| GNMA—Government National Mortgage Association |
| HUD—Housing and Urban Development |
| MTA—Metropolitan Transportation Authority |
| NATL-RE—National Public Finance Guarantee Corp. |
| PSF-GTD—Permanent School Fund Guaranteed |
| Q-SBLF—Qualified School Board Loan Fund |
| SD CRED PROG—School District Credit Enhancement Program |
| UT CSCE—Utah Charter School Credit Enhancement Program |
The notes to the financial statements are an integral part of, and should be read in conjunction with, the financial statements.
31
Portfolio of Investments October 31, 2023†^ (continued)
The following is a summary of the fair valuations according to the inputs used as of October 31, 2023, for valuing the Fund’s assets:
| Description | Quoted
Prices in
Active
Markets for
Identical
Assets
(Level 1) | | Significant
Other
Observable
Inputs
(Level 2) | | Significant
Unobservable
Inputs
(Level 3) | | Total |
| Asset Valuation Inputs | | | | | | | |
| Investments in Securities (a) | | | | | | | |
| Municipal Bonds | | | | | | | |
| Long-Term Municipal Bonds | $ — | | $ 518,685,333 | | $ — | | $ 518,685,333 |
| Short-Term Municipal Notes | — | | 2,600,000 | | — | | 2,600,000 |
| Total Municipal Bonds | — | | 521,285,333 | | — | | 521,285,333 |
| Other Financial Instruments | | | | | | | |
| Futures Contracts (b) | 559,324 | | — | | — | | 559,324 |
| Total Investments in Securities and Other Financial Instruments | $ 559,324 | | $ 521,285,333 | | $ — | | $ 521,844,657 |
| (a) | For a complete listing of investments and their industries, see the Portfolio of Investments. |
| (b) | The value listed for these securities reflects unrealized appreciation (depreciation) as shown on the Portfolio of Investments. |
The notes to the financial statements are an integral part of, and should be read in conjunction with, the financial statements.
| 32 | MainStay MacKay Strategic Municipal Allocation Fund |
Statement of Assets and Liabilities as of October 31, 2023
| Assets |
Investment in securities, at value
(identified cost $537,606,945) | $521,285,333 |
| Cash | 41,829,933 |
| Cash collateral on deposit at broker for futures contracts | 252,000 |
| Receivables: | |
| Interest | 6,591,146 |
| Fund shares sold | 6,369,347 |
| Investment securities sold | 338,267 |
| Other assets | 105,443 |
| Total assets | 576,771,469 |
| Liabilities |
| Payables: | |
| Investment securities purchased | 22,845,552 |
| Fund shares redeemed | 1,226,382 |
| Manager (See Note 3) | 149,909 |
| Transfer agent (See Note 3) | 36,026 |
| Custodian | 24,476 |
| NYLIFE Distributors (See Note 3) | 14,646 |
| Professional fees | 9,473 |
| Shareholder communication | 5,771 |
| Variation margin on futures contracts | 1,409 |
| Accrued expenses | 166 |
| Distributions payable | 132,810 |
| Total liabilities | 24,446,620 |
| Net assets | $552,324,849 |
| Composition of Net Assets |
| Shares of beneficial interest outstanding (par value of $.001 per share) unlimited number of shares authorized | $ 61,067 |
| Additional paid-in-capital | 576,669,165 |
| | 576,730,232 |
| Total distributable earnings (loss) | (24,405,383) |
| Net assets | $552,324,849 |
| Class A | |
| Net assets applicable to outstanding shares | $ 63,006,155 |
| Shares of beneficial interest outstanding | 6,956,726 |
| Net asset value per share outstanding | $ 9.06 |
| Maximum sales charge (3.00% of offering price) | 0.28 |
| Maximum offering price per share outstanding | $ 9.34 |
| Investor Class | |
| Net assets applicable to outstanding shares | $ 47,842 |
| Shares of beneficial interest outstanding | 5,289 |
| Net asset value per share outstanding | $ 9.05 |
| Maximum sales charge (2.50% of offering price) | 0.23 |
| Maximum offering price per share outstanding | $ 9.28 |
| Class C | |
| Net assets applicable to outstanding shares | $ 5,071,909 |
| Shares of beneficial interest outstanding | 560,990 |
| Net asset value and offering price per share outstanding | $ 9.04 |
| Class C2 | |
| Net assets applicable to outstanding shares | $ 300,863 |
| Shares of beneficial interest outstanding | 33,268 |
| Net asset value and offering price per share outstanding | $ 9.04 |
| Class I | |
| Net assets applicable to outstanding shares | $483,872,506 |
| Shares of beneficial interest outstanding | 53,507,984 |
| Net asset value and offering price per share outstanding | $ 9.04 |
| Class R6 | |
| Net assets applicable to outstanding shares | $ 25,574 |
| Shares of beneficial interest outstanding | 2,829 |
| Net asset value and offering price per share outstanding | $ 9.04 |
The notes to the financial statements are an integral part of, and should be read in conjunction with, the financial statements.
33
Statements of Operations for the period May 1, 2023 through October 31, 2023 and the year ended April 30, 2023
| | Period May 1,
2023
through
October 31,
2023(a) | Year Ended
April 30,
2023 |
| Investment Income (Loss) |
| Income | | |
| Interest | $ 8,269,642 | $ 7,200,859 |
| Expenses | | |
| Manager (See Note 3) | 857,073 | 839,511 |
| Distribution/Service—Class A (See Note 3) | 62,046 | 47,557 |
| Distribution/Service—Investor Class (See Note 3) | 67 | 322 |
| Distribution/Service—Class C (See Note 3) | 10,204 | 8,620 |
| Distribution/Service—Class C2 (See Note 3) | 791 | 348 |
| Transfer agent (See Note 3) | 119,103 | 103,820 |
| Registration | 101,967 | 125,861 |
| Shareholder communication | — | 17,528 |
| Professional fees | 81,025 | 76,071 |
| Custodian | 35,438 | 67,847 |
| Trustees | 6,132 | 4,259 |
| Miscellaneous | 2,876 | 9,660 |
| Total expenses before waiver/reimbursement | 1,276,722 | 1,301,404 |
| Expense waiver/reimbursement from Manager (See Note 3) | (87,021) | (153,643) |
| Reimbursement from prior custodian(b) | — | (597) |
| Net expenses | 1,189,701 | 1,147,164 |
| Net investment income (loss) | 7,079,941 | 6,053,695 |
| Realized and Unrealized Gain (Loss) |
| Net realized gain (loss) on: | | |
| Unaffiliated investment transactions | (603,400) | (8,103,792) |
| Futures transactions | 334,129 | 2,229,229 |
| Net realized gain (loss) | (269,271) | (5,874,563) |
| Net change in unrealized appreciation (depreciation) on: | | |
| Unaffiliated investments | (21,072,950) | 9,869,490 |
| Futures contracts | 1,860,460 | (1,835,660) |
| Net change in unrealized appreciation (depreciation) | (19,212,490) | 8,033,830 |
| Net realized and unrealized gain (loss) | (19,481,761) | 2,159,267 |
| Net increase (decrease) in net assets resulting from operations | $(12,401,820) | $ 8,212,962 |
| (a) | The Fund changed its fiscal year end from April 30 to October 31. |
| (b) | Represents a refund for overbilling of custody fees. |
The notes to the financial statements are an integral part of, and should be read in conjunction with, the financial statements.
| 34 | MainStay MacKay Strategic Municipal Allocation Fund |
Statements of Changes in Net Assets
for the period May 1, 2023 through October 31, 2023 and the years ended April 30, 2023 and April 30, 2022
| | Period May 1,
2023
through
October 31,
2023(a) | Year Ended
April 30,
2023 | Year Ended
April 30,
2022 |
| Increase (Decrease) in Net Assets |
| Operations: | | | |
| Net investment income (loss) | $ 7,079,941 | $ 6,053,695 | $ 1,039,155 |
| Net realized gain (loss) | (269,271) | (5,874,563) | 417,800 |
| Net change in unrealized appreciation (depreciation) | (19,212,490) | 8,033,830 | (7,062,471) |
| Net increase (decrease) in net assets resulting from operations | (12,401,820) | 8,212,962 | (5,605,516) |
| Distributions to shareholders: |
| Class A | (859,391) | (630,063) | (32,170) |
| Investor Class | (898) | (3,510) | (1,324) |
| Class C | (63,520) | (50,794) | (5,882) |
| Class C2 | (3,615) | (1,515) | — |
| Class I | (6,958,698) | (6,462,197) | (1,888,346) |
| Class R6 | (495) | (842) | (768) |
| Total distributions to shareholders | (7,886,617) | (7,148,921) | (1,928,490) |
| Capital share transactions: | | | |
| Net proceeds from sales of shares | 282,223,468 | 434,866,901 | 58,605,291 |
| Net asset value of shares issued to shareholders in reinvestment of distributions | 7,686,850 | 7,136,822 | 1,927,984 |
| Cost of shares redeemed | (74,377,473) | (183,989,524) | (16,807,791) |
| Increase (decrease) in net assets derived from capital share transactions | 215,532,845 | 258,014,199 | 43,725,484 |
| Net increase (decrease) in net assets | 195,244,408 | 259,078,240 | 36,191,478 |
| Net Assets |
| Beginning of period | 357,080,441 | 98,002,201 | 61,810,723 |
| End of period | $552,324,849 | $ 357,080,441 | $ 98,002,201 |
| (a) | The Fund changed its fiscal year end from April 30 to October 31. |
The notes to the financial statements are an integral part of, and should be read in conjunction with, the financial statements.
35
Financial Highlights selected per share data and ratios
| | May 1,
2023 through
October 31, | | Year Ended April 30, | | June 28, 2019^ through
April 30, |
| Class A | 2023 # | | 2023 | | 2022 | | 2021 | | 2020 |
| Net asset value at beginning of period | $ 9.47 | | $ 9.50 | | $ 10.43 | | $ 9.65 | | $ 10.00 |
| Net investment income (loss) | 0.15(a) | | 0.26(a) | | 0.12(a) | | 0.15(a) | | 0.14 |
| Net realized and unrealized gain (loss) | (0.40) | | (0.01) | | (0.78) | | 0.82 | | (0.29) |
| Total from investment operations | (0.25) | | 0.25 | | (0.66) | | 0.97 | | (0.15) |
| Less distributions: | | | | | | | | | |
| From net investment income | (0.16) | | (0.26) | | (0.17) | | (0.19) | | (0.14) |
| From net realized gain on investments | — | | (0.02) | | (0.10) | | — | | (0.06) |
| Total distributions | (0.16) | | (0.28) | | (0.27) | | (0.19) | | (0.20) |
| Net asset value at end of period | $ 9.06 | | $ 9.47 | | $ 9.50 | | $ 10.43 | | $ 9.65 |
| Total investment return (b) | (2.63)% | | 2.73% | | (6.54)% | | 10.02% | | (1.44)% |
| Ratios (to average net assets)/Supplemental Data: | | | | | | | | | |
| Net investment income (loss) | 3.09%†† | | 2.78% | | 1.22% | | 1.47% | | 1.39%†† |
| Net expenses | 0.77%†† | | 0.77% | | 0.77% | | 0.72% | | 0.77%†† |
| Expenses (before waiver/reimbursement) | 0.81%†† | | 0.84% | | 0.97% | | 0.98% | | 1.12%†† |
| Portfolio turnover rate (c) | 12% | | 81% | | 32% | | 66% | | 108% |
| Net assets at end of period (in 000's) | $ 63,006 | | $ 43,203 | | $ 5,246 | | $ 454 | | $ 136 |
| # | The Fund changed its fiscal year end from April 30 to October 31. |
| ^ | Inception date. |
| †† | Annualized. |
| (a) | Per share data based on average shares outstanding during the period. |
| (b) | Total investment return is calculated exclusive of sales charges and assumes the reinvestment of dividends and distributions. For periods of less than one year, total return is not annualized. |
| (c) | The portfolio turnover rate includes variable rate demand notes. |
| | May 1,
2023 through
October 31,
2023# | | Year Ended April 30, | | June 28,
2019^ through
April 30, |
| Investor Class | 2023 | | 2022 | | 2021 | | 2020 |
| Net asset value at beginning of period | $ 9.46 | | $ 9.49 | | $ 10.41 | | $ 9.65 | | $ 10.00 |
| Net investment income (loss) | 0.14(a) | | 0.21(a) | | 0.11(a) | | 0.13(a) | | 0.14 |
| Net realized and unrealized gain (loss) | (0.39) | | 0.03 | | (0.79) | | 0.80 | | (0.29) |
| Total from investment operations | (0.25) | | 0.24 | | (0.68) | | 0.93 | | (0.15) |
| Less distributions: | | | | | | | | | |
| From net investment income | (0.16) | | (0.25) | | (0.14) | | (0.17) | | (0.14) |
| From net realized gain on investments | — | | (0.02) | | (0.10) | | — | | (0.06) |
| Total distributions | (0.16) | | (0.27) | | (0.24) | | (0.17) | | (0.20) |
| Net asset value at end of period | $ 9.05 | | $ 9.46 | | $ 9.49 | | $ 10.41 | | $ 9.65 |
| Total investment return (b) | (2.69)% | | 2.58% | | (6.69)% | | 9.65% | | (1.56)% |
| Ratios (to average net assets)/Supplemental Data: | | | | | | | | | |
| Net investment income (loss) | 2.98%†† | | 2.23% | | 1.04% | | 1.23% | | 1.30%†† |
| Net expenses | 0.89%†† | | 0.92% | | 0.97% | | 0.98% | | 0.79%†† |
| Expenses (before waiver/reimbursement) | 0.93%†† | | 0.99% | | 1.17% | | 1.24% | | 1.14%†† |
| Portfolio turnover rate (c) | 12% | | 81% | | 32% | | 66% | | 108% |
| Net assets at end of period (in 000's) | $ 48 | | $ 100 | | $ 46 | | $ 33 | | $ 34 |
| # | The Fund changed its fiscal year end from April 30 to October 31. |
| ^ | Inception date. |
| †† | Annualized. |
| (a) | Per share data based on average shares outstanding during the period. |
| (b) | Total investment return is calculated exclusive of sales charges and assumes the reinvestment of dividends and distributions. For periods of less than one year, total return is not annualized. |
| (c) | The portfolio turnover rate includes variable rate demand notes. |
The notes to the financial statements are an integral part of, and should be read in conjunction with, the financial statements.
| 36 | MainStay MacKay Strategic Municipal Allocation Fund |
Financial Highlights selected per share data and ratios
| | May 1,
2023 through
October 31, | | Year Ended April 30, | | June 28,
2019^ through
April 30, |
| Class C | 2023 # | | 2023 | | 2022 | | 2021 | | 2020 |
| Net asset value at beginning of period | $ 9.45 | | $ 9.48 | | $ 10.42 | | $ 9.65 | | $ 10.00 |
| Net investment income (loss) | 0.13(a) | | 0.22(a) | | 0.08(a) | | 0.10(a) | | 0.12 |
| Net realized and unrealized gain (loss) | (0.39) | | (0.01) | | (0.80) | | 0.81 | | (0.29) |
| Total from investment operations | (0.26) | | 0.21 | | (0.72) | | 0.91 | | (0.17) |
| Less distributions: | | | | | | | | | |
| From net investment income | (0.15) | | (0.22) | | (0.12) | | (0.14) | | (0.12) |
| From net realized gain on investments | — | | (0.02) | | (0.10) | | — | | (0.06) |
| Total distributions | (0.15) | | (0.24) | | (0.22) | | (0.14) | | (0.18) |
| Net asset value at end of period | $ 9.04 | | $ 9.45 | | $ 9.48 | | $ 10.42 | | $ 9.65 |
| Total investment return (b) | (2.82)% | | 2.31% | | (7.12)% | | 9.49% | | (1.76)% |
| Ratios (to average net assets)/Supplemental Data: | | | | | | | | | |
| Net investment income (loss) | 2.74%†† | | 2.34% | | 0.76% | | 0.97% | | 1.11%†† |
| Net expenses | 1.13%†† | | 1.18% | | 1.22% | | 1.23% | | 1.03%†† |
| Expenses (before waiver/reimbursement) | 1.17%†† | | 1.25% | | 1.42% | | 1.49% | | 1.38%†† |
| Portfolio turnover rate (c) | 12% | | 81% | | 32% | | 66% | | 108% |
| Net assets at end of period (in 000's) | $ 5,072 | | $ 3,291 | | $ 558 | | $ 113 | | $ 79 |
| # | The Fund changed its fiscal year end from April 30 to October 31. |
| ^ | Inception date. |
| †† | Annualized. |
| (a) | Per share data based on average shares outstanding during the period. |
| (b) | Total investment return is calculated exclusive of sales charges and assumes the reinvestment of dividends and distributions. For periods of less than one year, total return is not annualized. |
| (c) | The portfolio turnover rate includes variable rate demand notes. |
| | May 1
2023 through
October 31, | | December 13,
2022^ through
April 30,
2023 |
| Class C2 | 2023 # | |
| Net asset value at beginning of period | $ 9.45 | | $ 9.43* |
| Net investment income (loss) (a) | 0.12 | | 0.09 |
| Net realized and unrealized gain (loss) | (0.39) | | 0.03 |
| Total from investment operations | (0.27) | | 0.12 |
| Less distributions: | | | |
| From net investment income | (0.14) | | (0.10) |
| Net asset value at end of period | $ 9.04 | | $ 9.45 |
| Total investment return (b) | (2.89)% | | 1.29% |
| Ratios (to average net assets)/Supplemental Data: | | | |
| Net investment income (loss)†† | 2.59% | | 2.49% |
| Net expenses†† | 1.28% | | 1.34% |
| Expenses (before waiver/reimbursement)†† | 1.32% | | 1.41% |
| Portfolio turnover rate (c) | 12% | | 81% |
| Net assets at end of period (in 000's) | $ 301 | | $ 214 |
| * | Based on the net asset value of Class C as of December 13, 2022. |
| # | The Fund changed its fiscal year end from April 30 to October 31. |
| ^ | Inception date. |
| †† | Annualized. |
| (a) | Per share data based on average shares outstanding during the period. |
| (b) | Total investment return is calculated exclusive of sales charges and assumes the reinvestment of dividends and distributions. For periods of less than one year, total return is not annualized. |
| (c) | The portfolio turnover rate includes variable rate demand notes. |
The notes to the financial statements are an integral part of, and should be read in conjunction with, the financial statements.
37
Financial Highlights selected per share data and ratios
| | May 1,
2023 through
October 31, | | Year Ended April 30, | | June 28,
2019^ through
April 30, |
| Class I | 2023 # | | 2023 | | 2022 | | 2021 | | 2020 |
| Net asset value at beginning of period | $ 9.45 | | $ 9.48 | | $ 10.42 | | $ 9.65 | | $ 10.00 |
| Net investment income (loss) | 0.16(a) | | 0.27(a) | | 0.15(a) | | 0.18(a) | | 0.16 |
| Net realized and unrealized gain (loss) | (0.39) | | 0.00‡ | | (0.80) | | 0.81 | | (0.29) |
| Total from investment operations | (0.23) | | 0.27 | | (0.65) | | 0.99 | | (0.13) |
| Less distributions: | | | | | | | | | |
| From net investment income | (0.18) | | (0.28) | | (0.19) | | (0.22) | | (0.16) |
| From net realized gain on investments | — | | (0.02) | | (0.10) | | — | | (0.06) |
| Total distributions | (0.18) | | (0.30) | | (0.29) | | (0.22) | | (0.22) |
| Net asset value at end of period | $ 9.04 | | $ 9.45 | | $ 9.48 | | $ 10.42 | | $ 9.65 |
| Total investment return (b) | (2.52)% | | 2.99% | | (6.43)% | | 10.28% | | (1.35)% |
| Ratios (to average net assets)/Supplemental Data: | | | | | | | | | |
| Net investment income (loss) | 3.34%†† | | 2.90% | | 1.49% | | 1.72% | | 1.57%†† |
| Net expenses | 0.52%†† | | 0.52% | | 0.51% | | 0.50% | | 0.53%†† |
| Expenses (before waiver/reimbursement) | 0.56%†† | | 0.59% | | 0.71% | | 0.76% | | 0.88%†† |
| Portfolio turnover rate (c) | 12% | | 81% | | 32% | | 66% | | 108% |
| Net assets at end of period (in 000's) | $ 483,873 | | $ 310,246 | | $ 92,126 | | $ 61,183 | | $ 51,059 |
| # | The Fund changed its fiscal year end from April 30 to October 31. |
| ^ | Inception date. |
| ‡ | Less than one cent per share. |
| †† | Annualized. |
| (a) | Per share data based on average shares outstanding during the period. |
| (b) | Total investment return is calculated exclusive of sales charges and assumes the reinvestment of dividends and distributions. Class I shares are not subject to sales charges. For periods of less than one year, total return is not annualized. |
| (c) | The portfolio turnover rate includes variable rate demand notes. |
The notes to the financial statements are an integral part of, and should be read in conjunction with, the financial statements.
| 38 | MainStay MacKay Strategic Municipal Allocation Fund |
Financial Highlights selected per share data and ratios
| | May 1,
2023 through
October 31, | | Year Ended April 30, | | June 28,
2019^ through
April 30, |
| Class R6 | 2023 # | | 2023 | | 2022 | | 2021 | | 2020 |
| Net asset value at beginning of period | $ 9.45 | | $ 9.48 | | $ 10.42 | | $ 9.65 | | $ 10.00 |
| Net investment income (loss) | 0.16(a) | | 0.26(a) | | 0.16(a) | | 0.18(a) | | 0.17 |
| Net realized and unrealized gain (loss) | (0.39) | | 0.02 | | (0.80) | | 0.81 | | (0.29) |
| Total from investment operations | (0.23) | | 0.28 | | (0.64) | | 0.99 | | (0.12) |
| Less distributions: | | | | | | | | | |
| From net investment income | (0.18) | | (0.29) | | (0.20) | | (0.22) | | (0.17) |
| From net realized gain on investments | — | | (0.02) | | (0.10) | | — | | (0.06) |
| Total distributions | (0.18) | | (0.31) | | (0.30) | | (0.22) | | (0.23) |
| Net asset value at end of period | $ 9.04 | | $ 9.45 | | $ 9.48 | | $ 10.42 | | $ 9.65 |
| Total investment return (b) | (2.50)% | | 3.01% | | (6.41)% | | 10.28% | | (1.32)% |
| Ratios (to average net assets)/Supplemental Data: | | | | | | | | | |
| Net investment income (loss) | 3.38%†† | | 2.75% | | 1.51% | | 1.72% | | 1.60%†† |
| Net expenses | 0.50%†† | | 0.50% | | 0.50% | | 0.50% | | 0.50%†† |
| Expenses (before waiver/reimbursement) | 0.51%†† | | 0.55% | | 0.70% | | 0.77% | | 0.86%†† |
| Portfolio turnover rate (c) | 12% | | 81% | | 32% | | 66% | | 108% |
| Net assets at end of period (in 000's) | $ 26 | | $ 26 | | $ 25 | | $ 27 | | $ 25 |
| # | The Fund changed its fiscal year end from April 30 to October 31. |
| ^ | Inception date. |
| †† | Annualized. |
| (a) | Per share data based on average shares outstanding during the period. |
| (b) | Total investment return is calculated exclusive of sales charges and assumes the reinvestment of dividends and distributions. Class R6 shares are not subject to sales charges. For periods of less than one year, total return is not annualized. |
| (c) | The portfolio turnover rate includes variable rate demand notes. |
The notes to the financial statements are an integral part of, and should be read in conjunction with, the financial statements.
39
Notes to Financial Statements
Note 1-Organization and Business
MainStay Funds Trust (the “Trust”) was organized as a Delaware statutory trust on April 28, 2009. The Trust is registered under the Investment Company Act of 1940, as amended (the “1940 Act”), as an open-end management investment company, and is comprised of thirty-seven funds (collectively referred to as the “Funds”). These financial statements and notes relate to the MainStay MacKay Strategic Municipal Allocation Fund (the "Fund"), a “diversified” fund, as that term is defined in the 1940 Act, as interpreted or modified by regulatory authorities having jurisdiction, from time to time.
The following table lists the Fund's share classes that have been registered and commenced operations:
| Class | Commenced Operations |
| Class A | June 28, 2019 |
| Investor Class | June 28, 2019 |
| Class C | June 28, 2019 |
| Class C2 | December 13, 2022 |
| Class I | June 28, 2019 |
| Class R6 | June 28, 2019 |
Class A and Investor Class shares are offered at net asset value (“NAV”) per share plus an initial sales charge. No initial sales charge applies to investments of $250,000 or more (and certain other qualified purchases) in Class A and Investor Class shares. A contingent deferred sales charge (“CDSC”) of 1.00% may be imposed on certain redemptions of Class A and Investor Class shares made within 18 months of the date of purchase on shares that were purchased without an initial sales charge. Class C and Class C2 shares are offered at NAV without an initial sales charge, although a 1.00% CDSC may be imposed on certain redemptions of such shares made within one year of the date of purchase of Class C and Class C2 shares. Class I and Class R6 shares are offered at NAV without a sales charge. In addition, depending upon eligibility, Class C and Class C2 shares convert to either Class A or Investor Class shares at the end of the calendar quarter eight years after the date they were purchased. Additionally, Investor Class shares may convert automatically to Class A shares based on a shareholder’s account balance as described in the Fund’s prospectus. Under certain circumstances and as may be permitted by the Trust’s multiple class plan pursuant to Rule 18f-3 under the 1940 Act, specified share classes of the Fund may be converted to one or more other share classes of the Fund as disclosed in the capital share transactions within these Notes. The classes of shares have the same voting (except for issues that relate solely to one class), dividend, liquidation and other rights, and the same terms and conditions, except that under distribution plans pursuant to Rule 12b-1 under the 1940 Act, Class C and Class C2 shares are subject to higher distribution and/or service fees than Class A and Investor Class shares. Class I and Class R6 shares are not subject to a distribution and/or service fee.
The Fund's investment objective is to seek current income exempt from regular federal income tax.
Effective at the close of business on May 1, 2023, the Fund changed its fiscal and tax year end from April 30 to October 31.
Note 2–Significant Accounting Policies
The Fund is an investment company and accordingly follows the investment company accounting and reporting guidance of the Financial Accounting Standards Board (“FASB”) Accounting Standards Codification Topic 946 Financial Services—Investment Companies. The Fund prepares its financial statements in accordance with generally accepted accounting principles (“GAAP”) in the United States of America and follows the significant accounting policies described below.
(A) Securities Valuation. Investments are usually valued as of the close of regular trading on the New York Stock Exchange (the "Exchange") (usually 4:00 p.m. Eastern time) on each day the Fund is open for business ("valuation date").
Pursuant to Rule 2a-5 under the 1940 Act, the Board of Trustees of the Trust (the "Board") has designated New York Life Investment Management LLC (“New York Life Investments” or the "Manager") as its Valuation Designee (the "Valuation Designee"). The Valuation Designee is responsible for performing fair valuations relating to all investments in the Fund’s portfolio for which market quotations are not readily available; periodically assessing and managing material valuation risks; establishing and applying fair value methodologies; testing fair valuation methodologies; evaluating and overseeing pricing services; ensuring appropriate segregation of valuation and portfolio management functions; providing quarterly, annual and prompt reporting to the Board, as appropriate; identifying potential conflicts of interest; and maintaining appropriate records. The Valuation Designee has established a valuation committee ("Valuation Committee") to assist in carrying out the Valuation Designee’s responsibilities and establish prices of securities for which market quotations are not readily available. The Fund's and the Valuation Designee's policies and procedures ("Valuation Procedures") govern the Valuation Designee’s selection and application of methodologies for determining and calculating the fair value of Fund investments. The Valuation Designee may value the Fund's portfolio securities for which market quotations are not readily available and other Fund assets utilizing inputs from pricing services and other third-party sources. The Valuation Committee meets (in person, via electronic mail or via teleconference) on an ad-hoc basis to determine fair valuations and on a quarterly basis to review fair value events with respect to certain securities for which market quotations are not readily available, including valuation risks and back-testing results, and preview reports to the Board.
The Valuation Committee establishes prices of securities for which market quotations are not readily available based on such methodologies and measurements on a regular basis after considering information that is reasonably available and deemed relevant by the Valuation Committee. The Board shall oversee the Valuation Designee and review fair valuation materials on a prompt, quarterly and annual basis and approve proposed revisions to the Valuation Procedures.
| 40 | MainStay MacKay Strategic Municipal Allocation Fund |
Investments for which market quotations are not readily available are valued at fair value as determined in good faith pursuant to the Valuation Procedures. A market quotation is readily available only when that quotation is a quoted price (unadjusted) in active markets for identical investments that the Fund can access at the measurement date, provided that a quotation will not be readily available if it is not reliable. "Fair value" is defined as the price the Fund would reasonably expect to receive upon selling an asset or liability in an orderly transaction to an independent buyer in the principal or most advantageous market for the asset or liability. Fair value measurements are determined within a framework that establishes a three-tier hierarchy that maximizes the use of observable market data and minimizes the use of unobservable inputs to establish a classification of fair value measurements for disclosure purposes. "Inputs" refer broadly to the assumptions that market participants would use in pricing the asset or liability, including assumptions about risk, such as the risk inherent in a particular valuation technique used to measure fair value using a pricing model and/or the risk inherent in the inputs for the valuation technique. Inputs may be observable or unobservable. Observable inputs reflect the assumptions market participants would use in pricing the asset or liability based on market data obtained from sources independent of the Fund. Unobservable inputs reflect the Fund’s own assumptions about the assumptions market participants would use in pricing the asset or liability based on the information available. The inputs or methodology used for valuing assets or liabilities may not be an indication of the risks associated with investing in those assets or liabilities. The three-tier hierarchy of inputs is summarized below.
| • | Level 1—quoted prices (unadjusted) in active markets for an identical asset or liability |
| • | Level 2—other significant observable inputs (including quoted prices for a similar asset or liability in active markets, interest rates and yield curves, prepayment speeds, credit risk, etc.) |
| • | Level 3—significant unobservable inputs (including the Fund's own assumptions about the assumptions that market participants would use in measuring fair value of an asset or liability) |
The level of an asset or liability within the fair value hierarchy is based on the lowest level of an input, both individually and in the aggregate, that is significant to the fair value measurement. The aggregate value by input level of the Fund’s assets and liabilities as of October 31, 2023, is included at the end of the Portfolio of Investments.
The Fund may use third-party vendor evaluations, whose prices may be derived from one or more of the following standard inputs, among others:
| • Benchmark yields | • Reported trades |
| • Broker/dealer quotes | • Issuer spreads |
| • Two-sided markets | • Benchmark securities |
| • Bids/offers | • Reference data (corporate actions or material event notices) |
| • Industry and economic events | • Comparable bonds |
| • Monthly payment information | |
An asset or liability for which a market quotation is not readily available is valued by methods deemed reasonable in good faith by the Valuation Committee, following the Valuation Procedures to represent fair value. Under these procedures, the Valuation Designee generally uses a market-based approach which may use related or comparable assets or liabilities, recent transactions, market multiples, book values and other relevant information. The Valuation Designee may also use an income-based valuation approach in which the anticipated future cash flows of the asset or liability are discounted to calculate fair value. Discounts may also be applied due to the nature and/or duration of any restrictions on the disposition of the asset or liability. Fair value represents a good faith approximation of the value of a security. Fair value determinations involve the consideration of a number of subjective factors, an analysis of applicable facts and circumstances and the exercise of judgment. As a result, it is possible that the fair value for a security determined in good faith in accordance with the Valuation Procedures may differ from valuations for the same security determined for other funds using their own valuation procedures. Although the Valuation Procedures are designed to value a security at the price the Fund may reasonably expect to receive upon the security's sale in an orderly transaction, there can be no assurance that any fair value determination thereunder would, in fact, approximate the amount that the Fund would actually realize upon the sale of the security or the price at which the security would trade if a reliable market price were readily available. During the period May 1, 2023 through October 31, 2023, there were no material changes to the fair value methodologies.
Securities which may be valued in this manner include, but are not limited to: (i) a security for which trading has been halted or suspended or otherwise does not have a readily available market quotation on a given day; (ii) a debt security that has recently gone into default and for which there is not a current market quotation; (iii) a security of an issuer that has entered into a restructuring; (iv) a security that has been delisted from a national exchange; (v) a security subject to trading collars for which no or limited trading takes place; and (vi) a security whose principal market has been temporarily closed at a time when, under normal conditions, it would be open. Securities valued in this manner are generally categorized as Level 2 or 3 in the hierarchy. No securities held by the Fund as of October 31, 2023, were fair valued in such a manner.
Futures contracts are valued at the last posted settlement price on the market where such futures are primarily traded. These securities are generally categorized as Level 1 in the hierarchy.
Municipal debt securities are valued at the evaluated mean prices supplied by a pricing agent or broker selected by the Valuation Designee, in consultation with the Subadvisor. The evaluations are market-based measurements processed through a pricing application and represents the pricing agent's good faith determination as to what a holder may receive in an orderly transaction under market conditions. The rules-based logic utilizes valuation techniques that reflect participants' assumptions and vary by asset class and per methodology, maximizing the use of relevant observable data including quoted prices for similar assets, benchmark yield curves and market corroborated inputs. The
Notes to Financial Statements (continued)
evaluated bid or mean prices are deemed by the Valuation Designee, in consultation with the Subadvisor, to be representative of market values, at the regular close of trading of the Exchange on each valuation date. Municipal debt securities purchased on a delayed delivery basis are marked to market daily until settlement at the forward settlement date. Municipal debt securities are generally categorized as Level 2 in the hierarchy.
The information above is not intended to reflect an exhaustive list of the methodologies that may be used to value portfolio investments. The Valuation Procedures permit the use of a variety of valuation methodologies in connection with valuing portfolio investments. The methodology used for a specific type of investment may vary based on the market data available or other considerations. The methodologies summarized above may not represent the specific means by which portfolio investments are valued on any particular business day.
(B) Income Taxes. The Fund's policy is to comply with the requirements of the Internal Revenue Code of 1986, as amended (the “Internal Revenue Code”), applicable to regulated investment companies and to distribute all of its taxable income to the shareholders of the Fund within the allowable time limits.
The Manager evaluates the Fund’s tax positions to determine if the tax positions taken meet the minimum recognition threshold in connection with accounting for uncertainties in income tax positions taken or expected to be taken for the purposes of measuring and recognizing tax liabilities in the financial statements. Recognition of tax benefits of an uncertain tax position is permitted only to the extent the position is “more likely than not” to be sustained assuming examination by taxing authorities. The Manager analyzed the Fund's tax positions taken on federal, state and local income tax returns for all open tax years (for up to three tax years) and has concluded that no provisions for federal, state and local income tax are required in the Fund's financial statements. The Fund's federal, state and local income tax and federal excise tax returns for tax years for which the applicable statutes of limitations have not expired are subject to examination by the Internal Revenue Service and state and local departments of revenue.
(C) Dividends and Distributions to Shareholders. Dividends and distributions are recorded on the ex-dividend date. The Fund intends to declare dividends from net investment income, if any, daily and intends to pay them at least monthly and declares and pays distributions from net realized capital gains, if any, at least annually. Unless a shareholder elects otherwise, all dividends and distributions are reinvested at NAV in the same class of shares of the Fund. Dividends and distributions to shareholders are determined in accordance with federal income tax regulations and may differ from determinations using GAAP.
(D) Security Transactions and Investment Income. The Fund records security transactions on the trade date. Realized gains and losses on security transactions are determined using the identified cost method. Interest income is accrued as earned using the effective interest rate method. Discounts and premiums on securities purchased, other than
temporary cash investments that mature in 60 days or less at the time of purchase, for the Fund are accreted and amortized, respectively, on the effective interest rate method.
Investment income and realized and unrealized gains and losses on investments of the Fund are allocated pro rata to the separate classes of shares based upon their relative net assets on the date the income is earned or realized and unrealized gains and losses are incurred.
The Fund may place a debt security on non-accrual status and reduce related interest income by ceasing current accruals and writing off all or a portion of any interest receivables when the collection of all or a portion of such interest has become doubtful. A debt security is removed from non-accrual status when the issuer resumes interest payments or when collectability of interest is reasonably assured.
(E) Expenses. Expenses of the Trust are allocated to the individual Funds in proportion to the net assets of the respective Funds when the expenses are incurred, except where direct allocations of expenses can be made. Expenses (other than transfer agent expenses and fees incurred under the shareholder services plans and/or the distribution plans further discussed in Note 3(B)) are allocated to separate classes of shares pro rata based upon their relative net assets on the date the expenses are incurred. The expenses borne by the Fund, including those of related parties to the Fund, are shown in the Statement of Operations.
(F) Use of Estimates. In preparing financial statements in conformity with GAAP, the Manager makes estimates and assumptions that affect the reported amounts and disclosures in the financial statements. Actual results could differ from those estimates and assumptions.
(G) Futures Contracts. A futures contract is an agreement to purchase or sell a specified quantity of an underlying instrument at a specified future date and price, or to make or receive a cash payment based on the value of a financial instrument (e.g., foreign currency, interest rate, security or securities index). The Fund is subject to risks such as market price risk, leverage risk, liquidity risk, counterparty risk, operational risk, legal risk and/or interest rate risk in the normal course of investing in these contracts. Upon entering into a futures contract, the Fund is required to pledge to the broker or futures commission merchant an amount of cash and/or U.S. government securities equal to a certain percentage of the collateral amount, known as the “initial margin.” During the period the futures contract is open, changes in the value of the contract are recognized as unrealized appreciation or depreciation by marking to market such contract on a daily basis to reflect the market value of the contract at the end of each day’s trading. The Fund agrees to receive from or pay to the broker or futures commission merchant an amount of cash equal to the daily fluctuation in the value of the contract. Such receipts or payments are known as “variation margin.” When the futures contract is closed, the Fund records a realized gain or loss equal to the difference between the proceeds from (or cost of) the closing transaction and the Fund's basis in the contract.
The use of futures contracts involves, to varying degrees, elements of market risk in excess of the amount recognized in the Statement of
| 42 | MainStay MacKay Strategic Municipal Allocation Fund |
Assets and Liabilities. The contract or notional amounts and variation margin reflect the extent of the Fund's involvement in open futures positions. There are several risks associated with the use of futures contracts as hedging techniques. There can be no assurance that a liquid market will exist at the time when the Fund seeks to close out a futures contract. If no liquid market exists, the Fund would remain obligated to meet margin requirements until the position is closed. Futures contracts may involve a small initial investment relative to the risk assumed, which could result in losses greater than if the Fund did not invest in futures contracts. Futures contracts may be more volatile than direct investments in the instrument underlying the futures and may not correlate to the underlying instrument, causing a given hedge not to achieve its objectives. The Fund's activities in futures contracts have minimal counterparty risk as they are conducted through regulated exchanges that guarantee the futures against default by the counterparty. In the event of a bankruptcy or insolvency of a futures commission merchant that holds margin on behalf of the Fund, the Fund may not be entitled to the return of the entire margin owed to the Fund, potentially resulting in a loss. The Fund may invest in futures contracts to seek enhanced returns or to reduce the risk of loss by hedging certain of its holdings. The Fund's investment in futures contracts and other derivatives may increase the volatility of the Fund's NAVs and may result in a loss to the Fund. Open futures contracts as of October 31, 2023, are shown in the Portfolio of Investments.
(H) Delayed Delivery Transactions. The Fund may purchase or sell securities on a delayed delivery basis. These transactions involve a commitment by the Fund to purchase or sell securities for a predetermined price or yield, with payment and delivery taking place beyond the customary settlement period. When delayed delivery purchases are outstanding, the Fund will designate liquid assets in an amount sufficient to meet the purchase price. When purchasing a security on a delayed delivery basis, the Fund assumes the rights and risks of ownership of the security, including the risk of price and yield fluctuations, and takes such fluctuations into account when determining its NAV. The Fund may dispose of or renegotiate a delayed delivery transaction after it is entered into, and may sell delayed delivery securities before they are delivered, which may result in a realized gain or loss. When the Fund has sold a security it owns on a delayed delivery basis, the Fund does not participate in future gains and losses with respect to the security. Delayed delivery transactions as of October 31, 2023, are shown in the Portfolio of Investments.
(I) Municipal Bond Risk. The Fund may invest more heavily in municipal bonds from certain cities, states, territories or regions than others, which may increase the Fund’s exposure to losses resulting from economic, political, regulatory occurrences, or declines in tax revenue impacting these particular cities, states, territories or regions. In addition, many state and municipal governments that issue securities are under significant economic and financial stress and may not be able to satisfy their obligations, and these events may be made worse due to economic challenges posed by COVID-19. The Fund may invest a substantial amount of its assets in municipal bonds whose interest is paid solely from
revenues of similar projects, such as tobacco settlement bonds. If the Fund concentrates its investments in this manner, it assumes the legal and economic risks relating to such projects and this may have a significant impact on the Fund’s investment performance.
Certain of the issuers in which the Fund may invest have recently experienced, or may experience, significant financial difficulties and repeated credit rating downgrades. On May 3, 2017, the Commonwealth of Puerto Rico (the "Commonwealth") began proceedings pursuant to the Puerto Rico Oversight, Management, and Economic Stability Act (“PROMESA”) to seek bankruptcy-type protections from approximately $74 billion in debt and approximately $48 billion in unfunded pension obligations. In addition, the current economic environment and the resulting pressure on Puerto Rico’s budget have further contributed to its financial challenges. Following the outbreak of COVID-19, the federal government passed certain relief packages, including the Coronavirus Aid, Relief, and Economic Security Act and the American Rescue Plan, which included an aggregate of more than $7 billion in disaster relief funds for the U.S. territories, including Puerto Rico. However, there can be no assurances that the federal funds allocated to the Commonwealth will be sufficient to address the long-term economic challenges that arose from COVID-19.
As of October 31, 2023 PREPA has remained in Title III Bankruptcy for over 6 years. A significant number of net revenue bond creditors, the Oversight Board, and the Commonwealth have been unable to reach a consensual resolution on PREPA’s debt restructuring following the termination of the previous 2019 PREPA Restructuring Support Agreement by the Commonwealth of Puerto Rico in March of 2022. On December 16, 2022, the Oversight Board filed a proposed plan of adjustment to restructure more than $10 billion of debt and other claims against PREPA. The plan of adjustment, amended in March, proposed to cut PREPA’s unsustainable debt to approximately $5.68 billion.
Bankruptcy litigation has ensued between the Oversight Board and a group of net revenue bond creditors over the security provisions of PREPA’s $8.3 billion of net revenue bonds resulting in a ruling in March that PREPA’s net revenue bonds are unsecured.
In June of 2023, a claims estimation hearing resulted in a ruling that PREPA’s now asserted unsecured net revenue bond claim was valued at approximately 2.383 billion, which is only 28.3% of the full pre-petition claim asserted by net revenue bond holders. Due to the lower claims estimation ruling, at the end of August 2023 the Oversight Board filed a new proposed plan of adjustment to reflect the March lien ruling and June estimation hearing with lower recovery amounts afforded to net revenue bond holders. In conjunction with the new proposed plan of adjustment, a subset of the original litigating PREPA creditors entered into Planned Support Agreements (”PSAs”) supporting the new proposed plan of adjustment.
However, following the new proposed plan of adjustment, a significant amount of creditors not previously involved in the PREPA bankruptcy have objected to the revised plan of adjustment, including the MainStay MacKay Municipal Bond Funds.
Notes to Financial Statements (continued)
Objecting creditors are appealing several rulings, including the March net revenue bond lien ruling, the June net revenue bond claims estimation ruling, and the November disclosure statement approval ruling that provides for a plan with disparate recoveries for the same creditors. Objecting creditors believe the PREPA bankruptcy plan of adjustment is un-confirmable and these rulings will be overturned on appeal, but there is no certainty that objecting creditors will be successful in appealing these rulings, or if overturned, these creditors will receive the relief sought. The proposed PREPA August plan of adjustment provides 3.5% of cash recovery for objecting creditors to the plan as opposed to 12.5% of cash recovery for consenting creditors who have not previously settled. Bankruptcy plan confirmation hearings are currently scheduled to begin in March of 2024.
The Fund’s vulnerability to potential losses associated with such developments may be reduced through investing in municipal securities that feature credit enhancements (such as bond insurance). The bond insurance provider pays both principal and interest when due to the bond holder. The magnitude of Puerto Rico’s debt restructuring or other adverse economic developments could pose significant strains on the ability of municipal securities insurers to meet all future claims. As of October 31, 2023, the Fund's total Puerto Rico investments is 1.7% of total investments, with none of that amount insured.
(J) Indemnifications. Under the Trust’s organizational documents, its officers and trustees are indemnified against certain liabilities that may arise out of performance of their duties to the Trust. Additionally, in the normal course of business, the Fund enters into contracts with third-party service providers that contain a variety of representations and warranties and that may provide general indemnifications. The Fund's maximum exposure under these arrangements is unknown, as this would involve future claims that may be made against the Fund that have not yet occurred. The Manager believes that the risk of loss in connection with these potential indemnification obligations is remote. However, there can be no assurance that material liabilities related to such obligations will not arise in the future, which could adversely impact the Fund.
(K) Quantitative Disclosure of Derivative Holdings. The following tables show additional disclosures related to the Fund's derivative and hedging activities, including how such activities are accounted for and their effect on the Fund's financial positions, performance and cash flows.
The Fund entered into futures contracts to manage its exposure to the securities markets or to movements in interest rates and currency values.
Fair value of derivative instruments as of October 31, 2023:
| Asset Derivatives | Interest
Rate
Contracts
Risk | Total |
| Futures Contracts - Net Assets—Net unrealized appreciation on futures contracts (a) | $559,324 | $559,324 |
| Total Fair Value | $559,324 | $559,324 |
| (a) | Includes cumulative appreciation (depreciation) of futures contracts as reported in the Portfolio of Investments. Only current day’s variation margin is reported within the Statement of Assets and Liabilities. |
The effect of derivative instruments on the Statement of Operations for the period May 1, 2023 to October 31, 2023:
| Net Realized Gain (Loss) from: | Interest
Rate
Contracts
Risk | Total |
| Futures Transactions | $334,129 | $334,129 |
| Total Net Realized Gain (Loss) | $334,129 | $334,129 |
| Net Change in Unrealized Appreciation (Depreciation) | Interest
Rate
Contracts
Risk | Total |
| Futures Contracts | $1,860,460 | $1,860,460 |
| Total Net Change in Unrealized Appreciation (Depreciation) | $1,860,460 | $1,860,460 |
| Average Notional Amount | Total |
| Futures Contracts Short | $(18,348,646) |
Note 3–Fees and Related Party Transactions
(A) Manager and Subadvisor. New York Life Investments, a registered investment adviser and an indirect, wholly-owned subsidiary of New York Life Insurance Company ("New York Life"), serves as the Fund's Manager, pursuant to an Amended and Restated Management Agreement ("Management Agreement"). The Manager provides offices, conducts clerical, recordkeeping and bookkeeping services and keeps most of the financial and accounting records required to be maintained by the Fund. Except for the portion of salaries and expenses that are the responsibility of the Fund, the Manager pays the salaries and expenses of all personnel affiliated with the Fund and certain operational expenses of the Fund. The Fund reimburses New York Life Investments in an amount equal to the portion of the compensation of the Chief Compliance Officer attributable to the Fund. MacKay Shields LLC ("MacKay Shields" or the "Subadvisor"), a registered investment adviser and an indirect, wholly-owned subsidiary of New York Life, serves as the Subadvisor to the Fund and is responsible for the day-to-day portfolio management of the Fund. Pursuant to the terms of an Amended and Restated Subadvisory Agreement
| 44 | MainStay MacKay Strategic Municipal Allocation Fund |
("Subadvisory Agreement") between New York Life Investments and MacKay Shields, New York Life Investments pays for the services of the Subadvisor.
Pursuant to the Management Agreement, the Fund pays the Manager a monthly fee for the services performed and the facilities furnished at an annual rate of 0.40% of the Fund's average daily net assets.
New York Life Investments has contractually agreed to waive fees and/or reimburse expenses so that Total Annual Fund Operating Expenses (excluding taxes, interest, litigation, extraordinary expenses, brokerage and other transaction expenses relating to the purchase or sale of portfolio investments and acquired (underlying) fund fees and expenses) do not exceed the following percentages of daily net assets: Class A, 0.77% and Class R6, 0.50%. New York Life Investments will apply an equivalent waiver or reimbursement, in an equal number of basis points of the Class A shares waiver/reimbursement to Investor Class, Class C, Class C2 and Class I shares. This agreement will remain in effect until August 31, 2024, and shall renew automatically for one-year terms unless New York Life Investments provides written notice of termination prior to the start of the next term or upon approval of the Board.
During the period May 1, 2023 through October 31, 2023, New York Life Investments earned fees from the Fund in the amount of $857,073 and waived fees and/or reimbursed expenses in the amount of $87,021 and paid the Subadvisor fees in the amount of $385,026.
JPMorgan Chase Bank, N.A. ("JPMorgan") provides sub-administration and sub-accounting services to the Fund pursuant to an agreement with New York Life Investments. These services include calculating the daily NAVs of the Fund, maintaining the general ledger and sub-ledger accounts for the calculation of the Fund's NAVs, and assisting New York Life Investments in conducting various aspects of the Fund's administrative operations. For providing these services to the Fund, JPMorgan is compensated by New York Life Investments.
Pursuant to an agreement between the Trust and New York Life Investments, New York Life Investments is responsible for providing or procuring certain regulatory reporting services for the Fund. The Fund will reimburse New York Life Investments for the actual costs incurred by New York Life Investments in connection with providing or procuring these services for the Fund.
(B) Distribution and Service Fees. The Trust, on behalf of the Fund, has entered into a distribution agreement with NYLIFE Distributors LLC (the “Distributor”), an affiliate of New York Life Investments. The Fund has adopted distribution plans (the “Plans”) in accordance with the provisions of Rule 12b-1 under the 1940 Act.
Pursuant to the Class A and Investor Class Plans, the Distributor receives a monthly fee from the Class A and Investor Class shares at an annual rate of 0.25% of the average daily net assets of the Class A and Investor Class shares for distribution and/or service activities as designated by the Distributor. Pursuant to the Class C Plan, Class C shares pay the Distributor a monthly distribution fee at an annual rate of 0.25% of the
average daily net assets of the Class C shares, along with a service fee at an annual rate of 0.25% of the average daily net assets of the Class C shares, for a total 12b-1 fee of 0.50%. Pursuant to the Class C2 Plan, Class C2 shares pay the Distributor a monthly distribution fee at an annual rate of 0.40% of the average daily net assets of the Class C2 shares, along with a service fee at an annual rate of 0.25% of the average daily net assets of the Class C2 shares, for a total 12b-1 fee of 0.65%. Class I and Class R6 shares are not subject to a distribution and/or service fee.
The Plans provide that the distribution and service fees are payable to the Distributor regardless of the amounts actually expended by the Distributor for distribution of the Fund's shares and service activities.
(C) Sales Charges. The Fund was advised by the Distributor that the amount of initial sales charges retained on sales of Class A and Investor Class shares during the period May 1, 2023 through October 31, 2023, were $1,748 and $8, respectively.
The Fund was also advised that the Distributor retained CDSCs on redemptions of Class A and Class C shares during the period May 1, 2023 through October 31, 2023, of $1,444 and $1,371, respectively.
(D) Transfer, Dividend Disbursing and Shareholder Servicing Agent. NYLIM Service Company LLC, an affiliate of New York Life Investments, is the Fund's transfer, dividend disbursing and shareholder servicing agent pursuant to an agreement between NYLIM Service Company LLC and the Trust. NYLIM Service Company LLC has entered into an agreement with SS&C Global Investor & Distribution Solutions, Inc. ("SS&C"), pursuant to which SS&C performs certain transfer agent services on behalf of NYLIM Service Company LLC. New York Life Investments has contractually agreed to limit the transfer agency expenses charged to the Fund’s share classes to a maximum of 0.35% of that share class’s average daily net assets on an annual basis after deducting any applicable Fund or class-level expense reimbursement or small account fees. This agreement will remain in effect until August 31, 2024, and shall renew automatically for one-year terms unless New York Life Investments provides written notice of termination prior to the start of the next term or upon approval of the Board. During the period May 1, 2023 through October 31, 2023, transfer agent expenses incurred by the Fund and any reimbursements, pursuant to the aforementioned Transfer Agency expense limitation agreement, were as follows:
| Class | Expense | Waived |
| Class A | $ 13,504 | $— |
| Investor Class | 46 | — |
| Class C | 3,272 | — |
| Class C2 | 197 | — |
| Class I | 102,084 | — |
(E) Small Account Fee. Shareholders with small accounts adversely impact the cost of providing transfer agency services. In an effort to reduce total transfer agency expenses, the Fund has implemented a small account fee on certain types of accounts. As described in the Fund's
Notes to Financial Statements (continued)
prospectus, certain shareholders with an account balance of less than $1,000 ($5,000 for Class A share accounts) are charged an annual per account fee of $20 (assessed semi-annually), the proceeds from which offset transfer agent fees as reflected in the Statement of Operations. This small account fee will not apply to certain types of accounts as described further in the Fund’s prospectus.
(F) Capital. As of October 31, 2023, New York Life and its affiliates beneficially held shares of the Fund with the values and percentages of net assets as follows:
| Class A | $25,262 | 0.0%‡ |
| Investor Class | 25,061 | 52.4 |
| Class C | 24,765 | 0.5 |
| Class C2 | 24,526 | 8.2 |
| Class R6 | 25,490 | 99.7 |
| ‡ | Less than one-tenth of a percent. |
Note 4-Federal Income Tax
As of October 31, 2023, the cost and unrealized appreciation (depreciation) of the Fund’s investment portfolio, including applicable derivative contracts and other financial instruments, as determined on a federal income tax basis, were as follows:
| | Federal Tax
Cost | Gross
Unrealized
Appreciation | Gross
Unrealized
(Depreciation) | Net
Unrealized
Appreciation/
(Depreciation) |
| Investments in Securities | $539,014,340 | $602,164 | $(18,331,172) | $(17,729,008) |
As of October 31, 2023, the components of accumulated gain (loss) on a tax basis were as follows:
Ordinary
Income | Undistributed
Tax Exempt
Income | Accumulated
Capital
and Other
Gain (Loss) | Other
Temporary
Differences | Unrealized
Appreciation
(Depreciation) | Total
Accumulated
Gain (Loss) |
| $— | $149,864 | $(6,693,429) | $(132,810) | $(17,729,008) | $(24,405,383) |
The difference between book-basis and tax-basis unrealized appreciation (depreciation) is primarily due to mark to market of futures contracts and premium tax amortization.
As of October 31, 2023, for federal income tax purposes, capital loss carryforwards of $6,693,429, as shown in the table below, were available to the extent provided by the regulations to offset future realized gains of the Fund. Accordingly, no capital gains distributions are expected to be
paid to shareholders until net gains have been realized in excess of such amounts.
Capital Loss
Available Through | Short-Term
Capital Loss
Amounts (000’s) | Long-Term
Capital Loss
Amounts (000’s) |
| Unlimited | $4,401 | $2,293 |
The Fund utilized $1,482,028 of capital loss carryforwards during the year ended October 31, 2023.
During the period from May 1, 2023 through October 31, 2023 and the years ended April 30, 2023 and April 30, 2022, the tax character of distributions paid as reflected in the Statements of Changes in Net Assets was as follows:
| | 2023 (a) | 2023 | 2022 |
| Distributions paid from: | | | |
| Ordinary Income | $ 346,234 | $ 288,952 | $ 17,770 |
| Long-Term Capital Gains | — | 365,818 | 594,960 |
| Exempt Interest Dividends | 7,540,383 | 6,494,151 | 1,315,760 |
| Total | $7,886,617 | $7,148,921 | $1,928,490 |
| (a) | The Fund changed its fiscal year end from April 30 to October 31. |
Note 5–Custodian
JPMorgan is the custodian of cash and securities held by the Fund. Custodial fees are charged to the Fund based on the Fund's net assets and/or the market value of securities held by the Fund and the number of certain transactions incurred by the Fund.
Note 6–Line of Credit
The Fund and certain other funds managed by New York Life Investments maintain a line of credit with a syndicate of banks in order to secure a source of funds for temporary purposes to meet unanticipated or excessive redemption requests.
Effective July 25, 2023, under the credit agreement (the “Credit Agreement”), the aggregate commitment amount is $600,000,000 with an additional uncommitted amount of $100,000,000. The commitment fee is an annual rate of 0.15% of the average commitment amount payable quarterly, regardless of usage, to JPMorgan, who serves as the agent to the syndicate. The commitment fee is allocated among the Fund and certain other funds managed by New York Life Investments based upon their respective net assets and other factors. Interest on any revolving credit loan is charged based upon the Federal Funds Rate, Daily Simple Secured Overnight Financing Rate ("SOFR") + 0.10%, or the Overnight Bank Funding Rate, whichever is higher. The Credit Agreement expires on July 23, 2024, although the Fund, certain other funds managed by New York Life Investments and the syndicate of banks may renew the Credit Agreement for an additional year on the same or different terms or enter into a credit agreement with a different syndicate of banks. Prior to July 25, 2023, the aggregate commitment amount and the commitment fee were the same as those under the current Credit
| 46 | MainStay MacKay Strategic Municipal Allocation Fund |
Agreement. During the period May 1, 2023 through October 31, 2023, there were no borrowings made or outstanding with respect to the Fund under the Credit Agreement.
Note 7–Interfund Lending Program
Pursuant to an exemptive order issued by the SEC, the Fund, along with certain other funds managed by New York Life Investments, may participate in an interfund lending program. The interfund lending program provides an alternative credit facility that permits the Fund and certain other funds managed by New York Life Investments to lend or borrow money for temporary purposes directly to or from one another, subject to the conditions of the exemptive order. During the period May 1, 2023 through October 31, 2023, there were no interfund loans made or outstanding with respect to the Fund.
Note 8–Purchases and Sales of Securities (in 000’s)
During the period May 1, 2023 through October 31, 2023, purchases and sales of securities, other than short-term securities, were $250,286 and $49,792, respectively.
Note 9–Capital Share Transactions
Transactions in capital shares for the period May 1, 2023 through October 31, 2023, and years ended April 30, 2023 and April 30, 2022, were as follows:
| Class A | Shares | Amount |
| Period ended October 31, 2023:(a) | | |
| Shares sold | 3,689,232 | $ 34,256,161 |
| Shares issued to shareholders in reinvestment of distributions | 91,415 | 850,727 |
| Shares redeemed | (1,386,764) | (12,997,772) |
| Net increase (decrease) | 2,393,883 | $ 22,109,116 |
| Year ended April 30, 2023: | | |
| Shares sold | 4,521,934 | $ 42,589,581 |
| Shares issued to shareholders in reinvestment of distributions | 66,760 | 629,178 |
| Shares redeemed | (595,824) | (5,610,827) |
| Net increase (decrease) in shares outstanding before conversion | 3,992,870 | 37,607,932 |
| Shares converted into Class A (See Note 1) | 17,915 | 166,839 |
| Net increase (decrease) | 4,010,785 | $ 37,774,771 |
| Year ended April 30, 2022: | | |
| Shares sold | 627,789 | $ 6,160,870 |
| Shares issued to shareholders in reinvestment of distributions | 3,108 | 31,706 |
| Shares redeemed | (123,551) | (1,239,097) |
| Net increase (decrease) in shares outstanding before conversion | 507,346 | 4,953,479 |
| Shares converted into Class A (See Note 1) | 1,148 | 11,409 |
| Net increase (decrease) | 508,494 | $ 4,964,888 |
| |
| Investor Class | Shares | Amount |
| Period ended October 31, 2023:(a) | | |
| Shares sold | 344 | $ 3,218 |
| Shares issued to shareholders in reinvestment of distributions | 87 | 807 |
| Shares redeemed | (5,663) | (53,311) |
| Net increase (decrease) | (5,232) | $ (49,286) |
| Year ended April 30, 2023: | | |
| Shares sold | 51,856 | $ 492,143 |
| Shares issued to shareholders in reinvestment of distributions | 345 | 3,235 |
| Shares redeemed | (28,623) | (267,552) |
| Net increase (decrease) in shares outstanding before conversion | 23,578 | 227,826 |
| Shares converted from Investor Class (See Note 1) | (17,939) | (166,839) |
| Net increase (decrease) | 5,639 | $ 60,987 |
| Year ended April 30, 2022: | | |
| Shares sold | 7,351 | $ 75,661 |
| Shares issued to shareholders in reinvestment of distributions | 128 | 1,306 |
| Shares redeemed | (5,527) | (54,397) |
| Net increase (decrease) in shares outstanding before conversion | 1,952 | 22,570 |
| Shares converted from Investor Class (See Note 1) | (269) | (2,812) |
| Net increase (decrease) | 1,683 | $ 19,758 |
| |
| Class C | Shares | Amount |
| Period ended October 31, 2023:(a) | | |
| Shares sold | 265,102 | $ 2,454,140 |
| Shares issued to shareholders in reinvestment of distributions | 6,802 | 63,153 |
| Shares redeemed | (59,165) | (548,284) |
| Net increase (decrease) | 212,739 | $ 1,969,009 |
| Year ended April 30, 2023: | | |
| Shares sold | 330,090 | $ 3,098,482 |
| Shares issued to shareholders in reinvestment of distributions | 5,401 | 50,790 |
| Shares redeemed | (46,116) | (431,464) |
| Net increase (decrease) | 289,375 | $ 2,717,808 |
| Year ended April 30, 2022: | | |
| Shares sold | 67,637 | $ 681,825 |
| Shares issued to shareholders in reinvestment of distributions | 577 | 5,875 |
| Shares redeemed | (19,293) | (192,733) |
| Net increase (decrease) in shares outstanding before conversion | 48,921 | 494,967 |
| Shares converted from Class C (See Note 1) | (882) | (8,597) |
| Net increase (decrease) | 48,039 | $ 486,370 |
| |
Notes to Financial Statements (continued)
| Class C2 | Shares | Amount |
| Period ended October 31, 2023:(a) | | |
| Shares sold | 10,564 | $ 97,131 |
| Shares issued to shareholders in reinvestment of distributions | 389 | 3,615 |
| Shares redeemed | (342) | (3,176) |
| Net increase (decrease) | 10,611 | $ 97,570 |
| Year ended April 30, 2023:(b) | | |
| Shares sold | 22,951 | $ 215,964 |
| Shares issued to shareholders in reinvestment of distributions | 160 | 1,515 |
| Shares redeemed | (454) | (4,320) |
| Net increase (decrease) | 22,657 | $ 213,159 |
| |
| Class I | Shares | Amount |
| Period ended October 31, 2023:(a) | | |
| Shares sold | 26,515,142 | $ 245,412,818 |
| Shares issued to shareholders in reinvestment of distributions | 728,403 | 6,768,053 |
| Shares redeemed | (6,555,020) | (60,774,930) |
| Net increase (decrease) | 20,688,525 | $ 191,405,941 |
| Year ended April 30, 2023: | | |
| Shares sold | 41,397,550 | $ 388,470,731 |
| Shares issued to shareholders in reinvestment of distributions | 686,149 | 6,451,262 |
| Shares redeemed | (18,977,575) | (177,675,361) |
| Net increase (decrease) | 23,106,124 | $ 217,246,632 |
| Year ended April 30, 2022: | | |
| Shares sold | 5,207,450 | $ 51,686,935 |
| Shares issued to shareholders in reinvestment of distributions | 184,680 | 1,888,329 |
| Shares redeemed | (1,552,936) | (15,321,564) |
| Net increase (decrease) | 3,839,194 | $ 38,253,700 |
| |
| Class R6 | Shares | Amount |
| Period ended October 31, 2023:(a) | | |
| Shares issued to shareholders in reinvestment of distributions | 54 | $ 495 |
| Net increase (decrease) | 54 | $ 495 |
| Year ended April 30, 2023: | | |
| Shares issued to shareholders in reinvestment of distributions | 89 | $ 842 |
| Net increase (decrease) | 89 | $ 842 |
| Year ended April 30, 2022: | | |
| Shares issued to shareholders in reinvestment of distributions | 75 | $ 768 |
| Net increase (decrease) | 75 | $ 768 |
| (a) | The Fund changed its fiscal year end from April 30 to October 31. |
| (b) | The inception of the class was December 13, 2022. |
Note 10–Other Matters
As of the date of this report, the Fund faces a heightened level of risk associated with current uncertainty, volatility and state of economies, financial markets, rising interest rates, and labor and health conditions around the world. Events such as war, acts of terrorism, recessions, rapid inflation, the imposition of international sanctions, earthquakes, hurricanes, epidemics and pandemics and other unforeseen natural or human disasters may have broad adverse social, political and economic effects on the global economy, which could negatively impact the value of the Fund's investments. Developments that disrupt global economies and financial markets may magnify factors that affect the Fund's performance.
Note 11–Subsequent Events
In connection with the preparation of the financial statements of the Fund as of and for the period May 1, 2023 through October 31, 2023, events and transactions subsequent to October 31, 2023, through the date the financial statements were issued, have been evaluated by the Manager for possible adjustment and/or disclosure. No subsequent events requiring financial statement adjustment or disclosure have been identified.
| 48 | MainStay MacKay Strategic Municipal Allocation Fund |
Report of Independent Registered Public Accounting Firm
To the Shareholders of the Fund and Board of Trustees
MainStay Funds Trust:
Opinion on the Financial Statements
We have audited the accompanying statement of assets and liabilities of MainStay MacKay Strategic Municipal Allocation Fund (the Fund), one of the funds constituting MainStay Funds Trust, including the portfolio of investments, as of October 31, 2023, the related statements of operations for the period May 1, 2023 through October 31, 2023 and the year ended April 30, 2023, the statements of changes in net assets for the period May 1, 2023 through October 31, 2023 and for each of the years in the two-year period ended April 30, 2023, and the related notes (collectively, the financial statements) and the financial highlights for the period May 1, 2023 through October 31, 2023 and for each of the years or periods in the five-year period ended April 30, 2023. In our opinion, the financial statements and financial highlights present fairly, in all material respects, the financial position of the Fund as of October 31, 2023, the results of its operations for the period May 1, 2023 through October 31, 2023 and for the year ended April 30, 2023, the changes in its net assets for the period May 1, 2023 through October 31, 2023 and for each of the years in the two-year period ended April 30, 2023, and the financial highlights for the period May 1, 2023 through October 31, 2023 and for each of the years or periods in the five-year period ended April 30, 2023, in conformity with U.S. generally accepted accounting principles.
Basis for Opinion
These financial statements and financial highlights are the responsibility of the Fund's management. Our responsibility is to express an opinion on these financial statements and financial highlights based on our audits. We are a public accounting firm registered with the Public Company Accounting Oversight Board (United States) (PCAOB) and are required to be independent with respect to the Fund in accordance with the U.S. federal securities laws and the applicable rules and regulations of the Securities and Exchange Commission and the PCAOB.
We conducted our audits in accordance with the standards of the PCAOB. Those standards require that we plan and perform the audit to obtain reasonable assurance about whether the financial statements and financial highlights are free of material misstatement, whether due to error or fraud. Our audits included performing procedures to assess the risks of material misstatement of the financial statements and financial highlights, whether due to error or fraud, and performing procedures that respond to those risks. Such procedures included examining, on a test basis, evidence regarding the amounts and disclosures in the financial statements and financial highlights. Such procedures also included confirmation of securities owned as of October 31, 2023, by correspondence with the custodian and brokers; when replies from brokers were not received, we performed other appropriate auditing procedures. Our audits also included evaluating the accounting principles used and significant estimates made by management, as well as evaluating the overall presentation of the financial statements and financial highlights. We believe that our audits provide a reasonable basis for our opinion.

We have served as the auditor of one or more New York Life Investment Management investment companies since 2003.
Philadelphia, Pennsylvania
December 22, 2023
Federal Income Tax Information
(Unaudited)
The Fund is required under the Internal Revenue Code to advise shareholders in a written statement as to the federal tax status of dividends paid by the Fund during such fiscal years.
For Federal individual income tax purposes, the Fund designated 95.6% of the ordinary income dividends paid during its fiscal year ended October 31, 2023 as attributable to interest income from Tax Exempt Municipal Bonds. Such dividends are currently exempt from Federal income taxes under Section 103(a) of the Internal Revenue Code.
In February 2024, shareholders will receive an IRS Form 1099-DIV or substitute Form 1099, which will show the federal tax status of the distributions received by shareholders in calendar year 2023. The amounts that will be reported on such 1099-DIV or substitute Form 1099 will be the amounts you are to use on your federal income tax return and will differ from the amounts which we must report for the Fund's fiscal year ended October 31, 2023.
Proxy Voting Policies and Procedures and Proxy Voting Record
The Fund is required to file with the SEC its proxy voting record for the 12-month period ending June 30 on Form N-PX. A description of the policies and procedures that are used to vote proxies relating to portfolio securities of the Fund is available free of charge upon request by calling 800-624-6782 or visiting the SEC’s website at www.sec.gov. The most recent Form N-PX or proxy voting record is available free of charge upon request by calling 800-624-6782; visiting newyorklifeinvestments.com; or visiting the SEC’s website at www.sec.gov.
Shareholder Reports and Quarterly Portfolio Disclosure
The Fund is required to file its complete schedule of portfolio holdings with the SEC 60 days after its first and third fiscal quarter on Form N-PORT. The Fund's holdings report is available free of charge upon request by calling New York Life Investments at 800-624-6782.
| 50 | MainStay MacKay Strategic Municipal Allocation Fund |
Board of Trustees and Officers (Unaudited)
The Trustees and officers of the Fund are listed below. The Board oversees the MainStay Group of Funds (which consists of MainStay Funds and MainStay Funds Trust), MainStay VP Funds Trust, MainStay MacKay DefinedTerm Municipal Opportunities Fund, MainStay CBRE Global Infrastructure Megatrends Term Fund, the Manager and the Subadvisors, and elects the officers of the Funds who are responsible for the day-to-day operations of the Fund. Information pertaining to the Trustees and officers is set forth below. Each Trustee serves until his or her successor is elected and qualified or until his or her resignation, death or
removal. Under the Board’s retirement policy, unless an exception is made, a Trustee must tender his or her resignation by the end of the calendar year during which he or she reaches the age of 75. Officers are elected annually by the Board. The business address of each Trustee and officer listed below is 51 Madison Avenue, New York, New York 10010. A majority of the Trustees are not “interested persons” (as defined by the 1940 Act and rules adopted by the SEC thereunder) of the Fund (“Independent Trustees”).
| | Name and
Year of Birth | Term of Office,
Position(s) Held and
Length of Service | Principal Occupation(s)
During Past Five Years | Number of
Portfolios in
Fund Complex
Overseen by
Trustee | Other Directorships
Held by Trustee |
| | | | | | |
| | Naïm Abou-Jaoudé*
1966 | MainStay Funds: Trustee
since 2023
MainStay Funds Trust:
Trustee since 2023 | Chief Executive Officer of New York Life Investment Management LLC (since 2023). Chief Executive Officer of Candriam (an affiliate of New York Life Investment Management LLC) (2007 to 2023). | 81 | MainStay VP Funds Trust:
Trustee since 2023 (31 portfolios);
MainStay MacKay DefinedTerm Municipal Opportunities Fund: Trustee
since 2023;
MainStay CBRE Global Infrastructure Megatrends Term Fund: Trustee
since 2023; and
New York Life Investment Management International (Chair) since 2015 |
| * | This Trustee is considered to be an “interested person” of the MainStay Group of Funds, MainStay VP Funds Trust, MainStay CBRE Global Infrastructure Megatrends Term Fund and MainStay MacKay DefinedTerm Municipal Opportunities Fund, within the meaning of the 1940 Act because of his affiliation with New York Life Investment Management LLC and Candriam, as described in detail above in the column entitled “Principal Occupation(s) During Past Five Years.” |
| | |
Board of Trustees and Officers (Unaudited) (continued)
| | Name and
Year of Birth | Term of Office,
Position(s) Held and
Length of Service | Principal Occupation(s)
During Past Five Years | Number of
Portfolios in
Fund Complex
Overseen by
Trustee | Other Directorships
Held by Trustee |
| | | | | | |
| | David H. Chow
1957 | MainStay Funds: Trustee since January 2016, Advisory Board Member (June 2015 to December 2015);MainStay Funds Trust:
Trustee since January 2016, Advisory Board Member (June 2015 to December 2015) | Founder and CEO, DanCourt Management, LLC (since 1999) | 81 | MainStay VP Funds Trust: Trustee since January 2016, Advisory Board Member (June 2015 to December 2015) (31 portfolios);
MainStay MacKay DefinedTerm Municipal Opportunities Fund: Trustee since January 2016, Advisory Board Member (June 2015 to December 2015);
MainStay CBRE Global Infrastructure Megatrends Term Fund: Trustee since 2021;
VanEck Vectors Group of Exchange-Traded Funds: Trustee since 2006 and Independent Chairman of the Board of Trustees from 2008 to 2022 (57 portfolios); and
Berea College of Kentucky: Trustee since 2009, Chair of the Investment Committee since 2018 |
| | Karen Hammond
1956 | MainStay Funds: Trustee since December 2021, Advisory Board Member (June 2021 to December 2021);MainStay Funds Trust:
Trustee since December 2021, Advisory Board Member (June 2021 to December 2021)
| Retired, Managing Director, Devonshire Investors (2007 to 2013); Senior Vice President, Fidelity Management & Research Co. (2005 to 2007); Senior Vice President and Corporate Treasurer, FMR Corp. (2003 to 2005); Chief Operating Officer, Fidelity Investments Japan (2001 to 2003) | 81 | MainStay VP Funds Trust: Trustee since December 2021, Advisory Board Member (June 2021 to December 2021) (31 portfolios);
MainStay MacKay DefinedTerm Municipal Opportunities Fund: Trustee since December 2021, Advisory Board Member (June 2021 to December 2021);
MainStay CBRE Global Infrastructure Megatrends Term Fund: Trustee since December 2021, Advisory Board Member (June 2021 to December 2021);
Two Harbors Investment Corp.: Director since 2018;
Rhode Island State Investment Commission: Member since 2017; and
Blue Cross Blue Shield of Rhode Island: Director since 2019 |
| | Susan B. Kerley
1951 | MainStay Funds: Chair since January 2017 and Trustee since 2007;MainStay Funds Trust:
Chair since January 2017 and Trustee since 1990*** | President, Strategic Management Advisors LLC (since 1990) | 81 | MainStay VP Funds Trust: Chair since January 2017 and Trustee since 2007 (31 portfolios)**;
MainStay MacKay DefinedTerm Municipal Opportunities Fund: Chair since January 2017 and Trustee since 2011;
MainStay CBRE Global Infrastructure Megatrends Term Fund: Trustee since June 2021; and
Legg Mason Partners Funds: Trustee since 1991 (45 portfolios) |
| 52 | MainStay MacKay Strategic Municipal Allocation Fund |
| | Name and
Year of Birth | Term of Office,
Position(s) Held and
Length of Service | Principal Occupation(s)
During Past Five Years | Number of
Portfolios in
Fund Complex
Overseen by
Trustee | Other Directorships
Held by Trustee |
| | | | | | |
| | Alan R. Latshaw
1951 | MainStay Funds: Trusteesince 2006;MainStay Funds Trust:
Trustee since 2007*** | Retired; Partner, Ernst & Young LLP (2002 to 2003); Partner, Arthur Andersen LLP (1989 to 2002); Consultant to the MainStay Funds Audit and Compliance Committee (2004 to 2006) | 81 | MainStay VP Funds Trust: Trustee since 2007 (31 portfolios)**;
MainStay MacKay DefinedTerm Municipal Opportunities Fund: Trustee since 2011; and
MainStay CBRE Global Infrastructure Megatrends Term Fund: Trustee since June 2021 |
| | Jacques P. Perold
1958 | MainStay Funds: Trustee since January 2016, Advisory Board Member (June 2015to December 2015);MainStay Funds Trust:
Trustee since January 2016, Advisory Board Member (June 2015 to December 2015) | Founder and Chief Executive Officer, CapShift Advisors LLC (since 2018); President, Fidelity Management & Research Company (2009 to 2014); President and Chief Investment Officer, Geode Capital Management, LLC (2001 to 2009) | 81 | MainStay VP Funds Trust: Trustee since January 2016, Advisory Board Member (June 2015 to December 2015) (31 portfolios);
MainStay MacKay DefinedTerm Municipal Opportunities Fund: Trustee since January 2016, Advisory Board Member (June 2015 to December 2015);
MainStay CBRE Global Infrastructure Megatrends Term Fund: Trustee since June 2021;
Allstate Corporation: Director since 2015; and
MSCI Inc.: Director since 2017 |
| | Richard S. Trutanic
1952 | MainStay Funds: Trustee since 1994;MainStay Funds Trust:
Trustee since 2007*** | Chairman and Chief Executive Officer, Somerset & Company (financial advisory firm) (since 2004); Managing Director, The Carlyle Group (private investment firm) (2002 to 2004); Senior Managing Director, Partner and Board Member, Groupe Arnault S.A. (private investment firm) (1999 to 2002) | 81 | MainStay VP Funds Trust: Trustee since 2007 (31 portfolios)**;
MainStay MacKay DefinedTerm Municipal Opportunities Fund: Trustee since 2011; and
MainStay CBRE Global Infrastructure Megatrends Term Fund: Trustee since June 2021 |
| ** | Includes prior service as a Director of MainStay VP Series Fund, Inc., the predecessor to MainStay VP Funds Trust. |
| *** | Includes prior service as a Director/Trustee of certain predecessor entities to MainStay Funds Trust. |
Board of Trustees and Officers (Unaudited) (continued)
| | Name and
Year of Birth | Position(s) Held and
Length of Service | Principal Occupation(s)
During Past Five Years | |
| | | | | |
| | Kirk C. Lehneis
1974 | President, MainStay Funds, MainStay Funds Trust (since 2017) | Chief Operating Officer and Senior Managing Director (since 2016), New York Life Investment Management LLC and New York Life Investment Management Holdings LLC; Member of the Board of Managers (since 2017) and Senior Managing Director (since 2018), NYLIFE Distributors LLC; Chairman of the Board and Senior Managing Director, NYLIM Service Company LLC (since 2017); Trustee, President and Principal Executive Officer of IndexIQ Trust, IndexIQ ETF Trust and IndexIQ Active ETF Trust (since 2018); President, MainStay CBRE Global Infrastructure Megatrends Term Fund (since 2021), MainStay MacKay DefinedTerm Municipal Opportunities Fund and MainStay VP Funds Trust (since 2017)**; Senior Managing Director, Global Product Development (2015 to 2016); Managing Director, Product Development (2010 to 2015), New York Life Investment Management LLC | |
| | Jack R. Benintende
1964 | Treasurer and Principal Financial and Accounting Officer, MainStay Funds (since 2007), MainStay Funds Trust (since 2009) | Managing Director, New York Life Investment Management LLC (since 2007); Treasurer and Principal Financial and Accounting Officer, MainStay CBRE Global Infrastructure Megatrends Term Fund (since 2021), MainStay MacKay DefinedTerm Municipal Opportunities Fund (since 2011) and MainStay VP Funds Trust (since 2007)**; and Assistant Treasurer, New York Life Investment Management Holdings LLC (2008 to 2012) | |
| | J. Kevin Gao
1967 | Secretary and Chief Legal Officer, MainStay Funds and MainStay Funds Trust (since 2010) | Managing Director and Associate General Counsel, New York Life Investment Management LLC (since 2010); Secretary and Chief Legal Officer, MainStay CBRE Global Infrastructure Megatrends Term Fund (since 2021), MainStay MacKay DefinedTerm Municipal Opportunities Fund (since 2011) and MainStay VP Funds Trust (since 2010)** | |
| | Kevin M. Gleason
1967 | Vice President and Chief Compliance Officer, MainStay Funds and MainStay Funds Trust (since June 2022) | Vice President and Chief Compliance Officer, IndexIQ Trust, IndexIQ ETF Trust and Index IQ Active ETF Trust (since June 2022); Vice President and Chief Compliance Officer, MainStay CBRE Global Infrastructure Megatrends Term Fund, MainStay VP Funds Trust and MainStay MacKay DefinedTerm Municipal Opportunities Fund (since June 2022); Senior Vice President, Voya Investment Management and Chief Compliance Officer, Voya Family of Funds (2012 to 2022) | |
| | Scott T. Harrington
1959 | Vice President— Administration, MainStay Funds (since 2005), MainStay Funds Trust (since 2009) | Managing Director, New York Life Investment Management LLC (including predecessor advisory organizations) (since 2000); Member of the Board of Directors, New York Life Trust Company (since 2009); Vice President—Administration, MainStay CBRE Global Infrastructure Megatrends Term Fund (since 2021), MainStay MacKay DefinedTerm Municipal Opportunities Fund (since 2011) and MainStay VP Funds Trust (since 2005)** | |
| * | The officers listed above are considered to be “interested persons” of the MainStay Group of Funds, MainStay VP Funds Trust, MainStay CBRE Global Infrastructure Megatrends Term Fund and MainStay MacKay DefinedTerm Municipal Opportunities Fund within the meaning of the 1940 Act because of their affiliation with the MainStay Group of Funds, New York Life Insurance Company and/or its affiliates, including New York Life Investment Management LLC, New York Life Insurance Company, NYLIM Service Company LLC, NYLIFE Securities LLC and/or NYLIFE Distributors LLC, as described in detail in the column captioned “Principal Occupation(s) During Past Five Years.” Officers are elected annually by the Board. |
| ** | Includes prior service as an Officer of MainStay VP Series Fund, Inc., the predecessor to MainStay VP Funds Trust. |
Officers of the Trust (Who are not Trustees)*
| 54 | MainStay MacKay Strategic Municipal Allocation Fund |
Equity
U.S. Equity
MainStay Epoch U.S. Equity Yield Fund
MainStay Fiera SMID Growth Fund
MainStay PineStone U.S. Equity Fund
MainStay S&P 500 Index Fund
MainStay Winslow Large Cap Growth Fund
MainStay WMC Enduring Capital Fund
MainStay WMC Growth Fund
MainStay WMC Small Companies Fund
MainStay WMC Value Fund
International Equity
MainStay Epoch International Choice Fund
MainStay PineStone International Equity Fund
MainStay WMC International Research Equity Fund
Emerging Markets Equity
MainStay Candriam Emerging Markets Equity Fund
Global Equity
MainStay Epoch Capital Growth Fund
MainStay Epoch Global Equity Yield Fund
MainStay PineStone Global Equity Fund
Fixed Income
Taxable Income
MainStay Candriam Emerging Markets Debt Fund
MainStay Floating Rate Fund
MainStay MacKay High Yield Corporate Bond Fund
MainStay MacKay Short Duration High Yield Fund
MainStay MacKay Strategic Bond Fund
MainStay MacKay Total Return Bond Fund
MainStay MacKay U.S. Infrastructure Bond Fund
MainStay Short Term Bond Fund
Tax-Exempt Income
MainStay MacKay California Tax Free Opportunities Fund1
MainStay MacKay High Yield Municipal Bond Fund
MainStay MacKay New York Tax Free Opportunities Fund2
MainStay MacKay Short Term Municipal Fund
MainStay MacKay Strategic Municipal Allocation Fund
MainStay MacKay Tax Free Bond Fund
Money Market
MainStay Money Market Fund
Mixed Asset
MainStay Balanced Fund
MainStay Income Builder Fund
MainStay MacKay Convertible Fund
Speciality
MainStay CBRE Global Infrastructure Fund
MainStay CBRE Real Estate Fund
MainStay Cushing MLP Premier Fund
Asset Allocation
MainStay Conservative Allocation Fund
MainStay Conservative ETF Allocation Fund
MainStay Defensive ETF Allocation Fund
MainStay Equity Allocation Fund
MainStay Equity ETF Allocation Fund
MainStay ESG Multi-Asset Allocation Fund
MainStay Growth Allocation Fund
MainStay Growth ETF Allocation Fund
MainStay Moderate Allocation Fund
MainStay Moderate ETF Allocation Fund
Manager
New York Life Investment Management LLC
New York, New York
Subadvisors
Candriam3
Strassen, Luxembourg
CBRE Investment Management Listed Real Assets LLC
Radnor, Pennsylvania
Cushing Asset Management, LP
Dallas, Texas
Epoch Investment Partners, Inc.
New York, New York
Fiera Capital Inc.
New York, New York
IndexIQ Advisors LLC3
New York, New York
MacKay Shields LLC3
New York, New York
NYL Investors LLC3
New York, New York
PineStone Asset Management Inc.
Montreal, Québec
Wellington Management Company LLP
Boston, Massachusetts
Winslow Capital Management, LLC
Minneapolis, Minnesota
Legal Counsel
Dechert LLP
Washington, District of Columbia
Independent Registered Public Accounting Firm
KPMG LLP
Philadelphia, Pennsylvania
Distributor
NYLIFE Distributors LLC3
Jersey City, New Jersey
Custodian
JPMorgan Chase Bank, N.A.
New York, New York
1.
This Fund is registered for sale in AZ, CA, NV, OR, TX, UT, WA and MI (Class A and Class I shares only), and CO, FL, GA, HI, ID, MA, MD, NH, NJ and NY (Class I shares only).
| 2. | This Fund is registered for sale in CA, CT, DE, FL, MA, NJ, NY and VT. |
| 3. | An affiliate of New York Life Investment Management LLC. |
Not part of the Annual Report
For more information
800-624-6782
newyorklifeinvestments.com
“New York Life Investments” is both a service mark, and the common trade name, of certain investment advisors affiliated with New York Life Insurance Company. The MainStay Funds® are managed by New York Life Investment Management LLC and distributed by NYLIFE Distributors LLC, 30 Hudson Street, Jersey City, NJ 07302, a wholly owned subsidiary of New York Life Insurance Company. NYLIFE Distributors LLC is a Member FINRA/SIPC.
©2023 NYLIFE Distributors LLC. All rights reserved.
| 5013753MS139-23 | MSMSMA11-12/23 |
(NYLIM) NL466
Item 2. Code of Ethics.
As of the end of the period covered by this report, the Registrant has adopted a code of ethics (the “Code”) that applies to the Registrant’s principal executive officer (“PEO”) and principal financial officer (“PFO”). During the period covered by this report, no amendments were made to the provisions of the Code. The Registrant did not grant any waivers, including implicit waivers, from any provisions of the Code to the PEO or PFO during the period covered by this report. A copy of the Code is filed herewith.
| Item 3. | Audit Committee Financial Expert. |
The Board of Trustees has determined that the Registrant has three “audit committee financial experts” serving on its Audit Committee. The Audit Committee financial experts are Alan R. Latshaw, Karen Hammond and Susan B. Kerley. Mr. Latshaw, Ms. Hammond and Ms. Kerley are “independent” as defined by Item 3 of Form N-CSR.
| Item 4. | Principal Accountant Fees and Services. |
(a) Audit Fees
The aggregate fees billed for the fiscal year ended October 31, 2023 for professional services rendered by KPMG LLP (“KPMG”) for the audit of the Registrant’s annual financial statements or services that are normally provided by KPMG in connection with statutory and regulatory filings or engagements for that fiscal year were $1,467,800.
The aggregate fees billed for the fiscal year ended April 30, 2023 for professional services rendered by KPMG for the audit of the Registrant’s series MainStay MacKay Short Term Municipal Fund and MainStay MacKay Strategic Municipal Allocation Fund annual financial statements or services that are normally provided by KPMG in connection with the statutory and regulatory filings or engagements for that fiscal year were $131,200.
The aggregate fees billed for the fiscal year ended October 31, 2022 for professional services rendered by KPMG for the audit of the Registrant’s annual financial statements or services that are normally provided by KPMG in connection with statutory and regulatory filings or engagements for that fiscal year were $1,286.050.
(b) Audit-Related Fees
The aggregate fees billed for assurance and related services by KPMG that are reasonably related to the performance of the audit of the Registrant’s financial statements and are not reported under paragraph (a) of this Item were: (i) $0 for the fiscal year ended October 31, 2023, and (ii) $0 for the fiscal year ended April 30, 2023 for the Registrant’s series MainStay MacKay Short Term Municipal Fund and MainStay MacKay Strategic Municipal Allocation Fund and (iii) $0 for the fiscal year ended October 31, 2022.
(c) Tax Fees
The aggregate fees billed for professional services rendered by KPMG for tax compliance, tax advice, and tax planning were :(i) $0 during the fiscal year ended October 31, 2023, and (ii) $0 for the fiscal year ended April 30, 2023 for the Registrant’s series MainStay MacKay Short Term Municipal Fund and MainStay MacKay Strategic Municipal Allocation Fund. (iii) $0 during the fiscal year ended October 31, 2022. These services primarily included preparation of federal, state and local income tax returns and excise tax returns, as well as services relating to excise tax distribution requirements.
(d) All Other Fees
The aggregate fees billed for products and services provided by KPMG, other than the services reported in paragraphs (a) through (c) of this Item were: (i) $0 during the fiscal year ended October 31, 2023, (ii) $0 for the fiscal year ended April 30, 2023 for the Registrant’s series MainStay MacKay Short Term Municipal Fund and MainStay Strategic Municipal Allocation Fund and (iii) $0 during the fiscal year ended October 31, 2022..
(e) Pre-Approval Policies and Procedures
| | (1) | The Registrant’s Audit Committee has adopted pre-approval policies and procedures (the “Procedures”) to govern the Committee’s pre-approval of (i) all audit services and permissible non-audit services to be provided to the Registrant by its independent accountant, and (ii) all permissible non-audit services to be provided by such independent accountant to the Registrant’s investment adviser and to any entity controlling, controlled by or under common control with the investment adviser that provides ongoing services to the Registrant (collectively, the “Service Affiliates”) if the services directly relate to the Registrant’s operations and financial reporting. In accordance with the Procedures, the Audit Committee is responsible for the engagement of the independent accountant to certify the Registrant’s financial statements for each fiscal year. With respect to the pre-approval of non-audit services provided to the Registrant and its Service Affiliates, the Procedures provide that the Audit Committee may annually pre-approve a list of the types of services that may be provided to the Registrant or its Service Affiliates, or the Audit Committee may pre-approve such services on a project-by-project basis as they arise. Unless a type of service has received general pre-approval, it will require specific pre-approval by the Audit Committee if it is to be provided by the independent accountant. The Procedures also permit the Audit Committee to delegate authority to one or more of its members to pre-approve any proposed non-audit services that have not been previously pre-approved by the Audit Committee, subject to the ratification by the full Audit Committee no later than its next scheduled meeting. To date, the Audit Committee has not delegated such authority. |
| | (2) | With respect to the services described in paragraphs (b) through (d) of this Item 4, no amount was approved by the Audit Committee pursuant to paragraph (c)(7)(i)(C) of Rule 2-01 of Regulation S-X. |
(f) There were no hours expended on KPMG’s engagement to audit the Registrant’s financial statements for the most recent fiscal year was attributable to work performed by persons other than KPMG’s full-time, permanent employees.
(g) All non-audit fees billed by KPMG for services rendered to the Registrant for the fiscal years ended October 31, 2023, for the fiscal year ended April 30, 2023 for the Registrant’s series Mainstay MacKay Short Term Municipal Fund and MainStay MacKay Strategic Municipal Allocation Fund and October 31, 2022 are disclosed in 4(b)-(d) above.
The aggregate non-audit fees billed by KPMG for services rendered to the Registrant’s investment adviser (not including any sub-adviser whose role is primarily portfolio management and is subcontracted with or overseen by another investment adviser), and any entity controlling, controlled by, or under common control with the adviser that provides ongoing services to the Registrant were approximately: (i) $252,428 for the fiscal year ended October 31, 2023, (ii) $369,972 for the fiscal year ended April 30, 2023 for the Registrant’s series MainStay MacKay Short Term Municipal Fund and MainStay MacKay Strategic Municipal Allocation Fund and (iii) $193,405 for the fiscal year ended October 31, 2022.
(h) The Registrant’s Audit Committee has determined that the non-audit services rendered by KPMG for the fiscal year ended October 31, 2023 to the Registrant’s investment adviser and any entity controlling, controlled by, or under common control with the Registrant’s investment adviser that provides ongoing services to the Registrant that were not required to be pre-approved by the Audit Committee because they did not relate directly to the operations and financial reporting of the registrant were compatible with maintaining the respective independence of KPMG during the relevant time period.
| Item 5. | Audit Committee of Listed Registrants. |
Not applicable.
The Schedule of Investments is included as part of Item 1 of this report.
| Item 7. | Disclosure of Proxy Voting Policies and Procedures for Closed-End Management Investment Companies. |
Not applicable.
| Item 8. | Portfolio Managers of Closed-End Management Investment Companies. |
Not applicable.
| Item 9. | Purchases of Equity Securities by Closed-End Management Investment Company and Affiliated Purchasers. |
Not applicable.
| Item 10. | Submission of Matters to a Vote of Security Holders. |
Since the Registrant’s last response to this Item, there have been no material changes to the procedures by which shareholders may recommend nominees to the Registrant’s Board of Trustees.
Item 11. Controls and Procedures.
(a) Based on an evaluation of the Registrant’s Disclosure Controls and Procedures (as defined in Rule 30a-3(c) under the Investment Company Act of 1940) (the “Disclosure Controls”), as of a date within 90 days prior to the filing date (the “Filing Date”) of this Form N-CSR (the “Report”), the Registrant’s principal executive officer and principal financial officer have concluded that the Disclosure Controls are reasonably designed to ensure that information required to be disclosed by the Registrant in
the Report is recorded, processed, summarized and reported by the Filing Date, including ensuring that information required to be disclosed in the Report is accumulated and communicated to the Registrant’s management, including the Registrant’s principal executive officer and principal financial officer, as appropriate to allow timely decisions regarding required disclosure.
(b) There were no changes in the Registrant’s internal control over financial reporting (as defined in Rule 30a-3(d)) under the Investment Company Act of 1940 that occurred during the period covered by this report that has materially affected, or is reasonably likely to materially affect, the Registrant’s internal control over financial reporting.
| Item 12. | Disclosure of Securities Lending Activities for Closed-End Management Investment Companies. |
Not applicable.
SIGNATURES
Pursuant to the requirements of the Securities Exchange Act of 1934 and the Investment Company Act of 1940, the Registrant has duly caused this Report to be signed on its behalf by the undersigned, thereunto duly authorized.
MAINSTAY FUNDS TRUST
| | |
| By: | | /s/ Kirk C. Lehneis |
| | Kirk C. Lehneis President and Principal Executive Officer |
| |
| Date: | | January 5, 2024 |
Pursuant to the requirements of the Securities Exchange Act of 1934 and the Investment Company Act of 1940, this Report has been signed below by the following persons on behalf of the Registrant and in the capacities and on the dates indicated.
| | |
| By: | | /s/ Kirk C. Lehneis |
| | Kirk C. Lehneis President and Principal Executive Officer |
| |
| Date: | | January 5, 2024 |
| |
| By: | | /s/ Jack R. Benintende |
| | Jack R. Benintende Treasurer and Principal Financial and Accounting Officer |
| |
| Date: | | January 5, 2024 |