UNITED STATES
SECURITIES AND EXCHANGE COMMISSION
Washington, D.C. 20549
Form N-CSR
CERTIFIED SHAREHOLDER REPORT OF REGISTERED MANAGEMENT
INVESTMENT COMPANIES
Investment Company Act File Number 811-22321
MAINSTAY FUNDS TRUST
(Exact name of Registrant as specified in charter)
51 Madison Avenue, New York, NY 10010
(Address of principal executive offices) (Zip code)
J. Kevin Gao, Esq.
30 Hudson Street
Jersey City, New Jersey 07302
(Name and address of agent for service)
Registrant’s telephone number, including area code: (212) 576-7000
Date of fiscal year end: November 30
(MainStay Cushing MLP Premier Fund only)
Date of reporting period: November 30, 2023
FORM N-CSR
Item 1. Reports to Stockholders.
MainStay Cushing® MLP
Premier Fund
Message from the President and Annual Report
November 30, 2023
Special Notice:
Beginning in July 2024, new regulations issued by the Securities and Exchange Commission (SEC) will take effect requiring open-end mutual fund companies and ETFs to (1) overhaul the content of their shareholder reports and (2) mail paper copies of the new tailored shareholder reports to shareholders who have not opted to receive these documents electronically.
If you have not yet elected to receive your shareholder reports electronically, please contact your financial intermediary or visit newyorklifeinvestments.com/accounts.
| Not FDIC/NCUA Insured | Not a Deposit | May Lose Value | No Bank Guarantee | Not Insured by Any Government Agency |
This page intentionally left blank
Message from the President
Amid easing inflationary pressures and continued economic growth, stocks and bonds generally gained ground during the 12-month period ended November 30, 2023, despite high levels of volatility and sharp disparities between the performance of various market sectors. While energy-related stocks significantly underperformed the broader market, the midstream energy segment exhibited surprising resilience, gaining significant ground due to strong company fundamentals.
Although the war in Ukraine, the outbreak of hostilities in the Middle East and several other notable events affected financial assets, inflation and interest rate trends stood at the forefront of market developments during most of the reporting period. As the period began, high levels of inflation already showed signs of easing in the face of aggressive rate hikes by U.S. Federal Reserve (the “Fed”). From a peak of 9.1% in June 2022, the annualized U.S. inflation rate dropped to 6.5% in December 2022, and to 3.1% in November 2023. At the same time, the Fed increased the benchmark federal funds rate from 3.75%–4.00% at the beginning of reporting period to 5.25%–5.50% as of November 30, 2023. As the pace of rate increases slowed, investors started to hope for an early shift to a looser monetary policy, and by the end of the reporting period, the market began pricing in rate cuts for 2024. In response, the yield on the 10-year U.S. Treasury bond dipped from a high of over 4.9% in mid-October 2023 to 4.3% as of November 30, 2023, but stayed above the 4.0% level. The yield curve remained inverted, meaning that short-term yields exceeded long-term yields, with the two-year Treasury ending the reporting period at 4.7%.
The S&P 500® Index, a widely regarded benchmark of U.S. market performance, produced double-digit gains during the reporting period, as investors anticipated an end to the Fed’s rate hike cycle and hoped for a soft economic landing. Not surprisingly, given the economic backdrop, growth-oriented stocks in the information technology and consumer discretionary sectors outperformed, while value-oriented and interest-rate sensitive shares lagged. Energy stocks also trailed the broader market, posting negative returns as crude oil slipped from more than $80
a barrel in December 2022 to just over $70 a barrel as of November 30, 2023. Natural gas prices declined even more dramatically over the same period, from $5.53 per million BTU to $2.71. While shares of many integrated oil & gas companies suffered in this environment, midstream MLPs (master limited partnerships) performed relatively well as investors favored the group’s strong fundamentals, disciplined management practices and substantial free-cash-flow generation. Only the interest-rate-sensitive YieldCo segment failed to post gains, due to the high interest rate environment.
Despite increasing expectations for Fed rate cuts in 2024, statements from the central bank continue to insist that the path forward remains uncertain, with future actions dependent on emergent economic data. Whether the Fed can reach its inflation target without driving the economy into recession remains to be seen. The direction of energy prices remains even more unpredictable, driven by shifting macroeconomic and geopolitical developments. Nevertheless, the midstream energy sector appears well positioned to weather these uncertainties, given companies’ robust fundamentals, appealing valuations, strong free-cash-flow generation and defensive characteristics. MainStay Cushing® MLP Premier Fund continues to sharply focus on this specialized area. By leveraging the independent, energy-related expertise of Cushing Asset Management, the Fund exemplifies the multi-boutique investment philosophy that sets New York Life Investments apart.
Thank you for trusting us to help meet your investment needs.
Sincerely,
Kirk C. Lehneis
President
The opinions expressed are as of the date of this report and are subject to change. There is no guarantee that any forecast made will come to pass. This material does not constitute investment advice and is not intended as an endorsement of any specific investment. Past performance is no guarantee of future results.
Not part of the Annual Report
Investors should refer to the Fund’s Summary Prospectus and/or Prospectus and consider the Fund’s investment objectives, strategies, risks, charges and expenses carefully before investing. The Summary Prospectus and/or Prospectus contain this and other information about the Fund. You may obtain copies of the Fund’s Summary Prospectus, Prospectus and Statement of Additional Information, which includes information about the MainStay Funds Trust's Trustees, free of charge, upon request, by calling toll-free 800-624-6782, by writing to NYLIFE Distributors LLC, Attn: MainStay Marketing Department, 30 Hudson Street, Jersey City, NJ 07302 or by sending an e-mail to MainStayShareholderServices@nylim.com. These documents are also available via the MainStay Funds’ website at newyorklifeinvestments.com. Please read the Fund’s Summary Prospectus and/or Prospectus carefully before investing.
Investment and Performance Comparison (Unaudited)
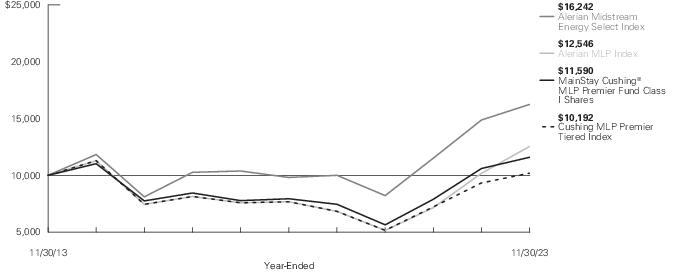
Performance data quoted represents past performance. Past performance is no guarantee of future results. Because of market volatility and other factors, current performance may be lower or higher than the figures shown. Investment return and principal value will fluctuate, and as a result, when shares are redeemed, they may be worth more or less than their original cost. The graph below depicts the historical performance of Class I shares of the Fund. Performance will vary from class to class based on differences in class-specific expenses and sales charges. For performance information current to the most recent month-end, please call 800-624-6782 or visit newyorklifeinvestments.com.
The performance table and graph do not reflect the deduction of taxes that a shareholder would pay on distributions or Fund share redemptions. Total returns reflect maximum applicable sales charges as indicated in the table below, if any, changes in share price, and reinvestment of dividend and capital gain distributions. The graph assumes the initial investment amount shown below and reflects the deduction of all sales charges that would have applied for the period of investment. Performance figures may reflect certain fee waivers and/or expense limitations, without which total returns may have been lower. For more information on share classes and current fee waivers and/or expense limitations (if any), please refer to the Notes to Financial Statements.
| Average Annual Total Returns for the Year-Ended November 30, 2023 |
| Class | Sales Charge | | Inception
Date | One
Year | Five
Years | Ten Years
or Since
Inception | Gross
Expense
Ratio1 |
| Class A Shares2 | Maximum 5.50% Initial Sales Charge | With sales charges | 10/20/2010 | 3.10% | 6.40% | 0.67% | 1.45% |
| | | Excluding sales charges | | 9.11 | 7.61 | 1.24 | 1.45 |
| Investor Class Shares3 | Maximum 5.00% Initial Sales Charge | With sales charges | 7/11/2014 | 3.63 | 6.40 | -0.84 | 1.44 |
| | | Excluding sales charges | | 9.08 | 7.61 | -0.24 | 1.44 |
| Class C Shares2 | Maximum 1.00% CDSC | With sales charges | 10/20/2010 | 7.30 | 6.78 | 0.47 | 2.19 |
| | if Redeemed Within One Year of Purchase | Excluding sales charges | | 8.27 | 6.78 | 0.47 | 2.19 |
| Class I Shares2 | No Sales Charge | | 10/20/2010 | 9.34 | 7.87 | 1.49 | 1.20 |
| 1. | The gross expense ratios presented reflect the Fund’s “Total Annual Fund Operating Expenses” from the most recent Prospectus and may differ from other expense ratios disclosed in this report. |
| 2. | Performance figures for Class A shares, Class C shares and Class I shares reflect the historical performance of the then–existing Class A shares, Class C shares and Class I shares, respectively, of the Cushing® MLP Premier Fund (the predecessor to the Fund, which was subject to a different fee structure) for periods prior to July 12, 2014. The Cushing® MLP Premier Fund commenced operations on October 20, 2010. |
| 3. | Prior to June 30, 2020, the maximum initial sales charge was 5.50%, which is reflected in the applicable average annual total return figures shown. |
The footnotes on the next page are an integral part of the table and graph and should be carefully read in conjunction with them.
| Benchmark Performance* | One
Year | Five
Years | Ten
Years |
| Alerian Midstream Energy Select Index1 | 9.23% | 10.60% | 4.97% |
| Cushing MLP Premier Tiered Index2 | 9.23 | 5.84 | 0.19 |
| Alerian MLP Index3 | 23.29 | 10.33 | 2.29 |
| Morningstar Energy Limited Partnership Category Average4 | 10.84 | 8.58 | 1.99 |
| * | Returns for indices reflect no deductions for fees, expenses or taxes, except for foreign withholding taxes where applicable. Results assume reinvestment of all dividends and capital gains. An investment cannot be made directly in an index. |
| 1. | The Alerian Midstream Energy Select Index is a broad-based composite of North American energy infrastructure companies. The Alerian Midstream Energy Select Index is a capped, float-adjusted, capitalization weighted index, whose constituents earn the majority of their cash flow from midstream activities involving energy commodities. |
| 2. | The returns for the tiered benchmark represent the returns of the Alerian MLP Index prior to December 1, 2020 and the returns of the Alerian Midstream Energy Select Index thereafter. |
| 3. | The Alerian MLP Index is an unmanaged, capped, float-adjusted, capitalization-weighted index and a leading gauge of energy MLPs. |
| 4. | The Morningstar Energy Limited Partnership Category Average is representative of funds that invest primarily a significant amount of their fund in energy master limited partnerships. These include but are not limited to limited partnerships specializing in midstream operations in the energy industry. Results are based on average total returns of similar funds with all dividends and capital gain distributions reinvested. |
The footnotes on the preceding page are an integral part of the table and graph and should be carefully read in conjunction with them.
| 6 | MainStay Cushing® MLP Premier Fund |
Cost in Dollars of a $1,000 Investment in MainStay Cushing® MLP Premier Fund (Unaudited)
The example below is intended to describe the fees and expenses borne by shareholders during the six-month period from June 1, 2023 to November 30, 2023, and the impact of those costs on your investment.
Example
As a shareholder of the Fund you incur two types of costs: (1) transaction costs, including exchange fees and sales charges (loads) on purchases (as applicable), and (2) ongoing costs, including management fees, distribution and/or service (12b-1) fees and other Fund expenses (as applicable). This example is intended to help you understand your ongoing costs (in dollars) of investing in the Fund and to compare these costs with the ongoing costs of investing in other mutual funds. The example is based on an investment of $1,000 made at the beginning of the six-month period and held for the entire period from June 1, 2023 to November 30, 2023.
This example illustrates your Fund’s ongoing costs in two ways:
Actual Expenses
The second and third data columns in the table below provide information about actual account values and actual expenses. You may use the information in these columns, together with the amount you invested, to estimate the expenses that you paid during the six months ended November 30, 2023. Simply divide your account value by $1,000 (for example, an $8,600 account value divided by $1,000 = 8.6), then
multiply the result by the number under the heading entitled “Expenses Paid During Period” to estimate the expenses you paid on your account during this period.
Hypothetical Example for Comparison Purposes
The fourth and fifth data columns in the table below provide information about hypothetical account values and hypothetical expenses based on the Fund’s actual expense ratio and an assumed rate of return of 5% per year before expenses, which is not the Fund’s actual return. The hypothetical account values and expenses may not be used to estimate the actual ending account balances or expenses you paid for the six-month period shown. You may use this information to compare the ongoing costs of investing in the Fund with the ongoing costs of investing in other mutual funds. To do so, compare this 5% hypothetical example with the 5% hypothetical examples that appear in the shareholder reports of the other mutual funds.
Please note that the expenses shown in the table are meant to highlight your ongoing costs only and do not reflect any transactional costs, such as exchange fees or sales charges (loads). Therefore, the fourth and fifth data columns of the table are useful in comparing ongoing costs only and will not help you determine the relative total costs of owning different funds. In addition, if these transactional costs were included, your costs would have been higher.
| Share Class | Beginning
Account
Value
6/1/23 | Ending Account
Value (Based
on Actual
Returns and
Expenses)
11/30/23 | Expenses
Paid
During
Period1 | Ending Account
Value (Based
on Hypothetical
5% Annualized
Return and
Actual Expenses)
11/30/23 | Expenses
Paid
During
Period1 | Net Expense
Ratio
During
Period2 |
| Class A Shares | $1,000.00 | $1,198.60 | $ 8.21 | $1,017.60 | $ 7.54 | 1.49% |
| Investor Class Shares | $1,000.00 | $1,198.10 | $ 8.16 | $1,017.65 | $ 7.49 | 1.48% |
| Class C Shares | $1,000.00 | $1,193.00 | $12.26 | $1,013.89 | $11.26 | 2.23% |
| Class I Shares | $1,000.00 | $1,198.70 | $ 6.83 | $1,018.85 | $ 6.28 | 1.24% |
| 1. | Expenses are equal to the Fund’s annualized expense ratio of each class multiplied by the average account value over the period, divided by 365 and multiplied by 183 (to reflect the six-month period). The table above represents the actual expenses incurred during the six-month period. In addition to the fees and expenses which the Fund bears directly, it also indirectly bears a pro rata share of the fees and expenses of the underlying funds in which it invests. Such indirect expenses are not included in the above-reported expense figures. |
| 2. | Expenses are equal to the Fund's annualized expense ratio to reflect the six-month period. |
Portfolio Composition as of November 30, 2023(1) (Unaudited)
(1) Fund holdings and sector allocations are subject to change, and there is no assurance that the Fund will continue to hold any particular security.
(2) Common Stocks
(3) MLPs and Related Companies
See Portfolio of Investments beginning on page 12 for specific holdings within these categories. The Fund's holdings are subject to change.
Top Ten Holdings and/or Issuers Held as of November 30, 2023 (excluding short-term investments) (Unaudited)
| 1. | Targa Resources Corp. |
| 2. | Energy Transfer LP |
| 3. | Cheniere Energy, Inc. |
| 4. | Plains GP Holdings LP, Class A |
| 5. | ONEOK, Inc. |
| 6. | Kinder Morgan, Inc. |
| 7. | Equitrans Midstream Corp. |
| 8. | Williams Cos., Inc. (The) |
| 9. | Pembina Pipeline Corp. |
| 10. | Enterprise Products Partners LP |
| 8 | MainStay Cushing® MLP Premier Fund |
Portfolio Management Discussion and Analysis (Unaudited)
Questions answered by portfolio manager John M. Musgrave and Saket Kumar of Cushing Asset Management, LP, the Fund’s Subadvisor.
How did MainStay Cushing® MLP Premier Fund perform relative to its benchmarks and peer group during the 12 months ended November 30, 2023?
For the 12 months ended November 30, 2023, Class I shares of MainStay Cushing® MLP Premier Fund returned 9.34%, outperforming the 9.23% return of the Fund’s primary benchmark, the Alerian Midstream Energy Select Index (the “Index”). Over the same period, Class I shares also outperformed the 9.23% return of the Cushing MLP Premier Tiered Index, which is the Fund’s secondary benchmark. During the reporting period, Class I shares of the Fund underperformed the 10.84% return of the Morningstar Energy Limited Partnership Category Average.1
Were there any changes to the Fund during the reporting period?
Effective March 30, 2023, Saket Kumar was added as a portfolio manager of the Fund.
What factors affected the Fund’s relative performance during the reporting period?
The largest contributors to outperformance relative to the Index included stock selection in the large-cap diversified C-Corporation (“C-Corp”) subsector and overweight positioning in the natural gas gatherers & processors subsector. (Contributions take weightings and total returns into account.) Notably, the positive impact of stock selection among large-cap diversified C-Corps more than made up for the negative impact of the Fund’s underweight exposure to the subsector.
During the same period, overweight positioning in the renewable YieldCo subsector detracted most significantly from the Fund’s relative performance. Sensitivity to interest rates undermined the performance of this subsector, especially as the U.S. Federal Reserve (the “Fed”) continued the most extensive and rapid tightening cycle since 1987. Additionally, the subsector suffered due to rising concerns about cost inflation, reduced growth expectations and a broader economic slowdown. During the reporting period, the Fund’s underweight position in the large-cap diversified MLP subsector also detracted from relative returns.
During the reporting period, were there any market events that materially impacted the Fund’s performance or liquidity?
The reporting period began on a high note, with strong performance through the month of January 2023, building on the positive momentum experienced in 2022. However, this progress was abruptly disrupted by a regional banking crisis involving the failure of several banks. The Fed found itself confronted with a challenging situation as it tackled two major issues concurrently: elevated inflation and the restoration of financial
stability. However, after a brief dip, the midstream energy sector recovered, helped by diminishing concerns about banking sector instability.
For the reporting period as a whole, the Index posted strong returns amid significant volatility in crude oil prices, including multiple advances and declines of over 20%. Macroeconomic factors—including an apparent softening of China's demand, global recession fears, restrictive central bank policy and persistently robust Russian crude oil exports—consistently weighed on crude oil prices. Several developments countered these factors, including extended voluntary supply cuts from Saudi Arabia and Russia, moderated U.S. shale growth and record U.S. weekly crude oil inventory depletions. The International Energy Agency (IEA) reported that worldwide oil consumption reached an all-time high of 103 million barrels per day in June 2023, reinforcing our conviction in the enduring relevance of hydrocarbons in the global energy framework.
We found the midstream sector's resilience in the face of commodity volatility encouraging, and identified continuing investment opportunities within North American energy infrastructure as the sector prioritized maximizing shareholder returns. We believe the sector’s gains may have been influenced by the market's realization of midstream energy companies' financial strength. These companies generally do not require external capital due to their typically substantial free-cash-flow (“FCF”) generation.
Merger and acquisition (“M&A”) activity in the midstream space increased as well. We attribute this uptick in part to the maturation of shale reservoirs, and in part to a transformative shift in strategy by midstream management teams. This shift, characterized by disciplined capital spending, high targeted returns on invested capital and sustained positive FCF generation, supported the restoration of balance sheet health and the prioritization of shareholder returns. As the reporting period progressed, management teams looked toward the future, with some eager to capitalize on newfound financial flexibility, while others believed that merging with, or selling to, a larger entity offered the optimal strategy.
During the reporting period, which subsectors were the strongest positive contributors to the Fund’s relative performance and which subsectors were particularly weak?
Relative to the Index, the subsectors providing the strongest performance included large-cap diversified C-corporations, natural gas gatherers & processors and refiners. In general, companies with higher direct and indirect energy commodity price exposure (including production volumes) outperformed. These companies, typically natural gas gatherers & processors and
| 1. | See "Investment and Performance Comparison" for other share class returns, which may be higher or lower than Class I share returns, and for more information on benchmark and peer group returns. |
select names among large-cap diversified C-Corps, exhibit elevated exposure to wellhead economics.
Holdings in the renewable YieldCo and large-cap diversified MLP subsectors underperformed the Index by the most significant margin. Overweight positioning in the renewable YieldCo subsector detracted from both relative and absolute performance, largely due to the high-interest rate environment. As a result, this sparked investor concerns regarding asset valuations and raised doubts about the ability of these companies to secure external capital for ongoing operations and sustained growth. While the large-cap diversified MLP subsector produced positive absolute performance, it represented one of the Fund’s largest underweight positions versus the Index throughout the reporting period.
During the reporting period, which individual stocks made the strongest positive contributions to the Fund’s absolute performance and which stocks detracted the most?
On an absolute basis, the top contributors to the Fund’s performance included Plains GP Holdings, Targa Resources and Energy Transfer. All three positions represented the largest absolute weights in the Fund during the reporting period, and all three were positively impacted by strong commodity prices and increased demand for domestic hydrocarbons. All three companies remained among the largest holdings in the Fund on an absolute and relative basis as of the end of the reporting period.
During the reporting period, Plains GP Holdings, which provides logistics services for crude oil and natural gas liquids, benefited from investors’ preference for liquids-focused midstream infrastructure over natural gas-focused midstream names. The company also continued to exhibit strong base business growth, capital discipline and strict adherence to its financial plan. As North America’s largest oil basin, the Permian, experienced production growth, Plains leveraged spare pipeline capacity and enhanced the use of existing assets, resulting in increased FCF.
Targa Resources, which gathers, processes, fractionates and exports natural gas and natural gas liquids, took radical action with its dividend and capital spending in 2020 in order to repair its balance sheet and drive positive FCF. Throughout the current reporting period, Targa Resouces sustained its track record of industry-leading growth, conducting substantial share buybacks and unveiling a new capital allocation plan aimed at returning more capital to investors. The company remained committed to executing a number of growth projects, including new processing plants and fractionators, and additional export capacity, contributing to the global supply of dependable energy sources.
Energy Transfer, a large-cap diversified MLP, maintained its successful track record of integrating acquisitions, facilitating steady business growth alongside four distribution increases and
robust positive FCF. The company announced several strategic acquisitions during the reporting period, expanding its asset footprint and operational capabilities. Improved operating fundamentals led to increased forward guidance, further bolstering the company’s performance.
On an absolute basis, the most significant detractors from performance included NextEra Energy Partners, Clearway Energy and Excelerate Energy. NextEra Energy Partners and Clearway Energy both own and operate diversified portfolios of highly contracted renewable and conventional power generation projects. We believe these stocks faced headwinds due to the companies’ sensitivity to interest rates, with each company's shares experiencing a sell-off in line with the broader utility sector. Additionally, the stocks were undermined by investors’ concerns regarding asset valuations and implications for the renewable YieldCo model in a higher interest rate environment. We reduced the Fund’s exposure to both companies during the reporting period. However, despite the Fund’s relatively small position sizes, these holdings had an outsized negative impact on overall portfolio performance given the subsector’s poor returns. Overall exposure to these names remained modest as of the end of the reporting, with NextEra and Clearway constituting less than 2.5% of the Fund.
Excelerate Energy owns, operates and develops a portfolio of assets enabling global liquefied natural gas (“LNG”) demand and supply, including floating storage regasification units, terminals and downstream assets. Shares underperformed due to falling global LNG prices, as well as moderating global demand for LNG. The Fund continued to hold Excelerate Energy as of the end of the reporting period.
What were some of the Fund’s largest purchases and sales during the reporting period?
The Fund’s largest purchase during the reporting period was a position in Equitrans Midstream Corporation. Other large purchases included positions in Energy Transfer LP, the Fund’s second-largest holding, and Antero Midstream Corporation.
We increased the Fund’s holdings both Equitrans and Antero Midstream Corporation to gain additional exposure to natural gas-focused names; this was driven by our anticipation of a recovery in natural gas fundamentals in 2024, following a substantial reduction in the number of drilling rigs in natural gas-focused basins. Additionally, while Equitrans’ key project, Mountain Valley Pipeline, had previously experienced years of delays due to regulatory and legal challenges, recent positive developments and approvals provide, in our view, a clear path for the project's completion.
Energy Transfer operates an extensive network of pipelines, terminals and storage facilities, primarily in the United States, facilitating the transportation and distribution of various
| 10 | MainStay Cushing® MLP Premier Fund |
commodities. With substantial FCF and sustained long-term EBITDA (earnings before interest, taxes, depreciation and amortization) and dividend growth, we find the company's valuation attractive.
The Fund’s largest sales during the reporting period included shares in Crestwood Equity Partners and Plains GP Holdings. We trimmed both positions on valuation considerations after strong relative performance. Notably, the Fund exited its entire position in Crestwood upon the announcement of the company’s acquisition by Energy Transfer later in the reporting period.
As mentioned above, the midstream energy sector saw a notable uptick in M&A activity during the reporting period. We believe full integration across the midstream value chain and cost of capital are emerging as differentiators to enhance value for shareholders.
How did the Fund’s subsector weightings change during the reporting period?
The Fund’s subsector weightings remained broadly steady throughout the reporting period. Exposure to the natural gas transportation & storage subsector increased with a larger position in Equitrans Midstream. Additionally, exposure to the large-cap diversified MLP subsector increased incrementally as a result of positive absolute and relative performance, together with additions to holdings in Enterprise Products Partners and Energy Transfer, partially offset by the removal of Midstream Magellan Partners, due to its acquisition by ONEOK. Exposure to renewable YieldCos decreased due to the lagging performance of NextEra Energy Partners and Clearway Energy. Exposure to the Canadian midstream & refiners subsectors incrementally also decreased.
How was the Fund positioned at the end of the reporting period?
Given the robust fundamentals, appealing valuations, strong FCF generation and defensive nature of midstream energy companies in an environment of high interest rates and inflation, we believe the sector is well-positioned to potentially outperform on a relative basis. As of November 30, 2023, the Fund’s largest subsector exposures on an absolute basis included large-cap diversified C-corporations, natural gas gatherers & processors and large-cap diversified MLPs. Relative to the Index, the Fund’s most overweight positions included Targa Resources, Plains GP Holdings and Western Midstream Partners. As of the same date, the Fund held its most significantly underweight positions in Enbridge, Enterprise Products Partners and Keyera.
The opinions expressed are those of the portfolio managers as of the date of this report and are subject to change. There is no guarantee that any forecasts will come to pass. This material does not constitute investment advice and is not intended as an endorsement of any specific investment.
Portfolio of Investments November 30, 2023†^
| | Shares | Value |
| Common Stocks 70.2% |
| Canadian Midstream 1.9% |
| Canada 1.9% |
| Keyera Corp. | 570,000 | $ 14,353,440 |
| General Partnerships 4.1% |
| United States 4.1% |
| EnLink Midstream LLC | 2,280,000 | 31,167,600 |
| Large Cap Diversified C Corps 33.8% |
| Canada 9.6% |
| Enbridge, Inc. | 540,000 | 18,829,800 |
| Pembina Pipeline Corp. | 1,070,000 | 35,770,100 |
| TC Energy Corp. | 520,000 | 19,510,400 |
| United States 24.2% |
| Cheniere Energy, Inc. | 340,000 | 61,931,000 |
| Kinder Morgan, Inc. | 2,160,000 | 37,951,200 |
| ONEOK, Inc. | 703,000 | 48,401,550 |
| Williams Cos., Inc. (The) | 1,020,000 | 37,525,800 |
| | | 259,919,850 |
| Natural Gas Gatherers & Processors 14.8% |
| United States 14.8% |
| Antero Midstream Corp. | 650,000 | 8,658,000 |
| Hess Midstream LP, Class A | 982,000 | 31,954,280 |
| Targa Resources Corp. | 810,000 | 73,264,500 |
| | | 113,876,780 |
| Natural Gas Transportation & Storage 9.4% |
| United States 9.4% |
| DT Midstream, Inc. | 525,000 | 30,077,250 |
| Equitrans Midstream Corp. | 4,030,000 | 37,801,400 |
| Excelerate Energy, Inc., Class A | 290,000 | 4,848,800 |
| | | 72,727,450 |
| Refiners 3.2% |
| United States 3.2% |
| Marathon Petroleum Corp. | 110,000 | 16,410,900 |
| Phillips 66 | 62,000 | 7,991,180 |
| | | 24,402,080 |
| Utility 0.9% |
| United States 0.9% |
| Sempra | 100,000 | 7,287,000 |
| YieldCo 2.1% |
| United States 2.1% |
| Clearway Energy, Inc., Class C | 451,000 | 11,261,470 |
| | Shares | | Value |
| YieldCo |
| United States (continued) |
| NextEra Energy Partners LP | 220,000 | | $ 5,178,800 |
| | | | 16,440,270 |
Total Common Stocks
(Cost $401,637,632) | | | 540,174,470 |
| MLP Investments and Related Companies 30.2% |
| Crude Oil & Refined Products 0.9% |
| United States 0.9% |
| Genesis Energy LP | 530,000 | | 6,656,800 |
| Large Cap Diversified C Corps 7.6% |
| United States 7.6% |
| Plains GP Holdings LP, Class A | 3,620,000 | | 58,499,200 |
| Large Cap MLP 17.9% |
| United States 17.9% |
| Energy Transfer LP | 5,180,000 | | 71,950,200 |
| Enterprise Products Partners LP | 1,290,000 | | 34,546,200 |
| MPLX LP | 860,000 | | 31,355,600 |
| | | | 137,852,000 |
| Natural Gas Gatherers & Processors 3.8% |
| United States 3.8% |
| Western Midstream Partners LP | 990,000 | | 29,521,800 |
Total MLP Investments and Related Companies
(Cost $128,414,160) | | | 232,529,800 |
| Short-Term Investment 0.5% |
| Affiliated Investment Company 0.5% |
| United States 0.5% |
| MainStay U.S. Government Liquidity Fund 5.255%(a) | 4,069,439 | | 4,069,439 |
Total Short-Term Investment
(Cost $4,069,439) | | | 4,069,439 |
Total Investments
(Cost $534,121,231) | 100.9% | | 776,773,709 |
| Other Assets, Less Liabilities | (0.9) | | (7,017,739) |
| Net Assets | 100.0% | | $ 769,755,970 |
| † | Percentages indicated are based on Fund net assets. |
| ^ | Industry classifications may be different than those used for compliance monitoring purposes. |
| (a) | Current yield as of November 30, 2023. |
The notes to the financial statements are an integral part of, and should be read in conjunction with, the financial statements.
| 12 | MainStay Cushing® MLP Premier Fund |
Investments in Affiliates (in 000's)
Investments in issuers considered to be affiliate(s) of the Fund during the year ended November 30, 2023 for purposes of Section 2(a)(3) of the Investment Company Act of 1940, as amended, were as follows:
| Affiliated Investment Companies | Value,
Beginning
of Year | Purchases
at Cost | Proceeds
from
Sales | Net
Realized
Gain/(Loss)
on Sales | Change in
Unrealized
Appreciation/
(Depreciation) | Value,
End of
Year | Dividend
Income | Other
Distributions | Shares
End of
Year |
| MainStay U.S. Government Liquidity Fund | $ 26,006 | $ 149,172 | $ (171,109) | $ — | $ — | $ 4,069 | $ 454 | $ — | 4,069 |
| Abbreviation(s): |
| MLP—Master limited partnership |
The following is a summary of the fair valuations according to the inputs used as of November 30, 2023, for valuing the Fund’s assets:
| Description | Quoted
Prices in
Active
Markets for
Identical
Assets
(Level 1) | | Significant
Other
Observable
Inputs
(Level 2) | | Significant
Unobservable
Inputs
(Level 3) | | Total |
| Asset Valuation Inputs | | | | | | | |
| Investments in Securities (a) | | | | | | | |
| Common Stocks | $ 540,174,470 | | $ — | | $ — | | $ 540,174,470 |
| MLP Investments and Related Companies | 232,529,800 | | — | | — | | 232,529,800 |
| Short-Term Investment | | | | | | | |
| Affiliated Investment Company | 4,069,439 | | — | | — | | 4,069,439 |
| Total Investments in Securities | $ 776,773,709 | | $ — | | $ — | | $ 776,773,709 |
| (a) | For a complete listing of investments and their industries, see the Portfolio of Investments. |
The notes to the financial statements are an integral part of, and should be read in conjunction with, the financial statements.
13
Statement of Assets and Liabilities as of November 30, 2023
| Assets |
Investment in unaffiliated securities, at value
(identified cost $530,051,792) | $772,704,270 |
Investment in affiliated investment companies, at value
(identified cost $4,069,439) | 4,069,439 |
Cash denominated in foreign currencies
(identified cost $803,618) | 805,850 |
| Receivables: | |
| Investment securities sold | 3,080,096 |
| Dividends | 690,485 |
| Fund shares sold | 431,449 |
| Other assets | 57,087 |
| Total assets | 781,838,676 |
| Liabilities |
| Due to custodian | 1,044 |
| Payables: | |
| Investments purchased | 7,599,282 |
| Fund shares redeemed | 3,301,055 |
| Manager fees (See Note 3) | 673,420 |
| NYLIFE Distributors (See Note 3) | 177,656 |
| Transfer agent (See Note 3) | 142,368 |
| Professional fees | 14,617 |
| Shareholder communication | 14,434 |
| Custodian | 14,392 |
| Trustees | 5,533 |
| Accrued expenses | 545 |
| Distributions payable | 138,360 |
| Total liabilities | 12,082,706 |
| Net assets | $769,755,970 |
| Composition of Net Assets |
| Shares of beneficial interest outstanding (par value of $.001 per share) unlimited number of shares authorized | $ 88,936 |
| Additional paid-in-capital | 627,397,890 |
| | 627,486,826 |
| Total distributable earnings (loss) | 142,269,144 |
| Net assets | $769,755,970 |
| Class A | |
| Net assets applicable to outstanding shares | $288,606,224 |
| Shares of beneficial interest outstanding | 32,658,468 |
| Net asset value per share outstanding | $ 8.84 |
| Maximum sales charge (5.50% of offering price) | 0.51 |
| Maximum offering price per share outstanding | $ 9.35 |
| Investor Class | |
| Net assets applicable to outstanding shares | $ 2,895,886 |
| Shares of beneficial interest outstanding | 326,913 |
| Net asset value per share outstanding | $ 8.86 |
| Maximum sales charge (5.00% of offering price) | 0.47 |
| Maximum offering price per share outstanding | $ 9.33 |
| Class C | |
| Net assets applicable to outstanding shares | $149,820,816 |
| Shares of beneficial interest outstanding | 21,159,033 |
| Net asset value and offering price per share outstanding | $ 7.08 |
| Class I | |
| Net assets applicable to outstanding shares | $328,433,044 |
| Shares of beneficial interest outstanding | 34,791,221 |
| Net asset value and offering price per share outstanding | $ 9.44 |
The notes to the financial statements are an integral part of, and should be read in conjunction with, the financial statements.
| 14 | MainStay Cushing® MLP Premier Fund |
Statement of Operations for the year ended November 30, 2023
| Investment Income (Loss) |
| Income | |
| Dividends and distributions (Net of return of capital of $23,705,712) (a) | $17,817,550 |
| Dividends-affiliated | 453,938 |
| Total income | 18,271,488 |
| Expenses | |
| Manager (See Note 3) | 7,984,344 |
| Distribution/Service—Class A (See Note 3) | 675,185 |
| Distribution/Service—Investor Class (See Note 3) | 7,237 |
| Distribution/Service—Class C (See Note 3) | 1,450,332 |
| Transfer agent (See Note 3) | 702,923 |
| Professional fees | 178,464 |
| Registration | 81,875 |
| Shareholder communication | 81,111 |
| Custodian | 45,345 |
| Trustees | 19,847 |
| Franchise tax | (140,747) |
| Miscellaneous | 22,137 |
| Total expenses before waiver/reimbursement | 11,108,053 |
| Reimbursement from prior custodian(b) | (1,440) |
| Net expenses | 11,106,613 |
| Net investment income (loss) | 7,164,875 |
| Realized and Unrealized Gain (Loss) |
| Net realized gain (loss) on: | |
| Unaffiliated investment transactions, before income taxes | 49,857,979 |
| Foreign currency transactions | (29,766) |
| Net realized gain (loss) | 49,828,213 |
| Net change in unrealized appreciation (depreciation) on: | |
| Unaffiliated investments, before income taxes | 5,509,239 |
| Translation of other assets and liabilities in foreign currencies | 15,333 |
| Net change in unrealized appreciation (depreciation) | 5,524,572 |
| Net realized and unrealized gain (loss) | 55,352,785 |
| Net increase (decrease) in net assets resulting from operations | $62,517,660 |
| (a) | Dividends recorded net of foreign withholding taxes in the amount of $814,122. |
| (b) | Represents a refund for overbilling of custody fees. |
The notes to the financial statements are an integral part of, and should be read in conjunction with, the financial statements.
15
Statements of Changes in Net Assets
for the years ended November 30, 2023 and November 30, 2022
| | 2023 | 2022 |
| Increase (Decrease) in Net Assets |
| Operations: | | |
| Net investment income (loss) | $ 7,164,875 | $ 2,640,319 |
| Net realized gain (loss) | 49,828,213 | 77,920,041 |
| Net change in unrealized appreciation (depreciation) | 5,524,572 | 120,670,527 |
| Net increase (decrease) in net assets resulting from operations | 62,517,660 | 201,230,887 |
| Distributions to shareholders: | | |
| Class A | (3,945,475) | (18,246,740) |
| Investor Class | (41,794) | (195,443) |
| Class C | (2,591,427) | (13,164,913) |
| Class I | (4,221,269) | (20,943,651) |
| | (10,799,965) | (52,550,747) |
| Distributions to shareholders from return of capital: | | |
| Class A | (20,560,275) | (5,391,374) |
| Investor Class | (217,795) | (57,748) |
| Class C | (13,504,196) | (3,889,844) |
| Class I | (21,997,471) | (6,188,232) |
| | (56,279,737) | (15,527,198) |
| Total distributions to shareholders | (67,079,702) | (68,077,945) |
| Capital share transactions: | | |
| Net proceeds from sales of shares | 98,984,060 | 181,505,764 |
| Net asset value of shares issued to shareholders in reinvestment of distributions | 65,510,460 | 66,552,261 |
| Cost of shares redeemed | (164,478,309) | (223,005,465) |
| Increase (decrease) in net assets derived from capital share transactions | 16,211 | 25,052,560 |
| Net increase (decrease) in net assets | (4,545,831) | 158,205,502 |
| Net Assets |
| Beginning of year | 774,301,801 | 616,096,299 |
| End of year | $ 769,755,970 | $ 774,301,801 |
The notes to the financial statements are an integral part of, and should be read in conjunction with, the financial statements.
| 16 | MainStay Cushing® MLP Premier Fund |
Financial Highlights selected per share data and ratios
| | Year Ended November 30, |
| Class A | 2023 | | 2022 | | 2021 | | 2020 | | 2019 |
| Net asset value at beginning of year | $ 8.87 | | $ 7.28 | | $ 5.93 | | $ 9.09 | | $ 10.64 |
| Net investment income (loss) (a) | 0.09 | | 0.04 | | 0.03 | | (0.01) | | (0.09) |
| Net realized and unrealized gain (loss) | 0.64 | | 2.33 | | 2.22 | | (2.25) | | (0.52) |
| Total from investment operations | 0.73 | | 2.37 | | 2.25 | | (2.26) | | (0.61) |
| Less distributions: | | | | | | | | | |
| From net investment income | (0.13) | | (0.60) | | (0.06) | | — | | — |
| Return of capital | (0.63) | | (0.18) | | (0.84) | | (0.90) | | (0.94) |
| Total distributions | (0.76) | | (0.78) | | (0.90) | | (0.90) | | (0.94) |
| Net asset value at end of year | $ 8.84 | | $ 8.87 | | $ 7.28 | | $ 5.93 | | $ 9.09 |
| Total investment return (b) | 9.11% | | 34.02% | | 39.57% | | (24.48)% | | (6.40)% |
| Ratios (to average net assets)/Supplemental Data: | | | | | | | | | |
| Net investment income (loss) (including net deferred income tax benefit (expense)) | 1.04% | | 0.45% | | 0.48%(c) | | (0.13)%(c) | | (0.92)%(c) |
| Net investment income (loss) (excluding net deferred income tax benefit (expense)) | 1.02% | | 0.45% | | 0.50%(c) | | (0.11)%(c) | | (0.90)%(c) |
| Net expenses (including net deferred income tax benefit (expense)) (d)(e) | 1.49% | | 1.45% | | 1.61%(c) | | 1.60%(c) | | 1.54%(c) |
| Portfolio turnover rate | 20% | | 32% | | 28% | | 33% | | 50% |
| Net assets at end of year (in 000’s) | $ 288,606 | | $ 283,004 | | $ 209,634 | | $ 168,532 | | $ 249,399 |
| (a) | Per share data based on average shares outstanding during the year. |
| (b) | Total investment return is calculated exclusive of sales charges and assumes the reinvestment of dividends and distributions. For periods of less than one year, total return is not annualized. |
| (c) | Ratios including/excluding tax benefit (expense) includes applicable franchise tax expense for the period.
For the year ended November 30, 2021, the Fund accrued $(94,246) in franchise tax expense, of which $(32,777) is attributable to Class A.
For the year ended November 30, 2020, the Fund accrued $(111,509) in franchise tax expense, of which $(30,329) is attributable to Class A.
For the year ended November 30, 2019, the Fund accrued $(209,064) in franchise tax expense, of which $(48,618) is attributable to Class A. |
| (d) | The ratio of expenses excluding tax expense to average net assets before waiver and recoupment was 1.51%, 1.45%, 1.59%, 1.59%, and 1.53% for the fiscal years ended November 30, 2023, 2022, 2021, 2020, and 2019, respectively. The ratio of expenses excluding tax expense to average net assets after waiver and recoupment was 1.51%, 1.45%, 1.59%, 1.59%, and 1.53% for the fiscal years ended November 30, 2023, 2022, 2021, 2020, and 2019, respectively. |
| (e) | In addition to the fees and expenses which the Fund bears directly, it also indirectly bears a pro-rata share of the fees and expenses of the underlying funds in which it invests. Such indirect expenses are not included in the above expense ratios. |
The notes to the financial statements are an integral part of, and should be read in conjunction with, the financial statements.
17
Financial Highlights selected per share data and ratios
| | Year Ended November 30, |
| Investor Class | 2023 | | 2022 | | 2021 | | 2020 | | 2019 |
| Net asset value at beginning of year | $ 8.89 | | $ 7.29 | | $ 5.94 | | $ 9.10 | | $ 10.65 |
| Net investment income (loss) (a) | 0.09 | | 0.03 | | 0.03 | | (0.01) | | (0.09) |
| Net realized and unrealized gain (loss) | 0.64 | | 2.35 | | 2.22 | | (2.25) | | (0.52) |
| Total from investment operations | 0.73 | | 2.38 | | 2.25 | | (2.26) | | (0.61) |
| Less distributions: | | | | | | | | | |
| From net investment income | (0.13) | | (0.60) | | (0.07) | | — | | — |
| Return of capital | (0.63) | | (0.18) | | (0.83) | | (0.90) | | (0.94) |
| Total distributions | (0.76) | | (0.78) | | (0.90) | | (0.90) | | (0.94) |
| Net asset value at end of year | $ 8.86 | | $ 8.89 | | $ 7.29 | | $ 5.94 | | $ 9.10 |
| Total investment return (b) | 9.08% | | 34.12% | | 39.50% | | (24.45)% | | (6.04)% |
| Ratios (to average net assets)/Supplemental Data: | | | | | | | | | |
| Net investment income (loss) (including net deferred income tax benefit (expense)) | 1.03% | | 0.42% | | 0.40%(c) | | (0.18)%(c) | | (0.92)%(c) |
| Net investment income (loss) (excluding net deferred income tax benefit (expense)) | 1.01% | | 0.42% | | 0.42%(c) | | (0.17)%(c) | | (0.91)%(c) |
| Net expenses (including net deferred income tax benefit (expense)) (d)(e) | 1.48% | | 1.44% | | 1.64%(c) | | 1.64%(c) | | 1.54%(c) |
| Portfolio turnover rate | 20% | | 32% | | 28% | | 33% | | 50% |
| Net assets at end of year (in 000's) | $ 2,896 | | $ 3,011 | | $ 2,105 | | $ 1,783 | | $ 2,446 |
| (a) | Per share data based on average shares outstanding during the year. |
| (b) | Total investment return is calculated exclusive of sales charges and assumes the reinvestment of dividends and distributions. For periods of less than one year, total return is not annualized. |
| (c) | Ratios including/excluding tax benefit (expense) includes applicable franchise tax expense for the period.
For the year ended November 30, 2021, the Fund accrued $(94,246) in franchise tax expense, of which $(311) is attributable to Investor Class.
For the year ended November 30, 2020, The Fund accrued $(111,509) in franchise tax expense, of which $(313) is attributable to Investor Class.
For the year ended November 30, 2019, the Fund accrued $(209,064) in franchise tax expense, of which $(466) is attributable to Investor Class. |
| (d) | The ratio of expenses excluding tax expense to average net assets before waiver was 1.50%, 1.44%, 1.62%, 1.63%, and 1.53% for the fiscal years ended November 30, 2023, 2022, 2021, 2020, and 2019, respectively. The ratio of expenses excluding tax expense to average net assets after waiver was 1.50%, 1.44%, 1.62%, 1.63%, and 1.53% for the fiscal years ended November 30, 2023, 2022, 2021, 2020 and 2019, respectively. |
| (e) | In addition to the fees and expenses which the Fund bears directly, it also indirectly bears a pro-rata share of the fees and expenses of the underlying funds in which it invests. Such indirect expenses are not included in the above expense ratios. |
The notes to the financial statements are an integral part of, and should be read in conjunction with, the financial statements.
| 18 | MainStay Cushing® MLP Premier Fund |
Financial Highlights selected per share data and ratios
| | Year Ended November 30, |
| Class C | 2023 | | 2022 | | 2021 | | 2020 | | 2019 |
| Net asset value at beginning of year | $ 7.31 | | $ 6.16 | | $ 5.17 | | $ 8.14 | | $ 9.69 |
| Net investment income (loss) (a) | 0.02 | | (0.02) | | (0.03) | | (0.05) | | (0.15) |
| Net realized and unrealized gain (loss) | 0.51 | | 1.95 | | 1.92 | | (2.02) | | (0.46) |
| Total from investment operations | 0.53 | | 1.93 | | 1.89 | | (2.07) | | (0.61) |
| Less distributions: | | | | | | | | | |
| From net investment income | (0.13) | | (0.60) | | (0.08) | | — | | — |
| Return of capital | (0.63) | | (0.18) | | (0.82) | | (0.90) | | (0.94) |
| Total distributions | (0.76) | | (0.78) | | (0.90) | | (0.90) | | (0.94) |
| Net asset value at end of year | $ 7.08 | | $ 7.31 | | $ 6.16 | | $ 5.17 | | $ 8.14 |
| Total investment return (b) | 8.27% | | 33.01% | | 38.36% | | (25.03)% | | (7.06)% |
| Ratios (to average net assets)/Supplemental Data: | | | | | | | | | |
| Net investment income (loss) (including net deferred income tax benefit (expense)) | 0.28% | | (0.33)% | | (0.41)%(c) | | (0.87)%(c) | | (1.65)%(c) |
| Net investment income (loss) (excluding net deferred income tax benefit (expense)) | 0.26% | | (0.33)% | | (0.39)%(c) | | (0.85)%(c) | | (1.64)%(c) |
| Net expenses (including net deferred income tax benefit (expense)) (d)(e) | 2.23% | | 2.19% | | 2.39%(c) | | 2.39%(c) | | 2.29%(c) |
| Portfolio turnover rate | 20% | | 32% | | 28% | | 33% | | 50% |
| Net assets at end of year (in 000’s) | $ 149,821 | | $ 159,900 | | $ 140,379 | | $ 138,776 | | $ 272,423 |
| (a) | Per share data based on average shares outstanding during the year. |
| (b) | Total investment return is calculated exclusive of sales charges and assumes the reinvestment of dividends and distributions. For periods of less than one year, total return is not annualized. |
| (c) | Ratios including/excluding tax benefit (expense) includes applicable franchise tax expense for the period.
For the year ended November 30, 2021, the Fund accrued $(94,246) in franchise tax expense, of which $(22,323) is attributable to Class C.
For the year ended November 30, 2020, the Fund accrued $(111,509) in franchise tax expense, of which $(29,666) is attributable to Class C.
For the year ended November 30, 2019, the Fund accrued $(209,064) in franchise tax expense, of which $(60,864) is attributable to Class C. |
| (d) | The ratio of expenses excluding tax expense to average net assets before waiver and recoupment was 2.25%, 2.19%, 2.37%, 2.38%, and 2.28% for the fiscal years ended November 30, 2023, 2022, 2021, 2020 and 2019, respectively. The ratio of expenses excluding tax expense to average net assets after waiver and recoupment was 2.25%, 2.19%, 2.37%, 2.38%, and 2.28% for the fiscal years ended November 30, 2023, 2022, 2021, 2020 and 2019, respectively. |
| (e) | In addition to the fees and expenses which the Fund bears directly, it also indirectly bears a pro-rata share of the fees and expenses of the underlying funds in which it invests. Such indirect expenses are not included in the above expense ratios. |
The notes to the financial statements are an integral part of, and should be read in conjunction with, the financial statements.
19
Financial Highlights selected per share data and ratios
| | Year Ended November 30, |
| Class I | 2023 | | 2022 | | 2021 | | 2020 | | 2019 |
| Net asset value at beginning of year | $ 9.40 | | $ 7.66 | | $ 6.19 | | $ 9.41 | | $ 10.95 |
| Net investment income (loss) (a) | 0.11 | | 0.06 | | 0.05 | | 0.01 | | (0.07) |
| Net realized and unrealized gain (loss) | 0.69 | | 2.46 | | 2.32 | | (2.33) | | (0.53) |
| Total from investment operations | 0.80 | | 2.52 | | 2.37 | | (2.32) | | (0.60) |
| Less distributions: | | | | | | | | | |
| From net investment income | (0.13) | | (0.60) | | (0.07) | | — | | — |
| Return of capital | (0.63) | | (0.18) | | (0.83) | | (0.90) | | (0.94) |
| Total distributions | (0.76) | | (0.78) | | (0.90) | | (0.90) | | (0.94) |
| Net asset value at end of year | $ 9.44 | | $ 9.40 | | $ 7.66 | | $ 6.19 | | $ 9.41 |
| Total investment return (b) | 9.34% | | 34.30% | | 39.87% | | (24.27)% | | (6.12)% |
| Ratios (to average net assets)/Supplemental Data: | | | | | | | | | |
| Net investment income (loss) (including net deferred income tax benefit (expense)) | 1.28% | | 0.67% | | 0.72%(c) | | 0.19%(c) | | (0.65)%(c) |
| Net investment income (loss) (excluding net deferred income tax benefit (expense)) | 1.26% | | 0.67% | | 0.74%(c) | | 0.21%(c) | | (0.63)%(c) |
| Net expenses (including net deferred income tax benefit (expense)) (d)(e) | 1.24% | | 1.20% | | 1.36%(c) | | 1.35%(c) | | 1.29%(c) |
| Portfolio turnover rate | 20% | | 32% | | 28% | | 33% | | 50% |
| Net assets at end of year (in 000’s) | $ 328,433 | | $ 328,387 | | $ 263,978 | | $ 218,903 | | $ 461,177 |
| (a) | Per share data based on average shares outstanding during the year. |
| (b) | Total investment return is calculated exclusive of sales charges and assumes the reinvestment of dividends and distributions. Class I shares are not subject to sales charges. For periods of less than one year, total return is not annualized. |
| (c) | Ratios including/excluding tax benefit (expense) includes applicable franchise tax expense for the period.
For the year ended November 30, 2021, the Fund accrued $(94,246) in franchise tax expense, of which $(38,835) is attributable to Class I.
For the year ended November 30, 2020, the Fund accrued $(111,509) in franchise tax expense, of which $(51,201) is attributable to Class I.
For the year ended November 30, 2019, the Fund accrued $(209,064) in franchise tax expense, of which $(99,116) is attributable to Class I. |
| (d) | The ratio of expenses excluding tax expense to average net assets before waiver and recoupment was 1.26%, 1.20%, 1.34%, 1.34%, and 1.27% for the fiscal years ended November 30, 2023, 2022, 2021, 2020 and 2019, respectively. The ratio of expenses excluding tax expense to average net assets after waiver and recoupment was 1.26%, 1.20%, 1.34%, 1.34%, and 1.27% for the fiscal years ended November 30, 2023, 2022, 2021, 2020 and 2019, respectively. |
| (e) | In addition to the fees and expenses which the Fund bears directly, it also indirectly bears a pro-rata share of the fees and expenses of the underlying funds in which it invests. Such indirect expenses are not included in the above expense ratios. |
The notes to the financial statements are an integral part of, and should be read in conjunction with, the financial statements.
| 20 | MainStay Cushing® MLP Premier Fund |
Notes to Financial Statements
Note 1-Organization and Business
MainStay Funds Trust (the “Trust”) was organized as a Delaware statutory trust on April 28, 2009. The Trust is registered under the Investment Company Act of 1940, as amended (the “1940 Act”), as an open-end management investment company, and is comprised of thirty-seven funds (collectively referred to as the “Funds”). These financial statements and notes relate to the MainStay Cushing® MLP Premier Fund (the "Fund"), a “non-diversified” fund, as that term is defined in the 1940 Act, as interpreted or modified by regulatory authorities having jurisdiction, from time to time. The Fund is the successor to the Cushing® MLP Premier Fund (the “Predecessor Fund”), for which Cushing® Asset Management, LP, a Texas limited partnership and the Fund’s Subadvisor (as defined in Note 3(A)), served as investment adviser.
The following table lists the Fund's share classes that have been registered and commenced operations:
| Class | Commenced Operations |
| Class A | October 20, 2010 |
| Investor Class | July 11, 2014 |
| Class C | October 20, 2010 |
| Class I | October 20, 2010 |
Class A and Investor Class shares are offered at net asset value (“NAV”) per share plus an initial sales charge. No initial sales charge applies to investments of $1 million or more (and certain other qualified purchases) in Class A and Investor Class shares. However, a contingent deferred sales charge (“CDSC”) of 1.00% may be imposed on certain redemptions made within 18 months of the date of purchase on shares that were purchased without an initial sales charge. Class C shares are offered at NAV without an initial sales charge, although a 1.00% CDSC may be imposed on certain redemptions of such shares made within one year of the date of purchase of Class C shares. Class I shares are offered at NAV without a sales charge. Investor Class shares may convert automatically to Class A shares. In addition, depending upon eligibility, Class C shares convert to either Class A or Investor Class shares at the end of the calendar quarter eight years after the date they were purchased. Under certain circumstances and as may be permitted by the Trust’s multiple class plan pursuant to Rule 18f-3 under the 1940 Act, specified share classes of the Fund may be converted to one or more other share classes of the Fund as disclosed in the capital share transactions within these Notes. The classes of shares have the same voting (except for issues that relate solely to one class), dividend, liquidation and other rights, and the same terms and conditions, except that under distribution plans pursuant to Rule 12b-1 under the 1940 Act, as described in Note 3(B) below.
The Fund's investment objective is to seek current income and capital appreciation. In seeking current income, the Fund intends to pay current cash distributions to shareholders, regardless of the character of such distributions for tax or accounting purposes.
Note 2–Significant Accounting Policies
The Fund is an investment company and accordingly follows the investment company accounting and reporting guidance of the Financial Accounting Standards Board (“FASB”) Accounting Standards Codification Topic 946 Financial Services—Investment Companies. The Fund prepares its financial statements in accordance with generally accepted accounting principles (“GAAP”) in the United States of America and follows the significant accounting policies described below.
(A) Securities Valuation. Investments are usually valued as of the close of regular trading on the New York Stock Exchange (the "Exchange") (usually 4:00 p.m. Eastern time) on each day the Fund is open for business ("valuation date").
Pursuant to Rule 2a-5 under the 1940 Act, the Board of Trustees of the Trust (the "Board") has designated New York Life Investment Management LLC (“New York Life Investments” or the "Manager") as its Valuation Designee (the "Valuation Designee"). The Valuation Designee is responsible for performing fair valuations relating to all investments in the Fund’s portfolio for which market quotations are not readily available; periodically assessing and managing material valuation risks; establishing and applying fair value methodologies; testing fair valuation methodologies; evaluating and overseeing pricing services; ensuring appropriate segregation of valuation and portfolio management functions; providing quarterly, annual and prompt reporting to the Board, as appropriate; identifying potential conflicts of interest; and maintaining appropriate records. The Valuation Designee has established a valuation committee ("Valuation Committee") to assist in carrying out the Valuation Designee’s responsibilities and establish prices of securities for which market quotations are not readily available. The Fund's and the Valuation Designee's policies and procedures ("Valuation Procedures") govern the Valuation Designee’s selection and application of methodologies for determining and calculating the fair value of Fund investments. The Valuation Designee may value the Fund's portfolio securities for which market quotations are not readily available and other Fund assets utilizing inputs from pricing services and other third-party sources. The Valuation Committee meets (in person, via electronic mail or via teleconference) on an ad-hoc basis to determine fair valuations and on a quarterly basis to review fair value events with respect to certain securities for which market quotations are not readily available, including valuation risks and back-testing results, and to preview reports to the Board.
The Valuation Committee establishes prices of securities for which market quotations are not readily available based on such methodologies and measurements on a regular basis after considering information that is reasonably available and deemed relevant by the Valuation Committee. The Board shall oversee the Valuation Designee and review fair valuation materials on a prompt, quarterly and annual basis and approve proposed revisions to the Valuation Procedures.
Investments for which market quotations are not readily available are valued at fair value as determined in good faith pursuant to the Valuation Procedures. A market quotation is readily available only when that
Notes to Financial Statements (continued)
quotation is a quoted price (unadjusted) in active markets for identical investments that the Fund can access at the measurement date, provided that a quotation will not be readily available if it is not reliable. "Fair value" is defined as the price the Fund would reasonably expect to receive upon selling an asset or liability in an orderly transaction to an independent buyer in the principal or most advantageous market for the asset or liability. Fair value measurements are determined within a framework that establishes a three-tier hierarchy that maximizes the use of observable market data and minimizes the use of unobservable inputs to establish a classification of fair value measurements for disclosure purposes. "Inputs" refer broadly to the assumptions that market participants would use in pricing the asset or liability, including assumptions about risk, such as the risk inherent in a particular valuation technique used to measure fair value using a pricing model and/or the risk inherent in the inputs for the valuation technique. Inputs may be observable or unobservable. Observable inputs reflect the assumptions market participants would use in pricing the asset or liability based on market data obtained from sources independent of the Fund. Unobservable inputs reflect the Fund’s own assumptions about the assumptions market participants would use in pricing the asset or liability based on the information available. The inputs or methodology used for valuing assets or liabilities may not be an indication of the risks associated with investing in those assets or liabilities. The three-tier hierarchy of inputs is summarized below.
| • | Level 1—quoted prices (unadjusted) in active markets for an identical asset or liability |
| • | Level 2—other significant observable inputs (including quoted prices for a similar asset or liability in active markets, interest rates and yield curves, prepayment speeds, credit risk, etc.) |
| • | Level 3—significant unobservable inputs (including the Fund's own assumptions about the assumptions that market participants would use in measuring fair value of an asset or liability) |
The level of an asset or liability within the fair value hierarchy is based on the lowest level of an input, both individually and in the aggregate, that is significant to the fair value measurement. The aggregate value by input level of the Fund’s assets and liabilities as of November 30, 2023, is included at the end of the Portfolio of Investments.
The Fund may use third-party vendor evaluations, whose prices may be derived from one or more of the following standard inputs, among others:
| • Benchmark yields | • Reported trades |
| • Broker/dealer quotes | • Issuer spreads |
| • Two-sided markets | • Benchmark securities |
| • Bids/offers | • Reference data (corporate actions or material event notices) |
| • Industry and economic events | • Comparable bonds |
| • Monthly payment information | |
An asset or liability for which a market quotation is not readily available is valued by methods deemed reasonable in good faith by the Valuation Committee, following the Valuation Procedures to represent fair value.
Under these procedures, the Valuation Designee generally uses a market-based approach which may use related or comparable assets or liabilities, recent transactions, market multiples, book values and other relevant information. The Valuation Designee may also use an income-based valuation approach in which the anticipated future cash flows of the asset or liability are discounted to calculate fair value. Discounts may also be applied due to the nature and/or duration of any restrictions on the disposition of the asset or liability. Fair value represents a good faith approximation of the value of a security. Fair value determinations involve the consideration of a number of subjective factors, an analysis of applicable facts and circumstances and the exercise of judgment. As a result, it is possible that the fair value for a security determined in good faith in accordance with the Valuation Procedures may differ from valuations for the same security determined for other funds using their own valuation procedures. Although the Valuation Procedures are designed to value a security at the price the Fund may reasonably expect to receive upon the security's sale in an orderly transaction, there can be no assurance that any fair value determination thereunder would, in fact, approximate the amount that the Fund would actually realize upon the sale of the security or the price at which the security would trade if a reliable market price were readily available. During the year ended November 30, 2023, there were no material changes to the fair value methodologies.
Securities which may be valued in this manner include, but are not limited to: (i) a security for which trading has been halted or suspended or otherwise does not have a readily available market quotation on a given day; (ii) a debt security that has recently gone into default and for which there is not a current market quotation; (iii) a security of an issuer that has entered into a restructuring; (iv) a security that has been delisted from a national exchange; (v) a security subject to trading collars for which no or limited trading takes place; and (vi) a security whose principal market has been temporarily closed at a time when, under normal conditions, it would be open. Securities valued in this manner are generally categorized as Level 2 or 3 in the hierarchy.
Certain securities held by the Fund may principally trade in foreign markets. Events may occur between the time the foreign markets close and the time at which the Fund's NAVs are calculated. These events may include, but are not limited to, situations relating to a single issuer in a market sector, significant fluctuations in U.S. or foreign markets, natural disasters, armed conflicts, governmental actions or other developments not tied directly to the securities markets. Should the Valuation Designee conclude that such events may have affected the accuracy of the last price of such securities reported on the local foreign market, the Valuation Designee may, pursuant to the Valuation Procedures, adjust the value of the local price to reflect the estimated impact on the price of such securities as a result of such events. In this instance, securities are generally categorized as Level 3 in the hierarchy. Additionally, certain foreign equity securities are also fair valued whenever the movement of a particular index exceeds certain thresholds. In such cases, the securities are fair valued by applying factors provided by a third-party vendor in
| 22 | MainStay Cushing® MLP Premier Fund |
accordance with the Valuation Procedures and are generally categorized as Level 2 in the hierarchy.
Equity securities, rights and warrants, if applicable, are valued at the last quoted sales prices as of the close of regular trading on the relevant exchange on each valuation date. Securities that are not traded on the valuation date are valued at the mean of the last quoted bid and ask prices. Prices are normally taken from the principal market in which each security trades. These securities are generally categorized as Level 1 in the hierarchy.
Investments in mutual funds, including money market funds, are valued at their respective NAVs at the close of business each day on the valuation date. These securities are generally categorized as Level 1 in the hierarchy.
Temporary cash investments acquired in excess of 60 days to maturity at the time of purchase are valued using the latest bid prices or using valuations based on a matrix system (which considers such factors as security prices, yields, maturities and ratings), both as furnished by independent pricing services. Temporary cash investments that mature in 60 days or less at the time of purchase ("Short-Term Investments") are valued using the amortized cost method of valuation, unless the use of such method would be inappropriate. The amortized cost method involves valuing a security at its cost on the date of purchase and thereafter assuming a constant amortization to maturity of the difference between such cost and the value on maturity date. Amortized cost approximates the current fair value of a security. Securities valued using the amortized cost method are not valued using quoted prices in an active market and are generally categorized as Level 2 in the hierarchy.
The information above is not intended to reflect an exhaustive list of the methodologies that may be used to value portfolio investments. The Valuation Procedures permit the use of a variety of valuation methodologies in connection with valuing portfolio investments. The methodology used for a specific type of investment may vary based on the market data available or other considerations. The methodologies summarized above may not represent the specific means by which portfolio investments are valued on any particular business day.
(B) Income Taxes. The Fund's policy is to comply with the requirements of the Internal Revenue Code of 1986, as amended (the “Internal Revenue Code”), applicable to regulated investment companies and to distribute all of its taxable income to the shareholders of the Fund within the allowable time limits.
The Manager evaluates the Fund’s tax positions to determine if the tax positions taken meet the minimum recognition threshold in connection with accounting for uncertainties in income tax positions taken or expected to be taken for the purposes of measuring and recognizing tax liabilities in the financial statements. Recognition of tax benefits of an uncertain tax position is permitted only to the extent the position is “more likely than not” to be sustained assuming examination by taxing authorities. The Manager analyzed the Fund's tax positions taken on federal, state and local income tax returns for all open tax years (for up to
three tax years) and has concluded that no provisions for federal, state and local income tax are required in the Fund's financial statements. The Fund's federal, state and local income tax and federal excise tax returns for tax years for which the applicable statutes of limitations have not expired are subject to examination by the Internal Revenue Service and state and local departments of revenue.
(C) Foreign Taxes. The Fund may be subject to foreign taxes on income and other transaction-based taxes imposed by certain countries in which it invests. A portion of the taxes on gains on investments or currency purchases/repatriation may be reclaimable. The Fund will accrue such taxes and reclaims as applicable, based upon its current interpretation of tax rules and regulations that exist in the markets in which it invests.
The Fund may be subject to taxation on realized capital gains, repatriation proceeds and other transaction-based taxes imposed by certain countries in which it invests. The Fund will accrue such taxes as applicable based upon its current interpretation of tax rules and regulations that exist in the market in which it invests. Capital gains taxes relating to positions still held are reflected as a liability in the Statement of Assets and Liabilities, as well as an adjustment to the Fund's net unrealized appreciation (depreciation). Taxes related to capital gains realized, if any, are reflected as part of net realized gain (loss) in the Statement of Operations. Changes in tax liabilities related to capital gains taxes on unrealized investment gains, if any, are reflected as part of the change in net unrealized appreciation (depreciation) on investments in the Statement of Operations. Transaction-based charges are generally assessed as a percentage of the transaction amount.
(D) Dividends and Distributions to Shareholders. Dividends and distributions are recorded on the ex-dividend date. The Fund intends to declare and pay dividends from net investment income, if any, at least monthly and distributions from net realized capital and currency gains, if any, at least annually. Unless a shareholder elects otherwise, all dividends and distributions are reinvested at NAV in the same class of shares of the Fund. Dividends and distributions to shareholders are determined in accordance with federal income tax regulations and may differ from determinations using GAAP.
The actual tax characterization of the distributions made during the current year will not be determined until after the end of the fiscal year when the Fund can determine its earnings and profits and, therefore, may differ from the preliminary estimates.
(E) Security Transactions and Investment Income. The Fund records security transactions on the trade date. Realized gains and losses on security transactions are determined using the identified cost method. Dividend income is recognized on the ex-dividend date, net of any foreign tax withheld at the source, and interest income is accrued as earned using the effective interest rate method. Distributions from MLPs are generally recorded based on the characterization reported on the Fund’s IRS Form 1065, Schedule K-1, received from each MLP. The Fund records its pro rata share of the income and deductions, and capital gains
Notes to Financial Statements (continued)
and losses allocated from each MLP, as well as adjusting the cost basis of each MLP accordingly.
Distributions received from the Fund’s investments in energy related U.S. royalty trusts and Canadian royalty trusts and exploration and production companies (collectively, “Energy Trusts”) and MLPs generally are comprised of ordinary income, capital gains and return of capital from the Energy Trusts and MLPs. The Fund records investment income on the ex-date of the distributions. For financial statement purposes, the Fund uses return of capital and income estimates to allocate the dividend income received. The Fund estimates approximately 100% of the distributions received from Energy Trusts and MLPs to be from return of capital. Such estimates are based on historical information available from each Energy Trust, MLP and other industry sources. These estimates may subsequently be revised based on information received from Energy Trusts or MLPs after their tax reporting periods are concluded, as the actual character of these distributions is not known until after the Fund’s fiscal year end.
The Fund estimates the allocation of investment income and return of capital for the distributions received from Energy Trusts and MLPs within the Statements of Operations. Investment income and realized and unrealized gains and losses on investments of the Fund are allocated pro rata to the separate classes of shares based upon their relative net assets on the date the income is earned or realized and unrealized gains and losses are incurred.
(F) Expenses. Expenses of the Trust are allocated to the individual Funds in proportion to the net assets of the respective Funds when the expenses are incurred, except where direct allocations of expenses can be made. Expenses (other than transfer agent expenses and fees incurred under the shareholder services plans and/or the distribution plans further discussed in Note 3(B)) are allocated to separate classes of shares pro rata based upon their relative net assets on the date the expenses are incurred. The expenses borne by the Fund, including those of related parties to the Fund, are shown in the Statement of Operations.
Additionally, the Fund may invest in mutual funds, which are subject to management fees and other fees that may cause the costs of investing in mutual funds to be greater than the costs of owning the underlying securities directly. These indirect expenses of mutual funds are not included in the amounts shown as expenses in the Statement of Operations or in the expense ratios included in the Financial Highlights.
(G) Use of Estimates. In preparing financial statements in conformity with GAAP, the Manager makes estimates and assumptions that affect the reported amounts and disclosures in the financial statements. Actual results could differ from those estimates and assumptions.
(H) Concentration of Risk. Under normal market conditions, the Fund invests at least 80% of its assets (net assets plus any borrowings for investment purposes) in a portfolio of MLPs and MLP-related investments. Therefore the Fund may be subject to more risks than if it was more broadly diversified over numerous industries and sectors of the economy. General changes in market sentiment towards companies in
the sectors in which it invests may adversely affect the Fund, and the performance of such sectors may lag behind the broader market as a whole.
The Fund is also subject to MLP structure risk. Holders of MLP units are subject to certain risks inherent in the structure of MLPs, including (i) tax risks, (ii) the limited ability to elect or remove management or the general partner or managing member, (iii) limited voting rights, except with respect to extraordinary transactions, and (iv) conflicts of interest between the general partner or managing member and its affiliates, on the one hand, and the limited partners or members, on the other hand, including those arising from incentive distribution payments or corporate opportunities.
(I) Indemnifications. Under the Trust’s organizational documents, its officers and trustees are indemnified against certain liabilities that may arise out of performance of their duties to the Trust. Additionally, in the normal course of business, the Fund enters into contracts with third-party service providers that contain a variety of representations and warranties and that may provide general indemnifications. The Fund's maximum exposure under these arrangements is unknown, as this would involve future claims that may be made against the Fund that have not yet occurred. The Manager believes that the risk of loss in connection with these potential indemnification obligations is remote. However, there can be no assurance that material liabilities related to such obligations will not arise in the future, which could adversely impact the Fund.
Note 3–Fees and Related Party Transactions
(A) Manager and Subadvisor. New York Life Investments, a registered investment adviser and an indirect, wholly-owned subsidiary of New York Life Insurance Company ("New York Life"), serves as the Fund's Manager, pursuant to an Amended and Restated Management Agreement ("Management Agreement"). The Manager provides offices, conducts clerical, recordkeeping and bookkeeping services and keeps most of the financial and accounting records required to be maintained by the Fund. Except for the portion of salaries and expenses that are the responsibility of the Fund, the Manager pays the salaries and expenses of all personnel affiliated with the Fund and certain operational expenses of the Fund. The Fund reimburses New York Life Investments an amount equal to the portion of the compensation of the Chief Compliance Officer attributable to the Fund. Cushing® Asset Management, LP (“Cushing® Asset Management” or the “Subadvisor”), a registered investment adviser and a wholly-owned investment advisory subsidiary of Swank Capital, serves as the Subadvisor to the Fund and is responsible for the day-to-day portfolio management of the Fund. Pursuant to the terms of a Subadvisory Agreement (“Subadvisory Agreement”) between New York Life Investments and Cushing® Asset Management, New York Life Investments pays for the services of the Subadvisor.
Pursuant to the Management Agreement, the Fund pays the Manager a monthly fee for the services performed and the facilities furnished at an annual rate of the Fund’s average daily net assets as follows: 1.10% up
| 24 | MainStay Cushing® MLP Premier Fund |
to $3 billion and 1.05% over $3 billion. During the year ended November 30, 2023, the effective management fee rate was 1.10%.
During the year ended November 30, 2023, New York Life Investments earned fees from the Fund in the amount of $7,984,344 and paid the Subadvisor fees in the amount of $3,991,938. There were no waived fees and/or reimbursed expenses.
JPMorgan Chase Bank, N.A. ("JPMorgan") provides sub-administration and sub-accounting services to the Fund pursuant to an agreement with New York Life Investments. These services include calculating the daily NAVs of the Fund, maintaining the general ledger and sub-ledger accounts for the calculation of the Fund's NAVs, and assisting New York Life Investments in conducting various aspects of the Fund's administrative operations. For providing these services to the Fund, JPMorgan is compensated by New York Life Investments.
Pursuant to an agreement between the Trust and New York Life Investments, New York Life Investments is responsible for providing or procuring certain regulatory reporting services for the Fund. The Fund will reimburse New York Life Investments for the actual costs incurred by New York Life Investments in connection with providing or procuring these services for the Fund.
(B) Distribution and Service Fees. The Trust, on behalf of the Fund, has entered into a distribution agreement with NYLIFE Distributors LLC (the “Distributor”), an affiliate of New York Life Investments. The Fund has adopted distribution plans (the “Plans”) in accordance with the provisions of Rule 12b-1 under the 1940 Act.
Pursuant to the Class A and Investor Class Plans, the Distributor receives a monthly fee from the Class A and Investor Class shares at an annual rate of 0.25% of the average daily net assets of the Class A and Investor Class shares for distribution and/or service activities as designated by the Distributor. Pursuant to the Class C Plan, Class C shares pay the Distributor a monthly distribution fee at an annual rate of 0.75% of the average daily net assets of the Class C shares, along with a service fee at an annual rate of 0.25% of the average daily net assets of the Class C shares, for a total 12b-1 fee of 1.00%. Class I shares are not subject to a distribution and/or service fee.
The Plans provide that the distribution and service fees are payable to the Distributor regardless of the amounts actually expended by the Distributor for distribution of the Fund's shares and service activities.
(C) Sales Charges. The Fund was advised by the Distributor that the amount of initial sales charges retained on sales of Class A and Investor Class shares during the year ended November 30, 2023, were $59,898 and $376, respectively.
The Fund was also advised that the Distributor retained CDSCs on redemptions of Class A and Class C shares during the year ended November 30, 2023, of $2,302 and $9,901, respectively.
(D) Transfer, Dividend Disbursing and Shareholder Servicing Agent. NYLIM Service Company LLC, an affiliate of New York Life Investments, is the Fund's transfer, dividend disbursing and shareholder servicing agent pursuant to an agreement between NYLIM Service Company LLC and the Trust. NYLIM Service Company LLC has entered into an agreement with SS&C Global Investor & Distribution Solutions, Inc. ("SS&C"), pursuant to which SS&C performs certain transfer agent services on behalf of NYLIM Service Company LLC. New York Life Investments has contractually agreed to limit the transfer agency expenses charged to the Fund’s share classes to a maximum of 0.35% of that share class’s average daily net assets on an annual basis after deducting any applicable Fund or class-level expense reimbursement or small account fees. This agreement will remain in effect until March 31, 2023, and shall renew automatically for one-year terms unless New York Life Investments provides written notice of termination prior to the start of the next term or upon approval of the Board. During the year ended November 30, 2023, transfer agent expenses incurred by the Fund and any reimbursements, pursuant to the aforementioned Transfer Agency expense limitation agreement, were as follows:
| Class | Expense | Waived |
| Class A | $267,767 | $— |
| Investor Class | 2,566 | — |
| Class C | 127,830 | — |
| Class I | 304,760 | — |
(E) Small Account Fee. Shareholders with small accounts adversely impact the cost of providing transfer agency services. In an effort to reduce total transfer agency expenses, the Fund has implemented a small account fee on certain types of accounts. As described in the Fund's prospectus, certain shareholders with an account balance of less than $1,000 ($5,000 for Class A share accounts) are charged an annual per account fee of $20 (assessed semi-annually), the proceeds from which offset transfer agent fees as reflected in the Statement of Operations. This small account fee will not apply to certain types of accounts as described further in the Fund’s prospectus.
Note 4-Federal Income Tax
As of November 30, 2023, the cost and unrealized appreciation (depreciation) of the Fund’s investment portfolio, including other financial instruments, as determined on a federal income tax basis, were as follows:
| | Federal Tax
Cost | Gross
Unrealized
Appreciation | Gross
Unrealized
(Depreciation) | Net
Unrealized
Appreciation/
(Depreciation) |
| Investments in Securities | $454,315,548 | $337,177,501 | $(14,719,340) | $322,458,161 |
Notes to Financial Statements (continued)
As of November 30, 2023, the components of accumulated gain (loss) on a tax basis were as follows:
Ordinary
Income | Accumulated
Capital
and Other
Gain (Loss) | Other
Temporary
Differences | Unrealized
Appreciation
(Depreciation) | Total
Accumulated
Gain (Loss) |
| $— | $(180,044,261) | $(138,360) | $322,451,765 | $142,269,144 |
The difference between book-basis and tax-basis unrealized appreciation (depreciation) is primarily due to partnership adjustments.
The following table discloses the current year reclassifications between total distributable earnings (loss) and additional paid-in capital arising from permanent differences; net assets as of November 30, 2023 were not affected.
| | Total
Distributable
Earnings (Loss) | Additional
Paid-In
Capital |
| | $(2,211,721) | $2,211,721 |
The reclassifications for the Fund are primarily due to return of capital distributions.
As of November 30, 2023, for federal income tax purposes, capital loss carryforwards of $180,044,261, as shown in the table below, were available to the extent provided by the regulations to offset future realized gains of the Fund. Accordingly, no capital gains distributions are expected to be paid to shareholders until net gains have been realized in excess of such amounts.
Capital Loss
Available Through | Short-Term
Capital Loss
Amounts (000’s) | Long-Term
Capital Loss
Amounts (000’s) |
| Unlimited | $178,033 | $2,011 |
The Fund utilized $27,792,127 of capital loss carryforwards during the year ended November 30, 2023.
During the years ended November 30, 2023 and November 30, 2022, the tax character of distributions paid as reflected in the Statements of Changes in Net Assets was as follows:
| | 2023 | 2022 |
| Distributions paid from: | | |
| Ordinary Income | $10,799,965 | $52,550,747 |
| Return of Capital | 56,279,737 | 15,527,198 |
| Total | $67,079,702 | $68,077,945 |
Note 5–Custodian
JPMorgan is the custodian of cash and securities held by the Fund. Custodial fees are charged to the Fund based on the Fund's net assets and/or the market value of securities held by the Fund and the number of certain transactions incurred by the Fund.
Note 6–Line of Credit
The Fund and certain other funds managed by New York Life Investments maintain a line of credit with a syndicate of banks in order to secure a source of funds for temporary purposes to meet unanticipated or excessive redemption requests.
Effective July 25, 2023, under the credit agreement (the “Credit Agreement”), the aggregate commitment amount is $600,000,000 with an additional uncommitted amount of $100,000,000. The commitment fee is an annual rate of 0.15% of the average commitment amount payable quarterly, regardless of usage, to JPMorgan, who serves as the agent to the syndicate. The commitment fee is allocated among the Fund and certain other funds managed by New York Life Investments based upon their respective net assets and other factors. Interest on any revolving credit loan is charged based upon the Federal Funds Rate, Daily Simple Secured Overnight Financing Rate ("SOFR") + 0.10%, or the Overnight Bank Funding Rate, whichever is higher. The Credit Agreement expires on July 23, 2024, although the Fund, certain other funds managed by New York Life Investments and the syndicate of banks may renew the Credit Agreement for an additional year on the same or different terms or enter into a credit agreement with a different syndicate of banks. Prior to July 25, 2023, the aggregate commitment amount and the commitment fee were the same as those under the current Credit Agreement. During the year ended November 30, 2023, there were no borrowings made or outstanding with respect to the Fund under the Credit Agreement.
Note 7–Interfund Lending Program
Pursuant to an exemptive order issued by the SEC, the Fund, along with certain other funds managed by New York Life Investments, may participate in an interfund lending program. The interfund lending program provides an alternative credit facility that permits the Fund and certain other funds managed by New York Life Investments to lend or borrow money for temporary purposes directly to or from one another, subject to the conditions of the exemptive order. During the year ended November 30, 2023, there were no interfund loans made or outstanding with respect to the Fund.
Note 8–Purchases and Sales of Securities (in 000’s)
During the year ended November 30, 2023, purchases and sales of securities, other than short-term securities, were $146,405 and $154,664, respectively.
Note 9–Capital Share Transactions
Transactions in capital shares for the years ended November 30, 2023 and November 30, 2022, were as follows:
| 26 | MainStay Cushing® MLP Premier Fund |
| Class A | Shares | Amount |
| Year ended November 30, 2023: | | |
| Shares sold | 4,852,459 | $ 40,227,707 |
| Shares issued to shareholders in reinvestment of distributions | 2,826,323 | 23,515,832 |
| Shares redeemed | (7,064,834) | (59,059,381) |
| Net increase (decrease) in shares outstanding before conversion | 613,948 | 4,684,158 |
| Shares converted into Class A (See Note 1) | 216,705 | 1,806,765 |
| Shares converted from Class A (See Note 1) | (70,159) | (606,438) |
| Net increase (decrease) | 760,494 | $ 5,884,485 |
| Year ended November 30, 2022: | | |
| Shares sold | 8,807,029 | $ 71,843,787 |
| Shares issued to shareholders in reinvestment of distributions | 2,780,383 | 22,691,743 |
| Shares redeemed | (8,662,302) | (70,108,405) |
| Net increase (decrease) in shares outstanding before conversion | 2,925,110 | 24,427,125 |
| Shares converted into Class A (See Note 1) | 170,723 | 1,413,711 |
| Shares converted from Class A (See Note 1) | (8,076) | (62,220) |
| Net increase (decrease) | 3,087,757 | $ 25,778,616 |
| |
| Investor Class | Shares | Amount |
| Year ended November 30, 2023: | | |
| Shares sold | 33,381 | $ 273,658 |
| Shares issued to shareholders in reinvestment of distributions | 29,549 | 246,201 |
| Shares redeemed | (35,992) | (300,533) |
| Net increase (decrease) in shares outstanding before conversion | 26,938 | 219,326 |
| Shares converted into Investor Class (See Note 1) | 22,208 | 187,861 |
| Shares converted from Investor Class (See Note 1) | (60,886) | (506,793) |
| Net increase (decrease) | (11,740) | $ (99,606) |
| Year ended November 30, 2022: | | |
| Shares sold | 190,437 | $ 1,579,531 |
| Shares issued to shareholders in reinvestment of distributions | 29,000 | 237,621 |
| Shares redeemed | (55,628) | (455,466) |
| Net increase (decrease) in shares outstanding before conversion | 163,809 | 1,361,686 |
| Shares converted into Investor Class (See Note 1) | 4,202 | 34,026 |
| Shares converted from Investor Class (See Note 1) | (118,144) | (984,443) |
| Net increase (decrease) | 49,867 | $ 411,269 |
| |
| Class C | Shares | Amount |
| Year ended November 30, 2023: | | |
| Shares sold | 2,437,852 | $ 16,547,273 |
| Shares issued to shareholders in reinvestment of distributions | 2,309,773 | 15,600,255 |
| Shares redeemed | (5,255,948) | (35,590,435) |
| Net increase (decrease) in shares outstanding before conversion | (508,323) | (3,442,907) |
| Shares converted from Class C (See Note 1) | (198,982) | (1,354,505) |
| Net increase (decrease) | (707,305) | $ (4,797,412) |
| Year ended November 30, 2022: | | |
| Shares sold | 3,337,346 | $ 22,776,877 |
| Shares issued to shareholders in reinvestment of distributions | 2,434,067 | 16,554,902 |
| Shares redeemed | (6,635,287) | (44,689,885) |
| Net increase (decrease) in shares outstanding before conversion | (863,874) | (5,358,106) |
| Shares converted from Class C (See Note 1) | (69,519) | (478,310) |
| Net increase (decrease) | (933,393) | $ (5,836,416) |
| |
| Class I | Shares | Amount |
| Year ended November 30, 2023: | | |
| Shares sold | 4,727,385 | $ 41,935,422 |
| Shares issued to shareholders in reinvestment of distributions | 2,952,321 | 26,148,172 |
| Shares redeemed | (7,864,350) | (69,527,960) |
| Net increase (decrease) in shares outstanding before conversion | (184,644) | (1,444,366) |
| Shares converted into Class I (See Note 1) | 65,842 | 606,338 |
| Shares converted from Class I (See Note 1) | (14,958) | (133,228) |
| Net increase (decrease) | (133,760) | $ (971,256) |
| Year ended November 30, 2022: | | |
| Shares sold | 9,948,919 | $ 85,305,569 |
| Shares issued to shareholders in reinvestment of distributions | 3,142,031 | 27,067,995 |
| Shares redeemed | (12,647,194) | (107,751,709) |
| Net increase (decrease) in shares outstanding before conversion | 443,756 | 4,621,855 |
| Shares converted into Class I (See Note 1) | 10,524 | 89,174 |
| Shares converted from Class I (See Note 1) | (1,377) | (11,938) |
| Net increase (decrease) | 452,903 | $ 4,699,091 |
Note 10–Other Matters
As of the date of this report, the Fund faces a heightened level of risk associated with current uncertainty, volatility and state of economies, financial markets, rising interest rates, and labor and health conditions around the world. Events such as war, acts of terrorism, recessions, rapid inflation, the imposition of international sanctions, earthquakes, hurricanes, epidemics and pandemics and other unforeseen natural or human disasters may have broad adverse social, political and economic effects on the global economy, which could negatively impact the value of the Fund's investments. Developments that disrupt global economies and
Notes to Financial Statements (continued)
financial markets may magnify factors that affect the Fund's performance.
Note 11–Subsequent Events
In connection with the preparation of the financial statements of the Fund as of and for the year ended November 30, 2023, events and transactions subsequent to November 30, 2023, through the date the financial statements were issued have been evaluated by the Manager for possible adjustment and/or disclosure. No subsequent events requiring financial statement adjustment or disclosure have been identified.
| 28 | MainStay Cushing® MLP Premier Fund |
Report of Independent Registered Public Accounting Firm
To the Shareholders of the Fund and Board of Trustees
MainStay Funds Trust:
Opinion on the Financial Statements
We have audited the accompanying statement of assets and liabilities of MainStay Cushing® MLP Premier Fund (the Fund), one of the funds constituting MainStay Funds Trust, including the portfolio of investments, as of November 30, 2023, the related statement of operations for the year then ended, the statements of changes in net assets for each of the years in the two-year period then ended, and the related notes (collectively, the financial statements) and the financial highlights for each of the years in the five-year period then ended. In our opinion, the financial statements and financial highlights present fairly, in all material respects, the financial position of the Fund as of November 30, 2023, the results of its operations for the year then ended, the changes in its net assets for each of the years in the two-year period then ended, and the financial highlights for each of the years in the five-year period then ended, in conformity with U.S. generally accepted accounting principles.
Basis for Opinion
These financial statements and financial highlights are the responsibility of the Fund's management. Our responsibility is to express an opinion on these financial statements and financial highlights based on our audits. We are a public accounting firm registered with the Public Company Accounting Oversight Board (United States) (PCAOB) and are required to be independent with respect to the Fund in accordance with the U.S. federal securities laws and the applicable rules and regulations of the Securities and Exchange Commission and the PCAOB.
We conducted our audits in accordance with the standards of the PCAOB. Those standards require that we plan and perform the audit to obtain reasonable assurance about whether the financial statements and financial highlights are free of material misstatement, whether due to error or fraud. Our audits included performing procedures to assess the risks of material misstatement of the financial statements and financial highlights, whether due to error or fraud, and performing procedures that respond to those risks. Such procedures included examining, on a test basis, evidence regarding the amounts and disclosures in the financial statements and financial highlights. Such procedures also included confirmation of securities owned as of November 30, 2023, by correspondence with the custodian, transfer agent, and brokers; when replies were not received from brokers, we performed other auditing procedures. Our audits also included evaluating the accounting principles used and significant estimates made by management, as well as evaluating the overall presentation of the financial statements and financial highlights. We believe that our audits provide a reasonable basis for our opinion.

We have served as the auditor of one or more New York Life Investment Management investment companies since 2003.
Philadelphia, Pennsylvania
January 24, 2024
Federal Income Tax Information
(Unaudited)
The Fund is required under the Internal Revenue Code to advise shareholders in a written statement as to the federal tax status of dividends paid by the Fund during such fiscal years.
In February 2024, shareholders will receive an IRS Form 1099-DIV or substitute Form 1099, which will show the federal tax status of the distributions received by shareholders in calendar year 2023. The amounts that will be reported on such 1099-DIV or substitute Form 1099 will be the amounts you are to use on your federal income tax return and will differ from the amounts which we must report for the Fund's fiscal year ended November 30, 2023.
Proxy Voting Policies and Procedures and Proxy Voting Record
The Fund is required to file with the SEC its proxy voting records for the 12-month period ending June 30 on Form N-PX. A description of the policies and procedures that are used to vote proxies relating to portfolio securities of the Fund is available free of charge upon request by calling 800-624-6782 or visiting the SEC’s website at www.sec.gov. The most recent Form N-PX or proxy voting record is available free of charge upon request by calling 800-624-6782; visiting newyorklifeinvestments.com; or visiting the SEC’s website at www.sec.gov.
Shareholder Reports and Quarterly Portfolio Disclosure
The Fund is required to file its complete schedule of portfolio holdings with the SEC 60 days after its first and third fiscal quarter on Form N-PORT. The Fund's holdings report is available free of charge upon request by calling New York Life Investments at 800-624-6782.
| 30 | MainStay Cushing® MLP Premier Fund |
Board of Trustees and Officers (Unaudited)
The Trustees and officers of the Fund are listed below. The Board oversees the MainStay Group of Funds (which consists of MainStay Funds and MainStay Funds Trust), MainStay VP Funds Trust, MainStay MacKay DefinedTerm Municipal Opportunities Fund, MainStay CBRE Global Infrastructure Megatrends Term Fund, the Manager and the Subadvisors, and elects the officers of the Funds who are responsible for the day-to-day operations of the Fund. Information pertaining to the Trustees and officers is set forth below. Each Trustee serves until his or her successor is elected and qualified or until his or her resignation, death or
removal. Under the Board’s retirement policy, unless an exception is made, a Trustee must tender his or her resignation by the end of the calendar year during which he or she reaches the age of 75. Officers are elected annually by the Board. The business address of each Trustee and officer listed below is 51 Madison Avenue, New York, New York 10010. A majority of the Trustees are not “interested persons” (as defined by the 1940 Act and rules adopted by the SEC thereunder) of the Fund (“Independent Trustees”).
| | Name and
Year of Birth | Term of Office,
Position(s) Held and
Length of Service | Principal Occupation(s)
During Past Five Years | Number of
Portfolios in
Fund Complex
Overseen by
Trustee | Other Directorships
Held by Trustee |
| | | | | | |
| | Naïm Abou-Jaoudé*
1966 | MainStay Funds: Trustee since 2023
MainStay Funds Trust:
Trustee since 2023 | Chief Executive Officer of New York Life Investment Management LLC (since 2023). Chief Executive Officer of Candriam (an affiliate of New York Life Investment Management LLC) (2007 to 2023). | 81 | MainStay VP Funds Trust:
Trustee since 2023 (31 portfolios);
MainStay MacKay DefinedTerm Municipal Opportunities Fund: Trustee
since 2023;
MainStay CBRE Global Infrastructure Megatrends Term Fund: Trustee
since 2023; and
New York Life Investment Management International (Chair) since 2015 |
| * | This Trustee is considered to be an “interested person” of the MainStay Group of Funds, MainStay VP Funds Trust, MainStay CBRE Global Infrastructure Megatrends Term Fund and MainStay MacKay DefinedTerm Municipal Opportunities Fund, within the meaning of the 1940 Act because of his affiliation with New York Life Investment Management LLC and Candriam, as described in detail above in the column entitled “Principal Occupation(s) During Past Five Years.” |
| | |
Board of Trustees and Officers (Unaudited) (continued)
| | Name and
Year of Birth | Term of Office,
Position(s) Held and
Length of Service | Principal Occupation(s)
During Past Five Years | Number of
Portfolios in
Fund Complex
Overseen by
Trustee | Other Directorships
Held by Trustee |
| | | | | | |
| | David H. Chow
1957 | MainStay Funds: Trustee since January 2016, Advisory Board Member (June 2015 to December 2015);MainStay Funds Trust:
Trustee since January 2016, Advisory Board Member (June 2015 to December 2015) | Founder and CEO, DanCourt Management, LLC (since 1999) | 81 | MainStay VP Funds Trust: Trustee since January 2016, Advisory Board Member (June 2015 to December 2015) (31 portfolios);
MainStay MacKay DefinedTerm Municipal Opportunities Fund: Trustee since January 2016, Advisory Board Member (June 2015 to December 2015);
MainStay CBRE Global Infrastructure Megatrends Term Fund: Trustee since 2021;
VanEck Vectors Group of Exchange-Traded Funds: Trustee since 2006 and Independent Chairman of the Board of Trustees from 2008 to 2022 (57 portfolios); and
Berea College of Kentucky: Trustee since 2009, Chair of the Investment Committee since 2018 |
| | Karen Hammond
1956 | MainStay Funds: Trustee since December 2021, Advisory Board Member (June 2021 to December 2021);MainStay Funds Trust:
Trustee since December 2021, Advisory Board Member (June 2021 to December 2021)
| Retired, Managing Director, Devonshire Investors (2007 to 2013); Senior Vice President, Fidelity Management & Research Co. (2005 to 2007); Senior Vice President and Corporate Treasurer, FMR Corp. (2003 to 2005); Chief Operating Officer, Fidelity Investments Japan (2001 to 2003) | 81 | MainStay VP Funds Trust: Trustee since December 2021, Advisory Board Member (June 2021 to December 2021) (31 portfolios);
MainStay MacKay DefinedTerm Municipal Opportunities Fund: Trustee since December 2021, Advisory Board Member (June 2021 to December 2021);
MainStay CBRE Global Infrastructure Megatrends Term Fund: Trustee since December 2021, Advisory Board Member (June 2021 to December 2021);
Two Harbors Investment Corp.: Director since 2018;
Rhode Island State Investment Commission: Member since 2017; and
Blue Cross Blue Shield of Rhode Island: Director since 2019 |
| | Susan B. Kerley
1951 | MainStay Funds: Chair since January 2017 and Trustee since 2007;MainStay Funds Trust:
Chair since January 2017 and Trustee since 1990*** | President, Strategic Management Advisors LLC (since 1990) | 81 | MainStay VP Funds Trust: Chair since January 2017 and Trustee since 2007 (31 portfolios)**;
MainStay MacKay DefinedTerm Municipal Opportunities Fund: Chair since January 2017 and Trustee since 2011;
MainStay CBRE Global Infrastructure Megatrends Term Fund: Trustee since June 2021; and
Legg Mason Partners Funds: Trustee since 1991 (45 portfolios) |
| 32 | MainStay Cushing® MLP Premier Fund |
| | Name and
Year of Birth | Term of Office,
Position(s) Held and
Length of Service | Principal Occupation(s)
During Past Five Years | Number of
Portfolios in
Fund Complex
Overseen by
Trustee | Other Directorships
Held by Trustee |
| | | | | | |
| | Alan R. Latshaw
1951 | MainStay Funds: Trusteesince 2006;MainStay Funds Trust:
Trustee since 2007*** | Retired; Partner, Ernst & Young LLP (2002 to 2003); Partner, Arthur Andersen LLP (1989 to 2002); Consultant to the MainStay Funds Audit and Compliance Committee (2004 to 2006) | 81 | MainStay VP Funds Trust: Trustee since 2007 (31 portfolios)**;
MainStay MacKay DefinedTerm Municipal Opportunities Fund: Trustee since 2011; and
MainStay CBRE Global Infrastructure Megatrends Term Fund: Trustee since June 2021 |
| | Jacques P. Perold
1958 | MainStay Funds: Trustee since January 2016, Advisory Board Member (June 2015to December 2015);MainStay Funds Trust:
Trustee since January 2016, Advisory Board Member (June 2015 to December 2015) | Founder and Chief Executive Officer, CapShift Advisors LLC (since 2018); President, Fidelity Management & Research Company (2009 to 2014); President and Chief Investment Officer, Geode Capital Management, LLC (2001 to 2009) | 81 | MainStay VP Funds Trust: Trustee since January 2016, Advisory Board Member (June 2015 to December 2015) (31 portfolios);
MainStay MacKay DefinedTerm Municipal Opportunities Fund: Trustee since January 2016, Advisory Board Member (June 2015 to December 2015);
MainStay CBRE Global Infrastructure Megatrends Term Fund: Trustee since June 2021;
Allstate Corporation: Director since 2015; and
MSCI Inc.: Director since 2017 |
| | Richard S. Trutanic
1952 | MainStay Funds: Trustee since 1994;MainStay Funds Trust:
Trustee since 2007*** | Chairman and Chief Executive Officer, Somerset & Company (financial advisory firm) (since 2004); Managing Director, The Carlyle Group (private investment firm) (2002 to 2004); Senior Managing Director, Partner and Board Member, Groupe Arnault S.A. (private investment firm) (1999 to 2002) | 81 | MainStay VP Funds Trust: Trustee since 2007 (31 portfolios)**;
MainStay MacKay DefinedTerm Municipal Opportunities Fund: Trustee since 2011; and
MainStay CBRE Global Infrastructure Megatrends Term Fund: Trustee since June 2021 |
| ** | Includes prior service as a Director of MainStay VP Series Fund, Inc., the predecessor to MainStay VP Funds Trust. |
| *** | Includes prior service as a Director/Trustee of certain predecessor entities to MainStay Funds Trust. |
Board of Trustees and Officers (Unaudited) (continued)
| | Name and
Year of Birth | Position(s) Held and
Length of Service | Principal Occupation(s)
During Past Five Years | |
| | | | | |
| | Kirk C. Lehneis
1974 | President, MainStay Funds, MainStay Funds Trust (since 2017) | Chief Operating Officer and Senior Managing Director (since 2016), New York Life Investment Management LLC and New York Life Investment Management Holdings LLC; Member of the Board of Managers (since 2017) and Senior Managing Director (since 2018), NYLIFE Distributors LLC; Chairman of the Board and Senior Managing Director, NYLIM Service Company LLC (since 2017); Trustee, President and Principal Executive Officer of IndexIQ Trust, IndexIQ ETF Trust and IndexIQ Active ETF Trust (since 2018); President, MainStay CBRE Global Infrastructure Megatrends Term Fund (since 2021), MainStay MacKay DefinedTerm Municipal Opportunities Fund and MainStay VP Funds Trust (since 2017)**; Senior Managing Director, Global Product Development (2015 to 2016); Managing Director, Product Development (2010 to 2015), New York Life Investment Management LLC | |
| | Jack R. Benintende
1964 | Treasurer and Principal Financial and Accounting Officer, MainStay Funds (since 2007), MainStay Funds Trust (since 2009) | Managing Director, New York Life Investment Management LLC (since 2007); Treasurer and Principal Financial and Accounting Officer, MainStay CBRE Global Infrastructure Megatrends Term Fund (since 2021), MainStay MacKay DefinedTerm Municipal Opportunities Fund (since 2011) and MainStay VP Funds Trust (since 2007)**; and Assistant Treasurer, New York Life Investment Management Holdings LLC (2008 to 2012) | |
| | J. Kevin Gao
1967 | Secretary and Chief Legal Officer, MainStay Funds and MainStay Funds Trust (since 2010) | Managing Director and Associate General Counsel, New York Life Investment Management LLC (since 2010); Secretary and Chief Legal Officer, MainStay CBRE Global Infrastructure Megatrends Term Fund (since 2021), MainStay MacKay DefinedTerm Municipal Opportunities Fund (since 2011) and MainStay VP Funds Trust (since 2010)** | |
| | Kevin M. Gleason
1967 | Vice President and Chief Compliance Officer, MainStay Funds and MainStay Funds Trust (since June 2022) | Vice President and Chief Compliance Officer, IndexIQ Trust, IndexIQ ETF Trust and Index IQ Active ETF Trust (since June 2022); Vice President and Chief Compliance Officer, MainStay CBRE Global Infrastructure Megatrends Term Fund, MainStay VP Funds Trust and MainStay MacKay DefinedTerm Municipal Opportunities Fund (since June 2022); Senior Vice President, Voya Investment Management and Chief Compliance Officer, Voya Family of Funds (2012 to 2022) | |
| | Scott T. Harrington
1959 | Vice President— Administration, MainStay Funds (since 2005), MainStay Funds Trust (since 2009) | Managing Director, New York Life Investment Management LLC (including predecessor advisory organizations) (since 2000); Member of the Board of Directors, New York Life Trust Company (since 2009); Vice President—Administration, MainStay CBRE Global Infrastructure Megatrends Term Fund (since 2021), MainStay MacKay DefinedTerm Municipal Opportunities Fund (since 2011) and MainStay VP Funds Trust (since 2005)** | |
| * | The officers listed above are considered to be “interested persons” of the MainStay Group of Funds, MainStay VP Funds Trust, MainStay CBRE Global Infrastructure Megatrends Term Fund and MainStay MacKay DefinedTerm Municipal Opportunities Fund within the meaning of the 1940 Act because of their affiliation with the MainStay Group of Funds, New York Life Insurance Company and/or its affiliates, including New York Life Investment Management LLC, New York Life Insurance Company, NYLIM Service Company LLC, NYLIFE Securities LLC and/or NYLIFE Distributors LLC, as described in detail in the column captioned “Principal Occupation(s) During Past Five Years.” Officers are elected annually by the Board. |
| ** | Includes prior service as an Officer of MainStay VP Series Fund, Inc., the predecessor to MainStay VP Funds Trust. |
Officers of the Trust (Who are not Trustees)*
| 34 | MainStay Cushing® MLP Premier Fund |
Equity
U.S. Equity
MainStay Epoch U.S. Equity Yield Fund
MainStay Fiera SMID Growth Fund
MainStay PineStone U.S. Equity Fund
MainStay S&P 500 Index Fund
MainStay Winslow Large Cap Growth Fund
MainStay WMC Enduring Capital Fund
MainStay WMC Growth Fund
MainStay WMC Small Companies Fund
MainStay WMC Value Fund
International Equity
MainStay Epoch International Choice Fund
MainStay PineStone International Equity Fund
MainStay WMC International Research Equity Fund
Emerging Markets Equity
MainStay Candriam Emerging Markets Equity Fund
Global Equity
MainStay Epoch Capital Growth Fund
MainStay Epoch Global Equity Yield Fund
MainStay PineStone Global Equity Fund
Fixed Income
Taxable Income
MainStay Candriam Emerging Markets Debt Fund
MainStay Floating Rate Fund
MainStay MacKay High Yield Corporate Bond Fund
MainStay MacKay Short Duration High Yield Fund
MainStay MacKay Strategic Bond Fund
MainStay MacKay Total Return Bond Fund
MainStay MacKay U.S. Infrastructure Bond Fund
MainStay Short Term Bond Fund
Tax-Exempt Income
MainStay MacKay California Tax Free Opportunities Fund1
MainStay MacKay High Yield Municipal Bond Fund
MainStay MacKay New York Tax Free Opportunities Fund2
MainStay MacKay Short Term Municipal Fund
MainStay MacKay Strategic Municipal Allocation Fund
MainStay MacKay Tax Free Bond Fund
Money Market
MainStay Money Market Fund
Mixed Asset
MainStay Balanced Fund
MainStay Income Builder Fund
MainStay MacKay Convertible Fund
Speciality
MainStay CBRE Global Infrastructure Fund
MainStay CBRE Real Estate Fund
MainStay Cushing MLP Premier Fund
Asset Allocation
MainStay Conservative Allocation Fund
MainStay Conservative ETF Allocation Fund
MainStay Defensive ETF Allocation Fund
MainStay Equity Allocation Fund
MainStay Equity ETF Allocation Fund
MainStay ESG Multi-Asset Allocation Fund
MainStay Growth Allocation Fund
MainStay Growth ETF Allocation Fund
MainStay Moderate Allocation Fund
MainStay Moderate ETF Allocation Fund
Manager
New York Life Investment Management LLC
New York, New York
Subadvisors
Candriam3
Strassen, Luxembourg
CBRE Investment Management Listed Real Assets LLC
Radnor, Pennsylvania
Cushing Asset Management, LP
Dallas, Texas
Epoch Investment Partners, Inc.
New York, New York
Fiera Capital Inc.
New York, New York
IndexIQ Advisors LLC3
New York, New York
MacKay Shields LLC3
New York, New York
NYL Investors LLC3
New York, New York
PineStone Asset Management Inc.
Montreal, Québec
Wellington Management Company LLP
Boston, Massachusetts
Winslow Capital Management, LLC
Minneapolis, Minnesota
Legal Counsel
Dechert LLP
Washington, District of Columbia
Independent Registered Public Accounting Firm
KPMG LLP
Philadelphia, Pennsylvania
Distributor
NYLIFE Distributors LLC3
Jersey City, New Jersey
Custodian
JPMorgan Chase Bank, N.A.
New York, New York
1.
This Fund is registered for sale in AZ, CA, NV, OR, TX, UT, WA and MI (Class A and Class I shares only), and CO, FL, GA, HI, ID, MA, MD, NH, NJ and NY (Class I shares only).
| 2. | This Fund is registered for sale in CA, CT, DE, FL, MA, NJ, NY and VT. |
| 3. | An affiliate of New York Life Investment Management LLC. |
Not part of the Annual Report
For more information
800-624-6782
newyorklifeinvestments.com
“New York Life Investments” is both a service mark, and the common trade name, of certain investment advisors affiliated with New York Life Insurance Company. The MainStay Funds® are managed by New York Life Investment Management LLC and distributed by NYLIFE Distributors LLC, 30 Hudson Street, Jersey City, NJ 07302, a wholly owned subsidiary of New York Life Insurance Company. NYLIFE Distributors LLC is a Member FINRA/SIPC.
©2023 NYLIFE Distributors LLC. All rights reserved.
| 5013537MS152-23 | MSCU11-01/24 |
(NYLIM) NL258
Item 2. Code of Ethics.
As of the end of the period covered by this report, the Registrant has adopted a code of ethics (the “Code”) that applies to the Registrant’s principal executive officer (“PEO”) and principal financial officer (“PFO”). During the period covered by this report, no amendments were made to the provisions of the Code. The Registrant did not grant any waivers, including implicit waivers, from any provisions of the Code to the PEO or PFO during the period covered by this report. A copy of the Code is filed herewith.
| Item 3. | Audit Committee Financial Expert. |
The Board of Trustees has determined that the Registrant has three “audit committee financial experts” serving on its Audit Committee. The Audit Committee financial experts are Alan R. Latshaw, Karen Hammond, and Susan B. Kerley. Mr. Latshaw, Ms. Hammond and Ms. Kerley are “independent” (as defined by Item 3 of Form N-CSR).
| Item 4. | Principal Accountant Fees and Services. |
The aggregate fees billed for the fiscal year ended November 30, 2023 for professional services rendered by KPMG LLP (“KPMG”) for the audit of the Registrant’s annual financial statements or services that are normally provided by KPMG in connection with statutory and regulatory filings or engagements for that fiscal year were $126,990.
The aggregate fees billed for the fiscal year ended November 30, 2022 for professional services rendered by KPMG for the audit of the Registrant’s annual financial statements or services that are normally provided by KPMG in connection with statutory and regulatory filings or engagements for that fiscal year were $122,200.
The aggregate fees billed for assurance and related services by KPMG that are reasonably related to the performance of the audit of the Registrant’s financial statements and are not reported under paragraph (a) of this Item were: (i) $0 for the fiscal year ended November 30, 2023; and (ii) $0 for the fiscal year ended November 30, 2022.
The aggregate fees billed for professional services rendered by KPMG for tax compliance, tax advice, and tax planning were: (i) $0 during the fiscal year ended November 30, 2023; and (ii) $0 during the fiscal year ended November 30, 2022. These services primarily included preparation of federal, state and local income tax returns and excise tax returns, as well as services relating to excise tax distribution requirements.
(d) All Other Fees
The aggregate fees billed for products and services provided by KPMG, other than the services reported in paragraphs (a) through (c) of this Item were: (i) $0 during the fiscal year ended November 30, 2023; and (ii) $0 during the fiscal year ended November 30, 2022.
| (e) | Pre-Approval Policies and Procedures |
| | (1) | The Registrant’s Audit Committee has adopted pre-approval policies and procedures (the “Procedures”) to govern the Committee’s pre-approval of (i) all audit services and permissible non-audit services to be provided to the Registrant by its independent accountant, and (ii) all permissible non-audit services to be provided by such independent accountant to the Registrant’s investment adviser and to any entity controlling, controlled by or under common control with the investment adviser that provides ongoing services to the Registrant (collectively, the “Service Affiliates”) if the services directly relate to the Registrant’s operations and financial reporting. In accordance with the Procedures, the Audit Committee is responsible for the engagement of the independent accountant to certify the Registrant’s financial statements for each fiscal year. With respect to the pre-approval of non-audit services provided to the Registrant and its Service Affiliates, the Procedures provide that the Audit Committee may annually pre-approve a list of the types of services that may be provided to the Registrant or its Service Affiliates, or the Audit Committee may pre-approve such services on a project-by-project basis as they arise. Unless a type of service has received general pre-approval, it will require specific pre-approval by the Audit Committee if it is to be provided by the independent accountant. The Procedures also permit the Audit Committee to delegate authority to one or more of its members to pre-approve any proposed non-audit services that have not been previously pre-approved by the Audit Committee, subject to the ratification by the full Audit Committee no later than its next scheduled meeting. To date, the Audit Committee has not delegated such authority. |
| | (2) | With respect to the services described in paragraphs (b) through (d) of this Item 4, no amount was approved by the Audit Committee pursuant to paragraph (c)(7)(i)(C) of Rule 2-01 of Regulation S-X. |
(f) There were no hours expended on KPMG’s engagement to audit the Registrant’s financial statements for the most recent fiscal year was attributable to work performed by persons other than KPMG’s full-time, permanent employees.
(g) All non-audit fees billed by KPMG for services rendered to the Registrant for the fiscal years ended November 30, 2023 and November 30, 2022 are disclosed in 4(b)-(d) above.
The aggregate non-audit fees billed by KPMG for services rendered to the Registrant’s investment adviser (not including any sub-adviser whose role is primarily portfolio management and is subcontracted with or overseen by another investment adviser), and any entity controlling, controlled by, or under common control with the adviser that provides ongoing services to the Registrant were approximately: (i) $222,674 for the fiscal year ended November 30, 2023; and (ii) $223,159 for the fiscal year ended November 30, 2022.
(h) The Registrant’s Audit Committee has determined that the non-audit services rendered by KPMG for the fiscal year ended November 30, 2023 to the Registrant’s investment adviser and any entity controlling, controlled by, or under common control with the Registrant’s investment adviser that provides ongoing services to the Registrant that were not required to be pre-approved by the Audit
Committee because they did not relate directly to the operations and financial reporting of the registrant were compatible with maintaining the respective independence of KPMG during the relevant time period.
| Item 5. | Audit Committee of Listed Registrants. |
Not applicable.
The Schedule of Investments is included as part of Item 1 of this report.
| Item 7. | Disclosure of Proxy Voting Policies and Procedures for Closed-End Management Investment Companies. |
Not applicable.
| Item 8. | Portfolio Managers of Closed-End Management Investment Companies. |
Not applicable.
| Item 9. | Purchases of Equity Securities by Closed-End Management Investment Company and Affiliated Purchasers. |
Not applicable.
| Item 10. | Submission of Matters to a Vote of Security Holders. |
Since the Registrant’s last response to this Item, there have been no material changes to the procedures by which shareholders may recommend nominees to the Registrant’s Board of Trustees.
| Item 11. | Controls and Procedures. |
(a) Based on an evaluation of the Registrant’s Disclosure Controls and Procedures (as defined in Rule 30a-3(c) under the Investment Company Act of 1940) (the “Disclosure Controls”), as of a date within 90 days prior to the filing date (the “Filing Date”) of this Form N-CSR (the “Report”), the Registrant’s principal executive officer and principal financial officer have concluded that the Disclosure Controls are reasonably designed to ensure that information required to be disclosed by the Registrant in the Report is recorded, processed, summarized and reported by the Filing Date, including ensuring that information required to be disclosed in the Report is accumulated and communicated to the Registrant’s management, including the Registrant’s principal executive officer and principal financial officer, as appropriate to allow timely decisions regarding required disclosure.
(b) There were no changes in the Registrant’s internal control over financial reporting (as defined in Rule 30a-3(d)) under the Investment Company Act of 1940 that occurred during the period covered by this report that has materially affected, or is reasonably likely to materially affect, the Registrant’s internal control over financial reporting.
| Item 12. | Disclosure of Securities Lending Activities for Closed-End Management Investment Companies. |
Not applicable.
SIGNATURES
Pursuant to the requirements of the Securities Exchange Act of 1934 and the Investment Company Act of 1940, the Registrant has duly caused this Report to be signed on its behalf by the undersigned, thereunto duly authorized.
MAINSTAY FUNDS TRUST
| | |
| By: | | /s/ Kirk C. Lehneis |
| | Kirk C. Lehneis |
| | President and Principal Executive Officer |
| |
| Date: | | February 2, 2024 |
Pursuant to the requirements of the Securities Exchange Act of 1934 and the Investment Company Act of 1940, this Report has been signed below by the following persons on behalf of the Registrant and in the capacities and on the dates indicated.
| | |
| By: | | /s/ Kirk C. Lehneis |
| | Kirk C. Lehneis |
| | President and Principal Executive Officer |
| |
| Date: | | February 2, 2024 |
| |
| By: | | /s/ Jack R. Benintende |
| | Jack R. Benintende |
| | Treasurer and Principal Financial and Accounting Officer |
| |
| Date: | | February 2, 2024 |