UNITED STATES
SECURITIES AND EXCHANGE COMMISSION
Washington, D.C. 20549
Form N-CSR
CERTIFIED SHAREHOLDER REPORT OF REGISTERED MANAGEMENT
INVESTMENT COMPANIES
Investment Company Act File Number 811-22321
MAINSTAY FUNDS TRUST
(Exact name of Registrant as specified in charter)
51 Madison Avenue, New York, NY 10010
(Address of principal executive offices) (Zip code)
J. Kevin Gao, Esq.
30 Hudson Street
Jersey City, New Jersey 07302
(Name and address of agent for service)
Registrant’s telephone number, including area code: (212) 576-7000
Date of fiscal year end: October 31
Date of reporting period: October 31, 2022
FORM N-CSR
| Item 1. | Reports to Stockholders. |
MainStay Balanced Fund
Message from the President and Annual Report
October 31, 2022
Sign up for e-delivery of your shareholder reports. For full details on e-delivery, including who can participate and what you can receive via e-delivery,
please log in to newyorklifeinvestments.com/accounts.
| Not FDIC/NCUA Insured | Not a Deposit | May Lose Value | No Bank Guarantee | Not Insured by Any Government Agency |
This page intentionally left blank
Message from the President
A series of economic and geopolitical challenges undermined equity and fixed-income markets during the 12-month reporting period ended October 31, 2022. Stocks and bonds alike trended lower in the face of sharply rising interest rates, increasing inflationary pressures, slowing economic growth and Russia’s invasion of Ukraine.
The reporting period began on a mixed note, with concerns about the spreading Omicron variant of the COVID-19 virus and increasingly hawkish statements from the U.S. Federal Reserve (the “Fed”) regarding mounting inflation, countered by bullish sentiment stemming from U.S. economic growth and strong corporate earnings. In January 2022, markets turned decisively negative as comments from the Fed raised the likelihood of rate hikes as early as March, and Russia issued increasingly aggressive threats toward Ukraine. The onset of Russia’s invasion in February exacerbated global inflationary pressures while increasing investor uncertainty. Domestic supply shortages, international trade imbalances and rising inflation caused GDP (gross domestic product) to contract in the first and second quarters of the year, although employment and consumer spending proved resilient. Prices for petroleum surged to multi-year highs, while many key agricultural chemicals and industrial metals climbed as well. Accelerating inflationary forces prompted the Fed to implement its most aggressive interest rate increases since the 1980s with a series of five sharp rate hikes, raising the federal funds rate from a range of 0.00% to 0.25% in March to 3.00% to 3.25% in September, with additional rate hikes expected before the end of the year. International central banks generally followed suit, raising rates by varying degrees in efforts to curb local inflation, although most increases remained significantly more modest than those in the United States. Relatively high U.S. interest rates and risk-averse international sentiment pushed U.S. dollar values higher compared to most other currencies, with the ensuing negative impact on global prices for food, fuel and other key, U.S.-dollar-denominated products.
The effects of these interrelated challenges were felt throughout U.S. and international financial markets. The S&P 500® Index, a widely regarded benchmark of U.S. market performance, declined by more than 14% during the reporting period. Although the energy sector generated strong gains, bolstered by elevated oil and gas prices, most other industry areas recorded losses. The more cyclical and growth-oriented sectors of consumer discretionary, real estate and information technology delivered the
weakest returns, while the traditionally defensive and value-oriented consumer staples, utilities and health care sectors outperformed. International stocks lagged compared to their U.S. counterparts, with some emerging markets, such as China, suffering particularly steep losses. A few markets, however, including Brazil, Mexico and the United Arab Emirates, ended the reporting period with little change. Fixed-income markets saw bond prices broadly decline as yields rose along with interest rates. Short-term yields rose faster than long-term yields, producing a yield curve inversion from July through the end of the reporting period, with long-term rates remaining below short-term rates. While floating-rate instruments, which feature variable interest rates that allow investors to benefit from a rising rate environment, provided a degree of insulation from inflation-driven trends, they were not immune to the market’s widespread declines.
While the Fed acknowledges the costs of rising rates in terms of weaker GDP growth and unsettled financial markets over the short term, its primary focus continues to be the longer-term economic impact of inflation. With the latest figures as of the date of this report showing that inflation remains above 8%, versus a target rate of just 2%, the Fed clearly has a distance yet to go, making further rate increases and market volatility more likely in the coming months. The question remains as to whether the Fed and other central banks will manage a so-called “soft landing,” curbing inflation while avoiding a persistent economic slowdown. If they prove successful, we expect that favorable inflation trends and increasingly attractive valuations in both equity and bond markets should eventually translate into sustainable improvements in the investment environment.
Whatever actions the Fed takes and however financial markets react, as a MainStay investor, you can depend on us to continue providing the insight, expertise and service that have long defined New York Life Investments. Thank you for trusting us to help you meet your investment needs.
Sincerely,
Kirk C. Lehneis
President
The opinions expressed are as of the date of this report and are subject to change. There is no guarantee that any forecast made will come to pass. This material does not constitute investment advice and is not intended as an endorsement of any specific investment. Past performance is no guarantee of future results.
Not part of the Annual Report
Investors should refer to the Fund’s Summary Prospectus and/or Prospectus and consider the Fund’s investment objectives, strategies, risks, charges and expenses carefully before investing. The Summary Prospectus and/or Prospectus contain this and other information about the Fund. You may obtain copies of the Fund’s Summary Prospectus, Prospectus and Statement of Additional Information, which includes information about the MainStay Funds Trust's Trustees, free of charge, upon request, by calling toll-free 800-624-6782, by writing to NYLIFE Distributors LLC, Attn: MainStay Marketing Department, 30 Hudson Street, Jersey City, NJ 07302 or by sending an e-mail to MainStayShareholderServices@nylim.com. These documents are also available via the MainStay Funds’ website at newyorklifeinvestments.com. Please read the Fund’s Summary Prospectus and/or Prospectus carefully before investing.
Investment and Performance Comparison (Unaudited)
Performance data quoted represents past performance. Past performance is no guarantee of future results. Because of market volatility and other factors, current performance may be lower or higher than the figures shown. Investment return and principal value will fluctuate, and as a result, when shares are redeemed, they may be worth more or less than their original cost. The graph below depicts the historical performance of Class I shares of the Fund. Performance will vary from class to class based on differences in class-specific expenses and sales charges. For performance information current to the most recent month-end, please call 800-624-6782 or visit newyorklifeinvestments.com.
The performance table and graph do not reflect the deduction of taxes that a shareholder would pay on distributions or Fund share redemptions. Total returns reflect maximum applicable sales charges as indicated in the table below, if any, changes in share price, and reinvestment of dividend and capital gain distributions. The graph assumes the initial investment amount shown below and reflects the deduction of all sales charges that would have applied for the period of investment. Performance figures may reflect certain fee waivers and/or expense limitations, without which total returns may have been lower. For more information on share classes and current fee waivers and/or expense limitations (if any), please refer to the Notes to Financial Statements.

| Average Annual Total Returns for the Year-Ended October 31, 2022 |
| Class | Sales Charge | | Inception
Date1 | One
Year | Five
Years | Ten Years
or Since
Inception | Gross
Expense
Ratio2 |
| Class A Shares3 | Maximum 3% Initial Sales Charge | With sales charges | 1/2/2004 | -8.19% | 3.98% | 6.57% | 1.07% |
| | | Excluding sales charges | | -5.35 | 5.16 | 7.18 | 1.07 |
| Investor Class Shares4 | Maximum 2.5% Initial Sales Charge | With sales charges | 2/28/2008 | -7.98 | 3.73 | 6.36 | 1.36 |
| | | Excluding sales charges | | -5.62 | 4.91 | 6.96 | 1.36 |
| Class B Shares5 | Maximum 5% CDSC | With sales charges | 1/2/2004 | -10.09 | 3.84 | 6.16 | 2.11 |
| | if Redeemed Within the First Six Years of Purchase | Excluding sales charges | | -6.30 | 4.13 | 6.16 | 2.11 |
| Class C Shares | Maximum 1% CDSC | With sales charges | 12/30/2002 | -7.06 | 4.13 | 6.17 | 2.11 |
| | if Redeemed Within One Year of Purchase | Excluding sales charges | | -6.30 | 4.13 | 6.17 | 2.11 |
| Class I Shares | No Sales Charge | | 5/1/1989 | -5.09 | 5.43 | 7.45 | 0.83 |
| Class R1 Shares | No Sales Charge | | 1/2/2004 | -5.23 | 5.32 | 7.33 | 0.93 |
| Class R2 Shares | No Sales Charge | | 1/2/2004 | -5.45 | 5.06 | 7.08 | 1.18 |
| Class R3 Shares | No Sales Charge | | 4/28/2006 | -5.72 | 4.79 | 6.80 | 1.43 |
| Class R6 Shares | No Sales Charge | | 12/15/2017 | -5.04 | N/A | 5.16 | 0.73 |
| 1. | Effective March 5, 2021, the Fund replaced the subadvisor to the equity portion of the Fund and modified its principal investment strategies. The past performance in the graph and table prior to that date reflects the Fund’s prior subadvisor and principal investment strategies for the equity portion of the Fund. |
| 2. | The gross expense ratios presented reflect the Fund’s “Total Annual Fund Operating Expenses” from the most recent Prospectus, as supplemented, and may differ from other expense ratios disclosed in this report. |
| 3. | Prior to November 4, 2019, the maximum initial sales charge was 5.5%, which is reflected in the applicable average annual total return figures shown. |
| 4. | Prior to June 30, 2020, the maximum initial sales charge was 3%, which is reflected in the applicable average annual total return figures shown. |
| 5. | Class B shares are closed to all new purchases as well as additional investments by existing Class B shareholders. |
The footnotes on the next page are an integral part of the table and graph and should be carefully read in conjunction with them.
| Benchmark Performance* | One
Year | Five
Years | Ten
Years |
| Russell 1000® Value Index1 | -7.00% | 7.21% | 10.30% |
| Bloomberg U.S. Intermediate Government/Credit Bond Index2 | -10.03 | 0.30 | 0.94 |
| Balanced Composite Index3 | -7.86 | 4.82 | 6.75 |
| Russell Midcap® Value Index4 | -10.18 | 6.49 | 10.42 |
| Morningstar Allocation-50% to 70% Equity Category Average5 | -14.40 | 4.25 | 6.01 |
| * | Returns for indices reflect no deductions for fees, expenses or taxes, except for foreign withholding taxes where applicable. Results assume reinvestment of all dividends and capital gains. An investment cannot be made directly in an index. |
| 1. | The Fund has selected the Russell 1000® Value Index as its primary benchmark. The Russell 1000® Value Index measures the performance of the large-cap value segment of the U.S. equity universe. It includes those Russell 1000® Index companies with lower price-to-book ratios and lower expected growth values. |
| 2. | The Fund has selected the Bloomberg U.S. Intermediate Government/Credit Bond Index as a secondary benchmark. The Bloomberg U.S. Intermediate Government/Credit Bond Index measures the performance of U.S. dollar denominated U.S. treasuries, government related and investment grade U.S. corporate securities that have a remaining maturity of greater than one year and less than ten years. |
| 3. | The Fund has selected the Balanced Composite Index as an additional benchmark. The Balanced Composite Index consists of the Russell Midcap® Value Index and the Bloomberg U.S. Intermediate Government/Credit Bond Index weighted 60% and 40%, respectively. |
| 4. | The Russell Midcap® Value Index has been replaced as the Fund’s primary broad-based securities market index for comparison purposes. The Russell Midcap® Value Index measures the performance of the mid-cap value segment of the U.S. equity universe. It includes those Russell Midcap® Index companies with lower price-to-book ratios and lower forecasted growth values. |
| 5. | The Morningstar Allocation – 50% to 70% Equity Category Average is representative of funds that seek to provide both income and capital appreciation by investing in multiple asset classes, including stocks, bonds, and cash. These portfolios are dominated by domestic holdings and have equity exposures between 50% and 70%. Results are based on average total returns of similar funds with all dividends and capital gain distributions reinvested. |
The footnotes on the preceding page are an integral part of the table and graph and should be carefully read in conjunction with them.
Cost in Dollars of a $1,000 Investment in MainStay Balanced Fund (Unaudited)
The example below is intended to describe the fees and expenses borne by shareholders during the six-month period from May 1, 2022 to October 31, 2022, and the impact of those costs on your investment.
Example
As a shareholder of the Fund you incur two types of costs: (1) transaction costs, including exchange fees and sales charges (loads) on purchases (as applicable), and (2) ongoing costs, including management fees, distribution and/or service (12b-1) fees and other Fund expenses (as applicable). This example is intended to help you understand your ongoing costs (in dollars) of investing in the Fund and to compare these costs with the ongoing costs of investing in other mutual funds. The example is based on an investment of $1,000 made at the beginning of the six-month period and held for the entire period from May 1, 2022 to October 31, 2022.
This example illustrates your Fund’s ongoing costs in two ways:
Actual Expenses
The second and third data columns in the table below provide information about actual account values and actual expenses. You may use the information in these columns, together with the amount you invested, to estimate the expenses that you paid during the six months ended October 31, 2022. Simply divide your account value by $1,000 (for example, an
$8,600 account value divided by $1,000 = 8.6), then multiply the result by the number under the heading entitled “Expenses Paid During Period” to estimate the expenses you paid on your account during this period.
Hypothetical Example for Comparison Purposes
The fourth and fifth data columns in the table below provide information about hypothetical account values and hypothetical expenses based on the Fund’s actual expense ratio and an assumed rate of return of 5% per year before expenses, which is not the Fund’s actual return. The hypothetical account values and expenses may not be used to estimate the actual ending account balances or expenses you paid for the six-month period shown. You may use this information to compare the ongoing costs of investing in the Fund with the ongoing costs of investing in other mutual funds. To do so, compare this 5% hypothetical example with the 5% hypothetical examples that appear in the shareholder reports of the other mutual funds.
Please note that the expenses shown in the table are meant to highlight your ongoing costs only and do not reflect any transactional costs, such as exchange fees or sales charges (loads). Therefore, the fourth and fifth data columns of the table are useful in comparing ongoing costs only and will not help you determine the relative total costs of owning different funds. In addition, if these transactional costs were included, your costs would have been higher.
| Share Class | Beginning
Account
Value
5/1/22 | Ending Account
Value (Based
on Actual
Returns and
Expenses)
10/31/22 | Expenses
Paid
During
Period1 | Ending Account
Value (Based
on Hypothetical
5% Annualized
Return and
Actual Expenses)
10/31/22 | Expenses
Paid
During
Period1 | Net Expense
Ratio
During
Period2 |
| Class A Shares | $1,000.00 | $981.30 | $ 5.29 | $1,019.86 | $ 5.40 | 1.06% |
| Investor Class Shares | $1,000.00 | $979.60 | $ 6.59 | $1,018.55 | $ 6.72 | 1.32% |
| Class B Shares | $1,000.00 | $976.20 | $10.31 | $1,014.77 | $10.51 | 2.07% |
| Class C Shares | $1,000.00 | $976.20 | $10.31 | $1,014.77 | $10.51 | 2.07% |
| Class I Shares | $1,000.00 | $982.70 | $ 4.05 | $1,021.12 | $ 4.13 | 0.81% |
| Class R1 Shares | $1,000.00 | $981.80 | $ 4.55 | $1,020.62 | $ 4.63 | 0.91% |
| Class R2 Shares | $1,000.00 | $980.80 | $ 5.79 | $1,019.36 | $ 5.90 | 1.16% |
| Class R3 Shares | $1,000.00 | $979.40 | $ 7.03 | $1,018.10 | $ 7.17 | 1.41% |
| Class R6 Shares | $1,000.00 | $982.80 | $ 3.65 | $1,021.53 | $ 3.72 | 0.73% |
| 1. | Expenses are equal to the Fund’s annualized expense ratio of each class multiplied by the average account value over the period, divided by 365 and multiplied by 184 (to reflect the six-month period). The table above represents the actual expenses incurred during the six-month period. In addition to the fees and expenses which the Fund bears directly, it also indirectly bears a pro rata share of the fees and expenses of the underlying funds in which it invests. Such indirect expenses are not included in the above-reported expense figures. |
| 2. | Expenses are equal to the Fund's annualized expense ratio to reflect the six-month period. |
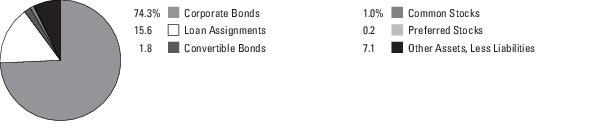
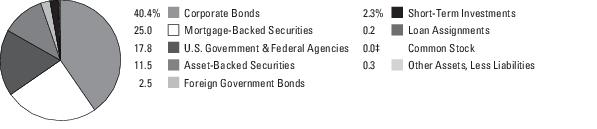
Portfolio Composition as of October 31, 2022 (Unaudited)
See Portfolio of Investments beginning on page 12 for specific holdings within these categories. The Fund's holdings are subject to change.
Top Ten Holdings and/or Issuers Held as of October 31, 2022 (excluding short-term investments) (Unaudited)
| 1. | U.S. Treasury Notes, 0.125%-4.25%, due 6/30/23–8/15/32 |
| 2. | iShares Intermediate Government/Credit Bond ETF |
| 3. | Vanguard Intermediate-Term Treasury ETF |
| 4. | JPMorgan Chase & Co. |
| 5. | Pfizer, Inc. |
| 6. | Morgan Stanley |
| 7. | ConocoPhillips |
| 8. | Cisco Systems, Inc. |
| 9. | Elevance Health, Inc. |
| 10. | Alphabet, Inc. |
Portfolio Management Discussion and Analysis (Unaudited)
Questions answered by portfolio managers Jae S. Yoon, CFA, and Jonathan Swaney of New York Life Investment Management LLC, the Fund’s Manager; Kenneth Sommer and AJ Rzad, CFA, of NYL Investors LLC, the Fund’s fixed-income Subadvisor; and portfolio manager Adam H. Illfelder, CFA, of Wellington Management Company LLP, the Fund’s equity Subadvisor.
How did MainStay Balanced Fund perform relative to its benchmarks and peer group during the 12 months ended October 31, 2022?
For the 12 months ended October 31, 2022, Class I shares of MainStay Balanced Fund returned −5.09%, outperforming the −7.00% return of the Fund’s primary benchmark, the Russell 1000® Value Index (the "Index"); the −10.03% return of the Bloomberg U.S. Intermediate Government/Credit Bond Index, which is the Fund’s secondary benchmark; and the −7.86% return of the Balanced Composite Index, which is an additional benchmark of the Fund. During the reporting period, the Fund also outperformed the −10.18% return of the Russell Midcap® Value Index, which was the Fund's former primary benchmark. For the 12 months ended October 31, 2022, Class I shares of the Fund outperformed the −14.40% return of the Morningstar Allocation –50% to 70% Equity Category Average.1
What factors affected relative performance in the equity portion of the Fund during the reporting period?
The equity portion of the Fund outperformed the Russell 1000® Value Index primarily due to strong security selection in the financials and health care sectors, partially offset by weaker selection in materials. Sector allocation, a result of our bottom-up stock selection process, weighed on relative results. Negative allocation effect was driven by the Fund’s underweight position in energy and overweight exposure to information technology, although this was partially offset by the positive impact of underweight allocation to communication services.
During the reporting period, which sectors were the strongest positive contributors to the relative performance of the equity portion of the Fund and which sectors were particularly weak?
During the reporting period, the financials, health care and industrials sectors provided the strongest positive contributions to the Fund’s relative performance. (Contributions take weightings and total returns into account.) Over the same period, the energy sector most notably detracted.
During the reporting period, which individual stocks made the strongest positive contributions to absolute performance in the equity portion of the Fund and which stocks detracted the most?
The individual stocks that made the strongest contributions to the equity portion of the Fund’s absolute performance included oil and natural gas company ConocoPhillips and pharmaceutical company Eli Lilly. Shares of ConocoPhillips rose strongly as the oil and gas
sector benefited from higher oil prices driven by a supply/demand imbalance. The company also announced an increase in its planned 2022 return of capital from $5 billion to $15 billion. Eli Lilly shares rose as the company reported notable drug development pipeline achievements, including U.S. Food and Drug Administration approval for Tirzepatide, a type 2 diabetes treatment. In addition, a competitor reported breakthrough trial results for an Alzheimer’s drug, fueling optimism over Eli Lilly’s drug Donanemab, which also targets removing the amyloid beta protein to slow disease progression. Both positions were still held at the end of the reporting period.
The holdings that detracted most significantly from absolute performance were U.S.-based social technology company Meta Platforms and Google’s parent company Alphabet. Meta Platforms' shares fell after management released disappointing quarterly results, as slowing growth in the e-commerce market weighed on Meta Platforms' advertising revenues. More recently, investors grew increasingly concerned about the company’s plans for continued high capital investments in the Metaverse. Shares of Alphabet declined due to concerns over lower ad spending, along with a sell-off in the broader information technology sector on recession fears. Toward the end of the reporting period, the company reported weaker-than-expected third-quarter revenue, reinforcing these concerns. The Fund continues to hold a position in Alphabet, but exited its position in Meta Platforms.
What were some of the largest purchases and sales in the equity portion of the Fund during the reporting period?
During the reporting period, the Fund initiated positions in oil & gas exploration & production company Coterra Energy and semiconductor company Qualcomm. We favor Coterra’s 50/50 balance of oil and gas businesses given the more defensive profile it provides, even in more challenged markets. The company was created from the 2021 strategic merger between Cabot Oil & Gas and Cimarex Energy; these two companies have good cost structures, strong balance sheets and an attractive reserves life. In terms of valuation, the company’s stock trades cheaper than its peers, and its stated dividend policy makes the capital return profile attractive. The Fund purchased Qualcomm shares after the stock traded down on concerns over industry-wide supply-chain issues and a broader reevaluation of the technology sector. However, we believe Qualcomm is well positioned to benefit from a slower-than-expected shakeout of Apple’s attempt to insource chip production, significant modem share gain in the latest Samsung phones, and rapid growth brought by the company’s diversification into the automobile space.
| 1. | See page 5 for other share class returns, which may be higher or lower than Class I share returns. See page 6 for more information on benchmark and peer group returns. |
During the same period, the Fund eliminated its holding of Bank of America, a U.S.-based financial services company, and trimmed its position in UnitedHealth Group, a U.S.-based insurance company, in favor of more compelling risk-reward profiles elsewhere.
How did sector weightings change in the equity portion of the Fund during the reporting period?
The equity portion of the Fund’s largest increases in sector exposures relative to the Russell 1000® Value Index were to consumer staples, real estate and consumer discretionary, while the most significant reductions in sector exposure were to materials, financials and information technology.
How was the equity portion of the Fund positioned at the end of the reporting period?
As of October 31, 2022, the equity portion of the Fund held its largest overweight exposures relative to the Russell 1000® Value Index in the information technology, health care and consumer discretionary sectors. As of the same date, the equity portion of the Fund’s most significantly underweight exposures were in communication services, materials and consumer staples.
What factors affected the relative performance of the fixed-income portion of the Fund during the reporting period?
Relative to the Bloomberg U.S. Intermediate Government/Credit Bond Index (the "Bloomberg Index"), the Fund held overweight positions in asset-backed securities (“ABS”) and commercial-mortgage-backed securities (“CBMS”) throughout the reporting period. The Fund began the reporting period with overweight positions in the corporate and U.S. government agency sectors, but reduced the allocation to these sectors during the second half of the reporting period. To facilitate the reduction in corporate and U.S. government agency allocations, the Fund added to its U.S. Treasury allocation. Option-adjusted spreads2 on the Bloomberg Index widened 24 basis points during the reporting period. (A basis point is one one-hundredth of a percentage point.) The corporate sector was the worst-performing sector, followed by overweight positions in ABS and U.S. government agencies. Overweight exposure to the CMBS sector also detracted from performance. Within the credit sector, underweight exposure
to the non-corporate subcomponent was accretive to relative performance.
During the reporting period, how was the performance of the fixed-income portion of the Fund materially affected by investments in derivatives?
During the reporting period, the Fund’s use of derivatives was limited to interest-rate derivatives utilized to keep the duration3 of the fixed-income portion of the Fund in line with our target duration. The interest-rate derivatives had a slightly negative impact on performance.
What was the duration strategy of the fixed-income portion of the Fund during the reporting period?
During the reporting period, the fixed-income portion of the Fund generally maintained a duration shorter than that of the Bloomberg U.S. Intermediate Government/Credit Bond Index in the front end (0-2 years) of the yield curve,4 and a duration longer than the Index in the 10-year part of the curve. This curve positioning helped to gradually increase performance as U.S. Federal Reserve officials tightened monetary policy at the fastest pace since 2000 in order to reign in out-of-control inflation. As of October 31, 2022, the Fund’s duration was 3.89 years, compared to a duration of 3.86 years for the Index.
During the reporting period, which sectors were the strongest positive contributors to the relative performance of the fixed-income portion of the Fund and which sectors were particularly weak?
During the reporting period, the fixed-income portion of the Fund maintained overweight exposure compared to the Bloomberg U.S. Intermediate Government/Credit Bond Index in the industrials and financials subsectors, detracting from relative performance. Among industrials, performance in the automotive, health care and food & beverage subsectors were particularly weak, most notably bonds issued by General Motors Financial Company, Fresenius Medical Care and Conagra Brands. Among financials, overweight exposure to the finance company subsector had the most negative impact on relative performance, particularly holdings in AerCap Ireland Capital, Aircastle and Aviation Capital Group. Within securitized products, ABS was the worst-performing sector. Within the floating-rate subcomponent of the ABS sector,
| 2. | An option-adjusted spread is the measurement of the spread of a fixed-income security rate and the risk-free rate of return, which is then adjusted to take into account an embedded option. |
| 3. | Duration is a measure of the price sensitivity of a fixed-income investment to changes in interest rates. Duration is expressed as a number of years and is considered a more accurate sensitivity gauge than average maturity. |
| 4. | The yield curve is a line that plots the yields of various securities of similar quality—typically U.S. Treasury issues—across a range of maturities. The U.S. Treasury yield curve serves as a benchmark for other debt and is used in economic forecasting. |
collateralized loan obligations (“CLOs”) rated AAA and AA detracted from relative performance.5 Within the fixed-rate subcomponent of the ABS sector, equipment and specialty finance securities detracted the most. Within the CMBS sector, overweight exposure to the non-agency subcomponent detracted from performance. Conversely, the Fund’s relatively underweight exposure to the sovereign, supranational and foreign agency subsectors was slightly accretive to relative performance.
What were some of the largest purchases and sales in the fixed-income portion of the Fund during the reporting period?
The largest additions to the fixed-income portion of the Fund during the reporting period included bonds from HSBC Holdings, Citigroup, Apple, The Goldman Sachs Group and Virginia Electric and Power Company. The largest reductions during the reporting period included positions in Highwoods Realty, Bank of America, FirstEnergy Transmission, Brighthouse Financial Global Funding and Anglo American Capital.
How did the sector weightings of the fixed-income portion of the Fund change during the reporting period?
During the reporting period, the fixed-income portion of the Fund reduced corporate credit exposure, particularly in the industrial subcomponent, during the second quarter of 2022. We anticipated the significant increase in rate volatility arising from the Federal Reserve’s removal of accommodation would likely continue into the foreseeable future. Anticipating that this environment would probably put upward pressure on credit spreads, we reduced the Fund’s allocation to the asset class to improve portfolio flexibility amid uncertainty. At the same time, we also reduced the Fund’s U.S. government agency exposure. Within the ABS sector, we reduced the Fund’s allocation to AAA and AA CLOs in the first quarter of 2022, due to their relative outperformance versus other fixed-income asset classes. Throughout the reporting period, we reduced the Fund’s allocation to corporate credit and ABS, and increased the Fund’s allocation to U.S. Treasuries.
How was the Fund positioned at the end of the reporting period?
As of October 31, 2022, the fixed-income portion of the Fund held its most significantly overweight exposure relative to the Bloomberg U.S. Intermediate Government/Credit Bond Index in ABS. Within the corporate sector, the Fund held overweight
positions in financials and utilities. The Fund also held overweight positions in CMBS and U.S. Treasuries. As of the same date, the Fund held relatively underweight positions in the sovereign, supranational, foreign agency and foreign local government sectors.
| 5. | An obligation rated ‘AAA’ has the highest rating assigned by Standard & Poor’s (“S&P”), and in the opinion of S&P, the obligor’s capacity to meet its financial commitment on the obligation is extremely strong. An obligation rated ‘AA’ by S&P is deemed by S&P to differ from the highest-rated obligations only to a small degree. In the opinion of S&P, the obligor's capacity to meet its financial commitment on the obligation is very strong. When applied to Fund holdings, ratings are based solely on the creditworthiness of the bonds in the portfolio and are not meant to represent the security or safety of the Fund. |
The opinions expressed are those of the portfolio managers as of the date of this report and are subject to change. There is no guarantee that any forecasts will come to pass. This material does not constitute investment advice and is not intended as an endorsement of any specific investment.
Portfolio of Investments October 31, 2022†
| | Principal
Amount | Value |
| Long-Term Bonds 30.6% |
| Asset-Backed Securities 1.1% |
| Other Asset-Backed Securities 1.1% |
| AIG CLO LLC | |
| Series 2020-1A, Class AR | | |
| 5.239% (3 Month LIBOR + 1.16%), due 4/15/34 (a)(b) | $ 500,000 | $ 479,798 |
| Apidos CLO XXX | |
| Series XXXA, Class A2 | | |
| 5.794% (3 Month LIBOR + 1.60%), due 10/18/31 (a)(b) | 600,000 | 564,347 |
| ARES L CLO Ltd. | |
| Series 2018-50A, Class AR | | |
| 5.129% (3 Month LIBOR + 1.05%), due 1/15/32 (a)(b) | 500,000 | 484,292 |
| ARES XXXVIII CLO Ltd. | |
| Series 2015-38A, Class BR | | |
| 5.643% (3 Month LIBOR + 1.40%), due 4/20/30 (a)(b) | 600,000 | 557,879 |
| Carlyle Global Market Strategies CLO Ltd. | |
| Series 2013-3A, Class A2R | | |
| 5.479% (3 Month LIBOR + 1.40%), due 10/15/30 (a)(b) | 1,100,000 | 1,033,152 |
| Palmer Square CLO Ltd. | |
| Series 2015-2A, Class A2R2 | | |
| 5.793% (3 Month LIBOR + 1.55%), due 7/20/30 (a)(b) | 250,000 | 236,998 |
| Regatta XIV Funding Ltd. | |
| Series 2018-3A, Class A | | |
| 5.548% (3 Month LIBOR + 1.19%), due 10/25/31 (a)(b) | 400,000 | 388,280 |
| STORE Master Funding I-VII XIV XIX XX | |
| Series 2021-1A, Class A1 | | |
| 2.12%, due 6/20/51 (a) | 306,692 | 251,981 |
| THL Credit Wind River CLO Ltd. | |
| Series 2017-4A, Class A | | |
| 4.134% (3 Month LIBOR + 1.15%), due 11/20/30 (a)(b) | 507,000 | 497,381 |
| Vantage Data Centers Issuer LLC | |
| Series 2020-1A, Class A2 | | |
| 1.645%, due 9/15/45 (a) | 850,000 | 745,240 |
Total Asset-Backed Securities
(Cost $5,605,894) | | 5,239,348 |
| | Principal
Amount | Value |
| Corporate Bonds 8.5% |
| Aerospace & Defense 0.1% |
| Boeing Co. (The) | | |
| 3.10%, due 5/1/26 | $ 145,000 | $ 130,930 |
| 3.25%, due 2/1/28 | 200,000 | 173,293 |
| | | 304,223 |
| Auto Manufacturers 0.1% |
| General Motors Financial Co., Inc. | | |
| 6.05%, due 10/10/25 | 595,000 | 589,955 |
| Banks 3.6% |
| Banco Santander SA | | |
| 5.294%, due 8/18/27 | 400,000 | 368,880 |
| Bank of America Corp. (c) | | |
| 1.922%, due 10/24/31 | 153,000 | 112,265 |
| 2.087%, due 6/14/29 | 865,000 | 699,964 |
| 5.015%, due 7/22/33 | 405,000 | 371,410 |
| Citigroup, Inc. (c) | | |
| 2.014%, due 1/25/26 | 875,000 | 799,389 |
| 2.666%, due 1/29/31 | 225,000 | 178,940 |
| 5.61%, due 9/29/26 | 1,050,000 | 1,036,088 |
| Citizens Bank NA | | |
| 6.064%, due 10/24/25 (c) | 380,000 | 382,707 |
| Cooperatieve Rabobank UA | | |
| 4.655% (1 Year Treasury Constant Maturity Rate + 1.75%), due 8/22/28 (a)(b) | 670,000 | 619,729 |
| Fifth Third Bancorp | | |
| 6.361%, due 10/27/28 (c) | 300,000 | 301,232 |
| Goldman Sachs Group, Inc. (The) | | |
| 2.64%, due 2/24/28 (c) | 600,000 | 518,594 |
| 5.70%, due 11/1/24 | 850,000 | 850,057 |
| HSBC Holdings plc (c) | | |
| 7.336%, due 11/3/26 | 655,000 | 656,813 |
| 7.39%, due 11/3/28 | 470,000 | 470,401 |
| JPMorgan Chase & Co. (c) | | |
| 1.578%, due 4/22/27 | 1,010,000 | 868,653 |
| 2.963%, due 1/25/33 | 365,000 | 285,152 |
| 4.565%, due 6/14/30 | 500,000 | 457,981 |
| 4.912%, due 7/25/33 | 180,000 | 163,785 |
| Lloyds Banking Group plc | | |
| 0.695% (1 Year Treasury Constant Maturity Rate + 0.55%), due 5/11/24 (b) | 650,000 | 630,314 |
| Mizuho Financial Group, Inc. | | |
| 5.414% (1 Year Treasury Constant Maturity Rate + 2.05%), due 9/13/28 (b) | 360,000 | 347,104 |
The notes to the financial statements are an integral part of, and should be read in conjunction with, the financial statements.
| | Principal
Amount | Value |
| Corporate Bonds (continued) |
| Banks (continued) |
| Morgan Stanley (c) | | |
| 4.679%, due 7/17/26 | $ 1,314,000 | $ 1,273,893 |
| 5.297%, due 4/20/37 | 365,000 | 323,690 |
| 6.296%, due 10/18/28 | 320,000 | 322,878 |
| 6.342%, due 10/18/33 | 95,000 | 96,332 |
| Nordea Bank Abp | | |
| 5.375%, due 9/22/27 (a) | 675,000 | 650,425 |
| PNC Financial Services Group, Inc. (The) | | |
| 6.037%, due 10/28/33 (c) | 375,000 | 376,807 |
| Royal Bank of Canada | | |
| 5.66%, due 10/25/24 | 605,000 | 606,117 |
| Santander Holdings USA, Inc. | | |
| 5.807%, due 9/9/26 (c) | 300,000 | 290,543 |
| Societe Generale SA | | |
| 1.792% (1 Year Treasury Constant Maturity Rate + 1.00%), due 6/9/27 (a)(b) | 325,000 | 266,204 |
| Standard Chartered plc (a)(b) | | |
| 0.991% (1 Year Treasury Constant Maturity Rate + 0.78%), due 1/12/25 | 300,000 | 278,887 |
| 2.608% (1 Year Treasury Constant Maturity Rate + 1.18%), due 1/12/28 | 275,000 | 227,073 |
| State Street Corp. | | |
| 4.164%, due 8/4/33 (c) | 195,000 | 172,650 |
| Swedbank AB | | |
| 5.337%, due 9/20/27 (a) | 610,000 | 580,506 |
| U.S. Bancorp | | |
| 5.85%, due 10/21/33 (c) | 335,000 | 333,870 |
| UBS Group AG | | |
| 1.364% (1 Year Treasury Constant Maturity Rate + 1.08%), due 1/30/27 (a)(b) | 375,000 | 313,584 |
| Wells Fargo & Co. | | |
| 4.54%, due 8/15/26 (c) | 590,000 | 567,566 |
| | | 16,800,483 |
| Biotechnology 0.1% |
| Amgen, Inc. | | |
| 4.05%, due 8/18/29 | 590,000 | 544,623 |
| Commercial Services 0.1% |
| Global Payments, Inc. | | |
| 2.15%, due 1/15/27 | 400,000 | 341,368 |
| | Principal
Amount | Value |
| |
| Commercial Services (continued) |
| PayPal Holdings, Inc. | | |
| 3.90%, due 6/1/27 | $ 340,000 | $ 322,983 |
| | | 664,351 |
| Computers 0.2% |
| Apple, Inc. | | |
| 1.65%, due 5/11/30 | 391,000 | 312,793 |
| 1.70%, due 8/5/31 | 595,000 | 461,438 |
| | | 774,231 |
| Cosmetics & Personal Care 0.1% |
| Unilever Capital Corp. | | |
| 1.75%, due 8/12/31 | 265,000 | 201,848 |
| Diversified Financial Services 1.1% |
| AerCap Ireland Capital DAC | | |
| 3.00%, due 10/29/28 | 550,000 | 444,329 |
| Air Lease Corp. | | |
| 0.70%, due 2/15/24 | 1,425,000 | 1,330,786 |
| Aircastle Ltd. | | |
| 2.85%, due 1/26/28 (a) | 291,000 | 219,626 |
| Antares Holdings LP | | |
| 3.95%, due 7/15/26 (a) | 750,000 | 638,215 |
| Blackstone Holdings Finance Co. LLC (a) | | |
| 1.625%, due 8/5/28 | 285,000 | 228,769 |
| 5.90%, due 11/3/27 | 605,000 | 603,760 |
| Capital One Financial Corp. | | |
| 4.985%, due 7/24/26 (c) | 610,000 | 586,097 |
| Intercontinental Exchange, Inc. | | |
| 4.35%, due 6/15/29 | 720,000 | 681,725 |
| Thirax 1 LLC | | |
| 0.968%, due 1/14/33 | 302,016 | 245,582 |
| | | 4,978,889 |
| Electric 0.8% |
| AEP Texas, Inc. | | |
| 4.70%, due 5/15/32 | 160,000 | 145,643 |
| Appalachian Power Co. | | |
| Series BB | | |
| 4.50%, due 8/1/32 | 160,000 | 142,921 |
| Commonwealth Edison Co. | | |
| 3.10%, due 11/1/24 | 290,000 | 277,388 |
| Duke Energy Carolinas LLC | | |
| 2.85%, due 3/15/32 | 410,000 | 335,048 |
| Duke Energy Corp. | | |
| 4.30%, due 3/15/28 | 300,000 | 281,991 |
| 4.50%, due 8/15/32 | 140,000 | 126,189 |
| Enel Finance America LLC | | |
| 7.10%, due 10/14/27 (a) | 420,000 | 418,772 |
The notes to the financial statements are an integral part of, and should be read in conjunction with, the financial statements.
13
Portfolio of Investments October 31, 2022† (continued)
| | Principal
Amount | Value |
| Corporate Bonds (continued) |
| Electric (continued) |
| Entergy Arkansas LLC | | |
| 3.70%, due 6/1/24 | $ 665,000 | $ 653,295 |
| Pacific Gas and Electric Co. | | |
| 5.45%, due 6/15/27 | 400,000 | 377,168 |
| Southern Co. (The) | | |
| 5.15%, due 10/6/25 | 220,000 | 218,992 |
| 5.70%, due 10/15/32 | 100,000 | 98,885 |
| Virginia Electric and Power Co. | | |
| Series B | | |
| 3.75%, due 5/15/27 | 750,000 | 703,426 |
| | | 3,779,718 |
| Entertainment 0.0% ‡ |
| Warnermedia Holdings, Inc. | | |
| 4.054%, due 3/15/29 (a) | 224,000 | 190,321 |
| Environmental Control 0.1% |
| Waste Management, Inc. | | |
| 4.15%, due 4/15/32 | 410,000 | 377,009 |
| Food 0.1% |
| Nestle Holdings, Inc. | | |
| 4.25%, due 10/1/29 (a) | 440,000 | 421,155 |
| Gas 0.1% |
| CenterPoint Energy Resources Corp. | | |
| 4.40%, due 7/1/32 | 415,000 | 382,137 |
| Healthcare-Services 0.0% ‡ |
| HCA, Inc. | | |
| 3.625%, due 3/15/32 (a) | 230,000 | 186,481 |
| Insurance 0.1% |
| Corebridge Financial, Inc. | | |
| 3.85%, due 4/5/29 (a) | 325,000 | 283,919 |
| Principal Life Global Funding II | | |
| 1.25%, due 8/16/26 (a) | 425,000 | 361,035 |
| | | 644,954 |
| Internet 0.1% |
| Amazon.com, Inc. | | |
| 3.60%, due 4/13/32 | 370,000 | 331,278 |
| Meta Platforms, Inc. | | |
| 3.85%, due 8/15/32 (a) | 290,000 | 246,745 |
| | | 578,023 |
| | Principal
Amount | Value |
| |
| Investment Companies 0.1% |
| Blackstone Private Credit Fund | | |
| 7.05%, due 9/29/25 (a) | $ 420,000 | $ 416,330 |
| Prospect Capital Corp. | | |
| 3.437%, due 10/15/28 | 292,000 | 212,900 |
| | | 629,230 |
| Media 0.0% ‡ |
| Charter Communications Operating LLC | | |
| 2.25%, due 1/15/29 | 130,000 | 102,588 |
| Oil & Gas 0.1% |
| Phillips 66 Co. | | |
| 3.15%, due 12/15/29 (a) | 535,000 | 451,925 |
| Pharmaceuticals 0.0% ‡ |
| AbbVie, Inc. | | |
| 4.25%, due 11/14/28 | 80,000 | 75,306 |
| Merck & Co., Inc. | | |
| 2.15%, due 12/10/31 | 150,000 | 119,070 |
| | | 194,376 |
| Pipelines 0.2% |
| MPLX LP | | |
| 4.95%, due 9/1/32 | 178,000 | 161,084 |
| ONEOK, Inc. | | |
| 5.85%, due 1/15/26 | 580,000 | 576,773 |
| | | 737,857 |
| Real Estate Investment Trusts 0.2% |
| CubeSmart LP | | |
| 2.25%, due 12/15/28 | 340,000 | 272,837 |
| Realty Income Corp. | | |
| 3.95%, due 8/15/27 | 504,000 | 467,696 |
| Simon Property Group LP | | |
| 1.75%, due 2/1/28 | 425,000 | 347,879 |
| | | 1,088,412 |
| Retail 0.2% |
| Home Depot, Inc. (The) | | |
| 3.25%, due 4/15/32 | 340,000 | 293,400 |
| Lowe's Cos., Inc. | | |
| 5.00%, due 4/15/33 | 205,000 | 193,425 |
| Walmart, Inc. | | |
| 5.25%, due 9/1/35 | 305,000 | 310,820 |
| | | 797,645 |
| Semiconductors 0.3% |
| NVIDIA Corp. | | |
| 1.55%, due 6/15/28 | 147,000 | 121,396 |
The notes to the financial statements are an integral part of, and should be read in conjunction with, the financial statements.
| | Principal
Amount | Value |
| Corporate Bonds (continued) |
| Semiconductors (continued) |
| NXP BV | | |
| 4.30%, due 6/18/29 | $ 255,000 | $ 229,461 |
| QUALCOMM, Inc. | | |
| 2.15%, due 5/20/30 | 490,000 | 401,561 |
| Texas Instruments, Inc. | | |
| 3.65%, due 8/16/32 | 590,000 | 527,492 |
| | | 1,279,910 |
| Software 0.1% |
| Microsoft Corp. | | |
| 2.525%, due 6/1/50 | 220,000 | 138,012 |
| Oracle Corp. | | |
| 2.30%, due 3/25/28 | 215,000 | 179,851 |
| 2.875%, due 3/25/31 | 115,000 | 90,633 |
| | | 408,496 |
| Telecommunications 0.5% |
| AT&T, Inc. | | |
| 4.35%, due 3/1/29 | 955,000 | 887,671 |
| T-Mobile US, Inc. | | |
| 2.625%, due 2/15/29 | 205,000 | 169,460 |
| 3.50%, due 4/15/31 | 415,000 | 348,935 |
| Verizon Communications, Inc. | | |
| 2.10%, due 3/22/28 | 340,000 | 285,730 |
| 3.376%, due 2/15/25 | 8,000 | 7,722 |
| 4.016%, due 12/3/29 | 881,000 | 794,041 |
| | | 2,493,559 |
| Transportation 0.1% |
| FedEx Corp. | | |
| 2.40%, due 5/15/31 | 210,000 | 163,111 |
| Union Pacific Corp. | | |
| 4.50%, due 1/20/33 | 200,000 | 188,580 |
| | | 351,691 |
Total Corporate Bonds
(Cost $43,130,418) | | 39,954,090 |
| Mortgage-Backed Security 0.2% |
| Commercial Mortgage Loans (Collateralized Mortgage Obligation) 0.2% |
| Citigroup Commercial Mortgage Trust | |
| Series 2020-GC46, Class A5 | | |
| 2.717%, due 2/15/53 | 1,000,000 | 822,081 |
Total Mortgage-Backed Security
(Cost $1,028,350) | | 822,081 |
| | Principal
Amount | Value |
| U.S. Government & Federal Agencies 20.8% |
| Federal Home Loan Mortgage Corporation (Mortgage Pass-Through Securities) 0.6% |
| FFCB | | |
| 2.03%, due 1/21/28 | $ 1,200,000 | $ 1,070,521 |
| 4.37%, due 5/17/32 | 450,000 | 412,470 |
| FHLB | | |
| 4.00%, due 5/26/27 | 1,325,000 | 1,265,344 |
| | | 2,748,335 |
| United States Treasury Bonds 0.0% ‡ |
| U.S. Treasury Bonds | | |
| 3.00%, due 8/15/52 | 300,000 | 240,235 |
| United States Treasury Notes 20.2% |
| U.S. Treasury Notes | | |
| 0.125%, due 10/15/23 | 800,000 | 766,188 |
| 2.625%, due 6/30/23 | 6,800,000 | 6,719,781 |
| 2.75%, due 8/15/32 | 9,455,000 | 8,460,748 |
| 3.875%, due 9/30/29 | 13,970,000 | 13,721,159 |
| 4.125%, due 9/30/27 | 15,980,000 | 15,892,609 |
| 4.25%, due 9/30/24 | 27,685,000 | 27,544,412 |
| 4.25%, due 10/15/25 | 21,710,000 | 21,594,666 |
| | | 94,699,563 |
Total U.S. Government & Federal Agencies
(Cost $99,477,010) | | 97,688,133 |
Total Long-Term Bonds
(Cost $149,241,672) | | 143,703,652 |
| |
| | Shares | |
| Common Stocks 58.5% |
| Aerospace & Defense 2.8% |
| General Dynamics Corp. | 15,081 | 3,767,234 |
| L3Harris Technologies, Inc. | 18,846 | 4,644,974 |
| Raytheon Technologies Corp. | 50,815 | 4,818,278 |
| | | 13,230,486 |
| Auto Components 0.7% |
| Gentex Corp. | 127,652 | 3,381,502 |
| Banks 4.2% |
| JPMorgan Chase & Co. | 70,070 | 8,820,412 |
| M&T Bank Corp. | 26,268 | 4,422,743 |
| PNC Financial Services Group, Inc. (The) | 21,237 | 3,436,784 |
The notes to the financial statements are an integral part of, and should be read in conjunction with, the financial statements.
15
Portfolio of Investments October 31, 2022† (continued)
| | Shares | Value |
| Common Stocks (continued) |
| Banks (continued) |
| Truist Financial Corp. | 69,469 | $ 3,111,516 |
| | | 19,791,455 |
| Beverages 0.8% |
| Keurig Dr Pepper, Inc. | 91,110 | 3,538,712 |
| Building Products 1.6% |
| Fortune Brands Home & Security, Inc. | 45,812 | 2,763,380 |
| Johnson Controls International plc | 81,032 | 4,686,891 |
| | | 7,450,271 |
| Capital Markets 4.1% |
| Ares Management Corp. | 55,696 | 4,223,428 |
| Blackstone, Inc. | 32,520 | 2,963,873 |
| LPL Financial Holdings, Inc. | 11,051 | 2,825,188 |
| Morgan Stanley | 70,351 | 5,780,741 |
| Raymond James Financial, Inc. | 29,313 | 3,463,038 |
| | | 19,256,268 |
| Chemicals 0.6% |
| Axalta Coating Systems Ltd. (d) | 120,576 | 2,811,832 |
| Communications Equipment 2.2% |
| Cisco Systems, Inc. | 149,371 | 6,785,924 |
| F5, Inc. (d) | 25,824 | 3,690,508 |
| | | 10,476,432 |
| Containers & Packaging 0.6% |
| Sealed Air Corp. | 60,392 | 2,875,867 |
| Diversified Consumer Services 0.6% |
| H&R Block, Inc. | 71,955 | 2,960,948 |
| Electric Utilities 1.6% |
| Duke Energy Corp. | 39,190 | 3,651,724 |
| Exelon Corp. | 92,515 | 3,570,154 |
| | | 7,221,878 |
| Electrical Equipment 0.8% |
| Emerson Electric Co. | 40,147 | 3,476,730 |
| Electronic Equipment, Instruments & Components 1.0% |
| Corning, Inc. | 136,864 | 4,402,915 |
| Entertainment 1.0% |
| Electronic Arts, Inc. | 35,374 | 4,455,709 |
| | Shares | Value |
| |
| Equity Real Estate Investment Trusts 2.3% |
| Gaming and Leisure Properties, Inc. | 83,391 | $ 4,179,557 |
| Host Hotels & Resorts, Inc. | 174,375 | 3,292,200 |
| Welltower, Inc. | 53,787 | 3,283,158 |
| | | 10,754,915 |
| Food Products 1.8% |
| Archer-Daniels-Midland Co. | 45,395 | 4,402,407 |
| Mondelez International, Inc., Class A | 67,818 | 4,169,451 |
| | | 8,571,858 |
| Gas Utilities 0.7% |
| Atmos Energy Corp. | 31,495 | 3,355,792 |
| Health Care Equipment & Supplies 2.7% |
| Becton Dickinson and Co. | 16,417 | 3,873,919 |
| Boston Scientific Corp. (d) | 95,281 | 4,107,564 |
| Medtronic plc | 51,637 | 4,509,976 |
| | | 12,491,459 |
| Health Care Providers & Services 3.1% |
| Centene Corp. (d) | 50,879 | 4,331,329 |
| Elevance Health, Inc. | 10,655 | 5,825,834 |
| UnitedHealth Group, Inc. | 8,223 | 4,564,999 |
| | | 14,722,162 |
| Household Durables 0.6% |
| Lennar Corp., Class A | 35,895 | 2,896,727 |
| Insurance 2.8% |
| Chubb Ltd. | 23,298 | 5,006,507 |
| MetLife, Inc. | 74,823 | 5,477,792 |
| Progressive Corp. (The) | 21,877 | 2,809,007 |
| | | 13,293,306 |
| Interactive Media & Services 1.2% |
| Alphabet, Inc., Class C (d) | 60,853 | 5,760,345 |
| IT Services 1.4% |
| Amdocs Ltd. | 39,436 | 3,403,721 |
| Global Payments, Inc. | 28,810 | 3,291,831 |
| | | 6,695,552 |
| Machinery 0.8% |
| Middleby Corp. (The) (d) | 27,138 | 3,795,521 |
| Media 0.6% |
| Omnicom Group, Inc. | 38,806 | 2,823,137 |
The notes to the financial statements are an integral part of, and should be read in conjunction with, the financial statements.
| | Shares | Value |
| Common Stocks (continued) |
| Multi-Utilities 0.9% |
| Sempra Energy | 26,600 | $ 4,015,004 |
| Oil, Gas & Consumable Fuels 4.5% |
| ConocoPhillips | 57,357 | 7,232,144 |
| Coterra Energy, Inc. | 150,011 | 4,669,842 |
| EOG Resources, Inc. | 36,509 | 4,984,209 |
| Phillips 66 | 41,497 | 4,327,722 |
| | | 21,213,917 |
| Personal Products 0.7% |
| Unilever plc, Sponsored ADR (e) | 75,561 | 3,438,781 |
| Pharmaceuticals 5.4% |
| AstraZeneca plc, Sponsored ADR | 57,411 | 3,376,341 |
| Eli Lilly and Co. | 14,605 | 5,288,324 |
| Merck & Co., Inc. | 55,681 | 5,634,917 |
| Pfizer, Inc. | 173,229 | 8,063,809 |
| Roche Holding AG | 8,780 | 2,915,853 |
| | | 25,279,244 |
| Real Estate Management & Development 0.7% |
| CBRE Group, Inc., Class A (d) | 44,318 | 3,143,919 |
| Road & Rail 0.6% |
| Knight-Swift Transportation Holdings, Inc. | 61,169 | 2,937,947 |
| Semiconductors & Semiconductor Equipment 2.6% |
| Analog Devices, Inc. | 36,060 | 5,142,877 |
| Micron Technology, Inc. | 56,664 | 3,065,523 |
| QUALCOMM, Inc. | 33,853 | 3,983,144 |
| | | 12,191,544 |
| Specialty Retail 2.5% |
| Home Depot, Inc. (The) | 17,362 | 5,141,409 |
| TJX Cos., Inc. (The) | 50,890 | 3,669,169 |
| Victoria's Secret & Co. (d) | 74,422 | 2,798,267 |
| | | 11,608,845 |
Total Common Stocks
(Cost $246,840,946) | | 274,320,980 |
| | Shares | | Value |
| Exchange-Traded Funds 8.2% |
| iShares Intermediate Government/Credit Bond ETF (e) | 214,445 | | $ 21,699,689 |
| Vanguard Intermediate-Term Treasury ETF | 290,925 | | 16,812,556 |
Total Exchange-Traded Funds
(Cost $39,128,082) | | | 38,512,245 |
| Short-Term Investments 2.6% |
| Affiliated Investment Company 2.3% |
| MainStay U.S. Government Liquidity Fund, 2.905% (f) | 10,984,933 | | 10,984,933 |
| Unaffiliated Investment Company 0.3% |
| Invesco Government & Agency Portfolio, 3.163% (f)(g) | 1,314,407 | | 1,314,407 |
Total Short-Term Investments
(Cost $12,299,340) | | | 12,299,340 |
Total Investments
(Cost $447,510,040) | 99.9% | | 468,836,217 |
| Other Assets, Less Liabilities | 0.1 | | 276,220 |
| Net Assets | 100.0% | | $ 469,112,437 |
| † | Percentages indicated are based on Fund net assets. |
| ‡ | Less than one-tenth of a percent. |
| (a) | May be sold to institutional investors only under Rule 144A or securities offered pursuant to Section 4(a)(2) of the Securities Act of 1933, as amended. |
| (b) | Floating rate—Rate shown was the rate in effect as of October 31, 2022. |
| (c) | Fixed to floating rate—Rate shown was the rate in effect as of October 31, 2022. |
| (d) | Non-income producing security. |
| (e) | All or a portion of this security was held on loan. As of October 31, 2022, the aggregate market value of securities on loan was $1,278,530. The Fund received cash collateral with a value of $1,314,407. (See Note 2(H)) |
| (f) | Current yield as of October 31, 2022. |
| (g) | Represents a security purchased with cash collateral received for securities on loan. |
The notes to the financial statements are an integral part of, and should be read in conjunction with, the financial statements.
17
Portfolio of Investments October 31, 2022† (continued)
Investments in Affiliates (in 000's)
Investments in issuers considered to be affiliate(s) of the Fund during the year ended October 31, 2022 for purposes of Section 2(a)(3) of the Investment Company Act of 1940, as amended, were as follows:
| Affiliated Investment Companies | Value,
Beginning
of Year | Purchases
at Cost | Proceeds
from
Sales | Net
Realized
Gain/(Loss)
on Sales | Change in
Unrealized
Appreciation/
(Depreciation) | Value,
End of
Year | Dividend
Income | Other
Distributions | Shares
End of
Year |
| MainStay U.S. Government Liquidity Fund | $ 3,803 | $ 103,142 | $ (95,960) | $ — | $ — | $ 10,985 | $ 43 | $ — | 10,985 |
Futures Contracts
As of October 31, 2022, the Fund held the following futures contracts1:
| Type | Number of
Contracts | Expiration
Date | Value at
Trade Date | Current
Notional
Amount | Unrealized
Appreciation
(Depreciation)2 |
| Long Contracts | | | | | |
| U.S. Treasury 2 Year Notes | 7 | December 2022 | $ 1,433,306 | $ 1,430,680 | $ (2,626) |
| U.S. Treasury 5 Year Notes | 75 | December 2022 | 8,245,729 | 7,994,531 | (251,198) |
| U.S. Treasury 10 Year Notes | 41 | December 2022 | 4,565,697 | 4,534,344 | (31,353) |
| U.S. Treasury Ultra Bonds | 2 | December 2022 | 257,790 | 255,312 | (2,478) |
| Total Long Contracts | | | | | (287,655) |
| Short Contracts | | | | | |
| U.S. Treasury 10 Year Ultra Bonds | (32) | December 2022 | (3,713,618) | (3,711,500) | 2,118 |
| U.S. Treasury Long Bonds | (6) | December 2022 | (776,895) | (723,000) | 53,895 |
| Total Short Contracts | | | | | 56,013 |
| Net Unrealized Depreciation | | | | | $ (231,642) |
| 1. | As of October 31, 2022, cash in the amount of $142,830 was on deposit with a broker or futures commission merchant for futures transactions. |
| 2. | Represents the difference between the value of the contracts at the time they were opened and the value as of October 31, 2022. |
| Abbreviation(s): |
| ADR—American Depositary Receipt |
| CLO—Collateralized Loan Obligation |
| ETF—Exchange-Traded Fund |
| FFCB—Federal Farm Credit Bank |
| FHLB—Federal Home Loan Bank |
| LIBOR—London Interbank Offered Rate |
The notes to the financial statements are an integral part of, and should be read in conjunction with, the financial statements.
The following is a summary of the fair valuations according to the inputs used as of October 31, 2022, for valuing the Fund’s assets and liabilities:
| Description | Quoted
Prices in
Active
Markets for
Identical
Assets
(Level 1) | | Significant
Other
Observable
Inputs
(Level 2) | | Significant
Unobservable
Inputs
(Level 3) | | Total |
| Asset Valuation Inputs | | | | | | | |
| Investments in Securities (a) | | | | | | | |
| Long-Term Bonds | | | | | | | |
| Asset-Backed Securities | $ — | | $ 5,239,348 | | $ — | | $ 5,239,348 |
| Corporate Bonds | — | | 39,954,090 | | — | | 39,954,090 |
| Mortgage-Backed Security | — | | 822,081 | | — | | 822,081 |
| U.S. Government & Federal Agencies | — | | 97,688,133 | | — | | 97,688,133 |
| Total Long-Term Bonds | — | | 143,703,652 | | — | | 143,703,652 |
| Common Stocks | 274,320,980 | | — | | — | | 274,320,980 |
| Exchange-Traded Funds | 38,512,245 | | — | | — | | 38,512,245 |
| Short-Term Investments | | | | | | | |
| Affiliated Investment Company | 10,984,933 | | — | | — | | 10,984,933 |
| Unaffiliated Investment Company | 1,314,407 | | — | | — | | 1,314,407 |
| Total Short-Term Investments | 12,299,340 | | — | | — | | 12,299,340 |
| Total Investments in Securities | 325,132,565 | | 143,703,652 | | — | | 468,836,217 |
| Other Financial Instruments | | | | | | | |
| Futures Contracts (b) | 56,013 | | — | | — | | 56,013 |
| Total Investments in Securities and Other Financial Instruments | $ 325,188,578 | | $ 143,703,652 | | $ — | | $ 468,892,230 |
| Liability Valuation Inputs | | | | | | | |
| Other Financial Instruments | | | | | | | |
| Futures Contracts (b) | $ (287,655) | | $ — | | $ — | | $ (287,655) |
| (a) | For a complete listing of investments and their industries, see the Portfolio of Investments. |
| (b) | The value listed for these securities reflects unrealized appreciation (depreciation) as shown on the Portfolio of Investments. |
The notes to the financial statements are an integral part of, and should be read in conjunction with, the financial statements.
19
Statement of Assets and Liabilities as of October 31, 2022
| Assets |
Investment in unaffiliated securities, at value
(identified cost $436,525,107) including securities on loan of $1,278,530 | $457,851,284 |
Investment in affiliated investment companies, at value
(identified cost $10,984,933) | 10,984,933 |
| Cash | 3,555,003 |
| Cash collateral on deposit at broker for futures contracts | 142,830 |
| Receivables: | |
| Investment securities sold | 2,470,807 |
| Dividends and interest | 927,450 |
| Fund shares sold | 319,132 |
| Securities lending | 2,784 |
| Other assets | 52,571 |
| Total assets | 476,306,794 |
| Liabilities |
| Cash collateral received for securities on loan | 1,314,407 |
| Payables: | |
| Investment securities purchased | 5,078,427 |
| Manager (See Note 3) | 251,181 |
| Fund shares redeemed | 222,526 |
| Transfer agent (See Note 3) | 109,531 |
| NYLIFE Distributors (See Note 3) | 99,697 |
| Shareholder communication | 46,491 |
| Variation margin on futures contracts | 41,362 |
| Professional fees | 12,630 |
| Custodian | 11,754 |
| Accrued expenses | 6,351 |
| Total liabilities | 7,194,357 |
| Net assets | $469,112,437 |
| Composition of Net Assets |
| Shares of beneficial interest outstanding (par value of $.001 per share) unlimited number of shares authorized | $ 16,636 |
| Additional paid-in-capital | 449,183,296 |
| | 449,199,932 |
| Total distributable earnings (loss) | 19,912,505 |
| Net assets | $469,112,437 |
| Class A | |
| Net assets applicable to outstanding shares | $345,376,498 |
| Shares of beneficial interest outstanding | 12,244,631 |
| Net asset value per share outstanding | $ 28.21 |
| Maximum sales charge (3.00% of offering price) | 0.87 |
| Maximum offering price per share outstanding | $ 29.08 |
| Investor Class | |
| Net assets applicable to outstanding shares | $ 40,341,312 |
| Shares of beneficial interest outstanding | 1,430,337 |
| Net asset value per share outstanding | $ 28.20 |
| Maximum sales charge (2.50% of offering price) | 0.72 |
| Maximum offering price per share outstanding | $ 28.92 |
| Class B | |
| Net assets applicable to outstanding shares | $ 5,798,044 |
| Shares of beneficial interest outstanding | 208,485 |
| Net asset value and offering price per share outstanding | $ 27.81 |
| Class C | |
| Net assets applicable to outstanding shares | $ 17,020,350 |
| Shares of beneficial interest outstanding | 612,263 |
| Net asset value and offering price per share outstanding | $ 27.80 |
| Class I | |
| Net assets applicable to outstanding shares | $ 57,771,525 |
| Shares of beneficial interest outstanding | 2,040,864 |
| Net asset value and offering price per share outstanding | $ 28.31 |
| Class R1 | |
| Net assets applicable to outstanding shares | $ 176,315 |
| Shares of beneficial interest outstanding | 6,240 |
| Net asset value and offering price per share outstanding | $ 28.26 |
| Class R2 | |
| Net assets applicable to outstanding shares | $ 650,782 |
| Shares of beneficial interest outstanding | 23,027 |
| Net asset value and offering price per share outstanding | $ 28.26 |
| Class R3 | |
| Net assets applicable to outstanding shares | $ 1,924,655 |
| Shares of beneficial interest outstanding | 68,437 |
| Net asset value and offering price per share outstanding | $ 28.12 |
| Class R6 | |
| Net assets applicable to outstanding shares | $ 52,956 |
| Shares of beneficial interest outstanding | 1,868 |
| Net asset value and offering price per share outstanding | $ 28.35 |
The notes to the financial statements are an integral part of, and should be read in conjunction with, the financial statements.
Statement of Operations for the year ended October 31, 2022
| Investment Income (Loss) |
| Income | |
| Dividends-unaffiliated (net of foreign tax withholding of $14,177) | $ 7,191,645 |
| Interest | 3,772,278 |
| Dividends-affiliated | 43,177 |
| Securities lending, net | 14,558 |
| Total income | 11,021,658 |
| Expenses | |
| Manager (See Note 3) | 3,144,803 |
| Distribution/Service—Class A (See Note 3) | 873,343 |
| Distribution/Service—Investor Class (See Note 3) | 107,426 |
| Distribution/Service—Class B (See Note 3) | 76,108 |
| Distribution/Service—Class C (See Note 3) | 208,625 |
| Distribution/Service—Class R2 (See Note 3) | 1,942 |
| Distribution/Service—Class R3 (See Note 3) | 10,169 |
| Transfer agent (See Note 3) | 623,658 |
| Registration | 119,613 |
| Professional fees | 91,604 |
| Shareholder communication | 54,828 |
| Custodian | 47,684 |
| Trustees | 9,585 |
| Shareholder service (See Note 3) | 2,929 |
| Miscellaneous | 28,421 |
| Total expenses before waiver/reimbursement | 5,400,738 |
| Expense waiver/reimbursement from Manager (See Note 3) | (12,455) |
| Net expenses | 5,388,283 |
| Net investment income (loss) | 5,633,375 |
| Realized and Unrealized Gain (Loss) |
| Net realized gain (loss) on: | |
| Unaffiliated investment transactions | (1,194,212) |
| Futures transactions | 35,246 |
| Foreign currency transactions | 1,452 |
| Net realized gain (loss) | (1,157,514) |
| Net change in unrealized appreciation (depreciation) on: | |
| Unaffiliated investments | (31,784,110) |
| Futures contracts | (111,730) |
| Translation of other assets and liabilities in foreign currencies | (1,478) |
| Net change in unrealized appreciation (depreciation) | (31,897,318) |
| Net realized and unrealized gain (loss) | (33,054,832) |
| Net increase (decrease) in net assets resulting from operations | $(27,421,457) |
The notes to the financial statements are an integral part of, and should be read in conjunction with, the financial statements.
21
Statements of Changes in Net Assets
for the years ended October 31, 2022 and October 31, 2021
| | 2022 | 2021 |
| Increase (Decrease) in Net Assets |
| Operations: | | |
| Net investment income (loss) | $ 5,633,375 | $ 3,863,884 |
| Net realized gain (loss) | (1,157,514) | 110,195,771 |
| Net change in unrealized appreciation (depreciation) | (31,897,318) | 13,015,252 |
| Net increase (decrease) in net assets resulting from operations | (27,421,457) | 127,074,907 |
| Distributions to shareholders: | | |
| Class A | (68,171,865) | (5,189,504) |
| Investor Class | (9,028,686) | (785,979) |
| Class B | (1,805,691) | (135,897) |
| Class C | (4,789,167) | (390,180) |
| Class I | (12,813,121) | (2,749,887) |
| Class R1 | (22,059) | (1,742) |
| Class R2 | (194,564) | (32,212) |
| Class R3 | (443,499) | (35,197) |
| Class R6 | (12,112) | (1,167) |
| Total distributions to shareholders | (97,280,764) | (9,321,765) |
| Capital share transactions: | | |
| Net proceeds from sales of shares | 85,070,719 | 70,944,777 |
| Net asset value of shares issued to shareholders in reinvestment of distributions | 95,556,872 | 9,150,987 |
| Cost of shares redeemed | (88,508,384) | (193,633,246) |
| Increase (decrease) in net assets derived from capital share transactions | 92,119,207 | (113,537,482) |
| Net increase (decrease) in net assets | (32,583,014) | 4,215,660 |
| Net Assets |
| Beginning of year | 501,695,451 | 497,479,791 |
| End of year | $469,112,437 | $ 501,695,451 |
The notes to the financial statements are an integral part of, and should be read in conjunction with, the financial statements.
Financial Highlights selected per share data and ratios
| | Year Ended October 31, |
| Class A | 2022 | | 2021 | | 2020 | | 2019 | | 2018 |
| Net asset value at beginning of year | $ 37.09 | | $ 29.72 | | $ 30.98 | | $ 31.49 | | $ 33.63 |
| Net investment income (loss) (a) | 0.36 | | 0.27 | | 0.36 | | 0.44 | | 0.44 |
| Net realized and unrealized gain (loss) | (2.03) | | 7.70 | | (0.54) | | 1.58 | | (0.23) |
| Total from investment operations | (1.67) | | 7.97 | | (0.18) | | 2.02 | | 0.21 |
| Less distributions: | | | | | | | | | |
| From net investment income | (0.33) | | (0.28) | | (0.41) | | (0.46) | | (0.48) |
| From net realized gain on investments | (6.88) | | (0.32) | | (0.67) | | (2.07) | | (1.87) |
| Total distributions | (7.21) | | (0.60) | | (1.08) | | (2.53) | | (2.35) |
| Net asset value at end of year | $ 28.21 | | $ 37.09 | | $ 29.72 | | $ 30.98 | | $ 31.49 |
| Total investment return (b) | (5.35)% | | 27.03% | | (0.53)% | | 7.07% | | 0.48%(c) |
| Ratios (to average net assets)/Supplemental Data: | | | | | | | | | |
| Net investment income (loss) | 1.22% | | 0.78% | | 1.21% | | 1.47% | | 1.35% |
| Net expenses (d) | 1.06% | | 1.08% | | 1.13% | | 1.12% | | 1.10% |
| Portfolio turnover rate | 290% | | 182% | | 217% | | 194% | | 200% |
| Net assets at end of year (in 000’s) | $ 345,376 | | $ 343,224 | | $ 252,574 | | $ 279,636 | | $ 265,314 |
| (a) | Per share data based on average shares outstanding during the year. |
| (b) | Total investment return is calculated exclusive of sales charges and assumes the reinvestment of dividends and distributions. For periods of less than one year, total return is not annualized. |
| (c) | Total investment return may reflect adjustments to conform to generally accepted accounting principles. |
| (d) | In addition to the fees and expenses which the Fund bears directly, it also indirectly bears a pro-rata share of the fees and expenses of the underlying funds in which it invests. Such indirect expenses are not included in the above expense ratios. |
| | Year Ended October 31, |
| Investor Class | 2022 | | 2021 | | 2020 | | 2019 | | 2018 |
| Net asset value at beginning of year | $ 37.10 | | $ 29.75 | | $ 31.01 | | $ 31.51 | | $ 33.65 |
| Net investment income (loss) (a) | 0.28 | | 0.19 | | 0.29 | | 0.38 | | 0.38 |
| Net realized and unrealized gain (loss) | (2.03) | | 7.69 | | (0.55) | | 1.58 | | (0.23) |
| Total from investment operations | (1.75) | | 7.88 | | (0.26) | | 1.96 | | 0.15 |
| Less distributions: | | | | | | | | | |
| From net investment income | (0.27) | | (0.21) | | (0.33) | | (0.39) | | (0.42) |
| From net realized gain on investments | (6.88) | | (0.32) | | (0.67) | | (2.07) | | (1.87) |
| Total distributions | (7.15) | | (0.53) | | (1.00) | | (2.46) | | (2.29) |
| Net asset value at end of year | $ 28.20 | | $ 37.10 | | $ 29.75 | | $ 31.01 | | $ 31.51 |
| Total investment return (b) | (5.62)% | | 26.68% | | (0.75)% | | 6.79% | | 0.29% |
| Ratios (to average net assets)/Supplemental Data: | | | | | | | | | |
| Net investment income (loss) | 0.95% | | 0.54% | | 0.97% | | 1.26% | | 1.18% |
| Net expenses (c) | 1.32% | | 1.35% | | 1.38% | | 1.33% | | 1.28% |
| Expenses (before waiver/reimbursement) (c) | 1.34% | | 1.37% | | 1.40% | | 1.35% | | 1.30% |
| Portfolio turnover rate | 290% | | 182% | | 217% | | 194% | | 200% |
| Net assets at end of year (in 000's) | $ 40,341 | | $ 46,706 | | $ 47,358 | | $ 53,006 | | $ 51,128 |
| (a) | Per share data based on average shares outstanding during the year. |
| (b) | Total investment return is calculated exclusive of sales charges and assumes the reinvestment of dividends and distributions. For periods of less than one year, total return is not annualized. |
| (c) | In addition to the fees and expenses which the Fund bears directly, it also indirectly bears a pro-rata share of the fees and expenses of the underlying funds in which it invests. Such indirect expenses are not included in the above expense ratios. |
The notes to the financial statements are an integral part of, and should be read in conjunction with, the financial statements.
23
Financial Highlights selected per share data and ratios
| | Year Ended October 31, |
| Class B | 2022 | | 2021 | | 2020 | | 2019 | | 2018 |
| Net asset value at beginning of year | $ 36.72 | | $ 29.56 | | $ 30.82 | | $ 31.35 | | $ 33.48 |
| Net investment income (loss) (a) | 0.05 | | (0.07) | | 0.07 | | 0.16 | | 0.14 |
| Net realized and unrealized gain (loss) | (1.99) | | 7.63 | | (0.54) | | 1.54 | | (0.23) |
| Total from investment operations | (1.94) | | 7.56 | | (0.47) | | 1.70 | | (0.09) |
| Less distributions: | | | | | | | | | |
| From net investment income | (0.09) | | (0.08) | | (0.12) | | (0.16) | | (0.17) |
| From net realized gain on investments | (6.88) | | (0.32) | | (0.67) | | (2.07) | | (1.87) |
| Total distributions | (6.97) | | (0.40) | | (0.79) | | (2.23) | | (2.04) |
| Net asset value at end of year | $ 27.81 | | $ 36.72 | | $ 29.56 | | $ 30.82 | | $ 31.35 |
| Total investment return (b) | (6.30)% | | 25.74% | | (1.51)% | | 6.00% | | (0.45)%(c) |
| Ratios (to average net assets)/Supplemental Data: | | | | | | | | | |
| Net investment income (loss) | 0.18% | | (0.21)% | | 0.23% | | 0.54% | | 0.43% |
| Net expenses (d) | 2.07% | | 2.10% | | 2.13% | | 2.08% | | 2.03% |
| Expenses (before waiver/reimbursement) (d) | 2.09% | | 2.12% | | 2.15% | | 2.10% | | 2.05% |
| Portfolio turnover rate | 290% | | 182% | | 217% | | 194% | | 200% |
| Net assets at end of year (in 000’s) | $ 5,798 | | $ 9,645 | | $ 10,671 | | $ 15,049 | | $ 18,795 |
| (a) | Per share data based on average shares outstanding during the year. |
| (b) | Total investment return is calculated exclusive of sales charges and assumes the reinvestment of dividends and distributions. For periods of less than one year, total return is not annualized. |
| (c) | Total investment return may reflect adjustments to conform to generally accepted accounting principles. |
| (d) | In addition to the fees and expenses which the Fund bears directly, it also indirectly bears a pro-rata share of the fees and expenses of the underlying funds in which it invests. Such indirect expenses are not included in the above expense ratios. |
| | Year Ended October 31, |
| Class C | 2022 | | 2021 | | 2020 | | 2019 | | 2018 |
| Net asset value at beginning of year | $ 36.71 | | $ 29.55 | | $ 30.81 | | $ 31.33 | | $ 33.46 |
| Net investment income (loss) (a) | 0.06 | | (0.07) | | 0.07 | | 0.18 | | 0.14 |
| Net realized and unrealized gain (loss) | (2.00) | | 7.63 | | (0.54) | | 1.53 | | (0.23) |
| Total from investment operations | (1.94) | | 7.56 | | (0.47) | | 1.71 | | (0.09) |
| Less distributions: | | | | | | | | | |
| From net investment income | (0.09) | | (0.08) | | (0.12) | | (0.16) | | (0.17) |
| From net realized gain on investments | (6.88) | | (0.32) | | (0.67) | | (2.07) | | (1.87) |
| Total distributions | (6.97) | | (0.40) | | (0.79) | | (2.23) | | (2.04) |
| Net asset value at end of year | $ 27.80 | | $ 36.71 | | $ 29.55 | | $ 30.81 | | $ 31.33 |
| Total investment return (b) | (6.30)% | | 25.75% | | (1.51)% | | 6.03% | | (0.45)%(c) |
| Ratios (to average net assets)/Supplemental Data: | | | | | | | | | |
| Net investment income (loss) | 0.19% | | (0.20)% | | 0.23% | | 0.59% | | 0.43% |
| Net expenses (d) | 2.07% | | 2.10% | | 2.13% | | 2.08% | | 2.03% |
| Expenses (before waiver/reimbursement) (d) | 2.09% | | 2.12% | | 2.15% | | 2.10% | | 2.05% |
| Portfolio turnover rate | 290% | | 182% | | 217% | | 194% | | 200% |
| Net assets at end of year (in 000’s) | $ 17,020 | | $ 26,050 | | $ 30,769 | | $ 45,437 | | $ 76,233 |
| (a) | Per share data based on average shares outstanding during the year. |
| (b) | Total investment return is calculated exclusive of sales charges and assumes the reinvestment of dividends and distributions. For periods of less than one year, total return is not annualized. |
| (c) | Total investment return may reflect adjustments to conform to generally accepted accounting principles. |
| (d) | In addition to the fees and expenses which the Fund bears directly, it also indirectly bears a pro-rata share of the fees and expenses of the underlying funds in which it invests. Such indirect expenses are not included in the above expense ratios. |
The notes to the financial statements are an integral part of, and should be read in conjunction with, the financial statements.
Financial Highlights selected per share data and ratios
| | Year Ended October 31, |
| Class I | 2022 | | 2021 | | 2020 | | 2019 | | 2018 |
| Net asset value at beginning of year | $ 37.19 | | $ 29.80 | | $ 31.06 | | $ 31.56 | | $ 33.71 |
| Net investment income (loss) (a) | 0.44 | | 0.37 | | 0.44 | | 0.53 | | 0.52 |
| Net realized and unrealized gain (loss) | (2.03) | | 7.70 | | (0.55) | | 1.57 | | (0.24) |
| Total from investment operations | (1.59) | | 8.07 | | (0.11) | | 2.10 | | 0.28 |
| Less distributions: | | | | | | | | | |
| From net investment income | (0.41) | | (0.36) | | (0.48) | | (0.53) | | (0.56) |
| From net realized gain on investments | (6.88) | | (0.32) | | (0.67) | | (2.07) | | (1.87) |
| Total distributions | (7.29) | | (0.68) | | (1.15) | | (2.60) | | (2.43) |
| Net asset value at end of year | $ 28.31 | | $ 37.19 | | $ 29.80 | | $ 31.06 | | $ 31.56 |
| Total investment return (b) | (5.09)% | | 27.32% | | (0.27)% | | 7.32% | | 0.70% |
| Ratios (to average net assets)/Supplemental Data: | | | | | | | | | |
| Net investment income (loss) | 1.47% | | 1.08% | | 1.47% | | 1.75% | | 1.61% |
| Net expenses (c) | 0.81% | | 0.84% | | 0.88% | | 0.87% | | 0.85% |
| Portfolio turnover rate | 290% | | 182% | | 217% | | 194% | | 200% |
| Net assets at end of year (in 000’s) | $ 57,772 | | $ 72,481 | | $ 152,036 | | $ 177,076 | | $ 217,380 |
| (a) | Per share data based on average shares outstanding during the year. |
| (b) | Total investment return is calculated exclusive of sales charges and assumes the reinvestment of dividends and distributions. Class I shares are not subject to sales charges. For periods of less than one year, total return is not annualized. |
| (c) | In addition to the fees and expenses which the Fund bears directly, it also indirectly bears a pro-rata share of the fees and expenses of the underlying funds in which it invests. Such indirect expenses are not included in the above expense ratios. |
| | Year Ended October 31, |
| Class R1 | 2022 | | 2021 | | 2020 | | 2019 | | 2018 |
| Net asset value at beginning of year | $ 37.14 | | $ 29.76 | | $ 31.02 | | $ 31.52 | | $ 33.66 |
| Net investment income (loss) (a) | 0.41 | | 0.33 | | 0.49 | | 0.50 | | 0.49 |
| Net realized and unrealized gain (loss) | (2.03) | | 7.70 | | (0.63) | | 1.57 | | (0.24) |
| Total from investment operations | (1.62) | | 8.03 | | (0.14) | | 2.07 | | 0.25 |
| Less distributions: | | | | | | | | | |
| From net investment income | (0.38) | | (0.33) | | (0.45) | | (0.50) | | (0.52) |
| From net realized gain on investments | (6.88) | | (0.32) | | (0.67) | | (2.07) | | (1.87) |
| Total distributions | (7.26) | | (0.65) | | (1.12) | | (2.57) | | (2.39) |
| Net asset value at end of year | $ 28.26 | | $ 37.14 | | $ 29.76 | | $ 31.02 | | $ 31.52 |
| Total investment return (b) | (5.23)% | | 27.20% | | (0.38)% | | 7.22% | | 0.62% |
| Ratios (to average net assets)/Supplemental Data: | | | | | | | | | |
| Net investment income (loss) | 1.37% | | 0.93% | | 1.60% | | 1.67% | | 1.50% |
| Net expenses (c) | 0.91% | | 0.94% | | 0.98% | | 0.97% | | 0.95% |
| Portfolio turnover rate | 290% | | 182% | | 217% | | 194% | | 200% |
| Net assets at end of year (in 000’s) | $ 176 | | $ 110 | | $ 78 | | $ 1,286 | | $ 1,805 |
| (a) | Per share data based on average shares outstanding during the year. |
| (b) | Total investment return is calculated exclusive of sales charges and assumes the reinvestment of dividends and distributions. Class R1 shares are not subject to sales charges. For periods of less than one year, total return is not annualized. |
| (c) | In addition to the fees and expenses which the Fund bears directly, it also indirectly bears a pro-rata share of the fees and expenses of the underlying funds in which it invests. Such indirect expenses are not included in the above expense ratios. |
The notes to the financial statements are an integral part of, and should be read in conjunction with, the financial statements.
25
Financial Highlights selected per share data and ratios
| | Year Ended October 31, |
| Class R2 | 2022 | | 2021 | | 2020 | | 2019 | | 2018 |
| Net asset value at beginning of year | $ 37.13 | | $ 29.77 | | $ 31.02 | | $ 31.53 | | $ 33.67 |
| Net investment income (loss) (a) | 0.33 | | 0.24 | | 0.34 | | 0.42 | | 0.41 |
| Net realized and unrealized gain (loss) | (2.02) | | 7.69 | | (0.55) | | 1.56 | | (0.24) |
| Total from investment operations | (1.69) | | 7.93 | | (0.21) | | 1.98 | | 0.17 |
| Less distributions: | | | | | | | | | |
| From net investment income | (0.30) | | (0.25) | | (0.37) | | (0.42) | | (0.44) |
| From net realized gain on investments | (6.88) | | (0.32) | | (0.67) | | (2.07) | | (1.87) |
| Total distributions | (7.18) | | (0.57) | | (1.04) | | (2.49) | | (2.31) |
| Net asset value at end of year | $ 28.26 | | $ 37.13 | | $ 29.77 | | $ 31.02 | | $ 31.53 |
| Total investment return (b) | (5.45)% | | 26.89% | | (0.60)% | | 6.95% | | 0.37%(c) |
| Ratios (to average net assets)/Supplemental Data: | | | | | | | | | |
| Net investment income (loss) | 1.09% | | 0.69% | | 1.14% | | 1.40% | | 1.26% |
| Net expenses (d) | 1.16% | | 1.19% | | 1.23% | | 1.22% | | 1.20% |
| Portfolio turnover rate | 290% | | 182% | | 217% | | 194% | | 200% |
| Net assets at end of year (in 000’s) | $ 651 | | $ 1,128 | | $ 1,693 | | $ 2,882 | | $ 3,496 |
| (a) | Per share data based on average shares outstanding during the year. |
| (b) | Total investment return is calculated exclusive of sales charges and assumes the reinvestment of dividends and distributions. Class R2 shares are not subject to sales charges. For periods of less than one year, total return is not annualized. |
| (c) | Total investment return may reflect adjustments to conform to generally accepted accounting principles. |
| (d) | In addition to the fees and expenses which the Fund bears directly, it also indirectly bears a pro-rata share of the fees and expenses of the underlying funds in which it invests. Such indirect expenses are not included in the above expense ratios. |
| | Year Ended October 31, |
| Class R3 | 2022 | | 2021 | | 2020 | | 2019 | | 2018 |
| Net asset value at beginning of year | $ 37.03 | | $ 29.70 | | $ 30.95 | | $ 31.45 | | $ 33.59 |
| Net investment income (loss) (a) | 0.26 | | 0.16 | | 0.26 | | 0.35 | | 0.33 |
| Net realized and unrealized gain (loss) | (2.04) | | 7.68 | | (0.55) | | 1.56 | | (0.24) |
| Total from investment operations | (1.78) | | 7.84 | | (0.29) | | 1.91 | | 0.09 |
| Less distributions: | | | | | | | | | |
| From net investment income | (0.25) | | (0.19) | | (0.29) | | (0.34) | | (0.36) |
| From net realized gain on investments | (6.88) | | (0.32) | | (0.67) | | (2.07) | | (1.87) |
| Total distributions | (7.13) | | (0.51) | | (0.96) | | (2.41) | | (2.23) |
| Net asset value at end of year | $ 28.12 | | $ 37.03 | | $ 29.70 | | $ 30.95 | | $ 31.45 |
| Total investment return (b) | (5.72)% | | 26.59% | | (0.88)% | | 6.68% | | 0.12% |
| Ratios (to average net assets)/Supplemental Data: | | | | | | | | | |
| Net investment income (loss) | 0.87% | | 0.45% | | 0.86% | | 1.15% | | 1.00% |
| Net expenses (c) | 1.41% | | 1.44% | | 1.48% | | 1.47% | | 1.45% |
| Portfolio turnover rate | 290% | | 182% | | 217% | | 194% | | 200% |
| Net assets at end of year (in 000’s) | $ 1,925 | | $ 2,290 | | $ 2,252 | | $ 3,048 | | $ 3,880 |
| (a) | Per share data based on average shares outstanding during the year. |
| (b) | Total investment return is calculated exclusive of sales charges and assumes the reinvestment of dividends and distributions. Class R3 shares are not subject to sales charges. For periods of less than one year, total return is not annualized. |
| (c) | In addition to the fees and expenses which the Fund bears directly, it also indirectly bears a pro-rata share of the fees and expenses of the underlying funds in which it invests. Such indirect expenses are not included in the above expense ratios. |
The notes to the financial statements are an integral part of, and should be read in conjunction with, the financial statements.
Financial Highlights selected per share data and ratios
| | Year Ended October 31, | | December 15, 2017^ through
October 31,
2018 |
| Class R6 | 2022 | | 2021 | | 2020 | | 2019 | |
| Net asset value at beginning of period | $ 37.23 | | $ 29.83 | | $ 31.06 | | $ 31.57 | | $ 32.52 |
| Net investment income (loss) (a) | 0.46 | | 0.39 | | 0.61 | | 0.53 | | 0.48 |
| Net realized and unrealized gain (loss) | (2.03) | | 7.73 | | (0.69) | | 1.59 | | (0.95) |
| Total from investment operations | (1.57) | | 8.12 | | (0.08) | | 2.12 | | (0.47) |
| Less distributions: | | | | | | | | | |
| From net investment income | (0.43) | | (0.40) | | (0.48) | | (0.56) | | (0.48) |
| From net realized gain on investments | (6.88) | | (0.32) | | (0.67) | | (2.07) | | — |
| Total distributions | (7.31) | | (0.72) | | (1.15) | | (2.63) | | (0.48) |
| Net asset value at end of period | $ 28.35 | | $ 37.23 | | $ 29.83 | | $ 31.06 | | $ 31.57 |
| Total investment return (b) | (5.04)% | | 27.45% | | (0.17)% | | 7.40% | | (1.48)% |
| Ratios (to average net assets)/Supplemental Data: | | | | | | | | | |
| Net investment income (loss) | 1.55% | | 1.12% | | 1.94% | | 1.75% | | 1.65%†† |
| Net expenses (c) | 0.73% | | 0.74% | | 0.78% | | 0.77% | | 0.76%†† |
| Portfolio turnover rate | 290% | | 182% | | 217% | | 194% | | 200% |
| Net assets at end of period (in 000’s) | $ 53 | | $ 61 | | $ 49 | | $ 14,697 | | $ 48 |
| ^ | Inception date. |
| †† | Annualized. |
| (a) | Per share data based on average shares outstanding during the period. |
| (b) | Total investment return is calculated exclusive of sales charges and assumes the reinvestment of dividends and distributions. Class R6 shares are not subject to sales charges. For periods of less than one year, total return is not annualized. |
| (c) | In addition to the fees and expenses which the Fund bears directly, it also indirectly bears a pro-rata share of the fees and expenses of the underlying funds in which it invests. Such indirect expenses are not included in the above expense ratios. |
The notes to the financial statements are an integral part of, and should be read in conjunction with, the financial statements.
27
Notes to Financial Statements
Note 1-Organization and Business
MainStay Funds Trust (the “Trust”) was organized as a Delaware statutory trust on April 28, 2009. The Trust is registered under the Investment Company Act of 1940, as amended (the “1940 Act”), as an open-end management investment company, and is comprised of thirty-three funds (collectively referred to as the “Funds”). These financial statements and notes relate to the MainStay Balanced Fund (the "Fund"), a “diversified” fund, as that term is defined in the 1940 Act, as interpreted or modified by regulatory authorities having jurisdiction, from time to time.
The following table lists the Fund's share classes that have been registered and commenced operations:
| Class | Commenced Operations |
| Class A | January 2, 2004 |
| Investor Class | February 28, 2008 |
| Class B | January 2, 2004 |
| Class C | December 30, 2002 |
| Class I | May 1, 1989 |
| Class R1 | January 2, 2004 |
| Class R2 | January 2, 2004 |
| Class R3 | April 28, 2006 |
| Class R6 | December 15, 2017 |
| SIMPLE Class | N/A* |
| * | SIMPLE Class shares were registered for sale effective as of August 31, 2020 but have not yet commenced operations. |
Class B shares of the MainStay Group of Funds are closed to all new purchases as well as additional investments by existing Class B shareholders. Existing Class B shareholders may continue to reinvest dividends and capital gains distributions, as well as exchange their Class B shares for Class B shares of other funds in the MainStay Group of Funds as permitted by the current exchange privileges. Class B shareholders continue to be subject to any applicable contingent deferred sales charge ("CDSC") at the time of redemption. All other features of the Class B shares, including but not limited to the fees and expenses applicable to Class B shares, remain unchanged. Unless redeemed, Class B shareholders will remain in Class B shares of their respective fund until the Class B shares are converted to Class A or Investor Class shares pursuant to the applicable conversion schedule.
Class A and Investor Class shares are offered at net asset value (“NAV”) per share plus an initial sales charge. No initial sales charge applies to investments of $250,000 or more (and certain other qualified purchases) in Class A and Investor Class shares. However, a CDSC of 1.00% may be imposed on certain redemptions made within 18 months of the date of purchase on shares that were purchased without an initial sales charge. Class C shares are offered at NAV without an initial sales charge, although a 1.00% CDSC may be imposed on certain redemptions of such shares made within one year of the date of purchase of Class C shares. When Class B shares were offered, they were offered at NAV without an initial sales charge, although a CDSC that declines depending on the number of years a shareholder held its Class B shares may be imposed
on certain redemptions of such shares made within six years of the date of purchase of such shares. Class I, Class R1, Class R2, Class R3 and Class R6 shares are offered at NAV without a sales charge. SIMPLE Class shares are expected to be offered at NAV without a sales charge if such shares are offered in the future. Depending upon eligibility, Class B shares convert to either Class A or Investor Class shares at the end of the calendar quarter eight years after the date they were purchased. In addition, depending upon eligibility, Class C shares convert to either Class A or Investor Class shares at the end of the calendar quarter ten years after the date they were purchased. Additionally, Investor Class shares may convert automatically to Class A shares. Under certain circumstances and as may be permitted by the Trust’s multiple class plan pursuant to Rule 18f-3 under the 1940 Act, specified share classes of the Fund may be converted to one or more other share classes of the Fund as disclosed in the capital share transactions within these Notes. The classes of shares have the same voting (except for issues that relate solely to one class), dividend, liquidation and other rights, and the same terms and conditions, except that under distribution plans pursuant to Rule 12b-1 under the 1940 Act, Class B and Class C shares are subject to higher distribution and/or service fees than Class A, Investor Class, Class R2, Class R3 and SIMPLE Class shares. Class I, Class R1 and Class R6 shares are not subject to a distribution and/or service fees. Class R1, Class R2 and Class R3 shares are subject to a shareholder service fee, which is in addition to any fees paid under the distribution plans for Class R2 and Class R3 shares.
The Fund's investment objective is to seek total return.
Note 2–Significant Accounting Policies
The Fund is an investment company and accordingly follows the investment company accounting and reporting guidance of the Financial Accounting Standards Board (“FASB”) Accounting Standards Codification Topic 946 Financial Services—Investment Companies. The Fund prepares its financial statements in accordance with generally accepted accounting principles (“GAAP”) in the United States of America and follows the significant accounting policies described below.
(A) Securities Valuation. Investments are usually valued as of the close of regular trading on the New York Stock Exchange (the "Exchange") (usually 4:00 p.m. Eastern time) on each day the Fund is open for business ("valuation date").
Effective September 8, 2022, and pursuant to Rule 2a-5 under the 1940 Act, the Board of Trustees of the Trust (the "Board") designated New York Life Investment Management LLC (“New York Life Investments” or the "Manager") as its Valuation Designee (the "Valuation Designee"). The Valuation Designee is responsible for performing fair valuations relating to all investments in the Fund’s portfolio for which market quotations are not readily available; periodically assessing and managing material valuation risks; establishing and applying fair value methodologies; testing fair valuation methodologies; evaluating and overseeing pricing services; segregation of valuation and portfolio management functions; providing quarterly, annual and prompt reporting to the Board, as appropriate;
identifying potential conflicts of interest; and maintaining appropriate records. The Valuation Designee has established a valuation committee ("Valuation Committee") to assist in carrying out the Valuation Designee’s responsibilities and establish prices of securities for which market quotations are not readily available. The Fund’s and the Valuation Designee's policies and procedures ("Valuation Procedures") govern the Valuation Designee’s selection and application of methodologies for determining and calculating the fair value of Fund investments. The Valuation Designee may value Fund portfolio securities for which market quotations are not readily available and other Fund assets utilizing inputs from pricing services and other third-party sources (together, “Pricing Sources”). The Valuation Committee meets (in person, via electronic mail or via teleconference) on an ad-hoc basis to determine fair valuations and on a quarterly basis to review fair value events (excluding fair valuations from pricing services), including valuation risks and back-testing results, and preview reports to the Board.
The Valuation Committee establishes prices of securities for which market quotations are not readily available based on such methodologies and measurements on a regular basis after considering information that is reasonably available and deemed relevant by the Valuation Committee. The Board shall oversee the Valuation Designee and review fair valuation materials on a prompt, quarterly and annual basis and approve proposed revisions to the Valuation Procedures.
Investments for which market quotations are not readily available are valued at fair value as determined in good faith pursuant to the Valuation Procedures. A market quotation is readily available only when that quotation is a quoted price (unadjusted) in active markets for identical investments that the Fund can access at the measurement date, provided that a quotation will not be readily available if it is not reliable. Fair value measurements are determined within a framework that establishes a three-tier hierarchy that maximizes the use of observable market data and minimizes the use of unobservable inputs to establish a classification of fair value measurements for disclosure purposes. "Inputs" refer broadly to the assumptions that market participants would use in pricing the asset or liability, including assumptions about risk, such as the risk inherent in a particular valuation technique used to measure fair value using a pricing model and/or the risk inherent in the inputs for the valuation technique. Inputs may be observable or unobservable. Observable inputs reflect the assumptions market participants would use in pricing the asset or liability based on market data obtained from sources independent of the Fund. Unobservable inputs reflect the Fund’s own assumptions about the assumptions market participants would use in pricing the asset or liability based on the information available. The inputs or methodology used for valuing assets or liabilities may not be an indication of the risks associated with investing in those assets or liabilities. The three-tier hierarchy of inputs is summarized below.
| • | Level 1—quoted prices (unadjusted) in active markets for an identical asset or liability |
| • | Level 2—other significant observable inputs (including quoted prices for a similar asset or liability in active markets, interest rates and yield curves, prepayment speeds, credit risk, etc.) |
| • | Level 3—significant unobservable inputs (including the Fund's own assumptions about the assumptions that market participants would use in measuring fair value of an asset or liability) |
The level of an asset or liability within the fair value hierarchy is based on the lowest level of an input, both individually and in the aggregate, that is significant to the fair value measurement. The aggregate value by input level of the Fund’s assets and liabilities as of October 31, 2022, is included at the end of the Portfolio of Investments.
The Fund may use third-party vendor evaluations, whose prices may be derived from one or more of the following standard inputs, among others:
| • Benchmark yields | • Reported trades |
| • Broker/dealer quotes | • Issuer spreads |
| • Two-sided markets | • Benchmark securities |
| • Bids/offers | • Reference data (corporate actions or material event notices) |
| • Industry and economic events | • Comparable bonds |
| • Monthly payment information | |
An asset or liability for which a market quotation is not readily available is valued by methods deemed reasonable in good faith by the Valuation Committee, following the Valuation Procedures to represent fair value. Under these procedures, the Valuation Designee generally uses a market-based approach which may use related or comparable assets or liabilities, recent transactions, market multiples, book values and other relevant information. The Valuation Designee may also use an income-based valuation approach in which the anticipated future cash flows of the asset or liability are discounted to calculate fair value. Discounts may also be applied due to the nature and/or duration of any restrictions on the disposition of the asset or liability. Fair value represents a good faith approximation of the value of a security. Fair value determinations involve the consideration of a number of subjective factors, an analysis of applicable facts and circumstances and the exercise of judgment. As a result, it is possible that the fair value for a security determined in good faith in accordance with the Valuation Procedures may differ from valuations for the same security determined for other funds using their own valuation procedures. Although the Valuation Procedures are designed to value a security at the price the Fund may reasonably expect to receive upon the security's sale in an orderly transaction, there can be no assurance that any fair value determination thereunder would, in fact, approximate the amount that the Fund would actually realize upon the sale of the security or the price at which the security would trade if a reliable market price were readily available. During the year ended October 31, 2022, there were no material changes to the fair value methodologies.
Securities which may be valued in this manner include, but are not limited to: (i) a security for which trading has been halted or suspended or
Notes to Financial Statements (continued)
otherwise does not have a readily available market quotation on a given day; (ii) a debt security that has recently gone into default and for which there is not a current market quotation; (iii) a security of an issuer that has entered into a restructuring; (iv) a security that has been delisted from a national exchange; (v) a security subject to trading collars for which no or limited trading takes place; and (vi) a security whose principal market has been temporarily closed at a time when, under normal conditions, it would be open. Securities valued in this manner are generally categorized as Level 2 or 3 in the hierarchy.
Equity securities are valued at the last quoted sales prices as of the close of regular trading on the relevant exchange on each valuation date. Securities that are not traded on the valuation date are valued at the mean of the last quoted bid and ask prices. Prices are normally taken from the principal market in which each security trades. These securities are generally categorized as Level 1 in the hierarchy.
Exchange-traded funds (“ETFs”) are valued at the last quoted sales prices as of the close of regular trading on the relevant exchange on each valuation date. Securities that are not traded on the valuation date are valued at the mean of the last quoted bid and ask prices. Prices are normally taken from the principal market in which each security trades. These securities are generally categorized as Level 1 in the hierarchy.
Investments in mutual funds, including money market funds, are valued at their respective NAVs at the close of business each day on the valuation date. These securities are generally categorized as Level 1 in the hierarchy.
Futures contracts are valued at the last posted settlement price on the market where such futures are primarily traded. These securities are generally categorized as Level 1 in the hierarchy.
Debt securities (other than convertible and municipal bonds) are valued at the evaluated bid prices (evaluated mean prices in the case of convertible and municipal bonds) supplied by a pricing agent or broker selected by the Valuation Designee, in consultation with the Subadvisors. The evaluations are market-based measurements processed through a pricing application and represents the pricing agent’s good faith determination as to what a holder may receive in an orderly transaction under market conditions. The rules-based logic utilizes valuation techniques that reflect participants’ assumptions and vary by asset class and per methodology, maximizing the use of relevant observable data including quoted prices for similar assets, benchmark yield curves and market corroborated inputs. The evaluated bid or mean prices are deemed by the Valuation Designee, in consultation with the Subadvisors, to be representative of market values at the regular close of trading of the Exchange on each valuation date. Debt securities purchased on a delayed delivery basis are marked to market daily until settlement at the forward settlement date. Debt securities, including corporate bonds, U.S. government and federal agency bonds, municipal bonds, foreign bonds, convertible bonds, asset-backed securities and mortgage-backed securities are generally categorized as Level 2 in the hierarchy.
Temporary cash investments acquired in excess of 60 days to maturity at the time of purchase are valued using the latest bid prices or using valuations based on a matrix system (which considers such factors as security prices, yields, maturities and ratings), both as furnished by independent pricing services. Temporary cash investments that mature in 60 days or less at the time of purchase ("Short-Term Investments") are valued using the amortized cost method of valuation, unless the use of such method would be inappropriate. The amortized cost method involves valuing a security at its cost on the date of purchase and thereafter assuming a constant amortization to maturity of the difference between such cost and the value on maturity date. Amortized cost approximates the current fair value of a security. Securities valued using the amortized cost method are not valued using quoted prices in an active market and are generally categorized as Level 2 in the hierarchy.
The information above is not intended to reflect an exhaustive list of the methodologies that may be used to value portfolio investments. The Valuation Procedures permit the use of a variety of valuation methodologies in connection with valuing portfolio investments. The methodology used for a specific type of investment may vary based on the market data available or other considerations. The methodologies summarized above may not represent the specific means by which portfolio investments are valued on any particular business day.
(B) Income Taxes. The Fund's policy is to comply with the requirements of the Internal Revenue Code of 1986, as amended (the “Internal Revenue Code”), applicable to regulated investment companies and to distribute all of its taxable income to the shareholders of the Fund within the allowable time limits.
The Manager evaluates the Fund’s tax positions to determine if the tax positions taken meet the minimum recognition threshold in connection with accounting for uncertainties in income tax positions taken or expected to be taken for the purposes of measuring and recognizing tax liabilities in the financial statements. Recognition of tax benefits of an uncertain tax position is permitted only to the extent the position is “more likely than not” to be sustained assuming examination by taxing authorities. The Manager analyzed the Fund's tax positions taken on federal, state and local income tax returns for all open tax years (for up to three tax years) and has concluded that no provisions for federal, state and local income tax are required in the Fund's financial statements. The Fund's federal, state and local income tax and federal excise tax returns for tax years for which the applicable statutes of limitations have not expired are subject to examination by the Internal Revenue Service and state and local departments of revenue.
(C) Dividends and Distributions to Shareholders. Dividends and distributions are recorded on the ex-dividend date. The Fund intends to declare and pay dividends from net investment income, if any, at least quarterly and distributions from net realized capital and currency gains, if any, at least annually. Unless a shareholder elects otherwise, all dividends and distributions are reinvested at NAV in the same class of shares of the Fund. Dividends and distributions to shareholders are determined in
accordance with federal income tax regulations and may differ from determinations using GAAP.
(D) Security Transactions and Investment Income. The Fund records security transactions on the trade date. Realized gains and losses on security transactions are determined using the identified cost method. Dividend income is recognized on the ex-dividend date, net of any foreign tax withheld at the source, and interest income is accrued as earned using the effective interest rate method. Distributions received from real estate investment trusts may be classified as dividends, capital gains and/or return of capital. Discounts and premiums on securities purchased for the Fund are accreted and amortized, respectively, on the effective interest rate method.
Investment income and realized and unrealized gains and losses on investments of the Fund are allocated pro rata to the separate classes of shares based upon their relative net assets on the date the income is earned or realized and unrealized gains and losses are incurred.
The Fund may place a debt security on non-accrual status and reduce related interest income by ceasing current accruals and writing off all or a portion of any interest receivables when the collection of all or a portion of such interest has become doubtful. A debt security is removed from non-accrual status when the issuer resumes interest payments or when collectability of interest is reasonably assured.
(E) Expenses. Expenses of the Trust are allocated to the individual Funds in proportion to the net assets of the respective Funds when the expenses are incurred, except where direct allocations of expenses can be made. Expenses (other than transfer agent expenses and fees incurred under the shareholder services plans and/or the distribution plans further discussed in Note 3(B)) are allocated to separate classes of shares pro rata based upon their relative net assets on the date the expenses are incurred. The expenses borne by the Fund, including those of related parties to the Fund, are shown in the Statement of Operations.
Additionally, the Fund may invest in ETFs and mutual funds, which are subject to management fees and other fees that may cause the costs of investing in ETFs and mutual funds to be greater than the costs of owning the underlying securities directly. These indirect expenses of ETFs and mutual funds are not included in the amounts shown as expenses in the Statement of Operations or in the expense ratios included in the Financial Highlights.
(F) Use of Estimates. In preparing financial statements in conformity with GAAP, the Manager makes estimates and assumptions that affect the reported amounts and disclosures in the financial statements. Actual results could differ from those estimates and assumptions.
(G) Futures Contracts. A futures contract is an agreement to purchase or sell a specified quantity of an underlying instrument at a specified future date and price, or to make or receive a cash payment based on the value of a financial instrument (e.g., foreign currency, interest rate, security or securities index). The Fund is subject to risks such as market price risk, leverage risk, liquidity risk, counterparty risk,
operational risk, legal risk and/or interest rate risk in the normal course of investing in these contracts. Upon entering into a futures contract, the Fund is required to pledge to the broker or futures commission merchant an amount of cash and/or U.S. government securities equal to a certain percentage of the collateral amount, known as the “initial margin.” During the period the futures contract is open, changes in the value of the contract are recognized as unrealized appreciation or depreciation by marking to market such contract on a daily basis to reflect the market value of the contract at the end of each day’s trading. The Fund agrees to receive from or pay to the broker or futures commission merchant an amount of cash equal to the daily fluctuation in the value of the contract. Such receipts or payments are known as “variation margin.” When the futures contract is closed, the Fund records a realized gain or loss equal to the difference between the proceeds from (or cost of) the closing transaction and the Fund's basis in the contract.
The use of futures contracts involves, to varying degrees, elements of market risk in excess of the amount recognized in the Statement of Assets and Liabilities. The contract or notional amounts and variation margin reflect the extent of the Fund's involvement in open futures positions. There are several risks associated with the use of futures contracts as hedging techniques. There can be no assurance that a liquid market will exist at the time when the Fund seeks to close out a futures contract. If no liquid market exists, the Fund would remain obligated to meet margin requirements until the position is closed. Futures contracts may involve a small initial investment relative to the risk assumed, which could result in losses greater than if the Fund did not invest in futures contracts. Futures contracts may be more volatile than direct investments in the instrument underlying the futures and may not correlate to the underlying instrument, causing a given hedge not to achieve its objectives. The Fund's activities in futures contracts have minimal counterparty risk as they are conducted through regulated exchanges that guarantee the futures against default by the counterparty. In the event of a bankruptcy or insolvency of a futures commission merchant that holds margin on behalf of the Fund, the Fund may not be entitled to the return of the entire margin owed to the Fund, potentially resulting in a loss. The Fund may invest in futures contracts to seek enhanced returns or to reduce the risk of loss by hedging certain of its holdings. The Fund's investment in futures contracts and other derivatives may increase the volatility of the Fund's NAVs and may result in a loss to the Fund. Open futures contracts as of October 31, 2022, are shown in the Portfolio of Investments.
(H) Securities Lending. In order to realize additional income, the Fund may engage in securities lending, subject to the limitations set forth in the 1940 Act and relevant guidance by the staff of the Securities and Exchange Commission (“SEC”). If the Fund engages in securities lending, the Fund will lend through its custodian, JPMorgan Chase Bank, N.A., ("JPMorgan"), acting as securities lending agent on behalf of the Fund. Under the current arrangement, JPMorgan will manage the Fund's collateral in accordance with the securities lending agency agreement between the Fund and JPMorgan, and indemnify the Fund against counterparty risk. The loans will be collateralized by cash (which may be
Notes to Financial Statements (continued)
invested in a money market fund) and/or non-cash collateral (which may include U.S. Treasury securities and/or U.S. government agency securities issued or guaranteed by the United States government or its agencies or instrumentalities) at least equal at all times to the market value of the securities loaned. Non-cash collateral held at year end is segregated and cannot be transferred by the Fund. The Fund bears the risk of delay in recovery of, or loss of rights in, the securities loaned. The Fund may also record a realized gain or loss on securities deemed sold due to a borrower’s inability to return securities on loan. The Fund bears the risk of any loss on investment of cash collateral. The Fund will receive compensation for lending its securities in the form of fees or it will retain a portion of interest earned on the investment of any cash collateral. The Fund will also continue to receive interest and dividends on the securities loaned and any gain or loss in the market price of the securities loaned that may occur during the term of the loan will be for the account of the Fund. Income earned from securities lending activities, if any, is reflected in the Statement of Operations. Securities on loan as of October 31, 2022, are shown in the Portfolio of Investments.
(I) Debt Securities Risk. The ability of issuers of debt securities held by the Fund to meet their obligations may be affected by, among other things, economic or political developments in a specific country, industry or region. Debt securities are also subject to the risks associated with changes in interest rates.
Investments in the Fund are not guaranteed, even though some of the Fund’s underlying investments are guaranteed by the U.S. government or its agencies or instrumentalities. The principal risk of mortgage-related and asset-backed securities is that the underlying debt may be prepaid ahead of schedule, if interest rates fall, thereby reducing the value of the Fund’s investment. If interest rates rise, less of the debt may be prepaid and the Fund may lose money because the Fund may be unable to invest in higher yielding assets. The Fund is subject to interest-rate risk and can lose principal value when interest rates rise. Bonds are also subject to credit risk, in which the bond issuer may fail to pay interest and principal in a timely manner.
The Fund may invest in foreign debt securities, which carry certain risks that are in addition to the usual risks inherent in domestic instruments. These risks include those resulting from currency fluctuations, future adverse political or economic developments and possible imposition of currency exchange blockages or other foreign governmental laws or restrictions. These risks are likely to be greater in emerging markets than in developed markets.
(J) LIBOR Replacement Risk. The Fund may invest in certain debt securities, derivatives or other financial instruments that utilize the London Interbank Offered Rate ("LIBOR"), as a “benchmark” or “reference rate” for various interest rate calculations. As of January 1, 2022, the United Kingdom Financial Conduct Authority, which regulates LIBOR, ceased its active encouragement of banks to provide the quotations needed to sustain most LIBOR rates due to the absence of an active market for interbank unsecured lending and other reasons. However, the United Kingdom Financial Conduct Authority, the LIBOR administrator and
other regulators announced that certain sterling and yen LIBOR settings would be calculated on a "synthetic" basis through the end of 2022 and the most widely used tenors of U.S. dollar LIBOR will continue until mid-2023. As a result, it is anticipated that the remaining LIBOR settings will be discontinued or will no longer be sufficiently robust to be representative of its underlying market around that time. Various financial industry groups will plan for that transition and certain regulators and industry groups have taken actions to establish alternative reference rates (e.g., the Secured Overnight Financing Rate, which measures the cost of overnight borrowings through repurchase agreement transactions collateralized with U.S. Treasury securities and is intended to replace U.S. dollar LIBOR with certain adjustments). However, there are challenges to converting certain contracts and transactions to a new benchmark and neither the full effects of the transition process nor its ultimate outcome is known.
The elimination of LIBOR or changes to other reference rates or any other changes or reforms to the determination or supervision of reference rates could have an adverse impact on the market for, or value of, any securities or payments linked to those reference rates, which may adversely affect the Fund's performance and/or net asset value. Uncertainty and risk also remain regarding the willingness and ability of issuers and lenders to include enhanced provisions in new and existing contracts or instruments. Consequently, the transition away from LIBOR to other reference rates may lead to increased volatility and illiquidity in markets that are tied to LIBOR, fluctuations in values of LIBOR-related investments or investments in issuers that utilize LIBOR, increased difficulty in borrowing or refinancing and diminished effectiveness of hedging strategies, adversely affecting the Fund's performance. Furthermore, the risks associated with the expected discontinuation of LIBOR and transition may be exacerbated if the work necessary to effect an orderly transition to an alternative reference rate is not completed in a timely manner. While the transition away from LIBOR has already begun with no material adverse effect to the Fund's performance, the transition is expected to last through mid-2023 for some LIBOR tenors. The usefulness of LIBOR as a benchmark could deteriorate anytime during this transition period.
(K) Indemnifications. Under the Trust’s organizational documents, its officers and trustees are indemnified against certain liabilities that may arise out of performance of their duties to the Trust. Additionally, in the normal course of business, the Fund enters into contracts with third-party service providers that contain a variety of representations and warranties and that may provide general indemnifications. The Fund's maximum exposure under these arrangements is unknown, as this would involve future claims that may be made against the Fund that have not yet occurred. The Manager believes that the risk of loss in connection with these potential indemnification obligations is remote. However, there can be no assurance that material liabilities related to such obligations will not arise in the future, which could adversely impact the Fund.
(L) Quantitative Disclosure of Derivative Holdings. The following tables show additional disclosures related to the Fund's derivative and hedging activities, including how such activities are accounted for and their effect on the Fund's financial positions, performance and cash flows.
The Fund entered into futures contracts to hedge against anticipated changes in interest rates that might otherwise have an adverse effect upon the value of the Fund’s securities as well as to help manage the duration and yield curve positioning of the portfolio.
Fair value of derivative instruments as of October 31, 2022:
| Asset Derivatives | Interest
Rate
Contracts
Risk | Total |
| Futures Contracts - Net Assets—Net unrealized appreciation on futures contracts (a) | $56,013 | $56,013 |
| Total Fair Value | $56,013 | $56,013 |
| (a) | Includes cumulative appreciation (depreciation) of futures contracts as reported in the Portfolio of Investments. Only current day’s variation margin is reported within the Statement of Assets and Liabilities. |
| Liability Derivatives | Interest
Rate
Contracts
Risk | Total |
| Futures Contracts - Net Assets—Net unrealized depreciation on futures contracts (a) | $(287,655) | $(287,655) |
| Total Fair Value | $(287,655) | $(287,655) |
| (a) | Includes cumulative appreciation (depreciation) of futures contracts as reported in the Portfolio of Investments. Only current day’s variation margin is reported within the Statement of Assets and Liabilities. |
The effect of derivative instruments on the Statement of Operations for the year ended October 31, 2022:
| Net Realized Gain (Loss) from: | Interest
Rate
Contracts
Risk | Total |
| Futures Contracts | $35,246 | $35,246 |
| Total Net Realized Gain (Loss) | $35,246 | $35,246 |
| Net Change in Unrealized Appreciation (Depreciation) | Interest
Rate
Contracts
Risk | Total |
| Futures Contracts | $(111,730) | $(111,730) |
| Total Net Change in Unrealized Appreciation (Depreciation) | $(111,730) | $(111,730) |
| Average Notional Amount | Total |
| Futures Contracts Long | $12,701,605 |
| Futures Contracts Short | $ (9,515,177) |
Note 3–Fees and Related Party Transactions
(A) Manager and Subadvisors. New York Life Investments, a registered investment adviser and an indirect, wholly-owned subsidiary of New York Life Insurance Company ("New York Life"), serves as the Fund’s Manager, pursuant to an Amended and Restated Management Agreement (“Management Agreement”). The Manager provides offices, conducts clerical, recordkeeping and bookkeeping services and keeps most of the financial and accounting records required to be maintained by the Fund. Except for the portion of salaries and expenses that are the responsibility of the Fund, the Manager pays the salaries and expenses of all personnel affiliated with the Fund and certain operational expenses of the Fund. During a portion of the year ended October 31, 2022, the Fund reimbursed New York Life Investments in an amount equal to the portion of the compensation of the Chief Compliance Officer attributable to the Fund. The Fund’s subadvisor changed effective March 5, 2021 due to the removal of MacKay Shields LLC ("MacKay Shields") as a subadvisor to the equity portion of the Fund and the appointment of Wellington Management Company LLP (“Wellington” or the “Subadvisor”) as a subadvisor to the equity portion of the Fund. Wellington, a registered investment adviser, is responsible for the day-to-day portfolio management of the equity portion of the Fund, pursuant to the terms of a Subadvisory Agreement (a “Subadvisory Agreement”) between New York Life Investments and Wellington. NYL Investors LLC (“NYL Investors” or the “Subadvisor,” and, together with Wellington, the “Subadvisors”), a registered investment adviser and a direct, wholly-owned subsidiary of New York Life, serves as the Subadvisor to the Fund and is responsible for the day-to-day portfolio management of the fixed-income portion of the Fund, pursuant to the terms of a Subadvisory Agreement between New York Life Investments and NYL Investors. New York Life Investments pays for the services of the Subadvisors.
Under the Management Agreement, the Fund pays the Manager a monthly fee for the services performed and the facilities furnished at an annual rate of the Fund’s average daily net assets as follows: 0.65% up to $1 billion; 0.625% from $1 billion to $2 billion; and 0.60% in excess of $2 billion. During the year ended October 31, 2022, the effective management fee rate was 0.65% of the Fund’s average daily net assets, exclusive of any applicable waivers/reimbursements.
New York Life Investments has contractually agreed to waive fees and/or reimburse expenses so that Total Annual Fund Operating Expenses (excluding taxes, interest, litigation, extraordinary expenses, brokerage and other transaction expenses relating to the purchase or sale of portfolio investments and acquired (underlying) fund fees and expenses) of Class R6 do not exceed those of Class I. This agreement will remain in effect until February 28, 2023, and shall renew automatically for one-year terms unless New York Life Investments provides written notice of termination prior to the start of the next term or upon approval of the Board.
During the year ended October 31, 2022, New York Life Investments earned fees from the Fund in the amount of $3,144,803 and waived fees and/or reimbursed expenses, including the voluntary
Notes to Financial Statements (continued)
waiver/reimbursement of certain class specific expenses in the amount of $12,455 and paid Wellington and NYL Investors $831,060 and $488,134, respectively.
JPMorgan provides sub-administration and sub-accounting services to the Fund pursuant to an agreement with New York Life Investments. These services include calculating the daily NAVs of the Fund, maintaining the general ledger and sub-ledger accounts for the calculation of the Fund's NAVs, and assisting New York Life Investments in conducting various aspects of the Fund's administrative operations. For providing these services to the Fund, JPMorgan is compensated by New York Life Investments.
Pursuant to an agreement between the Trust and New York Life Investments, New York Life Investments is responsible for providing or procuring certain regulatory reporting services for the Fund. The Fund will reimburse New York Life Investments for the actual costs incurred by New York Life Investments in connection with providing or procuring these services for the Fund.
(B) Distribution and Service Fees. The Trust, on behalf of the Fund, has entered into a distribution agreement with NYLIFE Distributors LLC (the “Distributor”), an affiliate of New York Life Investments. The Fund has adopted distribution plans (the “Plans”) in accordance with the provisions of Rule 12b-1 under the 1940 Act.
Pursuant to the Class A, Investor Class and Class R2 Plans, the Distributor receives a monthly fee from the Class A, Investor Class and Class R2 shares at an annual rate of 0.25% of the average daily net assets of the Class A, Investor Class and Class R2 shares for distribution and/or service activities as designated by the Distributor. Pursuant to the Class B and Class C Plans, Class B and Class C shares pay the Distributor a monthly distribution fee at an annual rate of 0.75% of the average daily net assets of the Class B and Class C shares, along with a service fee at an annual rate of 0.25% of the average daily net assets of the Class B and Class C shares, for a total 12b-1 fee of 1.00%. Pursuant to the Class R3 Plan, Class R3 shares pay the Distributor a monthly distribution fee at an annual rate of 0.25% of the average daily net assets of the Class R3 shares, along with a service fee at an annual rate of 0.25% of the average daily net assets of the Class R3 shares, for a total 12b-1 fee of 0.50%. Class I, Class R1 and Class R6 shares are not subject to a distribution and/or service fee.
The Plans provide that the distribution and service fees are payable to the Distributor regardless of the amounts actually expended by the Distributor for distribution of the Fund's shares and service activities.
In accordance with the Shareholder Services Plans for the Class R1, Class R2 and Class R3 shares, the Manager has agreed to provide, through its affiliates or independent third parties, various shareholder and administrative support services to shareholders of the Class R1, Class R2 and Class R3 shares. For its services, the Manager, its affiliates or independent third-party service providers are entitled to a shareholder service fee accrued daily and paid monthly at an annual rate of 0.10% of the average daily net assets of the Class R1, Class R2 and Class R3
shares. This is in addition to any fees paid under the Class R2 and Class R3 Plans.
During the year ended October 31, 2022, shareholder service fees incurred by the Fund were as follows:
| |
| Class R1 | $ 118 |
| Class R2 | 777 |
| Class R3 | 2,034 |
(C) Sales Charges. The Fund was advised by the Distributor that the amount of initial sales charges retained on sales of Class A and Investor Class shares during the year ended October 31, 2022, were $31,837 and $4,003, respectively.
The Fund was also advised that the Distributor retained CDSCs on redemptions of Class A, Investor Class, Class B and Class C shares during the year ended October 31, 2022, of $16,347, $8, $971 and $1,340, respectively.
(D) Transfer, Dividend Disbursing and Shareholder Servicing Agent. NYLIM Service Company LLC, an affiliate of New York Life Investments, is the Fund's transfer, dividend disbursing and shareholder servicing agent pursuant to an agreement between NYLIM Service Company LLC and the Trust. NYLIM Service Company LLC has entered into an agreement with DST Asset Manager Solutions, Inc. ("DST"), pursuant to which DST performs certain transfer agent services on behalf of NYLIM Service Company LLC. New York Life Investments has contractually agreed to limit the transfer agency expenses charged to the Fund’s share classes to a maximum of 0.35% of that share class’s average daily net assets on an annual basis after deducting any applicable Fund or class-level expense reimbursement or small account fees. This agreement will remain in effect until February 28, 2023, and shall renew automatically for one-year terms unless New York Life Investments provides written notice of termination prior to the start of the next term or upon approval of the Board. During the year ended October 31, 2022, transfer agent expenses incurred by the Fund and any reimbursements, pursuant to the aforementioned Transfer Agency expense limitation agreement, were as follows:
| Class | Expense | Waived |
| Class A | $306,371 | $ — |
| Investor Class | 157,596 | (7,290) |
| Class B | 28,026 | (1,402) |
| Class C | 76,742 | (3,763) |
| Class I | 52,368 | — |
| Class R1 | 104 | — |
| Class R2 | 670 | — |
| Class R3 | 1,777 | — |
| Class R6 | 4 | — |
(E) Small Account Fee. Shareholders with small accounts adversely impact the cost of providing transfer agency services. In an effort to reduce total transfer agency expenses, the Fund has implemented a small account fee on certain types of accounts. As described in the Fund's prospectus, certain shareholders with an account balance of less than $1,000 ($5,000 for Class A share accounts) are charged an annual per account fee of $20 (assessed semi-annually), the proceeds from which offset transfer agent fees as reflected in the Statement of Operations. This small account fee will not apply to certain types of accounts as described further in the Fund’s prospectus.
(F) Capital. As of October 31, 2022, New York Life and its affiliates beneficially held shares of the Fund with the values and percentages of net assets as follows:
Note 4-Federal Income Tax
As of October 31, 2022, the cost and unrealized appreciation (depreciation) of the Fund’s investment portfolio, including applicable derivative contracts and other financial instruments, as determined on a federal income tax basis, were as follows:
| | Federal Tax
Cost | Gross
Unrealized
Appreciation | Gross
Unrealized
(Depreciation) | Net
Unrealized
Appreciation/
(Depreciation) |
| Investments in Securities | $450,323,101 | $38,894,353 | $(20,383,216) | $18,511,137 |
As of October 31, 2022, the components of accumulated gain (loss) on a tax basis were as follows:
Ordinary
income | Accumulated
Capital
and Other
Gain (Loss) | Other
Temporary
Differences | Unrealized
Appreciation
(Depreciation) | Total
Accumulated
Gain (Loss) |
| $891,919 | $518,896 | $— | $18,501,690 | $19,912,505 |
The difference between book-basis and tax-basis unrealized appreciation (depreciation) is primarily due to mark to market of futures contracts, wash sale and cumulative bond amortization adjustments. The other temporary differences are primarily due to straddle loss deferral adjustments.
During the years ended October 31, 2022 and October 31, 2021, the tax character of distributions paid as reflected in the Statements of Changes in Net Assets was as follows:
| | 2022 | 2021 |
| Distributions paid from: | | |
| Ordinary Income | $64,088,486 | $4,025,384 |
| Long-Term Capital Gains | 33,192,278 | 5,296,381 |
| Total | $97,280,764 | $9,321,765 |
Note 5–Custodian
JPMorgan is the custodian of cash and securities held by the Fund. Custodial fees are charged to the Fund based on the Fund's net assets and/or the market value of securities held by the Fund and the number of certain transactions incurred by the Fund.
Note 6–Line of Credit
The Fund and certain other funds managed by New York Life Investments maintain a line of credit with a syndicate of banks in order to secure a source of funds for temporary purposes to meet unanticipated or excessive redemption requests.
Effective July 26, 2022, under the credit agreement (the “Credit Agreement”), the aggregate commitment amount is $600,000,000 with an additional uncommitted amount of $100,000,000. The commitment fee is an annual rate of 0.15% of the average commitment amount payable quarterly, regardless of usage, to JPMorgan, who serves as the agent to the syndicate. The commitment fee is allocated among the Fund and certain other funds managed by New York Life Investments based upon their respective net assets and other factors. Interest on any revolving credit loan is charged based upon the Federal Funds Rate, Daily Simple Secured Overnight Financing Rate ("SOFR") + 0.10%, or the Overnight Bank Funding Rate, whichever is higher. The Credit Agreement expires on July 25, 2023, although the Fund, certain other funds managed by New York Life Investments and the syndicate of banks may renew the Credit Agreement for an additional year on the same or different terms or enter into a credit agreement with a different syndicate of banks. Prior to July 26, 2022, the aggregate commitment amount and the commitment fee were the same as those under the current Credit Agreement. During the year ended October 31, 2022, there were no borrowings made or outstanding with respect to the Fund under the Credit Agreement.
Note 7–Interfund Lending Program
Pursuant to an exemptive order issued by the SEC, the Fund, along with certain other funds managed by New York Life Investments, may participate in an interfund lending program. The interfund lending program provides an alternative credit facility that permits the Fund and certain other funds managed by New York Life Investments to lend or borrow money for temporary purposes directly to or from one another, subject to the conditions of the exemptive order. During the year ended October 31, 2022, there were no interfund loans made or outstanding with respect to the Fund.
Note 8–Purchases and Sales of Securities (in 000’s)
During the year ended October 31, 2022, purchases and sales of U.S. government securities were $853,880 and $805,110, respectively. Purchases and sales of securities, other than U.S. government securities and short-term securities, were $502,320 and $563,704, respectively.
Notes to Financial Statements (continued)
The Fund may purchase securities from or sell securities to other portfolios managed by the Subadvisor. These interportfolio transactions are primarily used for cash management purposes and are made pursuant to Rule 17a-7 under the 1940 Act. During the year ended October 31, 2022, such purchases were $204.
Note 9–Capital Share Transactions
Transactions in capital shares for the years ended October 31, 2022 and October 31, 2021, were as follows:
| Class A | Shares | Amount |
| Year ended October 31, 2022: | | |
| Shares sold | 2,360,165 | $ 70,853,579 |
| Shares issued to shareholders in reinvestment of distributions | 2,244,761 | 66,915,052 |
| Shares redeemed | (1,808,327) | (53,389,436) |
| Net increase (decrease) in shares outstanding before conversion | 2,796,599 | 84,379,195 |
| Shares converted into Class A (See Note 1) | 195,265 | 5,809,937 |
| Shares converted from Class A (See Note 1) | (2,017) | (57,537) |
| Net increase (decrease) | 2,989,847 | $ 90,131,595 |
| Year ended October 31, 2021: | | |
| Shares sold | 1,354,099 | $ 47,965,141 |
| Shares issued to shareholders in reinvestment of distributions | 150,157 | 5,061,558 |
| Shares redeemed | (1,195,537) | (41,490,356) |
| Net increase (decrease) in shares outstanding before conversion | 308,719 | 11,536,343 |
| Shares converted into Class A (See Note 1) | 448,349 | 15,466,707 |
| Shares converted from Class A (See Note 1) | (151) | (5,190) |
| Net increase (decrease) | 756,917 | $ 26,997,860 |
| |
| Investor Class | Shares | Amount |
| Year ended October 31, 2022: | | |
| Shares sold | 93,127 | $ 2,823,914 |
| Shares issued to shareholders in reinvestment of distributions | 302,372 | 9,025,295 |
| Shares redeemed | (120,603) | (3,615,118) |
| Net increase (decrease) in shares outstanding before conversion | 274,896 | 8,234,091 |
| Shares converted into Investor Class (See Note 1) | 30,476 | 895,730 |
| Shares converted from Investor Class (See Note 1) | (134,021) | (4,026,279) |
| Net increase (decrease) | 171,351 | $ 5,103,542 |
| Year ended October 31, 2021: | | |
| Shares sold | 96,125 | $ 3,343,506 |
| Shares issued to shareholders in reinvestment of distributions | 23,555 | 784,434 |
| Shares redeemed | (124,594) | (4,313,833) |
| Net increase (decrease) in shares outstanding before conversion | (4,914) | (185,893) |
| Shares converted into Investor Class (See Note 1) | 39,661 | 1,396,885 |
| Shares converted from Investor Class (See Note 1) | (367,545) | (12,630,334) |
| Net increase (decrease) | (332,798) | $ (11,419,342) |
| |
| Class B | Shares | Amount |
| Year ended October 31, 2022: | | |
| Shares sold | 8,150 | $ 241,370 |
| Shares issued to shareholders in reinvestment of distributions | 56,056 | 1,653,945 |
| Shares redeemed | (64,900) | (1,895,859) |
| Net increase (decrease) in shares outstanding before conversion | (694) | (544) |
| Shares converted from Class B (See Note 1) | (53,480) | (1,538,713) |
| Net increase (decrease) | (54,174) | $ (1,539,257) |
| Year ended October 31, 2021: | | |
| Shares sold | 6,425 | $ 226,427 |
| Shares issued to shareholders in reinvestment of distributions | 3,830 | 124,552 |
| Shares redeemed | (53,970) | (1,853,573) |
| Net increase (decrease) in shares outstanding before conversion | (43,715) | (1,502,594) |
| Shares converted from Class B (See Note 1) | (54,584) | (1,900,545) |
| Net increase (decrease) | (98,299) | $ (3,403,139) |
| |
| Class C | Shares | Amount |
| Year ended October 31, 2022: | | |
| Shares sold | 68,601 | $ 2,020,751 |
| Shares issued to shareholders in reinvestment of distributions | 162,107 | 4,781,182 |
| Shares redeemed | (288,775) | (8,590,050) |
| Net increase (decrease) in shares outstanding before conversion | (58,067) | (1,788,117) |
| Shares converted from Class C (See Note 1) | (39,389) | (1,131,929) |
| Net increase (decrease) | (97,456) | $ (2,920,046) |
| Year ended October 31, 2021: | | |
| Shares sold | 39,332 | $ 1,374,443 |
| Shares issued to shareholders in reinvestment of distributions | 11,959 | 388,510 |
| Shares redeemed | (316,160) | (10,913,710) |
| Net increase (decrease) in shares outstanding before conversion | (264,869) | (9,150,757) |
| Shares converted from Class C (See Note 1) | (66,531) | (2,316,844) |
| Net increase (decrease) | (331,400) | $ (11,467,601) |
| |
| Class I | Shares | Amount |
| Year ended October 31, 2022: | | |
| Shares sold | 290,133 | $ 8,591,839 |
| Shares issued to shareholders in reinvestment of distributions | 421,036 | 12,591,346 |
| Shares redeemed | (620,781) | (19,940,257) |
| Net increase (decrease) in shares outstanding before conversion | 90,388 | 1,242,928 |
| Shares converted into Class I (See Note 1) | 1,718 | 48,791 |
| Net increase (decrease) | 92,106 | $ 1,291,719 |
| Year ended October 31, 2021: | | |
| Shares sold | 504,349 | $ 17,414,410 |
| Shares issued to shareholders in reinvestment of distributions | 81,649 | 2,728,015 |
| Shares redeemed | (3,739,247) | (132,973,686) |
| Net increase (decrease) in shares outstanding before conversion | (3,153,249) | (112,831,261) |
| Shares converted into Class I (See Note 1) | 344 | 11,556 |
| Net increase (decrease) | (3,152,905) | $(112,819,705) |
| |
| Class R1 | Shares | Amount |
| Year ended October 31, 2022: | | |
| Shares sold | 2,606 | $ 72,308 |
| Shares issued to shareholders in reinvestment of distributions | 739 | 22,059 |
| Shares redeemed | (62) | (1,828) |
| Net increase (decrease) | 3,283 | $ 92,539 |
| Year ended October 31, 2021: | | |
| Shares sold | 424 | $ 14,788 |
| Shares issued to shareholders in reinvestment of distributions | 51 | 1,742 |
| Shares redeemed | (135) | (4,437) |
| Net increase (decrease) | 340 | $ 12,093 |
| |
| Class R2 | Shares | Amount |
| Year ended October 31, 2022: | | |
| Shares sold | 3,483 | $ 103,858 |
| Shares issued to shareholders in reinvestment of distributions | 4,437 | 132,743 |
| Shares redeemed | (15,258) | (476,966) |
| Net increase (decrease) | (7,338) | $ (240,365) |
| Year ended October 31, 2021: | | |
| Shares sold | 4,917 | $ 171,250 |
| Shares issued to shareholders in reinvestment of distributions | 811 | 27,261 |
| Shares redeemed | (31,644) | (1,156,562) |
| Net increase (decrease) in shares outstanding before conversion | (25,916) | (958,051) |
| Shares converted from Class R2 (See Note 1) | (597) | (22,235) |
| Net increase (decrease) | (26,513) | $ (980,286) |
| |
| Class R3 | Shares | Amount |
| Year ended October 31, 2022: | | |
| Shares sold | 12,338 | $ 363,100 |
| Shares issued to shareholders in reinvestment of distributions | 14,211 | 423,138 |
| Shares redeemed | (19,963) | (593,453) |
| Net increase (decrease) | 6,586 | $ 192,785 |
| Year ended October 31, 2021: | | |
| Shares sold | 12,366 | $ 434,812 |
| Shares issued to shareholders in reinvestment of distributions | 1,017 | 33,747 |
| Shares redeemed | (27,360) | (926,559) |
| Net increase (decrease) | (13,977) | $ (458,000) |
| |
| Class R6 | Shares | Amount |
| Year ended October 31, 2022: | | |
| Shares issued to shareholders in reinvestment of distributions | 405 | $ 12,112 |
| Shares redeemed | (182) | (5,417) |
| Net increase (decrease) | 223 | $ 6,695 |
| Year ended October 31, 2021: | | |
| Shares issued to shareholders in reinvestment of distributions | 35 | $ 1,168 |
| Shares redeemed | (16) | (530) |
| Net increase (decrease) | 19 | $ 638 |
Note 10–Other Matters
As of the date of this report, interest rates in the United States and many parts of the world, including certain European countries, are ascending from historically low levels. Thus, the Fund currently faces a heightened level of risk associated with rising interest rates. This could be driven by a variety of factors, including but not limited to central bank monetary policies, changing inflation or real growth rates, general economic
Notes to Financial Statements (continued)
conditions, increasing bond issuances or reduced market demand for low yielding investments.
An outbreak of COVID-19, first detected in December 2019, has developed into a global pandemic and has resulted in travel restrictions, closure of international borders, certain businesses and securities markets, restrictions on securities trading activities, prolonged quarantines, supply chain disruptions, and lower consumer demand, as well as general concern and uncertainty. In 2022, many countries lifted some or all restrictions related to COVID-19. However, the continued impact of COVID-19 and related variants is uncertain and could further adversely affect the global economy, national economies, individual issuers and capital markets in unforeseeable ways and result in a substantial and extended economic downturn. Developments that disrupt global economies and financial markets, such as COVID-19, may magnify factors that affect the Fund's performance.
Note 11–Subsequent Events
In connection with the preparation of the financial statements of the Fund as of and for the year ended October 31, 2022, events and transactions subsequent to October 31, 2022, through the date the financial statements were issued have been evaluated by the Manager for possible adjustment and/or disclosure. No subsequent events requiring financial statement adjustment or disclosure have been identified.
Report of Independent Registered Public Accounting Firm
To the Shareholders of the Fund and Board of Trustees
MainStay Funds Trust:
Opinion on the Financial Statements
We have audited the accompanying statement of assets and liabilities of MainStay Balanced Fund (the Fund), one of the funds constituting MainStay Funds Trust, including the portfolio of investments, as of October 31, 2022, the related statement of operations for the year then ended, the statements of changes in net assets for each of the years in the two year period then ended, and the related notes (collectively, the financial statements) and the financial highlights for each of the years or periods in the five year period then ended. In our opinion, the financial statements and financial highlights present fairly, in all material respects, the financial position of the Fund as of October 31, 2022, the results of its operations for the year then ended, the changes in its net assets for each of the years in the two year period then ended, and the financial highlights for each of the years or periods in the five year period then ended, in conformity with U.S. generally accepted accounting principles.
Basis for Opinion
These financial statements and financial highlights are the responsibility of the Fund's management. Our responsibility is to express an opinion on these financial statements and financial highlights based on our audits. We are a public accounting firm registered with the Public Company Accounting Oversight Board (United States) (PCAOB) and are required to be independent with respect to the Fund in accordance with the U.S. federal securities laws and the applicable rules and regulations of the Securities and Exchange Commission and the PCAOB.
We conducted our audits in accordance with the standards of the PCAOB. Those standards require that we plan and perform the audit to obtain reasonable assurance about whether the financial statements and financial highlights are free of material misstatement, whether due to error or fraud. Our audits included performing procedures to assess the risks of material misstatement of the financial statements and financial highlights, whether due to error or fraud, and performing procedures that respond to those risks. Such procedures included examining, on a test basis, evidence regarding the amounts and disclosures in the financial statements and financial highlights. Such procedures also included confirmation of securities owned as of October 31, 2022, by correspondence with custodians, the transfer agent and brokers; when replies were not received from brokers, we performed other auditing procedures. Our audits also included evaluating the accounting principles used and significant estimates made by management, as well as evaluating the overall presentation of the financial statements and financial highlights. We believe that our audits provide a reasonable basis for our opinion.

We have served as the auditor of one or more New York Life Investment Management investment companies since 2003.
Philadelphia, Pennsylvania
December 23, 2022
Federal Income Tax Information
(Unaudited)
The Fund is required under the Internal Revenue Code to advise shareholders in a written statement as to the federal tax status of dividends paid by the Fund during such fiscal years. Accordingly, the Fund paid $33,159,933 as long term capital gain distributions.
For the fiscal year ended October 31, 2022, the Fund designated approximately $10,572,069 under the Internal Revenue Code as qualified dividend income eligible for reduced tax rates.
The dividends paid by the Fund during the fiscal year ended October 31, 2022 should be multiplied by 15.11% to arrive at the amount eligible for the corporate dividend-received deduction.
In February 2023, shareholders will receive an IRS Form 1099-DIV or substitute Form 1099, which will show the federal tax status of the distributions received by shareholders in calendar year 2022. The amounts that will be reported on such 1099-DIV or substitute Form 1099 will be the amounts you are to use on your federal income tax return and will differ from the amounts which we must report for the Fund's fiscal year ended October 31, 2022.
Proxy Voting Policies and Procedures and Proxy Voting Record
The Fund is required to file with the SEC its proxy voting record for the 12-month period ending June 30 on Form N-PX. A description of the policies and procedures that are used to vote proxies relating to portfolio securities of the Fund is available free of charge upon request by calling 800-624-6782 or visiting the SEC’s website at www.sec.gov. The most recent Form N-PX or proxy voting record is available free of charge upon request by calling 800-624-6782; visiting newyorklifeinvestments.com; or visiting the SEC’s website at www.sec.gov.
Shareholder Reports and Quarterly Portfolio Disclosure
The Fund is required to file its complete schedule of portfolio holdings with the SEC 60 days after its first and third fiscal quarter on Form N-PORT. The Fund's holdings report is available free of charge upon request by calling New York Life Investments at 800-624-6782.
Board of Trustees and Officers (Unaudited)
The Trustees and officers of the Fund are listed below. The Board oversees the MainStay Group of Funds (which consists of MainStay Funds and MainStay Funds Trust), MainStay VP Funds Trust, MainStay MacKay DefinedTerm Municipal Opportunities Fund, MainStay CBRE Global Infrastructure Megatrends Fund, the Manager and the Subadvisors, and elects the officers of the Funds who are responsible for the day-to-day operations of the Fund. Information pertaining to the Trustees and officers is set forth below. Each Trustee serves until his or her successor is
elected and qualified or until his or her resignation, death or removal. Under the Board’s retirement policy, unless an exception is made, a Trustee must tender his or her resignation by the end of the calendar year during which he or she reaches the age of 75. The business address of each Trustee and officer listed below is 51 Madison Avenue, New York, New York 10010. None of the Trustees are “interested persons” (as defined by the 1940 Act and rules adopted by the SEC thereunder) of the Fund (“Independent Trustees”).
| | Name and
Year of Birth | Term of Office,
Position(s) Held and
Length of Service | Principal Occupation(s)
During Past Five Years | Number of
Portfolios in
Fund Complex
Overseen by
Trustee | Other Directorships
Held by Trustee |
| | | | | | |
| | David H. Chow
1957 | MainStay Funds: Trustee since 2016, Advisory Board Member (June 2015 to December 2015);MainStay Funds Trust:
Trustee since January 2016, Advisory Board Member (June 2015 to December 2015) | Founder and CEO, DanCourt Management, LLC since 1999 | 78 | MainStay VP Funds Trust: Trustee since January 2016, Advisory Board Member (June 2015 to December 2015) (31 portfolios);
MainStay MacKay DefinedTerm Municipal Opportunities Fund: Trustee since January 2016, Advisory Board Member (June 2015 to December 2015);
MainStay CBRE Global Infrastructure Megatrends Fund: Trustee since June 2021; VanEck Vectors Group of Exchange-Traded Funds: Independent Chairman of the Board of Trustees since 2008 and Trustee since 2006 (56 portfolios); and Berea College of Kentucky: Trustee since 2009, Chair of the Investment Committee since 2018 |
| | Susan B. Kerley
1951 | MainStay Funds: Chairman since 2017 and Trustee since 2007;MainStay Funds Trust:
Chairman since 2017 and Trustee since 1990** | President, Strategic Management Advisors LLC since 1990 | 78 | MainStay VP Funds Trust: Chairman since January 2017 and Trustee since 2007 (31 portfolios)**;
MainStay MacKay DefinedTerm Municipal Opportunities Fund: Chairman since 2017 and Trustee since 2011;
MainStay CBRE Global Infrastructure Megatrends Fund: Trustee since June 2021; and Legg Mason Partners Funds: Trustee since 1991 (45 portfolios) |
| | Alan R. Latshaw
1951 | MainStay Funds: Trustee since 2006;MainStay Funds Trust:
Trustee since 2007*** | Retired; Partner, Ernst & Young LLP (2002 to 2003); Partner, Arthur Andersen LLP (1989 to 2002); Consultant to the MainStay Funds Audit and Compliance Committee (2004 to 2006) | 78 | MainStay VP Funds Trust: Trustee since 2007 (31 portfolios)**;
MainStay MacKay DefinedTerm Municipal Opportunities Fund: Trustee since 2011; and
MainStay CBRE Global Infrastructure Megatrends Fund: Trustee since June 2021 |
Board of Trustees and Officers (Unaudited) (continued)
| | Name and
Year of Birth | Term of Office,
Position(s) Held and
Length of Service | Principal Occupation(s)
During Past Five Years | Number of
Portfolios in
Fund Complex
Overseen by
Trustee | Other Directorships
Held by Trustee |
| | | | | | |
| | Karen Hammond
1956 | MainStay Funds: Trustee since December 2021, Advisory Board Member (June 2021 to December 2021);MainStay Funds Trust:
Trustee since December 2021, Advisory Board Member (June 2021 to December 2021)
| Retired, Managing Director, Devonshire Investors (2007 to 2013); Senior Vice President, Fidelity Management & Research Co. (2005 to 2007); Senior Vice President and Corporate Treasurer, FMR Corp. (2003 to 2005); Chief Operating Officer, Fidelity Investments Japan (2001 to 2003) | 78 | MainStay VP Funds Trust: Trustee since December 2021, Advisory Board Member (June 2021 to December 2021) (31 Portfolios);
MainStay MacKay DefinedTerm Municipal Opportunities Fund: Trustee since December 2021, Advisory Board Member (June 2021 to December 2021);
MainStay CBRE Global Infrastructure Megatrends Fund: Trustee since December 2021, Advisory Board Member (June 2021 to December 2021);
Two Harbors Investment Corp.: Director since 2018;
Rhode Island State Investment Commission: Member since 2017; and
Blue Cross Blue Shield of Rhode Island: Director since 2019 |
| | Jacques P. Perold
1958 | MainStay Funds: Trustee since 2016, Advisory Board Member (June 2015 toDecember 2015);MainStay Funds Trust:
Trustee since January 2016, Advisory Board Member (June 2015 to December 2015) | Founder and Chief Executive Officer, CapShift Advisors LLC (since 2018); President, Fidelity Management & Research Company (2009 to 2014); President and Chief Investment Officer, Geode Capital Management, LLC (2001 to 2009) | 78 | MainStay VP Funds Trust: Trustee since January 2016, Advisory Board Member (June 2015 to December 2015) (31 portfolios);
MainStay MacKay DefinedTerm Municipal Opportunities Fund: Trustee since January 2016, Advisory Board Member (June 2015 to December 2015);
MainStay CBRE Global Infrastructure Megatrends Fund: Trustee since June 2021; Partners in Health: Trustee since 2019; Allstate Corporation: Director since 2015; and MSCI Inc.: Director since 2017 |
| | Richard S. Trutanic
1952 | MainStay Funds: Trustee since 1994;MainStay Funds Trust:
Trustee since 2007*** | Chairman and Chief Executive Officer, Somerset & Company (financial advisory firm) since 2004; Managing Director, The Carlyle Group (private investment firm) (2002 to 2004); Senior Managing Director, Partner and Board Member, Groupe Arnault S.A. (private investment firm) (1999 to 2002) | 78 | MainStay VP Funds Trust: Trustee since 2007 (31 portfolios)**;
MainStay MacKay DefinedTerm Municipal Opportunities Fund: Trustee since 2011; and MainStay CBRE Global Infrastructure Megatrends Fund: Trustee since June 2021 |
| ** | Includes prior service as a Director of MainStay VP Series Fund, Inc., the predecessor to MainStay VP Funds Trust. |
| *** | Includes prior service as a Director/Trustee of certain predecessor entities to MainStay Funds Trust. |
| | Name and
Year of Birth | Position(s) Held and
Length of Service | Principal Occupation(s)
During Past Five Years | |
| | | | | |
| | Kirk C. Lehneis
1974 | President, MainStay Funds, MainStay Funds Trust since 2017 | Chief Operating Officer and Senior Managing Director (since 2016), New York Life Investment Management LLC and New York Life Investment Management Holdings LLC; Member of the Board of Managers (since 2017) and Senior Managing Director (since 2018), NYLIFE Distributors LLC; Chairman of the Board and Senior Managing Director, NYLIM Service Company LLC (since 2017); Trustee, President and Principal Executive Officer of IndexIQ Trust, IndexIQ ETF Trust and IndexIQ Active ETF Trust (since January 2018); President, MainStay CBRE Global Infrastructure Megatrends Fund (since 2021), MainStay MacKay DefinedTerm Municipal Opportunities Fund and MainStay VP Funds Trust (since 2017); Senior Managing Director, Global Product Development (From 2015-2016); Managing Director, Product Development (2010 to 2015), New York Life Investment Management LLC | |
| | Jack R. Benintende
1964 | Treasurer and Principal Financial and Accounting Officer, MainStay Funds (since 2007), MainStay Funds Trust (since 2009) | Managing Director, New York Life Investment Management LLC (since 2007); Treasurer and Principal Financial and Accounting Officer, MainStay CBRE Global Infrastructure Megatrends Fund (since 2021), MainStay MacKay DefinedTerm Municipal Opportunities Fund (since 2011) and MainStay VP Funds Trust (since 2007)** and Assistant Treasurer, New York Life Investment Management Holdings LLC (2008 to 2012) | |
| | J. Kevin Gao
1967 | Secretary and Chief Legal Officer, MainStay Funds and MainStay Funds Trust (since 2010) | Managing Director and Associate General Counsel, New York Life Investment Management LLC (since 2010); Secretary and Chief Legal Officer and MainStay CBRE Global Infrastructure Megatrends Fund (since 2021), MainStay MacKay DefinedTerm Municipal Opportunities Fund (since 2011) and MainStay VP Funds Trust (since 2010)** | |
| | Scott T. Harrington
1959 | Vice President— Administration, MainStay Funds (since 2009), MainStay Funds Trust (since 2009) | Managing Director, New York Life Investment Management LLC (including predecessor advisory organizations) (since 2000); Member of the Board of Directors, New York Life Trust Company (since 2009); Vice President—Administration, MainStay CBRE Global Infrastructure Megatrends Fund (since 2021), MainStay MacKay DefinedTerm Municipal Opportunities Fund (since 2011) and MainStay VP Funds Trust (since 2005)** | |
| | Kevin M. Gleason
1967 | Vice President and Chief Compliance Officer, MainStay Funds and MainStay Funds Trust (since June 2022) | Vice President and Chief Compliance Officer, IndexIQ, IndexIQ ETF Trust and Index IQ Active ETF Trust (since June 2022); Vice President and Chief Compliance Officer, MainStay CBRE Global Infrastructure Megatrends Fund, MainStay VP Funds Trust and MainStay MacKay DefinedTerm Municipal Opportunities Fund (since June 2022); Senior Vice President, Voya Investment Management and Chief Compliance Officer, Voya Family of Funds (2012-2022) | |
| * | The officers listed above are considered to be “interested persons” of the MainStay Group of Funds, MainStay VP Funds Trust, MainStay CBRE Global Infrastructure Megatrends Fund and MainStay MacKay DefinedTerm Municipal Opportunities Fund within the meaning of the 1940 Act because of their affiliation with the MainStay Group of Funds, New York Life Insurance Company and/or its affiliates, including New York Life Investment Management LLC, NYLIM Service Company LLC, NYLIFE Securities LLC and/or NYLIFE Distributors LLC, as described in detail in the column captioned “Principal Occupation(s) During Past Five Years.” Officers are elected annually by the Board. |
| ** | Includes prior service as an Officer of MainStay VP Series Fund, Inc., the predecessor to MainStay VP Funds Trust. |
Officers of the Trust (Who are not Trustees)*
This page intentionally left blank.
This page intentionally left blank.
This page intentionally left blank.
Equity
U.S. Equity
MainStay Epoch U.S. Equity Yield Fund
MainStay S&P 500 Index Fund1
MainStay Winslow Large Cap Growth Fund
MainStay WMC Enduring Capital Fund
MainStay WMC Growth Fund
MainStay WMC Small Companies Fund
MainStay WMC Value Fund
International Equity
MainStay Epoch International Choice Fund
MainStay MacKay International Equity Fund
MainStay WMC International Research Equity Fund
Emerging Markets Equity
MainStay Candriam Emerging Markets Equity Fund
Global Equity
MainStay Epoch Capital Growth Fund
MainStay Epoch Global Equity Yield Fund
Fixed Income
Taxable Income
MainStay Candriam Emerging Markets Debt Fund
MainStay Floating Rate Fund
MainStay MacKay High Yield Corporate Bond Fund
MainStay MacKay Short Duration High Yield Fund
MainStay MacKay Strategic Bond Fund
MainStay MacKay Total Return Bond Fund
MainStay MacKay U.S. Infrastructure Bond Fund
MainStay Short Term Bond Fund
Tax-Exempt Income
MainStay MacKay California Tax Free Opportunities Fund2
MainStay MacKay High Yield Municipal Bond Fund
MainStay MacKay New York Tax Free Opportunities Fund3
MainStay MacKay Short Term Municipal Fund
MainStay MacKay Strategic Municipal Allocation Fund
MainStay MacKay Tax Free Bond Fund
Money Market
MainStay Money Market Fund
Mixed Asset
MainStay Balanced Fund
MainStay Income Builder Fund
MainStay MacKay Convertible Fund
Speciality
MainStay CBRE Global Infrastructure Fund
MainStay CBRE Real Estate Fund
MainStay Cushing MLP Premier Fund
Asset Allocation
MainStay Conservative Allocation Fund
MainStay Conservative ETF Allocation Fund
MainStay Defensive ETF Allocation Fund
MainStay Equity Allocation Fund
MainStay Equity ETF Allocation Fund
MainStay ESG Multi-Asset Allocation Fund
MainStay Growth Allocation Fund
MainStay Growth ETF Allocation Fund
MainStay Moderate Allocation Fund
MainStay Moderate ETF Allocation Fund
Manager
New York Life Investment Management LLC
New York, New York
Subadvisors
Candriam4
Strassen, Luxembourg
CBRE Investment Management Listed Real Assets LLC
Radnor, Pennsylvania
Cushing Asset Management, LP
Dallas, Texas
Epoch Investment Partners, Inc.
New York, New York
MacKay Shields LLC4
New York, New York
NYL Investors LLC4
New York, New York
Wellington Management Company LLP
Boston, Massachusetts
Winslow Capital Management, LLC
Minneapolis, Minnesota
Legal Counsel
Dechert LLP
Washington, District of Columbia
Independent Registered Public Accounting Firm
KPMG LLP
Philadelphia, Pennsylvania
Distributor
NYLIFE Distributors LLC4
Jersey City, New Jersey
Custodian
JPMorgan Chase Bank, N.A.
New York, New York
1.
Prior to February 28, 2022, the Fund's name was MainStay MacKay S&P 500 Index Fund.
| 2. | This Fund is registered for sale in AZ, CA, NV, OR, TX, UT, WA and MI (Class A and Class I shares only), and CO, FL, GA, HI, ID, MA, MD, NH, NJ and NY (Class I shares only). |
| 3. | This Fund is registered for sale in CA, CT, DE, FL, MA, NJ, NY and VT. |
| 4. | An affiliate of New York Life Investment Management LLC. |
Not part of the Annual Report
For more information
800-624-6782
newyorklifeinvestments.com
“New York Life Investments” is both a service mark, and the common trade name, of certain investment advisors affiliated with New York Life Insurance Company. The MainStay Funds® are managed by New York Life Investment Management LLC and distributed by NYLIFE Distributors LLC, 30 Hudson Street, Jersey City, NJ 07302, a wholly owned subsidiary of New York Life Insurance Company. NYLIFE Distributors LLC is a Member FINRA/SIPC.
©2022 NYLIFE Distributors LLC. All rights reserved.
| 5013770.2MS229-22 | MSBL11-12/22 |
(NYLIM) NL231
MainStay Candriam Emerging Markets Equity Fund
Message from the President and Annual Report
October 31, 2022
Sign up for e-delivery of your shareholder reports. For full details on e-delivery, including who can participate and what you can receive via e-delivery,
please log in to newyorklifeinvestments.com/accounts.
| Not FDIC/NCUA Insured | Not a Deposit | May Lose Value | No Bank Guarantee | Not Insured by Any Government Agency |
This page intentionally left blank
Message from the President
A series of economic and geopolitical challenges undermined equity and fixed-income markets during the 12-month reporting period ended October 31, 2022. Stocks and bonds alike trended lower in the face of sharply rising interest rates, increasing inflationary pressures, slowing economic growth and Russia’s invasion of Ukraine.
The reporting period began on a mixed note, with concerns about the spreading Omicron variant of the COVID-19 virus and increasingly hawkish statements from the U.S. Federal Reserve (the “Fed”) regarding mounting inflation, countered by bullish sentiment stemming from U.S. economic growth and strong corporate earnings. In January 2022, markets turned decisively negative as comments from the Fed raised the likelihood of rate hikes as early as March, and Russia issued increasingly aggressive threats toward Ukraine. The onset of Russia’s invasion in February exacerbated global inflationary pressures while increasing investor uncertainty. Domestic supply shortages, international trade imbalances and rising inflation caused GDP (gross domestic product) to contract in the first and second quarters of the year, although employment and consumer spending proved resilient. Prices for petroleum surged to multi-year highs, while many key agricultural chemicals and industrial metals climbed as well. Accelerating inflationary forces prompted the Fed to implement its most aggressive interest rate increases since the 1980s with a series of five sharp rate hikes, raising the federal funds rate from a range of 0.00% to 0.25% in March to 3.00% to 3.25% in September, with additional rate hikes expected before the end of the year. International central banks generally followed suit, raising rates by varying degrees in efforts to curb local inflation, although most increases remained significantly more modest than those in the United States. Relatively high U.S. interest rates and risk-averse international sentiment pushed U.S. dollar values higher compared to most other currencies, with the ensuing negative impact on global prices for food, fuel and other key, U.S.-dollar-denominated products.
The effects of these interrelated challenges were felt throughout U.S. and international financial markets. The S&P 500® Index, a widely regarded benchmark of U.S. market performance, declined by more than 14% during the reporting period. Although the energy sector generated strong gains, bolstered by elevated oil and gas prices, most other industry areas recorded losses. The more cyclical and growth-oriented sectors of consumer discretionary, real estate and information technology delivered the
weakest returns, while the traditionally defensive and value-oriented consumer staples, utilities and health care sectors outperformed. International stocks lagged compared to their U.S. counterparts, with some emerging markets, such as China, suffering particularly steep losses. A few markets, however, including Brazil, Mexico and the United Arab Emirates, ended the reporting period with little change. Fixed-income markets saw bond prices broadly decline as yields rose along with interest rates. Short-term yields rose faster than long-term yields, producing a yield curve inversion from July through the end of the reporting period, with long-term rates remaining below short-term rates. While floating-rate instruments, which feature variable interest rates that allow investors to benefit from a rising rate environment, provided a degree of insulation from inflation-driven trends, they were not immune to the market’s widespread declines.
While the Fed acknowledges the costs of rising rates in terms of weaker GDP growth and unsettled financial markets over the short term, its primary focus continues to be the longer-term economic impact of inflation. With the latest figures as of the date of this report showing that inflation remains above 8%, versus a target rate of just 2%, the Fed clearly has a distance yet to go, making further rate increases and market volatility more likely in the coming months. The question remains as to whether the Fed and other central banks will manage a so-called “soft landing,” curbing inflation while avoiding a persistent economic slowdown. If they prove successful, we expect that favorable inflation trends and increasingly attractive valuations in both equity and bond markets should eventually translate into sustainable improvements in the investment environment.
Whatever actions the Fed takes and however financial markets react, as a MainStay investor, you can depend on us to continue providing the insight, expertise and service that have long defined New York Life Investments. Thank you for trusting us to help you meet your investment needs.
Sincerely,
Kirk C. Lehneis
President
The opinions expressed are as of the date of this report and are subject to change. There is no guarantee that any forecast made will come to pass. This material does not constitute investment advice and is not intended as an endorsement of any specific investment. Past performance is no guarantee of future results.
Not part of the Annual Report
Investors should refer to the Fund’s Summary Prospectus and/or Prospectus and consider the Fund’s investment objectives, strategies, risks, charges and expenses carefully before investing. The Summary Prospectus and/or Prospectus contain this and other information about the Fund. You may obtain copies of the Fund’s Summary Prospectus, Prospectus and Statement of Additional Information, which includes information about the MainStay Funds Trust's Trustees, free of charge, upon request, by calling toll-free 800-624-6782, by writing to NYLIFE Distributors LLC, Attn: MainStay Marketing Department, 30 Hudson Street, Jersey City, NJ 07302 or by sending an e-mail to MainStayShareholderServices@nylim.com. These documents are also available via the MainStay Funds’ website at newyorklifeinvestments.com. Please read the Fund’s Summary Prospectus and/or Prospectus carefully before investing.
Investment and Performance Comparison (Unaudited)
Performance data quoted represents past performance. Past performance is no guarantee of future results. Because of market volatility and other factors, current performance may be lower or higher than the figures shown. Investment return and principal value will fluctuate, and as a result, when shares are redeemed, they may be worth more or less than their original cost. The graph below depicts the historical performance of Class I shares of the Fund. Performance will vary from class to class based on differences in class-specific expenses and sales charges. For performance information current to the most recent month-end, please call 800-624-6782 or visit newyorklifeinvestments.com.
The performance table and graph do not reflect the deduction of taxes that a shareholder would pay on distributions or Fund share redemptions. Total returns reflect maximum applicable sales charges as indicated in the table below, if any, changes in share price, and reinvestment of dividend and capital gain distributions. The graph assumes the initial investment amount shown below and reflects the deduction of all sales charges that would have applied for the period of investment. Performance figures may reflect certain fee waivers and/or expense limitations, without which total returns may have been lower. For more information on share classes and current fee waivers and/or expense limitations (if any), please refer to the Notes to Financial Statements.

| Average Annual Total Returns for the Year-Ended October 31, 2022 |
| Class | Sales Charge | | Inception
Date | One
Year | Since
Inception | Gross
Expense
Ratio1 |
| Class A Shares | Maximum 5.5% Initial Sales Charge | With sales charges | 11/15/2017 | -38.53% | -4.32% | 1.75% |
| | | Excluding sales charges | | -34.95 | -3.22 | 1.75 |
| Investor Class Shares2 | Maximum 5% Initial Sales Charge | With sales charges | 11/15/2017 | -38.24 | -4.43 | 1.81 |
| | | Excluding sales charges | | -34.99 | -3.34 | 1.81 |
| Class C Shares | Maximum 1% CDSC | With sales charges | 11/15/2017 | -36.14 | -4.04 | 2.56 |
| | if Redeemed Within One Year of Purchase | Excluding sales charges | | -35.50 | -4.04 | 2.56 |
| Class I Shares | No Sales Charge | | 11/15/2017 | -34.65 | -2.89 | 1.52 |
| Class R6 Shares | No Sales Charge | | 11/15/2017 | -34.65 | -2.86 | 1.32 |
| 1. | The gross expense ratios presented reflect the Fund’s “Total Annual Fund Operating Expenses” from the most recent Prospectus, as supplemented, and may differ from other expense ratios disclosed in this report. |
| 2. | Prior to June 30, 2020, the maximum initial sales charge was 5.5%, which is reflected in the applicable average annual total return figures shown. |
The footnotes on the next page are an integral part of the table and graph and should be carefully read in conjunction with them.
| Benchmark Performance* | One
Year | Since
Inception |
| MSCI Emerging Markets Index (Net)1 | -31.03% | -2.99% |
| Morningstar Diversified Emerging Markets Category Average2 | -30.58 | -2.73 |
| * | Returns for indices reflect no deductions for fees, expenses or taxes, except for foreign withholding taxes where applicable. Results assume reinvestment of all dividends and capital gains. An investment cannot be made directly in an index. |
| 1. | The MSCI Emerging Markets Index (Net) is the Fund's primary benchmark. The MSCI Emerging Markets Index (Net) is a broad-based benchmark that is a free float-adjusted market capitalization index that is designed to measure equity market performance in the global emerging markets. |
| 2. | The Morningstar Diversified Emerging Markets Category Average is representative of funds that tend to divide their assets among 20 or more nations, although they tend to focus on the emerging markets of Asia and Latin America rather than on those of the Middle East, Africa, or Europe. These funds invest predominantly in emerging market equities, but some funds also invest in both equities and fixed income investments from emerging markets. Results are based on average total returns of similar funds with all dividends and capital gain distributions reinvested. |
The footnotes on the preceding page are an integral part of the table and graph and should be carefully read in conjunction with them.
| 6 | MainStay Candriam Emerging Markets Equity Fund |
Cost in Dollars of a $1,000 Investment in MainStay Candriam Emerging Markets Equity Fund (Unaudited)
The example below is intended to describe the fees and expenses borne by shareholders during the six-month period from May 1, 2022 to October 31, 2022, and the impact of those costs on your investment.
Example
As a shareholder of the Fund you incur two types of costs: (1) transaction costs, including exchange fees and sales charges (loads) on purchases (as applicable), and (2) ongoing costs, including management fees, distribution and/or service (12b-1) fees and other Fund expenses (as applicable). This example is intended to help you understand your ongoing costs (in dollars) of investing in the Fund and to compare these costs with the ongoing costs of investing in other mutual funds. The example is based on an investment of $1,000 made at the beginning of the six-month period and held for the entire period from May 1, 2022 to October 31, 2022.
This example illustrates your Fund’s ongoing costs in two ways:
Actual Expenses
The second and third data columns in the table below provide information about actual account values and actual expenses. You may use the information in these columns, together with the amount you invested, to estimate the expenses that you paid during the six months ended October 31, 2022. Simply divide your account value by $1,000 (for example, an
$8,600 account value divided by $1,000 = 8.6), then multiply the result by the number under the heading entitled “Expenses Paid During Period” to estimate the expenses you paid on your account during this period.
Hypothetical Example for Comparison Purposes
The fourth and fifth data columns in the table below provide information about hypothetical account values and hypothetical expenses based on the Fund’s actual expense ratio and an assumed rate of return of 5% per year before expenses, which is not the Fund’s actual return. The hypothetical account values and expenses may not be used to estimate the actual ending account balances or expenses you paid for the six-month period shown. You may use this information to compare the ongoing costs of investing in the Fund with the ongoing costs of investing in other mutual funds. To do so, compare this 5% hypothetical example with the 5% hypothetical examples that appear in the shareholder reports of the other mutual funds.
Please note that the expenses shown in the table are meant to highlight your ongoing costs only and do not reflect any transactional costs, such as exchange fees or sales charges (loads). Therefore, the fourth and fifth data columns of the table are useful in comparing ongoing costs only and will not help you determine the relative total costs of owning different funds. In addition, if these transactional costs were included, your costs would have been higher.
| Share Class | Beginning
Account
Value
5/1/22 | Ending Account
Value (Based
on Actual
Returns and
Expenses)
10/31/22 | Expenses
Paid
During
Period1 | Ending Account
Value (Based
on Hypothetical
5% Annualized
Return and
Actual Expenses)
10/31/22 | Expenses
Paid
During
Period1 | Net Expense
Ratio
During
Period2 |
| Class A Shares | $1,000.00 | $798.40 | $ 6.39 | $1,018.10 | $ 7.17 | 1.41% |
| Investor Class Shares | $1,000.00 | $798.80 | $ 6.85 | $1,017.59 | $ 7.68 | 1.51% |
| Class C Shares | $1,000.00 | $795.50 | $10.23 | $1,013.81 | $11.47 | 2.26% |
| Class I Shares | $1,000.00 | $800.20 | $ 4.67 | $1,020.01 | $ 5.24 | 1.03% |
| Class R6 Shares | $1,000.00 | $800.80 | $ 4.68 | $1,020.01 | $ 5.24 | 1.03% |
| 1. | Expenses are equal to the Fund’s annualized expense ratio of each class multiplied by the average account value over the period, divided by 365 and multiplied by 184 (to reflect the six-month period). The table above represents the actual expenses incurred during the six-month period. In addition to the fees and expenses which the Fund bears directly, it also indirectly bears a pro rata share of the fees and expenses of the underlying funds in which it invests. Such indirect expenses are not included in the above-reported expense figures. |
| 2. | Expenses are equal to the Fund's annualized expense ratio to reflect the six-month period. |
Country Composition as of October 31, 2022 (Unaudited)
| China | 26.2% |
| India | 17.6 |
| Brazil | 11.9 |
| Taiwan | 10.6 |
| Republic of Korea | 9.3 |
| Mexico | 4.7 |
| Thailand | 4.5 |
| Indonesia | 4.2 |
| South Africa | 3.1 |
| United States | 1.6 |
| Poland | 0.9 |
| Peru | 0.8% |
| Turkey | 0.7 |
| Chile | 0.7 |
| Uruguay | 0.4 |
| Hungary | 0.1 |
| Malaysia | 0.0‡ |
| Russia | 0.0‡ |
| Other Assets, Less Liabilities | 2.7 |
| | 100.0% |
| ‡ | Less than one–tenth of a percent. |
See Portfolio of Investments beginning on page 11 for specific holdings within these categories. The Fund's holdings are subject to change.
Top Ten Holdings and/or Issuers Held as of October 31, 2022 (excluding short-term investments) (Unaudited)
| 1. | Taiwan Semiconductor Manufacturing Co. Ltd. |
| 2. | Tencent Holdings Ltd. |
| 3. | Alibaba Group Holding Ltd. |
| 4. | Samsung SDI Co. Ltd. |
| 5. | Samsung Electronics Co. Ltd. |
| 6. | Eicher Motors Ltd. |
| 7. | Bank Central Asia Tbk. PT |
| 8. | Reliance Industries Ltd. |
| 9. | Grupo Financiero Banorte SAB de CV, Class O |
| 10. | Bharti Airtel Ltd. |
| 8 | MainStay Candriam Emerging Markets Equity Fund |
Portfolio Management Discussion and Analysis (Unaudited)
Questions answered by Paulo Salazar, Philip Screve and Lamine Saidi of Candriam, the Fund’s Subadvisor.
How did MainStay Candriam Emerging Markets Equity Fund perform relative to its benchmark and peer group during the 12 months ended October 31, 2022?
For the 12 months ended October 31, 2022, Class I shares of MainStay Candriam Emerging Markets Equity Fund returned −34.65%, underperforming the −31.03% return of the Fund’s benchmark, the MSCI Emerging Markets Index (Net) (the “Index”). Over the same period, Class I shares also underperformed the −30.58% return of the Morningstar Diversified Emerging Markets Category Average.1
Were there any changes to the Fund during the reporting period?
During the reporting period, Jan Boudewijns ceased serving as a portfolio manager of the Fund.
What factors affected the Fund’s relative performance during the reporting period?
Emerging markets equities faced exceptionally difficult and volatile conditions during the reporting period. While global and developed markets broadly corrected in the face of challenges from rising inflation and tightening liquidity from global central banks, emerging markets were further adversely affected by COVID-19-related restrictions in China and a strengthening U.S. dollar. Geopolitical risks remained elevated throughout the reporting period, with the ongoing war between Russia and Ukraine, and flaring geopolitical tensions between China and the United States. Although inflationary concerns were more pronounced for developed markets, some key emerging-markets regions, including South Korea and Taiwan, saw sharp corrections due to the rising risk of a significant demand slowdown in the United States and Europe.
Against the backdrop of these exceptionally adverse drivers, the Fund’s performance lagged that of the Index. In part, the Fund’s relative weakness was driven by a lack of direct exposure to outperforming Middle East markets. Indirect and energy-correlated exposure in markets such as South Korea and Brazil partly compensated for this, but could not completely offset the shortfall. In terms of style exposure, the Fund adopted a balanced position in view of rising rates and elevated inflation in the early part of the reporting period, complementing sustainable growth holdings with quality financials and thematic materials (especially those needed for energy transition like lithium and nickel). However, growth investing remained out of favor throughout the reporting period, and as concerns mounted regarding slowing global demand in the latter half of the reporting period, some of Fund’s other holdings came under pressure as well.
In terms of China exposure, risks from a consumer slowdown and geopolitical uncertainties grew more pronounced for offshore
equities, while onshore equities presented more diversified thematic opportunities and also proved relatively resilient to geopolitical headwinds. Accordingly, we positioned the Fund with underweight exposure to large offshore names facing slowing growth prospects, focusing instead on onshore names poised to benefit from a variety of thematic trends including clean energy, domestic consumption and automation.
It’s worth mentioning that, during this volatile reporting period, the Fund did not experience any catastrophic, stock-specific disappointments among its holdings. Additionally, the timely reduction of Russian exposure, well before the onset of Russia-Ukraine war, limited costly write-offs, while adding to relative returns through meaningfully underweight exposure to the region.
To summarize, a combination of adverse factors including broader underperformance of growth style, headwinds from China related exposure and no direct exposure to the Middle East, largely explain the relative underperformance that the Fund experienced in the reporting period.
During the reporting period, which sectors and/or countries were the strongest positive contributors to the Fund’s relative performance and which sectors and/or countries were particularly weak?
During the reporting period the sectors making the strongest positive contributions to relative performance were industrials, energy and communication services. (Contributions take weightings and total returns into account.) Strong stock selection in the energy sector added to relative returns. The weakest returns came from information technology, due to adverse stock selection, followed by materials, where a combination of allocation and stock selection undermined relative returns.
At the country level, key positive contributors to relative returns included Russia, Brazil and Chile. The Fund benefited from its early move to reduce exposure to Russia in light of escalating tensions between Russia and Ukraine prior to the outbreak of war. A combination of positive selection and allocation effects to Brazil and Chile enhanced relative returns. On the other hand, predominantly negative selections in China detracted from performance, as did total lack of exposure to the outperforming Saudi Arabian market.
During the reporting period, which individual stocks made the strongest positive contributions to the Fund’s absolute performance and which stocks detracted the most?
The strongest individual contributor to the Fund’s absolute performance during the reporting period was Chile-based lithium mining and fertilizer manufacturing company, Sociedad Quimica Y
| 1. | See page 5 for other share class returns, which may be higher or lower than Class I share returns. See page 6 for more information on benchmark and peer group returns. |
Minera de Chile, which benefited from elevated lithium prices. Other top contributors included Eicher Motors, an Indian manufacturer of premium motorcycles and other vehicles that benefited from a demand recovery and a new, affordable model launch, and Grupo Financiero Banorte, a Mexican financial services company that saw shares rise in response to a credit recovery, a strong interest margin environment, and the removal of an overhang related to an announced inorganic expansion. The Fund has booked gains and reduced exposure to Sociedad Quimica Y Minera de Chile while continuing to hold exposure to Eicher Motors and Grupo Financiero Banorte.
Chailease Holding, a Taiwanese leasing company with significant exposure to China, detracted most significantly from the Fund’s absolute returns, with shares correcting due to the risk of a demand slowdown related to China’s COVID-19 restrictions. Another key detractor, BYD Auto, a leading Chinese manufacturer of electric vehicles and EV batteries, lost ground despite posting strong operating results when strategic shareholder Berkshire Hathaway reduced its interest in the company. Both names remain in the Fund; however, exposure to Chailease Holding has been slightly reduced.
What were some of the Fund’s largest purchases and sales during the reporting period?
The largest purchases during the reporting period increased exposure to Taiwanese semiconductor and foundry giant Taiwan Semiconductor Manufacturing Company, thereby reducing the Fund’s underweight position in the company relative to the Index. In other significant purchases, the Fund initiated positions in Indian financial firm Axis Bank, which appears well-positioned to benefit from a broad-based credit recovery in India, and Brazilian oil & gas exploration & production company Petro Rio, which we believe may profit from elevated energy prices and prospects for continued organic and inorganic expansion.
Among significant sales during the reporting period, the Fund exited its position in Russian financial technology company TCS Group in early 2022 on concerns regarding extended valuation and geopolitical risks. In another major sale, the Fund closed its position in Taiwanese semiconductor and 5G chip manufacturing company MediaTek, in response to an ongoing inventory correction weighing on company’s prospects.
How did the Fund’s sector and/or country weightings change during the reporting period?
The Fund reduced its exposure to financials from an overweight position relative to the Index at the beginning of the reporting period to a slightly underweight position as of October 31, 2022. Conversely, the Fund added exposure in relatively defensive
sectors, including health care and consumer staples. From a country perspective, the Fund increased its exposure to regions that appeared relatively defensive and insulated from geopolitical risks, including Brazil, Indonesia and Thailand. The Fund reduced its exposure in China from an overweight position to a neutral position relative to the Index, and trimmed exposure to South Korea in light of the country’s reliance on global export demand.
How was the Fund positioned at the end of the reporting period?
As of October 31, 2022, the Fund continues to hold a balanced mix of growth and defensive positions. Among growth-oriented positions, we favor companies with sustainable growth prospects exposed to thematic trends that we believe could be relatively resilient to macro and geopolitical headwinds. Key overweight positions include:
| • | Eicher Motors, described above; |
| • | PT Bank Central Asia, an Indonesian banking franchise that we believe is likely to continue benefiting from an elevated interest rate environment; and |
| • | Beijing United Information Technology, a Chinese enterprise e-commerce company playing into industrial digitalization efforts. |
Among financials, the Fund currently avoids exposure to companies we see as vulnerable to slowing real estate and infrastructure end market demands; we’re focused instead on regional banks better positioned to benefit from a credit recovery, such as Bank of Jiangsu and Bank of Chengdu. The Fund also avoids exposure to Index heavyweight Vale due to ESG (environmental, social, and governance) concerns regarding the company.
The opinions expressed are those of the portfolio managers as of the date of this report and are subject to change. There is no guarantee that any forecasts will come to pass. This material does not constitute investment advice and is not intended as an endorsement of any specific investment.
| 10 | MainStay Candriam Emerging Markets Equity Fund |
Portfolio of Investments October 31, 2022†
| | Shares | Value |
| Common Stocks 94.7% |
| Brazil 10.2% |
| Arezzo Industria e Comercio SA (Textiles, Apparel & Luxury Goods) | 26,000 | $ 525,990 |
| B3 SA - Brasil Bolsa Balcao (Capital Markets) | 330,000 | 960,836 |
| BB Seguridade Participacoes SA (Insurance) | 290,000 | 1,666,847 |
| Hypera SA (Pharmaceuticals) (a) | 134,000 | 1,318,080 |
| Localiza Rent a Car SA (Road & Rail) | 116,000 | 1,584,095 |
| MercadoLibre, Inc. (Internet & Direct Marketing Retail) (a) | 1,400 | 1,262,268 |
| Petro Rio SA (Oil, Gas & Consumable Fuels) (a) | 242,000 | 1,657,996 |
| SLC Agricola SA (Food Products) | 58,000 | 515,942 |
| WEG SA (Electrical Equipment) | 208,000 | 1,621,961 |
| | | 11,114,015 |
| Chile 0.7% |
| Sociedad Quimica y Minera de Chile SA, Sponsored ADR (Chemicals) | 8,000 | 749,440 |
| China 26.2% |
| Aier Eye Hospital Group Co. Ltd., Class A (Health Care Providers & Services) | 161,575 | 546,804 |
| Airtac International Group (Machinery) | 15,000 | 344,480 |
| Alibaba Group Holding Ltd. (Internet & Direct Marketing Retail) (a) | 318,000 | 2,489,423 |
| Baidu, Inc., Class A (Interactive Media & Services) (a) | 24,000 | 229,615 |
| Bank of Chengdu Co. Ltd., Class A (Banks) | 240,000 | 447,867 |
| Bank of Jiangsu Co. Ltd., Class A (Banks) | 1,039,965 | 986,019 |
| Beijing United Information Technology Co. Ltd., Class A (Trading Companies & Distributors) | 76,252 | 1,295,488 |
| BYD Co. Ltd., Class H (Automobiles) | 59,000 | 1,320,607 |
| China Tourism Group Duty Free Corp. Ltd., Class H (Specialty Retail) (a)(b) | 25,000 | 494,608 |
| China Yangtze Power Co. Ltd., Class A (Independent Power and Renewable Electricity Producers) | 159,998 | 444,134 |
| Contemporary Amperex Technology Co. Ltd., Class A (Electrical Equipment) | 14,994 | 766,032 |
| East Money Information Co. Ltd., Class A (Capital Markets) | 210,800 | 450,852 |
| Ganfeng Lithium Group Co. Ltd., Class H (Metals & Mining) (b) | 58,000 | 392,349 |
| Ginlong Technologies Co. Ltd., Class A (Electrical Equipment) (a) | 27,994 | 716,477 |
| | Shares | Value |
| |
| China (continued) |
| Jafron Biomedical Co. Ltd., Class A (Health Care Equipment & Supplies) | 158,934 | $ 689,862 |
| JD.com, Inc., Class A (Internet & Direct Marketing Retail) | 64,000 | 1,183,034 |
| Jiumaojiu International Holdings Ltd. (Hotels, Restaurants & Leisure) (b)(c) | 340,000 | 533,629 |
| Li Ning Co. Ltd. (Textiles, Apparel & Luxury Goods) | 74,000 | 382,743 |
| LONGi Green Energy Technology Co. Ltd., Class A (Semiconductors & Semiconductor Equipment) | 94,997 | 624,497 |
| Meituan (Internet & Direct Marketing Retail) (a)(b) | 110,000 | 1,748,868 |
| Ming Yang Smart Energy Group Ltd., Class A (Electrical Equipment) | 209,990 | 716,405 |
| NARI Technology Co. Ltd., Class A (Electrical Equipment) | 212,995 | 712,065 |
| NetEase, Inc. (Entertainment) | 54,000 | 588,867 |
| Ningbo Deye Technology Co. Ltd., Class A (Machinery) | 7,996 | 358,432 |
| Ningbo Orient Wires & Cables Co. Ltd., Class A (Electrical Equipment) | 77,997 | 822,866 |
| NIO, Inc., Class A (Automobiles) (a) | 28,000 | 266,814 |
| Nongfu Spring Co. Ltd., Class H (Beverages) (b) | 140,000 | 703,598 |
| Proya Cosmetics Co. Ltd., Class A (Personal Products) | 33,986 | 778,336 |
| Shanghai Baosight Software Co. Ltd., Class A (Software) | 90,657 | 525,663 |
| Shenzhen Inovance Technology Co. Ltd., Class A (Machinery) | 106,926 | 977,169 |
| Tencent Holdings Ltd. (Interactive Media & Services) | 96,000 | 2,514,457 |
| Unigroup Guoxin Microelectronics Co. Ltd., Class A (Semiconductors & Semiconductor Equipment) | 37,074 | 833,614 |
| Wuxi Biologics Cayman, Inc. (Life Sciences Tools & Services) (a)(b) | 43,993 | 198,958 |
| Yadea Group Holdings Ltd. (Automobiles) (b) | 550,000 | 839,400 |
| Yealink Network Technology Corp. Ltd., Class A (Communications Equipment) | 37,428 | 353,224 |
| Yunnan Energy New Material Co. Ltd. (Chemicals) | 25,000 | 507,084 |
| Zhejiang Jiuzhou Pharmaceutical Co. Ltd., Class A (Pharmaceuticals) | 107,903 | 525,130 |
The notes to the financial statements are an integral part of, and should be read in conjunction with, the financial statements.
11
Portfolio of Investments October 31, 2022† (continued)
| | Shares | Value |
| Common Stocks (continued) |
| China (continued) |
| Zijin Mining Group Co. Ltd., Class H (Metals & Mining) | 288,000 | $ 275,171 |
| | | 28,584,641 |
| Hungary 0.1% |
| MOL Hungarian Oil & Gas plc (Oil, Gas & Consumable Fuels) | 10,000 | 60,063 |
| India 17.6% |
| ABB India Ltd. (Electrical Equipment) | 27,000 | 994,754 |
| Asian Paints Ltd. (Chemicals) | 34,000 | 1,276,455 |
| Axis Bank Ltd. (Banks) | 165,000 | 1,805,925 |
| Bajaj Finance Ltd. (Consumer Finance) | 15,800 | 1,363,617 |
| Bharti Airtel Ltd. (Wireless Telecommunication Services) | 192,000 | 1,929,800 |
| Eicher Motors Ltd. (Automobiles) | 47,000 | 2,186,236 |
| HDFC Bank Ltd. (Banks) | 106,000 | 1,916,586 |
| ICICI Bank Ltd. (Banks) | 80,000 | 878,210 |
| Infosys Ltd. (IT Services) | 88,000 | 1,634,662 |
| Jubilant Foodworks Ltd. (Hotels, Restaurants & Leisure) | 122,000 | 898,963 |
| Reliance Industries Ltd. (Oil, Gas & Consumable Fuels) | 67,000 | 2,063,643 |
| SBI Cards & Payment Services Ltd. (Consumer Finance) | 80,000 | 798,913 |
| Torrent Pharmaceuticals Ltd. (Pharmaceuticals) | 30,000 | 597,988 |
| Varun Beverages Ltd. (Beverages) | 65,000 | 823,753 |
| | | 19,169,505 |
| Indonesia 4.2% |
| Aneka Tambang Tbk. (Metals & Mining) | 5,200,000 | 615,099 |
| Bank Central Asia Tbk. PT (Banks) | 3,800,000 | 2,143,933 |
| Sumber Alfaria Trijaya Tbk. PT (Food & Staples Retailing) | 4,200,000 | 759,352 |
| Telkom Indonesia Persero Tbk. PT (Diversified Telecommunication Services) | 3,900,000 | 1,097,676 |
| | | 4,616,060 |
| Malaysia 0.0% ‡ |
| Press Metal Aluminium Holdings Bhd. (Metals & Mining) | 60,000 | 55,203 |
| Mexico 4.7% |
| America Movil SAB de CV (Wireless Telecommunication Services) | 1,420,000 | 1,343,815 |
| | Shares | Value |
| |
| Mexico (continued) |
| Gruma SAB de CV, Class B (Food Products) | 64,000 | $ 742,398 |
| Grupo Aeroportuario del Pacifico SAB de CV, Class B (Transportation Infrastructure) | 70,000 | 1,084,288 |
| Grupo Financiero Banorte SAB de CV, Class O (Banks) | 244,000 | 1,983,354 |
| | | 5,153,855 |
| Peru 0.8% |
| Credicorp Ltd. (Banks) | 6,000 | 878,160 |
| Poland 0.9% |
| Dino Polska SA (Food & Staples Retailing) (a)(b) | 15,000 | 980,918 |
| Republic of Korea 9.3% |
| KB Financial Group, Inc. (Banks) | 18,000 | 607,182 |
| L&F Co. Ltd. (Electronic Equipment, Instruments & Components) (a) | 6,400 | 1,010,916 |
| Samsung Biologics Co. Ltd. (Life Sciences Tools & Services) (a)(b) | 3,000 | 1,847,029 |
| Samsung Electronics Co. Ltd. (Technology Hardware, Storage & Peripherals) | 56,000 | 2,335,217 |
| Samsung Engineering Co. Ltd. (Construction & Engineering) (a) | 58,000 | 971,112 |
| Samsung SDI Co. Ltd. (Electronic Equipment, Instruments & Components) | 4,600 | 2,380,006 |
| SK Hynix, Inc. (Semiconductors & Semiconductor Equipment) | 17,000 | 986,977 |
| | | 10,138,439 |
| Russia 0.0% ‡ |
| Magnit PJSC (Food & Staples Retailing) (d)(e) | 6,769 | — |
| South Africa 3.1% |
| Capitec Bank Holdings Ltd. (Banks) | 6,800 | 703,580 |
| FirstRand Ltd. (Diversified Financial Services) | 340,000 | 1,191,099 |
| Gold Fields Ltd. (Metals & Mining) | 47,000 | 379,940 |
| Shoprite Holdings Ltd. (Food & Staples Retailing) | 84,000 | 1,069,621 |
| | | 3,344,240 |
| Taiwan 10.6% |
| Accton Technology Corp. (Communications Equipment) | 118,000 | 889,875 |
The notes to the financial statements are an integral part of, and should be read in conjunction with, the financial statements.
| 12 | MainStay Candriam Emerging Markets Equity Fund |
| | Shares | Value |
| Common Stocks (continued) |
| Taiwan (continued) |
| Alchip Technologies Ltd. (Semiconductors & Semiconductor Equipment) | 20,000 | $ 402,824 |
| Chailease Holding Co. Ltd. (Diversified Financial Services) | 230,000 | 1,063,543 |
| Delta Electronics, Inc. (Electronic Equipment, Instruments & Components) | 136,000 | 1,086,818 |
| E Ink Holdings, Inc. (Electronic Equipment, Instruments & Components) | 132,000 | 841,834 |
| E.Sun Financial Holding Co. Ltd. (Banks) | 680,349 | 489,847 |
| Hon Hai Precision Industry Co. Ltd. (Electronic Equipment, Instruments & Components) | 150,000 | 477,151 |
| Taiwan Semiconductor Manufacturing Co. Ltd. (Semiconductors & Semiconductor Equipment) | 484,000 | 5,858,019 |
| Voltronic Power Technology Corp. (Electrical Equipment) | 12,000 | 487,858 |
| | | 11,597,769 |
| Thailand 4.5% |
| Airports of Thailand PCL, NVDR (Transportation Infrastructure) (a) | 220,000 | 427,746 |
| Bangkok Dusit Medical Services PCL, NVDR (Health Care Providers & Services) | 2,040,000 | 1,581,188 |
| CP ALL PCL, NVDR (Food & Staples Retailing) | 500,000 | 788,229 |
| Energy Absolute PCL, NVDR (Independent Power and Renewable Electricity Producers) (c) | 470,000 | 1,191,671 |
| Kasikornbank PCL, NVDR (Banks) (c) | 250,000 | 959,012 |
| | | 4,947,846 |
| Turkey 0.7% |
| BIM Birlesik Magazalar A/S (Food & Staples Retailing) | 110,000 | 791,866 |
| United States 0.7% |
| Globant SA (IT Services) (a) | 4,000 | 754,720 |
| Uruguay 0.4% |
| Dlocal Ltd. (IT Services) (a) | 19,000 | 423,700 |
Total Common Stocks
(Cost $115,832,636) | | 103,360,440 |
| | Shares | | Value |
| Preferred Stock 1.7% |
| Brazil 1.7% |
| Itau Unibanco Holding SA (Banks) (a) | 306,000 | | $ 1,800,871 |
Total Preferred Stock
(Cost $1,495,116) | | | 1,800,871 |
| Short-Term Investment 0.9% |
| Unaffiliated Investment Company 0.9% |
| United States 0.9% |
| Invesco Government & Agency Portfolio, 3.163% (f)(g) | 960,539 | | 960,539 |
Total Short-Term Investment
(Cost $960,539) | | | 960,539 |
Total Investments
(Cost $118,288,291) | 97.3% | | 106,121,850 |
| Other Assets, Less Liabilities | 2.7 | | 2,994,736 |
| Net Assets | 100.0% | | $ 109,116,586 |
| † | Percentages indicated are based on Fund net assets. |
| ‡ | Less than one-tenth of a percent. |
| (a) | Non-income producing security. |
| (b) | May be sold to institutional investors only under Rule 144A or securities offered pursuant to Section 4(a)(2) of the Securities Act of 1933, as amended. |
| (c) | All or a portion of this security was held on loan. As of October 31, 2022, the aggregate market value of securities on loan was $908,502. The Fund received cash collateral with a value of $960,539. (See Note 2(J)) |
| (d) | Illiquid security—As of October 31, 2022, the total market value deemed illiquid under procedures approved by the Board of Trustees was $0, which represented less than one-tenth of a percent of the Fund’s net assets.(Unaudited) |
| (e) | Security in which significant unobservable inputs (Level 3) were used in determining fair value. |
| (f) | Current yield as of October 31, 2022. |
| (g) | Represents a security purchased with cash collateral received for securities on loan. |
| Abbreviation(s): |
| ADR—American Depositary Receipt |
| NVDR—Non-Voting Depositary Receipt |
| PCL—Provision for Credit Losses |
The notes to the financial statements are an integral part of, and should be read in conjunction with, the financial statements.
13
Portfolio of Investments October 31, 2022† (continued)
The following is a summary of the fair valuations according to the inputs used as of October 31, 2022, for valuing the Fund’s assets:
| Description | Quoted
Prices in
Active
Markets for
Identical
Assets
(Level 1) | | Significant
Other
Observable
Inputs
(Level 2) | | Significant
Unobservable
Inputs
(Level 3) | | Total |
| Asset Valuation Inputs | | | | | | | |
| Investments in Securities (a) | | | | | | | |
| Common Stocks | | | | | | | |
| Hungary | $ — | | $ 60,063 | | $ — | | $ 60,063 |
| All Other Countries | 103,300,377 | | — | | — | | 103,300,377 |
| Total Common Stocks | 103,300,377 | | 60,063 | | — | | 103,360,440 |
| Preferred Stock | 1,800,871 | | — | | — | | 1,800,871 |
| Short-Term Investment | | | | | | | |
| Unaffiliated Investment Company | 960,539 | | — | | — | | 960,539 |
| Total Investments in Securities | $ 106,061,787 | | $ 60,063 | | $ — | | $ 106,121,850 |
| (a) | For a complete listing of investments and their industries, see the Portfolio of Investments. |
The notes to the financial statements are an integral part of, and should be read in conjunction with, the financial statements.
| 14 | MainStay Candriam Emerging Markets Equity Fund |
The table below sets forth the diversification of the Fund’s investments by industry.
Industry Diversification
| | Value | | Percent † |
| Automobiles | $ 4,613,057 | | 4.2% |
| Banks | 15,600,546 | | 14.4 |
| Beverages | 1,527,351 | | 1.4 |
| Capital Markets | 1,411,688 | | 1.3 |
| Chemicals | 2,532,979 | | 2.4 |
| Communications Equipment | 1,243,099 | | 1.1 |
| Construction & Engineering | 971,112 | | 0.9 |
| Consumer Finance | 2,162,530 | | 1.9 |
| Diversified Financial Services | 2,254,642 | | 2.1 |
| Diversified Telecommunication Services | 1,097,676 | | 1.0 |
| Electrical Equipment | 6,838,418 | | 6.3 |
| Electronic Equipment, Instruments & Components | 5,796,725 | | 5.3 |
| Entertainment | 588,867 | | 0.5 |
| Food & Staples Retailing | 4,389,986 | | 4.0 |
| Food Products | 1,258,340 | | 1.2 |
| Health Care Equipment & Supplies | 689,862 | | 0.6 |
| Health Care Providers & Services | 2,127,992 | | 1.9 |
| Hotels, Restaurants & Leisure | 1,432,592 | | 1.3 |
| Independent Power and Renewable Electricity Producers | 1,635,805 | | 1.5 |
| Insurance | 1,666,847 | | 1.5 |
| Interactive Media & Services | 2,744,072 | | 2.5 |
| Internet & Direct Marketing Retail | 6,683,593 | | 6.2 |
| IT Services | 2,813,082 | | 2.6 |
| Life Sciences Tools & Services | 2,045,987 | | 1.9 |
| Machinery | 1,680,081 | | 1.5 |
| Metals & Mining | 1,717,762 | | 1.5 |
| Oil, Gas & Consumable Fuels | 3,781,702 | | 3.5 |
| Personal Products | 778,336 | | 0.7 |
| Pharmaceuticals | 2,441,198 | | 2.2 |
| Road & Rail | 1,584,095 | | 1.4 |
| Semiconductors & Semiconductor Equipment | 8,705,931 | | 8.1 |
| Software | 525,663 | | 0.5 |
| Specialty Retail | 494,608 | | 0.5 |
| Technology Hardware, Storage & Peripherals | 2,335,217 | | 2.1 |
| Textiles, Apparel & Luxury Goods | 908,733 | | 0.8 |
| Trading Companies & Distributors | 1,295,488 | | 1.2 |
| Transportation Infrastructure | 1,512,034 | | 1.4 |
| Wireless Telecommunication Services | 3,273,615 | | 3.0 |
| | 105,161,311 | | 96.4 |
| | Value | | Percent † |
| Short-Term Investment | $ 960,539 | | 0.9% |
| Other Assets, Less Liabilities | 2,994,736 | | 2.7 |
| Net Assets | $109,116,586 | | 100.0% |
| † | Percentages indicated are based on Fund net assets. |
The notes to the financial statements are an integral part of, and should be read in conjunction with, the financial statements.
15
Statement of Assets and Liabilities as of October 31, 2022
| Assets |
Investment in securities, at value
(identified cost $118,288,291) including securities on loan of $908,502 | $106,121,850 |
| Cash | 3,447,539 |
Cash denominated in foreign currencies
(identified cost $323,175) | 322,355 |
| Receivables: | |
| Investment securities sold | 267,901 |
| Fund shares sold | 138,148 |
| Dividends | 86,066 |
| Securities lending | 3,688 |
| Other assets | 51,551 |
| Total assets | 110,439,098 |
| Liabilities |
| Cash collateral received for securities on loan | 960,539 |
| Payables: | |
| Foreign capital gains tax (See Note 2) | 152,398 |
| Investment securities purchased | 80,594 |
| Manager (See Note 3) | 44,545 |
| Custodian | 41,418 |
| Professional fees | 22,387 |
| Fund shares redeemed | 6,890 |
| Shareholder communication | 3,874 |
| Transfer agent (See Note 3) | 3,782 |
| NYLIFE Distributors (See Note 3) | 638 |
| Trustees | 7 |
| Accrued expenses | 5,440 |
| Total liabilities | 1,322,512 |
| Net assets | $109,116,586 |
| Composition of Net Assets |
| Shares of beneficial interest outstanding (par value of $.001 per share) unlimited number of shares authorized | $ 13,174 |
| Additional paid-in-capital | 138,403,049 |
| | 138,416,223 |
| Total distributable earnings (loss) | (29,299,637) |
| Net assets | $109,116,586 |
| Class A | |
| Net assets applicable to outstanding shares | $ 2,143,892 |
| Shares of beneficial interest outstanding | 260,123 |
| Net asset value per share outstanding | $ 8.24 |
| Maximum sales charge (5.50% of offering price) | 0.48 |
| Maximum offering price per share outstanding | $ 8.72 |
| Investor Class | |
| Net assets applicable to outstanding shares | $ 256,112 |
| Shares of beneficial interest outstanding | 31,173 |
| Net asset value per share outstanding | $ 8.22 |
| Maximum sales charge (5.00% of offering price) | 0.43 |
| Maximum offering price per share outstanding | $ 8.65 |
| Class C | |
| Net assets applicable to outstanding shares | $ 141,126 |
| Shares of beneficial interest outstanding | 17,531 |
| Net asset value and offering price per share outstanding | $ 8.05 |
| Class I | |
| Net assets applicable to outstanding shares | $12,977,328 |
| Shares of beneficial interest outstanding | 1,557,220 |
| Net asset value and offering price per share outstanding | $ 8.33 |
| Class R6 | |
| Net assets applicable to outstanding shares | $93,598,128 |
| Shares of beneficial interest outstanding | 11,307,598 |
| Net asset value and offering price per share outstanding | $ 8.28 |
The notes to the financial statements are an integral part of, and should be read in conjunction with, the financial statements.
| 16 | MainStay Candriam Emerging Markets Equity Fund |
Statement of Operations for the year ended October 31, 2022
| Investment Income (Loss) |
| Income | |
| Dividends (net of foreign tax withholding of $258,109) | $ 2,681,133 |
| Securities lending, net | 20,370 |
| Other | 2,345 |
| Total income | 2,703,848 |
| Expenses | |
| Manager (See Note 3) | 1,004,093 |
| Custodian | 163,908 |
| Professional fees | 140,974 |
| Registration | 71,480 |
| Transfer agent (See Note 3) | 19,160 |
| Distribution/Service—Class A (See Note 3) | 6,380 |
| Distribution/Service—Investor Class (See Note 3) | 941 |
| Distribution/Service—Class C (See Note 3) | 1,797 |
| Shareholder communication | 6,267 |
| Trustees | 2,141 |
| Miscellaneous | 13,422 |
| Total expenses before waiver/reimbursement | 1,430,563 |
| Expense waiver/reimbursement from Manager (See Note 3) | (349,898) |
| Net expenses | 1,080,665 |
| Net investment income (loss) | 1,623,183 |
| Realized and Unrealized Gain (Loss) |
| Net realized gain (loss) on: | |
| Unaffiliated investment transactions(a) | (16,839,128) |
| Foreign currency transactions | (284,033) |
| Foreign currency forward transactions | (25,622) |
| Net realized gain (loss) | (17,148,783) |
| Net change in unrealized appreciation (depreciation) on: | |
| Unaffiliated investments(b) | (28,315,293) |
| Translation of other assets and liabilities in foreign currencies | 1,295 |
| Net change in unrealized appreciation (depreciation) | (28,313,998) |
| Net realized and unrealized gain (loss) | (45,462,781) |
| Net increase (decrease) in net assets resulting from operations | $(43,839,598) |
| (a) | Realized gain (loss) on security transactions recorded net of foreign capital gains tax in the amount of $(204,185). |
| (b) | Net change in unrealized appreciation (depreciation) on investments recorded net of foreign capital gains tax in the amount of $339,032. |
The notes to the financial statements are an integral part of, and should be read in conjunction with, the financial statements.
17
Statements of Changes in Net Assets
for the years ended October 31, 2022 and October 31, 2021
| | 2022 | 2021 |
| Increase (Decrease) in Net Assets |
| Operations: | | |
| Net investment income (loss) | $ 1,623,183 | $ 500,176 |
| Net realized gain (loss) | (17,148,783) | 15,334,663 |
| Net change in unrealized appreciation (depreciation) | (28,313,998) | 1,297,499 |
| Net increase (decrease) in net assets resulting from operations | (43,839,598) | 17,132,338 |
| Distributions to shareholders: | | |
| Class A | (13,154) | (3,773) |
| Investor Class | (2,228) | (842) |
| Class I | (35,091) | (210) |
| Class R6 | (751,850) | (446,085) |
| Total distributions to shareholders | (802,323) | (450,910) |
| Capital share transactions: | | |
| Net proceeds from sales of shares | 69,723,839 | 18,126,480 |
| Net asset value of shares issued to shareholders in reinvestment of distributions | 792,715 | 450,676 |
| Cost of shares redeemed | (8,846,223) | (28,117,993) |
| Increase (decrease) in net assets derived from capital share transactions | 61,670,331 | (9,540,837) |
| Net increase (decrease) in net assets | 17,028,410 | 7,140,591 |
| Net Assets |
| Beginning of year | 92,088,176 | 84,947,585 |
| End of year | $109,116,586 | $ 92,088,176 |
The notes to the financial statements are an integral part of, and should be read in conjunction with, the financial statements.
| 18 | MainStay Candriam Emerging Markets Equity Fund |
Financial Highlights selected per share data and ratios
| | Year Ended October 31, | | November 15, 2017^ through
October 31,
2018 |
| Class A | 2022 | | 2021 | | 2020 | | 2019 | |
| Net asset value at beginning of period | $ 12.73 | | $ 10.66 | | $ 8.97 | | $ 7.98 | | $ 10.00 |
| Net investment income (loss) (a) | 0.13 | | 0.04 | | 0.02 | | 0.10 | | 0.05 |
| Net realized and unrealized gain (loss) | (4.56) | | 2.06 | | 1.85 | | 0.93 | | (2.07) |
| Total from investment operations | (4.43) | | 2.10 | | 1.87 | | 1.03 | | (2.02) |
| Less distributions: | | | | | | | | | |
| From net investment income | (0.06) | | (0.03) | | (0.18) | | (0.04) | | — |
| Net asset value at end of period | $ 8.24 | | $ 12.73 | | $ 10.66 | | $ 8.97 | | $ 7.98 |
| Total investment return (b) | (34.95)% | | 19.68% | | 21.14% | | 12.96% | | (20.20)% |
| Ratios (to average net assets)/Supplemental Data: | | | | | | | | | |
| Net investment income (loss) | 1.25% | | 0.30% | | 0.22% | | 1.18% | | 0.51%†† |
| Net expenses (c) | 1.44% | | 1.47% | | 1.50% | | 1.50% | | 1.50%†† |
| Expenses (before waiver/reimbursement) (c) | 1.77% | | 1.75% | | 2.00% | | 1.77% | | 1.89%†† |
| Portfolio turnover rate | 105% | | 74% | | 122% | | 107% | | 80% |
| Net assets at end of period (in 000’s) | $ 2,144 | | $ 2,921 | | $ 1,111 | | $ 77 | | $ 35 |
| ^ | Inception date. |
| †† | Annualized. |
| (a) | Per share data based on average shares outstanding during the period. |
| (b) | Total investment return is calculated exclusive of sales charges and assumes the reinvestment of dividends and distributions. For periods of less than one year, total return is not annualized. |
| (c) | In addition to the fees and expenses which the Fund bears directly, it also indirectly bears a pro-rata share of the fees and expenses of the underlying funds in which it invests. Such indirect expenses are not included in the above expense ratios. |
| | Year Ended October 31, | | November 15, 2017^ through
October 31,
2018 |
| Investor Class | 2022 | | 2021 | | 2020 | | 2019 | |
| Net asset value at beginning of period | $ 12.70 | | $ 10.65 | | $ 8.95 | | $ 7.97 | | $ 10.00 |
| Net investment income (loss) (a) | 0.12 | | 0.02 | | 0.02 | | 0.07 | | 0.05 |
| Net realized and unrealized gain (loss) | (4.55) | | 2.05 | | 1.84 | | 0.94 | | (2.08) |
| Total from investment operations | (4.43) | | 2.07 | | 1.86 | | 1.01 | | (2.03) |
| Less distributions: | | | | | | | | | |
| From net investment income | (0.05) | | (0.02) | | (0.16) | | (0.03) | | — |
| Net asset value at end of period | $ 8.22 | | $ 12.70 | | $ 10.65 | | $ 8.95 | | $ 7.97 |
| Total investment return (b) | (34.99)% | | 19.49% | | 21.11%(c) | | 12.71%(c) | | (20.30)%(c) |
| Ratios (to average net assets)/Supplemental Data: | | | | | | | | | |
| Net investment income (loss) | 1.09% | | 0.15% | | 0.17% | | 0.76% | | 0.53%†† |
| Net expenses (d) | 1.57% | | 1.52% | | 1.52% | | 1.66% | | 1.68%†† |
| Expenses (before waiver/reimbursement) (d) | 1.88% | | 1.81% | | 2.03% | | 1.92% | | 2.03%†† |
| Portfolio turnover rate | 105% | | 74% | | 122% | | 107% | | 80% |
| Net assets at end of period (in 000's) | $ 256 | | $ 507 | | $ 360 | | $ 121 | | $ 108 |
| ^ | Inception date. |
| †† | Annualized. |
| (a) | Per share data based on average shares outstanding during the period. |
| (b) | Total investment return is calculated exclusive of sales charges and assumes the reinvestment of dividends and distributions. For periods of less than one year, total return is not annualized. |
| (c) | Total investment return may reflect adjustments to conform to generally accepted accounting principles. |
| (d) | In addition to the fees and expenses which the Fund bears directly, it also indirectly bears a pro-rata share of the fees and expenses of the underlying funds in which it invests. Such indirect expenses are not included in the above expense ratios. |
The notes to the financial statements are an integral part of, and should be read in conjunction with, the financial statements.
19
Financial Highlights selected per share data and ratios
| | Year Ended October 31, | | November 15, 2017^ through
October 31,
2018 |
| Class C | 2022 | | 2021 | | 2020 | | 2019 | |
| Net asset value at beginning of period | $ 12.48 | | $ 10.52 | | $ 8.85 | | $ 7.91 | | $ 10.00 |
| Net investment income (loss) (a) | 0.04 | | (0.08) | | (0.05) | | (0.01) | | 0.00‡ |
| Net realized and unrealized gain (loss) | (4.47) | | 2.04 | | 1.83 | | 0.95 | | (2.09) |
| Total from investment operations | (4.43) | | 1.96 | | 1.78 | | 0.94 | | (2.09) |
| Less distributions: | | | | | | | | | |
| From net investment income | — | | — | | (0.11) | | — | | — |
| Net asset value at end of period | $ 8.05 | | $ 12.48 | | $ 10.52 | | $ 8.85 | | $ 7.91 |
| Total investment return (b) | (35.50)% | | 18.63%(c) | | 20.23% | | 11.88% | | (20.90)% |
| Ratios (to average net assets)/Supplemental Data: | | | | | | | | | |
| Net investment income (loss) | 0.36% | | (0.63)% | | (0.52)% | | (0.13)% | | 0.04%†† |
| Net expenses (d) | 2.31% | | 2.27% | | 2.27% | | 2.40% | | 2.44%†† |
| Expenses (before waiver/reimbursement) (d) | 2.64% | | 2.57% | | 2.78% | | 2.67% | | 2.73%†† |
| Portfolio turnover rate | 105% | | 74% | | 122% | | 107% | | 80% |
| Net assets at end of period (in 000’s) | $ 141 | | $ 212 | | $ 217 | | $ 56 | | $ 93 |
| ^ | Inception date. |
| ‡ | Less than one cent per share. |
| †† | Annualized. |
| (a) | Per share data based on average shares outstanding during the period. |
| (b) | Total investment return is calculated exclusive of sales charges and assumes the reinvestment of dividends and distributions. For periods of less than one year, total return is not annualized. |
| (c) | Total investment return may reflect adjustments to conform to generally accepted accounting principles. |
| (d) | In addition to the fees and expenses which the Fund bears directly, it also indirectly bears a pro-rata share of the fees and expenses of the underlying funds in which it invests. Such indirect expenses are not included in the above expense ratios. |
| | Year Ended October 31, | | November 15, 2017^ through
October 31,
2018 |
| Class I | 2022 | | 2021 | | 2020 | | 2019 | |
| Net asset value at beginning of period | $ 12.85 | | $ 10.77 | | $ 8.99 | | $ 8.00 | | $ 10.00 |
| Net investment income (loss) (a) | 0.16 | | 0.05 | | 0.05 | | (0.02) | | 0.03 |
| Net realized and unrealized gain (loss) | (4.58) | | 2.11 | | 1.87 | | 1.07 | | (2.03) |
| Total from investment operations | (4.42) | | 2.16 | | 1.92 | | 1.05 | | (2.00) |
| Less distributions: | | | | | | | | | |
| From net investment income | (0.10) | | (0.08) | | (0.14) | | (0.06) | | (0.00)‡ |
| Net asset value at end of period | $ 8.33 | | $ 12.85 | | $ 10.77 | | $ 8.99 | | $ 8.00 |
| Total investment return (b) | (34.65)% | | 20.05% | | 21.60% | | 13.28% | | (19.99)% |
| Ratios (to average net assets)/Supplemental Data: | | | | | | | | | |
| Net investment income (loss) | 1.65% | | 0.38% | | 0.55% | | (0.26)% | | 0.34%†† |
| Net expenses (c) | 1.06% | | 1.07% | | 1.15% | | 1.15% | | 1.19%†† |
| Expenses (before waiver/reimbursement) (c) | 1.54% | | 1.52% | | 1.79% | | 1.52% | | 1.79%†† |
| Portfolio turnover rate | 105% | | 74% | | 122% | | 107% | | 80% |
| Net assets at end of period (in 000’s) | $ 12,977 | | $ 4,532 | | $ 30 | | $ 40 | | $ 7,934 |
| ^ | Inception date. |
| ‡ | Less than one cent per share. |
| †† | Annualized. |
| (a) | Per share data based on average shares outstanding during the period. |
| (b) | Total investment return is calculated exclusive of sales charges and assumes the reinvestment of dividends and distributions. Class I shares are not subject to sales charges. For periods of less than one year, total return is not annualized. |
| (c) | In addition to the fees and expenses which the Fund bears directly, it also indirectly bears a pro-rata share of the fees and expenses of the underlying funds in which it invests. Such indirect expenses are not included in the above expense ratios. |
The notes to the financial statements are an integral part of, and should be read in conjunction with, the financial statements.
| 20 | MainStay Candriam Emerging Markets Equity Fund |
Financial Highlights selected per share data and ratios
| | Year Ended October 31, | | November 15, 2017^ through
October 31,
2018 |
| Class R6 | 2022 | | 2021 | | 2020 | | 2019 | |
| Net asset value at beginning of period | $ 12.79 | | $ 10.71 | | $ 9.00 | | $ 8.01 | | $ 10.00 |
| Net investment income (loss) (a) | 0.17 | | 0.08 | | 0.05 | | 0.10 | | 0.14 |
| Net realized and unrealized gain (loss) | (4.57) | | 2.06 | | 1.86 | | 0.95 | | (2.13) |
| Total from investment operations | (4.40) | | 2.14 | | 1.91 | | 1.05 | | (1.99) |
| Less distributions: | | | | | | | | | |
| From net investment income | (0.11) | | (0.06) | | (0.20) | | (0.06) | | (0.00)‡ |
| Net asset value at end of period | $ 8.28 | | $ 12.79 | | $ 10.71 | | $ 9.00 | | $ 8.01 |
| Total investment return (b) | (34.65)% | | 20.05% | | 21.61% | | 13.29% | | (19.89)% |
| Ratios (to average net assets)/Supplemental Data: | | | | | | | | | |
| Net investment income (loss) | 1.63% | | 0.58% | | 0.51% | | 1.11% | | 1.54%†† |
| Net expenses (c) | 1.06% | | 1.07% | | 1.15% | | 1.15% | | 1.15%†† |
| Expenses (before waiver/reimbursement) (c) | 1.40% | | 1.32% | | 1.53% | | 1.42% | | 1.43%†† |
| Portfolio turnover rate | 105% | | 74% | | 122% | | 107% | | 80% |
| Net assets at end of period (in 000’s) | $ 93,598 | | $ 83,916 | | $ 83,230 | | $ 49,111 | | $ 62,635 |
| ^ | Inception date. |
| ‡ | Less than one cent per share. |
| †† | Annualized. |
| (a) | Per share data based on average shares outstanding during the period. |
| (b) | Total investment return is calculated exclusive of sales charges and assumes the reinvestment of dividends and distributions. Class R6 shares are not subject to sales charges. For periods of less than one year, total return is not annualized. |
| (c) | In addition to the fees and expenses which the Fund bears directly, it also indirectly bears a pro-rata share of the fees and expenses of the underlying funds in which it invests. Such indirect expenses are not included in the above expense ratios. |
The notes to the financial statements are an integral part of, and should be read in conjunction with, the financial statements.
21
Notes to Financial Statements
Note 1-Organization and Business
MainStay Funds Trust (the “Trust”) was organized as a Delaware statutory trust on April 28, 2009. The Trust is registered under the Investment Company Act of 1940, as amended (the “1940 Act”), as an open-end management investment company, and is comprised of thirty-three funds (collectively referred to as the “Funds”). These financial statements and notes relate to the MainStay Candriam Emerging Markets Equity Fund (the "Fund"), a “diversified” fund, as that term is defined in the 1940 Act, as interpreted or modified by regulatory authorities having jurisdiction, from time to time.
The following table lists the Fund's share classes that have been registered and commenced operations:
| Class | Commenced Operations |
| Class A | November 15, 2017 |
| Investor Class | November 15, 2017 |
| Class C | November 15, 2017 |
| Class I | November 15, 2017 |
| Class R6 | November 15, 2017 |
| SIMPLE Class | N/A* |
| * | SIMPLE Class shares were registered for sale effective as of August 31, 2020 but have not yet commenced operations. |
Class A and Investor Class shares are offered at net asset value (“NAV”) per share plus an initial sales charge. No initial sales charge applies to investments of $1 million or more (and certain other qualified purchases) in Class A and Investor Class shares. A contingent deferred sales charge (“CDSC”) of 1.00% may be imposed on certain redemptions of Class A and Investor Class shares made within 18 months of the date of purchase on shares that were purchased without an initial sales charge. Class C shares are offered at NAV without an initial sales charge, although a 1.00% CDSC may be imposed on certain redemptions of such shares made within one year of the date of purchase of Class C shares. Class I and Class R6 shares are offered at NAV without a sales charge. SIMPLE Class shares are expected to be offered at NAV without a sales charge if such shares are offered in the future. Depending upon eligibility, Class C shares convert to either Class A or Investor Class shares at the end of the calendar quarter eight years after the date they were purchased. Additionally, Investor Class shares may convert automatically to Class A shares. Under certain circumstances and as may be permitted by the Trust’s multiple class plan pursuant to Rule 18f-3 under the 1940 Act, specified share classes of the Fund may be converted to one or more other share classes of the Fund as disclosed in the capital share transactions within these Notes. The classes of shares have the same voting (except for issues that relate solely to one class), dividend, liquidation and other rights, and the same terms and conditions, except that under distribution plans pursuant to Rule 12b-1 under the 1940 Act, Class C shares are subject to higher distribution and/or service fees than Class A, Investor Class and SIMPLE Class shares. Class I and Class R6 shares are not subject to a distribution and/or service fee.
The Fund's investment objective is to seek long-term capital appreciation.
Note 2–Significant Accounting Policies
The Fund is an investment company and accordingly follows the investment company accounting and reporting guidance of the Financial Accounting Standards Board (“FASB”) Accounting Standards Codification Topic 946 Financial Services—Investment Companies. The Fund prepares its financial statements in accordance with generally accepted accounting principles (“GAAP”) in the United States of America and follows the significant accounting policies described below.
(A) Securities Valuation. Investments are usually valued as of the close of regular trading on the New York Stock Exchange (the "Exchange") (usually 4:00 p.m. Eastern time) on each day the Fund is open for business ("valuation date").
Effective September 8, 2022, and pursuant to Rule 2a-5 under the 1940 Act, the Board of Trustees of the Trust (the "Board") designated New York Life Investment Management LLC (“New York Life Investments” or the "Manager") as its Valuation Designee (the "Valuation Designee"). The Valuation Designee is responsible for performing fair valuations relating to all investments in the Fund’s portfolio for which market quotations are not readily available; periodically assessing and managing material valuation risks; establishing and applying fair value methodologies; testing fair valuation methodologies; evaluating and overseeing pricing services; segregation of valuation and portfolio management functions; providing quarterly, annual and prompt reporting to the Board, as appropriate; identifying potential conflicts of interest; and maintaining appropriate records. The Valuation Designee has established a valuation committee ("Valuation Committee") to assist in carrying out the Valuation Designee’s responsibilities and establish prices of securities for which market quotations are not readily available. The Fund’s and the Valuation Designee's policies and procedures ("Valuation Procedures") govern the Valuation Designee’s selection and application of methodologies for determining and calculating the fair value of Fund investments. The Valuation Designee may value Fund portfolio securities for which market quotations are not readily available and other Fund assets utilizing inputs from pricing services and other third-party sources (together, “Pricing Sources”). The Valuation Committee meets (in person, via electronic mail or via teleconference) on an ad-hoc basis to determine fair valuations and on a quarterly basis to review fair value events (excluding fair valuations from pricing services), including valuation risks and back-testing results, and preview reports to the Board.
The Valuation Committee establishes prices of securities for which market quotations are not readily available based on such methodologies and measurements on a regular basis after considering information that is reasonably available and deemed relevant by the Valuation Committee. The Board shall oversee the Valuation Designee and review fair valuation materials on a prompt, quarterly and annual basis and approve proposed revisions to the Valuation Procedures.
Investments for which market quotations are not readily available are valued at fair value as determined in good faith pursuant to the Valuation Procedures. A market quotation is readily available only when that
| 22 | MainStay Candriam Emerging Markets Equity Fund |
quotation is a quoted price (unadjusted) in active markets for identical investments that the Fund can access at the measurement date, provided that a quotation will not be readily available if it is not reliable. Fair value measurements are determined within a framework that establishes a three-tier hierarchy that maximizes the use of observable market data and minimizes the use of unobservable inputs to establish a classification of fair value measurements for disclosure purposes. "Inputs" refer broadly to the assumptions that market participants would use in pricing the asset or liability, including assumptions about risk, such as the risk inherent in a particular valuation technique used to measure fair value using a pricing model and/or the risk inherent in the inputs for the valuation technique. Inputs may be observable or unobservable. Observable inputs reflect the assumptions market participants would use in pricing the asset or liability based on market data obtained from sources independent of the Fund. Unobservable inputs reflect the Fund’s own assumptions about the assumptions market participants would use in pricing the asset or liability based on the information available. The inputs or methodology used for valuing assets or liabilities may not be an indication of the risks associated with investing in those assets or liabilities. The three-tier hierarchy of inputs is summarized below.
| • | Level 1—quoted prices (unadjusted) in active markets for an identical asset or liability |
| • | Level 2—other significant observable inputs (including quoted prices for a similar asset or liability in active markets, interest rates and yield curves, prepayment speeds, credit risk, etc.) |
| • | Level 3—significant unobservable inputs (including the Fund's own assumptions about the assumptions that market participants would use in measuring fair value of an asset or liability) |
The level of an asset or liability within the fair value hierarchy is based on the lowest level of an input, both individually and in the aggregate, that is significant to the fair value measurement. The aggregate value by input level of the Fund’s assets and liabilities as of October 31, 2022, is included at the end of the Portfolio of Investments.
The Fund may use third-party vendor evaluations, whose prices may be derived from one or more of the following standard inputs, among others:
| • Broker/dealer quotes | • Benchmark securities |
| • Two-sided markets | • Reference data (corporate actions or material event notices) |
| • Bids/offers | • Monthly payment information |
| • Industry and economic events | • Reported trades |
An asset or liability for which a market quotation is not readily available is valued by methods deemed reasonable in good faith by the Valuation Committee, following the Valuation Procedures to represent fair value. Under these procedures, the Valuation Designee generally uses a market-based approach which may use related or comparable assets or liabilities, recent transactions, market multiples, book values and other relevant information. The Valuation Designee may also use an income-based valuation approach in which the anticipated future cash
flows of the asset or liability are discounted to calculate fair value. Discounts may also be applied due to the nature and/or duration of any restrictions on the disposition of the asset or liability. Fair value represents a good faith approximation of the value of a security. Fair value determinations involve the consideration of a number of subjective factors, an analysis of applicable facts and circumstances and the exercise of judgment. As a result, it is possible that the fair value for a security determined in good faith in accordance with the Valuation Procedures may differ from valuations for the same security determined for other funds using their own valuation procedures. Although the Valuation Procedures are designed to value a security at the price the Fund may reasonably expect to receive upon the security's sale in an orderly transaction, there can be no assurance that any fair value determination thereunder would, in fact, approximate the amount that the Fund would actually realize upon the sale of the security or the price at which the security would trade if a reliable market price were readily available. During the year ended October 31, 2022, there were no material changes to the fair value methodologies.
Securities which may be valued in this manner include, but are not limited to: (i) a security for which trading has been halted or suspended or otherwise does not have a readily available market quotation on a given day; (ii) a debt security that has recently gone into default and for which there is not a current market quotation; (iii) a security of an issuer that has entered into a restructuring; (iv) a security that has been delisted from a national exchange; (v) a security subject to trading collars for which no or limited trading takes place; and (vi) a security whose principal market has been temporarily closed at a time when, under normal conditions, it would be open. Securities valued in this manner are generally categorized as Level 2 or 3 in the hierarchy.
Certain securities held by the Fund may principally trade in foreign markets. Events may occur between the time the foreign markets close and the time at which the Fund's NAVs are calculated. These events may include, but are not limited to, situations relating to a single issuer in a market sector, significant fluctuations in U.S. or foreign markets, natural disasters, armed conflicts, governmental actions or other developments not tied directly to the securities markets. Should the Valuation Designee conclude that such events may have affected the accuracy of the last price of such securities reported on the local foreign market, the Valuation Designee may, pursuant to the Valuation Procedures, adjust the value of the local price to reflect the estimated impact on the price of such securities as a result of such events. In this instance, securities are generally categorized as Level 3 in the hierarchy. Additionally, certain foreign equity securities are also fair valued whenever the movement of a particular index exceeds certain thresholds. In such cases, the securities are fair valued by applying factors provided by a third-party vendor in accordance with the Valuation Procedures and are generally categorized as Level 2 in the hierarchy. Securities that were fair valued in such a manner as of October 31, 2022, are shown in the Portfolio of Investments.
If the principal market of certain foreign equity securities is closed in observance of a local foreign holiday, these securities are valued using
Notes to Financial Statements (continued)
the last closing price of regular trading on the relevant exchange and fair valued by applying factors provided by a third-party vendor in accordance with the Valuation Procedures. These securities are generally categorized as Level 2 in the hierarchy. Securities that were fair valued in such a manner as of October 31, 2022, are shown in the Portfolio of Investments.
Equity securities are valued at the last quoted sales prices as of the close of regular trading on the relevant exchange on each valuation date. Securities that are not traded on the valuation date are valued at the mean of the last quoted bid and ask prices. Prices are normally taken from the principal market in which each security trades. These securities are generally categorized as Level 1 in the hierarchy.
Investments in mutual funds, including money market funds, are valued at their respective NAVs at the close of business each day on the valuation date. These securities are generally categorized as Level 1 in the hierarchy.
Temporary cash investments acquired in excess of 60 days to maturity at the time of purchase are valued using the latest bid prices or using valuations based on a matrix system (which considers such factors as security prices, yields, maturities and ratings), both as furnished by independent pricing services. Temporary cash investments that mature in 60 days or less at the time of purchase ("Short-Term Investments") are valued using the amortized cost method of valuation, unless the use of such method would be inappropriate. The amortized cost method involves valuing a security at its cost on the date of purchase and thereafter assuming a constant amortization to maturity of the difference between such cost and the value on maturity date. Amortized cost approximates the current fair value of a security. Securities valued using the amortized cost method are not valued using quoted prices in an active market and are generally categorized as Level 2 in the hierarchy.
The information above is not intended to reflect an exhaustive list of the methodologies that may be used to value portfolio investments. The Valuation Procedures permit the use of a variety of valuation methodologies in connection with valuing portfolio investments. The methodology used for a specific type of investment may vary based on the market data available or other considerations. The methodologies summarized above may not represent the specific means by which portfolio investments are valued on any particular business day.
(B) Income Taxes. The Fund's policy is to comply with the requirements of the Internal Revenue Code of 1986, as amended (the “Internal Revenue Code”), applicable to regulated investment companies and to distribute all of its taxable income to the shareholders of the Fund within the allowable time limits.
The Manager evaluates the Fund’s tax positions to determine if the tax positions taken meet the minimum recognition threshold in connection with accounting for uncertainties in income tax positions taken or expected to be taken for the purposes of measuring and recognizing tax liabilities in the financial statements. Recognition of tax benefits of an uncertain tax position is permitted only to the extent the position is “more
likely than not” to be sustained assuming examination by taxing authorities. The Manager analyzed the Fund's tax positions taken on federal, state and local income tax returns for all open tax years (for up to three tax years) and has concluded that no provisions for federal, state and local income tax are required in the Fund's financial statements. The Fund's federal, state and local income tax and federal excise tax returns for tax years for which the applicable statutes of limitations have not expired are subject to examination by the Internal Revenue Service and state and local departments of revenue.
(C) Foreign Taxes. The Fund may be subject to foreign taxes on income and other transaction-based taxes imposed by certain countries in which it invests. A portion of the taxes on gains on investments or currency purchases/repatriation may be reclaimable. The Fund will accrue such taxes and reclaims as applicable, based upon its current interpretation of tax rules and regulations that exist in the markets in which it invests.
The Fund may be subject to taxation on realized capital gains, repatriation proceeds and other transaction-based taxes imposed by certain countries in which it invests. The Fund will accrue such taxes as applicable based upon its current interpretation of tax rules and regulations that exist in the market in which it invests. Capital gains taxes relating to positions still held are reflected as a liability in the Statement of Assets and Liabilities, as well as an adjustment to the Fund's net unrealized appreciation (depreciation). Taxes related to capital gains realized, if any, are reflected as part of net realized gain (loss) in the Statement of Operations. Changes in tax liabilities related to capital gains taxes on unrealized investment gains, if any, are reflected as part of the change in net unrealized appreciation (depreciation) on investments in the Statement of Operations. Transaction-based charges are generally assessed as a percentage of the transaction amount.
(D) Dividends and Distributions to Shareholders. Dividends and distributions are recorded on the ex-dividend date. The Fund intends to declare and pay dividends from net investment income and distributions from net realized capital and currency gains, if any, at least annually. Unless a shareholder elects otherwise, all dividends and distributions are reinvested at NAV in the same class of shares of the Fund. Dividends and distributions to shareholders are determined in accordance with federal income tax regulations and may differ from determinations using GAAP.
(E) Security Transactions and Investment Income. The Fund records security transactions on the trade date. Realized gains and losses on security transactions are determined using the identified cost method. Dividend income is recognized on the ex-dividend date, net of any foreign tax withheld at the source, and interest income is accrued as earned using the effective interest rate method. Distributions received from real estate investment trusts may be classified as dividends, capital gains and/or return of capital.
Investment income and realized and unrealized gains and losses on investments of the Fund are allocated pro rata to the separate classes of
| 24 | MainStay Candriam Emerging Markets Equity Fund |
shares based upon their relative net assets on the date the income is earned or realized and unrealized gains and losses are incurred.
(F) Expenses. Expenses of the Trust are allocated to the individual Funds in proportion to the net assets of the respective Funds when the expenses are incurred, except where direct allocations of expenses can be made. Expenses (other than transfer agent expenses and fees incurred under the shareholder services plans and/or the distribution plans further discussed in Note 3(B)) are allocated to separate classes of shares pro rata based upon their relative net assets on the date the expenses are incurred. The expenses borne by the Fund, including those of related parties to the Fund, are shown in the Statement of Operations.
Additionally, the Fund may invest in mutual funds, which are subject to management fees and other fees that may cause the costs of investing in mutual funds to be greater than the costs of owning the underlying securities directly. These indirect expenses of mutual funds are not included in the amounts shown as expenses in the Statement of Operations or in the expense ratios included in the Financial Highlights.
(G) Use of Estimates. In preparing financial statements in conformity with GAAP, the Manager makes estimates and assumptions that affect the reported amounts and disclosures in the financial statements. Actual results could differ from those estimates and assumptions.
(H) Foreign Currency Forward Contracts. The Fund may enter into foreign currency forward contracts, which are agreements to buy or sell foreign currencies on a specified future date at a specified rate. The Fund is subject to foreign currency exchange rate risk in the normal course of investing in these transactions. During the period the forward contract is open, changes in the value of the contract are recognized as unrealized appreciation or depreciation by marking to market such contract on a daily basis to reflect the market value of the contract at the end of each day’s trading. Cash movement occurs on the settlement date. When the forward contract is closed, the Fund records a realized gain or loss equal to the difference between the proceeds from (or cost of) the closing transaction and the Fund's basis in the contract. The Fund may purchase and sell foreign currency forward contracts for purposes of seeking to enhance portfolio returns and manage portfolio risk more efficiently. Foreign currency forward contracts may also be used to gain exposure to a particular currency or to hedge against the risk of loss due to changing currency exchange rates. Foreign currency forward contracts to purchase or sell a foreign currency may also be used in anticipation of future purchases or sales of securities denominated in foreign currency, even if the specific investments have not yet been selected.
The use of foreign currency forward contracts involves, to varying degrees, elements of risk in excess of the amount recognized in the Statement of Assets and Liabilities, including counterparty risk, market risk, leverage risk, operational risk, legal risk and liquidity risk. Counterparty risk is heightened for these instruments because foreign currency forward contracts are not exchange-traded and therefore no clearinghouse or exchange stands ready to meet the obligations under such contracts. Thus, the Fund faces the risk that its counterparties under
such contracts may not perform their obligations. Market risk is the risk that the value of a foreign currency forward contract will depreciate due to unfavorable changes in exchange rates. Liquidity risk arises because the secondary market for foreign currency forward contracts may have less liquidity relative to markets for other securities and financial instruments. Liquidity risk also can arise when forward currency contracts create margin or settlement payment obligations for the Fund. Leverage risk is the risk that a foreign currency forward contract can magnify the Fund's gains and losses. Operational risk refers to risk related to potential operational issues (including documentation issues, settlement issues, systems failures, inadequate controls and human error), and legal risk refers to insufficient documentation, insufficient capacity or authority of the counterparty, or legality or enforceability of a foreign currency forward contract. Risks also arise from the possible movements in the foreign exchange rates underlying these instruments. While the Fund may enter into forward contracts to reduce currency exchange risks, changes in currency exchange rates may result in poorer overall performance for the Fund than if it had not engaged in such transactions. Exchange rate movements can be large, depending on the currency, and can last for extended periods of time, affecting the value of the Fund's assets. Moreover, there may be an imperfect correlation between the Fund's holdings of securities denominated in a particular currency and forward contracts entered into by the Fund. Such imperfect correlation may prevent the Fund from achieving the intended hedge or expose the Fund to the risk of currency exchange loss. The unrealized appreciation (depreciation) on forward contracts also reflects the Fund's exposure at the valuation date to credit loss in the event of a counterparty’s failure to perform its obligations. As of October 31, 2022, the Fund did not hold any foreign currency forward contracts.
(I) Foreign Currency Transactions. The Fund's books and records are maintained in U.S. dollars. Prices of securities denominated in foreign currency amounts are translated into U.S. dollars at the mean between the buying and selling rates last quoted by any major U.S. bank at the following dates:
(i) market value of investment securities, other assets and liabilities— at the valuation date; and
(ii) purchases and sales of investment securities, income and expenses—at the date of such transactions.
The assets and liabilities that are denominated in foreign currency amounts are presented at the exchange rates and market values at the close of the period. The realized and unrealized changes in net assets arising from fluctuations in exchange rates and market prices of securities are not separately presented.
Net realized gain (loss) on foreign currency transactions represents net currency gains or losses realized as a result of differences between the amounts of securities sale proceeds or purchase cost, dividends, interest and withholding taxes as recorded on the Fund's books, and the U.S. dollar equivalent amount actually received or paid. Net currency gains or losses from valuing such foreign currency denominated assets and
Notes to Financial Statements (continued)
liabilities, other than investments at valuation date exchange rates, are reflected in unrealized foreign exchange gains or losses.
(J) Securities Lending. In order to realize additional income, the Fund may engage in securities lending, subject to the limitations set forth in the 1940 Act and relevant guidance by the staff of the Securities and Exchange Commission (“SEC”). If the Fund engages in securities lending, the Fund will lend through its custodian, JPMorgan Chase Bank, N.A., ("JPMorgan"), acting as securities lending agent on behalf of the Fund. Under the current arrangement, JPMorgan will manage the Fund's collateral in accordance with the securities lending agency agreement between the Fund and JPMorgan, and indemnify the Fund against counterparty risk. The loans will be collateralized by cash (which may be invested in a money market fund) and/or non-cash collateral (which may include U.S. Treasury securities and/or U.S. government agency securities issued or guaranteed by the United States government or its agencies or instrumentalities) at least equal at all times to the market value of the securities loaned. Non-cash collateral held at year end is segregated and cannot be transferred by the Fund. The Fund bears the risk of delay in recovery of, or loss of rights in, the securities loaned. The Fund may also record a realized gain or loss on securities deemed sold due to a borrower’s inability to return securities on loan. The Fund bears the risk of any loss on investment of cash collateral. The Fund will receive compensation for lending its securities in the form of fees or it will retain a portion of interest earned on the investment of any cash collateral. The Fund will also continue to receive interest and dividends on the securities loaned and any gain or loss in the market price of the securities loaned that may occur during the term of the loan will be for the account of the Fund. Income earned from securities lending activities, if any, is reflected in the Statement of Operations. Securities on loan as of October 31, 2022, are shown in the Portfolio of Investments.
(K) Foreign Securities Risk. The Fund may invest in foreign securities, which carry certain risks that are in addition to the usual risks inherent in domestic securities. These risks include those resulting from currency fluctuations, future adverse political or economic developments and possible imposition of currency exchange blockages or other foreign governmental laws or restrictions. These risks are likely to be greater in emerging markets than in developed markets. The ability of issuers of debt securities held by the Fund to meet their obligations may be affected by, among other things, economic or political developments in a specific country, industry or region. For example, the Fund's portfolio has significant investments in the Asia-Pacific region. The development and stability of the Asia-Pacific region can be adversely affected by, among other regional and global developments, trade barriers, exchange controls and other measures imposed or negotiated by the countries with which they trade. Some Asia-Pacific countries can be characterized as emerging markets or newly industrialized and may experience more volatile economic cycles and less liquid markets than developed countries.
(L) Indemnifications. Under the Trust’s organizational documents, its officers and trustees are indemnified against certain liabilities that may arise out of performance of their duties to the Trust. Additionally, in the
normal course of business, the Fund enters into contracts with third-party service providers that contain a variety of representations and warranties and that may provide general indemnifications. The Fund's maximum exposure under these arrangements is unknown, as this would involve future claims that may be made against the Fund that have not yet occurred. The Manager believes that the risk of loss in connection with these potential indemnification obligations is remote. However, there can be no assurance that material liabilities related to such obligations will not arise in the future, which could adversely impact the Fund.
(M) Quantitative Disclosure of Derivative Holdings. The following tables show additional disclosures related to the Fund's derivative and hedging activities, including how such activities are accounted for and their effect on the Fund's financial positions, performance and cash flows. These derivatives are not accounted for as hedging instruments.
The effect of derivative instruments on the Statement of Operations for the year ended October 31, 2022:
| Net Realized Gain (Loss) from: | Foreign
Exchange
Contracts
Risk | Total |
| Forward Contracts | $(25,622) | $(25,622) |
| Total Net Realized Gain (Loss) | $(25,622) | $(25,622) |
| Average Notional Amount | Total |
| Forward Contracts Long (a) | $56,443 |
| (a) | Position was open one month during the reporting period. |
Note 3–Fees and Related Party Transactions
(A) Manager and Subadvisor. New York Life Investments, a registered investment adviser and an indirect, wholly-owned subsidiary of New York Life Insurance Company ("New York Life"), serves as the Fund's Manager, pursuant to an Amended and Restated Management Agreement (“Management Agreement”). The Manager provides offices, conducts clerical, recordkeeping and bookkeeping services and keeps most of the financial and accounting records required to be maintained by the Fund. Except for the portion of salaries and expenses that are the responsibility of the Fund, the Manager pays the salaries and expenses of all personnel affiliated with the Fund and certain operational expenses of the Fund. During a portion of the year ended October 31, 2022, the Fund reimbursed New York Life Investments in an amount equal to the portion of the compensation of the Chief Compliance Officer attributable to the Fund. Candriam (the "Subadvisor"), a registered investment adviser and an indirect, wholly-owned subsidiary of New York Life, serves as the Subadvisor to the Fund and is responsible for the day-to-day portfolio management of the Fund. Pursuant to the terms of a Subadvisory Agreement (“Subadvisory Agreement”) between New York Life Investments and Candriam, New York Life Investments pays for the services of the Subadvisor.
| 26 | MainStay Candriam Emerging Markets Equity Fund |
Pursuant to the Management Agreement, the Fund pays the Manager a monthly fee for the services performed and the facilities furnished at an annual rate of the Fund’s average daily net assets as follows: 1.00% up to $1 billion and 0.975% in excess of $1 billion. During the year ended October 31, 2022, the effective management fee rate was 1.00% of the Fund’s average daily net assets, exclusive of any applicable waivers/reimbursements.
Effective June 10, 2022, New York Life Investments has contractually agreed to waive fees and/or reimburse expenses so that Total Annual Fund Operating Expenses (excluding taxes, interest, litigation, extraordinary expenses, brokerage and other transaction expenses relating to the purchase or sale of portfolio investments, and acquired (underlying) fund fees and expenses) for Class I shares do not exceed 1.01% of the Fund’s average daily net assets. New York Life Investments will apply a waiver or reimbursement so that Class R6 fees and expenses do not exceed those of Class I. This agreement will remain in effect until February 28, 2024, and shall renew automatically for one-year terms unless New York Life Investments provides written notice of termination prior to the start of the next term or upon approval of the Board.
For the period November 1, 2021 through June 12, 2022, New York Life Investments had contractually agreed to waive fees and/or reimburse expenses so that Total Annual Fund Operating Expenses (excluding taxes, interest, litigation, extraordinary expenses, brokerage and other transaction expenses relating to the purchase or sale of portfolio investments, and acquired (underlying) fund fees and expenses) for Class I shares do not exceed 1.10% of the Fund’s average daily net assets.
New York Life Investments has contractually agreed to waive fees and/or reimburse expenses so that Total Annual Fund Operating Expenses (excluding taxes, interest, litigation, extraordinary expenses, brokerage and other transaction expenses relating to the purchase or sale of portfolio investments and acquired (underlying) fund fees and expenses) for Class A shares do not exceed 1.50% of the Fund's average daily net assets. New York Life Investments will apply an equivalent waiver or reimbursement, in an equal number of basis points of the Class A shares waiver/reimbursement, to Investor Class and Class C. These agreements will remain in effect until February 28, 2023, and shall renew automatically for one-year terms unless New York Life Investments provides written notice of termination prior to the start of the next term or upon approval of the Board.
During the year ended October 31, 2022, New York Life Investments earned fees from the Fund in the amount of $1,004,093 and waived fees and/or reimbursed expenses in the amount of $349,898 and paid the Subadvisor fees of $327,098.
JPMorgan provides sub-administration and sub-accounting services to the Fund pursuant to an agreement with New York Life Investments. These services include calculating the daily NAVs of the Fund, maintaining the general ledger and sub-ledger accounts for the calculation of the Fund's NAVs, and assisting New York Life Investments in conducting various aspects of the Fund's administrative operations. For
providing these services to the Fund, JPMorgan is compensated by New York Life Investments.
Pursuant to an agreement between the Trust and New York Life Investments, New York Life Investments is responsible for providing or procuring certain regulatory reporting services for the Fund. The Fund will reimburse New York Life Investments for the actual costs incurred by New York Life Investments in connection with providing or procuring these services for the Fund.
(B) Distribution and Service Fees. The Trust, on behalf of the Fund, has entered into a distribution agreement with NYLIFE Distributors LLC (the “Distributor”), an affiliate of New York Life Investments. The Fund has adopted distribution plans (the “Plans”) in accordance with the provisions of Rule 12b-1 under the 1940 Act.
Pursuant to the Class A and Investor Class Plans, the Distributor receives a monthly fee from the Class A and Investor Class shares at an annual rate of 0.25% of the average daily net assets of the Class A and Investor Class shares for distribution and/or service activities as designated by the Distributor. Pursuant to the Class C Plan, Class C shares pay the Distributor a monthly distribution fee at an annual rate of 0.75% of the average daily net assets of the Class C shares, along with a service fee at an annual rate of 0.25% of the average daily net assets of the Class C shares, for a total 12b-1 fee of 1.00%. Class I and Class R6 shares are not subject to a distribution and/or service fee.
The Plans provide that the distribution and service fees are payable to the Distributor regardless of the amounts actually expended by the Distributor for distribution of the Fund's shares and service activities.
(C) Sales Charges. The Fund was advised by the Distributor that the amount of initial sales charges retained on sales of Class A and Investor Class shares during the year ended October 31, 2022, were $1,079 and $89, respectively.
(D) Transfer, Dividend Disbursing and Shareholder Servicing Agent. NYLIM Service Company LLC, an affiliate of New York Life Investments, is the Fund's transfer, dividend disbursing and shareholder servicing agent pursuant to an agreement between NYLIM Service Company LLC and the Trust. NYLIM Service Company LLC has entered into an agreement with DST Asset Manager Solutions, Inc. ("DST"), pursuant to which DST performs certain transfer agent services on behalf of NYLIM Service Company LLC. New York Life Investments has contractually agreed to limit the transfer agency expenses charged to the Fund’s share classes to a maximum of 0.35% of that share class’s average daily net assets on an annual basis after deducting any applicable Fund or class-level expense reimbursement or small account fees. This agreement will remain in effect until February 28, 2023, and shall renew automatically for one-year terms unless New York Life Investments provides written notice of termination prior to the start of the next term or upon approval of the Board. During the year ended October 31, 2022, transfer agent expenses incurred by the Fund and any
Notes to Financial Statements (continued)
reimbursements, pursuant to the aforementioned Transfer Agency expense limitation agreement, were as follows:
| Class | Expense | Waived |
| Class A | $ 3,311 | $— |
| Investor Class | 932 | — |
| Class C | 444 | — |
| Class I | 10,914 | — |
| Class R6 | 3,559 | — |
(E) Small Account Fee. Shareholders with small accounts adversely impact the cost of providing transfer agency services. In an effort to reduce total transfer agency expenses, the Fund has implemented a small account fee on certain types of accounts. As described in the Fund's prospectus, certain shareholders with an account balance of less than $1,000 ($5,000 for Class A share accounts) are charged an annual per account fee of $20 (assessed semi-annually), the proceeds from which offset transfer agent fees as reflected in the Statement of Operations. This small account fee will not apply to certain types of accounts as described further in the Fund’s prospectus.
(F) Capital. As of October 31, 2022, New York Life and its affiliates beneficially held shares of the Fund with the values and percentages of net assets as follows:
| Class I | $23,665 | 0.2% |
| Class R6 | 23,666 | 0.0‡ |
| ‡ | Less than one-tenth of a percent. |
Note 4-Federal Income Tax
As of October 31, 2022, the cost and unrealized appreciation (depreciation) of the Fund’s investment portfolio, including applicable derivative contracts and other financial instruments, as determined on a federal income tax basis, were as follows:
| | Federal Tax
Cost | Gross
Unrealized
Appreciation | Gross
Unrealized
(Depreciation) | Net
Unrealized
Appreciation/
(Depreciation) |
| Investments in Securities | $122,360,399 | $6,270,093 | $(22,508,642) | $(16,238,549) |
As of October 31, 2022, the components of accumulated gain (loss) on a tax basis were as follows:
Ordinary
income | Accumulated
Capital
and Other
Gain (Loss) | Other
Temporary
Differences | Unrealized
Appreciation
(Depreciation) | Total
Accumulated
Gain (Loss) |
| $1,299,709 | $(14,167,029) | $— | $(16,432,317) | $(29,299,637) |
The difference between book-basis and tax-basis unrealized appreciation (depreciation) is primarily due to wash sale adjustments and Passive Foreign Investment Company ("PFIC") adjustments.
As of October 31, 2022, for federal income tax purposes, capital loss carryforwards of $14,167,029, as shown in the table below, were available to the extent provided by the regulations to offset future realized gains of the Fund. Accordingly, no capital gains distributions are expected to be paid to shareholders until net gains have been realized in excess of such amounts.
Capital Loss
Available Through | Short-Term
Capital Loss
Amounts (000’s) | Long-Term
Capital Loss
Amounts (000’s) |
| Unlimited | $14,167 | $— |
During the years ended October 31, 2022 and October 31, 2021, the tax character of distributions paid as reflected in the Statements of Changes in Net Assets was as follows:
| | 2022 | 2021 |
| Distributions paid from: | | |
| Ordinary Income | $802,323 | $450,910 |
Note 5–Custodian
JPMorgan is the custodian of cash and securities held by the Fund. Custodial fees are charged to the Fund based on the Fund's net assets and/or the market value of securities held by the Fund and the number of certain transactions incurred by the Fund.
Note 6–Line of Credit
The Fund and certain other funds managed by New York Life Investments maintain a line of credit with a syndicate of banks in order to secure a source of funds for temporary purposes to meet unanticipated or excessive redemption requests.
Effective July 26, 2022, under the credit agreement (the “Credit Agreement”), the aggregate commitment amount is $600,000,000 with an additional uncommitted amount of $100,000,000. The commitment fee is an annual rate of 0.15% of the average commitment amount payable quarterly, regardless of usage, to JPMorgan, who serves as the agent to the syndicate. The commitment fee is allocated among the Fund and certain other funds managed by New York Life Investments based upon their respective net assets and other factors. Interest on any revolving credit loan is charged based upon the Federal Funds Rate, Daily Simple Secured Overnight Financing Rate ("SOFR") + 0.10%, or the Overnight Bank Funding Rate, whichever is higher. The Credit Agreement expires on July 25, 2023, although the Fund, certain other funds managed by New York Life Investments and the syndicate of banks may renew the Credit Agreement for an additional year on the same or different terms or enter into a credit agreement with a different syndicate of banks. Prior to July 26, 2022, the aggregate commitment amount and the commitment fee were the same as those under the current Credit Agreement. During the year ended October 31, 2022, there were no
| 28 | MainStay Candriam Emerging Markets Equity Fund |
borrowings made or outstanding with respect to the Fund under the Credit Agreement.
Note 7–Interfund Lending Program
Pursuant to an exemptive order issued by the SEC, the Fund, along with certain other funds managed by New York Life Investments, may participate in an interfund lending program. The interfund lending program provides an alternative credit facility that permits the Fund and certain other funds managed by New York Life Investments to lend or borrow money for temporary purposes directly to or from one another, subject to the conditions of the exemptive order. During the year ended October 31, 2022, there were no interfund loans made or outstanding with respect to the Fund.
Note 8–Purchases and Sales of Securities (in 000’s)
During the year ended October 31, 2022, purchases and sales of securities, other than short-term securities, were $162,509 and $101,342, respectively.
Note 9–Capital Share Transactions
Transactions in capital shares for the years ended October 31, 2022 and October 31, 2021, were as follows:
| Class A | Shares | Amount |
| Year ended October 31, 2022: | | |
| Shares sold | 103,556 | $ 1,141,430 |
| Shares issued to shareholders in reinvestment of distributions | 1,080 | 13,154 |
| Shares redeemed | (78,458) | (865,939) |
| Net increase (decrease) in shares outstanding before conversion | 26,178 | 288,645 |
| Shares converted into Class A (See Note 1) | 4,437 | 49,329 |
| Net increase (decrease) | 30,615 | $ 337,974 |
| Year ended October 31, 2021: | | |
| Shares sold | 183,552 | $ 2,422,744 |
| Shares issued to shareholders in reinvestment of distributions | 294 | 3,539 |
| Shares redeemed | (73,552) | (961,047) |
| Net increase (decrease) in shares outstanding before conversion | 110,294 | 1,465,236 |
| Shares converted into Class A (See Note 1) | 14,968 | 188,531 |
| Net increase (decrease) | 125,262 | $ 1,653,767 |
| |
| Investor Class | Shares | Amount |
| Year ended October 31, 2022: | | |
| Shares sold | 5,012 | $ 55,702 |
| Shares issued to shareholders in reinvestment of distributions | 183 | 2,228 |
| Shares redeemed | (10,689) | (111,295) |
| Net increase (decrease) in shares outstanding before conversion | (5,494) | (53,365) |
| Shares converted into Investor Class (See Note 1) | 182 | 1,857 |
| Shares converted from Investor Class (See Note 1) | (3,454) | (40,618) |
| Net increase (decrease) | (8,766) | $ (92,126) |
| Year ended October 31, 2021: | | |
| Shares sold | 28,442 | $ 373,741 |
| Shares issued to shareholders in reinvestment of distributions | 70 | 842 |
| Shares redeemed | (8,659) | (111,752) |
| Net increase (decrease) in shares outstanding before conversion | 19,853 | 262,831 |
| Shares converted into Investor Class (See Note 1) | 1,158 | 15,431 |
| Shares converted from Investor Class (See Note 1) | (14,872) | (187,174) |
| Net increase (decrease) | 6,139 | $ 91,088 |
| |
| Class C | Shares | Amount |
| Year ended October 31, 2022: | | |
| Shares sold | 2,570 | $ 28,268 |
| Shares redeemed | (1,811) | (18,804) |
| Net increase (decrease) in shares outstanding before conversion | 759 | 9,464 |
| Shares converted from Class C (See Note 1) | (186) | (1,857) |
| Net increase (decrease) | 573 | $ 7,607 |
| Year ended October 31, 2021: | | |
| Shares sold | 3,454 | $ 44,739 |
| Shares redeemed | (5,870) | (74,767) |
| Net increase (decrease) in shares outstanding before conversion | (2,416) | (30,028) |
| Shares converted from Class C (See Note 1) | (1,278) | (16,788) |
| Net increase (decrease) | (3,694) | $ (46,816) |
| |
Notes to Financial Statements (continued)
| Class I | Shares | Amount |
| Year ended October 31, 2022: | | |
| Shares sold | 1,475,630 | $ 15,043,035 |
| Shares issued to shareholders in reinvestment of distributions | 2,077 | 25,483 |
| Shares redeemed | (273,007) | (2,590,693) |
| Net increase (decrease) | 1,204,700 | $ 12,477,825 |
| Year ended October 31, 2021: | | |
| Shares sold | 628,742 | $ 8,155,416 |
| Shares issued to shareholders in reinvestment of distributions | 17 | 210 |
| Shares redeemed | (279,040) | (3,577,313) |
| Net increase (decrease) | 349,719 | $ 4,578,313 |
| |
| Class R6 | Shares | Amount |
| Year ended October 31, 2022: | | |
| Shares sold | 5,207,580 | $ 53,455,404 |
| Shares issued to shareholders in reinvestment of distributions | 61,678 | 751,850 |
| Shares redeemed | (521,083) | (5,259,492) |
| Net increase (decrease) in shares outstanding before conversion | 4,748,175 | 48,947,762 |
| Shares converted from Class R6 (See Note 1) | (988) | (8,711) |
| Net increase (decrease) | 4,747,187 | $ 48,939,051 |
| Year ended October 31, 2021: | | |
| Shares sold | 541,627 | $ 7,129,840 |
| Shares issued to shareholders in reinvestment of distributions | 37,020 | 446,085 |
| Shares redeemed | (1,790,189) | (23,393,114) |
| Net increase (decrease) | (1,211,542) | $(15,817,189) |
Note 10–Other Matters
As of the date of this report, interest rates in the United States and many parts of the world, including certain European countries, are ascending from historically low levels. Thus, the Fund currently faces a heightened level of risk associated with rising interest rates. This could be driven by a variety of factors, including but not limited to central bank monetary policies, changing inflation or real growth rates, general economic conditions, increasing bond issuances or reduced market demand for low yielding investments.
An outbreak of COVID-19, first detected in December 2019, has developed into a global pandemic and has resulted in travel restrictions, closure of international borders, certain businesses and securities markets, restrictions on securities trading activities, prolonged quarantines, supply chain disruptions, and lower consumer demand, as well as general concern and uncertainty. In 2022, many countries lifted some or all restrictions related to COVID-19. However, the continued impact of COVID-19 and related variants is uncertain and could further adversely affect the global economy, national economies, individual issuers and capital markets in unforeseeable ways and result in a substantial and extended economic downturn. Developments that disrupt
global economies and financial markets, such as COVID-19, may magnify factors that affect the Fund's performance.
Note 11–Subsequent Events
In connection with the preparation of the financial statements of the Fund as of and for the year ended October 31, 2022, events and transactions subsequent to October 31, 2022, through the date the financial statements were issued have been evaluated by the Manager for possible adjustment and/or disclosure. No subsequent events requiring financial statement adjustment or disclosure have been identified.
| 30 | MainStay Candriam Emerging Markets Equity Fund |
Report of Independent Registered Public Accounting Firm
To the Shareholders of the Fund and Board of Trustees
MainStay Funds Trust:
Opinion on the Financial Statements
We have audited the accompanying statement of assets and liabilities of MainStay Candriam Emerging Markets Equity Fund (the Fund), one of the funds constituting MainStay Funds Trust, including the portfolio of investments, as of October 31, 2022, the related statement of operations for the year then ended, the statements of changes in net assets for each of the years in the two-year period then ended, and the related notes (collectively, the financial statements) and the financial highlights for each of the years in the four-year period then ended and the period from November 15, 2017 (commencement of operations) through October 31, 2018. In our opinion, the financial statements and financial highlights present fairly, in all material respects, the financial position of the Fund as of October 31, 2022, the results of its operations for the year then ended, the changes in its net assets for each of the years in the two-year period then ended, and the financial highlights for each of the years in the four-year period then ended and the period November 15, 2017 through October 31, 2018, in conformity with U.S. generally accepted accounting principles.
Basis for Opinion
These financial statements and financial highlights are the responsibility of the Fund's management. Our responsibility is to express an opinion on these financial statements and financial highlights based on our audits. We are a public accounting firm registered with the Public Company Accounting Oversight Board (United States) (PCAOB) and are required to be independent with respect to the Fund in accordance with the U.S. federal securities laws and the applicable rules and regulations of the Securities and Exchange Commission and the PCAOB.
We conducted our audits in accordance with the standards of the PCAOB. Those standards require that we plan and perform the audit to obtain reasonable assurance about whether the financial statements and financial highlights are free of material misstatement, whether due to error or fraud. Our audits included performing procedures to assess the risks of material misstatement of the financial statements and financial highlights, whether due to error or fraud, and performing procedures that respond to those risks. Such procedures included examining, on a test basis, evidence regarding the amounts and disclosures in the financial statements and financial highlights. Such procedures also included confirmation of securities owned as of October 31, 2022, by correspondence with custodians and brokers; when replies were not received from the broker, we performed other auditing procedures. Our audits also included evaluating the accounting principles used and significant estimates made by management, as well as evaluating the overall presentation of the financial statements and financial highlights. We believe that our audits provide a reasonable basis for our opinion.

We have served as the auditor of one or more New York Life Investment Management investment companies since 2003.
Philadelphia, Pennsylvania
December 23, 2022
Federal Income Tax Information
(Unaudited)
The Fund is required under the Internal Revenue Code to advise shareholders in a written statement as to the federal tax status of dividends paid by the Fund during such fiscal years.
For the fiscal year ended October 31, 2022, the Fund designated approximately $663,370 under the Internal Revenue Code as qualified dividend income eligible for reduced tax rates.
The dividends paid by the Fund during the fiscal year ended October 31, 2022 should be multiplied by 2.27% to arrive at the amount eligible for the corporate dividend-received deduction.
In accordance with federal tax law, the Fund elected to provide each shareholder with their portion of the Fund’s foreign taxes paid and the income sourced from foreign countries. Accordingly, the Fund made the following designations regarding its fiscal year ended October 31, 2022:
• the total amount of taxes credited to foreign countries was $462,293.
• the total amount of income sourced from foreign countries was $2,892,064.
In February 2023, shareholders will receive an IRS Form 1099-DIV or substitute Form 1099, which will show the federal tax status of the distributions received by shareholders in calendar year 2022. The amounts that will be reported on such 1099-DIV or substitute Form 1099 will be the amounts you are to use on your federal income tax return and will differ from the amounts which we must report for the Fund's fiscal year ended October 31, 2022.
Proxy Voting Policies and Procedures and Proxy Voting Record
The Fund is required to file with the SEC its proxy voting record for the 12-month period ending June 30 on Form N-PX. A description of the policies and procedures that are used to vote proxies relating to portfolio securities of the Fund is available free of charge upon request by calling 800-624-6782 or visiting the SEC’s website at www.sec.gov. The most recent Form N-PX or proxy voting record is available free of charge upon request by calling 800-624-6782; visiting newyorklifeinvestments.com; or visiting the SEC’s website at www.sec.gov.
Shareholder Reports and Quarterly Portfolio Disclosure
The Fund is required to file its complete schedule of portfolio holdings with the SEC 60 days after its first and third fiscal quarter on Form N-PORT. The Fund's holdings report is available free of charge upon request by calling New York Life Investments at 800-624-6782.
| 32 | MainStay Candriam Emerging Markets Equity Fund |
Board of Trustees and Officers (Unaudited)
The Trustees and officers of the Fund are listed below. The Board oversees the MainStay Group of Funds (which consists of MainStay Funds and MainStay Funds Trust), MainStay VP Funds Trust, MainStay MacKay DefinedTerm Municipal Opportunities Fund, MainStay CBRE Global Infrastructure Megatrends Fund, the Manager and the Subadvisors, and elects the officers of the Funds who are responsible for the day-to-day operations of the Fund. Information pertaining to the Trustees and officers is set forth below. Each Trustee serves until his or her successor is
elected and qualified or until his or her resignation, death or removal. Under the Board’s retirement policy, unless an exception is made, a Trustee must tender his or her resignation by the end of the calendar year during which he or she reaches the age of 75. The business address of each Trustee and officer listed below is 51 Madison Avenue, New York, New York 10010. None of the Trustees are “interested persons” (as defined by the 1940 Act and rules adopted by the SEC thereunder) of the Fund (“Independent Trustees”).
| | Name and
Year of Birth | Term of Office,
Position(s) Held and
Length of Service | Principal Occupation(s)
During Past Five Years | Number of
Portfolios in
Fund Complex
Overseen by
Trustee | Other Directorships
Held by Trustee |
| | | | | | |
| | David H. Chow
1957 | MainStay Funds: Trustee since 2016, Advisory Board Member (June 2015 to December 2015);MainStay Funds Trust:
Trustee since January 2016, Advisory Board Member (June 2015 to December 2015) | Founder and CEO, DanCourt Management, LLC since 1999 | 78 | MainStay VP Funds Trust: Trustee since January 2016, Advisory Board Member (June 2015 to December 2015) (31 portfolios);
MainStay MacKay DefinedTerm Municipal Opportunities Fund: Trustee since January 2016, Advisory Board Member (June 2015 to December 2015);
MainStay CBRE Global Infrastructure Megatrends Fund: Trustee since June 2021; VanEck Vectors Group of Exchange-Traded Funds: Independent Chairman of the Board of Trustees since 2008 and Trustee since 2006 (56 portfolios); and Berea College of Kentucky: Trustee since 2009, Chair of the Investment Committee since 2018 |
| | Susan B. Kerley
1951 | MainStay Funds: Chairman since 2017 and Trustee since 2007;MainStay Funds Trust:
Chairman since 2017 and Trustee since 1990** | President, Strategic Management Advisors LLC since 1990 | 78 | MainStay VP Funds Trust: Chairman since January 2017 and Trustee since 2007 (31 portfolios)**;
MainStay MacKay DefinedTerm Municipal Opportunities Fund: Chairman since 2017 and Trustee since 2011;
MainStay CBRE Global Infrastructure Megatrends Fund: Trustee since June 2021; and Legg Mason Partners Funds: Trustee since 1991 (45 portfolios) |
| | Alan R. Latshaw
1951 | MainStay Funds: Trustee since 2006;MainStay Funds Trust:
Trustee since 2007*** | Retired; Partner, Ernst & Young LLP (2002 to 2003); Partner, Arthur Andersen LLP (1989 to 2002); Consultant to the MainStay Funds Audit and Compliance Committee (2004 to 2006) | 78 | MainStay VP Funds Trust: Trustee since 2007 (31 portfolios)**;
MainStay MacKay DefinedTerm Municipal Opportunities Fund: Trustee since 2011; and
MainStay CBRE Global Infrastructure Megatrends Fund: Trustee since June 2021 |
Board of Trustees and Officers (Unaudited) (continued)
| | Name and
Year of Birth | Term of Office,
Position(s) Held and
Length of Service | Principal Occupation(s)
During Past Five Years | Number of
Portfolios in
Fund Complex
Overseen by
Trustee | Other Directorships
Held by Trustee |
| | | | | | |
| | Karen Hammond
1956 | MainStay Funds: Trustee since December 2021, Advisory Board Member (June 2021 to December 2021);MainStay Funds Trust:
Trustee since December 2021, Advisory Board Member (June 2021 to December 2021)
| Retired, Managing Director, Devonshire Investors (2007 to 2013); Senior Vice President, Fidelity Management & Research Co. (2005 to 2007); Senior Vice President and Corporate Treasurer, FMR Corp. (2003 to 2005); Chief Operating Officer, Fidelity Investments Japan (2001 to 2003) | 78 | MainStay VP Funds Trust: Trustee since December 2021, Advisory Board Member (June 2021 to December 2021) (31 Portfolios);
MainStay MacKay DefinedTerm Municipal Opportunities Fund: Trustee since December 2021, Advisory Board Member (June 2021 to December 2021);
MainStay CBRE Global Infrastructure Megatrends Fund: Trustee since December 2021, Advisory Board Member (June 2021 to December 2021);
Two Harbors Investment Corp.: Director since 2018;
Rhode Island State Investment Commission: Member since 2017; and
Blue Cross Blue Shield of Rhode Island: Director since 2019 |
| | Jacques P. Perold
1958 | MainStay Funds: Trustee since 2016, Advisory Board Member (June 2015 toDecember 2015);MainStay Funds Trust:
Trustee since January 2016, Advisory Board Member (June 2015 to December 2015) | Founder and Chief Executive Officer, CapShift Advisors LLC (since 2018); President, Fidelity Management & Research Company (2009 to 2014); President and Chief Investment Officer, Geode Capital Management, LLC (2001 to 2009) | 78 | MainStay VP Funds Trust: Trustee since January 2016, Advisory Board Member (June 2015 to December 2015) (31 portfolios);
MainStay MacKay DefinedTerm Municipal Opportunities Fund: Trustee since January 2016, Advisory Board Member (June 2015 to December 2015);
MainStay CBRE Global Infrastructure Megatrends Fund: Trustee since June 2021; Partners in Health: Trustee since 2019; Allstate Corporation: Director since 2015; and MSCI Inc.: Director since 2017 |
| | Richard S. Trutanic
1952 | MainStay Funds: Trustee since 1994;MainStay Funds Trust:
Trustee since 2007*** | Chairman and Chief Executive Officer, Somerset & Company (financial advisory firm) since 2004; Managing Director, The Carlyle Group (private investment firm) (2002 to 2004); Senior Managing Director, Partner and Board Member, Groupe Arnault S.A. (private investment firm) (1999 to 2002) | 78 | MainStay VP Funds Trust: Trustee since 2007 (31 portfolios)**;
MainStay MacKay DefinedTerm Municipal Opportunities Fund: Trustee since 2011; and MainStay CBRE Global Infrastructure Megatrends Fund: Trustee since June 2021 |
| ** | Includes prior service as a Director of MainStay VP Series Fund, Inc., the predecessor to MainStay VP Funds Trust. |
| *** | Includes prior service as a Director/Trustee of certain predecessor entities to MainStay Funds Trust. |
| 34 | MainStay Candriam Emerging Markets Equity Fund |
| | Name and
Year of Birth | Position(s) Held and
Length of Service | Principal Occupation(s)
During Past Five Years | |
| | | | | |
| | Kirk C. Lehneis
1974 | President, MainStay Funds, MainStay Funds Trust since 2017 | Chief Operating Officer and Senior Managing Director (since 2016), New York Life Investment Management LLC and New York Life Investment Management Holdings LLC; Member of the Board of Managers (since 2017) and Senior Managing Director (since 2018), NYLIFE Distributors LLC; Chairman of the Board and Senior Managing Director, NYLIM Service Company LLC (since 2017); Trustee, President and Principal Executive Officer of IndexIQ Trust, IndexIQ ETF Trust and IndexIQ Active ETF Trust (since January 2018); President, MainStay CBRE Global Infrastructure Megatrends Fund (since 2021), MainStay MacKay DefinedTerm Municipal Opportunities Fund and MainStay VP Funds Trust (since 2017); Senior Managing Director, Global Product Development (From 2015-2016); Managing Director, Product Development (2010 to 2015), New York Life Investment Management LLC | |
| | Jack R. Benintende
1964 | Treasurer and Principal Financial and Accounting Officer, MainStay Funds (since 2007), MainStay Funds Trust (since 2009) | Managing Director, New York Life Investment Management LLC (since 2007); Treasurer and Principal Financial and Accounting Officer, MainStay CBRE Global Infrastructure Megatrends Fund (since 2021), MainStay MacKay DefinedTerm Municipal Opportunities Fund (since 2011) and MainStay VP Funds Trust (since 2007)** and Assistant Treasurer, New York Life Investment Management Holdings LLC (2008 to 2012) | |
| | J. Kevin Gao
1967 | Secretary and Chief Legal Officer, MainStay Funds and MainStay Funds Trust (since 2010) | Managing Director and Associate General Counsel, New York Life Investment Management LLC (since 2010); Secretary and Chief Legal Officer and MainStay CBRE Global Infrastructure Megatrends Fund (since 2021), MainStay MacKay DefinedTerm Municipal Opportunities Fund (since 2011) and MainStay VP Funds Trust (since 2010)** | |
| | Scott T. Harrington
1959 | Vice President— Administration, MainStay Funds (since 2009), MainStay Funds Trust (since 2009) | Managing Director, New York Life Investment Management LLC (including predecessor advisory organizations) (since 2000); Member of the Board of Directors, New York Life Trust Company (since 2009); Vice President—Administration, MainStay CBRE Global Infrastructure Megatrends Fund (since 2021), MainStay MacKay DefinedTerm Municipal Opportunities Fund (since 2011) and MainStay VP Funds Trust (since 2005)** | |
| | Kevin M. Gleason
1967 | Vice President and Chief Compliance Officer, MainStay Funds and MainStay Funds Trust (since June 2022) | Vice President and Chief Compliance Officer, IndexIQ, IndexIQ ETF Trust and Index IQ Active ETF Trust (since June 2022); Vice President and Chief Compliance Officer, MainStay CBRE Global Infrastructure Megatrends Fund, MainStay VP Funds Trust and MainStay MacKay DefinedTerm Municipal Opportunities Fund (since June 2022); Senior Vice President, Voya Investment Management and Chief Compliance Officer, Voya Family of Funds (2012-2022) | |
| * | The officers listed above are considered to be “interested persons” of the MainStay Group of Funds, MainStay VP Funds Trust, MainStay CBRE Global Infrastructure Megatrends Fund and MainStay MacKay DefinedTerm Municipal Opportunities Fund within the meaning of the 1940 Act because of their affiliation with the MainStay Group of Funds, New York Life Insurance Company and/or its affiliates, including New York Life Investment Management LLC, NYLIM Service Company LLC, NYLIFE Securities LLC and/or NYLIFE Distributors LLC, as described in detail in the column captioned “Principal Occupation(s) During Past Five Years.” Officers are elected annually by the Board. |
| ** | Includes prior service as an Officer of MainStay VP Series Fund, Inc., the predecessor to MainStay VP Funds Trust. |
Officers of the Trust (Who are not Trustees)*
This page intentionally left blank.
This page intentionally left blank.
This page intentionally left blank.
Equity
U.S. Equity
MainStay Epoch U.S. Equity Yield Fund
MainStay S&P 500 Index Fund1
MainStay Winslow Large Cap Growth Fund
MainStay WMC Enduring Capital Fund
MainStay WMC Growth Fund
MainStay WMC Small Companies Fund
MainStay WMC Value Fund
International Equity
MainStay Epoch International Choice Fund
MainStay MacKay International Equity Fund
MainStay WMC International Research Equity Fund
Emerging Markets Equity
MainStay Candriam Emerging Markets Equity Fund
Global Equity
MainStay Epoch Capital Growth Fund
MainStay Epoch Global Equity Yield Fund
Fixed Income
Taxable Income
MainStay Candriam Emerging Markets Debt Fund
MainStay Floating Rate Fund
MainStay MacKay High Yield Corporate Bond Fund
MainStay MacKay Short Duration High Yield Fund
MainStay MacKay Strategic Bond Fund
MainStay MacKay Total Return Bond Fund
MainStay MacKay U.S. Infrastructure Bond Fund
MainStay Short Term Bond Fund
Tax-Exempt Income
MainStay MacKay California Tax Free Opportunities Fund2
MainStay MacKay High Yield Municipal Bond Fund
MainStay MacKay New York Tax Free Opportunities Fund3
MainStay MacKay Short Term Municipal Fund
MainStay MacKay Strategic Municipal Allocation Fund
MainStay MacKay Tax Free Bond Fund
Money Market
MainStay Money Market Fund
Mixed Asset
MainStay Balanced Fund
MainStay Income Builder Fund
MainStay MacKay Convertible Fund
Speciality
MainStay CBRE Global Infrastructure Fund
MainStay CBRE Real Estate Fund
MainStay Cushing MLP Premier Fund
Asset Allocation
MainStay Conservative Allocation Fund
MainStay Conservative ETF Allocation Fund
MainStay Defensive ETF Allocation Fund
MainStay Equity Allocation Fund
MainStay Equity ETF Allocation Fund
MainStay ESG Multi-Asset Allocation Fund
MainStay Growth Allocation Fund
MainStay Growth ETF Allocation Fund
MainStay Moderate Allocation Fund
MainStay Moderate ETF Allocation Fund
Manager
New York Life Investment Management LLC
New York, New York
Subadvisors
Candriam4
Strassen, Luxembourg
CBRE Investment Management Listed Real Assets LLC
Radnor, Pennsylvania
Cushing Asset Management, LP
Dallas, Texas
Epoch Investment Partners, Inc.
New York, New York
MacKay Shields LLC4
New York, New York
NYL Investors LLC4
New York, New York
Wellington Management Company LLP
Boston, Massachusetts
Winslow Capital Management, LLC
Minneapolis, Minnesota
Legal Counsel
Dechert LLP
Washington, District of Columbia
Independent Registered Public Accounting Firm
KPMG LLP
Philadelphia, Pennsylvania
Distributor
NYLIFE Distributors LLC4
Jersey City, New Jersey
Custodian
JPMorgan Chase Bank, N.A.
New York, New York
1.
Prior to February 28, 2022, the Fund's name was MainStay MacKay S&P 500 Index Fund.
| 2. | This Fund is registered for sale in AZ, CA, NV, OR, TX, UT, WA and MI (Class A and Class I shares only), and CO, FL, GA, HI, ID, MA, MD, NH, NJ and NY (Class I shares only). |
| 3. | This Fund is registered for sale in CA, CT, DE, FL, MA, NJ, NY and VT. |
| 4. | An affiliate of New York Life Investment Management LLC. |
Not part of the Annual Report
For more information
800-624-6782
newyorklifeinvestments.com
“New York Life Investments” is both a service mark, and the common trade name, of certain investment advisors affiliated with New York Life Insurance Company. The MainStay Funds® are managed by New York Life Investment Management LLC and distributed by NYLIFE Distributors LLC, 30 Hudson Street, Jersey City, NJ 07302, a wholly owned subsidiary of New York Life Insurance Company. NYLIFE Distributors LLC is a Member FINRA/SIPC.
©2022 NYLIFE Distributors LLC. All rights reserved.
| 5013883.2MS229-22 | MSCEME11-12/22 |
(NYLIM) NL440
MainStay Asset Allocation Funds
Message from the President and Annual Report
October 31, 2022
| MainStay Conservative Allocation Fund |
| MainStay Moderate Allocation Fund |
| MainStay Growth Allocation Fund |
| MainStay Equity Allocation Fund |
Sign up for e-delivery of your shareholder reports. For full details on e-delivery, including who can participate and what you can receive via e-delivery,
please log in to newyorklifeinvestments.com/accounts.
| Not FDIC/NCUA Insured | Not a Deposit | May Lose Value | No Bank Guarantee | Not Insured by Any Government Agency |
This page intentionally left blank
Message from the President
A series of economic and geopolitical challenges undermined equity and fixed-income markets during the 12-month reporting period ended October 31, 2022. Stocks and bonds alike trended lower in the face of sharply rising interest rates, increasing inflationary pressures, slowing economic growth and Russia’s invasion of Ukraine.
The reporting period began on a mixed note, with concerns about the spreading Omicron variant of the COVID-19 virus and increasingly hawkish statements from the U.S. Federal Reserve (the “Fed”) regarding mounting inflation, countered by bullish sentiment stemming from U.S. economic growth and strong corporate earnings. In January 2022, markets turned decisively negative as comments from the Fed raised the likelihood of rate hikes as early as March, and Russia issued increasingly aggressive threats toward Ukraine. The onset of Russia’s invasion in February exacerbated global inflationary pressures while increasing investor uncertainty. Domestic supply shortages, international trade imbalances and rising inflation caused GDP (gross domestic product) to contract in the first and second quarters of the year, although employment and consumer spending proved resilient. Prices for petroleum surged to multi-year highs, while many key agricultural chemicals and industrial metals climbed as well. Accelerating inflationary forces prompted the Fed to implement its most aggressive interest rate increases since the 1980s with a series of five sharp rate hikes, raising the federal funds rate from a range of 0.00% to 0.25% in March to 3.00% to 3.25% in September, with additional rate hikes expected before the end of the year. International central banks generally followed suit, raising rates by varying degrees in efforts to curb local inflation, although most increases remained significantly more modest than those in the United States. Relatively high U.S. interest rates and risk-averse international sentiment pushed U.S. dollar values higher compared to most other currencies, with the ensuing negative impact on global prices for food, fuel and other key, U.S.-dollar-denominated products.
The effects of these interrelated challenges were felt throughout U.S. and international financial markets. The S&P 500® Index, a widely regarded benchmark of U.S. market performance, declined by more than 14% during the reporting period. Although the energy sector generated strong gains, bolstered by elevated oil and gas prices, most other industry areas recorded losses. The more cyclical and growth-oriented sectors of consumer discretionary, real estate and information technology delivered the
weakest returns, while the traditionally defensive and value-oriented consumer staples, utilities and health care sectors outperformed. International stocks lagged compared to their U.S. counterparts, with some emerging markets, such as China, suffering particularly steep losses. A few markets, however, including Brazil, Mexico and the United Arab Emirates, ended the reporting period with little change. Fixed-income markets saw bond prices broadly decline as yields rose along with interest rates. Short-term yields rose faster than long-term yields, producing a yield curve inversion from July through the end of the reporting period, with long-term rates remaining below short-term rates. While floating-rate instruments, which feature variable interest rates that allow investors to benefit from a rising rate environment, provided a degree of insulation from inflation-driven trends, they were not immune to the market’s widespread declines.
While the Fed acknowledges the costs of rising rates in terms of weaker GDP growth and unsettled financial markets over the short term, its primary focus continues to be the longer-term economic impact of inflation. With the latest figures as of the date of this report showing that inflation remains above 8%, versus a target rate of just 2%, the Fed clearly has a distance yet to go, making further rate increases and market volatility more likely in the coming months. The question remains as to whether the Fed and other central banks will manage a so-called “soft landing,” curbing inflation while avoiding a persistent economic slowdown. If they prove successful, we expect that favorable inflation trends and increasingly attractive valuations in both equity and bond markets should eventually translate into sustainable improvements in the investment environment.
Whatever actions the Fed takes and however financial markets react, as a MainStay investor, you can depend on us to continue providing the insight, expertise and service that have long defined New York Life Investments. Thank you for trusting us to help you meet your investment needs.
Sincerely,
Kirk C. Lehneis
President
The opinions expressed are as of the date of this report and are subject to change. There is no guarantee that any forecast made will come to pass. This material does not constitute investment advice and is not intended as an endorsement of any specific investment. Past performance is no guarantee of future results.
Not part of the Annual Report
Investors should refer to each Fund’s Summary Prospectus and/or Prospectus and consider each Fund’s investment objectives, strategies, risks, charges and expenses carefully before investing. The Summary Prospectus and/or Prospectus contain this and other information about each Fund. You may obtain copies of each Fund’s Summary Prospectus, Prospectus and Statement of Additional Information, which includes information about the MainStay Funds Trust's Trustees, free of charge, upon request, by calling toll-free 800-624-6782, by writing to NYLIFE Distributors LLC, Attn: MainStay Marketing Department, 30 Hudson Street, Jersey City, NJ 07302 or by sending an e-mail to MainStayShareholderServices@nylim.com. These documents are also available via the MainStay Funds’ website at newyorklifeinvestments.com. Please read each Fund’s Summary Prospectus and/or Prospectus carefully before investing.
MainStay Conservative Allocation Fund
Investment and Performance Comparison (Unaudited)
Performance data quoted represents past performance. Past performance is no guarantee of future results. Because of market volatility and other factors, current performance may be lower or higher than the figures shown. Investment return and principal value will fluctuate, and as a result, when shares are redeemed, they may be worth more or less than their original cost. The graph below depicts the historical performance of Class I shares of the Fund. Performance will vary from class to class based on differences in class-specific expenses and sales charges. For performance information current to the most recent month-end, please call 800-624-6782 or visit newyorklifeinvestments.com.
The performance table and graph do not reflect the deduction of taxes that a shareholder would pay on distributions or Fund share redemptions. Total returns reflect maximum applicable sales charges as indicated in the table below, if any, changes in share price, and reinvestment of dividend and capital gain distributions. The graph assumes the initial investment amount shown below and reflects the deduction of all sales charges that would have applied for the period of investment. Performance figures may reflect certain fee waivers and/or expense limitations, without which total returns may have been lower. For more information on share classes and current fee waivers and/or expense limitations (if any), please refer to the Notes to Financial Statements.

| Average Annual Total Returns for the Year-Ended October 31, 2022 |
| Class | Sales Charge | | Inception
Date | One
Year | Five
Years | Ten Years
or Since
Inception | Gross
Expense
Ratio1 |
| Class A Shares2 | Maximum 3% Initial Sales Charge | With sales charges | 4/4/2005 | -16.63% | 0.79% | 3.45% | 0.90% |
| | | Excluding sales charges | | -14.05 | 1.94 | 4.04 | 0.90 |
| Investor Class Shares2, 3 | Maximum 2.5% Initial Sales Charge | With sales charges | 2/28/2008 | -16.37 | 0.63 | 3.29 | 1.17 |
| | | Excluding sales charges | | -14.22 | 1.77 | 3.87 | 1.17 |
| Class B Shares4 | Maximum 5% CDSC | With sales charges | 4/4/2005 | -18.83 | 0.68 | 3.10 | 1.92 |
| | if Redeemed Within the First Six Years of Purchase | Excluding sales charges | | -14.86 | 1.00 | 3.10 | 1.92 |
| Class C Shares | Maximum 1% CDSC | With sales charges | 4/4/2005 | -15.67 | 1.00 | 3.09 | 1.92 |
| | if Redeemed Within One Year of Purchase | Excluding sales charges | | -14.87 | 1.00 | 3.09 | 1.92 |
| Class I Shares | No Sales Charge | | 4/4/2005 | -13.82 | 2.22 | 4.30 | 0.65 |
| Class R2 Shares | No Sales Charge | | 6/14/2019 | -14.14 | N/A | 2.17 | 1.00 |
| Class R3 Shares | No Sales Charge | | 2/29/2016 | -14.34 | 1.59 | 3.77 | 1.25 |
| SIMPLE Class Shares | No Sales Charge | | 8/31/2020 | -14.45 | N/A | -2.04 | 1.42 |
| 1. | The gross expense ratios presented reflect the Fund’s “Total Annual Fund Operating Expenses” from the most recent Prospectus, as supplemented, and may differ from other expense ratios disclosed in this report. |
| 2. | Prior to July 22, 2019, the maximum initial sales charge was 5.5%, which is reflected in the applicable average annual total return figures shown. |
| 3. | Prior to June 30, 2020, the maximum initial sales charge was 3%, which is reflected in the applicable average annual total return figures shown. |
| 4. | Class B shares are closed to all new purchases as well as additional investments by existing Class B shareholders. |
The footnotes on the next page are an integral part of the table and graph and should be carefully read in conjunction with them.
| Benchmark Performance* | One
Year | Five
Years | Ten
Years |
| S&P 500® Index1 | -14.61% | 10.44% | 12.79% |
| MSCI EAFE® Index (Net)2 | -23.00 | -0.09 | 4.13 |
| Bloomberg U.S. Aggregate Bond Index3 | -15.68 | -0.54 | 0.74 |
| Conservative Allocation Composite Index4 | -15.83 | 3.05 | 4.84 |
| Morningstar Allocation-30% to 50% Equity Category Average5 | -14.82 | 1.90 | 3.35 |
| * | Returns for indices reflect no deductions for fees, expenses or taxes, except for foreign withholding taxes where applicable. Results assume reinvestment of all dividends and capital gains. An investment cannot be made directly in an index. |
| 1. | The S&P 500® Index is the Fund's primary benchmark. S&P 500® is a trademark of The McGraw-Hill Companies, Inc. The S&P 500® Index is widely regarded as the standard index for measuring large-cap U.S. stock market performance. |
| 2. | The MSCI EAFE® Index (Net) is the Fund's secondary benchmark. The MSCI EAFE® Index (Net) consists of international stocks representing the developed world outside of North America. |
| 3. | The Fund has selected the Bloomberg U.S. Aggregate Bond Index as an additional benchmark. The Bloomberg U.S. Aggregate Bond Index is a broad-based benchmark that measures the performance of the investment grade, U.S. dollar-denominated, fixed-rate taxable bond market, including Treasurys, government-related and corporate securities, mortgage-backed securities (agency fixed-rate and hybrid adjustable rate mortgage pass-throughs), asset-backed securities, and commercial mortgage-backed securities. |
| 4. | The Fund has selected the Conservative Allocation Composite Index as an additional benchmark. The Conservative Allocation Composite Index consists of the S&P 500® Index, the MSCI EAFE® Index (Net) and the Bloomberg U.S. Aggregate Bond Index weighted 30%, 10% and 60%, respectively. |
| 5. | The Morningstar Allocation – 30% to 50% Equity Category Average is representative of funds that seek to provide both income and capital appreciation by investing in multiple asset classes, including stocks, bonds, and cash. These portfolios are dominated by domestic holdings and have equity exposures between 30% to 50%. Results are based on average total returns of similar funds with all dividends and capital gain distributions reinvested. |
The footnotes on the preceding page are an integral part of the table and graph and should be carefully read in conjunction with them.
| 6 | MainStay Conservative Allocation Fund |
Cost in Dollars of a $1,000 Investment in MainStay Conservative Allocation Fund (Unaudited)
The example below is intended to describe the fees and expenses borne by shareholders during the six-month period from May 1, 2022 to October 31, 2022, and the impact of those costs on your investment.
Example
As a shareholder of the Fund you incur two types of costs: (1) transaction costs, including exchange fees and sales charges (loads) on purchases (as applicable), and (2) ongoing costs, including management fees, distribution and/or service (12b-1) fees and other Fund expenses (as applicable). This example is intended to help you understand your ongoing costs (in dollars) of investing in the Fund and to compare these costs with the ongoing costs of investing in other mutual funds. The example is based on an investment of $1,000 made at the beginning of the six-month period and held for the entire period from May 1, 2022 to October 31, 2022.
This example illustrates your Fund’s ongoing costs in two ways:
Actual Expenses
The second and third data columns in the table below provide information about actual account values and actual expenses. You may use the information in these columns, together with the amount you invested, to estimate the expenses that you paid during the six months ended October 31, 2022. Simply divide your account value by $1,000 (for example, an
$8,600 account value divided by $1,000 = 8.6), then multiply the result by the number under the heading entitled “Expenses Paid During Period” to estimate the expenses you paid on your account during this period.
Hypothetical Example for Comparison Purposes
The fourth and fifth data columns in the table below provide information about hypothetical account values and hypothetical expenses based on the Fund’s actual expense ratio and an assumed rate of return of 5% per year before expenses, which is not the Fund’s actual return. The hypothetical account values and expenses may not be used to estimate the actual ending account balances or expenses you paid for the six-month period shown. You may use this information to compare the ongoing costs of investing in the Fund with the ongoing costs of investing in other mutual funds. To do so, compare this 5% hypothetical example with the 5% hypothetical examples that appear in the shareholder reports of the other mutual funds.
Please note that the expenses shown in the table are meant to highlight your ongoing costs only and do not reflect any transactional costs, such as exchange fees or sales charges (loads). Therefore, the fourth and fifth data columns of the table are useful in comparing ongoing costs only and will not help you determine the relative total costs of owning different funds. In addition, if these transactional costs were included, your costs would have been higher.
| Share Class | Beginning
Account
Value
5/1/22 | Ending Account
Value (Based
on Actual
Returns and
Expenses)
10/31/22 | Expenses
Paid
During
Period1 | Ending Account
Value (Based
on Hypothetical
5% Annualized
Return and
Actual Expenses)
10/31/22 | Expenses
Paid
During
Period1 | Net Expense
Ratio
During
Period2 |
| Class A Shares | $1,000.00 | $942.30 | $1.71 | $1,023.44 | $1.79 | 0.35% |
| Investor Class Shares | $1,000.00 | $941.40 | $2.69 | $1,022.43 | $2.80 | 0.55% |
| Class B Shares | $1,000.00 | $938.90 | $6.35 | $1,018.65 | $6.61 | 1.30% |
| Class C Shares | $1,000.00 | $938.00 | $6.35 | $1,018.65 | $6.61 | 1.30% |
| Class I Shares | $1,000.00 | $944.20 | $0.49 | $1,024.70 | $0.51 | 0.10% |
| Class R2 Shares | $1,000.00 | $941.90 | $2.20 | $1,022.94 | $2.29 | 0.45% |
| Class R3 Shares | $1,000.00 | $941.30 | $3.43 | $1,021.68 | $3.57 | 0.70% |
| SIMPLE Class Shares | $1,000.00 | $940.30 | $3.91 | $1,021.17 | $4.08 | 0.80% |
| 1. | Expenses are equal to the Fund’s annualized expense ratio of each class multiplied by the average account value over the period, divided by 365 and multiplied by 184 (to reflect the six-month period). The table above represents the actual expenses incurred during the six-month period. In addition to the fees and expenses which the Fund bears directly, it also indirectly bears a pro rata share of the fees and expenses of the underlying funds in which it invests. Such indirect expenses are not included in the above-reported expense figures. |
| 2. | Expenses are equal to the Fund's annualized expense ratio to reflect the six-month period. |
Asset Diversification as of October 31, 2022 (Unaudited)
| Equity Funds | 36.8% |
| Fixed Income Funds | 52.1 |
| Short-Term Investment | 10.3 |
| Other Assets, Less Liabilities | 0.8 |
See Portfolio of Investments beginning on page 12 for specific holdings within these categories. The Fund’s holdings are subject to change.
| 8 | MainStay Conservative Allocation Fund |
Portfolio Management Discussion and Analysis (Unaudited)
Questions answered by portfolio managers Jae S. Yoon, CFA, Jonathan Swaney, Poul Kristensen, CFA, and Amit Soni, CFA, of New York Life Investment Management LLC, the Fund’s Manager.
How did MainStay Conservative Allocation Fund perform relative to its benchmarks and peer group during the 12 months ended October 31, 2022?
For the 12 months ended October 31, 2022, Class I shares of MainStay Conservative Allocation Fund returned −13.82%, outperforming the −14.61% return of the Fund’s primary benchmark, the S&P 500® Index (the "Index"), and the −23.00% return of the MSCI EAFE® Index (Net), which is the Fund’s secondary benchmark. Over the same period, Class I shares of the Fund outperformed the −15.68% return of the Bloomberg U.S. Aggregate Bond Index and the −15.83% return of the Conservative Allocation Composite Index, both of which are additional benchmarks of the Fund. For the 12 months ended October 31, 2022, Class I shares of the Fund outperformed the −14.82% return of the Morningstar Allocation -30% to 50% Equity Category Average.1
What factors affected the Fund’s relative performance during the reporting period?
The Fund is a “fund of funds,” meaning that it seeks to achieve its investment objective by investing primarily in mutual funds and exchange-traded funds (“ETFs”) managed by New York Life Investments or its affiliates (the “Underlying Funds”). The Underlying Funds may invest in U.S. equities, international equities and fixed-income instruments, making comparisons to any single index generally less suitable than a weighted combination of indices, which is a more useful yardstick by which to measure performance. The most influential factor affecting returns for the Fund during the reporting period (versus the performance of a weighted combination of indices) is the net performance of the Underlying Funds themselves, relative to their respective benchmarks. During the reporting period, asset class policy was the primary determinant of the Fund's relative performance.
Fund management internally maintains a blend of indices that are taken into consideration when managing the Fund. During the reporting period, the Fund outperformed this internally maintained blend of indices, primarily due to active positioning at the asset class level.
The Fund’s outperformance was driven by the following factors:
| • | Management of the stock/bond blend: The Fund’s management of its stock/bond blend proved generally successful, reflecting tactical adjustments made throughout the reporting period. With both investment-grade bonds and U.S. stocks posting declines in the mid-teens, there was little cost or benefit to being persistently overweight or underweight in equities, although adjusting that |
exposure over time (buying dips and selling rallies) added material value.
| • | Value created within asset classes: The equity portion of the Fund emphasized value over growth, with a specific focus on energy companies and defensive sectors that the market rewarded. Conditions also favored the Fund’s skew toward profitable small-cap companies. |
| • | Shorter duration:2 The fixed-income portion of the Fund shortened its average duration by holding cash and by emphasizing exposure to MainStay MacKay Short Duration High Yield Fund over MainStay MacKay High Yield Corporate Bond Fund; these moves lifted relative returns. |
Conversely, the underperformance of some of the Underlying Funds relative to their benchmarks detracted modestly from the Fund’s relative performance. The Fund’s largest Underlying Fund holding, MainStay MacKay Total Return Bond Fund, was also the largest individual detractor.
During the reporting period, how was the Fund’s performance materially affected by investments in derivatives?
Total return swaps were used to express most of the Fund’s asset class policy views. Therefore, the swaps can be seen as enhancing the Fund’s relative performance over the course of the reporting period.
How did you allocate the Fund’s assets during the reporting period and why?
Stock/bond blend: On average, the Fund held a moderately overweight exposure to equities during the reporting period, with the magnitude of that bias managed tactically in response to swings in pricing, as described above. We are generally reluctant to position the Fund with an underweight allocation to equities, as stocks have tended to perform well over time, and anticipating drawdowns is challenging. The opposite is less true; we are happy to increase the Fund’s allocation to equities when we believe they are well supported fundamentally or when a correction has run further than we believe appropriate. This approach paid off handsomely during the reporting period. Although stocks declined by double digits, the Fund generated roughly 0.5% of excess return3 through tactical adjustments to its degree of overweight exposure to equities.
Duration: Believing inflationary pressures to be partially structural in nature and likely to persist at elevated levels for the foreseeable future, we skewed the Fund’s fixed-income holdings to favor
| 1. | See page 5 for other share class returns, which may be higher or lower than Class I share returns. See page 6 for more information on benchmark and peer group returns. |
| 2. | Duration is a measure of the price sensitivity of a fixed-income investment to changes in interest rates. Duration is expressed as a number of years and is considered a more accurate sensitivity gauge than average maturity. |
| 3. | The expression “excess return” may refer to the return that a security or portfolio provides above (or below) an investment with the lowest perceived risk, such as comparable U.S. Treasury securities. The expression may also refer to the return that a security or portfolio provides above (or below) an index or other benchmark. |
shorter maturity instruments, less sensitive to rising bond yields, although we increased the Fund’s duration as yields rose. By the end of the reporting period, the average duration of the fixed-income portion of the Fund was only slightly shorter than that of the benchmark. The Fund’s duration policy contributed positively to performance. (Contributions take weightings and total returns into account.)
Equity style: In the same way that inflation is threatening to long-duration bonds, equities with values disproportionately reflected in more distant cash flows (i.e., growth stocks with high prices relative to current earnings) are likewise vulnerable. Accordingly, we tilted the Fund to emphasize value stocks that offered more attractive near-term cash flows, placing particular focus on more defensive sectors: real estate, utilities, consumer staples and (most of all) health care. The combined effect was a positive contribution to return of approximately 0.5%.
Equity size: Small-company stocks were more heavily owned in the Fund than in the Index. The thesis behind this positioning was based on attractive valuations, insulation from economic weakness abroad, less sensitivity to dollar strength and disproportionate exposure to domestic demand, which remained healthy. The Fund’s active position in small-cap companies contributed modestly to relative performance.
Geographic exposure: Prior to Russia’s invasion of Ukraine, the Fund’s geographic exposure reflected our positive expectations for non-U.S. developed markets generally, and Europe in particular, based on attractive valuations and the post-COVID-19 cyclical recovery we saw coming. Accordingly, we tilted the Fund in that direction. War, sanctions, soaring local energy prices and looming recession changed the underlying picture. We responded by unwinding the Fund’s position, eventually resetting international exposure to an underweight position, but not before relative performance was slightly diminished.
Gold miners: The Fund maintained a varying position in gold miners as an intended hedge against inflation and/or a monetary policy mistake. The position proved volatile, contributing positively to performance in the first half of the reporting period, only to give it all back in the second half, with little net impact on returns for the reporting period overall.
Energy: As with gold miners, the Fund maintained exposure to upstream energy producers as a commodity play to provide an additional intended inflation hedge. These holdings also positioned the Fund to take advantage of opportunities for domestic producers to benefit as Western nations revisit energy policy to source supplies from stable and friendly jurisdictions, rather than autocratic petrostates that present national security risks. While the Fund’s position was small, it had a disproportionately positive impact on performance as oil and gas prices soared.
How did the Fund’s allocations change over the course of the reporting period?
The Fund’s positioning is most often implemented through the use of derivatives, specifically total return swaps. The use of swaps to reduce exposure to non-U.S. developed markets during the reporting period, as discussed above, is a good example. Similarly, exposure to defensive sectors and energy producers was realized by swapping into the return stream on specific ETFs, including Invesco S&P Low Volatility ETF, SPDR S&P Oil & Gas Exploration ETF and VanEck Oil Services ETF. We also added duration to the Fund’s bond portfolio, after yields had already risen considerably, by entering into a swap in which the Fund received the return on iShares 20+ Year Treasury Bond ETF.
The largest adjustment made to actual Fund holdings involved a partial shift out of MainStay MacKay Total Return Bond Fund and into IQ MacKay ESG Core Plus Bond ETF. Both vehicles are managed by the same team and pursue largely identical strategies, although the latter introduces some additional criteria to the selection of individual issues. The Fund benefited from diversification across both products.
During the reporting period, which Underlying Equity Funds had the highest total returns and which had the lowest total returns?
Among Underlying Equity Funds, the top-performing investments involved swaps that had been in place for only part of the reporting period. Exposure to energy companies, the health care industry and low volatility stocks enjoyed the highest returns. Among Underlying Equity Funds held for the entire reporting period, the highest returns came from MainStay WMC Value Fund, MainStay Epoch U.S. Equity Yield Fund and IQ Chaikin U.S. Small Cap ETF. At the other end of the spectrum, performance proved notably weak for MainStay Candriam Emerging Markets Equity Fund, MainStay MacKay International Equity Fund and MainStay WMC Growth Fund.
Which Underlying Equity Funds were the strongest positive contributors to the Fund’s performance and which Underlying Equity Funds were particularly weak?
While none of the Underlying Equity Funds held for the entire reporting period contributed positively to the Fund’s performance, those producing the smallest negative contributions included MainStay Epoch U.S. Equity Yield Fund and MainStay WMC Value Fund. Extending the analysis to include investments accessed via derivatives, SPDR S&P Oil & Gas Exploration ETF, VanEck Oil Services ETF and S&P 500 Healthcare sector all produced positive contributions to return. The Underlying Equity Funds that detracted the most from performance were MainStay Winslow Large Cap Growth Fund, MainStay WMC Growth Fund and MainStay Candriam Emerging Markets Equity Fund.
| 10 | MainStay Conservative Allocation Fund |
During the reporting period, which Underlying Fixed-Income Funds had the highest total returns and which Underlying Fixed-Income Funds had the lowest total returns?
While none of the Underlying Fixed-Income Funds held for the entire reporting period generated positive returns, those producing the smallest losses included MainStay Floating Rate Fund and MainStay MacKay Short Duration High Yield Fund. The largest losses came from exposure through a swap to iShares 20+ Year Treasury Bond ETF, and to MainStay MacKay Total Return Bond Fund and IQ MacKay ESG Core Plus Bond ETF.
Which Underlying Fixed-Income Funds were the strongest positive contributors to the Fund’s performance and which Underlying Fixed-Income Funds were particularly weak?
With all Underlying Fixed-Income Funds experiencing losses during the reporting period, none contributed positively to performance. Those detracting the least were MainStay Short Term Bond Fund, which was held for only part of the reporting period, and MainStay Floating Rate Fund. The most significant detractors were MainStay MacKay Total Return Bond Fund and IQ MacKay ESG Core Plus Bond ETF.
How was the Fund positioned at the end of the reporting period?
As the market rallied in October 2022, we trimmed the Fund’s equity allocations, positioning the Fund very close to neutral as of October 31, 2022. We anticipate that the market will continue to move generally sideways within a very broad channel, presenting opportunities to trade tactically, adding to equity holdings during periods of weakness and trimming them again as prices recover.
The bias we expect to have the largest impact on active return is our preference for small- and mid-cap stocks. We believe that the large-cap space is potentially vulnerable to economic weakness abroad, a strong U.S. dollar, rich valuations and concentration in a relatively short list of very large companies (mega-cap technology). Smaller companies, in contrast, cater primarily to what we view as a financially healthy domestic clientele and have historically been more successful than larger companies in protecting real earnings amid high inflation.
Likewise, the Fund’s emphasis on value stocks over growth stocks remains intact, with a particular emphasis on what we perceive to be the defensive “RUSH” sectors: real estate, utilities, consumer staples and health care. The thesis rests primarily on the idea that inflation will prove persistent and jeopardize the high price multiples paid on fast-growing companies with current valuations that depend on distant earnings. We are also mindful of the
economy’s progression in the business cycle and the possibility that a recession may not be far away.
The Fund maintains a position in energy sector firms, as we envision sustained supply constraints keeping commodity prices elevated, thus preserving meaty profit margins for several years to come.
Within fixed income, we have lessened the Fund’s short-duration posture considerably as yields have climbed. As of October 31, 2022, the Fund’s duration is closer to the benchmark. We have also reduced the Fund’s exposure to credit as corporate fundamentals are gradually showing signs of deterioration.
The opinions expressed are those of the portfolio managers as of the date of this report and are subject to change. There is no guarantee that any forecasts will come to pass. This material does not constitute investment advice and is not intended as an endorsement of any specific investment.
Portfolio of Investments October 31, 2022†
| | Shares | Value |
| Affiliated Investment Companies 88.9% |
| Equity Funds 36.8% |
| IQ 500 International ETF | 267,696 | $ 6,936,003 |
| IQ Candriam ESG International Equity ETF | 306,707 | 6,872,200 |
| IQ Candriam ESG U.S. Large Cap Equity ETF | 416,371 | 13,661,132 |
| IQ Chaikin U.S. Large Cap ETF | 353,919 | 11,038,734 |
| IQ Chaikin U.S. Small Cap ETF | 255,279 | 8,332,307 |
| IQ FTSE International Equity Currency Neutral ETF | 404,537 | 8,250,047 |
| IQ Winslow Large Cap Growth ETF (a)(b) | 28,565 | 727,256 |
| MainStay Candriam Emerging Markets Equity Fund Class R6 (a) | 693,275 | 5,738,446 |
| MainStay Epoch Capital Growth Fund Class I | 139,044 | 1,458,413 |
| MainStay Epoch International Choice Fund Class I | 132,517 | 4,147,888 |
| MainStay Epoch U.S. Equity Yield Fund Class R6 (a) | 600,810 | 11,409,983 |
| MainStay MacKay International Equity Fund Class R6 | 284,646 | 3,984,905 |
| MainStay S&P 500 Index Fund Class I | 125,569 | 6,225,368 |
| MainStay Winslow Large Cap Growth Fund Class R6 | 1,347,851 | 12,631,253 |
| MainStay WMC Enduring Capital Fund Class R6 (a) | 349,547 | 10,569,440 |
| MainStay WMC Growth Fund Class R6 (a) | 427,178 | 13,336,678 |
| MainStay WMC International Research Equity Fund Class I | 684,202 | 4,070,178 |
| MainStay WMC Small Companies Fund Class I (a) | 384,542 | 8,623,129 |
| MainStay WMC Value Fund Class R6 | 364,349 | 11,001,892 |
Total Equity Funds
(Cost $140,198,909) | | 149,015,252 |
| | Shares | | Value |
| |
| Fixed Income Funds 52.1% |
| IQ MacKay ESG Core Plus Bond ETF (a) | 3,483,580 | | $ 70,570,364 |
| MainStay Floating Rate Fund Class R6 (a) | 3,531,899 | | 30,201,270 |
| MainStay MacKay High Yield Corporate Bond Fund Class R6 | 2,739,957 | | 13,337,835 |
| MainStay MacKay Short Duration High Yield Fund Class I | 1,869,372 | | 16,996,145 |
| MainStay MacKay Total Return Bond Fund Class R6 (a) | 9,267,315 | | 79,385,671 |
Total Fixed Income Funds
(Cost $239,642,966) | | | 210,491,285 |
Total Affiliated Investment Companies
(Cost $379,841,875) | | | 359,506,537 |
| Short-Term Investment 10.3% |
| Affiliated Investment Company 10.3% |
| MainStay U.S. Government Liquidity Fund, 2.905% (c) | 41,565,643 | | 41,565,643 |
Total Short-Term Investment
(Cost $41,565,643) | 10.3% | | 41,565,643 |
Total Investments
(Cost $421,407,518) | 99.2% | | 401,072,180 |
| Other Assets, Less Liabilities | 0.8 | | 3,199,856 |
| Net Assets | 100.0% | | $ 404,272,036 |
| † | Percentages indicated are based on Fund net assets. |
| (a) | As of October 31, 2022, the Fund's ownership exceeds 5% of the outstanding shares of the Underlying Fund's share class. |
| (b) | Non-income producing security. |
| (c) | Current yield as of October 31, 2022. |
The notes to the financial statements are an integral part of, and should be read in conjunction with, the financial statements.
| 12 | MainStay Conservative Allocation Fund |
Investments in Affiliates (in 000's)
Investments in issuers considered to be affiliate(s) of the Fund during the year ended October 31, 2022 for purposes of Section 2(a)(3) of the Investment Company Act of 1940, as amended, were as follows:
| Affiliated Investment Companies | Value,
Beginning
of Year | Purchases
at Cost | Proceeds
from
Sales | Net
Realized
Gain/(Loss)
on Sales | Change in
Unrealized
Appreciation/
(Depreciation) | Value,
End of
Year | Dividend
Income | Other
Distributions | Shares
End of
Year |
| IQ 500 International ETF | $ 8,948 | $ 1,149 | $ (1,372) | $ 58 | $ (1,847) | $ 6,936 | $ 308 | $ — | 268 |
| IQ Candriam ESG International Equity ETF | 8,695 | 1,287 | (879) | 60 | (2,291) | 6,872 | 248 | — | 307 |
| IQ Candriam ESG U.S. Large Cap Equity ETF | 18,855 | 1,355 | (3,511) | 582 | (3,620) | 13,661 | 203 | — | 416 |
| IQ Chaikin U.S. Large Cap ETF | 12,726 | 1,045 | (1,353) | (110) | (1,269) | 11,039 | 160 | — | 354 |
| IQ Chaikin U.S. Small Cap ETF | 8,996 | 1,431 | (1,350) | 358 | (1,103) | 8,332 | 99 | — | 255 |
| IQ FTSE International Equity Currency Neutral ETF | 10,170 | 947 | (1,051) | 33 | (1,849) | 8,250 | 294 | — | 405 |
| IQ MacKay ESG Core Plus Bond ETF | — | 81,001 | (2,668) | (286) | (7,477) | 70,570 | 924 | — | 3,484 |
| IQ Winslow Large Cap Growth ETF | — | 787 | — | — | (60) | 727 | — | — | 29 |
| MainStay Candriam Emerging Markets Equity Fund Class R6 | 7,538 | 1,231 | (151) | (25) | (2,854) | 5,739 | 68 | — | 693 |
| MainStay Epoch Capital Growth Fund Class I | 1,886 | 576 | (206) | (31) | (767) | 1,458 | 2 | 420 | 139 |
| MainStay Epoch International Choice Fund Class I | 5,144 | 859 | (591) | (17) | (1,247) | 4,148 | 131 | — | 133 |
| MainStay Epoch U.S. Equity Yield Fund Class R6 | 14,602 | 317 | (2,994) | 73 | (588) | 11,410 | 274 | — | 601 |
| MainStay Floating Rate Fund Class R6 | 38,149 | 2,101 | (7,776) | (310) | (1,963) | 30,201 | 1,405 | — | 3,532 |
| MainStay MacKay High Yield Corporate Bond Fund Class R6 | 20,305 | 12,113 | (16,224) | (2,274) | (582) | 13,338 | 1,105 | — | 2,740 |
| MainStay MacKay International Equity Fund Class R6 | 4,948 | 1,925 | (517) | (218) | (2,153) | 3,985 | 19 | 612 | 285 |
| MainStay MacKay Short Duration High Yield Fund Class I | 25,436 | 11,666 | (17,843) | (978) | (1,285) | 16,996 | 1,112 | — | 1,869 |
| MainStay MacKay Total Return Bond Fund Class R6 | 193,306 | 10,005 | (88,843) | (9,457) | (25,625) | 79,386 | 4,220 | 5,785 | 9,267 |
| MainStay S&P 500 Index Fund Class I (a) | 8,546 | 738 | (1,624) | 450 | (1,885) | 6,225 | 92 | 294 | 126 |
| MainStay Short Term Bond Fund Class I | 2,536 | 1 | (2,516) | (49) | 28 | — | 5 | 6 | — |
| MainStay U.S. Government Liquidity Fund | 45,132 | 149,682 | (153,248) | — | — | 41,566 | 340 | — | 41,566 |
| MainStay Winslow Large Cap Growth Fund Class R6 | 19,359 | 6,851 | (4,074) | (735) | (8,770) | 12,631 | — | 3,581 | 1,348 |
| MainStay WMC Enduring Capital Fund Class R6 | 12,610 | 1,897 | (1,563) | (218) | (2,156) | 10,570 | 42 | 1,033 | 350 |
| MainStay WMC Growth Fund Class R6 | 17,634 | 7,556 | (2,279) | (1,140) | (8,434) | 13,337 | — | 3,520 | 427 |
| MainStay WMC International Research Equity Fund Class I | 5,054 | 934 | (475) | (60) | (1,383) | 4,070 | 133 | — | 684 |
| MainStay WMC Small Companies Fund Class I | 8,471 | 3,966 | (768) | (286) | (2,760) | 8,623 | — | 1,946 | 385 |
| MainStay WMC Value Fund Class R6 | 13,224 | 6,324 | (2,335) | (131) | (6,080) | 11,002 | 124 | 5,850 | 364 |
| | $512,270 | $307,744 | $(316,211) | $(14,711) | $ (88,020) | $401,072 | $11,308 | $23,047 | |
| | |
| (a) | Prior to February 28, 2022, known as MainStay MacKay S&P 500 Index Fund Class I. |
Swap Contracts
Open OTC total return equity swap contracts as of October 31, 2022 were as follows1:
Swap
Counterparty | Reference Obligation | Floating Rate2 | Termination
Date(s) | Payment
Frequency
Paid/
Received | Notional
Amount
Long/
(Short)
(000)3 | Unrealized
Appreciation/
(Depreciation)4 |
| Citibank NA | Invesco S&P 500 Low Volatility ETF | 1 day FEDF plus 0.45% | 12/2/22 | Daily | 9,578 | $ — |
| Citibank NA | iShares 20+ Year Treasury Bond ETF | 1 day FEDF plus 0.35% | 12/2/22 | Daily | 3,646 | — |
| Citibank NA | iShares MSCI EAFE ETF | 1 day FEDF minus 1.25% | 12/2/22 | Daily | (12,201) | — |
| Citibank NA | iShares Semiconductor ETF | 1 day FEDF plus 0.35% | 12/2/22 | Daily | 1,848 | — |
| Citibank NA | Russell 1000 Growth Total Return Index | 1 day FEDF minus 0.20% | 12/2/22 | Daily | (5,828) | — |
| Citibank NA | Russell Midcap Total Return Index | 1 day FEDF plus 0.40% | 12/2/22 | Daily | 6,880 | — |
| Citibank NA | S&P 500 Health Care Sector | 1 day FEDF plus 0.45% | 12/2/22 | Daily | 7,959 | — |
| Citibank NA | S&P 500 Total Return Index | 1 day FEDF plus 0.12% | 12/2/22 | Daily | (18,910) | — |
| Citibank NA | S&P 600 Total Return | 1 day FEDF plus 0.40% | 12/2/22 | Daily | 24,754 | — |
The notes to the financial statements are an integral part of, and should be read in conjunction with, the financial statements.
13
Portfolio of Investments October 31, 2022† (continued)
Swap
Counterparty | Reference Obligation | Floating Rate2 | Termination
Date(s) | Payment
Frequency
Paid/
Received | Notional
Amount
Long/
(Short)
(000)3 | Unrealized
Appreciation/
(Depreciation)4 |
| Citibank NA | SPDR S&P Oil & Gas Exploration & Production ETF | 1 day FEDF plus 0.40% | 12/2/22 | Daily | 2,381 | $ — |
| Citibank NA | VanEck Gold Miners ETF | 1 day FEDF plus 0.55% | 12/2/22 | Daily | 3,677 | — |
| Citibank NA | VanEck Oil Services ETF | 1 day FEDF plus 0.40% | 12/2/22 | Daily | 2,908 | — |
| Citibank NA | Vanguard FTSE Europe ETF | 1 day FEDF minus 2.50% | 12/2/22 | Daily | (3,956) | — |
| | | | | | | $ — |
| 1. | As of October 31, 2022, cash in the amount $2,000,000 was pledged from brokers for OTC swap contracts. |
| 2. | Fund pays the floating rate and receives the total return of the reference entity. |
| 3. | Notional amounts reflected as a positive value indicate a long position held by the Fund or Index and a negative value indicates a short position. |
| 4. | Reflects the value at reset date as of October 31, 2022. |
| Abbreviation(s): |
| EAFE—Europe, Australasia and Far East |
| ETF—Exchange-Traded Fund |
| FEDF—Federal Funds Rate |
| FTSE—Financial Times Stock Exchange |
| MSCI—Morgan Stanley Capital International |
| SPDR—Standard & Poor’s Depositary Receipt |
The following is a summary of the fair valuations according to the inputs used as of October 31, 2022, for valuing the Fund’s assets:
| Description | Quoted
Prices in
Active
Markets for
Identical
Assets
(Level 1) | | Significant
Other
Observable
Inputs
(Level 2) | | Significant
Unobservable
Inputs
(Level 3) | | Total |
| Asset Valuation Inputs | | | | | | | |
| Investments in Securities (a) | | | | | | | |
| Affiliated Investment Companies | | | | | | | |
| Equity Funds | $ 149,015,252 | | $ — | | $ — | | $ 149,015,252 |
| Fixed Income Funds | 210,491,285 | | — | | — | | 210,491,285 |
| Total Affiliated Investment Companies | 359,506,537 | | — | | — | | 359,506,537 |
| Short-Term Investment | | | | | | | |
| Affiliated Investment Company | 41,565,643 | | — | | — | | 41,565,643 |
| Total Investments in Securities | $ 401,072,180 | | $ — | | $ — | | $ 401,072,180 |
| (a) | For a complete listing of investments, see the Portfolio of Investments. |
The notes to the financial statements are an integral part of, and should be read in conjunction with, the financial statements.
| 14 | MainStay Conservative Allocation Fund |
Statement of Assets and Liabilities as of October 31, 2022
| Assets |
Investment in affiliated investment companies, at value
(identified cost $421,407,518) | $401,072,180 |
| Cash | 60 |
| Cash collateral on deposit at broker for swap contracts | 2,000,000 |
| Receivables: | |
| Dividends and interest on OTC swaps contracts | 1,928,151 |
| Dividends and interest | 263,760 |
| Fund shares sold | 234,126 |
| Manager (See Note 3) | 3,309 |
| Other assets | 39,376 |
| Total assets | 405,540,962 |
| Liabilities |
| Payables: | |
| Fund shares redeemed | 851,864 |
| Investment securities purchased | 161,827 |
| NYLIFE Distributors (See Note 3) | 99,487 |
| Transfer agent (See Note 3) | 79,174 |
| Shareholder communication | 57,378 |
| Professional fees | 9,786 |
| Custodian | 4,443 |
| Trustees | 108 |
| Accrued expenses | 4,859 |
| Total liabilities | 1,268,926 |
| Net assets | $404,272,036 |
| Composition of Net Assets |
| Shares of beneficial interest outstanding (par value of $.001 per share) unlimited number of shares authorized | $ 37,667 |
| Additional paid-in-capital | 422,281,646 |
| | 422,319,313 |
| Total distributable earnings (loss) | (18,047,277) |
| Net assets | $404,272,036 |
| Class A | |
| Net assets applicable to outstanding shares | $336,710,663 |
| Shares of beneficial interest outstanding | 31,340,952 |
| Net asset value per share outstanding | $ 10.74 |
| Maximum sales charge (3.00% of offering price) | 0.33 |
| Maximum offering price per share outstanding | $ 11.07 |
| Investor Class | |
| Net assets applicable to outstanding shares | $ 33,624,654 |
| Shares of beneficial interest outstanding | 3,130,792 |
| Net asset value per share outstanding | $ 10.74 |
| Maximum sales charge (2.50% of offering price) | 0.28 |
| Maximum offering price per share outstanding | $ 11.02 |
| Class B | |
| Net assets applicable to outstanding shares | $ 5,786,942 |
| Shares of beneficial interest outstanding | 548,686 |
| Net asset value and offering price per share outstanding | $ 10.55 |
| Class C | |
| Net assets applicable to outstanding shares | $ 18,098,597 |
| Shares of beneficial interest outstanding | 1,716,464 |
| Net asset value and offering price per share outstanding | $ 10.54 |
| Class I | |
| Net assets applicable to outstanding shares | $ 6,412,375 |
| Shares of beneficial interest outstanding | 589,930 |
| Net asset value and offering price per share outstanding | $ 10.87 |
| Class R2 | |
| Net assets applicable to outstanding shares | $ 141,641 |
| Shares of beneficial interest outstanding | 13,188 |
| Net asset value and offering price per share outstanding | $ 10.74 |
| Class R3 | |
| Net assets applicable to outstanding shares | $ 2,195,848 |
| Shares of beneficial interest outstanding | 205,417 |
| Net asset value and offering price per share outstanding | $ 10.69 |
| SIMPLE Class | |
| Net assets applicable to outstanding shares | $ 1,301,316 |
| Shares of beneficial interest outstanding | 121,452 |
| Net asset value and offering price per share outstanding | $ 10.71 |
The notes to the financial statements are an integral part of, and should be read in conjunction with, the financial statements.
15
Statement of Operations for the year ended October 31, 2022
| Investment Income (Loss) |
| Income | |
| Dividend distributions from affiliated investment companies | $ 11,307,519 |
| Expenses | |
| Distribution/Service—Class A (See Note 3) | 956,208 |
| Distribution/Service—Investor Class (See Note 3) | 92,419 |
| Distribution/Service—Class B (See Note 3) | 82,627 |
| Distribution/Service—Class C (See Note 3) | 238,896 |
| Distribution/Service—Class R2 (See Note 3) | 349 |
| Distribution/Service—Class R3 (See Note 3) | 10,172 |
| Distribution/Service—SIMPLE Class (See Note 3) | 4,336 |
| Transfer agent (See Note 3) | 394,802 |
| Registration | 109,461 |
| Professional fees | 44,655 |
| Custodian | 26,945 |
| Shareholder communication | 16,697 |
| Trustees | 9,706 |
| Shareholder service (See Note 3) | 2,174 |
| Miscellaneous | 24,983 |
| Total expenses before waiver/reimbursement | 2,014,430 |
| Expense waiver/reimbursement from Manager (See Note 3) | (14,645) |
| Net expenses | 1,999,785 |
| Net investment income (loss) | 9,307,734 |
| Realized and Unrealized Gain (Loss) |
| Net realized gain (loss) on: | |
| Affiliated investment company transactions | (14,710,963) |
| Realized capital gain distributions from affiliated investment companies | 23,046,741 |
| Swap transactions | (483,425) |
| Net realized gain (loss) | 7,852,353 |
Net change in unrealized appreciation (depreciation) on:
Affiliated investments companies | (88,020,370) |
| Net realized and unrealized gain (loss) | (80,168,017) |
| Net increase (decrease) in net assets resulting from operations | $(70,860,283) |
The notes to the financial statements are an integral part of, and should be read in conjunction with, the financial statements.
| 16 | MainStay Conservative Allocation Fund |
Statements of Changes in Net Assets
for the years ended October 31, 2022 and October 31, 2021
| | 2022 | 2021 |
| Increase (Decrease) in Net Assets |
| Operations: | | |
| Net investment income (loss) | $ 9,307,734 | $ 7,796,752 |
| Net realized gain (loss) | 7,852,353 | 26,317,771 |
| Net change in unrealized appreciation (depreciation) | (88,020,370) | 35,512,215 |
| Net increase (decrease) in net assets resulting from operations | (70,860,283) | 69,626,738 |
| Distributions to shareholders: | | |
| Class A | (32,054,607) | (16,481,132) |
| Investor Class | (2,979,304) | (1,733,066) |
| Class B | (720,688) | (498,090) |
| Class C | (1,918,125) | (1,405,781) |
| Class I | (665,424) | (385,287) |
| Class R2 | (10,998) | (4,957) |
| Class R3 | (140,771) | (54,586) |
| SIMPLE Class | (41,601) | (3,866) |
| Total distributions to shareholders | (38,531,518) | (20,566,765) |
| Capital share transactions: | | |
| Net proceeds from sales of shares | 48,044,098 | 59,958,845 |
| Net asset value of shares issued to shareholders in reinvestment of distributions | 38,086,216 | 20,354,709 |
| Cost of shares redeemed | (85,734,187) | (72,335,582) |
| Increase (decrease) in net assets derived from capital share transactions | 396,127 | 7,977,972 |
| Net increase (decrease) in net assets | (108,995,674) | 57,037,945 |
| Net Assets |
| Beginning of year | 513,267,710 | 456,229,765 |
| End of year | $ 404,272,036 | $513,267,710 |
The notes to the financial statements are an integral part of, and should be read in conjunction with, the financial statements.
17
Financial Highlights selected per share data and ratios
| | Year Ended October 31, |
| Class A | 2022 | | 2021 | | 2020 | | 2019 | | 2018 |
| Net asset value at beginning of year | $ 13.53 | | $ 12.23 | | $ 11.96 | | $ 11.69 | | $ 12.51 |
| Net investment income (loss) (a) | 0.25 | | 0.22 | | 0.25 | | 0.24 | | 0.22 |
| Net realized and unrealized gain (loss) | (2.02) | | 1.64 | | 0.33 | | 0.69 | | (0.55) |
| Total from investment operations | (1.77) | | 1.86 | | 0.58 | | 0.93 | | (0.33) |
| Less distributions: | | | | | | | | | |
| From net investment income | (0.44) | | (0.19) | | (0.26) | | (0.28) | | (0.25) |
| From net realized gain on investments | (0.58) | | (0.37) | | (0.05) | | (0.38) | | (0.24) |
| Total distributions | (1.02) | | (0.56) | | (0.31) | | (0.66) | | (0.49) |
| Net asset value at end of year | $ 10.74 | | $ 13.53 | | $ 12.23 | | $ 11.96 | | $ 11.69 |
| Total investment return (b) | (14.05)% | | 15.51% | | 5.00% | | 8.54% | | (2.73)% |
| Ratios (to average net assets)/Supplemental Data: | | | | | | | | | |
| Net investment income (loss) | 2.09% | | 1.67% | | 2.10% | | 2.11% | | 1.77% |
| Net expenses (c) | 0.35% | | 0.37% | | 0.37% | | 0.38% | | 0.36% |
| Portfolio turnover rate | 38% | | 25% | | 70% | | 46% | | 59% |
| Net assets at end of year (in 000’s) | $ 336,711 | | $ 419,554 | | $ 355,167 | | $ 334,242 | | $ 299,016 |
| (a) | Per share data based on average shares outstanding during the year. |
| (b) | Total investment return is calculated exclusive of sales charges and assumes the reinvestment of dividends and distributions. For periods of less than one year, total return is not annualized. |
| (c) | In addition to the fees and expenses which the Fund bears directly, it also indirectly bears a pro-rata share of the fees and expenses of the underlying funds in which it invests. Such indirect expenses are not included in the above expense ratios. |
| | Year Ended October 31, |
| Investor Class | 2022 | | 2021 | | 2020 | | 2019 | | 2018 |
| Net asset value at beginning of year | $ 13.53 | | $ 12.23 | | $ 11.97 | | $ 11.69 | | $ 12.51 |
| Net investment income (loss) (a) | 0.22 | | 0.20 | | 0.23 | | 0.22 | | 0.20 |
| Net realized and unrealized gain (loss) | (2.01) | | 1.64 | | 0.33 | | 0.70 | | (0.54) |
| Total from investment operations | (1.79) | | 1.84 | | 0.56 | | 0.92 | | (0.34) |
| Less distributions: | | | | | | | | | |
| From net investment income | (0.42) | | (0.17) | | (0.25) | | (0.26) | | (0.24) |
| From net realized gain on investments | (0.58) | | (0.37) | | (0.05) | | (0.38) | | (0.24) |
| Total distributions | (1.00) | | (0.54) | | (0.30) | | (0.64) | | (0.48) |
| Net asset value at end of year | $ 10.74 | | $ 13.53 | | $ 12.23 | | $ 11.97 | | $ 11.69 |
| Total investment return (b) | (14.22)% | | 15.33% | | 4.80% | | 8.43% | | (2.88)% |
| Ratios (to average net assets)/Supplemental Data: | | | | | | | | | |
| Net investment income (loss) | 1.90% | | 1.49% | | 1.93% | | 1.92% | | 1.60% |
| Net expenses (c) | 0.55% | | 0.55% | | 0.55% | | 0.55% | | 0.51% |
| Expenses (before waiver/reimbursement) (c) | 0.57% | | 0.64% | | 0.61% | | 0.59% | | 0.54% |
| Portfolio turnover rate | 38% | | 25% | | 70% | | 46% | | 59% |
| Net assets at end of year (in 000's) | $ 33,625 | | $ 41,154 | | $ 41,762 | | $ 44,934 | | $ 37,828 |
| (a) | Per share data based on average shares outstanding during the year. |
| (b) | Total investment return is calculated exclusive of sales charges and assumes the reinvestment of dividends and distributions. For periods of less than one year, total return is not annualized. |
| (c) | In addition to the fees and expenses which the Fund bears directly, it also indirectly bears a pro-rata share of the fees and expenses of the underlying funds in which it invests. Such indirect expenses are not included in the above expense ratios. |
The notes to the financial statements are an integral part of, and should be read in conjunction with, the financial statements.
| 18 | MainStay Conservative Allocation Fund |
Financial Highlights selected per share data and ratios
| | Year Ended October 31, |
| Class B | 2022 | | 2021 | | 2020 | | 2019 | | 2018 |
| Net asset value at beginning of year | $ 13.30 | | $ 12.07 | | $ 11.84 | | $ 11.64 | | $ 12.46 |
| Net investment income (loss) (a) | 0.13 | | 0.09 | | 0.15 | | 0.14 | | 0.11 |
| Net realized and unrealized gain (loss) | (1.97) | | 1.63 | | 0.31 | | 0.69 | | (0.55) |
| Total from investment operations | (1.84) | | 1.72 | | 0.46 | | 0.83 | | (0.44) |
| Less distributions: | | | | | | | | | |
| From net investment income | (0.33) | | (0.12) | | (0.18) | | (0.25) | | (0.14) |
| From net realized gain on investments | (0.58) | | (0.37) | | (0.05) | | (0.38) | | (0.24) |
| Total distributions | (0.91) | | (0.49) | | (0.23) | | (0.63) | | (0.38) |
| Net asset value at end of year | $ 10.55 | | $ 13.30 | | $ 12.07 | | $ 11.84 | | $ 11.64 |
| Total investment return (b) | (14.86)% | | 14.49% | | 3.99% | | 7.61% | | (3.63)% |
| Ratios (to average net assets)/Supplemental Data: | | | | | | | | | |
| Net investment income (loss) | 1.13% | | 0.72% | | 1.23% | | 1.22% | | 0.89% |
| Net expenses (c) | 1.30% | | 1.30% | | 1.30% | | 1.30% | | 1.26% |
| Expenses (before waiver/reimbursement) (c) | 1.32% | | 1.39% | | 1.36% | | 1.34% | | 1.29% |
| Portfolio turnover rate | 38% | | 25% | | 70% | | 46% | | 59% |
| Net assets at end of year (in 000’s) | $ 5,787 | | $ 11,550 | | $ 13,236 | | $ 17,273 | | $ 21,988 |
| (a) | Per share data based on average shares outstanding during the year. |
| (b) | Total investment return is calculated exclusive of sales charges and assumes the reinvestment of dividends and distributions. For periods of less than one year, total return is not annualized. |
| (c) | In addition to the fees and expenses which the Fund bears directly, it also indirectly bears a pro-rata share of the fees and expenses of the underlying funds in which it invests. Such indirect expenses are not included in the above expense ratios. |
| | Year Ended October 31, |
| Class C | 2022 | | 2021 | | 2020 | | 2019 | | 2018 |
| Net asset value at beginning of year | $ 13.29 | | $ 12.07 | | $ 11.84 | | $ 11.64 | | $ 12.45 |
| Net investment income (loss) (a) | 0.13 | | 0.09 | | 0.14 | | 0.14 | | 0.11 |
| Net realized and unrealized gain (loss) | (1.97) | | 1.62 | | 0.32 | | 0.69 | | (0.54) |
| Total from investment operations | (1.84) | | 1.71 | | 0.46 | | 0.83 | | (0.43) |
| Less distributions: | | | | | | | | | |
| From net investment income | (0.33) | | (0.12) | | (0.18) | | (0.25) | | (0.14) |
| From net realized gain on investments | (0.58) | | (0.37) | | (0.05) | | (0.38) | | (0.24) |
| Total distributions | (0.91) | | (0.49) | | (0.23) | | (0.63) | | (0.38) |
| Net asset value at end of year | $ 10.54 | | $ 13.29 | | $ 12.07 | | $ 11.84 | | $ 11.64 |
| Total investment return (b) | (14.87)% | | 14.41% | | 3.99% | | 7.61% | | (3.56)% |
| Ratios (to average net assets)/Supplemental Data: | | | | | | | | | |
| Net investment income (loss) | 1.13% | | 0.73% | | 1.21% | | 1.24% | | 0.89% |
| Net expenses (c) | 1.30% | | 1.30% | | 1.30% | | 1.30% | | 1.26% |
| Expenses (before waiver/reimbursement) (c) | 1.32% | | 1.39% | | 1.36% | | 1.34% | | 1.29% |
| Portfolio turnover rate | 38% | | 25% | | 70% | | 46% | | 59% |
| Net assets at end of year (in 000’s) | $ 18,099 | | $ 29,825 | | $ 36,802 | | $ 44,222 | | $ 57,482 |
| (a) | Per share data based on average shares outstanding during the year. |
| (b) | Total investment return is calculated exclusive of sales charges and assumes the reinvestment of dividends and distributions. For periods of less than one year, total return is not annualized. |
| (c) | In addition to the fees and expenses which the Fund bears directly, it also indirectly bears a pro-rata share of the fees and expenses of the underlying funds in which it invests. Such indirect expenses are not included in the above expense ratios. |
The notes to the financial statements are an integral part of, and should be read in conjunction with, the financial statements.
19
Financial Highlights selected per share data and ratios
| | Year Ended October 31, |
| Class I | 2022 | | 2021 | | 2020 | | 2019 | | 2018 |
| Net asset value at beginning of year | $ 13.68 | | $ 12.36 | | $ 12.08 | | $ 11.80 | | $ 12.61 |
| Net investment income (loss) (a) | 0.28 | | 0.25 | | 0.29 | | 0.28 | | 0.26 |
| Net realized and unrealized gain (loss) | (2.04) | | 1.66 | | 0.33 | | 0.69 | | (0.54) |
| Total from investment operations | (1.76) | | 1.91 | | 0.62 | | 0.97 | | (0.28) |
| Less distributions: | | | | | | | | | |
| From net investment income | (0.47) | | (0.22) | | (0.29) | | (0.31) | | (0.29) |
| From net realized gain on investments | (0.58) | | (0.37) | | (0.05) | | (0.38) | | (0.24) |
| Total distributions | (1.05) | | (0.59) | | (0.34) | | (0.69) | | (0.53) |
| Net asset value at end of year | $ 10.87 | | $ 13.68 | | $ 12.36 | | $ 12.08 | | $ 11.80 |
| Total investment return (b) | (13.82)% | | 15.79% | | 5.30% | | 8.91% | | (2.38)%(c) |
| Ratios (to average net assets)/Supplemental Data: | | | | | | | | | |
| Net investment income (loss) | 2.33% | | 1.91% | | 2.40% | | 2.38% | | 2.12% |
| Net expenses (d) | 0.10% | | 0.12% | | 0.12% | | 0.13% | | 0.11% |
| Portfolio turnover rate | 38% | | 25% | | 70% | | 46% | | 59% |
| Net assets at end of year (in 000’s) | $ 6,412 | | $ 8,909 | | $ 7,878 | | $ 9,272 | | $ 8,036 |
| (a) | Per share data based on average shares outstanding during the year. |
| (b) | Total investment return is calculated exclusive of sales charges and assumes the reinvestment of dividends and distributions. Class I shares are not subject to sales charges. For periods of less than one year, total return is not annualized. |
| (c) | Total investment return may reflect adjustments to conform to generally accepted accounting principles. |
| (d) | In addition to the fees and expenses which the Fund bears directly, it also indirectly bears a pro-rata share of the fees and expenses of the underlying funds in which it invests. Such indirect expenses are not included in the above expense ratios. |
| | Year Ended October 31, | | June 14, 2019^ through
October 31,
2019 |
| Class R2 | 2022 | | 2021 | | 2020 | |
| Net asset value at beginning of period | $ 13.53 | | $ 12.23 | | $ 11.96 | | $ 11.61 |
| Net investment income (loss) (a) | 0.24 | | 0.21 | | 0.24 | | 0.08 |
| Net realized and unrealized gain (loss) | (2.02) | | 1.64 | | 0.34 | | 0.32 |
| Total from investment operations | (1.78) | | 1.85 | | 0.58 | | 0.40 |
| Less distributions: | | | | | | | |
| From net investment income | (0.43) | | (0.18) | | (0.26) | | (0.05) |
| From net realized gain on investments | (0.58) | | (0.37) | | (0.05) | | — |
| Total distributions | (1.01) | | (0.55) | | (0.31) | | (0.05) |
| Net asset value at end of period | $ 10.74 | | $ 13.53 | | $ 12.23 | | $ 11.96 |
| Total investment return (b) | (14.14)% | | 15.40% | | 4.93% | | 3.44% |
| Ratios (to average net assets)/Supplemental Data: | | | | | | | |
| Net investment income (loss) | 2.01% | | 1.56% | | 2.00% | | 1.83%†† |
| Net expenses (c) | 0.45% | | 0.47% | | 0.47% | | 0.49%†† |
| Portfolio turnover rate | 38% | | 25% | | 70% | | 46% |
| Net assets at end of period (in 000’s) | $ 142 | | $ 141 | | $ 109 | | $ 100 |
| ^ | Inception date. |
| †† | Annualized. |
| (a) | Per share data based on average shares outstanding during the period. |
| (b) | Total investment return is calculated exclusive of sales charges and assumes the reinvestment of dividends and distributions. Class R2 shares are not subject to sales charges. For periods of less than one year, total return is not annualized. |
| (c) | In addition to the fees and expenses which the Fund bears directly, it also indirectly bears a pro-rata share of the fees and expenses of the underlying funds in which it invests. Such indirect expenses are not included in the above expense ratios. |
The notes to the financial statements are an integral part of, and should be read in conjunction with, the financial statements.
| 20 | MainStay Conservative Allocation Fund |
Financial Highlights selected per share data and ratios
| | Year Ended October 31, |
| Class R3 | 2022 | | 2021 | | 2020 | | 2019 | | 2018 |
| Net asset value at beginning of year | $ 13.47 | | $ 12.19 | | $ 11.94 | | $ 11.67 | | $ 12.50 |
| Net investment income (loss) (a) | 0.21 | | 0.17 | | 0.20 | | 0.19 | | 0.15 |
| Net realized and unrealized gain (loss) | (2.01) | | 1.64 | | 0.34 | | 0.70 | | (0.52) |
| Total from investment operations | (1.80) | | 1.81 | | 0.54 | | 0.89 | | (0.37) |
| Less distributions: | | | | | | | | | |
| From net investment income | (0.40) | | (0.16) | | (0.24) | | (0.24) | | (0.22) |
| From net realized gain on investments | (0.58) | | (0.37) | | (0.05) | | (0.38) | | (0.24) |
| Total distributions | (0.98) | | (0.53) | | (0.29) | | (0.62) | | (0.46) |
| Net asset value at end of year | $ 10.69 | | $ 13.47 | | $ 12.19 | | $ 11.94 | | $ 11.67 |
| Total investment return (b) | (14.34)% | | 15.12% | | 4.59% | | 8.20% | | (3.06)% |
| Ratios (to average net assets)/Supplemental Data: | | | | | | | | | |
| Net investment income (loss) | 1.80% | | 1.32% | | 1.66% | | 1.68% | | 1.25% |
| Net expenses (c) | 0.70% | | 0.72% | | 0.73% | | 0.73% | | 0.71% |
| Portfolio turnover rate | 38% | | 25% | | 70% | | 46% | | 59% |
| Net assets at end of year (in 000’s) | $ 2,196 | | $ 1,831 | | $ 1,249 | | $ 739 | | $ 442 |
| (a) | Per share data based on average shares outstanding during the year. |
| (b) | Total investment return is calculated exclusive of sales charges and assumes the reinvestment of dividends and distributions. Class R3 shares are not subject to sales charges. For periods of less than one year, total return is not annualized. |
| (c) | In addition to the fees and expenses which the Fund bears directly, it also indirectly bears a pro-rata share of the fees and expenses of the underlying funds in which it invests. Such indirect expenses are not included in the above expense ratios. |
| | Year Ended October 31, | | August 31, 2020^ through
October 31, |
| SIMPLE Class | 2022 | | 2021 | | 2020 |
| Net asset value at beginning of period | $ 13.50 | | $ 12.23 | | $ 12.58* |
| Net investment income (loss) (a) | 0.20 | | 0.17 | | 0.03 |
| Net realized and unrealized gain (loss) | (2.02) | | 1.63 | | (0.38) |
| Total from investment operations | (1.82) | | 1.80 | | (0.35) |
| Less distributions: | | | | | |
| From net investment income | (0.39) | | (0.16) | | — |
| From net realized gain on investments | (0.58) | | (0.37) | | — |
| Total distributions | (0.97) | | (0.53) | | — |
| Net asset value at end of period | $ 10.71 | | $ 13.50 | | $ 12.23 |
| Total investment return (b) | (14.45)% | | 14.98% | | (2.78)% |
| Ratios (to average net assets)/Supplemental Data: | | | | | |
| Net investment income (loss) | 1.74% | | 1.27% | | 1.25%†† |
| Net expenses (c) | 0.80% | | 0.80% | | 0.80%†† |
| Expenses (before waiver/reimbursement) (c) | 0.80% | | 0.89% | | 0.88%†† |
| Portfolio turnover rate | 38% | | 25% | | 70% |
| Net assets at end of period (in 000’s) | $ 1,301 | | $ 304 | | $ 27 |
| ^ | Inception date. |
| * | Based on the net asset value of Investor Class as of August 31, 2020. |
| †† | Annualized. |
| (a) | Per share data based on average shares outstanding during the period. |
| (b) | Total investment return is calculated exclusive of sales charges and assumes the reinvestment of dividends and distributions. SIMPLE Class shares are not subject to sales charges. For periods of less than one year, total return is not annualized. |
| (c) | In addition to the fees and expenses which the Fund bears directly, it also indirectly bears a pro-rata share of the fees and expenses of the underlying funds in which it invests. Such indirect expenses are not included in the above expense ratios. |
The notes to the financial statements are an integral part of, and should be read in conjunction with, the financial statements.
21
MainStay Moderate Allocation Fund
Investment and Performance Comparison (Unaudited)
Performance data quoted represents past performance. Past performance is no guarantee of future results. Because of market volatility and other factors, current performance may be lower or higher than the figures shown. Investment return and principal value will fluctuate, and as a result, when shares are redeemed, they may be worth more or less than their original cost. The graph below depicts the historical performance of Class I shares of the Fund. Performance will vary from class to class based on differences in class-specific expenses and sales charges. For performance information current to the most recent month-end, please call 800-624-6782 or visit newyorklifeinvestments.com.
The performance table and graph do not reflect the deduction of taxes that a shareholder would pay on distributions or Fund share redemptions. Total returns reflect maximum applicable sales charges as indicated in the table below, if any, changes in share price, and reinvestment of dividend and capital gain distributions. The graph assumes the initial investment amount shown below and reflects the deduction of all sales charges that would have applied for the period of investment. Performance figures may reflect certain fee waivers and/or expense limitations, without which total returns may have been lower. For more information on share classes and current fee waivers and/or expense limitations (if any), please refer to the Notes to Financial Statements.

| Average Annual Total Returns for the Year-Ended October 31, 2022 |
| Class | Sales Charge | | Inception
Date | One
Year | Five
Years | Ten Years
or Since
Inception | Gross
Expense
Ratio1 |
| Class A Shares2 | Maximum 3% Initial Sales Charge | With sales charges | 4/4/2005 | -17.52% | 1.98% | 5.13% | 0.88% |
| | | Excluding sales charges | | -14.97 | 3.14 | 5.72 | 0.88 |
| Investor Class Shares2, 3 | Maximum 2.5% Initial Sales Charge | With sales charges | 2/28/2008 | -17.20 | 1.79 | 4.94 | 1.20 |
| | | Excluding sales charges | | -15.08 | 2.95 | 5.54 | 1.20 |
| Class B Shares4 | Maximum 5% CDSC | With sales charges | 4/4/2005 | -19.65 | 1.85 | 4.74 | 1.95 |
| | if Redeemed Within the First Six Years of Purchase | Excluding sales charges | | -15.77 | 2.17 | 4.74 | 1.95 |
| Class C Shares | Maximum 1% CDSC | With sales charges | 4/4/2005 | -16.54 | 2.17 | 4.74 | 1.95 |
| | if Redeemed Within One Year of Purchase | Excluding sales charges | | -15.76 | 2.17 | 4.74 | 1.95 |
| Class I Shares | No Sales Charge | | 4/4/2005 | -14.76 | 3.37 | 5.98 | 0.63 |
| Class R2 Shares | No Sales Charge | | 6/14/2019 | -15.01 | N/A | 3.93 | 0.98 |
| Class R3 Shares | No Sales Charge | | 2/29/2016 | -15.27 | 2.78 | 5.51 | 1.23 |
| SIMPLE Class Shares | No Sales Charge | | 8/31/2020 | -15.33 | N/A | -0.06 | 1.45 |
| 1. | The gross expense ratios presented reflect the Fund’s “Total Annual Fund Operating Expenses” from the most recent Prospectus, as supplemented, and may differ from other expense ratios disclosed in this report. |
| 2. | Prior to July 22, 2019, the maximum initial sales charge was 5.5%, which is reflected in the applicable average annual total return figures shown. |
| 3. | Prior to June 30, 2020, the maximum initial sales charge was 3%, which is reflected in the applicable average annual total return figures shown. |
| 4. | Class B shares are closed to all new purchases as well as additional investments by existing Class B shareholders. |
The footnotes on the next page are an integral part of the table and graph and should be carefully read in conjunction with them.
| 22 | MainStay Moderate Allocation Fund |
| Benchmark Performance* | One
Year | Five
Years | Ten
Years |
| S&P 500® Index1 | -14.61% | 10.44% | 12.79% |
| MSCI EAFE® Index (Net)2 | -23.00 | -0.09 | 4.13 |
| Bloomberg U.S. Aggregate Bond Index3 | -15.68 | -0.54 | 0.74 |
| Moderate Allocation Composite Index4 | -16.04 | 4.72 | 6.82 |
| Morningstar Allocation-50% to 70% Equity Category Average5 | -14.40 | 4.25 | 6.01 |
| * | Returns for indices reflect no deductions for fees, expenses or taxes, except for foreign withholding taxes where applicable. Results assume reinvestment of all dividends and capital gains. An investment cannot be made directly in an index. |
| 1. | The S&P 500® Index is the Fund's primary benchmark. S&P 500® is a trademark of The McGraw-Hill Companies, Inc. The S&P 500® Index is widely regarded as the standard index for measuring large-cap U.S. stock market performance. |
| 2. | The MSCI EAFE® Index (Net) is the Fund's secondary benchmark. The MSCI EAFE® Index (Net) consists of international stocks representing the developed world outside of North America. |
| 3. | The Fund has selected the Bloomberg U.S. Aggregate Bond Index as an additional benchmark. The Bloomberg U.S. Aggregate Bond Index is a broad-based benchmark that measures the performance of the investment grade, U.S. dollar-denominated, fixed-rate taxable bond market, including Treasurys, government-related and corporate securities, mortgage-backed securities (agency fixed-rate and hybrid adjustable rate mortgage pass-throughs), asset-backed securities, and commercial mortgage-backed securities. |
| 4. | The Fund has selected the Moderate Allocation Composite Index as an additional benchmark. The Moderate Allocation Composite Index consists of the S&P 500® Index, the MSCI EAFE® Index (Net) and the Bloomberg U.S. Aggregate Bond Index weighted 45%, 15% and 40%, respectively. |
| 5. | The Morningstar Allocation – 50% to 70% Equity Category Average is representative of funds that seek to provide both income and capital appreciation by investing in multiple asset classes, including stocks, bonds, and cash. These portfolios are dominated by domestic holdings and have equity exposures between 50% and 70%. Results are based on average total returns of similar funds with all dividends and capital gain distributions reinvested. |
The footnotes on the preceding page are an integral part of the table and graph and should be carefully read in conjunction with them.
Cost in Dollars of a $1,000 Investment in MainStay Moderate Allocation Fund (Unaudited)
The example below is intended to describe the fees and expenses borne by shareholders during the six-month period from May 1, 2022 to October 31, 2022, and the impact of those costs on your investment.
Example
As a shareholder of the Fund you incur two types of costs: (1) transaction costs, including exchange fees and sales charges (loads) on purchases (as applicable), and (2) ongoing costs, including management fees, distribution and/or service (12b-1) fees and other Fund expenses (as applicable). This example is intended to help you understand your ongoing costs (in dollars) of investing in the Fund and to compare these costs with the ongoing costs of investing in other mutual funds. The example is based on an investment of $1,000 made at the beginning of the six-month period and held for the entire period from May 1, 2022 to October 31, 2022.
This example illustrates your Fund’s ongoing costs in two ways:
Actual Expenses
The second and third data columns in the table below provide information about actual account values and actual expenses. You may use the information in these columns, together with the amount you invested, to estimate the expenses that you paid during the six months ended October 31, 2022. Simply divide your account value by $1,000 (for example, an
$8,600 account value divided by $1,000 = 8.6), then multiply the result by the number under the heading entitled “Expenses Paid During Period” to estimate the expenses you paid on your account during this period.
Hypothetical Example for Comparison Purposes
The fourth and fifth data columns in the table below provide information about hypothetical account values and hypothetical expenses based on the Fund’s actual expense ratio and an assumed rate of return of 5% per year before expenses, which is not the Fund’s actual return. The hypothetical account values and expenses may not be used to estimate the actual ending account balances or expenses you paid for the six-month period shown. You may use this information to compare the ongoing costs of investing in the Fund with the ongoing costs of investing in other mutual funds. To do so, compare this 5% hypothetical example with the 5% hypothetical examples that appear in the shareholder reports of the other mutual funds.
Please note that the expenses shown in the table are meant to highlight your ongoing costs only and do not reflect any transactional costs, such as exchange fees or sales charges (loads). Therefore, the fourth and fifth data columns of the table are useful in comparing ongoing costs only and will not help you determine the relative total costs of owning different funds. In addition, if these transactional costs were included, your costs would have been higher.
| Share Class | Beginning
Account
Value
5/1/22 | Ending Account
Value (Based
on Actual
Returns and
Expenses)
10/31/22 | Expenses
Paid
During
Period1 | Ending Account
Value (Based
on Hypothetical
5% Annualized
Return and
Actual Expenses)
10/31/22 | Expenses
Paid
During
Period1 | Net Expense
Ratio
During
Period2 |
| Class A Shares | $1,000.00 | $941.80 | $1.71 | $1,023.44 | $1.79 | 0.35% |
| Investor Class Shares | $1,000.00 | $941.20 | $2.69 | $1,022.43 | $2.80 | 0.55% |
| Class B Shares | $1,000.00 | $937.30 | $6.35 | $1,018.65 | $6.61 | 1.30% |
| Class C Shares | $1,000.00 | $937.30 | $6.35 | $1,018.65 | $6.61 | 1.30% |
| Class I Shares | $1,000.00 | $942.30 | $0.49 | $1,024.70 | $0.51 | 0.10% |
| Class R2 Shares | $1,000.00 | $941.00 | $2.20 | $1,022.94 | $2.29 | 0.45% |
| Class R3 Shares | $1,000.00 | $940.10 | $3.42 | $1,021.68 | $3.57 | 0.70% |
| SIMPLE Class Shares | $1,000.00 | $939.60 | $3.91 | $1,021.17 | $4.08 | 0.80% |
| 1. | Expenses are equal to the Fund’s annualized expense ratio of each class multiplied by the average account value over the period, divided by 365 and multiplied by 184 (to reflect the six-month period). The table above represents the actual expenses incurred during the six-month period. In addition to the fees and expenses which the Fund bears directly, it also indirectly bears a pro rata share of the fees and expenses of the underlying funds in which it invests. Such indirect expenses are not included in the above-reported expense figures. |
| 2. | Expenses are equal to the Fund's annualized expense ratio to reflect the six-month period. |
| 24 | MainStay Moderate Allocation Fund |
Asset Diversification as of October 31, 2022 (Unaudited)
| Equity Funds | 56.5% |
| Fixed Income Funds | 31.9 |
| Short-Term Investment | 10.6 |
| Other Assets, Less Liabilities | 1.0 |
See Portfolio of Investments beginning on page 29 for specific holdings within these categories. The Fund’s holdings are subject to change.
Portfolio Management Discussion and Analysis (Unaudited)
Questions answered by portfolio managers Jae S. Yoon, CFA, Jonathan Swaney, Poul Kristensen, CFA, and Amit Soni, CFA, of New York Life Investment Management LLC, the Fund’s Manager.
How did MainStay Moderate Allocation Fund perform relative to its benchmarks and peer group during the 12 months ended October 31, 2022?
For the 12 months ended October 31, 2022, Class I shares of MainStay Moderate Allocation Fund returned −14.76%, underperforming the −14.61% return of the Fund’s primary benchmark, the S&P 500® Index (the "Index"), and outperforming the −23.00% return of the MSCI EAFE® Index (Net), which is the Fund’s secondary benchmark. Over the same period, Class I shares of the Fund outperformed the −15.68% return of the Bloomberg U.S. Aggregate Bond Index, and the −16.04% return of the Moderate Allocation Composite Index, both of which are additional benchmarks of the Fund. For the 12 months ended October 31, 2022, Class I shares of the Fund underperformed the −14.40% return of the Morningstar Allocation -50% to 70% Equity Category Average.1
What factors affected the Fund’s relative performance during the reporting period?
The Fund is a “fund of funds,” meaning that it seeks to achieve its investment objective by investing primarily in mutual funds and exchange-traded funds (“ETFs”) managed by New York Life Investments or its affiliates (the “Underlying Funds”). The Underlying Funds may invest in U.S. equities, international equities and fixed-income instruments, making comparisons to any single index generally less suitable than a weighted combination of indices, which is a more useful yardstick by which to measure performance. The most influential factor affecting returns for the Fund during the reporting period (versus the performance of a weighted combination of indices) is the net performance of the Underlying Funds themselves, relative to their respective benchmarks. During the reporting period, asset class policy was the primary determinant of the Fund's relative performance.
Fund management internally maintains a blend of indices that are taken into consideration when managing the Fund. During the reporting period, the Fund outperformed this internally maintained blend of indices, primarily due to active positioning at the asset class level.
The Fund’s outperformance was driven by the following factors:
| • | Management of the stock/bond blend: The Fund’s management of its stock/bond blend proved generally successful, reflecting tactical adjustments made throughout the reporting period. With both investment-grade bonds and U.S. stocks posting declines in the mid-teens, there was little cost or benefit to being persistently overweight or underweight in equities, although adjusting that |
exposure over time (buying dips and selling rallies) added material value.
| • | Value created within asset classes: The equity portion of the Fund emphasized value over growth, with a specific focus on energy companies and defensive sectors that the market rewarded. Conditions also favored the Fund’s skew toward profitable small-cap companies. |
| • | Shorter duration:2 The fixed-income portion of the Fund shortened its average duration by holding cash and by emphasizing exposure to MainStay MacKay Short Duration High Yield Fund over MainStay MacKay High Yield Corporate Bond Fund; these moves lifted relative returns. |
Conversely, the underperformance of some of the Underlying Funds relative to their benchmarks detracted modestly from the Fund’s relative performance. The Fund’s largest Underlying Fund holding, MainStay MacKay Total Return Bond Fund, was also the largest individual detractor.
During the reporting period, how was the Fund’s performance materially affected by investments in derivatives?
Total return swaps were used to express most of the Fund’s asset class policy views. Therefore, the swaps can be seen as enhancing the Fund’s relative performance over the course of the reporting period.
How did you allocate the Fund’s assets during the reporting period and why?
Stock/bond blend: On average, the Fund held a moderately overweight exposure to equities during the reporting period, with the magnitude of that bias managed tactically in response to swings in pricing, as described above. We are generally reluctant to position the Fund with an underweight allocation to equities, as stocks have tended to perform well over time, and anticipating drawdowns is challenging. The opposite is less true; we are happy to increase the Fund’s allocation to equities when we believe they are well supported fundamentally or when a correction has run further than we believe appropriate. This approach paid off handsomely during the reporting period. Although stocks declined by double digits, the Fund generated roughly 0.5% of excess return3 through tactical adjustments to its degree of overweight exposure to equities.
Duration: Believing inflationary pressures to be partially structural in nature and likely to persist at elevated levels for the foreseeable future, we skewed the Fund’s fixed-income holdings to favor
| 1. | See page 22 for other share class returns, which may be higher or lower than Class I share returns. See page 23 for more information on benchmark and peer group returns. |
| 2. | Duration is a measure of the price sensitivity of a fixed-income investment to changes in interest rates. Duration is expressed as a number of years and is considered a more accurate sensitivity gauge than average maturity. |
| 3. | The expression “excess return” may refer to the return that a security or portfolio provides above (or below) an investment with the lowest perceived risk, such as comparable U.S. Treasury securities. The expression may also refer to the return that a security or portfolio provides above (or below) an index or other benchmark. |
| 26 | MainStay Moderate Allocation Fund |
shorter maturity instruments less sensitive to rising bond yields, although we increased the Fund’s duration as yields rose. By the end of the reporting period, the average duration of the fixed-income portion of the Fund was only slightly shorter than that of the benchmark. The Fund’s duration policy contributed positively to performance. (Contributions take weightings and total returns into account.)
Equity style: In the same way that inflation is threatening to long-duration bonds, equities with values disproportionately reflected in more distant cash flows (i.e., growth stocks with high prices relative to current earnings) are likewise vulnerable. Accordingly, we tilted the Fund to emphasize value stocks that offered more attractive near-term cash flows, placing particular focus on more defensive sectors: real estate, utilities, consumer staples and (most of all) health care. The combined effect was a positive contribution to return of approximately 0.5%.
Equity size: Small-company stocks were more heavily owned in the Fund than in the Index. The thesis behind this positioning was based on attractive valuations, insulation from economic weakness abroad, less sensitivity to dollar strength and disproportionate exposure to domestic demand, which remained healthy. The Fund’s active position in small-cap companies contributed modestly to relative performance.
Geographic exposure: Prior to Russia’s invasion of Ukraine, the Fund’s geographic exposure reflected our positive expectations for non-U.S. developed markets generally, and Europe in particular, based on attractive valuations and the post-COVID-19 cyclical recovery we saw coming. Accordingly, we tilted the Fund in that direction. War, sanctions, soaring local energy prices and looming recession changed the underlying picture. We responded by unwinding the Fund’s position, eventually resetting international exposure to an underweight position, but not before relative performance was slightly diminished.
Gold miners: The Fund maintained a varying position in gold miners as an intended hedge against inflation and/or a monetary policy mistake. The position proved volatile, contributing positively to performance in the first half of the reporting period, only to give it all back in the second half, with little net impact on returns for the reporting period overall.
Energy: As with gold miners, the Fund maintained exposure to upstream energy producers as a commodity play to provide an additional intended inflation hedge. These holdings also positioned the Fund to take advantage of opportunities for domestic producers to benefit as Western nations revisit energy policy to source supplies from stable and friendly jurisdictions, rather than autocratic petrostates that present national security risks. While the Fund’s position was small, it had a disproportionately positive impact on performance as oil and gas prices soared.
How did the Fund’s allocations change over the course of the reporting period?
The Fund’s positioning is most often implemented through the use of derivatives, specifically total return swaps. The use of swaps to reduce exposure to non-U.S. developed markets during the reporting period, as discussed above, is a good example. Similarly, exposure to defensive sectors and energy producers was realized by swapping into the return stream on specific ETFs, including Invesco S&P Low Volatility ETF, SPDR S&P Oil & Gas Exploration ETF and VanEck Oil Services ETF. We also added duration to the Fund’s bond portfolio, after yields had already risen considerably, by entering into a swap in which the Fund received the return on iShares 20+ Year Treasury Bond ETF.
The largest adjustment made to actual Fund holdings involved a partial shift out of MainStay MacKay Total Return Bond Fund and into IQ MacKay ESG Core Plus Bond ETF. Both vehicles are managed by the same team and pursue largely identical strategies, although the latter introduces some additional criteria to the selection of individual issues. The Fund benefited from diversification across both products.
During the reporting period, which Underlying Equity Funds had the highest total returns and which had the lowest total returns?
Among Underlying Equity Funds, the top-performing investments involved swaps that had been in place for only part of the reporting period. Exposure to energy companies, the health care industry and low volatility stocks enjoyed the highest returns. Among the Underlying Equity Funds held for the entire reporting period, the highest returns came from MainStay WMC Value Fund, MainStay Epoch U.S. Equity Yield Fund and IQ Chaikin U.S. Small Cap ETF. At the other end of the spectrum, performance proved notably weak for MainStay Candriam Emerging Markets Equity Fund, MainStay MacKay International Equity Fund and MainStay WMC Growth Fund.
Which Underlying Equity Funds were the strongest positive contributors to the Fund’s performance and which Underlying Equity Funds were particularly weak?
While none of the Underlying Equity Funds held for the entire reporting period contributed positively to the Fund’s performance, those producing the smallest negative contributions included MainStay Epoch U.S. Equity Yield Fund, MainStay Epoch Capital Growth Fund and MainStay WMC Value Fund. Extending the analysis to include investments accessed via derivatives, SPDR S&P Oil & Gas Exploration ETF, VanEck Oil Services ETF and S&P 500 Healthcare sector all produced positive contributions to return. The Underlying Equity Funds that detracted the most from the Fund’s performance were MainStay Winslow Large Cap Growth Fund, MainStay WMC Growth Fund and MainStay Candriam Emerging Markets Equity Fund.
During the reporting period, which Underlying Fixed-Income Funds had the highest total returns and which Underlying Fixed-Income Funds had the lowest total returns?
While none of the Underlying Fixed-Income Funds held for the entire reporting period generated positive returns, those producing the smallest losses included MainStay Floating Rate Fund and MainStay MacKay Short Duration High Yield Fund. The largest losses came from exposure through a swap to iShares 20+ Year Treasury Bond ETF, and to MainStay MacKay Total Return Bond Fund and IQ MacKay ESG Core Plus Bond ETF.
Which Underlying Fixed-Income Funds were the strongest positive contributors to the Fund’s performance and which Underlying Fixed-Income Funds were particularly weak?
With all Underlying Fixed-Income Funds experiencing losses during the reporting period, none contributed positively to performance. Those detracting the least were MainStay Short Term Bond Fund, which was held for only part of the reporting period, and MainStay Floating Rate Fund. The most significant detractors were MainStay Total Return Bond Fund and IQ MacKay ESG Core Plus Bond ETF.
How was the Fund positioned at the end of the reporting period?
As the market rallied in October 2022, we trimmed the Fund’s equity allocation, positioning the Fund very close to neutral as of October 31, 2022. We anticipate that the market will continue to move generally sideways within a very broad channel, presenting opportunities to trade tactically, adding to equity holdings during periods of weakness and trimming them again as prices recover.
The bias we expect to have the largest impact on active return is our preference for small- and mid-cap stocks. We believe that the large-cap space is potentially vulnerable to economic weakness abroad, a strong U.S. dollar, rich valuations and concentration in a relatively short list of very large companies (mega-cap technology). Smaller companies, in contrast, cater primarily to what we view as a financially healthy domestic clientele and have historically been more successful than larger companies in protecting real earnings amid high inflation.
Likewise, the Fund’s emphasis on value stocks over growth stocks remains intact, with a particular emphasis on what we perceive to be the defensive “RUSH” sectors: real estate, utilities, consumer staples and health care. The thesis rests primarily on the idea that inflation will prove persistent and jeopardize the high price multiples paid on fast-growing companies with current valuations that depend on distant earnings. We are also mindful of the
economy’s progression in the business cycle and the possibility that a recession may not be far away.
The Fund maintains a position in energy sector firms, as we envision sustained supply constraints keeping commodity prices elevated, thus preserving meaty profit margins for several years to come.
Within fixed income, we have lessened the Fund’s short-duration posture considerably as yields have climbed. As of October 31, 2022, the Fund’s duration is closer to the benchmark. We have also reduced the Fund’s exposure to credit as corporate fundamentals are gradually showing signs of deterioration.
The opinions expressed are those of the portfolio managers as of the date of this report and are subject to change. There is no guarantee that any forecasts will come to pass. This material does not constitute investment advice and is not intended as an endorsement of any specific investment.
| 28 | MainStay Moderate Allocation Fund |
Portfolio of Investments October 31, 2022†
| | Shares | Value |
| Affiliated Investment Companies 88.4% |
| Equity Funds 56.5% |
| IQ 500 International ETF (a) | 712,441 | $ 18,459,346 |
| IQ Candriam ESG International Equity ETF (a) | 816,264 | 18,289,538 |
| IQ Candriam ESG U.S. Large Cap Equity ETF (a) | 1,244,531 | 40,833,062 |
| IQ Chaikin U.S. Large Cap ETF (a) | 1,078,423 | 33,636,013 |
| IQ Chaikin U.S. Small Cap ETF (a) | 593,252 | 19,363,745 |
| IQ FTSE International Equity Currency Neutral ETF (a) | 727,213 | 14,830,637 |
| IQ Winslow Large Cap Growth ETF (a)(b) | 80,438 | 2,047,927 |
| MainStay Candriam Emerging Markets Equity Fund Class R6 (a) | 2,077,288 | 17,194,337 |
| MainStay Epoch Capital Growth Fund Class I (a) | 249,763 | 2,619,741 |
| MainStay Epoch International Choice Fund Class I (a) | 429,196 | 13,434,129 |
| MainStay Epoch U.S. Equity Yield Fund Class R6 (a) | 1,838,248 | 34,910,174 |
| MainStay MacKay International Equity Fund Class R6 (a) | 922,032 | 12,907,989 |
| MainStay S&P 500 Index Fund Class I | 225,681 | 11,188,694 |
| MainStay Winslow Large Cap Growth Fund Class R6 | 4,010,298 | 37,582,105 |
| MainStay WMC Enduring Capital Fund Class R6 (a) | 1,057,305 | 31,970,259 |
| MainStay WMC Growth Fund Class R6 (a) | 1,272,784 | 39,736,826 |
| MainStay WMC International Research Equity Fund Class I (a) | 2,215,630 | 13,180,339 |
| MainStay WMC Small Companies Fund Class I (a) | 918,078 | 20,587,355 |
| MainStay WMC Value Fund Class R6 (a) | 1,106,558 | 33,413,640 |
Total Equity Funds
(Cost $396,396,644) | | 416,185,856 |
| | Shares | | Value |
| |
| Fixed Income Funds 31.9% |
| IQ MacKay ESG Core Plus Bond ETF (a) | 4,023,967 | | $ 81,517,523 |
| MainStay Floating Rate Fund Class R6 (a) | 4,220,732 | | 36,091,479 |
| MainStay MacKay High Yield Corporate Bond Fund Class R6 | 3,432,166 | | 16,707,441 |
| MainStay MacKay Short Duration High Yield Fund Class I | 2,159,879 | | 19,637,405 |
| MainStay MacKay Total Return Bond Fund Class R6 (a) | 9,519,034 | | 81,541,948 |
Total Fixed Income Funds
(Cost $265,686,578) | | | 235,495,796 |
Total Affiliated Investment Companies
(Cost $662,083,222) | | | 651,681,652 |
| Short-Term Investment 10.6% |
| Affiliated Investment Company 10.6% |
| MainStay U.S. Government Liquidity Fund, 2.905% (a)(c) | 78,208,346 | | 78,208,346 |
Total Short-Term Investment
(Cost $78,208,346) | 10.6% | | 78,208,346 |
Total Investments
(Cost $740,291,568) | 99.0% | | 729,889,998 |
| Other Assets, Less Liabilities | 1.0 | | 7,472,893 |
| Net Assets | 100.0% | | $ 737,362,891 |
| † | Percentages indicated are based on Fund net assets. |
| (a) | As of October 31, 2022, the Fund's ownership exceeds 5% of the outstanding shares of the Underlying Fund's share class. |
| (b) | Non-income producing security. |
| (c) | Current yield as of October 31, 2022. |
The notes to the financial statements are an integral part of, and should be read in conjunction with, the financial statements.
29
Portfolio of Investments October 31, 2022† (continued)
Investments in Affiliates (in 000's)
Investments in issuers considered to be affiliate(s) of the Fund during the year ended October 31, 2022 for purposes of Section 2(a)(3) of the Investment Company Act of 1940, as amended, were as follows:
| Affiliated Investment Companies | Value,
Beginning
of Year | Purchases
at Cost | Proceeds
from
Sales | Net
Realized
Gain/(Loss)
on Sales | Change in
Unrealized
Appreciation/
(Depreciation) | Value,
End of
Year | Dividend
Income | Other
Distributions | Shares
End of
Year |
| IQ 500 International ETF | $ 23,168 | $ 2,959 | $ (2,963) | $ 55 | $ (4,760) | $ 18,459 | $ 806 | $ — | 712 |
| IQ Candriam ESG International Equity ETF | 22,592 | 3,245 | (1,678) | (127) | (5,742) | 18,290 | 646 | — | 816 |
| IQ Candriam ESG U.S. Large Cap Equity ETF | 56,419 | 3,929 | (10,459) | 370 | (9,426) | 40,833 | 598 | — | 1,245 |
| IQ Chaikin U.S. Large Cap ETF | 36,057 | 4,833 | (3,030) | (353) | (3,871) | 33,636 | 478 | — | 1,078 |
| IQ Chaikin U.S. Small Cap ETF | 25,705 | 4,657 | (9,349) | 2,707 | (4,356) | 19,364 | 224 | — | 593 |
| IQ FTSE International Equity Currency Neutral ETF | 17,601 | 1,781 | (1,324) | (14) | (3,213) | 14,831 | 517 | — | 727 |
| IQ MacKay ESG Core Plus Bond ETF | — | 93,789 | (3,971) | (425) | (7,875) | 81,518 | 967 | — | 4,024 |
| IQ Winslow Large Cap Growth ETF | — | 2,216 | — | — | (168) | 2,048 | — | — | 80 |
| MainStay Candriam Emerging Markets Equity Fund Class R6 | 21,671 | 4,363 | (336) | (60) | (8,444) | 17,194 | 194 | — | 2,077 |
| MainStay Epoch Capital Growth Fund Class I | 3,284 | 1,026 | (288) | (48) | (1,354) | 2,620 | 3 | 732 | 250 |
| MainStay Epoch International Choice Fund Class I | 15,971 | 2,808 | (1,320) | (119) | (3,906) | 13,434 | 408 | — | 429 |
| MainStay Epoch U.S. Equity Yield Fund Class R6 | 37,443 | 3,006 | (3,845) | (46) | (1,648) | 34,910 | 788 | — | 1,838 |
| MainStay Floating Rate Fund Class R6 | 44,123 | 2,757 | (8,081) | (367) | (2,340) | 36,092 | 1,653 | — | 4,221 |
| MainStay MacKay High Yield Corporate Bond Fund Class R6 | 35,227 | 14,514 | (28,346) | (3,943) | (745) | 16,707 | 1,728 | — | 3,432 |
| MainStay MacKay International Equity Fund Class R6 | 15,438 | 6,200 | (1,206) | (512) | (7,012) | 12,908 | 59 | 1,909 | 922 |
| MainStay MacKay Short Duration High Yield Fund Class I | 22,064 | 19,377 | (19,285) | (1,034) | (1,485) | 19,637 | 1,198 | — | 2,160 |
| MainStay MacKay Total Return Bond Fund Class R6 | 202,770 | 12,091 | (97,858) | (10,206) | (25,255) | 81,542 | 4,253 | 6,068 | 9,519 |
| MainStay S&P 500 Index Fund Class I (a) | 21,605 | 1,605 | (9,321) | 3,266 | (5,966) | 11,189 | 234 | 744 | 226 |
| MainStay Short Term Bond Fund Class I | 4,399 | 4 | (4,365) | (86) | 48 | — | 8 | 11 | — |
| MainStay U.S. Government Liquidity Fund | 77,521 | 199,413 | (198,726) | — | — | 78,208 | 628 | — | 78,208 |
| MainStay Winslow Large Cap Growth Fund Class R6 | 52,905 | 18,864 | (7,017) | (2,163) | (25,007) | 37,582 | — | 9,785 | 4,010 |
| MainStay WMC Enduring Capital Fund Class R6 | 36,462 | 6,448 | (3,953) | (249) | (6,738) | 31,970 | 121 | 2,987 | 1,057 |
| MainStay WMC Growth Fund Class R6 | 43,355 | 27,335 | (4,769) | (3,123) | (23,061) | 39,737 | — | 8,655 | 1,273 |
| MainStay WMC International Research Equity Fund Class I | 15,814 | 2,891 | (931) | (129) | (4,465) | 13,180 | 417 | — | 2,216 |
| MainStay WMC Small Companies Fund Class I | 24,633 | 9,953 | (5,729) | (84) | (8,186) | 20,587 | — | 5,657 | 918 |
| MainStay WMC Value Fund Class R6 | 35,940 | 18,962 | (4,414) | (723) | (16,351) | 33,414 | 337 | 15,899 | 1,107 |
| | $ 892,167 | $469,026 | $(432,564) | $(17,413) | $(181,326) | $ 729,890 | $16,265 | $52,447 | |
| | |
| (a) | Prior to February 28, 2022, known as MainStay MacKay S&P 500 Index Fund Class I. |
Swap Contracts
Open OTC total return equity swap contracts as of October 31, 2022 were as follows1:
Swap
Counterparty | Reference Obligation | Floating Rate2 | Termination
Date(s) | Payment
Frequency
Paid/
Received | Notional
Amount
Long/
(Short)
(000)3 | Unrealized
Appreciation/
(Depreciation)4 |
| Citibank NA | Invesco S&P 500 Low Volatility ETF | 1 day FEDF plus 0.45% | 12/2/22 | Daily | 17,214 | $ — |
| Citibank NA | iShares 20+ Year Treasury Bond ETF | 1 day FEDF plus 0.35% | 12/2/22 | Daily | 6,437 | — |
| Citibank NA | iShares MSCI EAFE ETF | 1 day FEDF minus 1.25% | 12/2/22 | Daily | (21,863) | — |
| Citibank NA | iShares Semiconductor ETF | 1 day FEDF plus 0.35% | 12/2/22 | Daily | 3,252 | — |
| Citibank NA | Russell 1000 Growth Total Return Index | 1 day FEDF minus 0.20% | 12/2/22 | Daily | (10,408) | — |
| Citibank NA | Russell Midcap Total Return Index | 1 day FEDF plus 0.40% | 12/2/22 | Daily | 13,914 | — |
| Citibank NA | S&P 500 Health Care Sector | 1 day FEDF plus 0.45% | 12/2/22 | Daily | 14,203 | — |
| Citibank NA | S&P 500 Total Return Index | 1 day FEDF plus 0.12% | 12/2/22 | Daily | (29,972) | — |
| Citibank NA | S&P 600 Total Return | 1 day FEDF plus 0.40% | 12/2/22 | Daily | 39,604 | — |
The notes to the financial statements are an integral part of, and should be read in conjunction with, the financial statements.
| 30 | MainStay Moderate Allocation Fund |
Swap
Counterparty | Reference Obligation | Floating Rate2 | Termination
Date(s) | Payment
Frequency
Paid/
Received | Notional
Amount
Long/
(Short)
(000)3 | Unrealized
Appreciation/
(Depreciation)4 |
| Citibank NA | SPDR S&P Oil & Gas Exploration & Production ETF | 1 day FEDF plus 0.40% | 12/2/22 | Daily | 4,273 | $ — |
| Citibank NA | VanEck Gold Miners ETF | 1 day FEDF plus 0.55% | 12/2/22 | Daily | 6,376 | — |
| Citibank NA | VanEck Oil Services ETF | 1 day FEDF plus 0.40% | 12/2/22 | Daily | 5,219 | — |
| Citibank NA | Vanguard FTSE Europe ETF | 1 day FEDF minus 2.50% | 12/2/22 | Daily | (7,062) | — |
| | | | | | | $ — |
| 1. | As of October 31, 2022, cash in the amount $4,000,000 was pledged from brokers for OTC swap contracts. |
| 2. | Fund pays the floating rate and receives the total return of the reference entity. |
| 3. | Notional amounts reflected as a positive value indicate a long position held by the Fund or Index and a negative value indicates a short position. |
| 4. | Reflects the value at reset date as of October 31, 2022. |
| Abbreviation(s): |
| EAFE—Europe, Australasia and Far East |
| ETF—Exchange-Traded Fund |
| FEDF—Federal Funds Rate |
| FTSE—Financial Times Stock Exchange |
| MSCI—Morgan Stanley Capital International |
| SPDR—Standard & Poor’s Depositary Receipt |
The following is a summary of the fair valuations according to the inputs used as of October 31, 2022, for valuing the Fund’s assets:
| Description | Quoted
Prices in
Active
Markets for
Identical
Assets
(Level 1) | | Significant
Other
Observable
Inputs
(Level 2) | | Significant
Unobservable
Inputs
(Level 3) | | Total |
| Asset Valuation Inputs | | | | | | | |
| Investments in Securities (a) | | | | | | | |
| Affiliated Investment Companies | | | | | | | |
| Equity Funds | $ 416,185,856 | | $ — | | $ — | | $ 416,185,856 |
| Fixed Income Funds | 235,495,796 | | — | | — | | 235,495,796 |
| Total Affiliated Investment Companies | 651,681,652 | | — | | — | | 651,681,652 |
| Short-Term Investment | | | | | | | |
| Affiliated Investment Company | 78,208,346 | | — | | — | | 78,208,346 |
| Total Investments in Securities | $ 729,889,998 | | $ — | | $ — | | $ 729,889,998 |
| (a) | For a complete listing of investments, see the Portfolio of Investments. |
The notes to the financial statements are an integral part of, and should be read in conjunction with, the financial statements.
31
Statement of Assets and Liabilities as of October 31, 2022
| Assets |
Investment in affiliated investment companies, at value
(identified cost $740,291,568) | $729,889,998 |
| Cash | 293 |
| Cash collateral on deposit at broker for swap contracts | 4,000,000 |
| Due from broker | 1,000,000 |
| Receivables: | |
| Dividends and interest on OTC swaps contracts | 2,833,199 |
| Dividends and interest | 378,765 |
| Fund shares sold | 216,016 |
| Manager (See Note 3) | 11,838 |
| Prepaid expenses | 7 |
| Other assets | 40,780 |
| Total assets | 738,370,896 |
| Liabilities |
| Payables: | |
| Fund shares redeemed | 375,709 |
| Investment securities purchased | 193,634 |
| NYLIFE Distributors (See Note 3) | 173,306 |
| Transfer agent (See Note 3) | 162,950 |
| Shareholder communication | 77,324 |
| Professional fees | 13,985 |
| Custodian | 3,379 |
| Trustees | 49 |
| Accrued expenses | 7,669 |
| Total liabilities | 1,008,005 |
| Net assets | $737,362,891 |
| Composition of Net Assets |
| Shares of beneficial interest outstanding (par value of $.001 per share) unlimited number of shares authorized | $ 60,765 |
| Additional paid-in-capital | 724,651,306 |
| | 724,712,071 |
| Total distributable earnings (loss) | 12,650,820 |
| Net assets | $737,362,891 |
| Class A | |
| Net assets applicable to outstanding shares | $605,510,859 |
| Shares of beneficial interest outstanding | 49,875,996 |
| Net asset value per share outstanding | $ 12.14 |
| Maximum sales charge (3.00% of offering price) | 0.38 |
| Maximum offering price per share outstanding | $ 12.52 |
| Investor Class | |
| Net assets applicable to outstanding shares | $ 84,179,998 |
| Shares of beneficial interest outstanding | 6,924,901 |
| Net asset value per share outstanding | $ 12.16 |
| Maximum sales charge (2.50% of offering price) | 0.31 |
| Maximum offering price per share outstanding | $ 12.47 |
| Class B | |
| Net assets applicable to outstanding shares | $ 14,889,748 |
| Shares of beneficial interest outstanding | 1,244,981 |
| Net asset value and offering price per share outstanding | $ 11.96 |
| Class C | |
| Net assets applicable to outstanding shares | $ 19,530,814 |
| Shares of beneficial interest outstanding | 1,633,537 |
| Net asset value and offering price per share outstanding | $ 11.96 |
| Class I | |
| Net assets applicable to outstanding shares | $ 8,483,377 |
| Shares of beneficial interest outstanding | 692,308 |
| Net asset value and offering price per share outstanding | $ 12.25 |
| Class R2 | |
| Net assets applicable to outstanding shares | $ 154,931 |
| Shares of beneficial interest outstanding | 12,774 |
| Net asset value and offering price per share outstanding | $ 12.13 |
| Class R3 | |
| Net assets applicable to outstanding shares | $ 1,600,525 |
| Shares of beneficial interest outstanding | 132,385 |
| Net asset value and offering price per share outstanding | $ 12.09 |
| SIMPLE Class | |
| Net assets applicable to outstanding shares | $ 3,012,639 |
| Shares of beneficial interest outstanding | 248,339 |
| Net asset value and offering price per share outstanding | $ 12.13 |
The notes to the financial statements are an integral part of, and should be read in conjunction with, the financial statements.
| 32 | MainStay Moderate Allocation Fund |
Statement of Operations for the year ended October 31, 2022
| Investment Income (Loss) |
| Income | |
| Dividend distributions from affiliated investment companies | $ 16,265,227 |
| Expenses | |
| Distribution/Service—Class A (See Note 3) | 1,662,707 |
| Distribution/Service—Investor Class (See Note 3) | 228,034 |
| Distribution/Service—Class B (See Note 3) | 204,435 |
| Distribution/Service—Class C (See Note 3) | 243,206 |
| Distribution/Service—Class R2 (See Note 3) | 414 |
| Distribution/Service—Class R3 (See Note 3) | 7,941 |
| Distribution/Service—SIMPLE Class (See Note 3) | 9,469 |
| Transfer agent (See Note 3) | 798,371 |
| Registration | 113,946 |
| Professional fees | 84,686 |
| Shareholder communication | 37,637 |
| Custodian | 29,510 |
| Trustees | 17,114 |
| Shareholder service (See Note 3) | 1,754 |
| Miscellaneous | 38,013 |
| Total expenses before waiver/reimbursement | 3,477,237 |
| Expense waiver/reimbursement from Manager (See Note 3) | (79,295) |
| Net expenses | 3,397,942 |
| Net investment income (loss) | 12,867,285 |
| Realized and Unrealized Gain (Loss) |
| Net realized gain (loss) on: | |
| Affiliated investment company transactions | (17,413,460) |
| Realized capital gain distributions from affiliated investment companies | 52,446,714 |
| Swap transactions | (347,011) |
| Net realized gain (loss) | 34,686,243 |
Net change in unrealized appreciation (depreciation) on:
Affiliated investments companies | (181,325,599) |
| Net realized and unrealized gain (loss) | (146,639,356) |
| Net increase (decrease) in net assets resulting from operations | $(133,772,071) |
The notes to the financial statements are an integral part of, and should be read in conjunction with, the financial statements.
33
Statements of Changes in Net Assets
for the years ended October 31, 2022 and October 31, 2021
| | 2022 | 2021 |
| Increase (Decrease) in Net Assets |
| Operations: | | |
| Net investment income (loss) | $ 12,867,285 | $ 10,446,065 |
| Net realized gain (loss) | 34,686,243 | 61,005,396 |
| Net change in unrealized appreciation (depreciation) | (181,325,599) | 98,856,644 |
| Net increase (decrease) in net assets resulting from operations | (133,772,071) | 170,308,105 |
| Distributions to shareholders: | | |
| Class A | (64,034,427) | (34,271,649) |
| Investor Class | (8,433,971) | (5,400,815) |
| Class B | (1,976,049) | (1,464,688) |
| Class C | (2,293,600) | (1,732,553) |
| Class I | (1,040,013) | (525,585) |
| Class R2 | (15,531) | (8,311) |
| Class R3 | (139,179) | (53,511) |
| SIMPLE Class | (100,741) | (5,676) |
| Total distributions to shareholders | (78,033,511) | (43,462,788) |
| Capital share transactions: | | |
| Net proceeds from sales of shares | 79,637,492 | 85,932,952 |
| Net asset value of shares issued to shareholders in reinvestment of distributions | 77,450,338 | 43,197,194 |
| Cost of shares redeemed | (101,599,989) | (109,098,684) |
| Increase (decrease) in net assets derived from capital share transactions | 55,487,841 | 20,031,462 |
| Net increase (decrease) in net assets | (156,317,741) | 146,876,779 |
| Net Assets |
| Beginning of year | 893,680,632 | 746,803,853 |
| End of year | $ 737,362,891 | $ 893,680,632 |
The notes to the financial statements are an integral part of, and should be read in conjunction with, the financial statements.
| 34 | MainStay Moderate Allocation Fund |
Financial Highlights selected per share data and ratios
| | Year Ended October 31, |
| Class A | 2022 | | 2021 | | 2020 | | 2019 | | 2018 |
| Net asset value at beginning of year | $ 15.64 | | $ 13.41 | | $ 13.28 | | $ 13.14 | | $ 14.23 |
| Net investment income (loss) (a) | 0.22 | | 0.20 | | 0.24 | | 0.23 | | 0.20 |
| Net realized and unrealized gain (loss) | (2.35) | | 2.83 | | 0.41 | | 0.81 | | (0.53) |
| Total from investment operations | (2.13) | | 3.03 | | 0.65 | | 1.04 | | (0.33) |
| Less distributions: | | | | | | | | | |
| From net investment income | (0.53) | | (0.23) | | (0.26) | | (0.27) | | (0.31) |
| From net realized gain on investments | (0.84) | | (0.57) | | (0.26) | | (0.63) | | (0.45) |
| Total distributions | (1.37) | | (0.80) | | (0.52) | | (0.90) | | (0.76) |
| Net asset value at end of year | $ 12.14 | | $ 15.64 | | $ 13.41 | | $ 13.28 | | $ 13.14 |
| Total investment return (b) | (14.97)% | | 23.28% | | 4.96% | | 8.88% | | (2.58)% |
| Ratios (to average net assets)/Supplemental Data: | | | | | | | | | |
| Net investment income (loss) | 1.65% | | 1.32% | | 1.87% | | 1.82% | | 1.47% |
| Net expenses (c) | 0.34% | | 0.35% | | 0.36% | | 0.36% | | 0.34% |
| Portfolio turnover rate | 32% | | 29% | | 59% | | 45% | | 52% |
| Net assets at end of year (in 000’s) | $ 605,511 | | $ 721,363 | | $ 568,079 | | $ 553,530 | | $ 480,956 |
| (a) | Per share data based on average shares outstanding during the year. |
| (b) | Total investment return is calculated exclusive of sales charges and assumes the reinvestment of dividends and distributions. For periods of less than one year, total return is not annualized. |
| (c) | In addition to the fees and expenses which the Fund bears directly, it also indirectly bears a pro-rata share of the fees and expenses of the underlying funds in which it invests. Such indirect expenses are not included in the above expense ratios. |
| | Year Ended October 31, |
| Investor Class | 2022 | | 2021 | | 2020 | | 2019 | | 2018 |
| Net asset value at beginning of year | $ 15.65 | | $ 13.42 | | $ 13.28 | | $ 13.14 | | $ 14.22 |
| Net investment income (loss) (a) | 0.19 | | 0.17 | | 0.22 | | 0.21 | | 0.18 |
| Net realized and unrealized gain (loss) | (2.34) | | 2.82 | | 0.41 | | 0.81 | | (0.54) |
| Total from investment operations | (2.15) | | 2.99 | | 0.63 | | 1.02 | | (0.36) |
| Less distributions: | | | | | | | | | |
| From net investment income | (0.50) | | (0.19) | | (0.23) | | (0.25) | | (0.27) |
| From net realized gain on investments | (0.84) | | (0.57) | | (0.26) | | (0.63) | | (0.45) |
| Total distributions | (1.34) | | (0.76) | | (0.49) | | (0.88) | | (0.72) |
| Net asset value at end of year | $ 12.16 | | $ 15.65 | | $ 13.42 | | $ 13.28 | | $ 13.14 |
| Total investment return (b) | (15.08)% | | 22.97% | | 4.83% | | 8.64% | | (2.78)% |
| Ratios (to average net assets)/Supplemental Data: | | | | | | | | | |
| Net investment income (loss) | 1.45% | | 1.12% | | 1.68% | | 1.60% | | 1.30% |
| Net expenses (c) | 0.55% | | 0.55% | | 0.55% | | 0.55% | | 0.51% |
| Expenses (before waiver/reimbursement) (c) | 0.61% | | 0.67% | | 0.66% | | 0.64% | | 0.58% |
| Portfolio turnover rate | 32% | | 29% | | 59% | | 45% | | 52% |
| Net assets at end of year (in 000's) | $ 84,180 | | $ 101,233 | | $ 101,831 | | $ 104,946 | | $ 84,202 |
| (a) | Per share data based on average shares outstanding during the year. |
| (b) | Total investment return is calculated exclusive of sales charges and assumes the reinvestment of dividends and distributions. For periods of less than one year, total return is not annualized. |
| (c) | In addition to the fees and expenses which the Fund bears directly, it also indirectly bears a pro-rata share of the fees and expenses of the underlying funds in which it invests. Such indirect expenses are not included in the above expense ratios. |
The notes to the financial statements are an integral part of, and should be read in conjunction with, the financial statements.
35
Financial Highlights selected per share data and ratios
| | Year Ended October 31, |
| Class B | 2022 | | 2021 | | 2020 | | 2019 | | 2018 |
| Net asset value at beginning of year | $ 15.42 | | $ 13.23 | | $ 13.09 | | $ 12.94 | | $ 14.00 |
| Net investment income (loss) (a) | 0.09 | | 0.06 | | 0.13 | | 0.12 | | 0.08 |
| Net realized and unrealized gain (loss) | (2.32) | | 2.79 | | 0.39 | | 0.79 | | (0.53) |
| Total from investment operations | (2.23) | | 2.85 | | 0.52 | | 0.91 | | (0.45) |
| Less distributions: | | | | | | | | | |
| From net investment income | (0.39) | | (0.09) | | (0.12) | | (0.13) | | (0.16) |
| From net realized gain on investments | (0.84) | | (0.57) | | (0.26) | | (0.63) | | (0.45) |
| Total distributions | (1.23) | | (0.66) | | (0.38) | | (0.76) | | (0.61) |
| Net asset value at end of year | $ 11.96 | | $ 15.42 | | $ 13.23 | | $ 13.09 | | $ 12.94 |
| Total investment return (b) | (15.77)% | | 22.04% | | 4.03% | | 7.82% | | (3.45)% |
| Ratios (to average net assets)/Supplemental Data: | | | | | | | | | |
| Net investment income (loss) | 0.70% | | 0.43% | | 1.00% | | 0.96% | | 0.60% |
| Net expenses (c) | 1.30% | | 1.30% | | 1.30% | | 1.30% | | 1.26% |
| Expenses (before waiver/reimbursement) (c) | 1.36% | | 1.42% | | 1.40% | | 1.38% | | 1.33% |
| Portfolio turnover rate | 32% | | 29% | | 59% | | 45% | | 52% |
| Net assets at end of year (in 000’s) | $ 14,890 | | $ 27,037 | | $ 31,682 | | $ 40,817 | | $ 50,416 |
| (a) | Per share data based on average shares outstanding during the year. |
| (b) | Total investment return is calculated exclusive of sales charges and assumes the reinvestment of dividends and distributions. For periods of less than one year, total return is not annualized. |
| (c) | In addition to the fees and expenses which the Fund bears directly, it also indirectly bears a pro-rata share of the fees and expenses of the underlying funds in which it invests. Such indirect expenses are not included in the above expense ratios. |
| | Year Ended October 31, |
| Class C | 2022 | | 2021 | | 2020 | | 2019 | | 2018 |
| Net asset value at beginning of year | $ 15.42 | | $ 13.23 | | $ 13.08 | | $ 12.93 | | $ 14.00 |
| Net investment income (loss) (a) | 0.09 | | 0.06 | | 0.13 | | 0.13 | | 0.08 |
| Net realized and unrealized gain (loss) | (2.32) | | 2.79 | | 0.40 | | 0.78 | | (0.54) |
| Total from investment operations | (2.23) | | 2.85 | | 0.53 | | 0.91 | | (0.46) |
| Less distributions: | | | | | | | | | |
| From net investment income | (0.39) | | (0.09) | | (0.12) | | (0.13) | | (0.16) |
| From net realized gain on investments | (0.84) | | (0.57) | | (0.26) | | (0.63) | | (0.45) |
| Total distributions | (1.23) | | (0.66) | | (0.38) | | (0.76) | | (0.61) |
| Net asset value at end of year | $ 11.96 | | $ 15.42 | | $ 13.23 | | $ 13.08 | | $ 12.93 |
| Total investment return (b) | (15.76)% | | 22.05% | | 4.11% | | 7.83% | | (3.52)% |
| Ratios (to average net assets)/Supplemental Data: | | | | | | | | | |
| Net investment income (loss) | 0.70% | | 0.40% | | 0.99% | | 1.00% | | 0.59% |
| Net expenses (c) | 1.30% | | 1.30% | | 1.30% | | 1.30% | | 1.26% |
| Expenses (before waiver/reimbursement) (c) | 1.36% | | 1.42% | | 1.40% | | 1.38% | | 1.33% |
| Portfolio turnover rate | 32% | | 29% | | 59% | | 45% | | 52% |
| Net assets at end of year (in 000’s) | $ 19,531 | | $ 30,309 | | $ 35,483 | | $ 43,681 | | $ 57,496 |
| (a) | Per share data based on average shares outstanding during the year. |
| (b) | Total investment return is calculated exclusive of sales charges and assumes the reinvestment of dividends and distributions. For periods of less than one year, total return is not annualized. |
| (c) | In addition to the fees and expenses which the Fund bears directly, it also indirectly bears a pro-rata share of the fees and expenses of the underlying funds in which it invests. Such indirect expenses are not included in the above expense ratios. |
The notes to the financial statements are an integral part of, and should be read in conjunction with, the financial statements.
| 36 | MainStay Moderate Allocation Fund |
Financial Highlights selected per share data and ratios
| | Year Ended October 31, |
| Class I | 2022 | | 2021 | | 2020 | | 2019 | | 2018 |
| Net asset value at beginning of year | $ 15.77 | | $ 13.52 | | $ 13.37 | | $ 13.24 | | $ 14.34 |
| Net investment income (loss) (a) | 0.26 | | 0.23 | | 0.30 | | 0.28 | | 0.24 |
| Net realized and unrealized gain (loss) | (2.37) | | 2.85 | | 0.40 | | 0.79 | | (0.54) |
| Total from investment operations | (2.11) | | 3.08 | | 0.70 | | 1.07 | | (0.30) |
| Less distributions: | | | | | | | | | |
| From net investment income | (0.57) | | (0.26) | | (0.29) | | (0.31) | | (0.35) |
| From net realized gain on investments | (0.84) | | (0.57) | | (0.26) | | (0.63) | | (0.45) |
| Total distributions | (1.41) | | (0.83) | | (0.55) | | (0.94) | | (0.80) |
| Net asset value at end of year | $ 12.25 | | $ 15.77 | | $ 13.52 | | $ 13.37 | | $ 13.24 |
| Total investment return (b) | (14.76)% | | 23.52% | | 5.33% | | 9.04% | | (2.39)% |
| Ratios (to average net assets)/Supplemental Data: | | | | | | | | | |
| Net investment income (loss) | 1.91% | | 1.55% | | 2.31% | | 2.15% | | 1.75% |
| Net expenses (c) | 0.09% | | 0.10% | | 0.11% | | 0.11% | | 0.09% |
| Portfolio turnover rate | 32% | | 29% | | 59% | | 45% | | 52% |
| Net assets at end of year (in 000’s) | $ 8,483 | | $ 11,150 | | $ 8,586 | | $ 11,687 | | $ 13,108 |
| (a) | Per share data based on average shares outstanding during the year. |
| (b) | Total investment return is calculated exclusive of sales charges and assumes the reinvestment of dividends and distributions. Class I shares are not subject to sales charges. For periods of less than one year, total return is not annualized. |
| (c) | In addition to the fees and expenses which the Fund bears directly, it also indirectly bears a pro-rata share of the fees and expenses of the underlying funds in which it invests. Such indirect expenses are not included in the above expense ratios. |
| | Year Ended October 31, | | June 14, 2019^ through
October 31,
2019 |
| Class R2 | 2022 | | 2021 | | 2020 | |
| Net asset value at beginning of period | $ 15.62 | | $ 13.40 | | $ 13.27 | | $ 12.78 |
| Net investment income (loss) (a) | 0.21 | | 0.18 | | 0.24 | | 0.06 |
| Net realized and unrealized gain (loss) | (2.34) | | 2.82 | | 0.40 | | 0.43 |
| Total from investment operations | (2.13) | | 3.00 | | 0.64 | | 0.49 |
| Less distributions: | | | | | | | |
| From net investment income | (0.52) | | (0.21) | | (0.25) | | — |
| From net realized gain on investments | (0.84) | | (0.57) | | (0.26) | | — |
| Total distributions | (1.36) | | (0.78) | | (0.51) | | — |
| Net asset value at end of period | $ 12.13 | | $ 15.62 | | $ 13.40 | | $ 13.27 |
| Total investment return (b) | (15.01)% | | 23.10% | | 4.89% | | 3.83% |
| Ratios (to average net assets)/Supplemental Data: | | | | | | | |
| Net investment income (loss) | 1.56% | | 1.22% | | 1.81% | | 1.13%†† |
| Net expenses (c) | 0.44% | | 0.45% | | 0.46% | | 0.47%†† |
| Portfolio turnover rate | 32% | | 29% | | 59% | | 45% |
| Net assets at end of period (in 000’s) | $ 155 | | $ 177 | | $ 141 | | $ 147 |
| ^ | Inception date. |
| †† | Annualized. |
| (a) | Per share data based on average shares outstanding during the period. |
| (b) | Total investment return is calculated exclusive of sales charges and assumes the reinvestment of dividends and distributions. Class R2 shares are not subject to sales charges. For periods of less than one year, total return is not annualized. |
| (c) | In addition to the fees and expenses which the Fund bears directly, it also indirectly bears a pro-rata share of the fees and expenses of the underlying funds in which it invests. Such indirect expenses are not included in the above expense ratios. |
The notes to the financial statements are an integral part of, and should be read in conjunction with, the financial statements.
37
Financial Highlights selected per share data and ratios
| | Year Ended October 31, |
| Class R3 | 2022 | | 2021 | | 2020 | | 2019 | | 2018 |
| Net asset value at beginning of year | $ 15.58 | | $ 13.37 | | $ 13.24 | | $ 13.09 | | $ 14.20 |
| Net investment income (loss) (a) | 0.17 | | 0.14 | | 0.20 | | 0.17 | | 0.13 |
| Net realized and unrealized gain (loss) | (2.34) | | 2.82 | | 0.42 | | 0.82 | | (0.50) |
| Total from investment operations | (2.17) | | 2.96 | | 0.62 | | 0.99 | | (0.37) |
| Less distributions: | | | | | | | | | |
| From net investment income | (0.48) | | (0.18) | | (0.23) | | (0.21) | | (0.29) |
| From net realized gain on investments | (0.84) | | (0.57) | | (0.26) | | (0.63) | | (0.45) |
| Total distributions | (1.32) | | (0.75) | | (0.49) | | (0.84) | | (0.74) |
| Net asset value at end of year | $ 12.09 | | $ 15.58 | | $ 13.37 | | $ 13.24 | | $ 13.09 |
| Total investment return (b) | (15.27)% | | 22.79% | | 4.70% | | 8.46% | | (2.91)% |
| Ratios (to average net assets)/Supplemental Data: | | | | | | | | | |
| Net investment income (loss) | 1.30% | | 0.96% | | 1.54% | | 1.32% | | 0.94% |
| Net expenses (c) | 0.69% | | 0.70% | | 0.71% | | 0.71% | | 0.69% |
| Portfolio turnover rate | 32% | | 29% | | 59% | | 45% | | 52% |
| Net assets at end of year (in 000’s) | $ 1,601 | | $ 1,557 | | $ 964 | | $ 1,004 | | $ 459 |
| (a) | Per share data based on average shares outstanding during the year. |
| (b) | Total investment return is calculated exclusive of sales charges and assumes the reinvestment of dividends and distributions. Class R3 shares are not subject to sales charges. For periods of less than one year, total return is not annualized. |
| (c) | In addition to the fees and expenses which the Fund bears directly, it also indirectly bears a pro-rata share of the fees and expenses of the underlying funds in which it invests. Such indirect expenses are not included in the above expense ratios. |
| | Year Ended October 31, | | August 31, 2020^ through
October 31, |
| SIMPLE Class | 2022 | | 2021 | | 2020 |
| Net asset value at beginning of period | $ 15.62 | | $ 13.42 | | $ 13.95* |
| Net investment income (loss) (a) | 0.15 | | 0.11 | | 0.02 |
| Net realized and unrealized gain (loss) | (2.34) | | 2.84 | | (0.55) |
| Total from investment operations | (2.19) | | 2.95 | | (0.53) |
| Less distributions: | | | | | |
| From net investment income | (0.46) | | (0.18) | | — |
| From net realized gain on investments | (0.84) | | (0.57) | | — |
| Total distributions | (1.30) | | (0.75) | | — |
| Net asset value at end of period | $ 12.13 | | $ 15.62 | | $ 13.42 |
| Total investment return (b) | (15.33)% | | 22.61% | | (3.80)% |
| Ratios (to average net assets)/Supplemental Data: | | | | | |
| Net investment income (loss) | 1.19% | | 0.75% | | 0.95%†† |
| Net expenses (c) | 0.80% | | 0.80% | | 0.80%†† |
| Expenses (before waiver/reimbursement) (c) | 0.86% | | 0.92% | | 0.93%†† |
| Portfolio turnover rate | 32% | | 29% | | 59% |
| Net assets at end of period (in 000’s) | $ 3,013 | | $ 853 | | $ 38 |
| ^ | Inception date. |
| * | Based on the net asset value of Investor Class as of August 31, 2020. |
| †† | Annualized. |
| (a) | Per share data based on average shares outstanding during the period. |
| (b) | Total investment return is calculated exclusive of sales charges and assumes the reinvestment of dividends and distributions. SIMPLE Class shares are not subject to sales charges. For periods of less than one year, total return is not annualized. |
| (c) | In addition to the fees and expenses which the Fund bears directly, it also indirectly bears a pro-rata share of the fees and expenses of the underlying funds in which it invests. Such indirect expenses are not included in the above expense ratios. |
The notes to the financial statements are an integral part of, and should be read in conjunction with, the financial statements.
| 38 | MainStay Moderate Allocation Fund |
MainStay Growth Allocation Fund
Investment and Performance Comparison (Unaudited)
Performance data quoted represents past performance. Past performance is no guarantee of future results. Because of market volatility and other factors, current performance may be lower or higher than the figures shown. Investment return and principal value will fluctuate, and as a result, when shares are redeemed, they may be worth more or less than their original cost. The graph below depicts the historical performance of Class I shares of the Fund. Performance will vary from class to class based on differences in class-specific expenses and sales charges. For performance information current to the most recent month-end, please call 800-624-6782 or visit newyorklifeinvestments.com.
The performance table and graph do not reflect the deduction of taxes that a shareholder would pay on distributions or Fund share redemptions. Total returns reflect maximum applicable sales charges as indicated in the table below, if any, changes in share price, and reinvestment of dividend and capital gain distributions. The graph assumes the initial investment amount shown below and reflects the deduction of all sales charges that would have applied for the period of investment. Performance figures may reflect certain fee waivers and/or expense limitations, without which total returns may have been lower. For more information on share classes and current fee waivers and/or expense limitations (if any), please refer to the Notes to Financial Statements.

| Average Annual Total Returns for the Year-Ended October 31, 2022 |
| Class | Sales Charge | | Inception
Date | One
Year | Five
Years | Ten Years
or Since
Inception | Gross
Expense
Ratio1 |
| Class A Shares2 | Maximum 3% Initial Sales Charge | With sales charges | 4/4/2005 | -17.45% | 2.93% | 6.58% | 0.90% |
| | | Excluding sales charges | | -14.90 | 4.10 | 7.18 | 0.90 |
| Investor Class Shares2, 3 | Maximum 2.5% Initial Sales Charge | With sales charges | 2/28/2008 | -17.17 | 2.76 | 6.39 | 1.23 |
| | | Excluding sales charges | | -15.05 | 3.93 | 6.99 | 1.23 |
| Class B Shares4 | Maximum 5% CDSC | With sales charges | 4/4/2005 | -19.52 | 2.84 | 6.19 | 1.98 |
| | if Redeemed Within the First Six Years of Purchase | Excluding sales charges | | -15.70 | 3.15 | 6.19 | 1.98 |
| Class C Shares | Maximum 1% CDSC | With sales charges | 4/4/2005 | -16.47 | 3.15 | 6.19 | 1.98 |
| | if Redeemed Within One Year of Purchase | Excluding sales charges | | -15.70 | 3.15 | 6.19 | 1.98 |
| Class I Shares | No Sales Charge | | 4/4/2005 | -14.68 | 4.37 | 7.45 | 0.65 |
| Class R2 Shares | No Sales Charge | | 6/14/2019 | -14.99 | N/A | 5.72 | 1.00 |
| Class R3 Shares | No Sales Charge | | 2/29/2016 | -15.18 | 3.76 | 7.01 | 1.25 |
| SIMPLE Class Shares | No Sales Charge | | 8/31/2020 | -15.29 | N/A | 2.60 | 1.48 |
| 1. | The gross expense ratios presented reflect the Fund’s “Total Annual Fund Operating Expenses” from the most recent Prospectus, as supplemented, and may differ from other expense ratios disclosed in this report. |
| 2. | Prior to July 22, 2019, the maximum initial sales charge was 5.5%, which is reflected in the applicable average annual total return figures shown. |
| 3. | Prior to June 30, 2020, the maximum initial sales charge was 3%, which is reflected in the applicable average annual total return figures shown. |
| 4. | Class B shares are closed to all new purchases as well as additional investments by existing Class B shareholders. |
The footnotes on the next page are an integral part of the table and graph and should be carefully read in conjunction with them.
| Benchmark Performance* | One
Year | Five
Years | Ten
Years |
| S&P 500® Index1 | -14.61% | 10.44% | 12.79% |
| MSCI EAFE® Index (Net)2 | -23.00 | -0.09 | 4.13 |
| Bloomberg U.S. Aggregate Bond Index3 | -15.68 | -0.54 | 0.74 |
| Growth Allocation Composite Index4 | -16.35 | 6.29 | 8.75 |
| Morningstar Allocation-70% to 85% Equity Category Average5 | -15.93 | 4.22 | 6.67 |
| * | Returns for indices reflect no deductions for fees, expenses or taxes, except for foreign withholding taxes where applicable. Results assume reinvestment of all dividends and capital gains. An investment cannot be made directly in an index. |
| 1. | The S&P 500® Index is the Fund's primary benchmark. S&P 500® is a trademark of The McGraw-Hill Companies, Inc. The S&P 500® Index is widely regarded as the standard index for measuring large-cap U.S. stock market performance. |
| 2. | The MSCI EAFE® Index (Net) is the Fund's secondary benchmark. The MSCI EAFE® Index (Net) consists of international stocks representing the developed world outside of North America. |
| 3. | The Fund has selected the Bloomberg U.S. Aggregate Bond Index as an additional benchmark. The Bloomberg U.S. Aggregate Bond Index is a broad-based benchmark that measures the performance of the investment grade, U.S. dollar-denominated, fixed-rate taxable bond market, including Treasurys, government-related and corporate securities, mortgage-backed securities (agency fixed-rate and hybrid adjustable rate mortgage pass-throughs), asset-backed securities, and commercial mortgage-backed securities. |
| 4. | The Fund has selected the Growth Allocation Composite Index as an additional benchmark. The Growth Allocation Composite Index consists of the S&P 500® Index, the MSCI EAFE® Index and the Bloomberg U.S. Aggregate Bond Index weighted 60%, 20% and 20%, respectively. |
| 5. | The Morningstar Allocation – 70% to 85% Equity Category Average is representative of funds that seek to provide both income and capital appreciation by investing in multiple asset classes, including stocks, bonds, and cash. These portfolios are dominated by domestic holdings and have equity exposures between 70% and 85%. Results are based on average total returns of similar funds with all dividends and capital gain distributions reinvested. |
The footnotes on the preceding page are an integral part of the table and graph and should be carefully read in conjunction with them.
| 40 | MainStay Growth Allocation Fund |
Cost in Dollars of a $1,000 Investment in MainStay Growth Allocation Fund (Unaudited)
The example below is intended to describe the fees and expenses borne by shareholders during the six-month period from May 1, 2022 to October 31, 2022, and the impact of those costs on your investment.
Example
As a shareholder of the Fund you incur two types of costs: (1) transaction costs, including exchange fees and sales charges (loads) on purchases (as applicable), and (2) ongoing costs, including management fees, distribution and/or service (12b-1) fees and other Fund expenses (as applicable). This example is intended to help you understand your ongoing costs (in dollars) of investing in the Fund and to compare these costs with the ongoing costs of investing in other mutual funds. The example is based on an investment of $1,000 made at the beginning of the six-month period and held for the entire period from May 1, 2022 to October 31, 2022.
This example illustrates your Fund’s ongoing costs in two ways:
Actual Expenses
The second and third data columns in the table below provide information about actual account values and actual expenses. You may use the information in these columns, together with the amount you invested, to estimate the expenses that you paid during the six months ended October 31, 2022. Simply divide your account value by $1,000 (for example, an
$8,600 account value divided by $1,000 = 8.6), then multiply the result by the number under the heading entitled “Expenses Paid During Period” to estimate the expenses you paid on your account during this period.
Hypothetical Example for Comparison Purposes
The fourth and fifth data columns in the table below provide information about hypothetical account values and hypothetical expenses based on the Fund’s actual expense ratio and an assumed rate of return of 5% per year before expenses, which is not the Fund’s actual return. The hypothetical account values and expenses may not be used to estimate the actual ending account balances or expenses you paid for the six-month period shown. You may use this information to compare the ongoing costs of investing in the Fund with the ongoing costs of investing in other mutual funds. To do so, compare this 5% hypothetical example with the 5% hypothetical examples that appear in the shareholder reports of the other mutual funds.
Please note that the expenses shown in the table are meant to highlight your ongoing costs only and do not reflect any transactional costs, such as exchange fees or sales charges (loads). Therefore, the fourth and fifth data columns of the table are useful in comparing ongoing costs only and will not help you determine the relative total costs of owning different funds. In addition, if these transactional costs were included, your costs would have been higher.
| Share Class | Beginning
Account
Value
5/1/22 | Ending Account
Value (Based
on Actual
Returns and
Expenses)
10/31/22 | Expenses
Paid
During
Period1 | Ending Account
Value (Based
on Hypothetical
5% Annualized
Return and
Actual Expenses)
10/31/22 | Expenses
Paid
During
Period1 | Net Expense
Ratio
During
Period2 |
| Class A Shares | $1,000.00 | $945.50 | $1.72 | $1,023.44 | $1.79 | 0.35% |
| Investor Class Shares | $1,000.00 | $944.90 | $2.70 | $1,022.43 | $2.80 | 0.55% |
| Class B Shares | $1,000.00 | $941.90 | $6.36 | $1,018.65 | $6.61 | 1.30% |
| Class C Shares | $1,000.00 | $941.30 | $6.36 | $1,018.65 | $6.61 | 1.30% |
| Class I Shares | $1,000.00 | $947.00 | $0.49 | $1,024.70 | $0.51 | 0.10% |
| Class R2 Shares | $1,000.00 | $945.50 | $2.21 | $1,022.94 | $2.29 | 0.45% |
| Class R3 Shares | $1,000.00 | $944.50 | $3.43 | $1,021.68 | $3.57 | 0.70% |
| SIMPLE Class Shares | $1,000.00 | $943.60 | $3.92 | $1,021.17 | $4.08 | 0.80% |
| 1. | Expenses are equal to the Fund’s annualized expense ratio of each class multiplied by the average account value over the period, divided by 365 and multiplied by 184 (to reflect the six-month period). The table above represents the actual expenses incurred during the six-month period. In addition to the fees and expenses which the Fund bears directly, it also indirectly bears a pro rata share of the fees and expenses of the underlying funds in which it invests. Such indirect expenses are not included in the above-reported expense figures. |
| 2. | Expenses are equal to the Fund's annualized expense ratio to reflect the six-month period. |
Asset Diversification as of October 31, 2022 (Unaudited)
| Equity Funds | 75.8% |
| Fixed Income Funds | 12.5 |
| Short-Term Investment | 10.8 |
| Other Assets, Less Liabilities | 0.9 |
See Portfolio of Investments beginning on page 46 for specific holdings within these categories. The Fund’s holdings are subject to change.
| 42 | MainStay Growth Allocation Fund |
Portfolio Management Discussion and Analysis (Unaudited)
Questions answered by portfolio managers Jae S. Yoon, CFA, Jonathan Swaney, Poul Kristensen, CFA, Amit Soni, CFA, of New York Life Investment Management LLC, the Fund’s Manager.
How did MainStay Growth Allocation Fund perform relative to its benchmarks and peer group during the 12 months ended October 31, 2022?
For the 12 months ended October 31, 2022, Class I shares of MainStay Growth Allocation Fund returned −14.68%, underperforming the −14.61% return of the Fund’s primary benchmark, the S&P 500® Index (the "Index"), and outperforming the −23.00% return of the MSCI EAFE® Index (Net), which is the Fund’s secondary benchmark. Over the same period, Class I shares of the Fund outperformed the −15.68% return of the Bloomberg U.S. Aggregate Bond Index, and the −16.35% return of the Growth Allocation Composite Index, both of which are additional benchmarks of the Fund. For the 12 months ended October 31, 2022, Class I shares of the Fund outperformed the −15.93% return of the Morningstar Allocation -70% to 85% Equity Category Average.1
What factors affected the Fund’s relative performance during the reporting period?
The Fund is a “fund of funds,” meaning that it seeks to achieve its investment objective by investing primarily in mutual funds and exchange-traded funds (“ETFs”) managed by New York Life Investments or its affiliates (the “Underlying Funds”). The Underlying Funds may invest in U.S. equities, international equities and fixed-income instruments, making comparisons to any single index generally less suitable than a weighted combination of indices, which is a more useful yardstick by which to measure performance. The most influential factor affecting returns for the Fund during the reporting period (versus the performance of a weighted combination of indices) is the net performance of the Underlying Funds themselves, relative to their respective benchmarks. During the reporting period, asset class policy was the primary determinant of the Fund's relative performance.
Fund management internally maintains a blend of indices that are taken into consideration when managing the Fund. During the reporting period, the Fund outperformed this internally maintained blend of indices, primarily due to active positioning at the asset class level.
The Fund’s outperformance was driven by the following factors:
| • | Management of the stock/bond blend: The Fund’s management of its stock/bond blend proved generally successful, reflecting tactical adjustments made throughout the reporting period. With both investment-grade bonds and U.S. stocks posting declines in the mid-teens, there was little cost or benefit to being persistently overweight or underweight in equities, although adjusting that |
exposure over time (buying dips and selling rallies) added material value.
| • | Value created within asset classes: The equity portion of the Fund emphasized value over growth, with a specific focus on energy companies and defensive sectors that the market rewarded. Conditions also favored the Fund’s skew toward profitable small-cap companies. |
| • | Shorter duration:2 The fixed-income portion of the Fund shortened its average duration by holding cash and by emphasizing exposure to MainStay MacKay Short Duration High Yield Fund over MainStay MacKay High Yield Corporate Bond Fund; these moves lifted relative returns. |
The performance of the Underlying Funds relative to their benchmarks produced mixed results, but provided a marginally positive contribution to the Fund’s performance in aggregate. (Contributions take weightings and total returns into account.)
During the reporting period, how was the Fund’s performance materially affected by investments in derivatives?
Total return swaps were used to express most of the Fund’s asset class policy views. Therefore, the swaps can be seen as enhancing the Fund’s relative performance over the course of the reporting period.
How did you allocate the Fund’s assets during the reporting period and why?
Stock/bond blend: On average, the Fund held a moderately overweight exposure to equities during the reporting period, with the magnitude of that bias managed tactically in response to swings in pricing, as described above. We are generally reluctant to position the Fund with an underweight allocation to equities, as stocks have tended to perform well over time, and anticipating drawdowns is challenging. The opposite is less true; we are happy to increase the Fund’s allocation to equities when we believe they are well supported fundamentally or when a correction has run further than we believe appropriate. This approach paid off handsomely during the reporting period. Although stocks declined by double digits, the Fund generated roughly 0.5% of excess return3 through tactical adjustments to its degree of overweight exposure to equities.
Duration: Believing inflationary pressures to be partially structural in nature and likely to persist at elevated levels for the foreseeable future, we skewed the Fund’s fixed-income holdings to favor shorter maturity instruments less sensitive to rising bond yields,
| 1. | See page 39 for other share class returns, which may be higher or lower than Class I share returns. See page 40 for more information on benchmark and peer group returns. |
| 2. | Duration is a measure of the price sensitivity of a fixed-income investment to changes in interest rates. Duration is expressed as a number of years and is considered a more accurate sensitivity gauge than average maturity. |
| 3. | The expression “excess return” may refer to the return that a security or portfolio provides above (or below) an investment with the lowest perceived risk, such as comparable U.S. Treasury securities. The expression may also refer to the return that a security or portfolio provides above (or below) an index or other benchmark. |
although we increased the Fund’s duration as yields rose. By the end of the reporting period, the average duration of the fixed-income portion of the Fund was only slightly shorter than that of the benchmark. The Fund’s duration policy contributed positively to performance.
Equity style: In the same way that inflation is threatening to long-duration bonds, equities with values disproportionately reflected in more distant cash flows (i.e., growth stocks with high prices relative to current earnings) are likewise vulnerable. Accordingly, we tilted the Fund to emphasize value stocks that offered more attractive near-term cash flows, placing particular focus on more defensive sectors: real estate, utilities, consumer staples and (most of all) health care. The combined effect was a positive contribution to return of approximately 0.5%.
Equity size: Small-company stocks were more heavily owned in the Fund than in the Index. The thesis behind this positioning was based on attractive valuations, insulation from economic weakness abroad, less sensitivity to dollar strength and disproportionate exposure to domestic demand, which remained healthy. The Fund’s active position in small-cap companies contributed modestly to relative performance.
Geographic exposure: Prior to Russia’s invasion of Ukraine, the Fund’s geographic exposure reflected our positive expectations for non-U.S. developed markets generally, and Europe in particular, based on attractive valuations and the post-COVID-19 cyclical recovery we saw coming. Accordingly, we tilted the Fund in that direction. War, sanctions, soaring local energy prices and looming recession changed the underlying picture. We responded by unwinding the Fund’s position, eventually resetting international exposure to an underweight position, but not before relative performance was slightly diminished.
Gold miners: The Fund maintained a varying position in gold miners as an intended hedge against inflation and/or a monetary policy mistake. The position proved volatile, contributing positively to performance in the first half of the reporting period, only to give it all back in the second half, with little net impact on returns for the reporting period overall.
Energy: As with gold miners, the Fund maintained exposure to upstream energy producers as a commodity play to provide an additional intended inflation hedge. These holdings also positioned the Fund to take advantage of opportunities for domestic producers to benefit as Western nations revisit energy policy to source supplies from stable and friendly jurisdictions, rather than autocratic petrostates that present national security risks. While
the Fund’s position was small, it had a disproportionately positive impact on performance as oil and gas prices soared.
How did the Fund’s allocations change over the course of the reporting period?
The Fund’s positioning is most often implemented through the use of derivatives, specifically total return swaps. The use of swaps to reduce exposure to non-U.S. developed markets during the reporting period, as discussed above, is a good example. Similarly, exposure to defensive sectors and energy producers was realized by swapping into the return stream on specific ETFs, including Invesco S&P Low Volatility ETF, SPDR S&P Oil & Gas Exploration ETF and VanEck Oil Services ETF. We also added duration to the Fund’s bond portfolio, after yields had already risen considerably, by entering into a swap in which the Fund received the return on iShares 20+ Year Treasury Bond ETF.
The largest adjustment made to actual Fund holdings involved a partial shift out of MainStay MacKay Total Return Bond Fund and into IQ MacKay ESG Core Plus Bond ETF. Both vehicles are managed by the same team and pursue largely identical strategies, although the latter introduces some additional criteria to the selection of individual issues. The Fund benefited from diversification across both products. The Fund also reduced its holdings of MainStay MacKay High Yield Corporate Bond Fund to pull back on credit exposure.
During the reporting period, which Underlying Equity Funds had the highest total returns and which had the lowest total returns?
Among Underlying Equity Funds, the top-performing investments involved swaps that had been in place for only part of the reporting period. Exposure to energy companies, the health care industry and low volatility stocks enjoyed the highest returns. Among the Underlying Equity Funds held for the entire reporting period, the highest returns came from MainStay WMC Value Fund, MainStay Epoch U.S. Equity Yield Fund and IQ Chaikin U.S. Small Cap ETF. At the other end of the spectrum, performance proved notably weak for MainStay Candriam Emerging Markets Equity Fund, MainStay MacKay International Equity Fund and MainStay WMC Growth Fund.
Which Underlying Equity Funds were the strongest positive contributors to the Fund’s performance and which Underlying Equity Funds were particularly weak?
While none of the Underlying Equity Funds held for the entire reporting period contributed positively to the Fund’s performance, those producing the smallest negative contributions included
| 44 | MainStay Growth Allocation Fund |
MainStay Epoch U.S. Equity Yield Fund, MainStay Epoch Capital Growth Fund and MainStay WMC Value Fund. Extending the analysis to include investments accessed via derivatives, SPDR S&P Oil & Gas Exploration ETF, VanEck Oil Services ETF and S&P 500 Healthcare sector all produced positive contributions to return. The Underlying Equity Funds that detracted the most from the Fund’s performance were MainStay Winslow Large Cap Growth Fund, MainStay WMC Growth Fund and MainStay Candriam Emerging Markets Equity Fund.
During the reporting period, which Underlying Fixed-Income Funds had the highest total returns and which Underlying Fixed-Income Funds had the lowest total returns?
While none of the Underlying Fixed-Income Funds held for the entire reporting period generated positive returns, those producing the smallest losses included MainStay Floating Rate Fund and MainStay MacKay Short Duration High Yield Fund. The largest losses came from exposure through a swap to iShares 20+ Year Treasury Bond ETF, and to MainStay MacKay Total Return Bond Fund and IQ MacKay ESG Core Plus Bond ETF.
Which Underlying Fixed-Income Funds were the strongest positive contributors to the Fund’s performance and which Underlying Fixed-Income Funds were particularly weak?
With all Underlying Fixed-Income Funds experiencing losses during the reporting period, none contributed positively to performance. Those detracting the least were MainStay Short Term Bond Fund, which was held for only part of the reporting period, and IQ MacKay ESG Core Plus Bond ETF. The most significant detractors were MainStay MacKay High Yield Corporate Bond Fund and MainStay MacKay Short Duration High Yield Bond Fund.
How was the Fund positioned at the end of the reporting period?
As the market rallied in October 2022, we trimmed the Fund’s equity allocation, positioning the Fund very close to neutral as of October 31, 2022. We anticipate that the market will continue to move generally sideways within a very broad channel, presenting opportunities to trade tactically, adding to equity holdings during periods of weakness and trimming them again as prices recover.
The bias we expect to have the largest impact on active return is our preference for small- and mid-cap stocks. We believe that the large-cap space is potentially vulnerable to economic weakness abroad, a strong U.S. dollar, rich valuations and concentration in a relatively short list of very large companies (mega-cap
technology). Smaller companies, in contrast, cater primarily to what we view as a financially healthy domestic clientele and have historically been more successful than larger companies in protecting real earnings amid high inflation.
Likewise, the Fund’s emphasis on value stocks over growth stocks remains intact, with a particular emphasis on what we perceive to be the defensive “RUSH” sectors: real estate, utilities, consumer staples and health care. The thesis rests primarily on the idea that inflation will prove persistent and jeopardize the high price multiples paid on fast-growing companies with current valuations that depend on distant earnings. We are also mindful of the economy’s progression in the business cycle and the possibility that a recession may not be far away.
The Fund maintains a position in energy sector firms, as we envision sustained supply constraints keeping commodity prices elevated, preserving meaty profit margins for a couple of years to come.
Within fixed income, we have lessened the Fund’s short-duration posture considerably as yields have climbed. As of October 31, 2022, the Fund’s duration is closer to the benchmark. We have also reduced the Fund’s exposure to credit as corporate fundamentals are gradually showing signs of deterioration.
The opinions expressed are those of the portfolio managers as of the date of this report and are subject to change. There is no guarantee that any forecasts will come to pass. This material does not constitute investment advice and is not intended as an endorsement of any specific investment.
Portfolio of Investments October 31, 2022†
| | Shares | Value |
| Affiliated Investment Companies 88.3% |
| Equity Funds 75.8% |
| IQ 500 International ETF (a) | 948,287 | $ 24,570,116 |
| IQ Candriam ESG International Equity ETF (a) | 1,090,790 | 24,440,677 |
| IQ Candriam ESG U.S. Large Cap Equity ETF (a) | 1,488,856 | 48,849,366 |
| IQ Chaikin U.S. Large Cap ETF (a) | 1,442,632 | 44,995,692 |
| IQ Chaikin U.S. Small Cap ETF (a) | 1,309,557 | 42,743,941 |
| IQ FTSE International Equity Currency Neutral ETF (a) | 731,177 | 14,911,478 |
| IQ Winslow Large Cap Growth ETF (a)(b) | 105,234 | 2,679,226 |
| MainStay Candriam Emerging Markets Equity Fund Class R6 (a) | 2,934,446 | 24,289,290 |
| MainStay Epoch Capital Growth Fund Class I (a) | 251,959 | 2,642,774 |
| MainStay Epoch International Choice Fund Class I (a) | 625,767 | 19,586,936 |
| MainStay Epoch U.S. Equity Yield Fund Class R6 (a) | 2,425,912 | 46,070,490 |
| MainStay MacKay International Equity Fund Class R6 (a) | 1,344,625 | 18,824,082 |
| MainStay S&P 500 Index Fund Class I | 226,914 | 11,249,821 |
| MainStay Winslow Large Cap Growth Fund Class R6 | 4,880,622 | 45,738,259 |
| MainStay WMC Enduring Capital Fund Class R6 (a) | 1,449,484 | 43,828,763 |
| MainStay WMC Growth Fund Class R6 (a) | 1,534,974 | 47,922,513 |
| MainStay WMC International Research Equity Fund Class I (a) | 3,227,135 | 19,197,582 |
| MainStay WMC Small Companies Fund Class I (a) | 1,915,560 | 42,955,295 |
| MainStay WMC Value Fund Class R6 (a) | 1,497,820 | 45,228,182 |
Total Equity Funds
(Cost $534,479,444) | | 570,724,483 |
| | Shares | | Value |
| |
| Fixed Income Funds 12.5% |
| IQ MacKay ESG Core Plus Bond ETF (a) | 616,686 | | $ 12,492,825 |
| MainStay Floating Rate Fund Class R6 (a) | 4,213,658 | | 36,030,986 |
| MainStay MacKay High Yield Corporate Bond Fund Class R6 | 3,141,418 | | 15,292,107 |
| MainStay MacKay Short Duration High Yield Fund Class I | 1,916,755 | | 17,426,944 |
| MainStay MacKay Total Return Bond Fund Class R6 | 1,463,810 | | 12,539,289 |
Total Fixed Income Funds
(Cost $97,855,290) | | | 93,782,151 |
Total Affiliated Investment Companies
(Cost $632,334,734) | | | 664,506,634 |
| Short-Term Investment 10.8% |
| Affiliated Investment Company 10.8% |
| MainStay U.S. Government Liquidity Fund, 2.905% (a)(c) | 81,000,096 | | 81,000,096 |
Total Short-Term Investment
(Cost $81,000,096) | 10.8% | | 81,000,096 |
Total Investments
(Cost $713,334,830) | 99.1% | | 745,506,730 |
| Other Assets, Less Liabilities | 0.9 | | 6,786,804 |
| Net Assets | 100.0% | | $ 752,293,534 |
| † | Percentages indicated are based on Fund net assets. |
| (a) | As of October 31, 2022, the Fund's ownership exceeds 5% of the outstanding shares of the Underlying Fund's share class. |
| (b) | Non-income producing security. |
| (c) | Current yield as of October 31, 2022. |
The notes to the financial statements are an integral part of, and should be read in conjunction with, the financial statements.
| 46 | MainStay Growth Allocation Fund |
Investments in Affiliates (in 000's)
Investments in issuers considered to be affiliate(s) of the Fund during the year ended October 31, 2022 for purposes of Section 2(a)(3) of the Investment Company Act of 1940, as amended, were as follows:
| Affiliated Investment Companies | Value,
Beginning
of Year | Purchases
at Cost | Proceeds
from
Sales | Net
Realized
Gain/(Loss)
on Sales | Change in
Unrealized
Appreciation/
(Depreciation) | Value,
End of
Year | Dividend
Income | Other
Distributions | Shares
End of
Year |
| IQ 500 International ETF | $ 31,518 | $ 2,823 | $ (3,351) | $ 245 | $ (6,665) | $ 24,570 | $ 1,090 | $ — | 948 |
| IQ Candriam ESG International Equity ETF | 30,446 | 3,398 | (1,482) | (218) | (7,703) | 24,441 | 868 | — | 1,091 |
| IQ Candriam ESG U.S. Large Cap Equity ETF | 69,277 | 3,091 | (12,467) | 897 | (11,949) | 48,849 | 724 | — | 1,489 |
| IQ Chaikin U.S. Large Cap ETF | 49,858 | 4,239 | (3,363) | (317) | (5,421) | 44,996 | 638 | — | 1,443 |
| IQ Chaikin U.S. Small Cap ETF | 43,922 | 3,821 | (699) | (46) | (4,254) | 42,744 | 539 | — | 1,310 |
| IQ FTSE International Equity Currency Neutral ETF | 18,364 | 1,067 | (1,222) | 92 | (3,390) | 14,911 | 526 | — | 731 |
| IQ MacKay ESG Core Plus Bond ETF | — | 12,750 | (28) | (3) | (226) | 12,493 | 31 | — | 617 |
| IQ Winslow Large Cap Growth ETF | — | 2,899 | — | — | (220) | 2,679 | — | — | 105 |
| MainStay Candriam Emerging Markets Equity Fund Class R6 | 31,337 | 5,562 | (515) | (65) | (12,030) | 24,289 | 282 | — | 2,934 |
| MainStay Epoch Capital Growth Fund Class I | 3,402 | 898 | (207) | (34) | (1,416) | 2,643 | 5 | 758 | 252 |
| MainStay Epoch International Choice Fund Class I | 24,126 | 3,221 | (1,775) | (22) | (5,963) | 19,587 | 617 | — | 626 |
| MainStay Epoch U.S. Equity Yield Fund Class R6 | 49,334 | 2,810 | (3,793) | (99) | (2,181) | 46,071 | 1,035 | — | 2,426 |
| MainStay Floating Rate Fund Class R6 | 45,562 | 3,463 | (10,229) | (454) | (2,311) | 36,031 | 1,675 | — | 4,214 |
| MainStay MacKay High Yield Corporate Bond Fund Class R6 | 36,407 | 12,484 | (28,807) | (4,061) | (731) | 15,292 | 1,791 | — | 3,141 |
| MainStay MacKay International Equity Fund Class R6 | 23,131 | 8,266 | (1,535) | (633) | (10,405) | 18,824 | 89 | 2,860 | 1,345 |
| MainStay MacKay Short Duration High Yield Fund Class I | 22,784 | 28,503 | (31,345) | (1,352) | (1,163) | 17,427 | 1,141 | — | 1,917 |
| MainStay MacKay Total Return Bond Fund Class R6 | 27,310 | 11,838 | (24,671) | (985) | (953) | 12,539 | 237 | 817 | 1,464 |
| MainStay S&P 500 Index Fund Class I (a) | 40,628 | 2,245 | (27,510) | 8,600 | (12,713) | 11,250 | 439 | 1,399 | 227 |
| MainStay Short Term Bond Fund Class I | 4,542 | 3 | (4,507) | (88) | 50 | — | 8 | 12 | — |
| MainStay U.S. Government Liquidity Fund | 77,898 | 150,601 | (147,499) | — | — | 81,000 | 643 | — | 81,000 |
| MainStay Winslow Large Cap Growth Fund Class R6 | 70,521 | 19,936 | (10,615) | (1,936) | (32,168) | 45,738 | — | 13,043 | 4,881 |
| MainStay WMC Enduring Capital Fund Class R6 | 51,881 | 6,375 | (4,566) | (340) | (9,521) | 43,829 | 173 | 4,250 | 1,449 |
| MainStay WMC Growth Fund Class R6 | 52,771 | 31,242 | (4,767) | (3,222) | (28,101) | 47,923 | — | 10,534 | 1,535 |
| MainStay WMC International Research Equity Fund Class I | 23,755 | 3,267 | (1,019) | (113) | (6,692) | 19,198 | 626 | — | 3,227 |
| MainStay WMC Small Companies Fund Class I | 44,757 | 16,320 | (1,848) | (247) | (16,027) | 42,955 | — | 10,279 | 1,916 |
| MainStay WMC Value Fund Class R6 | 50,079 | 23,341 | (4,375) | (147) | (23,670) | 45,228 | 469 | 22,154 | 1,498 |
| | $ 923,610 | $364,463 | $(332,195) | $(4,548) | $(205,823) | $ 745,507 | $ 13,646 | $66,106 | |
| | |
| (a) | Prior to February 28, 2022, known as MainStay MacKay S&P 500 Index Fund Class I. |
The notes to the financial statements are an integral part of, and should be read in conjunction with, the financial statements.
47
Portfolio of Investments October 31, 2022† (continued)
Swap Contracts
Open OTC total return equity swap contracts as of October 31, 2022 were as follows1:
Swap
Counterparty | Reference Obligation | Floating Rate2 | Termination
Date(s) | Payment
Frequency
Paid/
Received | Notional
Amount
Long/
(Short)
(000)3 | Unrealized
Appreciation/
(Depreciation)4 |
| Citibank NA | Invesco S&P 500 Low Volatility ETF | 1 day FEDF plus 0.45% | 12/2/22 | Daily | 17,357 | $ — |
| Citibank NA | iShares 20+ Year Treasury Bond ETF | 1 day FEDF plus 0.35% | 12/2/22 | Daily | 6,553 | — |
| Citibank NA | iShares MSCI EAFE ETF | 1 day FEDF minus 1.25% | 12/2/22 | Daily | (21,968) | — |
| Citibank NA | iShares Semiconductor ETF | 1 day FEDF plus 0.35% | 12/2/22 | Daily | 3,288 | — |
| Citibank NA | Russell 1000 Growth Total Return Index | 1 day FEDF minus 0.20% | 12/2/22 | Daily | (10,542) | — |
| Citibank NA | Russell Midcap Total Return Index | 1 day FEDF plus 0.40% | 12/2/22 | Daily | 14,910 | — |
| Citibank NA | S&P 500 Health Care Sector | 1 day FEDF plus 0.45% | 12/2/22 | Daily | 14,354 | — |
| Citibank NA | S&P 500 Total Return Index | 1 day FEDF plus 0.12% | 12/2/22 | Daily | (27,885) | — |
| Citibank NA | S&P 600 Total Return | 1 day FEDF plus 0.40% | 12/2/22 | Daily | 39,743 | — |
| Citibank NA | SPDR S&P Oil & Gas Exploration & Production ETF | 1 day FEDF plus 0.40% | 12/2/22 | Daily | 4,256 | — |
| Citibank NA | VanEck Gold Miners ETF | 1 day FEDF plus 0.55% | 12/2/22 | Daily | 6,497 | — |
| Citibank NA | VanEck Oil Services ETF | 1 day FEDF plus 0.40% | 12/2/22 | Daily | 5,203 | — |
| Citibank NA | Vanguard FTSE Europe ETF | 1 day FEDF minus 2.50% | 12/2/22 | Daily | (7,153) | — |
| | | | | | | $ — |
| 1. | As of October 31, 2022, cash in the amount $3,999,999 was pledged from brokers for OTC swap contracts. |
| 2. | Fund pays the floating rate and receives the total return of the reference entity. |
| 3. | Notional amounts reflected as a positive value indicate a long position held by the Fund or Index and a negative value indicates a short position. |
| 4. | Reflects the value at reset date as of October 31, 2022. |
| Abbreviation(s): |
| EAFE—Europe, Australasia and Far East |
| ETF—Exchange-Traded Fund |
| FEDF—Federal Funds Rate |
| FTSE—Financial Times Stock Exchange |
| MSCI—Morgan Stanley Capital International |
| SPDR—Standard & Poor’s Depositary Receipt |
The notes to the financial statements are an integral part of, and should be read in conjunction with, the financial statements.
| 48 | MainStay Growth Allocation Fund |
The following is a summary of the fair valuations according to the inputs used as of October 31, 2022, for valuing the Fund’s assets:
| Description | Quoted
Prices in
Active
Markets for
Identical
Assets
(Level 1) | | Significant
Other
Observable
Inputs
(Level 2) | | Significant
Unobservable
Inputs
(Level 3) | | Total |
| Asset Valuation Inputs | | | | | | | |
| Investments in Securities (a) | | | | | | | |
| Affiliated Investment Companies | | | | | | | |
| Equity Funds | $ 570,724,483 | | $ — | | $ — | | $ 570,724,483 |
| Fixed Income Funds | 93,782,151 | | — | | — | | 93,782,151 |
| Total Affiliated Investment Companies | 664,506,634 | | — | | — | | 664,506,634 |
| Short-Term Investment | | | | | | | |
| Affiliated Investment Company | 81,000,096 | | — | | — | | 81,000,096 |
| Total Investments in Securities | $ 745,506,730 | | $ — | | $ — | | $ 745,506,730 |
| (a) | For a complete listing of investments, see the Portfolio of Investments. |
The notes to the financial statements are an integral part of, and should be read in conjunction with, the financial statements.
49
Statement of Assets and Liabilities as of October 31, 2022
| Assets |
Investment in affiliated investment companies, at value
(identified cost $713,334,830) | $745,506,730 |
| Cash | 2,933 |
| Cash collateral on deposit at broker for swap contracts | 3,999,999 |
| Receivables: | |
| Dividends and interest on OTC swaps contracts | 2,990,584 |
| Fund shares sold | 439,703 |
| Dividends and interest | 385,995 |
| Manager (See Note 3) | 12,247 |
| Prepaid expenses | 21 |
| Other assets | 43,222 |
| Total assets | 753,381,434 |
| Liabilities |
| Payables: | |
| Fund shares redeemed | 398,008 |
| Investment securities purchased | 193,563 |
| Transfer agent (See Note 3) | 184,115 |
| NYLIFE Distributors (See Note 3) | 176,130 |
| Shareholder communication | 103,276 |
| Professional fees | 15,727 |
| Custodian | 7,545 |
| Accrued expenses | 9,536 |
| Total liabilities | 1,087,900 |
| Net assets | $752,293,534 |
| Composition of Net Assets |
| Shares of beneficial interest outstanding (par value of $.001 per share) unlimited number of shares authorized | $ 54,890 |
| Additional paid-in-capital | 685,874,441 |
| | 685,929,331 |
| Total distributable earnings (loss) | 66,364,203 |
| Net assets | $752,293,534 |
| Class A | |
| Net assets applicable to outstanding shares | $603,691,356 |
| Shares of beneficial interest outstanding | 44,018,090 |
| Net asset value per share outstanding | $ 13.71 |
| Maximum sales charge (3.00% of offering price) | 0.42 |
| Maximum offering price per share outstanding | $ 14.13 |
| Investor Class | |
| Net assets applicable to outstanding shares | $ 99,449,439 |
| Shares of beneficial interest outstanding | 7,244,981 |
| Net asset value per share outstanding | $ 13.73 |
| Maximum sales charge (2.50% of offering price) | 0.35 |
| Maximum offering price per share outstanding | $ 14.08 |
| Class B | |
| Net assets applicable to outstanding shares | $ 16,753,250 |
| Shares of beneficial interest outstanding | 1,245,109 |
| Net asset value and offering price per share outstanding | $ 13.46 |
| Class C | |
| Net assets applicable to outstanding shares | $ 20,271,770 |
| Shares of beneficial interest outstanding | 1,506,152 |
| Net asset value and offering price per share outstanding | $ 13.46 |
| Class I | |
| Net assets applicable to outstanding shares | $ 7,973,949 |
| Shares of beneficial interest outstanding | 572,395 |
| Net asset value and offering price per share outstanding | $ 13.93 |
| Class R2 | |
| Net assets applicable to outstanding shares | $ 77,705 |
| Shares of beneficial interest outstanding | 5,670 |
| Net asset value and offering price per share outstanding | $ 13.70 |
| Class R3 | |
| Net assets applicable to outstanding shares | $ 1,004,133 |
| Shares of beneficial interest outstanding | 73,726 |
| Net asset value and offering price per share outstanding | $ 13.62 |
| SIMPLE Class | |
| Net assets applicable to outstanding shares | $ 3,071,932 |
| Shares of beneficial interest outstanding | 224,041 |
| Net asset value and offering price per share outstanding | $ 13.71 |
The notes to the financial statements are an integral part of, and should be read in conjunction with, the financial statements.
| 50 | MainStay Growth Allocation Fund |
Statement of Operations for the year ended October 31, 2022
| Investment Income (Loss) |
| Income | |
| Dividend distributions from affiliated investment companies | $ 13,645,726 |
| Expenses | |
| Distribution/Service—Class A (See Note 3) | 1,651,916 |
| Distribution/Service—Investor Class (See Note 3) | 269,351 |
| Distribution/Service—Class B (See Note 3) | 230,317 |
| Distribution/Service—Class C (See Note 3) | 242,464 |
| Distribution/Service—Class R2 (See Note 3) | 210 |
| Distribution/Service—Class R3 (See Note 3) | 6,344 |
| Distribution/Service—SIMPLE Class (See Note 3) | 11,404 |
| Transfer agent (See Note 3) | 896,477 |
| Registration | 112,783 |
| Professional fees | 63,410 |
| Shareholder communication | 42,861 |
| Custodian | 36,128 |
| Trustees | 17,243 |
| Shareholder service (See Note 3) | 1,381 |
| Miscellaneous | 39,685 |
| Total expenses before waiver/reimbursement | 3,621,974 |
| Expense waiver/reimbursement from Manager (See Note 3) | (80,706) |
| Net expenses | 3,541,268 |
| Net investment income (loss) | 10,104,458 |
| Realized and Unrealized Gain (Loss) |
| Net realized gain (loss) on: | |
| Affiliated investment company transactions | (4,548,178) |
| Realized capital gain distributions from affiliated investment companies | 66,106,351 |
| Swap transactions | (1,468,902) |
| Net realized gain (loss) | 60,089,271 |
Net change in unrealized appreciation (depreciation) on:
Affiliated investments companies | (205,823,448) |
| Net realized and unrealized gain (loss) | (145,734,177) |
| Net increase (decrease) in net assets resulting from operations | $(135,629,719) |
The notes to the financial statements are an integral part of, and should be read in conjunction with, the financial statements.
51
Statements of Changes in Net Assets
for the years ended October 31, 2022 and October 31, 2021
| | 2022 | 2021 |
| Increase (Decrease) in Net Assets |
| Operations: | | |
| Net investment income (loss) | $ 10,104,458 | $ 7,822,013 |
| Net realized gain (loss) | 60,089,271 | 71,646,065 |
| Net change in unrealized appreciation (depreciation) | (205,823,448) | 148,908,402 |
| Net increase (decrease) in net assets resulting from operations | (135,629,719) | 228,376,480 |
| Distributions to shareholders: | | |
| Class A | (73,904,222) | (31,498,716) |
| Investor Class | (11,530,594) | (6,212,150) |
| Class B | (2,637,375) | (1,465,424) |
| Class C | (2,609,494) | (1,469,549) |
| Class I | (800,931) | (489,405) |
| Class R1 (a) | (6,054) | (1,919) |
| Class R2 | (9,226) | (4,993) |
| Class R3 | (167,463) | (56,274) |
| SIMPLE Class | (191,425) | (16,390) |
| Total distributions to shareholders | (91,856,784) | (41,214,820) |
| Capital share transactions: | | |
| Net proceeds from sales of shares | 65,486,668 | 77,741,470 |
| Net asset value of shares issued to shareholders in reinvestment of distributions | 91,464,910 | 41,061,476 |
| Cost of shares redeemed | (102,221,841) | (124,117,592) |
| Increase (decrease) in net assets derived from capital share transactions | 54,729,737 | (5,314,646) |
| Net increase (decrease) in net assets | (172,756,766) | 181,847,014 |
| Net Assets |
| Beginning of year | 925,050,300 | 743,203,286 |
| End of year | $ 752,293,534 | $ 925,050,300 |
| (a) | Class R1 liquidated and no longer offered for sale as of April 28, 2022. |
The notes to the financial statements are an integral part of, and should be read in conjunction with, the financial statements.
| 52 | MainStay Growth Allocation Fund |
Financial Highlights selected per share data and ratios
| | Year Ended October 31, |
| Class A | 2022 | | 2021 | | 2020 | | 2019 | | 2018 |
| Net asset value at beginning of year | $ 17.89 | | $ 14.33 | | $ 14.40 | | $ 14.76 | | $ 15.96 |
| Net investment income (loss) (a) | 0.19 | | 0.16 | | 0.24 | | 0.22 | | 0.16 |
| Net realized and unrealized gain (loss) | (2.56) | | 4.22 | | 0.32 | | 0.77 | | (0.55) |
| Total from investment operations | (2.37) | | 4.38 | | 0.56 | | 0.99 | | (0.39) |
| Less distributions: | | | | | | | | | |
| From net investment income | (0.66) | | (0.17) | | (0.26) | | (0.28) | | (0.36) |
| From net realized gain on investments | (1.15) | | (0.65) | | (0.37) | | (1.07) | | (0.45) |
| Total distributions | (1.81) | | (0.82) | | (0.63) | | (1.35) | | (0.81) |
| Net asset value at end of year | $ 13.71 | | $ 17.89 | | $ 14.33 | | $ 14.40 | | $ 14.76 |
| Total investment return (b) | (14.90)% | | 31.45% | | 3.89% | | 8.17% | | (2.75)% |
| Ratios (to average net assets)/Supplemental Data: | | | | | | | | | |
| Net investment income (loss) | 1.30% | | 0.98% | | 1.69% | | 1.55% | | 1.02% |
| Net expenses (c) | 0.35% | | 0.35% | | 0.37% | | 0.37% | | 0.35% |
| Portfolio turnover rate | 25% | | 29% | | 47% | | 42% | | 47% |
| Net assets at end of year (in 000’s) | $ 603,691 | | $ 728,402 | | $ 542,938 | | $ 545,586 | | $ 484,182 |
| (a) | Per share data based on average shares outstanding during the year. |
| (b) | Total investment return is calculated exclusive of sales charges and assumes the reinvestment of dividends and distributions. For periods of less than one year, total return is not annualized. |
| (c) | In addition to the fees and expenses which the Fund bears directly, it also indirectly bears a pro-rata share of the fees and expenses of the underlying funds in which it invests. Such indirect expenses are not included in the above expense ratios. |
| | Year Ended October 31, |
| Investor Class | 2022 | | 2021 | | 2020 | | 2019 | | 2018 |
| Net asset value at beginning of year | $ 17.91 | | $ 14.33 | | $ 14.40 | | $ 14.76 | | $ 15.93 |
| Net investment income (loss) (a) | 0.17 | | 0.14 | | 0.21 | | 0.18 | | 0.14 |
| Net realized and unrealized gain (loss) | (2.58) | | 4.22 | | 0.32 | | 0.79 | | (0.55) |
| Total from investment operations | (2.41) | | 4.36 | | 0.53 | | 0.97 | | (0.41) |
| Less distributions: | | | | | | | | | |
| From net investment income | (0.62) | | (0.13) | | (0.23) | | (0.26) | | (0.31) |
| From net realized gain on investments | (1.15) | | (0.65) | | (0.37) | | (1.07) | | (0.45) |
| Total distributions | (1.77) | | (0.78) | | (0.60) | | (1.33) | | (0.76) |
| Net asset value at end of year | $ 13.73 | | $ 17.91 | | $ 14.33 | | $ 14.40 | | $ 14.76 |
| Total investment return (b) | (15.05)% | | 31.27% | | 3.70% | | 7.94% | | (2.86)% |
| Ratios (to average net assets)/Supplemental Data: | | | | | | | | | |
| Net investment income (loss) | 1.11% | | 0.82% | | 1.54% | | 1.32% | | 0.87% |
| Net expenses (c) | 0.55% | | 0.55% | | 0.55% | | 0.55% | | 0.52% |
| Expenses (before waiver/reimbursement) (c) | 0.60% | | 0.68% | | 0.67% | | 0.68% | | 0.61% |
| Portfolio turnover rate | 25% | | 29% | | 47% | | 42% | | 47% |
| Net assets at end of year (in 000's) | $ 99,449 | | $ 122,265 | | $ 126,514 | | $ 139,892 | | $ 110,200 |
| (a) | Per share data based on average shares outstanding during the year. |
| (b) | Total investment return is calculated exclusive of sales charges and assumes the reinvestment of dividends and distributions. For periods of less than one year, total return is not annualized. |
| (c) | In addition to the fees and expenses which the Fund bears directly, it also indirectly bears a pro-rata share of the fees and expenses of the underlying funds in which it invests. Such indirect expenses are not included in the above expense ratios. |
The notes to the financial statements are an integral part of, and should be read in conjunction with, the financial statements.
53
Financial Highlights selected per share data and ratios
| | Year Ended October 31, |
| Class B | 2022 | | 2021 | | 2020 | | 2019 | | 2018 |
| Net asset value at beginning of year | $ 17.59 | | $ 14.10 | | $ 14.16 | | $ 14.50 | | $ 15.66 |
| Net investment income (loss) (a) | 0.06 | | 0.02 | | 0.12 | | 0.10 | | 0.03 |
| Net realized and unrealized gain (loss) | (2.54) | | 4.14 | | 0.30 | | 0.76 | | (0.55) |
| Total from investment operations | (2.48) | | 4.16 | | 0.42 | | 0.86 | | (0.52) |
| Less distributions: | | | | | | | | | |
| From net investment income | (0.50) | | (0.02) | | (0.11) | | (0.13) | | (0.19) |
| From net realized gain on investments | (1.15) | | (0.65) | | (0.37) | | (1.07) | | (0.45) |
| Total distributions | (1.65) | | (0.67) | | (0.48) | | (1.20) | | (0.64) |
| Net asset value at end of year | $ 13.46 | | $ 17.59 | | $ 14.10 | | $ 14.16 | | $ 14.50 |
| Total investment return (b) | (15.70)% | | 30.24% | | 2.97% | | 7.14% | | (3.60)% |
| Ratios (to average net assets)/Supplemental Data: | | | | | | | | | |
| Net investment income (loss) | 0.37% | | 0.11% | | 0.87% | | 0.73% | | 0.18% |
| Net expenses (c) | 1.30% | | 1.30% | | 1.30% | | 1.30% | | 1.27% |
| Expenses (before waiver/reimbursement) (c) | 1.35% | | 1.43% | | 1.42% | | 1.42% | | 1.36% |
| Portfolio turnover rate | 25% | | 29% | | 47% | | 42% | | 47% |
| Net assets at end of year (in 000’s) | $ 16,753 | | $ 30,461 | | $ 32,739 | | $ 43,800 | | $ 55,493 |
| (a) | Per share data based on average shares outstanding during the year. |
| (b) | Total investment return is calculated exclusive of sales charges and assumes the reinvestment of dividends and distributions. For periods of less than one year, total return is not annualized. |
| (c) | In addition to the fees and expenses which the Fund bears directly, it also indirectly bears a pro-rata share of the fees and expenses of the underlying funds in which it invests. Such indirect expenses are not included in the above expense ratios. |
| | Year Ended October 31, |
| Class C | 2022 | | 2021 | | 2020 | | 2019 | | 2018 |
| Net asset value at beginning of year | $ 17.59 | | $ 14.10 | | $ 14.16 | | $ 14.50 | | $ 15.66 |
| Net investment income (loss) (a) | 0.05 | | 0.02 | | 0.11 | | 0.10 | | 0.02 |
| Net realized and unrealized gain (loss) | (2.53) | | 4.14 | | 0.31 | | 0.76 | | (0.54) |
| Total from investment operations | (2.48) | | 4.16 | | 0.42 | | 0.86 | | (0.52) |
| Less distributions: | | | | | | | | | |
| From net investment income | (0.50) | | (0.02) | | (0.11) | | (0.13) | | (0.19) |
| From net realized gain on investments | (1.15) | | (0.65) | | (0.37) | | (1.07) | | (0.45) |
| Total distributions | (1.65) | | (0.67) | | (0.48) | | (1.20) | | (0.64) |
| Net asset value at end of year | $ 13.46 | | $ 17.59 | | $ 14.10 | | $ 14.16 | | $ 14.50 |
| Total investment return (b) | (15.70)% | | 30.23% | | 2.97% | | 7.14% | | (3.60)% |
| Ratios (to average net assets)/Supplemental Data: | | | | | | | | | |
| Net investment income (loss) | 0.36% | | 0.09% | | 0.81% | | 0.76% | | 0.14% |
| Net expenses (c) | 1.30% | | 1.30% | | 1.30% | | 1.30% | | 1.27% |
| Expenses (before waiver/reimbursement) (c) | 1.35% | | 1.43% | | 1.42% | | 1.42% | | 1.36% |
| Portfolio turnover rate | 25% | | 29% | | 47% | | 42% | | 47% |
| Net assets at end of year (in 000’s) | $ 20,272 | | $ 29,440 | | $ 31,564 | | $ 36,721 | | $ 47,590 |
| (a) | Per share data based on average shares outstanding during the year. |
| (b) | Total investment return is calculated exclusive of sales charges and assumes the reinvestment of dividends and distributions. For periods of less than one year, total return is not annualized. |
| (c) | In addition to the fees and expenses which the Fund bears directly, it also indirectly bears a pro-rata share of the fees and expenses of the underlying funds in which it invests. Such indirect expenses are not included in the above expense ratios. |
The notes to the financial statements are an integral part of, and should be read in conjunction with, the financial statements.
| 54 | MainStay Growth Allocation Fund |
Financial Highlights selected per share data and ratios
| | Year Ended October 31, |
| Class I | 2022 | | 2021 | | 2020 | | 2019 | | 2018 |
| Net asset value at beginning of year | $ 18.15 | | $ 14.52 | | $ 14.58 | | $ 14.94 | | $ 16.14 |
| Net investment income (loss) (a) | 0.23 | | 0.21 | | 0.31 | | 0.25 | | 0.21 |
| Net realized and unrealized gain (loss) | (2.60) | | 4.27 | | 0.30 | | 0.78 | | (0.56) |
| Total from investment operations | (2.37) | | 4.48 | | 0.61 | | 1.03 | | (0.35) |
| Less distributions: | | | | | | | | | |
| From net investment income | (0.70) | | (0.20) | | (0.30) | | (0.32) | | (0.40) |
| From net realized gain on investments | (1.15) | | (0.65) | | (0.37) | | (1.07) | | (0.45) |
| Total distributions | (1.85) | | (0.85) | | (0.67) | | (1.39) | | (0.85) |
| Net asset value at end of year | $ 13.93 | | $ 18.15 | | $ 14.52 | | $ 14.58 | | $ 14.94 |
| Total investment return (b) | (14.68)% | | 31.82% | | 4.16% | | 8.40% | | (2.48)% |
| Ratios (to average net assets)/Supplemental Data: | | | | | | | | | |
| Net investment income (loss) | 1.51% | | 1.23% | | 2.18% | | 1.74% | | 1.32% |
| Net expenses (c) | 0.10% | | 0.10% | | 0.11% | | 0.13% | | 0.10% |
| Portfolio turnover rate | 25% | | 29% | | 47% | | 42% | | 47% |
| Net assets at end of year (in 000’s) | $ 7,974 | | $ 11,142 | | $ 8,063 | | $ 11,037 | | $ 8,129 |
| (a) | Per share data based on average shares outstanding during the year. |
| (b) | Total investment return is calculated exclusive of sales charges and assumes the reinvestment of dividends and distributions. Class I shares are not subject to sales charges. For periods of less than one year, total return is not annualized. |
| (c) | In addition to the fees and expenses which the Fund bears directly, it also indirectly bears a pro-rata share of the fees and expenses of the underlying funds in which it invests. Such indirect expenses are not included in the above expense ratios. |
| | Year Ended October 31, | | June 14, 2019^ through
October 31,
2019 |
| Class R2 | 2022 | | 2021 | | 2020 | |
| Net asset value at beginning of period | $ 17.88 | | $ 14.32 | | $ 14.40 | | $ 13.82 |
| Net investment income (loss) (a) | 0.18 | | 0.15 | | 0.25 | | 0.04 |
| Net realized and unrealized gain (loss) | (2.57) | | 4.21 | | 0.29 | | 0.54 |
| Total from investment operations | (2.39) | | 4.36 | | 0.54 | | 0.58 |
| Less distributions: | | | | | | | |
| From net investment income | (0.64) | | (0.15) | | (0.25) | | — |
| From net realized gain on investments | (1.15) | | (0.65) | | (0.37) | | — |
| Total distributions | (1.79) | | (0.80) | | (0.62) | | — |
| Net asset value at end of period | $ 13.70 | | $ 17.88 | | $ 14.32 | | $ 14.40 |
| Total investment return (b) | (14.99)% | | 31.34% | | 3.75% | | 4.20% |
| Ratios (to average net assets)/Supplemental Data: | | | | | | | |
| Net investment income (loss) | 1.20% | | 0.90% | | 1.79% | | 0.68%†† |
| Net expenses (c) | 0.45% | | 0.45% | | 0.47% | | 0.49%†† |
| Portfolio turnover rate | 25% | | 29% | | 47% | | 42% |
| Net assets at end of period (in 000’s) | $ 78 | | $ 92 | | $ 89 | | $ 130 |
| ^ | Inception date. |
| †† | Annualized. |
| (a) | Per share data based on average shares outstanding during the period. |
| (b) | Total investment return is calculated exclusive of sales charges and assumes the reinvestment of dividends and distributions. Class R2 shares are not subject to sales charges. For periods of less than one year, total return is not annualized. |
| (c) | In addition to the fees and expenses which the Fund bears directly, it also indirectly bears a pro-rata share of the fees and expenses of the underlying funds in which it invests. Such indirect expenses are not included in the above expense ratios. |
The notes to the financial statements are an integral part of, and should be read in conjunction with, the financial statements.
55
Financial Highlights selected per share data and ratios
| | Year Ended October 31, |
| Class R3 | 2022 | | 2021 | | 2020 | | 2019 | | 2018 |
| Net asset value at beginning of year | $ 17.78 | | $ 14.24 | | $ 14.33 | | $ 14.68 | | $ 15.90 |
| Net investment income (loss) (a) | 0.15 | | 0.10 | | 0.20 | | 0.12 | | 0.06 |
| Net realized and unrealized gain (loss) | (2.56) | | 4.20 | | 0.31 | | 0.83 | | (0.49) |
| Total from investment operations | (2.41) | | 4.30 | | 0.51 | | 0.95 | | (0.43) |
| Less distributions: | | | | | | | | | |
| From net investment income | (0.60) | | (0.11) | | (0.23) | | (0.23) | | (0.34) |
| From net realized gain on investments | (1.15) | | (0.65) | | (0.37) | | (1.07) | | (0.45) |
| Total distributions | (1.75) | | (0.76) | | (0.60) | | (1.30) | | (0.79) |
| Net asset value at end of year | $ 13.62 | | $ 17.78 | | $ 14.24 | | $ 14.33 | | $ 14.68 |
| Total investment return (b) | (15.18)% | | 30.99% | | 3.53% | | 7.81% | | (3.04)% |
| Ratios (to average net assets)/Supplemental Data: | | | | | | | | | |
| Net investment income (loss) | 1.00% | | 0.60% | | 1.43% | | 0.90% | | 0.38% |
| Net expenses (c) | 0.70% | | 0.70% | | 0.72% | | 0.73% | | 0.70% |
| Portfolio turnover rate | 25% | | 29% | | 47% | | 42% | | 47% |
| Net assets at end of year (in 000’s) | $ 1,004 | | $ 1,622 | | $ 1,084 | | $ 1,262 | | $ 449 |
| (a) | Per share data based on average shares outstanding during the year. |
| (b) | Total investment return is calculated exclusive of sales charges and assumes the reinvestment of dividends and distributions. Class R3 shares are not subject to sales charges. For periods of less than one year, total return is not annualized. |
| (c) | In addition to the fees and expenses which the Fund bears directly, it also indirectly bears a pro-rata share of the fees and expenses of the underlying funds in which it invests. Such indirect expenses are not included in the above expense ratios. |
| | Year Ended October 31, | | August 31, 2020^ through
October 31, |
| SIMPLE Class | 2022 | | 2021 | | 2020 |
| Net asset value at beginning of period | $ 17.89 | | $ 14.33 | | $ 15.03* |
| Net investment income (loss) (a) | 0.12 | | 0.06 | | 0.02 |
| Net realized and unrealized gain (loss) | (2.57) | | 4.25 | | (0.72) |
| Total from investment operations | (2.45) | | 4.31 | | (0.70) |
| Less distributions: | | | | | |
| From net investment income | (0.58) | | (0.10) | | — |
| From net realized gain on investments | (1.15) | | (0.65) | | — |
| Total distributions | (1.73) | | (0.75) | | — |
| Net asset value at end of period | $ 13.71 | | $ 17.89 | | $ 14.33 |
| Total investment return (b) | (15.29)% | | 30.89% | | (4.66)% |
| Ratios (to average net assets)/Supplemental Data: | | | | | |
| Net investment income (loss) | 0.79% | | 0.37% | | 0.80%†† |
| Net expenses (c) | 0.80% | | 0.80% | | 0.80%†† |
| Expenses (before waiver/reimbursement) (c) | 0.85% | | 0.93% | | 0.95%†† |
| Portfolio turnover rate | 25% | | 29% | | 47% |
| Net assets at end of period (in 000’s) | $ 3,072 | | $ 1,567 | | $ 180 |
| ^ | Inception date. |
| * | Based on the net asset value of Investor Class as of August 31, 2020. |
| †† | Annualized. |
| (a) | Per share data based on average shares outstanding during the period. |
| (b) | Total investment return is calculated exclusive of sales charges and assumes the reinvestment of dividends and distributions. SIMPLE Class shares are not subject to sales charges. For periods of less than one year, total return is not annualized. |
| (c) | In addition to the fees and expenses which the Fund bears directly, it also indirectly bears a pro-rata share of the fees and expenses of the underlying funds in which it invests. Such indirect expenses are not included in the above expense ratios. |
The notes to the financial statements are an integral part of, and should be read in conjunction with, the financial statements.
| 56 | MainStay Growth Allocation Fund |
MainStay Equity Allocation Fund
Investment and Performance Comparison (Unaudited)
Performance data quoted represents past performance. Past performance is no guarantee of future results. Because of market volatility and other factors, current performance may be lower or higher than the figures shown. Investment return and principal value will fluctuate, and as a result, when shares are redeemed, they may be worth more or less than their original cost. The graph below depicts the historical performance of Class I shares of the Fund. Performance will vary from class to class based on differences in class-specific expenses and sales charges. For performance information current to the most recent month-end, please call 800-624-6782 or visit newyorklifeinvestments.com.
The performance table and graph do not reflect the deduction of taxes that a shareholder would pay on distributions or Fund share redemptions. Total returns reflect maximum applicable sales charges as indicated in the table below, if any, changes in share price, and reinvestment of dividend and capital gain distributions. The graph assumes the initial investment amount shown below and reflects the deduction of all sales charges that would have applied for the period of investment. Performance figures may reflect certain fee waivers and/or expense limitations, without which total returns may have been lower. For more information on share classes and current fee waivers and/or expense limitations (if any), please refer to the Notes to Financial Statements.

| Average Annual Total Returns for the Year-Ended October 31, 2022 |
| Class | Sales Charge | | Inception
Date | One
Year | Five
Years | Ten Years
or Since
Inception | Gross
Expense
Ratio1 |
| Class A Shares2 | Maximum 3% Initial Sales Charge | With sales charges | 4/4/2005 | -20.04% | 3.52% | 7.54% | 0.94% |
| | | Excluding sales charges | | -17.56 | 4.69 | 8.15 | 0.94 |
| Investor Class Shares2, 3 | Maximum 2.5% Initial Sales Charge | With sales charges | 2/28/2008 | -19.78 | 3.33 | 7.36 | 1.27 |
| | | Excluding sales charges | | -17.72 | 4.51 | 7.97 | 1.27 |
| Class B Shares4 | Maximum 5% CDSC | With sales charges | 4/4/2005 | -22.00 | 3.43 | 7.18 | 2.02 |
| | if Redeemed Within the First Six Years of Purchase | Excluding sales charges | | -18.36 | 3.73 | 7.18 | 2.02 |
| Class C Shares | Maximum 1% CDSC | With sales charges | 4/4/2005 | -19.10 | 3.73 | 7.17 | 2.02 |
| | if Redeemed Within One Year of Purchase | Excluding sales charges | | -18.37 | 3.73 | 7.17 | 2.02 |
| Class I Shares | No Sales Charge | | 4/4/2005 | -17.35 | 4.94 | 8.42 | 0.69 |
| Class R3 Shares | No Sales Charge | | 2/29/2016 | -17.91 | 4.31 | 8.04 | 1.29 |
| SIMPLE Class Shares | No Sales Charge | | 8/31/2020 | -17.91 | N/A | 3.60 | 1.52 |
| 1. | The gross expense ratios presented reflect the Fund’s “Total Annual Fund Operating Expenses” from the most recent Prospectus, as supplemented, and may differ from other expense ratios disclosed in this report. |
| 2. | Prior to July 22, 2019, the maximum initial sales charge was 5.5%, which is reflected in the applicable average annual total return figures shown. |
| 3. | Prior to June 30, 2020, the maximum initial sales charge was 3%, which is reflected in the applicable average annual total return figures shown. |
| 4. | Class B shares are closed to all new purchases as well as additional investments by existing Class B shareholders. |
The footnotes on the next page are an integral part of the table and graph and should be carefully read in conjunction with them.
| Benchmark Performance* | One
Year | Five
Years | Ten
Years |
| S&P 500® Index1 | -14.61% | 10.44% | 12.79% |
| MSCI EAFE® Index (Net)2 | -23.00 | -0.09 | 4.13 |
| Equity Allocation Composite Index3 | -16.75 | 7.77 | 10.63 |
| Morningstar Allocation-85%+ Equity Category Average4 | -20.09 | 4.46 | 7.75 |
| * | Returns for indices reflect no deductions for fees, expenses or taxes, except for foreign withholding taxes where applicable. Results assume reinvestment of all dividends and capital gains. An investment cannot be made directly in an index. |
| 1. | The S&P 500® Index is the Fund's primary benchmark. S&P 500® is a trademark of The McGraw-Hill Companies, Inc. The S&P 500® Index is widely regarded as the standard index for measuring large-cap U.S. stock market performance. |
| 2. | The MSCI EAFE® Index (Net) is the Fund's secondary benchmark. The MSCI EAFE® Index (Net) consists of international stocks representing the developed world outside of North America. |
| 3. | The Fund has selected the Equity Allocation Composite Index as an additional benchmark. Effective February 28, 2014, the Equity Allocation Composite Index consists of the S&P 500®Index and the MSCI EAFE® Index weighted 75% and 25%, respectively. Prior to February 28, 2014, the Equity Allocation Composite Index consisted of the S&P 500® Index and the MSCI EAFE® Index weighted 80% and 20%, respectively. |
| 4. | The Morningstar Allocation – 85%+ Equity Category Average is representative of funds that seek to provide both income and capital appreciation by investing in multiple asset classes, including stocks, bonds, and cash. These portfolios are dominated by domestic holdings and have equity exposures of over 85%. These funds typically allocate at least 10% to equities of foreign companies and do not exclusively allocate between cash and equities. Results are based on average total returns of similar funds with all dividends and capital gain distributions reinvested. |
The footnotes on the preceding page are an integral part of the table and graph and should be carefully read in conjunction with them.
| 58 | MainStay Equity Allocation Fund |
Cost in Dollars of a $1,000 Investment in MainStay Equity Allocation Fund (Unaudited)
The example below is intended to describe the fees and expenses borne by shareholders during the six-month period from May 1, 2022 to October 31, 2022, and the impact of those costs on your investment.
Example
As a shareholder of the Fund you incur two types of costs: (1) transaction costs, including exchange fees and sales charges (loads) on purchases (as applicable), and (2) ongoing costs, including management fees, distribution and/or service (12b-1) fees and other Fund expenses (as applicable). This example is intended to help you understand your ongoing costs (in dollars) of investing in the Fund and to compare these costs with the ongoing costs of investing in other mutual funds. The example is based on an investment of $1,000 made at the beginning of the six-month period and held for the entire period from May 1, 2022 to October 31, 2022.
This example illustrates your Fund’s ongoing costs in two ways:
Actual Expenses
The second and third data columns in the table below provide information about actual account values and actual expenses. You may use the information in these columns, together with the amount you invested, to estimate the expenses that you paid during the six months ended October 31, 2022. Simply divide your account value by $1,000 (for example, an
$8,600 account value divided by $1,000 = 8.6), then multiply the result by the number under the heading entitled “Expenses Paid During Period” to estimate the expenses you paid on your account during this period.
Hypothetical Example for Comparison Purposes
The fourth and fifth data columns in the table below provide information about hypothetical account values and hypothetical expenses based on the Fund’s actual expense ratio and an assumed rate of return of 5% per year before expenses, which is not the Fund’s actual return. The hypothetical account values and expenses may not be used to estimate the actual ending account balances or expenses you paid for the six-month period shown. You may use this information to compare the ongoing costs of investing in the Fund with the ongoing costs of investing in other mutual funds. To do so, compare this 5% hypothetical example with the 5% hypothetical examples that appear in the shareholder reports of the other mutual funds.
Please note that the expenses shown in the table are meant to highlight your ongoing costs only and do not reflect any transactional costs, such as exchange fees or sales charges (loads). Therefore, the fourth and fifth data columns of the table are useful in comparing ongoing costs only and will not help you determine the relative total costs of owning different funds. In addition, if these transactional costs were included, your costs would have been higher.
| Share Class | Beginning
Account
Value
5/1/22 | Ending Account
Value (Based
on Actual
Returns and
Expenses)
10/31/22 | Expenses
Paid
During
Period1 | Ending Account
Value (Based
on Hypothetical
5% Annualized
Return and
Actual Expenses)
10/31/22 | Expenses
Paid
During
Period1 | Net Expense
Ratio
During
Period2 |
| Class A Shares | $1,000.00 | $936.70 | $1.85 | $1,023.29 | $1.94 | 0.38% |
| Investor Class Shares | $1,000.00 | $935.40 | $2.68 | $1,022.43 | $2.80 | 0.55% |
| Class B Shares | $1,000.00 | $931.60 | $6.33 | $1,018.65 | $6.61 | 1.30% |
| Class C Shares | $1,000.00 | $931.80 | $6.33 | $1,018.65 | $6.61 | 1.30% |
| Class I Shares | $1,000.00 | $937.50 | $0.63 | $1,024.55 | $0.66 | 0.13% |
| Class R3 Shares | $1,000.00 | $934.20 | $3.56 | $1,021.53 | $3.72 | 0.73% |
| SIMPLE Class Shares | $1,000.00 | $934.10 | $3.90 | $1,021.17 | $4.08 | 0.80% |
| 1. | Expenses are equal to the Fund’s annualized expense ratio of each class multiplied by the average account value over the period, divided by 365 and multiplied by 184 (to reflect the six-month period). The table above represents the actual expenses incurred during the six-month period. In addition to the fees and expenses which the Fund bears directly, it also indirectly bears a pro rata share of the fees and expenses of the underlying funds in which it invests. Such indirect expenses are not included in the above-reported expense figures. |
| 2. | Expenses are equal to the Fund's annualized expense ratio to reflect the six-month period. |
Asset Diversification as of October 31, 2022 (Unaudited)
| Equity Funds | 95.8% |
| Short-Term Investment | 3.7 |
| Other Assets, Less Liabilities | 0.5 |
See Portfolio of Investments beginning on page 63 for specific holdings within these categories. The Fund’s holdings are subject to change.
| 60 | MainStay Equity Allocation Fund |
Portfolio Management Discussion and Analysis (Unaudited)
Questions answered by portfolio managers Jae S. Yoon, CFA, Jonathan Swaney, Poul Kristensen, CFA, and Amit Soni, CFA, of New York Life Investment Management LLC, the Fund’s Manager.
How did MainStay Equity Allocation Fund perform relative to its benchmarks and peer group during the 12 months ended October 31, 2022?
For the 12 months ended October 31, 2022, Class I shares of MainStay Equity Allocation Fund returned −17.35%, underperforming the −14.61% return of the Fund’s primary benchmark, the S&P 500® Index (the "Index") and outperforming the −23.00% return of the MSCI EAFE® Index (Net), which is the Fund’s secondary benchmark. Over the same period, Class I shares of the Fund underperformed the −16.75% return of the Equity Allocation Composite Index, which is an additional benchmark of the Fund, and outperformed the −20.09% return of the Morningstar Allocation -85%+ Equity Category Average.1
What factors affected the Fund’s relative performance during the reporting period?
The Fund is a “fund of funds,” meaning that it seeks to achieve its investment objective by investing in mutual funds and exchange-traded funds (“ETFs”) managed by New York Life Investments or its affiliates (the “Underlying Funds”). The Fund invests, under normal circumstances, at least 80% of its assets (net assets plus any borrowings for investment purposes) in Underlying Equity Funds. The Underlying Funds may invest in U.S. equities and international equities, making comparisons to any single index generally less suitable than a weighted combination of indices, which is a more useful yardstick by which to measure performance. The most influential factor affecting returns for the Fund during the reporting period (versus the performance of a weighted combination of indices) is the net performance of the Underlying Funds themselves, relative to their respective benchmarks. During the reporting period, asset class policy was the primary determinant of the Fund's relative performance.
Fund management internally maintains a blend of indices that are taken into consideration when managing the Fund. During the reporting period, the Fund outperformed this internally maintained blend of indices, primarily due to active positioning at the asset class level.
The Fund’s outperformance was driven by a preference for value over growth, with specific focus on energy companies and defensive sectors that the markets rewarded. Conditions also favored the Fund’s skew toward profitable small-cap companies. The performance of the Underlying Funds relative to their benchmarks produced mixed results, but provided a marginally positive contribution to the Fund’s performance in aggregate. (Contributions take weightings and total returns into account.)
During the reporting period, how was the Fund’s performance materially affected by investments in derivatives?
Total return swaps were used to express most of the Fund’s asset class policy views. Therefore, the swaps can be seen as enhancing the Fund’s relative performance over the course of the reporting period.
How did you allocate the Fund’s assets during the reporting period and why?
Equity style: In the same way that inflation is threatening to long-duration2 bonds, equities with values disproportionately reflected in more distant cash flows (i.e., growth stocks with high prices relative to current earnings) are likewise vulnerable. Accordingly, we tilted the Fund to emphasize value stocks that offered more attractive near-term cash flows, placing particular focus on more defensive sectors: real estate, utilities, consumer staples and (most of all) health care. The combined effect was a positive contribution to return of approximately 0.5%.
Equity size: Small-company stocks were more heavily owned in the Fund than in the Index. The thesis behind this positioning was based on attractive valuations, insulation from economic weakness abroad, less sensitivity to dollar strength and disproportionate exposure to domestic demand, which remained healthy. The Fund’s active position in small-cap companies contributed modestly to relative performance.
Geographic exposure: Prior to Russia’s invasion of Ukraine, the Fund’s geographic exposure reflected our positive expectations for non-U.S. developed markets generally, and Europe in particular, based on attractive valuations and the post-COVID-19 cyclical recovery we saw coming. Accordingly, we tilted the Fund in that direction. War, sanctions, soaring local energy prices and looming recession changed the underlying picture. We responded by unwinding the Fund’s position, eventually resetting international exposure to an underweight position, but not before relative performance was slightly diminished.
Energy: The Fund maintained exposure to upstream energy producers as a commodity play to provide an additional inflation hedge. These holdings also positioned the Fund to take advantage of opportunities for domestic producers to benefit as Western nations revisit energy policy to source supplies from stable and friendly jurisdictions, rather than autocratic petrostates that present national security risks. While the Fund’s position was small, it had a disproportionately positive impact on performance as oil and gas prices soared.
| 1. | See page 57 for other share class returns, which may be higher or lower than Class I share returns. See page 58 for more information on benchmark and peer group returns. |
| 2. | Duration is a measure of the price sensitivity of a fixed-income investment to changes in interest rates. Duration is expressed as a number of years and is considered a more accurate sensitivity gauge than average maturity. |
How did the Fund’s allocations change over the course of the reporting period?
We made only slight adjustments to Underlying Fund holdings. The Fund’s positioning is most often implemented through the use of derivatives, specifically total return swaps. The use of swaps to reduce exposure to non-U.S. developed markets during the reporting period, as discussed above, is a good example. Similarly, exposure to defensive sectors and energy producers was realized by swapping into the return stream on specific ETFs, including Invesco S&P Low Volatility ETF, SPDR S&P Oil & Gas Exploration ETF and VanEck Oil Services ETF.
During the reporting period, which Underlying Funds had the highest total returns and which had the lowest total returns?
Among Underlying Funds, the top-performing investments involved swaps that had been in place for only part of the reporting period. Exposure to energy companies, the health care industry and low volatility stocks enjoyed the highest returns. Among the Underlying Funds held for the entire reporting period, the highest returns came from MainStay WMC Value Fund, MainStay Epoch U.S. Equity Yield Fund and IQ Chaikin U.S. Small Cap ETF. At the other end of the spectrum, performance proved notably weak for MainStay Candriam Emerging Markets Equity Fund, MainStay MacKay International Equity Fund and MainStay WMC Growth Fund.
Which Underlying Funds were the strongest positive contributors to the Fund’s performance and which Underlying Funds were particularly weak?
While none of the Underlying Funds held for the entire reporting period contributed positively to the Fund’s performance, those producing the smallest negative contributions included MainStay Epoch U.S. Equity Yield Fund, MainStay Epoch Capital Growth Fund and MainStay WMC Value Fund. Extending the analysis to include investments accessed via derivatives, SPDR S&P Oil & Gas Exploration ETF, VanEck Oil Services ETF and S&P 500 Healthcare sector all produced positive contributions to return. The Underlying Funds that detracted the most from the Fund’s performance were MainStay Winslow Large Cap Growth Fund, MainStay WMC Growth Fund and MainStay Candriam Emerging Markets Equity Fund.
How was the Fund positioned at the end of the reporting period?
The bias we expect to have the largest impact on active return is our preference for small- and mid-cap stocks. We believe that the large-cap space is potentially vulnerable to economic weakness
abroad, a strong U.S. dollar, rich valuations and concentration in a relatively short list of very large companies (mega-cap technology). Smaller companies, in contrast, cater primarily to what we view as a financially healthy domestic clientele and have historically been more successful than larger companies in protecting real earnings amid high inflation.
Likewise, the Fund’s emphasis on value stocks over growth stocks remains intact, with a particular emphasis on what we perceive to be the defensive “RUSH” sectors: real estate, utilities, consumer staples and health care. The thesis rests primarily on the idea that inflation will prove persistent and jeopardize the high price multiples paid on fast-growing companies with current valuations that depend on distant earnings. We are also mindful of the economy’s progression in the business cycle and the possibility that a recession may not be far away.
The Fund also maintains a position in energy sector firms, as we envision sustained supply constraints keeping commodity prices elevated, thus preserving meaty profit margins for several years to come.
The opinions expressed are those of the portfolio managers as of the date of this report and are subject to change. There is no guarantee that any forecasts will come to pass. This material does not constitute investment advice and is not intended as an endorsement of any specific investment.
| 62 | MainStay Equity Allocation Fund |
Portfolio of Investments October 31, 2022†
| | Shares | Value |
| Affiliated Investment Companies 95.8% |
| Equity Funds 95.8% |
| IQ 500 International ETF (a) | 596,439 | $ 15,453,735 |
| IQ Candriam ESG International Equity ETF (a) | 687,733 | 15,409,621 |
| IQ Candriam ESG U.S. Large Cap Equity ETF (a) | 970,029 | 31,826,652 |
| IQ Chaikin U.S. Large Cap ETF (a) | 958,355 | 29,891,092 |
| IQ Chaikin U.S. Small Cap ETF (a) | 888,105 | 28,987,747 |
| IQ FTSE International Equity Currency Neutral ETF | 380,042 | 7,750,501 |
| IQ Winslow Large Cap Growth ETF (a)(b) | 54,564 | 1,389,183 |
| MainStay Candriam Emerging Markets Equity Fund Class R6 (a) | 2,177,255 | 18,021,792 |
| MainStay Epoch Capital Growth Fund Class I | 130,251 | 1,366,185 |
| MainStay Epoch International Choice Fund Class I (a) | 412,562 | 12,913,490 |
| MainStay Epoch U.S. Equity Yield Fund Class R6 (a) | 1,612,450 | 30,622,036 |
| MainStay MacKay International Equity Fund Class R6 (a) | 886,452 | 12,409,891 |
| MainStay S&P 500 Index Fund Class I | 118,272 | 5,863,641 |
| MainStay Winslow Large Cap Growth Fund Class R6 | 3,220,649 | 30,181,992 |
| MainStay WMC Enduring Capital Fund Class R6 (a) | 965,766 | 29,202,355 |
| MainStay WMC Growth Fund Class R6 (a) | 999,968 | 31,219,409 |
| MainStay WMC International Research Equity Fund Class I (a) | 2,127,601 | 12,656,673 |
| | Shares | | Value |
| |
| Equity Funds (continued) |
| MainStay WMC Small Companies Fund Class I (a) | 1,295,853 | | $ 29,058,732 |
| MainStay WMC Value Fund Class R6 (a) | 995,993 | | 30,075,001 |
Total Affiliated Investment Companies
(Cost $362,752,975) | | | 374,299,728 |
| Short-Term Investment 3.7% |
| Affiliated Investment Company 3.7% |
| MainStay U.S. Government Liquidity Fund, 2.905% (c) | 14,588,056 | | 14,588,056 |
Total Short-Term Investment
(Cost $14,588,056) | 3.7% | | 14,588,056 |
Total Investments
(Cost $377,341,031) | 99.5% | | 388,887,784 |
| Other Assets, Less Liabilities | 0.5 | | 2,010,735 |
| Net Assets | 100.0% | | $ 390,898,519 |
| † | Percentages indicated are based on Fund net assets. |
| (a) | As of October 31, 2022, the Fund's ownership exceeds 5% of the outstanding shares of the Underlying Fund's share class. |
| (b) | Non-income producing security. |
| (c) | Current yield as of October 31, 2022. |
The notes to the financial statements are an integral part of, and should be read in conjunction with, the financial statements.
63
Portfolio of Investments October 31, 2022† (continued)
Investments in Affiliates (in 000's)
Investments in issuers considered to be affiliate(s) of the Fund during the year ended October 31, 2022 for purposes of Section 2(a)(3) of the Investment Company Act of 1940, as amended, were as follows:
| Affiliated Investment Companies | Value,
Beginning
of Year | Purchases
at Cost | Proceeds
from
Sales | Net
Realized
Gain/(Loss)
on Sales | Change in
Unrealized
Appreciation/
(Depreciation) | Value,
End of
Year | Dividend
Income | Other
Distributions | Shares
End of
Year |
| IQ 500 International ETF | $ 20,659 | $ 2,055 | $ (3,192) | $ 165 | $ (4,233) | $ 15,454 | $ 702 | $ — | 596 |
| IQ Candriam ESG International Equity ETF | 20,184 | 1,800 | (1,465) | (132) | (4,977) | 15,410 | 557 | — | 688 |
| IQ Candriam ESG U.S. Large Cap Equity ETF | 45,944 | 1,614 | (8,457) | 884 | (8,158) | 31,827 | 469 | — | 970 |
| IQ Chaikin U.S. Large Cap ETF | 31,234 | 4,432 | (1,892) | (350) | (3,533) | 29,891 | 423 | — | 958 |
| IQ Chaikin U.S. Small Cap ETF | 26,204 | 6,039 | (425) | (47) | (2,783) | 28,988 | 354 | — | 888 |
| IQ FTSE International Equity Currency Neutral ETF | 9,607 | 516 | (625) | (62) | (1,685) | 7,751 | 275 | — | 380 |
| IQ Winslow Large Cap Growth ETF | — | 1,503 | — | — | (114) | 1,389 | — | — | 55 |
| MainStay Candriam Emerging Markets Equity Fund Class R6 | 23,328 | 4,978 | (1,165) | (297) | (8,822) | 18,022 | 209 | — | 2,177 |
| MainStay Epoch Capital Growth Fund Class I | 1,805 | 471 | (141) | (25) | (744) | 1,366 | 2 | 402 | 130 |
| MainStay Epoch International Choice Fund Class I | 16,037 | 1,987 | (1,102) | (111) | (3,898) | 12,913 | 410 | — | 413 |
| MainStay Epoch U.S. Equity Yield Fund Class R6 | 35,655 | 1,100 | (4,600) | (5) | (1,528) | 30,622 | 709 | — | 1,612 |
| MainStay MacKay International Equity Fund Class R6 | 14,977 | 5,664 | (817) | (361) | (7,053) | 12,410 | 57 | 1,852 | 886 |
| MainStay S&P 500 Index Fund Class I (a) | 35,121 | 1,786 | (27,355) | 6,432 | (10,120) | 5,864 | 380 | 1,209 | 118 |
| MainStay U.S. Government Liquidity Fund | 17,193 | 42,250 | (44,855) | — | — | 14,588 | 111 | — | 14,588 |
| MainStay Winslow Large Cap Growth Fund Class R6 | 46,321 | 14,240 | (8,151) | (1,166) | (21,062) | 30,182 | — | 8,567 | 3,221 |
| MainStay WMC Enduring Capital Fund Class R6 | 28,553 | 9,287 | (2,507) | (453) | (5,678) | 29,202 | 95 | 2,339 | 966 |
| MainStay WMC Growth Fund Class R6 | 38,251 | 17,298 | (2,895) | (2,033) | (19,403) | 31,218 | — | 7,636 | 1,000 |
| MainStay WMC International Research Equity Fund Class I | 15,897 | 1,904 | (578) | (70) | (4,496) | 12,657 | 419 | — | 2,128 |
| MainStay WMC Small Companies Fund Class I | 26,834 | 12,426 | — | — | (10,201) | 29,059 | — | 6,163 | 1,296 |
| MainStay WMC Value Fund Class R6 | 36,016 | 16,335 | (5,202) | (42) | (17,032) | 30,075 | 338 | 15,933 | 996 |
| | $ 489,820 | $147,685 | $(115,424) | $ 2,327 | $(135,520) | $ 388,888 | $5,510 | $44,101 | |
| | |
| (a) | Prior to February 28, 2022, known as MainStay MacKay S&P 500 Index Fund Class I. |
Swap Contracts
Open OTC total return equity swap contracts as of October 31, 2022 were as follows:
Swap
Counterparty | Reference Obligation | Floating Rate2 | Termination
Date(s) | Payment
Frequency
Paid/
Received | Notional
Amount
Long/
(Short)
(000)3 | Unrealized
Appreciation/
(Depreciation)4 |
| Citibank NA | Invesco S&P 500 Low Volatility ETF | 1 day FEDF plus 0.45% | 12/2/22 | Daily | 9,015 | $ — |
| Citibank NA | iShares MSCI EAFE ETF | 1 day FEDF minus 1.25% | 12/2/22 | Daily | (11,655) | — |
| Citibank NA | iShares Semiconductor ETF | 1 day FEDF plus 0.35% | 12/2/22 | Daily | 1,788 | — |
| Citibank NA | Russell 1000 Growth Total Return Index | 1 day FEDF minus 0.20% | 12/2/22 | Daily | (5,737) | — |
| Citibank NA | Russell Midcap Total Return Index | 1 day FEDF plus 0.40% | 12/2/22 | Daily | 7,072 | — |
| Citibank NA | S&P 500 Health Care Sector | 1 day FEDF plus 0.45% | 12/2/22 | Daily | 6,997 | — |
| Citibank NA | S&P 500 Total Return Index | 1 day FEDF minus 0.10% | 12/2/22 | Daily | (1,331) | — |
| Citibank NA | S&P 600 Total Return | 1 day FEDF plus 0.40% | 12/2/22 | Daily | 8,223 | — |
| Citibank NA | SPDR S&P Oil & Gas Exploration & Production ETF | 1 day FEDF plus 0.40% | 12/2/22 | Daily | 2,001 | — |
The notes to the financial statements are an integral part of, and should be read in conjunction with, the financial statements.
| 64 | MainStay Equity Allocation Fund |
Swap
Counterparty | Reference Obligation | Floating Rate2 | Termination
Date(s) | Payment
Frequency
Paid/
Received | Notional
Amount
Long/
(Short)
(000)3 | Unrealized
Appreciation/
(Depreciation)4 |
| Citibank NA | VanEck Gold Miners ETF | 1 day FEDF plus 0.55% | 12/2/22 | Daily | 1,804 | $ — |
| Citibank NA | VanEck Oil Services ETF | 1 day FEDF plus 0.40% | 12/2/22 | Daily | 2,399 | — |
| Citibank NA | Vanguard FTSE Europe ETF | 1 day FEDF minus 2.75% | 12/2/22 | Daily | (3,983) | — |
| | | | | | | $ — |
| 1. | As of October 31, 2022, cash in the amount $0 was pledged from brokers for OTC swap contracts. |
| 2. | Fund pays the floating rate and receives the total return of the reference entity. |
| 3. | Notional amounts reflected as a positive value indicate a long position held by the Fund or Index and a negative value indicates a short position. |
| 4. | Reflects the value at reset date as of October 31, 2022. |
| Abbreviation(s): |
| EAFE—Europe, Australasia and Far East |
| ETF—Exchange-Traded Fund |
| FEDF—Federal Funds Rate |
| FTSE—Financial Times Stock Exchange |
| MSCI—Morgan Stanley Capital International |
| SPDR—Standard & Poor’s Depositary Receipt |
The following is a summary of the fair valuations according to the inputs used as of October 31, 2022, for valuing the Fund’s assets:
| Description | Quoted
Prices in
Active
Markets for
Identical
Assets
(Level 1) | | Significant
Other
Observable
Inputs
(Level 2) | | Significant
Unobservable
Inputs
(Level 3) | | Total |
| Asset Valuation Inputs | | | | | | | |
| Investments in Securities (a) | | | | | | | |
| Affiliated Investment Companies | | | | | | | |
| Equity Funds | $ 374,299,728 | | $ — | | $ — | | $ 374,299,728 |
| Short-Term Investment | | | | | | | |
| Affiliated Investment Company | 14,588,056 | | — | | — | | 14,588,056 |
| Total Investments in Securities | $ 388,887,784 | | $ — | | $ — | | $ 388,887,784 |
| (a) | For a complete listing of investments, see the Portfolio of Investments. |
The notes to the financial statements are an integral part of, and should be read in conjunction with, the financial statements.
65
Statement of Assets and Liabilities as of October 31, 2022
| Assets |
Investment in affiliated investment companies, at value
(identified cost $377,341,031) | $388,887,784 |
| Cash | 72 |
| Receivables: | |
| Dividends and interest on OTC swaps contracts | 2,423,718 |
| Fund shares sold | 117,058 |
| Interest | 29,059 |
| Manager (See Note 3) | 10,125 |
| Other assets | 38,401 |
| Total assets | 391,506,217 |
| Liabilities |
| Payables: | |
| Fund shares redeemed | 361,492 |
| Transfer agent (See Note 3) | 107,624 |
| NYLIFE Distributors (See Note 3) | 92,225 |
| Shareholder communication | 24,496 |
| Professional fees | 9,066 |
| Custodian | 5,231 |
| Accrued expenses | 7,564 |
| Total liabilities | 607,698 |
| Net assets | $390,898,519 |
| Composition of Net Assets |
| Shares of beneficial interest outstanding (par value of $.001 per share) unlimited number of shares authorized | $ 27,024 |
| Additional paid-in-capital | 350,017,321 |
| | 350,044,345 |
| Total distributable earnings (loss) | 40,854,174 |
| Net assets | $390,898,519 |
| Class A | |
| Net assets applicable to outstanding shares | $302,558,864 |
| Shares of beneficial interest outstanding | 20,871,670 |
| Net asset value per share outstanding | $ 14.50 |
| Maximum sales charge (3.00% of offering price) | 0.45 |
| Maximum offering price per share outstanding | $ 14.95 |
| Investor Class | |
| Net assets applicable to outstanding shares | $ 58,318,184 |
| Shares of beneficial interest outstanding | 4,027,162 |
| Net asset value per share outstanding | $ 14.48 |
| Maximum sales charge (2.50% of offering price) | 0.37 |
| Maximum offering price per share outstanding | $ 14.85 |
| Class B | |
| Net assets applicable to outstanding shares | $ 10,467,741 |
| Shares of beneficial interest outstanding | 753,011 |
| Net asset value and offering price per share outstanding | $ 13.90 |
| Class C | |
| Net assets applicable to outstanding shares | $ 10,762,984 |
| Shares of beneficial interest outstanding | 772,645 |
| Net asset value and offering price per share outstanding | $ 13.93 |
| Class I | |
| Net assets applicable to outstanding shares | $ 5,462,790 |
| Shares of beneficial interest outstanding | 368,214 |
| Net asset value and offering price per share outstanding | $ 14.84 |
| Class R3 | |
| Net assets applicable to outstanding shares | $ 1,944,766 |
| Shares of beneficial interest outstanding | 135,489 |
| Net asset value and offering price per share outstanding | $ 14.35 |
| SIMPLE Class | |
| Net assets applicable to outstanding shares | $ 1,383,190 |
| Shares of beneficial interest outstanding | 95,646 |
| Net asset value and offering price per share outstanding | $ 14.46 |
The notes to the financial statements are an integral part of, and should be read in conjunction with, the financial statements.
| 66 | MainStay Equity Allocation Fund |
Statement of Operations for the year ended October 31, 2022
| Investment Income (Loss) |
| Income | |
| Dividend distributions from affiliated investment companies | $ 5,509,952 |
| Expenses | |
| Distribution/Service—Class A (See Note 3) | 836,344 |
| Distribution/Service—Investor Class (See Note 3) | 159,506 |
| Distribution/Service—Class B (See Note 3) | 141,398 |
| Distribution/Service—Class C (See Note 3) | 129,518 |
| Distribution/Service—Class R3 (See Note 3) | 10,079 |
| Distribution/Service—SIMPLE Class (See Note 3) | 4,229 |
| Transfer agent (See Note 3) | 526,596 |
| Registration | 103,321 |
| Professional fees | 66,006 |
| Custodian | 27,198 |
| Shareholder communication | 14,560 |
| Trustees | 9,051 |
| Shareholder service (See Note 3) | 2,016 |
| Miscellaneous | 27,276 |
| Total expenses before waiver/reimbursement | 2,057,098 |
| Expense waiver/reimbursement from Manager (See Note 3) | (72,266) |
| Net expenses | 1,984,832 |
| Net investment income (loss) | 3,525,120 |
| Realized and Unrealized Gain (Loss) |
| Net realized gain (loss) on: | |
| Affiliated investment company transactions | 2,326,656 |
| Realized capital gain distributions from affiliated investment companies | 44,100,837 |
| Swap transactions | 222,124 |
| Net realized gain (loss) | 46,649,617 |
Net change in unrealized appreciation (depreciation) on:
Affiliated investments companies | (135,519,813) |
| Net realized and unrealized gain (loss) | (88,870,196) |
| Net increase (decrease) in net assets resulting from operations | $ (85,345,076) |
The notes to the financial statements are an integral part of, and should be read in conjunction with, the financial statements.
67
Statements of Changes in Net Assets
for the years ended October 31, 2022 and October 31, 2021
| | 2022 | 2021 |
| Increase (Decrease) in Net Assets |
| Operations: | | |
| Net investment income (loss) | $ 3,525,120 | $ 2,356,690 |
| Net realized gain (loss) | 46,649,617 | 42,435,715 |
| Net change in unrealized appreciation (depreciation) | (135,519,813) | 100,435,412 |
| Net increase (decrease) in net assets resulting from operations | (85,345,076) | 145,227,817 |
| Distributions to shareholders: | | |
| Class A | (42,722,083) | (14,572,968) |
| Investor Class | (7,837,705) | (3,373,691) |
| Class B | (1,882,929) | (929,852) |
| Class C | (1,657,436) | (786,948) |
| Class I | (777,037) | (264,076) |
| Class R3 | (237,105) | (71,345) |
| SIMPLE Class | (69,622) | (3,946) |
| Total distributions to shareholders | (55,183,917) | (20,002,826) |
| Capital share transactions: | | |
| Net proceeds from sales of shares | 39,138,627 | 41,972,232 |
| Net asset value of shares issued to shareholders in reinvestment of distributions | 54,836,059 | 19,905,540 |
| Cost of shares redeemed | (52,534,541) | (70,932,485) |
| Increase (decrease) in net assets derived from capital share transactions | 41,440,145 | (9,054,713) |
| Net increase (decrease) in net assets | (99,088,848) | 116,170,278 |
| Net Assets |
| Beginning of year | 489,987,367 | 373,817,089 |
| End of year | $ 390,898,519 | $489,987,367 |
The notes to the financial statements are an integral part of, and should be read in conjunction with, the financial statements.
| 68 | MainStay Equity Allocation Fund |
Financial Highlights selected per share data and ratios
| | Year Ended October 31, |
| Class A | 2022 | | 2021 | | 2020 | | 2019 | | 2018 |
| Net asset value at beginning of year | $ 19.80 | | $ 14.86 | | $ 15.10 | | $ 15.60 | | $ 17.01 |
| Net investment income (loss) (a) | 0.14 | | 0.11 | | 0.19 | | 0.15 | | 0.12 |
| Net realized and unrealized gain (loss) | (3.19) | | 5.64 | | 0.38 | | 0.93 | | (0.59) |
| Total from investment operations | (3.05) | | 5.75 | | 0.57 | | 1.08 | | (0.47) |
| Less distributions: | | | | | | | | | |
| From net investment income | (0.86) | | (0.08) | | (0.28) | | (0.18) | | (0.36) |
| From net realized gain on investments | (1.39) | | (0.73) | | (0.53) | | (1.40) | | (0.58) |
| Total distributions | (2.25) | | (0.81) | | (0.81) | | (1.58) | | (0.94) |
| Net asset value at end of year | $ 14.50 | | $ 19.80 | | $ 14.86 | | $ 15.10 | | $ 15.60 |
| Total investment return (b) | (17.56)% | | 39.73% | | 3.70% | | 8.72% | | (3.15)% |
| Ratios (to average net assets)/Supplemental Data: | | | | | | | | | |
| Net investment income (loss) | 0.89% | | 0.60% | | 1.29% | | 1.06% | | 0.69% |
| Net expenses (c) | 0.37% | | 0.38% | | 0.41% | | 0.43% | | 0.38% |
| Portfolio turnover rate | 17% | | 27% | | 36% | | 35% | | 48% |
| Net assets at end of year (in 000’s) | $ 302,559 | | $ 372,926 | | $ 258,743 | | $ 248,068 | | $ 236,201 |
| (a) | Per share data based on average shares outstanding during the year. |
| (b) | Total investment return is calculated exclusive of sales charges and assumes the reinvestment of dividends and distributions. For periods of less than one year, total return is not annualized. |
| (c) | In addition to the fees and expenses which the Fund bears directly, it also indirectly bears a pro-rata share of the fees and expenses of the underlying funds in which it invests. Such indirect expenses are not included in the above expense ratios. |
| | Year Ended October 31, |
| Investor Class | 2022 | | 2021 | | 2020 | | 2019 | | 2018 |
| Net asset value at beginning of year | $ 19.78 | | $ 14.84 | | $ 15.08 | | $ 15.58 | | $ 16.98 |
| Net investment income (loss) (a) | 0.12 | | 0.09 | | 0.17 | | 0.13 | | 0.09 |
| Net realized and unrealized gain (loss) | (3.20) | | 5.62 | | 0.38 | | 0.93 | | (0.59) |
| Total from investment operations | (3.08) | | 5.71 | | 0.55 | | 1.06 | | (0.50) |
| Less distributions: | | | | | | | | | |
| From net investment income | (0.83) | | (0.04) | | (0.26) | | (0.16) | | (0.32) |
| From net realized gain on investments | (1.39) | | (0.73) | | (0.53) | | (1.40) | | (0.58) |
| Total distributions | (2.22) | | (0.77) | | (0.79) | | (1.56) | | (0.90) |
| Net asset value at end of year | $ 14.48 | | $ 19.78 | | $ 14.84 | | $ 15.08 | | $ 15.58 |
| Total investment return (b) | (17.72)% | | 39.50% | | 3.55% | | 8.52% | | (3.34)% |
| Ratios (to average net assets)/Supplemental Data: | | | | | | | | | |
| Net investment income (loss) | 0.73% | | 0.48% | | 1.18% | | 0.89% | | 0.56% |
| Net expenses (c) | 0.55% | | 0.55% | | 0.55% | | 0.55% | | 0.55% |
| Expenses (before waiver/reimbursement) (c) | 0.63% | | 0.71% | | 0.72% | | 0.72% | | 0.64% |
| Portfolio turnover rate | 17% | | 27% | | 36% | | 35% | | 48% |
| Net assets at end of year (in 000's) | $ 58,318 | | $ 73,138 | | $ 73,492 | | $ 75,913 | | $ 66,924 |
| (a) | Per share data based on average shares outstanding during the year. |
| (b) | Total investment return is calculated exclusive of sales charges and assumes the reinvestment of dividends and distributions. For periods of less than one year, total return is not annualized. |
| (c) | In addition to the fees and expenses which the Fund bears directly, it also indirectly bears a pro-rata share of the fees and expenses of the underlying funds in which it invests. Such indirect expenses are not included in the above expense ratios. |
The notes to the financial statements are an integral part of, and should be read in conjunction with, the financial statements.
69
Financial Highlights selected per share data and ratios
| | Year Ended October 31, |
| Class B | 2022 | | 2021 | | 2020 | | 2019 | | 2018 |
| Net asset value at beginning of year | $ 19.07 | | $ 14.40 | | $ 14.64 | | $ 15.13 | | $ 16.51 |
| Net investment income (loss) (a) | 0.00‡ | | (0.03) | | 0.08 | | 0.04 | | (0.02) |
| Net realized and unrealized gain (loss) | (3.09) | | 5.43 | | 0.34 | | 0.89 | | (0.60) |
| Total from investment operations | (3.09) | | 5.40 | | 0.42 | | 0.93 | | (0.62) |
| Less distributions: | | | | | | | | | |
| From net investment income | (0.69) | | — | | (0.13) | | (0.02) | | (0.18) |
| From net realized gain on investments | (1.39) | | (0.73) | | (0.53) | | (1.40) | | (0.58) |
| Total distributions | (2.08) | | (0.73) | | (0.66) | | (1.42) | | (0.76) |
| Net asset value at end of year | $ 13.90 | | $ 19.07 | | $ 14.40 | | $ 14.64 | | $ 15.13 |
| Total investment return (b) | (18.36)% | | 38.44% | | 2.80% | | 7.73% | | (4.09)% |
| Ratios (to average net assets)/Supplemental Data: | | | | | | | | | |
| Net investment income (loss) | 0.02% | | (0.19)% | | 0.55% | | 0.28% | | (0.13)% |
| Net expenses (c) | 1.30% | | 1.30% | | 1.30% | | 1.30% | | 1.30% |
| Expenses (before waiver/reimbursement) (c) | 1.38% | | 1.46% | | 1.47% | | 1.47% | | 1.39% |
| Portfolio turnover rate | 17% | | 27% | | 36% | | 35% | | 48% |
| Net assets at end of year (in 000’s) | $ 10,468 | | $ 18,670 | | $ 19,651 | | $ 25,905 | | $ 32,586 |
| ‡ | Less than one cent per share. |
| (a) | Per share data based on average shares outstanding during the year. |
| (b) | Total investment return is calculated exclusive of sales charges and assumes the reinvestment of dividends and distributions. For periods of less than one year, total return is not annualized. |
| (c) | In addition to the fees and expenses which the Fund bears directly, it also indirectly bears a pro-rata share of the fees and expenses of the underlying funds in which it invests. Such indirect expenses are not included in the above expense ratios. |
| | Year Ended October 31, |
| Class C | 2022 | | 2021 | | 2020 | | 2019 | | 2018 |
| Net asset value at beginning of year | $ 19.11 | | $ 14.42 | | $ 14.66 | | $ 15.15 | | $ 16.53 |
| Net investment income (loss) (a) | (0.00)‡ | | (0.04) | | 0.07 | | 0.05 | | (0.03) |
| Net realized and unrealized gain (loss) | (3.10) | | 5.46 | | 0.35 | | 0.88 | | (0.59) |
| Total from investment operations | (3.10) | | 5.42 | | 0.42 | | 0.93 | | (0.62) |
| Less distributions: | | | | | | | | | |
| From net investment income | (0.69) | | — | | (0.13) | | (0.02) | | (0.18) |
| From net realized gain on investments | (1.39) | | (0.73) | | (0.53) | | (1.40) | | (0.58) |
| Total distributions | (2.08) | | (0.73) | | (0.66) | | (1.42) | | (0.76) |
| Net asset value at end of year | $ 13.93 | | $ 19.11 | | $ 14.42 | | $ 14.66 | | $ 15.15 |
| Total investment return (b) | (18.37)% | | 38.53% | | 2.79% | | 7.72% | | (4.08)% |
| Ratios (to average net assets)/Supplemental Data: | | | | | | | | | |
| Net investment income (loss) | (0.00)%‡ | | (0.25)% | | 0.49% | | 0.33% | | (0.16)% |
| Net expenses (c) | 1.30% | | 1.30% | | 1.30% | | 1.30% | | 1.30% |
| Expenses (before waiver/reimbursement) (c) | 1.38% | | 1.46% | | 1.47% | | 1.47% | | 1.39% |
| Portfolio turnover rate | 17% | | 27% | | 36% | | 35% | | 48% |
| Net assets at end of year (in 000’s) | $ 10,763 | | $ 16,001 | | $ 15,805 | | $ 18,411 | | $ 23,998 |
| ‡ | Less than one cent per share. |
| ‡ | Less than one-tenth of a percent. |
| (a) | Per share data based on average shares outstanding during the year. |
| (b) | Total investment return is calculated exclusive of sales charges and assumes the reinvestment of dividends and distributions. For periods of less than one year, total return is not annualized. |
| (c) | In addition to the fees and expenses which the Fund bears directly, it also indirectly bears a pro-rata share of the fees and expenses of the underlying funds in which it invests. Such indirect expenses are not included in the above expense ratios. |
The notes to the financial statements are an integral part of, and should be read in conjunction with, the financial statements.
| 70 | MainStay Equity Allocation Fund |
Financial Highlights selected per share data and ratios
| | Year Ended October 31, |
| Class I | 2022 | | 2021 | | 2020 | | 2019 | | 2018 |
| Net asset value at beginning of year | $ 20.21 | | $ 15.15 | | $ 15.37 | | $ 15.86 | | $ 17.29 |
| Net investment income (loss) (a) | 0.19 | | 0.16 | | 0.24 | | 0.21 | | 0.16 |
| Net realized and unrealized gain (loss) | (3.27) | | 5.74 | | 0.39 | | 0.93 | | (0.61) |
| Total from investment operations | (3.08) | | 5.90 | | 0.63 | | 1.14 | | (0.45) |
| Less distributions: | | | | | | | | | |
| From net investment income | (0.90) | | (0.11) | | (0.32) | | (0.23) | | (0.40) |
| From net realized gain on investments | (1.39) | | (0.73) | | (0.53) | | (1.40) | | (0.58) |
| Total distributions | (2.29) | | (0.84) | | (0.85) | | (1.63) | | (0.98) |
| Net asset value at end of year | $ 14.84 | | $ 20.21 | | $ 15.15 | | $ 15.37 | | $ 15.86 |
| Total investment return (b) | (17.35)% | | 40.05% | | 4.02% | | 8.97% | | (2.98)% |
| Ratios (to average net assets)/Supplemental Data: | | | | | | | | | |
| Net investment income (loss) | 1.16% | | 0.86% | | 1.60% | | 1.40% | | 0.96% |
| Net expenses (c) | 0.12% | | 0.13% | | 0.16% | | 0.16% | | 0.13% |
| Portfolio turnover rate | 17% | | 27% | | 36% | | 35% | | 48% |
| Net assets at end of year (in 000’s) | $ 5,463 | | $ 6,649 | | $ 4,727 | | $ 4,894 | | $ 5,915 |
| (a) | Per share data based on average shares outstanding during the year. |
| (b) | Total investment return is calculated exclusive of sales charges and assumes the reinvestment of dividends and distributions. Class I shares are not subject to sales charges. For periods of less than one year, total return is not annualized. |
| (c) | In addition to the fees and expenses which the Fund bears directly, it also indirectly bears a pro-rata share of the fees and expenses of the underlying funds in which it invests. Such indirect expenses are not included in the above expense ratios. |
| | Year Ended October 31, |
| Class R3 | 2022 | | 2021 | | 2020 | | 2019 | | 2018 |
| Net asset value at beginning of year | $ 19.63 | | $ 14.74 | | $ 15.00 | | $ 15.51 | | $ 16.96 |
| Net investment income (loss) (a) | 0.08 | | 0.04 | | 0.11 | | 0.06 | | 0.00‡ |
| Net realized and unrealized gain (loss) | (3.18) | | 5.61 | | 0.40 | | 0.97 | | (0.53) |
| Total from investment operations | (3.10) | | 5.65 | | 0.51 | | 1.03 | | (0.53) |
| Less distributions: | | | | | | | | | |
| From net investment income | (0.79) | | (0.03) | | (0.24) | | (0.14) | | (0.34) |
| From net realized gain on investments | (1.39) | | (0.73) | | (0.53) | | (1.40) | | (0.58) |
| Total distributions | (2.18) | | (0.76) | | (0.77) | | (1.54) | | (0.92) |
| Net asset value at end of year | $ 14.35 | | $ 19.63 | | $ 14.74 | | $ 15.00 | | $ 15.51 |
| Total investment return (b) | (17.91)% | | 39.29% | | 3.30% | | 8.34% | | (3.51)% |
| Ratios (to average net assets)/Supplemental Data: | | | | | | | | | |
| Net investment income (loss) | 0.52% | | 0.23% | | 0.78% | | 0.40% | | 0.01% |
| Net expenses (c) | 0.72% | | 0.73% | | 0.76% | | 0.77% | | 0.73% |
| Portfolio turnover rate | 17% | | 27% | | 36% | | 35% | | 48% |
| Net assets at end of year (in 000’s) | $ 1,945 | | $ 2,140 | | $ 1,375 | | $ 1,060 | | $ 405 |
| ‡ | Less than one cent per share. |
| (a) | Per share data based on average shares outstanding during the year. |
| (b) | Total investment return is calculated exclusive of sales charges and assumes the reinvestment of dividends and distributions. Class R3 shares are not subject to sales charges. For periods of less than one year, total return is not annualized. |
| (c) | In addition to the fees and expenses which the Fund bears directly, it also indirectly bears a pro-rata share of the fees and expenses of the underlying funds in which it invests. Such indirect expenses are not included in the above expense ratios. |
The notes to the financial statements are an integral part of, and should be read in conjunction with, the financial statements.
71
Financial Highlights selected per share data and ratios
| | Year Ended October 31, | | August 31, 2020^ through
October 31, |
| SIMPLE Class | 2022 | | 2021 | | 2020 |
| Net asset value at beginning of period | $ 19.75 | | $ 14.84 | | $ 15.70* |
| Net investment income (loss) (a) | 0.05 | | (0.01) | | (0.01) |
| Net realized and unrealized gain (loss) | (3.17) | | 5.68 | | (0.85) |
| Total from investment operations | (3.12) | | 5.67 | | (0.86) |
| Less distributions: | | | | | |
| From net investment income | (0.78) | | (0.03) | | — |
| From net realized gain on investments | (1.39) | | (0.73) | | — |
| Total distributions | (2.17) | | (0.76) | | — |
| Net asset value at end of period | $ 14.46 | | $ 19.75 | | $ 14.84 |
| Total investment return (b) | (17.91)% | | 39.15% | | (5.48)% |
| Ratios (to average net assets)/Supplemental Data: | | | | | |
| Net investment income (loss) | 0.30% | | (0.07)% | | (0.27)%†† |
| Net expenses (c) | 0.80% | | 0.80% | | 0.80%†† |
| Expenses (before waiver/reimbursement) (c) | 0.88% | | 0.96% | | 0.97%†† |
| Portfolio turnover rate | 17% | | 27% | | 36% |
| Net assets at end of period (in 000’s) | $ 1,383 | | $ 463 | | $ 24 |
| ^ | Inception date. |
| * | Based on the net asset value of Investor Class as of August 31, 2020. |
| †† | Annualized. |
| (a) | Per share data based on average shares outstanding during the period. |
| (b) | Total investment return is calculated exclusive of sales charges and assumes the reinvestment of dividends and distributions. SIMPLE Class shares are not subject to sales charges. For periods of less than one year, total return is not annualized. |
| (c) | In addition to the fees and expenses which the Fund bears directly, it also indirectly bears a pro-rata share of the fees and expenses of the underlying funds in which it invests. Such indirect expenses are not included in the above expense ratios. |
The notes to the financial statements are an integral part of, and should be read in conjunction with, the financial statements.
| 72 | MainStay Equity Allocation Fund |
Notes to Financial Statements
Note 1-Organization and Business
MainStay Funds Trust (the “Trust”) was organized as a Delaware statutory trust on April 28, 2009. The Trust is registered under the Investment Company Act of 1940, as amended (the “1940 Act”), as an open-end management investment company, and is comprised of thirty-three funds (collectively referred to as the “Funds” and each individually, referred to as a “Fund"). These financial statements and notes relate to the MainStay Conservative Allocation Fund, MainStay Moderate Allocation Fund, MainStay Growth Allocation Fund (formerly known as MainStay Moderate Growth Allocation Fund) and MainStay Equity Allocation Fund (formerly known as MainStay Growth Allocation Fund) (collectively referred to as the "Allocation Funds" and each individually referred to as an "Allocation Fund"). Each is a “diversified” fund, as that term is defined in the 1940 Act, as interpreted or modified by regulatory authorities having jurisdiction, from time to time.
The following table lists each Allocation Fund's share classes that have been registered and commenced operations:
| Fund | Share Classes Commenced Operations1 |
| MainStay Conservative Allocation Fund | Class A, Investor Class, Class B, Class C, Class I, Class R2, Class R3 and SIMPLE Class |
| MainStay Moderate Allocation Fund | Class A, Investor Class, Class B, Class C, Class I, Class R2, Class R3 and SIMPLE Class |
| MainStay Growth Allocation Fund2 | Class A, Investor Class, Class B, Class C, Class I, Class R2, Class R3 and SIMPLE Class |
| MainStay Equity Allocation Fund | Class A, Investor Class, Class B, Class C, Class I, Class R3 and SIMPLE Class |
| 1. | For each Allocation Fund, Class R6 shares were registered for sale effective as of February 28, 2020, but as of October 31, 2022 were not yet offered for sale. |
| 2. | For the MainStay Growth Allocation Fund, Class R1 shares were previously available for sale. As of April 28, 2022, Class R1 shares were no longer available for sale. |
Class B shares of the MainStay Group of Funds are closed to all new purchases as well as additional investments by existing Class B shareholders. Existing Class B shareholders may continue to reinvest dividends and capital gains distributions, as well as exchange their Class B shares for Class B shares of other funds in the MainStay Group of Funds as permitted by the current exchange privileges. Class B shareholders continue to be subject to any applicable contingent deferred sales charge ("CDSC") at the time of redemption. All other features of the Class B shares, including but not limited to the fees and expenses applicable to Class B shares, remain unchanged. Unless redeemed, Class B shareholders will remain in Class B shares of their respective fund until the Class B shares are converted to Class A or Investor Class shares pursuant to the applicable conversion schedule.
Class A and Investor Class shares are offered at net asset value (“NAV”) per share plus an initial sales charge. No initial sales charge applies to investments of $250,000 or more (and certain other qualified purchases) in Class A and Investor Class shares. However, a CDSC of 1.00% may be imposed on certain redemptions made within 18 months of the date of purchase on shares that were purchased without an initial sales charge. Class C shares are offered at NAV without an initial sales charge,
although a CDSC of 1.00% may be imposed on certain redemptions of such shares made within one year of the date of purchase of Class C shares. When Class B shares were offered, they were offered at NAV without an initial sales charge, although a CDSC that declines depending on the number of years a shareholder held its Class B shares may be imposed on certain redemptions of such shares made within six years of the date of purchase of such shares. Class I, Class R2, Class R3 and SIMPLE Class shares are offered at NAV without a sales charge. Depending upon eligibility, Class B shares convert to either Class A or Investor Class shares at the end of the calendar quarter eight years after the date they were purchased. In addition, depending upon eligibility, Class C shares convert to either Class A or Investor Class shares at the end of the calendar quarter ten years after the date they were purchased. Additionally, Investor Class shares may convert automatically to Class A shares. SIMPLE Class shares convert to Class A shares, or Investor Class shares if you are not eligible to hold Class A shares, at the end of the calendar quarter, ten years after the date they were purchased. Share class conversions are based on the relevant NAVs of the two classes at the time of the conversion, and no sales load or other charge is imposed. Under certain circumstances and as may be permitted by the Trust’s multiple class plan pursuant to Rule 18f-3 under the 1940 Act, specified share classes of an Allocation Fund may be converted to one or more other share classes of the Allocation Funds as disclosed in the capital share transactions within these Notes. The classes of shares have the same voting (except for issues that relate solely to one class), dividend, liquidation and other rights, and the same terms and conditions, except that under distribution plans pursuant to Rule 12b-1 under the 1940 Act, Class B and Class C shares are subject to higher distribution and/or service fees than Class A, Investor Class, Class R2, Class R3 and SIMPLE Class shares. Class I shares are not subject to a distribution and/or service fee. Class R2 and Class R3 shares are subject to a shareholder service fee, which is in addition to fees paid under the distribution plans for Class R2 and Class R3 shares.
The investment objective for each of the Allocation Funds is as follows:
The MainStay Conservative Allocation Fund seeks current income and, secondarily, long-term growth of capital.
The MainStay Moderate Allocation Fund seeks long-term growth of capital and, secondarily, current income.
The MainStay Growth Allocation Fund seeks long-term growth of capital and, secondarily, current income.
The MainStay Equity Allocation Fund seeks long-term growth of capital.
The Allocation Funds are "funds-of-funds" that seek to achieve their investment objectives by investing in mutual funds and exchange-traded funds (“ETFs”) managed by New York Life Investment Management LLC (“New York Life Investments” or “Manager”) or its affiliates (the “Underlying Funds”). The MainStay Equity Allocation Fund invests, under normal circumstances, at least 80% of its assets (net assets plus any borrowings for investment purposes) in Underlying Equity Funds.
Notes to Financial Statements (continued)
Note 2–Significant Accounting Policies
The Allocation Funds are investment companies and accordingly follow the investment company accounting and reporting guidance of the Financial Accounting Standards Board (“FASB”) Accounting Standards Codification Topic 946 Financial Services—Investment Companies. The Allocation Funds prepare their financial statements in accordance with generally accepted accounting principles (“GAAP”) in the United States of America and follow the significant accounting policies described below.
(A) Securities Valuation. Investments are usually valued as of the close of regular trading on the New York Stock Exchange (the "Exchange") (usually 4:00 p.m. Eastern time) on each day the Allocation Funds are open for business ("valuation date").
Effective September 8, 2022, and pursuant to Rule 2a-5 under the 1940 Act, the Board of Trustees of the Trust (the "Board") designated New York Life Investments as its Valuation Designee (the "Valuation Designee"). The Valuation Designee is responsible for performing fair valuations relating to all investments in each Allocation Fund’s portfolio for which market quotations are not readily available; periodically assessing and managing material valuation risks; establishing and applying fair value methodologies; testing fair valuation methodologies; evaluating and overseeing pricing services; segregation of valuation and portfolio management functions; providing quarterly, annual and prompt reporting to the Board, as appropriate; identifying potential conflicts of interest; and maintaining appropriate records. The Valuation Designee has established a valuation committee ("Valuation Committee") to assist in carrying out the Valuation Designee’s responsibilities and establish prices of securities for which market quotations are not readily available. The Allocation Fund’s and the Valuation Designee's policies and procedures ("Valuation Procedures") govern the Valuation Designee’s selection and application of methodologies for determining and calculating the fair value of Allocation Fund investments. The Valuation Designee may value Allocation Fund portfolio securities for which market quotations are not readily available and other Allocation Fund assets utilizing inputs from pricing services and other third-party sources (together, “Pricing Sources”). The Valuation Committee meets (in person, via electronic mail or via teleconference) on an ad-hoc basis to determine fair valuations and on a quarterly basis to review fair value events (excluding fair valuations from pricing services), including valuation risks and back-testing results, and preview reports to the Board.
The Valuation Committee establishes prices of securities for which market quotations are not readily available based on such methodologies and measurements on a regular basis after considering information that is reasonably available and deemed relevant by the Valuation Committee. The Board shall oversee the Valuation Designee and review fair valuation materials on a prompt, quarterly and annual basis and approve proposed revisions to the Valuation Procedures.
Investments for which market quotations are not readily available are valued at fair value as determined in good faith pursuant to the Valuation Procedures. A market quotation is readily available only when that
quotation is a quoted price (unadjusted) in active markets for identical investments that each Allocation Fund can access at the measurement date, provided that a quotation will not be readily available if it is not reliable. Fair value measurements are determined within a framework that establishes a three-tier hierarchy that maximizes the use of observable market data and minimizes the use of unobservable inputs to establish a classification of fair value measurements for disclosure purposes. "Inputs" refer broadly to the assumptions that market participants would use in pricing the asset or liability, including assumptions about risk, such as the risk inherent in a particular valuation technique used to measure fair value using a pricing model and/or the risk inherent in the inputs for the valuation technique. Inputs may be observable or unobservable. Observable inputs reflect the assumptions market participants would use in pricing the asset or liability based on market data obtained from sources independent of each Allocation Fund. Unobservable inputs reflect each Allocation Fund’s own assumptions about the assumptions market participants would use in pricing the asset or liability based on the information available. The inputs or methodology used for valuing assets or liabilities may not be an indication of the risks associated with investing in those assets or liabilities. The three-tier hierarchy of inputs is summarized below.
| • | Level 1—quoted prices (unadjusted) in active markets for an identical asset or liability |
| • | Level 2—other significant observable inputs (including quoted prices for a similar asset or liability in active markets, interest rates and yield curves, prepayment speeds, credit risk, etc.) |
| • | Level 3—significant unobservable inputs (including each Allocation Fund's own assumptions about the assumptions that market participants would use in measuring fair value of an asset or liability) |
The level of an asset or liability within the fair value hierarchy is based on the lowest level of an input, both individually and in the aggregate, that is significant to the fair value measurement. The aggregate value by input level of each Allocation Fund’s assets and liabilities as of October 31, 2022, is included at the end of each Allocation Fund’s Portfolio of Investments.
Exchange-traded funds (“ETFs”) are valued at the last quoted sales prices as of the close of regular trading on the relevant exchange on each valuation date. Securities that are not traded on the valuation date are valued at the mean of the last quoted bid and ask prices. Prices are normally taken from the principal market in which each security trades. These securities are generally categorized as Level 1 in the hierarchy.
Investments in mutual funds, including money market funds, are valued at their respective NAVs at the close of business each day on the valuation date. These securities are generally categorized as Level 1 in the hierarchy.
Swaps are marked to market daily based upon quotations from pricing agents, brokers or market makers. These securities are generally categorized as Level 2 in the hierarchy.
| 74 | MainStay Asset Allocation Funds |
Total return swap contracts, which are arrangements to exchange a market-linked return for a periodic payment, are based on a notional principal amount. To the extent that the total return of the security, index or other financial measure underlying the transaction exceeds or falls short of the offsetting interest rate obligation, the Allocation Funds will receive a payment from or make a payment to the counterparty. Total return swap contracts are marked to market daily based upon quotations from market makers and these securities are generally categorized as Level 2 in the hierarchy.
Temporary cash investments acquired in excess of 60 days to maturity at the time of purchase are valued using the latest bid prices or using valuations based on a matrix system (which considers such factors as security prices, yields, maturities and ratings), both as furnished by independent pricing services. Temporary cash investments that mature in 60 days or less at the time of purchase ("Short-Term Investments") are valued using the amortized cost method of valuation, unless the use of such method would be inappropriate. The amortized cost method involves valuing a security at its cost on the date of purchase and thereafter assuming a constant amortization to maturity of the difference between such cost and the value on maturity date. Amortized cost approximates the current fair value of a security. Securities valued using the amortized cost method are not valued using quoted prices in an active market and are generally categorized as Level 2 in the hierarchy.
The information above is not intended to reflect an exhaustive list of the methodologies that may be used to value portfolio investments. The Valuation Procedures permit the use of a variety of valuation methodologies in connection with valuing portfolio investments. The methodology used for a specific type of investment may vary based on the market data available or other considerations. The methodologies summarized above may not represent the specific means by which portfolio investments are valued on any particular business day.
(B) Income Taxes. Each Allocation Fund is treated as a separate entity for federal income tax purposes. The Allocation Funds' policy is to comply with the requirements of the Internal Revenue Code of 1986, as amended (the “Internal Revenue Code”), applicable to regulated investment companies and to distribute all of its taxable income to the shareholders of each Allocation Fund within the allowable time limits.
The Manager evaluates each Allocation Fund’s tax positions to determine if the tax positions taken meet the minimum recognition threshold in connection with accounting for uncertainties in income tax positions taken or expected to be taken for the purposes of measuring and recognizing tax liabilities in the financial statements. Recognition of tax benefits of an uncertain tax position is permitted only to the extent the position is “more likely than not” to be sustained assuming examination by taxing authorities. The Manager analyzed the Allocation Funds' tax positions taken on federal, state and local income tax returns for all open tax years (for up to three tax years) and has concluded that no provisions for federal, state and local income tax are required in the Allocation Funds' financial statements. The Allocation Funds' federal, state and local income tax and federal excise tax returns for tax years for which the
applicable statutes of limitations have not expired are subject to examination by the Internal Revenue Service and state and local departments of revenue.
(C) Dividends and Distributions to Shareholders. Dividends and distributions are recorded on the ex-dividend date. The MainStay Moderate Allocation Fund, MainStay Growth Allocation Fund and MainStay Equity Allocation Fund each intend to declare and pay dividends from net investment income and distributions from net realized capital and currency gains, if any, at least annually. The MainStay Conservative Allocation Fund intends to declare and dividends from net investment income, if any, at least quarterly and distributions from net realized capital and currency gains, if any, at least annually. Unless a shareholder elects otherwise, all dividends and distributions are reinvested at NAV in the same class of shares of the respective Allocation Fund. Dividends and distributions to shareholders are determined in accordance with federal income tax regulations and may differ from determinations using GAAP.
(D) Security Transactions and Investment Income. The Allocation Funds record security transactions on the trade date. Realized gains and losses on security transactions are determined using the identified cost method. Dividends and distributions received by the Allocation Funds from the Underlying Funds are recorded on the ex-dividend date.
Investment income and realized and unrealized gains and losses on investments of the Allocation Funds are allocated pro rata to the separate classes of shares based upon their relative net assets on the date the income is earned or realized and unrealized gains and losses are incurred.
(E) Expenses. Expenses of the Trust are allocated to the individual Funds in proportion to the net assets of the respective Funds when the expenses are incurred, except where direct allocations of expenses can be made. Expenses (other than transfer agent expenses and fees incurred under the shareholder services plans and/or the distribution plans further discussed in Note 3(B)) are allocated to separate classes of shares pro rata based upon their relative net assets on the date the expenses are incurred. The expenses borne by the Allocation Funds, including those of related parties to the Allocation Funds, are shown in the Statement of Operations.
Additionally, the Allocation Funds may invest in mutual funds, which are subject to management fees and other fees that may cause the costs of investing in mutual funds to be greater than the costs of owning the underlying securities directly. These indirect expenses of mutual funds are not included in the amounts shown as expenses in the Statement of Operations or in the expense ratios included in the Financial Highlights.
(F) Use of Estimates. In preparing financial statements in conformity with GAAP, the Manager makes estimates and assumptions that affect the reported amounts and disclosures in the financial statements. Actual results could differ from those estimates and assumptions.
Notes to Financial Statements (continued)
(G) Swap Contracts. The Allocation Funds may enter into credit default, interest rate, equity, index and currency exchange rate swap contracts (“swaps”). In a typical swap transaction, two parties agree to exchange the future returns (or differentials in rates of future returns) earned or realized at periodic intervals on a particular investment or instrument based on a notional principal amount. Generally, the Allocation Funds will enter into a swap on a net basis, which means that the two payment streams under the swap are netted, with the Allocation Funds receiving or paying (as the case may be) only the net amount of the two payment streams. Therefore, the Allocation Funds' current obligation under a swap generally will be equal to the net amount to be paid or received under the swap, based on the relative value of notional positions attributable to each counterparty to the swap. The payments may be adjusted for transaction costs, interest payments, the amount of interest paid on the investment or instrument or other factors. Collateral, in the form of cash or securities, may be required to be held in segregated accounts with the custodian bank or broker in accordance with the terms of the swap. Swap agreements are privately negotiated in the over the counter (“OTC”) market and may be executed in a multilateral or other trade facilities platform, such as a registered commodities exchange (“centrally cleared swaps”).
Certain standardized swaps, including certain credit default and interest rate swaps, are subject to mandatory clearing and exchange-trading, and more types of standardized swaps are expected to be subject to mandatory clearing and exchange-trading in the future. The counterparty risk for exchange-traded and cleared derivatives is expected to be generally lower than for uncleared derivatives, but cleared contracts are not risk-free. In a cleared derivative transaction, the Allocation Funds typically enters into the transaction with a financial institution counterparty, and performance of the transaction is effectively guaranteed by a central clearinghouse, thereby reducing or eliminating the Allocation Funds' exposure to the credit risk of its original counterparty. The Allocation Funds will be required to post specified levels of margin with the clearinghouse or at the instruction of the clearinghouse; the margin required by a clearinghouse may be greater than the margin the Allocation Funds would be required to post in an uncleared transaction.
Swaps are marked to market daily based upon quotations from pricing agents, brokers, or market makers and the change in value, if any, is recorded as unrealized appreciation or depreciation. Any payments made or received upon entering into a swap would be amortized or accreted over the life of the swap and recorded as a realized gain or loss. Early termination of a swap is recorded as a realized gain or loss. Daily changes in valuation of centrally cleared swaps, if any, are recorded as a receivable or payable for the change in value as appropriate on the Statement of Assets and Liabilities.
The Allocation Funds bears the risk of loss of the amount expected to be received under a swap in the event of the default or bankruptcy of the swap counterparty. The Allocation Funds may be able to eliminate its exposure under a swap either by assignment or other disposition, or by entering into an offsetting swap with the same party or a similar
credit-worthy party. Swaps are not actively traded on financial markets. Entering into swaps involves elements of credit, market, leverage, liquidity, operational, counterparty and legal/documentation risk in excess of the amounts recognized on the Statement of Assets and Liabilities. Such risks involve the possibilities that there will be no liquid market for these swaps, that the counterparty to the swaps may default on its obligation to perform or disagree as to the meaning of the contractual terms in the swaps and that there may be unfavorable changes in interest rates, the price of the index or the security underlying these transactions, among other risks.
Equity Swaps (Total Return Swaps). Total return swap contracts are agreements between counterparties to exchange cash flow, one based on a market-linked return of an individual asset or group of assets (such as an index), and the other on a fixed or floating rate. As a total return swap, an equity swap may be structured in different ways. For example, when the Allocation Funds enters into a “long” equity swap, the counterparty may agree to pay the Allocation Funds the amount, if any, by which the notional amount of the equity swap would have increased in value had it been invested in a particular referenced security or securities, plus the dividends that would have been received on those securities. In return, the Allocation Funds will generally agree to pay the counterparty interest on the notional amount of the equity swap plus the amount, if any, by which that notional amount would have decreased in value had it been invested in such referenced security or securities, plus, in certain instances, commissions or trading spreads on the notional amounts. Therefore, the Allocation Funds' return on the equity swap generally should equal the gain or loss on the notional amount, plus dividends on the referenced security or securities less the interest paid by the Allocation Funds on the notional amount. Alternatively, when the Allocation Funds enters into a “short” equity swap, the counterparty will generally agree to pay the Allocation Funds the amount, if any, by which the notional amount of the equity swap would have decreased in value had the Allocation Funds sold a particular referenced security or securities short, less the dividend expense that the Allocation Funds would have incurred on the referenced security or securities, as adjusted for interest payments or other economic factors. In this situation, the Allocation Funds will generally be obligated to pay the amount, if any, by which the notional amount of the swap would have increased in value had it been invested directly in the referenced security or securities.
Equity swaps generally do not involve the delivery of securities or other referenced assets. Accordingly, the risk of loss with respect to equity swaps is normally limited to the net amount of payments that the Allocation Funds is contractually obligated to make. If the other party to an equity swap defaults, the Allocation Funds' risk of loss consists of the net amount of payments that the Allocation Funds is contractually entitled to receive, if any. The Allocation Funds will segregate cash or liquid assets, enter into offsetting transactions or use other measures permitted by applicable law to “cover” the Allocation Funds' current obligations. The Allocation Funds and New York Life Investments, however, believe these transactions do not constitute senior securities under the 1940 Act and,
| 76 | MainStay Asset Allocation Funds |
accordingly, will not treat them as being subject to the Allocation Funds' borrowing restrictions.
Equity swaps are derivatives and their value can be very volatile. The Allocation Funds may engage in total return swaps to gain exposure to emerging markets securities, along with offsetting long total return swap positions to maintain appropriate currency balances and risk exposures across all swap positions. To the extent that the Manager , or the Subadvisor do not accurately analyze and predict future market trends, the values or assets or economic factors, the Allocation Funds may suffer a loss, which may be substantial. As of October 31, 2022, open swap agreements are shown in the Portfolio of Investments.
(H) LIBOR Replacement Risk. The Allocation Funds may invest in certain debt securities, derivatives or other financial instruments that utilize the London Interbank Offered Rate ("LIBOR"), as a “benchmark” or “reference rate” for various interest rate calculations. As of January 1, 2022, the United Kingdom Financial Conduct Authority, which regulates LIBOR, ceased its active encouragement of banks to provide the quotations needed to sustain most LIBOR rates due to the absence of an active market for interbank unsecured lending and other reasons. However, the United Kingdom Financial Conduct Authority, the LIBOR administrator and other regulators announced that certain sterling and yen LIBOR settings would be calculated on a "synthetic" basis through the end of 2022 and the most widely used tenors of U.S. dollar LIBOR will continue until mid-2023. As a result, it is anticipated that the remaining LIBOR settings will be discontinued or will no longer be sufficiently robust to be representative of its underlying market around that time. Various financial industry groups will plan for that transition and certain regulators and industry groups have taken actions to establish alternative reference rates (e.g., the Secured Overnight Financing Rate, which measures the cost of overnight borrowings through repurchase agreement transactions collateralized with U.S. Treasury securities and is intended to replace U.S. dollar LIBOR with certain adjustments). However, there are challenges to converting certain contracts and transactions to a new benchmark and neither the full effects of the transition process nor its ultimate outcome is known.
The elimination of LIBOR or changes to other reference rates or any other changes or reforms to the determination or supervision of reference rates could have an adverse impact on the market for, or value of, any securities or payments linked to those reference rates, which may adversely affect the Allocation Funds' performance and/or net asset value. Uncertainty and risk also remain regarding the willingness and ability of issuers and lenders to include enhanced provisions in new and existing contracts or instruments. Consequently, the transition away from LIBOR to other reference rates may lead to increased volatility and illiquidity in markets that are tied to LIBOR, fluctuations in values of LIBOR-related investments or investments in issuers that utilize LIBOR, increased difficulty in borrowing or refinancing and diminished effectiveness of hedging strategies, adversely affecting the Allocation Funds' performance. Furthermore, the risks associated with the expected discontinuation of LIBOR and transition may be exacerbated if the work
necessary to effect an orderly transition to an alternative reference rate is not completed in a timely manner. While the transition away from LIBOR has already begun with no material adverse effect to the Allocation Funds' performance, the transition is expected to last through mid-2023 for some LIBOR tenors. The usefulness of LIBOR as a benchmark could deteriorate anytime during this transition period.
(I) Indemnifications. Under the Trust’s organizational documents, its officers and trustees are indemnified against certain liabilities that may arise out of performance of their duties to the Trust. Additionally, in the normal course of business, the Allocation Funds enter into contracts with third-party service providers that contain a variety of representations and warranties and that may provide general indemnifications. The Allocation Funds' maximum exposure under these arrangements is unknown, as this would involve future claims that may be made against the Allocation Funds that have not yet occurred. The Manager believes that the risk of loss in connection with these potential indemnification obligations is remote. However, there can be no assurance that material liabilities related to such obligations will not arise in the future, which could adversely impact the Allocation Funds.
(J) Quantitative Disclosure of Derivative Holdings. The following tables show additional disclosures related to the Allocation Funds' derivative and hedging activities, including how such activities are accounted for and their effect on the Allocation Funds' financial positions, performance and cash flows.
The Allocation Funds entered into total return swap contracts to seek to enhance returns or reduce the risk of loss by hedging certain of the Allocation Funds' holdings. These derivatives are not accounted for as hedging instruments.
MainStay Conservative Allocation Fund
The effect of derivative instruments on the Statement of Operations for the year ended October 31, 2022:
| Net Realized Gain (Loss) from: | Equity
Contracts
Risk | Total |
| Swap Contracts | $(483,425) | $(483,425) |
| Total Net Realized Gain (Loss) | $(483,425) | $(483,425) |
| Average Notional Amount | Total |
| Swap Contracts Long | $ 68,112,236 |
| Swap Contracts Short | $(29,361,033) |
MainStay Moderate Allocation Fund
Notes to Financial Statements (continued)
The effect of derivative instruments on the Statement of Operations for the year ended October 31, 2022:
| Net Realized Gain (Loss) from: | Equity
Contracts
Risk | Total |
| Swap Contracts | $(347,011) | $(347,011) |
| Total Net Realized Gain (Loss) | $(347,011) | $(347,011) |
| Average Notional Amount | Total |
| Swap Contracts Long | $119,622,437 |
| Swap Contracts Short | $ (50,990,303) |
MainStay Growth Allocation Fund
The effect of derivative instruments on the Statement of Operations for the year ended October 31, 2022:
| Net Realized Gain (Loss) from: | Equity
Contracts
Risk | Total |
| Swap Contracts | $(1,468,902) | $(1,468,902) |
| Total Net Realized Gain (Loss) | $(1,468,902) | $(1,468,902) |
| Average Notional Amount | Total |
| Swap Contracts Long | $121,159,140 |
| Swap Contracts Short | $ (52,422,444) |
MainStay Equity Allocation Fund
The effect of derivative instruments on the Statement of Operations for the year ended October 31, 2022:
| Net Realized Gain (Loss) from: | Equity
Contracts
Risk | Total |
| Swap Contracts | $222,124 | $222,124 |
| Total Net Realized Gain (Loss) | $222,124 | $222,124 |
| Average Notional Amount | Total |
| Swap Contracts Long | $ 44,993,263 |
| Swap Contracts Short | $(27,442,461) |
Note 3–Fees and Related Party Transactions
(A) Manager. New York Life Investments, a registered investment adviser and an indirect, wholly-owned subsidiary of New York Life Insurance Company (“New York Life”), serves as the Allocation Funds' Manager, pursuant to an Amended and Restated Management Agreement (“Management Agreement”) and is responsible for the day-to-day portfolio management of the Allocation Funds. The Manager provides offices, conducts clerical, recordkeeping and bookkeeping services, and keeps most of the financial and accounting records required to be maintained by the Allocation Funds. Except for the portion of salaries and expenses that are the responsibility of the Allocation Funds, the Manager pays the salaries and expenses of all personnel affiliated with the Allocation Funds and certain operational expenses of the Allocation Funds. During a portion of the year ended October 31, 2022, the Allocation Funds reimbursed New York Life Investments in an amount equal to a portion of the compensation of the Chief Compliance Officer attributable to the Allocation Funds.
The Allocation Funds do not pay any fees to the Manager in return for the services performed under the Management Agreement. The Allocation Funds do, however, indirectly pay a proportionate share of the management fees paid to the managers of the Underlying Portfolios/Funds in which the Allocation Funds invest.
| 78 | MainStay Asset Allocation Funds |
New York Life Investments has contractually agreed to waive fees and/or reimburse expenses so that Total Annual Fund Operating Expenses (excluding taxes, interest, litigation, extraordinary expenses, brokerage and other transaction expenses relating to the purchase and sale of portfolio investments, and acquired (underlying) fund fees and expenses) of a class do not exceed the following percentages of average daily net assets for each class:
| Fund | Class A | Investor Class | Class B | Class C | Class I | Class R2 | Class R3 | SIMPLE Class |
| MainStay Conservative Allocation Fund | 0.50% | 0.55% | 1.30% | 1.30% | 0.25% | 0.60% | 0.85% | 0.80% |
| MainStay Moderate Allocation Fund | 0.50 | 0.55 | 1.30 | 1.30 | 0.25 | 0.60 | 0.85 | 0.80 |
| MainStay Growth Allocation Fund | 0.50 | 0.55 | 1.30 | 1.30 | 0.25 | 0.60 | 0.85 | 0.80 |
| MainStay Equity Allocation Fund | 0.50 | 0.55 | 1.30 | 1.30 | 0.25 | N/A | 0.85 | 0.80 |
This agreement will remain in effect until February 28, 2023, and shall renew automatically for one-year terms unless New York Life Investments provides written notice of termination prior to the start of the next term or upon approval of the Board.
During the year ended October 31, 2022, New York Life Investments waived its fees and/or reimbursed expenses of the Allocation Funds as follows:
| Fund | Total |
| MainStay Conservative Allocation Fund | $14,645 |
| MainStay Moderate Allocation Fund | 79,295 |
| MainStay Growth Allocation Fund | 80,706 |
| MainStay Equity Allocation Fund | 72,266 |
JPMorgan provides sub-administration and sub-accounting services to the Allocation Funds pursuant to an agreement with New York Life Investments. These services include calculating the daily NAVs of the Allocation Funds, maintaining the general ledger and sub-ledger accounts for the calculation of the Allocation Funds' respective NAVs, and assisting New York Life Investments in conducting various aspects of the Allocation Funds' administrative operations. For providing these services to the Allocation Funds, JPMorgan is compensated by New York Life Investments.
Pursuant to an agreement between the Trust and New York Life Investments, New York Life Investments is responsible for providing or procuring certain regulatory reporting services for the Allocation Funds. The Allocation Funds will reimburse New York Life Investments for the actual costs incurred by New York Life Investments in connection with providing or procuring these services for the Allocation Funds.
(B) Distribution, Service and Shareholder Service Fees. The Trust, on behalf of the Allocation Funds, has entered into a distribution agreement with NYLIFE Distributors LLC (the “Distributor”), an affiliate of New York Life Investments. The Allocation Funds have adopted distribution plans (the “Plans”) in accordance with the provisions of Rule 12b-1 under the 1940 Act.
Pursuant to the Class A, Investor Class and Class R2 Plans, the Distributor receives a monthly fee from the Class A, Investor Class and Class R2 shares at an annual rate of 0.25% of the average daily net assets of the Class A, Investor Class and Class R2 shares for distribution and/or service activities as designated by the Distributor. Pursuant to the Class B and Class C Plans, Class B and Class C shares pay the
Distributor a monthly distribution fee at an annual rate of 0.75% of the average daily net assets of the Class B and Class C shares, along with a service fee at an annual rate of 0.25% of the average daily net assets of the Class B and Class C shares, for a total 12b-1 fee of 1.00%. Pursuant to the Class R3 and SIMPLE Class Plans, Class R3 and SIMPLE Class shares pay the Distributor a monthly distribution fee at an annual rate of 0.25% of the average daily net assets of the Class R3 and SIMPLE Class shares, along with a service fee at an annual rate of 0.25% of the average daily net assets of the Class R3 and SIMPLE Class shares, for a total 12b-1 fee of 0.50%. Class I shares are not subject to a distribution and/or service fee.
The Plans provide that the distribution and service fees are payable to the Distributor regardless of the amounts actually expended by the Distributor for distribution of the Allocation Funds' shares and service activities.
In accordance with the Shareholder Services Plans for the Class R1, Class R2 and Class R3 shares, the Manager has agreed to provide, through its affiliates or independent third parties, various shareholder and administrative support services to shareholders of the Class R1, Class R2 and Class R3 shares. For its services, the Manager, its affiliates or independent third-party service providers are entitled to a shareholder service fee accrued daily and paid monthly at an annual rate of 0.10% of the average daily net assets of the Class R1, Class R2 and Class R3 shares. This is in addition to any fees paid under the Class R2 and Class R3 Plans.
During the year ended October 31, 2022, shareholder service fees incurred by the Fund were as follows:
| MainStay Conservative Allocation Fund |
| Class R2 | $ 140 |
| Class R3 | 2,034 |
| |
| MainStay Moderate Allocation Fund |
| Class R2 | $ 166 |
| Class R3 | 1,588 |
| |
Notes to Financial Statements (continued)
| MainStay Growth Allocation Fund |
| Class R11 | $ 28 |
| Class R2 | 84 |
| Class R3 | 1,269 |
| |
| MainStay Equity Allocation Fund |
| Class R3 | $2,016 |
| 1. | Class R1 liquidated and no longer offered for sale as of April 28, 2022. |
(C) Sales Charges. The Allocation Funds were advised by the Distributor that the amount of initial sales charges retained on sales of each class of shares during the year ended October 31, 2022, was as follows:
| MainStay Conservative Allocation Fund | |
| Class A | $ 31,957 |
| Investor Class | 9,957 |
| |
| MainStay Moderate Allocation Fund | |
| Class A | $ 73,134 |
| Investor Class | 32,928 |
| |
| MainStay Growth Allocation Fund | |
| Class A | $ 74,368 |
| Investor Class | 30,838 |
| |
| MainStay Equity Allocation Fund | |
| Class A | $ 39,708 |
| Investor Class | 19,488 |
The Allocation Funds were also advised that the Distributor retained CDSCs on redemptions of Class A, Investor Class, Class B and Class C shares during the year ended October 31, 2022, as follows:
| MainStay Conservative Allocation Fund | |
| Class A | $ 22,119 |
| Class B | 31,720 |
| Class C | 1,614 |
| |
| MainStay Moderate Allocation Fund | |
| Class A | $ 9,942 |
| Investor Class | 34 |
| Class B | 3,516 |
| Class C | 2,465 |
| |
| MainStay Growth Allocation Fund | |
| Class A | $ 7,897 |
| Investor Class | 22 |
| Class B | 3,142 |
| Class C | 1,963 |
| |
| MainStay Equity Allocation Fund | |
| Class A | $ 4,511 |
| Investor Class | 1 |
| Class C | 600 |
(D) Transfer, Dividend Disbursing and Shareholder Servicing Agent. NYLIM Service Company LLC, an affiliate of New York Life Investments, is the Allocation Funds’ transfer, dividend disbursing and shareholder servicing agent pursuant to an agreement between NYLIM Service Company LLC and the Trust. NYLIM Service Company LLC has entered into an agreement with DST Asset Manager Solutions, Inc. ("DST"), pursuant to which DST performs certain transfer agent services on behalf of NYLIM Service Company LLC. New York Life Investments has contractually agreed to limit the transfer agency expenses charged to each of the Fund’s share classes to a maximum of 0.35% of that share class’s average daily net assets on an annual basis after deducting any applicable Fund or class-level expense reimbursement or small account fees. This agreement will remain in effect until August 31, 2023 and shall renew automatically for one-year terms unless New York Life Investments provides written notice of termination prior to the start of the next term or upon approval of the Board. During the year ended October 31, 2022, transfer agent expenses incurred by the Allocation Funds and any reimbursements, pursuant to the aforementioned Transfer Agency expense limitation agreement, were as follows:
| MainStay Conservative Allocation Fund | Expense | Waived |
| Class A | $ 200,393 | $ — |
| Investor Class | 99,448 | — |
| Class B | 22,685 | — |
| Class C | 64,982 | — |
| Class I | 3,926 | — |
| Class R2 | 74 | — |
| Class R3 | 1,079 | — |
| SIMPLE Class | 2,215 | — |
| 80 | MainStay Asset Allocation Funds |
| MainStay Moderate Allocation Fund | Expense | Waived |
| Class A | $ 353,618 | $ — |
| Investor Class | 288,803 | — |
| Class B | 66,034 | — |
| Class C | 78,044 | — |
| Class I | 5,194 | — |
| Class R2 | 88 | — |
| Class R3 | 847 | — |
| SIMPLE Class | 5,743 | — |
| MainStay Growth Allocation Fund | Expense | Waived |
| Class A | $ 398,281 | $ — |
| Investor Class | 336,111 | — |
| Class B | 73,335 | — |
| Class C | 76,325 | — |
| Class I | 4,691 | — |
| Class R11 | 16 | — |
| Class R2 | 51 | — |
| Class R3 | 760 | — |
| SIMPLE Class | 6,907 | — |
| 1. | Class R1 liquidated and no longer offered for sale as of April 28, 2022. |
| MainStay Equity Allocation Fund | Expense | Waived |
| Class A | $ 226,319 | $ — |
| Investor Class | 204,351 | — |
| Class B | 46,050 | — |
| Class C | 41,847 | — |
| Class I | 4,082 | — |
| Class R3 | 1,368 | — |
| SIMPLE Class | 2,579 | — |
(E) Small Account Fee. Shareholders with small accounts adversely impact the cost of providing transfer agency services. In an effort to reduce total transfer agency expenses, the Fund has implemented a small account fee on certain types of accounts. As described in the Fund's prospectus, certain shareholders with an account balance of less than $1,000 ($5,000 for Class A share accounts) are charged an annual per account fee of $20 (assessed semi-annually), the proceeds from which offset transfer agent fees as reflected in the Statement of Operations. This small account fee will not apply to certain types of accounts as described further in the Fund’s prospectus.
(F) Capital. As of October 31, 2022, New York Life and its affiliates beneficially held shares of the Allocation Funds with the values and percentages of net assets as follows:
| MainStay Conservative Allocation Fund | | |
| SIMPLE Class | $23,907 | 1.8% |
| |
| MainStay Moderate Allocation Fund | | |
| SIMPLE Class | $24,969 | 0.8% |
| |
| MainStay Growth Allocation Fund | | |
| SIMPLE Class | $26,428 | 0.9% |
| |
| MainStay Equity Allocation Fund | | |
| SIMPLE Class | $26,991 | 2.0% |
Note 4-Federal Income Tax
As of October 31, 2022, the cost and unrealized appreciation (depreciation) of each Allocation Fund’s investment portfolio, including applicable derivative contracts and other financial instruments, as determined on a federal income tax basis, were as follows:
| MainStay Conservative Allocation Fund |
| | Federal Tax
Cost | Gross
Unrealized
Appreciation | Gross
Unrealized
(Depreciation) | Net
Unrealized
Appreciation/
(Depreciation) |
| Investments in Securities | $426,155,619 | $11,965,549 | $(37,048,988) | $(25,083,439) |
| MainStay Moderate Allocation Fund |
| | Federal Tax
Cost | Gross
Unrealized
Appreciation | Gross
Unrealized
(Depreciation) | Net
Unrealized
Appreciation/
(Depreciation) |
| Investments in Securities | $748,962,807 | $42,489,099 | $(63,619,355) | $(21,130,256) |
| MainStay Growth Allocation Fund |
| | Federal Tax
Cost | Gross
Unrealized
Appreciation | Gross
Unrealized
(Depreciation) | Net
Unrealized
Appreciation/
(Depreciation) |
| Investments in Securities | $724,591,098 | $49,211,179 | $(28,296,600) | $20,914,579 |
Notes to Financial Statements (continued)
| MainStay Equity Allocation Fund |
| | Federal Tax
Cost | Gross
Unrealized
Appreciation | Gross
Unrealized
(Depreciation) | Net
Unrealized
Appreciation/
(Depreciation) |
| Investments in Securities | $382,857,259 | $24,457,264 | $(19,592,257) | $4,865,007 |
As of October 31, 2022, the components of accumulated gain (loss) on a tax basis were as follows:
| Fund | Ordinary
income | Accumulated
Capital
and Other
Gain (Loss) | Other
Temporary
Differences | Unrealized
Appreciation
(Depreciation) | Total
Accumulated
Gain (Loss) |
| MainStay Conservative Allocation Fund | $ 2,016 | $ 5,738,353 | $— | $(23,787,646) | $(18,047,277) |
| MainStay Moderate Allocation Fund | 4,871,458 | 26,852,994 | — | (19,073,632) | 12,650,820 |
| MainStay Growth Allocation Fund | 7,788,229 | 35,232,593 | — | 23,343,381 | 66,364,203 |
| MainStay Equity Allocation Fund | 4,741,560 | 30,082,089 | — | 6,030,525 | 40,854,174 |
The difference between book-basis and tax-basis unrealized appreciation (depreciation) is primarily due to straddle loss deferral and wash sales adjustments.
The following table discloses the current year reclassifications between total distributable earnings (loss) and additional paid-in capital arising from permanent differences; net assets as of October 31, 2022 were not affected.
| Fund | Total
Distributable
Earnings (Loss) | Additional
Paid-In
Capital |
| MainStay Conservative Allocation Fund | $ — | $ — |
| MainStay Moderate Allocation Fund | — | — |
| MainStay Growth Allocation Fund | (4,690,417) | 4,690,417 |
| MainStay Equity Allocation Fund | (1,273,875) | 1,273,875 |
The reclassifications for the Fund are primarily due to equalization.
During the years ended October 31, 2022 and October 31, 2021, the tax character of distributions paid as reflected in the Statements of Changes in Net Assets was as follows:
| | 2022 | | 2021 |
| Fund | Ordinary
Income | Long-Term
Capital Gains | Total | | Ordinary
Income | Long-Term
Capital Gains | Total |
| MainStay Conservative Allocation Fund | $19,955,173 | $18,576,345 | $38,531,518 | | $ 6,972,852 | $13,593,913 | $20,566,765 |
| MainStay Moderate Allocation Fund | 35,112,571 | 42,920,940 | 78,033,511 | | 13,578,645 | 29,884,143 | 43,462,788 |
| MainStay Growth Allocation Fund | 34,790,239 | 57,066,545 | 91,856,784 | | 8,096,188 | 33,118,632 | 41,214,820 |
| MainStay Equity Allocation Fund | 24,711,549 | 30,472,368 | 55,183,917 | | 2,177,837 | 17,824,989 | 20,002,826 |
Note 5–Custodian
JPMorgan is the custodian of cash and securities held by the Allocation Funds. Custodial fees are charged to each Allocation Fund based on each Allocation Fund's net assets and/or the market value of securities held by each Allocation Fund and the number of certain transactions incurred by each Allocation Fund.
Note 6–Line of Credit
The Allocation Funds and certain other funds managed by New York Life Investments maintain a line of credit with a syndicate of banks in order to secure a source of funds for temporary purposes to meet unanticipated or excessive redemption requests.
| 82 | MainStay Asset Allocation Funds |
Effective July 26, 2022, under the credit agreement (the “Credit Agreement”), the aggregate commitment amount is $600,000,000 with an additional uncommitted amount of $100,000,000. The commitment fee is an annual rate of 0.15% of the average commitment amount payable quarterly, regardless of usage, to JPMorgan, who serves as the agent to the syndicate. The commitment fee is allocated among the Allocation Funds and certain other funds managed by New York Life Investments based upon their respective net assets and other factors. Interest on any revolving credit loan is charged based upon the Federal Funds Rate, Daily Simple Secured Overnight Financing Rate ("SOFR") + 0.10%, or the Overnight Bank Funding Rate, whichever is higher. The Credit Agreement expires on July 25, 2023, although the Allocation Funds, certain other funds managed by New York Life Investments and the syndicate of banks may renew the Credit Agreement for an additional year on the same or different terms or enter into a credit agreement with a different syndicate of banks. Prior to July 26, 2022, the aggregate commitment amount and the commitment fee were the same as those under the current Credit Agreement. During the year ended October 31, 2022, there were no borrowings made or outstanding with respect to the Allocation Funds under the Credit Agreement.
Note 7–Interfund Lending Program
Pursuant to an exemptive order issued by the SEC, the Allocation Funds, along with certain other funds managed by New York Life Investments, may participate in an interfund lending program. The interfund lending program provides an alternative credit facility that permits the Allocation Funds and certain other funds managed by New York Life Investments to lend or borrow money for temporary purposes directly to or from one another, subject to the conditions of the exemptive order. During the year ended October 31, 2022, there were no interfund loans made or outstanding with respect to the Allocation Funds.
Note 8–Purchases and Sales of Securities (in 000’s)
During the year ended October 31, 2022, purchases and sales of securities were as follows:
| Fund | Purchases | Sales |
| MainStay Conservative Allocation Fund | $158,062 | $162,962 |
| MainStay Moderate Allocation Fund | 269,697 | 233,837 |
| MainStay Growth Allocation Fund | 213,866 | 184,697 |
| MainStay Equity Allocation Fund | 105,435 | 70,569 |
Note 9–Capital Share Transactions
Transactions in capital shares for the years ended October 31, 2022 and October 31, 2021, were as follows:
MainStay Conservative Allocation Fund
| Class A | Shares | Amount |
| Year ended October 31, 2022: | | |
| Shares sold | 3,241,218 | $ 39,327,539 |
| Shares issued to shareholders in reinvestment of distributions | 2,539,638 | 31,663,367 |
| Shares redeemed | (6,009,934) | (70,234,602) |
| Net increase (decrease) in shares outstanding before conversion | (229,078) | 756,304 |
| Shares converted into Class A (See Note 1) | 565,960 | 6,874,220 |
| Net increase (decrease) | 336,882 | $ 7,630,524 |
| Year ended October 31, 2021: | | |
| Shares sold | 3,622,029 | $ 47,604,056 |
| Shares issued to shareholders in reinvestment of distributions | 1,278,445 | 16,300,876 |
| Shares redeemed | (4,209,736) | (55,202,891) |
| Net increase (decrease) in shares outstanding before conversion | 690,738 | 8,702,041 |
| Shares converted into Class A (See Note 1) | 1,278,968 | 16,732,719 |
| Shares converted from Class A (See Note 1) | (3,704) | (47,762) |
| Net increase (decrease) | 1,966,002 | $ 25,386,998 |
| |
| Investor Class | Shares | Amount |
| Year ended October 31, 2022: | | |
| Shares sold | 372,325 | $ 4,417,522 |
| Shares issued to shareholders in reinvestment of distributions | 237,886 | 2,970,897 |
| Shares redeemed | (405,256) | (4,754,108) |
| Net increase (decrease) in shares outstanding before conversion | 204,955 | 2,634,311 |
| Shares converted into Investor Class (See Note 1) | 136,945 | 1,618,308 |
| Shares converted from Investor Class (See Note 1) | (253,600) | (3,165,856) |
| Net increase (decrease) | 88,300 | $ 1,086,763 |
| Year ended October 31, 2021: | | |
| Shares sold | 453,396 | $ 5,928,657 |
| Shares issued to shareholders in reinvestment of distributions | 135,865 | 1,729,851 |
| Shares redeemed | (393,553) | (5,154,246) |
| Net increase (decrease) in shares outstanding before conversion | 195,708 | 2,504,262 |
| Shares converted into Investor Class (See Note 1) | 198,558 | 2,602,063 |
| Shares converted from Investor Class (See Note 1) | (766,422) | (10,067,218) |
| Net increase (decrease) | (372,156) | $ (4,960,893) |
| |
Notes to Financial Statements (continued)
| Class B | Shares | Amount |
| Year ended October 31, 2022: | | |
| Shares sold | 14,547 | $ 166,793 |
| Shares issued to shareholders in reinvestment of distributions | 56,288 | 699,015 |
| Shares redeemed | (177,255) | (2,097,364) |
| Net increase (decrease) in shares outstanding before conversion | (106,420) | (1,231,556) |
| Shares converted from Class B (See Note 1) | (213,538) | (2,488,526) |
| Net increase (decrease) | (319,958) | $ (3,720,082) |
| Year ended October 31, 2021: | | |
| Shares sold | 80,278 | $ 1,016,936 |
| Shares issued to shareholders in reinvestment of distributions | 38,276 | 480,251 |
| Shares redeemed | (139,174) | (1,791,406) |
| Net increase (decrease) in shares outstanding before conversion | (20,620) | (294,219) |
| Shares converted from Class B (See Note 1) | (207,082) | (2,691,195) |
| Net increase (decrease) | (227,702) | $ (2,985,414) |
| |
| Class C | Shares | Amount |
| Year ended October 31, 2022: | | |
| Shares sold | 129,326 | $ 1,517,177 |
| Shares issued to shareholders in reinvestment of distributions | 153,626 | 1,904,640 |
| Shares redeemed | (565,296) | (6,511,415) |
| Net increase (decrease) in shares outstanding before conversion | (282,344) | (3,089,598) |
| Shares converted from Class C (See Note 1) | (244,856) | (2,838,146) |
| Net increase (decrease) | (527,200) | $ (5,927,744) |
| Year ended October 31, 2021: | | |
| Shares sold | 232,887 | $ 2,996,141 |
| Shares issued to shareholders in reinvestment of distributions | 111,652 | 1,400,695 |
| Shares redeemed | (634,837) | (8,169,894) |
| Net increase (decrease) in shares outstanding before conversion | (290,298) | (3,773,058) |
| Shares converted from Class C (See Note 1) | (515,459) | (6,575,466) |
| Net increase (decrease) | (805,757) | $(10,348,524) |
| |
| Class I | Shares | Amount |
| Year ended October 31, 2022: | | |
| Shares sold | 53,975 | $ 650,165 |
| Shares issued to shareholders in reinvestment of distributions | 52,596 | 662,856 |
| Shares redeemed | (167,870) | (2,011,174) |
| Net increase (decrease) | (61,299) | $ (698,153) |
| Year ended October 31, 2021: | | |
| Shares sold | 119,101 | $ 1,583,117 |
| Shares issued to shareholders in reinvestment of distributions | 29,744 | 383,843 |
| Shares redeemed | (135,168) | (1,804,019) |
| Net increase (decrease) | 13,677 | $ 162,941 |
| |
| Class R2 | Shares | Amount |
| Year ended October 31, 2022: | | |
| Shares sold | 1,981 | $ 22,863 |
| Shares issued to shareholders in reinvestment of distributions | 883 | 10,998 |
| Shares redeemed | (85) | (960) |
| Net increase (decrease) | 2,779 | $ 32,901 |
| Year ended October 31, 2021: | | |
| Shares sold | 1,144 | $ 15,213 |
| Shares issued to shareholders in reinvestment of distributions | 389 | 4,956 |
| Shares redeemed | (48) | (629) |
| Net increase (decrease) | 1,485 | $ 19,540 |
| |
| Class R3 | Shares | Amount |
| Year ended October 31, 2022: | | |
| Shares sold | 59,563 | $ 695,614 |
| Shares issued to shareholders in reinvestment of distributions | 10,741 | 132,994 |
| Shares redeemed | (782) | (10,227) |
| Net increase (decrease) | 69,522 | $ 818,381 |
| Year ended October 31, 2021: | | |
| Shares sold | 44,607 | $ 584,978 |
| Shares issued to shareholders in reinvestment of distributions | 3,966 | 50,389 |
| Shares redeemed | (15,101) | (199,590) |
| Net increase (decrease) | 33,472 | $ 435,777 |
| |
| SIMPLE Class | Shares | Amount |
| Year ended October 31, 2022: | | |
| Shares sold | 105,252 | $ 1,246,425 |
| Shares issued to shareholders in reinvestment of distributions | 3,382 | 41,449 |
| Shares redeemed | (9,713) | (114,337) |
| Net increase (decrease) | 98,921 | $ 1,173,537 |
| Year ended October 31, 2021: | | |
| Shares sold | 17,345 | $ 229,747 |
| Shares issued to shareholders in reinvestment of distributions | 301 | 3,848 |
| Shares redeemed | (969) | (12,907) |
| Net increase (decrease) in shares outstanding before conversion | 16,677 | 220,688 |
| Shares converted into SIMPLE Class (See Note 1) | 3,638 | 46,859 |
| Net increase (decrease) | 20,315 | $ 267,547 |
| 84 | MainStay Asset Allocation Funds |
MainStay Moderate Allocation Fund
| Class A | Shares | Amount |
| Year ended October 31, 2022: | | |
| Shares sold | 4,310,609 | $ 58,632,973 |
| Shares issued to shareholders in reinvestment of distributions | 4,409,392 | 63,495,168 |
| Shares redeemed | (6,087,255) | (80,493,181) |
| Net increase (decrease) in shares outstanding before conversion | 2,632,746 | 41,634,960 |
| Shares converted into Class A (See Note 1) | 1,138,271 | 15,841,670 |
| Shares converted from Class A (See Note 1) | (25,139) | (377,349) |
| Net increase (decrease) | 3,745,878 | $ 57,099,281 |
| Year ended October 31, 2021: | | |
| Shares sold | 4,076,035 | $ 60,817,637 |
| Shares issued to shareholders in reinvestment of distributions | 2,419,820 | 34,046,873 |
| Shares redeemed | (5,667,732) | (83,972,232) |
| Net increase (decrease) in shares outstanding before conversion | 828,123 | 10,892,278 |
| Shares converted into Class A (See Note 1) | 2,964,650 | 43,988,773 |
| Shares converted from Class A (See Note 1) | (10,385) | (152,287) |
| Net increase (decrease) | 3,782,388 | $ 54,728,764 |
| |
| Investor Class | Shares | Amount |
| Year ended October 31, 2022: | | |
| Shares sold | 1,047,643 | $ 14,035,989 |
| Shares issued to shareholders in reinvestment of distributions | 583,028 | 8,424,747 |
| Shares redeemed | (762,705) | (10,139,771) |
| Net increase (decrease) in shares outstanding before conversion | 867,966 | 12,320,965 |
| Shares converted into Investor Class (See Note 1) | 233,726 | 3,120,077 |
| Shares converted from Investor Class (See Note 1) | (644,002) | (9,178,421) |
| Net increase (decrease) | 457,690 | $ 6,262,621 |
| Year ended October 31, 2021: | | |
| Shares sold | 1,247,981 | $ 18,511,785 |
| Shares issued to shareholders in reinvestment of distributions | 382,348 | 5,394,936 |
| Shares redeemed | (759,247) | (11,250,524) |
| Net increase (decrease) in shares outstanding before conversion | 871,082 | 12,656,197 |
| Shares converted into Investor Class (See Note 1) | 286,927 | 4,289,689 |
| Shares converted from Investor Class (See Note 1) | (2,276,751) | (33,878,257) |
| Net increase (decrease) | (1,118,742) | $(16,932,371) |
| |
| Class B | Shares | Amount |
| Year ended October 31, 2022: | | |
| Shares sold | 17,417 | $ 223,363 |
| Shares issued to shareholders in reinvestment of distributions | 137,033 | 1,960,943 |
| Shares redeemed | (191,411) | (2,531,471) |
| Net increase (decrease) in shares outstanding before conversion | (36,961) | (347,165) |
| Shares converted from Class B (See Note 1) | (471,190) | (6,252,362) |
| Net increase (decrease) | (508,151) | $ (6,599,527) |
| Year ended October 31, 2021: | | |
| Shares sold | 29,004 | $ 430,134 |
| Shares issued to shareholders in reinvestment of distributions | 103,272 | 1,444,773 |
| Shares redeemed | (284,806) | (4,171,780) |
| Net increase (decrease) in shares outstanding before conversion | (152,530) | (2,296,873) |
| Shares converted from Class B (See Note 1) | (488,746) | (7,231,334) |
| Net increase (decrease) | (641,276) | $ (9,528,207) |
| |
| Class C | Shares | Amount |
| Year ended October 31, 2022: | | |
| Shares sold | 151,925 | $ 2,001,192 |
| Shares issued to shareholders in reinvestment of distributions | 160,147 | 2,290,108 |
| Shares redeemed | (379,909) | (5,012,594) |
| Net increase (decrease) in shares outstanding before conversion | (67,837) | (721,294) |
| Shares converted from Class C (See Note 1) | (264,665) | (3,523,021) |
| Net increase (decrease) | (332,502) | $ (4,244,315) |
| Year ended October 31, 2021: | | |
| Shares sold | 182,775 | $ 2,686,085 |
| Shares issued to shareholders in reinvestment of distributions | 123,469 | 1,726,099 |
| Shares redeemed | (526,780) | (7,687,350) |
| Net increase (decrease) in shares outstanding before conversion | (220,536) | (3,275,166) |
| Shares converted from Class C (See Note 1) | (496,125) | (7,212,281) |
| Net increase (decrease) | (716,661) | $(10,487,447) |
| |
Notes to Financial Statements (continued)
| Class I | Shares | Amount |
| Year ended October 31, 2022: | | |
| Shares sold | 129,798 | $ 1,768,839 |
| Shares issued to shareholders in reinvestment of distributions | 70,570 | 1,023,972 |
| Shares redeemed | (239,452) | (3,218,447) |
| Net increase (decrease) in shares outstanding before conversion | (39,084) | (425,636) |
| Shares converted into Class I (See Note 1) | 24,366 | 369,406 |
| Net increase (decrease) | (14,718) | $ (56,230) |
| Year ended October 31, 2021: | | |
| Shares sold | 139,907 | $ 2,077,360 |
| Shares issued to shareholders in reinvestment of distributions | 36,516 | 517,062 |
| Shares redeemed | (109,545) | (1,612,749) |
| Net increase (decrease) in shares outstanding before conversion | 66,878 | 981,673 |
| Shares converted into Class I (See Note 1) | 5,153 | 76,769 |
| Net increase (decrease) | 72,031 | $ 1,058,442 |
| |
| Class R2 | Shares | Amount |
| Year ended October 31, 2022: | | |
| Shares sold | 559 | $ 7,338 |
| Shares issued to shareholders in reinvestment of distributions | 1,079 | 15,531 |
| Shares redeemed | (186) | (2,189) |
| Net increase (decrease) | 1,452 | $ 20,680 |
| Year ended October 31, 2021: | | |
| Shares sold | 188 | $ 2,922 |
| Shares issued to shareholders in reinvestment of distributions | 591 | 8,311 |
| Shares redeemed | — | (2) |
| Net increase (decrease) | 779 | $ 11,231 |
| |
| Class R3 | Shares | Amount |
| Year ended October 31, 2022: | | |
| Shares sold | 27,980 | $ 376,716 |
| Shares issued to shareholders in reinvestment of distributions | 9,668 | 139,128 |
| Shares redeemed | (5,243) | (71,327) |
| Net increase (decrease) | 32,405 | $ 444,517 |
| Year ended October 31, 2021: | | |
| Shares sold | 45,884 | $ 676,042 |
| Shares issued to shareholders in reinvestment of distributions | 3,804 | 53,481 |
| Shares redeemed | (21,774) | (318,343) |
| Net increase (decrease) | 27,914 | $ 411,180 |
| |
| SIMPLE Class | Shares | Amount |
| Year ended October 31, 2022: | | |
| Shares sold | 196,586 | $ 2,591,082 |
| Shares issued to shareholders in reinvestment of distributions | 6,972 | 100,741 |
| Shares redeemed | (9,826) | (131,009) |
| Net increase (decrease) | 193,732 | $ 2,560,814 |
| Year ended October 31, 2021: | | |
| Shares sold | 49,066 | $ 730,987 |
| Shares issued to shareholders in reinvestment of distributions | 401 | 5,659 |
| Shares redeemed | (5,879) | (85,704) |
| Net increase (decrease) in shares outstanding before conversion | 43,588 | 650,942 |
| Shares converted into SIMPLE Class (See Note 1) | 8,204 | 118,928 |
| Net increase (decrease) | 51,792 | $ 769,870 |
MainStay Growth Allocation Fund
| Class A | Shares | Amount |
| Year ended October 31, 2022: | | |
| Shares sold | 2,998,767 | $ 45,352,741 |
| Shares issued to shareholders in reinvestment of distributions | 4,508,464 | 73,578,134 |
| Shares redeemed | (5,294,349) | (79,259,848) |
| Net increase (decrease) in shares outstanding before conversion | 2,212,882 | 39,671,027 |
| Shares converted into Class A (See Note 1) | 1,097,499 | 17,558,142 |
| Shares converted from Class A (See Note 1) | (699) | (10,390) |
| Net increase (decrease) | 3,309,682 | $ 57,218,779 |
| Year ended October 31, 2021: | | |
| Shares sold | 3,172,649 | $ 53,192,811 |
| Shares issued to shareholders in reinvestment of distributions | 2,020,572 | 31,376,297 |
| Shares redeemed | (5,813,797) | (96,740,855) |
| Net increase (decrease) in shares outstanding before conversion | (620,576) | (12,171,747) |
| Shares converted into Class A (See Note 1) | 3,466,843 | 57,511,022 |
| Shares converted from Class A (See Note 1) | (24,581) | (396,778) |
| Net increase (decrease) | 2,821,686 | $ 44,942,497 |
| |
| 86 | MainStay Asset Allocation Funds |
| Investor Class | Shares | Amount |
| Year ended October 31, 2022: | | |
| Shares sold | 853,832 | $ 12,862,862 |
| Shares issued to shareholders in reinvestment of distributions | 704,025 | 11,517,853 |
| Shares redeemed | (677,404) | (10,185,045) |
| Net increase (decrease) in shares outstanding before conversion | 880,453 | 14,195,670 |
| Shares converted into Investor Class (See Note 1) | 226,568 | 3,404,061 |
| Shares converted from Investor Class (See Note 1) | (690,453) | (11,396,445) |
| Net increase (decrease) | 416,568 | $ 6,203,286 |
| Year ended October 31, 2021: | | |
| Shares sold | 1,087,072 | $ 18,055,508 |
| Shares issued to shareholders in reinvestment of distributions | 398,601 | 6,206,219 |
| Shares redeemed | (841,538) | (13,956,069) |
| Net increase (decrease) in shares outstanding before conversion | 644,135 | 10,305,658 |
| Shares converted into Investor Class (See Note 1) | 246,679 | 4,143,950 |
| Shares converted from Investor Class (See Note 1) | (2,888,823) | (47,952,711) |
| Net increase (decrease) | (1,998,009) | $(33,503,103) |
| |
| Class B | Shares | Amount |
| Year ended October 31, 2022: | | |
| Shares sold | 4,043 | $ 58,430 |
| Shares issued to shareholders in reinvestment of distributions | 163,164 | 2,633,473 |
| Shares redeemed | (177,997) | (2,635,721) |
| Net increase (decrease) in shares outstanding before conversion | (10,790) | 56,182 |
| Shares converted from Class B (See Note 1) | (476,327) | (7,059,122) |
| Net increase (decrease) | (487,117) | $ (7,002,940) |
| Year ended October 31, 2021: | | |
| Shares sold | 9,479 | $ 154,168 |
| Shares issued to shareholders in reinvestment of distributions | 95,067 | 1,462,126 |
| Shares redeemed | (251,842) | (4,127,837) |
| Net increase (decrease) in shares outstanding before conversion | (147,296) | (2,511,543) |
| Shares converted from Class B (See Note 1) | (442,986) | (7,342,690) |
| Net increase (decrease) | (590,282) | $ (9,854,233) |
| |
| Class C | Shares | Amount |
| Year ended October 31, 2022: | | |
| Shares sold | 125,156 | $ 1,855,227 |
| Shares issued to shareholders in reinvestment of distributions | 161,426 | 2,607,023 |
| Shares redeemed | (289,182) | (4,330,282) |
| Net increase (decrease) in shares outstanding before conversion | (2,600) | 131,968 |
| Shares converted from Class C (See Note 1) | (165,079) | (2,480,095) |
| Net increase (decrease) | (167,679) | $ (2,348,127) |
| Year ended October 31, 2021: | | |
| Shares sold | 132,849 | $ 2,172,795 |
| Shares issued to shareholders in reinvestment of distributions | 95,378 | 1,467,859 |
| Shares redeemed | (401,610) | (6,569,620) |
| Net increase (decrease) in shares outstanding before conversion | (173,383) | (2,928,966) |
| Shares converted from Class C (See Note 1) | (391,551) | (6,382,146) |
| Net increase (decrease) | (564,934) | $ (9,311,112) |
| |
| Class I | Shares | Amount |
| Year ended October 31, 2022: | | |
| Shares sold | 205,566 | $ 2,969,610 |
| Shares issued to shareholders in reinvestment of distributions | 46,454 | 768,348 |
| Shares redeemed | (293,545) | (4,850,249) |
| Net increase (decrease) | (41,525) | $ (1,112,291) |
| Year ended October 31, 2021: | | |
| Shares sold | 148,062 | $ 2,486,680 |
| Shares issued to shareholders in reinvestment of distributions | 30,069 | 472,689 |
| Shares redeemed | (121,741) | (2,087,635) |
| Net increase (decrease) in shares outstanding before conversion | 56,390 | 871,734 |
| Shares converted into Class I (See Note 1) | 2,890 | 45,971 |
| Shares converted from Class I (See Note 1) | (569) | (9,450) |
| Net increase (decrease) | 58,711 | $ 908,255 |
| |
| Class R1 | Shares | Amount |
| Year ended October 31, 2022: (a) | | |
| Shares sold | 217 | $ 3,599 |
| Shares issued to shareholders in reinvestment of distributions | 366 | 6,054 |
| Shares redeemed | (3,812) | (57,535) |
| Net increase (decrease) | (3,229) | $ (47,882) |
| Year ended October 31, 2021: | | |
| Shares sold | 927 | $ 15,923 |
| Shares issued to shareholders in reinvestment of distributions | 122 | 1,920 |
| Shares redeemed | (13) | (231) |
| Net increase (decrease) | 1,036 | $ 17,612 |
| |
Notes to Financial Statements (continued)
| Class R2 | Shares | Amount |
| Year ended October 31, 2022: | | |
| Shares issued to shareholders in reinvestment of distributions | 565 | $ 9,226 |
| Shares redeemed | (60) | (814) |
| Net increase (decrease) | 505 | $ 8,412 |
| Year ended October 31, 2021: | | |
| Shares issued to shareholders in reinvestment of distributions | 322 | $ 4,993 |
| Shares redeemed | (1,354) | (23,014) |
| Net increase (decrease) | (1,032) | $ (18,021) |
| |
| Class R3 | Shares | Amount |
| Year ended October 31, 2022: | | |
| Shares sold | 20,556 | $ 321,992 |
| Shares issued to shareholders in reinvestment of distributions | 9,438 | 153,374 |
| Shares redeemed | (46,301) | (705,174) |
| Net increase (decrease) in shares outstanding before conversion | (16,307) | (229,808) |
| Shares converted from Class R3 (See Note 1) | (1,210) | (16,151) |
| Net increase (decrease) | (17,517) | $ (245,959) |
| Year ended October 31, 2021: | | |
| Shares sold | 34,815 | $ 583,481 |
| Shares issued to shareholders in reinvestment of distributions | 3,423 | 52,983 |
| Shares redeemed | (23,149) | (385,476) |
| Net increase (decrease) | 15,089 | $ 250,988 |
| |
| SIMPLE Class | Shares | Amount |
| Year ended October 31, 2022: | | |
| Shares sold | 137,751 | $ 2,062,207 |
| Shares issued to shareholders in reinvestment of distributions | 11,687 | 191,425 |
| Shares redeemed | (13,003) | (197,173) |
| Net increase (decrease) | 136,435 | $ 2,056,459 |
| Year ended October 31, 2021: | | |
| Shares sold | 64,224 | $ 1,080,104 |
| Shares issued to shareholders in reinvestment of distributions | 1,052 | 16,390 |
| Shares redeemed | (13,851) | (226,855) |
| Net increase (decrease) in shares outstanding before conversion | 51,425 | 869,639 |
| Shares converted into SIMPLE Class (See Note 1) | 23,642 | 382,832 |
| Net increase (decrease) | 75,067 | $ 1,252,471 |
| (a) | Class R1 liquidated and no longer offered for sale as of April 28, 2022. |
MainStay Equity Allocation Fund
| Class A | Shares | Amount |
| Year ended October 31, 2022: | | |
| Shares sold | 1,692,419 | $ 27,586,671 |
| Shares issued to shareholders in reinvestment of distributions | 2,377,051 | 42,430,363 |
| Shares redeemed | (2,572,629) | (41,487,935) |
| Net increase (decrease) in shares outstanding before conversion | 1,496,841 | 28,529,099 |
| Shares converted into Class A (See Note 1) | 540,027 | 9,463,094 |
| Shares converted from Class A (See Note 1) | (34) | (569) |
| Net increase (decrease) | 2,036,834 | $ 37,991,624 |
| Year ended October 31, 2021: | | |
| Shares sold | 1,494,848 | $ 27,006,566 |
| Shares issued to shareholders in reinvestment of distributions | 872,425 | 14,499,695 |
| Shares redeemed | (2,978,513) | (53,821,402) |
| Net increase (decrease) in shares outstanding before conversion | (611,240) | (12,315,141) |
| Shares converted into Class A (See Note 1) | 2,041,426 | 36,649,970 |
| Shares converted from Class A (See Note 1) | (11,978) | (210,797) |
| Net increase (decrease) | 1,418,208 | $ 24,124,032 |
| |
| Investor Class | Shares | Amount |
| Year ended October 31, 2022: | | |
| Shares sold | 502,859 | $ 8,114,965 |
| Shares issued to shareholders in reinvestment of distributions | 438,877 | 7,833,960 |
| Shares redeemed | (374,514) | (6,052,697) |
| Net increase (decrease) in shares outstanding before conversion | 567,222 | 9,896,228 |
| Shares converted into Investor Class (See Note 1) | 108,545 | 1,770,436 |
| Shares converted from Investor Class (See Note 1) | (345,839) | (6,278,887) |
| Net increase (decrease) | 329,928 | $ 5,387,777 |
| Year ended October 31, 2021: | | |
| Shares sold | 653,167 | $ 11,715,859 |
| Shares issued to shareholders in reinvestment of distributions | 202,761 | 3,371,913 |
| Shares redeemed | (436,864) | (7,851,483) |
| Net increase (decrease) in shares outstanding before conversion | 419,064 | 7,236,289 |
| Shares converted into Investor Class (See Note 1) | 127,858 | 2,335,995 |
| Shares converted from Investor Class (See Note 1) | (1,802,767) | (32,287,138) |
| Net increase (decrease) | (1,255,845) | $(22,714,854) |
| |
| 88 | MainStay Asset Allocation Funds |
| Class B | Shares | Amount |
| Year ended October 31, 2022: | | |
| Shares sold | 2,093 | $ 35,116 |
| Shares issued to shareholders in reinvestment of distributions | 108,219 | 1,866,768 |
| Shares redeemed | (100,442) | (1,573,542) |
| Net increase (decrease) in shares outstanding before conversion | 9,870 | 328,342 |
| Shares converted from Class B (See Note 1) | (235,669) | (3,698,337) |
| Net increase (decrease) | (225,799) | $ (3,369,995) |
| Year ended October 31, 2021: | | |
| Shares sold | 12,121 | $ 211,656 |
| Shares issued to shareholders in reinvestment of distributions | 56,825 | 916,583 |
| Shares redeemed | (199,101) | (3,459,502) |
| Net increase (decrease) in shares outstanding before conversion | (130,155) | (2,331,263) |
| Shares converted from Class B (See Note 1) | (255,906) | (4,519,402) |
| Net increase (decrease) | (386,061) | $ (6,850,665) |
| |
| Class C | Shares | Amount |
| Year ended October 31, 2022: | | |
| Shares sold | 59,338 | $ 910,154 |
| Shares issued to shareholders in reinvestment of distributions | 95,825 | 1,656,787 |
| Shares redeemed | (142,326) | (2,243,135) |
| Net increase (decrease) in shares outstanding before conversion | 12,837 | 323,806 |
| Shares converted from Class C (See Note 1) | (77,670) | (1,239,389) |
| Net increase (decrease) | (64,833) | $ (915,583) |
| Year ended October 31, 2021: | | |
| Shares sold | 65,817 | $ 1,155,539 |
| Shares issued to shareholders in reinvestment of distributions | 48,679 | 786,655 |
| Shares redeemed | (241,072) | (4,191,419) |
| Net increase (decrease) in shares outstanding before conversion | (126,576) | (2,249,225) |
| Shares converted from Class C (See Note 1) | (131,844) | (2,306,142) |
| Net increase (decrease) | (258,420) | $ (4,555,367) |
| |
| Class I | Shares | Amount |
| Year ended October 31, 2022: | | |
| Shares sold | 60,046 | $ 1,056,549 |
| Shares issued to shareholders in reinvestment of distributions | 42,339 | 771,834 |
| Shares redeemed | (63,110) | (1,064,905) |
| Net increase (decrease) | 39,275 | $ 763,478 |
| Year ended October 31, 2021: | | |
| Shares sold | 59,525 | $ 1,085,155 |
| Shares issued to shareholders in reinvestment of distributions | 15,490 | 262,250 |
| Shares redeemed | (59,385) | (1,095,430) |
| Net increase (decrease) in shares outstanding before conversion | 15,630 | 251,975 |
| Shares converted into Class I (See Note 1) | 1,172 | 22,557 |
| Net increase (decrease) | 16,802 | $ 274,532 |
| |
| Class R3 | Shares | Amount |
| Year ended October 31, 2022: | | |
| Shares sold | 19,970 | $ 324,343 |
| Shares issued to shareholders in reinvestment of distributions | 11,666 | 206,725 |
| Shares redeemed | (4,037) | (71,215) |
| Net increase (decrease) in shares outstanding before conversion | 27,599 | 459,853 |
| Shares converted from Class R3 (See Note 1) | (1,163) | (16,348) |
| Net increase (decrease) | 26,436 | $ 443,505 |
| Year ended October 31, 2021: | | |
| Shares sold | 25,036 | $ 444,290 |
| Shares issued to shareholders in reinvestment of distributions | 3,904 | 64,497 |
| Shares redeemed | (13,180) | (240,690) |
| Net increase (decrease) | 15,760 | $ 268,097 |
| |
| SIMPLE Class | Shares | Amount |
| Year ended October 31, 2022: | | |
| Shares sold | 70,829 | $ 1,110,829 |
| Shares issued to shareholders in reinvestment of distributions | 3,896 | 69,622 |
| Shares redeemed | (2,539) | (41,112) |
| Net increase (decrease) | 72,186 | $ 1,139,339 |
| Year ended October 31, 2021: | | |
| Shares sold | 19,167 | $ 353,167 |
| Shares issued to shareholders in reinvestment of distributions | 237 | 3,947 |
| Shares redeemed | (15,601) | (272,559) |
| Net increase (decrease) in shares outstanding before conversion | 3,803 | 84,555 |
| Shares converted into SIMPLE Class (See Note 1) | 18,059 | 314,957 |
| Net increase (decrease) | 21,862 | $ 399,512 |
Notes to Financial Statements (continued)
Note 10–Other Matters
As of the date of this report, interest rates in the United States and many parts of the world, including certain European countries, are ascending from historically low levels. Thus, the Fund currently faces a heightened level of risk associated with rising interest rates. This could be driven by a variety of factors, including but not limited to central bank monetary policies, changing inflation or real growth rates, general economic conditions, increasing bond issuances or reduced market demand for low yielding investments.
An outbreak of COVID-19, first detected in December 2019, has developed into a global pandemic and has resulted in travel restrictions, closure of international borders, certain businesses and securities markets, restrictions on securities trading activities, prolonged quarantines, supply chain disruptions, and lower consumer demand, as well as general concern and uncertainty. In 2022, many countries lifted some or all restrictions related to COVID-19. However, the continued impact of COVID-19 and related variants is uncertain and could further adversely affect the global economy, national economies, individual issuers and capital markets in unforeseeable ways and result in a substantial and extended economic downturn. Developments that disrupt global economies and financial markets, such as COVID-19, may magnify factors that affect the Allocation Funds' performance.
Note 11–Subsequent Events
In connection with the preparation of the financial statements of the Allocation Funds as of and for the year ended October 31, 2022, events and transactions subsequent to October 31, 2022, through the date the financial statements were issued have been evaluated by the Manager for possible adjustment and/or disclosure. No subsequent events requiring financial statement adjustment or disclosure have been identified.
| 90 | MainStay Asset Allocation Funds |
Report of Independent Registered Public Accounting Firm
To the Shareholders of the Fund and Board of Trustees
MainStay Funds Trust:
Opinion on the Financial Statements
We have audited the accompanying statements of assets and liabilities of MainStay Conservative Allocation Fund, MainStay Moderate Allocation Fund, MainStay Growth Allocation Fund, and MainStay Equity Allocation Fund (each a Fund and collectively, the Funds), four of the funds constituting MainStay Funds Trust, including the portfolios of investments, as of October 31, 2022, the related statements of operations for the year then ended, the statements of changes in net assets for each of the years in the two-year period then ended, and the related notes (collectively, the financial statements) and the financial highlights for each of the years or periods in the five-year period then ended. In our opinion, the financial statements and financial highlights present fairly, in all material respects, the financial position of the Funds as of October 31, 2022, the results of their operations for the year then ended, the changes in their net assets for each of the years in the two-year period then ended, and the financial highlights for each of the years or periods in the five-year period then ended, in conformity with U.S. generally accepted accounting principles.
Basis for Opinion
These financial statements and financial highlights are the responsibility of the Funds' management. Our responsibility is to express an opinion on these financial statements and financial highlights based on our audits. We are a public accounting firm registered with the Public Company Accounting Oversight Board (United States) (PCAOB) and are required to be independent with respect to the Funds in accordance with the U.S. federal securities laws and the applicable rules and regulations of the Securities and Exchange Commission and the PCAOB.
We conducted our audits in accordance with the standards of the PCAOB. Those standards require that we plan and perform the audit to obtain reasonable assurance about whether the financial statements and financial highlights are free of material misstatement, whether due to error or fraud. Our audits included performing procedures to assess the risks of material misstatement of the financial statements and financial highlights, whether due to error or fraud, and performing procedures that respond to those risks. Such procedures included examining, on a test basis, evidence regarding the amounts and disclosures in the financial statements and financial highlights. Such procedures also included confirmation of securities owned as of October 31, 2022, by correspondence with the custodian, the transfer agent and brokers; when replies were not received from brokers, we performed other auditing procedures. Our audits also included evaluating the accounting principles used and significant estimates made by management, as well as evaluating the overall presentation of the financial statements and financial highlights. We believe that our audits provide a reasonable basis for our opinion.

We have served as the auditor of one or more New York Life Investment Management investment companies since 2003.
Philadelphia, Pennsylvania
December 23, 2022
Federal Income Tax Information
(Unaudited)
The Allocation Funds are required under the Internal Revenue Code to advise shareholders in a written statement as to the federal tax status of dividends paid by the Allocation Funds during such fiscal years.
Accordingly, the Allocation Funds paid the following as long term capital gain distributions.
| MainStay Conservative Allocation Fund | $18,254,835 |
| MainStay Moderate Allocation Fund | 42,917,104 |
| MainStay Growth Allocation Fund | 57,066,545 |
| MainStay Equity Allocation Fund | 30,472,368 |
For the fiscal year ended October 31, 2022, the Allocation Funds designated approximately the following amounts under the Internal Revenue Code as qualified dividend income eligible for reduced tax rates.
| | QDI$ |
| MainStay Conservative Allocation Fund | $ 3,399,829 |
| MainStay Moderate Allocation Fund | 8,534,746 |
| MainStay Growth Allocation Fund | 10,908,663 |
| MainStay Equity Allocation Fund | 9,930,414 |
The dividends paid by the following Allocation Funds during the fiscal year ended October 31, 2022 which are not designated as capital gain distributions should be multiplied by the following percentages to arrive at the amount eligible for the corporate dividend received deduction.
| | DRD% |
| MainStay Conservative Allocation Fund | 9.34% |
| MainStay Moderate Allocation Fund | 14.05% |
| MainStay Growth Allocation Fund | 17.91% |
| MainStay Equity Allocation Fund | 24.15% |
The list of qualified Fund of Funds passing through foreign tax credits for the tax year ended October 31, 2022 is listed below.
| | FTC$ |
| MainStay Conservative Allocation Fund | $126,352 |
| MainStay Moderate Allocation Fund | 364,161 |
| MainStay Growth Allocation Fund | 527,610 |
| MainStay Equity Allocation Fund | 371,856 |
In February 2023, shareholders will receive an IRS Form 1099-DIV or substitute Form 1099, which will show the federal tax status of the distributions received by shareholders in calendar year 2022. The amounts that will be reported on such 1099-DIV or substitute Form 1099 will be the amounts you are to use on your federal income tax return and will differ from the amounts which we must report for the Allocation Funds' fiscal year ended October 31, 2022.
Proxy Voting Policies and Procedures and Proxy Voting Record
Each Allocation Fund is required to file with the SEC its proxy voting record for the 12-month period ending June 30 on Form N-PX. A description of the policies and procedures that are used to vote proxies relating to portfolio securities of the Fund is available free of charge upon request by calling 800-624-6782 or visiting the SEC’s website at www.sec.gov. The most recent Form N-PX or proxy voting record is available free of charge upon request by calling 800-624-6782; visiting newyorklifeinvestments.com; or visiting the SEC’s website at www.sec.gov.
Shareholder Reports and Quarterly Portfolio Disclosure
Each Allocation Fund is required to file its complete schedule of portfolio holdings with the SEC 60 days after its first and third fiscal quarter on Form N-PORT. The Allocation Funds' holdings report is available free of charge upon request by calling New York Life Investments at 800-624-6782.
| 92 | MainStay Asset Allocation Funds |
Board of Trustees and Officers (Unaudited)
The Trustees and officers of the Funds are listed below. The Board oversees the MainStay Group of Funds (which consists of MainStay Funds and MainStay Funds Trust), MainStay VP Funds Trust, MainStay MacKay DefinedTerm Municipal Opportunities Fund, MainStay CBRE Global Infrastructure Megatrends Fund, the Manager and the Subadvisors, and elects the officers of the Funds who are responsible for the day-to-day operations of the Funds. Information pertaining to the Trustees and officers is set forth below. Each Trustee serves until his or her successor
is elected and qualified or until his or her resignation, death or removal. Under the Board’s retirement policy, unless an exception is made, a Trustee must tender his or her resignation by the end of the calendar year during which he or she reaches the age of 75. The business address of each Trustee and officer listed below is 51 Madison Avenue, New York, New York 10010. None of the Trustees are “interested persons” (as defined by the 1940 Act and rules adopted by the SEC thereunder) of the Funds (“Independent Trustees”).
| | Name and
Year of Birth | Term of Office,
Position(s) Held and
Length of Service | Principal Occupation(s)
During Past Five Years | Number of
Portfolios in
Fund Complex
Overseen by
Trustee | Other Directorships
Held by Trustee |
| | | | | | |
| | David H. Chow
1957 | MainStay Funds: Trustee since 2016, Advisory Board Member (June 2015 to December 2015);MainStay Funds Trust:
Trustee since January 2016, Advisory Board Member (June 2015 to December 2015) | Founder and CEO, DanCourt Management, LLC since 1999 | 78 | MainStay VP Funds Trust: Trustee since January 2016, Advisory Board Member (June 2015 to December 2015) (31 portfolios);
MainStay MacKay DefinedTerm Municipal Opportunities Fund: Trustee since January 2016, Advisory Board Member (June 2015 to December 2015);
MainStay CBRE Global Infrastructure Megatrends Fund: Trustee since June 2021; VanEck Vectors Group of Exchange-Traded Funds: Independent Chairman of the Board of Trustees since 2008 and Trustee since 2006 (56 portfolios); and Berea College of Kentucky: Trustee since 2009, Chair of the Investment Committee since 2018 |
| | Susan B. Kerley
1951 | MainStay Funds: Chairman since 2017 and Trustee since 2007;MainStay Funds Trust:
Chairman since 2017 and Trustee since 1990** | President, Strategic Management Advisors LLC since 1990 | 78 | MainStay VP Funds Trust: Chairman since January 2017 and Trustee since 2007 (31 portfolios)**;
MainStay MacKay DefinedTerm Municipal Opportunities Fund: Chairman since 2017 and Trustee since 2011;
MainStay CBRE Global Infrastructure Megatrends Fund: Trustee since June 2021; and Legg Mason Partners Funds: Trustee since 1991 (45 portfolios) |
| | Alan R. Latshaw
1951 | MainStay Funds: Trustee since 2006;MainStay Funds Trust:
Trustee since 2007*** | Retired; Partner, Ernst & Young LLP (2002 to 2003); Partner, Arthur Andersen LLP (1989 to 2002); Consultant to the MainStay Funds Audit and Compliance Committee (2004 to 2006) | 78 | MainStay VP Funds Trust: Trustee since 2007 (31 portfolios)**;
MainStay MacKay DefinedTerm Municipal Opportunities Fund: Trustee since 2011; and
MainStay CBRE Global Infrastructure Megatrends Fund: Trustee since June 2021 |
Board of Trustees and Officers (Unaudited) (continued)
| | Name and
Year of Birth | Term of Office,
Position(s) Held and
Length of Service | Principal Occupation(s)
During Past Five Years | Number of
Portfolios in
Fund Complex
Overseen by
Trustee | Other Directorships
Held by Trustee |
| | | | | | |
| | Karen Hammond
1956 | MainStay Funds: Trustee since December 2021, Advisory Board Member (June 2021 to December 2021);MainStay Funds Trust:
Trustee since December 2021, Advisory Board Member (June 2021 to December 2021)
| Retired, Managing Director, Devonshire Investors (2007 to 2013); Senior Vice President, Fidelity Management & Research Co. (2005 to 2007); Senior Vice President and Corporate Treasurer, FMR Corp. (2003 to 2005); Chief Operating Officer, Fidelity Investments Japan (2001 to 2003) | 78 | MainStay VP Funds Trust: Trustee since December 2021, Advisory Board Member (June 2021 to December 2021) (31 Portfolios);
MainStay MacKay DefinedTerm Municipal Opportunities Fund: Trustee since December 2021, Advisory Board Member (June 2021 to December 2021);
MainStay CBRE Global Infrastructure Megatrends Fund: Trustee since December 2021, Advisory Board Member (June 2021 to December 2021);
Two Harbors Investment Corp.: Director since 2018;
Rhode Island State Investment Commission: Member since 2017; and
Blue Cross Blue Shield of Rhode Island: Director since 2019 |
| | Jacques P. Perold
1958 | MainStay Funds: Trustee since 2016, Advisory Board Member (June 2015 toDecember 2015);MainStay Funds Trust:
Trustee since January 2016, Advisory Board Member (June 2015 to December 2015) | Founder and Chief Executive Officer, CapShift Advisors LLC (since 2018); President, Fidelity Management & Research Company (2009 to 2014); President and Chief Investment Officer, Geode Capital Management, LLC (2001 to 2009) | 78 | MainStay VP Funds Trust: Trustee since January 2016, Advisory Board Member (June 2015 to December 2015) (31 portfolios);
MainStay MacKay DefinedTerm Municipal Opportunities Fund: Trustee since January 2016, Advisory Board Member (June 2015 to December 2015);
MainStay CBRE Global Infrastructure Megatrends Fund: Trustee since June 2021; Partners in Health: Trustee since 2019; Allstate Corporation: Director since 2015; and MSCI Inc.: Director since 2017 |
| | Richard S. Trutanic
1952 | MainStay Funds: Trustee since 1994;MainStay Funds Trust:
Trustee since 2007*** | Chairman and Chief Executive Officer, Somerset & Company (financial advisory firm) since 2004; Managing Director, The Carlyle Group (private investment firm) (2002 to 2004); Senior Managing Director, Partner and Board Member, Groupe Arnault S.A. (private investment firm) (1999 to 2002) | 78 | MainStay VP Funds Trust: Trustee since 2007 (31 portfolios)**;
MainStay MacKay DefinedTerm Municipal Opportunities Fund: Trustee since 2011; and MainStay CBRE Global Infrastructure Megatrends Fund: Trustee since June 2021 |
| ** | Includes prior service as a Director of MainStay VP Series Fund, Inc., the predecessor to MainStay VP Funds Trust. |
| *** | Includes prior service as a Director/Trustee of certain predecessor entities to MainStay Funds Trust. |
| 94 | MainStay Asset Allocation Funds |
| | Name and
Year of Birth | Position(s) Held and
Length of Service | Principal Occupation(s)
During Past Five Years | |
| | | | | |
| | Kirk C. Lehneis
1974 | President, MainStay Funds, MainStay Funds Trust since 2017 | Chief Operating Officer and Senior Managing Director (since 2016), New York Life Investment Management LLC and New York Life Investment Management Holdings LLC; Member of the Board of Managers (since 2017) and Senior Managing Director (since 2018), NYLIFE Distributors LLC; Chairman of the Board and Senior Managing Director, NYLIM Service Company LLC (since 2017); Trustee, President and Principal Executive Officer of IndexIQ Trust, IndexIQ ETF Trust and IndexIQ Active ETF Trust (since January 2018); President, MainStay CBRE Global Infrastructure Megatrends Fund (since 2021), MainStay MacKay DefinedTerm Municipal Opportunities Fund and MainStay VP Funds Trust (since 2017); Senior Managing Director, Global Product Development (From 2015-2016); Managing Director, Product Development (2010 to 2015), New York Life Investment Management LLC | |
| | Jack R. Benintende
1964 | Treasurer and Principal Financial and Accounting Officer, MainStay Funds (since 2007), MainStay Funds Trust (since 2009) | Managing Director, New York Life Investment Management LLC (since 2007); Treasurer and Principal Financial and Accounting Officer, MainStay CBRE Global Infrastructure Megatrends Fund (since 2021), MainStay MacKay DefinedTerm Municipal Opportunities Fund (since 2011) and MainStay VP Funds Trust (since 2007)** and Assistant Treasurer, New York Life Investment Management Holdings LLC (2008 to 2012) | |
| | J. Kevin Gao
1967 | Secretary and Chief Legal Officer, MainStay Funds and MainStay Funds Trust (since 2010) | Managing Director and Associate General Counsel, New York Life Investment Management LLC (since 2010); Secretary and Chief Legal Officer and MainStay CBRE Global Infrastructure Megatrends Fund (since 2021), MainStay MacKay DefinedTerm Municipal Opportunities Fund (since 2011) and MainStay VP Funds Trust (since 2010)** | |
| | Scott T. Harrington
1959 | Vice President— Administration, MainStay Funds (since 2009), MainStay Funds Trust (since 2009) | Managing Director, New York Life Investment Management LLC (including predecessor advisory organizations) (since 2000); Member of the Board of Directors, New York Life Trust Company (since 2009); Vice President—Administration, MainStay CBRE Global Infrastructure Megatrends Fund (since 2021), MainStay MacKay DefinedTerm Municipal Opportunities Fund (since 2011) and MainStay VP Funds Trust (since 2005)** | |
| | Kevin M. Gleason
1967 | Vice President and Chief Compliance Officer, MainStay Funds and MainStay Funds Trust (since June 2022) | Vice President and Chief Compliance Officer, IndexIQ, IndexIQ ETF Trust and Index IQ Active ETF Trust (since June 2022); Vice President and Chief Compliance Officer, MainStay CBRE Global Infrastructure Megatrends Fund, MainStay VP Funds Trust and MainStay MacKay DefinedTerm Municipal Opportunities Fund (since June 2022); Senior Vice President, Voya Investment Management and Chief Compliance Officer, Voya Family of Funds (2012-2022) | |
| * | The officers listed above are considered to be “interested persons” of the MainStay Group of Funds, MainStay VP Funds Trust, MainStay CBRE Global Infrastructure Megatrends Fund and MainStay MacKay DefinedTerm Municipal Opportunities Fund within the meaning of the 1940 Act because of their affiliation with the MainStay Group of Funds, New York Life Insurance Company and/or its affiliates, including New York Life Investment Management LLC, NYLIM Service Company LLC, NYLIFE Securities LLC and/or NYLIFE Distributors LLC, as described in detail in the column captioned “Principal Occupation(s) During Past Five Years.” Officers are elected annually by the Board. |
| ** | Includes prior service as an Officer of MainStay VP Series Fund, Inc., the predecessor to MainStay VP Funds Trust. |
Officers of the Trust (Who are not Trustees)*
This page intentionally left blank.
This page intentionally left blank.
This page intentionally left blank.
Equity
U.S. Equity
MainStay Epoch U.S. Equity Yield Fund
MainStay S&P 500 Index Fund1
MainStay Winslow Large Cap Growth Fund
MainStay WMC Enduring Capital Fund
MainStay WMC Growth Fund
MainStay WMC Small Companies Fund
MainStay WMC Value Fund
International Equity
MainStay Epoch International Choice Fund
MainStay MacKay International Equity Fund
MainStay WMC International Research Equity Fund
Emerging Markets Equity
MainStay Candriam Emerging Markets Equity Fund
Global Equity
MainStay Epoch Capital Growth Fund
MainStay Epoch Global Equity Yield Fund
Fixed Income
Taxable Income
MainStay Candriam Emerging Markets Debt Fund
MainStay Floating Rate Fund
MainStay MacKay High Yield Corporate Bond Fund
MainStay MacKay Short Duration High Yield Fund
MainStay MacKay Strategic Bond Fund
MainStay MacKay Total Return Bond Fund
MainStay MacKay U.S. Infrastructure Bond Fund
MainStay Short Term Bond Fund
Tax-Exempt Income
MainStay MacKay California Tax Free Opportunities Fund2
MainStay MacKay High Yield Municipal Bond Fund
MainStay MacKay New York Tax Free Opportunities Fund3
MainStay MacKay Short Term Municipal Fund
MainStay MacKay Strategic Municipal Allocation Fund
MainStay MacKay Tax Free Bond Fund
Money Market
MainStay Money Market Fund
Mixed Asset
MainStay Balanced Fund
MainStay Income Builder Fund
MainStay MacKay Convertible Fund
Speciality
MainStay CBRE Global Infrastructure Fund
MainStay CBRE Real Estate Fund
MainStay Cushing MLP Premier Fund
Asset Allocation
MainStay Conservative Allocation Fund
MainStay Conservative ETF Allocation Fund
MainStay Defensive ETF Allocation Fund
MainStay Equity Allocation Fund
MainStay Equity ETF Allocation Fund
MainStay ESG Multi-Asset Allocation Fund
MainStay Growth Allocation Fund
MainStay Growth ETF Allocation Fund
MainStay Moderate Allocation Fund
MainStay Moderate ETF Allocation Fund
Manager
New York Life Investment Management LLC
New York, New York
Subadvisors
Candriam4
Strassen, Luxembourg
CBRE Investment Management Listed Real Assets LLC
Radnor, Pennsylvania
Cushing Asset Management, LP
Dallas, Texas
Epoch Investment Partners, Inc.
New York, New York
MacKay Shields LLC4
New York, New York
NYL Investors LLC4
New York, New York
Wellington Management Company LLP
Boston, Massachusetts
Winslow Capital Management, LLC
Minneapolis, Minnesota
Legal Counsel
Dechert LLP
Washington, District of Columbia
Independent Registered Public Accounting Firm
KPMG LLP
Philadelphia, Pennsylvania
Distributor
NYLIFE Distributors LLC4
Jersey City, New Jersey
Custodian
JPMorgan Chase Bank, N.A.
New York, New York
1.
Prior to February 28, 2022, the Fund's name was MainStay MacKay S&P 500 Index Fund.
| 2. | This Fund is registered for sale in AZ, CA, NV, OR, TX, UT, WA and MI (Class A and Class I shares only), and CO, FL, GA, HI, ID, MA, MD, NH, NJ and NY (Class I shares only). |
| 3. | This Fund is registered for sale in CA, CT, DE, FL, MA, NJ, NY and VT. |
| 4. | An affiliate of New York Life Investment Management LLC. |
Not part of the Annual Report
For more information
800-624-6782
newyorklifeinvestments.com
“New York Life Investments” is both a service mark, and the common trade name, of certain investment advisors affiliated with New York Life Insurance Company. The MainStay Funds® are managed by New York Life Investment Management LLC and distributed by NYLIFE Distributors LLC, 30 Hudson Street, Jersey City, NJ 07302, a wholly owned subsidiary of New York Life Insurance Company. NYLIFE Distributors LLC is a Member FINRA/SIPC.
©2022 NYLIFE Distributors LLC. All rights reserved.
| 5013729.2MS229-22 | MSAA11-12/22 |
(NYLIM) NL224
MainStay Epoch Capital Growth Fund
Message from the President and Annual Report
October 31, 2022
Sign up for e-delivery of your shareholder reports. For full details on e-delivery, including who can participate and what you can receive via e-delivery,
please log in to newyorklifeinvestments.com/accounts.
| Not FDIC/NCUA Insured | Not a Deposit | May Lose Value | No Bank Guarantee | Not Insured by Any Government Agency |
This page intentionally left blank
Message from the President
A series of economic and geopolitical challenges undermined equity and fixed-income markets during the 12-month reporting period ended October 31, 2022. Stocks and bonds alike trended lower in the face of sharply rising interest rates, increasing inflationary pressures, slowing economic growth and Russia’s invasion of Ukraine.
The reporting period began on a mixed note, with concerns about the spreading Omicron variant of the COVID-19 virus and increasingly hawkish statements from the U.S. Federal Reserve (the “Fed”) regarding mounting inflation, countered by bullish sentiment stemming from U.S. economic growth and strong corporate earnings. In January 2022, markets turned decisively negative as comments from the Fed raised the likelihood of rate hikes as early as March, and Russia issued increasingly aggressive threats toward Ukraine. The onset of Russia’s invasion in February exacerbated global inflationary pressures while increasing investor uncertainty. Domestic supply shortages, international trade imbalances and rising inflation caused GDP (gross domestic product) to contract in the first and second quarters of the year, although employment and consumer spending proved resilient. Prices for petroleum surged to multi-year highs, while many key agricultural chemicals and industrial metals climbed as well. Accelerating inflationary forces prompted the Fed to implement its most aggressive interest rate increases since the 1980s with a series of five sharp rate hikes, raising the federal funds rate from a range of 0.00% to 0.25% in March to 3.00% to 3.25% in September, with additional rate hikes expected before the end of the year. International central banks generally followed suit, raising rates by varying degrees in efforts to curb local inflation, although most increases remained significantly more modest than those in the United States. Relatively high U.S. interest rates and risk-averse international sentiment pushed U.S. dollar values higher compared to most other currencies, with the ensuing negative impact on global prices for food, fuel and other key, U.S.-dollar-denominated products.
The effects of these interrelated challenges were felt throughout U.S. and international financial markets. The S&P 500® Index, a widely regarded benchmark of U.S. market performance, declined by more than 14% during the reporting period. Although the energy sector generated strong gains, bolstered by elevated oil and gas prices, most other industry areas recorded losses. The more cyclical and growth-oriented sectors of consumer discretionary, real estate and information technology delivered the
weakest returns, while the traditionally defensive and value-oriented consumer staples, utilities and health care sectors outperformed. International stocks lagged compared to their U.S. counterparts, with some emerging markets, such as China, suffering particularly steep losses. A few markets, however, including Brazil, Mexico and the United Arab Emirates, ended the reporting period with little change. Fixed-income markets saw bond prices broadly decline as yields rose along with interest rates. Short-term yields rose faster than long-term yields, producing a yield curve inversion from July through the end of the reporting period, with long-term rates remaining below short-term rates. While floating-rate instruments, which feature variable interest rates that allow investors to benefit from a rising rate environment, provided a degree of insulation from inflation-driven trends, they were not immune to the market’s widespread declines.
While the Fed acknowledges the costs of rising rates in terms of weaker GDP growth and unsettled financial markets over the short term, its primary focus continues to be the longer-term economic impact of inflation. With the latest figures as of the date of this report showing that inflation remains above 8%, versus a target rate of just 2%, the Fed clearly has a distance yet to go, making further rate increases and market volatility more likely in the coming months. The question remains as to whether the Fed and other central banks will manage a so-called “soft landing,” curbing inflation while avoiding a persistent economic slowdown. If they prove successful, we expect that favorable inflation trends and increasingly attractive valuations in both equity and bond markets should eventually translate into sustainable improvements in the investment environment.
Whatever actions the Fed takes and however financial markets react, as a MainStay investor, you can depend on us to continue providing the insight, expertise and service that have long defined New York Life Investments. Thank you for trusting us to help you meet your investment needs.
Sincerely,
Kirk C. Lehneis
President
The opinions expressed are as of the date of this report and are subject to change. There is no guarantee that any forecast made will come to pass. This material does not constitute investment advice and is not intended as an endorsement of any specific investment. Past performance is no guarantee of future results.
Not part of the Annual Report
Investors should refer to the Fund’s Summary Prospectus and/or Prospectus and consider the Fund’s investment objectives, strategies, risks, charges and expenses carefully before investing. The Summary Prospectus and/or Prospectus contain this and other information about the Fund. You may obtain copies of the Fund’s Summary Prospectus, Prospectus and Statement of Additional Information, which includes information about the MainStay Funds Trust's Trustees, free of charge, upon request, by calling toll-free 800-624-6782, by writing to NYLIFE Distributors LLC, Attn: MainStay Marketing Department, 30 Hudson Street, Jersey City, NJ 07302 or by sending an e-mail to MainStayShareholderServices@nylim.com. These documents are also available via the MainStay Funds’ website at newyorklifeinvestments.com. Please read the Fund’s Summary Prospectus and/or Prospectus carefully before investing.
Investment and Performance Comparison (Unaudited)
Performance data quoted represents past performance. Past performance is no guarantee of future results. Because of market volatility and other factors, current performance may be lower or higher than the figures shown. Investment return and principal value will fluctuate, and as a result, when shares are redeemed, they may be worth more or less than their original cost. The graph below depicts the historical performance of Class I shares of the Fund. Performance will vary from class to class based on differences in class-specific expenses and sales charges. For performance information current to the most recent month-end, please call 800-624-6782 or visit newyorklifeinvestments.com.
The performance table and graph do not reflect the deduction of taxes that a shareholder would pay on distributions or Fund share redemptions. Total returns reflect maximum applicable sales charges as indicated in the table below, if any, changes in share price, and reinvestment of dividend and capital gain distributions. The graph assumes the initial investment amount shown below and reflects the deduction of all sales charges that would have applied for the period of investment. Performance figures may reflect certain fee waivers and/or expense limitations, without which total returns may have been lower. For more information on share classes and current fee waivers and/or expense limitations (if any), please refer to the Notes to Financial Statements.
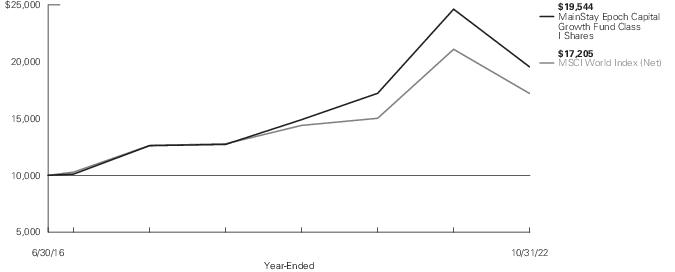
| Average Annual Total Returns for the Year-Ended October 31, 2022 |
| Class | Sales Charge | | Inception
Date | One
Year | Five
Years | Since
Inception | Gross
Expense
Ratio1 |
| Class A Shares | Maximum 5.5% Initial Sales Charge | With sales charges | 6/30/2016 | -25.15% | 7.67% | 9.91% | 1.35% |
| | | Excluding sales charges | | -20.79 | 8.90 | 10.89 | 1.35 |
| Investor Class Shares2 | Maximum 5% Initial Sales Charge | With sales charges | 6/30/2016 | -24.99 | 7.36 | 9.64 | 1.59 |
| | | Excluding sales charges | | -21.04 | 8.58 | 10.63 | 1.59 |
| Class C Shares | Maximum 1% CDSC | With sales charges | 6/30/2016 | -22.20 | 7.80 | 9.82 | 2.34 |
| | if Redeemed Within One Year of Purchase | Excluding sales charges | | -21.60 | 7.80 | 9.82 | 2.34 |
| Class I Shares | No Sales Charge | | 6/30/2016 | -20.63 | 9.16 | 11.15 | 1.10 |
| 1. | The gross expense ratios presented reflect the Fund’s “Total Annual Fund Operating Expenses” from the most recent Prospectus, as supplemented, and may differ from other expense ratios disclosed in this report. |
| 2. | Prior to June 30, 2020, the maximum initial sales charge was 5.5%, which is reflected in the applicable average annual total return figures shown. |
The footnotes on the next page are an integral part of the table and graph and should be carefully read in conjunction with them.
| Benchmark Performance* | One
Year | Five
Years | Since
Inception |
| MSCI World Index (Net)1 | -18.48% | 6.37% | 8.94% |
| Morningstar Global Large Stock Growth Category Average2 | -31.91 | 5.04 | 8.38 |
| * | Returns for indices reflect no deductions for fees, expenses or taxes, except for foreign withholding taxes where applicable. Results assume reinvestment of all dividends and capital gains. An investment cannot be made directly in an index. |
| 1. | The MSCI World Index (Net) is the Fund's primary broad-based securities market index for comparison purposes. The MSCI World Index (Net) is a free float-adjusted market capitalization weighted index that is designed to measure the equity market performance of developed markets. |
| 2. | The Morningstar Global Large Stock Growth Category Average is a representative of funds that invest in a variety of international stocks and typically skew towards large caps that are more expensive or projected to grow faster than other global large-cap stocks. World large stock growth portfolios have few geographical limitations. It is common for these portfolios to invest the majority of their assets in developed markets, with the remainder divided among the globe's emerging markets. These portfolios are not significantly overweight U.S. equity exposure relative to the Morningstar Global Market Index and maintain at least a 20% absolute U.S. exposure. Results are based on average total returns of similar funds with all dividends and capital gain distributions reinvested. |
The footnotes on the preceding page are an integral part of the table and graph and should be carefully read in conjunction with them.
| 6 | MainStay Epoch Capital Growth Fund |
Cost in Dollars of a $1,000 Investment in MainStay Epoch Capital Growth Fund (Unaudited)
The example below is intended to describe the fees and expenses borne by shareholders during the six-month period from May 1, 2022 to October 31, 2022, and the impact of those costs on your investment.
Example
As a shareholder of the Fund you incur two types of costs: (1) transaction costs, including exchange fees and sales charges (loads) on purchases (as applicable), and (2) ongoing costs, including management fees, distribution and/or service (12b-1) fees and other Fund expenses (as applicable). This example is intended to help you understand your ongoing costs (in dollars) of investing in the Fund and to compare these costs with the ongoing costs of investing in other mutual funds. The example is based on an investment of $1,000 made at the beginning of the six-month period and held for the entire period from May 1, 2022 to October 31, 2022.
This example illustrates your Fund’s ongoing costs in two ways:
Actual Expenses
The second and third data columns in the table below provide information about actual account values and actual expenses. You may use the information in these columns, together with the amount you invested, to estimate the expenses that you paid during the six months ended October 31, 2022. Simply divide your account value by $1,000 (for example, an
$8,600 account value divided by $1,000 = 8.6), then multiply the result by the number under the heading entitled “Expenses Paid During Period” to estimate the expenses you paid on your account during this period.
Hypothetical Example for Comparison Purposes
The fourth and fifth data columns in the table below provide information about hypothetical account values and hypothetical expenses based on the Fund’s actual expense ratio and an assumed rate of return of 5% per year before expenses, which is not the Fund’s actual return. The hypothetical account values and expenses may not be used to estimate the actual ending account balances or expenses you paid for the six-month period shown. You may use this information to compare the ongoing costs of investing in the Fund with the ongoing costs of investing in other mutual funds. To do so, compare this 5% hypothetical example with the 5% hypothetical examples that appear in the shareholder reports of the other mutual funds.
Please note that the expenses shown in the table are meant to highlight your ongoing costs only and do not reflect any transactional costs, such as exchange fees or sales charges (loads). Therefore, the fourth and fifth data columns of the table are useful in comparing ongoing costs only and will not help you determine the relative total costs of owning different funds. In addition, if these transactional costs were included, your costs would have been higher.
| Share Class | Beginning
Account
Value
5/1/22 | Ending Account
Value (Based
on Actual
Returns and
Expenses)
10/31/22 | Expenses
Paid
During
Period1 | Ending Account
Value (Based
on Hypothetical
5% Annualized
Return and
Actual Expenses)
10/31/22 | Expenses
Paid
During
Period1 | Net Expense
Ratio
During
Period2 |
| Class A Shares | $1,000.00 | $958.70 | $ 5.68 | $1,019.41 | $ 5.85 | 1.15% |
| Investor Class Shares | $1,000.00 | $957.40 | $ 6.71 | $1,018.35 | $ 6.92 | 1.36% |
| Class C Shares | $1,000.00 | $953.60 | $10.39 | $1,014.57 | $10.71 | 2.11% |
| Class I Shares | $1,000.00 | $959.70 | $ 4.45 | $1,020.67 | $ 4.58 | 0.90% |
| 1. | Expenses are equal to the Fund’s annualized expense ratio of each class multiplied by the average account value over the period, divided by 365 and multiplied by 184 (to reflect the six-month period). The table above represents the actual expenses incurred during the six-month period. In addition to the fees and expenses which the Fund bears directly, it also indirectly bears a pro rata share of the fees and expenses of the underlying funds in which it invests. Such indirect expenses are not included in the above-reported expense figures. |
| 2. | Expenses are equal to the Fund's annualized expense ratio to reflect the six-month period. |
Country Composition as of October 31, 2022 (Unaudited)
| United States | 69.5% |
| United Kingdom | 3.2 |
| Switzerland | 3.2 |
| Sweden | 2.8 |
| Denmark | 2.7 |
| Canada | 2.6 |
| Netherlands | 2.1 |
| France | 2.1 |
| China | 2.0 |
| Spain | 1.8 |
| Italy | 1.6 |
| Mexico | 1.3 |
| Malta | 1.2% |
| Australia | 1.0 |
| Jordan | 0.9 |
| Japan | 0.8 |
| Indonesia | 0.7 |
| Singapore | 0.6 |
| South Africa | 0.5 |
| Taiwan | 0.3 |
| Hong Kong | 0.2 |
| Other Assets, Less Liabilities | –1.1 |
| | 100.0% |
See Portfolio of Investments beginning on page 12 for specific holdings within these categories. The Fund's holdings are subject to change.
Top Ten Holdings and/or Issuers Held as of October 31, 2022 (excluding short-term investments) (Unaudited)
| 1. | Costco Wholesale Corp. |
| 2. | Eli Lilly and Co. |
| 3. | Medpace Holdings, Inc. |
| 4. | UnitedHealth Group, Inc. |
| 5. | Monster Beverage Corp. |
| 6. | World Wrestling Entertainment, Inc., Class A |
| 7. | Microsoft Corp. |
| 8. | Paychex, Inc. |
| 9. | Zoetis, Inc. |
| 10. | Constellation Software, Inc. |
| 8 | MainStay Epoch Capital Growth Fund |
Portfolio Management Discussion and Analysis (Unaudited)
Questions answered by portfolio managers William W. Priest, CFA, Steven D. Bleiberg, Michael A. Welhoelter, CFA, and David J. Siino, CFA, CAIA, of Epoch Investment Partners, Inc., the Fund’s Subadvisor.
How did MainStay Epoch Capital Growth Fund perform relative to its benchmark and peer group during the 12 months ended October 31, 2022?
For the 12 months ended October 31, 2022, Class I shares of MainStay Epoch Capital Growth Fund returned −20.63%, underperforming the −18.48% return of the Fund’s primary benchmark, the MSCI World Index (Net) (the “Index”). Over the same period, Class I shares outperformed the −31.91% return of the Morningstar Global Large Stock Growth Category Average.1
What factors affected the Fund’s relative performance during the reporting period?
Sector allocations accounted for the majority of the Fund’s underperformance relative to the Index during the reporting period, particularly underweight exposure to energy, which was the market's best-performing sector. Stock selection within sectors had a slightly negative impact on the Fund’s relative performance.
During the reporting period, were there any market events that materially impacted the Fund’s performance or liquidity?
Two events, or series of events, drove much of the Fund's performance during the reporting period: 1) the Russian invasion of Ukraine, which exacerbated existing imbalances in energy markets and sent prices for oil and natural gas sharply higher, and 2) interest rate increases by many of the world's central banks. The former led to significant outperformance by energy stocks, and the latter led to significant underperformance by growth stocks, which tend to exhibit cash flows associated with a longer duration, and hence are more negatively affected by an increase in interest rates.
During the reporting period, which sectors and/or countries were the strongest positive contributors to the Fund’s relative performance and which sectors and/or countries were particularly weak?
During the reporting period, stock selection in the consumer discretionary and communication services sectors made the strongest positive contributions to the Fund’s relative performance, followed by an overweight position in the health care sector. (Contributions take weightings and total returns into account.) Stock selection in the health care sector was the most
significant detractor from the Fund’s relative performance, followed by underweight exposure to the energy sector.
During the reporting period, which individual stocks made the strongest positive contributions to the Fund’s absolute performance and which stocks detracted the most?
The biggest positive contributors to the Fund’s absolute performance included independent broker-dealer LPL Financial, pharmaceutical company Eli Lilly, and media content provider World Wrestling Entertainment.
As the largest independent broker/dealer in the United States, LPL’s stock price is sensitive to expectations for short-term interest rates, which influence expected earnings on client cash balances. As a result, in the short term, the positive earnings impact from an expected increase in the federal funds rate, as occurred over the last year, can be significant. Longer-term, we believe organic growth in net new assets on LPL's platform will be far more consequential in determining returns on capital. By this metric, LPL continued to grow at a mid- to high-single-digit rate during the reporting period.
Eli Lilly's outperformance was likely due to investor optimism about the potential revenue from the company's new type-2 diabetes drug, Mounjaro, which received FDA approval in May 2022.
We believe several factors drove the strong performance of World Wrestling Entertainment (WWE) shares during the reporting period: 1) TV ratings for WWE's shows improved significantly, 2) new management at WWE and missteps by new-entrant AEW (All Elite Wrestling) helped WWE recruit talent, and 3) most of WWE's revenues come from content rights fees that are not economically sensitive, thus making the company's profits more defensive than most.
The most significant detractors from the Fund’s absolute performance during the reporting period were holdings in semiconductor maker Silergy, internet search and advertising firm Alphabet, and medical device maker Masimo.
Silergy is a leading provider of analog semiconductors. Top line growth continued at a greater-than-20% rate, however near-term growth expectations were tempered by a slowdown in demand for consumer electronics and handsets, exacerbated by continued high levels of inventory in the distribution channel. Although
| 1. | See page 5 for other share class returns, which may be higher or lower than Class I share returns. See page 6 for more information on benchmark and peer group returns. |
Silergy operates in sharply cyclical end markets, over time we believe it will grow faster than the industry as a whole – given its position as one of China’s most successful semiconductor businesses – and bolstered by China's goal of relying increasingly on domestic producers.
Shares in Alphabet, the parent company of Google, declined by more than 35% during the reporting period as pandemic-related tailwinds abated and new investments weighed on profitability. Specifically, revenue growth from search and advertising decelerated as the digital advertising market contracted. Meanwhile, operating expenses and capital expenditures increased substantially due to headcount additions and data center expansions, while areas of heavy investment, including Google Cloud and Other Bets, failed to generate positive returns. We believe that over the long term the company will still earn high returns on its invested capital.
Masimo, which currently splits the hospital-grade pulse oximetry market with Medtronic, announced in February 2022 that it would acquire Sound United, which sells high-end consumer electronics, such as speakers. We believe that management's decision was not consistent with the company's historically conservative and incremental approach to building a predictable and profitable business, and the stock dropped sharply. Venturing into the highly competitive consumer electronics market without a meaningful competitive advantage by making a $1 billion competitively bid acquisition undermined our trust in management and led us to sell the Fund’s position.
What were some of the Fund’s largest purchases and sales during the reporting period?
Significant new purchases during the reporting period included shares of financial planning products and services provider Ameriprise Financial, electronic design company Cadence Design Systems, and biotechnology developer Vertex Pharmaceuticals.
Through its various brands and affiliates—including Ameriprise Financial Services, Columbia Threadneedle and RiverSource—Ameriprise manages approximately $1.1 trillion in assets for individual and institutional clients, marketing and administering its products primarily through a network of more than 10,000 financial advisors. We find Ameriprise attractive for its high margins and high returns on invested capital. Historically, the company’s portfolio of businesses typically increases revenues faster than costs when assets under advisement (AUA) and assets under management (AUM) are growing. In the dozen years since closing the company’s Columbia Asset Management acquisition, AUA grew at a 9% annualized rate, and AUM grew at a 7.5% rate. Meanwhile, operating expenses grew at only a 6% rate in Ameriprise’s Advice & Wealth Management division and at a 2.5% rate in its Asset Management division. This has resulted in higher profit margins. The company’s independent RIA (Registered Investment Advisor) and direct channels have taken a growing
share of client assets over time, and we expect this trend to continue. With independent RIAs constituting 80% of Ameriprise's advisors, the firm has grown more rapidly than its wirehouse peers and appears well positioned for future growth.
Customers use Cadence products to design integrated circuits, printed circuit boards, smartphones, laptop computers, gaming systems and more, making it the #2 company globally in electronic design automation (“EDA”) and #3 in semiconductor intellectual property, two key industries critical to the development of semiconductors and chips. Due to favorable industry dynamics and the importance of EDA software in the semiconductor development process, Cadence enjoys very strong pricing power. In addition, EDA tools provide significant value to end customers relative to their cost, driving a high rate (nearly 90%) of recurring revenue, with 3-year licenses on average. Customers typically pay on a per-seat basis, meaning an additional license must be purchased for each engineer who uses the software. The marginal cost to Cadence of an additional license is zero, resulting in high operating leverage. EDA sales are directly tied to research and development (“R&D”) spending by semiconductor companies. Thus, while EDA providers are exposed to the secular growth of the semiconductor industry, they are not as susceptible to the industry's cyclicality. Semiconductor companies have a long-term focus on their future pipelines and have generally increased their R&D spending, even in down years for the industry. As a result, EDA companies tend to exhibit more stable growth and margin profiles than the broader semiconductor industry. We believe Cadence’s 3-year contracts, strong pricing power, and lack of cyclical exposure should enable the company to maintain high margins and returns on capital even during cyclical downturns.
Vertex provides leading treatments for cystic fibrosis (“CF”), a genetic, life-threatening endocrine disorder. An estimated 83,000 CF patients globally currently live with the disease, and the total patient population is rising steadily. To date, Vertex holds a monopoly on CF drugs approved by U.S. and European regulators. The company's most recently approved drug, Trikafta (approved in the United States in 2019) shows a nearly 90% reduction in lung transplants, a nearly 80% reduction in pulmonary exacerbations and a 75% reduction in risk of death. With key patents on Trikafta enforceable to 2037, the company has more than a decade to develop better CF treatments that can replace it. Vertex's core CF franchise generates over $7 billion in revenue, with gross margins of nearly 90%. We believe the company’s CF franchise is likely to produce a growth rate in the low teens as the number of patients diagnosed and treated increases, and as Vertex continues making strong progress in securing reimbursed commercial access to its medicines globally. Beyond its CF franchise (which currently generates 100% of the company's revenue), the company has an attractive pipeline of small molecule, cell and gene therapies to treat type-1 diabetes, Duchenne muscular dystrophy, sickle cell disease, pain (without opioids) and other rare illnesses.
| 10 | MainStay Epoch Capital Growth Fund |
The Fund’s largest sales during the same period included its entire positions in Masimo, Take-Two Interactive Software, and eMemory Technology. Masimo, as noted above, made an acquisition that we judged as a very poor use of capital. At Take-Two, a recent large acquisition diluted the company's return on invested capital, creating uncertainty as to the ultimate payback from the deal. With regard to eMemory, the stock had performed so well since the Fund established its position that we were no longer comfortable with its valuation.
How did the Fund’s sector and/or country weightings change during the reporting period?
During the reporting period, the Fund’s weightings in the consumer discretionary and industrials sectors increased, while weightings in the information technology and financials sectors decreased. The largest increases in the Fund’s country weights were in the United States, Sweden and Mexico, while the largest decreases were in Japan and Taiwan.
How was the Fund positioned at the end of the reporting period?
As of October 31, 2022, the Fund held its most overweight exposures relative to the Index in the health care, information technology and consumer discretionary sectors. As of the same date, the Fund’s most underweight positions were in the energy, financials and utilities sectors. From a country perspective, the Fund’s largest overweight positions were in Sweden and Denmark, while the most significantly underweight positions were in the United States, Japan and Germany.
The opinions expressed are those of the portfolio managers as of the date of this report and are subject to change. There is no guarantee that any forecasts will come to pass. This material does not constitute investment advice and is not intended as an endorsement of any specific investment.
Portfolio of Investments October 31, 2022†
| | Shares | Value |
| Common Stocks 98.7% |
| Australia 1.0% |
| Aristocrat Leisure Ltd. (Hotels, Restaurants & Leisure) | 27,811 | $ 659,450 |
| Canada 2.6% |
| Alimentation Couche-Tard, Inc. (Food & Staples Retailing) | 15,805 | 707,678 |
| Constellation Software, Inc. (Software) | 667 | 964,448 |
| | | 1,672,126 |
| China 2.0% |
| Chongqing Brewery Co. Ltd., Class A (Beverages) | 25,774 | 308,712 |
| Silergy Corp. (Semiconductors & Semiconductor Equipment) | 42,000 | 487,485 |
| SITC International Holdings Co. Ltd. (Marine) | 289,000 | 473,466 |
| | | 1,269,663 |
| Denmark 2.7% |
| Coloplast A/S, Class B (Health Care Equipment & Supplies) | 2,384 | 265,792 |
| Genmab A/S (Biotechnology) (a) | 1,810 | 697,642 |
| Novo Nordisk A/S, Class B (Pharmaceuticals) | 7,036 | 764,927 |
| | | 1,728,361 |
| France 2.1% |
| Edenred (IT Services) | 17,594 | 903,443 |
| Sartorius Stedim Biotech (Life Sciences Tools & Services) | 1,363 | 432,651 |
| | | 1,336,094 |
| Hong Kong 0.2% |
| Hong Kong Exchanges & Clearing Ltd. (Capital Markets) | 5,900 | 157,090 |
| Indonesia 0.7% |
| Bank Central Asia Tbk. PT (Banks) | 733,300 | 413,723 |
| Italy 1.6% |
| FinecoBank Banca Fineco SpA (Banks) | 45,884 | 618,504 |
| Recordati Industria Chimica e Farmaceutica SpA (Pharmaceuticals) | 11,514 | 432,732 |
| | | 1,051,236 |
| Japan 0.8% |
| Hoya Corp. (Health Care Equipment & Supplies) | 4,900 | 457,228 |
| | Shares | Value |
| |
| Japan (continued) |
| Zenkoku Hosho Co. Ltd. (Diversified Financial Services) | 1,100 | $ 36,322 |
| | | 493,550 |
| Jordan 0.9% |
| Hikma Pharmaceuticals plc (Pharmaceuticals) | 39,503 | 565,822 |
| Malta 1.2% |
| Kindred Group plc SDR (Hotels, Restaurants & Leisure) | 86,924 | 755,779 |
| Mexico 1.3% |
| Grupo Aeroportuario del Pacifico SAB de CV, Class B (Transportation Infrastructure) | 28,325 | 438,750 |
| Wal-Mart de Mexico SAB de CV (Food & Staples Retailing) | 96,500 | 372,742 |
| | | 811,492 |
| Netherlands 2.1% |
| ASML Holding NV (Semiconductors & Semiconductor Equipment) | 986 | 465,770 |
| BE Semiconductor Industries NV (Semiconductors & Semiconductor Equipment) | 17,272 | 882,812 |
| | | 1,348,582 |
| Singapore 0.6% |
| Singapore Exchange Ltd. (Capital Markets) | 67,400 | 400,896 |
| South Africa 0.5% |
| FirstRand Ltd. (Diversified Financial Services) | 90,857 | 318,293 |
| Spain 1.8% |
| Amadeus IT Group SA (IT Services) (a) | 6,607 | 344,359 |
| Industria de Diseno Textil SA (Specialty Retail) (b) | 34,629 | 785,055 |
| | | 1,129,414 |
| Sweden 2.8% |
| Atlas Copco AB, Class B (Machinery) | 37,287 | 361,145 |
| Epiroc AB, Class B (Machinery) | 25,900 | 347,993 |
| Evolution AB (Hotels, Restaurants & Leisure) (c) | 4,670 | 436,919 |
| Swedish Match AB (Tobacco) | 63,379 | 652,090 |
| | | 1,798,147 |
| 12 | MainStay Epoch Capital Growth Fund |
| | Shares | Value |
| Common Stocks (continued) |
| Switzerland 3.2% |
| EMS-Chemie Holding AG (Registered) (Chemicals) | 471 | $ 296,095 |
| Kuehne + Nagel International AG (Registered) (Marine) | 2,921 | 622,501 |
| Logitech International SA (Registered) (Technology Hardware, Storage & Peripherals) | 9,589 | 477,367 |
| Partners Group Holding AG (Capital Markets) | 712 | 639,509 |
| | | 2,035,472 |
| Taiwan 0.3% |
| Taiwan Semiconductor Manufacturing Co. Ltd. (Semiconductors & Semiconductor Equipment) | 18,000 | 217,860 |
| United Kingdom 3.2% |
| Auto Trader Group plc (Interactive Media & Services) (c) | 66,308 | 396,635 |
| Diageo plc (Beverages) | 9,399 | 387,820 |
| Fevertree Drinks plc (Beverages) | 32,084 | 351,566 |
| Games Workshop Group plc (Leisure Products) | 5,569 | 408,738 |
| Howden Joinery Group plc (Trading Companies & Distributors) | 85,567 | 504,379 |
| | | 2,049,138 |
| United States 67.1% |
| Accenture plc, Class A (IT Services) | 2,251 | 639,059 |
| Adobe, Inc. (Software) (a) | 1,253 | 399,080 |
| Align Technology, Inc. (Health Care Equipment & Supplies) (a) | 2,313 | 449,416 |
| Alphabet, Inc., Class A (Interactive Media & Services) (a) | 9,745 | 921,000 |
| Ameriprise Financial, Inc. (Capital Markets) | 2,348 | 725,814 |
| Apple, Inc. (Technology Hardware, Storage & Peripherals) | 5,221 | 800,588 |
| Applied Materials, Inc. (Semiconductors & Semiconductor Equipment) | 6,199 | 547,310 |
| Arista Networks, Inc. (Communications Equipment) (a) | 7,088 | 856,656 |
| Artisan Partners Asset Management, Inc., Class A (Capital Markets) | 15,987 | 455,789 |
| Automatic Data Processing, Inc. (IT Services) | 3,121 | 754,346 |
| Booking Holdings, Inc. (Hotels, Restaurants & Leisure) (a) | 226 | 422,502 |
| Bruker Corp. (Life Sciences Tools & Services) | 5,557 | 343,645 |
| Cadence Design Systems, Inc. (Software) (a) | 3,486 | 527,746 |
| | Shares | Value |
| |
| United States (continued) |
| Chemed Corp. (Health Care Providers & Services) | 1,386 | $ 647,082 |
| Corcept Therapeutics, Inc. (Pharmaceuticals) (a) | 22,141 | 633,233 |
| Costco Wholesale Corp. (Food & Staples Retailing) | 2,297 | 1,151,945 |
| CSL Ltd. (Biotechnology) | 4,774 | 856,499 |
| Deckers Outdoor Corp. (Textiles, Apparel & Luxury Goods) (a) | 2,053 | 718,406 |
| Domino's Pizza, Inc. (Hotels, Restaurants & Leisure) | 2,127 | 706,674 |
| Donaldson Co., Inc. (Machinery) | 11,219 | 644,532 |
| Eagle Materials, Inc. (Construction Materials) | 3,889 | 475,664 |
| Electronic Arts, Inc. (Entertainment) | 3,666 | 461,769 |
| Eli Lilly and Co. (Pharmaceuticals) | 3,173 | 1,148,912 |
| Encompass Health Corp. (Health Care Providers & Services) | 8,817 | 479,997 |
| eXp World Holdings, Inc. (Real Estate Management & Development) (b) | 13,667 | 180,541 |
| Expeditors International of Washington, Inc. (Air Freight & Logistics) | 3,823 | 374,081 |
| Fastenal Co. (Trading Companies & Distributors) | 19,589 | 946,736 |
| Ferguson plc (Trading Companies & Distributors) | 8,324 | 907,821 |
| Fortinet, Inc. (Software) (a) | 16,544 | 945,655 |
| Gentex Corp. (Auto Components) | 24,154 | 639,839 |
| Graco, Inc. (Machinery) | 7,669 | 533,609 |
| Home Depot, Inc. (The) (Specialty Retail) | 2,164 | 640,825 |
| Intuitive Surgical, Inc. (Health Care Equipment & Supplies) (a) | 1,114 | 274,568 |
| KLA Corp. (Semiconductors & Semiconductor Equipment) | 2,808 | 888,592 |
| Lam Research Corp. (Semiconductors & Semiconductor Equipment) | 1,818 | 735,890 |
| Liberty Media Corp-Liberty SiriusXM (a) | | |
| Class A (Media) | 12,077 | 512,548 |
| Class C (Media) | 673 | 28,394 |
| |
| LPL Financial Holdings, Inc. (Capital Markets) | 3,666 | 937,213 |
| Manhattan Associates, Inc. (Software) (a) | 2,251 | 273,879 |
| Mastercard, Inc., Class A (IT Services) | 2,900 | 951,722 |
| Medpace Holdings, Inc. (Life Sciences Tools & Services) (a) | 5,166 | 1,146,749 |
| Meta Platforms, Inc., Class A (Interactive Media & Services) (a) | 2,692 | 250,787 |
| Mettler-Toledo International, Inc. (Life Sciences Tools & Services) (a) | 534 | 675,473 |
| Microsoft Corp. (Software) | 4,385 | 1,017,890 |
Portfolio of Investments October 31, 2022† (continued)
| | Shares | Value |
| Common Stocks (continued) |
| United States (continued) |
| |
| Monster Beverage Corp. (Beverages) (a) | 11,161 | $ 1,046,009 |
| Paychex, Inc. (IT Services) | 8,365 | 989,663 |
| Rollins, Inc. (Commercial Services & Supplies) | 14,629 | 615,588 |
| Starbucks Corp. (Hotels, Restaurants & Leisure) | 7,193 | 622,842 |
| SVB Financial Group (Banks) (a) | 1,294 | 298,862 |
| Texas Instruments, Inc. (Semiconductors & Semiconductor Equipment) | 3,834 | 615,855 |
| TJX Cos., Inc. (The) (Specialty Retail) | 6,404 | 461,728 |
| Trex Co., Inc. (Building Products) (a) | 7,816 | 375,871 |
| Ulta Beauty, Inc. (Specialty Retail) (a) | 1,305 | 547,278 |
| Union Pacific Corp. (Road & Rail) | 3,016 | 594,574 |
| UnitedHealth Group, Inc. (Health Care Providers & Services) | 1,897 | 1,053,120 |
| Veeva Systems, Inc., Class A (Health Care Technology) (a) | 2,752 | 462,171 |
| Vertex Pharmaceuticals, Inc. (Biotechnology) (a) | 1,618 | 504,816 |
| Visa, Inc., Class A (IT Services) | 3,635 | 753,027 |
| VMware, Inc., Class A (Software) | 5,783 | 650,761 |
| Waters Corp. (Life Sciences Tools & Services) (a) | 1,085 | 324,599 |
| West Pharmaceutical Services, Inc. (Life Sciences Tools & Services) | 2,463 | 566,736 |
| Western Alliance Bancorp (Banks) | 5,673 | 381,055 |
| Wingstop, Inc. (Hotels, Restaurants & Leisure) | 4,967 | 786,723 |
| World Wrestling Entertainment, Inc., Class A (Entertainment) | 12,994 | 1,025,097 |
| Yum! Brands, Inc. (Hotels, Restaurants & Leisure) | 6,139 | 725,937 |
| Zoetis, Inc. (Pharmaceuticals) | 6,543 | 986,554 |
| | | 43,019,342 |
Total Common Stocks
(Cost $57,748,527) | | 63,231,530 |
| | Shares | | Value |
| Short-Term Investments 2.4% |
| Affiliated Investment Company 1.0% |
| United States 1.0% |
| MainStay U.S. Government Liquidity Fund, 2.905% (d) | 643,993 | | $ 643,993 |
| Unaffiliated Investment Company 1.4% |
| United States 1.4% |
| Invesco Government & Agency Portfolio, 3.163% (d)(e) | 909,820 | | 909,820 |
Total Short-Term Investments
(Cost $1,553,813) | | | 1,553,813 |
Total Investments
(Cost $59,302,340) | 101.1% | | 64,785,343 |
| Other Assets, Less Liabilities | (1.1) | | (696,035) |
| Net Assets | 100.0% | | $ 64,089,308 |
| † | Percentages indicated are based on Fund net assets. |
| (a) | Non-income producing security. |
| (b) | All or a portion of this security was held on loan. As of October 31, 2022, the aggregate market value of securities on loan was $843,553. The Fund received cash collateral with a value of $909,820. (See Note 2(I)) |
| (c) | May be sold to institutional investors only under Rule 144A or securities offered pursuant to Section 4(a)(2) of the Securities Act of 1933, as amended. |
| (d) | Current yield as of October 31, 2022. |
| (e) | Represents a security purchased with cash collateral received for securities on loan. |
Investments in Affiliates (in 000's)
Investments in issuers considered to be affiliate(s) of the Fund during the year ended October 31, 2022 for purposes of Section 2(a)(3) of the Investment Company Act of 1940, as amended, were as follows:
| Affiliated Investment Companies | Value,
Beginning
of Year | Purchases
at Cost | Proceeds
from
Sales | Net
Realized
Gain/(Loss)
on Sales | Change in
Unrealized
Appreciation/
(Depreciation) | Value,
End of
Year | Dividend
Income | Other
Distributions | Shares
End of
Year |
| MainStay U.S. Government Liquidity Fund | $ 989 | $ 16,105 | $ (16,450) | $ — | $ — | $ 644 | $ 6 | $ — | 644 |
| 14 | MainStay Epoch Capital Growth Fund |
| Abbreviation(s): |
| SDR—Special Drawing Right |
The following is a summary of the fair valuations according to the inputs used as of October 31, 2022, for valuing the Fund’s assets:
| Description | Quoted
Prices in
Active
Markets for
Identical
Assets
(Level 1) | | Significant
Other
Observable
Inputs
(Level 2) | | Significant
Unobservable
Inputs
(Level 3) | | Total |
| Asset Valuation Inputs | | | | | | | |
| Investments in Securities (a) | | | | | | | |
| Common Stocks | $ 63,231,530 | | $ — | | $ — | | $ 63,231,530 |
| Short-Term Investments | | | | | | | |
| Affiliated Investment Company | 643,993 | | — | | — | | 643,993 |
| Unaffiliated Investment Company | 909,820 | | — | | — | | 909,820 |
| Total Short-Term Investments | 1,553,813 | | — | | — | | 1,553,813 |
| Total Investments in Securities | $ 64,785,343 | | $ — | | $ — | | $ 64,785,343 |
| (a) | For a complete listing of investments and their industries, see the Portfolio of Investments. |
Portfolio of Investments October 31, 2022† (continued)
The table below sets forth the diversification of the Fund’s investments by industry.
Industry Diversification
| | Value | | Percent |
| Air Freight & Logistics | $ 374,081 | | 0.6% |
| Auto Components | 639,839 | | 1.0 |
| Banks | 1,712,144 | | 2.7 |
| Beverages | 2,094,107 | | 3.3 |
| Biotechnology | 2,058,957 | | 3.2 |
| Building Products | 375,871 | | 0.6 |
| Capital Markets | 3,316,311 | | 5.1 |
| Chemicals | 296,095 | | 0.5 |
| Commercial Services & Supplies | 615,588 | | 1.0 |
| Communications Equipment | 856,656 | | 1.3 |
| Construction Materials | 475,664 | | 0.7 |
| Diversified Financial Services | 354,615 | | 0.6 |
| Entertainment | 1,486,866 | | 2.3 |
| Food & Staples Retailing | 2,232,365 | | 3.5 |
| Health Care Equipment & Supplies | 1,447,004 | | 2.2 |
| Health Care Providers & Services | 2,180,199 | | 3.4 |
| Health Care Technology | 462,171 | | 0.7 |
| Hotels, Restaurants & Leisure | 5,116,826 | | 8.0 |
| Interactive Media & Services | 1,568,422 | | 2.4 |
| IT Services | 5,335,619 | | 8.4 |
| Leisure Products | 408,738 | | 0.6 |
| Life Sciences Tools & Services | 3,489,853 | | 5.5 |
| Machinery | 1,887,279 | | 2.9 |
| Marine | 1,095,967 | | 1.7 |
| Media | 540,942 | | 0.8 |
| Pharmaceuticals | 4,532,180 | | 7.1 |
| Real Estate Management & Development | 180,541 | | 0.3 |
| Road & Rail | 594,574 | | 0.9 |
| Semiconductors & Semiconductor Equipment | 4,841,574 | | 7.7 |
| Software | 4,779,459 | | 7.4 |
| Specialty Retail | 2,434,886 | | 3.8 |
| Technology Hardware, Storage & Peripherals | 1,277,955 | | 2.0 |
| Textiles, Apparel & Luxury Goods | 718,406 | | 1.1 |
| Tobacco | 652,090 | | 1.0 |
| Trading Companies & Distributors | 2,358,936 | | 3.7 |
| Transportation Infrastructure | 438,750 | | 0.7 |
| | 63,231,530 | | 98.7 |
| Short-Term Investments | 1,553,813 | | 2.4 |
| Other Assets, Less Liabilities | (696,035) | | (1.1) |
| Net Assets | $64,089,308 | | 100.0% |
| † | Percentages indicated are based on Fund net assets. |
| 16 | MainStay Epoch Capital Growth Fund |
Statement of Assets and Liabilities as of October 31, 2022
| Assets |
Investment in unaffiliated securities, at value
(identified cost $58,658,347) including securities on loan of $843,553 | $64,141,350 |
Investment in affiliated investment companies, at value
(identified cost $643,993) | 643,993 |
Cash denominated in foreign currencies
(identified cost $1,438) | 1,434 |
| Receivables: | |
| Dividends | 116,251 |
| Fund shares sold | 99,418 |
| Investment securities sold | 35,853 |
| Securities lending | 500 |
| Other assets | 45,664 |
| Total assets | 65,084,463 |
| Liabilities |
| Cash collateral received for securities on loan | 909,820 |
| Payables: | |
| Manager (See Note 3) | 32,832 |
| Custodian | 9,512 |
| Professional fees | 8,968 |
| Shareholder communication | 8,709 |
| Transfer agent (See Note 3) | 5,948 |
| Fund shares redeemed | 5,883 |
| NYLIFE Distributors (See Note 3) | 5,105 |
| Accrued expenses | 8,378 |
| Total liabilities | 995,155 |
| Net assets | $64,089,308 |
| Composition of Net Assets |
| Shares of beneficial interest outstanding (par value of $.001 per share) unlimited number of shares authorized | $ 6,127 |
| Additional paid-in-capital | 58,255,918 |
| | 58,262,045 |
| Total distributable earnings (loss) | 5,827,263 |
| Net assets | $64,089,308 |
| Class A | |
| Net assets applicable to outstanding shares | $20,879,791 |
| Shares of beneficial interest outstanding | 2,000,864 |
| Net asset value per share outstanding | $ 10.44 |
| Maximum sales charge (5.50% of offering price) | 0.61 |
| Maximum offering price per share outstanding | $ 11.05 |
| Investor Class | |
| Net assets applicable to outstanding shares | $ 1,133,534 |
| Shares of beneficial interest outstanding | 109,497 |
| Net asset value per share outstanding | $ 10.35 |
| Maximum sales charge (5.00% of offering price) | 0.54 |
| Maximum offering price per share outstanding | $ 10.89 |
| Class C | |
| Net assets applicable to outstanding shares | $ 794,427 |
| Shares of beneficial interest outstanding | 80,563 |
| Net asset value and offering price per share outstanding | $ 9.86 |
| Class I | |
| Net assets applicable to outstanding shares | $41,281,556 |
| Shares of beneficial interest outstanding | 3,935,718 |
| Net asset value and offering price per share outstanding | $ 10.49 |
The notes to the financial statements are an integral part of, and should be read in conjunction with, the financial statements.
17
Statement of Operations for the year ended October 31, 2022
| Investment Income (Loss) |
| Income | |
| Dividends-unaffiliated (net of foreign tax withholding of $68,555) | $ 989,409 |
| Dividends-affiliated | 5,529 |
| Securities lending, net | 2,317 |
| Total income | 997,255 |
| Expenses | |
| Manager (See Note 3) | 518,034 |
| Distribution/Service—Class A (See Note 3) | 53,390 |
| Distribution/Service—Investor Class (See Note 3) | 3,280 |
| Distribution/Service—Class C (See Note 3) | 9,592 |
| Registration | 59,943 |
| Transfer agent (See Note 3) | 37,970 |
| Custodian | 37,678 |
| Professional fees | 24,005 |
| Shareholder communication | 3,099 |
| Trustees | 1,193 |
| Miscellaneous | 12,979 |
| Total expenses before waiver/reimbursement | 761,163 |
| Expense waiver/reimbursement from Manager (See Note 3) | (67,710) |
| Net expenses | 693,453 |
| Net investment income (loss) | 303,802 |
| Realized and Unrealized Gain (Loss) |
| Net realized gain (loss) on: | |
| Unaffiliated investment transactions | 325,905 |
| Foreign currency transactions | (10,778) |
| Net realized gain (loss) | 315,127 |
| Net change in unrealized appreciation (depreciation) on: | |
| Unaffiliated investments | (16,914,263) |
| Translation of other assets and liabilities in foreign currencies | (8,049) |
| Net change in unrealized appreciation (depreciation) | (16,922,312) |
| Net realized and unrealized gain (loss) | (16,607,185) |
| Net increase (decrease) in net assets resulting from operations | $(16,303,383) |
The notes to the financial statements are an integral part of, and should be read in conjunction with, the financial statements.
| 18 | MainStay Epoch Capital Growth Fund |
Statements of Changes in Net Assets
for the years ended October 31, 2022 and October 31, 2021
| | 2022 | 2021 |
| Increase (Decrease) in Net Assets |
| Operations: | | |
| Net investment income (loss) | $ 303,802 | $ 82,382 |
| Net realized gain (loss) | 315,127 | 19,506,272 |
| Net change in unrealized appreciation (depreciation) | (16,922,312) | 5,298,259 |
| Net increase (decrease) in net assets resulting from operations | (16,303,383) | 24,886,913 |
| Distributions to shareholders: | | |
| Class A | (4,992,940) | (1,425,751) |
| Investor Class | (363,357) | (268,568) |
| Class C | (298,992) | (201,859) |
| Class I | (12,067,689) | (10,411,550) |
| Total distributions to shareholders | (17,722,978) | (12,307,728) |
| Capital share transactions: | | |
| Net proceeds from sales of shares | 14,278,356 | 38,605,038 |
| Net asset value of shares issued to shareholders in reinvestment of distributions | 17,496,640 | 12,162,981 |
| Cost of shares redeemed | (12,307,173) | (50,502,481) |
| Increase (decrease) in net assets derived from capital share transactions | 19,467,823 | 265,538 |
| Net increase (decrease) in net assets | (14,558,538) | 12,844,723 |
| Net Assets |
| Beginning of year | 78,647,846 | 65,803,123 |
| End of year | $ 64,089,308 | $ 78,647,846 |
The notes to the financial statements are an integral part of, and should be read in conjunction with, the financial statements.
19
Financial Highlights selected per share data and ratios
| | Year Ended October 31, |
| Class A | 2022 | | 2021 | | 2020 | | 2019 | | 2018 |
| Net asset value at beginning of year | $ 17.09 | | $ 14.43 | | $ 13.20 | | $ 12.21 | | $ 12.55 |
| Net investment income (loss) (a) | 0.03 | | (0.01) | | 0.00‡ | | 0.07 | | 0.07 |
| Net realized and unrealized gain (loss) | (2.86) | | 5.43 | | 1.92 | | 1.81 | | 0.02 |
| Total from investment operations | (2.83) | | 5.42 | | 1.92 | | 1.88 | | 0.09 |
| Less distributions: | | | | | | | | | |
| From net investment income | — | | (0.03) | | (0.07) | | (0.08) | | (0.07) |
| From net realized gain on investments | (3.82) | | (2.73) | | (0.62) | | (0.81) | | (0.36) |
| Total distributions | (3.82) | | (2.76) | | (0.69) | | (0.89) | | (0.43) |
| Net asset value at end of year | $ 10.44 | | $ 17.09 | | $ 14.43 | | $ 13.20 | | $ 12.21 |
| Total investment return (b) | (20.79)% | | 42.61% | | 15.31% | | 16.82% | | 0.63% |
| Ratios (to average net assets)/Supplemental Data: | | | | | | | | | |
| Net investment income (loss) | 0.30% | | (0.08)% | | 0.01% | | 0.58% | | 0.57% |
| Net expenses (c) | 1.15% | | 1.15% | | 1.13% | | 1.15% | | 1.15% |
| Expenses (before waiver/reimbursement) (c) | 1.25% | | 1.36% | | 1.16% | | 1.27% | | 1.15% |
| Portfolio turnover rate | 31% | | 80% | | 43% | | 46% | | 51% |
| Net assets at end of year (in 000’s) | $ 20,880 | | $ 21,767 | | $ 6,733 | | $ 4,041 | | $ 268 |
| ‡ | Less than one cent per share. |
| (a) | Per share data based on average shares outstanding during the year. |
| (b) | Total investment return is calculated exclusive of sales charges and assumes the reinvestment of dividends and distributions. For periods of less than one year, total return is not annualized. |
| (c) | In addition to the fees and expenses which the Fund bears directly, it also indirectly bears a pro-rata share of the fees and expenses of the underlying funds in which it invests. Such indirect expenses are not included in the above expense ratios. |
| | Year Ended October 31, |
| Investor Class | 2022 | | 2021 | | 2020 | | 2019 | | 2018 |
| Net asset value at beginning of year | $ 17.02 | | $ 14.40 | | $ 13.16 | | $ 12.18 | | $ 12.54 |
| Net investment income (loss) (a) | 0.01 | | (0.05) | | (0.02) | | 0.04 | | 0.05 |
| Net realized and unrealized gain (loss) | (2.86) | | 5.40 | | 1.92 | | 1.80 | | 0.01 |
| Total from investment operations | (2.85) | | 5.35 | | 1.90 | | 1.84 | | 0.06 |
| Less distributions: | | | | | | | | | |
| From net investment income | — | | (0.00)‡ | | (0.04) | | (0.05) | | (0.06) |
| From net realized gain on investments | (3.82) | | (2.73) | | (0.62) | | (0.81) | | (0.36) |
| Total distributions | (3.82) | | (2.73) | | (0.66) | | (0.86) | | (0.42) |
| Net asset value at end of year | $ 10.35 | | $ 17.02 | | $ 14.40 | | $ 13.16 | | $ 12.18 |
| Total investment return (b) | (21.04)% | | 42.05% | | 15.14% | | 16.42% | | 0.40% |
| Ratios (to average net assets)/Supplemental Data: | | | | | | | | | |
| Net investment income (loss) | 0.05% | | (0.31)% | | (0.17)% | | 0.30% | | 0.40% |
| Net expenses (c) | 1.39% | | 1.42% | | 1.34% | | 1.43% | | 1.40% |
| Expenses (before waiver/reimbursement) (c) | 1.44% | | 1.59% | | 1.36% | | 1.54% | | 1.40% |
| Portfolio turnover rate | 31% | | 80% | | 43% | | 46% | | 51% |
| Net assets at end of year (in 000's) | $ 1,134 | | $ 1,648 | | $ 1,416 | | $ 1,177 | | $ 78 |
| ‡ | Less than one cent per share. |
| (a) | Per share data based on average shares outstanding during the year. |
| (b) | Total investment return is calculated exclusive of sales charges and assumes the reinvestment of dividends and distributions. For periods of less than one year, total return is not annualized. |
| (c) | In addition to the fees and expenses which the Fund bears directly, it also indirectly bears a pro-rata share of the fees and expenses of the underlying funds in which it invests. Such indirect expenses are not included in the above expense ratios. |
The notes to the financial statements are an integral part of, and should be read in conjunction with, the financial statements.
| 20 | MainStay Epoch Capital Growth Fund |
Financial Highlights selected per share data and ratios
| | Year Ended October 31, |
| Class C | 2022 | | 2021 | | 2020 | | 2019 | | 2018 |
| Net asset value at beginning of year | $ 16.49 | | $ 14.10 | | $ 12.97 | | $ 12.04 | | $ 12.44 |
| Net investment income (loss) (a) | (0.08) | | (0.16) | | (0.12) | | (0.06) | | (0.05) |
| Net realized and unrealized gain (loss) | (2.73) | | 5.28 | | 1.87 | | 1.80 | | 0.01 |
| Total from investment operations | (2.81) | | 5.12 | | 1.75 | | 1.74 | | (0.04) |
| Less distributions: | | | | | | | | | |
| From net investment income | — | | — | | (0.62) | | (0.81) | | (0.36) |
| From net realized gain on investments | (3.82) | | (2.73) | | — | | — | | — |
| Total distributions | (3.82) | | (2.73) | | (0.62) | | (0.81) | | (0.36) |
| Net asset value at end of year | $ 9.86 | | $ 16.49 | | $ 14.10 | | $ 12.97 | | $ 12.04 |
| Total investment return (b) | (21.60)% | | 41.17% | | 14.24% | | 15.59% | | (0.38)% |
| Ratios (to average net assets)/Supplemental Data: | | | | | | | | | |
| Net investment income (loss) | (0.71)% | | (1.09)% | | (0.92)% | | (0.46)% | | (0.40)% |
| Net expenses (c) | 2.14% | | 2.17% | | 2.09% | | 2.17% | | 2.15% |
| Expenses (before waiver/reimbursement) (c) | 2.20% | | 2.34% | | 2.11% | | 2.27% | | 2.15% |
| Portfolio turnover rate | 31% | | 80% | | 43% | | 46% | | 51% |
| Net assets at end of year (in 000’s) | $ 794 | | $ 1,288 | | $ 1,152 | | $ 1,236 | | $ 41 |
| (a) | Per share data based on average shares outstanding during the year. |
| (b) | Total investment return is calculated exclusive of sales charges and assumes the reinvestment of dividends and distributions. For periods of less than one year, total return is not annualized. |
| (c) | In addition to the fees and expenses which the Fund bears directly, it also indirectly bears a pro-rata share of the fees and expenses of the underlying funds in which it invests. Such indirect expenses are not included in the above expense ratios. |
| | Year Ended October 31, |
| Class I | 2022 | | 2021 | | 2020 | | 2019 | | 2018 |
| Net asset value at beginning of year | $ 17.15 | | $ 14.47 | | $ 13.23 | | $ 12.24 | | $ 12.57 |
| Net investment income (loss) (a) | 0.06 | | 0.03 | | 0.04 | | 0.08 | | 0.11 |
| Net realized and unrealized gain (loss) | (2.88) | | 5.45 | | 1.92 | | 1.83 | | 0.01 |
| Total from investment operations | (2.82) | | 5.48 | | 1.96 | | 1.91 | | 0.12 |
| Less distributions: | | | | | | | | | |
| From net investment income | (0.02) | | (0.07) | | (0.10) | | (0.11) | | (0.09) |
| From net realized gain on investments | (3.82) | | (2.73) | | (0.62) | | (0.81) | | (0.36) |
| Total distributions | (3.84) | | (2.80) | | (0.72) | | (0.92) | | (0.45) |
| Net asset value at end of year | $ 10.49 | | $ 17.15 | | $ 14.47 | | $ 13.23 | | $ 12.24 |
| Total investment return (b) | (20.63)% | | 42.99% | | 15.58% | | 17.11% | | 0.87% |
| Ratios (to average net assets)/Supplemental Data: | | | | | | | | | |
| Net investment income (loss) | 0.54% | | 0.21% | | 0.29% | | 0.66% | | 0.83% |
| Net expenses (c) | 0.90% | | 0.90% | | 0.90% | | 0.90% | | 0.90% |
| Expenses (before waiver/reimbursement) (c) | 1.00% | | 1.10% | | 0.93% | | 1.00% | | 0.90% |
| Portfolio turnover rate | 31% | | 80% | | 43% | | 46% | | 51% |
| Net assets at end of year (in 000’s) | $ 41,282 | | $ 53,944 | | $ 56,502 | | $ 119,464 | | $ 106,925 |
| (a) | Per share data based on average shares outstanding during the year. |
| (b) | Total investment return is calculated exclusive of sales charges and assumes the reinvestment of dividends and distributions. Class I shares are not subject to sales charges. For periods of less than one year, total return is not annualized. |
| (c) | In addition to the fees and expenses which the Fund bears directly, it also indirectly bears a pro-rata share of the fees and expenses of the underlying funds in which it invests. Such indirect expenses are not included in the above expense ratios. |
The notes to the financial statements are an integral part of, and should be read in conjunction with, the financial statements.
21
Notes to Financial Statements
Note 1-Organization and Business
MainStay Funds Trust (the “Trust”) was organized as a Delaware statutory trust on April 28, 2009. The Trust is registered under the Investment Company Act of 1940, as amended (the “1940 Act”), as an open-end management investment company, and is comprised of thirty-three funds (collectively referred to as the “Funds”). These financial statements and notes relate to the MainStay Epoch Capital Growth Fund (the "Fund"), a “diversified” fund, as that term is defined in the 1940 Act, as interpreted or modified by regulatory authorities having jurisdiction, from time to time.
The following table lists the Fund's share classes that have been registered and commenced operations:
| Class | Commenced Operations |
| Class A | June 30, 2016 |
| Investor Class | June 30, 2016 |
| Class C | June 30, 2016 |
| Class I | June 30, 2016 |
| Class R6 | N/A* |
| SIMPLE Class | N/A* |
| * | Class R6 shares were registered for sale effective as of February 28, 2017 and SIMPLE Class shares were registered for sale effective as of August 31, 2020 but have not yet commenced operations. |
Class A and Investor Class shares are offered at net asset value (“NAV”) per share plus an initial sales charge. No initial sales charge applies to investments of $1 million or more (and certain other qualified purchases) in Class A and Investor Class shares. However, a contingent deferred sales charge (“CDSC”) of 1.00% may be imposed on certain redemptions made within 18 months of the date of purchase on shares that were purchased without an initial sales charge. Class C shares are offered at NAV without an initial sales charge, although a 1.00% CDSC may be imposed on certain redemptions of such shares made within one year of the date of purchase of Class C shares. Class I shares are offered at NAV without a sales charge. Class R6 and SIMPLE Class shares are expected to be offered at NAV without a sales charge if such shares are offered in the future. Depending upon eligibility, Class C shares convert to either Class A or Investor Class shares at the end of the calendar quarter eight years after the date they were purchased. Additionally, Investor Class shares may convert automatically to Class A shares. Under certain circumstances and as may be permitted by the Trust’s multiple class plan pursuant to Rule 18f-3 under the 1940 Act, specified share classes of the Fund may be converted to one or more other share classes of the Fund as disclosed in the capital share transactions within these Notes. The classes of shares have the same voting (except for issues that relate solely to one class), dividend, liquidation and other rights, and the same terms and conditions, except that under distribution plans pursuant to Rule 12b-1 under the 1940 Act, Class C shares are subject to higher distribution and/or service fees than Class A, Investor Class and SIMPLE Class shares. Class I and Class R6 shares are not subject to a distribution and/or service fee.
The Fund's investment objective is to seek long-term capital appreciation.
Note 2–Significant Accounting Policies
The Fund is an investment company and accordingly follows the investment company accounting and reporting guidance of the Financial Accounting Standards Board (“FASB”) Accounting Standards Codification Topic 946 Financial Services—Investment Companies. The Fund prepares its financial statements in accordance with generally accepted accounting principles (“GAAP”) in the United States of America and follows the significant accounting policies described below.
(A) Securities Valuation. Investments are usually valued as of the close of regular trading on the New York Stock Exchange (the "Exchange") (usually 4:00 p.m. Eastern time) on each day the Fund is open for business ("valuation date").
Effective September 8, 2022, and pursuant to Rule 2a-5 under the 1940 Act, the Board of Trustees of the Trust (the "Board") designated New York Life Investment Management LLC (“New York Life Investments” or the "Manager") as its Valuation Designee (the "Valuation Designee"). The Valuation Designee is responsible for performing fair valuations relating to all investments in the Fund’s portfolio for which market quotations are not readily available; periodically assessing and managing material valuation risks; establishing and applying fair value methodologies; testing fair valuation methodologies; evaluating and overseeing pricing services; segregation of valuation and portfolio management functions; providing quarterly, annual and prompt reporting to the Board, as appropriate; identifying potential conflicts of interest; and maintaining appropriate records. The Valuation Designee has established a valuation committee ("Valuation Committee") to assist in carrying out the Valuation Designee’s responsibilities and establish prices of securities for which market quotations are not readily available. The Fund’s and the Valuation Designee's policies and procedures ("Valuation Procedures") govern the Valuation Designee’s selection and application of methodologies for determining and calculating the fair value of Fund investments. The Valuation Designee may value Fund portfolio securities for which market quotations are not readily available and other Fund assets utilizing inputs from pricing services and other third-party sources (together, “Pricing Sources”). The Valuation Committee meets (in person, via electronic mail or via teleconference) on an ad-hoc basis to determine fair valuations and on a quarterly basis to review fair value events (excluding fair valuations from pricing services), including valuation risks and back-testing results, and preview reports to the Board.
The Valuation Committee establishes prices of securities for which market quotations are not readily available based on such methodologies and measurements on a regular basis after considering information that is reasonably available and deemed relevant by the Valuation Committee. The Board shall oversee the Valuation Designee and review fair valuation materials on a prompt, quarterly and annual basis and approve proposed revisions to the Valuation Procedures.
Investments for which market quotations are not readily available are valued at fair value as determined in good faith pursuant to the Valuation Procedures. A market quotation is readily available only when that
| 22 | MainStay Epoch Capital Growth Fund |
quotation is a quoted price (unadjusted) in active markets for identical investments that the Fund can access at the measurement date, provided that a quotation will not be readily available if it is not reliable. Fair value measurements are determined within a framework that establishes a three-tier hierarchy that maximizes the use of observable market data and minimizes the use of unobservable inputs to establish a classification of fair value measurements for disclosure purposes. "Inputs" refer broadly to the assumptions that market participants would use in pricing the asset or liability, including assumptions about risk, such as the risk inherent in a particular valuation technique used to measure fair value using a pricing model and/or the risk inherent in the inputs for the valuation technique. Inputs may be observable or unobservable. Observable inputs reflect the assumptions market participants would use in pricing the asset or liability based on market data obtained from sources independent of the Fund. Unobservable inputs reflect the Fund’s own assumptions about the assumptions market participants would use in pricing the asset or liability based on the information available. The inputs or methodology used for valuing assets or liabilities may not be an indication of the risks associated with investing in those assets or liabilities. The three-tier hierarchy of inputs is summarized below.
| • | Level 1—quoted prices (unadjusted) in active markets for an identical asset or liability |
| • | Level 2—other significant observable inputs (including quoted prices for a similar asset or liability in active markets, interest rates and yield curves, prepayment speeds, credit risk, etc.) |
| • | Level 3—significant unobservable inputs (including the Fund's own assumptions about the assumptions that market participants would use in measuring fair value of an asset or liability) |
The level of an asset or liability within the fair value hierarchy is based on the lowest level of an input, both individually and in the aggregate, that is significant to the fair value measurement. The aggregate value by input level of the Fund’s assets and liabilities as of October 31, 2022, is included at the end of the Portfolio of Investments.
The Fund may use third-party vendor evaluations, whose prices may be derived from one or more of the following standard inputs, among others:
| • Broker/dealer quotes | • Benchmark securities |
| • Two-sided markets | • Reference data (corporate actions or material event notices) |
| • Bids/offers | • Monthly payment information |
| • Industry and economic events | • Reported trades |
An asset or liability for which a market quotation is not readily available is valued by methods deemed reasonable in good faith by the Valuation Committee, following the Valuation Procedures to represent fair value. Under these procedures, the Valuation Designee generally uses a market-based approach which may use related or comparable assets or liabilities, recent transactions, market multiples, book values and other relevant information. The Valuation Designee may also use an income-based valuation approach in which the anticipated future cash
flows of the asset or liability are discounted to calculate fair value. Discounts may also be applied due to the nature and/or duration of any restrictions on the disposition of the asset or liability. Fair value represents a good faith approximation of the value of a security. Fair value determinations involve the consideration of a number of subjective factors, an analysis of applicable facts and circumstances and the exercise of judgment. As a result, it is possible that the fair value for a security determined in good faith in accordance with the Valuation Procedures may differ from valuations for the same security determined for other funds using their own valuation procedures. Although the Valuation Procedures are designed to value a security at the price the Fund may reasonably expect to receive upon the security's sale in an orderly transaction, there can be no assurance that any fair value determination thereunder would, in fact, approximate the amount that the Fund would actually realize upon the sale of the security or the price at which the security would trade if a reliable market price were readily available. During the year ended October 31, 2022, there were no material changes to the fair value methodologies.
Securities which may be valued in this manner include, but are not limited to: (i) a security for which trading has been halted or suspended or otherwise does not have a readily available market quotation on a given day; (ii) a debt security that has recently gone into default and for which there is not a current market quotation; (iii) a security of an issuer that has entered into a restructuring; (iv) a security that has been delisted from a national exchange; (v) a security subject to trading collars for which no or limited trading takes place; and (vi) a security whose principal market has been temporarily closed at a time when, under normal conditions, it would be open. Securities valued in this manner are generally categorized as Level 2 or 3 in the hierarchy.
Certain securities held by the Fund may principally trade in foreign markets. Events may occur between the time the foreign markets close and the time at which the Fund's NAVs are calculated. These events may include, but are not limited to, situations relating to a single issuer in a market sector, significant fluctuations in U.S. or foreign markets, natural disasters, armed conflicts, governmental actions or other developments not tied directly to the securities markets. Should the Valuation Designee conclude that such events may have affected the accuracy of the last price of such securities reported on the local foreign market, the Valuation Designee may, pursuant to the Valuation Procedures, adjust the value of the local price to reflect the estimated impact on the price of such securities as a result of such events. In this instance, securities are generally categorized as Level 3 in the hierarchy. Additionally, certain foreign equity securities are also fair valued whenever the movement of a particular index exceeds certain thresholds. In such cases, the securities are fair valued by applying factors provided by a third-party vendor in accordance with the Valuation Procedures and are generally categorized as Level 2 in the hierarchy. No foreign equity securities held by the Fund as of October 31, 2022 were fair valued in such a manner.
If the principal market of certain foreign equity securities is closed in observance of a local foreign holiday, these securities are valued using the last closing price of regular trading on the relevant exchange and fair
Notes to Financial Statements (continued)
valued by applying factors provided by a third-party vendor in accordance with the Valuation Procedures. These securities are generally categorized as Level 2 in the hierarchy. No securities held by the Fund as of October 31, 2022, were fair valued in such a manner.
Equity securities are valued at the last quoted sales prices as of the close of regular trading on the relevant exchange on each valuation date. Securities that are not traded on the valuation date are valued at the mean of the last quoted bid and ask prices. Prices are normally taken from the principal market in which each security trades. These securities are generally categorized as Level 1 in the hierarchy.
Investments in mutual funds, including money market funds, are valued at their respective NAVs at the close of business each day on the valuation date. These securities are generally categorized as Level 1 in the hierarchy.
Temporary cash investments acquired in excess of 60 days to maturity at the time of purchase are valued using the latest bid prices or using valuations based on a matrix system (which considers such factors as security prices, yields, maturities and ratings), both as furnished by independent pricing services. Temporary cash investments that mature in 60 days or less at the time of purchase ("Short-Term Investments") are valued using the amortized cost method of valuation, unless the use of such method would be inappropriate. The amortized cost method involves valuing a security at its cost on the date of purchase and thereafter assuming a constant amortization to maturity of the difference between such cost and the value on maturity date. Amortized cost approximates the current fair value of a security. Securities valued using the amortized cost method are not valued using quoted prices in an active market and are generally categorized as Level 2 in the hierarchy.
The information above is not intended to reflect an exhaustive list of the methodologies that may be used to value portfolio investments. The Valuation Procedures permit the use of a variety of valuation methodologies in connection with valuing portfolio investments. The methodology used for a specific type of investment may vary based on the market data available or other considerations. The methodologies summarized above may not represent the specific means by which portfolio investments are valued on any particular business day.
(B) Income Taxes. The Fund's policy is to comply with the requirements of the Internal Revenue Code of 1986, as amended (the “Internal Revenue Code”), applicable to regulated investment companies and to distribute all of its taxable income to the shareholders of the Fund within the allowable time limits.
The Manager evaluates the Fund’s tax positions to determine if the tax positions taken meet the minimum recognition threshold in connection with accounting for uncertainties in income tax positions taken or expected to be taken for the purposes of measuring and recognizing tax liabilities in the financial statements. Recognition of tax benefits of an uncertain tax position is permitted only to the extent the position is “more likely than not” to be sustained assuming examination by taxing authorities. The Manager analyzed the Fund's tax positions taken on
federal, state and local income tax returns for all open tax years (for up to three tax years) and has concluded that no provisions for federal, state and local income tax are required in the Fund's financial statements. The Fund's federal, state and local income tax and federal excise tax returns for tax years for which the applicable statutes of limitations have not expired are subject to examination by the Internal Revenue Service and state and local departments of revenue.
(C) Foreign Taxes. The Fund may be subject to foreign taxes on income and other transaction-based taxes imposed by certain countries in which it invests. A portion of the taxes on gains on investments or currency purchases/repatriation may be reclaimable. The Fund will accrue such taxes and reclaims as applicable, based upon its current interpretation of tax rules and regulations that exist in the markets in which it invests.
The Fund may be subject to taxation on realized capital gains, repatriation proceeds and other transaction-based taxes imposed by certain countries in which it invests. The Fund will accrue such taxes as applicable based upon its current interpretation of tax rules and regulations that exist in the market in which it invests. Capital gains taxes relating to positions still held are reflected as a liability in the Statement of Assets and Liabilities, as well as an adjustment to the Fund's net unrealized appreciation (depreciation). Taxes related to capital gains realized, if any, are reflected as part of net realized gain (loss) in the Statement of Operations. Changes in tax liabilities related to capital gains taxes on unrealized investment gains, if any, are reflected as part of the change in net unrealized appreciation (depreciation) on investments in the Statement of Operations. Transaction-based charges are generally assessed as a percentage of the transaction amount.
(D) Dividends and Distributions to Shareholders. Dividends and distributions are recorded on the ex-dividend date. The Fund intends to declare and pay dividends from net investment income and distributions from net realized capital and currency gains, if any, at least annually. Unless a shareholder elects otherwise, all dividends and distributions are reinvested at NAV in the same class of shares of the Fund. Dividends and distributions to shareholders are determined in accordance with federal income tax regulations and may differ from determinations using GAAP.
(E) Security Transactions and Investment Income. The Fund records security transactions on the trade date. Realized gains and losses on security transactions are determined using the identified cost method. Dividend income is recognized on the ex-dividend date, net of any foreign tax withheld at the source, and interest income is accrued as earned using the effective interest rate method. Distributions received from real estate investment trusts may be classified as dividends, capital gains and/or return of capital.
Investment income and realized and unrealized gains and losses on investments of the Fund are allocated pro rata to the separate classes of shares based upon their relative net assets on the date the income is earned or realized and unrealized gains and losses are incurred.
| 24 | MainStay Epoch Capital Growth Fund |
(F) Expenses. Expenses of the Trust are allocated to the individual Funds in proportion to the net assets of the respective Funds when the expenses are incurred, except where direct allocations of expenses can be made. Expenses (other than transfer agent expenses and fees incurred under the shareholder services plans and/or the distribution plans further discussed in Note 3(B)) are allocated to separate classes of shares pro rata based upon their relative net assets on the date the expenses are incurred. The expenses borne by the Fund, including those of related parties to the Fund, are shown in the Statement of Operations.
Additionally, the Fund may invest in mutual funds, which are subject to management fees and other fees that may cause the costs of investing in mutual funds to be greater than the costs of owning the underlying securities directly. These indirect expenses of mutual funds are not included in the amounts shown as expenses in the Statement of Operations or in the expense ratios included in the Financial Highlights.
(G) Use of Estimates. In preparing financial statements in conformity with GAAP, the Manager makes estimates and assumptions that affect the reported amounts and disclosures in the financial statements. Actual results could differ from those estimates and assumptions.
(H) Foreign Currency Transactions. The Fund's books and records are maintained in U.S. dollars. Prices of securities denominated in foreign currency amounts are translated into U.S. dollars at the mean between the buying and selling rates last quoted by any major U.S. bank at the following dates:
(i) market value of investment securities, other assets and liabilities— at the valuation date; and
(ii) purchases and sales of investment securities, income and expenses—at the date of such transactions.
The assets and liabilities that are denominated in foreign currency amounts are presented at the exchange rates and market values at the close of the period. The realized and unrealized changes in net assets arising from fluctuations in exchange rates and market prices of securities are not separately presented.
Net realized gain (loss) on foreign currency transactions represents net currency gains or losses realized as a result of differences between the amounts of securities sale proceeds or purchase cost, dividends, interest and withholding taxes as recorded on the Fund's books, and the U.S. dollar equivalent amount actually received or paid. Net currency gains or losses from valuing such foreign currency denominated assets and liabilities, other than investments at valuation date exchange rates, are reflected in unrealized foreign exchange gains or losses.
(I) Securities Lending. In order to realize additional income, the Fund may engage in securities lending, subject to the limitations set forth in the 1940 Act and relevant guidance by the staff of the Securities and Exchange Commission (“SEC”). If the Fund engages in securities lending, the Fund will lend through its custodian, JPMorgan Chase Bank, N.A., ("JPMorgan"), acting as securities lending agent on behalf of the Fund. Under the current arrangement, JPMorgan will manage the Fund's
collateral in accordance with the securities lending agency agreement between the Fund and JPMorgan, and indemnify the Fund against counterparty risk. The loans will be collateralized by cash (which may be invested in a money market fund) and/or non-cash collateral (which may include U.S. Treasury securities and/or U.S. government agency securities issued or guaranteed by the United States government or its agencies or instrumentalities) at least equal at all times to the market value of the securities loaned. Non-cash collateral held at year end is segregated and cannot be transferred by the Fund. The Fund bears the risk of delay in recovery of, or loss of rights in, the securities loaned. The Fund may also record a realized gain or loss on securities deemed sold due to a borrower’s inability to return securities on loan. The Fund bears the risk of any loss on investment of cash collateral. The Fund will receive compensation for lending its securities in the form of fees or it will retain a portion of interest earned on the investment of any cash collateral. The Fund will also continue to receive interest and dividends on the securities loaned and any gain or loss in the market price of the securities loaned that may occur during the term of the loan will be for the account of the Fund. Income earned from securities lending activities, if any, is reflected in the Statement of Operations. Securities on loan as of October 31, 2022, are shown in the Portfolio of Investments.
(J) Foreign Securities Risk. The Fund may invest in foreign securities, which carry certain risks that are in addition to the usual risks inherent in domestic securities. These risks include those resulting from currency fluctuations, future adverse political or economic developments and possible imposition of currency exchange blockages or other foreign governmental laws or restrictions. These risks are likely to be greater in emerging markets than in developed markets. The ability of issuers of debt securities held by the Fund to meet their obligations may be affected by, among other things, economic or political developments in a specific country, industry or region.
(K) Indemnifications. Under the Trust’s organizational documents, its officers and trustees are indemnified against certain liabilities that may arise out of performance of their duties to the Trust. Additionally, in the normal course of business, the Fund enters into contracts with third-party service providers that contain a variety of representations and warranties and that may provide general indemnifications. The Fund's maximum exposure under these arrangements is unknown, as this would involve future claims that may be made against the Fund that have not yet occurred. The Manager believes that the risk of loss in connection with these potential indemnification obligations is remote. However, there can be no assurance that material liabilities related to such obligations will not arise in the future, which could adversely impact the Fund.
Note 3–Fees and Related Party Transactions
(A) Manager and Subadvisor. New York Life Investments, a registered investment adviser and an indirect, wholly-owned subsidiary of New York Life Insurance Company ("New York Life"), serves as the Fund's Manager, pursuant to an Amended and Restated Management Agreement (“Management Agreement”). The Manager provides offices, conducts
Notes to Financial Statements (continued)
clerical, recordkeeping and bookkeeping services and keeps most of the financial and accounting records required to be maintained by the Fund. Except for the portion of salaries and expenses that are the responsibility of the Fund, the Manager pays the salaries and expenses of all personnel affiliated with the Fund and certain operational expenses of the Fund. During a portion of the year ended October 31, 2022, the Fund reimbursed New York Life Investments in an amount equal to the portion of the compensation of the Chief Compliance Officer attributable to the Fund. Epoch Investment Partners, Inc. (“Epoch” or the “Subadvisor”), a registered investment adviser, serves as the Subadvisor to the Fund and is responsible for the day-to-day portfolio management of the Fund. Pursuant to the terms of an Amended and Restated Subadvisory Agreement (“Subadvisory Agreement”) between New York Life Investments and Epoch, New York Life Investments pays for the services of the Subadvisor.
Pursuant to the Management Agreement, the Fund pays the Manager a monthly fee for the services performed and the facilities furnished at an annual rate of 0.75% of the Fund's average daily net assets.
New York Life Investments has contractually agreed to waive fees and/or reimburse expenses so that Total Annual Fund Operating Expenses (excluding taxes, interest, litigation, extraordinary expenses, brokerage and other transaction expenses relating to the purchase or sale of portfolio investments and acquired (underlying) fund fees and expenses) do not exceed the following percentages of average daily net assets: Class A,1.15% and Class I, 0.90%. This agreement will remain in effect until February 28, 2023, and shall renew automatically for one-year terms unless New York Life Investments provides written notice of termination prior to the start of the next term or upon approval of the Board.
During the year ended October 31, 2022, New York Life Investments earned fees from the Fund in the amount of $518,034 and waived fees and/or reimbursed expenses in the amount of $67,710 and paid the Subadvisor fees in the amount of $225,182.
JPMorgan provides sub-administration and sub-accounting services to the Fund pursuant to an agreement with New York Life Investments. These services include calculating the daily NAVs of the Fund, maintaining the general ledger and sub-ledger accounts for the calculation of the Fund's NAVs, and assisting New York Life Investments in conducting various aspects of the Fund's administrative operations. For providing these services to the Fund, JPMorgan is compensated by New York Life Investments.
Pursuant to an agreement between the Trust and New York Life Investments, New York Life Investments is responsible for providing or procuring certain regulatory reporting services for the Fund. The Fund will reimburse New York Life Investments for the actual costs incurred by New York Life Investments in connection with providing or procuring these services for the Fund.
(B) Distribution and Service Fees. The Trust, on behalf of the Fund, has entered into a distribution agreement with NYLIFE Distributors LLC (the “Distributor”), an affiliate of New York Life Investments. The Fund has adopted distribution plans (the “Plans”) in accordance with the provisions of Rule 12b-1 under the 1940 Act.
Pursuant to the Class A and Investor Class Plans, the Distributor receives a monthly fee from the Class A and Investor Class shares at an annual rate of 0.25% of the average daily net assets of the Class A and Investor Class shares for distribution and/or service activities as designated by the Distributor. Pursuant to the Class C Plan, Class C shares pay the Distributor a monthly distribution fee at an annual rate of 0.75% of the average daily net assets of the Class C shares, along with a service fee at an annual rate of 0.25% of the average daily net assets of the Class C shares, for a total 12b-1 fee of 1.00%. Class I shares are not subject to a distribution and/or service fee.
The Plans provide that the distribution and service fees are payable to the Distributor regardless of the amounts actually expended by the Distributor for distribution of the Fund's shares and service activities.
(C) Sales Charges. The Fund was advised by the Distributor that the amount of initial sales charges retained on sales of Class A and Investor Class shares during the year ended October 31, 2022, were $12,255 and $401, respectively.
The Fund was also advised that the Distributor retained CDSCs on redemptions of Class A and Class C shares during the year ended October 31, 2022, of $525 and $142, respectively.
(D) Transfer, Dividend Disbursing and Shareholder Servicing Agent. NYLIM Service Company LLC, an affiliate of New York Life Investments, is the Fund's transfer, dividend disbursing and shareholder servicing agent pursuant to an agreement between NYLIM Service Company LLC and the Trust. NYLIM Service Company LLC has entered into an agreement with DST Asset Manager Solutions, Inc. ("DST"), pursuant to which DST performs certain transfer agent services on behalf of NYLIM Service Company LLC. New York Life Investments has contractually agreed to limit the transfer agency expenses charged to the Fund’s share classes to a maximum of 0.35% of that share class’s average daily net assets on an annual basis after deducting any applicable Fund or class-level expense reimbursement or small account fees. This agreement will remain in effect until February 28, 2023, and shall renew automatically for one-year terms unless New York Life Investments provides written notice of termination prior to the start of the next term or upon approval of the Board. During the year ended October 31, 2022, transfer agent expenses incurred by the Fund and any
| 26 | MainStay Epoch Capital Growth Fund |
reimbursements, pursuant to the aforementioned Transfer Agency expense limitation agreement, were as follows:
| Class | Expense | Waived |
| Class A | $10,451 | $— |
| Investor Class | 3,147 | — |
| Class C | 2,320 | — |
| Class I | 22,052 | — |
(E) Small Account Fee. Shareholders with small accounts adversely impact the cost of providing transfer agency services. In an effort to reduce total transfer agency expenses, the Fund has implemented a small account fee on certain types of accounts. As described in the Fund's prospectus, certain shareholders with an account balance of less than $1,000 ($5,000 for Class A share accounts) are charged an annual per account fee of $20 (assessed semi-annually), the proceeds from which offset transfer agent fees as reflected in the Statement of Operations. This small account fee will not apply to certain types of accounts as described further in the Fund’s prospectus.
Note 4-Federal Income Tax
As of October 31, 2022, the cost and unrealized appreciation (depreciation) of the Fund’s investment portfolio, including applicable derivative contracts and other financial instruments, as determined on a federal income tax basis, were as follows:
| | Federal Tax
Cost | Gross
Unrealized
Appreciation | Gross
Unrealized
(Depreciation) | Net
Unrealized
Appreciation/
(Depreciation) |
| Investments in Securities | $59,761,436 | $10,866,642 | $(5,842,627) | $5,024,015 |
As of October 31, 2022, the components of accumulated gain (loss) on a tax basis were as follows:
Ordinary
income | Accumulated
Capital
and Other
Gain (Loss) | Other
Temporary
Differences | Unrealized
Appreciation
(Depreciation) | Total
Accumulated
Gain (Loss) |
| $192,116 | $659,186 | $(41,138) | $5,017,099 | $5,827,263 |
The difference between book-basis and tax-basis unrealized appreciation (depreciation) is primarily due to Passive Foreign Investment Company (“PFIC”) and wash sale adjustments. The other temporary differences are primarily due to amortization of organizational expenses.
During the years ended October 31, 2022 and October 31, 2021, the tax character of distributions paid as reflected in the Statements of Changes in Net Assets was as follows:
| | 2022 | 2021 |
| Distributions paid from: | | |
| Ordinary Income | $ 3,330,996 | $ 1,475,154 |
| Long-Term Capital Gains | 14,391,982 | 10,832,574 |
| Total | $17,722,978 | $12,307,728 |
Note 5–Custodian
JPMorgan is the custodian of cash and securities held by the Fund. Custodial fees are charged to the Fund based on the Fund's net assets and/or the market value of securities held by the Fund and the number of certain transactions incurred by the Fund.
Note 6–Line of Credit
The Fund and certain other funds managed by New York Life Investments maintain a line of credit with a syndicate of banks in order to secure a source of funds for temporary purposes to meet unanticipated or excessive redemption requests.
Effective July 26, 2022, under the credit agreement (the “Credit Agreement”), the aggregate commitment amount is $600,000,000 with an additional uncommitted amount of $100,000,000. The commitment fee is an annual rate of 0.15% of the average commitment amount payable quarterly, regardless of usage, to JPMorgan, who serves as the agent to the syndicate. The commitment fee is allocated among the Fund and certain other funds managed by New York Life Investments based upon their respective net assets and other factors. Interest on any revolving credit loan is charged based upon the Federal Funds Rate, Daily Simple Secured Overnight Financing Rate ("SOFR") + 0.10%, or the Overnight Bank Funding Rate, whichever is higher. The Credit Agreement expires on July 25, 2023, although the Fund, certain other funds managed by New York Life Investments and the syndicate of banks may renew the Credit Agreement for an additional year on the same or different terms or enter into a credit agreement with a different syndicate of banks. Prior to July 26, 2022, the aggregate commitment amount and the commitment fee were the same as those under the current Credit Agreement. During the year ended October 31, 2022, there were no borrowings made or outstanding with respect to the Fund under the Credit Agreement.
Note 7–Interfund Lending Program
Pursuant to an exemptive order issued by the SEC, the Fund, along with certain other funds managed by New York Life Investments, may participate in an interfund lending program. The interfund lending program provides an alternative credit facility that permits the Fund and certain other funds managed by New York Life Investments to lend or borrow money for temporary purposes directly to or from one another, subject to the conditions of the exemptive order. During the year ended
Notes to Financial Statements (continued)
October 31, 2022, there were no interfund loans made or outstanding with respect to the Fund.
Note 8–Purchases and Sales of Securities (in 000’s)
During the year ended October 31, 2022, purchases and sales of securities, other than short-term securities, were $23,785 and $21,612, respectively.
Note 9–Capital Share Transactions
Transactions in capital shares for the years ended October 31, 2022 and October 31, 2021, were as follows:
| Class A | Shares | Amount |
| Year ended October 31, 2022: | | |
| Shares sold | 709,982 | $ 8,625,981 |
| Shares issued to shareholders in reinvestment of distributions | 384,632 | 4,954,057 |
| Shares redeemed | (391,322) | (4,603,433) |
| Net increase (decrease) in shares outstanding before conversion | 703,292 | 8,976,605 |
| Shares converted into Class A (See Note 1) | 23,937 | 303,739 |
| Net increase (decrease) | 727,229 | $ 9,280,344 |
| Year ended October 31, 2021: | | |
| Shares sold | 849,654 | $ 13,153,711 |
| Shares issued to shareholders in reinvestment of distributions | 103,916 | 1,408,059 |
| Shares redeemed | (199,599) | (3,086,554) |
| Net increase (decrease) in shares outstanding before conversion | 753,971 | 11,475,216 |
| Shares converted into Class A (See Note 1) | 53,113 | 800,905 |
| Net increase (decrease) | 807,084 | $ 12,276,121 |
| |
| Investor Class | Shares | Amount |
| Year ended October 31, 2022: | | |
| Shares sold | 14,650 | $ 181,933 |
| Shares issued to shareholders in reinvestment of distributions | 28,387 | 363,357 |
| Shares redeemed | (14,009) | (161,742) |
| Net increase (decrease) in shares outstanding before conversion | 29,028 | 383,548 |
| Shares converted into Investor Class (See Note 1) | 1,563 | 17,080 |
| Shares converted from Investor Class (See Note 1) | (17,935) | (235,284) |
| Net increase (decrease) | 12,656 | $ 165,344 |
| Year ended October 31, 2021: | | |
| Shares sold | 37,171 | $ 556,301 |
| Shares issued to shareholders in reinvestment of distributions | 19,835 | 268,568 |
| Shares redeemed | (13,478) | (204,246) |
| Net increase (decrease) in shares outstanding before conversion | 43,528 | 620,623 |
| Shares converted into Investor Class (See Note 1) | 4,200 | 62,596 |
| Shares converted from Investor Class (See Note 1) | (49,222) | (739,778) |
| Net increase (decrease) | (1,494) | $ (56,559) |
| |
| Class C | Shares | Amount |
| Year ended October 31, 2022: | | |
| Shares sold | 28,990 | $ 303,526 |
| Shares issued to shareholders in reinvestment of distributions | 23,870 | 293,121 |
| Shares redeemed | (42,311) | (462,532) |
| Net increase (decrease) in shares outstanding before conversion | 10,549 | 134,115 |
| Shares converted from Class C (See Note 1) | (8,094) | (85,535) |
| Net increase (decrease) | 2,455 | $ 48,580 |
| Year ended October 31, 2021: | | |
| Shares sold | 33,628 | $ 491,294 |
| Shares issued to shareholders in reinvestment of distributions | 15,244 | 201,064 |
| Shares redeemed | (44,021) | (635,564) |
| Net increase (decrease) in shares outstanding before conversion | 4,851 | 56,794 |
| Shares converted from Class C (See Note 1) | (8,445) | (123,723) |
| Net increase (decrease) | (3,594) | $ (66,929) |
| |
| 28 | MainStay Epoch Capital Growth Fund |
| Class I | Shares | Amount |
| Year ended October 31, 2022: | | |
| Shares sold | 461,566 | $ 5,166,916 |
| Shares issued to shareholders in reinvestment of distributions | 920,690 | 11,886,105 |
| Shares redeemed | (591,942) | (7,079,466) |
| Net increase (decrease) | 790,314 | $ 9,973,555 |
| Year ended October 31, 2021: | | |
| Shares sold | 1,780,134 | $ 24,403,732 |
| Shares issued to shareholders in reinvestment of distributions | 758,502 | 10,285,290 |
| Shares redeemed | (3,298,049) | (46,576,117) |
| Net increase (decrease) | (759,413) | $(11,887,095) |
Note 10–Other Matters
As of the date of this report, interest rates in the United States and many parts of the world, including certain European countries, are ascending from historically low levels. Thus, the Fund currently faces a heightened level of risk associated with rising interest rates. This could be driven by a variety of factors, including but not limited to central bank monetary policies, changing inflation or real growth rates, general economic conditions, increasing bond issuances or reduced market demand for low yielding investments.
An outbreak of COVID-19, first detected in December 2019, has developed into a global pandemic and has resulted in travel restrictions, closure of international borders, certain businesses and securities markets, restrictions on securities trading activities, prolonged quarantines, supply chain disruptions, and lower consumer demand, as well as general concern and uncertainty. In 2022, many countries lifted some or all restrictions related to COVID-19. However, the continued impact of COVID-19 and related variants is uncertain and could further adversely affect the global economy, national economies, individual issuers and capital markets in unforeseeable ways and result in a substantial and extended economic downturn. Developments that disrupt global economies and financial markets, such as COVID-19, may magnify factors that affect the Fund's performance.
Note 11–Subsequent Events
In connection with the preparation of the financial statements of the Fund as of and for the year ended October 31, 2022, events and transactions subsequent to October 31, 2022, through the date the financial statements were issued have been evaluated by the Manager for possible adjustment and/or disclosure. No subsequent events requiring financial statement adjustment or disclosure have been identified.
Report of Independent Registered Public Accounting Firm
To the Shareholders of the Fund and Board of Trustees
MainStay Funds Trust:
Opinion on the Financial Statements
We have audited the accompanying statement of assets and liabilities of MainStay Epoch Capital Growth Fund (the Fund), one of the funds constituting MainStay Funds Trust, including the portfolio of investments, as of October 31, 2022, the related statement of operations for the year then ended, the statements of changes in net assets for each of the years in the two-year period then ended, and the related notes (collectively, the financial statements) and the financial highlights for each of the years in the five-year period then ended. In our opinion, the financial statements and financial highlights present fairly, in all material respects, the financial position of the Fund as of October 31, 2022, the results of its operations for the year then ended, the changes in its net assets for each of the years in the two-year period then ended, and the financial highlights for each of the years in the five-year period then ended, in conformity with U.S. generally accepted accounting principles.
Basis for Opinion
These financial statements and financial highlights are the responsibility of the Fund's management. Our responsibility is to express an opinion on these financial statements and financial highlights based on our audits. We are a public accounting firm registered with the Public Company Accounting Oversight Board (United States) (PCAOB) and are required to be independent with respect to the Fund in accordance with the U.S. federal securities laws and the applicable rules and regulations of the Securities and Exchange Commission and the PCAOB.
We conducted our audits in accordance with the standards of the PCAOB. Those standards require that we plan and perform the audit to obtain reasonable assurance about whether the financial statements and financial highlights are free of material misstatement, whether due to error or fraud. Our audits included performing procedures to assess the risks of material misstatement of the financial statements and financial highlights, whether due to error or fraud, and performing procedures that respond to those risks. Such procedures included examining, on a test basis, evidence regarding the amounts and disclosures in the financial statements and financial highlights. Such procedures also included confirmation of securities owned as of October 31, 2022, by correspondence with custodians, the transfer agent and brokers; when replies were not received from brokers, we performed other auditing procedures. Our audits also included evaluating the accounting principles used and significant estimates made by management, as well as evaluating the overall presentation of the financial statements and financial highlights. We believe that our audits provide a reasonable basis for our opinion.

We have served as the auditor of one or more New York Life Investment Management investment companies since 2003.
Philadelphia, Pennsylvania
December 23, 2022
| 30 | MainStay Epoch Capital Growth Fund |
Federal Income Tax Information
(Unaudited)
The Fund is required under the Internal Revenue Code to advise shareholders in a written statement as to the federal tax status of dividends paid by the Fund during such fiscal years. Accordingly, the Fund paid $14,391,819 as long term capital gain distributions.
For the fiscal year ended October 31, 2022, the Fund designated approximately $726,830 under the Internal Revenue Code as qualified dividend income eligible for reduced tax rates.
The dividends paid by the Fund during the fiscal year ended October 31, 2022 should be multiplied by 10.77% to arrive at the amount eligible for the corporate dividend-received deduction.
In February 2023, shareholders will receive an IRS Form 1099-DIV or substitute Form 1099, which will show the federal tax status of the distributions received by shareholders in calendar year 2022. The amounts that will be reported on such 1099-DIV or substitute Form 1099 will be the amounts you are to use on your federal income tax return and will differ from the amounts which we must report for the Fund's fiscal year ended October 31, 2022.
Proxy Voting Policies and Procedures and Proxy Voting Record
The Fund is required to file with the SEC its proxy voting record for the 12-month period ending June 30 on Form N-PX. A description of the policies and procedures that are used to vote proxies relating to portfolio securities of the Fund is available free of charge upon request by calling 800-624-6782 or visiting the SEC’s website at www.sec.gov. The most recent Form N-PX or proxy voting record is available free of charge upon request by calling 800-624-6782; visiting newyorklifeinvestments.com; or visiting the SEC’s website at www.sec.gov.
Shareholder Reports and Quarterly Portfolio Disclosure
The Fund is required to file its complete schedule of portfolio holdings with the SEC 60 days after its first and third fiscal quarter on Form N-PORT. The Fund's holdings report is available free of charge upon request by calling New York Life Investments at 800-624-6782.
Board of Trustees and Officers (Unaudited)
The Trustees and officers of the Fund are listed below. The Board oversees the MainStay Group of Funds (which consists of MainStay Funds and MainStay Funds Trust), MainStay VP Funds Trust, MainStay MacKay DefinedTerm Municipal Opportunities Fund, MainStay CBRE Global Infrastructure Megatrends Fund, the Manager and the Subadvisors, and elects the officers of the Funds who are responsible for the day-to-day operations of the Fund. Information pertaining to the Trustees and officers is set forth below. Each Trustee serves until his or her successor is
elected and qualified or until his or her resignation, death or removal. Under the Board’s retirement policy, unless an exception is made, a Trustee must tender his or her resignation by the end of the calendar year during which he or she reaches the age of 75. The business address of each Trustee and officer listed below is 51 Madison Avenue, New York, New York 10010. None of the Trustees are “interested persons” (as defined by the 1940 Act and rules adopted by the SEC thereunder) of the Fund (“Independent Trustees”).
| | Name and
Year of Birth | Term of Office,
Position(s) Held and
Length of Service | Principal Occupation(s)
During Past Five Years | Number of
Portfolios in
Fund Complex
Overseen by
Trustee | Other Directorships
Held by Trustee |
| | | | | | |
| | David H. Chow
1957 | MainStay Funds: Trustee since 2016, Advisory Board Member (June 2015 to December 2015);MainStay Funds Trust:
Trustee since January 2016, Advisory Board Member (June 2015 to December 2015) | Founder and CEO, DanCourt Management, LLC since 1999 | 78 | MainStay VP Funds Trust: Trustee since January 2016, Advisory Board Member (June 2015 to December 2015) (31 portfolios);
MainStay MacKay DefinedTerm Municipal Opportunities Fund: Trustee since January 2016, Advisory Board Member (June 2015 to December 2015);
MainStay CBRE Global Infrastructure Megatrends Fund: Trustee since June 2021; VanEck Vectors Group of Exchange-Traded Funds: Independent Chairman of the Board of Trustees since 2008 and Trustee since 2006 (56 portfolios); and Berea College of Kentucky: Trustee since 2009, Chair of the Investment Committee since 2018 |
| | Susan B. Kerley
1951 | MainStay Funds: Chairman since 2017 and Trustee since 2007;MainStay Funds Trust:
Chairman since 2017 and Trustee since 1990** | President, Strategic Management Advisors LLC since 1990 | 78 | MainStay VP Funds Trust: Chairman since January 2017 and Trustee since 2007 (31 portfolios)**;
MainStay MacKay DefinedTerm Municipal Opportunities Fund: Chairman since 2017 and Trustee since 2011;
MainStay CBRE Global Infrastructure Megatrends Fund: Trustee since June 2021; and Legg Mason Partners Funds: Trustee since 1991 (45 portfolios) |
| | Alan R. Latshaw
1951 | MainStay Funds: Trustee since 2006;MainStay Funds Trust:
Trustee since 2007*** | Retired; Partner, Ernst & Young LLP (2002 to 2003); Partner, Arthur Andersen LLP (1989 to 2002); Consultant to the MainStay Funds Audit and Compliance Committee (2004 to 2006) | 78 | MainStay VP Funds Trust: Trustee since 2007 (31 portfolios)**;
MainStay MacKay DefinedTerm Municipal Opportunities Fund: Trustee since 2011; and
MainStay CBRE Global Infrastructure Megatrends Fund: Trustee since June 2021 |
| 32 | MainStay Epoch Capital Growth Fund |
| | Name and
Year of Birth | Term of Office,
Position(s) Held and
Length of Service | Principal Occupation(s)
During Past Five Years | Number of
Portfolios in
Fund Complex
Overseen by
Trustee | Other Directorships
Held by Trustee |
| | | | | | |
| | Karen Hammond
1956 | MainStay Funds: Trustee since December 2021, Advisory Board Member (June 2021 to December 2021);MainStay Funds Trust:
Trustee since December 2021, Advisory Board Member (June 2021 to December 2021)
| Retired, Managing Director, Devonshire Investors (2007 to 2013); Senior Vice President, Fidelity Management & Research Co. (2005 to 2007); Senior Vice President and Corporate Treasurer, FMR Corp. (2003 to 2005); Chief Operating Officer, Fidelity Investments Japan (2001 to 2003) | 78 | MainStay VP Funds Trust: Trustee since December 2021, Advisory Board Member (June 2021 to December 2021) (31 Portfolios);
MainStay MacKay DefinedTerm Municipal Opportunities Fund: Trustee since December 2021, Advisory Board Member (June 2021 to December 2021);
MainStay CBRE Global Infrastructure Megatrends Fund: Trustee since December 2021, Advisory Board Member (June 2021 to December 2021);
Two Harbors Investment Corp.: Director since 2018;
Rhode Island State Investment Commission: Member since 2017; and
Blue Cross Blue Shield of Rhode Island: Director since 2019 |
| | Jacques P. Perold
1958 | MainStay Funds: Trustee since 2016, Advisory Board Member (June 2015 toDecember 2015);MainStay Funds Trust:
Trustee since January 2016, Advisory Board Member (June 2015 to December 2015) | Founder and Chief Executive Officer, CapShift Advisors LLC (since 2018); President, Fidelity Management & Research Company (2009 to 2014); President and Chief Investment Officer, Geode Capital Management, LLC (2001 to 2009) | 78 | MainStay VP Funds Trust: Trustee since January 2016, Advisory Board Member (June 2015 to December 2015) (31 portfolios);
MainStay MacKay DefinedTerm Municipal Opportunities Fund: Trustee since January 2016, Advisory Board Member (June 2015 to December 2015);
MainStay CBRE Global Infrastructure Megatrends Fund: Trustee since June 2021; Partners in Health: Trustee since 2019; Allstate Corporation: Director since 2015; and MSCI Inc.: Director since 2017 |
| | Richard S. Trutanic
1952 | MainStay Funds: Trustee since 1994;MainStay Funds Trust:
Trustee since 2007*** | Chairman and Chief Executive Officer, Somerset & Company (financial advisory firm) since 2004; Managing Director, The Carlyle Group (private investment firm) (2002 to 2004); Senior Managing Director, Partner and Board Member, Groupe Arnault S.A. (private investment firm) (1999 to 2002) | 78 | MainStay VP Funds Trust: Trustee since 2007 (31 portfolios)**;
MainStay MacKay DefinedTerm Municipal Opportunities Fund: Trustee since 2011; and MainStay CBRE Global Infrastructure Megatrends Fund: Trustee since June 2021 |
| ** | Includes prior service as a Director of MainStay VP Series Fund, Inc., the predecessor to MainStay VP Funds Trust. |
| *** | Includes prior service as a Director/Trustee of certain predecessor entities to MainStay Funds Trust. |
Board of Trustees and Officers (Unaudited) (continued)
| | Name and
Year of Birth | Position(s) Held and
Length of Service | Principal Occupation(s)
During Past Five Years | |
| | | | | |
| | Kirk C. Lehneis
1974 | President, MainStay Funds, MainStay Funds Trust since 2017 | Chief Operating Officer and Senior Managing Director (since 2016), New York Life Investment Management LLC and New York Life Investment Management Holdings LLC; Member of the Board of Managers (since 2017) and Senior Managing Director (since 2018), NYLIFE Distributors LLC; Chairman of the Board and Senior Managing Director, NYLIM Service Company LLC (since 2017); Trustee, President and Principal Executive Officer of IndexIQ Trust, IndexIQ ETF Trust and IndexIQ Active ETF Trust (since January 2018); President, MainStay CBRE Global Infrastructure Megatrends Fund (since 2021), MainStay MacKay DefinedTerm Municipal Opportunities Fund and MainStay VP Funds Trust (since 2017); Senior Managing Director, Global Product Development (From 2015-2016); Managing Director, Product Development (2010 to 2015), New York Life Investment Management LLC | |
| | Jack R. Benintende
1964 | Treasurer and Principal Financial and Accounting Officer, MainStay Funds (since 2007), MainStay Funds Trust (since 2009) | Managing Director, New York Life Investment Management LLC (since 2007); Treasurer and Principal Financial and Accounting Officer, MainStay CBRE Global Infrastructure Megatrends Fund (since 2021), MainStay MacKay DefinedTerm Municipal Opportunities Fund (since 2011) and MainStay VP Funds Trust (since 2007)** and Assistant Treasurer, New York Life Investment Management Holdings LLC (2008 to 2012) | |
| | J. Kevin Gao
1967 | Secretary and Chief Legal Officer, MainStay Funds and MainStay Funds Trust (since 2010) | Managing Director and Associate General Counsel, New York Life Investment Management LLC (since 2010); Secretary and Chief Legal Officer and MainStay CBRE Global Infrastructure Megatrends Fund (since 2021), MainStay MacKay DefinedTerm Municipal Opportunities Fund (since 2011) and MainStay VP Funds Trust (since 2010)** | |
| | Scott T. Harrington
1959 | Vice President— Administration, MainStay Funds (since 2009), MainStay Funds Trust (since 2009) | Managing Director, New York Life Investment Management LLC (including predecessor advisory organizations) (since 2000); Member of the Board of Directors, New York Life Trust Company (since 2009); Vice President—Administration, MainStay CBRE Global Infrastructure Megatrends Fund (since 2021), MainStay MacKay DefinedTerm Municipal Opportunities Fund (since 2011) and MainStay VP Funds Trust (since 2005)** | |
| | Kevin M. Gleason
1967 | Vice President and Chief Compliance Officer, MainStay Funds and MainStay Funds Trust (since June 2022) | Vice President and Chief Compliance Officer, IndexIQ, IndexIQ ETF Trust and Index IQ Active ETF Trust (since June 2022); Vice President and Chief Compliance Officer, MainStay CBRE Global Infrastructure Megatrends Fund, MainStay VP Funds Trust and MainStay MacKay DefinedTerm Municipal Opportunities Fund (since June 2022); Senior Vice President, Voya Investment Management and Chief Compliance Officer, Voya Family of Funds (2012-2022) | |
| * | The officers listed above are considered to be “interested persons” of the MainStay Group of Funds, MainStay VP Funds Trust, MainStay CBRE Global Infrastructure Megatrends Fund and MainStay MacKay DefinedTerm Municipal Opportunities Fund within the meaning of the 1940 Act because of their affiliation with the MainStay Group of Funds, New York Life Insurance Company and/or its affiliates, including New York Life Investment Management LLC, NYLIM Service Company LLC, NYLIFE Securities LLC and/or NYLIFE Distributors LLC, as described in detail in the column captioned “Principal Occupation(s) During Past Five Years.” Officers are elected annually by the Board. |
| ** | Includes prior service as an Officer of MainStay VP Series Fund, Inc., the predecessor to MainStay VP Funds Trust. |
Officers of the Trust (Who are not Trustees)*
| 34 | MainStay Epoch Capital Growth Fund |
Equity
U.S. Equity
MainStay Epoch U.S. Equity Yield Fund
MainStay S&P 500 Index Fund1
MainStay Winslow Large Cap Growth Fund
MainStay WMC Enduring Capital Fund
MainStay WMC Growth Fund
MainStay WMC Small Companies Fund
MainStay WMC Value Fund
International Equity
MainStay Epoch International Choice Fund
MainStay MacKay International Equity Fund
MainStay WMC International Research Equity Fund
Emerging Markets Equity
MainStay Candriam Emerging Markets Equity Fund
Global Equity
MainStay Epoch Capital Growth Fund
MainStay Epoch Global Equity Yield Fund
Fixed Income
Taxable Income
MainStay Candriam Emerging Markets Debt Fund
MainStay Floating Rate Fund
MainStay MacKay High Yield Corporate Bond Fund
MainStay MacKay Short Duration High Yield Fund
MainStay MacKay Strategic Bond Fund
MainStay MacKay Total Return Bond Fund
MainStay MacKay U.S. Infrastructure Bond Fund
MainStay Short Term Bond Fund
Tax-Exempt Income
MainStay MacKay California Tax Free Opportunities Fund2
MainStay MacKay High Yield Municipal Bond Fund
MainStay MacKay New York Tax Free Opportunities Fund3
MainStay MacKay Short Term Municipal Fund
MainStay MacKay Strategic Municipal Allocation Fund
MainStay MacKay Tax Free Bond Fund
Money Market
MainStay Money Market Fund
Mixed Asset
MainStay Balanced Fund
MainStay Income Builder Fund
MainStay MacKay Convertible Fund
Speciality
MainStay CBRE Global Infrastructure Fund
MainStay CBRE Real Estate Fund
MainStay Cushing MLP Premier Fund
Asset Allocation
MainStay Conservative Allocation Fund
MainStay Conservative ETF Allocation Fund
MainStay Defensive ETF Allocation Fund
MainStay Equity Allocation Fund
MainStay Equity ETF Allocation Fund
MainStay ESG Multi-Asset Allocation Fund
MainStay Growth Allocation Fund
MainStay Growth ETF Allocation Fund
MainStay Moderate Allocation Fund
MainStay Moderate ETF Allocation Fund
Manager
New York Life Investment Management LLC
New York, New York
Subadvisors
Candriam4
Strassen, Luxembourg
CBRE Investment Management Listed Real Assets LLC
Radnor, Pennsylvania
Cushing Asset Management, LP
Dallas, Texas
Epoch Investment Partners, Inc.
New York, New York
MacKay Shields LLC4
New York, New York
NYL Investors LLC4
New York, New York
Wellington Management Company LLP
Boston, Massachusetts
Winslow Capital Management, LLC
Minneapolis, Minnesota
Legal Counsel
Dechert LLP
Washington, District of Columbia
Independent Registered Public Accounting Firm
KPMG LLP
Philadelphia, Pennsylvania
Distributor
NYLIFE Distributors LLC4
Jersey City, New Jersey
Custodian
JPMorgan Chase Bank, N.A.
New York, New York
1.
Prior to February 28, 2022, the Fund's name was MainStay MacKay S&P 500 Index Fund.
| 2. | This Fund is registered for sale in AZ, CA, NV, OR, TX, UT, WA and MI (Class A and Class I shares only), and CO, FL, GA, HI, ID, MA, MD, NH, NJ and NY (Class I shares only). |
| 3. | This Fund is registered for sale in CA, CT, DE, FL, MA, NJ, NY and VT. |
| 4. | An affiliate of New York Life Investment Management LLC. |
Not part of the Annual Report
For more information
800-624-6782
newyorklifeinvestments.com
“New York Life Investments” is both a service mark, and the common trade name, of certain investment advisors affiliated with New York Life Insurance Company. The MainStay Funds® are managed by New York Life Investment Management LLC and distributed by NYLIFE Distributors LLC, 30 Hudson Street, Jersey City, NJ 07302, a wholly owned subsidiary of New York Life Insurance Company. NYLIFE Distributors LLC is a Member FINRA/SIPC.
©2022 NYLIFE Distributors LLC. All rights reserved.
| 5013738.2MS229-22 | MSECG11-12/22 |
(NYLIM) NL284
MainStay Epoch Global Equity Yield Fund
Message from the President and Annual Report
October 31, 2022
Sign up for e-delivery of your shareholder reports. For full details on e-delivery, including who can participate and what you can receive via e-delivery,
please log in to newyorklifeinvestments.com/accounts.
| Not FDIC/NCUA Insured | Not a Deposit | May Lose Value | No Bank Guarantee | Not Insured by Any Government Agency |
This page intentionally left blank
Message from the President
A series of economic and geopolitical challenges undermined equity and fixed-income markets during the 12-month reporting period ended October 31, 2022. Stocks and bonds alike trended lower in the face of sharply rising interest rates, increasing inflationary pressures, slowing economic growth and Russia’s invasion of Ukraine.
The reporting period began on a mixed note, with concerns about the spreading Omicron variant of the COVID-19 virus and increasingly hawkish statements from the U.S. Federal Reserve (the “Fed”) regarding mounting inflation, countered by bullish sentiment stemming from U.S. economic growth and strong corporate earnings. In January 2022, markets turned decisively negative as comments from the Fed raised the likelihood of rate hikes as early as March, and Russia issued increasingly aggressive threats toward Ukraine. The onset of Russia’s invasion in February exacerbated global inflationary pressures while increasing investor uncertainty. Domestic supply shortages, international trade imbalances and rising inflation caused GDP (gross domestic product) to contract in the first and second quarters of the year, although employment and consumer spending proved resilient. Prices for petroleum surged to multi-year highs, while many key agricultural chemicals and industrial metals climbed as well. Accelerating inflationary forces prompted the Fed to implement its most aggressive interest rate increases since the 1980s with a series of five sharp rate hikes, raising the federal funds rate from a range of 0.00% to 0.25% in March to 3.00% to 3.25% in September, with additional rate hikes expected before the end of the year. International central banks generally followed suit, raising rates by varying degrees in efforts to curb local inflation, although most increases remained significantly more modest than those in the United States. Relatively high U.S. interest rates and risk-averse international sentiment pushed U.S. dollar values higher compared to most other currencies, with the ensuing negative impact on global prices for food, fuel and other key, U.S.-dollar-denominated products.
The effects of these interrelated challenges were felt throughout U.S. and international financial markets. The S&P 500® Index, a widely regarded benchmark of U.S. market performance, declined by more than 14% during the reporting period. Although the energy sector generated strong gains, bolstered by elevated oil and gas prices, most other industry areas recorded losses. The more cyclical and growth-oriented sectors of consumer discretionary, real estate and information technology delivered the
weakest returns, while the traditionally defensive and value-oriented consumer staples, utilities and health care sectors outperformed. International stocks lagged compared to their U.S. counterparts, with some emerging markets, such as China, suffering particularly steep losses. A few markets, however, including Brazil, Mexico and the United Arab Emirates, ended the reporting period with little change. Fixed-income markets saw bond prices broadly decline as yields rose along with interest rates. Short-term yields rose faster than long-term yields, producing a yield curve inversion from July through the end of the reporting period, with long-term rates remaining below short-term rates. While floating-rate instruments, which feature variable interest rates that allow investors to benefit from a rising rate environment, provided a degree of insulation from inflation-driven trends, they were not immune to the market’s widespread declines.
While the Fed acknowledges the costs of rising rates in terms of weaker GDP growth and unsettled financial markets over the short term, its primary focus continues to be the longer-term economic impact of inflation. With the latest figures as of the date of this report showing that inflation remains above 8%, versus a target rate of just 2%, the Fed clearly has a distance yet to go, making further rate increases and market volatility more likely in the coming months. The question remains as to whether the Fed and other central banks will manage a so-called “soft landing,” curbing inflation while avoiding a persistent economic slowdown. If they prove successful, we expect that favorable inflation trends and increasingly attractive valuations in both equity and bond markets should eventually translate into sustainable improvements in the investment environment.
Whatever actions the Fed takes and however financial markets react, as a MainStay investor, you can depend on us to continue providing the insight, expertise and service that have long defined New York Life Investments. Thank you for trusting us to help you meet your investment needs.
Sincerely,
Kirk C. Lehneis
President
The opinions expressed are as of the date of this report and are subject to change. There is no guarantee that any forecast made will come to pass. This material does not constitute investment advice and is not intended as an endorsement of any specific investment. Past performance is no guarantee of future results.
Not part of the Annual Report
Investors should refer to the Fund’s Summary Prospectus and/or Prospectus and consider the Fund’s investment objectives, strategies, risks, charges and expenses carefully before investing. The Summary Prospectus and/or Prospectus contain this and other information about the Fund. You may obtain copies of the Fund’s Summary Prospectus, Prospectus and Statement of Additional Information, which includes information about the MainStay Funds Trust's Trustees, free of charge, upon request, by calling toll-free 800-624-6782, by writing to NYLIFE Distributors LLC, Attn: MainStay Marketing Department, 30 Hudson Street, Jersey City, NJ 07302 or by sending an e-mail to MainStayShareholderServices@nylim.com. These documents are also available via the MainStay Funds’ website at newyorklifeinvestments.com. Please read the Fund’s Summary Prospectus and/or Prospectus carefully before investing.
Investment and Performance Comparison (Unaudited)
Performance data quoted represents past performance. Past performance is no guarantee of future results. Because of market volatility and other factors, current performance may be lower or higher than the figures shown. Investment return and principal value will fluctuate, and as a result, when shares are redeemed, they may be worth more or less than their original cost. The graph below depicts the historical performance of Class I shares of the Fund. Performance will vary from class to class based on differences in class-specific expenses and sales charges. For performance information current to the most recent month-end, please call 800-624-6782 or visit newyorklifeinvestments.com.
The performance table and graph do not reflect the deduction of taxes that a shareholder would pay on distributions or Fund share redemptions. Total returns reflect maximum applicable sales charges as indicated in the table below, if any, changes in share price, and reinvestment of dividend and capital gain distributions. The graph assumes the initial investment amount shown below and reflects the deduction of all sales charges that would have applied for the period of investment. Performance figures may reflect certain fee waivers and/or expense limitations, without which total returns may have been lower. For more information on share classes and current fee waivers and/or expense limitations (if any), please refer to the Notes to Financial Statements.
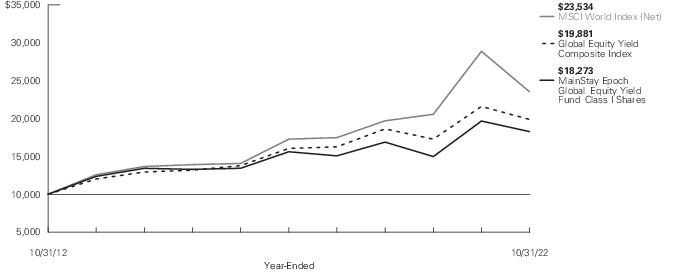
| Average Annual Total Returns for the Year-Ended October 31, 2022 |
| Class | Sales Charge | | Inception
Date | One
Year | Five
Years | Ten Years
or Since
Inception | Gross
Expense
Ratio1 |
| Class A Shares | Maximum 5.5% Initial Sales Charge | With sales charges | 8/2/2006 | -12.45% | 1.78% | 5.35% | 1.16% |
| | | Excluding sales charges | | -7.36 | 2.94 | 5.95 | 1.16 |
| Investor Class Shares2 | Maximum 5% Initial Sales Charge | With sales charges | 11/16/2009 | -12.05 | 1.74 | 5.33 | 1.16 |
| | | Excluding sales charges | | -7.42 | 2.90 | 5.93 | 1.16 |
| Class C Shares | Maximum 1% CDSC | With sales charges | 11/16/2009 | -8.97 | 2.16 | 5.15 | 1.91 |
| | if Redeemed Within One Year of Purchase | Excluding sales charges | | -8.07 | 2.16 | 5.15 | 1.91 |
| Class I Shares | No Sales Charge | | 12/27/2005 | -7.08 | 3.20 | 6.21 | 0.91 |
| Class R2 Shares | No Sales Charge | | 2/28/2014 | -7.49 | 2.78 | 3.80 | 1.26 |
| Class R3 Shares | No Sales Charge | | 2/29/2016 | -7.70 | 2.51 | 4.99 | 1.51 |
| Class R6 Shares | No Sales Charge | | 6/17/2013 | -7.02 | 3.04 | 5.15 | 0.75 |
| 1. | The gross expense ratios presented reflect the Fund’s “Total Annual Fund Operating Expenses” from the most recent Prospectus, as supplemented, and may differ from other expense ratios disclosed in this report. |
| 2. | Prior to June 30, 2020, the maximum initial sales charge was 5.5%, which is reflected in the applicable average annual total return figures shown. |
The footnotes on the next page are an integral part of the table and graph and should be carefully read in conjunction with them.
| Benchmark Performance* | One
Year | Five
Years | Ten
Years |
| MSCI World Index (Net)1 | -18.48% | 6.37% | 8.94% |
| Global Equity Yield Composite Index2 | -7.94 | 4.37 | 7.11 |
| Morningstar Global Large Stock Value Category Average3 | -12.38 | 2.92 | 6.54 |
| * | Returns for indices reflect no deductions for fees, expenses or taxes, except for foreign withholding taxes where applicable. Results assume reinvestment of all dividends and capital gains. An investment cannot be made directly in an index. |
| 1. | The MSCI World Index (Net) is the Fund's primary broad-based securities market index for comparison purposes. The MSCI World Index (Net) is a free float-adjusted market capitalization weighted index that is designed to measure the equity market performance of developed markets. |
| 2. | The Fund has selected the Global Equity Yield Composite Index as its secondary benchmark. The Global Equity Yield Composite Index consists of the MSCI World High Dividend Yield Index and the MSCI World Minimum Volatility (USD) Index weighted at 60% and 40%, respectively. The MSCI World High Dividend Yield Index is based on the MSCI World Index and is designed to reflect the performance of equities in the MSCI World Index (excluding real estate investment trusts) with higher dividend income and quality characteristics than average dividend yields that are both sustainable and persistent. The MSCI World Minimum Volatility (USD) Index aims to reflect the performance characteristics of a minimum variance strategy applied to the MSCI large and mid-cap equity universe across 23 developed markets countries. The MSCI World Minimum Volatility (USD) Index is calculated by optimizing the MSCI World Index for the lowest absolute risk (within a given set of constraints). |
| 3. | Morningstar Global Large Stock Value portfolios invest in a variety of international stocks and typically skew towards large caps that are less expensive or growing more slowly than other global large-cap stocks. Global large stock value portfolios have few geographical limitations. It is common for these portfolios to invest the majority of their assets in developed markets, with the remainder divided among the globe’s emerging markets. These portfolios are not significantly overweight U.S. equity exposure relative to the Morningstar Global Market Index and maintain at least a 20% absolute U.S. exposure. |
The footnotes on the preceding page are an integral part of the table and graph and should be carefully read in conjunction with them.
| 6 | MainStay Epoch Global Equity Yield Fund |
Cost in Dollars of a $1,000 Investment in MainStay Epoch Global Equity Yield Fund (Unaudited)
The example below is intended to describe the fees and expenses borne by shareholders during the six-month period from May 1, 2022 to October 31, 2022, and the impact of those costs on your investment.
Example
As a shareholder of the Fund you incur two types of costs: (1) transaction costs, including exchange fees and sales charges (loads) on purchases (as applicable), and (2) ongoing costs, including management fees, distribution and/or service (12b-1) fees and other Fund expenses (as applicable). This example is intended to help you understand your ongoing costs (in dollars) of investing in the Fund and to compare these costs with the ongoing costs of investing in other mutual funds. The example is based on an investment of $1,000 made at the beginning of the six-month period and held for the entire period from May 1, 2022 to October 31, 2022.
This example illustrates your Fund’s ongoing costs in two ways:
Actual Expenses
The second and third data columns in the table below provide information about actual account values and actual expenses. You may use the information in these columns, together with the amount you invested, to estimate the expenses that you paid during the six months ended October 31, 2022. Simply divide your account value by $1,000 (for example, an
$8,600 account value divided by $1,000 = 8.6), then multiply the result by the number under the heading entitled “Expenses Paid During Period” to estimate the expenses you paid on your account during this period.
Hypothetical Example for Comparison Purposes
The fourth and fifth data columns in the table below provide information about hypothetical account values and hypothetical expenses based on the Fund’s actual expense ratio and an assumed rate of return of 5% per year before expenses, which is not the Fund’s actual return. The hypothetical account values and expenses may not be used to estimate the actual ending account balances or expenses you paid for the six-month period shown. You may use this information to compare the ongoing costs of investing in the Fund with the ongoing costs of investing in other mutual funds. To do so, compare this 5% hypothetical example with the 5% hypothetical examples that appear in the shareholder reports of the other mutual funds.
Please note that the expenses shown in the table are meant to highlight your ongoing costs only and do not reflect any transactional costs, such as exchange fees or sales charges (loads). Therefore, the fourth and fifth data columns of the table are useful in comparing ongoing costs only and will not help you determine the relative total costs of owning different funds. In addition, if these transactional costs were included, your costs would have been higher.
| Share Class | Beginning
Account
Value
5/1/22 | Ending Account
Value (Based
on Actual
Returns and
Expenses)
10/31/22 | Expenses
Paid
During
Period1 | Ending Account
Value (Based
on Hypothetical
5% Annualized
Return and
Actual Expenses)
10/31/22 | Expenses
Paid
During
Period1 | Net Expense
Ratio
During
Period2 |
| Class A Shares | $1,000.00 | $942.50 | $5.34 | $1,019.71 | $5.55 | 1.09% |
| Investor Class Shares | $1,000.00 | $942.00 | $5.68 | $1,019.36 | $5.90 | 1.16% |
| Class C Shares | $1,000.00 | $939.00 | $8.99 | $1,015.93 | $9.35 | 1.84% |
| Class I Shares | $1,000.00 | $944.20 | $4.12 | $1,020.97 | $4.28 | 0.84% |
| Class R2 Shares | $1,000.00 | $941.70 | $6.17 | $1,018.85 | $6.41 | 1.26% |
| Class R3 Shares | $1,000.00 | $940.90 | $7.39 | $1,017.59 | $7.68 | 1.51% |
| Class R6 Shares | $1,000.00 | $944.50 | $3.63 | $1,021.47 | $3.77 | 0.74% |
| 1. | Expenses are equal to the Fund’s annualized expense ratio of each class multiplied by the average account value over the period, divided by 365 and multiplied by 184 (to reflect the six-month period). The table above represents the actual expenses incurred during the six-month period. In addition to the fees and expenses which the Fund bears directly, it also indirectly bears a pro rata share of the fees and expenses of the underlying funds in which it invests. Such indirect expenses are not included in the above-reported expense figures. |
| 2. | Expenses are equal to the Fund's annualized expense ratio to reflect the six-month period. |
Country Composition as of October 31, 2022 (Unaudited)
| United States | 67.3% |
| United Kingdom | 7.8 |
| Canada | 5.8 |
| Germany | 5.4 |
| France | 5.3 |
| Switzerland | 2.2 |
| Japan | 1.7 |
| Republic of Korea | 1.1 |
| Taiwan | 0.8 |
| Denmark | 0.5% |
| Norway | 0.5 |
| Italy | 0.4 |
| China | 0.4 |
| Austria | 0.4 |
| Other Assets, Less Liabilities | 0.4 |
| | 100.0% |
See Portfolio of Investments beginning on page 12 for specific holdings within these categories. The Fund's holdings are subject to change.
Top Ten Holdings and/or Issuers Held as of October 31, 2022 (excluding short-term investments) (Unaudited)
| 1. | Apple, Inc. |
| 2. | International Business Machines Corp. |
| 3. | Broadcom, Inc. |
| 4. | Microsoft Corp. |
| 5. | Analog Devices, Inc. |
| 6. | Cisco Systems, Inc. |
| 7. | UnitedHealth Group, Inc. |
| 8. | Restaurant Brands International, Inc. |
| 9. | AstraZeneca plc, Sponsored ADR |
| 10. | Walmart, Inc. |
| 8 | MainStay Epoch Global Equity Yield Fund |
Portfolio Management Discussion and Analysis (Unaudited)
Questions answered by portfolio managers Michael A. Welhoelter, CFA, William W. Priest, CFA, Kera Van Valen, CFA, and John Tobin, PhD, CFA, of Epoch Investment Partners, Inc., the Fund’s Subadvisor.
How did MainStay Epoch Global Equity Yield Fund perform relative to its benchmarks and peer group during the 12 months ended October 31, 2022?
For the 12 months ended October 31, 2022, Class I shares of MainStay Epoch Global Equity Yield Fund returned −7.08%, outperforming the −18.48% return of the Fund’s primary benchmark, the MSCI World Index (Net). Over the same period, Class I shares also outperformed the −7.94% return of the Global Equity Yield Composite Index, which is the Fund’s secondary benchmark, and the −12.38% return of the Morningstar Global Large Stock Value Category Average.1
What factors affected the Fund’s relative performance during the reporting period?
The reporting period was characterized by heightened volatility and deteriorating macroeconomic conditions, with the implementation of increasingly restrictive monetary policy to fight inflation, putting heavy pressure on equity price multiples. The eruption of war in Ukraine struck another blow to market sentiment, fueling geopolitical tensions and straining supply chains still recovering from the pandemic. Global economies remained challenged by rising prices while central bank officials signaled their commitment to curbing inflation, despite growing concerns of a recession on the horizon.
In this challenging environment, the strategy outperformed the benchmark by a wide margin, providing significant downside protection. Low exposure to volatility, market sensitivity, and growth were tailwinds to relative returns. Most sectors made positive contributions, with the largest coming from communication services and information technology. (Contributions take weightings and total returns into account.) Stock selection drove nearly all outperformance in communication services, owing largely to the Fund’s lack of exposure to two major components of the MSCI World Index (Net) that experienced extreme drops in share price. Stock selection also drove strong relative returns in information technology, mainly due to a lack of exposure to some of the worst-performing technology services stocks.
During the reporting period, which sectors and/or countries were the strongest positive contributors to the Fund’s relative performance and which sectors and/or countries were particularly weak?
During the reporting period, an underweight exposure in communication services contributed to the Fund’s performance relative to the MSCI World Index (Net), with stock selection further enhancing returns. Similarly, in information technology, underweight exposure and good stock selection bolstered relative returns. Stock selection in the industrials sector also added to
relative performance. By country, holdings in the United States and Canada were leading contributors. Conversely, energy was the biggest drag on relative returns, largely due to a lack of exposure to several strong-performing oil, gas & consumable fuel stocks. By country, China and Taiwan were the most significant detractors.
During the reporting period, which individual stocks made the strongest positive contributions to the Fund’s absolute performance and which stocks detracted the most?
Top contributors to the Fund’s absolute performance during the reporting period included pharmaceutical maker AbbVie and integrated energy company Chevron.
AbbVie develops and markets drugs in specialty therapeutic areas, including immunology, oncology and virology, among others. Shares generally traded higher in response to favorable quarterly earnings reports, in addition to constructive news flow regarding clinical successes and approvals for key drugs. While the market remained concerned about the revenue impact from the impending entry of biosimilar competitors for the blockbuster immunology drug Humira, AbbVie continued to advance key drugs in multiple therapeutic areas, such as Skyrizi and Rinvoq in immunology, Venclexta in oncology, and Vraylar in neuroscience. Additionally, in aesthetics, Botox and Juvederm continued to sell well.
Chevron is a global integrated energy company that explores, produces and markets crude oil and natural gas. The company also owns and operates downstream assets that include chemicals, lubricants & additives, and fuel retail & marketing. Chevron shares outperformed as the prolonged war in Ukraine held oil and gas prices at elevated levels. Although oil prices declined late in the reporting period, Chevron shares gained after the OPEC+ oil supplying countries decided to cut production to reduce supply in early October 2022. Strong refining margins further supported the company’s shares. Chevron’s integrated business model, geographic and product diversification, strong balance sheet and continued efforts to manage costs and improve capital efficiencies allows the company to generate sustainable cash flow through commodity price cycles, while returning cash to shareholders through an attractive and growing dividend and share buybacks, using excess free cash flow.
The most significant detractors from the Fund’s absolute performance during the same period were financial services provider software company Microsoft and medical device maker Medtronic.
Microsoft is a global software company for enterprises. The company’s shares have come under pressure from persistent
| 1. | See page 5 for other share class returns, which may be higher or lower than Class I share returns. See page 6 for more information on benchmark and peer group returns. |
concerns that its end markets may be slowing. Although the personal computer market has declined, we believe Microsoft’s shift toward a software subscription model rather than relying on perpetual licenses, along with the continued growth of the company’s Azure cloud business, are likely to support earnings and revenues better than in previous economic downturns, even if the world slips into a recession. We believe that management remains dedicated to shareholder returns through continued improvements to its dividend and share repurchase plans.
Medtronic’s devices treat a variety of conditions, including cardiac rhythm diseases, vascular and heart disease, spinal conditions and diabetes. Additionally, the company has developed a line of advanced surgical devices and systems. Medtronic's business faced challenges during the reporting period due to the COVID-19 pandemic, which depressed surgical procedure volumes and created supply-chain issues that led to product availability issues. While revenues, earnings and cash flows have recovered from the lows reached during the peak of the pandemic, certain procedure volumes have not fully recovered, and supply-chain shortages continue to plague some products. We view these challenges as temporary macro headwinds and expect financial performance to continue to improve going forward. We also note that cash flow generation remains comfortably able to cover the company’s dividend – which was increased by 8% in May 2022 – as well as share repurchases. Medtronic has established a track record of innovation and a promising development pipeline, and returns capital to owners through a consistently growing dividend and regular share repurchases, with a minimum combined payout of 50% of free cash flow.
What were some of the Fund’s largest purchases and sales during the reporting period?
New positions initiated during the reporting period included biopharmaceutical company Eli Lilly and Company and financial services firm Bank of America.
Eli Lilly discovers, develops and commercializes medicines in large, growing and defensive therapeutic areas with high unmet needs—including endocrinology, oncology, immunology and neurology—and has also created a particularly strong diabetes franchise. We appreciate the company’s favorable growth outlook, with several promising drugs recently launched or awaiting approval, along with a broad pipeline of drugs in various stages of clinical development. Eli Lilly returns cash to owners through a growing dividend and regular share repurchases. The dividend is targeted to grow in line with earnings and is well covered by free cash flow.
Bank of America operates a diversified business model with four main business segments, including consumer banking, global wealth & investment management, global banking and global markets. The company has over $3 trillion in assets, a well-capitalized balance sheet and a core deposit franchise that
supports improving profitability in a rising interest rate environment. Bank of America returns excess capital to shareholders through an attractive, growing dividend, and regular share repurchases.
The Fund’s most significant sales during the same period included closing its entire positions in telecommunications operator Telenor and insurer Tokio Marine.
Telenor operates the best – or second-best – network in the markets it serves, which include the Nordics and Asia. The company’s network superiority gives it competitive pricing power in developed markets. However, the slower than expected return of travel and the company’s reliance on migrant workers in its Asian subsidiaries has put pressure on cash generation. Mergers and acquisitions in the region are expected to improve operations, although extended regulatory approval has prolonged completion of the deals. Given the increased uncertainty and an uncovered dividend through 2025, we chose to sell the Fund’s position in favor of higher conviction names.
In addition to enjoying the position as Japan’s largest insurer, Tokio Marine maintains strong market share outside Japan in several markets with dynamic growth prospects. While the company pays an attractive dividend, Tokio Marine's investment concentration in domestic equities exposes its capital base to a correction in Japanese equity prices. Moreover, the company's own strong share price performance has limited its prospective shareholder yield. Accordingly, we exited the Fund’s position in favor of other opportunities.
How did the Fund’s sector and country weightings change during the reporting period?
During the reporting period, the Fund’s most significant sector allocation changes included decreases in exposure to utilities and communication services, and increases in health care and industrials. The Fund's most significant country allocation changes during the reporting period were increases in the United States, and reductions in Canada and Germany. The Fund’s sector and country allocations are a result of our bottom-up, fundamental investment process and reflect the companies and securities that we confidently believe can collect and distribute sustainable and growing shareholder yield.
How was the Fund positioned at the end of the reporting period?
As of October 31, 2022, the Fund’s largest sector positions on an absolute basis included information technology and health care, while the smallest sector positions were to real estate, materials and energy. Compared to the MSCI World Index (Net), the Fund’s most overweight sector allocation was to utilities, a defensive sector that is typically well-represented in the Fund. The Fund’s
| 10 | MainStay Epoch Global Equity Yield Fund |
most significantly underweight allocations were to the information technology and consumer discretionary sectors.
The opinions expressed are those of the portfolio managers as of the date of this report and are subject to change. There is no guarantee that any forecasts will come to pass. This material does not constitute investment advice and is not intended as an endorsement of any specific investment.
Portfolio of Investments October 31, 2022†
| | Shares | Value |
| Common Stocks 97.9% |
| Austria 0.4% |
| BAWAG Group AG (Banks) (a)(b) | 80,535 | $ 3,893,480 |
| Canada 5.8% |
| Enbridge, Inc. (Oil, Gas & Consumable Fuels) | 150,010 | 5,844,703 |
| Fortis, Inc. (Electric Utilities) | 127,505 | 4,974,412 |
| Manulife Financial Corp. (Insurance) | 619,159 | 10,262,128 |
| Nutrien Ltd. (Chemicals) | 134,356 | 11,353,082 |
| Restaurant Brands International, Inc. (Hotels, Restaurants & Leisure) | 299,578 | 17,788,942 |
| Royal Bank of Canada (Banks) | 58,777 | 5,438,280 |
| TELUS Corp. (Diversified Telecommunication Services) | 267,349 | 5,583,058 |
| | | 61,244,605 |
| China 0.4% |
| China Resources Gas Group Ltd. (Gas Utilities) | 1,630,000 | 4,173,817 |
| Denmark 0.5% |
| Novo Nordisk A/S, Class B (Pharmaceuticals) | 55,204 | 6,001,566 |
| France 5.3% |
| AXA SA (Insurance) | 333,020 | 8,227,675 |
| Cie Generale des Etablissements Michelin SCA (Auto Components) | 185,659 | 4,735,555 |
| Danone SA (Food Products) | 102,859 | 5,117,082 |
| Orange SA (Diversified Telecommunication Services) | 528,987 | 5,034,811 |
| Sanofi (Pharmaceuticals) | 116,408 | 10,046,461 |
| TotalEnergies SE (Oil, Gas & Consumable Fuels) | 314,216 | 17,109,870 |
| Vinci SA (Construction & Engineering) | 65,482 | 6,029,919 |
| | | 56,301,373 |
| Germany 5.4% |
| Allianz SE (Registered) (Insurance) | 29,739 | 5,354,779 |
| BASF SE (Chemicals) | 117,445 | 5,273,414 |
| Bayer AG (Registered) (Pharmaceuticals) | 116,411 | 6,122,598 |
| Deutsche Post AG (Registered) (Air Freight & Logistics) | 294,179 | 10,439,841 |
| Deutsche Telekom AG (Registered) (Diversified Telecommunication Services) | 920,030 | 17,424,285 |
| | Shares | Value |
| |
| Germany (continued) |
| Muenchener Rueckversicherungs-Gesellschaft AG (Registered) (Insurance) | 23,750 | $ 6,276,129 |
| Siemens AG (Registered) (Industrial Conglomerates) | 58,687 | 6,416,836 |
| | | 57,307,882 |
| Italy 0.4% |
| Snam SpA (Gas Utilities) | 1,037,029 | 4,613,847 |
| Japan 1.7% |
| Bridgestone Corp. (Auto Components) | 180,000 | 6,490,871 |
| Koei Tecmo Holdings Co. Ltd. (Entertainment) | 405,400 | 6,128,916 |
| Toyota Motor Corp. (Automobiles) | 372,500 | 5,159,311 |
| | | 17,779,098 |
| Norway 0.5% |
| Orkla ASA (Food Products) | 771,960 | 5,209,689 |
| Republic of Korea 1.1% |
| Samsung Electronics Co. Ltd., GDR (Technology Hardware, Storage & Peripherals) | 7,177 | 7,417,429 |
| SK Telecom Co. Ltd. (Wireless Telecommunication Services) | 139,486 | 4,905,928 |
| | | 12,323,357 |
| Switzerland 2.2% |
| Nestle SA (Registered) (Food Products) | 65,445 | 7,126,502 |
| Novartis AG (Registered) (Pharmaceuticals) | 199,311 | 16,102,522 |
| | | 23,229,024 |
| Taiwan 0.8% |
| Taiwan Semiconductor Manufacturing Co. Ltd., Sponsored ADR (Semiconductors & Semiconductor Equipment) | 136,153 | 8,380,217 |
| United Kingdom 7.8% |
| AstraZeneca plc, Sponsored ADR (Pharmaceuticals) | 301,276 | 17,718,042 |
| BAE Systems plc (Aerospace & Defense) | 662,134 | 6,184,027 |
| British American Tobacco plc (Tobacco) | 370,707 | 14,596,728 |
| Coca-Cola Europacific Partners plc (Beverages) | 352,526 | 16,586,348 |
The notes to the financial statements are an integral part of, and should be read in conjunction with, the financial statements.
| 12 | MainStay Epoch Global Equity Yield Fund |
| | Shares | Value |
| Common Stocks (continued) |
| United Kingdom (continued) |
| Linde plc (Chemicals) | 54,721 | $ 16,271,289 |
| RELX plc (Professional Services) | 203,885 | 5,486,555 |
| Unilever plc (Personal Products) | 128,636 | 5,863,173 |
| | | 82,706,162 |
| United States 65.6% |
| AbbVie, Inc. (Biotechnology) | 82,980 | 12,148,272 |
| Air Products and Chemicals, Inc. (Chemicals) | 30,520 | 7,642,208 |
| Altria Group, Inc. (Tobacco) | 133,164 | 6,161,498 |
| Ameren Corp. (Multi-Utilities) | 67,663 | 5,515,888 |
| American Electric Power Co., Inc. (Electric Utilities) | 143,858 | 12,647,995 |
| Amgen, Inc. (Biotechnology) | 25,528 | 6,901,495 |
| Analog Devices, Inc. (Semiconductors & Semiconductor Equipment) | 141,056 | 20,117,407 |
| Apple, Inc. (Technology Hardware, Storage & Peripherals) | 143,966 | 22,075,746 |
| Arthur J. Gallagher & Co. (Insurance) | 44,196 | 8,268,188 |
| AT&T, Inc. (Diversified Telecommunication Services) | 382,642 | 6,975,564 |
| Bank of America Corp. (Banks) | 403,560 | 14,544,302 |
| Broadcom, Inc. (Semiconductors & Semiconductor Equipment) | 46,461 | 21,842,245 |
| Chevron Corp. (Oil, Gas & Consumable Fuels) | 40,644 | 7,352,500 |
| Cisco Systems, Inc. (Communications Equipment) | 412,819 | 18,754,367 |
| Coca-Cola Co. (The) (Beverages) | 154,245 | 9,231,563 |
| Columbia Banking System, Inc. (Banks) | 311,230 | 10,416,868 |
| Comcast Corp., Class A (Media) | 252,609 | 8,017,810 |
| Cummins, Inc. (Machinery) | 53,434 | 13,065,147 |
| CVS Health Corp. (Health Care Providers & Services) | 75,323 | 7,133,088 |
| Dow, Inc. (Chemicals) | 106,459 | 4,975,894 |
| Duke Energy Corp. (Electric Utilities) | 56,705 | 5,283,772 |
| Eaton Corp. plc (Electrical Equipment) | 69,090 | 10,368,336 |
| Eli Lilly and Co. (Pharmaceuticals) | 30,004 | 10,864,148 |
| Emerson Electric Co. (Electrical Equipment) | 124,981 | 10,823,355 |
| Entergy Corp. (Electric Utilities) | 55,166 | 5,910,485 |
| Enterprise Products Partners LP (Oil, Gas & Consumable Fuels) | 338,433 | 8,545,433 |
| Evergy, Inc. (Electric Utilities) | 88,064 | 5,383,352 |
| GSK plc (Pharmaceuticals) | 313,793 | 5,141,648 |
| Hasbro, Inc. (Leisure Products) | 131,694 | 8,593,034 |
| | Shares | Value |
| |
| United States (continued) |
| Home Depot, Inc. (The) (Specialty Retail) | 22,086 | $ 6,540,327 |
| Honeywell International, Inc. (Industrial Conglomerates) | 52,483 | 10,707,582 |
| Hubbell, Inc. (Electrical Equipment) | 32,059 | 7,613,371 |
| Intel Corp. (Semiconductors & Semiconductor Equipment) | 190,993 | 5,429,931 |
| International Business Machines Corp. (IT Services) | 157,991 | 21,848,575 |
| Iron Mountain, Inc. (Equity Real Estate Investment Trusts) | 135,180 | 6,768,463 |
| Johnson & Johnson (Pharmaceuticals) | 30,803 | 5,358,798 |
| JPMorgan Chase & Co. (Banks) | 114,216 | 14,377,510 |
| KeyCorp (Banks) | 756,385 | 13,516,600 |
| KLA Corp. (Semiconductors & Semiconductor Equipment) | 40,810 | 12,914,325 |
| Lazard Ltd., Class A (Capital Markets) | 163,971 | 6,183,346 |
| Leggett & Platt, Inc. (Household Durables) | 164,019 | 5,535,641 |
| Lockheed Martin Corp. (Aerospace & Defense) | 14,388 | 7,002,352 |
| LyondellBasell Industries NV, Class A (Chemicals) | 63,679 | 4,868,260 |
| Magellan Midstream Partners LP (Oil, Gas & Consumable Fuels) | 122,199 | 6,592,636 |
| McDonald's Corp. (Hotels, Restaurants & Leisure) | 29,547 | 8,056,285 |
| Medtronic plc (Health Care Equipment & Supplies) | 191,698 | 16,742,903 |
| Merck & Co., Inc. (Pharmaceuticals) | 112,799 | 11,415,259 |
| MetLife, Inc. (Insurance) | 193,131 | 14,139,121 |
| Microsoft Corp. (Software) | 90,343 | 20,971,321 |
| MPLX LP (Oil, Gas & Consumable Fuels) | 188,930 | 6,336,712 |
| MSC Industrial Direct Co., Inc., Class A (Trading Companies & Distributors) | 77,743 | 6,451,114 |
| NextEra Energy, Inc. (Electric Utilities) | 158,239 | 12,263,523 |
| NiSource, Inc. (Multi-Utilities) | 205,629 | 5,282,609 |
| Omnicom Group, Inc. (Media) | 85,799 | 6,241,877 |
| Pfizer, Inc. (Pharmaceuticals) | 110,750 | 5,155,413 |
| Philip Morris International, Inc. (Tobacco) | 79,042 | 7,260,008 |
| PNC Financial Services Group, Inc. (The) (Banks) | 41,298 | 6,683,255 |
| Procter & Gamble Co. (The) (Household Products) | 38,773 | 5,221,560 |
| Raytheon Technologies Corp. (Aerospace & Defense) | 113,569 | 10,768,613 |
The notes to the financial statements are an integral part of, and should be read in conjunction with, the financial statements.
13
Portfolio of Investments October 31, 2022† (continued)
| | Shares | Value |
| Common Stocks (continued) |
| United States (continued) |
| Realty Income Corp. (Equity Real Estate Investment Trusts) | 89,694 | $ 5,585,245 |
| Roche Holding AG (Pharmaceuticals) | 16,833 | 5,590,267 |
| Texas Instruments, Inc. (Semiconductors & Semiconductor Equipment) | 65,174 | 10,468,900 |
| Travelers Cos., Inc. (The) (Insurance) | 62,981 | 11,617,475 |
| Truist Financial Corp. (Banks) | 122,381 | 5,481,445 |
| U.S. Bancorp (Banks) | 203,947 | 8,657,550 |
| United Parcel Service, Inc., Class B (Air Freight & Logistics) | 53,230 | 8,930,397 |
| UnitedHealth Group, Inc. (Health Care Providers & Services) | 33,356 | 18,517,583 |
| Vail Resorts, Inc. (Hotels, Restaurants & Leisure) | 49,958 | 10,947,297 |
| Verizon Communications, Inc. (Diversified Telecommunication Services) | 121,584 | 4,543,594 |
| Walmart, Inc. (Food & Staples Retailing) | 122,876 | 17,488,941 |
| WEC Energy Group, Inc. (Multi-Utilities) | 62,580 | 5,715,431 |
| Welltower, Inc. (Equity Real Estate Investment Trusts) | 73,268 | 4,472,279 |
| WP Carey, Inc. (Equity Real Estate Investment Trusts) | 69,564 | 5,307,733 |
| | | 696,273,035 |
Total Common Stocks
(Cost $940,729,901) | | 1,039,437,152 |
| | Shares | | Value |
| Short-Term Investment 1.7% |
| Affiliated Investment Company 1.7% |
| United States 1.7% |
| MainStay U.S. Government Liquidity Fund, 2.905% (c) | 18,619,778 | | $ 18,619,778 |
Total Short-Term Investment
(Cost $18,619,778) | | | 18,619,778 |
Total Investments
(Cost $959,349,679) | 99.6% | | 1,058,056,930 |
| Other Assets, Less Liabilities | 0.4 | | 3,757,662 |
| Net Assets | 100.0% | | $ 1,061,814,592 |
| † | Percentages indicated are based on Fund net assets. |
| (a) | May be sold to institutional investors only under Rule 144A or securities offered pursuant to Section 4(a)(2) of the Securities Act of 1933, as amended. |
| (b) | Non-income producing security. |
| (c) | Current yield as of October 31, 2022. |
Investments in Affiliates (in 000's)
Investments in issuers considered to be affiliate(s) of the Fund during the year ended October 31, 2022 for purposes of Section 2(a)(3) of the Investment Company Act of 1940, as amended, were as follows:
| Affiliated Investment Companies | Value,
Beginning
of Year | Purchases
at Cost | Proceeds
from
Sales | Net
Realized
Gain/(Loss)
on Sales | Change in
Unrealized
Appreciation/
(Depreciation) | Value,
End of
Year | Dividend
Income | Other
Distributions | Shares
End of
Year |
| MainStay U.S. Government Liquidity Fund | $ 19,800 | $ 155,013 | $ (156,193) | $ — | $ — | $ 18,620 | $ 117 | $ — | 18,620 |
| Abbreviation(s): |
| ADR—American Depositary Receipt |
| GDR—Global Depositary Receipt |
The notes to the financial statements are an integral part of, and should be read in conjunction with, the financial statements.
| 14 | MainStay Epoch Global Equity Yield Fund |
The following is a summary of the fair valuations according to the inputs used as of October 31, 2022, for valuing the Fund’s assets:
| Description | Quoted
Prices in
Active
Markets for
Identical
Assets
(Level 1) | | Significant
Other
Observable
Inputs
(Level 2) | | Significant
Unobservable
Inputs
(Level 3) | | Total |
| Asset Valuation Inputs | | | | | | | |
| Investments in Securities (a) | | | | | | | |
| Common Stocks | $ 1,039,437,152 | | $ — | | $ — | | $ 1,039,437,152 |
| Short-Term Investment | | | | | | | |
| Affiliated Investment Company | 18,619,778 | | — | | — | | 18,619,778 |
| Total Investments in Securities | $ 1,058,056,930 | | $ — | | $ — | | $ 1,058,056,930 |
| (a) | For a complete listing of investments and their industries, see the Portfolio of Investments. |
The notes to the financial statements are an integral part of, and should be read in conjunction with, the financial statements.
15
Portfolio of Investments October 31, 2022† (continued)
The table below sets forth the diversification of the Fund’s investments by industry.
Industry Diversification
| | Value | | Percent |
| Aerospace & Defense | $ 23,954,992 | | 2.3% |
| Air Freight & Logistics | 19,370,238 | | 1.8 |
| Auto Components | 11,226,426 | | 1.0 |
| Automobiles | 5,159,311 | | 0.5 |
| Banks | 83,009,290 | | 7.8 |
| Beverages | 25,817,911 | | 2.5 |
| Biotechnology | 19,049,767 | | 1.7 |
| Capital Markets | 6,183,346 | | 0.6 |
| Chemicals | 50,384,147 | | 4.8 |
| Communications Equipment | 18,754,367 | | 1.8 |
| Construction & Engineering | 6,029,919 | | 0.6 |
| Diversified Telecommunication Services | 39,561,312 | | 3.7 |
| Electric Utilities | 46,463,539 | | 4.5 |
| Electrical Equipment | 28,805,062 | | 2.7 |
| Entertainment | 6,128,916 | | 0.6 |
| Equity Real Estate Investment Trusts | 22,133,720 | | 2.0 |
| Food & Staples Retailing | 17,488,941 | | 1.6 |
| Food Products | 17,453,273 | | 1.7 |
| Gas Utilities | 8,787,664 | | 0.8 |
| Health Care Equipment & Supplies | 16,742,903 | | 1.6 |
| Health Care Providers & Services | 25,650,671 | | 2.4 |
| Hotels, Restaurants & Leisure | 36,792,524 | | 3.5 |
| Household Durables | 5,535,641 | | 0.5 |
| Household Products | 5,221,560 | | 0.5 |
| Industrial Conglomerates | 17,124,418 | | 1.6 |
| Insurance | 64,145,495 | | 6.1 |
| IT Services | 21,848,575 | | 2.1 |
| Leisure Products | 8,593,034 | | 0.8 |
| Machinery | 13,065,147 | | 1.2 |
| Media | 14,259,687 | | 1.4 |
| Multi-Utilities | 16,513,928 | | 1.5 |
| Oil, Gas & Consumable Fuels | 51,781,854 | | 4.8 |
| Personal Products | 5,863,173 | | 0.5 |
| Pharmaceuticals | 99,516,722 | | 9.3 |
| Professional Services | 5,486,555 | | 0.5 |
| Semiconductors & Semiconductor Equipment | 79,153,025 | | 7.5 |
| Software | 20,971,321 | | 2.0 |
| Specialty Retail | 6,540,327 | | 0.6 |
| Technology Hardware, Storage & Peripherals | 29,493,175 | | 2.8 |
| Tobacco | 28,018,234 | | 2.7 |
| Trading Companies & Distributors | 6,451,114 | | 0.6 |
| Wireless Telecommunication Services | 4,905,928 | | 0.4 |
| | 1,039,437,152 | | 97.9 |
| | Value | | Percent |
| Short-Term Investment | $ 18,619,778 | | 1.7% |
| Other Assets, Less Liabilities | 3,757,662 | | 0.4 |
| Net Assets | $1,061,814,592 | | 100.0% |
| † | Percentages indicated are based on Fund net assets. |
The notes to the financial statements are an integral part of, and should be read in conjunction with, the financial statements.
| 16 | MainStay Epoch Global Equity Yield Fund |
Statement of Assets and Liabilities as of October 31, 2022
| Assets |
Investment in unaffiliated securities, at value
(identified cost $940,729,901) | $1,039,437,152 |
Investment in affiliated investment companies, at value
(identified cost $18,619,778) | 18,619,778 |
| Cash | 187,479 |
Cash denominated in foreign currencies
(identified cost $18,518) | 18,504 |
| Receivables: | |
| Dividends | 4,678,121 |
| Fund shares sold | 1,380,870 |
| Investment securities sold | 455,642 |
| Securities lending | 2,864 |
| Other assets | 64,905 |
| Total assets | 1,064,845,315 |
| Liabilities |
| Payables: | |
| Investment securities purchased | 1,159,388 |
| Fund shares redeemed | 885,917 |
| Manager (See Note 3) | 482,125 |
| Transfer agent (See Note 3) | 300,968 |
| Shareholder communication | 111,570 |
| NYLIFE Distributors (See Note 3) | 39,594 |
| Professional fees | 23,622 |
| Custodian | 11,332 |
| Trustees | 86 |
| Accrued expenses | 16,121 |
| Total liabilities | 3,030,723 |
| Net assets | $1,061,814,592 |
| Composition of Net Assets |
| Shares of beneficial interest outstanding (par value of $.001 per share) unlimited number of shares authorized | $ 58,238 |
| Additional paid-in-capital | 1,021,713,215 |
| | 1,021,771,453 |
| Total distributable earnings (loss) | 40,043,139 |
| Net assets | $1,061,814,592 |
| Class A | |
| Net assets applicable to outstanding shares | $120,648,376 |
| Shares of beneficial interest outstanding | 6,601,393 |
| Net asset value per share outstanding | $ 18.28 |
| Maximum sales charge (5.50% of offering price) | 1.06 |
| Maximum offering price per share outstanding | $ 19.34 |
| Investor Class | |
| Net assets applicable to outstanding shares | $ 7,975,661 |
| Shares of beneficial interest outstanding | 437,338 |
| Net asset value per share outstanding | $ 18.24 |
| Maximum sales charge (5.00% of offering price) | 0.96 |
| Maximum offering price per share outstanding | $ 19.20 |
| Class C | |
| Net assets applicable to outstanding shares | $ 15,800,764 |
| Shares of beneficial interest outstanding | 868,868 |
| Net asset value and offering price per share outstanding | $ 18.19 |
| Class I | |
| Net assets applicable to outstanding shares | $910,692,910 |
| Shares of beneficial interest outstanding | 49,958,745 |
| Net asset value and offering price per share outstanding | $ 18.23 |
| Class R2 | |
| Net assets applicable to outstanding shares | $ 211,275 |
| Shares of beneficial interest outstanding | 11,548 |
| Net asset value and offering price per share outstanding | $ 18.30 |
| Class R3 | |
| Net assets applicable to outstanding shares | $ 634,438 |
| Shares of beneficial interest outstanding | 34,739 |
| Net asset value and offering price per share outstanding | $ 18.26 |
| Class R6 | |
| Net assets applicable to outstanding shares | $ 5,851,168 |
| Shares of beneficial interest outstanding | 325,153 |
| Net asset value and offering price per share outstanding | $ 18.00 |
The notes to the financial statements are an integral part of, and should be read in conjunction with, the financial statements.
17
Statement of Operations for the year ended October 31, 2022
| Investment Income (Loss) |
| Income | |
| Dividends-unaffiliated (net of foreign tax withholding of $231,898) | $ 35,636,902 |
| Dividends-affiliated | 117,280 |
| Securities lending, net | 103,520 |
| Total income | 35,857,702 |
| Expenses | |
| Manager (See Note 3) | 7,914,873 |
| Transfer agent (See Note 3) | 1,824,129 |
| Distribution/Service—Class A (See Note 3) | 325,050 |
| Distribution/Service—Investor Class (See Note 3) | 21,491 |
| Distribution/Service—Class C (See Note 3) | 218,564 |
| Distribution/Service—Class R2 (See Note 3) | 558 |
| Distribution/Service—Class R3 (See Note 3) | 3,142 |
| Professional fees | 194,496 |
| Registration | 106,294 |
| Custodian | 56,810 |
| Shareholder communication | 45,385 |
| Trustees | 19,560 |
| Shareholder service (See Note 3) | 851 |
| Miscellaneous | 69,983 |
| Total expenses before waiver/reimbursement | 10,801,186 |
| Expense waiver/reimbursement from Manager (See Note 3) | (730,460) |
| Net expenses | 10,070,726 |
| Net investment income (loss) | 25,786,976 |
| Realized and Unrealized Gain (Loss) |
| Net realized gain (loss) on: | |
| Unaffiliated investment transactions | 30,450,875 |
| Foreign currency transactions | 90,678 |
| Net realized gain (loss) | 30,541,553 |
| Net change in unrealized appreciation (depreciation) on: | |
| Unaffiliated investments | (138,497,516) |
| Translation of other assets and liabilities in foreign currencies | (438,832) |
| Net change in unrealized appreciation (depreciation) | (138,936,348) |
| Net realized and unrealized gain (loss) | (108,394,795) |
| Net increase (decrease) in net assets resulting from operations | $ (82,607,819) |
The notes to the financial statements are an integral part of, and should be read in conjunction with, the financial statements.
| 18 | MainStay Epoch Global Equity Yield Fund |
Statements of Changes in Net Assets
for the years ended October 31, 2022 and October 31, 2021
| | 2022 | 2021 |
| Increase (Decrease) in Net Assets |
| Operations: | | |
| Net investment income (loss) | $ 25,786,976 | $ 30,455,754 |
| Net realized gain (loss) | 30,541,553 | 134,496,684 |
| Net change in unrealized appreciation (depreciation) | (138,936,348) | 172,222,843 |
| Net increase (decrease) in net assets resulting from operations | (82,607,819) | 337,175,281 |
| Distributions to shareholders: | | |
| Class A | (2,921,191) | (3,483,019) |
| Investor Class | (188,229) | (241,824) |
| Class C | (296,524) | (643,860) |
| Class I | (24,118,312) | (30,164,398) |
| Class R2 | (4,681) | (12,269) |
| Class R3 | (11,174) | (12,566) |
| Class R6 | (73,763) | (19,563) |
| Total distributions to shareholders | (27,613,874) | (34,577,499) |
| Capital share transactions: | | |
| Net proceeds from sales of shares | 199,939,434 | 212,090,447 |
| Net asset value of shares issued to shareholders in reinvestment of distributions | 24,854,003 | 30,532,850 |
| Cost of shares redeemed | (229,910,828) | (629,451,002) |
| Increase (decrease) in net assets derived from capital share transactions | (5,117,391) | (386,827,705) |
| Net increase (decrease) in net assets | (115,339,084) | (84,229,923) |
| Net Assets |
| Beginning of year | 1,177,153,676 | 1,261,383,599 |
| End of year | $1,061,814,592 | $1,177,153,676 |
The notes to the financial statements are an integral part of, and should be read in conjunction with, the financial statements.
19
Financial Highlights selected per share data and ratios
| | Year Ended October 31, |
| Class A | 2022 | | 2021 | | 2020 | | 2019 | | 2018 |
| Net asset value at beginning of year | $ 20.18 | | $ 15.83 | | $ 18.75 | | $ 18.38 | | $ 19.66 |
| Net investment income (loss) (a) | 0.41 | | 0.45 | | 0.46 | | 0.57 | | 0.60 |
| Net realized and unrealized gain (loss) | (1.87) | | 4.43 | | (2.59) | | 1.42 | | (1.30) |
| Total from investment operations | (1.46) | | 4.88 | | (2.13) | | 1.99 | | (0.70) |
| Less distributions: | | | | | | | | | |
| From net investment income | (0.44) | | (0.53) | | (0.45) | | (0.59) | | (0.56) |
| From net realized gain on investments | — | | — | | (0.34) | | (1.03) | | (0.02) |
| Total distributions | (0.44) | | (0.53) | | (0.79) | | (1.62) | | (0.58) |
| Net asset value at end of year | $ 18.28 | | $ 20.18 | | $ 15.83 | | $ 18.75 | | $ 18.38 |
| Total investment return (b) | (7.36)% | | 30.98% | | (11.48)% | | 11.66% | | (3.64)% |
| Ratios (to average net assets)/Supplemental Data: | | | | | | | | | |
| Net investment income (loss) | 2.08% | | 2.32% | | 2.74% | | 3.17% | | 3.07% |
| Net expenses (c) | 1.09% | | 1.09%(d) | | 1.09%(d) | | 1.10%(d) | | 1.10% |
| Expenses (before waiver/reimbursement) (c) | 1.16% | | 1.16%(d) | | 1.14%(d) | | 1.14%(d) | | 1.16% |
| Portfolio turnover rate | 50% | | 27% | | 40% | | 24% | | 15% |
| Net assets at end of year (in 000’s) | $ 120,648 | | $ 134,982 | | $ 103,166 | | $ 125,791 | | $ 134,136 |
| (a) | Per share data based on average shares outstanding during the year. |
| (b) | Total investment return is calculated exclusive of sales charges and assumes the reinvestment of dividends and distributions. For periods of less than one year, total return is not annualized. |
| (c) | In addition to the fees and expenses which the Fund bears directly, it also indirectly bears a pro-rata share of the fees and expenses of the underlying funds in which it invests. Such indirect expenses are not included in the above expense ratios. |
| (d) | Net of interest expense of less than 0.01%. (See Note 6) |
| | Year Ended October 31, |
| Investor Class | 2022 | | 2021 | | 2020 | | 2019 | | 2018 |
| Net asset value at beginning of year | $ 20.14 | | $ 15.80 | | $ 18.72 | | $ 18.35 | | $ 19.63 |
| Net investment income (loss) (a) | 0.39 | | 0.44 | | 0.46 | | 0.57 | | 0.54 |
| Net realized and unrealized gain (loss) | (1.86) | | 4.42 | | (2.59) | | 1.42 | | (1.24) |
| Total from investment operations | (1.47) | | 4.86 | | (2.13) | | 1.99 | | (0.70) |
| Less distributions: | | | | | | | | | |
| From net investment income | (0.43) | | (0.52) | | (0.45) | | (0.59) | | (0.56) |
| From net realized gain on investments | — | | — | | (0.34) | | (1.03) | | (0.02) |
| Total distributions | (0.43) | | (0.52) | | (0.79) | | (1.62) | | (0.58) |
| Net asset value at end of year | $ 18.24 | | $ 20.14 | | $ 15.80 | | $ 18.72 | | $ 18.35 |
| Total investment return (b) | (7.42)% | | 30.91% | | (11.53)% | | 11.67% | | (3.65)% |
| Ratios (to average net assets)/Supplemental Data: | | | | | | | | | |
| Net investment income (loss) | 2.02% | | 2.29% | | 2.70% | | 3.15% | | 2.80% |
| Net expenses (c) | 1.15% | | 1.15%(d) | | 1.13%(d) | | 1.11%(d) | | 1.10% |
| Expenses (before waiver/reimbursement) (c) | 1.16% | | 1.16%(d) | | 1.13%(d) | | 1.11%(d) | | 1.10% |
| Portfolio turnover rate | 50% | | 27% | | 40% | | 24% | | 15% |
| Net assets at end of year (in 000's) | $ 7,976 | | $ 9,081 | | $ 7,897 | | $ 10,067 | | $ 9,582 |
| (a) | Per share data based on average shares outstanding during the year. |
| (b) | Total investment return is calculated exclusive of sales charges and assumes the reinvestment of dividends and distributions. For periods of less than one year, total return is not annualized. |
| (c) | In addition to the fees and expenses which the Fund bears directly, it also indirectly bears a pro-rata share of the fees and expenses of the underlying funds in which it invests. Such indirect expenses are not included in the above expense ratios. |
| (d) | Net of interest expense of less than 0.01%. (See Note 6) |
The notes to the financial statements are an integral part of, and should be read in conjunction with, the financial statements.
| 20 | MainStay Epoch Global Equity Yield Fund |
Financial Highlights selected per share data and ratios
| | Year Ended October 31, |
| Class C | 2022 | | 2021 | | 2020 | | 2019 | | 2018 |
| Net asset value at beginning of year | $ 20.07 | | $ 15.73 | | $ 18.62 | | $ 18.25 | | $ 19.53 |
| Net investment income (loss) (a) | 0.26 | | 0.30 | | 0.34 | | 0.44 | | 0.40 |
| Net realized and unrealized gain (loss) | (1.86) | | 4.40 | | (2.57) | | 1.41 | | (1.25) |
| Total from investment operations | (1.60) | | 4.70 | | (2.23) | | 1.85 | | (0.85) |
| Less distributions: | | | | | | | | | |
| From net investment income | (0.28) | | (0.36) | | (0.32) | | (0.45) | | (0.41) |
| From net realized gain on investments | — | | — | | (0.34) | | (1.03) | | (0.02) |
| Total distributions | (0.28) | | (0.36) | | (0.66) | | (1.48) | | (0.43) |
| Net asset value at end of year | $ 18.19 | | $ 20.07 | | $ 15.73 | | $ 18.62 | | $ 18.25 |
| Total investment return (b) | (8.07)% | | 30.00% | | (12.14)% | | 10.88% | | (4.41)% |
| Ratios (to average net assets)/Supplemental Data: | | | | | | | | | |
| Net investment income (loss) | 1.34% | | 1.59% | | 2.00% | | 2.47% | | 2.08% |
| Net expenses (c) | 1.84% | | 1.84%(d) | | 1.84%(d) | | 1.85%(d) | | 1.84% |
| Expenses (before waiver/reimbursement) (c) | 1.91% | | 1.91%(d) | | 1.88%(d) | | 1.87%(d) | | 1.85% |
| Portfolio turnover rate | 50% | | 27% | | 40% | | 24% | | 15% |
| Net assets at end of year (in 000’s) | $ 15,801 | | $ 27,874 | | $ 42,298 | | $ 97,872 | | $ 138,182 |
| (a) | Per share data based on average shares outstanding during the year. |
| (b) | Total investment return is calculated exclusive of sales charges and assumes the reinvestment of dividends and distributions. For periods of less than one year, total return is not annualized. |
| (c) | In addition to the fees and expenses which the Fund bears directly, it also indirectly bears a pro-rata share of the fees and expenses of the underlying funds in which it invests. Such indirect expenses are not included in the above expense ratios. |
| (d) | Net of interest expense of less than 0.01%. (See Note 6) |
| | Year Ended October 31, |
| Class I | 2022 | | 2021 | | 2020 | | 2019 | | 2018 |
| Net asset value at beginning of year | $ 20.13 | | $ 15.79 | | $ 18.72 | | $ 18.34 | | $ 19.63 |
| Net investment income (loss) (a) | 0.45 | | 0.50 | | 0.50 | | 0.62 | | 0.59 |
| Net realized and unrealized gain (loss) | (1.86) | | 4.42 | | (2.59) | | 1.43 | | (1.25) |
| Total from investment operations | (1.41) | | 4.92 | | (2.09) | | 2.05 | | (0.66) |
| Less distributions: | | | | | | | | | |
| From net investment income | (0.49) | | (0.58) | | (0.50) | | (0.64) | | (0.61) |
| From net realized gain on investments | — | | — | | (0.34) | | (1.03) | | (0.02) |
| Total distributions | (0.49) | | (0.58) | | (0.84) | | (1.67) | | (0.63) |
| Net asset value at end of year | $ 18.23 | | $ 20.13 | | $ 15.79 | | $ 18.72 | | $ 18.34 |
| Total investment return (b) | (7.08)% | | 31.32% | | (11.31)% | | 12.03% | | (3.44)% |
| Ratios (to average net assets)/Supplemental Data: | | | | | | | | | |
| Net investment income (loss) | 2.33% | | 2.59% | | 2.98% | | 3.44% | | 3.03% |
| Net expenses (c) | 0.84% | | 0.84%(d) | | 0.84%(d) | | 0.85%(d) | | 0.85% |
| Expenses (before waiver/reimbursement) (c) | 0.91% | | 0.91%(d) | | 0.89%(d) | | 0.89%(d) | | 0.91% |
| Portfolio turnover rate | 50% | | 27% | | 40% | | 24% | | 15% |
| Net assets at end of year (in 000’s) | $ 910,693 | | $ 1,003,575 | | $ 1,106,793 | | $ 1,657,341 | | $ 2,279,815 |
| (a) | Per share data based on average shares outstanding during the year. |
| (b) | Total investment return is calculated exclusive of sales charges and assumes the reinvestment of dividends and distributions. Class I shares are not subject to sales charges. For periods of less than one year, total return is not annualized. |
| (c) | In addition to the fees and expenses which the Fund bears directly, it also indirectly bears a pro-rata share of the fees and expenses of the underlying funds in which it invests. Such indirect expenses are not included in the above expense ratios. |
| (d) | Net of interest expense of less than 0.01%. (See Note 6) |
The notes to the financial statements are an integral part of, and should be read in conjunction with, the financial statements.
21
Financial Highlights selected per share data and ratios
| | Year Ended October 31, |
| Class R2 | 2022 | | 2021 | | 2020 | | 2019 | | 2018 |
| Net asset value at beginning of year | $ 20.20 | | $ 15.84 | | $ 18.77 | | $ 18.39 | | $ 19.67 |
| Net investment income (loss) (a) | 0.38 | | 0.45 | | 0.44 | | 0.55 | | 0.50 |
| Net realized and unrealized gain (loss) | (1.87) | | 4.40 | | (2.60) | | 1.42 | | (1.24) |
| Total from investment operations | (1.49) | | 4.85 | | (2.16) | | 1.97 | | (0.74) |
| Less distributions: | | | | | | | | | |
| From net investment income | (0.41) | | (0.49) | | (0.43) | | (0.56) | | (0.52) |
| From net realized gain on investments | — | | — | | (0.34) | | (1.03) | | (0.02) |
| Total distributions | (0.41) | | (0.49) | | (0.77) | | (1.59) | | (0.54) |
| Net asset value at end of year | $ 18.30 | | $ 20.20 | | $ 15.84 | | $ 18.77 | | $ 18.39 |
| Total investment return (b) | (7.49)% | | 30.76% | | (11.66)% | | 11.55% | | (3.81)% |
| Ratios (to average net assets)/Supplemental Data: | | | | | | | | | |
| Net investment income (loss) | 1.92% | | 2.35% | | 2.59% | | 3.02% | | 2.60% |
| Net expenses (c) | 1.25% | | 1.26%(d) | | 1.24%(d) | | 1.24%(d) | | 1.27% |
| Expenses (before waiver/reimbursement) (c) | 1.26% | | 1.28%(d) | | 1.24%(d) | | 1.24%(d) | | 1.27% |
| Portfolio turnover rate | 50% | | 27% | | 40% | | 24% | | 15% |
| Net assets at end of year (in 000’s) | $ 211 | | $ 228 | | $ 459 | | $ 632 | | $ 583 |
| (a) | Per share data based on average shares outstanding during the year. |
| (b) | Total investment return is calculated exclusive of sales charges and assumes the reinvestment of dividends and distributions. Class R2 shares are not subject to sales charges. For periods of less than one year, total return is not annualized. |
| (c) | In addition to the fees and expenses which the Fund bears directly, it also indirectly bears a pro-rata share of the fees and expenses of the underlying funds in which it invests. Such indirect expenses are not included in the above expense ratios. |
| (d) | Net of interest expense of less than 0.01%. (See Note 6) |
| | Year Ended October 31, |
| Class R3 | 2022 | | 2021 | | 2020 | | 2019 | | 2018 |
| Net asset value at beginning of year | $ 20.16 | | $ 15.82 | | $ 18.74 | | $ 18.36 | | $ 19.65 |
| Net investment income (loss) (a) | 0.32 | | 0.37 | | 0.40 | | 0.53 | | 0.47 |
| Net realized and unrealized gain (loss) | (1.86) | | 4.42 | | (2.60) | | 1.40 | | (1.26) |
| Total from investment operations | (1.54) | | 4.79 | | (2.20) | | 1.93 | | (0.79) |
| Less distributions: | | | | | | | | | |
| From net investment income | (0.36) | | (0.45) | | (0.38) | | (0.52) | | (0.48) |
| From net realized gain on investments | — | | — | | (0.34) | | (1.03) | | (0.02) |
| Total distributions | (0.36) | | (0.45) | | (0.72) | | (1.55) | | (0.50) |
| Net asset value at end of year | $ 18.26 | | $ 20.16 | | $ 15.82 | | $ 18.74 | | $ 18.36 |
| Total investment return (b) | (7.70)% | | 30.42% | | (11.87)% | | 11.28% | | (4.10)% |
| Ratios (to average net assets)/Supplemental Data: | | | | | | | | | |
| Net investment income (loss) | 1.66% | | 1.90% | | 2.33% | | 2.92% | | 2.42% |
| Net expenses (c) | 1.50% | | 1.50%(d) | | 1.49%(d) | | 1.49%(d) | | 1.52% |
| Expenses (before waiver/reimbursement) (c) | 1.51% | | 1.51%(d) | | 1.49%(d) | | 1.49%(d) | | 1.52% |
| Portfolio turnover rate | 50% | | 27% | | 40% | | 24% | | 15% |
| Net assets at end of year (in 000’s) | $ 634 | | $ 643 | | $ 446 | | $ 568 | | $ 690 |
| (a) | Per share data based on average shares outstanding during the year. |
| (b) | Total investment return is calculated exclusive of sales charges and assumes the reinvestment of dividends and distributions. Class R3 shares are not subject to sales charges. For periods of less than one year, total return is not annualized. |
| (c) | In addition to the fees and expenses which the Fund bears directly, it also indirectly bears a pro-rata share of the fees and expenses of the underlying funds in which it invests. Such indirect expenses are not included in the above expense ratios. |
| (d) | Net of interest expense of less than 0.01%. (See Note 6) |
The notes to the financial statements are an integral part of, and should be read in conjunction with, the financial statements.
| 22 | MainStay Epoch Global Equity Yield Fund |
Financial Highlights selected per share data and ratios
| | Year Ended October 31, |
| Class R6 | 2022 | | 2021 | | 2020 | | 2019 | | 2018 |
| Net asset value at beginning of year | $ 19.88 | | $ 15.60 | | $ 18.73 | | $ 18.35 | | $ 19.64 |
| Net investment income (loss) (a) | 0.44 | | 0.54 | | 0.54 | | 0.63 | | 0.63 |
| Net realized and unrealized gain (loss) | (1.81) | | 4.34 | | (2.81) | | 1.43 | | (1.27) |
| Total from investment operations | (1.37) | | 4.88 | | (2.27) | | 2.06 | | (0.64) |
| Less distributions: | | | | | | | | | |
| From net investment income | (0.51) | | (0.60) | | (0.52) | | (0.65) | | (0.63) |
| From net realized gain on investments | — | | — | | (0.34) | | (1.03) | | (0.02) |
| Total distributions | (0.51) | | (0.60) | | (0.86) | | (1.68) | | (0.65) |
| Net asset value at end of year | $ 18.00 | | $ 19.88 | | $ 15.60 | | $ 18.73 | | $ 18.35 |
| Total investment return (b) | (7.02)% | | 31.45% | | (12.32)% | | 12.14% | | (3.32)% |
| Ratios (to average net assets)/Supplemental Data: | | | | | | | | | |
| Net investment income (loss) | 2.33% | | 2.81% | | 3.18% | | 3.50% | | 3.25% |
| Net expenses (c) | 0.74% | | 0.74%(d) | | 0.74%(d) | | 0.75%(d) | | 0.74% |
| Expenses (before waiver/reimbursement) (c) | 0.75% | | 0.75%(d) | | 0.76%(d) | | 0.75%(d) | | 0.74% |
| Portfolio turnover rate | 50% | | 27% | | 40% | | 24% | | 15% |
| Net assets at end of year (in 000’s) | $ 5,851 | | $ 769 | | $ 325 | | $ 67,054 | | $ 83,418 |
| (a) | Per share data based on average shares outstanding during the year. |
| (b) | Total investment return is calculated exclusive of sales charges and assumes the reinvestment of dividends and distributions. Class R6 shares are not subject to sales charges. For periods of less than one year, total return is not annualized. |
| (c) | In addition to the fees and expenses which the Fund bears directly, it also indirectly bears a pro-rata share of the fees and expenses of the underlying funds in which it invests. Such indirect expenses are not included in the above expense ratios. |
| (d) | Net of interest expense of less than 0.01%. (See Note 6) |
The notes to the financial statements are an integral part of, and should be read in conjunction with, the financial statements.
23
Notes to Financial Statements
Note 1-Organization and Business
MainStay Funds Trust (the “Trust”) was organized as a Delaware statutory trust on April 28, 2009. The Trust is registered under the Investment Company Act of 1940, as amended (the “1940 Act”), as an open-end management investment company, and is comprised of thirty-three funds (collectively referred to as the “Funds”). These financial statements and notes relate to the MainStay Epoch Global Equity Yield Fund (the "Fund"), a “diversified” fund, as that term is defined in the 1940 Act, as interpreted or modified by regulatory authorities having jurisdiction, from time to time.
The following table lists the Fund's share classes that have been registered and commenced operations:
| Class | Commenced Operations |
| Class A | August 2, 2006 |
| Investor Class | November 16, 2009 |
| Class C | November 16, 2009 |
| Class I | December 27, 2005 |
| Class R2 | February 28, 2014 |
| Class R3 | February 29, 2016 |
| Class R6 | June 17, 2013 |
| SIMPLE Class | N/A* |
| * | SIMPLE Class shares were registered for sale effective as of August 31, 2020 but have not yet commenced operations. |
Class A and Investor Class shares are offered at net asset value (“NAV”) per share plus an initial sales charge. No initial sales charge applies to investments of $1 million or more (and certain other qualified purchases) in Class A and Investor Class shares. However, a contingent deferred sales charge (“CDSC”) of 1.00% may be imposed on certain redemptions made within 18 months of the date of purchase on shares that were purchased without an initial sales charge. Class C shares are offered at NAV without an initial sales charge, although a 1.00% CDSC may be imposed on certain redemptions of such shares made within one year of the date of purchase of Class C shares. Class I, Class R2, Class R3 and Class R6 shares are offered at NAV without a sales charge. SIMPLE Class shares are expected to be offered at NAV without a sales charge if such shares are offered in the future. In addition, depending upon eligibility, Class C shares convert to either Class A or Investor Class shares at the end of the calendar quarter eight years after the date they were purchased. Additionally, Investor Class shares may convert automatically to Class A shares. Under certain circumstances and as may be permitted by the Trust’s multiple class plan pursuant to Rule 18f-3 under the 1940 Act, specified share classes of the Fund may be converted to one or more other share classes of the Fund as disclosed in the capital share transactions within these Notes. The classes of shares have the same voting (except for issues that relate solely to one class), dividend, liquidation and other rights, and the same terms and conditions, except that Class C shares are subject to higher distribution and/or service fees than Class A, Investor Class, Class R2, Class R3 and SIMPLE Class shares under distribution plans pursuant to Rule 12b-1 under the 1940 Act. Class I and Class R6 shares are not subject to a distribution and/or
service fee. Class R2 and Class R3 shares are subject to a shareholder service fee, which is in addition to fees paid under the distribution plans for Class R2 and Class R3 shares.
The Fund's investment objective is to seek a high level of income. Capital appreciation is a secondary investment objective.
Note 2–Significant Accounting Policies
The Fund is an investment company and accordingly follows the investment company accounting and reporting guidance of the Financial Accounting Standards Board (“FASB”) Accounting Standards Codification Topic 946 Financial Services—Investment Companies. The Fund prepares its financial statements in accordance with generally accepted accounting principles (“GAAP”) in the United States of America and follows the significant accounting policies described below.
(A) Securities Valuation. Investments are usually valued as of the close of regular trading on the New York Stock Exchange (the "Exchange") (usually 4:00 p.m. Eastern time) on each day the Fund is open for business ("valuation date").
Effective September 8, 2022, and pursuant to Rule 2a-5 under the 1940 Act, the Board of Trustees of the Trust (the "Board") designated New York Life Investment Management LLC (“New York Life Investments” or the "Manager") as its Valuation Designee (the "Valuation Designee"). The Valuation Designee is responsible for performing fair valuations relating to all investments in the Fund’s portfolio for which market quotations are not readily available; periodically assessing and managing material valuation risks; establishing and applying fair value methodologies; testing fair valuation methodologies; evaluating and overseeing pricing services; segregation of valuation and portfolio management functions; providing quarterly, annual and prompt reporting to the Board, as appropriate; identifying potential conflicts of interest; and maintaining appropriate records. The Valuation Designee has established a valuation committee ("Valuation Committee") to assist in carrying out the Valuation Designee’s responsibilities and establish prices of securities for which market quotations are not readily available. The Fund’s and the Valuation Designee's policies and procedures ("Valuation Procedures") govern the Valuation Designee’s selection and application of methodologies for determining and calculating the fair value of Fund investments. The Valuation Designee may value Fund portfolio securities for which market quotations are not readily available and other Fund assets utilizing inputs from pricing services and other third-party sources (together, “Pricing Sources”). The Valuation Committee meets (in person, via electronic mail or via teleconference) on an ad-hoc basis to determine fair valuations and on a quarterly basis to review fair value events (excluding fair valuations from pricing services), including valuation risks and back-testing results, and preview reports to the Board.
The Valuation Committee establishes prices of securities for which market quotations are not readily available based on such methodologies and measurements on a regular basis after considering information that is reasonably available and deemed relevant by the Valuation Committee.
| 24 | MainStay Epoch Global Equity Yield Fund |
The Board shall oversee the Valuation Designee and review fair valuation materials on a prompt, quarterly and annual basis and approve proposed revisions to the Valuation Procedures.
Investments for which market quotations are not readily available are valued at fair value as determined in good faith pursuant to the Valuation Procedures. A market quotation is readily available only when that quotation is a quoted price (unadjusted) in active markets for identical investments that the Fund can access at the measurement date, provided that a quotation will not be readily available if it is not reliable. Fair value measurements are determined within a framework that establishes a three-tier hierarchy that maximizes the use of observable market data and minimizes the use of unobservable inputs to establish a classification of fair value measurements for disclosure purposes. "Inputs" refer broadly to the assumptions that market participants would use in pricing the asset or liability, including assumptions about risk, such as the risk inherent in a particular valuation technique used to measure fair value using a pricing model and/or the risk inherent in the inputs for the valuation technique. Inputs may be observable or unobservable. Observable inputs reflect the assumptions market participants would use in pricing the asset or liability based on market data obtained from sources independent of the Fund. Unobservable inputs reflect the Fund’s own assumptions about the assumptions market participants would use in pricing the asset or liability based on the information available. The inputs or methodology used for valuing assets or liabilities may not be an indication of the risks associated with investing in those assets or liabilities. The three-tier hierarchy of inputs is summarized below.
| • | Level 1—quoted prices (unadjusted) in active markets for an identical asset or liability |
| • | Level 2—other significant observable inputs (including quoted prices for a similar asset or liability in active markets, interest rates and yield curves, prepayment speeds, credit risk, etc.) |
| • | Level 3—significant unobservable inputs (including the Fund's own assumptions about the assumptions that market participants would use in measuring fair value of an asset or liability) |
The level of an asset or liability within the fair value hierarchy is based on the lowest level of an input, both individually and in the aggregate, that is significant to the fair value measurement. The aggregate value by input level of the Fund’s assets and liabilities as of October 31, 2022, is included at the end of the Portfolio of Investments.
The Fund may use third-party vendor evaluations, whose prices may be derived from one or more of the following standard inputs, among others:
| • Broker/dealer quotes | • Benchmark securities |
| • Two-sided markets | • Reference data (corporate actions or material event notices) |
| • Bids/offers | • Monthly payment information |
| • Industry and economic events | • Reported trades |
An asset or liability for which a market quotation is not readily available is valued by methods deemed reasonable in good faith by the Valuation
Committee, following the Valuation Procedures to represent fair value. Under these procedures, the Valuation Designee generally uses a market-based approach which may use related or comparable assets or liabilities, recent transactions, market multiples, book values and other relevant information. The Valuation Designee may also use an income-based valuation approach in which the anticipated future cash flows of the asset or liability are discounted to calculate fair value. Discounts may also be applied due to the nature and/or duration of any restrictions on the disposition of the asset or liability. Fair value represents a good faith approximation of the value of a security. Fair value determinations involve the consideration of a number of subjective factors, an analysis of applicable facts and circumstances and the exercise of judgment. As a result, it is possible that the fair value for a security determined in good faith in accordance with the Valuation Procedures may differ from valuations for the same security determined for other funds using their own valuation procedures. Although the Valuation Procedures are designed to value a security at the price the Fund may reasonably expect to receive upon the security's sale in an orderly transaction, there can be no assurance that any fair value determination thereunder would, in fact, approximate the amount that the Fund would actually realize upon the sale of the security or the price at which the security would trade if a reliable market price were readily available. During the year ended October 31, 2022, there were no material changes to the fair value methodologies.
Securities which may be valued in this manner include, but are not limited to: (i) a security for which trading has been halted or suspended or otherwise does not have a readily available market quotation on a given day; (ii) a debt security that has recently gone into default and for which there is not a current market quotation; (iii) a security of an issuer that has entered into a restructuring; (iv) a security that has been delisted from a national exchange; (v) a security subject to trading collars for which no or limited trading takes place; and (vi) a security whose principal market has been temporarily closed at a time when, under normal conditions, it would be open. Securities valued in this manner are generally categorized as Level 2 or 3 in the hierarchy.
Certain securities held by the Fund may principally trade in foreign markets. Events may occur between the time the foreign markets close and the time at which the Fund's NAVs are calculated. These events may include, but are not limited to, situations relating to a single issuer in a market sector, significant fluctuations in U.S. or foreign markets, natural disasters, armed conflicts, governmental actions or other developments not tied directly to the securities markets. Should the Valuation Designee conclude that such events may have affected the accuracy of the last price of such securities reported on the local foreign market, the Valuation Designee may, pursuant to the Valuation Procedures, adjust the value of the local price to reflect the estimated impact on the price of such securities as a result of such events. In this instance, securities are generally categorized as Level 3 in the hierarchy. Additionally, certain foreign equity securities are also fair valued whenever the movement of a particular index exceeds certain thresholds. In such cases, the securities are fair valued by applying factors provided by a third-party vendor in
Notes to Financial Statements (continued)
accordance with the Valuation Procedures and are generally categorized as Level 2 in the hierarchy. No foreign equity securities held by the Fund as of October 31, 2022 were fair valued in such a manner.
If the principal market of certain foreign equity securities is closed in observance of a local foreign holiday, these securities are valued using the last closing price of regular trading on the relevant exchange and fair valued by applying factors provided by a third-party vendor in accordance with the Valuation Procedures. These securities are generally categorized as Level 2 in the hierarchy. No securities held by the Fund as of October 31, 2022, were fair valued in such a manner.
Equity securities are valued at the last quoted sales prices as of the close of regular trading on the relevant exchange on each valuation date. Securities that are not traded on the valuation date are valued at the mean of the last quoted bid and ask prices. Prices are normally taken from the principal market in which each security trades. These securities are generally categorized as Level 1 in the hierarchy.
Investments in mutual funds, including money market funds, are valued at their respective NAVs at the close of business each day on the valuation date. These securities are generally categorized as Level 1 in the hierarchy.
Temporary cash investments acquired in excess of 60 days to maturity at the time of purchase are valued using the latest bid prices or using valuations based on a matrix system (which considers such factors as security prices, yields, maturities and ratings), both as furnished by independent pricing services. Temporary cash investments that mature in 60 days or less at the time of purchase ("Short-Term Investments") are valued using the amortized cost method of valuation, unless the use of such method would be inappropriate. The amortized cost method involves valuing a security at its cost on the date of purchase and thereafter assuming a constant amortization to maturity of the difference between such cost and the value on maturity date. Amortized cost approximates the current fair value of a security. Securities valued using the amortized cost method are not valued using quoted prices in an active market and are generally categorized as Level 2 in the hierarchy.
The information above is not intended to reflect an exhaustive list of the methodologies that may be used to value portfolio investments. The Valuation Procedures permit the use of a variety of valuation methodologies in connection with valuing portfolio investments. The methodology used for a specific type of investment may vary based on the market data available or other considerations. The methodologies summarized above may not represent the specific means by which portfolio investments are valued on any particular business day.
(B) Income Taxes. The Fund's policy is to comply with the requirements of the Internal Revenue Code of 1986, as amended (the “Internal Revenue Code”), applicable to regulated investment companies and to distribute all of its taxable income to the shareholders of the Fund within the allowable time limits.
The Manager evaluates the Fund’s tax positions to determine if the tax positions taken meet the minimum recognition threshold in connection with accounting for uncertainties in income tax positions taken or expected to be taken for the purposes of measuring and recognizing tax liabilities in the financial statements. Recognition of tax benefits of an uncertain tax position is permitted only to the extent the position is “more likely than not” to be sustained assuming examination by taxing authorities. The Manager analyzed the Fund's tax positions taken on federal, state and local income tax returns for all open tax years (for up to three tax years) and has concluded that no provisions for federal, state and local income tax are required in the Fund's financial statements. The Fund's federal, state and local income tax and federal excise tax returns for tax years for which the applicable statutes of limitations have not expired are subject to examination by the Internal Revenue Service and state and local departments of revenue.
(C) Foreign Taxes. The Fund may be subject to foreign taxes on income and other transaction-based taxes imposed by certain countries in which it invests. A portion of the taxes on gains on investments or currency purchases/repatriation may be reclaimable. The Fund will accrue such taxes and reclaims as applicable, based upon its current interpretation of tax rules and regulations that exist in the markets in which it invests.
The Fund may be subject to taxation on realized capital gains, repatriation proceeds and other transaction-based taxes imposed by certain countries in which it invests. The Fund will accrue such taxes as applicable based upon its current interpretation of tax rules and regulations that exist in the market in which it invests. Capital gains taxes relating to positions still held are reflected as a liability in the Statement of Assets and Liabilities, as well as an adjustment to the Fund's net unrealized appreciation (depreciation). Taxes related to capital gains realized, if any, are reflected as part of net realized gain (loss) in the Statement of Operations. Changes in tax liabilities related to capital gains taxes on unrealized investment gains, if any, are reflected as part of the change in net unrealized appreciation (depreciation) on investments in the Statement of Operations. Transaction-based charges are generally assessed as a percentage of the transaction amount.
(D) Dividends and Distributions to Shareholders. Dividends and distributions are recorded on the ex-dividend date. The Fund intends to declare and pay dividends from net investment income, if any, at least quarterly and distributions from net realized capital and currency gains, if any, at least annually. Unless a shareholder elects otherwise, all dividends and distributions are reinvested at NAV in the same class of shares of the Fund. Dividends and distributions to shareholders are determined in accordance with federal income tax regulations and may differ from determinations using GAAP.
(E) Security Transactions and Investment Income. The Fund records security transactions on the trade date. Realized gains and losses on security transactions are determined using the identified cost method. Dividend income is recognized on the ex-dividend date, net of any foreign tax withheld at the source, and interest income is accrued as earned
| 26 | MainStay Epoch Global Equity Yield Fund |
using the effective interest rate method. Distributions received from real estate investment trusts may be classified as dividends, capital gains and/or return of capital.
Investment income and realized and unrealized gains and losses on investments of the Fund are allocated pro rata to the separate classes of shares based upon their relative net assets on the date the income is earned or realized and unrealized gains and losses are incurred.
(F) Expenses. Expenses of the Trust are allocated to the individual Funds in proportion to the net assets of the respective Funds when the expenses are incurred, except where direct allocations of expenses can be made. Expenses (other than transfer agent expenses and fees incurred under the shareholder services plans and/or the distribution plans further discussed in Note 3(B)) are allocated to separate classes of shares pro rata based upon their relative net assets on the date the expenses are incurred. The expenses borne by the Fund, including those of related parties to the Fund, are shown in the Statement of Operations.
Additionally, the Fund may invest in mutual funds, which are subject to management fees and other fees that may cause the costs of investing in mutual funds to be greater than the costs of owning the underlying securities directly. These indirect expenses of mutual funds are not included in the amounts shown as expenses in the Statement of Operations or in the expense ratios included in the Financial Highlights.
(G) Use of Estimates. In preparing financial statements in conformity with GAAP, the Manager makes estimates and assumptions that affect the reported amounts and disclosures in the financial statements. Actual results could differ from those estimates and assumptions.
(H) Foreign Currency Transactions. The Fund's books and records are maintained in U.S. dollars. Prices of securities denominated in foreign currency amounts are translated into U.S. dollars at the mean between the buying and selling rates last quoted by any major U.S. bank at the following dates:
(i) market value of investment securities, other assets and liabilities— at the valuation date; and
(ii) purchases and sales of investment securities, income and expenses—at the date of such transactions.
The assets and liabilities that are denominated in foreign currency amounts are presented at the exchange rates and market values at the close of the period. The realized and unrealized changes in net assets arising from fluctuations in exchange rates and market prices of securities are not separately presented.
Net realized gain (loss) on foreign currency transactions represents net currency gains or losses realized as a result of differences between the amounts of securities sale proceeds or purchase cost, dividends, interest and withholding taxes as recorded on the Fund's books, and the U.S. dollar equivalent amount actually received or paid. Net currency gains or losses from valuing such foreign currency denominated assets and
liabilities, other than investments at valuation date exchange rates, are reflected in unrealized foreign exchange gains or losses.
(I) Securities Lending. In order to realize additional income, the Fund may engage in securities lending, subject to the limitations set forth in the 1940 Act and relevant guidance by the staff of the Securities and Exchange Commission (“SEC”). If the Fund engages in securities lending, the Fund will lend through its custodian, JPMorgan Chase Bank, N.A., ("JPMorgan"), acting as securities lending agent on behalf of the Fund. Under the current arrangement, JPMorgan will manage the Fund's collateral in accordance with the securities lending agency agreement between the Fund and JPMorgan, and indemnify the Fund against counterparty risk. The loans will be collateralized by cash (which may be invested in a money market fund) and/or non-cash collateral (which may include U.S. Treasury securities and/or U.S. government agency securities issued or guaranteed by the United States government or its agencies or instrumentalities) at least equal at all times to the market value of the securities loaned. Non-cash collateral held at year end is segregated and cannot be transferred by the Fund. The Fund bears the risk of delay in recovery of, or loss of rights in, the securities loaned. The Fund may also record a realized gain or loss on securities deemed sold due to a borrower’s inability to return securities on loan. The Fund bears the risk of any loss on investment of cash collateral. The Fund will receive compensation for lending its securities in the form of fees or it will retain a portion of interest earned on the investment of any cash collateral. The Fund will also continue to receive interest and dividends on the securities loaned and any gain or loss in the market price of the securities loaned that may occur during the term of the loan will be for the account of the Fund. Income earned from securities lending activities, if any, is reflected in the Statement of Operations. As of October 31, 2022, the Fund did not have any portfolio securities on loan.
(J) Foreign Securities Risk. The Fund may invest in foreign securities, which carry certain risks that are in addition to the usual risks inherent in domestic securities. These risks include those resulting from currency fluctuations, future adverse political or economic developments and possible imposition of currency exchange blockages or other foreign governmental laws or restrictions. These risks are likely to be greater in emerging markets than in developed markets. The ability of issuers of debt securities held by the Fund to meet their obligations may be affected by, among other things, economic or political developments in a specific country, industry or region.
(K) Large Transaction Risks. From time to time, the Fund may receive large purchase or redemption orders from affiliated or unaffiliated mutual funds or other investors. Such large transactions could have adverse effects on the Fund’s performance if the Fund were required to sell securities or invest cash at times when it otherwise would not do so. This activity could also accelerate the realization of capital gains and increase the Fund’s transaction costs. The Fund has adopted procedures designed to mitigate the negative impacts of such large transactions, but there can be no assurance that these procedures will be effective.
Notes to Financial Statements (continued)
(L) Indemnifications. Under the Trust’s organizational documents, its officers and trustees are indemnified against certain liabilities that may arise out of performance of their duties to the Trust. Additionally, in the normal course of business, the Fund enters into contracts with third-party service providers that contain a variety of representations and warranties and that may provide general indemnifications. The Fund's maximum exposure under these arrangements is unknown, as this would involve future claims that may be made against the Fund that have not yet occurred. The Manager believes that the risk of loss in connection with these potential indemnification obligations is remote. However, there can be no assurance that material liabilities related to such obligations will not arise in the future, which could adversely impact the Fund.
Note 3–Fees and Related Party Transactions
(A) Manager and Subadvisor. New York Life Investments, a registered investment adviser and an indirect, wholly-owned subsidiary of New York Life Insurance Company ("New York Life"), serves as the Fund's Manager, pursuant to an Amended and Restated Management Agreement (“Management Agreement”). The Manager provides offices, conducts clerical, recordkeeping and bookkeeping services and keeps most of the financial and accounting records required to be maintained by the Fund. Except for the portion of salaries and expenses that are the responsibility of the Fund, the Manager pays the salaries and expenses of all personnel affiliated with the Fund and certain operational expenses of the Fund. During a portion of the year ended October 31, 2022, the Fund reimbursed New York Life Investments in an amount equal to the portion of the compensation of the Chief Compliance Officer attributable to the Fund. Epoch Investment Partners, Inc. (“Epoch” or the “Subadvisor”), a registered investment adviser, serves as the Subadvisor to the Fund and is responsible for the day-to-day portfolio management of the Fund. Pursuant to the terms of an Amended and Restated Subadvisory Agreement (“Subadvisory Agreement”) between New York Life Investments and Epoch, New York Life Investments pays for the services of the Subadvisor.
Pursuant to the Management Agreement, the Fund pays the Manager a monthly fee for the services performed and the facilities furnished at an annual rate of 0.70% of the Fund's average daily net assets.
New York Life Investments has contractually agreed to waive fees and/or reimburse expenses so that Total Annual Fund Operating Expenses (excluding taxes, interest, litigation, extraordinary expenses, brokerage and other transaction expenses relating to the purchase or sale of portfolio investments and acquired (underlying) fund fees and expenses) do not exceed the following percentages of average daily net assets: Class A, 1.09%; Class C, 1.84%; Class I, 0.84%; and Class R6, 0.74%. This agreement will remain in effect until February 28, 2023, and shall renew automatically for one-year terms unless New York Life Investments provides written notice of termination prior to the start of the next term or upon approval of the Board.
During the year ended October 31, 2022, New York Life Investments earned fees from the Fund in the amount of $7,914,873 and waived fees
and/or reimbursed certain class specific expenses in the amount of $730,460 and paid the Subadvisor fees in the amount of $3,957,437.
JPMorgan provides sub-administration and sub-accounting services to the Fund pursuant to an agreement with New York Life Investments. These services include calculating the daily NAVs of the Fund, maintaining the general ledger and sub-ledger accounts for the calculation of the Fund's NAVs, and assisting New York Life Investments in conducting various aspects of the Fund's administrative operations. For providing these services to the Fund, JPMorgan is compensated by New York Life Investments.
Pursuant to an agreement between the Trust and New York Life Investments, New York Life Investments is responsible for providing or procuring certain regulatory reporting services for the Fund. The Fund will reimburse New York Life Investments for the actual costs incurred by New York Life Investments in connection with providing or procuring these services for the Fund.
(B) Distribution and Service Fees. The Trust, on behalf of the Fund, has entered into a distribution agreement with NYLIFE Distributors LLC (the “Distributor”), an affiliate of New York Life Investments. The Fund has adopted distribution plans (the “Plans”) in accordance with the provisions of Rule 12b-1 under the 1940 Act.
Pursuant to the Class A, Investor Class and Class R2 Plans, the Distributor receives a monthly fee from the Class A, Investor Class and Class R2 shares at an annual rate of 0.25% of the average daily net assets of the Class A, Investor Class and Class R2 shares for distribution and/or service activities as designated by the Distributor. Pursuant to the Class C Plan, Class C shares pay the Distributor a monthly distribution fee at an annual rate of 0.75% of the average daily net assets of the Class C shares, along with a service fee at an annual rate of 0.25% of the average daily net assets of the Class C shares, for a total 12b-1 fee of 1.00%. Pursuant to the Class R3 Plan, Class R3 shares pay the Distributor a monthly distribution fee at an annual rate of 0.25% of the average daily net assets of the Class R3 shares, along with a service fee at an annual rate of 0.25% of the average daily net assets of the Class R3 shares, for a total 12b-1 fee of 0.50%. Class I and Class R6 shares are not subject to a distribution and/or service fee.
The Plans provide that the distribution and service fees are payable to the Distributor regardless of the amounts actually expended by the Distributor for distribution of the Fund's shares and service activities.
In accordance with the Shareholder Services Plans for the Class R2 and Class R3 shares, the Manager has agreed to provide, through its affiliates or independent third parties, various shareholder and administrative support services to shareholders of the Class R2 and Class R3 shares. For its services, the Manager, its affiliates or independent third-party service providers are entitled to a shareholder service fee accrued daily and paid monthly at an annual rate of 0.10% of the average daily net assets of the Class R2 and Class R3 shares. This is in addition to any fees paid under the Class R2 and Class R3 Plans.
| 28 | MainStay Epoch Global Equity Yield Fund |
During the year ended October 31, 2022, shareholder service fees incurred by the Fund were as follows:
(C) Sales Charges. The Fund was advised by the Distributor that the amount of initial sales charges retained on sales of Class A and Investor Class shares during the year ended October 31, 2022, were $5,849 and $611, respectively.
The Fund was also advised that the Distributor retained CDSCs on redemptions of Class A, Investor Class and Class C shares during the year ended October 31, 2022, of $6,137, $15 and $29, respectively.
(D) Transfer, Dividend Disbursing and Shareholder Servicing Agent. NYLIM Service Company LLC, an affiliate of New York Life Investments, is the Fund's transfer, dividend disbursing and shareholder servicing agent pursuant to an agreement between NYLIM Service Company LLC and the Trust. NYLIM Service Company LLC has entered into an agreement with DST Asset Manager Solutions, Inc. ("DST"), pursuant to which DST performs certain transfer agent services on behalf of NYLIM Service Company LLC. New York Life Investments has contractually agreed to limit the transfer agency expenses charged to the Fund’s share classes to a maximum of 0.35% of that share class’s average daily net assets on an annual basis after deducting any applicable Fund or class-level expense reimbursement or small account fees. This agreement will remain in effect until February 28, 2023, and shall renew automatically for one-year terms unless New York Life Investments provides written notice of termination prior to the start of the next term or upon approval of the Board. During the year ended October 31, 2022, transfer agent expenses incurred by the Fund and any reimbursements, pursuant to the aforementioned Transfer Agency expense limitation agreement, were as follows:
| Class | Expense | Waived |
| Class A | $ 210,080 | $— |
| Investor Class | 14,360 | — |
| Class C | 36,367 | — |
| Class I | 1,561,840 | — |
| Class R2 | 360 | — |
| Class R3 | 1,018 | — |
| Class R6 | 104 | — |
(E) Small Account Fee. Shareholders with small accounts adversely impact the cost of providing transfer agency services. In an effort to reduce total transfer agency expenses, the Fund has implemented a small account fee on certain types of accounts. As described in the Fund's prospectus, certain shareholders with an account balance of less than $1,000 ($5,000 for Class A share accounts) are charged an annual per account fee of $20 (assessed semi-annually), the proceeds from which offset transfer agent fees as reflected in the Statement of Operations.
This small account fee will not apply to certain types of accounts as described further in the Fund’s prospectus.
(F) Capital. As of October 31, 2022, New York Life and its affiliates beneficially held shares of the Fund with the values and percentages of net assets as follows:
| Class R2 | $34,549 | 16.4% |
| Class R3 | 34,610 | 5.5 |
Note 4-Federal Income Tax
As of October 31, 2022, the cost and unrealized appreciation (depreciation) of the Fund’s investment portfolio, including applicable derivative contracts and other financial instruments, as determined on a federal income tax basis, were as follows:
| | Federal Tax
Cost | Gross
Unrealized
Appreciation | Gross
Unrealized
(Depreciation) | Net
Unrealized
Appreciation/
(Depreciation) |
| Investments in Securities | $990,552,058 | $115,585,137 | $(48,080,265) | $67,504,872 |
As of October 31, 2022, the components of accumulated gain (loss) on a tax basis were as follows:
Ordinary
income | Accumulated
Capital
and Other
Gain (Loss) | Other
Temporary
Differences | Unrealized
Appreciation
(Depreciation) | Total
Accumulated
Gain (Loss) |
| $4,483,753 | $(31,527,876) | $— | $67,087,262 | $40,043,139 |
The difference between book-basis and tax-basis unrealized appreciation (depreciation) is primarily due to wash sale adjustments and partnerships.
As of October 31, 2022, for federal income tax purposes, capital loss carryforwards of $31,527,876, as shown in the table below, were available to the extent provided by the regulations to offset future realized gains of the Fund. Accordingly, no capital gains distributions are expected to be paid to shareholders until net gains have been realized in excess of such amounts.
Capital Loss
Available Through | Short-Term
Capital Loss
Amounts (000’s) | Long-Term
Capital Loss
Amounts (000’s) |
| Unlimited | $31,528 | $— |
The Fund utilized $35,457,484 of capital loss carryforwards during the year ended October 31, 2022.
During the years ended October 31, 2022 and October 31, 2021, the tax character of distributions paid as reflected in the Statements of Changes in Net Assets was as follows:
| | 2022 | 2021 |
| Distributions paid from: | | |
| Ordinary Income | $27,613,874 | $34,577,499 |
Notes to Financial Statements (continued)
Note 5–Custodian
JPMorgan is the custodian of cash and securities held by the Fund. Custodial fees are charged to the Fund based on the Fund's net assets and/or the market value of securities held by the Fund and the number of certain transactions incurred by the Fund.
Note 6–Line of Credit
The Fund and certain other funds managed by New York Life Investments maintain a line of credit with a syndicate of banks in order to secure a source of funds for temporary purposes to meet unanticipated or excessive redemption requests.
Effective July 26, 2022, under the credit agreement (the “Credit Agreement”), the aggregate commitment amount is $600,000,000 with an additional uncommitted amount of $100,000,000. The commitment fee is an annual rate of 0.15% of the average commitment amount payable quarterly, regardless of usage, to JPMorgan, who serves as the agent to the syndicate. The commitment fee is allocated among the Fund and certain other funds managed by New York Life Investments based upon their respective net assets and other factors. Interest on any revolving credit loan is charged based upon the Federal Funds Rate, Daily Simple Secured Overnight Financing Rate ("SOFR") + 0.10%, or the Overnight Bank Funding Rate, whichever is higher. The Credit Agreement expires on July 25, 2023, although the Fund, certain other funds managed by New York Life Investments and the syndicate of banks may renew the Credit Agreement for an additional year on the same or different terms or enter into a credit agreement with a different syndicate of banks. Prior to July 26, 2022, the aggregate commitment amount and the commitment fee were the same as those under the current Credit Agreement. During the year ended October 31, 2022, there were no borrowings made or outstanding with respect to the Fund under the Credit Agreement.
Note 7–Interfund Lending Program
Pursuant to an exemptive order issued by the SEC, the Fund, along with certain other funds managed by New York Life Investments, may participate in an interfund lending program. The interfund lending program provides an alternative credit facility that permits the Fund and certain other funds managed by New York Life Investments to lend or borrow money for temporary purposes directly to or from one another, subject to the conditions of the exemptive order. During the year ended October 31, 2022, there were no interfund loans made or outstanding with respect to the Fund.
Note 8–Purchases and Sales of Securities (in 000’s)
During the year ended October 31, 2022, purchases and sales of securities, other than short-term securities, were $550,981 and $556,740, respectively.
Note 9–Capital Share Transactions
Transactions in capital shares for the years ended October 31, 2022 and October 31, 2021, were as follows:
| Class A | Shares | Amount |
| Year ended October 31, 2022: | | |
| Shares sold | 859,251 | $ 16,801,816 |
| Shares issued to shareholders in reinvestment of distributions | 125,489 | 2,385,618 |
| Shares redeemed | (1,090,606) | (21,146,458) |
| Net increase (decrease) in shares outstanding before conversion | (105,866) | (1,959,024) |
| Shares converted into Class A (See Note 1) | 29,554 | 588,529 |
| Shares converted from Class A (See Note 1) | (11,185) | (221,782) |
| Net increase (decrease) | (87,497) | $ (1,592,277) |
| Year ended October 31, 2021: | | |
| Shares sold | 1,422,975 | $ 27,830,579 |
| Shares issued to shareholders in reinvestment of distributions | 146,494 | 2,853,734 |
| Shares redeemed | (1,478,201) | (28,274,577) |
| Net increase (decrease) in shares outstanding before conversion | 91,268 | 2,409,736 |
| Shares converted into Class A (See Note 1) | 80,646 | 1,573,124 |
| Shares converted from Class A (See Note 1) | (428) | (8,525) |
| Net increase (decrease) | 171,486 | $ 3,974,335 |
| |
| Investor Class | Shares | Amount |
| Year ended October 31, 2022: | | |
| Shares sold | 38,014 | $ 744,939 |
| Shares issued to shareholders in reinvestment of distributions | 9,889 | 187,826 |
| Shares redeemed | (48,380) | (945,633) |
| Net increase (decrease) in shares outstanding before conversion | (477) | (12,868) |
| Shares converted into Investor Class (See Note 1) | 8,890 | 173,952 |
| Shares converted from Investor Class (See Note 1) | (21,960) | (440,271) |
| Net increase (decrease) | (13,547) | $ (279,187) |
| Year ended October 31, 2021: | | |
| Shares sold | 51,765 | $ 1,021,051 |
| Shares issued to shareholders in reinvestment of distributions | 12,390 | 240,393 |
| Shares redeemed | (82,034) | (1,590,170) |
| Net increase (decrease) in shares outstanding before conversion | (17,879) | (328,726) |
| Shares converted into Investor Class (See Note 1) | 14,123 | 275,582 |
| Shares converted from Investor Class (See Note 1) | (45,293) | (886,846) |
| Net increase (decrease) | (49,049) | $ (939,990) |
| |
| 30 | MainStay Epoch Global Equity Yield Fund |
| Class C | Shares | Amount |
| Year ended October 31, 2022: | | |
| Shares sold | 39,389 | $ 772,835 |
| Shares issued to shareholders in reinvestment of distributions | 14,494 | 276,826 |
| Shares redeemed | (556,835) | (10,852,716) |
| Net increase (decrease) in shares outstanding before conversion | (502,952) | (9,803,055) |
| Shares converted from Class C (See Note 1) | (17,249) | (334,287) |
| Net increase (decrease) | (520,201) | $ (10,137,342) |
| Year ended October 31, 2021: | | |
| Shares sold | 47,423 | $ 916,407 |
| Shares issued to shareholders in reinvestment of distributions | 31,075 | 600,521 |
| Shares redeemed | (1,331,504) | (25,474,798) |
| Net increase (decrease) in shares outstanding before conversion | (1,253,006) | (23,957,870) |
| Shares converted from Class C (See Note 1) | (47,266) | (914,626) |
| Net increase (decrease) | (1,300,272) | $ (24,872,496) |
| |
| Class I | Shares | Amount |
| Year ended October 31, 2022: | | |
| Shares sold | 9,092,022 | $ 175,816,550 |
| Shares issued to shareholders in reinvestment of distributions | 1,156,561 | 21,916,216 |
| Shares redeemed | (10,151,265) | (196,585,259) |
| Net increase (decrease) in shares outstanding before conversion | 97,318 | 1,147,507 |
| Shares converted into Class I (See Note 1) | 11,840 | 233,859 |
| Net increase (decrease) | 109,158 | $ 1,381,366 |
| Year ended October 31, 2021: | | |
| Shares sold | 9,426,765 | $ 181,570,372 |
| Shares issued to shareholders in reinvestment of distributions | 1,382,808 | 26,793,856 |
| Shares redeemed | (31,039,645) | (573,368,338) |
| Net increase (decrease) in shares outstanding before conversion | (20,230,072) | (365,004,110) |
| Shares converted into Class I (See Note 1) | 663 | 12,348 |
| Shares converted from Class I (See Note 1) | (2,856) | (51,057) |
| Net increase (decrease) | (20,232,265) | $(365,042,819) |
| |
| Class R2 | Shares | Amount |
| Year ended October 31, 2022: | | |
| Shares issued to shareholders in reinvestment of distributions | 245 | $ 4,681 |
| Shares redeemed | (5) | (100) |
| Net increase (decrease) | 240 | $ 4,581 |
| Year ended October 31, 2021: | | |
| Shares issued to shareholders in reinvestment of distributions | 630 | $ 12,269 |
| Shares redeemed | (18,274) | (360,203) |
| Net increase (decrease) | (17,644) | $ (347,934) |
| |
| Class R3 | Shares | Amount |
| Year ended October 31, 2022: | | |
| Shares sold | 7,812 | $ 153,343 |
| Shares issued to shareholders in reinvestment of distributions | 584 | 11,074 |
| Shares redeemed | (5,566) | (107,411) |
| Net increase (decrease) | 2,830 | $ 57,006 |
| Year ended October 31, 2021: | | |
| Shares sold | 5,512 | $ 109,021 |
| Shares issued to shareholders in reinvestment of distributions | 642 | 12,514 |
| Shares redeemed | (2,421) | (45,206) |
| Net increase (decrease) | 3,733 | $ 76,329 |
| |
| Class R6 | Shares | Amount |
| Year ended October 31, 2022: | | |
| Shares sold | 296,515 | $ 5,649,951 |
| Shares issued to shareholders in reinvestment of distributions | 3,985 | 71,762 |
| Shares redeemed | (14,048) | (273,251) |
| Net increase (decrease) | 286,452 | $ 5,448,462 |
| Year ended October 31, 2021: | | |
| Shares sold | 33,713 | $ 643,017 |
| Shares issued to shareholders in reinvestment of distributions | 1,015 | 19,563 |
| Shares redeemed | (16,856) | (337,710) |
| Net increase (decrease) | 17,872 | $ 324,870 |
Note 10–Other Matters
As of the date of this report, interest rates in the United States and many parts of the world, including certain European countries, are ascending from historically low levels. Thus, the Fund currently faces a heightened level of risk associated with rising interest rates. This could be driven by a variety of factors, including but not limited to central bank monetary policies, changing inflation or real growth rates, general economic conditions, increasing bond issuances or reduced market demand for low yielding investments.
An outbreak of COVID-19, first detected in December 2019, has developed into a global pandemic and has resulted in travel restrictions,
Notes to Financial Statements (continued)
closure of international borders, certain businesses and securities markets, restrictions on securities trading activities, prolonged quarantines, supply chain disruptions, and lower consumer demand, as well as general concern and uncertainty. In 2022, many countries lifted some or all restrictions related to COVID-19. However, the continued impact of COVID-19 and related variants is uncertain and could further adversely affect the global economy, national economies, individual issuers and capital markets in unforeseeable ways and result in a substantial and extended economic downturn. Developments that disrupt global economies and financial markets, such as COVID-19, may magnify factors that affect the Fund's performance.
Note 11–Subsequent Events
In connection with the preparation of the financial statements of the Fund as of and for the year ended October 31, 2022, events and transactions subsequent to October 31, 2022, through the date the financial statements were issued have been evaluated by the Manager for possible adjustment and/or disclosure. No subsequent events requiring financial statement adjustment or disclosure have been identified.
| 32 | MainStay Epoch Global Equity Yield Fund |
Report of Independent Registered Public Accounting Firm
To the Shareholders of the Fund and Board of Trustees
MainStay Funds Trust:
Opinion on the Financial Statements
We have audited the accompanying statement of assets and liabilities of MainStay Epoch Global Equity Yield Fund (the Fund), one of the funds constituting MainStay Funds Trust, including the portfolio of investments, as of October 31, 2022, the related statement of operations for the year then ended, the statements of changes in net assets for each of the years in the two-year period then ended, and the related notes (collectively, the financial statements) and the financial highlights for each of the years in the five-year period then ended. In our opinion, the financial statements and financial highlights present fairly, in all material respects, the financial position of the Fund as of October 31, 2022, the results of its operations for the year then ended, the changes in its net assets for each of the years in the two-year period then ended, and the financial highlights for each of the years in the five-year period then ended, in conformity with U.S. generally accepted accounting principles.
Basis for Opinion
These financial statements and financial highlights are the responsibility of the Fund's management. Our responsibility is to express an opinion on these financial statements and financial highlights based on our audits. We are a public accounting firm registered with the Public Company Accounting Oversight Board (United States) (PCAOB) and are required to be independent with respect to the Fund in accordance with the U.S. federal securities laws and the applicable rules and regulations of the Securities and Exchange Commission and the PCAOB.
We conducted our audits in accordance with the standards of the PCAOB. Those standards require that we plan and perform the audit to obtain reasonable assurance about whether the financial statements and financial highlights are free of material misstatement, whether due to error or fraud. Our audits included performing procedures to assess the risks of material misstatement of the financial statements and financial highlights, whether due to error or fraud, and performing procedures that respond to those risks. Such procedures included examining, on a test basis, evidence regarding the amounts and disclosures in the financial statements and financial highlights. Such procedures also included confirmation of securities owned as of October 31, 2022, by correspondence with the custodian, the transfer agent and brokers; when replies were not received from brokers, we performed other auditing procedures. Our audits also included evaluating the accounting principles used and significant estimates made by management, as well as evaluating the overall presentation of the financial statements and financial highlights. We believe that our audits provide a reasonable basis for our opinion.

We have served as the auditor of one or more New York Life Investment Management investment companies since 2003.
Philadelphia, Pennsylvania
December 23, 2022
Federal Income Tax Information
(Unaudited)
The Fund is required under the Internal Revenue Code to advise shareholders in a written statement as to the federal tax status of dividends paid by the Fund during such fiscal years.
For the fiscal year ended October 31, 2022, the Fund designated approximately $27,613,874 under the Internal Revenue Code as qualified dividend income eligible for reduced tax rates.
The dividends paid by the Fund during the fiscal year ended October 31, 2022 should be multiplied by 60.85% to arrive at the amount eligible for the corporate dividend-received deduction.
In February 2023, shareholders will receive an IRS Form 1099-DIV or substitute Form 1099, which will show the federal tax status of the distributions received by shareholders in calendar year 2022. The amounts that will be reported on such 1099-DIV or substitute Form 1099 will be the amounts you are to use on your federal income tax return and will differ from the amounts which we must report for the Fund's fiscal year ended October 31, 2022.
Proxy Voting Policies and Procedures and Proxy Voting Record
The Fund is required to file with the SEC its proxy voting record for the 12-month period ending June 30 on Form N-PX. A description of the policies and procedures that are used to vote proxies relating to portfolio securities of the Fund is available free of charge upon request by calling 800-624-6782 or visiting the SEC’s website at www.sec.gov. The most recent Form N-PX or proxy voting record is available free of charge upon request by calling 800-624-6782; visiting newyorklifeinvestments.com; or visiting the SEC’s website at www.sec.gov.
Shareholder Reports and Quarterly Portfolio Disclosure
The Fund is required to file its complete schedule of portfolio holdings with the SEC 60 days after its first and third fiscal quarter on Form N-PORT. The Fund's holdings report is available free of charge upon request by calling New York Life Investments at 800-624-6782.
| 34 | MainStay Epoch Global Equity Yield Fund |
Board of Trustees and Officers (Unaudited)
The Trustees and officers of the Fund are listed below. The Board oversees the MainStay Group of Funds (which consists of MainStay Funds and MainStay Funds Trust), MainStay VP Funds Trust, MainStay MacKay DefinedTerm Municipal Opportunities Fund, MainStay CBRE Global Infrastructure Megatrends Fund, the Manager and the Subadvisors, and elects the officers of the Funds who are responsible for the day-to-day operations of the Fund. Information pertaining to the Trustees and officers is set forth below. Each Trustee serves until his or her successor is
elected and qualified or until his or her resignation, death or removal. Under the Board’s retirement policy, unless an exception is made, a Trustee must tender his or her resignation by the end of the calendar year during which he or she reaches the age of 75. The business address of each Trustee and officer listed below is 51 Madison Avenue, New York, New York 10010. None of the Trustees are “interested persons” (as defined by the 1940 Act and rules adopted by the SEC thereunder) of the Fund (“Independent Trustees”).
| | Name and
Year of Birth | Term of Office,
Position(s) Held and
Length of Service | Principal Occupation(s)
During Past Five Years | Number of
Portfolios in
Fund Complex
Overseen by
Trustee | Other Directorships
Held by Trustee |
| | | | | | |
| | David H. Chow
1957 | MainStay Funds: Trustee since 2016, Advisory Board Member (June 2015 to December 2015);MainStay Funds Trust:
Trustee since January 2016, Advisory Board Member (June 2015 to December 2015) | Founder and CEO, DanCourt Management, LLC since 1999 | 78 | MainStay VP Funds Trust: Trustee since January 2016, Advisory Board Member (June 2015 to December 2015) (31 portfolios);
MainStay MacKay DefinedTerm Municipal Opportunities Fund: Trustee since January 2016, Advisory Board Member (June 2015 to December 2015);
MainStay CBRE Global Infrastructure Megatrends Fund: Trustee since June 2021; VanEck Vectors Group of Exchange-Traded Funds: Independent Chairman of the Board of Trustees since 2008 and Trustee since 2006 (56 portfolios); and Berea College of Kentucky: Trustee since 2009, Chair of the Investment Committee since 2018 |
| | Susan B. Kerley
1951 | MainStay Funds: Chairman since 2017 and Trustee since 2007;MainStay Funds Trust:
Chairman since 2017 and Trustee since 1990** | President, Strategic Management Advisors LLC since 1990 | 78 | MainStay VP Funds Trust: Chairman since January 2017 and Trustee since 2007 (31 portfolios)**;
MainStay MacKay DefinedTerm Municipal Opportunities Fund: Chairman since 2017 and Trustee since 2011;
MainStay CBRE Global Infrastructure Megatrends Fund: Trustee since June 2021; and Legg Mason Partners Funds: Trustee since 1991 (45 portfolios) |
| | Alan R. Latshaw
1951 | MainStay Funds: Trustee since 2006;MainStay Funds Trust:
Trustee since 2007*** | Retired; Partner, Ernst & Young LLP (2002 to 2003); Partner, Arthur Andersen LLP (1989 to 2002); Consultant to the MainStay Funds Audit and Compliance Committee (2004 to 2006) | 78 | MainStay VP Funds Trust: Trustee since 2007 (31 portfolios)**;
MainStay MacKay DefinedTerm Municipal Opportunities Fund: Trustee since 2011; and
MainStay CBRE Global Infrastructure Megatrends Fund: Trustee since June 2021 |
Board of Trustees and Officers (Unaudited) (continued)
| | Name and
Year of Birth | Term of Office,
Position(s) Held and
Length of Service | Principal Occupation(s)
During Past Five Years | Number of
Portfolios in
Fund Complex
Overseen by
Trustee | Other Directorships
Held by Trustee |
| | | | | | |
| | Karen Hammond
1956 | MainStay Funds: Trustee since December 2021, Advisory Board Member (June 2021 to December 2021);MainStay Funds Trust:
Trustee since December 2021, Advisory Board Member (June 2021 to December 2021)
| Retired, Managing Director, Devonshire Investors (2007 to 2013); Senior Vice President, Fidelity Management & Research Co. (2005 to 2007); Senior Vice President and Corporate Treasurer, FMR Corp. (2003 to 2005); Chief Operating Officer, Fidelity Investments Japan (2001 to 2003) | 78 | MainStay VP Funds Trust: Trustee since December 2021, Advisory Board Member (June 2021 to December 2021) (31 Portfolios);
MainStay MacKay DefinedTerm Municipal Opportunities Fund: Trustee since December 2021, Advisory Board Member (June 2021 to December 2021);
MainStay CBRE Global Infrastructure Megatrends Fund: Trustee since December 2021, Advisory Board Member (June 2021 to December 2021);
Two Harbors Investment Corp.: Director since 2018;
Rhode Island State Investment Commission: Member since 2017; and
Blue Cross Blue Shield of Rhode Island: Director since 2019 |
| | Jacques P. Perold
1958 | MainStay Funds: Trustee since 2016, Advisory Board Member (June 2015 toDecember 2015);MainStay Funds Trust:
Trustee since January 2016, Advisory Board Member (June 2015 to December 2015) | Founder and Chief Executive Officer, CapShift Advisors LLC (since 2018); President, Fidelity Management & Research Company (2009 to 2014); President and Chief Investment Officer, Geode Capital Management, LLC (2001 to 2009) | 78 | MainStay VP Funds Trust: Trustee since January 2016, Advisory Board Member (June 2015 to December 2015) (31 portfolios);
MainStay MacKay DefinedTerm Municipal Opportunities Fund: Trustee since January 2016, Advisory Board Member (June 2015 to December 2015);
MainStay CBRE Global Infrastructure Megatrends Fund: Trustee since June 2021; Partners in Health: Trustee since 2019; Allstate Corporation: Director since 2015; and MSCI Inc.: Director since 2017 |
| | Richard S. Trutanic
1952 | MainStay Funds: Trustee since 1994;MainStay Funds Trust:
Trustee since 2007*** | Chairman and Chief Executive Officer, Somerset & Company (financial advisory firm) since 2004; Managing Director, The Carlyle Group (private investment firm) (2002 to 2004); Senior Managing Director, Partner and Board Member, Groupe Arnault S.A. (private investment firm) (1999 to 2002) | 78 | MainStay VP Funds Trust: Trustee since 2007 (31 portfolios)**;
MainStay MacKay DefinedTerm Municipal Opportunities Fund: Trustee since 2011; and MainStay CBRE Global Infrastructure Megatrends Fund: Trustee since June 2021 |
| ** | Includes prior service as a Director of MainStay VP Series Fund, Inc., the predecessor to MainStay VP Funds Trust. |
| *** | Includes prior service as a Director/Trustee of certain predecessor entities to MainStay Funds Trust. |
| 36 | MainStay Epoch Global Equity Yield Fund |
| | Name and
Year of Birth | Position(s) Held and
Length of Service | Principal Occupation(s)
During Past Five Years | |
| | | | | |
| | Kirk C. Lehneis
1974 | President, MainStay Funds, MainStay Funds Trust since 2017 | Chief Operating Officer and Senior Managing Director (since 2016), New York Life Investment Management LLC and New York Life Investment Management Holdings LLC; Member of the Board of Managers (since 2017) and Senior Managing Director (since 2018), NYLIFE Distributors LLC; Chairman of the Board and Senior Managing Director, NYLIM Service Company LLC (since 2017); Trustee, President and Principal Executive Officer of IndexIQ Trust, IndexIQ ETF Trust and IndexIQ Active ETF Trust (since January 2018); President, MainStay CBRE Global Infrastructure Megatrends Fund (since 2021), MainStay MacKay DefinedTerm Municipal Opportunities Fund and MainStay VP Funds Trust (since 2017); Senior Managing Director, Global Product Development (From 2015-2016); Managing Director, Product Development (2010 to 2015), New York Life Investment Management LLC | |
| | Jack R. Benintende
1964 | Treasurer and Principal Financial and Accounting Officer, MainStay Funds (since 2007), MainStay Funds Trust (since 2009) | Managing Director, New York Life Investment Management LLC (since 2007); Treasurer and Principal Financial and Accounting Officer, MainStay CBRE Global Infrastructure Megatrends Fund (since 2021), MainStay MacKay DefinedTerm Municipal Opportunities Fund (since 2011) and MainStay VP Funds Trust (since 2007)** and Assistant Treasurer, New York Life Investment Management Holdings LLC (2008 to 2012) | |
| | J. Kevin Gao
1967 | Secretary and Chief Legal Officer, MainStay Funds and MainStay Funds Trust (since 2010) | Managing Director and Associate General Counsel, New York Life Investment Management LLC (since 2010); Secretary and Chief Legal Officer and MainStay CBRE Global Infrastructure Megatrends Fund (since 2021), MainStay MacKay DefinedTerm Municipal Opportunities Fund (since 2011) and MainStay VP Funds Trust (since 2010)** | |
| | Scott T. Harrington
1959 | Vice President— Administration, MainStay Funds (since 2009), MainStay Funds Trust (since 2009) | Managing Director, New York Life Investment Management LLC (including predecessor advisory organizations) (since 2000); Member of the Board of Directors, New York Life Trust Company (since 2009); Vice President—Administration, MainStay CBRE Global Infrastructure Megatrends Fund (since 2021), MainStay MacKay DefinedTerm Municipal Opportunities Fund (since 2011) and MainStay VP Funds Trust (since 2005)** | |
| | Kevin M. Gleason
1967 | Vice President and Chief Compliance Officer, MainStay Funds and MainStay Funds Trust (since June 2022) | Vice President and Chief Compliance Officer, IndexIQ, IndexIQ ETF Trust and Index IQ Active ETF Trust (since June 2022); Vice President and Chief Compliance Officer, MainStay CBRE Global Infrastructure Megatrends Fund, MainStay VP Funds Trust and MainStay MacKay DefinedTerm Municipal Opportunities Fund (since June 2022); Senior Vice President, Voya Investment Management and Chief Compliance Officer, Voya Family of Funds (2012-2022) | |
| * | The officers listed above are considered to be “interested persons” of the MainStay Group of Funds, MainStay VP Funds Trust, MainStay CBRE Global Infrastructure Megatrends Fund and MainStay MacKay DefinedTerm Municipal Opportunities Fund within the meaning of the 1940 Act because of their affiliation with the MainStay Group of Funds, New York Life Insurance Company and/or its affiliates, including New York Life Investment Management LLC, NYLIM Service Company LLC, NYLIFE Securities LLC and/or NYLIFE Distributors LLC, as described in detail in the column captioned “Principal Occupation(s) During Past Five Years.” Officers are elected annually by the Board. |
| ** | Includes prior service as an Officer of MainStay VP Series Fund, Inc., the predecessor to MainStay VP Funds Trust. |
Officers of the Trust (Who are not Trustees)*
This page intentionally left blank.
Equity
U.S. Equity
MainStay Epoch U.S. Equity Yield Fund
MainStay S&P 500 Index Fund1
MainStay Winslow Large Cap Growth Fund
MainStay WMC Enduring Capital Fund
MainStay WMC Growth Fund
MainStay WMC Small Companies Fund
MainStay WMC Value Fund
International Equity
MainStay Epoch International Choice Fund
MainStay MacKay International Equity Fund
MainStay WMC International Research Equity Fund
Emerging Markets Equity
MainStay Candriam Emerging Markets Equity Fund
Global Equity
MainStay Epoch Capital Growth Fund
MainStay Epoch Global Equity Yield Fund
Fixed Income
Taxable Income
MainStay Candriam Emerging Markets Debt Fund
MainStay Floating Rate Fund
MainStay MacKay High Yield Corporate Bond Fund
MainStay MacKay Short Duration High Yield Fund
MainStay MacKay Strategic Bond Fund
MainStay MacKay Total Return Bond Fund
MainStay MacKay U.S. Infrastructure Bond Fund
MainStay Short Term Bond Fund
Tax-Exempt Income
MainStay MacKay California Tax Free Opportunities Fund2
MainStay MacKay High Yield Municipal Bond Fund
MainStay MacKay New York Tax Free Opportunities Fund3
MainStay MacKay Short Term Municipal Fund
MainStay MacKay Strategic Municipal Allocation Fund
MainStay MacKay Tax Free Bond Fund
Money Market
MainStay Money Market Fund
Mixed Asset
MainStay Balanced Fund
MainStay Income Builder Fund
MainStay MacKay Convertible Fund
Speciality
MainStay CBRE Global Infrastructure Fund
MainStay CBRE Real Estate Fund
MainStay Cushing MLP Premier Fund
Asset Allocation
MainStay Conservative Allocation Fund
MainStay Conservative ETF Allocation Fund
MainStay Defensive ETF Allocation Fund
MainStay Equity Allocation Fund
MainStay Equity ETF Allocation Fund
MainStay ESG Multi-Asset Allocation Fund
MainStay Growth Allocation Fund
MainStay Growth ETF Allocation Fund
MainStay Moderate Allocation Fund
MainStay Moderate ETF Allocation Fund
Manager
New York Life Investment Management LLC
New York, New York
Subadvisors
Candriam4
Strassen, Luxembourg
CBRE Investment Management Listed Real Assets LLC
Radnor, Pennsylvania
Cushing Asset Management, LP
Dallas, Texas
Epoch Investment Partners, Inc.
New York, New York
MacKay Shields LLC4
New York, New York
NYL Investors LLC4
New York, New York
Wellington Management Company LLP
Boston, Massachusetts
Winslow Capital Management, LLC
Minneapolis, Minnesota
Legal Counsel
Dechert LLP
Washington, District of Columbia
Independent Registered Public Accounting Firm
KPMG LLP
Philadelphia, Pennsylvania
Distributor
NYLIFE Distributors LLC4
Jersey City, New Jersey
Custodian
JPMorgan Chase Bank, N.A.
New York, New York
1.
Prior to February 28, 2022, the Fund's name was MainStay MacKay S&P 500 Index Fund.
| 2. | This Fund is registered for sale in AZ, CA, NV, OR, TX, UT, WA and MI (Class A and Class I shares only), and CO, FL, GA, HI, ID, MA, MD, NH, NJ and NY (Class I shares only). |
| 3. | This Fund is registered for sale in CA, CT, DE, FL, MA, NJ, NY and VT. |
| 4. | An affiliate of New York Life Investment Management LLC. |
Not part of the Annual Report
For more information
800-624-6782
newyorklifeinvestments.com
“New York Life Investments” is both a service mark, and the common trade name, of certain investment advisors affiliated with New York Life Insurance Company. The MainStay Funds® are managed by New York Life Investment Management LLC and distributed by NYLIFE Distributors LLC, 30 Hudson Street, Jersey City, NJ 07302, a wholly owned subsidiary of New York Life Insurance Company. NYLIFE Distributors LLC is a Member FINRA/SIPC.
©2022 NYLIFE Distributors LLC. All rights reserved.
| 5013736.2MS229-22 | MSEGE11-12/22 |
(NYLIM) NL241
MainStay Epoch International Choice Fund
Message from the President and Annual Report
October 31, 2022
Sign up for e-delivery of your shareholder reports. For full details on e-delivery, including who can participate and what you can receive via e-delivery,
please log in to newyorklifeinvestments.com/accounts.
| Not FDIC/NCUA Insured | Not a Deposit | May Lose Value | No Bank Guarantee | Not Insured by Any Government Agency |
This page intentionally left blank
Message from the President
A series of economic and geopolitical challenges undermined equity and fixed-income markets during the 12-month reporting period ended October 31, 2022. Stocks and bonds alike trended lower in the face of sharply rising interest rates, increasing inflationary pressures, slowing economic growth and Russia’s invasion of Ukraine.
The reporting period began on a mixed note, with concerns about the spreading Omicron variant of the COVID-19 virus and increasingly hawkish statements from the U.S. Federal Reserve (the “Fed”) regarding mounting inflation, countered by bullish sentiment stemming from U.S. economic growth and strong corporate earnings. In January 2022, markets turned decisively negative as comments from the Fed raised the likelihood of rate hikes as early as March, and Russia issued increasingly aggressive threats toward Ukraine. The onset of Russia’s invasion in February exacerbated global inflationary pressures while increasing investor uncertainty. Domestic supply shortages, international trade imbalances and rising inflation caused GDP (gross domestic product) to contract in the first and second quarters of the year, although employment and consumer spending proved resilient. Prices for petroleum surged to multi-year highs, while many key agricultural chemicals and industrial metals climbed as well. Accelerating inflationary forces prompted the Fed to implement its most aggressive interest rate increases since the 1980s with a series of five sharp rate hikes, raising the federal funds rate from a range of 0.00% to 0.25% in March to 3.00% to 3.25% in September, with additional rate hikes expected before the end of the year. International central banks generally followed suit, raising rates by varying degrees in efforts to curb local inflation, although most increases remained significantly more modest than those in the United States. Relatively high U.S. interest rates and risk-averse international sentiment pushed U.S. dollar values higher compared to most other currencies, with the ensuing negative impact on global prices for food, fuel and other key, U.S.-dollar-denominated products.
The effects of these interrelated challenges were felt throughout U.S. and international financial markets. The S&P 500® Index, a widely regarded benchmark of U.S. market performance, declined by more than 14% during the reporting period. Although the energy sector generated strong gains, bolstered by elevated oil and gas prices, most other industry areas recorded losses. The more cyclical and growth-oriented sectors of consumer discretionary, real estate and information technology delivered the
weakest returns, while the traditionally defensive and value-oriented consumer staples, utilities and health care sectors outperformed. International stocks lagged compared to their U.S. counterparts, with some emerging markets, such as China, suffering particularly steep losses. A few markets, however, including Brazil, Mexico and the United Arab Emirates, ended the reporting period with little change. Fixed-income markets saw bond prices broadly decline as yields rose along with interest rates. Short-term yields rose faster than long-term yields, producing a yield curve inversion from July through the end of the reporting period, with long-term rates remaining below short-term rates. While floating-rate instruments, which feature variable interest rates that allow investors to benefit from a rising rate environment, provided a degree of insulation from inflation-driven trends, they were not immune to the market’s widespread declines.
While the Fed acknowledges the costs of rising rates in terms of weaker GDP growth and unsettled financial markets over the short term, its primary focus continues to be the longer-term economic impact of inflation. With the latest figures as of the date of this report showing that inflation remains above 8%, versus a target rate of just 2%, the Fed clearly has a distance yet to go, making further rate increases and market volatility more likely in the coming months. The question remains as to whether the Fed and other central banks will manage a so-called “soft landing,” curbing inflation while avoiding a persistent economic slowdown. If they prove successful, we expect that favorable inflation trends and increasingly attractive valuations in both equity and bond markets should eventually translate into sustainable improvements in the investment environment.
Whatever actions the Fed takes and however financial markets react, as a MainStay investor, you can depend on us to continue providing the insight, expertise and service that have long defined New York Life Investments. Thank you for trusting us to help you meet your investment needs.
Sincerely,
Kirk C. Lehneis
President
The opinions expressed are as of the date of this report and are subject to change. There is no guarantee that any forecast made will come to pass. This material does not constitute investment advice and is not intended as an endorsement of any specific investment. Past performance is no guarantee of future results.
Not part of the Annual Report
Investors should refer to the Fund’s Summary Prospectus and/or Prospectus and consider the Fund’s investment objectives, strategies, risks, charges and expenses carefully before investing. The Summary Prospectus and/or Prospectus contain this and other information about the Fund. You may obtain copies of the Fund’s Summary Prospectus, Prospectus and Statement of Additional Information, which includes information about the MainStay Funds Trust's Trustees, free of charge, upon request, by calling toll-free 800-624-6782, by writing to NYLIFE Distributors LLC, Attn: MainStay Marketing Department, 30 Hudson Street, Jersey City, NJ 07302 or by sending an e-mail to MainStayShareholderServices@nylim.com. These documents are also available via the MainStay Funds’ website at newyorklifeinvestments.com. Please read the Fund’s Summary Prospectus and/or Prospectus carefully before investing.
Investment and Performance Comparison (Unaudited)
Performance data quoted represents past performance. Past performance is no guarantee of future results. Because of market volatility and other factors, current performance may be lower or higher than the figures shown. Investment return and principal value will fluctuate, and as a result, when shares are redeemed, they may be worth more or less than their original cost. The graph below depicts the historical performance of Class I shares of the Fund. Performance will vary from class to class based on differences in class-specific expenses and sales charges. For performance information current to the most recent month-end, please call 800-624-6782 or visit newyorklifeinvestments.com.
The performance table and graph do not reflect the deduction of taxes that a shareholder would pay on distributions or Fund share redemptions. Total returns reflect maximum applicable sales charges as indicated in the table below, if any, changes in share price, and reinvestment of dividend and capital gain distributions. The graph assumes the initial investment amount shown below and reflects the deduction of all sales charges that would have applied for the period of investment. Performance figures may reflect certain fee waivers and/or expense limitations, without which total returns may have been lower. For more information on share classes and current fee waivers and/or expense limitations (if any), please refer to the Notes to Financial Statements.

| Average Annual Total Returns for the Year-Ended October 31, 2022 |
| Class | Sales Charge | | Inception
Date | One
Year | Five
Years | Ten Years
or Since
Inception | Gross
Expense
Ratio1 |
| Class A Shares | Maximum 5.5% Initial Sales Charge | With sales charges | 9/1/2006 | -27.08% | -2.42% | 2.17% | 1.21% |
| | | Excluding sales charges | | -22.84 | -1.31 | 2.75 | 1.21 |
| Investor Class Shares2 | Maximum 5% Initial Sales Charge | With sales charges | 4/29/2008 | -26.91 | -2.66 | 1.97 | 1.59 |
| | | Excluding sales charges | | -23.07 | -1.55 | 2.55 | 1.59 |
| Class C Shares | Maximum 1% CDSC | With sales charges | 9/1/2006 | -24.42 | -2.34 | 1.76 | 2.34 |
| | if Redeemed Within One Year of Purchase | Excluding sales charges | | -23.66 | -2.34 | 1.76 | 2.34 |
| Class I Shares | No Sales Charge | | 12/31/1997 | -22.63 | -1.06 | 3.03 | 0.96 |
| Class R1 Shares | No Sales Charge | | 9/1/2006 | -22.73 | -1.16 | 2.92 | 1.06 |
| Class R2 Shares | No Sales Charge | | 9/1/2006 | -22.89 | -1.40 | 2.66 | 1.31 |
| Class R3 Shares | No Sales Charge | | 9/1/2006 | -23.13 | -1.66 | 2.39 | 1.56 |
| SIMPLE Class Shares | No Sales Charge | | 8/31/2020 | -23.26 | N/A | -5.51 | 1.84 |
| 1. | The gross expense ratios presented reflect the Fund’s “Total Annual Fund Operating Expenses” from the most recent Prospectus, as supplemented, and may differ from other expense ratios disclosed in this report. |
| 2. | Prior to June 30, 2020, the maximum initial sales charge was 5.5%, which is reflected in the applicable average annual total return figures shown. |
The footnotes on the next page are an integral part of the table and graph and should be carefully read in conjunction with them.
| Benchmark Performance* | One
Year | Five
Years | Ten
Years |
| MSCI EAFE® Index (Net)1 | -23.00% | -0.09% | 4.13% |
| Morningstar Foreign Large Blend Category Average2 | -24.05 | -0.71 | 3.44 |
| * | Returns for indices reflect no deductions for fees, expenses or taxes, except for foreign withholding taxes where applicable. Results assume reinvestment of all dividends and capital gains. An investment cannot be made directly in an index. |
| 1. | The MSCI EAFE® Index (Net) is the Fund's primary broad-based securities market index for comparison purposes. The MSCI EAFE® Index (Net) consists of international stocks representing the developed world outside of North America. |
| 2. | The Morningstar Foreign Large Blend Category Average is representative of funds that invest in a variety of big international stocks. Most of these portfolios divide their assets among a dozen or more developed markets, including Japan, Britain, France, and Germany. These portfolios primarily invest in stocks that have market caps in the top 70% of each economically integrated market (such as Europe or Asia ex-Japan). The blend style is assigned to portfolios where neither growth nor value characteristics predominate. These portfolios typically will have less than 20% of assets invested in U.S. stocks. Results are based on average total returns of similar funds with all dividends and capital gain distributions reinvested. |
The footnotes on the preceding page are an integral part of the table and graph and should be carefully read in conjunction with them.
| 6 | MainStay Epoch International Choice Fund |
Cost in Dollars of a $1,000 Investment in MainStay Epoch International Choice Fund (Unaudited)
The example below is intended to describe the fees and expenses borne by shareholders during the six-month period from May 1, 2022 to October 31, 2022, and the impact of those costs on your investment.
Example
As a shareholder of the Fund you incur two types of costs: (1) transaction costs, including exchange fees and sales charges (loads) on purchases (as applicable), and (2) ongoing costs, including management fees, distribution and/or service (12b-1) fees and other Fund expenses (as applicable). This example is intended to help you understand your ongoing costs (in dollars) of investing in the Fund and to compare these costs with the ongoing costs of investing in other mutual funds. The example is based on an investment of $1,000 made at the beginning of the six-month period and held for the entire period from May 1, 2022 to October 31, 2022.
This example illustrates your Fund’s ongoing costs in two ways:
Actual Expenses
The second and third data columns in the table below provide information about actual account values and actual expenses. You may use the information in these columns, together with the amount you invested, to estimate the expenses that you paid during the six months ended October 31, 2022. Simply divide your account value by $1,000 (for example, an
$8,600 account value divided by $1,000 = 8.6), then multiply the result by the number under the heading entitled “Expenses Paid During Period” to estimate the expenses you paid on your account during this period.
Hypothetical Example for Comparison Purposes
The fourth and fifth data columns in the table below provide information about hypothetical account values and hypothetical expenses based on the Fund’s actual expense ratio and an assumed rate of return of 5% per year before expenses, which is not the Fund’s actual return. The hypothetical account values and expenses may not be used to estimate the actual ending account balances or expenses you paid for the six-month period shown. You may use this information to compare the ongoing costs of investing in the Fund with the ongoing costs of investing in other mutual funds. To do so, compare this 5% hypothetical example with the 5% hypothetical examples that appear in the shareholder reports of the other mutual funds.
Please note that the expenses shown in the table are meant to highlight your ongoing costs only and do not reflect any transactional costs, such as exchange fees or sales charges (loads). Therefore, the fourth and fifth data columns of the table are useful in comparing ongoing costs only and will not help you determine the relative total costs of owning different funds. In addition, if these transactional costs were included, your costs would have been higher.
| Share Class | Beginning
Account
Value
5/1/22 | Ending Account
Value (Based
on Actual
Returns and
Expenses)
10/31/22 | Expenses
Paid
During
Period1 | Ending Account
Value (Based
on Hypothetical
5% Annualized
Return and
Actual Expenses)
10/31/22 | Expenses
Paid
During
Period1 | Net Expense
Ratio
During
Period2 |
| Class A Shares | $1,000.00 | $916.80 | $ 6.04 | $1,018.90 | $ 6.36 | 1.25% |
| Investor Class Shares | $1,000.00 | $915.20 | $ 7.48 | $1,017.39 | $ 7.88 | 1.55% |
| Class C Shares | $1,000.00 | $911.70 | $11.08 | $1,013.61 | $11.67 | 2.30% |
| Class I Shares | $1,000.00 | $918.20 | $ 4.59 | $1,020.42 | $ 4.84 | 0.95% |
| Class R1 Shares | $1,000.00 | $917.70 | $ 5.08 | $1,019.91 | $ 5.35 | 1.05% |
| Class R2 Shares | $1,000.00 | $916.50 | $ 6.28 | $1,018.65 | $ 6.61 | 1.30% |
| Class R3 Shares | $1,000.00 | $914.80 | $ 7.77 | $1,017.09 | $ 8.19 | 1.61% |
| SIMPLE Class Shares | $1,000.00 | $914.30 | $ 8.69 | $1,016.13 | $ 9.15 | 1.80% |
| 1. | Expenses are equal to the Fund’s annualized expense ratio of each class multiplied by the average account value over the period, divided by 365 and multiplied by 184 (to reflect the six-month period). The table above represents the actual expenses incurred during the six-month period. In addition to the fees and expenses which the Fund bears directly, it also indirectly bears a pro rata share of the fees and expenses of the underlying funds in which it invests. Such indirect expenses are not included in the above-reported expense figures. |
| 2. | Expenses are equal to the Fund's annualized expense ratio to reflect the six-month period. |
Country Composition as of October 31, 2022 (Unaudited)
| United Kingdom | 26.4% |
| France | 21.9 |
| United States | 17.9 |
| Japan | 12.6 |
| Germany | 5.5 |
| Spain | 4.9 |
| Netherlands | 3.6 |
| Finland | 2.9% |
| Republic of Korea | 2.7 |
| Singapore | 1.9 |
| Taiwan | 1.2 |
| Other Assets, Less Liabilities | –1.5 |
| | 100.0% |
See Portfolio of Investments beginning on page 11 for specific holdings within these categories. The Fund's holdings are subject to change.
Top Ten Holdings and/or Issuers Held as of October 31, 2022 (excluding short-term investments) (Unaudited)
| 1. | Deutsche Telekom AG (Registered) |
| 2. | TotalEnergies SE |
| 3. | Coca-Cola Europacific Partners plc |
| 4. | Linde plc |
| 5. | Rentokil Initial plc |
| 6. | Compass Group plc |
| 7. | Roche Holding AG |
| 8. | Sony Group Corp. |
| 9. | Unilever plc |
| 10. | AXA SA |
| 8 | MainStay Epoch International Choice Fund |
Portfolio Management Discussion and Analysis (Unaudited)
Questions answered by portfolio managers Michael A. Welhoelter, CFA, William J. Booth, CFA, and Glen Petraglia, CFA, of Epoch Investment Partners, Inc., the Fund’s Subadvisor.
How did MainStay Epoch International Choice Fund perform relative to its benchmark and peer group during the 12 months ended October 31, 2022?
For the 12 months ended October 31, 2022, Class I shares of MainStay Epoch International Choice Fund returned −22.63%, outperforming the −23.00% return of the Fund’s benchmark, the MSCI EAFE® Index (Net) (the “Index”). Over the same period, Class I shares also outperformed the −24.05% return of the Morningstar Foreign Large Blend Category Average.1
What factors affected the Fund’s relative performance during the reporting period?
Equity markets fell into bear market territory as investors responded to increasingly hawkish central banks, rising inflation, supply chain challenges and Russia's invasion of Ukraine. Bond yields surged, with the 10-year German bund yield moving above zero for the first time since the start of the pandemic. Energy and other commodity prices rose due to constrained supplies of Russian oil, gas and agricultural products. The energy sector had the largest gains by far – with all other sectors posting double-digit negative returns. Information technology, consumer discretionary and real estate experienced the largest declines during the reporting period. The U.S. dollar strengthened versus all other currencies, as the euro slumped to parity, the Bank of Japan intervened in currency markets to prop up the yen after it hit a 24-year low, and the British pound fell to its weakest level since 1985.
In this challenging environment, the Fund slightly outperformed the Index due to stock selection, driven by the strong relative performance of holdings in the information technology, consumer discretionary, communication services and financials sectors. Stock selection by country also enhanced relative performance, as did the Fund’s currency positions. Conversely, sector allocations had a slightly negative effect on relative returns, primarily due to the Fund’s overweight exposure to information technology; however, the positive impact of stock selection in the sector completely offset the negative allocation effect.
During the reporting period, which sectors and/or countries were the strongest positive contributors to the Fund’s relative performance and which sectors and/or countries were particularly weak?
The sectors making the strongest positive contributions to the Fund’s performance relative to the Index included consumer discretionary, communication services, industrials, and financials. (Contributions take weightings and total returns into account.) Conversely, the health care sector detracted most significantly from the Fund’s relative returns. At the country level, holdings in France, Germany and Sweden bolstered relative returns the most,
while holdings in Japan, Australia and the UK were the most significant detractors.
During the reporting period, which individual stocks made the strongest positive contributions to the Fund’s absolute performance and which stocks detracted the most?
The Fund’s top contributors to absolute performance included shares in France-based integrated oil & gas company TotalEnergies, France-based benefits and payments solutions provider Edenred, and Germany-based telecommunications services provider Deutsche Telekom.
TotalEnergies was a positive contributor during the reporting period. We believe TotalEnergies offers a balanced energy transition strategy featuring a good compromise between reducing its carbon footprint and delivering cash flow growth, while maintaining leverage to commodity upside. The company is committed to providing a stable and well-covered dividend, with further benefits to shareholders through share buybacks, which started in 2021.
Edenred shares rose as the company delivered on multiple avenues of growth. The penetration rate of their employee benefit solutions offered further opportunities in the small- and mid-size enterprise market. The company’s complimentary solutions offerings, while small, showed signs of growth, with Edenred looking to build scale – both organically and through the disciplined acquisition of smaller companies in the same line of business.
Deutsche Telekom (DT) also contributed positively to performance. We view DT as both a U.S. growth story (through the company’s 48.3% strategic ownership of T-Mobile USA) and as an inexpensive way to participate in Europe's communication services industry. The company is one of Europe's largest telecom services, providing a well-covered and growing dividend.
During the same period, the most significant detractors from the Fund’s absolute performance were Japan-based electronics and entertainment company Sony Group and Netherlands-based semiconductor equipment maker ASML Holdings.
Sony shares were relatively weak during the reporting period. Sony reported better than expected earnings earlier in the reporting period, but lowered operating profit guidance given the weak performance of its Games & Network Services division and costs associated with the earlier-than-expected closing of the Bungie gaming acquisition. Despite a challenging backdrop, with rapidly changing industry dynamics impacting its businesses, we believe Sony is well-positioned to navigate these macro and industry challenges, and should continue to deliver robust free cash flows during the next few years.
| 1. | See page 5 for other share class returns, which may be higher or lower than Class I share returns. See page 6 for more information on benchmark and peer group returns. |
ASML designs and manufactures the lithography machines that are an essential component in semiconductor chip manufacturing. Shares were pressured by concerns of a downturn in semiconductor equipment capital expenditures. The Fund continues to hold ASML given its leading position as the only manufacturer of the extreme ultraviolet equipment necessary for production of the most advanced semiconductors. We believe ASML’s technology provides the company with a near-insurmountable competitive advantage, thereby protecting its high margins, free cash flow, and future growth outlook.
What were some of the Fund’s largest purchases and sales during the reporting period?
The Fund’s largest purchases during the reporting period included shares in Switzerland-based pharmaceutical company Roche, UK-based Lloyds Banking Group and France-based aerospace contractor Airbus.
During the reporting period, the Fund initiated a position in Roche, which offers a best-in-class oncology portfolio, attractive diagnostics business, and a longstanding track record of research and development productivity. The threat to some of the company’s key drugs from biosimilar competitors has begun to recede. At the same time, Roche's base business continues to deliver strong free-cash-flows, and new, high-margin products are starting to make a larger financial impact on the company’s bottom line.
The Fund increased its exposure to financials with the addition of Lloyds, the largest mortgage and consumer lender in the UK. Our research indicates that the market underappreciates the company’s cash generating power and return sustainability over time. In our opinion, Lloyds is well positioned to benefit from rising interest rates and the normalization of Bank of England monetary policy.
Airbus represented another new addition to the Fund. One of the world’s largest aerospace & defense companies, Airbus expects to book sales of approximately €60 billion for fiscal year 2022. As travel activity regains its pre-pandemic trajectory, Airbus stands to benefit from the production ramp up of its significant order backlog.
During the same period, the Fund’s most significant sales included positions in France-based drug manufacturer Sanofi, Japan-based investment holding company SoftBank Group and Netherlands-based specialty chemical company Akzo Nobel.
We closed the Fund’s position in Sanofi due to uncertainties regarding future litigation involving the company’s heartburn relief drug Zantac (ranitidine). The share price reaction seemed over-blown given the diversification of Sanofi's extensive product
line-up and the complicated history of Zantac's prior ownership. However, product liability litigation is notoriously difficult to predict and will likely overhang the company’s share price for some time, with bellwether trials in California not set to begin until early 2023.
We also sold the Fund’s position in SoftBank after the company reduced its ownership of Alibaba from 23.7% to 13.7%. Softbank holds major investments in Alibaba, Softbank Corp, T-Mobile, Deutsche Telkom, ARM and the Softbank Vision Funds. Our original investment thesis regarding Softbank was a sum-of-the-parts valuation of the key operating businesses. It now appears that management sold Alibaba at a relatively low price, thus changing the mix of business, that had served as the basis of our original assessment.
Akzo Nobel experienced significant raw material headwinds, cost inflation and supply chain bottlenecks, with the expected impact on profit margins in the future, all of which led us to sell the Fund’s shares. We redeployed the proceeds into more compelling opportunities with better risk/return profiles.
How did the Fund’s sector and/or country weightings change during the reporting period?
The Fund’s largest increases in sector weight during the reporting period were in information technology, consumer staples and energy. Conversely, the Fund reduced exposure to the materials, utilities and consumer discretionary sectors. From a country perspective, the Fund experienced its largest increases in exposure to the UK, Spain and Germany, and its most significant reductions in exposure to the Netherlands, Japan and Italy.
How was the Fund positioned at the end of the reporting period?
As of October 31, 2022, the Fund held its most overweight exposures relative to the Index in the information technology, consumer discretionary and consumer staples sectors. As of the same date, the Fund’s most underweight positions were in the financials, industrials and utilities. On a country basis, the Fund’s most notable overweight position was in France, while its most significant underweight positions were in Japan and Australia.
The opinions expressed are those of the portfolio managers as of the date of this report and are subject to change. There is no guarantee that any forecasts will come to pass. This material does not constitute investment advice and is not intended as an endorsement of any specific investment.
| 10 | MainStay Epoch International Choice Fund |
Portfolio of Investments October 31, 2022†
| | Shares | Value |
| Common Stocks 97.0% |
| Finland 2.9% |
| Nordea Bank Abp (Banks) | 628,757 | $ 6,008,988 |
| France 21.9% |
| Airbus SE (Aerospace & Defense) | 51,905 | 5,620,919 |
| AXA SA (Insurance) | 304,046 | 7,511,837 |
| Edenred (IT Services) | 88,349 | 4,536,674 |
| LVMH Moet Hennessy Louis Vuitton SE (Textiles, Apparel & Luxury Goods) | 8,184 | 5,168,128 |
| Pernod Ricard SA (Beverages) | 25,928 | 4,553,269 |
| Sartorius Stedim Biotech (Life Sciences Tools & Services) | 21,743 | 6,901,791 |
| TotalEnergies SE (Oil, Gas & Consumable Fuels) | 194,989 | 10,617,653 |
| | | 44,910,271 |
| Germany 5.5% |
| Deutsche Telekom AG (Registered) (Diversified Telecommunication Services) | 590,650 | 11,186,216 |
| Japan 12.6% |
| Asahi Group Holdings Ltd. (Beverages) | 164,700 | 4,612,198 |
| Hoya Corp. (Health Care Equipment & Supplies) | 62,400 | 5,822,657 |
| Keyence Corp. (Electronic Equipment, Instruments & Components) | 19,400 | 7,347,981 |
| Sony Group Corp. (Household Durables) | 119,000 | 7,993,356 |
| | | 25,776,192 |
| Netherlands 3.6% |
| ASML Holding NV (Semiconductors & Semiconductor Equipment) | 15,669 | 7,401,777 |
| Republic of Korea 2.7% |
| Samsung Electronics Co. Ltd., GDR (Technology Hardware, Storage & Peripherals) | 5,394 | 5,574,699 |
| Singapore 1.9% |
| STMicroelectronics NV (Semiconductors & Semiconductor Equipment) | 126,781 | 3,959,206 |
| Spain 4.9% |
| Amadeus IT Group SA (IT Services) (a) | 105,032 | 5,474,300 |
| | Shares | Value |
| |
| Spain (continued) |
| Industria de Diseno Textil SA (Specialty Retail) (b) | 202,839 | $ 4,598,452 |
| | | 10,072,752 |
| Taiwan 1.2% |
| Taiwan Semiconductor Manufacturing Co. Ltd., Sponsored ADR (Semiconductors & Semiconductor Equipment) | 38,418 | 2,364,628 |
| United Kingdom 26.4% |
| Coca-Cola Europacific Partners plc (Beverages) | 202,432 | 9,524,426 |
| Compass Group plc (Hotels, Restaurants & Leisure) | 402,123 | 8,469,105 |
| InterContinental Hotels Group plc (Hotels, Restaurants & Leisure) | 75,676 | 4,075,435 |
| Linde plc (Chemicals) | 29,606 | 8,803,344 |
| Lloyds Banking Group plc (Banks) | 14,440,873 | 6,958,845 |
| Rentokil Initial plc (Commercial Services & Supplies) | 1,385,809 | 8,651,854 |
| Unilever plc (Personal Products) | 165,566 | 7,546,426 |
| | | 54,029,435 |
| United States 13.4% |
| CSL Ltd. (Biotechnology) | 17,187 | 3,083,503 |
| Ferguson plc (Trading Companies & Distributors) | 41,914 | 4,571,169 |
| Roche Holding AG (Pharmaceuticals) | 24,250 | 8,053,465 |
| Schneider Electric SE (Electrical Equipment) | 40,465 | 5,129,058 |
| Swiss Re AG (Insurance) | 90,244 | 6,705,102 |
| | | 27,542,297 |
Total Common Stocks
(Cost $216,062,245) | | 198,826,461 |
| Short-Term Investments 4.5% |
| Affiliated Investment Company 2.1% |
| United States 2.1% |
| MainStay U.S. Government Liquidity Fund, 2.905% (c) | 4,246,122 | 4,246,122 |
The notes to the financial statements are an integral part of, and should be read in conjunction with, the financial statements.
11
Portfolio of Investments October 31, 2022† (continued)
| | Shares | | Value |
| Short-Term Investments (continued) |
| Unaffiliated Investment Company 2.4% |
| United States 2.4% |
| Invesco Government & Agency Portfolio, 3.163% (c)(d) | 4,932,828 | | $ 4,932,828 |
Total Short-Term Investments
(Cost $9,178,950) | | | 9,178,950 |
Total Investments
(Cost $225,241,195) | 101.5% | | 208,005,411 |
| Other Assets, Less Liabilities | (1.5) | | (3,094,457) |
| Net Assets | 100.0% | | $ 204,910,954 |
| † | Percentages indicated are based on Fund net assets. |
| (a) | Non-income producing security. |
| (b) | All or a portion of this security was held on loan. As of October 31, 2022, the aggregate market value of securities on loan was $4,560,615. The Fund received cash collateral with a value of $4,932,828. (See Note 2(H)) |
| (c) | Current yield as of October 31, 2022. |
| (d) | Represents a security purchased with cash collateral received for securities on loan. |
Investments in Affiliates (in 000's)
Investments in issuers considered to be affiliate(s) of the Fund during the year ended October 31, 2022 for purposes of Section 2(a)(3) of the Investment Company Act of 1940, as amended, were as follows:
| Affiliated Investment Companies | Value,
Beginning
of Year | Purchases
at Cost | Proceeds
from
Sales | Net
Realized
Gain/(Loss)
on Sales | Change in
Unrealized
Appreciation/
(Depreciation) | Value,
End of
Year | Dividend
Income | Other
Distributions | Shares
End of
Year |
| MainStay U.S. Government Liquidity Fund | $ 6,568 | $ 55,285 | $ (57,607) | $ — | $ — | $ 4,246 | $ 46 | $ — | 4,246 |
| Abbreviation(s): |
| ADR—American Depositary Receipt |
| GDR—Global Depositary Receipt |
The notes to the financial statements are an integral part of, and should be read in conjunction with, the financial statements.
| 12 | MainStay Epoch International Choice Fund |
The following is a summary of the fair valuations according to the inputs used as of October 31, 2022, for valuing the Fund’s assets:
| Description | Quoted
Prices in
Active
Markets for
Identical
Assets
(Level 1) | | Significant
Other
Observable
Inputs
(Level 2) | | Significant
Unobservable
Inputs
(Level 3) | | Total |
| Asset Valuation Inputs | | | | | | | |
| Investments in Securities (a) | | | | | | | |
| Common Stocks | $ 198,826,461 | | $ — | | $ — | | $ 198,826,461 |
| Short-Term Investments | | | | | | | |
| Affiliated Investment Company | 4,246,122 | | — | | — | | 4,246,122 |
| Unaffiliated Investment Company | 4,932,828 | | — | | — | | 4,932,828 |
| Total Short-Term Investments | 9,178,950 | | — | | — | | 9,178,950 |
| Total Investments in Securities | $ 208,005,411 | | $ — | | $ — | | $ 208,005,411 |
| (a) | For a complete listing of investments and their industries, see the Portfolio of Investments. |
The notes to the financial statements are an integral part of, and should be read in conjunction with, the financial statements.
13
Portfolio of Investments October 31, 2022† (continued)
The table below sets forth the diversification of the Fund’s investments by industry.
Industry Diversification
| | Value | | Percent |
| Aerospace & Defense | $ 5,620,919 | | 2.7% |
| Banks | 12,967,833 | | 6.3 |
| Beverages | 18,689,893 | | 9.2 |
| Biotechnology | 3,083,503 | | 1.5 |
| Chemicals | 8,803,344 | | 4.3 |
| Commercial Services & Supplies | 8,651,854 | | 4.2 |
| Diversified Telecommunication Services | 11,186,216 | | 5.5 |
| Electrical Equipment | 5,129,058 | | 2.5 |
| Electronic Equipment, Instruments & Components | 7,347,981 | | 3.6 |
| Health Care Equipment & Supplies | 5,822,657 | | 2.8 |
| Hotels, Restaurants & Leisure | 12,544,540 | | 6.1 |
| Household Durables | 7,993,356 | | 3.9 |
| Insurance | 14,216,939 | | 7.0 |
| IT Services | 10,010,974 | | 4.9 |
| Life Sciences Tools & Services | 6,901,791 | | 3.4 |
| Oil, Gas & Consumable Fuels | 10,617,653 | | 5.2 |
| Personal Products | 7,546,426 | | 3.7 |
| Pharmaceuticals | 8,053,465 | | 3.9 |
| Semiconductors & Semiconductor Equipment | 13,725,611 | | 6.7 |
| Specialty Retail | 4,598,452 | | 2.2 |
| Technology Hardware, Storage & Peripherals | 5,574,699 | | 2.7 |
| Textiles, Apparel & Luxury Goods | 5,168,128 | | 2.5 |
| Trading Companies & Distributors | 4,571,169 | | 2.2 |
| | 198,826,461 | | 97.0 |
| Short-Term Investments | 9,178,950 | | 4.5 |
| Other Assets, Less Liabilities | (3,094,457) | | (1.5) |
| Net Assets | $204,910,954 | | 100.0% |
| † | Percentages indicated are based on Fund net assets. |
The notes to the financial statements are an integral part of, and should be read in conjunction with, the financial statements.
| 14 | MainStay Epoch International Choice Fund |
Statement of Assets and Liabilities as of October 31, 2022
| Assets |
Investment in unaffiliated securities, at value
(identified cost $220,995,073) including securities on loan of $4,560,615 | $203,759,289 |
Investment in affiliated investment companies, at value
(identified cost $4,246,122) | 4,246,122 |
| Cash | 42 |
Cash denominated in foreign currencies
(identified cost $163,505) | 162,142 |
| Receivables: | |
| Dividends | 3,229,805 |
| Investment securities sold | 2,162,021 |
| Fund shares sold | 15,871 |
| Securities lending | 327 |
| Other assets | 37,866 |
| Total assets | 213,613,485 |
| Liabilities |
| Cash collateral received for securities on loan | 4,932,828 |
| Payables: | |
| Investment securities purchased | 3,320,018 |
| Fund shares redeemed | 242,521 |
| Manager (See Note 3) | 117,891 |
| Transfer agent (See Note 3) | 28,227 |
| Shareholder communication | 20,596 |
| Professional fees | 11,764 |
| Custodian | 10,921 |
| NYLIFE Distributors (See Note 3) | 8,055 |
| Trustees | 69 |
| Accrued expenses | 9,641 |
| Total liabilities | 8,702,531 |
| Net assets | $204,910,954 |
| Composition of Net Assets |
| Shares of beneficial interest outstanding (par value of $.001 per share) unlimited number of shares authorized | $ 6,549 |
| Additional paid-in-capital | 298,135,696 |
| | 298,142,245 |
| Total distributable earnings (loss) | (93,231,291) |
| Net assets | $204,910,954 |
| Class A | |
| Net assets applicable to outstanding shares | $ 19,444,507 |
| Shares of beneficial interest outstanding | 621,724 |
| Net asset value per share outstanding | $ 31.28 |
| Maximum sales charge (5.50% of offering price) | 1.82 |
| Maximum offering price per share outstanding | $ 33.10 |
| Investor Class | |
| Net assets applicable to outstanding shares | $ 3,795,142 |
| Shares of beneficial interest outstanding | 121,641 |
| Net asset value per share outstanding | $ 31.20 |
| Maximum sales charge (5.00% of offering price) | 1.64 |
| Maximum offering price per share outstanding | $ 32.84 |
| Class C | |
| Net assets applicable to outstanding shares | $ 338,907 |
| Shares of beneficial interest outstanding | 11,055 |
| Net asset value and offering price per share outstanding | $ 30.66 |
| Class I | |
| Net assets applicable to outstanding shares | $173,142,260 |
| Shares of beneficial interest outstanding | 5,531,937 |
| Net asset value and offering price per share outstanding | $ 31.30 |
| Class R1 | |
| Net assets applicable to outstanding shares | $ 32,421 |
| Shares of beneficial interest outstanding | 1,039 |
| Net asset value and offering price per share outstanding | $ 31.20 |
| Class R2 | |
| Net assets applicable to outstanding shares | $ 5,656,825 |
| Shares of beneficial interest outstanding | 180,934 |
| Net asset value and offering price per share outstanding | $ 31.26 |
| Class R3 | |
| Net assets applicable to outstanding shares | $ 2,472,862 |
| Shares of beneficial interest outstanding | 79,666 |
| Net asset value and offering price per share outstanding | $ 31.04 |
| SIMPLE Class | |
| Net assets applicable to outstanding shares | $ 28,030 |
| Shares of beneficial interest outstanding | 900 |
| Net asset value and offering price per share outstanding(a) | $ 31.16 |
| (a) | The difference between the calculated and stated NAV was caused by rounding. |
The notes to the financial statements are an integral part of, and should be read in conjunction with, the financial statements.
15
Statement of Operations for the year ended October 31, 2022
| Investment Income (Loss) |
| Income | |
| Dividends-unaffiliated (net of foreign tax withholding of $755,983) | $ 5,291,432 |
| Dividends-affiliated | 46,427 |
| Securities lending, net | 30,757 |
| Total income | 5,368,616 |
| Expenses | |
| Manager (See Note 3) | 1,938,171 |
| Transfer agent (See Note 3) | 170,044 |
| Distribution/Service—Class A (See Note 3) | 56,865 |
| Distribution/Service—Investor Class (See Note 3) | 11,239 |
| Distribution/Service—Class C (See Note 3) | 7,566 |
| Distribution/Service—Class R2 (See Note 3) | 17,966 |
| Distribution/Service—Class R3 (See Note 3) | 16,784 |
| Distribution/Service—SIMPLE Class (See Note 3) | 151 |
| Professional fees | 107,774 |
| Registration | 91,598 |
| Custodian | 39,289 |
| Shareholder communication | 22,617 |
| Shareholder service (See Note 3) | 10,630 |
| Trustees | 4,494 |
| Miscellaneous | 23,577 |
| Total expenses before waiver/reimbursement | 2,518,765 |
| Expense waiver/reimbursement from Manager (See Note 3) | (70,951) |
| Net expenses | 2,447,814 |
| Net investment income (loss) | 2,920,802 |
| Realized and Unrealized Gain (Loss) |
| Net realized gain (loss) on: | |
| Unaffiliated investment transactions | 959,471 |
| Payments from affiliates (See Note 3) | 148,000 |
| Foreign currency transactions | (85,433) |
| Net realized gain (loss) | 1,022,038 |
| Net change in unrealized appreciation (depreciation) on: | |
| Unaffiliated investments | (65,380,042) |
| Translation of other assets and liabilities in foreign currencies | (305,531) |
| Net change in unrealized appreciation (depreciation) | (65,685,573) |
| Net realized and unrealized gain (loss) | (64,663,535) |
| Net increase (decrease) in net assets resulting from operations | $(61,742,733) |
The notes to the financial statements are an integral part of, and should be read in conjunction with, the financial statements.
| 16 | MainStay Epoch International Choice Fund |
Statements of Changes in Net Assets
for the years ended October 31, 2022 and October 31, 2021
| | 2022 | 2021 |
| Increase (Decrease) in Net Assets |
| Operations: | | |
| Net investment income (loss) | $ 2,920,802 | $ 2,971,564 |
| Net realized gain (loss) | 1,022,038 | 46,948,818 |
| Net change in unrealized appreciation (depreciation) | (65,685,573) | 19,130,791 |
| Net increase (decrease) in net assets resulting from operations | (61,742,733) | 69,051,173 |
| Distributions to shareholders: | | |
| Class A | (609,561) | (107,083) |
| Investor Class | (106,243) | (14,596) |
| Class C | (4,372) | — |
| Class I | (6,137,693) | (2,007,419) |
| Class R1 | (3,987) | (1,681) |
| Class R2 | (192,553) | (33,206) |
| Class R3 | (78,119) | (7,839) |
| SIMPLE Class | (630) | — |
| Total distributions to shareholders | (7,133,158) | (2,171,824) |
| Capital share transactions: | | |
| Net proceeds from sales of shares | 16,723,170 | 15,067,092 |
| Net asset value of shares issued to shareholders in reinvestment of distributions | 7,075,921 | 2,142,671 |
| Cost of shares redeemed | (37,319,851) | (92,410,629) |
| Increase (decrease) in net assets derived from capital share transactions | (13,520,760) | (75,200,866) |
| Net increase (decrease) in net assets | (82,396,651) | (8,321,517) |
| Net Assets |
| Beginning of year | 287,307,605 | 295,629,122 |
| End of year | $204,910,954 | $287,307,605 |
The notes to the financial statements are an integral part of, and should be read in conjunction with, the financial statements.
17
Financial Highlights selected per share data and ratios
| | Year Ended October 31, |
| Class A | 2022 | | 2021 | | 2020 | | 2019 | | 2018 |
| Net asset value at beginning of year | $ 41.50 | | $ 33.68 | | $ 35.57 | | $ 33.37 | | $ 36.20 |
| Net investment income (loss) (a) | 0.35 | | 0.34 | | 0.17 | | 0.74 | | 0.50 |
| Net realized and unrealized gain (loss) | (9.61) | | 7.66 | | (1.14) | | 1.96 | | (2.94) |
| Total from investment operations | (9.26) | | 8.00 | | (0.97) | | 2.70 | | (2.44) |
| Less distributions: | | | | | | | | | |
| From net investment income | (0.96) | | (0.18) | | (0.92) | | (0.50) | | (0.39) |
| Net asset value at end of year | $ 31.28 | | $ 41.50 | | $ 33.68 | | $ 35.57 | | $ 33.37 |
| Total investment return (b) | (22.84)%(c) | | 23.80% | | (2.87)% | | 8.30% | | (6.82)% |
| Ratios (to average net assets)/Supplemental Data: | | | | | | | | | |
| Net investment income (loss) | 0.97% | | 0.83% | | 0.48% | | 2.19% | | 1.40% |
| Net expenses (d) | 1.23% | | 1.21% | | 1.20%(e) | | 1.19%(e) | | 1.18%(e) |
| Portfolio turnover rate | 49% | | 43% | | 52% | | 47% | | 44% |
| Net assets at end of year (in 000’s) | $ 19,445 | | $ 26,613 | | $ 20,108 | | $ 23,114 | | $ 23,409 |
| (a) | Per share data based on average shares outstanding during the year. |
| (b) | Total investment return is calculated exclusive of sales charges and assumes the reinvestment of dividends and distributions. For periods of less than one year, total return is not annualized. |
| (c) | In 2022, the Fund’s total investment return includes impact of payments from affiliates due to a trade communications error. Excluding these items, total return would have been (22.89)%. |
| (d) | In addition to the fees and expenses which the Fund bears directly, it also indirectly bears a pro-rata share of the fees and expenses of the underlying funds in which it invests. Such indirect expenses are not included in the above expense ratios. |
| (e) | Net of interest expense of less than 0.01%. |
| | Year Ended October 31, |
| Investor Class | 2022 | | 2021 | | 2020 | | 2019 | | 2018 |
| Net asset value at beginning of year | $ 41.39 | | $ 33.60 | | $ 35.49 | | $ 33.30 | | $ 36.13 |
| Net investment income (loss) (a) | 0.24 | | 0.20 | | 0.08 | | 0.66 | | 0.45 |
| Net realized and unrealized gain (loss) | (9.60) | | 7.68 | | (1.13) | | 1.95 | | (2.96) |
| Total from investment operations | (9.36) | | 7.88 | | (1.05) | | 2.61 | | (2.51) |
| Less distributions: | | | | | | | | | |
| From net investment income | (0.83) | | (0.09) | | (0.84) | | (0.42) | | (0.32) |
| Net asset value at end of year | $ 31.20 | | $ 41.39 | | $ 33.60 | | $ 35.49 | | $ 33.30 |
| Total investment return (b) | (23.07)%(c) | | 23.48% | | (3.10)% | | 8.02% | | (7.00)% |
| Ratios (to average net assets)/Supplemental Data: | | | | | | | | | |
| Net investment income (loss) | 0.67% | | 0.50% | | 0.23% | | 1.97% | | 1.27% |
| Net expenses (d) | 1.52% | | 1.50% | | 1.46%(e) | | 1.41%(e) | | 1.38%(e) |
| Expenses (before waiver/reimbursement) (d) | 1.63% | | 1.59% | | 1.46%(e) | | 1.42%(e) | | 1.38%(e) |
| Portfolio turnover rate | 49% | | 43% | | 52% | | 47% | | 44% |
| Net assets at end of year (in 000's) | $ 3,795 | | $ 5,341 | | $ 5,308 | | $ 6,306 | | $ 5,901 |
| (a) | Per share data based on average shares outstanding during the year. |
| (b) | Total investment return is calculated exclusive of sales charges and assumes the reinvestment of dividends and distributions. For periods of less than one year, total return is not annualized. |
| (c) | In 2022, the Fund’s total investment return includes impact of payments from affiliates due to a trade communications error. Excluding these items, total return would have been (23.12)%. |
| (d) | In addition to the fees and expenses which the Fund bears directly, it also indirectly bears a pro-rata share of the fees and expenses of the underlying funds in which it invests. Such indirect expenses are not included in the above expense ratios. |
| (e) | Net of interest expense of less than 0.01%. |
The notes to the financial statements are an integral part of, and should be read in conjunction with, the financial statements.
| 18 | MainStay Epoch International Choice Fund |
Financial Highlights selected per share data and ratios
| | Year Ended October 31, |
| Class C | 2022 | | 2021 | | 2020 | | 2019 | | 2018 |
| Net asset value at beginning of year | $ 40.33 | | $ 32.90 | | $ 34.73 | | $ 32.54 | | $ 35.41 |
| Net investment income (loss) (a) | (0.01) | | (0.28) | | (0.17) | | 0.42 | | 0.19 |
| Net realized and unrealized gain (loss) | (9.49) | | 7.71 | | (1.13) | | 1.92 | | (3.00) |
| Total from investment operations | (9.50) | | 7.43 | | (1.30) | | 2.34 | | (2.81) |
| Less distributions: | | | | | | | | | |
| From net investment income | (0.17) | | — | | (0.53) | | (0.15) | | (0.06) |
| Net asset value at end of year | $ 30.66 | | $ 40.33 | | $ 32.90 | | $ 34.73 | | $ 32.54 |
| Total investment return (b) | (23.66)%(c) | | 22.55% | | (3.81)% | | 7.25% | | (7.96)% |
| Ratios (to average net assets)/Supplemental Data: | | | | | | | | | |
| Net investment income (loss) | (0.02)% | | (0.71)% | | (0.51)% | | 1.27% | | 0.53% |
| Net expenses (d) | 2.27% | | 2.25% | | 2.21%(e) | | 2.16%(e) | | 2.13%(e) |
| Expenses (before waiver/reimbursement) (d) | 2.38% | | 2.28% | | 2.21%(e) | | 2.17%(e) | | 2.13%(e) |
| Portfolio turnover rate | 49% | | 43% | | 52% | | 47% | | 44% |
| Net assets at end of year (in 000’s) | $ 339 | | $ 1,081 | | $ 4,740 | | $ 6,416 | | $ 9,354 |
| (a) | Per share data based on average shares outstanding during the year. |
| (b) | Total investment return is calculated exclusive of sales charges and assumes the reinvestment of dividends and distributions. For periods of less than one year, total return is not annualized. |
| (c) | In 2022, the Fund’s total investment return includes impact of payments from affiliates due to a trade communications error. Excluding these items, total return would have been (23.71)%. |
| (d) | In addition to the fees and expenses which the Fund bears directly, it also indirectly bears a pro-rata share of the fees and expenses of the underlying funds in which it invests. Such indirect expenses are not included in the above expense ratios. |
| (e) | Net of interest expense of less than 0.01%. |
| | Year Ended October 31, |
| Class I | 2022 | | 2021 | | 2020 | | 2019 | | 2018 |
| Net asset value at beginning of year | $ 41.52 | | $ 33.69 | | $ 35.58 | | $ 33.40 | | $ 36.25 |
| Net investment income (loss) (a) | 0.45 | | 0.40 | | 0.26 | | 0.80 | | 0.60 |
| Net realized and unrealized gain (loss) | (9.61) | | 7.70 | | (1.14) | | 1.98 | | (2.96) |
| Total from investment operations | (9.16) | | 8.10 | | (0.88) | | 2.78 | | (2.36) |
| Less distributions: | | | | | | | | | |
| From net investment income | (1.06) | | (0.27) | | (1.01) | | (0.60) | | (0.49) |
| Net asset value at end of year | $ 31.30 | | $ 41.52 | | $ 33.69 | | $ 35.58 | | $ 33.40 |
| Total investment return (b) | (22.63)%(c) | | 24.11% | | (2.61)% | | 8.57% | | (6.62)% |
| Ratios (to average net assets)/Supplemental Data: | | | | | | | | | |
| Net investment income (loss) | 1.27% | | 0.99% | | 0.76% | | 2.40% | | 1.67% |
| Net expenses (d) | 0.95% | | 0.95% | | 0.95%(e) | | 0.94%(e) | | 0.93%(e) |
| Expenses (before waiver/reimbursement) (d) | 0.98% | | 0.96% | | 0.96%(e) | | 0.94%(e) | | 0.93%(e) |
| Portfolio turnover rate | 49% | | 43% | | 52% | | 47% | | 44% |
| Net assets at end of year (in 000’s) | $ 173,142 | | $ 241,084 | | $ 252,974 | | $ 355,348 | | $ 479,523 |
| (a) | Per share data based on average shares outstanding during the year. |
| (b) | Total investment return is calculated exclusive of sales charges and assumes the reinvestment of dividends and distributions. Class I shares are not subject to sales charges. For periods of less than one year, total return is not annualized. |
| (c) | In 2022, the Fund’s total investment return includes impact of payments from affiliates due to a trade communications error. Excluding these items, total return would have been (22.68)%. |
| (d) | In addition to the fees and expenses which the Fund bears directly, it also indirectly bears a pro-rata share of the fees and expenses of the underlying funds in which it invests. Such indirect expenses are not included in the above expense ratios. |
| (e) | Net of interest expense of less than 0.01%. |
The notes to the financial statements are an integral part of, and should be read in conjunction with, the financial statements.
19
Financial Highlights selected per share data and ratios
| | Year Ended October 31, |
| Class R1 | 2022 | | 2021 | | 2020 | | 2019 | | 2018 |
| Net asset value at beginning of year | $ 41.39 | | $ 33.60 | | $ 35.48 | | $ 33.30 | | $ 36.18 |
| Net investment income (loss) (a) | 0.48 | | 0.36 | | 0.21 | | 0.81 | | 0.64 |
| Net realized and unrealized gain (loss) | (9.67) | | 7.68 | | (1.12) | | 1.93 | | (3.04) |
| Total from investment operations | (9.19) | | 8.04 | | (0.91) | | 2.74 | | (2.40) |
| Less distributions: | | | | | | | | | |
| From net investment income | (1.00) | | (0.25) | | (0.97) | | (0.56) | | (0.48) |
| Net asset value at end of year | $ 31.20 | | $ 41.39 | | $ 33.60 | | $ 35.48 | | $ 33.30 |
| Total investment return (b) | (22.73)%(c) | | 24.00% | | (2.69)% | | 8.45% | | (6.72)% |
| Ratios (to average net assets)/Supplemental Data: | | | | | | | | | |
| Net investment income (loss) | 1.29% | | 0.88% | | 0.63% | | 2.43% | | 1.79% |
| Net expenses (d) | 1.05% | | 1.05% | | 1.05%(e) | | 1.04%(e) | | 1.03%(e) |
| Expenses (before waiver/reimbursement) (d) | 1.08% | | 1.06% | | 1.06%(e) | | 1.04%(e) | | 1.03%(e) |
| Portfolio turnover rate | 49% | | 43% | | 52% | | 47% | | 44% |
| Net assets at end of year (in 000’s) | $ 32 | | $ 164 | | $ 201 | | $ 230 | | $ 229 |
| (a) | Per share data based on average shares outstanding during the year. |
| (b) | Total investment return is calculated exclusive of sales charges and assumes the reinvestment of dividends and distributions. Class R1 shares are not subject to sales charges. For periods of less than one year, total return is not annualized. |
| (c) | In 2022, the Fund’s total investment return includes impact of payments from affiliates due to a trade communications error. Excluding these items, total return would have been (22.78)%. |
| (d) | In addition to the fees and expenses which the Fund bears directly, it also indirectly bears a pro-rata share of the fees and expenses of the underlying funds in which it invests. Such indirect expenses are not included in the above expense ratios. |
| (e) | Net of interest expense of less than 0.01%. |
| | Year Ended October 31, |
| Class R2 | 2022 | | 2021 | | 2020 | | 2019 | | 2018 |
| Net asset value at beginning of year | $ 41.47 | | $ 33.65 | | $ 35.54 | | $ 33.33 | | $ 36.16 |
| Net investment income (loss) (a) | 0.33 | | 0.27 | | 0.13 | | 0.71 | | 0.48 |
| Net realized and unrealized gain (loss) | (9.63) | | 7.69 | | (1.14) | | 1.96 | | (2.96) |
| Total from investment operations | (9.30) | | 7.96 | | (1.01) | | 2.67 | | (2.48) |
| Less distributions: | | | | | | | | | |
| From net investment income | (0.91) | | (0.14) | | (0.88) | | (0.46) | | (0.35) |
| Net asset value at end of year | $ 31.26 | | $ 41.47 | | $ 33.65 | | $ 35.54 | | $ 33.33 |
| Total investment return (b) | (22.89)%(c) | | 23.69% | | (2.94)% | | 8.17% | | (6.92)% |
| Ratios (to average net assets)/Supplemental Data: | | | | | | | | | |
| Net investment income (loss) | 0.93% | | 0.67% | | 0.39% | | 2.12% | | 1.33% |
| Net expenses (d) | 1.30% | | 1.30% | | 1.30%(e) | | 1.29%(e) | | 1.28%(e) |
| Expenses (before waiver/reimbursement) (d) | 1.33% | | 1.31% | | 1.31%(e) | | 1.29%(e) | | 1.28%(e) |
| Portfolio turnover rate | 49% | | 43% | | 52% | | 47% | | 44% |
| Net assets at end of year (in 000’s) | $ 5,657 | | $ 8,886 | | $ 7,827 | | $ 10,884 | | $ 14,656 |
| (a) | Per share data based on average shares outstanding during the year. |
| (b) | Total investment return is calculated exclusive of sales charges and assumes the reinvestment of dividends and distributions. Class R2 shares are not subject to sales charges. For periods of less than one year, total return is not annualized. |
| (c) | In 2022, the Fund’s total investment return includes impact of payments from affiliates due to a trade communications error. Excluding these items, total return would have been (22.94)%. |
| (d) | In addition to the fees and expenses which the Fund bears directly, it also indirectly bears a pro-rata share of the fees and expenses of the underlying funds in which it invests. Such indirect expenses are not included in the above expense ratios. |
| (e) | Net of interest expense of less than 0.01%. |
The notes to the financial statements are an integral part of, and should be read in conjunction with, the financial statements.
| 20 | MainStay Epoch International Choice Fund |
Financial Highlights selected per share data and ratios
| | Year Ended October 31, |
| Class R3 | 2022 | | 2021 | | 2020 | | 2019 | | 2018 |
| Net asset value at beginning of year | $ 41.18 | | $ 33.43 | | $ 35.31 | | $ 33.10 | | $ 35.90 |
| Net investment income (loss) (a) | 0.24 | | 0.17 | | 0.04 | | 0.62 | | 0.40 |
| Net realized and unrealized gain (loss) | (9.58) | | 7.64 | | (1.13) | | 1.95 | | (2.95) |
| Total from investment operations | (9.34) | | 7.81 | | (1.09) | | 2.57 | | (2.55) |
| Less distributions: | | | | | | | | | |
| From net investment income | (0.80) | | (0.06) | | (0.79) | | (0.36) | | (0.25) |
| Net asset value at end of year | $ 31.04 | | $ 41.18 | | $ 33.43 | | $ 35.31 | | $ 33.10 |
| Total investment return (b) | (23.13)%(c) | | 23.37% | | (3.21)% | | 7.90% | | (7.15)% |
| Ratios (to average net assets)/Supplemental Data: | | | | | | | | | |
| Net investment income (loss) | 0.67% | | 0.41% | | 0.12% | | 1.85% | | 1.13% |
| Net expenses (d) | 1.58% | | 1.55% | | 1.55%(e) | | 1.54%(e) | | 1.53%(e) |
| Portfolio turnover rate | 49% | | 43% | | 52% | | 47% | | 44% |
| Net assets at end of year (in 000’s) | $ 2,473 | | $ 4,104 | | $ 4,447 | | $ 5,134 | | $ 5,609 |
| (a) | Per share data based on average shares outstanding during the year. |
| (b) | Total investment return is calculated exclusive of sales charges and assumes the reinvestment of dividends and distributions. Class R3 shares are not subject to sales charges. For periods of less than one year, total return is not annualized. |
| (c) | In 2022, the Fund’s total investment return includes impact of payments from affiliates due to a trade communications error. Excluding these items, total return would have been (23.18)%. |
| (d) | In addition to the fees and expenses which the Fund bears directly, it also indirectly bears a pro-rata share of the fees and expenses of the underlying funds in which it invests. Such indirect expenses are not included in the above expense ratios. |
| (e) | Net of interest expense of less than 0.01%. |
| | Year Ended October 31, | | August 31, 2020^ through
October 31, |
| SIMPLE Class | 2022 | | 2021 | | 2020 |
| Net asset value at beginning of period | $ 41.39 | | $ 33.59 | | $ 35.90* |
| Net investment income (loss) (a) | 0.14 | | 0.11 | | (0.02) |
| Net realized and unrealized gain (loss) | (9.60) | | 7.69 | | (2.29) |
| Total from investment operations | (9.46) | | 7.80 | | (2.31) |
| Less distributions: | | | | | |
| From net investment income | (0.77) | | — | | — |
| Net asset value at end of period | $ 31.16 | | $ 41.39 | | $ 33.59 |
| Total investment return (b) | (23.26)%(c) | | 23.19% | | (6.43)% |
| Ratios (to average net assets)/Supplemental Data: | | | | | |
| Net investment income (loss) | 0.40% | | 0.27% | | (0.29)% |
| Net expenses (d) | 1.77% | | 1.74% | | 1.69%(e) |
| Expenses (before waiver/reimbursement) (d) | 1.88% | | 1.86% | | 1.69%(e) |
| Portfolio turnover rate | 49% | | 43% | | 52% |
| Net assets at end of period (in 000’s) | $ 28 | | $ 34 | | $ 23 |
| ^ | Inception date. |
| * | Based on the net asset value of Investor Class as of August 31, 2020. |
| (a) | Per share data based on average shares outstanding during the period. |
| (b) | Total investment return is calculated exclusive of sales charges and assumes the reinvestment of dividends and distributions. SIMPLE Class shares are not subject to sales charges. For periods of less than one year, total return is not annualized. |
| (c) | In 2022, the Fund’s total investment return includes impact of payments from affiliates due to a trade communications error. Excluding these items, total return would have been (23.31)%. |
| (d) | In addition to the fees and expenses which the Fund bears directly, it also indirectly bears a pro-rata share of the fees and expenses of the underlying funds in which it invests. Such indirect expenses are not included in the above expense ratios. |
| (e) | Net of interest expense of less than 0.01%. |
The notes to the financial statements are an integral part of, and should be read in conjunction with, the financial statements.
21
Notes to Financial Statements
Note 1-Organization and Business
MainStay Funds Trust (the “Trust”) was organized as a Delaware statutory trust on April 28, 2009. The Trust is registered under the Investment Company Act of 1940, as amended (the “1940 Act”), as an open-end management investment company, and is comprised of thirty-three funds (collectively referred to as the “Funds”). These financial statements and notes relate to the MainStay Epoch International Choice Fund (the "Fund"), a “diversified” fund, as that term is defined in the 1940 Act, as interpreted or modified by regulatory authorities having jurisdiction, from time to time.
The following table lists the Fund's share classes that have been registered and commenced operations:
| Class | Commenced Operations |
| Class A | September 1, 2006 |
| Investor Class | April 29, 2008 |
| Class C | September 1, 2006 |
| Class I | December 31, 1997 |
| Class R1 | September 1, 2006 |
| Class R2 | September 1, 2006 |
| Class R3 | September 1, 2006 |
| SIMPLE Class | August 31, 2020 |
| Class R6 | N/A* |
| * | Class R6 shares were registered for sale effective as of February 28, 2017 but have not yet commenced operations. |
Class A and Investor Class shares are offered at net asset value (“NAV”) per share plus an initial sales charge. No initial sales charge applies to investments of $1 million or more (and certain other qualified purchases) in Class A and Investor Class shares. However, a contingent deferred sales charge (“CDSC”) of 1.00% may be imposed on certain redemptions made within 18 months of the date of purchase on shares that were purchased without an initial sales charge. Class C shares are offered at NAV without an initial sales charge, although a 1.00% CDSC may be imposed on certain redemptions of such shares made within one year of the date of purchase of Class C shares. Class I, Class R1, Class R2, Class R3 and SIMPLE Class shares are offered at NAV without a sales charge. Class R6 shares are expected to be offered at NAV without a sales charge if such shares are offered in the future. In addition, depending upon eligibility, Class C shares convert to either Class A or Investor Class shares at the end of the calendar quarter eight years after the date they were purchased. Additionally, Investor Class shares may convert automatically to Class A shares. SIMPLE Class shares convert to Class A shares, or Investor Class shares if you are not eligible to hold Class A shares, at the end of the calendar quarter, ten years after the date they were purchased. Share class conversions are based on the relevant NAVs of the two classes at the time of the conversion, and no sales load or other charge is imposed. Under certain circumstances and as may be permitted by the Trust’s multiple class plan pursuant to Rule 18f-3 under the 1940 Act, specified share classes of the Fund may be converted to one or more other share classes of the Fund as disclosed in the capital
share transactions within these Notes. The classes of shares have the same voting (except for issues that relate solely to one class), dividend, liquidation and other rights, and the same terms and conditions, except that under distribution plans pursuant to Rule 12b-1 under the 1940 Act, Class C shares are subject to higher distribution and/or service fees than Class A, Investor Class, Class R2, Class R3 and SIMPLE Class shares. Class I, Class R1 and Class R6 shares are not subject to a distribution and/or service fee. Class R1, Class R2 and Class R3 shares are subject to a shareholder service fee, which is in addition to fees paid under the distribution plans for Class R2 and Class R3 shares.
The Fund's investment objective is to seek total return.
Note 2–Significant Accounting Policies
The Fund is an investment company and accordingly follows the investment company accounting and reporting guidance of the Financial Accounting Standards Board (“FASB”) Accounting Standards Codification Topic 946 Financial Services—Investment Companies. The Fund prepares its financial statements in accordance with generally accepted accounting principles (“GAAP”) in the United States of America and follows the significant accounting policies described below.
(A) Securities Valuation. Investments are usually valued as of the close of regular trading on the New York Stock Exchange (the "Exchange") (usually 4:00 p.m. Eastern time) on each day the Fund is open for business ("valuation date").
Effective September 8, 2022, and pursuant to Rule 2a-5 under the 1940 Act, the Board of Trustees of the Trust (the "Board") designated New York Life Investment Management LLC (“New York Life Investments” or the "Manager") as its Valuation Designee (the "Valuation Designee"). The Valuation Designee is responsible for performing fair valuations relating to all investments in the Fund’s portfolio for which market quotations are not readily available; periodically assessing and managing material valuation risks; establishing and applying fair value methodologies; testing fair valuation methodologies; evaluating and overseeing pricing services; segregation of valuation and portfolio management functions; providing quarterly, annual and prompt reporting to the Board, as appropriate; identifying potential conflicts of interest; and maintaining appropriate records. The Valuation Designee has established a valuation committee ("Valuation Committee") to assist in carrying out the Valuation Designee’s responsibilities and establish prices of securities for which market quotations are not readily available. The Fund’s and the Valuation Designee's policies and procedures ("Valuation Procedures") govern the Valuation Designee’s selection and application of methodologies for determining and calculating the fair value of Fund investments. The Valuation Designee may value Fund portfolio securities for which market quotations are not readily available and other Fund assets utilizing inputs from pricing services and other third-party sources (together, “Pricing Sources”). The Valuation Committee meets (in person, via electronic mail or via teleconference) on an ad-hoc basis to determine fair valuations and on a quarterly basis to review fair value events (excluding fair valuations
| 22 | MainStay Epoch International Choice Fund |
from pricing services), including valuation risks and back-testing results, and preview reports to the Board.
The Valuation Committee establishes prices of securities for which market quotations are not readily available based on such methodologies and measurements on a regular basis after considering information that is reasonably available and deemed relevant by the Valuation Committee. The Board shall oversee the Valuation Designee and review fair valuation materials on a prompt, quarterly and annual basis and approve proposed revisions to the Valuation Procedures.
Investments for which market quotations are not readily available are valued at fair value as determined in good faith pursuant to the Valuation Procedures. A market quotation is readily available only when that quotation is a quoted price (unadjusted) in active markets for identical investments that the Fund can access at the measurement date, provided that a quotation will not be readily available if it is not reliable. Fair value measurements are determined within a framework that establishes a three-tier hierarchy that maximizes the use of observable market data and minimizes the use of unobservable inputs to establish a classification of fair value measurements for disclosure purposes. "Inputs" refer broadly to the assumptions that market participants would use in pricing the asset or liability, including assumptions about risk, such as the risk inherent in a particular valuation technique used to measure fair value using a pricing model and/or the risk inherent in the inputs for the valuation technique. Inputs may be observable or unobservable. Observable inputs reflect the assumptions market participants would use in pricing the asset or liability based on market data obtained from sources independent of the Fund. Unobservable inputs reflect the Fund’s own assumptions about the assumptions market participants would use in pricing the asset or liability based on the information available. The inputs or methodology used for valuing assets or liabilities may not be an indication of the risks associated with investing in those assets or liabilities. The three-tier hierarchy of inputs is summarized below.
| • | Level 1—quoted prices (unadjusted) in active markets for an identical asset or liability |
| • | Level 2—other significant observable inputs (including quoted prices for a similar asset or liability in active markets, interest rates and yield curves, prepayment speeds, credit risk, etc.) |
| • | Level 3—significant unobservable inputs (including the Fund's own assumptions about the assumptions that market participants would use in measuring fair value of an asset or liability) |
The level of an asset or liability within the fair value hierarchy is based on the lowest level of an input, both individually and in the aggregate, that is significant to the fair value measurement. The aggregate value by input level of the Fund’s assets and liabilities as of October 31, 2022, is included at the end of the Portfolio of Investments.
The Fund may use third-party vendor evaluations, whose prices may be derived from one or more of the following standard inputs, among others:
| • Broker/dealer quotes | • Benchmark securities |
| • Two-sided markets | • Reference data (corporate actions or material event notices) |
| • Bids/offers | • Monthly payment information |
| • Industry and economic events | • Reported trades |
An asset or liability for which a market quotation is not readily available is valued by methods deemed reasonable in good faith by the Valuation Committee, following the Valuation Procedures to represent fair value. Under these procedures, the Valuation Designee generally uses a market-based approach which may use related or comparable assets or liabilities, recent transactions, market multiples, book values and other relevant information. The Valuation Designee may also use an income-based valuation approach in which the anticipated future cash flows of the asset or liability are discounted to calculate fair value. Discounts may also be applied due to the nature and/or duration of any restrictions on the disposition of the asset or liability. Fair value represents a good faith approximation of the value of a security. Fair value determinations involve the consideration of a number of subjective factors, an analysis of applicable facts and circumstances and the exercise of judgment. As a result, it is possible that the fair value for a security determined in good faith in accordance with the Valuation Procedures may differ from valuations for the same security determined for other funds using their own valuation procedures. Although the Valuation Procedures are designed to value a security at the price the Fund may reasonably expect to receive upon the security's sale in an orderly transaction, there can be no assurance that any fair value determination thereunder would, in fact, approximate the amount that the Fund would actually realize upon the sale of the security or the price at which the security would trade if a reliable market price were readily available. During the year ended October 31, 2022, there were no material changes to the fair value methodologies.
Securities which may be valued in this manner include, but are not limited to: (i) a security for which trading has been halted or suspended or otherwise does not have a readily available market quotation on a given day; (ii) a debt security that has recently gone into default and for which there is not a current market quotation; (iii) a security of an issuer that has entered into a restructuring; (iv) a security that has been delisted from a national exchange; (v) a security subject to trading collars for which no or limited trading takes place; and (vi) a security whose principal market has been temporarily closed at a time when, under normal conditions, it would be open. Securities valued in this manner are generally categorized as Level 2 or 3 in the hierarchy.
Certain securities held by the Fund may principally trade in foreign markets. Events may occur between the time the foreign markets close and the time at which the Fund's NAVs are calculated. These events may include, but are not limited to, situations relating to a single issuer in a market sector, significant fluctuations in U.S. or foreign markets, natural disasters, armed conflicts, governmental actions or other developments
Notes to Financial Statements (continued)
not tied directly to the securities markets. Should the Valuation Designee conclude that such events may have affected the accuracy of the last price of such securities reported on the local foreign market, the Valuation Designee may, pursuant to the Valuation Procedures, adjust the value of the local price to reflect the estimated impact on the price of such securities as a result of such events. In this instance, securities are generally categorized as Level 3 in the hierarchy. Additionally, certain foreign equity securities are also fair valued whenever the movement of a particular index exceeds certain thresholds. In such cases, the securities are fair valued by applying factors provided by a third-party vendor in accordance with the Valuation Procedures and are generally categorized as Level 2 in the hierarchy. No foreign equity securities held by the Fund as of October 31, 2022 were fair valued in such a manner.
If the principal market of certain foreign equity securities is closed in observance of a local foreign holiday, these securities are valued using the last closing price of regular trading on the relevant exchange and fair valued by applying factors provided by a third-party vendor in accordance with the Valuation Procedures. These securities are generally categorized as Level 2 in the hierarchy. No securities held by the Fund as of October 31, 2022, were fair valued in such a manner.
Equity securities are valued at the last quoted sales prices as of the close of regular trading on the relevant exchange on each valuation date. Securities that are not traded on the valuation date are valued at the mean of the last quoted bid and ask prices. Prices are normally taken from the principal market in which each security trades. These securities are generally categorized as Level 1 in the hierarchy.
Investments in mutual funds, including money market funds, are valued at their respective NAVs at the close of business each day on the valuation date. These securities are generally categorized as Level 1 in the hierarchy.
Temporary cash investments acquired in excess of 60 days to maturity at the time of purchase are valued using the latest bid prices or using valuations based on a matrix system (which considers such factors as security prices, yields, maturities and ratings), both as furnished by independent pricing services. Temporary cash investments that mature in 60 days or less at the time of purchase ("Short-Term Investments") are valued using the amortized cost method of valuation, unless the use of such method would be inappropriate. The amortized cost method involves valuing a security at its cost on the date of purchase and thereafter assuming a constant amortization to maturity of the difference between such cost and the value on maturity date. Amortized cost approximates the current fair value of a security. Securities valued using the amortized cost method are not valued using quoted prices in an active market and are generally categorized as Level 2 in the hierarchy.
The information above is not intended to reflect an exhaustive list of the methodologies that may be used to value portfolio investments. The Valuation Procedures permit the use of a variety of valuation methodologies in connection with valuing portfolio investments. The methodology used for a specific type of investment may vary based on the market data available or other considerations. The methodologies
summarized above may not represent the specific means by which portfolio investments are valued on any particular business day.
(B) Income Taxes. The Fund's policy is to comply with the requirements of the Internal Revenue Code of 1986, as amended (the “Internal Revenue Code”), applicable to regulated investment companies and to distribute all of its taxable income to the shareholders of the Fund within the allowable time limits.
The Manager evaluates the Fund’s tax positions to determine if the tax positions taken meet the minimum recognition threshold in connection with accounting for uncertainties in income tax positions taken or expected to be taken for the purposes of measuring and recognizing tax liabilities in the financial statements. Recognition of tax benefits of an uncertain tax position is permitted only to the extent the position is “more likely than not” to be sustained assuming examination by taxing authorities. The Manager analyzed the Fund's tax positions taken on federal, state and local income tax returns for all open tax years (for up to three tax years) and has concluded that no provisions for federal, state and local income tax are required in the Fund's financial statements. The Fund's federal, state and local income tax and federal excise tax returns for tax years for which the applicable statutes of limitations have not expired are subject to examination by the Internal Revenue Service and state and local departments of revenue.
(C) Foreign Taxes. The Fund may be subject to foreign taxes on income and other transaction-based taxes imposed by certain countries in which it invests. A portion of the taxes on gains on investments or currency purchases/repatriation may be reclaimable. The Fund will accrue such taxes and reclaims as applicable, based upon its current interpretation of tax rules and regulations that exist in the markets in which it invests.
The Fund may be subject to taxation on realized capital gains, repatriation proceeds and other transaction-based taxes imposed by certain countries in which it invests. The Fund will accrue such taxes as applicable based upon its current interpretation of tax rules and regulations that exist in the market in which it invests. Capital gains taxes relating to positions still held are reflected as a liability in the Statement of Assets and Liabilities, as well as an adjustment to the Fund's net unrealized appreciation (depreciation). Taxes related to capital gains realized, if any, are reflected as part of net realized gain (loss) in the Statement of Operations. Changes in tax liabilities related to capital gains taxes on unrealized investment gains, if any, are reflected as part of the change in net unrealized appreciation (depreciation) on investments in the Statement of Operations. Transaction-based charges are generally assessed as a percentage of the transaction amount.
(D) Dividends and Distributions to Shareholders. Dividends and distributions are recorded on the ex-dividend date. The Fund intends to declare and pay dividends from net investment income and distributions from net realized capital and currency gains, if any, at least annually. Unless a shareholder elects otherwise, all dividends and distributions are reinvested at NAV in the same class of shares of the Fund. Dividends and
| 24 | MainStay Epoch International Choice Fund |
distributions to shareholders are determined in accordance with federal income tax regulations and may differ from determinations using GAAP.
(E) Security Transactions and Investment Income. The Fund records security transactions on the trade date. Realized gains and losses on security transactions are determined using the identified cost method. Dividend income is recognized on the ex-dividend date, net of any foreign tax withheld at the source, and interest income is accrued as earned using the effective interest rate method. Distributions received from real estate investment trusts may be classified as dividends, capital gains and/or return of capital. Discounts and premiums on securities purchased for the Fund are accreted and amortized, respectively, on the effective interest rate method over the life of the respective securities.
Investment income and realized and unrealized gains and losses on investments of the Fund are allocated pro rata to the separate classes of shares based upon their relative net assets on the date the income is earned or realized and unrealized gains and losses are incurred.
(F) Expenses. Expenses of the Trust are allocated to the individual Funds in proportion to the net assets of the respective Funds when the expenses are incurred, except where direct allocations of expenses can be made. Expenses (other than transfer agent expenses and fees incurred under the shareholder services plans and/or the distribution plans further discussed in Note 3(B)) are allocated to separate classes of shares pro rata based upon their relative net assets on the date the expenses are incurred. The expenses borne by the Fund, including those of related parties to the Fund, are shown in the Statement of Operations.
Additionally, the Fund may invest in mutual funds, which are subject to management fees and other fees that may cause the costs of investing in mutual funds to be greater than the costs of owning the underlying securities directly. These indirect expenses of mutual funds are not included in the amounts shown as expenses in the Statement of Operations or in the expense ratios included in the Financial Highlights.
(G) Use of Estimates. In preparing financial statements in conformity with GAAP, the Manager makes estimates and assumptions that affect the reported amounts and disclosures in the financial statements. Actual results could differ from those estimates and assumptions.
(H) Securities Lending. In order to realize additional income, the Fund may engage in securities lending, subject to the limitations set forth in the 1940 Act and relevant guidance by the staff of the Securities and Exchange Commission (“SEC”). If the Fund engages in securities lending, the Fund will lend through its custodian, JPMorgan Chase Bank, N.A., ("JPMorgan"), acting as securities lending agent on behalf of the Fund. Under the current arrangement, JPMorgan will manage the Fund's collateral in accordance with the securities lending agency agreement between the Fund and JPMorgan, and indemnify the Fund against counterparty risk. The loans will be collateralized by cash (which may be invested in a money market fund) and/or non-cash collateral (which may include U.S. Treasury securities and/or U.S. government agency securities issued or guaranteed by the United States government or its agencies or instrumentalities) at least equal at all times to the market value of the
securities loaned. Non-cash collateral held at year end is segregated and cannot be transferred by the Fund. The Fund bears the risk of delay in recovery of, or loss of rights in, the securities loaned. The Fund may also record a realized gain or loss on securities deemed sold due to a borrower’s inability to return securities on loan. The Fund bears the risk of any loss on investment of cash collateral. The Fund will receive compensation for lending its securities in the form of fees or it will retain a portion of interest earned on the investment of any cash collateral. The Fund will also continue to receive interest and dividends on the securities loaned and any gain or loss in the market price of the securities loaned that may occur during the term of the loan will be for the account of the Fund. Income earned from securities lending activities, if any, is reflected in the Statement of Operations. Securities on loan as of October 31, 2022, are shown in the Portfolio of Investments.
(I) Foreign Securities Risk. The Fund invests in foreign securities, which carry certain risks that are in addition to the usual risks inherent in domestic securities. These risks include those resulting from currency fluctuations, future adverse political or economic developments and possible imposition of currency exchange blockages or other foreign governmental laws or restrictions. These risks are likely to be greater in emerging markets than in developed markets. The ability of issuers of debt securities held by the Fund to meet their obligations may be affected by, among other things, economic or political developments in a specific country, industry or region.
(J) Indemnifications. Under the Trust’s organizational documents, its officers and trustees are indemnified against certain liabilities that may arise out of performance of their duties to the Trust. Additionally, in the normal course of business, the Fund enters into contracts with third-party service providers that contain a variety of representations and warranties and that may provide general indemnifications. The Fund's maximum exposure under these arrangements is unknown, as this would involve future claims that may be made against the Fund that have not yet occurred. The Manager believes that the risk of loss in connection with these potential indemnification obligations is remote. However, there can be no assurance that material liabilities related to such obligations will not arise in the future, which could adversely impact the Fund.
Note 3–Fees and Related Party Transactions
(A) Manager and Subadvisor. New York Life Investments, a registered investment adviser and an indirect, wholly-owned subsidiary of New York Life Insurance Company ("New York Life"), serves as the Fund's Manager, pursuant to an Amended and Restated Management Agreement (“Management Agreement”). The Manager provides offices, conducts clerical, recordkeeping and bookkeeping services and keeps most of the financial and accounting records required to be maintained by the Fund. Except for the portion of salaries and expenses that are the responsibility of the Fund, the Manager pays the salaries and expenses of all personnel affiliated with the Fund and certain operational expenses of the Fund. During a portion of the year ended October 31, 2022, the Fund reimbursed New York Life Investments in an amount equal to the portion
Notes to Financial Statements (continued)
of the compensation of the Chief Compliance Officer attributable to the Fund. Epoch Investment Partners, Inc. (“Epoch” or the “Subadvisor”), a registered investment adviser, serves as the Subadvisor to the Fund and is responsible for the day-to-day portfolio management of the Fund. Pursuant to the terms of an Amended and Restated Subadvisory Agreement (“Subadvisory Agreement”) between New York Life Investments and Epoch, New York Life Investments pays for the services of the Subadvisor.
Pursuant to the Management Agreement, the Fund pays the Manager a monthly fee for the services performed and the facilities furnished at an annual rate of the Fund’s average daily net assets as follows: 0.80% up to $5 billion; 0.775% from $5 billion to $7.5 billion; and 0.75% in excess of $7.5 billion. During the year ended October 31, 2022, the effective management fee rate was 0.80% of the Fund’s average daily net assets, exclusive of any applicable waivers/reimbursements.
New York Life Investments has contractually agreed to waive fees and/or reimburse expenses so that Total Annual Fund Operating Expenses (excluding taxes, interest, litigation, extraordinary expenses, brokerage and other transaction expenses relating to the purchase or sale of portfolio investments and acquired (underlying) fund fees and expenses) do not exceed the following percentages of average daily net assets: Class I, 0.95%. This agreement will remain in effect until February 28, 2023, and shall renew automatically for one-year terms unless New York Life Investments provides written notice of termination prior to the start of the next term or upon approval of the Board.
Additionally, New York Life Investments has agreed to further voluntarily waive fees and/or reimburse expenses of the appropriate class of the Fund so that Total Annual Fund Operating Expenses (excluding taxes, interest, litigation, extraordinary expenses, brokerage and other transaction expenses relating to the purchase and sale of portfolio investments, and acquired (underlying) fund fees and expenses) do not exceed the following percentages of average daily net assets: Class R1, 1.05%; and Class R2, 1.30%. This voluntary waiver or reimbursement may be discontinued at any time without notice.
During the year ended October 31, 2022, New York Life Investments earned fees from the Fund in the amount of $1,938,171 and waived fees and/or reimbursed expenses, including the waiver/reimbursement of certain class specific expenses in the amount of $70,951 and paid the Subadvisor fees in the amount of $936,441.
JPMorgan provides sub-administration and sub-accounting services to the Fund pursuant to an agreement with New York Life Investments. These services include calculating the daily NAVs of the Fund, maintaining the general ledger and sub-ledger accounts for the calculation of the Fund's NAVs, and assisting New York Life Investments in conducting various aspects of the Fund's administrative operations. For providing these services to the Fund, JPMorgan is compensated by New York Life Investments.
During the year ended October 31, 2022, the New York Life Investments reimbursed the Fund $148,000 for trading losses incurred due to a trade communications error.
Pursuant to an agreement between the Trust and New York Life Investments, New York Life Investments is responsible for providing or procuring certain regulatory reporting services for the Fund. The Fund will reimburse New York Life Investments for the actual costs incurred by New York Life Investments in connection with providing or procuring these services for the Fund.
(B) Distribution and Service Fees. The Trust, on behalf of the Fund, has entered into a distribution agreement with NYLIFE Distributors LLC (the “Distributor”), an affiliate of New York Life Investments. The Fund has adopted distribution plans (the “Plans”) in accordance with the provisions of Rule 12b-1 under the 1940 Act.
Pursuant to the Class A, Investor Class and Class R2 Plans, the Distributor receives a monthly fee from the Class A, Investor Class and Class R2 shares at an annual rate of 0.25% of the average daily net assets of the Class A, Investor Class and Class R2 shares for distribution and/or service activities as designated by the Distributor. Pursuant to the Class C Plan, Class C shares pay the Distributor a monthly distribution fee at an annual rate of 0.75% of the average daily net assets of the Class C shares, along with a service fee at an annual rate of 0.25% of the average daily net assets of the Class C shares, for a total 12b-1 fee of 1.00%. Pursuant to the Class R3 and SIMPLE Class Plan, Class R3 and SIMPLE Class shares pay the Distributor a monthly distribution fee at an annual rate of 0.25% of the average daily net assets of the Class R3 and SIMPLE Class shares, along with a service fee at an annual rate of 0.25% of the average daily net assets of the Class R3 and SIMPLE Class shares, for a total 12b-1 fee of 0.50%. Class I and Class R1 shares are not subject to a distribution and/or service fee.
The Plans provide that the distribution and service fees are payable to the Distributor regardless of the amounts actually expended by the Distributor for distribution of the Fund's shares and service activities.
In accordance with the Shareholder Services Plans for the Class R1, Class R2 and Class R3 shares, the Manager has agreed to provide, through its affiliates or independent third parties, various shareholder and administrative support services to shareholders of the Class R1, Class R2 and Class R3 shares. For its services, the Manager, its affiliates or independent third-party service providers are entitled to a shareholder service fee accrued daily and paid monthly at an annual rate of 0.10% of the average daily net assets of the Class R1, Class R2 and Class R3 shares. This is in addition to any fees paid under the Class R2 and Class R3 Plans.
| 26 | MainStay Epoch International Choice Fund |
During the year ended October 31, 2022, shareholder service fees incurred by the Fund were as follows:
| |
| Class R1 | $ 87 |
| Class R2 | 7,186 |
| Class R3 | 3,357 |
(C) Sales Charges. The Fund was advised by the Distributor that the amount of initial sales charges retained on sales of Class A and Investor Class shares during the year ended October 31, 2022, were $793 and $1,216, respectively.
The Fund was also advised that the Distributor retained CDSCs on redemptions of Class C shares during the year ended October 31, 2022, of $8.
(D) Transfer, Dividend Disbursing and Shareholder Servicing Agent. NYLIM Service Company LLC, an affiliate of New York Life Investments, is the Fund's transfer, dividend disbursing and shareholder servicing agent pursuant to an agreement between NYLIM Service Company LLC and the Trust. NYLIM Service Company LLC has entered into an agreement with DST Asset Manager Solutions, Inc. ("DST"), pursuant to which DST performs certain transfer agent services on behalf of NYLIM Service Company LLC. New York Life Investments has contractually agreed to limit the transfer agency expenses charged to the Fund’s share classes to a maximum of 0.35% of that share class’s average daily net assets on an annual basis after deducting any applicable Fund or class-level expense reimbursement or small account fees. This agreement will remain in effect until February 28, 2023, and shall renew automatically for one-year terms unless New York Life Investments provides written notice of termination prior to the start of the next term or upon approval of the Board. During the year ended October 31, 2022, transfer agent expenses incurred by the Fund and any reimbursements, pursuant to the aforementioned Transfer Agency expense limitation agreement, were as follows:
| Class | Expense | Waived |
| Class A | $ 13,998 | $ — |
| Investor Class | 20,591 | (4,785) |
| Class C | 3,501 | (845) |
| Class I | 125,275 | — |
| Class R1 | 53 | — |
| Class R2 | 4,422 | — |
| Class R3 | 2,067 | — |
| SIMPLE Class | 137 | (31) |
(E) Small Account Fee. Shareholders with small accounts adversely impact the cost of providing transfer agency services. In an effort to reduce total transfer agency expenses, the Fund has implemented a small account fee on certain types of accounts. As described in the Fund's prospectus, certain shareholders with an account balance of less than $1,000 ($5,000 for Class A share accounts) are charged an annual per
account fee of $20 (assessed semi-annually), the proceeds from which offset transfer agent fees as reflected in the Statement of Operations. This small account fee will not apply to certain types of accounts as described further in the Fund’s prospectus.
(F) Capital. As of October 31, 2022, New York Life and its affiliates beneficially held shares of the Fund with the values and percentages of net assets as follows:
Note 4-Federal Income Tax
As of October 31, 2022, the cost and unrealized appreciation (depreciation) of the Fund’s investment portfolio, including applicable derivative contracts and other financial instruments, as determined on a federal income tax basis, were as follows:
| | Federal Tax
Cost | Gross
Unrealized
Appreciation | Gross
Unrealized
(Depreciation) | Net
Unrealized
Appreciation/
(Depreciation) |
| Investments in Securities | $225,302,199 | $12,262,191 | $(29,558,979) | $(17,296,788) |
As of October 31, 2022, the components of accumulated gain (loss) on a tax basis were as follows:
Ordinary
income | Accumulated
Capital
and Other
Gain (Loss) | Other
Temporary
Differences | Unrealized
Appreciation
(Depreciation) | Total
Accumulated
Gain (Loss) |
| $2,613,449 | $(78,394,309) | $— | $(17,450,431) | $(93,231,291) |
The difference between book-basis and tax-basis unrealized appreciation (depreciation) is primarily due to wash sale adjustments.
As of October 31, 2022, for federal income tax purposes, capital loss carryforwards of $78,394,309, as shown in the table below, were available to the extent provided by the regulations to offset future realized gains of the Fund. Accordingly, no capital gains distributions are expected to be paid to shareholders until net gains have been realized in excess of such amounts.
Capital Loss
Available Through | Short-Term
Capital Loss
Amounts (000’s) | Long-Term
Capital Loss
Amounts (000’s) |
| Unlimited | $76,530 | $1,864 |
The Fund utilized $1,107,026 of capital loss carryforwards during the year ended October 31, 2022.
Notes to Financial Statements (continued)
During the years ended October 31, 2022 and October 31, 2021, the tax character of distributions paid as reflected in the Statements of Changes in Net Assets was as follows:
| | 2022 | 2021 |
| Distributions paid from: | | |
| Ordinary Income | $7,133,158 | $2,171,824 |
Note 5–Custodian
JPMorgan is the custodian of cash and securities held by the Fund. Custodial fees are charged to the Fund based on the Fund's net assets and/or the market value of securities held by the Fund and the number of certain transactions incurred by the Fund.
Note 6–Line of Credit
The Fund and certain other funds managed by New York Life Investments maintain a line of credit with a syndicate of banks in order to secure a source of funds for temporary purposes to meet unanticipated or excessive redemption requests.
Effective July 26, 2022, under the credit agreement (the “Credit Agreement”), the aggregate commitment amount is $600,000,000 with an additional uncommitted amount of $100,000,000. The commitment fee is an annual rate of 0.15% of the average commitment amount payable quarterly, regardless of usage, to JPMorgan, who serves as the agent to the syndicate. The commitment fee is allocated among the Fund and certain other funds managed by New York Life Investments based upon their respective net assets and other factors. Interest on any revolving credit loan is charged based upon the Federal Funds Rate, Daily Simple Secured Overnight Financing Rate ("SOFR") + 0.10%, or the Overnight Bank Funding Rate, whichever is higher. The Credit Agreement expires on July 25, 2023, although the Fund, certain other funds managed by New York Life Investments and the syndicate of banks may renew the Credit Agreement for an additional year on the same or different terms or enter into a credit agreement with a different syndicate of banks. Prior to July 26, 2022, the aggregate commitment amount and the commitment fee were the same as those under the current Credit Agreement. During the year ended October 31, 2022, there were no borrowings made or outstanding with respect to the Fund under the Credit Agreement.
Note 7–Interfund Lending Program
Pursuant to an exemptive order issued by the SEC, the Fund, along with certain other funds managed by New York Life Investments, may participate in an interfund lending program. The interfund lending program provides an alternative credit facility that permits the Fund and certain other funds managed by New York Life Investments to lend or borrow money for temporary purposes directly to or from one another, subject to the conditions of the exemptive order. During the year ended October 31, 2022, there were no interfund loans made or outstanding with respect to the Fund.
Note 8–Purchases and Sales of Securities (in 000’s)
During the year ended October 31, 2022, purchases and sales of securities, other than short-term securities, were $114,497 and $128,436, respectively.
Note 9–Capital Share Transactions
Transactions in capital shares for the years ended October 31, 2022 and October 31, 2021, were as follows:
| Class A | Shares | Amount |
| Year ended October 31, 2022: | | |
| Shares sold | 38,134 | $ 1,358,832 |
| Shares issued to shareholders in reinvestment of distributions | 14,871 | 600,059 |
| Shares redeemed | (74,618) | (2,638,760) |
| Net increase (decrease) in shares outstanding before conversion | (21,613) | (679,869) |
| Shares converted into Class A (See Note 1) | 2,019 | 72,879 |
| Net increase (decrease) | (19,594) | $ (606,990) |
| Year ended October 31, 2021: | | |
| Shares sold | 118,268 | $ 4,756,256 |
| Shares issued to shareholders in reinvestment of distributions | 2,704 | 104,608 |
| Shares redeemed | (99,267) | (4,002,536) |
| Net increase (decrease) in shares outstanding before conversion | 21,705 | 858,328 |
| Shares converted into Class A (See Note 1) | 22,815 | 921,028 |
| Shares converted from Class A (See Note 1) | (267) | (11,431) |
| Net increase (decrease) | 44,253 | $ 1,767,925 |
| |
| 28 | MainStay Epoch International Choice Fund |
| Investor Class | Shares | Amount |
| Year ended October 31, 2022: | | |
| Shares sold | 7,166 | $ 247,942 |
| Shares issued to shareholders in reinvestment of distributions | 2,628 | 106,090 |
| Shares redeemed | (16,541) | (586,739) |
| Net increase (decrease) in shares outstanding before conversion | (6,747) | (232,707) |
| Shares converted into Investor Class (See Note 1) | 964 | 36,562 |
| Shares converted from Investor Class (See Note 1) | (1,616) | (58,562) |
| Net increase (decrease) | (7,399) | $ (254,707) |
| Year ended October 31, 2021: | | |
| Shares sold | 6,666 | $ 270,942 |
| Shares issued to shareholders in reinvestment of distributions | 377 | 14,577 |
| Shares redeemed | (16,054) | (653,856) |
| Net increase (decrease) in shares outstanding before conversion | (9,011) | (368,337) |
| Shares converted into Investor Class (See Note 1) | 2,359 | 95,793 |
| Shares converted from Investor Class (See Note 1) | (22,276) | (898,243) |
| Net increase (decrease) | (28,928) | $ (1,170,787) |
| |
| Class C | Shares | Amount |
| Year ended October 31, 2022: | | |
| Shares sold | 111 | $ 3,989 |
| Shares issued to shareholders in reinvestment of distributions | 109 | 4,352 |
| Shares redeemed | (14,594) | (484,423) |
| Net increase (decrease) in shares outstanding before conversion | (14,374) | (476,082) |
| Shares converted from Class C (See Note 1) | (1,386) | (50,879) |
| Net increase (decrease) | (15,760) | $ (526,961) |
| Year ended October 31, 2021: | | |
| Shares sold | 1,153 | $ 43,419 |
| Shares redeemed | (115,417) | (4,517,395) |
| Net increase (decrease) in shares outstanding before conversion | (114,264) | (4,473,976) |
| Shares converted from Class C (See Note 1) | (2,984) | (118,578) |
| Net increase (decrease) | (117,248) | $ (4,592,554) |
| |
| Class I | Shares | Amount |
| Year ended October 31, 2022: | | |
| Shares sold | 403,328 | $ 13,510,548 |
| Shares issued to shareholders in reinvestment of distributions | 151,372 | 6,097,248 |
| Shares redeemed | (829,534) | (29,840,473) |
| Net increase (decrease) | (274,834) | $(10,232,677) |
| Year ended October 31, 2021: | | |
| Shares sold | 194,281 | $ 7,889,373 |
| Shares issued to shareholders in reinvestment of distributions | 51,337 | 1,982,113 |
| Shares redeemed | (1,948,578) | (78,940,526) |
| Net increase (decrease) in shares outstanding before conversion | (1,702,960) | (69,069,040) |
| Shares converted into Class I (See Note 1) | 267 | 11,431 |
| Net increase (decrease) | (1,702,693) | $(69,057,609) |
| |
| Class R1 | Shares | Amount |
| Year ended October 31, 2022: | | |
| Shares sold | 600 | $ 23,070 |
| Shares issued to shareholders in reinvestment of distributions | 99 | 3,987 |
| Shares redeemed | (3,623) | (131,374) |
| Net increase (decrease) | (2,924) | $ (104,317) |
| Year ended October 31, 2021: | | |
| Shares sold | 1,217 | $ 47,935 |
| Shares issued to shareholders in reinvestment of distributions | 44 | 1,681 |
| Shares redeemed | (3,293) | (137,223) |
| Net increase (decrease) | (2,032) | $ (87,607) |
| |
| Class R2 | Shares | Amount |
| Year ended October 31, 2022: | | |
| Shares sold | 28,186 | $ 1,009,844 |
| Shares issued to shareholders in reinvestment of distributions | 4,626 | 186,691 |
| Shares redeemed | (66,159) | (2,329,954) |
| Net increase (decrease) | (33,347) | $ (1,133,419) |
| Year ended October 31, 2021: | | |
| Shares sold | 33,596 | $ 1,365,655 |
| Shares issued to shareholders in reinvestment of distributions | 826 | 31,942 |
| Shares redeemed | (52,731) | (2,138,343) |
| Net increase (decrease) | (18,309) | $ (740,746) |
| |
Notes to Financial Statements (continued)
| Class R3 | Shares | Amount |
| Year ended October 31, 2022: | | |
| Shares sold | 15,362 | $ 566,824 |
| Shares issued to shareholders in reinvestment of distributions | 1,913 | 76,864 |
| Shares redeemed | (37,287) | (1,308,128) |
| Net increase (decrease) | (20,012) | $ (664,440) |
| Year ended October 31, 2021: | | |
| Shares sold | 17,050 | $ 688,346 |
| Shares issued to shareholders in reinvestment of distributions | 201 | 7,750 |
| Shares redeemed | (50,601) | (2,020,750) |
| Net increase (decrease) | (33,350) | $ (1,324,654) |
| |
| SIMPLE Class | Shares | Amount |
| Year ended October 31, 2022: | | |
| Shares sold | 65 | $ 2,121 |
| Shares issued to shareholders in reinvestment of distributions | 16 | 630 |
| Net increase (decrease) | 81 | $ 2,751 |
| Year ended October 31, 2021: | | |
| Shares sold | 123 | $ 5,166 |
| Net increase (decrease) | 123 | $ 5,166 |
Note 10–Other Matters
As of the date of this report, interest rates in the United States and many parts of the world, including certain European countries, are ascending from historically low levels. Thus, the Fund currently faces a heightened level of risk associated with rising interest rates. This could be driven by a variety of factors, including but not limited to central bank monetary policies, changing inflation or real growth rates, general economic conditions, increasing bond issuances or reduced market demand for low yielding investments.
An outbreak of COVID-19, first detected in December 2019, has developed into a global pandemic and has resulted in travel restrictions, closure of international borders, certain businesses and securities markets, restrictions on securities trading activities, prolonged quarantines, supply chain disruptions, and lower consumer demand, as well as general concern and uncertainty. In 2022, many countries lifted some or all restrictions related to COVID-19. However, the continued impact of COVID-19 and related variants is uncertain and could further adversely affect the global economy, national economies, individual issuers and capital markets in unforeseeable ways and result in a substantial and extended economic downturn. Developments that disrupt global economies and financial markets, such as COVID-19, may magnify factors that affect the Fund's performance.
Note 11–Subsequent Events
In connection with the preparation of the financial statements of the Fund as of and for the year ended October 31, 2022, events and transactions subsequent to October 31, 2022, through the date the financial statements were issued have been evaluated by the Manager for possible adjustment and/or disclosure. No subsequent events requiring financial statement adjustment or disclosure have been identified.
| 30 | MainStay Epoch International Choice Fund |
Report of Independent Registered Public Accounting Firm
To the Shareholders of the Fund and Board of Trustees
MainStay Funds Trust:
Opinion on the Financial Statements
We have audited the accompanying statement of assets and liabilities of MainStay Epoch International Choice Fund (the Fund), one of the funds constituting MainStay Funds Trust, including the portfolio of investments, as of October 31, 2022, the related statement of operations for the year then ended, the statements of changes in net assets for each of the years in the two-year period then ended, and the related notes (collectively, the financial statements) and the financial highlights for each of the years or periods in the five-year period then ended. In our opinion, the financial statements and financial highlights present fairly, in all material respects, the financial position of the Fund as of October 31, 2022, the results of its operations for the year then ended, the changes in its net assets for each of the years in the two-year period then ended, and the financial highlights for each of the years or periods in the five-year period then ended, in conformity with U.S. generally accepted accounting principles.
Basis for Opinion
These financial statements and financial highlights are the responsibility of the Fund's management. Our responsibility is to express an opinion on these financial statements and financial highlights based on our audits. We are a public accounting firm registered with the Public Company Accounting Oversight Board (United States) (PCAOB) and are required to be independent with respect to the Fund in accordance with the U.S. federal securities laws and the applicable rules and regulations of the Securities and Exchange Commission and the PCAOB.
We conducted our audits in accordance with the standards of the PCAOB. Those standards require that we plan and perform the audit to obtain reasonable assurance about whether the financial statements and financial highlights are free of material misstatement, whether due to error or fraud. Our audits included performing procedures to assess the risks of material misstatement of the financial statements and financial highlights, whether due to error or fraud, and performing procedures that respond to those risks. Such procedures included examining, on a test basis, evidence regarding the amounts and disclosures in the financial statements and financial highlights. Such procedures also included confirmation of securities owned as of October 31, 2022, by correspondence with custodians, the transfer agent and brokers; when replies were not received from brokers, we performed other auditing procedures. Our audits also included evaluating the accounting principles used and significant estimates made by management, as well as evaluating the overall presentation of the financial statements and financial highlights. We believe that our audits provide a reasonable basis for our opinion.

We have served as the auditor of one or more New York Life Investment Management investment companies since 2003.
Philadelphia, Pennsylvania
December 23, 2022
Federal Income Tax Information
(Unaudited)
The Fund is required under the Internal Revenue Code to advise shareholders in a written statement as to the federal tax status of dividends paid by the Fund during such fiscal years.
For the fiscal year ended October 31, 2022, the Fund designated approximately $6,771,970 under the Internal Revenue Code as qualified dividend income eligible for reduced tax rates.
In February 2023, shareholders will receive an IRS Form 1099-DIV or substitute Form 1099, which will show the federal tax status of the distributions received by shareholders in calendar year 2022. The amounts that will be reported on such 1099-DIV or substitute Form 1099 will be the amounts you are to use on your federal income tax return and will differ from the amounts which we must report for the Fund's fiscal year ended October 31, 2022.
Proxy Voting Policies and Procedures and Proxy Voting Record
The Fund is required to file with the SEC its proxy voting record for the 12-month period ending June 30 on Form N-PX. A description of the policies and procedures that are used to vote proxies relating to portfolio securities of the Fund is available free of charge upon request by calling 800-624-6782 or visiting the SEC’s website at www.sec.gov. The most recent Form N-PX or proxy voting record is available free of charge upon request by calling 800-624-6782; visiting newyorklifeinvestments.com; or visiting the SEC’s website at www.sec.gov.
Shareholder Reports and Quarterly Portfolio Disclosure
The Fund is required to file its complete schedule of portfolio holdings with the SEC 60 days after its first and third fiscal quarter on Form N-PORT. The Fund's holdings report is available free of charge upon request by calling New York Life Investments at 800-624-6782.
| 32 | MainStay Epoch International Choice Fund |
Board of Trustees and Officers (Unaudited)
The Trustees and officers of the Fund are listed below. The Board oversees the MainStay Group of Funds (which consists of MainStay Funds and MainStay Funds Trust), MainStay VP Funds Trust, MainStay MacKay DefinedTerm Municipal Opportunities Fund, MainStay CBRE Global Infrastructure Megatrends Fund, the Manager and the Subadvisors, and elects the officers of the Funds who are responsible for the day-to-day operations of the Fund. Information pertaining to the Trustees and officers is set forth below. Each Trustee serves until his or her successor is
elected and qualified or until his or her resignation, death or removal. Under the Board’s retirement policy, unless an exception is made, a Trustee must tender his or her resignation by the end of the calendar year during which he or she reaches the age of 75. The business address of each Trustee and officer listed below is 51 Madison Avenue, New York, New York 10010. None of the Trustees are “interested persons” (as defined by the 1940 Act and rules adopted by the SEC thereunder) of the Fund (“Independent Trustees”).
| | Name and
Year of Birth | Term of Office,
Position(s) Held and
Length of Service | Principal Occupation(s)
During Past Five Years | Number of
Portfolios in
Fund Complex
Overseen by
Trustee | Other Directorships
Held by Trustee |
| | | | | | |
| | David H. Chow
1957 | MainStay Funds: Trustee since 2016, Advisory Board Member (June 2015 to December 2015);MainStay Funds Trust:
Trustee since January 2016, Advisory Board Member (June 2015 to December 2015) | Founder and CEO, DanCourt Management, LLC since 1999 | 78 | MainStay VP Funds Trust: Trustee since January 2016, Advisory Board Member (June 2015 to December 2015) (31 portfolios);
MainStay MacKay DefinedTerm Municipal Opportunities Fund: Trustee since January 2016, Advisory Board Member (June 2015 to December 2015);
MainStay CBRE Global Infrastructure Megatrends Fund: Trustee since June 2021; VanEck Vectors Group of Exchange-Traded Funds: Independent Chairman of the Board of Trustees since 2008 and Trustee since 2006 (56 portfolios); and Berea College of Kentucky: Trustee since 2009, Chair of the Investment Committee since 2018 |
| | Susan B. Kerley
1951 | MainStay Funds: Chairman since 2017 and Trustee since 2007;MainStay Funds Trust:
Chairman since 2017 and Trustee since 1990** | President, Strategic Management Advisors LLC since 1990 | 78 | MainStay VP Funds Trust: Chairman since January 2017 and Trustee since 2007 (31 portfolios)**;
MainStay MacKay DefinedTerm Municipal Opportunities Fund: Chairman since 2017 and Trustee since 2011;
MainStay CBRE Global Infrastructure Megatrends Fund: Trustee since June 2021; and Legg Mason Partners Funds: Trustee since 1991 (45 portfolios) |
| | Alan R. Latshaw
1951 | MainStay Funds: Trustee since 2006;MainStay Funds Trust:
Trustee since 2007*** | Retired; Partner, Ernst & Young LLP (2002 to 2003); Partner, Arthur Andersen LLP (1989 to 2002); Consultant to the MainStay Funds Audit and Compliance Committee (2004 to 2006) | 78 | MainStay VP Funds Trust: Trustee since 2007 (31 portfolios)**;
MainStay MacKay DefinedTerm Municipal Opportunities Fund: Trustee since 2011; and
MainStay CBRE Global Infrastructure Megatrends Fund: Trustee since June 2021 |
Board of Trustees and Officers (Unaudited) (continued)
| | Name and
Year of Birth | Term of Office,
Position(s) Held and
Length of Service | Principal Occupation(s)
During Past Five Years | Number of
Portfolios in
Fund Complex
Overseen by
Trustee | Other Directorships
Held by Trustee |
| | | | | | |
| | Karen Hammond
1956 | MainStay Funds: Trustee since December 2021, Advisory Board Member (June 2021 to December 2021);MainStay Funds Trust:
Trustee since December 2021, Advisory Board Member (June 2021 to December 2021)
| Retired, Managing Director, Devonshire Investors (2007 to 2013); Senior Vice President, Fidelity Management & Research Co. (2005 to 2007); Senior Vice President and Corporate Treasurer, FMR Corp. (2003 to 2005); Chief Operating Officer, Fidelity Investments Japan (2001 to 2003) | 78 | MainStay VP Funds Trust: Trustee since December 2021, Advisory Board Member (June 2021 to December 2021) (31 Portfolios);
MainStay MacKay DefinedTerm Municipal Opportunities Fund: Trustee since December 2021, Advisory Board Member (June 2021 to December 2021);
MainStay CBRE Global Infrastructure Megatrends Fund: Trustee since December 2021, Advisory Board Member (June 2021 to December 2021);
Two Harbors Investment Corp.: Director since 2018;
Rhode Island State Investment Commission: Member since 2017; and
Blue Cross Blue Shield of Rhode Island: Director since 2019 |
| | Jacques P. Perold
1958 | MainStay Funds: Trustee since 2016, Advisory Board Member (June 2015 toDecember 2015);MainStay Funds Trust:
Trustee since January 2016, Advisory Board Member (June 2015 to December 2015) | Founder and Chief Executive Officer, CapShift Advisors LLC (since 2018); President, Fidelity Management & Research Company (2009 to 2014); President and Chief Investment Officer, Geode Capital Management, LLC (2001 to 2009) | 78 | MainStay VP Funds Trust: Trustee since January 2016, Advisory Board Member (June 2015 to December 2015) (31 portfolios);
MainStay MacKay DefinedTerm Municipal Opportunities Fund: Trustee since January 2016, Advisory Board Member (June 2015 to December 2015);
MainStay CBRE Global Infrastructure Megatrends Fund: Trustee since June 2021; Partners in Health: Trustee since 2019; Allstate Corporation: Director since 2015; and MSCI Inc.: Director since 2017 |
| | Richard S. Trutanic
1952 | MainStay Funds: Trustee since 1994;MainStay Funds Trust:
Trustee since 2007*** | Chairman and Chief Executive Officer, Somerset & Company (financial advisory firm) since 2004; Managing Director, The Carlyle Group (private investment firm) (2002 to 2004); Senior Managing Director, Partner and Board Member, Groupe Arnault S.A. (private investment firm) (1999 to 2002) | 78 | MainStay VP Funds Trust: Trustee since 2007 (31 portfolios)**;
MainStay MacKay DefinedTerm Municipal Opportunities Fund: Trustee since 2011; and MainStay CBRE Global Infrastructure Megatrends Fund: Trustee since June 2021 |
| ** | Includes prior service as a Director of MainStay VP Series Fund, Inc., the predecessor to MainStay VP Funds Trust. |
| *** | Includes prior service as a Director/Trustee of certain predecessor entities to MainStay Funds Trust. |
| 34 | MainStay Epoch International Choice Fund |
| | Name and
Year of Birth | Position(s) Held and
Length of Service | Principal Occupation(s)
During Past Five Years | |
| | | | | |
| | Kirk C. Lehneis
1974 | President, MainStay Funds, MainStay Funds Trust since 2017 | Chief Operating Officer and Senior Managing Director (since 2016), New York Life Investment Management LLC and New York Life Investment Management Holdings LLC; Member of the Board of Managers (since 2017) and Senior Managing Director (since 2018), NYLIFE Distributors LLC; Chairman of the Board and Senior Managing Director, NYLIM Service Company LLC (since 2017); Trustee, President and Principal Executive Officer of IndexIQ Trust, IndexIQ ETF Trust and IndexIQ Active ETF Trust (since January 2018); President, MainStay CBRE Global Infrastructure Megatrends Fund (since 2021), MainStay MacKay DefinedTerm Municipal Opportunities Fund and MainStay VP Funds Trust (since 2017); Senior Managing Director, Global Product Development (From 2015-2016); Managing Director, Product Development (2010 to 2015), New York Life Investment Management LLC | |
| | Jack R. Benintende
1964 | Treasurer and Principal Financial and Accounting Officer, MainStay Funds (since 2007), MainStay Funds Trust (since 2009) | Managing Director, New York Life Investment Management LLC (since 2007); Treasurer and Principal Financial and Accounting Officer, MainStay CBRE Global Infrastructure Megatrends Fund (since 2021), MainStay MacKay DefinedTerm Municipal Opportunities Fund (since 2011) and MainStay VP Funds Trust (since 2007)** and Assistant Treasurer, New York Life Investment Management Holdings LLC (2008 to 2012) | |
| | J. Kevin Gao
1967 | Secretary and Chief Legal Officer, MainStay Funds and MainStay Funds Trust (since 2010) | Managing Director and Associate General Counsel, New York Life Investment Management LLC (since 2010); Secretary and Chief Legal Officer and MainStay CBRE Global Infrastructure Megatrends Fund (since 2021), MainStay MacKay DefinedTerm Municipal Opportunities Fund (since 2011) and MainStay VP Funds Trust (since 2010)** | |
| | Scott T. Harrington
1959 | Vice President— Administration, MainStay Funds (since 2009), MainStay Funds Trust (since 2009) | Managing Director, New York Life Investment Management LLC (including predecessor advisory organizations) (since 2000); Member of the Board of Directors, New York Life Trust Company (since 2009); Vice President—Administration, MainStay CBRE Global Infrastructure Megatrends Fund (since 2021), MainStay MacKay DefinedTerm Municipal Opportunities Fund (since 2011) and MainStay VP Funds Trust (since 2005)** | |
| | Kevin M. Gleason
1967 | Vice President and Chief Compliance Officer, MainStay Funds and MainStay Funds Trust (since June 2022) | Vice President and Chief Compliance Officer, IndexIQ, IndexIQ ETF Trust and Index IQ Active ETF Trust (since June 2022); Vice President and Chief Compliance Officer, MainStay CBRE Global Infrastructure Megatrends Fund, MainStay VP Funds Trust and MainStay MacKay DefinedTerm Municipal Opportunities Fund (since June 2022); Senior Vice President, Voya Investment Management and Chief Compliance Officer, Voya Family of Funds (2012-2022) | |
| * | The officers listed above are considered to be “interested persons” of the MainStay Group of Funds, MainStay VP Funds Trust, MainStay CBRE Global Infrastructure Megatrends Fund and MainStay MacKay DefinedTerm Municipal Opportunities Fund within the meaning of the 1940 Act because of their affiliation with the MainStay Group of Funds, New York Life Insurance Company and/or its affiliates, including New York Life Investment Management LLC, NYLIM Service Company LLC, NYLIFE Securities LLC and/or NYLIFE Distributors LLC, as described in detail in the column captioned “Principal Occupation(s) During Past Five Years.” Officers are elected annually by the Board. |
| ** | Includes prior service as an Officer of MainStay VP Series Fund, Inc., the predecessor to MainStay VP Funds Trust. |
Officers of the Trust (Who are not Trustees)*
This page intentionally left blank.
This page intentionally left blank.
This page intentionally left blank.
Equity
U.S. Equity
MainStay Epoch U.S. Equity Yield Fund
MainStay S&P 500 Index Fund1
MainStay Winslow Large Cap Growth Fund
MainStay WMC Enduring Capital Fund
MainStay WMC Growth Fund
MainStay WMC Small Companies Fund
MainStay WMC Value Fund
International Equity
MainStay Epoch International Choice Fund
MainStay MacKay International Equity Fund
MainStay WMC International Research Equity Fund
Emerging Markets Equity
MainStay Candriam Emerging Markets Equity Fund
Global Equity
MainStay Epoch Capital Growth Fund
MainStay Epoch Global Equity Yield Fund
Fixed Income
Taxable Income
MainStay Candriam Emerging Markets Debt Fund
MainStay Floating Rate Fund
MainStay MacKay High Yield Corporate Bond Fund
MainStay MacKay Short Duration High Yield Fund
MainStay MacKay Strategic Bond Fund
MainStay MacKay Total Return Bond Fund
MainStay MacKay U.S. Infrastructure Bond Fund
MainStay Short Term Bond Fund
Tax-Exempt Income
MainStay MacKay California Tax Free Opportunities Fund2
MainStay MacKay High Yield Municipal Bond Fund
MainStay MacKay New York Tax Free Opportunities Fund3
MainStay MacKay Short Term Municipal Fund
MainStay MacKay Strategic Municipal Allocation Fund
MainStay MacKay Tax Free Bond Fund
Money Market
MainStay Money Market Fund
Mixed Asset
MainStay Balanced Fund
MainStay Income Builder Fund
MainStay MacKay Convertible Fund
Speciality
MainStay CBRE Global Infrastructure Fund
MainStay CBRE Real Estate Fund
MainStay Cushing MLP Premier Fund
Asset Allocation
MainStay Conservative Allocation Fund
MainStay Conservative ETF Allocation Fund
MainStay Defensive ETF Allocation Fund
MainStay Equity Allocation Fund
MainStay Equity ETF Allocation Fund
MainStay ESG Multi-Asset Allocation Fund
MainStay Growth Allocation Fund
MainStay Growth ETF Allocation Fund
MainStay Moderate Allocation Fund
MainStay Moderate ETF Allocation Fund
Manager
New York Life Investment Management LLC
New York, New York
Subadvisors
Candriam4
Strassen, Luxembourg
CBRE Investment Management Listed Real Assets LLC
Radnor, Pennsylvania
Cushing Asset Management, LP
Dallas, Texas
Epoch Investment Partners, Inc.
New York, New York
MacKay Shields LLC4
New York, New York
NYL Investors LLC4
New York, New York
Wellington Management Company LLP
Boston, Massachusetts
Winslow Capital Management, LLC
Minneapolis, Minnesota
Legal Counsel
Dechert LLP
Washington, District of Columbia
Independent Registered Public Accounting Firm
KPMG LLP
Philadelphia, Pennsylvania
Distributor
NYLIFE Distributors LLC4
Jersey City, New Jersey
Custodian
JPMorgan Chase Bank, N.A.
New York, New York
1.
Prior to February 28, 2022, the Fund's name was MainStay MacKay S&P 500 Index Fund.
| 2. | This Fund is registered for sale in AZ, CA, NV, OR, TX, UT, WA and MI (Class A and Class I shares only), and CO, FL, GA, HI, ID, MA, MD, NH, NJ and NY (Class I shares only). |
| 3. | This Fund is registered for sale in CA, CT, DE, FL, MA, NJ, NY and VT. |
| 4. | An affiliate of New York Life Investment Management LLC. |
Not part of the Annual Report
For more information
800-624-6782
newyorklifeinvestments.com
“New York Life Investments” is both a service mark, and the common trade name, of certain investment advisors affiliated with New York Life Insurance Company. The MainStay Funds® are managed by New York Life Investment Management LLC and distributed by NYLIFE Distributors LLC, 30 Hudson Street, Jersey City, NJ 07302, a wholly owned subsidiary of New York Life Insurance Company. NYLIFE Distributors LLC is a Member FINRA/SIPC.
©2022 NYLIFE Distributors LLC. All rights reserved.
| 5013734.2MS229-22 | MSEIC11-12/22 |
(NYLIM) NL319
MainStay Epoch U.S. Equity
Yield Fund
Message from the President and Annual Report
October 31, 2022
Sign up for e-delivery of your shareholder reports. For full details on e-delivery, including who can participate and what you can receive via e-delivery,
please log in to newyorklifeinvestments.com/accounts.
| Not FDIC/NCUA Insured | Not a Deposit | May Lose Value | No Bank Guarantee | Not Insured by Any Government Agency |
This page intentionally left blank
Message from the President
A series of economic and geopolitical challenges undermined equity and fixed-income markets during the 12-month reporting period ended October 31, 2022. Stocks and bonds alike trended lower in the face of sharply rising interest rates, increasing inflationary pressures, slowing economic growth and Russia’s invasion of Ukraine.
The reporting period began on a mixed note, with concerns about the spreading Omicron variant of the COVID-19 virus and increasingly hawkish statements from the U.S. Federal Reserve (the “Fed”) regarding mounting inflation, countered by bullish sentiment stemming from U.S. economic growth and strong corporate earnings. In January 2022, markets turned decisively negative as comments from the Fed raised the likelihood of rate hikes as early as March, and Russia issued increasingly aggressive threats toward Ukraine. The onset of Russia’s invasion in February exacerbated global inflationary pressures while increasing investor uncertainty. Domestic supply shortages, international trade imbalances and rising inflation caused GDP (gross domestic product) to contract in the first and second quarters of the year, although employment and consumer spending proved resilient. Prices for petroleum surged to multi-year highs, while many key agricultural chemicals and industrial metals climbed as well. Accelerating inflationary forces prompted the Fed to implement its most aggressive interest rate increases since the 1980s with a series of five sharp rate hikes, raising the federal funds rate from a range of 0.00% to 0.25% in March to 3.00% to 3.25% in September, with additional rate hikes expected before the end of the year. International central banks generally followed suit, raising rates by varying degrees in efforts to curb local inflation, although most increases remained significantly more modest than those in the United States. Relatively high U.S. interest rates and risk-averse international sentiment pushed U.S. dollar values higher compared to most other currencies, with the ensuing negative impact on global prices for food, fuel and other key, U.S.-dollar-denominated products.
The effects of these interrelated challenges were felt throughout U.S. and international financial markets. The S&P 500® Index, a widely regarded benchmark of U.S. market performance, declined by more than 14% during the reporting period. Although the energy sector generated strong gains, bolstered by elevated oil and gas prices, most other industry areas recorded losses. The more cyclical and growth-oriented sectors of consumer discretionary, real estate and information technology delivered the
weakest returns, while the traditionally defensive and value-oriented consumer staples, utilities and health care sectors outperformed. International stocks lagged compared to their U.S. counterparts, with some emerging markets, such as China, suffering particularly steep losses. A few markets, however, including Brazil, Mexico and the United Arab Emirates, ended the reporting period with little change. Fixed-income markets saw bond prices broadly decline as yields rose along with interest rates. Short-term yields rose faster than long-term yields, producing a yield curve inversion from July through the end of the reporting period, with long-term rates remaining below short-term rates. While floating-rate instruments, which feature variable interest rates that allow investors to benefit from a rising rate environment, provided a degree of insulation from inflation-driven trends, they were not immune to the market’s widespread declines.
While the Fed acknowledges the costs of rising rates in terms of weaker GDP growth and unsettled financial markets over the short term, its primary focus continues to be the longer-term economic impact of inflation. With the latest figures as of the date of this report showing that inflation remains above 8%, versus a target rate of just 2%, the Fed clearly has a distance yet to go, making further rate increases and market volatility more likely in the coming months. The question remains as to whether the Fed and other central banks will manage a so-called “soft landing,” curbing inflation while avoiding a persistent economic slowdown. If they prove successful, we expect that favorable inflation trends and increasingly attractive valuations in both equity and bond markets should eventually translate into sustainable improvements in the investment environment.
Whatever actions the Fed takes and however financial markets react, as a MainStay investor, you can depend on us to continue providing the insight, expertise and service that have long defined New York Life Investments. Thank you for trusting us to help you meet your investment needs.
Sincerely,
Kirk C. Lehneis
President
The opinions expressed are as of the date of this report and are subject to change. There is no guarantee that any forecast made will come to pass. This material does not constitute investment advice and is not intended as an endorsement of any specific investment. Past performance is no guarantee of future results.
Not part of the Annual Report
Investors should refer to the Fund’s Summary Prospectus and/or Prospectus and consider the Fund’s investment objectives, strategies, risks, charges and expenses carefully before investing. The Summary Prospectus and/or Prospectus contain this and other information about the Fund. You may obtain copies of the Fund’s Summary Prospectus, Prospectus and Statement of Additional Information, which includes information about the MainStay Funds Trust's Trustees, free of charge, upon request, by calling toll-free 800-624-6782, by writing to NYLIFE Distributors LLC, Attn: MainStay Marketing Department, 30 Hudson Street, Jersey City, NJ 07302 or by sending an e-mail to MainStayShareholderServices@nylim.com. These documents are also available via the MainStay Funds’ website at newyorklifeinvestments.com. Please read the Fund’s Summary Prospectus and/or Prospectus carefully before investing.
Investment and Performance Comparison (Unaudited)
Performance data quoted represents past performance. Past performance is no guarantee of future results. Because of market volatility and other factors, current performance may be lower or higher than the figures shown. Investment return and principal value will fluctuate, and as a result, when shares are redeemed, they may be worth more or less than their original cost. The graph below depicts the historical performance of Class I shares of the Fund. Performance will vary from class to class based on differences in class-specific expenses and sales charges. For performance information current to the most recent month-end, please call 800-624-6782 or visit newyorklifeinvestments.com.
The performance table and graph do not reflect the deduction of taxes that a shareholder would pay on distributions or Fund share redemptions. Total returns reflect maximum applicable sales charges as indicated in the table below, if any, changes in share price, and reinvestment of dividend and capital gain distributions. The graph assumes the initial investment amount shown below and reflects the deduction of all sales charges that would have applied for the period of investment. Performance figures may reflect certain fee waivers and/or expense limitations, without which total returns may have been lower. For more information on share classes and current fee waivers and/or expense limitations (if any), please refer to the Notes to Financial Statements.
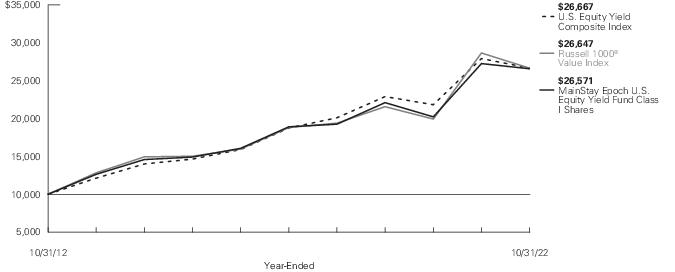
| Average Annual Total Returns for the Year-Ended October 31, 2022 |
| Class | Sales Charge | | Inception
Date | One
Year | Five
Years | Ten Years
or Since
Inception | Gross
Expense
Ratio1 |
| Class A Shares | Maximum 5.5% Initial Sales Charge | With sales charges | 2/3/2009 | -8.19% | 5.53% | 9.34% | 1.07% |
| | | Excluding sales charges | | -2.85 | 6.73 | 9.96 | 1.07 |
| Investor Class Shares2 | Maximum 5% Initial Sales Charge | With sales charges | 11/16/2009 | -7.96 | 5.29 | 9.13 | 1.39 |
| | | Excluding sales charges | | -3.12 | 6.48 | 9.75 | 1.39 |
| Class B Shares3 | Maximum 5% CDSC | With sales charges | 5/8/2017 | -8.59 | 5.37 | 6.17 | 2.14 |
| | if Redeemed Within the First Six Years of Purchase | Excluding sales charges | | -3.82 | 5.69 | 6.31 | 2.14 |
| Class C Shares | Maximum 1% CDSC | With sales charges | 11/16/2009 | -4.78 | 5.69 | 8.93 | 2.14 |
| | if Redeemed Within One Year of Purchase | Excluding sales charges | | -3.82 | 5.69 | 8.93 | 2.14 |
| Class I Shares | No Sales Charge | | 12/3/2008 | -2.50 | 7.05 | 10.27 | 0.82 |
| Class R1 Shares | No Sales Charge | | 5/8/2017 | -2.66 | 6.89 | 7.51 | 0.92 |
| Class R2 Shares | No Sales Charge | | 5/8/2017 | -2.91 | 6.63 | 7.23 | 1.17 |
| Class R3 Shares | No Sales Charge | | 5/8/2017 | -3.17 | 6.37 | 6.97 | 1.42 |
| Class R6 Shares | No Sales Charge | | 5/8/2017 | -2.54 | 7.10 | 7.72 | 0.73 |
| SIMPLE Class Shares | No Sales Charge | | 8/31/2020 | -3.34 | N/A | 10.35 | 1.64 |
| 1. | The gross expense ratios presented reflect the Fund’s “Total Annual Fund Operating Expenses” from the most recent Prospectus, as supplemented, and may differ from other expense ratios disclosed in this report. |
| 2. | Prior to June 30, 2020, the maximum initial sales charge was 5.5%, which is reflected in the applicable average annual total return figures shown. |
| 3. | Class B shares are closed to all new purchases as well as additional investments by existing Class B shareholders. |
The footnotes on the next page are an integral part of the table and graph and should be carefully read in conjunction with them.
| Benchmark Performance* | One
Year | Five
Years | Ten
Years |
| Russell 1000® Value Index1 | -7.00% | 7.21% | 10.30% |
| U.S. Equity Yield Composite Index2 | -4.46 | 7.30 | 10.31 |
| Morningstar Large Value Category Average3 | -4.60 | 7.43 | 9.85 |
| * | Returns for indices reflect no deductions for fees, expenses or taxes, except for foreign withholding taxes where applicable. Results assume reinvestment of all dividends and capital gains. An investment cannot be made directly in an index. |
| 1. | The Fund has selected the Russell 1000® Value Index as its primary benchmark. The Russell 1000® Value Index measures the performance of the large-cap value segment of the U.S. equity universe. It includes those Russell 1000® Index companies with lower price-to-book ratios and lower expected growth values. |
| 2. | The Fund has selected the U.S. Equity Yield Composite Index as its secondary benchmark. The U.S. Equity Yield Composite Index consists of the MSCI USA High Dividend Yield Index and the MSCI USA Minimum Volatility (USD) Index weighted at 60% and 40%, respectively. The MSCI USA High Dividend Yield Index is based on the MSCI USA Index and includes large and mid-cap stocks. The MSCI USA High Dividend Yield Index is designed to reflect the performance of equities in the MSCI USA Index (excluding real estate investment trusts) with higher dividend income and quality characteristics than average dividend yields that are both sustainable and persistent. The MSCI USA Minimum Volatility (USD) Index aims to reflect the performance characteristics of a minimum variance strategy applied to the large and mid-cap USA equity universe. The MSCI USA Minimum Volatility (USD) Index is calculated by optimizing the MSCI USA Index in USD for the lowest absolute risk (within a given set of constraints). |
| 3. | The Morningstar Large Value Category Average is representative of funds that invest primarily in big U.S. companies that are less expensive or growing more slowly than other large-cap stocks. Results are based on average total returns of similar funds with all dividends and capital gain distributions reinvested. |
The footnotes on the preceding page are an integral part of the table and graph and should be carefully read in conjunction with them.
| 6 | MainStay Epoch U.S. Equity Yield Fund |
Cost in Dollars of a $1,000 Investment in MainStay Epoch U.S. Equity Yield Fund (Unaudited)
The example below is intended to describe the fees and expenses borne by shareholders during the six-month period from May 1, 2022 to October 31, 2022, and the impact of those costs on your investment.
Example
As a shareholder of the Fund you incur two types of costs: (1) transaction costs, including exchange fees and sales charges (loads) on purchases (as applicable), and (2) ongoing costs, including management fees, distribution and/or service (12b-1) fees and other Fund expenses (as applicable). This example is intended to help you understand your ongoing costs (in dollars) of investing in the Fund and to compare these costs with the ongoing costs of investing in other mutual funds. The example is based on an investment of $1,000 made at the beginning of the six-month period and held for the entire period from May 1, 2022 to October 31, 2022.
This example illustrates your Fund’s ongoing costs in two ways:
Actual Expenses
The second and third data columns in the table below provide information about actual account values and actual expenses. You may use the information in these columns, together with the amount you invested, to estimate the expenses that you paid during the six months ended October 31, 2022. Simply divide your account value by $1,000 (for example, an
$8,600 account value divided by $1,000 = 8.6), then multiply the result by the number under the heading entitled “Expenses Paid During Period” to estimate the expenses you paid on your account during this period.
Hypothetical Example for Comparison Purposes
The fourth and fifth data columns in the table below provide information about hypothetical account values and hypothetical expenses based on the Fund’s actual expense ratio and an assumed rate of return of 5% per year before expenses, which is not the Fund’s actual return. The hypothetical account values and expenses may not be used to estimate the actual ending account balances or expenses you paid for the six-month period shown. You may use this information to compare the ongoing costs of investing in the Fund with the ongoing costs of investing in other mutual funds. To do so, compare this 5% hypothetical example with the 5% hypothetical examples that appear in the shareholder reports of the other mutual funds.
Please note that the expenses shown in the table are meant to highlight your ongoing costs only and do not reflect any transactional costs, such as exchange fees or sales charges (loads). Therefore, the fourth and fifth data columns of the table are useful in comparing ongoing costs only and will not help you determine the relative total costs of owning different funds. In addition, if these transactional costs were included, your costs would have been higher.
| Share Class | Beginning
Account
Value
5/1/22 | Ending Account
Value (Based
on Actual
Returns and
Expenses)
10/31/22 | Expenses
Paid
During
Period1 | Ending Account
Value (Based
on Hypothetical
5% Annualized
Return and
Actual Expenses)
10/31/22 | Expenses
Paid
During
Period1 | Net Expense
Ratio
During
Period2 |
| Class A Shares | $1,000.00 | $974.90 | $ 5.23 | $1,019.91 | $ 5.35 | 1.05% |
| Investor Class Shares | $1,000.00 | $974.00 | $ 6.42 | $1,018.70 | $ 6.56 | 1.29% |
| Class B Shares | $1,000.00 | $970.20 | $10.13 | $1,014.92 | $10.36 | 2.04% |
| Class C Shares | $1,000.00 | $970.20 | $10.13 | $1,014.92 | $10.36 | 2.04% |
| Class I Shares | $1,000.00 | $976.90 | $ 3.64 | $1,021.53 | $ 3.72 | 0.73% |
| Class R1 Shares | $1,000.00 | $976.00 | $ 4.48 | $1,020.67 | $ 4.58 | 0.90% |
| Class R2 Shares | $1,000.00 | $974.90 | $ 5.72 | $1,019.41 | $ 5.85 | 1.15% |
| Class R3 Shares | $1,000.00 | $973.90 | $ 6.97 | $1,018.15 | $ 7.12 | 1.40% |
| Class R6 Shares | $1,000.00 | $976.90 | $ 3.64 | $1,021.53 | $ 3.72 | 0.73% |
| SIMPLE Class Shares | $1,000.00 | $972.90 | $ 7.66 | $1,017.44 | $ 7.83 | 1.54% |
| 1. | Expenses are equal to the Fund’s annualized expense ratio of each class multiplied by the average account value over the period, divided by 365 and multiplied by 184 (to reflect the six-month period). The table above represents the actual expenses incurred during the six-month period. In addition to the fees and expenses which the Fund bears directly, it also indirectly bears a pro rata share of the fees and expenses of the underlying funds in which it invests. Such indirect expenses are not included in the above-reported expense figures. |
| 2. | Expenses are equal to the Fund's annualized expense ratio to reflect the six-month period. |
Industry Composition as of October 31, 2022 (Unaudited)
| Banks | 9.5% |
| Pharmaceuticals | 6.9 |
| Electric Utilities | 6.4 |
| Oil, Gas & Consumable Fuels | 6.1 |
| Insurance | 5.9 |
| Semiconductors & Semiconductor Equipment | 5.2 |
| Chemicals | 4.8 |
| Equity Real Estate Investment Trusts | 3.9 |
| Electrical Equipment | 3.8 |
| Health Care Providers & Services | 3.7 |
| Biotechnology | 3.5 |
| Aerospace & Defense | 3.1 |
| IT Services | 2.5 |
| Household Products | 2.4 |
| Capital Markets | 2.4 |
| Multi–Utilities | 2.4 |
| Beverages | 2.3 |
| Hotels, Restaurants & Leisure | 2.1 |
| Media | 1.9 |
| Health Care Equipment & Supplies | 1.9 |
| Machinery | 1.9% |
| Tobacco | 1.6 |
| Food & Staples Retailing | 1.6 |
| Software | 1.5 |
| Diversified Telecommunication Services | 1.4 |
| Specialty Retail | 1.3 |
| Communications Equipment | 1.2 |
| Air Freight & Logistics | 1.2 |
| Industrial Conglomerates | 1.1 |
| Commercial Services & Supplies | 1.0 |
| Leisure Products | 0.9 |
| Trading Companies & Distributors | 0.9 |
| Technology Hardware, Storage & Peripherals | 0.7 |
| Containers & Packaging | 0.7 |
| Household Durables | 0.7 |
| Short–Term Investments | 1.4 |
| Other Assets, Less Liabilities | 0.2 |
| | 100.0% |
See Portfolio of Investments beginning on page 11 for specific holdings within these categories. The Fund's holdings are subject to change.
Top Ten Holdings and/or Issuers Held as of October 31, 2022 (excluding short-term investments) (Unaudited)
| 1. | Chevron Corp. |
| 2. | Merck & Co., Inc. |
| 3. | AbbVie, Inc. |
| 4. | UnitedHealth Group, Inc. |
| 5. | MetLife, Inc. |
| 6. | Johnson & Johnson |
| 7. | Medtronic plc |
| 8. | Bank of America Corp. |
| 9. | Cummins, Inc. |
| 10. | JPMorgan Chase & Co. |
| 8 | MainStay Epoch U.S. Equity Yield Fund |
Portfolio Management Discussion and Analysis (Unaudited)
Questions answered by portfolio managers Michael A. Welhoelter, CFA, William W. Priest, CFA, John Tobin, PhD, CFA, and Kera Van Valen, CFA, of Epoch Investment Partners, Inc., the Fund’s Subadvisor.
How did MainStay Epoch U.S. Equity Yield Fund perform relative to its benchmarks and peer group during the 12 months ended October 31, 2022?
For the 12 months ended October 31, 2022, Class I shares of MainStay Epoch U.S. Equity Yield Fund returned −2.50%, outperforming the −7.00% return of the Fund’s primary benchmark, the Russell 1000® Value Index. Over the same period, Class I shares also outperformed the −4.46% return of the U.S. Equity Yield Composite Index, which is the Fund’s secondary benchmark, and the −4.60% return of the Morningstar Large Value Category Average.1
What factors affected the Fund’s relative performance during the reporting period?
The Fund proved more resilient to a challenging environment than the broader market. Low exposure to volatility and market sensitivity helped drive outperformance relative to the Russell 1000® Value Index, providing investors a wide margin of downside protection. Most sectors contributed positively to returns, with the largest contributions coming from industrials and communication services. (Contributions take weightings and total returns into account.) Stock selection drove returns in industrials through exposure to aerospace & defense stocks, as well as commercial services and supplies companies. Returns in communication services were also driven by stock selection, along with an underweight allocation to this sector, the weakest performing sector in the benchmark.
The reporting period was characterized by heightened volatility and deteriorating macroeconomic conditions, with aggressive monetary tightening to fight inflation putting heavy pressure on price multiples. The policy set by the U.S. Federal Reserve largely dictated investor sentiment throughout the reporting period, and the central bank's increasingly hawkish tone—along with the most rapid rise in rates seen in decades—significantly suppressed risk appetite. The war in Ukraine served to further hamper markets, challenging global growth and increasing geopolitical tension.
During the reporting period, which sectors were the strongest positive contributors to the Fund’s relative performance and which sectors were particularly weak?
During the reporting period, the strongest positive sector contributions to the Fund’s performance relative to the Russell 1000® Value Index came from industrials. As mentioned above, stock selection in the sector drove the outperformance. Underweight exposure to communications services, the worst performing sector in the benchmark, was another top contributor to relative results. Stock selection in health care also contributed positively, although the effect was partially offset by an
underweight position in the sector. Conversely, energy—the best-performing sector in the benchmark—detracted most significantly from relative returns, primarily due to the Fund’s underweight exposure. Stock selection in the consumer discretionary sector also detracted.
During the reporting period, which individual stocks made the strongest positive contributions to the Fund’s absolute performance and which stocks detracted the most?
Top contributors to the Fund’s absolute performance during the reporting period included pharmaceutical company AbbVie and integrated global energy company Chevron.
AbbVie develops and markets drugs in specialty therapeutic areas, including immunology, oncology and virology, among others. Shares generally traded higher in response to favorable quarterly earnings reports, in addition to constructive news flow regarding clinical successes and approvals for key drugs. While the market remained concerned about the revenue impact from the impending entry of biosimilar competitors for the blockbuster immunology drug Humira, AbbVie continued to advance key drugs in multiple therapeutic areas, such as Skyrizi and Rinvoq in immunology, Venclexta in oncology, and Vraylar in neuroscience. In aesthetics, Botox and Juvederm also continued to sell well.
Chevron is a global integrated energy company that explores, produces, and markets crude oil and natural gas. Chevron shares outperformed as the prolonged war in Ukraine held oil and gas prices at elevated levels. Although oil prices declined late in the reporting period, Chevron shares gained after the OPEC+ oil supplying countries decided to cut production to reduce supply in early October 2022. Strong refining margins further supported the company’s shares. Chevron has an integrated business model, geographic and product diversification, a strong balance sheet, and has demonstrated continued efforts to manage costs and improve capital efficiencies. This allows the company to generate sustainable cash flow through commodity price cycles, while returning cash to shareholders through an attractive and growing dividend and share buybacks, using excess free cash flow.
The most significant detractors from the Fund’s absolute performance during the same period were cable and entertainment company Comcast and domestic retailer Target.
Comcast controls the largest cable operations in the U.S., owns several cable networks, as well as the broadcast networks of NBC and Telemundo, produces films through Universal Pictures that support its Universal Theme Park business and also owns Sky, a large pay-tv provider in Europe. Shares were pressured by low internet subscriber acquisition rates and guidance that the numbers are likely to remain low to non-existent in the coming
| 1. | See page 5 for other share class returns, which may be higher or lower than Class I share returns. See page 6 for more information on benchmark and peer group returns. |
quarters. Despite this, customer attrition and pricing were strong, supporting the company’s continued cash flow growth. We believe Comcast's attractive internet speeds and network blueprint should allow the company to remain competitive. Comcast pays a growing dividend and is reducing debt incurred with the Sky acquisition.
Target serves middle- to upper-income consumers through its 1,900 retail stores and e-commerce channel. Annual revenue represents approximately 2% of U.S. retail sales. As the first-quarter 2022 earnings season progressed, it became clear that general merchandise retailers, as a group, had accumulated excessive levels of inventory and were likely to see continued deterioration in metrics including inventory days, gross margins and cash flow growth. Given Target’s heavy reliance on general merchandise sales, we concluded that the company may be challenged for some time and decided to close the Fund’s position.
What were some of the Fund’s largest purchases and sales during the reporting period?
New purchases initiated during the reporting period included regional bank Columbia Banking System and industrial gas, equipment and services provider Air Products and Chemicals.
Columbia Banking System operates in Washington, Oregon and Northern California. The company has a local low-cost deposit franchise, a diversified loan portfolio and a well-capitalized balance sheet, which we believe should allow it to earn mid-teens returns on equity on a mid-cycle basis. Columbia has a strong history of returning excess capital to shareholders, and its pending merger with Umpqua Holdings should help fortify the drivers of its attractive shareholder yield.
Air Products and Chemicals generates strong cash flow from providing industrial gases and related equipment and services to customers in various industries, including refining, chemicals, metals, electronics, manufacturing, food & beverage and health care. Cash flow growth is driven by organic volume increases from growing applications of its products, cost improvements through process and network optimizations, and capital investments in new projects and joint ventures. The company returns cash to its shareholders via an attractive and growing dividend and is expected to deliver high single-digit growth from a strong backlog of attractive capital projects.
The Fund’s most significant sales during the same period included closing its positions entirely in utility Dominion Energy and apparel maker Hanesbrands.
One of the largest utility companies in the United States, Dominion Energy provides regulated electric and gas services to customers
in five states. Additionally, it’s involved in merchant power generation, although on a much smaller scale. The company focuses on investing in regulated growth, driven by the need to improve transmission and distribution infrastructure, and generate electricity from renewable sources. We believe the company’s planned undertaking of a sizeable offshore wind project in the next few years is likely to lead to a heavier debt burden on its balance sheet and possibly more equity issuance. We closed the Fund’s position in favor of other shareholder yield opportunities.
Hanesbrands produces activewear and underwear for the Hanes, Champion, Bali and other labels. Approximately 75% of the company’s revenue is earned in the United States from sales to mass retailers and department stores, as well as direct-to-consumer channels. We closed the Fund’s position in the expectation that persistently deteriorating traffic trends at some of Hanesbrands’ wholesale partners would negatively impact the company’s ability to return capital to shareholders.
How did the Fund’s sector weightings change during the reporting period?
The Fund’s most significant sector weighting changes during the reporting period were decreases in information technology and consumer discretionary, and increases in health care and energy. The Fund’s sector allocations are a result of our bottom-up, fundamental investment process and reflect the companies and securities that we confidently believe can collect and distribute sustainable and growing shareholder yield.
How was the Fund positioned at the end of the reporting period?
As of October 31, 2022, the Fund’s largest sector allocations on an absolute basis were to financials and health care, while its smallest total sector allocations were to communication services and real estate. As of the same date, relative to the Russell 1000® Value Index, the Fund held its most overweight exposure in utilities, a defensive sector that is typically more heavily represented in the Fund, as well as information technology. The Fund’s most significant underweight exposures were in the communication services and energy.
The opinions expressed are those of the portfolio managers as of the date of this report and are subject to change. There is no guarantee that any forecasts will come to pass. This material does not constitute investment advice and is not intended as an endorsement of any specific investment.
| 10 | MainStay Epoch U.S. Equity Yield Fund |
Portfolio of Investments October 31, 2022†
| | Shares | Value |
| Common Stocks 98.4% |
| Aerospace & Defense 3.1% |
| General Dynamics Corp. | 37,073 | $ 9,260,835 |
| Lockheed Martin Corp. | 21,602 | 10,513,261 |
| Raytheon Technologies Corp. | 142,019 | 13,466,242 |
| | | 33,240,338 |
| Air Freight & Logistics 1.2% |
| United Parcel Service, Inc., Class B | 73,591 | 12,346,362 |
| Banks 9.5% |
| Bank of America Corp. | 552,447 | 19,910,190 |
| Columbia Banking System, Inc. | 289,806 | 9,699,807 |
| JPMorgan Chase & Co. | 154,872 | 19,495,287 |
| KeyCorp | 734,451 | 13,124,639 |
| PNC Financial Services Group, Inc. (The) | 67,949 | 10,996,187 |
| Truist Financial Corp. | 218,408 | 9,782,494 |
| U.S. Bancorp | 420,951 | 17,869,370 |
| | | 100,877,974 |
| Beverages 2.3% |
| Coca-Cola Co. (The) | 138,218 | 8,272,348 |
| Coca-Cola Europacific Partners plc | 180,745 | 8,504,052 |
| PepsiCo, Inc. | 42,109 | 7,646,152 |
| | | 24,422,552 |
| Biotechnology 3.5% |
| AbbVie, Inc. | 169,072 | 24,752,141 |
| Amgen, Inc. | 46,240 | 12,500,984 |
| | | 37,253,125 |
| Capital Markets 2.4% |
| BlackRock, Inc. | 13,358 | 8,628,066 |
| CME Group, Inc. | 29,584 | 5,126,907 |
| Lazard Ltd., Class A (a) | 166,461 | 6,277,245 |
| T. Rowe Price Group, Inc. | 50,770 | 5,389,743 |
| | | 25,421,961 |
| Chemicals 4.8% |
| Air Products and Chemicals, Inc. | 32,923 | 8,243,919 |
| Dow, Inc. | 165,569 | 7,738,695 |
| Linde plc | 42,636 | 12,677,815 |
| LyondellBasell Industries NV, Class A | 89,693 | 6,857,030 |
| Nutrien Ltd. | 78,606 | 6,642,207 |
| PPG Industries, Inc. | 77,494 | 8,848,265 |
| | | 51,007,931 |
| Commercial Services & Supplies 1.0% |
| Republic Services, Inc. | 41,108 | 5,451,743 |
| | Shares | Value |
| |
| Commercial Services & Supplies (continued) |
| Waste Management, Inc. | 34,909 | $ 5,528,538 |
| | | 10,980,281 |
| Communications Equipment 1.2% |
| Cisco Systems, Inc. | 287,386 | 13,055,946 |
| Containers & Packaging 0.7% |
| Amcor plc | 637,498 | 7,382,227 |
| Diversified Telecommunication Services 1.4% |
| AT&T, Inc. | 373,772 | 6,813,864 |
| Verizon Communications, Inc. | 232,204 | 8,677,463 |
| | | 15,491,327 |
| Electric Utilities 6.4% |
| Alliant Energy Corp. | 108,711 | 5,671,453 |
| American Electric Power Co., Inc. | 187,304 | 16,467,768 |
| Duke Energy Corp. | 57,208 | 5,330,641 |
| Entergy Corp. | 92,540 | 9,914,736 |
| Evergy, Inc. | 159,821 | 9,769,858 |
| Eversource Energy | 87,109 | 6,644,674 |
| NextEra Energy, Inc. | 181,376 | 14,056,640 |
| | | 67,855,770 |
| Electrical Equipment 3.8% |
| Eaton Corp. plc | 106,313 | 15,954,392 |
| Emerson Electric Co. | 193,237 | 16,734,324 |
| Hubbell, Inc. | 30,910 | 7,340,507 |
| | | 40,029,223 |
| Equity Real Estate Investment Trusts 3.9% |
| American Tower Corp. | 29,836 | 6,181,721 |
| Iron Mountain, Inc. | 293,561 | 14,698,599 |
| Realty Income Corp. | 103,916 | 6,470,849 |
| Welltower, Inc. | 66,536 | 4,061,358 |
| WP Carey, Inc. (a) | 130,259 | 9,938,762 |
| | | 41,351,289 |
| Food & Staples Retailing 1.6% |
| Walmart, Inc. | 121,743 | 17,327,681 |
| Health Care Equipment & Supplies 1.9% |
| Medtronic plc | 231,329 | 20,204,275 |
| Health Care Providers & Services 3.7% |
| CVS Health Corp. | 153,709 | 14,556,242 |
| UnitedHealth Group, Inc. | 43,894 | 24,367,754 |
| | | 38,923,996 |
The notes to the financial statements are an integral part of, and should be read in conjunction with, the financial statements.
11
Portfolio of Investments October 31, 2022† (continued)
| | Shares | Value |
| Common Stocks (continued) |
| Hotels, Restaurants & Leisure 2.1% |
| McDonald's Corp. | 45,963 | $ 12,532,272 |
| Vail Resorts, Inc. | 42,864 | 9,392,788 |
| | | 21,925,060 |
| Household Durables 0.7% |
| Leggett & Platt, Inc. | 215,507 | 7,273,361 |
| Household Products 2.4% |
| Colgate-Palmolive Co. | 70,992 | 5,242,049 |
| Kimberly-Clark Corp. | 47,531 | 5,915,708 |
| Procter & Gamble Co. (The) | 109,401 | 14,733,033 |
| | | 25,890,790 |
| Industrial Conglomerates 1.1% |
| Honeywell International, Inc. | 55,565 | 11,336,371 |
| Insurance 5.9% |
| Arthur J. Gallagher & Co. | 84,645 | 15,835,386 |
| Marsh & McLennan Cos., Inc. | 51,788 | 8,363,244 |
| MetLife, Inc. | 323,189 | 23,660,667 |
| Travelers Cos., Inc. (The) | 80,741 | 14,893,485 |
| | | 62,752,782 |
| IT Services 2.5% |
| Automatic Data Processing, Inc. | 29,146 | 7,044,588 |
| International Business Machines Corp. | 94,204 | 13,027,471 |
| Paychex, Inc. | 55,905 | 6,614,121 |
| | | 26,686,180 |
| Leisure Products 0.9% |
| Hasbro, Inc. | 151,926 | 9,913,172 |
| Machinery 1.9% |
| Cummins, Inc. | 81,037 | 19,814,357 |
| Media 1.9% |
| Comcast Corp., Class A | 343,981 | 10,917,957 |
| Omnicom Group, Inc. | 136,160 | 9,905,640 |
| | | 20,823,597 |
| Multi-Utilities 2.4% |
| Ameren Corp. | 105,624 | 8,610,468 |
| CMS Energy Corp. | 88,478 | 5,047,670 |
| NiSource, Inc. | 227,725 | 5,850,255 |
| WEC Energy Group, Inc. | 61,390 | 5,606,749 |
| | | 25,115,142 |
| | Shares | Value |
| |
| Oil, Gas & Consumable Fuels 6.1% |
| Chevron Corp. | 155,353 | $ 28,103,358 |
| Enterprise Products Partners LP | 569,061 | 14,368,790 |
| Magellan Midstream Partners LP | 163,587 | 8,825,519 |
| MPLX LP | 188,277 | 6,314,811 |
| TotalEnergies SE, Sponsored ADR | 131,881 | 7,223,122 |
| | | 64,835,600 |
| Pharmaceuticals 6.9% |
| Eli Lilly and Co. | 45,383 | 16,432,730 |
| Johnson & Johnson | 120,032 | 20,881,967 |
| Merck & Co., Inc. | 246,043 | 24,899,552 |
| Pfizer, Inc. | 230,813 | 10,744,345 |
| | | 72,958,594 |
| Semiconductors & Semiconductor Equipment 5.2% |
| Analog Devices, Inc. | 106,653 | 15,210,851 |
| Broadcom, Inc. | 40,117 | 18,859,804 |
| KLA Corp. | 39,131 | 12,383,005 |
| Texas Instruments, Inc. | 54,876 | 8,814,732 |
| | | 55,268,392 |
| Software 1.5% |
| Microsoft Corp. | 71,226 | 16,533,691 |
| Specialty Retail 1.3% |
| Home Depot, Inc. (The) | 45,963 | 13,611,023 |
| Technology Hardware, Storage & Peripherals 0.7% |
| Apple, Inc. | 52,478 | 8,046,977 |
| Tobacco 1.6% |
| British American Tobacco plc, Sponsored ADR | 143,678 | 5,692,522 |
| Philip Morris International, Inc. | 128,714 | 11,822,381 |
| | | 17,514,903 |
| Trading Companies & Distributors 0.9% |
| MSC Industrial Direct Co., Inc., Class A | 113,857 | 9,447,854 |
Total Common Stocks
(Cost $823,684,015) | | 1,046,920,104 |
| Short-Term Investments 1.4% |
| Affiliated Investment Company 1.4% |
| MainStay U.S. Government Liquidity Fund, 2.905% (b) | 15,212,130 | 15,212,130 |
The notes to the financial statements are an integral part of, and should be read in conjunction with, the financial statements.
| 12 | MainStay Epoch U.S. Equity Yield Fund |
| | Shares | | Value |
| Short-Term Investments (continued) |
| Unaffiliated Investment Company 0.0% ‡ |
| Invesco Government & Agency Portfolio, 3.163% (b)(c) | 51,305 | | $ 51,305 |
Total Short-Term Investments
(Cost $15,263,435) | | | 15,263,435 |
Total Investments
(Cost $838,947,450) | 99.8% | | 1,062,183,539 |
| Other Assets, Less Liabilities | 0.2 | | 1,713,311 |
| Net Assets | 100.0% | | $ 1,063,896,850 |
| † | Percentages indicated are based on Fund net assets. |
| ‡ | Less than one-tenth of a percent. |
| (a) | All or a portion of this security was held on loan. As of October 31, 2022, the aggregate market value of securities on loan was $5,831,500; the total market value of collateral held by the Fund was $6,069,166. The market value of the collateral held included non-cash collateral in the form of U.S. Treasury securities with a value of $6,017,861. The Fund received cash collateral with a value of $51,305. (See Note 2(G)) |
| (b) | Current yield as of October 31, 2022. |
| (c) | Represents a security purchased with cash collateral received for securities on loan. |
Investments in Affiliates (in 000's)
Investments in issuers considered to be affiliate(s) of the Fund during the year ended October 31, 2022 for purposes of Section 2(a)(3) of the Investment Company Act of 1940, as amended, were as follows:
| Affiliated Investment Companies | Value,
Beginning
of Year | Purchases
at Cost | Proceeds
from
Sales | Net
Realized
Gain/(Loss)
on Sales | Change in
Unrealized
Appreciation/
(Depreciation) | Value,
End of
Year | Dividend
Income | Other
Distributions | Shares
End of
Year |
| MainStay U.S. Government Liquidity Fund | $ 35,199 | $ 152,438 | $ (172,425) | $ — | $ — | $ 15,212 | $ 132 | $ — | 15,212 |
| Abbreviation(s): |
| ADR—American Depositary Receipt |
The notes to the financial statements are an integral part of, and should be read in conjunction with, the financial statements.
13
Portfolio of Investments October 31, 2022† (continued)
The following is a summary of the fair valuations according to the inputs used as of October 31, 2022, for valuing the Fund’s assets:
| Description | Quoted
Prices in
Active
Markets for
Identical
Assets
(Level 1) | | Significant
Other
Observable
Inputs
(Level 2) | | Significant
Unobservable
Inputs
(Level 3) | | Total |
| Asset Valuation Inputs | | | | | | | |
| Investments in Securities (a) | | | | | | | |
| Common Stocks | $ 1,046,920,104 | | $ — | | $ — | | $ 1,046,920,104 |
| Short-Term Investments | | | | | | | |
| Affiliated Investment Company | 15,212,130 | | — | | — | | 15,212,130 |
| Unaffiliated Investment Company | 51,305 | | — | | — | | 51,305 |
| Total Short-Term Investments | 15,263,435 | | — | | — | | 15,263,435 |
| Total Investments in Securities | $ 1,062,183,539 | | $ — | | $ — | | $ 1,062,183,539 |
| (a) | For a complete listing of investments and their industries, see the Portfolio of Investments. |
The notes to the financial statements are an integral part of, and should be read in conjunction with, the financial statements.
| 14 | MainStay Epoch U.S. Equity Yield Fund |
Statement of Assets and Liabilities as of October 31, 2022
| Assets |
Investment in unaffiliated securities, at value
(identified cost $823,735,320) including securities on loan of $5,831,500 | $1,046,971,409 |
Investment in affiliated investment companies, at value
(identified cost $15,212,130) | 15,212,130 |
| Cash | 802 |
| Receivables: | |
| Dividends and interest | 2,059,587 |
| Fund shares sold | 472,050 |
| Securities lending | 3,135 |
| Other assets | 487,336 |
| Total assets | 1,065,206,449 |
| Liabilities |
| Cash collateral received for securities on loan | 51,305 |
| Payables: | |
| Manager (See Note 3) | 570,041 |
| Fund shares redeemed | 289,351 |
| Transfer agent (See Note 3) | 179,772 |
| NYLIFE Distributors (See Note 3) | 126,741 |
| Shareholder communication | 59,958 |
| Professional fees | 19,774 |
| Custodian | 6,215 |
| Accrued expenses | 6,442 |
| Total liabilities | 1,309,599 |
| Net assets | $1,063,896,850 |
| Composition of Net Assets |
| Shares of beneficial interest outstanding (par value of $.001 per share) unlimited number of shares authorized | $ 56,408 |
| Additional paid-in-capital | 823,428,810 |
| | 823,485,218 |
| Total distributable earnings (loss) | 240,411,632 |
| Net assets | $1,063,896,850 |
| Class A | |
| Net assets applicable to outstanding shares | $483,935,597 |
| Shares of beneficial interest outstanding | 25,764,477 |
| Net asset value per share outstanding | $ 18.78 |
| Maximum sales charge (5.50% of offering price) | 1.09 |
| Maximum offering price per share outstanding | $ 19.87 |
| Investor Class | |
| Net assets applicable to outstanding shares | $ 73,131,798 |
| Shares of beneficial interest outstanding | 3,912,046 |
| Net asset value per share outstanding | $ 18.69 |
| Maximum sales charge (5.00% of offering price) | 0.98 |
| Maximum offering price per share outstanding | $ 19.67 |
| Class B | |
| Net assets applicable to outstanding shares | $ 4,826,701 |
| Shares of beneficial interest outstanding | 266,490 |
| Net asset value and offering price per share outstanding | $ 18.11 |
| Class C | |
| Net assets applicable to outstanding shares | $ 10,960,973 |
| Shares of beneficial interest outstanding | 605,185 |
| Net asset value and offering price per share outstanding | $ 18.11 |
| Class I | |
| Net assets applicable to outstanding shares | $351,105,824 |
| Shares of beneficial interest outstanding | 18,488,852 |
| Net asset value and offering price per share outstanding | $ 18.99 |
| Class R1 | |
| Net assets applicable to outstanding shares | $ 750,659 |
| Shares of beneficial interest outstanding | 39,553 |
| Net asset value and offering price per share outstanding | $ 18.98 |
| Class R2 | |
| Net assets applicable to outstanding shares | $ 1,314,627 |
| Shares of beneficial interest outstanding | 70,002 |
| Net asset value and offering price per share outstanding | $ 18.78 |
| Class R3 | |
| Net assets applicable to outstanding shares | $ 2,601,514 |
| Shares of beneficial interest outstanding | 138,471 |
| Net asset value and offering price per share outstanding | $ 18.79 |
| Class R6 | |
| Net assets applicable to outstanding shares | $135,192,249 |
| Shares of beneficial interest outstanding | 7,118,714 |
| Net asset value and offering price per share outstanding | $ 18.99 |
| SIMPLE Class | |
| Net assets applicable to outstanding shares | $ 76,908 |
| Shares of beneficial interest outstanding | 4,105 |
| Net asset value and offering price per share outstanding | $ 18.74 |
The notes to the financial statements are an integral part of, and should be read in conjunction with, the financial statements.
15
Statement of Operations for the year ended October 31, 2022
| Investment Income (Loss) |
| Income | |
| Dividends-unaffiliated (net of foreign tax withholding of $42,916) | $ 33,047,167 |
| Dividends-affiliated | 131,574 |
| Securities lending, net | 23,479 |
| Total income | 33,202,220 |
| Expenses | |
| Manager (See Note 3) | 7,478,759 |
| Distribution/Service—Class A (See Note 3) | 1,253,735 |
| Distribution/Service—Investor Class (See Note 3) | 196,221 |
| Distribution/Service—Class B (See Note 3) | 62,882 |
| Distribution/Service—Class C (See Note 3) | 126,054 |
| Distribution/Service—Class R2 (See Note 3) | 3,610 |
| Distribution/Service—Class R3 (See Note 3) | 15,341 |
| Distribution/Service—SIMPLE Class (See Note 3) | 351 |
| Transfer agent (See Note 3) | 978,786 |
| Registration | 134,203 |
| Professional fees | 127,208 |
| Shareholder communication | 36,927 |
| Custodian | 26,131 |
| Trustees | 22,747 |
| Shareholder service (See Note 3) | 5,228 |
| Miscellaneous | 45,339 |
| Total expenses before waiver/reimbursement | 10,513,522 |
| Expense waiver/reimbursement from Manager (See Note 3) | (240,401) |
| Net expenses | 10,273,121 |
| Net investment income (loss) | 22,929,099 |
| Realized and Unrealized Gain (Loss) |
| Net realized gain (loss) on unaffiliated investments | 31,113,371 |
| Net change in unrealized appreciation (depreciation) on unaffiliated investments | (83,353,644) |
| Net realized and unrealized gain (loss) | (52,240,273) |
| Net increase (decrease) in net assets resulting from operations | $(29,311,174) |
The notes to the financial statements are an integral part of, and should be read in conjunction with, the financial statements.
| 16 | MainStay Epoch U.S. Equity Yield Fund |
Statements of Changes in Net Assets
for the years ended October 31, 2022 and October 31, 2021
| | 2022 | 2021 |
| Increase (Decrease) in Net Assets |
| Operations: | | |
| Net investment income (loss) | $ 22,929,099 | $ 19,263,207 |
| Net realized gain (loss) | 31,113,371 | 33,774,174 |
| Net change in unrealized appreciation (depreciation) | (83,353,644) | 237,975,102 |
| Net increase (decrease) in net assets resulting from operations | (29,311,174) | 291,012,483 |
| Distributions to shareholders: | | |
| Class A | (9,203,234) | (9,072,614) |
| Investor Class | (1,240,229) | (1,494,104) |
| Class B | (52,088) | (89,076) |
| Class C | (106,742) | (169,662) |
| Class I | (7,426,431) | (7,402,130) |
| Class R1 | (14,511) | (16,551) |
| Class R2 | (24,522) | (34,197) |
| Class R3 | (44,187) | (55,673) |
| Class R6 | (3,012,144) | (2,673,834) |
| SIMPLE Class | (929) | (427) |
| Total distributions to shareholders | (21,125,017) | (21,008,268) |
| Capital share transactions: | | |
| Net proceeds from sales of shares | 139,051,648 | 131,984,621 |
| Net asset value of shares issued to shareholders in reinvestment of distributions | 20,858,991 | 20,724,582 |
| Cost of shares redeemed | (169,519,523) | (169,506,829) |
| Increase (decrease) in net assets derived from capital share transactions | (9,608,884) | (16,797,626) |
| Net increase (decrease) in net assets | (60,045,075) | 253,206,589 |
| Net Assets |
| Beginning of year | 1,123,941,925 | 870,735,336 |
| End of year | $1,063,896,850 | $1,123,941,925 |
The notes to the financial statements are an integral part of, and should be read in conjunction with, the financial statements.
17
Financial Highlights selected per share data and ratios
| | Year Ended October 31, |
| Class A | 2022 | | 2021 | | 2020 | | 2019 | | 2018 |
| Net asset value at beginning of year | $ 19.70 | | $ 14.96 | | $ 17.07 | | $ 15.70 | | $ 16.31 |
| Net investment income (loss) (a) | 0.39 | | 0.32 | | 0.36 | | 0.36 | | 0.33 |
| Net realized and unrealized gain (loss) | (0.95) | | 4.78 | | (1.83) | | 1.84 | | (0.06) |
| Total from investment operations | (0.56) | | 5.10 | | (1.47) | | 2.20 | | 0.27 |
| Less distributions: | | | | | | | | | |
| From net investment income | (0.36) | | (0.36) | | (0.34) | | (0.37) | | (0.32) |
| From net realized gain on investments | — | | — | | (0.30) | | (0.46) | | (0.56) |
| Total distributions | (0.36) | | (0.36) | | (0.64) | | (0.83) | | (0.88) |
| Net asset value at end of year | $ 18.78 | | $ 19.70 | | $ 14.96 | | $ 17.07 | | $ 15.70 |
| Total investment return (b) | (2.85)% | | 34.30% | | (8.77)% | | 14.49% | | 1.62% |
| Ratios (to average net assets)/Supplemental Data: | | | | | | | | | |
| Net investment income (loss) | 2.00% | | 1.76% | | 2.31% | | 2.21% | | 2.06% |
| Net expenses (c) | 1.05% | | 1.07% | | 1.08%(d) | | 1.08% | | 1.07% |
| Expenses (before waiver/reimbursement) (c) | 1.05% | | 1.07% | | 1.09% | | 1.08% | | 1.07% |
| Portfolio turnover rate | 25% | | 16% | | 29% | | 18% | | 17% |
| Net assets at end of year (in 000’s) | $ 483,936 | | $ 508,888 | | $ 379,695 | | $ 450,979 | | $ 405,863 |
| (a) | Per share data based on average shares outstanding during the year. |
| (b) | Total investment return is calculated exclusive of sales charges and assumes the reinvestment of dividends and distributions. For periods of less than one year, total return is not annualized. |
| (c) | In addition to the fees and expenses which the Fund bears directly, it also indirectly bears a pro-rata share of the fees and expenses of the underlying funds in which it invests. Such indirect expenses are not included in the above expense ratios. |
| (d) | Net of interest expense of less than 0.01%. |
| | Year Ended October 31, |
| Investor Class | 2022 | | 2021 | | 2020 | | 2019 | | 2018 |
| Net asset value at beginning of year | $ 19.61 | | $ 14.89 | | $ 16.99 | | $ 15.63 | | $ 16.24 |
| Net investment income (loss) (a) | 0.34 | | 0.28 | | 0.32 | | 0.32 | | 0.30 |
| Net realized and unrealized gain (loss) | (0.95) | | 4.75 | | (1.82) | | 1.83 | | (0.06) |
| Total from investment operations | (0.61) | | 5.03 | | (1.50) | | 2.15 | | 0.24 |
| Less distributions: | | | | | | | | | |
| From net investment income | (0.31) | | (0.31) | | (0.30) | | (0.33) | | (0.29) |
| From net realized gain on investments | — | | — | | (0.30) | | (0.46) | | (0.56) |
| Total distributions | (0.31) | | (0.31) | | (0.60) | | (0.79) | | (0.85) |
| Net asset value at end of year | $ 18.69 | | $ 19.61 | | $ 14.89 | | $ 16.99 | | $ 15.63 |
| Total investment return (b) | (3.12)% | | 33.96% | | (8.99)% | | 14.25% | | 1.45% |
| Ratios (to average net assets)/Supplemental Data: | | | | | | | | | |
| Net investment income (loss) | 1.75% | | 1.53% | | 2.07% | | 2.01% | | 1.90% |
| Net expenses (c) | 1.30% | | 1.33% | | 1.33%(d) | | 1.30% | | 1.24% |
| Expenses (before waiver/reimbursement) (c) | 1.30% | | 1.39% | | 1.38% | | 1.35% | | 1.29% |
| Portfolio turnover rate | 25% | | 16% | | 29% | | 18% | | 17% |
| Net assets at end of year (in 000's) | $ 73,132 | | $ 86,155 | | $ 81,365 | | $ 100,602 | | $ 98,939 |
| (a) | Per share data based on average shares outstanding during the year. |
| (b) | Total investment return is calculated exclusive of sales charges and assumes the reinvestment of dividends and distributions. For periods of less than one year, total return is not annualized. |
| (c) | In addition to the fees and expenses which the Fund bears directly, it also indirectly bears a pro-rata share of the fees and expenses of the underlying funds in which it invests. Such indirect expenses are not included in the above expense ratios. |
| (d) | Net of interest expense of less than 0.01%. |
The notes to the financial statements are an integral part of, and should be read in conjunction with, the financial statements.
| 18 | MainStay Epoch U.S. Equity Yield Fund |
Financial Highlights selected per share data and ratios
| | Year Ended October 31, |
| Class B | 2022 | | 2021 | | 2020 | | 2019 | | 2018 |
| Net asset value at beginning of year | $ 19.00 | | $ 14.43 | | $ 16.48 | | $ 15.18 | | $ 15.79 |
| Net investment income (loss) (a) | 0.19 | | 0.14 | | 0.21 | | 0.20 | | 0.18 |
| Net realized and unrealized gain (loss) | (0.92) | | 4.60 | | (1.78) | | 1.77 | | (0.06) |
| Total from investment operations | (0.73) | | 4.74 | | (1.57) | | 1.97 | | 0.12 |
| Less distributions: | | | | | | | | | |
| From net investment income | (0.16) | | (0.17) | | (0.18) | | (0.21) | | (0.17) |
| From net realized gain on investments | — | | — | | (0.30) | | (0.46) | | (0.56) |
| Total distributions | (0.16) | | (0.17) | | (0.48) | | (0.67) | | (0.73) |
| Net asset value at end of year | $ 18.11 | | $ 19.00 | | $ 14.43 | | $ 16.48 | | $ 15.18 |
| Total investment return (b) | (3.82)% | | 32.98% | | (9.71)% | | 13.40% | | 0.70% |
| Ratios (to average net assets)/Supplemental Data: | | | | | | | | | |
| Net investment income (loss) | 1.01% | | 0.80% | | 1.36% | | 1.29% | | 1.18% |
| Net expenses (c) | 2.06% | | 2.08% | | 2.08%(d) | | 2.05% | | 1.99% |
| Expenses (before waiver/reimbursement) (c) | 2.06% | | 2.14% | | 2.13% | | 2.10% | | 2.04% |
| Portfolio turnover rate | 25% | | 16% | | 29% | | 18% | | 17% |
| Net assets at end of year (in 000’s) | $ 4,827 | | $ 7,840 | | $ 8,894 | | $ 14,579 | | $ 17,984 |
| (a) | Per share data based on average shares outstanding during the year. |
| (b) | Total investment return is calculated exclusive of sales charges and assumes the reinvestment of dividends and distributions. For periods of less than one year, total return is not annualized. |
| (c) | In addition to the fees and expenses which the Fund bears directly, it also indirectly bears a pro-rata share of the fees and expenses of the underlying funds in which it invests. Such indirect expenses are not included in the above expense ratios. |
| (d) | Net of interest expense of less than 0.01%. |
| | Year Ended October 31, |
| Class C | 2022 | | 2021 | | 2020 | | 2019 | | 2018 |
| Net asset value at beginning of year | $ 19.00 | | $ 14.43 | | $ 16.47 | | $ 15.17 | | $ 15.79 |
| Net investment income (loss) (a) | 0.19 | | 0.14 | | 0.20 | | 0.20 | | 0.18 |
| Net realized and unrealized gain (loss) | (0.92) | | 4.60 | | (1.76) | | 1.77 | | (0.07) |
| Total from investment operations | (0.73) | | 4.74 | | (1.56) | | 1.97 | | 0.11 |
| Less distributions: | | | | | | | | | |
| From net investment income | (0.16) | | (0.17) | | (0.18) | | (0.21) | | (0.17) |
| From net realized gain on investments | — | | — | | (0.30) | | (0.46) | | (0.56) |
| Total distributions | (0.16) | | (0.17) | | (0.48) | | (0.67) | | (0.73) |
| Net asset value at end of year | $ 18.11 | | $ 19.00 | | $ 14.43 | | $ 16.47 | | $ 15.17 |
| Total investment return (b) | (3.82)% | | 32.98% | | (9.66)% | | 13.41% | | 0.63% |
| Ratios (to average net assets)/Supplemental Data: | | | | | | | | | |
| Net investment income (loss) | 1.00% | | 0.81% | | 1.35% | | 1.30% | | 1.16% |
| Net expenses (c) | 2.06% | | 2.08% | | 2.08%(d) | | 2.05% | | 1.99% |
| Expenses (before waiver/reimbursement) (c) | 2.06% | | 2.14% | | 2.13% | | 2.10% | | 2.04% |
| Portfolio turnover rate | 25% | | 16% | | 29% | | 18% | | 17% |
| Net assets at end of year (in 000’s) | $ 10,961 | | $ 14,435 | | $ 17,920 | | $ 30,663 | | $ 40,888 |
| (a) | Per share data based on average shares outstanding during the year. |
| (b) | Total investment return is calculated exclusive of sales charges and assumes the reinvestment of dividends and distributions. For periods of less than one year, total return is not annualized. |
| (c) | In addition to the fees and expenses which the Fund bears directly, it also indirectly bears a pro-rata share of the fees and expenses of the underlying funds in which it invests. Such indirect expenses are not included in the above expense ratios. |
| (d) | Net of interest expense of less than 0.01%. |
The notes to the financial statements are an integral part of, and should be read in conjunction with, the financial statements.
19
Financial Highlights selected per share data and ratios
| | Year Ended October 31, |
| Class I | 2022 | | 2021 | | 2020 | | 2019 | | 2018 |
| Net asset value at beginning of year | $ 19.91 | | $ 15.11 | | $ 17.24 | | $ 15.85 | | $ 16.46 |
| Net investment income (loss) (a) | 0.45 | | 0.39 | | 0.41 | | 0.40 | | 0.39 |
| Net realized and unrealized gain (loss) | (0.95) | | 4.82 | | (1.85) | | 1.86 | | (0.08) |
| Total from investment operations | (0.50) | | 5.21 | | (1.44) | | 2.26 | | 0.31 |
| Less distributions: | | | | | | | | | |
| From net investment income | (0.42) | | (0.41) | | (0.39) | | (0.41) | | (0.36) |
| From net realized gain on investments | — | | — | | (0.30) | | (0.46) | | (0.56) |
| Total distributions | (0.42) | | (0.41) | | (0.69) | | (0.87) | | (0.92) |
| Net asset value at end of year | $ 18.99 | | $ 19.91 | | $ 15.11 | | $ 17.24 | | $ 15.85 |
| Total investment return (b) | (2.50)% | | 34.78% | | (8.50)% | | 14.76% | | 1.86% |
| Ratios (to average net assets)/Supplemental Data: | | | | | | | | | |
| Net investment income (loss) | 2.32% | | 2.10% | | 2.63% | | 2.46% | | 2.37% |
| Net expenses (c) | 0.73% | | 0.73% | | 0.76%(d) | | 0.83% | | 0.81% |
| Expenses (before waiver/reimbursement) (c) | 0.80% | | 0.82% | | 0.84% | | 0.83% | | 0.81% |
| Portfolio turnover rate | 25% | | 16% | | 29% | | 18% | | 17% |
| Net assets at end of year (in 000’s) | $ 351,106 | | $ 357,565 | | $ 269,100 | | $ 313,261 | | $ 276,587 |
| (a) | Per share data based on average shares outstanding during the year. |
| (b) | Total investment return is calculated exclusive of sales charges and assumes the reinvestment of dividends and distributions. Class I shares are not subject to sales charges. For periods of less than one year, total return is not annualized. |
| (c) | In addition to the fees and expenses which the Fund bears directly, it also indirectly bears a pro-rata share of the fees and expenses of the underlying funds in which it invests. Such indirect expenses are not included in the above expense ratios. |
| (d) | Net of interest expense of less than 0.01%. |
| | Year Ended October 31, |
| Class R1 | 2022 | | 2021 | | 2020 | | 2019 | | 2018 |
| Net asset value at beginning of year | $ 19.90 | | $ 15.11 | | $ 17.24 | | $ 15.84 | | $ 16.45 |
| Net investment income (loss) (a) | 0.42 | | 0.35 | | 0.41 | | 0.38 | | 0.37 |
| Net realized and unrealized gain (loss) | (0.95) | | 4.82 | | (1.88) | | 1.87 | | (0.07) |
| Total from investment operations | (0.53) | | 5.17 | | (1.47) | | 2.25 | | 0.30 |
| Less distributions: | | | | | | | | | |
| From net investment income | (0.39) | | (0.38) | | (0.36) | | (0.39) | | (0.35) |
| From net realized gain on investments | — | | — | | (0.30) | | (0.46) | | (0.56) |
| Total distributions | (0.39) | | (0.38) | | (0.66) | | (0.85) | | (0.91) |
| Net asset value at end of year | $ 18.98 | | $ 19.90 | | $ 15.11 | | $ 17.24 | | $ 15.84 |
| Total investment return (b) | (2.66)% | | 34.50% | | (8.66)% | | 14.73% | | 1.69% |
| Ratios (to average net assets)/Supplemental Data: | | | | | | | | | |
| Net investment income (loss) | 2.13% | | 1.91% | | 2.54% | | 2.32% | | 2.31% |
| Net expenses (c) | 0.90% | | 0.92% | | 0.93%(d) | | 0.93% | | 0.92% |
| Expenses (before waiver/reimbursement) (c) | 0.90% | | 0.92% | | 0.94% | | 0.93% | | 0.92% |
| Portfolio turnover rate | 25% | | 16% | | 29% | | 18% | | 17% |
| Net assets at end of year (in 000’s) | $ 751 | | $ 719 | | $ 530 | | $ 1,009 | | $ 778 |
| (a) | Per share data based on average shares outstanding during the year. |
| (b) | Total investment return is calculated exclusive of sales charges and assumes the reinvestment of dividends and distributions. Class R1 shares are not subject to sales charges. For periods of less than one year, total return is not annualized. |
| (c) | In addition to the fees and expenses which the Fund bears directly, it also indirectly bears a pro-rata share of the fees and expenses of the underlying funds in which it invests. Such indirect expenses are not included in the above expense ratios. |
| (d) | Net of interest expense of less than 0.01%. |
The notes to the financial statements are an integral part of, and should be read in conjunction with, the financial statements.
| 20 | MainStay Epoch U.S. Equity Yield Fund |
Financial Highlights selected per share data and ratios
| | Year Ended October 31, |
| Class R2 | 2022 | | 2021 | | 2020 | | 2019 | | 2018 |
| Net asset value at beginning of year | $ 19.69 | | $ 14.95 | | $ 17.06 | | $ 15.69 | | $ 16.30 |
| Net investment income (loss) (a) | 0.37 | | 0.32 | | 0.35 | | 0.34 | | 0.32 |
| Net realized and unrealized gain (loss) | (0.95) | | 4.76 | | (1.84) | | 1.84 | | (0.06) |
| Total from investment operations | (0.58) | | 5.08 | | (1.49) | | 2.18 | | 0.26 |
| Less distributions: | | | | | | | | | |
| From net investment income | (0.33) | | (0.34) | | (0.32) | | (0.35) | | (0.31) |
| From net realized gain on investments | — | | — | | (0.30) | | (0.46) | | (0.56) |
| Total distributions | (0.33) | | (0.34) | | (0.62) | | (0.81) | | (0.87) |
| Net asset value at end of year | $ 18.78 | | $ 19.69 | | $ 14.95 | | $ 17.06 | | $ 15.69 |
| Total investment return (b) | (2.91)% | | 34.20% | | (8.87)% | | 14.39% | | 1.51% |
| Ratios (to average net assets)/Supplemental Data: | | | | | | | | | |
| Net investment income (loss) | 1.90% | | 1.76% | | 2.23% | | 2.12% | | 2.02% |
| Net expenses (c) | 1.15% | | 1.17% | | 1.18%(d) | | 1.18% | | 1.17% |
| Expenses (before waiver/reimbursement) (c) | 1.15% | | 1.17% | | 1.19% | | 1.18% | | 1.17% |
| Portfolio turnover rate | 25% | | 16% | | 29% | | 18% | | 17% |
| Net assets at end of year (in 000’s) | $ 1,315 | | $ 1,609 | | $ 2,135 | | $ 2,812 | | $ 2,665 |
| (a) | Per share data based on average shares outstanding during the year. |
| (b) | Total investment return is calculated exclusive of sales charges and assumes the reinvestment of dividends and distributions. Class R2 shares are not subject to sales charges. For periods of less than one year, total return is not annualized. |
| (c) | In addition to the fees and expenses which the Fund bears directly, it also indirectly bears a pro-rata share of the fees and expenses of the underlying funds in which it invests. Such indirect expenses are not included in the above expense ratios. |
| (d) | Net of interest expense of less than 0.01%. |
| | Year Ended October 31, |
| Class R3 | 2022 | | 2021 | | 2020 | | 2019 | | 2018 |
| Net asset value at beginning of year | $ 19.70 | | $ 14.96 | | $ 17.06 | | $ 15.69 | | $ 16.30 |
| Net investment income (loss) (a) | 0.32 | | 0.26 | | 0.31 | | 0.30 | | 0.28 |
| Net realized and unrealized gain (loss) | (0.95) | | 4.77 | | (1.83) | | 1.84 | | (0.07) |
| Total from investment operations | (0.63) | | 5.03 | | (1.52) | | 2.14 | | 0.21 |
| Less distributions: | | | | | | | | | |
| From net investment income | (0.28) | | (0.29) | | (0.28) | | (0.31) | | (0.26) |
| From net realized gain on investments | — | | — | | (0.30) | | (0.46) | | (0.56) |
| Total distributions | (0.28) | | (0.29) | | (0.58) | | (0.77) | | (0.82) |
| Net asset value at end of year | $ 18.79 | | $ 19.70 | | $ 14.96 | | $ 17.06 | | $ 15.69 |
| Total investment return (b) | (3.17)% | | 33.83% | | (9.06)% | | 14.11% | | 1.25% |
| Ratios (to average net assets)/Supplemental Data: | | | | | | | | | |
| Net investment income (loss) | 1.66% | | 1.45% | | 1.96% | | 1.86% | | 1.75% |
| Net expenses (c) | 1.40% | | 1.42% | | 1.43%(d) | | 1.43% | | 1.42% |
| Expenses (before waiver/reimbursement) (c) | 1.40% | | 1.42% | | 1.44% | | 1.43% | | 1.42% |
| Portfolio turnover rate | 25% | | 16% | | 29% | | 18% | | 17% |
| Net assets at end of year (in 000’s) | $ 2,602 | | $ 3,252 | | $ 3,184 | | $ 4,339 | | $ 3,817 |
| (a) | Per share data based on average shares outstanding during the year. |
| (b) | Total investment return is calculated exclusive of sales charges and assumes the reinvestment of dividends and distributions. Class R3 shares are not subject to sales charges. For periods of less than one year, total return is not annualized. |
| (c) | In addition to the fees and expenses which the Fund bears directly, it also indirectly bears a pro-rata share of the fees and expenses of the underlying funds in which it invests. Such indirect expenses are not included in the above expense ratios. |
| (d) | Net of interest expense of less than 0.01%. |
The notes to the financial statements are an integral part of, and should be read in conjunction with, the financial statements.
21
Financial Highlights selected per share data and ratios
| | Year Ended October 31, |
| Class R6 | 2022 | | 2021 | | 2020 | | 2019 | | 2018 |
| Net asset value at beginning of year | $ 19.92 | | $ 15.12 | | $ 17.25 | | $ 15.85 | | $ 16.46 |
| Net investment income (loss) (a) | 0.46 | | 0.39 | | 0.42 | | 0.42 | | 0.37 |
| Net realized and unrealized gain (loss) | (0.97) | | 4.83 | | (1.86) | | 1.86 | | (0.04) |
| Total from investment operations | (0.51) | | 5.22 | | (1.44) | | 2.28 | | 0.33 |
| Less distributions: | | | | | | | | | |
| From net investment income | (0.42) | | (0.42) | | (0.39) | | (0.42) | | (0.38) |
| From net realized gain on investments | — | | — | | (0.30) | | (0.46) | | (0.56) |
| Total distributions | (0.42) | | (0.42) | | (0.69) | | (0.88) | | (0.94) |
| Net asset value at end of year | $ 18.99 | | $ 19.92 | | $ 15.12 | | $ 17.25 | | $ 15.85 |
| Total investment return (b) | (2.54)% | | 34.78% | | (8.46)% | | 14.94% | | 1.95% |
| Ratios (to average net assets)/Supplemental Data: | | | | | | | | | |
| Net investment income (loss) | 2.32% | | 2.11% | | 2.68% | | 2.60% | | 2.31% |
| Net expenses (c) | 0.73% | | 0.73% | | 0.73%(d) | | 0.73% | | 0.73% |
| Expenses (before waiver/reimbursement) (c) | 0.73% | | 0.73% | | 0.74% | | 0.73% | | 0.73% |
| Portfolio turnover rate | 25% | | 16% | | 29% | | 18% | | 17% |
| Net assets at end of year (in 000’s) | $ 135,192 | | $ 143,436 | | $ 107,887 | | $ 165,999 | | $ 190,456 |
| (a) | Per share data based on average shares outstanding during the year. |
| (b) | Total investment return is calculated exclusive of sales charges and assumes the reinvestment of dividends and distributions. Class R6 shares are not subject to sales charges. For periods of less than one year, total return is not annualized. |
| (c) | In addition to the fees and expenses which the Fund bears directly, it also indirectly bears a pro-rata share of the fees and expenses of the underlying funds in which it invests. Such indirect expenses are not included in the above expense ratios. |
| (d) | Net of interest expense of less than 0.01%. |
| | Year Ended October 31, | | August 31, 2020^ through
October 31, |
| SIMPLE Class | 2022 | | 2021 | | 2020 |
| Net asset value at beginning of period | $ 19.65 | | $ 14.89 | | $ 15.57* |
| Net investment income (loss) (a) | 0.28 | | 0.22 | | 0.03 |
| Net realized and unrealized gain (loss) | (0.93) | | 4.76 | | (0.68) |
| Total from investment operations | (0.65) | | 4.98 | | (0.65) |
| Less distributions: | | | | | |
| From net investment income | (0.26) | | (0.22) | | (0.03) |
| Net asset value at end of period | $ 18.74 | | $ 19.65 | | $ 14.89 |
| Total investment return (b) | (3.34)% | | 33.61% | | (4.16)% |
| Ratios (to average net assets)/Supplemental Data: | | | | | |
| Net investment income (loss) | 1.48% | | 1.20% | | 0.98%†† |
| Net expenses (c) | 1.55% | | 1.58% | | 1.57%††(d) |
| Expenses (before waiver/reimbursement) (c) | 1.55% | | 1.65% | | 1.63%†† |
| Portfolio turnover rate | 25% | | 16% | | 29% |
| Net assets at end of period (in 000’s) | $ 77 | | $ 43 | | $ 24 |
| ^ | Inception date. |
| * | Based on the net asset value of Investor Class as of August 31, 2020. |
| †† | Annualized. |
| (a) | Per share data based on average shares outstanding during the period. |
| (b) | Total investment return is calculated exclusive of sales charges and assumes the reinvestment of dividends and distributions. SIMPLE Class shares are not subject to sales charges. For periods of less than one year, total return is not annualized. |
| (c) | In addition to the fees and expenses which the Fund bears directly, it also indirectly bears a pro-rata share of the fees and expenses of the underlying funds in which it invests. Such indirect expenses are not included in the above expense ratios. |
| (d) | Net of interest expense of less than 0.01%. |
The notes to the financial statements are an integral part of, and should be read in conjunction with, the financial statements.
| 22 | MainStay Epoch U.S. Equity Yield Fund |
Notes to Financial Statements
Note 1-Organization and Business
MainStay Funds Trust (the “Trust”) was organized as a Delaware statutory trust on April 28, 2009. The Trust is registered under the Investment Company Act of 1940, as amended (the “1940 Act”), as an open-end management investment company, and is comprised of thirty-three funds (collectively referred to as the “Funds”). These financial statements and notes relate to the MainStay Epoch U.S. Equity Yield Fund (the "Fund"), a “diversified” fund, as that term is defined in the 1940 Act, as interpreted or modified by regulatory authorities having jurisdiction, from time to time.
The following table lists the Fund's share classes that have been registered and commenced operations:
| Class | Commenced Operations |
| Class A | February 3, 2009 |
| Investor Class | November 16, 2009 |
| Class B | May 08, 2017 |
| Class C | November 16, 2009 |
| Class I | December 3, 2008 |
| Class R1 | May 8, 2017 |
| Class R2 | May 8, 2017 |
| Class R3 | May 8, 2017 |
| Class R6 | May 8, 2017 |
| SIMPLE Class | August 31, 2020 |
Class B shares of the MainStay Group of Funds are closed to all new purchases as well as additional investments by existing Class B shareholders. Existing Class B shareholders may continue to reinvest dividends and capital gains distributions, as well as exchange their Class B shares for Class B shares of other funds in the MainStay Group of Funds as permitted by the current exchange privileges. Class B shareholders continue to be subject to any applicable contingent deferred sales charge ("CDSC") at the time of redemption. All other features of the Class B shares, including but not limited to the fees and expenses applicable to Class B shares, remain unchanged. Unless redeemed, Class B shareholders will remain in Class B shares of their respective fund until the Class B shares are converted to Class A or Investor Class shares pursuant to the applicable conversion schedule.
Class A and Investor Class shares are offered at net asset value (“NAV”) per share plus an initial sales charge. No initial sales charge applies to investments of $1 million or more (and certain other qualified purchases) in Class A and Investor Class shares. However, a CDSC of 1.00% may be imposed on certain redemptions made within 18 months of the date of purchase on shares that were purchased without an initial sales charge. Class B and Class C shares are offered at NAV without an initial sales charge, although a CDSC that declines depending on the number of years a shareholder held its Class B shares may be imposed on redemptions made within six years of the date of purchase of such shares and a 1.00% CDSC may be imposed on redemptions made within one year of the date of purchase of Class C shares. Class I, Class R1, Class R2, Class R3, Class R6 and SIMPLE Class shares are offered at NAV without a sales charge. Depending upon eligibility, Class B shares convert to either
Class A or Investor Class shares at the end of the calendar quarter eight years after the date they were purchased. In addition, depending upon eligibility, Class C shares convert to either Class A or Investor Class shares at the end of the calendar quarter eight years after the date they were purchased. Additionally, Investor Class shares may convert automatically to Class A shares. SIMPLE Class shares convert to Class A shares, or Investor Class shares if you are not eligible to hold Class A shares, at the end of the calendar quarter, ten years after the date they were purchased. Share class conversions are based on the relevant NAVs of the two classes at the time of the conversion, and no sales load or other charge is imposed. Under certain circumstances and as may be permitted by the Trust’s multiple class plan pursuant to Rule 18f-3 under the 1940 Act, specified share classes of the Fund may be converted to one or more other share classes of the Fund as disclosed in the capital share transactions within these Notes. The classes of shares have the same voting (except for issues that relate solely to one class), dividend, liquidation and other rights, and the same terms and conditions, except that Class B and Class C shares are subject to higher distribution and/or service fees than Class A, Investor Class, Class R2, Class R3 and SIMPLE Class shares under distribution plans pursuant to Rule 12b-1 under the 1940 Act. Class I, Class R1 and Class R6 shares are not subject to a distribution and/or service fee. Class R1, Class R2 and Class R3 shares are subject to a shareholder service fee, which is in addition to fees paid under a distribution plan for Class R1, Class R2 and Class R3 shares.
The Fund's investment objective is to seek current income and capital appreciation.
Note 2–Significant Accounting Policies
The Fund is an investment company and accordingly follows the investment company accounting and reporting guidance of the Financial Accounting Standards Board (“FASB”) Accounting Standards Codification Topic 946 Financial Services—Investment Companies. The Fund prepares its financial statements in accordance with generally accepted accounting principles (“GAAP”) in the United States of America and follows the significant accounting policies described below.
(A) Securities Valuation. Investments are usually valued as of the close of regular trading on the New York Stock Exchange (the "Exchange") (usually 4:00 p.m. Eastern time) on each day the Fund is open for business ("valuation date").
Effective September 8, 2022, and pursuant to Rule 2a-5 under the 1940 Act, the Board of Trustees of the Trust (the "Board") designated New York Life Investment Management LLC (“New York Life Investments” or the "Manager") as its Valuation Designee (the "Valuation Designee"). The Valuation Designee is responsible for performing fair valuations relating to all investments in the Fund’s portfolio for which market quotations are not readily available; periodically assessing and managing material valuation risks; establishing and applying fair value methodologies; testing fair valuation methodologies; evaluating and overseeing pricing services; segregation of valuation and portfolio management functions; providing quarterly, annual and prompt reporting to the Board, as appropriate;
Notes to Financial Statements (continued)
identifying potential conflicts of interest; and maintaining appropriate records. The Valuation Designee has established a valuation committee ("Valuation Committee") to assist in carrying out the Valuation Designee’s responsibilities and establish prices of securities for which market quotations are not readily available. The Fund’s and the Valuation Designee's policies and procedures ("Valuation Procedures") govern the Valuation Designee’s selection and application of methodologies for determining and calculating the fair value of Fund investments. The Valuation Designee may value Fund portfolio securities for which market quotations are not readily available and other Fund assets utilizing inputs from pricing services and other third-party sources (together, “Pricing Sources”). The Valuation Committee meets (in person, via electronic mail or via teleconference) on an ad-hoc basis to determine fair valuations and on a quarterly basis to review fair value events (excluding fair valuations from pricing services), including valuation risks and back-testing results, and preview reports to the Board.
The Valuation Committee establishes prices of securities for which market quotations are not readily available based on such methodologies and measurements on a regular basis after considering information that is reasonably available and deemed relevant by the Valuation Committee. The Board shall oversee the Valuation Designee and review fair valuation materials on a prompt, quarterly and annual basis and approve proposed revisions to the Valuation Procedures.
Investments for which market quotations are not readily available are valued at fair value as determined in good faith pursuant to the Valuation Procedures. A market quotation is readily available only when that quotation is a quoted price (unadjusted) in active markets for identical investments that the Fund can access at the measurement date, provided that a quotation will not be readily available if it is not reliable. Fair value measurements are determined within a framework that establishes a three-tier hierarchy that maximizes the use of observable market data and minimizes the use of unobservable inputs to establish a classification of fair value measurements for disclosure purposes. "Inputs" refer broadly to the assumptions that market participants would use in pricing the asset or liability, including assumptions about risk, such as the risk inherent in a particular valuation technique used to measure fair value using a pricing model and/or the risk inherent in the inputs for the valuation technique. Inputs may be observable or unobservable. Observable inputs reflect the assumptions market participants would use in pricing the asset or liability based on market data obtained from sources independent of the Fund. Unobservable inputs reflect the Fund’s own assumptions about the assumptions market participants would use in pricing the asset or liability based on the information available. The inputs or methodology used for valuing assets or liabilities may not be an indication of the risks associated with investing in those assets or liabilities. The three-tier hierarchy of inputs is summarized below.
| • | Level 1—quoted prices (unadjusted) in active markets for an identical asset or liability |
| • | Level 2—other significant observable inputs (including quoted prices for a similar asset or liability in active markets, interest rates and yield curves, prepayment speeds, credit risk, etc.) |
| • | Level 3—significant unobservable inputs (including the Fund's own assumptions about the assumptions that market participants would use in measuring fair value of an asset or liability) |
The level of an asset or liability within the fair value hierarchy is based on the lowest level of an input, both individually and in the aggregate, that is significant to the fair value measurement. The aggregate value by input level of the Fund’s assets and liabilities as of October 31, 2022, is included at the end of the Portfolio of Investments.
The Fund may use third-party vendor evaluations, whose prices may be derived from one or more of the following standard inputs, among others:
| • Broker/dealer quotes | • Benchmark securities |
| • Two-sided markets | • Reference data (corporate actions or material event notices) |
| • Bids/offers | • Monthly payment information |
| • Industry and economic events | • Reported trades |
An asset or liability for which a market quotation is not readily available is valued by methods deemed reasonable in good faith by the Valuation Committee, following the Valuation Procedures to represent fair value. Under these procedures, the Valuation Designee generally uses a market-based approach which may use related or comparable assets or liabilities, recent transactions, market multiples, book values and other relevant information. The Valuation Designee may also use an income-based valuation approach in which the anticipated future cash flows of the asset or liability are discounted to calculate fair value. Discounts may also be applied due to the nature and/or duration of any restrictions on the disposition of the asset or liability. Fair value represents a good faith approximation of the value of a security. Fair value determinations involve the consideration of a number of subjective factors, an analysis of applicable facts and circumstances and the exercise of judgment. As a result, it is possible that the fair value for a security determined in good faith in accordance with the Valuation Procedures may differ from valuations for the same security determined for other funds using their own valuation procedures. Although the Valuation Procedures are designed to value a security at the price the Fund may reasonably expect to receive upon the security's sale in an orderly transaction, there can be no assurance that any fair value determination thereunder would, in fact, approximate the amount that the Fund would actually realize upon the sale of the security or the price at which the security would trade if a reliable market price were readily available. During the year ended October 31, 2022, there were no material changes to the fair value methodologies.
Securities which may be valued in this manner include, but are not limited to: (i) a security for which trading has been halted or suspended or otherwise does not have a readily available market quotation on a given day; (ii) a debt security that has recently gone into default and for which there is not a current market quotation; (iii) a security of an issuer that
| 24 | MainStay Epoch U.S. Equity Yield Fund |
has entered into a restructuring; (iv) a security that has been delisted from a national exchange; (v) a security subject to trading collars for which no or limited trading takes place; and (vi) a security whose principal market has been temporarily closed at a time when, under normal conditions, it would be open. Securities valued in this manner are generally categorized as Level 2 or 3 in the hierarchy.
Equity securities are valued at the last quoted sales prices as of the close of regular trading on the relevant exchange on each valuation date. Securities that are not traded on the valuation date are valued at the mean of the last quoted bid and ask prices. Prices are normally taken from the principal market in which each security trades. These securities are generally categorized as Level 1 in the hierarchy.
Investments in mutual funds, including money market funds, are valued at their respective NAVs at the close of business each day on the valuation date. These securities are generally categorized as Level 1 in the hierarchy.
Temporary cash investments acquired in excess of 60 days to maturity at the time of purchase are valued using the latest bid prices or using valuations based on a matrix system (which considers such factors as security prices, yields, maturities and ratings), both as furnished by independent pricing services. Temporary cash investments that mature in 60 days or less at the time of purchase ("Short-Term Investments") are valued using the amortized cost method of valuation, unless the use of such method would be inappropriate. The amortized cost method involves valuing a security at its cost on the date of purchase and thereafter assuming a constant amortization to maturity of the difference between such cost and the value on maturity date. Amortized cost approximates the current fair value of a security. Securities valued using the amortized cost method are not valued using quoted prices in an active market and are generally categorized as Level 2 in the hierarchy.
The information above is not intended to reflect an exhaustive list of the methodologies that may be used to value portfolio investments. The Valuation Procedures permit the use of a variety of valuation methodologies in connection with valuing portfolio investments. The methodology used for a specific type of investment may vary based on the market data available or other considerations. The methodologies summarized above may not represent the specific means by which portfolio investments are valued on any particular business day.
(B) Income Taxes. The Fund's policy is to comply with the requirements of the Internal Revenue Code of 1986, as amended (the “Internal Revenue Code”), applicable to regulated investment companies and to distribute all of its taxable income to the shareholders of the Fund within the allowable time limits.
The Manager evaluates the Fund’s tax positions to determine if the tax positions taken meet the minimum recognition threshold in connection with accounting for uncertainties in income tax positions taken or expected to be taken for the purposes of measuring and recognizing tax liabilities in the financial statements. Recognition of tax benefits of an uncertain tax position is permitted only to the extent the position is “more
likely than not” to be sustained assuming examination by taxing authorities. The Manager analyzed the Fund's tax positions taken on federal, state and local income tax returns for all open tax years (for up to three tax years) and has concluded that no provisions for federal, state and local income tax are required in the Fund's financial statements. The Fund's federal, state and local income tax and federal excise tax returns for tax years for which the applicable statutes of limitations have not expired are subject to examination by the Internal Revenue Service and state and local departments of revenue.
(C) Dividends and Distributions to Shareholders. Dividends and distributions are recorded on the ex-dividend date. The Fund intends to declare and pay dividends from net investment income, if any, at least quarterly and distributions from net realized capital and currency gains, if any, at least annually. Unless a shareholder elects otherwise, all dividends and distributions are reinvested at NAV in the same class of shares of the Fund. Dividends and distributions to shareholders are determined in accordance with federal income tax regulations and may differ from determinations using GAAP.
(D) Security Transactions and Investment Income. The Fund records security transactions on the trade date. Realized gains and losses on security transactions are determined using the identified cost method. Dividend income is recognized on the ex-dividend date, net of any foreign tax withheld at the source, and interest income is accrued as earned using the effective interest rate method. Distributions received from real estate investment trusts may be classified as dividends, capital gains and/or return of capital.
Investment income and realized and unrealized gains and losses on investments of the Fund are allocated pro rata to the separate classes of shares based upon their relative net assets on the date the income is earned or realized and unrealized gains and losses are incurred.
(E) Expenses. Expenses of the Trust are allocated to the individual Funds in proportion to the net assets of the respective Funds when the expenses are incurred, except where direct allocations of expenses can be made. Expenses (other than transfer agent expenses and fees incurred under the shareholder services plans and/or the distribution plans further discussed in Note 3(B)) are allocated to separate classes of shares pro rata based upon their relative net assets on the date the expenses are incurred. The expenses borne by the Fund, including those of related parties to the Fund, are shown in the Statement of Operations.
Additionally, the Fund may invest in mutual funds, which are subject to management fees and other fees that may cause the costs of investing in mutual funds to be greater than the costs of owning the underlying securities directly. These indirect expenses of mutual funds are not included in the amounts shown as expenses in the Statement of Operations or in the expense ratios included in the Financial Highlights.
(F) Use of Estimates. In preparing financial statements in conformity with GAAP, the Manager makes estimates and assumptions that affect the reported amounts and disclosures in the financial statements. Actual results could differ from those estimates and assumptions.
Notes to Financial Statements (continued)
(G) Securities Lending. In order to realize additional income, the Fund may engage in securities lending, subject to the limitations set forth in the 1940 Act and relevant guidance by the staff of the Securities and Exchange Commission (“SEC”). If the Fund engages in securities lending, the Fund will lend through its custodian, JPMorgan Chase Bank, N.A., ("JPMorgan"), acting as securities lending agent on behalf of the Fund. Under the current arrangement, JPMorgan will manage the Fund's collateral in accordance with the securities lending agency agreement between the Fund and JPMorgan, and indemnify the Fund against counterparty risk. The loans will be collateralized by cash (which may be invested in a money market fund) and/or non-cash collateral (which may include U.S. Treasury securities and/or U.S. government agency securities issued or guaranteed by the United States government or its agencies or instrumentalities) at least equal at all times to the market value of the securities loaned. Non-cash collateral held at year end is segregated and cannot be transferred by the Fund. The Fund bears the risk of delay in recovery of, or loss of rights in, the securities loaned. The Fund may also record a realized gain or loss on securities deemed sold due to a borrower’s inability to return securities on loan. The Fund bears the risk of any loss on investment of cash collateral. The Fund will receive compensation for lending its securities in the form of fees or it will retain a portion of interest earned on the investment of any cash collateral. The Fund will also continue to receive interest and dividends on the securities loaned and any gain or loss in the market price of the securities loaned that may occur during the term of the loan will be for the account of the Fund. Income earned from securities lending activities, if any, is reflected in the Statement of Operations. Securities on loan as of October 31, 2022, are shown in the Portfolio of Investments.
(H) Large Transaction Risks. From time to time, the Fund may receive large purchase or redemption orders from affiliated or unaffiliated mutual funds or other investors. Such large transactions could have adverse effects on the Fund’s performance if the Fund were required to sell securities or invest cash at times when it otherwise would not do so. This activity could also accelerate the realization of capital gains and increase the Fund’s transaction costs. The Fund has adopted procedures designed to mitigate the negative impacts of such large transactions, but there can be no assurance that these procedures will be effective.
(I) Indemnifications. Under the Trust’s organizational documents, its officers and trustees are indemnified against certain liabilities that may arise out of performance of their duties to the Trust. Additionally, in the normal course of business, the Fund enters into contracts with third-party service providers that contain a variety of representations and warranties and that may provide general indemnifications. The Fund's maximum exposure under these arrangements is unknown, as this would involve future claims that may be made against the Fund that have not yet occurred. The Manager believes that the risk of loss in connection with these potential indemnification obligations is remote. However, there can be no assurance that material liabilities related to such obligations will not arise in the future, which could adversely impact the Fund.
Note 3–Fees and Related Party Transactions
(A) Manager and Subadvisor. New York Life Investments, a registered investment adviser and an indirect, wholly-owned subsidiary of New York Life Insurance Company ("New York Life"), serves as the Fund's Manager, pursuant to an Amended and Restated Management Agreement (“Management Agreement”). The Manager provides offices, conducts clerical, recordkeeping and bookkeeping services and keeps most of the financial and accounting records required to be maintained by the Fund. Except for the portion of salaries and expenses that are the responsibility of the Fund, the Manager pays the salaries and expenses of all personnel affiliated with the Fund and certain operational expenses of the Fund. During a portion of the year ended October 31, 2022, the Fund reimbursed New York Life Investments in an amount equal to the portion of the compensation of the Chief Compliance Officer attributable to the Fund. Epoch Investment Partners, Inc. (“Epoch” or the “Subadvisor”), a registered investment adviser, serves as the Subadvisor to the Fund and is responsible for the day-to-day portfolio management of the Fund. Pursuant to the terms of an Amended and Restated Subadvisory Agreement (“Subadvisory Agreement”) between New York Life Investments and Epoch, New York Life Investments pays for the services of the Subadvisor.
Pursuant to the Management Agreement, the Fund pays the Manager a monthly fee for the services performed and the facilities furnished at an annual rate of the Fund’s average daily net assets as follows: 0.70% up to $500 million; 0.68% from $500 million to $1 billion; 0.66% from $1 billion to $2 billion; and 0.65% in excess of $2 billion. During the year ended October 31, 2022, the effective management fee rate was 0.69% of the Fund’s average daily net assets, exclusive of any applicable waivers/reimbursements.
New York Life Investments has contractually agreed to waive fees and/or reimburse expenses so that Total Annual Fund Operating Expenses (excluding taxes, interest, litigation, extraordinary expenses, brokerage and other transaction expenses relating to the purchase or sale of portfolio investments, and acquired (underlying) fund fees and expenses) of Class I do not exceed 0.73%. In addition, New York Life Investments will waive fees and/or reimburse expenses so that Total Annual Fund Operating Expenses (excluding taxes, interest, litigation, extraordinary expenses, brokerage and other transaction expenses relating to the purchase or sale of portfolio investments, and acquired (underlying) fund fees and expenses) of Class R6 do not exceed those of Class I. These agreements will remain in effect until February 28, 2023, and shall renew automatically for one-year terms unless New York Life Investments provides written notice of termination prior to the start of the next term or upon approval of the Board.
During the year ended October 31, 2022, New York Life Investments earned fees from the Fund in the amount of $7,478,759 and waived fees and/or reimbursed certain class specific expenses in the amount of $240,401 and paid the Subadvisor in the amount of $3,619,003.
| 26 | MainStay Epoch U.S. Equity Yield Fund |
JPMorgan provides sub-administration and sub-accounting services to the Fund pursuant to an agreement with New York Life Investments. These services include calculating the daily NAVs of the Fund, maintaining the general ledger and sub-ledger accounts for the calculation of the Fund's NAVs, and assisting New York Life Investments in conducting various aspects of the Fund's administrative operations. For providing these services to the Fund, JPMorgan is compensated by New York Life Investments.
Pursuant to an agreement between the Trust and New York Life Investments, New York Life Investments is responsible for providing or procuring certain regulatory reporting services for the Fund. The Fund will reimburse New York Life Investments for the actual costs incurred by New York Life Investments in connection with providing or procuring these services for the Fund.
(B) Distribution and Service Fees. The Trust, on behalf of the Fund, has entered into a distribution agreement with NYLIFE Distributors LLC (the “Distributor”), an affiliate of New York Life Investments. The Fund has adopted distribution plans (the “Plans”) in accordance with the provisions of Rule 12b-1 under the 1940 Act.
Pursuant to the Class A, Investor Class and Class R2 Plans, the Distributor receives a monthly fee from the Class A, Investor Class and Class R2 shares at an annual rate of 0.25% of the average daily net assets of the Class A, Investor Class and Class R2 shares for distribution and/or service activities as designated by the Distributor. Pursuant to the Class B and Class C Plans, Class B and Class C shares pay the Distributor a monthly distribution fee at an annual rate of 0.75% of the average daily net assets of the Class B and Class C shares, along with a service fee at an annual rate of 0.25% of the average daily net assets of the Class B and Class C shares, for a total 12b-1 fee of 1.00%. Pursuant to the Class R3 and SIMPLE Class Plans, Class R3 and SIMPLE Class shares pay the Distributor a monthly distribution fee at an annual rate of 0.25% of the average daily net assets of the Class R3 and SIMPLE Class shares, along with a service fee at an annual rate of 0.25% of the average daily net assets of the Class R3 and SIMPLE Class shares, for a total 12b-1 fee of 0.50%. Class I, Class R1 and Class R6 shares are not subject to a distribution and/or service fee.
The Plans provide that the distribution and service fees are payable to the Distributor regardless of the amounts actually expended by the Distributor for distribution of the Fund's shares and service activities.
In accordance with the Shareholder Services Plans for the Class R1, Class R2 and Class R3 shares, the Manager has agreed to provide, through its affiliates or independent third parties, various shareholder and administrative support services to shareholders of the Class R1, Class R2 and Class R3 shares. For its services, the Manager, its affiliates or independent third-party service providers are entitled to a shareholder service fee accrued daily and paid monthly at an annual rate of 0.10% of the average daily net assets of the Class R1, Class R2 and Class R3 shares. This is in addition to any fees paid under the Class R2 and Class R3 Plans.
During the year ended October 31, 2022, shareholder service fees incurred by the Fund were as follows:
| |
| Class R1 | $ 716 |
| Class R2 | 1,444 |
| Class R3 | 3,068 |
(C) Sales Charges. The Fund was advised by the Distributor that the amount of initial sales charges retained on sales of Class A and Investor Class shares during the year ended October 31, 2022, were $48,076 and $7,280, respectively.
The Fund was also advised that the Distributor retained CDSCs on redemptions of Class A, Investor Class, Class B and Class C shares during the year ended October 31, 2022, of $3,240, $57, $1,566 and $623, respectively.
(D) Transfer, Dividend Disbursing and Shareholder Servicing Agent. NYLIM Service Company LLC, an affiliate of New York Life Investments, is the Fund's transfer, dividend disbursing and shareholder servicing agent pursuant to an agreement between NYLIM Service Company LLC and the Trust. NYLIM Service Company LLC has entered into an agreement with DST Asset Manager Solutions, Inc. ("DST"), pursuant to which DST performs certain transfer agent services on behalf of NYLIM Service Company LLC. New York Life Investments has contractually agreed to limit the transfer agency expenses charged to the Fund’s share classes to a maximum of 0.35% of that share class’s average daily net assets on an annual basis after deducting any applicable Fund or class-level expense reimbursement or small account fees. This agreement will remain in effect until February 28, 2023, and shall renew automatically for one-year terms unless New York Life Investments provides written notice of termination prior to the start of the next term or upon approval of the Board. During the year ended October 31, 2022, transfer agent expenses incurred by the Fund and any reimbursements, pursuant to the aforementioned Transfer Agency expense limitation agreement, were as follows:
| Class | Expense | Waived |
| Class A | $384,586 | $— |
| Investor Class | 259,540 | — |
| Class B | 20,967 | — |
| Class C | 41,817 | — |
| Class I | 261,975 | — |
| Class R1 | 549 | — |
| Class R2 | 1,108 | — |
| Class R3 | 2,354 | — |
| Class R6 | 5,660 | — |
| SIMPLE Class | 230 | — |
(E) Small Account Fee. Shareholders with small accounts adversely impact the cost of providing transfer agency services. In an effort to reduce total transfer agency expenses, the Fund has implemented a small
Notes to Financial Statements (continued)
account fee on certain types of accounts. As described in the Fund's prospectus, certain shareholders with an account balance of less than $1,000 ($5,000 for Class A share accounts) are charged an annual per account fee of $20 (assessed semi-annually), the proceeds from which offset transfer agent fees as reflected in the Statement of Operations. This small account fee will not apply to certain types of accounts as described further in the Fund’s prospectus.
(F) Capital. As of October 31, 2022, New York Life and its affiliates beneficially held shares of the Fund with the values and percentages of net assets as follows:
Note 4-Federal Income Tax
As of October 31, 2022, the cost and unrealized appreciation (depreciation) of the Fund’s investment portfolio, including applicable derivative contracts and other financial instruments, as determined on a federal income tax basis, were as follows:
| | Federal Tax
Cost | Gross
Unrealized
Appreciation | Gross
Unrealized
(Depreciation) | Net
Unrealized
Appreciation/
(Depreciation) |
| Investments in Securities | $831,099,356 | $262,006,775 | $(30,922,592) | $231,084,183 |
As of October 31, 2022, the components of accumulated gain (loss) on a tax basis were as follows:
Ordinary
income | Accumulated
Capital
and Other
Gain (Loss) | Other
Temporary
Differences | Unrealized
Appreciation
(Depreciation) | Total
Accumulated
Gain (Loss) |
| $1,616,274 | $16,265,047 | $— | $222,530,311 | $240,411,632 |
The difference between book-basis and tax-basis unrealized appreciation (depreciation) is primarily due to wash sales and partnerships.
The following table discloses the current year reclassifications between total distributable earnings (loss) and additional paid-in capital arising from permanent differences; net assets as of October 31, 2022 were not affected.
| | Total
Distributable
Earnings (Loss) | Additional
Paid-In
Capital |
| | $2,486 | $(2,486) |
The reclassifications for the Fund are primarily due to different book and tax treatment of investments in partnerships.
The Fund utilized $15,674,033 of capital loss carryforwards during the year ended October 31, 2022.
During the years ended October 31, 2022 and October 31, 2021, the tax character of distributions paid as reflected in the Statements of Changes in Net Assets was as follows:
| | 2022 | 2021 |
| Distributions paid from: | | |
| Ordinary Income | $21,125,017 | $21,008,268 |
Note 5–Custodian
JPMorgan is the custodian of cash and securities held by the Fund. Custodial fees are charged to the Fund based on the Fund's net assets and/or the market value of securities held by the Fund and the number of certain transactions incurred by the Fund.
Note 6–Line of Credit
The Fund and certain other funds managed by New York Life Investments maintain a line of credit with a syndicate of banks in order to secure a source of funds for temporary purposes to meet unanticipated or excessive redemption requests.
Effective July 26, 2022, under the credit agreement (the “Credit Agreement”), the aggregate commitment amount is $600,000,000 with an additional uncommitted amount of $100,000,000. The commitment fee is an annual rate of 0.15% of the average commitment amount payable quarterly, regardless of usage, to JPMorgan, who serves as the agent to the syndicate. The commitment fee is allocated among the Fund and certain other funds managed by New York Life Investments based upon their respective net assets and other factors. Interest on any revolving credit loan is charged based upon the Federal Funds Rate, Daily Simple Secured Overnight Financing Rate ("SOFR") + 0.10%, or the Overnight Bank Funding Rate, whichever is higher. The Credit Agreement expires on July 25, 2023, although the Fund, certain other funds managed by New York Life Investments and the syndicate of banks may renew the Credit Agreement for an additional year on the same or different terms or enter into a credit agreement with a different syndicate of banks. Prior to July 26, 2022, the aggregate commitment amount and the commitment fee were the same as those under the current Credit Agreement. During the year ended October 31, 2022, there were no borrowings made or outstanding with respect to the Fund under the Credit Agreement.
Note 7–Interfund Lending Program
Pursuant to an exemptive order issued by the SEC, the Fund, along with certain other funds managed by New York Life Investments, may participate in an interfund lending program. The interfund lending program provides an alternative credit facility that permits the Fund and certain other funds managed by New York Life Investments to lend or borrow money for temporary purposes directly to or from one another, subject to the conditions of the exemptive order. During the year ended October 31, 2022, there were no interfund loans made or outstanding with respect to the Fund.
| 28 | MainStay Epoch U.S. Equity Yield Fund |
Note 8–Purchases and Sales of Securities (in 000’s)
During the year ended October 31, 2022, purchases and sales of securities, other than short-term securities, were $277,008 and $265,345, respectively.
Note 9–Capital Share Transactions
Transactions in capital shares for the years ended October 31, 2022 and October 31, 2021, were as follows:
| Class A | Shares | Amount |
| Year ended October 31, 2022: | | |
| Shares sold | 2,023,734 | $ 39,515,886 |
| Shares issued to shareholders in reinvestment of distributions | 480,909 | 9,018,052 |
| Shares redeemed | (3,068,447) | (59,210,657) |
| Net increase (decrease) in shares outstanding before conversion | (563,804) | (10,676,719) |
| Shares converted into Class A (See Note 1) | 497,544 | 9,884,122 |
| Shares converted from Class A (See Note 1) | (1,519) | (30,097) |
| Net increase (decrease) | (67,779) | $ (822,694) |
| Year ended October 31, 2021: | | |
| Shares sold | 2,249,277 | $ 40,750,326 |
| Shares issued to shareholders in reinvestment of distributions | 493,273 | 8,889,039 |
| Shares redeemed | (3,390,878) | (60,776,692) |
| Net increase (decrease) in shares outstanding before conversion | (648,328) | (11,137,327) |
| Shares converted into Class A (See Note 1) | 1,123,748 | 20,572,925 |
| Shares converted from Class A (See Note 1) | (28,366) | (495,003) |
| Net increase (decrease) | 447,054 | $ 8,940,595 |
| |
| Investor Class | Shares | Amount |
| Year ended October 31, 2022: | | |
| Shares sold | 133,288 | $ 2,595,443 |
| Shares issued to shareholders in reinvestment of distributions | 66,093 | 1,233,644 |
| Shares redeemed | (319,282) | (6,151,698) |
| Net increase (decrease) in shares outstanding before conversion | (119,901) | (2,322,611) |
| Shares converted into Investor Class (See Note 1) | 52,662 | 1,021,358 |
| Shares converted from Investor Class (See Note 1) | (414,979) | (8,255,610) |
| Net increase (decrease) | (482,218) | $ (9,556,863) |
| Year ended October 31, 2021: | | |
| Shares sold | 166,473 | $ 3,006,614 |
| Shares issued to shareholders in reinvestment of distributions | 83,434 | 1,486,548 |
| Shares redeemed | (416,188) | (7,482,548) |
| Net increase (decrease) in shares outstanding before conversion | (166,281) | (2,989,386) |
| Shares converted into Investor Class (See Note 1) | 77,902 | 1,417,638 |
| Shares converted from Investor Class (See Note 1) | (983,460) | (17,902,208) |
| Net increase (decrease) | (1,071,839) | $(19,473,956) |
| |
| Class B | Shares | Amount |
| Year ended October 31, 2022: | | |
| Shares sold | 4,380 | $ 83,831 |
| Shares issued to shareholders in reinvestment of distributions | 2,863 | 51,913 |
| Shares redeemed | (45,406) | (854,600) |
| Net increase (decrease) in shares outstanding before conversion | (38,163) | (718,856) |
| Shares converted from Class B (See Note 1) | (107,981) | (2,013,472) |
| Net increase (decrease) | (146,144) | $ (2,732,328) |
| Year ended October 31, 2021: | | |
| Shares sold | 4,665 | $ 79,966 |
| Shares issued to shareholders in reinvestment of distributions | 5,177 | 88,331 |
| Shares redeemed | (65,970) | (1,149,355) |
| Net increase (decrease) in shares outstanding before conversion | (56,128) | (981,058) |
| Shares converted from Class B (See Note 1) | (147,557) | (2,611,509) |
| Net increase (decrease) | (203,685) | $ (3,592,567) |
| |
Notes to Financial Statements (continued)
| Class C | Shares | Amount |
| Year ended October 31, 2022: | | |
| Shares sold | 87,124 | $ 1,633,926 |
| Shares issued to shareholders in reinvestment of distributions | 5,893 | 106,407 |
| Shares redeemed | (215,025) | (4,031,784) |
| Net increase (decrease) in shares outstanding before conversion | (122,008) | (2,291,451) |
| Shares converted from Class C (See Note 1) | (32,685) | (611,280) |
| Net increase (decrease) | (154,693) | $ (2,902,731) |
| Year ended October 31, 2021: | | |
| Shares sold | 89,457 | $ 1,571,337 |
| Shares issued to shareholders in reinvestment of distributions | 9,938 | 168,966 |
| Shares redeemed | (498,460) | (8,636,960) |
| Net increase (decrease) in shares outstanding before conversion | (399,065) | (6,896,657) |
| Shares converted from Class C (See Note 1) | (82,979) | (1,467,646) |
| Net increase (decrease) | (482,044) | $ (8,364,303) |
| |
| Class I | Shares | Amount |
| Year ended October 31, 2022: | | |
| Shares sold | 4,180,482 | $ 81,194,638 |
| Shares issued to shareholders in reinvestment of distributions | 388,567 | 7,353,728 |
| Shares redeemed | (4,038,116) | (79,778,322) |
| Net increase (decrease) in shares outstanding before conversion | 530,933 | 8,770,044 |
| Shares converted into Class I (See Note 1) | 1,502 | 30,097 |
| Net increase (decrease) | 532,435 | $ 8,800,141 |
| Year ended October 31, 2021: | | |
| Shares sold | 3,124,739 | $ 57,647,200 |
| Shares issued to shareholders in reinvestment of distributions | 400,983 | 7,312,490 |
| Shares redeemed | (3,403,222) | (62,224,726) |
| Net increase (decrease) in shares outstanding before conversion | 122,500 | 2,734,964 |
| Shares converted into Class I (See Note 1) | 27,561 | 485,803 |
| Net increase (decrease) | 150,061 | $ 3,220,767 |
| |
| Class R1 | Shares | Amount |
| Year ended October 31, 2022: | | |
| Shares sold | 9,871 | $ 187,910 |
| Shares issued to shareholders in reinvestment of distributions | 767 | 14,511 |
| Shares redeemed | (7,206) | (145,990) |
| Net increase (decrease) | 3,432 | $ 56,431 |
| Year ended October 31, 2021: | | |
| Shares sold | 17,145 | $ 302,082 |
| Shares issued to shareholders in reinvestment of distributions | 910 | 16,551 |
| Shares redeemed | (17,025) | (317,998) |
| Net increase (decrease) | 1,030 | $ 635 |
| |
| Class R2 | Shares | Amount |
| Year ended October 31, 2022: | | |
| Shares sold | 17,561 | $ 341,153 |
| Shares issued to shareholders in reinvestment of distributions | 1,261 | 23,678 |
| Shares redeemed | (30,527) | (590,639) |
| Net increase (decrease) | (11,705) | $ (225,808) |
| Year ended October 31, 2021: | | |
| Shares sold | 9,968 | $ 179,455 |
| Shares issued to shareholders in reinvestment of distributions | 1,871 | 33,157 |
| Shares redeemed | (72,897) | (1,231,050) |
| Net increase (decrease) | (61,058) | $ (1,018,438) |
| |
| Class R3 | Shares | Amount |
| Year ended October 31, 2022: | | |
| Shares sold | 31,718 | $ 610,972 |
| Shares issued to shareholders in reinvestment of distributions | 2,333 | 43,986 |
| Shares redeemed | (60,678) | (1,204,977) |
| Net increase (decrease) | (26,627) | $ (550,019) |
| Year ended October 31, 2021: | | |
| Shares sold | 28,384 | $ 515,537 |
| Shares issued to shareholders in reinvestment of distributions | 3,088 | 55,239 |
| Shares redeemed | (79,294) | (1,433,508) |
| Net increase (decrease) | (47,822) | $ (862,732) |
| |
| Class R6 | Shares | Amount |
| Year ended October 31, 2022: | | |
| Shares sold | 650,236 | $ 12,850,146 |
| Shares issued to shareholders in reinvestment of distributions | 158,717 | 3,012,143 |
| Shares redeemed | (891,227) | (17,550,643) |
| Net increase (decrease) in shares outstanding before conversion | (82,274) | (1,688,354) |
| Shares converted from Class R6 (See Note 1) | (1,267) | (25,118) |
| Net increase (decrease) | (83,541) | $ (1,713,472) |
| Year ended October 31, 2021: | | |
| Shares sold | 1,419,176 | $ 27,921,772 |
| Shares issued to shareholders in reinvestment of distributions | 146,875 | 2,673,834 |
| Shares redeemed | (1,500,982) | (26,253,992) |
| Net increase (decrease) | 65,069 | $ 4,341,614 |
| |
| 30 | MainStay Epoch U.S. Equity Yield Fund |
| SIMPLE Class | Shares | Amount |
| Year ended October 31, 2022: | | |
| Shares sold | 1,887 | $ 37,743 |
| Shares issued to shareholders in reinvestment of distributions | 50 | 929 |
| Shares redeemed | (10) | (213) |
| Net increase (decrease) | 1,927 | $ 38,459 |
| Year ended October 31, 2021: | | |
| Shares sold | 546 | $ 10,332 |
| Shares issued to shareholders in reinvestment of distributions | 23 | 427 |
| Net increase (decrease) | 569 | $ 10,759 |
Note 10–Other Matters
As of the date of this report, interest rates in the United States and many parts of the world, including certain European countries, are ascending from historically low levels. Thus, the Fund currently faces a heightened level of risk associated with rising interest rates. This could be driven by a variety of factors, including but not limited to central bank monetary policies, changing inflation or real growth rates, general economic conditions, increasing bond issuances or reduced market demand for low yielding investments.
An outbreak of COVID-19, first detected in December 2019, has developed into a global pandemic and has resulted in travel restrictions, closure of international borders, certain businesses and securities markets, restrictions on securities trading activities, prolonged quarantines, supply chain disruptions, and lower consumer demand, as well as general concern and uncertainty. In 2022, many countries lifted some or all restrictions related to COVID-19. However, the continued impact of COVID-19 and related variants is uncertain and could further adversely affect the global economy, national economies, individual issuers and capital markets in unforeseeable ways and result in a substantial and extended economic downturn. Developments that disrupt global economies and financial markets, such as COVID-19, may magnify factors that affect the Fund's performance.
Note 11–Subsequent Events
In connection with the preparation of the financial statements of the Fund as of and for the year ended October 31, 2022, events and transactions subsequent to October 31, 2022, through the date the financial statements were issued have been evaluated by the Manager for possible adjustment and/or disclosure. No subsequent events requiring financial statement adjustment or disclosure have been identified.
Report of Independent Registered Public Accounting Firm
To the Shareholders of the Fund and Board of Trustees
MainStay Funds Trust:
Opinion on the Financial Statements
We have audited the accompanying statement of assets and liabilities of MainStay Epoch U.S. Equity Yield Fund (the Fund), one of the funds constituting MainStay Funds Trust, including the portfolio of investments, as of October 31, 2022, the related statement of operations for the year then ended, the statements of changes in net assets for each of the years in the two-year period then ended, and the related notes (collectively, the financial statements) and the financial highlights for each of the years or periods in the five-year period then ended. In our opinion, the financial statements and financial highlights present fairly, in all material respects, the financial position of the Fund as of October 31, 2022, the results of its operations for the year then ended, the changes in its net assets for each of the years in the two-year period then ended, and the financial highlights for each of the years or periods in the five-year period then ended, in conformity with U.S. generally accepted accounting principles.
Basis for Opinion
These financial statements and financial highlights are the responsibility of the Fund's management. Our responsibility is to express an opinion on these financial statements and financial highlights based on our audits. We are a public accounting firm registered with the Public Company Accounting Oversight Board (United States) (PCAOB) and are required to be independent with respect to the Fund in accordance with the U.S. federal securities laws and the applicable rules and regulations of the Securities and Exchange Commission and the PCAOB.
We conducted our audits in accordance with the standards of the PCAOB. Those standards require that we plan and perform the audit to obtain reasonable assurance about whether the financial statements and financial highlights are free of material misstatement, whether due to error or fraud. Our audits included performing procedures to assess the risks of material misstatement of the financial statements and financial highlights, whether due to error or fraud, and performing procedures that respond to those risks. Such procedures included examining, on a test basis, evidence regarding the amounts and disclosures in the financial statements and financial highlights. Such procedures also included confirmation of securities owned as of October 31, 2022, by correspondence with custodians and the transfer agent. Our audits also included evaluating the accounting principles used and significant estimates made by management, as well as evaluating the overall presentation of the financial statements and financial highlights. We believe that our audits provide a reasonable basis for our opinion.

We have served as the auditor of one or more New York Life Investment Management investment companies since 2003.
Philadelphia, Pennsylvania
December 23, 2022
| 32 | MainStay Epoch U.S. Equity Yield Fund |
Federal Income Tax Information
(Unaudited)
The Fund is required under the Internal Revenue Code to advise shareholders in a written statement as to the federal tax status of dividends paid by the Fund during such fiscal years.
For the fiscal year ended October 31, 2022, the Fund designated approximately $21,125,017 under the Internal Revenue Code as qualified dividend income eligible for reduced tax rates.
The dividends paid by the Fund during the fiscal year ended October 31, 2022 should be multiplied by 100.00% to arrive at the amount eligible for the corporate dividend-received deduction.
In February 2023, shareholders will receive an IRS Form 1099-DIV or substitute Form 1099, which will show the federal tax status of the distributions received by shareholders in calendar year 2022. The amounts that will be reported on such 1099-DIV or substitute Form 1099 will be the amounts you are to use on your federal income tax return and will differ from the amounts which we must report for the Fund's fiscal year ended October 31, 2022.
Proxy Voting Policies and Procedures and Proxy Voting Record
The Fund is required to file with the SEC its proxy voting record for the 12-month period ending June 30 on Form N-PX. A description of the policies and procedures that are used to vote proxies relating to portfolio securities of the Fund is available free of charge upon request by calling 800-624-6782 or visiting the SEC’s website at www.sec.gov. The most recent Form N-PX or proxy voting record is available free of charge upon request by calling 800-624-6782; visiting newyorklifeinvestments.com; or visiting the SEC’s website at www.sec.gov.
Shareholder Reports and Quarterly Portfolio Disclosure
The Fund is required to file its complete schedule of portfolio holdings with the SEC 60 days after its first and third fiscal quarter on Form N-PORT. The Fund's holdings report is available free of charge upon request by calling New York Life Investments at 800-624-6782.
Board of Trustees and Officers (Unaudited)
The Trustees and officers of the Fund are listed below. The Board oversees the MainStay Group of Funds (which consists of MainStay Funds and MainStay Funds Trust), MainStay VP Funds Trust, MainStay MacKay DefinedTerm Municipal Opportunities Fund, MainStay CBRE Global Infrastructure Megatrends Fund, the Manager and the Subadvisors, and elects the officers of the Funds who are responsible for the day-to-day operations of the Fund. Information pertaining to the Trustees and officers is set forth below. Each Trustee serves until his or her successor is
elected and qualified or until his or her resignation, death or removal. Under the Board’s retirement policy, unless an exception is made, a Trustee must tender his or her resignation by the end of the calendar year during which he or she reaches the age of 75. The business address of each Trustee and officer listed below is 51 Madison Avenue, New York, New York 10010. None of the Trustees are “interested persons” (as defined by the 1940 Act and rules adopted by the SEC thereunder) of the Fund (“Independent Trustees”).
| | Name and
Year of Birth | Term of Office,
Position(s) Held and
Length of Service | Principal Occupation(s)
During Past Five Years | Number of
Portfolios in
Fund Complex
Overseen by
Trustee | Other Directorships
Held by Trustee |
| | | | | | |
| | David H. Chow
1957 | MainStay Funds: Trustee since 2016, Advisory Board Member (June 2015 to December 2015);MainStay Funds Trust:
Trustee since January 2016, Advisory Board Member (June 2015 to December 2015) | Founder and CEO, DanCourt Management, LLC since 1999 | 78 | MainStay VP Funds Trust: Trustee since January 2016, Advisory Board Member (June 2015 to December 2015) (31 portfolios);
MainStay MacKay DefinedTerm Municipal Opportunities Fund: Trustee since January 2016, Advisory Board Member (June 2015 to December 2015);
MainStay CBRE Global Infrastructure Megatrends Fund: Trustee since June 2021; VanEck Vectors Group of Exchange-Traded Funds: Independent Chairman of the Board of Trustees since 2008 and Trustee since 2006 (56 portfolios); and Berea College of Kentucky: Trustee since 2009, Chair of the Investment Committee since 2018 |
| | Susan B. Kerley
1951 | MainStay Funds: Chairman since 2017 and Trustee since 2007;MainStay Funds Trust:
Chairman since 2017 and Trustee since 1990** | President, Strategic Management Advisors LLC since 1990 | 78 | MainStay VP Funds Trust: Chairman since January 2017 and Trustee since 2007 (31 portfolios)**;
MainStay MacKay DefinedTerm Municipal Opportunities Fund: Chairman since 2017 and Trustee since 2011;
MainStay CBRE Global Infrastructure Megatrends Fund: Trustee since June 2021; and Legg Mason Partners Funds: Trustee since 1991 (45 portfolios) |
| | Alan R. Latshaw
1951 | MainStay Funds: Trustee since 2006;MainStay Funds Trust:
Trustee since 2007*** | Retired; Partner, Ernst & Young LLP (2002 to 2003); Partner, Arthur Andersen LLP (1989 to 2002); Consultant to the MainStay Funds Audit and Compliance Committee (2004 to 2006) | 78 | MainStay VP Funds Trust: Trustee since 2007 (31 portfolios)**;
MainStay MacKay DefinedTerm Municipal Opportunities Fund: Trustee since 2011; and
MainStay CBRE Global Infrastructure Megatrends Fund: Trustee since June 2021 |
| 34 | MainStay Epoch U.S. Equity Yield Fund |
| | Name and
Year of Birth | Term of Office,
Position(s) Held and
Length of Service | Principal Occupation(s)
During Past Five Years | Number of
Portfolios in
Fund Complex
Overseen by
Trustee | Other Directorships
Held by Trustee |
| | | | | | |
| | Karen Hammond
1956 | MainStay Funds: Trustee since December 2021, Advisory Board Member (June 2021 to December 2021);MainStay Funds Trust:
Trustee since December 2021, Advisory Board Member (June 2021 to December 2021)
| Retired, Managing Director, Devonshire Investors (2007 to 2013); Senior Vice President, Fidelity Management & Research Co. (2005 to 2007); Senior Vice President and Corporate Treasurer, FMR Corp. (2003 to 2005); Chief Operating Officer, Fidelity Investments Japan (2001 to 2003) | 78 | MainStay VP Funds Trust: Trustee since December 2021, Advisory Board Member (June 2021 to December 2021) (31 Portfolios);
MainStay MacKay DefinedTerm Municipal Opportunities Fund: Trustee since December 2021, Advisory Board Member (June 2021 to December 2021);
MainStay CBRE Global Infrastructure Megatrends Fund: Trustee since December 2021, Advisory Board Member (June 2021 to December 2021);
Two Harbors Investment Corp.: Director since 2018;
Rhode Island State Investment Commission: Member since 2017; and
Blue Cross Blue Shield of Rhode Island: Director since 2019 |
| | Jacques P. Perold
1958 | MainStay Funds: Trustee since 2016, Advisory Board Member (June 2015 toDecember 2015);MainStay Funds Trust:
Trustee since January 2016, Advisory Board Member (June 2015 to December 2015) | Founder and Chief Executive Officer, CapShift Advisors LLC (since 2018); President, Fidelity Management & Research Company (2009 to 2014); President and Chief Investment Officer, Geode Capital Management, LLC (2001 to 2009) | 78 | MainStay VP Funds Trust: Trustee since January 2016, Advisory Board Member (June 2015 to December 2015) (31 portfolios);
MainStay MacKay DefinedTerm Municipal Opportunities Fund: Trustee since January 2016, Advisory Board Member (June 2015 to December 2015);
MainStay CBRE Global Infrastructure Megatrends Fund: Trustee since June 2021; Partners in Health: Trustee since 2019; Allstate Corporation: Director since 2015; and MSCI Inc.: Director since 2017 |
| | Richard S. Trutanic
1952 | MainStay Funds: Trustee since 1994;MainStay Funds Trust:
Trustee since 2007*** | Chairman and Chief Executive Officer, Somerset & Company (financial advisory firm) since 2004; Managing Director, The Carlyle Group (private investment firm) (2002 to 2004); Senior Managing Director, Partner and Board Member, Groupe Arnault S.A. (private investment firm) (1999 to 2002) | 78 | MainStay VP Funds Trust: Trustee since 2007 (31 portfolios)**;
MainStay MacKay DefinedTerm Municipal Opportunities Fund: Trustee since 2011; and MainStay CBRE Global Infrastructure Megatrends Fund: Trustee since June 2021 |
| ** | Includes prior service as a Director of MainStay VP Series Fund, Inc., the predecessor to MainStay VP Funds Trust. |
| *** | Includes prior service as a Director/Trustee of certain predecessor entities to MainStay Funds Trust. |
Board of Trustees and Officers (Unaudited) (continued)
| | Name and
Year of Birth | Position(s) Held and
Length of Service | Principal Occupation(s)
During Past Five Years | |
| | | | | |
| | Kirk C. Lehneis
1974 | President, MainStay Funds, MainStay Funds Trust since 2017 | Chief Operating Officer and Senior Managing Director (since 2016), New York Life Investment Management LLC and New York Life Investment Management Holdings LLC; Member of the Board of Managers (since 2017) and Senior Managing Director (since 2018), NYLIFE Distributors LLC; Chairman of the Board and Senior Managing Director, NYLIM Service Company LLC (since 2017); Trustee, President and Principal Executive Officer of IndexIQ Trust, IndexIQ ETF Trust and IndexIQ Active ETF Trust (since January 2018); President, MainStay CBRE Global Infrastructure Megatrends Fund (since 2021), MainStay MacKay DefinedTerm Municipal Opportunities Fund and MainStay VP Funds Trust (since 2017); Senior Managing Director, Global Product Development (From 2015-2016); Managing Director, Product Development (2010 to 2015), New York Life Investment Management LLC | |
| | Jack R. Benintende
1964 | Treasurer and Principal Financial and Accounting Officer, MainStay Funds (since 2007), MainStay Funds Trust (since 2009) | Managing Director, New York Life Investment Management LLC (since 2007); Treasurer and Principal Financial and Accounting Officer, MainStay CBRE Global Infrastructure Megatrends Fund (since 2021), MainStay MacKay DefinedTerm Municipal Opportunities Fund (since 2011) and MainStay VP Funds Trust (since 2007)** and Assistant Treasurer, New York Life Investment Management Holdings LLC (2008 to 2012) | |
| | J. Kevin Gao
1967 | Secretary and Chief Legal Officer, MainStay Funds and MainStay Funds Trust (since 2010) | Managing Director and Associate General Counsel, New York Life Investment Management LLC (since 2010); Secretary and Chief Legal Officer and MainStay CBRE Global Infrastructure Megatrends Fund (since 2021), MainStay MacKay DefinedTerm Municipal Opportunities Fund (since 2011) and MainStay VP Funds Trust (since 2010)** | |
| | Scott T. Harrington
1959 | Vice President— Administration, MainStay Funds (since 2009), MainStay Funds Trust (since 2009) | Managing Director, New York Life Investment Management LLC (including predecessor advisory organizations) (since 2000); Member of the Board of Directors, New York Life Trust Company (since 2009); Vice President—Administration, MainStay CBRE Global Infrastructure Megatrends Fund (since 2021), MainStay MacKay DefinedTerm Municipal Opportunities Fund (since 2011) and MainStay VP Funds Trust (since 2005)** | |
| | Kevin M. Gleason
1967 | Vice President and Chief Compliance Officer, MainStay Funds and MainStay Funds Trust (since June 2022) | Vice President and Chief Compliance Officer, IndexIQ, IndexIQ ETF Trust and Index IQ Active ETF Trust (since June 2022); Vice President and Chief Compliance Officer, MainStay CBRE Global Infrastructure Megatrends Fund, MainStay VP Funds Trust and MainStay MacKay DefinedTerm Municipal Opportunities Fund (since June 2022); Senior Vice President, Voya Investment Management and Chief Compliance Officer, Voya Family of Funds (2012-2022) | |
| * | The officers listed above are considered to be “interested persons” of the MainStay Group of Funds, MainStay VP Funds Trust, MainStay CBRE Global Infrastructure Megatrends Fund and MainStay MacKay DefinedTerm Municipal Opportunities Fund within the meaning of the 1940 Act because of their affiliation with the MainStay Group of Funds, New York Life Insurance Company and/or its affiliates, including New York Life Investment Management LLC, NYLIM Service Company LLC, NYLIFE Securities LLC and/or NYLIFE Distributors LLC, as described in detail in the column captioned “Principal Occupation(s) During Past Five Years.” Officers are elected annually by the Board. |
| ** | Includes prior service as an Officer of MainStay VP Series Fund, Inc., the predecessor to MainStay VP Funds Trust. |
Officers of the Trust (Who are not Trustees)*
| 36 | MainStay Epoch U.S. Equity Yield Fund |
This page intentionally left blank.
This page intentionally left blank.
Equity
U.S. Equity
MainStay Epoch U.S. Equity Yield Fund
MainStay S&P 500 Index Fund1
MainStay Winslow Large Cap Growth Fund
MainStay WMC Enduring Capital Fund
MainStay WMC Growth Fund
MainStay WMC Small Companies Fund
MainStay WMC Value Fund
International Equity
MainStay Epoch International Choice Fund
MainStay MacKay International Equity Fund
MainStay WMC International Research Equity Fund
Emerging Markets Equity
MainStay Candriam Emerging Markets Equity Fund
Global Equity
MainStay Epoch Capital Growth Fund
MainStay Epoch Global Equity Yield Fund
Fixed Income
Taxable Income
MainStay Candriam Emerging Markets Debt Fund
MainStay Floating Rate Fund
MainStay MacKay High Yield Corporate Bond Fund
MainStay MacKay Short Duration High Yield Fund
MainStay MacKay Strategic Bond Fund
MainStay MacKay Total Return Bond Fund
MainStay MacKay U.S. Infrastructure Bond Fund
MainStay Short Term Bond Fund
Tax-Exempt Income
MainStay MacKay California Tax Free Opportunities Fund2
MainStay MacKay High Yield Municipal Bond Fund
MainStay MacKay New York Tax Free Opportunities Fund3
MainStay MacKay Short Term Municipal Fund
MainStay MacKay Strategic Municipal Allocation Fund
MainStay MacKay Tax Free Bond Fund
Money Market
MainStay Money Market Fund
Mixed Asset
MainStay Balanced Fund
MainStay Income Builder Fund
MainStay MacKay Convertible Fund
Speciality
MainStay CBRE Global Infrastructure Fund
MainStay CBRE Real Estate Fund
MainStay Cushing MLP Premier Fund
Asset Allocation
MainStay Conservative Allocation Fund
MainStay Conservative ETF Allocation Fund
MainStay Defensive ETF Allocation Fund
MainStay Equity Allocation Fund
MainStay Equity ETF Allocation Fund
MainStay ESG Multi-Asset Allocation Fund
MainStay Growth Allocation Fund
MainStay Growth ETF Allocation Fund
MainStay Moderate Allocation Fund
MainStay Moderate ETF Allocation Fund
Manager
New York Life Investment Management LLC
New York, New York
Subadvisors
Candriam4
Strassen, Luxembourg
CBRE Investment Management Listed Real Assets LLC
Radnor, Pennsylvania
Cushing Asset Management, LP
Dallas, Texas
Epoch Investment Partners, Inc.
New York, New York
MacKay Shields LLC4
New York, New York
NYL Investors LLC4
New York, New York
Wellington Management Company LLP
Boston, Massachusetts
Winslow Capital Management, LLC
Minneapolis, Minnesota
Legal Counsel
Dechert LLP
Washington, District of Columbia
Independent Registered Public Accounting Firm
KPMG LLP
Philadelphia, Pennsylvania
Distributor
NYLIFE Distributors LLC4
Jersey City, New Jersey
Custodian
JPMorgan Chase Bank, N.A.
New York, New York
1.
Prior to February 28, 2022, the Fund's name was MainStay MacKay S&P 500 Index Fund.
| 2. | This Fund is registered for sale in AZ, CA, NV, OR, TX, UT, WA and MI (Class A and Class I shares only), and CO, FL, GA, HI, ID, MA, MD, NH, NJ and NY (Class I shares only). |
| 3. | This Fund is registered for sale in CA, CT, DE, FL, MA, NJ, NY and VT. |
| 4. | An affiliate of New York Life Investment Management LLC. |
Not part of the Annual Report
For more information
800-624-6782
newyorklifeinvestments.com
“New York Life Investments” is both a service mark, and the common trade name, of certain investment advisors affiliated with New York Life Insurance Company. The MainStay Funds® are managed by New York Life Investment Management LLC and distributed by NYLIFE Distributors LLC, 30 Hudson Street, Jersey City, NJ 07302, a wholly owned subsidiary of New York Life Insurance Company. NYLIFE Distributors LLC is a Member FINRA/SIPC.
©2022 NYLIFE Distributors LLC. All rights reserved.
| 5013893.2MS229-22 | MSEUE11-12/22 |
(NYLIM) NL239
MainStay Floating Rate Fund
Message from the President and Annual Report
October 31, 2022
Sign up for e-delivery of your shareholder reports. For full details on e-delivery, including who can participate and what you can receive via e-delivery,
please log in to newyorklifeinvestments.com/accounts.
| Not FDIC/NCUA Insured | Not a Deposit | May Lose Value | No Bank Guarantee | Not Insured by Any Government Agency |
This page intentionally left blank
Message from the President
A series of economic and geopolitical challenges undermined equity and fixed-income markets during the 12-month reporting period ended October 31, 2022. Stocks and bonds alike trended lower in the face of sharply rising interest rates, increasing inflationary pressures, slowing economic growth and Russia’s invasion of Ukraine.
The reporting period began on a mixed note, with concerns about the spreading Omicron variant of the COVID-19 virus and increasingly hawkish statements from the U.S. Federal Reserve (the “Fed”) regarding mounting inflation, countered by bullish sentiment stemming from U.S. economic growth and strong corporate earnings. In January 2022, markets turned decisively negative as comments from the Fed raised the likelihood of rate hikes as early as March, and Russia issued increasingly aggressive threats toward Ukraine. The onset of Russia’s invasion in February exacerbated global inflationary pressures while increasing investor uncertainty. Domestic supply shortages, international trade imbalances and rising inflation caused GDP (gross domestic product) to contract in the first and second quarters of the year, although employment and consumer spending proved resilient. Prices for petroleum surged to multi-year highs, while many key agricultural chemicals and industrial metals climbed as well. Accelerating inflationary forces prompted the Fed to implement its most aggressive interest rate increases since the 1980s with a series of five sharp rate hikes, raising the federal funds rate from a range of 0.00% to 0.25% in March to 3.00% to 3.25% in September, with additional rate hikes expected before the end of the year. International central banks generally followed suit, raising rates by varying degrees in efforts to curb local inflation, although most increases remained significantly more modest than those in the United States. Relatively high U.S. interest rates and risk-averse international sentiment pushed U.S. dollar values higher compared to most other currencies, with the ensuing negative impact on global prices for food, fuel and other key, U.S.-dollar-denominated products.
The effects of these interrelated challenges were felt throughout U.S. and international financial markets. The S&P 500® Index, a widely regarded benchmark of U.S. market performance, declined by more than 14% during the reporting period. Although the energy sector generated strong gains, bolstered by elevated oil and gas prices, most other industry areas recorded losses. The more cyclical and growth-oriented sectors of consumer discretionary, real estate and information technology delivered the
weakest returns, while the traditionally defensive and value-oriented consumer staples, utilities and health care sectors outperformed. International stocks lagged compared to their U.S. counterparts, with some emerging markets, such as China, suffering particularly steep losses. A few markets, however, including Brazil, Mexico and the United Arab Emirates, ended the reporting period with little change. Fixed-income markets saw bond prices broadly decline as yields rose along with interest rates. Short-term yields rose faster than long-term yields, producing a yield curve inversion from July through the end of the reporting period, with long-term rates remaining below short-term rates. While floating-rate instruments, which feature variable interest rates that allow investors to benefit from a rising rate environment, provided a degree of insulation from inflation-driven trends, they were not immune to the market’s widespread declines.
While the Fed acknowledges the costs of rising rates in terms of weaker GDP growth and unsettled financial markets over the short term, its primary focus continues to be the longer-term economic impact of inflation. With the latest figures as of the date of this report showing that inflation remains above 8%, versus a target rate of just 2%, the Fed clearly has a distance yet to go, making further rate increases and market volatility more likely in the coming months. The question remains as to whether the Fed and other central banks will manage a so-called “soft landing,” curbing inflation while avoiding a persistent economic slowdown. If they prove successful, we expect that favorable inflation trends and increasingly attractive valuations in both equity and bond markets should eventually translate into sustainable improvements in the investment environment.
Whatever actions the Fed takes and however financial markets react, as a MainStay investor, you can depend on us to continue providing the insight, expertise and service that have long defined New York Life Investments. Thank you for trusting us to help you meet your investment needs.
Sincerely,
Kirk C. Lehneis
President
The opinions expressed are as of the date of this report and are subject to change. There is no guarantee that any forecast made will come to pass. This material does not constitute investment advice and is not intended as an endorsement of any specific investment. Past performance is no guarantee of future results.
Not part of the Annual Report
Investors should refer to the Fund’s Summary Prospectus and/or Prospectus and consider the Fund’s investment objectives, strategies, risks, charges and expenses carefully before investing. The Summary Prospectus and/or Prospectus contain this and other information about the Fund. You may obtain copies of the Fund’s Summary Prospectus, Prospectus and Statement of Additional Information, which includes information about the MainStay Funds Trust's Trustees, free of charge, upon request, by calling toll-free 800-624-6782, by writing to NYLIFE Distributors LLC, Attn: MainStay Marketing Department, 30 Hudson Street, Jersey City, NJ 07302 or by sending an e-mail to MainStayShareholderServices@nylim.com. These documents are also available via the MainStay Funds’ website at newyorklifeinvestments.com. Please read the Fund’s Summary Prospectus and/or Prospectus carefully before investing.
Investment and Performance Comparison (Unaudited)
Performance data quoted represents past performance. Past performance is no guarantee of future results. Because of market volatility and other factors, current performance may be lower or higher than the figures shown. Investment return and principal value will fluctuate, and as a result, when shares are redeemed, they may be worth more or less than their original cost. The graph below depicts the historical performance of Class I shares of the Fund. Performance will vary from class to class based on differences in class-specific expenses and sales charges. For performance information current to the most recent month-end, please call 800-624-6782 or visit newyorklifeinvestments.com.
The performance table and graph do not reflect the deduction of taxes that a shareholder would pay on distributions or Fund share redemptions. Total returns reflect maximum applicable sales charges as indicated in the table below, if any, changes in share price, and reinvestment of dividend and capital gain distributions. The graph assumes the initial investment amount shown below and reflects the deduction of all sales charges that would have applied for the period of investment. Performance figures may reflect certain fee waivers and/or expense limitations, without which total returns may have been lower. For more information on share classes and current fee waivers and/or expense limitations (if any), please refer to the Notes to Financial Statements.
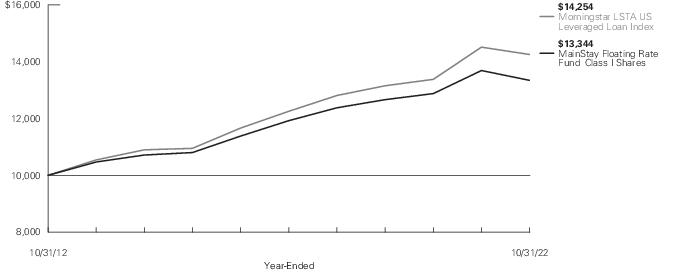
| Average Annual Total Returns for the Year-Ended October 31, 2022 |
| Class | Sales Charge | | Inception
Date | One
Year | Five
Years | Ten Years
or Since
Inception | Gross
Expense
Ratio1 |
| Class A Shares | Maximum 3% Initial Sales Charge | With sales charges | 5/3/2004 | -5.69% | 1.40% | 2.36% | 1.04% |
| | | Excluding sales charges | | -2.77 | 2.02 | 2.67 | 1.04 |
| Investor Class Shares2 | Maximum 2.5% Initial Sales Charge | With sales charges | 2/28/2008 | -5.28 | 1.37 | 2.34 | 1.14 |
| | | Excluding sales charges | | -2.85 | 1.99 | 2.65 | 1.14 |
| Class B Shares3 | Maximum 3% CDSC | With sales charges | 5/3/2004 | -6.49 | 1.20 | 1.87 | 1.89 |
| | if Redeemed Within the First Four Years of Purchase | Excluding sales charges | | -3.69 | 1.20 | 1.87 | 1.89 |
| Class C Shares | Maximum 1% CDSC | With sales charges | 5/3/2004 | -4.52 | 1.22 | 1.87 | 1.89 |
| | if Redeemed Within One Year of Purchase | Excluding sales charges | | -3.58 | 1.22 | 1.87 | 1.89 |
| Class I Shares | No Sales Charge | | 5/3/2004 | -2.53 | 2.27 | 2.93 | 0.79 |
| Class R3 Shares | No Sales Charge | | 2/29/2016 | -3.11 | 1.66 | 2.99 | 1.39 |
| Class R6 Shares | No Sales Charge | | 2/28/2019 | -2.42 | N/A | 2.08 | 0.64 |
| SIMPLE Class Shares | No Sales Charge | | 8/31/2020 | -3.09 | N/A | 1.36 | 1.39 |
| 1. | The gross expense ratios presented reflect the Fund’s “Total Annual Fund Operating Expenses” from the most recent Prospectus, as supplemented, and may differ from other expense ratios disclosed in this report. |
| 2. | Prior to June 30, 2020, the maximum initial sales charge was 3%, which is reflected in the applicable average annual total return figures shown. |
| 3. | Class B shares are closed to all new purchases as well as additional investments by existing Class B shareholders. |
The footnotes on the next page are an integral part of the table and graph and should be carefully read in conjunction with them.
| Benchmark Performance* | One
Year | Five
Years | Ten
Years |
| Morningstar LSTA US Leveraged Loan Index1 | -1.79% | 3.07% | 3.61% |
| Morningstar Bank Loan Category Average2 | -3.79 | 1.68 | 2.64 |
| * | Returns for indices reflect no deductions for fees, expenses or taxes, except for foreign withholding taxes where applicable. Results assume reinvestment of all dividends and capital gains. An investment cannot be made directly in an index. |
| 1. | The Morningstar LSTA US Leveraged Loan Index is the Fund's primary broad-based securities market index for comparison purposes. The Morningstar LSTA US Leveraged Loan Index is a broad-based index designed to reflect the performance of U.S. dollar facilities in the leveraged loan market. |
| 2. | The Morningstar Bank Loan Category Average is representative of funds that invest in floating-rate bank loans instead of bonds. In exchange for their credit risk, these loans offer high interest payments that typically float above a common short-term benchmark. Results are based on average total returns of similar funds with all dividends and capital gain distributions reinvested. |
The footnotes on the preceding page are an integral part of the table and graph and should be carefully read in conjunction with them.
| 6 | MainStay Floating Rate Fund |
Cost in Dollars of a $1,000 Investment in MainStay Floating Rate Fund (Unaudited)
The example below is intended to describe the fees and expenses borne by shareholders during the six-month period from May 1, 2022 to October 31, 2022, and the impact of those costs on your investment.
Example
As a shareholder of the Fund you incur two types of costs: (1) transaction costs, including exchange fees and sales charges (loads) on purchases (as applicable), and (2) ongoing costs, including management fees, distribution and/or service (12b-1) fees and other Fund expenses (as applicable). This example is intended to help you understand your ongoing costs (in dollars) of investing in the Fund and to compare these costs with the ongoing costs of investing in other mutual funds. The example is based on an investment of $1,000 made at the beginning of the six-month period and held for the entire period from May 1, 2022 to October 31, 2022.
This example illustrates your Fund’s ongoing costs in two ways:
Actual Expenses
The second and third data columns in the table below provide information about actual account values and actual expenses. You may use the information in these columns, together with the amount you invested, to estimate the expenses that you paid during the six months ended October 31, 2022. Simply divide your account value by $1,000 (for example, an
$8,600 account value divided by $1,000 = 8.6), then multiply the result by the number under the heading entitled “Expenses Paid During Period” to estimate the expenses you paid on your account during this period.
Hypothetical Example for Comparison Purposes
The fourth and fifth data columns in the table below provide information about hypothetical account values and hypothetical expenses based on the Fund’s actual expense ratio and an assumed rate of return of 5% per year before expenses, which is not the Fund’s actual return. The hypothetical account values and expenses may not be used to estimate the actual ending account balances or expenses you paid for the six-month period shown. You may use this information to compare the ongoing costs of investing in the Fund with the ongoing costs of investing in other mutual funds. To do so, compare this 5% hypothetical example with the 5% hypothetical examples that appear in the shareholder reports of the other mutual funds.
Please note that the expenses shown in the table are meant to highlight your ongoing costs only and do not reflect any transactional costs, such as exchange fees or sales charges (loads). Therefore, the fourth and fifth data columns of the table are useful in comparing ongoing costs only and will not help you determine the relative total costs of owning different funds. In addition, if these transactional costs were included, your costs would have been higher.
| Share Class | Beginning
Account
Value
5/1/22 | Ending Account
Value (Based
on Actual
Returns and
Expenses)
10/31/22 | Expenses
Paid
During
Period1 | Ending Account
Value (Based
on Hypothetical
5% Annualized
Return and
Actual Expenses)
10/31/22 | Expenses
Paid
During
Period1 | Net Expense
Ratio
During
Period2 |
| Class A Shares | $1,000.00 | $977.20 | $4.98 | $1,020.16 | $5.09 | 1.00% |
| Investor Class Shares | $1,000.00 | $976.90 | $5.33 | $1,019.81 | $5.45 | 1.07% |
| Class B Shares | $1,000.00 | $972.10 | $9.00 | $1,016.08 | $9.20 | 1.81% |
| Class C Shares | $1,000.00 | $972.10 | $9.05 | $1,016.03 | $9.25 | 1.82% |
| Class I Shares | $1,000.00 | $978.40 | $3.74 | $1,021.42 | $3.82 | 0.75% |
| Class R3 Shares | $1,000.00 | $975.50 | $6.72 | $1,018.40 | $6.87 | 1.35% |
| Class R6 Shares | $1,000.00 | $977.90 | $3.14 | $1,022.03 | $3.21 | 0.63% |
| SIMPLE Class Shares | $1,000.00 | $975.60 | $6.57 | $1,018.55 | $6.72 | 1.32% |
| 1. | Expenses are equal to the Fund’s annualized expense ratio of each class multiplied by the average account value over the period, divided by 365 and multiplied by 184 (to reflect the six-month period). The table above represents the actual expenses incurred during the six-month period. In addition to the fees and expenses which the Fund bears directly, it also indirectly bears a pro rata share of the fees and expenses of the underlying funds in which it invests. Such indirect expenses are not included in the above-reported expense figures. |
| 2. | Expenses are equal to the Fund's annualized expense ratio to reflect the six-month period. |
Industry Composition as of October 31, 2022 (Unaudited)
| Electronics | 7.0% |
| Finance | 6.8 |
| Healthcare, Education & Childcare | 5.1 |
| Services: Business | 4.9 |
| Chemicals, Plastics & Rubber | 4.8 |
| Software | 4.0 |
| Telecommunications | 3.8 |
| Hotels, Motels, Inns & Gaming | 3.6 |
| Other Asset-Backed Securities | 3.6 |
| Insurance | 3.4 |
| Aerospace & Defense | 2.8 |
| Containers, Packaging & Glass | 2.5 |
| Diversified/Conglomerate Manufacturing | 2.3 |
| Broadcasting & Entertainment | 2.3 |
| Diversified/Conglomerate Service | 2.3 |
| Oil & Gas | 2.3 |
| Buildings & Real Estate | 2.2 |
| Media | 2.2 |
| Healthcare | 2.2 |
| Manufacturing | 2.1 |
| Automobile | 2.0 |
| Beverage, Food & Tobacco | 2.0 |
| High Tech Industries | 1.8 |
| Healthcare & Pharmaceuticals | 1.8 |
| Utilities | 1.7 |
| Personal & Nondurable Consumer Products | 1.7 |
| Retail Store | 1.5 |
| Personal, Food & Miscellaneous Services | 1.4 |
| Entertainment | 1.2 |
| Banking | 1.1 |
| Mining, Steel, Iron & Non-Precious Metals | 1.0 |
| Retail | 1.0 |
| Leisure, Amusement, Motion Pictures & Entertainment | 0.8 |
| Machinery (Non-Agriculture, Non-Construct & Non-Electronic) | 0.8 |
| Commercial Services | 0.7 |
| Printing & Publishing | 0.6 |
| Personal & Nondurable Consumer Products (Manufacturing Only) | 0.5 |
| Ecological | 0.5 |
| Water | 0.4 |
| Chemicals | 0.4% |
| Pharmaceuticals | 0.3 |
| Affiliated Investment Company | 0.3 |
| Cargo Transport | 0.3 |
| Personal Transportation | 0.3 |
| Hotel, Gaming & Leisure | 0.3 |
| Environmental Control | 0.3 |
| Consumer Durables | 0.2 |
| Animal Food | 0.2 |
| Packaging | 0.2 |
| Energy (Electricity) | 0.2 |
| Capital Equipment | 0.2 |
| Auto Manufacturers | 0.2 |
| Electric | 0.1 |
| Food | 0.1 |
| Lodging | 0.1 |
| Packaging & Containers | 0.1 |
| Building Materials | 0.1 |
| Real Estate | 0.1 |
| Airlines | 0.1 |
| Internet | 0.1 |
| Home and Office Furnishings, Housewares & Durable Consumer Products | 0.0‡ |
| Healthcare-Services | 0.0‡ |
| Iron & Steel | 0.0‡ |
| Machinery-Diversified | 0.0‡ |
| Distribution & Wholesale | 0.0‡ |
| Real Estate Investment Trusts | 0.0‡ |
| Oil & Gas Services | 0.0‡ |
| Healthcare-Products | 0.0‡ |
| Health Care Equipment & Supplies | 0.0‡ |
| Machinery | 0.0‡ |
| Independent Power and Renewable Electricity Producers | 0.0‡ |
| Auto Components | 0.0‡ |
| Capital Markets | 0.0‡ |
| Short-Term Investments | 2.3 |
| Other Assets, Less Liabilities | 0.8 |
| | 100.0% |
| ‡ | Less than one-tenth of a percent. |
See Portfolio of Investments beginning on page 12 for specific holdings within these categories. The Fund's holdings are subject to change.
| 8 | MainStay Floating Rate Fund |
Top Ten Holdings and/or Issuers Held as of October 31, 2022 (excluding short-term investments) (Unaudited)
| 1. | NortonLifeLock, Inc., 5.829%-6.75%, due 9/30/27–9/12/29 |
| 2. | GFL Environmental, Inc., 3.75%-7.415%, due 5/30/25–6/15/29 |
| 3. | Great Outdoors Group LLC, 7.504%, due 3/6/28 |
| 4. | MKS Instruments, Inc., 6.317%, due 8/17/29 |
| 5. | UKG, Inc., 6.998%-8.998%, due 5/4/26–5/3/27 |
| 6. | SS&C Technologies Holdings, Inc., 5.504%-6.079%, due 4/16/25–3/22/29 |
| 7. | Informatica LLC, 6.563%, due 10/27/28 |
| 8. | Trans Union LLC, 6.004%, due 12/1/28 |
| 9. | Asurion LLC, 6.754%-9.004%, due 11/3/24–1/20/29 |
| 10. | AAdvantage Loyality IP Ltd., 8.993%, due 4/20/28 |
Portfolio Management Discussion and Analysis (Unaudited)
Questions answered by portfolio managers Mark A. Campellone and Arthur S. Torrey of NYL Investors LLC, the Fund’s Subadvisor.
How did MainStay Floating Rate Fund perform relative to its benchmark and peer group during the 12 months ended October 31, 2022?
For the 12 months ended October 31, 2022, Class I shares of MainStay Floating Rate Fund returned −2.53%, underperforming the −1.79% return of the Fund’s benchmark, the Morningstar LSTA US Leveraged Loan Index (the “Index”). Over the same period, Class I shares outperformed the −3.79% return of the Morningstar Bank Loan Category Average.1
What factors affected the Fund’s relative performance during the reporting period?
Market conditions were generally mixed during the reporting period, with the floating-rate market realizing negative performance overall during the reporting period, resulting from seven months of positive performance and five months of negative performance. The broader market in risk assets was more volatile due to concerns over rising interest rates and inflation in the United States, and geopolitical risks in central Europe. The market for floating-rate loans was insulated from, but not immune to, these broader performance trends, as floating-rate loans generally outperformed other fixed-income assets, including investment-grade, high-yield and long-dated U.S. Treasury securities.
The Fund has historically been focused on maintaining a larger position in higher-credit-quality loans rated BB, and less exposure to lower-credit-quality loans rated CCC and below.2 In addition, the Fund started to realize some outflows during the latter part of the reporting period, leading to a partial decrease in cash balances. As a result, the Fund outperformed the Index on a gross basis.
Were there any changes to the Fund during the reporting period?
Effective June 7, 2022, Robert Dial no longer served as a portfolio manager for the Fund.
What was the Fund’s duration3 strategy during the reporting period?
Floating-rate loans are, by their nature, a low-duration asset. Loans earn a stated spread4 over a floating reference rate, which is tied to LIBOR5 or SOFR.6 Issuers can generally borrow under a 30-to-90-day range. The weighted average time to LIBOR/SOFR
reset on the Fund’s portfolio averaged less than 41 days during the reporting period.
During the reporting period, which sectors were the strongest positive contributors to the Fund’s relative performance and which sectors were particularly weak?
Effective July 1, 2022, Morningstar LCD (formerly S&P Global Leveraged Commentary & Data) revised the industry classifications of the Index. As a result, comparisons of sector attribution are no longer possible between the period before the change and the period after the change.
From the beginning of the reporting period through June 30, 2022, the strongest contributions to the Fund’s relative performance were underweight positions in leisure, health care and cable TV. (Contributions take weightings and total returns into account.) Detracting from performance were off-Index positions, including floating-rate ETFs and high-yield bonds, as well as the Fund’s overweight positions in building & developers and chemicals.
The strongest contributions to relative performance from July 1, 2022 through the end of the reporting period were underweight positions in health care providers, software and entertainment. The largest detractors were off-Index positions in floating-rate ETFs and high-yield bonds, in addition to the Fund’s underweight positions in capital markets and diversified telecom.
What were some of the Fund’s largest purchases and sales during the reporting period?
The Fund’s largest purchases during the reporting period included loans issued by NortonLifeLock, Light & Wonder (formerly Scientific Games) and MKS Instruments, reflecting our favorable view towards the relative value, business prospects and the management of these issuers. The largest sales during the same period were bonds issued by Peraton, Medline Industries and Nestlé Skin Health. The partial sales of these three credits were made primarily to rebalance the Fund’s holdings for relative value and liquidity reasons.
How did the Fund’s sector weightings change during the reporting period?
As noted above, on July 1, 2022, Morningstar LCD revised industry classifications. From November 1, 2021, through June 30, 2022, we increased the Fund’s holdings in assets that fall
| 1. | See page 5 for other share class returns, which may be higher or lower than Class I share returns. See page 6 for more information on benchmark and peer group returns. |
| 2. | An obligation rated ‘BB’ by Standard & Poor’s (“S&P”) is deemed by S&P to be less vulnerable to nonpayment than other speculative issues. In the opinion of S&P, however, the obligor faces major ongoing uncertainties or exposure to adverse business, financial or economic conditions which could lead to the obligor’s inadequate capacity to meet its financial commitment on the obligation. An obligation rated ‘CCC’ by S&P is deemed by S&P to be currently vulnerable to nonpayment and is dependent upon favorable business, financial and economic conditions for the obligor to meet its financial commitment on the obligation. It is the opinion of S&P that in the event of adverse business, financial or economic conditions, the obligor is not likely to have the capacity to meet its financial commitment on the obligation. When applied to Fund holdings, ratings are based solely on the creditworthiness of the bonds in the portfolio and are not meant to represent the security or safety of the Fund. |
| 3. | Duration is a measure of the price sensitivity of a fixed-income investment to changes in interest rates. Duration is expressed as a number of years and is considered a more accurate sensitivity gauge than average maturity. |
| 4. | The terms “spread” and “yield spread” may refer to the difference in yield between a security or type of security and comparable U.S. Treasury issues. The terms may also refer to the difference in yield between two specific securities or types of securities at a given time. |
| 5. | The London InterBank Offered Rate (LIBOR) is a composite of interest rates at which banks borrow from one another in the London market, and it is a widely used benchmark for short-term interest rates. |
| 6. | The Secured Overnight Financing Rate (SOFR) is a secured, interbank overnight interest rate established as an alternative to LIBOR. |
| 10 | MainStay Floating Rate Fund |
outside standard industry classifications, and also increased the Fund’s exposure to health care, electronics, and oil and gas. Conversely, we reduced the Fund’s exposure to building development, hotels and casinos, and leisure.
How was the Fund positioned at the end of the reporting period?
As of October 31, 2022, we remained cautiously optimistic about the performance of the floating-rate market. The Fund held its most overweight positions relative to the Index in the health care equipment; pharmaceuticals; and hotels, restaurants & leisure sectors. The Fund held its most significantly underweight positions in the diversified telecom, capital markets and health care providers sectors. We continue to look for opportunities to add exposure in these underweight sectors, subject to our underwriting criteria.
From a rating perspective, the Fund held overweight positions in credit rated BB and B,7 while maintaining underweight exposure to credit rated CCC and below, and NR,8 reflecting our view favoring higher-rated credit in the loan market. As of the end of the reporting period, average cash balances moved lower as market conditions turned more volatile, resulting in outflows.
| 7. | An obligation rated ‘B’ by S&P is deemed by S&P to be more vulnerable to nonpayment than obligations rated ‘BB’, but in the opinion of S&P, the obligor currently has the capacity to meet its financial commitment on the obligation. It is the opinion of S&P that adverse business, financial, or economic conditions will likely impair the obligor's capacity or willingness to meet its financial commitment on the obligation. When applied to Fund holdings, ratings are based solely on the creditworthiness of the bonds in the portfolio and are not meant to represent the security or safety of the Fund. |
| 8. | NR indicates that S&P has not assigned an obligation with a rating, or a rating is no longer assigned. |
The opinions expressed are those of the portfolio managers as of the date of this report and are subject to change. There is no guarantee that any forecasts will come to pass. This material does not constitute investment advice and is not intended as an endorsement of any specific investment.
Portfolio of Investments October 31, 2022†
| | Principal
Amount | Value |
| Long-Term Bonds 96.6% |
| Asset-Backed Securities 3.6% |
| Other Asset-Backed Securities 3.6% |
| AGL CLO 20 Ltd. (a)(b) | |
| Series 2022-20A, Class B | | |
| 5.968% (3 Month SOFR + 2.95%), due 7/20/35 | $ 2,500,000 | $ 2,443,407 |
| Series 2022-20A, Class E | | |
| 11.378% (3 Month SOFR + 8.36%), due 7/20/35 | 2,500,000 | 2,316,487 |
| AIMCO CLO 16 Ltd. (a)(b) | |
| Series 2021-16A, Class B | | |
| 5.729% (3 Month LIBOR + 1.65%), due 1/17/35 | 2,500,000 | 2,331,750 |
| Series 2021-16A, Class E | | |
| 10.279% (3 Month LIBOR + 6.20%), due 1/17/35 | 2,500,000 | 2,189,623 |
| Bain Capital Credit CLO Ltd. | |
| Series 2021-6A, Class B | | |
| 5.928% (3 Month LIBOR + 1.65%), due 10/21/34 (a)(b) | 2,500,000 | 2,297,500 |
| Ballyrock CLO 21 Ltd. (a)(b) | |
| Series 2022-21A, Class A2A | | |
| 7.192% (3 Month SOFR + 2.80%), due 10/20/35 | 2,700,000 | 2,697,697 |
| Series 2022-21A, Class C | | |
| 9.712% (3 Month SOFR + 5.32%), due 10/20/35 | 2,500,000 | 2,485,377 |
| Carlyle U.S. CLO Ltd. (a)(b) | |
| Series 2021-5A, Class B | | |
| 5.843% (3 Month LIBOR + 1.60%), due 7/20/34 | 2,500,000 | 2,330,750 |
| Series 2022-2A, Class A2 | | |
| 5.963% (3 Month SOFR + 2.00%), due 4/20/35 | 2,500,000 | 2,343,600 |
| Series 2021-5A, Class E | | |
| 10.493% (3 Month LIBOR + 6.25%), due 7/20/34 | 2,500,000 | 2,071,033 |
| Series 2022-2A, Class D | | |
| 11.363% (3 Month SOFR + 7.40%), due 4/20/35 | 2,500,000 | 2,169,530 |
| Danby Park CLO Ltd. (a)(b)(c) | |
| Series 2022-1A, Class B | | |
| 7.048% (3 Month SOFR + 2.95%), due 10/21/35 | 1,000,000 | 999,650 |
| Series 2022-1A, Class D | | |
| 9.428% (3 Month SOFR + 5.33%), due 10/21/35 | 1,000,000 | 989,133 |
| | Principal
Amount | Value |
| |
| Other Asset-Backed Securities (continued) |
| Dryden 87 CLO Ltd. (a)(b) | |
| Series 2021-87A, Class B | | |
| 4.534% (3 Month LIBOR + 1.55%), due 5/20/34 | $ 2,500,000 | $ 2,321,250 |
| Series 2021-87A, Class E | | |
| 9.134% (3 Month LIBOR + 6.15%), due 5/20/34 | 2,500,000 | 2,046,225 |
| Elmwood CLO 16 Ltd. (a)(b) | |
| Series 2022-3A, Class B | | |
| 5.913% (3 Month SOFR + 1.95%), due 4/20/34 | 2,500,000 | 2,411,905 |
| Series 2022-3A, Class E | | |
| 11.183% (3 Month SOFR + 7.22%), due 4/20/34 | 2,500,000 | 2,262,312 |
| Elmwood CLO XII Ltd. (a)(b) | |
| Series 2021-5A, Class B | | |
| 5.943% (3 Month LIBOR + 1.70%), due 1/20/35 | 2,500,000 | 2,350,750 |
| Series 2021-5A, Class E | | |
| 10.593% (3 Month LIBOR + 6.35%), due 1/20/35 | 2,500,000 | 2,201,655 |
| Magnetite XXXI Ltd. (a)(b) | |
| Series 2021-31A, Class B | | |
| 5.729% (3 Month LIBOR + 1.65%), due 7/15/34 | 2,500,000 | 2,339,500 |
| Series 2021-31A, Class E | | |
| 10.079% (3 Month LIBOR + 6.00%), due 7/15/34 | 2,500,000 | 2,165,650 |
| Neuberger Berman Loan Advisers CLO 43 Ltd. (a)(b) | |
| Series 2021-43A, Class C | | |
| 6.029% (3 Month LIBOR + 1.95%), due 7/17/35 | 2,500,000 | 2,270,477 |
| Series 2021-43A, Class E | | |
| 10.079% (3 Month LIBOR + 6.00%), due 7/17/35 | 2,500,000 | 2,152,903 |
| Neuberger Berman Loan Advisers CLO 51 Ltd. (a)(b) | |
| Series 2022-51A, Class B | | |
| 6.249% (3 Month SOFR + 3.05%), due 10/23/35 | 1,250,000 | 1,242,804 |
| Series 2022-51A, Class D | | |
| 8.899% (3 Month SOFR + 5.70%), due 10/23/35 | 1,250,000 | 1,241,855 |
| Octagon 59 Ltd. (a)(b) | |
| Series 2022-1A, Class B | | |
| 3.051% (3 Month SOFR + 1.95%), due 5/15/35 | 2,500,000 | 2,341,820 |
The notes to the financial statements are an integral part of, and should be read in conjunction with, the financial statements.
| 12 | MainStay Floating Rate Fund |
| | Principal
Amount | Value |
| Asset-Backed Securities (continued) |
| Other Asset-Backed Securities (continued) |
| Octagon 59 Ltd. (a)(b) (continued) | |
| Series 2022-1A, Class E | | |
| 8.701% (3 Month SOFR + 7.60%), due 5/15/35 | $ 2,500,000 | $ 2,116,000 |
| Octagon Investment Partners 51 Ltd. (a)(b) | |
| Series 2021-1A, Class B | | |
| 5.943% (3 Month LIBOR + 1.70%), due 7/20/34 | 2,500,000 | 2,341,500 |
| Series 2021-1A, Class E | | |
| 10.993% (3 Month LIBOR + 6.75%), due 7/20/34 | 2,500,000 | 2,109,850 |
| Palmer Square CLO Ltd. (a)(b) | |
| Series 2022-2A, Class B | | |
| 4.313% (3 Month SOFR + 2.20%), due 7/20/34 | 2,500,000 | 2,399,347 |
| Series 2021-4A, Class B | | |
| 5.729% (3 Month LIBOR + 1.65%), due 10/15/34 | 2,500,000 | 2,333,250 |
| Series 2022-2A, Class E | | |
| 9.943% (3 Month SOFR + 7.83%), due 7/20/34 | 2,500,000 | 2,215,000 |
| Series 2021-4A, Class E | | |
| 10.129% (3 Month LIBOR + 6.05%), due 10/15/34 | 2,500,000 | 2,166,920 |
| Rockland Park CLO Ltd. (a)(b) | |
| Series 2021-1A, Class B | | |
| 5.893% (3 Month LIBOR + 1.65%), due 4/20/34 | 2,500,000 | 2,340,500 |
| Series 2021-1A, Class E | | |
| 10.493% (3 Month LIBOR + 6.25%), due 4/20/34 | 2,500,000 | 2,072,043 |
| Sixth Street CLO XXI Ltd. (a)(b)(c) | |
| Series 2022-21A, Class B | | |
| 7.036% (3 Month SOFR + 3.00%), due 10/15/35 | 2,500,000 | 2,497,860 |
| Series 2022-21A, Class D | | |
| 9.136% (3 Month SOFR + 5.10%), due 10/15/35 | 1,429,000 | 1,426,554 |
Total Asset-Backed Securities
(Cost $85,928,795) | | 79,033,467 |
| Corporate Bonds 2.5% |
| Aerospace & Defense 0.1% |
| Howmet Aerospace, Inc. | | |
| 6.875%, due 5/1/25 | 500,000 | 511,105 |
| | Principal
Amount | Value |
| |
| Aerospace & Defense (continued) |
| Spirit AeroSystems, Inc. | | |
| 7.50%, due 4/15/25 (a) | $ 2,100,000 | $ 2,040,234 |
| | | 2,551,339 |
| Airlines 0.1% |
| United Airlines, Inc. (a) | | |
| 4.375%, due 4/15/26 | 800,000 | 730,126 |
| 4.625%, due 4/15/29 | 2,400,000 | 2,052,696 |
| | | 2,782,822 |
| Auto Manufacturers 0.2% |
| Ford Motor Co. | | |
| 6.10%, due 8/19/32 | 4,900,000 | 4,484,994 |
| Building Materials 0.1% |
| JELD-WEN, Inc. (a) | | |
| 4.625%, due 12/15/25 | 590,000 | 486,750 |
| 4.875%, due 12/15/27 | 780,000 | 581,786 |
| Koppers, Inc. | | |
| 6.00%, due 2/15/25 (a) | 2,000,000 | 1,790,000 |
| | | 2,858,536 |
| Chemicals 0.1% |
| ASP Unifrax Holdings, Inc. | | |
| 5.25%, due 9/30/28 (a) | 730,000 | 580,168 |
| SCIL IV LLC | | |
| 5.375%, due 11/1/26 (a) | 660,000 | 524,654 |
| WR Grace Holdings LLC | | |
| 5.625%, due 8/15/29 (a) | 700,000 | 541,086 |
| | | 1,645,908 |
| Commercial Services 0.2% |
| Herc Holdings, Inc. | | |
| 5.50%, due 7/15/27 (a) | 850,000 | 804,313 |
| PECF USS Intermediate Holding III Corp. | | |
| 8.00%, due 11/15/29 (a) | 420,000 | 281,257 |
| Prime Security Services Borrower LLC | | |
| 6.25%, due 1/15/28 (a) | 1,000,000 | 918,985 |
| Sotheby's | | |
| 5.875%, due 6/1/29 (a) | 2,100,000 | 1,755,108 |
| | | 3,759,663 |
| Distribution & Wholesale 0.0% ‡ |
| IAA, Inc. | | |
| 5.50%, due 6/15/27 (a) | 500,000 | 467,899 |
| KAR Auction Services, Inc. | | |
| 5.125%, due 6/1/25 (a) | 400,000 | 385,184 |
| | | 853,083 |
The notes to the financial statements are an integral part of, and should be read in conjunction with, the financial statements.
13
Portfolio of Investments October 31, 2022† (continued)
| | Principal
Amount | Value |
| Corporate Bonds (continued) |
| Electric 0.1% |
| Vistra Operations Co. LLC | | |
| 5.00%, due 7/31/27 (a) | $ 1,500,000 | $ 1,383,750 |
| Entertainment 0.1% |
| Caesars Resort Collection LLC | | |
| 5.75%, due 7/1/25 (a) | 500,000 | 488,390 |
| Scientific Games International, Inc. | | |
| 7.00%, due 5/15/28 (a) | 1,350,000 | 1,306,435 |
| | | 1,794,825 |
| Environmental Control 0.3% |
| GFL Environmental, Inc. (a) | | |
| 3.75%, due 8/1/25 | 2,000,000 | 1,890,000 |
| 4.25%, due 6/1/25 | 1,200,000 | 1,145,712 |
| 4.75%, due 6/15/29 | 4,000,000 | 3,486,310 |
| | | 6,522,022 |
| Food 0.1% |
| Post Holdings, Inc. | | |
| 5.50%, due 12/15/29 (a) | 240,000 | 215,981 |
| U.S. Foods, Inc. | | |
| 6.25%, due 4/15/25 (a) | 1,200,000 | 1,194,228 |
| | | 1,410,209 |
| Healthcare-Products 0.0% ‡ |
| Medline Borrower LP | | |
| 5.25%, due 10/1/29 (a) | 470,000 | 366,013 |
| Healthcare-Services 0.0% ‡ |
| Acadia Healthcare Co., Inc. | | |
| 5.00%, due 4/15/29 (a) | 240,000 | 216,588 |
| Team Health Holdings, Inc. | | |
| 6.375%, due 2/1/25 (a) | 1,000,000 | 755,000 |
| | | 971,588 |
| Insurance 0.0% ‡ |
| GTCR AP Finance, Inc. | | |
| 8.00%, due 5/15/27 (a) | 900,000 | 857,415 |
| Internet 0.1% |
| NortonLifeLock, Inc. | | |
| 6.75%, due 9/30/27 (a) | 1,320,000 | 1,301,249 |
| Iron & Steel 0.0% ‡ |
| Carpenter Technology Corp. | | |
| 6.375%, due 7/15/28 | 630,000 | 581,997 |
| | Principal
Amount | Value |
| |
| Lodging 0.1% |
| Boyd Gaming Corp. | | |
| 4.75%, due 12/1/27 | $ 600,000 | $ 552,792 |
| Hilton Domestic Operating Co., Inc. | | |
| 5.375%, due 5/1/25 (a) | 1,000,000 | 985,000 |
| | | 1,537,792 |
| Machinery-Diversified 0.0% ‡ |
| GrafTech Finance, Inc. | | |
| 4.625%, due 12/15/28 (a) | 430,000 | 348,300 |
| Media 0.1% |
| Radiate Holdco LLC | | |
| 4.50%, due 9/15/26 (a) | 730,000 | 616,850 |
| Univision Communications, Inc. | | |
| 6.625%, due 6/1/27 (a) | 1,400,000 | 1,382,500 |
| | | 1,999,350 |
| Oil & Gas Services 0.0% ‡ |
| USA Compression Partners LP | | |
| 6.875%, due 4/1/26 | 640,000 | 614,317 |
| Packaging & Containers 0.1% |
| Ardagh Metal Packaging Finance USA LLC | | |
| 4.00%, due 9/1/29 (a) | 1,600,000 | 1,213,744 |
| Ardagh Packaging Finance plc | | |
| 5.25%, due 4/30/25 (a) | 1,000,000 | 942,950 |
| Clydesdale Acquisition Holdings, Inc. | | |
| 8.75%, due 4/15/30 (a) | 900,000 | 790,875 |
| | | 2,947,569 |
| Pharmaceuticals 0.1% |
| Bausch Health Cos., Inc. | | |
| 5.50%, due 11/1/25 (a) | 700,000 | 559,286 |
| Organon & Co. | | |
| 5.125%, due 4/30/31 (a) | 1,400,000 | 1,188,978 |
| | | 1,748,264 |
| Real Estate 0.1% |
| Realogy Group LLC | | |
| 5.75%, due 1/15/29 (a) | 1,670,000 | 1,200,313 |
| Real Estate Investment Trusts 0.0% ‡ |
| Iron Mountain, Inc. | | |
| 5.00%, due 7/15/28 (a) | 650,000 | 581,490 |
| RHP Hotel Properties LP | | |
| 4.75%, due 10/15/27 | 300,000 | 276,912 |
| | | 858,402 |
The notes to the financial statements are an integral part of, and should be read in conjunction with, the financial statements.
| 14 | MainStay Floating Rate Fund |
| | Principal
Amount | Value |
| Corporate Bonds (continued) |
| Retail 0.3% |
| 1011778 B.C. Unlimited Liability Co. | | |
| 4.00%, due 10/15/30 (a) | $ 3,120,000 | $ 2,546,700 |
| IRB Holding Corp. | | |
| 7.00%, due 6/15/25 (a) | 580,000 | 579,693 |
| LBM Acquisition LLC | | |
| 6.25%, due 1/15/29 (a) | 2,000,000 | 1,398,960 |
| Michaels Cos., Inc. (The) (a) | | |
| 5.25%, due 5/1/28 | 1,050,000 | 745,647 |
| 7.875%, due 5/1/29 | 1,400,000 | 780,500 |
| | | 6,051,500 |
| Software 0.1% |
| Clarivate Science Holdings Corp. (a) | | |
| 3.875%, due 7/1/28 | 700,000 | 600,306 |
| 4.875%, due 7/1/29 | 700,000 | 583,625 |
| | | 1,183,931 |
| Telecommunications 0.1% |
| Frontier Communications Holdings LLC | | |
| 5.875%, due 10/15/27 (a) | 560,000 | 515,103 |
| GoTo Group, Inc. | | |
| 5.50%, due 9/1/27 (a) | 2,200,000 | 1,275,428 |
| Lumen Technologies, Inc. | | |
| 4.50%, due 1/15/29 (a) | 1,330,000 | 937,587 |
| Telesat Canada | | |
| 4.875%, due 6/1/27 (a) | 900,000 | 395,730 |
| | | 3,123,848 |
Total Corporate Bonds
(Cost $65,468,705) | | 55,738,999 |
| Loan Assignments 90.5% |
| Aerospace & Defense 2.7% |
| AI Convoy (Luxembourg) SARL | |
| USD Facility Term Loan B 7.727% - 8.174% | |
| (2 Month LIBOR + 3.50%, 6 Month LIBOR + 3.50%), due 1/18/27 (b) | 1,579,796 | 1,539,906 |
| Amentum Government Services Holdings LLC (b) | |
| First Lien Tranche Term Loan 1 7.674% - 8.17% | |
| (3 Month LIBOR + 4.00%), due 1/29/27 | 5,027,330 | 4,863,942 |
| First Lien Tranche Term Loan 3 7.206% - 7.558% | |
| (3 Month LIBOR + 4.00%, 6 Month LIBOR + 4.00%), due 2/15/29 | 4,073,125 | 3,940,748 |
| | Principal
Amount | Value |
| |
| Aerospace & Defense (continued) |
| Arcline FM Holdings LLC | |
| First Lien Initial Term Loan | |
| 8.392% (3 Month LIBOR + 4.75%), due 6/23/28 (b) | $ 7,170,429 | $ 6,793,981 |
| Asplundh Tree Expert LLC | |
| Amendment No. 1 Term Loan | |
| 5.504% (1 Month LIBOR + 1.75%), due 9/7/27 (b) | 3,806,895 | 3,741,462 |
| Cobham Ultra SeniorCo. SARL | |
| USD Facility Term Loan B | |
| 7.063% (6 Month LIBOR + 3.75%), due 8/3/29 (b) | 5,400,000 | 5,204,250 |
| Dynasty Acquisition Co., Inc. (b) | |
| 2020 Term Loan B1 | |
| 7.254% (1 Month LIBOR + 3.50%), due 4/6/26 | 1,789,749 | 1,677,666 |
| 2020 Term Loan B2 | |
| 7.254% (1 Month LIBOR + 3.50%), due 4/6/26 | 962,231 | 901,971 |
| Kestrel Bidco, Inc. | |
| Term Loan | |
| 6.489% (1 Month LIBOR + 3.00%), due 12/11/26 (b) | 6,143,246 | 5,334,384 |
| Russell Investments U.S. Institutional Holdco, Inc. | |
| 2025 Term Loan | |
| 7.254% (1 Month LIBOR + 3.50%), due 5/30/25 (b) | 5,484,803 | 5,051,734 |
| SkyMiles IP Ltd. | |
| Initial Term Loan | |
| 7.993% (3 Month LIBOR + 3.75%), due 10/20/27 (b) | 5,314,286 | 5,354,882 |
| Spirit Aerosystems, Inc. | |
| 2021 Refinancing Term Loan | |
| 7.504% (1 Month LIBOR + 3.75%), due 1/15/25 (b) | 495,000 | 490,050 |
| TransDigm, Inc. (b) | |
| Tranche Refinancing Term Loan G | |
| 5.924% (3 Month LIBOR + 2.25%), due 8/22/24 | 1,974,619 | 1,939,390 |
| Tranche Refinancing Term Loan E | |
| 5.924% (3 Month LIBOR + 2.25%), due 5/30/25 | 955,481 | 933,114 |
| Tranche Refinancing Term Loan F | |
| 5.924% (3 Month LIBOR + 2.25%), due 12/9/25 | 8,258,719 | 8,055,067 |
The notes to the financial statements are an integral part of, and should be read in conjunction with, the financial statements.
15
Portfolio of Investments October 31, 2022† (continued)
| | Principal
Amount | Value |
| Loan Assignments (continued) |
| Aerospace & Defense (continued) |
| United AirLines, Inc. | |
| Term Loan B | |
| 8.108% (3 Month LIBOR + 3.75%), due 4/21/28 (b) | $ 4,137,000 | $ 4,028,921 |
| | | 59,851,468 |
| Animal Food 0.2% |
| Alltech, Inc. | |
| Term Loan B | |
| 7.754% (1 Month LIBOR + 4.00%), due 10/13/28 (b) | 4,102,333 | 3,927,984 |
| Automobile 2.0% |
| American Auto Auction Group LLC | |
| First Lien Tranche Term Loan B | |
| 8.703% (3 Month LIBOR + 5.00%), due 12/30/27 (b) | 5,955,000 | 5,359,500 |
| American Axle & Manufacturing, Inc. | |
| Tranche Term Loan B | |
| 5.84% (1 Month LIBOR + 2.25%), due 4/6/24 (b) | 1,273,824 | 1,255,353 |
| Autokiniton U.S. Holdings, Inc. | |
| Closing Date Term Loan B | |
| 7.80% (1 Month LIBOR + 4.50%), due 4/6/28 (b) | 7,090,250 | 6,615,203 |
| Belron Finance 2019 LLC | |
| Dollar Second Incremental Term Loan | |
| 6.688% (3 Month LIBOR + 2.25%), due 10/30/26 (b) | 4,200,280 | 4,121,525 |
| Belron Group SA | |
| Dollar Third Incremental Term Loan | |
| 5.375% (3 Month LIBOR + 2.50%), due 4/13/28 (b) | 6,347,267 | 6,230,236 |
| Chassix, Inc. | |
| Initial Term Loan 7.563% - 9.063% | |
| (1 Month LIBOR + 5.50%, 3 Month LIBOR + 5.50%), due 11/15/23 (b) | 3,500,024 | 3,179,187 |
| Clarios Global LP | |
| First Lien Amendment No. 1 Dollar Term Loan | |
| 7.004% (1 Month LIBOR + 3.25%), due 4/30/26 (b) | 5,145,827 | 4,996,814 |
| First Brands Group LLC | |
| First Lien 2021 Term Loan | |
| 8.368% (6 Month LIBOR + 5.00%), due 3/30/27 (b) | 2,979,811 | 2,810,954 |
| | Principal
Amount | Value |
| |
| Automobile (continued) |
| Wand Newco 3, Inc. | |
| First Lien Tranche Term Loan B1 | |
| 6.754% (1 Month LIBOR + 3.00%), due 2/5/26 (b) | $ 9,114,373 | $ 8,535,611 |
| | | 43,104,383 |
| Banking 1.1% |
| Apollo Commercial Real Estate Finance, Inc. (b) | |
| Initial Term Loan | |
| 6.504% (1 Month LIBOR + 2.75%), due 5/15/26 | 3,435,865 | 3,264,072 |
| Term Loan B1 | |
| 7.076% (1 Month LIBOR + 3.50%), due 3/11/28 | 2,955,000 | 2,807,250 |
| Brookfield Property REIT, Inc. | |
| Initial Term Loan B | |
| 6.329% (1 Month LIBOR + 2.50%), due 8/27/25 (b) | 1,073,367 | 1,047,108 |
| Edelman Financial Engines Center LLC (The) | |
| First Lien 2021 Initial Term Loan | |
| 7.254% (1 Month LIBOR + 3.50%), due 4/7/28 (b) | 7,640,288 | 7,113,826 |
| Greenhill & Co., Inc. | |
| New Term Loan | |
| 6.32% (3 Month LIBOR + 3.25%), due 4/12/24 (b)(d) | 1,299,454 | 1,263,719 |
| Jane Street Group LLC | |
| Dollar Term Loan | |
| 6.504% (1 Month LIBOR + 2.75%), due 1/26/28 (b) | 8,763,116 | 8,503,877 |
| | | 23,999,852 |
| Beverage, Food & Tobacco 2.0% |
| 8th Avenue Food & Provisions, Inc. | |
| First Lien Term Loan | |
| 7.504% (1 Month LIBOR + 3.75%), due 10/1/25 (b) | 4,749,993 | 4,092,912 |
| Arctic Glacier Group Holdings, Inc. | |
| Specified Refinancing Term Loan | |
| 7.174% (3 Month LIBOR + 3.50%), due 3/20/24 (b)(d) | 961,552 | 833,545 |
| B&G Foods, Inc. | |
| Tranche Term Loan B4 | |
| 6.254% (1 Month LIBOR + 2.50%), due 10/10/26 (b) | 825,833 | 775,767 |
| CHG PPC Parent LLC | |
| First Lien 2021-1 U.S. Term Loan | |
| 6.813% (1 Month LIBOR + 3.00%), due 12/8/28 (b) | 5,805,813 | 5,602,609 |
The notes to the financial statements are an integral part of, and should be read in conjunction with, the financial statements.
| 16 | MainStay Floating Rate Fund |
| | Principal
Amount | Value |
| Loan Assignments (continued) |
| Beverage, Food & Tobacco (continued) |
| Froneri International Ltd. | |
| First Lien Facility Term Loan B2 | |
| 6.004% (1 Month LIBOR + 2.25%), due 1/29/27 (b) | $ 2,947,162 | $ 2,841,065 |
| H-Food Holdings LLC | |
| Initial Term Loan | |
| 6.803% (1 Month LIBOR + 3.688%), due 5/23/25 (b) | 9,505,724 | 7,979,713 |
| Naked Juice LLC (b) | |
| First Lien Initial Term Loan | |
| 6.903% (3 Month LIBOR + 3.25%), due 1/24/29 | 2,655,000 | 2,422,688 |
| Second Lien Initial Term Loan | |
| 9.653% (3 Month LIBOR + 6.00%), due 1/24/30 | 1,400,000 | 1,212,313 |
| Pegasus BidCo BV | |
| Initial Dollar Term Loan | |
| 6.962% (3 Month LIBOR + 4.25%), due 7/12/29 (b) | 6,400,000 | 6,160,000 |
| Sotheby's | |
| 2021 Second Refinancing Term Loan | |
| 8.579% (3 Month LIBOR + 4.50%), due 1/15/27 (b) | 2,262,519 | 2,210,669 |
| U.S. Foods, Inc. | |
| Incremental 2021 Term Loan B | |
| 6.504% (1 Month LIBOR + 2.75%), due 11/22/28 (b) | 4,378,316 | 4,303,885 |
| United Natural Foods, Inc. | |
| Initial Term Loan | |
| 7.093% (1 Month LIBOR + 3.25%), due 10/22/25 (b) | 5,535,736 | 5,485,914 |
| | | 43,921,080 |
| Broadcasting & Entertainment 2.3% |
| Altice France SA | |
| USD Incremental Term Loan B13 | |
| 6.905% (3 Month LIBOR + 4.00%), due 8/14/26 (b) | 6,910,485 | 6,305,817 |
| Charter Communications Operating LLC | |
| Term Loan B1 | |
| 5.51% (1 Month LIBOR + 1.75%), due 4/30/25 (b) | 9,525,000 | 9,394,031 |
| Clear Channel Outdoor Holdings, Inc. | |
| Term Loan B 7.254% - 7.915% | |
| (1 Month LIBOR + 3.50%, 3 Month LIBOR + 3.50%), due 8/21/26 (b) | 7,166,464 | 6,548,357 |
| | Principal
Amount | Value |
| |
| Broadcasting & Entertainment (continued) |
| CMG Media Corp. | |
| First Lien 2021 Term Loan B | |
| 7.254% (1 Month LIBOR + 3.50%), due 12/17/26 (b) | $ 8,758,022 | $ 8,170,507 |
| Gray Television, Inc. (b) | |
| Term Loan C | |
| 5.628% (1 Month LIBOR + 2.50%), due 1/2/26 | 3,011,963 | 2,957,639 |
| Term Loan D | |
| 6.128% (1 Month LIBOR + 3.00%), due 12/1/28 | 4,369,487 | 4,302,123 |
| Nexstar Media, Inc. | |
| Term Loan B4 | |
| 6.254% (1 Month LIBOR + 2.50%), due 9/18/26 (b) | 4,863,658 | 4,805,902 |
| Numericable U.S. LLC (b) | |
| USD Term Loan B11 | |
| 7.165% (3 Month LIBOR + 2.75%), due 7/31/25 | 429,049 | 387,753 |
| USD Term Loan B12 | |
| 7.767% (3 Month LIBOR + 3.688%), due 1/31/26 | 807,850 | 723,278 |
| Univision Communications, Inc. (b) | |
| First Lien 2017 Replacement Repriced Term Loan | |
| 6.504% (1 Month LIBOR + 2.75%), due 3/15/24 | 945,806 | 940,486 |
| First Lien Initial Term Loan | |
| 7.004% (1 Month LIBOR + 3.25%), due 1/31/29 | 6,487,400 | 6,195,467 |
| First Lien 2022 Incremental Term Loan | |
| 7.79% (3 Month LIBOR + 4.25%), due 6/24/29 | 935,156 | 914,894 |
| | | 51,646,254 |
| Buildings & Real Estate 2.2% |
| Allspring Buyer LLC | |
| Initial Term Loan | |
| 6.688% (3 Month LIBOR + 3.00%), due 11/1/28 (b) | 3,702,190 | 3,644,343 |
| Beacon Roofing Supply, Inc. | |
| 2028 Term Loan | |
| 6.004% (1 Month LIBOR + 2.25%), due 5/19/28 (b) | 3,456,250 | 3,375,243 |
| Core & Main LP | |
| Tranche Term Loan B 6.096% - 7.416% | |
| (1 Month LIBOR + 2.50%, 3 Month LIBOR + 2.50%), due 7/27/28 (b) | 7,401,683 | 7,202,763 |
The notes to the financial statements are an integral part of, and should be read in conjunction with, the financial statements.
17
Portfolio of Investments October 31, 2022† (continued)
| | Principal
Amount | Value |
| Loan Assignments (continued) |
| Buildings & Real Estate (continued) |
| Cornerstone Building Brands, Inc. | |
| Tranche Term Loan B | |
| 6.589% (1 Month LIBOR + 3.25%), due 4/12/28 (b) | $ 8,502,167 | $ 7,099,309 |
| Cushman & Wakefield U.S. Borrower LLC | |
| Replacement Term Loan | |
| 6.504% (1 Month LIBOR + 2.75%), due 8/21/25 (b) | 9,782,895 | 9,554,630 |
| SRS Distribution, Inc. (b) | |
| 2021 Refinancing Term Loan | |
| 7.254% (1 Month LIBOR + 3.50%), due 6/2/28 | 6,013,775 | 5,577,777 |
| Term Loan | |
| 7.329% (1 Month LIBOR + 3.50%), due 6/2/28 | 1,389,500 | 1,288,761 |
| VC GB Holdings I Corp. | |
| First Lien Initial Term Loan | |
| 6.377% (3 Month LIBOR + 3.50%), due 7/21/28 (b) | 4,218,125 | 3,718,982 |
| Wilsonart LLC | |
| Tranche Term Loan E | |
| 6.93% (3 Month LIBOR + 3.25%), due 12/31/26 (b) | 8,745,914 | 8,105,591 |
| | | 49,567,399 |
| Capital Equipment 0.2% |
| AZZ, Inc. | |
| Initial Term Loan 6.977% - 7.384% | |
| (1 Month LIBOR + 4.25%, 3 Month LIBOR + 4.25%), due 5/13/29 (b) | 3,343,846 | 3,307,622 |
| Cargo Transport 0.3% |
| Genesee & Wyoming, Inc. | |
| Initial Term Loan | |
| 5.674% (3 Month LIBOR + 2.00%), due 12/30/26 (b) | 6,879,430 | 6,780,538 |
| Chemicals 0.3% |
| ASP Unifrax Holdings, Inc. | |
| First Lien USD Term Loan | |
| 7.424% (3 Month LIBOR + 3.75%), due 12/12/25 (b) | 2,976,804 | 2,716,334 |
| | Principal
Amount | Value |
| |
| Chemicals (continued) |
| LSF11 A5 Holdco LLC | |
| Term Loan | |
| 7.343% (1 Month LIBOR + 3.50%), due 10/15/28 (b) | $ 3,316,667 | $ 3,149,798 |
| | | 5,866,132 |
| Chemicals, Plastics & Rubber 4.8% |
| Aruba Investments Holdings LLC | |
| First Lien Initial Dollar Term Loan | |
| 7.576% (1 Month LIBOR + 4.00%), due 11/24/27 (b) | 1,298,208 | 1,217,070 |
| Bakelite UK Intermediate Ltd. | |
| Term Loan | |
| 7.669% (3 Month LIBOR + 4.00%), due 5/29/29 (b) | 6,184,500 | 5,724,528 |
| Clydesdale Acquisition Holdings, Inc. | |
| First Lien Term Loan B | |
| 8.004% (1 Month LIBOR + 4.175%), due 4/13/29 (b) | 6,977,500 | 6,710,611 |
| Diamond (BC) BV | |
| Amendment No. 3 Refinancing Term Loan 6.504% - 7.165% | |
| (1 Month LIBOR + 2.75%, 3 Month LIBOR + 2.75%), due 9/29/28 (b) | 4,962,500 | 4,631,253 |
| Entegris, Inc. | |
| 2022 Tranche Term Loan B 5.597% - 6.729% | |
| (1 Month LIBOR + 3.00%, 6 Month LIBOR + 3.00%), due 7/6/29 (b) | 10,600,000 | 10,528,779 |
| Herens Holdco SARL | |
| USD Facility Term Loan B | |
| 7.674% (3 Month LIBOR + 4.00%), due 7/3/28 (b) | 4,597,843 | 4,027,710 |
| INEOS Styrolution Group GmbH | |
| 2026 Tranche Dollar Term Loan B | |
| 6.504% (1 Month LIBOR + 2.75%), due 1/29/26 (b) | 3,515,500 | 3,301,641 |
| Ineos U.S. Finance LLC (b) | |
| 2028 Dollar Term Loan | |
| 5.615% (1 Month LIBOR + 2.50%), due 11/8/28 | 1,857,333 | 1,724,224 |
| 2024 New Dollar Term Loan | |
| 5.754% (1 Month LIBOR + 2.00%), due 4/1/24 | 2,363,165 | 2,316,230 |
| Innophos Holdings, Inc. | |
| Initial Term Loan | |
| 7.004% (1 Month LIBOR + 3.25%), due 2/5/27 (b) | 5,392,036 | 5,216,794 |
The notes to the financial statements are an integral part of, and should be read in conjunction with, the financial statements.
| 18 | MainStay Floating Rate Fund |
| | Principal
Amount | Value |
| Loan Assignments (continued) |
| Chemicals, Plastics & Rubber (continued) |
| Jazz Pharmaceuticals plc | |
| Initial Dollar Term Loan | |
| 7.254% (1 Month LIBOR + 3.50%), due 5/5/28 (b) | $ 10,256,775 | $ 10,125,365 |
| Nouryon Finance BV | |
| Initial Dollar Term Loan | |
| 7.165% (3 Month LIBOR + 2.75%), due 10/1/25 (b) | 5,483,206 | 5,164,494 |
| Olympus Water U.S. Holding Corp. | |
| Initial Dollar Term Loan | |
| 7.438% (3 Month LIBOR + 3.75%), due 11/9/28 (b) | 4,709,400 | 4,275,462 |
| Oxea Holding Vier GmbH | |
| Tranche Term Loan B2 | |
| 7.00% (3 Month LIBOR + 3.25%), due 10/14/24 (b) | 4,962,097 | 4,515,508 |
| PMHC II, Inc. | |
| Initial Term Loan | |
| 8.494% (3 Month LIBOR + 4.25%), due 4/23/29 (b) | 8,000,000 | 6,174,288 |
| SCIH Salt Holdings, Inc. | |
| First Lien Incremental Term Loan B1 | |
| 8.415% (3 Month LIBOR + 4.00%), due 3/16/27 (b) | 9,830,123 | 9,248,504 |
| Sparta U.S. Holdco LLC | |
| First Lien Initial Term Loan | |
| 6.378% (1 Month LIBOR + 3.25%), due 8/2/28 (b) | 2,084,250 | 1,973,785 |
| Tricorbraun Holdings, Inc. | |
| First Lien Closing Date Initial Term Loan | |
| 7.004% (1 Month LIBOR + 3.25%), due 3/3/28 (b) | 7,885,747 | 7,457,504 |
| Tronox Finance LLC (b) | |
| First Lien Refinancing Term Loan 5.924% - 6.004% | |
| (1 Month LIBOR + 2.25%, 3 Month LIBOR + 2.25%), due 3/10/28 | 2,635,347 | 2,478,325 |
| First Lien 2022 Incremental Term Loan | |
| 6.803% (3 Month LIBOR + 3.25%), due 4/4/29 | 4,975,000 | 4,744,906 |
| Venator Finance SARL | |
| Initial Term Loan | |
| 6.754% (1 Month LIBOR + 3.00%), due 8/8/24 (b) | 1,384,704 | 858,517 |
| | Principal
Amount | Value |
| |
| Chemicals, Plastics & Rubber (continued) |
| W. R. Grace Holdings LLC | |
| Initial Term Loan | |
| 7.438% (3 Month LIBOR + 3.75%), due 9/22/28 (b) | $ 3,473,750 | $ 3,331,698 |
| | | 105,747,196 |
| Commercial Services 0.5% |
| MHI Holdings LLC | |
| Initial Term Loan | |
| 8.754% (1 Month LIBOR + 5.00%), due 9/21/26 (b) | 2,351,999 | 2,300,549 |
| Prime Security Services Borrower LLC | |
| First Lien 2021 Refinancing Term Loan B1 | |
| 6.505% (3 Month LIBOR + 2.75%), due 9/23/26 (b) | 8,754,625 | 8,614,551 |
| | | 10,915,100 |
| Consumer Durables 0.2% |
| SWF Holdings I Corp. | |
| First Lien Initial Term Loan | |
| 7.602% (3 Month LIBOR + 4.00%), due 10/6/28 (b) | 6,865,500 | 5,326,481 |
| Containers, Packaging & Glass 2.5% |
| Alliance Laundry Systems LLC | |
| Initial Term Loan B | |
| 7.409% (3 Month LIBOR + 3.50%), due 10/8/27 (b) | 6,663,467 | 6,425,248 |
| Altium Packaging LLC | |
| First Lien 2021 Term Loan | |
| 6.504% (1 Month LIBOR + 2.75%), due 2/3/28 (b) | 3,038,830 | 2,859,214 |
| Anchor Glass Container Corp. | |
| First Lien July 2017 Additional Term Loan 6.424% - 6.534% | |
| (3 Month LIBOR + 2.75%), due 12/7/23 (b) | 2,625,486 | 1,949,894 |
| Berlin Packaging LLC (b) | |
| Tranche Initial Term Loan B4 6.38% - 6.93% | |
| (1 Month LIBOR + 3.25%, 3 Month LIBOR + 3.25%), due 3/11/28 | 3,940,125 | 3,714,797 |
| Tranche Term Loan B5 6.88% - 7.43% | |
| (1 Month LIBOR + 3.75%, 3 Month LIBOR + 3.75%), due 3/11/28 | 1,069,200 | 1,021,754 |
| Berry Global, Inc. | |
| Term Loan Z | |
| 5.05% (1 Month LIBOR + 1.75%), due 7/1/26 (b) | 3,300,749 | 3,248,987 |
The notes to the financial statements are an integral part of, and should be read in conjunction with, the financial statements.
19
Portfolio of Investments October 31, 2022† (continued)
| | Principal
Amount | Value |
| Loan Assignments (continued) |
| Containers, Packaging & Glass (continued) |
| Charter Next Generation, Inc. | |
| First Lien 2021 Initial Term Loan | |
| 7.504% (1 Month LIBOR + 3.75%), due 12/1/27 (b) | $ 3,554,399 | $ 3,440,363 |
| Graham Packaging Co., Inc. | |
| 2021 Initial Term Loan | |
| 6.754% (1 Month LIBOR + 3.00%), due 8/4/27 (b) | 7,458,036 | 7,257,176 |
| Mauser Packaging Solutions Holding Co. | |
| Initial Term Loan | |
| 6.378% (1 Month LIBOR + 3.25%), due 4/3/24 (b) | 5,694,603 | 5,395,636 |
| Pactiv Evergreen, Inc. (b) | |
| Tranche B3 U.S. Term Loan 6.615% - 7.254% | |
| (1 Month LIBOR + 3.50%), due 9/24/28 | 990,000 | 959,062 |
| Tranche U.S. Term Loan B2 | |
| 7.004% (1 Month LIBOR + 3.25%), due 2/5/26 | 3,075,237 | 2,985,287 |
| Pretium PKG Holdings, Inc. (b) | |
| First Lien Initial Term Loan 7.168% - 7.743% | |
| (3 Month LIBOR + 4.00%), due 10/2/28 | 3,652,400 | 3,177,588 |
| Second Lien Initial Term Loan 9.918% - 10.493% | |
| (3 Month LIBOR + 6.75%), due 10/1/29 | 1,750,000 | 1,452,500 |
| Reynolds Consumer Products LLC | |
| Initial Term Loan | |
| 5.504% (1 Month LIBOR + 1.75%), due 2/4/27 (b) | 2,134,470 | 2,091,484 |
| RLG Holdings LLC | |
| First Lien Closing Date Initial Term Loan | |
| 7.754% (1 Month LIBOR + 4.00%), due 7/7/28 (b) | 4,962,500 | 4,639,938 |
| Trident TPI Holdings, Inc. | |
| Tranche Term Loan B1 | |
| 6.924% (3 Month LIBOR + 3.25%), due 10/17/24 (b) | 1,980,754 | 1,944,853 |
| Tranche Initial Term Loan B3 | |
| 7.674% (3 Month LIBOR + 4.00%), due 9/15/28 (b) | 3,269,899 | 3,094,727 |
| Tranche Delayed Draw Term Loan B3 | |
| 7.674% (3 Month LIBOR + 4.00%), due 9/15/28 (b)(d) | 291,549 | 275,930 |
| Incremental Term Loan | |
| 9.336%, due 9/15/28 | 400,000 | 382,333 |
| | | 56,316,771 |
| | Principal
Amount | Value |
| |
| Diversified/Conglomerate Manufacturing 2.3% |
| Allied Universal Holdco LLC | |
| Initial U.S. Dollar Term Loan | |
| 7.504% (1 Month LIBOR + 3.75%), due 5/12/28 (b) | $ 11,037,594 | $ 9,992,466 |
| EWT Holdings III Corp. | |
| Initial Term Loan | |
| 6.313% (1 Month LIBOR + 2.50%), due 4/1/28 (b) | 4,665,937 | 4,581,367 |
| Filtration Group Corp. (b) | |
| 2021 Incremental Term Loan | |
| 6.615% (1 Month LIBOR + 3.50%), due 10/21/28 | 2,984,925 | 2,871,924 |
| Initial Dollar Term Loan | |
| 6.754% (1 Month LIBOR + 3.00%), due 3/31/25 | 5,796,931 | 5,665,462 |
| Gardner Denver, Inc. | |
| 2020 GDI Tranche Dollar Term Loan B2 | |
| 5.579% (1 Month LIBOR + 1.75%), due 3/1/27 (b) | 3,343,085 | 3,268,561 |
| GYP Holdings III Corp. | |
| First Lien 2021 Incremental Term Loan | |
| 6.254% (1 Month LIBOR + 2.50%), due 6/1/25 (b) | 2,573,707 | 2,544,217 |
| Ingersoll-Rand Services Co. | |
| 2020 Spinco Tranche Dollar Term Loan B1 | |
| 5.579% (1 Month LIBOR + 1.75%), due 3/1/27 (b) | 851,243 | 832,267 |
| Iron Mountain Information Management LLC | |
| Incremental Term Loan B | |
| 5.504% (1 Month LIBOR + 1.75%), due 1/2/26 (b) | 3,211,036 | 3,142,802 |
| LTI Holdings, Inc. (b) | |
| First Lien Initial Term Loan | |
| 7.004% (1 Month LIBOR + 3.25%), due 9/6/25 | 1,295,965 | 1,206,219 |
| First Lien Third Amendment Additional Term Loan | |
| 8.254% (1 Month LIBOR + 4.50%), due 7/24/26 (d) | 248,125 | 231,997 |
| First Lien Third Amendment Delayed Draw Term Loan | |
| 8.254% (1 Month LIBOR + 4.50%), due 7/24/26 (d) | 250,000 | 233,750 |
| First Lien First Amendment Additional Term Loan | |
| 8.254% (1 Month LIBOR + 4.50%), due 7/24/26 | 1,238,994 | 1,152,265 |
| QUIKRETE Holdings, Inc. (b) | |
| First Lien Initial Term Loan | |
| 5.74% (1 Month LIBOR + 2.625%), due 2/1/27 | 2,311,469 | 2,243,776 |
The notes to the financial statements are an integral part of, and should be read in conjunction with, the financial statements.
| 20 | MainStay Floating Rate Fund |
| | Principal
Amount | Value |
| Loan Assignments (continued) |
| Diversified/Conglomerate Manufacturing (continued) |
| QUIKRETE Holdings, Inc. (b) (continued) | |
| First Lien Fourth Amendment Term Loan B1 | |
| 6.754% (1 Month LIBOR + 3.00%), due 6/11/28 | $ 5,472,500 | $ 5,324,288 |
| Red Ventures LLC | |
| First Lien Term Loan B2 | |
| 6.254% (1 Month LIBOR + 2.50%), due 11/8/24 (b) | 4,177,532 | 4,096,070 |
| WP CPP Holdings LLC | |
| First Lien Initial Term Loan 7.51% - 8.17% | |
| (1 Month LIBOR + 3.75%, 3 Month LIBOR + 3.75%), due 4/30/25 (b) | 2,968,076 | 2,522,865 |
| | | 49,910,296 |
| Diversified/Conglomerate Service 2.3% |
| Applied Systems, Inc. (b) | |
| First Lien Closing Date Term Loan | |
| 6.674% (3 Month LIBOR + 3.00%), due 9/19/24 | 3,463,798 | 3,415,305 |
| Second Lien 2021 Term Loan | |
| 9.174% (3 Month LIBOR + 5.50%), due 9/19/25 | 1,982,109 | 1,946,595 |
| Blackhawk Network Holdings, Inc. | |
| First Lien Term Loan | |
| 7.077% (3 Month LIBOR + 3.00%), due 6/15/25 (b) | 5,834,296 | 5,562,640 |
| Brightview Landscapes LLC | |
| 2022 Initial Term Loan | |
| 6.979% (1 Month LIBOR + 3.25%), due 4/20/29 (b) | 1,428,282 | 1,383,648 |
| Element Materials Technology Group U.S. Holdings, Inc. (b) | |
| Initial USD Term Loan B | |
| 7.903% (3 Month LIBOR + 4.25%), due 6/22/29 | 1,915,790 | 1,833,889 |
| First Lien Delayed Draw Term Loan B | |
| 7.904% (3 Month LIBOR + 4.25%), due 6/22/29 | 884,211 | 846,411 |
| Genesys Cloud Services Holdings I LLC | |
| 2020 Initial Dollar Term Loan | |
| 7.754% (1 Month LIBOR + 4.00%), due 12/1/27 (b) | 8,338,786 | 8,116,416 |
| MKS Instruments, Inc. | |
| Initial Dollar Term Loan B | |
| 6.317% (1 Month LIBOR + 2.75%), due 8/17/29 (b) | 13,390,000 | 13,071,987 |
| | Principal
Amount | Value |
| |
| Diversified/Conglomerate Service (continued) |
| TruGreen LP | |
| First Lien Second Refinancing Term Loan | |
| 7.754% (1 Month LIBOR + 4.00%), due 11/2/27 (b) | $ 7,890,324 | $ 7,278,824 |
| Verint Systems, Inc. | |
| Refinancing Term Loan | |
| 5.128% (1 Month LIBOR + 2.00%), due 6/28/24 (b) | 705,882 | 697,059 |
| Verscend Holding Corp. | |
| Term Loan B1 | |
| 7.754% (1 Month LIBOR + 4.00%), due 8/27/25 (b) | 6,082,645 | 5,985,700 |
| | | 50,138,474 |
| Ecological 0.5% |
| GFL Environmental, Inc. | |
| 2020 Refinancing Term Loan | |
| 7.415% (3 Month LIBOR + 3.00%), due 5/30/25 (b) | 10,353,670 | 10,287,106 |
| Electronics 7.0% |
| Camelot U.S. Acquisition 1 Co. (b) | |
| Initial Term Loan | |
| 6.754% (1 Month LIBOR + 3.00%), due 10/30/26 | 2,858,253 | 2,804,661 |
| Amendment No. 2 Incremental Term Loan | |
| 6.754% (1 Month LIBOR + 3.00%), due 10/30/26 | 4,573,660 | 4,492,478 |
| Castle U.S. Holding Corp. (b) | |
| Initial Dollar Term Loan | |
| 7.504% (1 Month LIBOR + 3.75%), due 1/29/27 | 2,262,335 | 1,538,387 |
| Dollar Term Loan B2 | |
| 7.754% (1 Month LIBOR + 4.00%), due 1/29/27 | 4,937,500 | 3,357,500 |
| Commscope, Inc. | |
| Initial Term Loan | |
| 7.004% (1 Month LIBOR + 3.25%), due 4/6/26 (b) | 8,197,296 | 7,799,728 |
| CoreLogic, Inc. | |
| First Lien Initial Term Loan | |
| 7.313% (1 Month LIBOR + 3.50%), due 6/2/28 (b) | 7,485,057 | 5,467,213 |
| DCert Buyer, Inc. | |
| First Lien Initial Term Loan | |
| 6.903% (3 Month LIBOR + 4.00%), due 10/16/26 (b) | 5,403,247 | 5,195,222 |
The notes to the financial statements are an integral part of, and should be read in conjunction with, the financial statements.
21
Portfolio of Investments October 31, 2022† (continued)
| | Principal
Amount | Value |
| Loan Assignments (continued) |
| Electronics (continued) |
| Diebold Nixdorf, Inc. | |
| New Dollar Term Loan B | |
| 6.063% (1 Month LIBOR + 2.75%), due 11/6/23 (b) | $ 930,016 | $ 725,994 |
| ECi Macola/MAX Holding LLC | |
| First Lien Initial Term Loan | |
| 7.424% (3 Month LIBOR + 3.75%), due 11/9/27 (b) | 3,438,750 | 3,321,258 |
| Epicor Software Corp. | |
| Term Loan C | |
| 7.004% (1 Month LIBOR + 3.25%), due 7/30/27 (b) | 7,678,033 | 7,282,614 |
| Flexera Software LLC | |
| First Lien Term Loan B1 | |
| 7.51% (1 Month LIBOR + 3.75%), due 3/3/28 (b) | 5,213,751 | 5,009,544 |
| Gainwell Acquisition Corp. | |
| First Lien Term Loan B | |
| 7.674% (3 Month LIBOR + 4.00%), due 10/1/27 (b) | 5,589,685 | 5,305,545 |
| Generation Bridge LLC (b) | |
| Term Loan B | |
| 8.674% (3 Month LIBOR + 5.00%), due 12/1/28 | 3,402,857 | 3,362,448 |
| Term Loan C | |
| 8.674% (3 Month LIBOR + 5.00%), due 12/1/28 (d) | 71,429 | 70,580 |
| Go Daddy Operating Co. LLC | |
| Tranche Term Loan B2 | |
| 4.865% (1 Month LIBOR + 1.75%), due 2/15/24 (b) | 2,147,727 | 2,135,199 |
| Helios Software Holdings, Inc. | |
| 2021 Initial Dollar Term Loan | |
| 7.453% (3 Month LIBOR + 3.75%), due 3/11/28 (b) | 1,988,571 | 1,911,017 |
| Hyland Software, Inc. (b) | |
| First Lien 2018 Refinancing Term Loan | |
| 7.254% (1 Month LIBOR + 3.50%), due 7/1/24 | 7,340,083 | 7,147,405 |
| Second Lien 2021 Refinancing Term Loan | |
| 10.004% (1 Month LIBOR + 6.25%), due 7/7/25 | 1,996,667 | 1,905,818 |
| ION Trading Finance Ltd. | |
| 2021 Initial Dollar Term Loan | |
| 8.424% (3 Month LIBOR + 4.75%), due 4/1/28 (b) | 3,950,000 | 3,667,741 |
| | Principal
Amount | Value |
| |
| Electronics (continued) |
| MA FinanceCo. LLC | |
| Tranche Term Loan B4 | |
| 7.418% (3 Month LIBOR + 4.25%), due 6/5/25 (b)(d) | $ 2,396,960 | $ 2,368,995 |
| MH Sub I LLC (b) | |
| First Lien Amendment No. 2 Initial Term Loan | |
| 7.504% (1 Month LIBOR + 3.75%), due 9/13/24 | 4,036,487 | 3,882,092 |
| First Lien 2020 June New Term Loan | |
| 7.504% (1 Month LIBOR + 3.75%), due 9/13/24 | 5,280,037 | 5,072,136 |
| Misys Ltd. | |
| First Lien Dollar Term Loan | |
| 6.871% (3 Month LIBOR + 3.50%), due 6/13/24 (b) | 7,969,525 | 7,186,519 |
| Project Alpha Intermediate Holding, Inc. | |
| 2021 Refinancing Term Loan | |
| 7.76% (1 Month LIBOR + 4.00%), due 4/26/24 (b) | 7,201,556 | 6,992,711 |
| Proofpoint, Inc. | |
| First Lien Initial Term Loan | |
| 6.32% (3 Month LIBOR + 3.25%), due 8/31/28 (b) | 7,528,000 | 7,145,721 |
| Rocket Software, Inc. (b) | |
| First Lien Initial Term Loan | |
| 8.004% (1 Month LIBOR + 4.25%), due 11/28/25 | 4,005,987 | 3,873,289 |
| First Lien 2021 Dollar Term Loan | |
| 8.004% (1 Month LIBOR + 4.25%), due 11/28/25 | 2,221,875 | 2,147,813 |
| Seattle SpinCo, Inc. | |
| Initial Term Loan | |
| 6.504% (1 Month LIBOR + 2.75%), due 6/21/24 (b) | 1,494,808 | 1,475,500 |
| Sharp Midco LLC | |
| First Lien Initial Term Loan | |
| 7.674% (3 Month LIBOR + 4.00%), due 12/31/28 (b) | 6,169,000 | 5,922,240 |
| SS&C Technologies Holdings, Inc. (b) | |
| Term Loan B3 | |
| 5.504% (1 Month LIBOR + 1.75%), due 4/16/25 | 3,357,000 | 3,279,668 |
| Term Loan B4 | |
| 5.504% (1 Month LIBOR + 1.75%), due 4/16/25 | 2,725,197 | 2,662,419 |
| Term Loan B6 | |
| 6.079% (1 Month LIBOR + 2.25%), due 3/22/29 | 2,552,206 | 2,500,843 |
The notes to the financial statements are an integral part of, and should be read in conjunction with, the financial statements.
| 22 | MainStay Floating Rate Fund |
| | Principal
Amount | Value |
| Loan Assignments (continued) |
| Electronics (continued) |
| SS&C Technologies Holdings, Inc. (b) (continued) | |
| Term Loan B7 | |
| 6.079% (1 Month LIBOR + 2.25%), due 3/22/29 | $ 3,845,588 | $ 3,768,196 |
| Surf Holdings SARL | |
| First Lien Dollar Tranche Term Loan | |
| 6.668% (3 Month LIBOR + 3.50%), due 3/5/27 (b) | 2,987,793 | 2,920,568 |
| ThoughtWorks, Inc. | |
| Incremental Term Loan | |
| 6.504% (1 Month LIBOR + 2.75%), due 3/24/28 (b) | 1,357,007 | 1,330,715 |
| Trader Corp. | |
| First Lien 2017 Refinancing Term Loan | |
| 6.632% (1 Month LIBOR + 3.00%), due 9/28/23 (b) | 7,034,981 | 6,788,756 |
| Vertiv Group Corp. | |
| Term Loan B | |
| 5.878% (1 Month LIBOR + 2.75%), due 3/2/27 (b) | 7,857,742 | 7,559,148 |
| VS Buyer LLC | |
| Initial Term Loan | |
| 6.754% (1 Month LIBOR + 3.00%), due 2/28/27 (b) | 1,462,500 | 1,418,625 |
| WEX, Inc. | |
| Term Loan B | |
| 6.004% (1 Month LIBOR + 2.25%), due 3/31/28 (b) | 3,940,000 | 3,854,163 |
| | | 154,650,469 |
| Energy (Electricity) 0.2% |
| Covanta Holding Corp. (b) | |
| Initial Term Loan B | |
| 6.254% (1 Month LIBOR + 2.50%), due 11/30/28 | 4,072,913 | 4,014,874 |
| Initial Term Loan C | |
| 6.254% (1 Month LIBOR + 2.50%), due 11/30/28 | 306,620 | 302,251 |
| | | 4,317,125 |
| Entertainment 1.1% |
| Alterra Mountain Co. | |
| Term Loan B2 | |
| 7.254% (1 Month LIBOR + 3.50%), due 8/17/28 (b) | 4,791,225 | 4,671,444 |
| | Principal
Amount | Value |
| |
| Entertainment (continued) |
| Fertitta Entertainment LLC | |
| Initial Term Loan B | |
| 7.729% (1 Month LIBOR + 4.00%), due 1/27/29 (b) | $ 10,191,269 | $ 9,543,400 |
| Formula One Management Ltd. | |
| USD Facility Term Loan B3 | |
| 6.254% (1 Month LIBOR + 2.50%), due 2/1/24 (b) | 3,650,036 | 3,639,389 |
| J&J Ventures Gaming LLC | |
| Initial Term Loan | |
| 7.674% (3 Month LIBOR + 4.00%), due 4/26/28 (b) | 7,425,000 | 6,998,062 |
| | | 24,852,295 |
| Finance 6.8% |
| AAdvantage Loyality IP Ltd. | |
| Initial Term Loan | |
| 8.993% (3 Month LIBOR + 4.75%), due 4/20/28 (b) | 11,200,000 | 11,070,002 |
| Acuity Specialty Products, Inc. | |
| First Lien Initial Term Loan | |
| 7.674% (3 Month LIBOR + 4.00%), due 8/12/24 (b)(d) | 1,589,243 | 1,356,153 |
| Acuris Finance U.S., Inc. | |
| Initial Dollar Term Loan | |
| 7.703% (3 Month LIBOR + 4.00%), due 2/16/28 (b) | 7,147,135 | 6,975,604 |
| ADMI Corp. (b) | |
| Amendment No.4 Refinancing Term Loan | |
| 7.129% (1 Month LIBOR + 3.375%), due 12/23/27 | 2,462,500 | 2,184,238 |
| Amendment No. 5 Incremental Term Loan | |
| 7.504% (1 Month LIBOR + 3.75%), due 12/23/27 | 3,712,500 | 3,313,406 |
| Ahlstrom-Munksjo Holding 3 Oy | |
| USD Facility Term Loan B | |
| 7.424% (3 Month LIBOR + 3.75%), due 2/4/28 (b) | 3,152,299 | 2,860,711 |
| AlixPartners LLP | |
| Initial Dollar Term Loan | |
| 6.504% (1 Month LIBOR + 2.75%), due 2/4/28 (b) | 4,900,063 | 4,773,887 |
| Blackstone Mortgage Trust, Inc. | |
| Term Loan B4 | |
| 7.229% (1 Month LIBOR + 3.50%), due 5/9/29 (b) | 4,788,000 | 4,656,330 |
The notes to the financial statements are an integral part of, and should be read in conjunction with, the financial statements.
23
Portfolio of Investments October 31, 2022† (continued)
| | Principal
Amount | Value |
| Loan Assignments (continued) |
| Finance (continued) |
| Blue Tree Holdings, Inc. | |
| Term Loan | |
| 6.18% (3 Month LIBOR + 2.50%), due 3/4/28 (b) | $ 1,477,500 | $ 1,429,481 |
| Boxer Parent Co., Inc. | |
| 2021 Replacement Dollar Term Loan | |
| 7.504% (1 Month LIBOR + 3.75%), due 10/2/25 (b) | 3,897,962 | 3,739,794 |
| Brand Industrial Services, Inc. | |
| Initial Term Loan 7.033% - 8.034% | |
| (3 Month LIBOR + 4.25%), due 6/21/24 (b) | 6,453,899 | 5,573,658 |
| Colouroz Investment 1 GmbH | |
| First Lien Initial Term Loan C 8.266% - 8.575% | |
| (0.75% PIK) (2 Month LIBOR + 4.25%, 3 Month LIBOR + 4.25%), due 9/21/23 (b)(d)(e) | 235,468 | 169,831 |
| Colouroz Investment 2 LLC | |
| First Lien Initial Term Loan B2 8.266% - 8.575% | |
| (0.75% PIK) (2 Month LIBOR + 4.25%, 3 Month LIBOR + 4.25%), due 9/21/23 (b)(d)(e) | 1,424,386 | 1,027,338 |
| Covia Holdings LLC | |
| Initial Term Loan | |
| 7.748% (3 Month LIBOR + 4.00%), due 7/31/26 (b) | 837,917 | 796,440 |
| CPC Acquisition Corp. | |
| First Lien Initial Term Loan | |
| 7.424% (3 Month LIBOR + 3.75%), due 12/29/27 (b) | 5,405,032 | 4,269,975 |
| Deerfield Dakota Holding LLC | |
| First Lien Initial Dollar Term Loan | |
| 7.479% (1 Month LIBOR + 3.75%), due 4/9/27 (b) | 8,873,036 | 8,379,474 |
| Endurance International Group Holdings, Inc. | |
| Initial Term Loan | |
| 6.698% (1 Month LIBOR + 3.50%), due 2/10/28 (b) | 7,675,081 | 6,509,428 |
| LBM Acquisition LLC | |
| First Lien Initial Term Loan | |
| 7.121% (3 Month LIBOR + 3.75%), due 12/17/27 (b) | 6,521,623 | 5,561,718 |
| LSF11 Skyscraper Holdco SARL | |
| USD Facility Term Loan B3 | |
| 7.174% (3 Month LIBOR + 3.50%), due 9/29/27 (b) | 6,107,579 | 5,863,276 |
| | Principal
Amount | Value |
| |
| Finance (continued) |
| Minimax Viking GmbH | |
| Facility Term Loan B1C | |
| 6.254% (1 Month LIBOR + 2.50%), due 7/31/25 (b) | $ 4,085,635 | $ 3,956,685 |
| ON Semiconductor Corp. | |
| 2019 New Replacement Term Loan B4 | |
| 5.754% (1 Month LIBOR + 2.00%), due 9/19/26 (b) | 329,584 | 329,790 |
| Onex TSG Intermediate Corp. | |
| Initial Term Loan | |
| 9.165% (3 Month LIBOR + 4.75%), due 2/28/28 (b) | 3,950,000 | 3,495,750 |
| Park River Holdings, Inc. | |
| First Lien Initial Term Loan | |
| 6.993% (3 Month LIBOR + 3.25%), due 12/28/27 (b) | 7,576,401 | 6,402,059 |
| Peraton Corp. | |
| First Lien Term Loan B | |
| 7.504% (1 Month LIBOR + 3.75%), due 2/1/28 (b) | 5,035,331 | 4,839,311 |
| Pluto Acquisition I, Inc. | |
| First Lien 2021 Term Loan | |
| 6.076% (3 Month LIBOR + 4.00%), due 6/22/26 (b) | 7,307,500 | 6,296,632 |
| PODS LLC | |
| Initial Term Loan | |
| 6.754% (1 Month LIBOR + 3.00%), due 3/31/28 (b) | 4,390,426 | 4,230,175 |
| Potters Industries LLC | |
| Initial Term Loan | |
| 7.674% (3 Month LIBOR + 4.00%), due 12/14/27 (b) | 1,182,000 | 1,134,720 |
| RealPage, Inc. | |
| First Lien Initial Term Loan | |
| 6.754% (1 Month LIBOR + 3.00%), due 4/24/28 (b) | 6,342,092 | 5,947,297 |
| RealTruck Group, Inc. | |
| Initial Term Loan | |
| 7.254% (1 Month LIBOR + 3.50%), due 1/31/28 (b) | 5,944,587 | 5,090,052 |
| Triton Water Holdings, Inc. | |
| First Lien Initial Term Loan | |
| 7.174% (3 Month LIBOR + 3.50%), due 3/31/28 (b) | 7,845,585 | 6,960,509 |
| WCG Purchaser Corp. | |
| First Lien Initial Term Loan 7.115% - 7.674% | |
| (1 Month LIBOR + 4.00%, 3 Month LIBOR + 4.00%), due 1/8/27 (b) | 7,486,693 | 7,093,642 |
The notes to the financial statements are an integral part of, and should be read in conjunction with, the financial statements.
| 24 | MainStay Floating Rate Fund |
| | Principal
Amount | Value |
| Loan Assignments (continued) |
| Finance (continued) |
| WildBrain Ltd. | |
| Initial Term Loan | �� |
| 8.093% (1 Month LIBOR + 4.25%), due 3/24/28 (b) | $ 7,525,400 | $ 6,948,450 |
| WIN Waste Innovations Holdings, Inc. | |
| Initial Term Loan | |
| 6.424% (3 Month LIBOR + 2.75%), due 3/24/28 (b) | 7,860,500 | 7,732,767 |
| | | 150,968,583 |
| Healthcare 2.2% |
| AHP Health Partners, Inc. | |
| Initial Term Loan | |
| 7.254% (1 Month LIBOR + 3.50%), due 8/24/28 (b) | 1,980,000 | 1,881,000 |
| Chariot Buyer LLC | |
| First Lien Initial Term Loan | |
| 6.615% (1 Month LIBOR + 3.50%), due 11/3/28 (b) | 7,121,025 | 6,450,460 |
| CHG Healthcare Services, Inc. | |
| First Lien Initial Term Loan | |
| 7.004% (1 Month LIBOR + 3.25%), due 9/29/28 (b) | 6,145,444 | 5,958,198 |
| ICU Medical, Inc. | |
| Tranche Term Loan B 5.953% - 6.019% | |
| (1 Month LIBOR + 2.25%, 3 Month LIBOR + 2.25%), due 1/8/29 (b) | 7,363,000 | 7,190,426 |
| LSCS Holdings, Inc. | |
| First Lien Initial Term Loan | |
| 8.174% (3 Month LIBOR + 4.50%), due 12/16/28 (b) | 4,764,000 | 4,533,742 |
| Medical Solutions Holdings, Inc. | |
| First Lien Initial Term Loan | |
| 6.377% (3 Month LIBOR + 3.50%), due 11/1/28 (b) | 1,764,515 | 1,697,463 |
| Medline Borrower LP | |
| Initial Dollar Term Loan | |
| 7.004% (1 Month LIBOR + 3.25%), due 10/23/28 (b) | 8,350,519 | 7,661,601 |
| U.S. Anesthesia Partners, Inc. | |
| First Lien Initial Term Loan | |
| 7.378% (1 Month LIBOR + 4.25%), due 10/1/28 (b) | 6,435,000 | 6,078,778 |
| | Principal
Amount | Value |
| |
| Healthcare (continued) |
| WP CityMD Bidco LLC | |
| Second Amendment Refinancing Term Loan | |
| 6.924% (3 Month LIBOR + 3.25%), due 12/22/28 (b) | $ 7,291,679 | $ 7,061,991 |
| | | 48,513,659 |
| Healthcare & Pharmaceuticals 1.8% |
| Bausch & Lomb Corp. | |
| Initial Term Loan | |
| 6.618% (1 Month LIBOR + 3.25%), due 5/10/27 (b) | 7,980,000 | 7,466,287 |
| Bausch Health Cos., Inc. | |
| Second Amendment Term Loan | |
| 8.624% (1 Month LIBOR + 5.25%), due 2/1/27 (b) | 8,887,500 | 6,627,533 |
| Embecta Corp. | |
| First Lien Initial Term Loan | |
| 6.553% (3 Month LIBOR + 3.00%), due 3/30/29 (b) | 6,391,793 | 6,221,344 |
| Envision Healthcare Corp. (b) | |
| Third Out Term Loan | |
| 6.325% (3 Month LIBOR + 3.75%), due 3/31/27 | 1,460,742 | 372,489 |
| Second Out Term Loan | |
| 6.825% (3 Month LIBOR + 4.25%), due 3/31/27 | 3,106,017 | 1,296,762 |
| First Out Term Loan | |
| 11.553% (1 Month LIBOR + 7.875%), due 3/31/27 | 524,944 | 478,355 |
| Owens & Minor, Inc. | |
| Term Loan B1 7.579% - 7.831% | |
| (1 Month LIBOR + 3.75%, 6 Month LIBOR + 3.75%), due 3/29/29 (b) | 3,980,000 | 3,890,450 |
| Pediatric Associates Holding Co. LLC (b) | |
| Amendment No. 1 Incremental Term Loan | |
| 7.004% (1 Month LIBOR + 3.25%), due 12/29/28 | 5,526,060 | 5,318,832 |
| Amendment No. 1 Incremental Delayed Draw Term Loan | |
| 7.004% (1 Month LIBOR + 3.25%), due 12/29/28 (d)(f) | 418,643 | 402,944 |
| Physician Partners LLC | |
| Initial Term Loan | |
| 7.829% (1 Month LIBOR + 4.00%), due 12/23/28 (b) | 5,596,875 | 5,268,059 |
The notes to the financial statements are an integral part of, and should be read in conjunction with, the financial statements.
25
Portfolio of Investments October 31, 2022† (continued)
| | Principal
Amount | Value |
| Loan Assignments (continued) |
| Healthcare & Pharmaceuticals (continued) |
| Team Health Holdings, Inc. | |
| Extended Term Loan | |
| 8.979% (1 Month LIBOR + 5.25%), due 3/2/27 (b) | $ 2,434,138 | $ 2,012,222 |
| | | 39,355,277 |
| Healthcare, Education & Childcare 5.1% |
| Agiliti Health, Inc. | |
| Initial Term Loan | |
| 5.938% (1 Month LIBOR + 2.75%), due 1/4/26 (b) | 5,011,036 | 4,910,815 |
| Akorn Operating Co. LLC | |
| Term Loan | |
| 11.243% (3 Month LIBOR + 7.50%), due 10/1/25 (b) | 53,924 | 50,890 |
| Alvogen Pharma U.S., Inc. | |
| January 2020 Term Loan | |
| 8.953% (3 Month LIBOR + 5.25%), due 12/31/23 (b) | 896,261 | 775,266 |
| Amneal Pharmaceuticals LLC | |
| Initial Term Loan 7.188% - 7.313% | |
| (1 Month LIBOR + 3.50%, 3 Month LIBOR + 3.50%), due 5/4/25 (b) | 8,966,650 | 7,610,445 |
| athenahealth Group, Inc. | |
| Initial Term Loan | |
| 6.967% (1 Month LIBOR + 3.50%), due 2/15/29 (b) | 8,099,226 | 7,350,048 |
| Auris Luxembourg III SARL | |
| Facility Term Loan B2 7.824% - 8.678% | |
| (2 Month LIBOR + 3.75%, 6 Month LIBOR + 3.75%), due 2/27/26 (b) | 1,362,829 | 1,158,404 |
| Carestream Dental Technology Parent Ltd. (b) | |
| First Lien Initial Term Loan | |
| 7.004% (1 Month LIBOR + 3.25%), due 9/1/24 | 1,382,762 | 1,292,882 |
| First Lien Tranche Term Loan B | |
| 8.254% (1 Month LIBOR + 4.50%), due 9/1/24 | 1,834,678 | 1,758,998 |
| Carestream Health, Inc. | |
| Term Loan | |
| 11.153% (3 Month LIBOR + 7.50%), due 9/30/27 (b) | 2,536,788 | 2,130,902 |
| Ecovyst Catalyst Technologies LLC | |
| Initial Term Loan | |
| 6.915% (3 Month LIBOR + 2.50%), due 6/9/28 (b) | 5,506,150 | 5,302,422 |
| | Principal
Amount | Value |
| |
| Healthcare, Education & Childcare (continued) |
| Elanco Animal Health, Inc. | |
| Term Loan | |
| 4.878% (1 Month LIBOR + 1.75%), due 8/1/27 (b) | $ 2,673,745 | $ 2,573,814 |
| eResearchTechnology, Inc. | |
| First Lien Initial Term Loan | |
| 8.254% (1 Month LIBOR + 4.50%), due 2/4/27 (b) | 7,886,009 | 7,333,988 |
| FC Compassus LLC | |
| Term Loan B1 | |
| 7.127% (3 Month LIBOR + 4.25%), due 12/31/26 (b)(d) | 6,343,880 | 5,730,636 |
| Grifols Worldwide Operations Ltd. | |
| Dollar Tranche Term Loan B | |
| 5.754% (1 Month LIBOR + 2.00%), due 11/15/27 (b) | 3,730,270 | 3,572,771 |
| Horizon Therapeutics USA, Inc. | |
| Incremental Term Loan B2 | |
| 5.375% (1 Month LIBOR + 1.75%), due 3/15/28 (b) | 2,626,667 | 2,570,304 |
| Insulet Corp. | |
| Term Loan B | |
| 7.004% (1 Month LIBOR + 3.25%), due 5/4/28 (b) | 7,519,924 | 7,341,326 |
| Journey Personal Care Corp. | |
| Initial Term Loan | |
| 7.924% (3 Month LIBOR + 4.25%), due 3/1/28 (b) | 4,937,500 | 3,115,563 |
| LifePoint Health, Inc. | |
| First Lien Term Loan B | |
| 8.165% (3 Month LIBOR + 3.75%), due 11/16/25 (b) | 4,642,116 | 4,086,719 |
| Mallinckrodt International Finance SA | |
| 2017 Replacement Term Loan | |
| 8.733% (3 Month LIBOR + 5.25%), due 9/30/27 (b) | 1,972,489 | 1,587,854 |
| National Mentor Holdings, Inc. (b) | |
| First Lien Initial Term Loan 6.87% - 7.43% | |
| (1 Month LIBOR + 3.75%, 3 Month LIBOR + 3.75%), due 3/2/28 | 8,023,351 | 5,736,696 |
| First Lien Initial Term Loan C | |
| 7.43% (3 Month LIBOR + 3.75%), due 3/2/28 | 245,454 | 175,500 |
| Organon & Co. | |
| Dollar Term Loan | |
| 6.188% (3 Month LIBOR + 3.00%), due 6/2/28 (b) | 8,144,792 | 7,926,625 |
The notes to the financial statements are an integral part of, and should be read in conjunction with, the financial statements.
| 26 | MainStay Floating Rate Fund |
| | Principal
Amount | Value |
| Loan Assignments (continued) |
| Healthcare, Education & Childcare (continued) |
| Petco Health and Wellness Co., Inc. | |
| First Lien Initial Term Loan | |
| 6.924% (3 Month LIBOR + 3.25%), due 3/3/28 (b) | $ 8,394,830 | $ 8,052,044 |
| Raptor Acquisition Corp. | |
| First Lien Term Loan B | |
| 7.602% (3 Month LIBOR + 4.00%), due 11/1/26 (b) | 4,239,375 | 4,107,954 |
| Select Medical Corp. | |
| Tranche Term Loan B | |
| 6.26% (1 Month LIBOR + 2.50%), due 3/6/25 (b) | 7,354,845 | 7,141,099 |
| Sound Inpatient Physicians, Inc. | |
| First Lien Initial Term Loan | |
| 5.865% (1 Month LIBOR + 2.75%), due 6/27/25 (b)(d) | 1,915,000 | 1,496,573 |
| Sunshine Luxembourg VII SARL | |
| Facility Term Loan B3 | |
| 7.424% (3 Month LIBOR + 3.75%), due 10/1/26 (b) | 7,686,572 | 7,297,439 |
| | | 112,187,977 |
| High Tech Industries 1.8% |
| Altar BidCo, Inc. | |
| First Lien Initial Term Loan 4.952% - 5.50% | |
| (1 Year LIBOR + 3.10%, 6 Month LIBOR + 3.10%), due 2/1/29 (b) | 5,610,937 | 5,239,213 |
| AP Gaming I LLC | |
| Term Loan B | |
| 8.061% (1 Month LIBOR + 4.00%), due 2/15/29 (b) | 5,804,167 | 5,586,510 |
| Central Parent, Inc. | |
| First Lien Initial Term Loan | |
| 8.112% (3 Month LIBOR + 4.50%), due 7/6/29 (b) | 4,000,000 | 3,911,112 |
| NAB Holdings LLC | |
| Initial Term Loan | |
| 6.703% (3 Month LIBOR + 3.00%), due 11/23/28 (b) | 6,446,275 | 6,161,563 |
| Scientific Games Holdings LP | |
| First Lien Initial Dollar Term Loan | |
| 7.097% (3 Month LIBOR + 3.50%), due 4/4/29 (b) | 7,346,154 | 6,909,469 |
| | Principal
Amount | Value |
| |
| High Tech Industries (continued) |
| Trans Union LLC | |
| 2021 Incremental Term Loan B6 | |
| 6.004% (1 Month LIBOR + 2.25%), due 12/1/28 (b) | $ 11,566,237 | $ 11,373,463 |
| | | 39,181,330 |
| Home and Office Furnishings, Housewares & Durable Consumer Products 0.0% ‡ |
| Serta Simmons Bedding LLC | |
| First Lien Initial Term Loan 7.743% - 7.827% | |
| (3 Month LIBOR + 3.50%), due 11/8/23 (b) | 4,286,100 | 425,931 |
| Hotel, Gaming & Leisure 0.3% |
| Flutter Entertainment plc | |
| 2028 Third Amendment Term Loan B | |
| 6.781% (3 Month LIBOR + 3.25%), due 7/22/28 (b) | 7,288,011 | 7,187,801 |
| Hotels, Motels, Inns & Gaming 3.6% |
| Aimbridge Acquisition Co., Inc. | |
| First Lien 2019 Initial Term Loan | |
| 7.504% (1 Month LIBOR + 3.75%), due 2/2/26 (b) | 8,111,304 | 7,302,704 |
| Caesars Resort Collection LLC (b) | |
| Term Loan B | |
| 6.504% (1 Month LIBOR + 2.75%), due 12/23/24 | 5,242,782 | 5,179,035 |
| Term Loan B1 | |
| 7.254% (1 Month LIBOR + 3.50%), due 7/21/25 | 3,938,543 | 3,894,234 |
| Churchill Downs, Inc. | |
| Facility Term Loan B | |
| 5.76% (1 Month LIBOR + 2.00%), due 12/27/24 (b) | 2,381,250 | 2,359,671 |
| Entain Holdings (Gibraltar) Ltd. | |
| Term Loan B2 | |
| 7.506%, due 10/18/29 | 1,000,000 | 984,167 |
| Entain plc | |
| USD Facility Term Loan B | |
| 6.174% (3 Month LIBOR + 2.50%), due 3/29/27 (b) | 6,771,429 | 6,604,256 |
| Everi Holdings, Inc. | |
| Term Loan B | |
| 6.254% (1 Month LIBOR + 2.50%), due 8/3/28 (b) | 4,090,376 | 3,988,967 |
The notes to the financial statements are an integral part of, and should be read in conjunction with, the financial statements.
27
Portfolio of Investments October 31, 2022† (continued)
| | Principal
Amount | Value |
| Loan Assignments (continued) |
| Hotels, Motels, Inns & Gaming (continued) |
| Four Seasons Holdings, Inc. | |
| First Lien 2013 Term Loan | |
| 5.754% (1 Month LIBOR + 2.00%), due 11/30/23 (b) | $ 1,437,775 | $ 1,434,438 |
| Golden Entertainment, Inc. | |
| First Lien Facility Term Loan B | |
| 6.60% (1 Month LIBOR + 3.00%), due 10/21/24 (b) | 1,243,523 | 1,231,088 |
| Hilton Worldwide Finance LLC | |
| Refinanced Term Loan B2 | |
| 5.336% (1 Month LIBOR + 1.75%), due 6/22/26 (b) | 1,720,157 | 1,688,525 |
| Oceankey U.S. II Corp. | |
| Initial Term Loan | |
| 7.254% (1 Month LIBOR + 3.50%), due 12/15/28 (b) | 6,102,667 | 5,721,250 |
| PCI Gaming Authority | |
| Facility Term Loan B | |
| 6.254% (1 Month LIBOR + 2.50%), due 5/29/26 (b) | 3,370,300 | 3,326,766 |
| Penn National Gaming, Inc. | |
| Facility Term Loan B | |
| 6.579% (1 Month LIBOR + 2.75%), due 5/3/29 (b) | 1,995,000 | 1,967,569 |
| Scientific Games International, Inc. | |
| Initial Term Loan B | |
| 6.402% (1 Month LIBOR + 3.00%), due 4/14/29 (b) | 8,977,500 | 8,856,304 |
| Station Casinos LLC | |
| Facility Term Loan B1 | |
| 6.01% (1 Month LIBOR + 2.25%), due 2/8/27 (b) | 4,894,878 | 4,791,626 |
| Travel + Leisure Co. | |
| Term Loan B | |
| 6.004% (1 Month LIBOR + 2.25%), due 5/30/25 (b) | 3,840,000 | 3,720,000 |
| UFC Holdings LLC | |
| First Lien Term Loan B3 | |
| 7.11% (3 Month LIBOR + 2.75%), due 4/29/26 (b) | 9,659,928 | 9,435,335 |
| Whatabrands LLC | |
| Initial Term Loan B | |
| 7.004% (1 Month LIBOR + 3.25%), due 8/3/28 (b) | 5,945,050 | 5,638,880 |
| | Principal
Amount | Value |
| |
| Hotels, Motels, Inns & Gaming (continued) |
| Wyndham Hotels & Resorts, Inc. | |
| Term Loan B | |
| 5.504% (1 Month LIBOR + 1.75%), due 5/30/25 (b) | $ 2,502,500 | $ 2,484,252 |
| | | 80,609,067 |
| Insurance 3.4% |
| Acrisure LLC (b) | |
| First Lien 2020 Term Loan | |
| 7.254% (1 Month LIBOR + 3.50%), due 2/15/27 | 3,847,723 | 3,566,840 |
| First Lien 2021-2 Additional Term Loan | |
| 8.004% (1 Month LIBOR + 4.25%), due 2/15/27 | 4,912,875 | 4,667,231 |
| Alliant Holdings Intermediate LLC | |
| New Term Loan B4 | |
| 6.98% (1 Month LIBOR + 3.50%), due 11/5/27 (b) | 3,960,000 | 3,819,277 |
| AmWINS Group, Inc. | |
| Term Loan | |
| 6.004% (1 Month LIBOR + 2.25%), due 2/19/28 (b) | 8,887,094 | 8,679,731 |
| AssuredPartners Capital, Inc. | |
| 2022 Term Loan | |
| 7.229% (1 Month LIBOR + 3.50%), due 2/12/27 (b) | 2,985,000 | 2,841,347 |
| AssuredPartners, Inc. | |
| 2020 February Refinancing Term Loan | |
| 7.254% (1 Month LIBOR + 3.50%), due 2/12/27 (b) | 4,934,555 | 4,700,164 |
| Asurion LLC (b) | |
| New Term Loan B7 | |
| 6.754% (1 Month LIBOR + 3.00%), due 11/3/24 | 789,786 | 745,854 |
| New Term Loan B8 | |
| 7.004% (1 Month LIBOR + 3.25%), due 12/23/26 | 1,965,000 | 1,748,237 |
| Second Lien New Term Loan B3 | |
| 9.004% (1 Month LIBOR + 5.25%), due 1/31/28 | 6,200,000 | 4,343,875 |
| Second Lien New Term Loan B4 | |
| 9.004% (1 Month LIBOR + 5.25%), due 1/20/29 | 6,500,000 | 4,521,563 |
| Broadstreet Partners, Inc. (b) | |
| 2020 Initial Term Loan | |
| 6.754% (1 Month LIBOR + 3.00%), due 1/27/27 | 5,256,778 | 5,013,653 |
The notes to the financial statements are an integral part of, and should be read in conjunction with, the financial statements.
| 28 | MainStay Floating Rate Fund |
| | Principal
Amount | Value |
| Loan Assignments (continued) |
| Insurance (continued) |
| Broadstreet Partners, Inc. (b) (continued) | |
| Tranche Term Loan B2 | |
| 7.004% (1 Month LIBOR + 3.25%), due 1/27/27 | $ 1,155,000 | $ 1,103,025 |
| Hub International Ltd. (b) | |
| Initial Term Loan 6.983% - 7.327% | |
| (2 Month LIBOR + 3.00%, 3 Month LIBOR + 3.00%), due 4/25/25 | 1,568,823 | 1,536,376 |
| Incremental Term Loan B3 7.232% - 7.528% | |
| (3 Month LIBOR + 3.25%), due 4/25/25 | 5,874,637 | 5,760,816 |
| 2022 Incremental Term Loan | |
| 8.22% (3 Month LIBOR + 4.00%), due 11/10/29 | 360,000 | 345,600 |
| NFP Corp. | |
| Closing Date Term Loan | |
| 7.004% (1 Month LIBOR + 3.25%), due 2/15/27 (b) | 3,346,743 | 3,170,202 |
| Ryan Specialty Group LLC | |
| Initial Term Loan | |
| 6.829% (1 Month LIBOR + 3.00%), due 9/1/27 (b) | 3,957,215 | 3,894,145 |
| Sedgwick Claims Management Services, Inc. (b) | |
| Initial Term Loan | |
| 7.004% (1 Month LIBOR + 3.25%), due 12/31/25 | 4,789,763 | 4,619,127 |
| 2019 Term Loan | |
| 7.504% (1 Month LIBOR + 3.75%), due 9/3/26 | 2,946,700 | 2,870,269 |
| USI, Inc. (b) | |
| 2017 New Term Loan | |
| 6.424% (3 Month LIBOR + 2.75%), due 5/16/24 | 5,252,280 | 5,178,968 |
| 2021 New Term Loan | |
| 6.924% (3 Month LIBOR + 3.25%), due 12/2/26 | 972,528 | 950,444 |
| | | 74,076,744 |
| Leisure, Amusement, Motion Pictures & Entertainment 0.8% |
| Bombardier Recreational Products, Inc. | |
| 2020 Replacement Term Loan | |
| 5.754% (1 Month LIBOR + 2.00%), due 5/24/27 (b) | 4,219,964 | 4,047,650 |
| Creative Artists Agency LLC (b) | |
| Closing Date Term Loan | |
| 7.504% (1 Month LIBOR + 3.75%), due 11/27/26 | 2,431,250 | 2,401,873 |
| | Principal
Amount | Value |
| |
| Leisure, Amusement, Motion Pictures & Entertainment (continued) |
| Creative Artists Agency LLC (b) (continued) | |
| Incremental Term Loan B2 | |
| 7.979% (1 Month LIBOR + 4.25%), due 11/27/26 | $ 1,197,000 | $ 1,180,541 |
| Fitness International LLC (b) | |
| Term Loan A 7.079% - 7.494% | |
| (1 Month LIBOR + 3.25%, 3 Month LIBOR + 3.25%), due 1/8/25 | 1,487,813 | 1,339,031 |
| Term Loan B | |
| 7.494% (3 Month LIBOR + 3.25%), due 4/18/25 | 291,959 | 262,763 |
| Lions Gate Capital Holdings LLC | |
| Term Loan B | |
| 6.004% (1 Month LIBOR + 2.25%), due 3/24/25 (b) | 1,342,450 | 1,315,602 |
| Marriott Ownership Resorts, Inc. | |
| 2019 Refinancing Term Loan | |
| 5.504% (1 Month LIBOR + 1.75%), due 8/29/25 (b) | 4,410,432 | 4,245,041 |
| William Morris Endeavor Entertainment LLC | |
| First Lien Term Loan B1 | |
| 6.51% (1 Month LIBOR + 2.75%), due 5/18/25 (b) | 4,068,375 | 3,936,153 |
| | | 18,728,654 |
| Machinery (Non-Agriculture, Non-Construct & Non-Electronic) 0.8% |
| Advanced Drainage Systems, Inc. | |
| Initial Term Loan | |
| 5.37% (1 Month LIBOR + 2.25%), due 7/31/26 (b) | 459,643 | 458,724 |
| Columbus McKinnon Corp. | |
| Initial Term Loan | |
| 6.438% (3 Month LIBOR + 2.75%), due 5/14/28 (b) | 6,091,348 | 5,999,978 |
| CPM Holdings, Inc. (b) | |
| First Lien Initial Term Loan | |
| 6.628% (1 Month LIBOR + 3.50%), due 11/17/25 | 4,410,613 | 4,256,241 |
| Second Lien Initial Term Loan | |
| 11.378% (1 Month LIBOR + 8.25%), due 11/16/26 (d)(f) | 797,980 | 758,081 |
| Husky Injection Molding Systems Ltd. | |
| Initial Term Loan | |
| 5.877% (3 Month LIBOR + 3.00%), due 3/28/25 (b) | 6,449,347 | 5,867,564 |
| | | 17,340,588 |
The notes to the financial statements are an integral part of, and should be read in conjunction with, the financial statements.
29
Portfolio of Investments October 31, 2022† (continued)
| | Principal
Amount | Value |
| Loan Assignments (continued) |
| Manufacturing 2.1% |
| ASP Blade Holdings, Inc. | |
| Initial Term Loan | |
| 7.674% (3 Month LIBOR + 4.00%), due 10/13/28 (b) | $ 5,964,672 | $ 4,818,603 |
| Clark Equipment Co. | |
| Tranche Term Loan B | |
| 6.153% (3 Month LIBOR + 2.50%), due 4/20/29 (b) | 497,500 | 487,799 |
| Coherent Corp. | |
| Initial Term Loan B | |
| 5.878% (1 Month LIBOR + 2.75%), due 7/2/29 (b) | 9,416,667 | 9,115,333 |
| CP Atlas Buyer, Inc. | |
| Term Loan B | |
| 7.254% (1 Month LIBOR + 3.50%), due 11/23/27 (b) | 5,399,332 | 4,545,255 |
| CPG International LLC | |
| Closing Date Term Loan | |
| 6.269% (1 Month LIBOR + 2.50%), due 4/28/29 (b) | 3,750,000 | 3,611,719 |
| FCG Acquisitions, Inc. | |
| First Lien Initial Term Loan | |
| 7.424% (3 Month LIBOR + 3.75%), due 3/31/28 (b) | 5,929,340 | 5,599,520 |
| Idemia Group SAS | |
| USD Facility Term Loan B3 | |
| 8.174% (3 Month LIBOR + 4.50%), due 1/10/26 (b) | 2,149,595 | 2,020,619 |
| Madison IAQ LLC | |
| Term Loan | |
| 6.815% (3 Month LIBOR + 3.25%), due 6/21/28 (b) | 5,293,000 | 4,790,165 |
| Pro Mach Group, Inc. | |
| First Lien Closing Date Initial Term Loan | |
| 7.754% (1 Month LIBOR + 4.00%), due 8/31/28 (b) | 6,359,993 | 6,191,058 |
| Standard Industries, Inc. | |
| Initial Term Loan | |
| 6.675% (3 Month LIBOR + 2.50%), due 9/22/28 (b) | 2,467,725 | 2,413,082 |
| Weber-Stephen Products LLC | |
| Initial Term Loan B | |
| 7.004% (1 Month LIBOR + 3.25%), due 10/30/27 (b) | 580,622 | 474,054 |
| | Principal
Amount | Value |
| |
| Manufacturing (continued) |
| Zurn LLC | |
| First Lien Term Loan B | |
| 5.754% (1 Month LIBOR + 2.00%), due 10/4/28 (b) | $ 2,133,875 | $ 2,110,759 |
| | | 46,177,966 |
| Media 2.1% |
| Cogeco Communications Finance (USA) LP | |
| Amendment No. 5 Incremental Term Loan B | |
| 6.254% (1 Month LIBOR + 2.50%), due 9/1/28 (b) | 11,193,750 | 10,869,926 |
| Diamond Sports Group LLC | |
| Second Lien Term Loan | |
| 6.458% (1 Month LIBOR + 3.25%), due 8/24/26 (b) | 2,905,631 | 558,122 |
| DIRECTV Financing LLC | |
| Closing Date Term Loan | |
| 8.754% (1 Month LIBOR + 5.00%), due 8/2/27 (b) | 9,828,000 | 9,318,851 |
| KKR Apple Bidco LLC (b) | |
| First Lien Initial Term Loan | |
| 6.504% (1 Month LIBOR + 2.75%), due 9/22/28 | 7,473,525 | 7,235,306 |
| First Lien Amendment No. 1 Term Loan | |
| 7.627% (1 Month LIBOR + 4.00%), due 9/22/28 | 1,750,000 | 1,717,734 |
| Mission Broadcasting, Inc. | |
| Term Loan B4 | |
| 5.628% (1 Month LIBOR + 2.50%), due 6/2/28 (b) | 1,382,500 | 1,366,659 |
| Radiate Holdco LLC | |
| Amendment No. 6 Term Loan | |
| 7.004% (1 Month LIBOR + 3.25%), due 9/25/26 (b) | 7,597,394 | 6,946,867 |
| Sinclair Television Group, Inc. (b) | |
| Term Loan B3 | |
| 6.76% (1 Month LIBOR + 3.00%), due 4/1/28 | 2,962,500 | 2,747,257 |
| Term Loan B4 | |
| 7.579% (1 Month LIBOR + 3.75%), due 4/21/29 | 5,985,000 | 5,591,486 |
| | | 46,352,208 |
| Mining, Steel, Iron & Non-Precious Metals 1.0% |
| American Rock Salt Co. LLC | |
| First Lien Initial Term Loan | |
| 7.75% (1 Month LIBOR + 4.00%), due 6/9/28 (b) | 5,454,889 | 4,986,679 |
The notes to the financial statements are an integral part of, and should be read in conjunction with, the financial statements.
| 30 | MainStay Floating Rate Fund |
| | Principal
Amount | Value |
| Loan Assignments (continued) |
| Mining, Steel, Iron & Non-Precious Metals (continued) |
| Gates Global LLC | |
| Initial Dollar Term Loan B3 | |
| 6.254% (1 Month LIBOR + 2.50%), due 3/31/27 (b) | $ 10,837,851 | $ 10,530,783 |
| Graftech International Ltd. | |
| Initial Term Loan | |
| 6.754% (1 Month LIBOR + 3.00%), due 2/12/25 (b) | 1,122,713 | 1,066,577 |
| MRC Global U.S., Inc. | |
| 2018 Refinancing Term Loan | |
| 6.754% (1 Month LIBOR + 3.00%), due 9/20/24 (b) | 2,307,583 | 2,255,662 |
| U.S. Silica Co. | |
| Term Loan | |
| 7.813% (1 Month LIBOR + 4.00%), due 5/1/25 (b) | 3,396,441 | 3,292,123 |
| | | 22,131,824 |
| Oil & Gas 2.3% |
| AL GCX Holdings LLC | |
| Initial Term Loan | |
| 7.565% (3 Month LIBOR + 3.75%), due 5/17/29 (b) | 1,496,250 | 1,482,534 |
| Buckeye Partners LP | |
| 2021 Tranche Term Loan B1 | |
| 5.365% (1 Month LIBOR + 2.25%), due 11/1/26 (b) | 2,315,937 | 2,286,119 |
| ChampionX Corp. | |
| Term Loan B1 | |
| 6.618% (1 Month LIBOR + 3.25%), due 6/7/29 (b) | 6,000,000 | 5,982,000 |
| DT Midstream, Inc. | |
| Initial Term Loan | |
| 5.813% (1 Month LIBOR + 2.00%), due 6/26/28 (b) | 1,277,850 | 1,277,672 |
| Fleet Midco I Ltd. | |
| Facility Term Loan B | |
| 7.928% (6 Month LIBOR + 3.00%), due 10/7/26 (b) | 3,197,155 | 3,149,197 |
| GIP III Stetson I LP | |
| Initial Term Loan | |
| 8.004% (1 Month LIBOR + 4.25%), due 7/18/25 (b)(d) | 1,995,801 | 1,918,963 |
| Keane Group Holdings LLC | |
| Initial Term Loan | |
| 7.563% (1 Month LIBOR + 3.75%), due 5/25/25 (b) | 5,399,630 | 5,149,897 |
| | Principal
Amount | Value |
| |
| Oil & Gas (continued) |
| Medallion Midland Acquisition LLC | |
| Initial Term Loan | |
| 7.424% (3 Month LIBOR + 3.75%), due 10/18/28 (b) | $ 4,797,029 | $ 4,734,068 |
| Murphy Oil USA, Inc. | |
| Tranche Term Loan B | |
| 4.88% (1 Month LIBOR + 1.75%), due 1/31/28 (b) | 788,000 | 787,344 |
| NorthRiver Midstream Finance LP | |
| Initial Term Loan B | |
| 6.993% (3 Month LIBOR + 3.25%), due 10/1/25 (b) | 5,672,456 | 5,580,279 |
| Oryx Midstream Services Permian Basin LLC | |
| Initial Term Loan | |
| 6.211% (3 Month LIBOR + 3.25%), due 10/5/28 (b) | 3,969,917 | 3,905,958 |
| PES Holdings LLC | |
| Tranche Term Loan C | |
| 10.75% (3.00% PIK) (1 Month LIBOR + 4.50%), due 12/31/22 (b)(d)(e)(g)(h) | 1,940,313 | 48,508 |
| Prairie ECI Acquiror LP | |
| Initial Term Loan | |
| 8.504% (1 Month LIBOR + 4.75%), due 3/11/26 (b) | 5,201,721 | 4,894,262 |
| TransMontaigne Operating Co. LP | |
| Tranche Term Loan B 6.989% - 7.072% | |
| (1 Month LIBOR + 3.50%), due 11/17/28 (b) | 4,962,500 | 4,782,609 |
| Traverse Midstream Partners LLC | |
| Advance Term Loan | |
| 7.977% (1 Month LIBOR + 4.25%), due 9/27/24 (b) | 3,021,280 | 2,982,572 |
| Veritas U.S., Inc. | |
| 2021 Dollar Term Loan B | |
| 8.674% (3 Month LIBOR + 5.00%), due 9/1/25 (b) | 2,762,685 | 2,188,276 |
| | | 51,150,258 |
| Packaging 0.2% |
| LABL, Inc. | |
| Initial Dollar Term Loan | |
| 8.115% (1 Month LIBOR + 5.00%), due 10/29/28 (b) | 2,679,750 | 2,468,720 |
The notes to the financial statements are an integral part of, and should be read in conjunction with, the financial statements.
31
Portfolio of Investments October 31, 2022† (continued)
| | Principal
Amount | Value |
| Loan Assignments (continued) |
| Packaging (continued) |
| Plastipak Holdings, Inc. | |
| 2021 Tranche Term Loan B | |
| 6.313% (1 Month LIBOR + 2.50%), due 12/1/28 (b) | $ 1,926,176 | $ 1,881,633 |
| | | 4,350,353 |
| Personal & Nondurable Consumer Products 1.7% |
| ABG Intermediate Holdings 2 LLC | |
| First Lien Tranche Term Loan B1 | |
| 7.329% (1 Month LIBOR + 3.50%), due 12/21/28 (b) | 9,092,200 | 8,711,464 |
| Foundation Building Materials, Inc. | |
| First Lien Initial Term Loan 7.004% - 7.665% | |
| (1 Month LIBOR + 3.25%, 3 Month LIBOR + 3.25%), due 1/31/28 (b) | 6,181,800 | 5,620,801 |
| Hunter Douglas Holding BV | |
| Tranche Term Loan B1 | |
| 6.34% (3 Month LIBOR + 3.50%), due 2/26/29 (b) | 4,987,500 | 4,126,119 |
| Leslie's Poolmart, Inc. | |
| Initial Term Loan | |
| 6.254% (1 Month LIBOR + 2.50%), due 3/9/28 (b) | 7,884,912 | 7,654,278 |
| Michaels Cos., Inc. (The) | |
| Term Loan B | |
| 7.924% (3 Month LIBOR + 4.25%), due 4/15/28 (b) | 4,730,075 | 3,645,536 |
| Perrigo Co. plc | |
| Initial Term Loan B | |
| 6.329% (1 Month LIBOR + 2.50%), due 4/20/29 (b) | 4,987,500 | 4,912,688 |
| Prestige Brands, Inc. | |
| Term Loan B5 | |
| 5.754% (1 Month LIBOR + 2.00%), due 7/3/28 (b) | 1,540,000 | 1,534,465 |
| Spectrum Brands, Inc. | |
| 2021 Term Loan 5.76% - 6.42% | |
| (1 Month LIBOR + 2.00%, 3 Month LIBOR + 2.00%), due 3/3/28 (b) | 295,500 | 282,941 |
| | | 36,488,292 |
| Personal & Nondurable Consumer Products (Manufacturing Only) 0.5% |
| American Builders & Contractors Supply Co., Inc. | |
| Restatement Effective Date Term Loan | |
| 5.754% (1 Month LIBOR + 2.00%), due 1/15/27 (b) | 2,667,500 | 2,609,564 |
| | Principal
Amount | Value |
| |
| Personal & Nondurable Consumer Products (Manufacturing Only) (continued) |
| Hercules Achievement, Inc. | |
| First Lien Initial Term Loan 6.615% - 7.254% | |
| (1 Month LIBOR + 3.50%), due 12/16/24 (b) | $ 4,286,438 | $ 3,969,718 |
| SRAM LLC | |
| Initial Term Loan 5.82% - 6.504% | |
| (1 Month LIBOR + 2.75%, 3 Month LIBOR + 2.75%), due 5/18/28 (b) | 5,377,273 | 5,206,991 |
| | | 11,786,273 |
| Personal Transportation 0.3% |
| First Student Bidco, Inc. (b) | |
| Initial Term Loan B | |
| 6.642% (3 Month LIBOR + 3.00%), due 7/21/28 | 2,635,825 | 2,472,404 |
| Initial Term Loan C | |
| 6.642% (3 Month LIBOR + 3.00%), due 7/21/28 | 980,308 | 919,529 |
| Uber Technologies, Inc. (b) | |
| 2021 Incremental Term Loan | |
| 6.57% (3 Month LIBOR + 3.50%), due 4/4/25 | 1,636,231 | 1,620,209 |
| 2021 Refinancing Term Loan | |
| 6.57% (3 Month LIBOR + 3.50%), due 2/25/27 | 1,968,586 | 1,942,502 |
| | | 6,954,644 |
| Personal, Food & Miscellaneous Services 1.4% |
| 1011778 B.C. Unlimited Liability Co. | |
| Term Loan B4 5.504% - 6.165% | |
| (1 Month LIBOR + 1.75%, 3 Month LIBOR + 1.75%), due 11/19/26 (b) | 5,043,052 | 4,899,113 |
| Aramark Intermediate HoldCo Corp. (b) | |
| U.S. Term Loan B4 | |
| 5.504% (1 Month LIBOR + 1.75%), due 1/15/27 | 1,631,875 | 1,574,759 |
| U.S. Term Loan B5 | |
| 6.254% (1 Month LIBOR + 2.50%), due 4/6/28 | 7,611,889 | 7,488,196 |
| Hayward Industries, Inc. | |
| First Lien Refinancing Term Loan | |
| 6.254% (1 Month LIBOR + 2.50%), due 5/30/28 (b) | 5,628,750 | 5,276,953 |
The notes to the financial statements are an integral part of, and should be read in conjunction with, the financial statements.
| 32 | MainStay Floating Rate Fund |
| | Principal
Amount | Value |
| Loan Assignments (continued) |
| Personal, Food & Miscellaneous Services (continued) |
| Hillman Group, Inc. (The) (b) | |
| Initial Term Loan | |
| 6.326% (1 Month LIBOR + 2.75%), due 7/14/28 | $ 1,627,721 | $ 1,552,101 |
| Initial Delayed Draw Term Loan | |
| 6.326% (1 Month LIBOR + 2.75%), due 7/14/28 | 31,190 | 29,741 |
| IRB Holding Corp. (b) | |
| 2022 Replacement Term Loan B | |
| 6.208% (1 Month LIBOR + 3.00%), due 12/15/27 | 9,011,175 | 8,725,818 |
| 2020 Replacement Term Loan B | |
| 6.504% (1 Month LIBOR + 2.75%), due 2/5/25 | 234,752 | 230,979 |
| KFC Holding Co. | |
| 2021 Term Loan B | |
| 5.193% (1 Month LIBOR + 1.75%), due 3/15/28 (b) | 2,183,829 | 2,151,618 |
| | | 31,929,278 |
| Pharmaceuticals 0.2% |
| Padagis LLC | |
| Term Loan B | |
| 8.491% (3 Month LIBOR + 4.75%), due 7/6/28 (b) | 5,011,765 | 4,234,941 |
| Printing & Publishing 0.6% |
| Getty Images, Inc. | |
| Initial Dollar Term Loan | |
| 7.625% (3 Month LIBOR + 4.50%), due 2/19/26 (b) | 2,761,306 | 2,738,526 |
| Severin Acquisition LLC | |
| First Lien Initial Term Loan | |
| 7.094% (3 Month LIBOR + 3.00%), due 8/1/25 (b) | 4,363,376 | 4,281,563 |
| Springer Nature Deutschland GmbH | |
| Initial Term Loan B18 | |
| 6.674% (3 Month LIBOR + 3.00%), due 8/14/26 (b) | 6,992,564 | 6,871,942 |
| | | 13,892,031 |
| Retail 0.7% |
| Great Outdoors Group LLC | |
| Term Loan B2 | |
| 7.504% (1 Month LIBOR + 3.75%), due 3/6/28 (b) | 16,643,064 | 15,637,540 |
| | Principal
Amount | Value |
| |
| Retail Store 1.5% |
| BJ's Wholesale Club, Inc. | |
| First Lien Tranche Term Loan B | |
| 5.346% (1 Month LIBOR + 2.00%), due 2/3/24 (b) | $ 2,495,395 | $ 2,493,524 |
| EG Group Ltd. (b) | |
| USD Facility Term Loan B | |
| 7.674% (3 Month LIBOR + 4.00%), due 2/7/25 | 1,215,985 | 1,099,325 |
| USD Additional Facility Term Loan | |
| 7.674% (3 Month LIBOR + 4.00%), due 2/7/25 | 1,422,937 | 1,284,794 |
| USD Additional Facility Term Loan | |
| 7.924% (3 Month LIBOR + 4.25%), due 3/31/26 | 2,965,232 | 2,692,801 |
| Harbor Freight Tools USA, Inc. | |
| 2021 Initial Term Loan | |
| 6.504% (1 Month LIBOR + 2.75%), due 10/19/27 (b) | 6,910,594 | 6,469,083 |
| PetSmart LLC | |
| Initial Term Loan | |
| 7.50% (1 Month LIBOR + 3.75%), due 2/11/28 (b) | 8,986,250 | 8,630,547 |
| Rising Tide Holdings, Inc. | |
| First Lien Initial Term Loan | |
| 8.504% (1 Month LIBOR + 4.75%), due 6/1/28 (b) | 4,305,500 | 3,578,947 |
| White Cap Supply Holdings LLC | |
| Initial Closing Date Term Loan | |
| 7.479% (1 Month LIBOR + 3.75%), due 10/19/27 (b) | 6,874,191 | 6,500,407 |
| | | 32,749,428 |
| Services: Business 4.9% |
| Avis Budget Car Rental LLC | |
| Tranche Term Loan C | |
| 7.329% (1 Month LIBOR + 3.50%), due 3/16/29 (b) | 4,975,000 | 4,906,594 |
| Brown Group Holdings LLC (b) | |
| Initial Term Loan | |
| 6.254% (1 Month LIBOR + 2.50%), due 6/7/28 | 6,912,483 | 6,703,671 |
| Facility Incremental Term Loan B2 | |
| 7.479% (1 Month LIBOR + 3.75%), due 7/2/29 | 333,333 | 329,083 |
| Charlotte Buyer, Inc. | |
| First Lien Initial Term Loan B | |
| 7.98% (3 Month LIBOR + 5.25%), due 2/11/28 (b) | 1,200,000 | 1,134,000 |
The notes to the financial statements are an integral part of, and should be read in conjunction with, the financial statements.
33
Portfolio of Investments October 31, 2022† (continued)
| | Principal
Amount | Value |
| Loan Assignments (continued) |
| Services: Business (continued) |
| ConnectWise LLC | |
| Initial Term Loan | |
| 7.174% (3 Month LIBOR + 3.50%), due 9/29/28 (b) | $ 3,573,000 | $ 3,367,552 |
| Corporation Service Co. | |
| Term Loan B | |
| 7.436%, due 11/2/29 | 1,500,000 | 1,466,250 |
| Dun & Bradstreet Corp. (The) (b) | |
| Initial Borrowing Term Loan | |
| 6.846% (1 Month LIBOR + 3.25%), due 2/6/26 | 4,911,239 | 4,825,292 |
| 2022 Incremental Term Loan B2 | |
| 6.896% (1 Month LIBOR + 3.25%), due 1/18/29 | 696,500 | 677,637 |
| Electron Bidco, Inc. | |
| First Lien Initial Term Loan | |
| 6.754% (1 Month LIBOR + 3.00%), due 11/1/28 (b) | 9,610,852 | 9,282,478 |
| GIP II Blue Holding LP | |
| Initial Term Loan | |
| 8.174% (3 Month LIBOR + 4.50%), due 9/29/28 (b) | 4,542,239 | 4,493,978 |
| Hunter Holdco 3 Ltd. | |
| First Lien Initial Dollar Term Loan | |
| 7.924% (3 Month LIBOR + 4.25%), due 8/19/28 (b) | 9,077,000 | 8,668,535 |
| Icon plc (b) | |
| Lux Term Loan | |
| 5.938% (3 Month LIBOR + 2.25%), due 7/3/28 | 6,069,258 | 6,003,510 |
| U.S. Term Loan | |
| 5.938% (3 Month LIBOR + 2.25%), due 7/3/28 | 1,512,159 | 1,495,778 |
| Indy U.S. Bidco LLC | |
| 2021 Refinancing Dollar Term Loan | |
| 7.504% (1 Month LIBOR + 3.75%), due 3/6/28 (b) | 6,392,825 | 5,631,011 |
| Intrado Corp. | |
| Initial Term Loan B | |
| 8.415% (3 Month LIBOR + 4.00%), due 10/10/24 (b) | 3,352,732 | 2,935,437 |
| Mercury Borrower, Inc. | |
| First Lien Initial Term Loan | |
| 7.188% (3 Month LIBOR + 3.50%), due 8/2/28 (b) | 7,125,133 | 6,661,999 |
| | Principal
Amount | Value |
| |
| Services: Business (continued) |
| Mitchell International, Inc. (b) | |
| First Lien Initial Term Loan | |
| 6.734% (3 Month LIBOR + 3.75%), due 10/15/28 | $ 3,316,667 | $ 2,954,321 |
| Second Lien Initial Term Loan | |
| 9.57% (3 Month LIBOR + 6.50%), due 10/15/29 | 1,800,000 | 1,446,376 |
| MPH Acquisition Holdings LLC | |
| Initial Term Loan | |
| 7.32% (3 Month LIBOR + 4.25%), due 9/1/28 (b) | 4,950,000 | 4,593,600 |
| Orbit Private Holdings I Ltd. | |
| First Lien Initial Dollar Term Loan | |
| 8.174% (3 Month LIBOR + 4.50%), due 12/11/28 (b) | 3,644,142 | 3,543,928 |
| PECF USS Intermediate Holding III Corp. | |
| Initial Term Loan | |
| 8.004% (1 Month LIBOR + 4.25%), due 12/15/28 (b) | 6,939,937 | 5,328,879 |
| Phoenix Newco, Inc. | |
| First Lien Initial Term Loan | |
| 6.365% (1 Month LIBOR + 3.25%), due 11/15/28 (b) | 7,457,512 | 7,175,783 |
| Polaris Newco LLC | |
| First Lien Dollar Term Loan | |
| 7.674% (3 Month LIBOR + 4.00%), due 6/2/28 (b) | 7,965,083 | 7,263,709 |
| Project Boost Purchaser LLC | |
| 2021 Tranche Term Loan 2 | |
| 6.615% (1 Month LIBOR + 3.50%), due 5/30/26 (b) | 4,690,625 | 4,497,137 |
| Vizient, Inc. | |
| Term Loan B7 | |
| 5.817% (1 Month LIBOR + 2.25%), due 5/16/29 (b) | 2,244,375 | 2,233,620 |
| | | 107,620,158 |
| Software 3.9% |
| AppLovin Corp. | |
| Amendment No. 6 New Term Loan | |
| 6.674% (3 Month LIBOR + 3.00%), due 10/25/28 (b) | 4,780,988 | 4,595,724 |
| Cornerstone OnDemand, Inc. | |
| First Lien Initial Term Loan | |
| 7.504% (1 Month LIBOR + 3.75%), due 10/16/28 (b) | 3,606,875 | 3,002,724 |
The notes to the financial statements are an integral part of, and should be read in conjunction with, the financial statements.
| 34 | MainStay Floating Rate Fund |
| | Principal
Amount | Value |
| Loan Assignments (continued) |
| Software (continued) |
| Informatica LLC | |
| Initial Term Loan | |
| 6.563% (1 Month LIBOR + 2.75%), due 10/27/28 (b) | $ 11,780,800 | $ 11,445,047 |
| Magenta Buyer LLC | |
| First Lien Initial Term Loan | |
| 9.17% (3 Month LIBOR + 4.75%), due 7/27/28 (b) | 6,237,000 | 5,426,190 |
| McAfee Corp. | |
| Tranche Term Loan B1 | |
| 6.87% (1 Month LIBOR + 3.75%), due 3/1/29 (b) | 9,975,000 | 9,060,622 |
| Mitnick Corp. Purchaser, Inc. | |
| Initial Term Loan | |
| 8.944% (3 Month LIBOR + 4.75%), due 5/2/29 (b) | 5,500,000 | 5,222,250 |
| NortonLifeLock, Inc. | |
| Tranche Initial Term Loan B | |
| 5.829% (1 Month LIBOR + 2.00%), due 9/12/29 (b) | 16,800,000 | 16,374,002 |
| Quest Software U.S. Holdings, Inc. | |
| First Lien Initial Term Loan | |
| 8.494% (3 Month LIBOR + 4.25%), due 2/1/29 (b) | 6,546,094 | 4,825,924 |
| Sophia LP | |
| First Lien Term Loan B | |
| 7.174% (3 Month LIBOR + 3.50%), due 10/7/27 (b) | 2,852,325 | 2,743,937 |
| Sovos Compliance LLC | |
| First Lien Initial Term Loan | |
| 8.254% (1 Month LIBOR + 4.50%), due 8/11/28 (b) | 4,469,563 | 4,321,509 |
| TIBCO Software, Inc. | |
| First Lien Dollar Term Loan B | |
| 8.153% (3 Month LIBOR + 4.50%), due 3/30/29 (b) | 2,400,000 | 2,184,857 |
| UKG, Inc. (b) | |
| First Lien 2021-2 Incremental Term Loan | |
| 6.998% (3 Month LIBOR + 3.25%), due 5/4/26 | 5,121,691 | 4,935,231 |
| First Lien Initial Term Loan | |
| 7.504% (1 Month LIBOR + 3.75%), due 5/4/26 | 4,924,615 | 4,778,246 |
| Second Lien 2021 Incremental Term Loan | |
| 8.998% (3 Month LIBOR + 5.25%), due 5/3/27 | 3,300,000 | 3,013,999 |
| | Principal
Amount | Value |
| |
| Software (continued) |
| Vision Solutions, Inc. | |
| First Lien Third Incremental Term Loan | |
| 8.358% (3 Month LIBOR + 4.00%), due 4/24/28 (b) | $ 4,778,772 | $ 4,050,009 |
| | | 85,980,271 |
| Telecommunications 3.7% |
| Avaya, Inc. | |
| Tranche Term Loan B2 | |
| 7.412% (1 Month LIBOR + 4.00%), due 12/15/27 (b) | 3,947,115 | 1,845,276 |
| Azalea TopCo, Inc. (b) | |
| First Lien Initial Term Loan | |
| 6.615% (1 Month LIBOR + 3.50%), due 7/24/26 | 2,425,000 | 2,261,312 |
| First Lien 2021 Term Loan | |
| 6.865% (1 Month LIBOR + 3.75%), due 7/24/26 | 1,975,000 | 1,837,984 |
| First Lien 2022 Incremental Term Loan | |
| 7.579% (1 Month LIBOR + 3.75%), due 7/24/26 | 2,985,000 | 2,779,781 |
| Cablevision Lightpath LLC | |
| Initial Term Loan | |
| 6.662% (1 Month LIBOR + 3.25%), due 11/30/27 (b) | 5,058,369 | 4,931,910 |
| Connect Finco SARL | |
| Amendement No.1 Refinancing Term Loan | |
| 7.26% (1 Month LIBOR + 3.50%), due 12/11/26 (b) | 9,605,338 | 9,269,151 |
| CSC Holdings LLC | |
| September 2019 Initial Term Loan | |
| 5.912% (1 Month LIBOR + 2.50%), due 4/15/27 (b) | 9,495,408 | 8,996,900 |
| Cyxtera DC Holdings, Inc. | |
| First Lien Initial Term Loan | |
| 7.36% (3 Month LIBOR + 3.00%), due 5/1/24 (b)(d) | 1,421,250 | 1,200,956 |
| Frontier Communications Holdings LLC | |
| Term Loan B | |
| 7.438% (3 Month LIBOR + 3.75%), due 5/1/28 (b) | 5,772,149 | 5,442,312 |
| Gogo Intermediate Holdings LLC | |
| Initial Term Loan | |
| 8.165% (3 Month LIBOR + 3.75%), due 4/30/28 (b) | 9,396,125 | 9,212,120 |
The notes to the financial statements are an integral part of, and should be read in conjunction with, the financial statements.
35
Portfolio of Investments October 31, 2022† (continued)
| | Principal
Amount | Value |
| Loan Assignments (continued) |
| Telecommunications (continued) |
| Intelsat Jackson Holdings SA | |
| Term Loan B | |
| 7.445% (6 Month LIBOR + 4.25%), due 2/1/29 (b) | $ 6,184,141 | $ 5,934,197 |
| Level 3 Financing, Inc. | |
| Tranche 2027 Term Loan B | |
| 5.504% (1 Month LIBOR + 1.75%), due 3/1/27 (b) | 1,937,389 | 1,838,098 |
| Lumen Technologies, Inc. | |
| Term Loan B | |
| 6.004% (1 Month LIBOR + 2.25%), due 3/15/27 (b) | 10,543,185 | 9,811,752 |
| Redstone HoldCo 2 LP | |
| First Lien Initial Term Loan | |
| 9.108% (3 Month LIBOR + 4.75%), due 4/27/28 (b) | 2,470,038 | 1,772,252 |
| SBA Senior Finance II LLC | |
| Initial Term Loan | |
| 5.51% (1 Month LIBOR + 1.75%), due 4/11/25 (b) | 6,250,064 | 6,186,001 |
| Telesat Canada | |
| Term Loan B5 | |
| 7.17% (3 Month LIBOR + 2.75%), due 12/7/26 (b) | 2,034,078 | 1,054,543 |
| Zayo Group Holdings, Inc. | |
| Initial Dollar Term Loan | |
| 6.754% (1 Month LIBOR + 3.00%), due 3/9/27 (b) | 9,075,110 | 7,300,926 |
| | | 81,675,471 |
| Utilities 1.7% |
| Astoria Energy LLC | |
| 2020 Advance Term Loan B | |
| 7.26% (1 Month LIBOR + 3.50%), due 12/10/27 (b) | 901,640 | 879,421 |
| Brookfield WEC Holdings, Inc. (b) | |
| First Lien 2021 Initial Term Loan | |
| 6.504% (1 Month LIBOR + 2.75%), due 8/1/25 | 7,274,739 | 7,137,327 |
| Initial Term Loan | |
| 7.479% (1 Month LIBOR + 3.75%), due 8/1/25 | 1,750,000 | 1,730,313 |
| Calpine Corp. | |
| 2019 Term Loan | |
| 5.76% (1 Month LIBOR + 2.00%), due 4/5/26 (b) | 2,031,750 | 1,988,892 |
| | Principal
Amount | Value |
| |
| Utilities (continued) |
| Compass Power Generation LLC | |
| Tranche Term Loan B2 | |
| 8.093% (1 Month LIBOR + 4.25%), due 4/14/29 (b) | $ 1,966,704 | $ 1,901,557 |
| Constellation Renewables LLC | |
| Term Loan | |
| 5.57% (3 Month LIBOR + 2.50%), due 12/15/27 (b) | 2,490,680 | 2,463,438 |
| Edgewater Generation LLC | |
| Term Loan | |
| 7.504% (1 Month LIBOR + 3.75%), due 12/13/25 (b) | 6,591,135 | 5,882,588 |
| Granite Generation LLC | |
| Term Loan | |
| 7.504% (1 Month LIBOR + 3.75%), due 11/9/26 (b) | 6,191,955 | 6,012,970 |
| Hamilton Projects Acquiror LLC | |
| Term Loan | |
| 8.174% (3 Month LIBOR + 4.50%), due 6/17/27 (b) | 2,192,778 | 2,154,952 |
| PG&E Corp. | |
| Term Loan | |
| 6.813% (1 Month LIBOR + 3.00%), due 6/23/25 (b) | 3,176,875 | 3,119,691 |
| Vistra Operations Co. LLC | |
| 2018 Incremental Term Loan 5.162% - 5.504% | |
| (1 Month LIBOR + 1.75%), due 12/31/25 (b) | 4,889,976 | 4,846,078 |
| | | 38,117,227 |
| Water 0.4% |
| Osmosis Buyer Ltd. | |
| 2022 Refinanciang Term Loan B | |
| 6.858% (1 Month LIBOR + 3.75%), due 7/31/28 (b) | 5,586,000 | 5,194,980 |
| Term Loan | |
| 7.844%, due 7/31/28 | 4,259,259 | 3,957,917 |
| | | 9,152,897 |
Total Loan Assignments
(Cost $2,132,532,360) | | 1,999,390,696 |
Total Long-Term Bonds
(Cost $2,283,929,860) | | 2,134,163,162 |
| |
The notes to the financial statements are an integral part of, and should be read in conjunction with, the financial statements.
| 36 | MainStay Floating Rate Fund |
| | Shares | Value |
| Affiliated Investment Company 0.3% |
| Fixed Income Fund 0.3% | | |
| MainStay MacKay High Yield Corporate Bond Fund Class I | 1,299,065 | $ 6,341,647 |
Total Affiliated Investment Company
(Cost $7,331,284) | | 6,341,647 |
| Common Stocks 0.0% ‡ |
| Auto Components 0.0% ‡ |
| Millennium Corporate Trust (d)(f)(i) | 4,973 | — |
| Millennium Lender Trust (d)(f)(i) | 5,298 | — |
| | | — |
| Health Care Equipment & Supplies 0.0% ‡ |
| Carestream Equity (d)(f)(i) | 5,387 | 114,743 |
| Independent Power and Renewable Electricity Producers 0.0% ‡ |
| Sempra Texas Holdings Corp. (d)(f)(i) | 175,418 | — |
| Machinery 0.0% ‡ |
| Ameriforge Group, Inc. (d)(f)(i) | 60,753 | 99,635 |
Total Common Stocks
(Cost $2,206,664) | | 214,378 |
| |
| | Number of
Rights | |
| Rights 0.0% ‡ |
| Independent Power and Renewable Electricity Producers 0.0% ‡ |
| Vistra Corp. | | |
| Expires 12/31/46 (d)(f)(i) | 107,130 | 127,485 |
Total Rights
(Cost $87,846) | | 127,485 |
| |
| | Number of
Warrants | |
| Warrants 0.0% ‡ |
| Capital Markets 0.0% ‡ |
| THAIHOT Investment Co. Ltd. | | |
| Expires 10/13/27 (d)(f)(i)(j) | 26 | 0 |
Total Warrants
(Cost $0) | | 0 |
| |
| | Principal
Amount | | Value |
| Short-Term Investments 2.3% |
| U.S. Treasury Debt 2.3% |
| U.S. Treasury Bills (k) | | | |
| 2.507%, due 11/8/22 | $ 23,319,000 | | $ 23,306,899 |
| 2.764%, due 11/1/22 | 16,164,000 | | 16,164,000 |
| 3.101%, due 11/15/22 | 12,109,000 | | 12,094,873 |
Total Short-Term Investments
(Cost $51,564,283) | | | 51,565,772 |
Total Investments
(Cost $2,345,119,937) | 99.2% | | 2,192,412,444 |
| Other Assets, Less Liabilities | 0.8 | | 16,789,047 |
| Net Assets | 100.0% | | $ 2,209,201,491 |
| † | Percentages indicated are based on Fund net assets. |
| ‡ | Less than one-tenth of a percent. |
| (a) | May be sold to institutional investors only under Rule 144A or securities offered pursuant to Section 4(a)(2) of the Securities Act of 1933, as amended. |
| (b) | Floating rate—Rate shown was the rate in effect as of October 31, 2022. |
| (c) | Delayed delivery security. |
| (d) | Illiquid security—As of October 31, 2022, the total market value deemed illiquid under procedures approved by the Board of Trustees was $19,730,362, which represented 0.9% of the Fund’s net assets.(Unaudited) |
| (e) | PIK ("Payment-in-Kind")—issuer may pay interest or dividends with additional securities and/or in cash. |
| (f) | Security in which significant unobservable inputs (Level 3) were used in determining fair value. |
| (g) | Issue in default. |
| (h) | Issue in non-accrual status. |
| (i) | Non-income producing security. |
| (j) | Less than $1. |
| (k) | Interest rate shown represents yield to maturity. |
The notes to the financial statements are an integral part of, and should be read in conjunction with, the financial statements.
37
Portfolio of Investments October 31, 2022† (continued)
Investments in Affiliates (in 000's)
Investments in issuers considered to be affiliate(s) of the Fund during the year ended October 31, 2022 for purposes of Section 2(a)(3) of the Investment Company Act of 1940, as amended, were as follows:
| Affiliated Investment Companies | Value,
Beginning
of Year | Purchases
at Cost | Proceeds
from
Sales | Net
Realized
Gain/(Loss)
on Sales | Change in
Unrealized
Appreciation/
(Depreciation) | Value,
End of
Year | Dividend
Income | Other
Distributions | Shares
End of
Year |
| MainStay MacKay High Yield Corporate Bond Fund Class I | $ 13,501 | $ — | $ (5,383) | $ (882) | $ (894) | $ 6,342 | $ 550 | $ — | 1,299 |
| Abbreviation(s): |
| CLO—Collateralized Loan Obligation |
| LIBOR—London Interbank Offered Rate |
| REIT—Real Estate Investment Trust |
| SOFR—Secured Overnight Financing Rate |
| TBD—To Be Determined |
| USD—United States Dollar |
The following is a summary of the fair valuations according to the inputs used as of October 31, 2022, for valuing the Fund’s assets:
| Description | Quoted
Prices in
Active
Markets for
Identical
Assets
(Level 1) | | Significant
Other
Observable
Inputs
(Level 2) | | Significant
Unobservable
Inputs
(Level 3) | | Total |
| Asset Valuation Inputs | | | | | | | |
| Investments in Securities (a) | | | | | | | |
| Long-Term Bonds | | | | | | | |
| Asset-Backed Securities | $ — | | $ 79,033,467 | | $ — | | $ 79,033,467 |
| Corporate Bonds | — | | 55,738,999 | | — | | 55,738,999 |
| Loan Assignments | — | | 1,998,229,671 | | 1,161,025 | | 1,999,390,696 |
| Total Long-Term Bonds | — | | 2,133,002,137 | | 1,161,025 | | 2,134,163,162 |
| Affiliated Investment Company | | | | | | | |
| Fixed Income Fund | 6,341,647 | | — | | — | | 6,341,647 |
| Common Stocks | — | | — | | 214,378 | | 214,378 |
| Rights | — | | — | | 127,485 | | 127,485 |
| Warrants (b) | — | | — | | 0 | | 0 |
| Short-Term Investments | | | | | | | |
| U.S. Treasury Debt | — | | 51,565,772 | | — | | 51,565,772 |
| Total Investments in Securities | $ 6,341,647 | | $ 2,184,567,909 | | $ 1,502,888 | | $ 2,192,412,444 |
| (a) | For a complete listing of investments and their industries, see the Portfolio of Investments. |
| (b) | Less than $1. |
The notes to the financial statements are an integral part of, and should be read in conjunction with, the financial statements.
| 38 | MainStay Floating Rate Fund |
Statement of Assets and Liabilities as of October 31, 2022
| Assets |
Investment in unaffiliated securities, at value
(identified cost $2,337,788,653) | $2,186,070,797 |
Investment in affiliated investment companies, at value
(identified cost $7,331,284) | 6,341,647 |
| Cash | 9,715,252 |
| Receivables: | |
| Investment securities sold | 24,234,892 |
| Interest | 8,062,689 |
| Fund shares sold | 8,022,548 |
| Other assets | 101,044 |
| Total assets | 2,242,548,869 |
| Liabilities |
| Unrealized depreciation on unfunded commitments (See Note 5) | 221,518 |
| Payables: | |
| Investment securities purchased | 24,123,392 |
| Fund shares redeemed | 5,429,427 |
| Manager (See Note 3) | 1,114,233 |
| Transfer agent (See Note 3) | 421,523 |
| NYLIFE Distributors (See Note 3) | 162,241 |
| Professional fees | 36,914 |
| Shareholder communication | 21,343 |
| Custodian | 12,214 |
| Trustees | 1,107 |
| Accrued expenses | 12,951 |
| Distributions payable | 1,790,515 |
| Total liabilities | 33,347,378 |
| Net assets | $2,209,201,491 |
| Composition of Net Assets |
| Shares of beneficial interest outstanding (par value of $.001 per share) unlimited number of shares authorized | $ 258,444 |
| Additional paid-in-capital | 2,480,494,502 |
| | 2,480,752,946 |
| Total distributable earnings (loss) | (271,551,455) |
| Net assets | $2,209,201,491 |
| Class A | |
| Net assets applicable to outstanding shares | $ 513,557,721 |
| Shares of beneficial interest outstanding | 60,087,111 |
| Net asset value per share outstanding | $ 8.55 |
| Maximum sales charge (3.00% of offering price) | 0.26 |
| Maximum offering price per share outstanding | $ 8.81 |
| Investor Class | |
| Net assets applicable to outstanding shares | $ 17,819,887 |
| Shares of beneficial interest outstanding | 2,084,814 |
| Net asset value per share outstanding | $ 8.55 |
| Maximum sales charge (2.50% of offering price) | 0.22 |
| Maximum offering price per share outstanding | $ 8.77 |
| Class B | |
| Net assets applicable to outstanding shares | $ 548,846 |
| Shares of beneficial interest outstanding | 64,165 |
| Net asset value and offering price per share outstanding | $ 8.55 |
| Class C | |
| Net assets applicable to outstanding shares | $ 56,706,316 |
| Shares of beneficial interest outstanding | 6,632,535 |
| Net asset value and offering price per share outstanding | $ 8.55 |
| Class I | |
| Net assets applicable to outstanding shares | $1,287,716,130 |
| Shares of beneficial interest outstanding | 150,648,249 |
| Net asset value and offering price per share outstanding | $ 8.55 |
| Class R3 | |
| Net assets applicable to outstanding shares | $ 744,963 |
| Shares of beneficial interest outstanding | 87,145 |
| Net asset value and offering price per share outstanding | $ 8.55 |
| Class R6 | |
| Net assets applicable to outstanding shares | $ 332,081,883 |
| Shares of beneficial interest outstanding | 38,836,745 |
| Net asset value and offering price per share outstanding | $ 8.55 |
| SIMPLE Class | |
| Net assets applicable to outstanding shares | $ 25,745 |
| Shares of beneficial interest outstanding | 3,012 |
| Net asset value and offering price per share outstanding | $ 8.55 |
The notes to the financial statements are an integral part of, and should be read in conjunction with, the financial statements.
39
Statement of Operations for the year ended October 31, 2022
| Investment Income (Loss) |
| Income | |
| Interest | $ 110,768,021 |
| Dividends-unaffiliated | 1,070,661 |
| Dividends-affiliated | 550,165 |
| Securities lending, net | 247,567 |
| Total income | 112,636,414 |
| Expenses | |
| Manager (See Note 3) | 13,932,570 |
| Transfer agent (See Note 3) | 2,376,633 |
| Distribution/Service—Class A (See Note 3) | 1,225,379 |
| Distribution/Service—Investor Class (See Note 3) | 46,528 |
| Distribution/Service—Class B (See Note 3) | 7,209 |
| Distribution/Service—Class C (See Note 3) | 585,534 |
| Distribution/Service—Class R3 (See Note 3) | 3,638 |
| Distribution/Service—SIMPLE Class (See Note 3) | 130 |
| Registration | 306,902 |
| Professional fees | 250,646 |
| Shareholder communication | 63,630 |
| Trustees | 57,066 |
| Custodian | 50,422 |
| Shareholder service (See Note 3) | 728 |
| Miscellaneous | 172,939 |
| Total expenses | 19,079,954 |
| Net investment income (loss) | 93,556,460 |
| Realized and Unrealized Gain (Loss) |
| Net realized gain (loss) on: | |
| Unaffiliated investment transactions | (27,781,538) |
| Affiliated investment company transactions | (881,731) |
| Net realized gain (loss) | (28,663,269) |
| Net change in unrealized appreciation (depreciation) on: | |
| Unaffiliated investments | (141,794,247) |
| Affiliated investments | (894,283) |
| Unfunded commitments | (226,608) |
| Net change in unrealized appreciation (depreciation) | (142,915,138) |
| Net realized and unrealized gain (loss) | (171,578,407) |
| Net increase (decrease) in net assets resulting from operations | $ (78,021,947) |
The notes to the financial statements are an integral part of, and should be read in conjunction with, the financial statements.
| 40 | MainStay Floating Rate Fund |
Statements of Changes in Net Assets
for the years ended October 31, 2022 and October 31, 2021
| | 2022 | 2021 |
| Increase (Decrease) in Net Assets |
| Operations: | | |
| Net investment income (loss) | $ 93,556,460 | $ 44,320,664 |
| Net realized gain (loss) | (28,663,269) | (5,286,664) |
| Net change in unrealized appreciation (depreciation) | (142,915,138) | 33,400,606 |
| Net increase (decrease) in net assets resulting from operations | (78,021,947) | 72,434,606 |
| Distributions to shareholders: | | |
| Class A | (18,650,038) | (8,877,779) |
| Investor Class | (674,941) | (513,155) |
| Class B | (19,904) | (20,388) |
| Class C | (1,701,117) | (969,119) |
| Class I | (56,965,680) | (24,392,511) |
| Class R3 | (24,753) | (13,109) |
| Class R6 | (15,202,101) | (7,525,422) |
| SIMPLE Class | (887) | (606) |
| Total distributions to shareholders | (93,239,421) | (42,312,089) |
| Capital share transactions: | | |
| Net proceeds from sales of shares | 1,632,823,205 | 1,441,425,937 |
| Net asset value of shares issued to shareholders in reinvestment of distributions | 78,654,636 | 37,317,100 |
| Cost of shares redeemed | (1,354,635,928) | (408,186,068) |
| Increase (decrease) in net assets derived from capital share transactions | 356,841,913 | 1,070,556,969 |
| Net increase (decrease) in net assets | 185,580,545 | 1,100,679,486 |
| Net Assets |
| Beginning of year | 2,023,620,946 | 922,941,460 |
| End of year | $ 2,209,201,491 | $2,023,620,946 |
The notes to the financial statements are an integral part of, and should be read in conjunction with, the financial statements.
41
Financial Highlights selected per share data and ratios
| | Year Ended October 31, |
| Class A | 2022 | | 2021 | | 2020 | | 2019 | | 2018 |
| Net asset value at beginning of year | $ 9.13 | | $ 8.84 | | $ 9.02 | | $ 9.28 | | $ 9.35 |
| Net investment income (loss) | 0.34(a) | | 0.25(a) | | 0.31(a) | | 0.43(a) | | 0.40 |
| Net realized and unrealized gain (loss) | (0.59) | | 0.28 | | (0.18) | | (0.26) | | (0.07) |
| Total from investment operations | (0.25) | | 0.53 | | 0.13 | | 0.17 | | 0.33 |
| Less distributions: | | | | | | | | | |
| From net investment income | (0.33) | | (0.24) | | (0.31) | | (0.43) | | (0.40) |
| Net asset value at end of year | $ 8.55 | | $ 9.13 | | $ 8.84 | | $ 9.02 | | $ 9.28 |
| Total investment return (b) | (2.77)% | | 6.05% | | 1.55% | | 1.94% | | 3.54% |
| Ratios (to average net assets)/Supplemental Data: | | | | | | | | | |
| Net investment income (loss) | 3.82% | | 2.78% | | 3.56% | | 4.76% | | 4.23% |
| Net expenses (c) | 0.99% | | 1.02% | | 1.14% | | 1.09% | | 1.05% |
| Portfolio turnover rate | 27% | | 22% | | 22% | | 19% | | 32% |
| Net assets at end of year (in 000’s) | $ 513,558 | | $ 397,101 | | $ 279,188 | | $ 338,392 | | $ 383,590 |
| (a) | Per share data based on average shares outstanding during the year. |
| (b) | Total investment return is calculated exclusive of sales charges and assumes the reinvestment of dividends and distributions. For periods of less than one year, total return is not annualized. |
| (c) | In addition to the fees and expenses which the Fund bears directly, it also indirectly bears a pro-rata share of the fees and expenses of the underlying funds in which it invests. Such indirect expenses are not included in the above expense ratios. |
| | Year Ended October 31, |
| Investor Class | 2022 | | 2021 | | 2020 | | 2019 | | 2018 |
| Net asset value at beginning of year | $ 9.13 | | $ 8.84 | | $ 9.02 | | $ 9.28 | | $ 9.35 |
| Net investment income (loss) | 0.32(a) | | 0.24(a) | | 0.31(a) | | 0.43(a) | | 0.40 |
| Net realized and unrealized gain (loss) | (0.58) | | 0.28 | | (0.18) | | (0.26) | | (0.07) |
| Total from investment operations | (0.26) | | 0.52 | | 0.13 | | 0.17 | | 0.33 |
| Less distributions: | | | | | | | | | |
| From net investment income | (0.32) | | (0.23) | | (0.31) | | (0.43) | | (0.40) |
| Net asset value at end of year | $ 8.55 | | $ 9.13 | | $ 8.84 | | $ 9.02 | | $ 9.28 |
| Total investment return (b) | (2.85)% | | 5.96% | | 1.55% | | 1.95% | | 3.54% |
| Ratios (to average net assets)/Supplemental Data: | | | | | | | | | |
| Net investment income (loss) | 3.64% | | 2.67% | | 3.55% | | 4.77% | | 4.24% |
| Net expenses (c) | 1.07% | | 1.12% | | 1.13% | | 1.08% | | 1.05% |
| Portfolio turnover rate | 27% | | 22% | | 22% | | 19% | | 32% |
| Net assets at end of year (in 000's) | $ 17,820 | | $ 19,314 | | $ 20,569 | | $ 23,496 | | $ 21,731 |
| (a) | Per share data based on average shares outstanding during the year. |
| (b) | Total investment return is calculated exclusive of sales charges and assumes the reinvestment of dividends and distributions. For periods of less than one year, total return is not annualized. |
| (c) | In addition to the fees and expenses which the Fund bears directly, it also indirectly bears a pro-rata share of the fees and expenses of the underlying funds in which it invests. Such indirect expenses are not included in the above expense ratios. |
The notes to the financial statements are an integral part of, and should be read in conjunction with, the financial statements.
| 42 | MainStay Floating Rate Fund |
Financial Highlights selected per share data and ratios
| | Year Ended October 31, |
| Class B | 2022 | | 2021 | | 2020 | | 2019 | | 2018 |
| Net asset value at beginning of year | $ 9.14 | | $ 8.85 | | $ 9.03 | | $ 9.28 | | $ 9.36 |
| Net investment income (loss) | 0.25(a) | | 0.17(a) | | 0.25(a) | | 0.37(a) | | 0.33 |
| Net realized and unrealized gain (loss) | (0.58) | | 0.28 | | (0.18) | | (0.25) | | (0.08) |
| Total from investment operations | (0.33) | | 0.45 | | 0.07 | | 0.12 | | 0.25 |
| Less distributions: | | | | | | | | | |
| From net investment income | (0.26) | | (0.16) | | (0.25) | | (0.37) | | (0.33) |
| Net asset value at end of year | $ 8.55 | | $ 9.14 | | $ 8.85 | | $ 9.03 | | $ 9.28 |
| Total investment return (b) | (3.69)% | | 5.16% | | 0.79% | | 1.19% | | 2.66%(c) |
| Ratios (to average net assets)/Supplemental Data: | | | | | | | | | |
| Net investment income (loss) | 2.77% | | 1.90% | | 2.87% | | 4.04% | | 3.47% |
| Net expenses (d) | 1.82% | | 1.88% | | 1.88% | | 1.83% | | 1.80% |
| Portfolio turnover rate | 27% | | 22% | | 22% | | 19% | | 32% |
| Net assets at end of year (in 000’s) | $ 549 | | $ 897 | | $ 1,584 | | $ 3,119 | | $ 5,259 |
| (a) | Per share data based on average shares outstanding during the year. |
| (b) | Total investment return is calculated exclusive of sales charges and assumes the reinvestment of dividends and distributions. For periods of less than one year, total return is not annualized. |
| (c) | Total investment return may reflect adjustments to conform to generally accepted accounting principles. |
| (d) | In addition to the fees and expenses which the Fund bears directly, it also indirectly bears a pro-rata share of the fees and expenses of the underlying funds in which it invests. Such indirect expenses are not included in the above expense ratios. |
| | Year Ended October 31, |
| Class C | 2022 | | 2021 | | 2020 | | 2019 | | 2018 |
| Net asset value at beginning of year | $ 9.13 | | $ 8.84 | | $ 9.03 | | $ 9.28 | | $ 9.36 |
| Net investment income (loss) | 0.26(a) | | 0.17(a) | | 0.25(a) | | 0.37(a) | | 0.33 |
| Net realized and unrealized gain (loss) | (0.58) | | 0.28 | | (0.19) | | (0.25) | | (0.08) |
| Total from investment operations | (0.32) | | 0.45 | | 0.06 | | 0.12 | | 0.25 |
| Less distributions: | | | | | | | | | |
| From net investment income | (0.26) | | (0.16) | | (0.25) | | (0.37) | | (0.33) |
| Net asset value at end of year | $ 8.55 | | $ 9.13 | | $ 8.84 | | $ 9.03 | | $ 9.28 |
| Total investment return (b) | (3.58)% | | 5.17% | | 0.68% | | 1.30% | | 2.66%(c) |
| Ratios (to average net assets)/Supplemental Data: | | | | | | | | | |
| Net investment income (loss) | 2.92% | | 1.91% | | 2.85% | | 4.03% | | 3.48% |
| Net expenses (d) | 1.82% | | 1.88% | | 1.88% | | 1.83% | | 1.80% |
| Portfolio turnover rate | 27% | | 22% | | 22% | | 19% | | 32% |
| Net assets at end of year (in 000’s) | $ 56,706 | | $ 52,522 | | $ 55,153 | | $ 86,012 | | $ 142,134 |
| (a) | Per share data based on average shares outstanding during the year. |
| (b) | Total investment return is calculated exclusive of sales charges and assumes the reinvestment of dividends and distributions. For periods of less than one year, total return is not annualized. |
| (c) | Total investment return may reflect adjustments to conform to generally accepted accounting principles. |
| (d) | In addition to the fees and expenses which the Fund bears directly, it also indirectly bears a pro-rata share of the fees and expenses of the underlying funds in which it invests. Such indirect expenses are not included in the above expense ratios. |
The notes to the financial statements are an integral part of, and should be read in conjunction with, the financial statements.
43
Financial Highlights selected per share data and ratios
| | Year Ended October 31, |
| Class I | 2022 | | 2021 | | 2020 | | 2019 | | 2018 |
| Net asset value at beginning of year | $ 9.13 | | $ 8.84 | | $ 9.03 | | $ 9.28 | | $ 9.35 |
| Net investment income (loss) | 0.35(a) | | 0.28(a) | | 0.33(a) | | 0.46(a) | | 0.42 |
| Net realized and unrealized gain (loss) | (0.58) | | 0.27 | | (0.19) | | (0.25) | | (0.07) |
| Total from investment operations | (0.23) | | 0.55 | | 0.14 | | 0.21 | | 0.35 |
| Less distributions: | | | | | | | | | |
| From net investment income | (0.35) | | (0.26) | | (0.33) | | (0.46) | | (0.42) |
| Net asset value at end of year | $ 8.55 | | $ 9.13 | | $ 8.84 | | $ 9.03 | | $ 9.28 |
| Total investment return (b) | (2.53)% | | 6.31% | | 1.69% | | 2.31% | | 3.80% |
| Ratios (to average net assets)/Supplemental Data: | | | | | | | | | |
| Net investment income (loss) | 3.98% | | 3.04% | | 3.85% | | 5.02% | | 4.49% |
| Net expenses (c) | 0.74% | | 0.77% | | 0.89% | | 0.84% | | 0.80% |
| Portfolio turnover rate | 27% | | 22% | | 22% | | 19% | | 32% |
| Net assets at end of year (in 000’s) | $ 1,287,716 | | $ 1,186,421 | | $ 445,468 | | $ 716,692 | | $ 1,048,033 |
| (a) | Per share data based on average shares outstanding during the year. |
| (b) | Total investment return is calculated exclusive of sales charges and assumes the reinvestment of dividends and distributions. Class I shares are not subject to sales charges. For periods of less than one year, total return is not annualized. |
| (c) | In addition to the fees and expenses which the Fund bears directly, it also indirectly bears a pro-rata share of the fees and expenses of the underlying funds in which it invests. Such indirect expenses are not included in the above expense ratios. |
| | Year Ended October 31, |
| Class R3 | 2022 | | 2021 | | 2020 | | 2019 | | 2018 |
| Net asset value at beginning of year | $ 9.13 | | $ 8.84 | | $ 9.03 | | $ 9.28 | | $ 9.35 |
| Net investment income (loss) | 0.30(a) | | 0.22(a) | | 0.28(a) | | 0.40(a) | | 0.36 |
| Net realized and unrealized gain (loss) | (0.58) | | 0.28 | | (0.19) | | (0.25) | | (0.07) |
| Total from investment operations | (0.28) | | 0.50 | | 0.09 | | 0.15 | | 0.29 |
| Less distributions: | | | | | | | | | |
| From net investment income | (0.30) | | (0.21) | | (0.28) | | (0.40) | | (0.36) |
| Net asset value at end of year | $ 8.55 | | $ 9.13 | | $ 8.84 | | $ 9.03 | | $ 9.28 |
| Total investment return (b) | (3.11)% | | 5.68% | | 1.08% | | 1.69% | | 3.18% |
| Ratios (to average net assets)/Supplemental Data: | | | | | | | | | |
| Net investment income (loss) | 3.41% | | 2.43% | | 3.14% | | 4.37% | | 3.97% |
| Net expenses (c) | 1.34% | | 1.37% | | 1.49% | | 1.43% | | 1.40% |
| Portfolio turnover rate | 27% | | 22% | | 22% | | 19% | | 32% |
| Net assets at end of year (in 000’s) | $ 745 | | $ 620 | | $ 523 | | $ 436 | | $ 379 |
| (a) | Per share data based on average shares outstanding during the year. |
| (b) | Total investment return is calculated exclusive of sales charges and assumes the reinvestment of dividends and distributions. Class R3 shares are not subject to sales charges. For periods of less than one year, total return is not annualized. |
| (c) | In addition to the fees and expenses which the Fund bears directly, it also indirectly bears a pro-rata share of the fees and expenses of the underlying funds in which it invests. Such indirect expenses are not included in the above expense ratios. |
The notes to the financial statements are an integral part of, and should be read in conjunction with, the financial statements.
| 44 | MainStay Floating Rate Fund |
Financial Highlights selected per share data and ratios
| | Year Ended October 31, | | February 28, 2019^ through
October 31,
2019 |
| Class R6 | 2022 | | 2021 | | 2020 | |
| Net asset value at beginning of period | $ 9.13 | | $ 8.84 | | $ 9.03 | | $ 9.18 |
| Net investment income (loss) (a) | 0.36 | | 0.30 | | 0.35 | | 0.32 |
| Net realized and unrealized gain (loss) | (0.58) | | 0.27 | | (0.19) | | (0.15) |
| Total from investment operations | (0.22) | | 0.57 | | 0.16 | | 0.17 |
| Less distributions: | | | | | | | |
| From net investment income | (0.36) | | (0.28) | | (0.35) | | (0.32) |
| Net asset value at end of period | $ 8.55 | | $ 9.13 | | $ 8.84 | | $ 9.03 |
| Total investment return (b) | (2.42)% | | 6.47% | | 1.92% | | 1.84% |
| Ratios (to average net assets)/Supplemental Data: | | | | | | | |
| Net investment income (loss) | 4.07% | | 3.24% | | 3.99% | | 5.18%†† |
| Net expenses (c) | 0.63% | | 0.62% | | 0.67% | | 0.64%†† |
| Portfolio turnover rate | 27% | | 22% | | 22% | | 19% |
| Net assets at end of period (in 000’s) | $ 332,082 | | $ 366,720 | | $ 120,432 | | $ 71,077 |
| ^ | Inception date. |
| †† | Annualized. |
| (a) | Per share data based on average shares outstanding during the period. |
| (b) | Total investment return is calculated exclusive of sales charges and assumes the reinvestment of dividends and distributions. Class R6 shares are not subject to sales charges. For periods of less than one year, total return is not annualized. |
| (c) | In addition to the fees and expenses which the Fund bears directly, it also indirectly bears a pro-rata share of the fees and expenses of the underlying funds in which it invests. Such indirect expenses are not included in the above expense ratios. |
| | Year Ended October 31, | | August 31, 2020^ through
October 31, |
| SIMPLE Class | 2022 | | 2021 | | 2020 |
| Net asset value at beginning of period | $ 9.13 | | $ 8.84 | | $ 8.83* |
| Net investment income (loss) (a) | 0.30 | | 0.22 | | 0.04 |
| Net realized and unrealized gain (loss) | (0.58) | | 0.28 | | 0.01 |
| Total from investment operations | (0.28) | | 0.50 | | 0.05 |
| Less distributions: | | | | | |
| From net investment income | (0.30) | | (0.21) | | (0.04) |
| Net asset value at end of period | $ 8.55 | | $ 9.13 | | $ 8.84 |
| Total investment return (b) | (3.09)% | | 5.67% | | 0.57% |
| Ratios (to average net assets)/Supplemental Data: | | | | | |
| Net investment income (loss) | 3.41% | | 2.42% | | 2.72%†† |
| Net expenses (c) | 1.32% | | 1.38% | | 1.37%†† |
| Portfolio turnover rate | 27% | | 22% | | 22% |
| Net assets at end of period (in 000’s) | $ 26 | | $ 27 | | $ 25 |
| ^ | Inception date. |
| * | Based on the net asset value of Investor Class as of August 31, 2020. |
| †† | Annualized. |
| (a) | Per share data based on average shares outstanding during the period. |
| (b) | Total investment return is calculated exclusive of sales charges and assumes the reinvestment of dividends and distributions. SIMPLE Class shares are not subject to sales charges. For periods of less than one year, total return is not annualized. |
| (c) | In addition to the fees and expenses which the Fund bears directly, it also indirectly bears a pro-rata share of the fees and expenses of the underlying funds in which it invests. Such indirect expenses are not included in the above expense ratios. |
The notes to the financial statements are an integral part of, and should be read in conjunction with, the financial statements.
45
Notes to Financial Statements
Note 1-Organization and Business
MainStay Funds Trust (the “Trust”) was organized as a Delaware statutory trust on April 28, 2009. The Trust is registered under the Investment Company Act of 1940, as amended (the “1940 Act”), as an open-end management investment company, and is comprised of thirty-three funds (collectively referred to as the “Funds”). These financial statements and notes relate to the MainStay Floating Rate Fund (the "Fund"), a “diversified” fund, as that term is defined in the 1940 Act, as interpreted or modified by regulatory authorities having jurisdiction, from time to time.
The following table lists the Fund's share classes that have been registered and commenced operations:
| Class | Commenced Operations |
| Class A | May 3, 2004 |
| Investor Class | February 28, 2008 |
| Class B | May 3, 2004 |
| Class C | May 3, 2004 |
| Class I | May 3, 2004 |
| Class R3 | February 29, 2016 |
| Class R6 | February 28, 2019 |
| SIMPLE Class | August 31, 2020 |
Class B shares of the MainStay Group of Funds are closed to all new purchases as well as additional investments by existing Class B shareholders. Existing Class B shareholders may continue to reinvest dividends and capital gains distributions, as well as exchange their Class B shares for Class B shares of other funds in the MainStay Group of Funds as permitted by the current exchange privileges. Class B shareholders continue to be subject to any applicable contingent deferred sales charge ("CDSC") at the time of redemption. All other features of the Class B shares, including but not limited to the fees and expenses applicable to Class B shares, remain unchanged. Unless redeemed, Class B shareholders will remain in Class B shares of their respective fund until the Class B shares are converted to Class A or Investor Class shares pursuant to the applicable conversion schedule.
Class A and Investor Class shares are offered at net asset value (“NAV”) per share plus an initial sales charge. No initial sales charge applies to investments of $250,000 or more (and certain other qualified purchases) in Class A and Investor Class shares. However, a CDSC of 1.00% may be imposed on certain redemptions of Class A and Investor Class shares made within 18 months of the date of purchase on shares that were purchased without an initial sales charge. For purchases of Class A and Investor Class shares made from August 1, 2017 through April 14, 2019, a CDSC of 1.00% may be imposed on certain redemptions (for investments of $500,000 which paid no initial sales charge) of such shares within 18 months of the date of purchase on shares that were purchased without an initial sales charge. Class C shares are offered at NAV without an initial sales charge, although a 1.00% CDSC may be imposed on redemptions of such shares made within one year of the date of purchase of Class C shares. Investments in Class C shares are subject to a purchase maximum of $250,000. When Class B shares were
offered, they were offered at NAV without an initial sales charge, although a CDSC that declines depending on the number of years a shareholder held its Class B shares may be imposed on certain redemptions of such shares made within six years of the date of purchase of such shares. Class I, Class R3, Class R6 and SIMPLE Class shares are offered at NAV without a sales charge. Depending upon eligibility, Class B shares convert to Class A or Investor Class shares at the end of the calendar quarter four years after the date they were purchased. In addition, depending upon eligibility, Class C shares convert to either Class A or Investor Class shares at the end of the calendar quarter eight years after the date they were purchased. Additionally, Investor Class shares may convert automatically to Class A shares. SIMPLE Class shares convert to Class A shares, or Investor Class shares if you are not eligible to hold Class A shares, at the end of the calendar quarter, ten years after the date they were purchased. Share class conversions are based on the relevant NAVs of the two classes at the time of the conversion, and no sales load or other charge is imposed. Under certain circumstances and as may be permitted by the Trust’s multiple class plan pursuant to Rule 18f-3 under the 1940 Act, specified share classes of the Fund may be converted to one or more other share classes of the Fund as disclosed in the capital share transactions within these Notes. The classes of shares have the same voting (except for issues that relate solely to one class), dividend, liquidation and other rights, and the same terms and conditions, except that under distribution plans pursuant to Rule 12b-1 under the 1940 Act, Class B and Class C shares are subject to higher distribution and/or service fees than Class A, Investor Class, Class R3 and SIMPLE Class shares. Class I and Class R6 shares are not subject to a distribution and/or service fee. Class R3 shares are subject to a shareholder service fee, which is in addition to fees paid under the distribution plan for Class R3 shares.
The Fund's investment objective is to seek high current income.
Note 2–Significant Accounting Policies
The Fund is an investment company and accordingly follows the investment company accounting and reporting guidance of the Financial Accounting Standards Board (“FASB”) Accounting Standards Codification Topic 946 Financial Services—Investment Companies. The Fund prepares its financial statements in accordance with generally accepted accounting principles (“GAAP”) in the United States of America and follows the significant accounting policies described below.
(A) Securities Valuation. Investments are usually valued as of the close of regular trading on the New York Stock Exchange (the "Exchange") (usually 4:00 p.m. Eastern time) on each day the Fund is open for business ("valuation date").
Effective September 8, 2022, and pursuant to Rule 2a-5 under the 1940 Act, the Board of Trustees of the Trust (the "Board") designated New York Life Investment Management LLC (“New York Life Investments” or the "Manager") as its Valuation Designee (the "Valuation Designee"). The Valuation Designee is responsible for performing fair valuations relating to all investments in the Fund’s portfolio for which market quotations are not
| 46 | MainStay Floating Rate Fund |
readily available; periodically assessing and managing material valuation risks; establishing and applying fair value methodologies; testing fair valuation methodologies; evaluating and overseeing pricing services; segregation of valuation and portfolio management functions; providing quarterly, annual and prompt reporting to the Board, as appropriate; identifying potential conflicts of interest; and maintaining appropriate records. The Valuation Designee has established a valuation committee ("Valuation Committee") to assist in carrying out the Valuation Designee’s responsibilities and establish prices of securities for which market quotations are not readily available. The Fund’s and the Valuation Designee's policies and procedures ("Valuation Procedures") govern the Valuation Designee’s selection and application of methodologies for determining and calculating the fair value of Fund investments. The Valuation Designee may value Fund portfolio securities for which market quotations are not readily available and other Fund assets utilizing inputs from pricing services and other third-party sources (together, “Pricing Sources”). The Valuation Committee meets (in person, via electronic mail or via teleconference) on an ad-hoc basis to determine fair valuations and on a quarterly basis to review fair value events (excluding fair valuations from pricing services), including valuation risks and back-testing results, and preview reports to the Board.
The Valuation Committee establishes prices of securities for which market quotations are not readily available based on such methodologies and measurements on a regular basis after considering information that is reasonably available and deemed relevant by the Valuation Committee. The Board shall oversee the Valuation Designee and review fair valuation materials on a prompt, quarterly and annual basis and approve proposed revisions to the Valuation Procedures.
Investments for which market quotations are not readily available are valued at fair value as determined in good faith pursuant to the Valuation Procedures. A market quotation is readily available only when that quotation is a quoted price (unadjusted) in active markets for identical investments that the Fund can access at the measurement date, provided that a quotation will not be readily available if it is not reliable. Fair value measurements are determined within a framework that establishes a three-tier hierarchy that maximizes the use of observable market data and minimizes the use of unobservable inputs to establish a classification of fair value measurements for disclosure purposes. "Inputs" refer broadly to the assumptions that market participants would use in pricing the asset or liability, including assumptions about risk, such as the risk inherent in a particular valuation technique used to measure fair value using a pricing model and/or the risk inherent in the inputs for the valuation technique. Inputs may be observable or unobservable. Observable inputs reflect the assumptions market participants would use in pricing the asset or liability based on market data obtained from sources independent of the Fund. Unobservable inputs reflect the Fund’s own assumptions about the assumptions market participants would use in pricing the asset or liability based on the information available. The inputs or methodology used for valuing assets or liabilities may not be an indication of the risks associated with investing in those assets or liabilities. The three-tier hierarchy of inputs is summarized below.
| • | Level 1—quoted prices (unadjusted) in active markets for an identical asset or liability |
| • | Level 2—other significant observable inputs (including quoted prices for a similar asset or liability in active markets, interest rates and yield curves, prepayment speeds, credit risk, etc.) |
| • | Level 3—significant unobservable inputs (including the Fund's own assumptions about the assumptions that market participants would use in measuring fair value of an asset or liability) |
The level of an asset or liability within the fair value hierarchy is based on the lowest level of an input, both individually and in the aggregate, that is significant to the fair value measurement. The aggregate value by input level of the Fund’s assets and liabilities as of October 31, 2022, is included at the end of the Portfolio of Investments.
The Fund may use third-party vendor evaluations, whose prices may be derived from one or more of the following standard inputs, among others:
| • Benchmark yields | • Reported trades |
| • Broker/dealer quotes | • Issuer spreads |
| • Two-sided markets | • Benchmark securities |
| • Bids/offers | • Reference data (corporate actions or material event notices) |
| • Industry and economic events | • Comparable bonds |
| • Monthly payment information | |
An asset or liability for which a market quotation is not readily available is valued by methods deemed reasonable in good faith by the Valuation Committee, following the Valuation Procedures to represent fair value. Under these procedures, the Valuation Designee generally uses a market-based approach which may use related or comparable assets or liabilities, recent transactions, market multiples, book values and other relevant information. The Valuation Designee may also use an income-based valuation approach in which the anticipated future cash flows of the asset or liability are discounted to calculate fair value. Discounts may also be applied due to the nature and/or duration of any restrictions on the disposition of the asset or liability. Fair value represents a good faith approximation of the value of a security. Fair value determinations involve the consideration of a number of subjective factors, an analysis of applicable facts and circumstances and the exercise of judgment. As a result, it is possible that the fair value for a security determined in good faith in accordance with the Valuation Procedures may differ from valuations for the same security determined for other funds using their own valuation procedures. Although the Valuation Procedures are designed to value a security at the price the Fund may reasonably expect to receive upon the security's sale in an orderly transaction, there can be no assurance that any fair value determination thereunder would, in fact, approximate the amount that the Fund would actually realize upon the sale of the security or the price at which the security would trade if a reliable market price were readily available. During the year ended October 31, 2022, there were no material changes to the fair value methodologies.
Notes to Financial Statements (continued)
Securities which may be valued in this manner include, but are not limited to: (i) a security for which trading has been halted or suspended or otherwise does not have a readily available market quotation on a given day; (ii) a debt security that has recently gone into default and for which there is not a current market quotation; (iii) a security of an issuer that has entered into a restructuring; (iv) a security that has been delisted from a national exchange; (v) a security subject to trading collars for which no or limited trading takes place; and (vi) a security whose principal market has been temporarily closed at a time when, under normal conditions, it would be open. Securities valued in this manner are generally categorized as Level 2 or 3 in the hierarchy.
Equity securities, rights and warrants are valued at the last quoted sales prices as of the close of regular trading on the relevant exchange on each valuation date. Securities that are not traded on the valuation date are valued at the mean of the last quoted bid and ask prices. Prices are normally taken from the principal market in which each security trades. These securities are generally categorized as Level 1 in the hierarchy.
Investments in mutual funds, including money market funds, are valued at their respective NAVs at the close of business each day on the valuation date. These securities are generally categorized as Level 1 in the hierarchy.
Debt securities (other than convertible and municipal bonds) are valued at the evaluated bid prices (evaluated mean prices in the case of convertible and municipal bonds) supplied by a pricing agent or broker selected by the Valuation Designee, in consultation with the Subadvisor. The evaluations are market-based measurements processed through a pricing application and represents the pricing agent’s good faith determination as to what a holder may receive in an orderly transaction under market conditions. The rules-based logic utilizes valuation techniques that reflect participants’ assumptions and vary by asset class and per methodology, maximizing the use of relevant observable data including quoted prices for similar assets, benchmark yield curves and market corroborated inputs. The evaluated bid or mean prices are deemed by the Valuation Designee, in consultation with the Subadvisor, to be representative of market values at the regular close of trading of the Exchange on each valuation date. Debt securities purchased on a delayed delivery basis are marked to market daily until settlement at the forward settlement date. Debt securities, including corporate bonds, U.S. government and federal agency bonds, municipal bonds, foreign bonds, convertible bonds, asset-backed securities and mortgage-backed securities are generally categorized as Level 2 in the hierarchy.
Loan assignments, participations and commitments are valued at the average of bid quotations obtained from the engaged independent pricing service and are generally categorized as Level 2 in the hierarchy. Certain loan assignments, participations and commitments may be valued by utilizing significant unobservable inputs obtained from the pricing service and are generally categorized as Level 3 in the hierarchy. As of October 31, 2022, securities that were fair valued in such a manner are shown in the Portfolio of Investments.
Temporary cash investments acquired in excess of 60 days to maturity at the time of purchase are valued using the latest bid prices or using valuations based on a matrix system (which considers such factors as security prices, yields, maturities and ratings), both as furnished by independent pricing services. Temporary cash investments that mature in 60 days or less at the time of purchase ("Short-Term Investments") are valued using the amortized cost method of valuation, unless the use of such method would be inappropriate. The amortized cost method involves valuing a security at its cost on the date of purchase and thereafter assuming a constant amortization to maturity of the difference between such cost and the value on maturity date. Amortized cost approximates the current fair value of a security. Securities valued using the amortized cost method are not valued using quoted prices in an active market and are generally categorized as Level 2 in the hierarchy.
The information above is not intended to reflect an exhaustive list of the methodologies that may be used to value portfolio investments. The Valuation Procedures permit the use of a variety of valuation methodologies in connection with valuing portfolio investments. The methodology used for a specific type of investment may vary based on the market data available or other considerations. The methodologies summarized above may not represent the specific means by which portfolio investments are valued on any particular business day.
A portfolio investment may be classified as an illiquid investment under the Trust's written liquidity risk management program and related procedures (“Liquidity Program”). Illiquidity of an investment might prevent the sale of such investment at a time when the Manager or the Subadvisor might wish to sell, and these investments could have the effect of decreasing the overall level of the Fund's liquidity. Further, the lack of an established secondary market may make it more difficult to value illiquid investments, requiring the Fund to rely on judgments that may be somewhat subjective in measuring value, which could vary materially from the amount that the Fund could realize upon disposition. Difficulty in selling illiquid investments may result in a loss or may be costly to the Fund. An illiquid investment is any investment that the Manager or Subadvisor reasonably expects cannot be sold or disposed of in current market conditions in seven calendar days or less without the sale or disposition significantly changing the market value of the investment. The liquidity classification of each investment will be made using information obtained after reasonable inquiry and taking into account, among other things, relevant market, trading and investment-specific considerations in accordance with the Liquidity Program. Illiquid investments are often fair valued in accordance with the Fund's procedures described above. The liquidity of the Fund's investments was determined as of October 31, 2022, and can change at any time. Illiquid investments as of October 31, 2022, are shown in the Portfolio of Investments.
(B) Income Taxes. The Fund's policy is to comply with the requirements of the Internal Revenue Code of 1986, as amended (the “Internal Revenue Code”), applicable to regulated investment companies
| 48 | MainStay Floating Rate Fund |
and to distribute all of its taxable income to the shareholders of the Fund within the allowable time limits.
The Manager evaluates the Fund’s tax positions to determine if the tax positions taken meet the minimum recognition threshold in connection with accounting for uncertainties in income tax positions taken or expected to be taken for the purposes of measuring and recognizing tax liabilities in the financial statements. Recognition of tax benefits of an uncertain tax position is permitted only to the extent the position is “more likely than not” to be sustained assuming examination by taxing authorities. The Manager analyzed the Fund's tax positions taken on federal, state and local income tax returns for all open tax years (for up to three tax years) and has concluded that no provisions for federal, state and local income tax are required in the Fund's financial statements. The Fund's federal, state and local income tax and federal excise tax returns for tax years for which the applicable statutes of limitations have not expired are subject to examination by the Internal Revenue Service and state and local departments of revenue.
(C) Dividends and Distributions to Shareholders. Dividends and distributions are recorded on the ex-dividend date. The Fund intends to declare dividends from net investment income, if any, daily and intends to pay them at least monthly and pays distributions from net realized capital and currency gains, if any, at least annually. Unless a shareholder elects otherwise, all dividends and distributions are reinvested at NAV in the same class of shares of the Fund. Dividends and distributions to shareholders are determined in accordance with federal income tax regulations and may differ from determinations using GAAP.
(D) Security Transactions and Investment Income. The Fund records security transactions on the trade date. Realized gains and losses on security transactions are determined using the identified cost method. Dividend income is recognized on the ex-dividend date, net of any foreign tax withheld at the source. Premiums and discount on purchased securities other than bank loans, are accreted and amortized, respectively on the effective interest rate method. Premiums and discounts on purchased bank loan securities are accreted and amortized, respectively, on the straight line method. Distributions received from real estate investment trusts may be classified as dividends, capital gains and/or return of capital.
Investment income and realized and unrealized gains and losses on investments of the Fund are allocated pro rata to the separate classes of shares based upon their relative net assets on the date the income is earned or realized and unrealized gains and losses are incurred.
The Fund may place a debt security on non-accrual status and reduce related interest income by ceasing current accruals and writing off all or a portion of any interest receivables when the collection of all or a portion of such interest has become doubtful. A debt security is removed from non-accrual status when the issuer resumes interest payments or when collectability of interest is reasonably assured.
(E) Expenses. Expenses of the Trust are allocated to the individual Funds in proportion to the net assets of the respective Funds when the expenses are incurred, except where direct allocations of expenses can be made. Expenses (other than transfer agent expenses and fees incurred under the shareholder services plans and/or the distribution plans further discussed in Note 3(B)) are allocated to separate classes of shares pro rata based upon their relative net assets on the date the expenses are incurred. The expenses borne by the Fund, including those of related parties to the Fund, are shown in the Statement of Operations.
Additionally, the Fund may invest in ETFs and mutual funds, which are subject to management fees and other fees that may cause the costs of investing in ETFs and mutual funds to be greater than the costs of owning the underlying securities directly. These indirect expenses of ETFs and mutual funds are not included in the amounts shown as expenses in the Statement of Operations or in the expense ratios included in the Financial Highlights.
(F) Use of Estimates. In preparing financial statements in conformity with GAAP, the Manager makes estimates and assumptions that affect the reported amounts and disclosures in the financial statements. Actual results could differ from those estimates and assumptions.
(G) Loan Assignments, Participations and Commitments. The Fund may invest in loan assignments and participations ("loans"). Commitments are agreements to make money available to a borrower in a specified amount, at a specified rate and within a specified time. The Fund records an investment when the borrower withdraws money on a commitment or when a funded loan is purchased (trade date) and records interest as earned. These loans pay interest at rates that are periodically reset by reference to a base lending rate plus a spread. These base lending rates are generally the prime rate offered by a designated U.S. bank, the London Interbank Offered Rate ("LIBOR") or an alternative reference rate.
The loans in which the Fund may invest are generally readily marketable, but may be subject to some restrictions on resale. For example, the Fund may be contractually obligated to receive approval from the agent bank and/or borrower prior to the sale of these investments. If the Fund purchases an assignment from a lender, the Fund will generally have direct contractual rights against the borrower in favor of the lender. If the Fund purchases a participation interest either from a lender or a participant, the Fund typically will have established a direct contractual relationship with the seller of the participation interest, but not with the borrower. Consequently, the Fund is subject to the credit risk of the lender or participant who sold the participation interest to the Fund, in addition to the usual credit risk of the borrower. In the event that the borrower, selling participant or intermediate participants become insolvent or enter into bankruptcy, the Fund may incur certain costs and delays in realizing payment, or may suffer a loss of principal and/or interest.
Unfunded commitments represent the remaining obligation of the Fund to the borrower. At any point in time, up to the maturity date of the issue, the borrower may demand the unfunded portion. Unfunded amounts, if any,
Notes to Financial Statements (continued)
are marked to market and any unrealized gains or losses are recorded in the Statement of Assets and Liabilities. As of October 31, 2022, the Fund held unfunded commitments. (See Note 5).
(H) Securities Lending. In order to realize additional income, the Fund may engage in securities lending, subject to the limitations set forth in the 1940 Act and relevant guidance by the staff of the Securities and Exchange Commission (“SEC”). If the Fund engages in securities lending, the Fund will lend through its custodian, JPMorgan Chase Bank, N.A., ("JPMorgan"), acting as securities lending agent on behalf of the Fund. Under the current arrangement, JPMorgan will manage the Fund's collateral in accordance with the securities lending agency agreement between the Fund and JPMorgan, and indemnify the Fund against counterparty risk. The loans will be collateralized by cash (which may be invested in a money market fund) and/or non-cash collateral (which may include U.S. Treasury securities and/or U.S. government agency securities issued or guaranteed by the United States government or its agencies or instrumentalities) at least equal at all times to the market value of the securities loaned. Non-cash collateral held at year end is segregated and cannot be transferred by the Fund. The Fund bears the risk of delay in recovery of, or loss of rights in, the securities loaned. The Fund may also record a realized gain or loss on securities deemed sold due to a borrower’s inability to return securities on loan. The Fund bears the risk of any loss on investment of cash collateral. The Fund will receive compensation for lending its securities in the form of fees or it will retain a portion of interest earned on the investment of any cash collateral. The Fund will also continue to receive interest and dividends on the securities loaned and any gain or loss in the market price of the securities loaned that may occur during the term of the loan will be for the account of the Fund. Income earned from securities lending activities, if any, is reflected in the Statement of Operations. As of October 31, 2022, the Fund did not have any portfolio securities on loan.
(I) Rights and Warrants. Rights are certificates that permit the holder to purchase a certain number of shares, or a fractional share, of a new stock from the issuer at a specific price. Warrants are instruments that entitle the holder to buy an equity security at a specific price for a specific period of time. These investments can provide a greater potential for profit or loss than an equivalent investment in the underlying security. Prices of these investments do not necessarily move in tandem with the prices of the underlying securities.
There is risk involved in the purchase of rights and warrants in that these investments are speculative investments. The Fund could also lose the entire value of its investment in warrants if such warrants are not exercised by the date of its expiration. The Fund is exposed to risk until the sale or exercise of each right or warrant is completed. Rights and Warrants as of October 31, 2022 are shown in the Portfolio of Investments.
(J) Delayed Delivery Transactions. The Fund may purchase or sell securities on a delayed delivery basis. These transactions involve a commitment by the Fund to purchase or sell securities for a predetermined price or yield, with payment and delivery taking place
beyond the customary settlement period. When delayed delivery purchases are outstanding, the Fund will designate liquid assets in an amount sufficient to meet the purchase price. When purchasing a security on a delayed delivery basis, the Fund assumes the rights and risks of ownership of the security, including the risk of price and yield fluctuations, and takes such fluctuations into account when determining its NAV. The Fund may dispose of or renegotiate a delayed delivery transaction after it is entered into, and may sell delayed delivery securities before they are delivered, which may result in a realized gain or loss. When the Fund has sold a security it owns on a delayed delivery basis, the Fund does not participate in future gains and losses with respect to the security. Delayed delivery transactions as of October 31, 2022, are shown in the Portfolio of Investments.
(K) Loan Risk. The Fund may invest in loans which are usually rated below investment grade and are generally considered speculative because they present a greater risk of loss, including default, than higher rated debt securities. These investments pay investors a higher interest rate than investment grade debt securities because of the increased risk of loss. Although certain loans are collateralized, there is no guarantee that the value of the collateral will be sufficient to repay the loan. In a recession or serious credit event, the value of these investments could decline significantly. As a result of these and other events, the Fund's NAVs could go down and you could lose money.
In addition, loans generally are subject to extended settlement periods that may be longer than seven days. As a result, the Fund may be adversely affected by selling other investments at an unfavorable time and/or under unfavorable conditions or engaging in borrowing transactions, such as borrowing against its credit facility, to raise cash to meet redemption obligations or pursue other investment opportunities.
In certain circumstances, loans may not be deemed to be securities. As a result, the Fund may not have the protection of anti-fraud provisions of the federal securities laws. In such cases, the Fund generally must rely on the contractual provisions in the loan agreement and common-law fraud protections under applicable state law.
(L) Foreign Securities Risk. The Fund may invest in foreign securities, which carry certain risks that are in addition to the usual risks inherent in domestic securities. These risks include those resulting from currency fluctuations, future adverse political or economic developments and possible imposition of currency exchange blockages or other foreign governmental laws or restrictions. These risks are likely to be greater in emerging markets than in developed markets. The ability of issuers of debt securities held by the Fund to meet their obligations may be affected by, among other things, economic or political developments in a specific country, industry or region.
(M) Debt Securities Risk. The Fund's investments may include securities such as variable rate notes, floaters and mortgage-related and asset-backed securities. If expectations about changes in interest rates or
| 50 | MainStay Floating Rate Fund |
assessments of an issuer's credit worthiness or market conditions are incorrect, investments in these types of securities could lose money for the Fund.
(N) LIBOR Replacement Risk. The Fund may invest in certain debt securities, derivatives or other financial instruments that utilize the London Interbank Offered Rate ("LIBOR"), as a “benchmark” or “reference rate” for various interest rate calculations. As of January 1, 2022, the United Kingdom Financial Conduct Authority, which regulates LIBOR, ceased its active encouragement of banks to provide the quotations needed to sustain most LIBOR rates due to the absence of an active market for interbank unsecured lending and other reasons. However, the United Kingdom Financial Conduct Authority, the LIBOR administrator and other regulators announced that certain sterling and yen LIBOR settings would be calculated on a "synthetic" basis through the end of 2022 and the most widely used tenors of U.S. dollar LIBOR will continue until mid-2023. As a result, it is anticipated that the remaining LIBOR settings will be discontinued or will no longer be sufficiently robust to be representative of its underlying market around that time. Various financial industry groups will plan for that transition and certain regulators and industry groups have taken actions to establish alternative reference rates (e.g., the Secured Overnight Financing Rate, which measures the cost of overnight borrowings through repurchase agreement transactions collateralized with U.S. Treasury securities and is intended to replace U.S. dollar LIBOR with certain adjustments). However, there are challenges to converting certain contracts and transactions to a new benchmark and neither the full effects of the transition process nor its ultimate outcome is known.
The elimination of LIBOR or changes to other reference rates or any other changes or reforms to the determination or supervision of reference rates could have an adverse impact on the market for, or value of, any securities or payments linked to those reference rates, which may adversely affect the Fund's performance and/or net asset value. Uncertainty and risk also remain regarding the willingness and ability of issuers and lenders to include enhanced provisions in new and existing contracts or instruments. Consequently, the transition away from LIBOR to other reference rates may lead to increased volatility and illiquidity in markets that are tied to LIBOR, fluctuations in values of LIBOR-related investments or investments in issuers that utilize LIBOR, increased difficulty in borrowing or refinancing and diminished effectiveness of hedging strategies, adversely affecting the Fund's performance. Furthermore, the risks associated with the expected discontinuation of LIBOR and transition may be exacerbated if the work necessary to effect an orderly transition to an alternative reference rate is not completed in a timely manner. While the transition away from LIBOR has already begun with no material adverse effect to the Fund's performance, the transition is expected to last through mid-2023 for some LIBOR tenors. The usefulness of LIBOR as a benchmark could deteriorate anytime during this transition period.
(O) Indemnifications. Under the Trust’s organizational documents, its officers and trustees are indemnified against certain liabilities that may arise out of performance of their duties to the Trust. Additionally, in the normal course of business, the Fund enters into contracts with third-party service providers that contain a variety of representations and warranties and that may provide general indemnifications. The Fund's maximum exposure under these arrangements is unknown, as this would involve future claims that may be made against the Fund that have not yet occurred. The Manager believes that the risk of loss in connection with these potential indemnification obligations is remote. However, there can be no assurance that material liabilities related to such obligations will not arise in the future, which could adversely impact the Fund.
Note 3–Fees and Related Party Transactions
(A) Manager and Subadvisor. New York Life Investments, a registered investment adviser and an indirect, wholly-owned subsidiary of New York Life Insurance Company ("New York Life"), serves as the Fund's Manager pursuant to an Amended and Restated Management Agreement ("Management Agreement"). The Manager provides offices, conducts clerical, recordkeeping and bookkeeping services and keeps most of the financial and accounting records required to be maintained by the Fund. Except for the portion of salaries and expenses that are the responsibility of the Fund, the Manager pays the salaries and expenses of all personnel affiliated with the Fund and certain operational expenses of the Fund. During a portion of the year ended October 31, 2022, the Fund reimbursed New York Life Investments in an amount equal to the portion of the compensation of the Chief Compliance Officer attributable to the Fund. NYL Investors LLC ("NYL Investors" or ''Subadvisor''), a registered investment adviser and a direct, wholly-owned subsidiary of New York Life, serves as the Subadvisor to the Fund and is responsible for the day-to-day portfolio management of the Fund. Pursuant to the terms of a Subadvisory Agreement ("Subadvisory Agreement") between New York Life Investments and NYL Investors, New York Life Investments pays for the services of the Subadvisor.
Pursuant to the Management Agreement, the Fund pays the Manager a monthly fee for the services performed and the facilities furnished at an annual rate of the Fund’s average daily net assets as follows: 0.60% up to $1 billion; 0.575% from $1 billion to $3 billion; and 0.565% in excess of $3 billion. During the year ended October 31, 2022, the effective management fee rate was 0.59%.
New York Life Investments has contractually agreed to waive fees and/or reimburse expenses so that Total Annual Fund Operating Expenses (excluding taxes, interest, litigation, extraordinary expenses, brokerage and other transaction expenses relating to the purchase or sale of portfolio investments, and acquired (underlying) fund fees and expenses) for Class A shares do not exceed 1.05% of the Fund’s average daily net assets. New York Life Investments will apply an equivalent waiver or reimbursement, in an equal number of basis points, to the other share classes of the Fund, except for Class R6 shares. New York Life Investments has contractually agreed to waive fees and/or reimburse
Notes to Financial Statements (continued)
expenses so that Class R6 fees and expenses do not exceed those of Class I. This agreement will remain in effect until February 28, 2023, and shall renew automatically for one-year terms unless New York Life Investments provides written notice of termination prior to the start of the next term or upon approval of the Board.
During the year ended October 31, 2022, New York Life Investments earned fees from the Fund in the amount of $13,932,570 and paid the Subadvisor in the amount of $6,966,285.
JPMorgan Chase Bank, N.A. ("JPMorgan") provides sub-administration and sub-accounting services to the Fund pursuant to an agreement with New York Life Investments. These services include calculating the daily NAVs of the Fund, maintaining the general ledger and sub-ledger accounts for the calculation of the Fund's NAVs, and assisting New York Life Investments in conducting various aspects of the Fund's administrative operations. For providing these services to the Fund, JPMorgan is compensated by New York Life Investments.
Pursuant to an agreement between the Trust and New York Life Investments, New York Life Investments is responsible for providing or procuring certain regulatory reporting services for the Fund. The Fund will reimburse New York Life Investments for the actual costs incurred by New York Life Investments in connection with providing or procuring these services for the Fund.
(B) Distribution and Service Fees. The Trust, on behalf of the Fund, has entered into a distribution agreement with NYLIFE Distributors LLC (the “Distributor”), an affiliate of New York Life Investments. The Fund has adopted distribution plans (the “Plans”) in accordance with the provisions of Rule 12b-1 under the 1940 Act.
Pursuant to the Class A and Investor Class Plans, the Distributor receives a monthly fee from the Class A and Investor Class shares at an annual rate of 0.25% of the average daily net assets of the Class A and Investor Class shares for distribution and/or service activities as designated by the Distributor. Pursuant to the Class B and Class C Plans, the Distributor receives a monthly distribution fee at an annual rate of 0.75% of the average daily net assets of the Class B and Class C shares, along with a service fee at an annual rate of 0.25% of the average daily net assets of the Class B and Class C shares, for a total 12b-1 fee of 1.00%. Pursuant to the Class R3 and SIMPLE Class shares Plans, Class R3 and SIMPLE Class shares pay the Distributor a monthly distribution fee at an annual rate of 0.25% of the average daily net assets of the Class R3 and SIMPLE Class shares, along with a service fee at an annual rate of 0.25% of the average daily net assets of the Class R3 and SIMPLE Class shares, for a total 12b-1 fee of 0.50%. Class I and Class R6 shares are not subject to a distribution and/or service fee.
The Plans provide that the distribution and service fees are payable to the Distributor regardless of the amounts actually expended by the Distributor for distribution of the Fund's shares and service activities.
In accordance with the Shareholder Services Plans for the Class R3 shares, the Manager has agreed to provide, through its affiliates or
independent third parties, various shareholder and administrative support services to shareholders of the Class R3 shares. For its services, the Manager, its affiliates or independent third-party service providers are entitled to a shareholder service fee accrued daily and paid monthly at an annual rate of 0.10% of the average daily net assets of the Class R3 shares. This is in addition to any fees paid under the Class R3 Plan.
During the year ended October 31, 2022, shareholder service fees incurred by the Fund were as follows:
(C) Sales Charges. The Fund was advised by the Distributor that the amount of initial sales charges retained on sales of Class A and Investor Class shares during the year ended October 31, 2022, were $40,152 and $1,583, respectively.
The Fund was also advised that the Distributor retained CDSCs on redemptions of Class A, Investor Class, Class B and Class C shares during the year ended October 31, 2022, of $240,221, $29, $238 and $14,414, respectively.
(D) Transfer, Dividend Disbursing and Shareholder Servicing Agent. NYLIM Service Company LLC, an affiliate of New York Life Investments, is the Fund's transfer, dividend disbursing and shareholder servicing agent pursuant to an agreement between NYLIM Service Company LLC and the Trust. NYLIM Service Company LLC has entered into an agreement with DST Asset Manager Solutions, Inc. ("DST"), pursuant to which DST performs certain transfer agent services on behalf of NYLIM Service Company LLC. New York Life Investments has contractually agreed to limit the transfer agency expenses charged to the Fund’s share classes to a maximum of 0.35% of that share class’s average daily net assets on an annual basis after deducting any applicable Fund or class-level expense reimbursement or small account fees. This agreement will remain in effect until February 28, 2023, and shall renew automatically for one-year terms unless New York Life Investments provides written notice of termination prior to the start of the next term or upon approval of the Board. During the year ended October 31, 2022, transfer agent expenses incurred by the Fund and any reimbursements, pursuant to the aforementioned Transfer Agency expense limitation agreement, were as follows:
| Class | Expense | Waived |
| Class A | $ 566,180 | $— |
| Investor Class | 37,076 | — |
| Class B | 1,446 | — |
| Class C | 115,895 | — |
| Class I | 1,640,141 | — |
| Class R3 | 840 | — |
| Class R6 | 15,003 | — |
| SIMPLE Class | 52 | — |
| 52 | MainStay Floating Rate Fund |
(E) Small Account Fee. Shareholders with small accounts adversely impact the cost of providing transfer agency services. In an effort to reduce total transfer agency expenses, the Fund has implemented a small account fee on certain types of accounts. As described in the Fund's prospectus, certain shareholders with an account balance of less than $1,000 ($5,000 for Class A share accounts) are charged an annual per account fee of $20 (assessed semi-annually), the proceeds from which offset transfer agent fees as reflected in the Statement of Operations. This small account fee will not apply to certain types of accounts as described further in the Fund’s prospectus.
(F) Capital. As of October 31, 2022, New York Life and its affiliates beneficially held shares of the Fund with the values and percentages of net assets as follows:
| Class R6 | $26,812 | 0.0%‡ |
| SIMPLE Class | 25,627 | 99.5 |
| ‡ | Less than one-tenth of a percent. |
Note 4-Federal Income Tax
As of October 31, 2022, the cost and unrealized appreciation (depreciation) of the Fund’s investment portfolio, including applicable derivative contracts and other financial instruments, as determined on a federal income tax basis, were as follows:
| | Federal Tax
Cost | Gross
Unrealized
Appreciation | Gross
Unrealized
(Depreciation) | Net
Unrealized
Appreciation/
(Depreciation) |
| Investments in Securities | $2,345,218,769 | $1,735,586 | $(154,541,911) | $(152,806,325) |
As of October 31, 2022, the components of accumulated gain (loss) on a tax basis were as follows:
Ordinary
income | Accumulated
Capital
and Other
Gain (Loss) | Other
Temporary
Differences | Unrealized
Appreciation
(Depreciation) | Total
Accumulated
Gain (Loss) |
| $2,554,419 | $(118,513,403) | $(2,555,843) | $(153,036,628) | $(271,551,455) |
The difference between book-basis and tax-basis unrealized appreciation (depreciation) is primarily due to cumulative bond amortization and wash sale adjustments. The other temporary differences are primarily due to interest accruals on defaulted securities and dividends payable.
The following table discloses the current year reclassifications between total distributable earnings (loss) and additional paid-in capital arising from permanent differences; net assets as of October 31, 2022 were not affected.
| | Total
Distributable
Earnings (Loss) | Additional
Paid-In
Capital |
| | $113,574 | $(113,574) |
The reclassifications for the Fund are primarily due to partnership adjustments and excise taxes paid.
As of October 31, 2022, for federal income tax purposes, capital loss carryforwards of $118,513,403, as shown in the table below, were available to the extent provided by the regulations to offset future realized gains of the Fund. Accordingly, no capital gains distributions are expected to be paid to shareholders until net gains have been realized in excess of such amounts.
Capital Loss
Available Through | Short-Term
Capital Loss
Amounts (000’s) | Long-Term
Capital Loss
Amounts (000’s) |
| Unlimited | $23,446 | $95,067 |
During the years ended October 31, 2022 and October 31, 2021, the tax character of distributions paid as reflected in the Statements of Changes in Net Assets was as follows:
| | 2022 | 2021 |
| Distributions paid from: | | |
| Ordinary Income | $93,239,421 | $42,312,089 |
Note 5–Commitments and Contingencies
As of October 31, 2022, the Fund had unfunded commitments pursuant to the following loan agreements:
| Borrower | Unfunded
Commitments | Unrealized
Appreciation/
(Depreciation) |
athenahealth Group, Inc.,
Initial Delayed Draw Term Loan
3.50%, due 2/15/29 | $1,248,893 | $(118,602) |
Hillman Group, Inc. (The),
Initial Delayed Draw Term Loan
2.75%, due 7/14/28 | 345,474 | (16,832) |
Medical Solutions Holdings, Inc.,
First Lien Delayed Draw Term Loan
3.50%, due 11/1/28 | 273,098 | (9,368) |
Osmosis Buyer Ltd.,
Delayed Draw Term Loan
TBD, due 7/31/28 | 688,333 | (52,407) |
Pediatric Associates Holding Co. LLC,
Amendment No. 1 Incremental Delayed Draw Term Loan
3.25%, due 12/29/28 | 404,967 | (14,972) |
Trident TPI Holdings, Inc.,
Tranche Delayed Draw Term Loan B3
4.00%, due 9/15/28 | 164,946 | (9,337) |
| Total | $3,125,711 | $(221,518) |
Commitments are available until maturity date.
Notes to Financial Statements (continued)
Note 6–Custodian
JPMorgan is the custodian of cash and securities held by the Fund. Custodial fees are charged to the Fund based on the Fund's net assets and/or the market value of securities held by the Fund and the number of certain transactions incurred by the Fund.
Note 7–Line of Credit
The Fund and certain other funds managed by New York Life Investments maintain a line of credit with a syndicate of banks in order to secure a source of funds for temporary purposes to meet unanticipated or excessive redemption requests.
Effective July 26, 2022, under the credit agreement (the “Credit Agreement”), the aggregate commitment amount is $600,000,000 with an additional uncommitted amount of $100,000,000. The commitment fee is an annual rate of 0.15% of the average commitment amount payable quarterly, regardless of usage, to JPMorgan, who serves as the agent to the syndicate. The commitment fee is allocated among the Fund and certain other funds managed by New York Life Investments based upon their respective net assets and other factors. Interest on any revolving credit loan is charged based upon the Federal Funds Rate, Daily Simple Secured Overnight Financing Rate ("SOFR") + 0.10%, or the Overnight Bank Funding Rate, whichever is higher. The Credit Agreement expires on July 25, 2023, although the Fund, certain other funds managed by New York Life Investments and the syndicate of banks may renew the Credit Agreement for an additional year on the same or different terms or enter into a credit agreement with a different syndicate of banks. Prior to July 26, 2022, the aggregate commitment amount and the commitment fee were the same as those under the current Credit Agreement. During the year ended October 31, 2022, there were no borrowings made or outstanding with respect to the Fund under the Credit Agreement.
Note 8–Interfund Lending Program
Pursuant to an exemptive order issued by the SEC, the Fund, along with certain other funds managed by New York Life Investments, may participate in an interfund lending program. The interfund lending program provides an alternative credit facility that permits the Fund and certain other funds managed by New York Life Investments to lend or borrow money for temporary purposes directly to or from one another, subject to the conditions of the exemptive order. During the year ended October 31, 2022, there were no interfund loans made or outstanding with respect to the Fund.
Note 9–Purchases and Sales of Securities (in 000’s)
During the year ended October 31, 2022, purchases and sales of securities, other than short-term securities, were $898,256 and $608,272, respectively.
Note 10–Capital Share Transactions
Transactions in capital shares for the years ended October 31, 2022 and October 31, 2021, were as follows:
| Class A | Shares | Amount |
| Year ended October 31, 2022: | | |
| Shares sold | 35,322,150 | $ 315,191,998 |
| Shares issued to shareholders in reinvestment of distributions | 1,953,269 | 17,079,210 |
| Shares redeemed | (21,176,272) | (186,216,536) |
| Net increase (decrease) in shares outstanding before conversion | 16,099,147 | 146,054,672 |
| Shares converted into Class A (See Note 1) | 529,231 | 4,710,199 |
| Shares converted from Class A (See Note 1) | (42,046) | (372,281) |
| Net increase (decrease) | 16,586,332 | $ 150,392,590 |
| Year ended October 31, 2021: | | |
| Shares sold | 19,130,520 | $ 174,474,811 |
| Shares issued to shareholders in reinvestment of distributions | 887,554 | 8,087,241 |
| Shares redeemed | (8,690,176) | (79,145,455) |
| Net increase (decrease) in shares outstanding before conversion | 11,327,898 | 103,416,597 |
| Shares converted into Class A (See Note 1) | 634,834 | 5,784,533 |
| Shares converted from Class A (See Note 1) | (45,793) | (417,965) |
| Net increase (decrease) | 11,916,939 | $ 108,783,165 |
| |
| 54 | MainStay Floating Rate Fund |
| Investor Class | Shares | Amount |
| Year ended October 31, 2022: | | |
| Shares sold | 496,359 | $ 4,443,739 |
| Shares issued to shareholders in reinvestment of distributions | 75,245 | 659,414 |
| Shares redeemed | (329,433) | (2,911,023) |
| Net increase (decrease) in shares outstanding before conversion | 242,171 | 2,192,130 |
| Shares converted into Investor Class (See Note 1) | 64,918 | 575,033 |
| Shares converted from Investor Class (See Note 1) | (337,925) | (3,027,893) |
| Net increase (decrease) | (30,836) | $ (260,730) |
| Year ended October 31, 2021: | | |
| Shares sold | 200,028 | $ 1,823,959 |
| Shares issued to shareholders in reinvestment of distributions | 54,913 | 500,217 |
| Shares redeemed | (307,461) | (2,798,762) |
| Net increase (decrease) in shares outstanding before conversion | (52,520) | (474,586) |
| Shares converted into Investor Class (See Note 1) | 137,170 | 1,250,762 |
| Shares converted from Investor Class (See Note 1) | (295,804) | (2,693,975) |
| Net increase (decrease) | (211,154) | $ (1,917,799) |
| |
| Class B | Shares | Amount |
| Year ended October 31, 2022: | | |
| Shares sold | 15,256 | $ 135,583 |
| Shares issued to shareholders in reinvestment of distributions | 1,635 | 14,353 |
| Shares redeemed | (28,245) | (250,015) |
| Net increase (decrease) in shares outstanding before conversion | (11,354) | (100,079) |
| Shares converted from Class B (See Note 1) | (22,634) | (200,602) |
| Net increase (decrease) | (33,988) | $ (300,681) |
| Year ended October 31, 2021: | | |
| Shares sold | 9,395 | $ 85,777 |
| Shares issued to shareholders in reinvestment of distributions | 1,661 | 15,130 |
| Shares redeemed | (58,224) | (529,413) |
| Net increase (decrease) in shares outstanding before conversion | (47,168) | (428,506) |
| Shares converted from Class B (See Note 1) | (33,720) | (307,007) |
| Net increase (decrease) | (80,888) | $ (735,513) |
| |
| Class C | Shares | Amount |
| Year ended October 31, 2022: | | |
| Shares sold | 3,237,524 | $ 29,019,142 |
| Shares issued to shareholders in reinvestment of distributions | 184,730 | 1,614,748 |
| Shares redeemed | (2,369,536) | (20,786,152) |
| Net increase (decrease) in shares outstanding before conversion | 1,052,718 | 9,847,738 |
| Shares converted from Class C (See Note 1) | (171,884) | (1,522,009) |
| Net increase (decrease) | 880,834 | $ 8,325,729 |
| Year ended October 31, 2021: | | |
| Shares sold | 2,111,531 | $ 19,264,168 |
| Shares issued to shareholders in reinvestment of distributions | 102,737 | 936,012 |
| Shares redeemed | (2,269,084) | (20,671,775) |
| Net increase (decrease) in shares outstanding before conversion | (54,816) | (471,595) |
| Shares converted from Class C (See Note 1) | (430,562) | (3,925,910) |
| Net increase (decrease) | (485,378) | $ (4,397,505) |
| |
| Class I | Shares | Amount |
| Year ended October 31, 2022: | | |
| Shares sold | 130,993,383 | $ 1,172,562,445 |
| Shares issued to shareholders in reinvestment of distributions | 5,028,139 | 44,069,454 |
| Shares redeemed | (115,362,508) | (1,009,434,495) |
| Net increase (decrease) in shares outstanding before conversion | 20,659,014 | 207,197,404 |
| Shares converted into Class I (See Note 1) | 40,608 | 359,148 |
| Shares converted from Class I (See Note 1) | (5,009) | (42,826) |
| Net increase (decrease) | 20,694,613 | $ 207,513,726 |
| Year ended October 31, 2021: | | |
| Shares sold | 106,428,988 | $ 971,333,702 |
| Shares issued to shareholders in reinvestment of distributions | 2,220,304 | 20,243,944 |
| Shares redeemed | (29,129,683) | (265,438,036) |
| Net increase (decrease) in shares outstanding before conversion | 79,519,609 | 726,139,610 |
| Shares converted into Class I (See Note 1) | 45,818 | 418,205 |
| Net increase (decrease) | 79,565,427 | $ 726,557,815 |
| |
Notes to Financial Statements (continued)
| Class R3 | Shares | Amount |
| Year ended October 31, 2022: | | |
| Shares sold | 29,390 | $ 264,271 |
| Shares issued to shareholders in reinvestment of distributions | 1,663 | 14,553 |
| Shares redeemed | (11,770) | (103,249) |
| Net increase (decrease) | 19,283 | $ 175,575 |
| Year ended October 31, 2021: | | |
| Shares sold | 28,824 | $ 262,708 |
| Shares issued to shareholders in reinvestment of distributions | 1,061 | 9,671 |
| Shares redeemed | (21,196) | (193,454) |
| Net increase (decrease) | 8,689 | $ 78,925 |
| |
| Class R6 | Shares | Amount |
| Year ended October 31, 2022: | | |
| Shares sold | 12,396,571 | $ 111,206,027 |
| Shares issued to shareholders in reinvestment of distributions | 1,732,416 | 15,202,017 |
| Shares redeemed | (15,392,660) | (134,934,458) |
| Net increase (decrease) in shares outstanding before conversion | (1,263,673) | (8,526,414) |
| Shares converted from Class R6 (See Note 1) | (55,146) | (478,769) |
| Net increase (decrease) | (1,318,819) | $ (9,005,183) |
| Year ended October 31, 2021: | | |
| Shares sold | 30,049,408 | $ 274,180,812 |
| Shares issued to shareholders in reinvestment of distributions | 824,900 | 7,524,282 |
| Shares redeemed | (4,323,892) | (39,409,173) |
| Net increase (decrease) in shares outstanding before conversion | 26,550,416 | 242,295,921 |
| Shares converted from Class R6 (See Note 1) | (11,900) | (108,643) |
| Net increase (decrease) | 26,538,516 | $ 242,187,278 |
| |
| SIMPLE Class | Shares | Amount |
| Year ended October 31, 2022: | | |
| Shares issued to shareholders in reinvestment of distributions | 102 | $ 887 |
| Net increase (decrease) | 102 | $ 887 |
| Year ended October 31, 2021: | | |
| Shares issued to shareholders in reinvestment of distributions | 66 | $ 603 |
| Net increase (decrease) | 66 | $ 603 |
Note 11–Other Matters
As of the date of this report, interest rates in the United States and many parts of the world, including certain European countries, are ascending from historically low levels. Thus, the Fund currently faces a heightened level of risk associated with rising interest rates. This could be driven by a variety of factors, including but not limited to central bank monetary
policies, changing inflation or real growth rates, general economic conditions, increasing bond issuances or reduced market demand for low yielding investments.
An outbreak of COVID-19, first detected in December 2019, has developed into a global pandemic and has resulted in travel restrictions, closure of international borders, certain businesses and securities markets, restrictions on securities trading activities, prolonged quarantines, supply chain disruptions, and lower consumer demand, as well as general concern and uncertainty. In 2022, many countries lifted some or all restrictions related to COVID-19. However, the continued impact of COVID-19 and related variants is uncertain and could further adversely affect the global economy, national economies, individual issuers and capital markets in unforeseeable ways and result in a substantial and extended economic downturn. Developments that disrupt global economies and financial markets, such as COVID-19, may magnify factors that affect the Fund's performance.
Note 12–Subsequent Events
In connection with the preparation of the financial statements of the Fund as of and for the year ended October 31, 2022, events and transactions subsequent to October 31, 2022, through the date the financial statements were issued have been evaluated by the Manager for possible adjustment and/or disclosure. No subsequent events requiring financial statement adjustment or disclosure have been identified.
| 56 | MainStay Floating Rate Fund |
Report of Independent Registered Public Accounting Firm
To the Shareholders of the Fund and Board of Trustees
MainStay Funds Trust:
Opinion on the Financial Statements
We have audited the accompanying statement of assets and liabilities of MainStay Floating Rate Fund (the Fund), one of the funds constituting MainStay Funds Trust, including the portfolio of investments, as of October 31, 2022, the related statement of operations for the year then ended, the statements of changes in net assets for each of the years in the two-year period then ended, and the related notes (collectively, the financial statements) and the financial highlights for each of the years or periods in the five-year period then ended. In our opinion, the financial statements and financial highlights present fairly, in all material respects, the financial position of the Fund as of October 31, 2022, the results of its operations for the year then ended, the changes in its net assets for each of the years in the two-year period then ended, and the financial highlights for each of the years or periods in the five-year period then ended, in conformity with U.S. generally accepted accounting principles.
Basis for Opinion
These financial statements and financial highlights are the responsibility of the Fund's management. Our responsibility is to express an opinion on these financial statements and financial highlights based on our audits. We are a public accounting firm registered with the Public Company Accounting Oversight Board (United States) (PCAOB) and are required to be independent with respect to the Fund in accordance with the U.S. federal securities laws and the applicable rules and regulations of the Securities and Exchange Commission and the PCAOB.
We conducted our audits in accordance with the standards of the PCAOB. Those standards require that we plan and perform the audit to obtain reasonable assurance about whether the financial statements and financial highlights are free of material misstatement, whether due to error or fraud. Our audits included performing procedures to assess the risks of material misstatement of the financial statements and financial highlights, whether due to error or fraud, and performing procedures that respond to those risks. Such procedures included examining, on a test basis, evidence regarding the amounts and disclosures in the financial statements and financial highlights. Such procedures also included confirmation of securities owned as of October 31, 2022, by correspondence with custodians, agent banks and brokers; when replies were not received from agent banks and brokers, we performed other auditing procedures. Our audits also included evaluating the accounting principles used and significant estimates made by management, as well as evaluating the overall presentation of the financial statements and financial highlights. We believe that our audits provide a reasonable basis for our opinion.

We have served as the auditor of one or more New York Life Investment Management investment companies since 2003.
Philadelphia, Pennsylvania
December 23, 2022
Federal Income Tax Information
(Unaudited)
The Fund is required under the Internal Revenue Code to advise shareholders in a written statement as to the federal tax status of dividends paid by the Fund during such fiscal years.
In February 2023, shareholders will receive an IRS Form 1099-DIV or substitute Form 1099, which will show the federal tax status of the distributions received by shareholders in calendar year 2022. The amounts that will be reported on such 1099-DIV or substitute Form 1099 will be the amounts you are to use on your federal income tax return and will differ from the amounts which we must report for the Fund's fiscal year ended October 31, 2022.
Proxy Voting Policies and Procedures and Proxy Voting Record
The Fund is required to file with the SEC its proxy voting record for the 12-month period ending June 30 on Form N-PX. A description of the policies and procedures that are used to vote proxies relating to portfolio securities of the Fund is available free of charge upon request by calling 800-624-6782 or visiting the SEC’s website at www.sec.gov. The most recent Form N-PX or proxy voting record is available free of charge upon request by calling 800-624-6782; visiting newyorklifeinvestments.com; or visiting the SEC’s website at www.sec.gov.
Shareholder Reports and Quarterly Portfolio Disclosure
The Fund is required to file its complete schedule of portfolio holdings with the SEC 60 days after its first and third fiscal quarter on Form N-PORT. The Fund's holdings report is available free of charge upon request by calling New York Life Investments at 800-624-6782.
| 58 | MainStay Floating Rate Fund |
Board of Trustees and Officers (Unaudited)
The Trustees and officers of the Fund are listed below. The Board oversees the MainStay Group of Funds (which consists of MainStay Funds and MainStay Funds Trust), MainStay VP Funds Trust, MainStay MacKay DefinedTerm Municipal Opportunities Fund, MainStay CBRE Global Infrastructure Megatrends Fund, the Manager and the Subadvisors, and elects the officers of the Funds who are responsible for the day-to-day operations of the Fund. Information pertaining to the Trustees and officers is set forth below. Each Trustee serves until his or her successor is
elected and qualified or until his or her resignation, death or removal. Under the Board’s retirement policy, unless an exception is made, a Trustee must tender his or her resignation by the end of the calendar year during which he or she reaches the age of 75. The business address of each Trustee and officer listed below is 51 Madison Avenue, New York, New York 10010. None of the Trustees are “interested persons” (as defined by the 1940 Act and rules adopted by the SEC thereunder) of the Fund (“Independent Trustees”).
| | Name and
Year of Birth | Term of Office,
Position(s) Held and
Length of Service | Principal Occupation(s)
During Past Five Years | Number of
Portfolios in
Fund Complex
Overseen by
Trustee | Other Directorships
Held by Trustee |
| | | | | | |
| | David H. Chow
1957 | MainStay Funds: Trustee since 2016, Advisory Board Member (June 2015 to December 2015);MainStay Funds Trust:
Trustee since January 2016, Advisory Board Member (June 2015 to December 2015) | Founder and CEO, DanCourt Management, LLC since 1999 | 78 | MainStay VP Funds Trust: Trustee since January 2016, Advisory Board Member (June 2015 to December 2015) (31 portfolios);
MainStay MacKay DefinedTerm Municipal Opportunities Fund: Trustee since January 2016, Advisory Board Member (June 2015 to December 2015);
MainStay CBRE Global Infrastructure Megatrends Fund: Trustee since June 2021; VanEck Vectors Group of Exchange-Traded Funds: Independent Chairman of the Board of Trustees since 2008 and Trustee since 2006 (56 portfolios); and Berea College of Kentucky: Trustee since 2009, Chair of the Investment Committee since 2018 |
| | Susan B. Kerley
1951 | MainStay Funds: Chairman since 2017 and Trustee since 2007;MainStay Funds Trust:
Chairman since 2017 and Trustee since 1990** | President, Strategic Management Advisors LLC since 1990 | 78 | MainStay VP Funds Trust: Chairman since January 2017 and Trustee since 2007 (31 portfolios)**;
MainStay MacKay DefinedTerm Municipal Opportunities Fund: Chairman since 2017 and Trustee since 2011;
MainStay CBRE Global Infrastructure Megatrends Fund: Trustee since June 2021; and Legg Mason Partners Funds: Trustee since 1991 (45 portfolios) |
| | Alan R. Latshaw
1951 | MainStay Funds: Trustee since 2006;MainStay Funds Trust:
Trustee since 2007*** | Retired; Partner, Ernst & Young LLP (2002 to 2003); Partner, Arthur Andersen LLP (1989 to 2002); Consultant to the MainStay Funds Audit and Compliance Committee (2004 to 2006) | 78 | MainStay VP Funds Trust: Trustee since 2007 (31 portfolios)**;
MainStay MacKay DefinedTerm Municipal Opportunities Fund: Trustee since 2011; and
MainStay CBRE Global Infrastructure Megatrends Fund: Trustee since June 2021 |
Board of Trustees and Officers (Unaudited) (continued)
| | Name and
Year of Birth | Term of Office,
Position(s) Held and
Length of Service | Principal Occupation(s)
During Past Five Years | Number of
Portfolios in
Fund Complex
Overseen by
Trustee | Other Directorships
Held by Trustee |
| | | | | | |
| | Karen Hammond
1956 | MainStay Funds: Trustee since December 2021, Advisory Board Member (June 2021 to December 2021);MainStay Funds Trust:
Trustee since December 2021, Advisory Board Member (June 2021 to December 2021)
| Retired, Managing Director, Devonshire Investors (2007 to 2013); Senior Vice President, Fidelity Management & Research Co. (2005 to 2007); Senior Vice President and Corporate Treasurer, FMR Corp. (2003 to 2005); Chief Operating Officer, Fidelity Investments Japan (2001 to 2003) | 78 | MainStay VP Funds Trust: Trustee since December 2021, Advisory Board Member (June 2021 to December 2021) (31 Portfolios);
MainStay MacKay DefinedTerm Municipal Opportunities Fund: Trustee since December 2021, Advisory Board Member (June 2021 to December 2021);
MainStay CBRE Global Infrastructure Megatrends Fund: Trustee since December 2021, Advisory Board Member (June 2021 to December 2021);
Two Harbors Investment Corp.: Director since 2018;
Rhode Island State Investment Commission: Member since 2017; and
Blue Cross Blue Shield of Rhode Island: Director since 2019 |
| | Jacques P. Perold
1958 | MainStay Funds: Trustee since 2016, Advisory Board Member (June 2015 toDecember 2015);MainStay Funds Trust:
Trustee since January 2016, Advisory Board Member (June 2015 to December 2015) | Founder and Chief Executive Officer, CapShift Advisors LLC (since 2018); President, Fidelity Management & Research Company (2009 to 2014); President and Chief Investment Officer, Geode Capital Management, LLC (2001 to 2009) | 78 | MainStay VP Funds Trust: Trustee since January 2016, Advisory Board Member (June 2015 to December 2015) (31 portfolios);
MainStay MacKay DefinedTerm Municipal Opportunities Fund: Trustee since January 2016, Advisory Board Member (June 2015 to December 2015);
MainStay CBRE Global Infrastructure Megatrends Fund: Trustee since June 2021; Partners in Health: Trustee since 2019; Allstate Corporation: Director since 2015; and MSCI Inc.: Director since 2017 |
| | Richard S. Trutanic
1952 | MainStay Funds: Trustee since 1994;MainStay Funds Trust:
Trustee since 2007*** | Chairman and Chief Executive Officer, Somerset & Company (financial advisory firm) since 2004; Managing Director, The Carlyle Group (private investment firm) (2002 to 2004); Senior Managing Director, Partner and Board Member, Groupe Arnault S.A. (private investment firm) (1999 to 2002) | 78 | MainStay VP Funds Trust: Trustee since 2007 (31 portfolios)**;
MainStay MacKay DefinedTerm Municipal Opportunities Fund: Trustee since 2011; and MainStay CBRE Global Infrastructure Megatrends Fund: Trustee since June 2021 |
| ** | Includes prior service as a Director of MainStay VP Series Fund, Inc., the predecessor to MainStay VP Funds Trust. |
| *** | Includes prior service as a Director/Trustee of certain predecessor entities to MainStay Funds Trust. |
| 60 | MainStay Floating Rate Fund |
| | Name and
Year of Birth | Position(s) Held and
Length of Service | Principal Occupation(s)
During Past Five Years | |
| | | | | |
| | Kirk C. Lehneis
1974 | President, MainStay Funds, MainStay Funds Trust since 2017 | Chief Operating Officer and Senior Managing Director (since 2016), New York Life Investment Management LLC and New York Life Investment Management Holdings LLC; Member of the Board of Managers (since 2017) and Senior Managing Director (since 2018), NYLIFE Distributors LLC; Chairman of the Board and Senior Managing Director, NYLIM Service Company LLC (since 2017); Trustee, President and Principal Executive Officer of IndexIQ Trust, IndexIQ ETF Trust and IndexIQ Active ETF Trust (since January 2018); President, MainStay CBRE Global Infrastructure Megatrends Fund (since 2021), MainStay MacKay DefinedTerm Municipal Opportunities Fund and MainStay VP Funds Trust (since 2017); Senior Managing Director, Global Product Development (From 2015-2016); Managing Director, Product Development (2010 to 2015), New York Life Investment Management LLC | |
| | Jack R. Benintende
1964 | Treasurer and Principal Financial and Accounting Officer, MainStay Funds (since 2007), MainStay Funds Trust (since 2009) | Managing Director, New York Life Investment Management LLC (since 2007); Treasurer and Principal Financial and Accounting Officer, MainStay CBRE Global Infrastructure Megatrends Fund (since 2021), MainStay MacKay DefinedTerm Municipal Opportunities Fund (since 2011) and MainStay VP Funds Trust (since 2007)** and Assistant Treasurer, New York Life Investment Management Holdings LLC (2008 to 2012) | |
| | J. Kevin Gao
1967 | Secretary and Chief Legal Officer, MainStay Funds and MainStay Funds Trust (since 2010) | Managing Director and Associate General Counsel, New York Life Investment Management LLC (since 2010); Secretary and Chief Legal Officer and MainStay CBRE Global Infrastructure Megatrends Fund (since 2021), MainStay MacKay DefinedTerm Municipal Opportunities Fund (since 2011) and MainStay VP Funds Trust (since 2010)** | |
| | Scott T. Harrington
1959 | Vice President— Administration, MainStay Funds (since 2009), MainStay Funds Trust (since 2009) | Managing Director, New York Life Investment Management LLC (including predecessor advisory organizations) (since 2000); Member of the Board of Directors, New York Life Trust Company (since 2009); Vice President—Administration, MainStay CBRE Global Infrastructure Megatrends Fund (since 2021), MainStay MacKay DefinedTerm Municipal Opportunities Fund (since 2011) and MainStay VP Funds Trust (since 2005)** | |
| | Kevin M. Gleason
1967 | Vice President and Chief Compliance Officer, MainStay Funds and MainStay Funds Trust (since June 2022) | Vice President and Chief Compliance Officer, IndexIQ, IndexIQ ETF Trust and Index IQ Active ETF Trust (since June 2022); Vice President and Chief Compliance Officer, MainStay CBRE Global Infrastructure Megatrends Fund, MainStay VP Funds Trust and MainStay MacKay DefinedTerm Municipal Opportunities Fund (since June 2022); Senior Vice President, Voya Investment Management and Chief Compliance Officer, Voya Family of Funds (2012-2022) | |
| * | The officers listed above are considered to be “interested persons” of the MainStay Group of Funds, MainStay VP Funds Trust, MainStay CBRE Global Infrastructure Megatrends Fund and MainStay MacKay DefinedTerm Municipal Opportunities Fund within the meaning of the 1940 Act because of their affiliation with the MainStay Group of Funds, New York Life Insurance Company and/or its affiliates, including New York Life Investment Management LLC, NYLIM Service Company LLC, NYLIFE Securities LLC and/or NYLIFE Distributors LLC, as described in detail in the column captioned “Principal Occupation(s) During Past Five Years.” Officers are elected annually by the Board. |
| ** | Includes prior service as an Officer of MainStay VP Series Fund, Inc., the predecessor to MainStay VP Funds Trust. |
Officers of the Trust (Who are not Trustees)*
This page intentionally left blank.
Equity
U.S. Equity
MainStay Epoch U.S. Equity Yield Fund
MainStay S&P 500 Index Fund1
MainStay Winslow Large Cap Growth Fund
MainStay WMC Enduring Capital Fund
MainStay WMC Growth Fund
MainStay WMC Small Companies Fund
MainStay WMC Value Fund
International Equity
MainStay Epoch International Choice Fund
MainStay MacKay International Equity Fund
MainStay WMC International Research Equity Fund
Emerging Markets Equity
MainStay Candriam Emerging Markets Equity Fund
Global Equity
MainStay Epoch Capital Growth Fund
MainStay Epoch Global Equity Yield Fund
Fixed Income
Taxable Income
MainStay Candriam Emerging Markets Debt Fund
MainStay Floating Rate Fund
MainStay MacKay High Yield Corporate Bond Fund
MainStay MacKay Short Duration High Yield Fund
MainStay MacKay Strategic Bond Fund
MainStay MacKay Total Return Bond Fund
MainStay MacKay U.S. Infrastructure Bond Fund
MainStay Short Term Bond Fund
Tax-Exempt Income
MainStay MacKay California Tax Free Opportunities Fund2
MainStay MacKay High Yield Municipal Bond Fund
MainStay MacKay New York Tax Free Opportunities Fund3
MainStay MacKay Short Term Municipal Fund
MainStay MacKay Strategic Municipal Allocation Fund
MainStay MacKay Tax Free Bond Fund
Money Market
MainStay Money Market Fund
Mixed Asset
MainStay Balanced Fund
MainStay Income Builder Fund
MainStay MacKay Convertible Fund
Speciality
MainStay CBRE Global Infrastructure Fund
MainStay CBRE Real Estate Fund
MainStay Cushing MLP Premier Fund
Asset Allocation
MainStay Conservative Allocation Fund
MainStay Conservative ETF Allocation Fund
MainStay Defensive ETF Allocation Fund
MainStay Equity Allocation Fund
MainStay Equity ETF Allocation Fund
MainStay ESG Multi-Asset Allocation Fund
MainStay Growth Allocation Fund
MainStay Growth ETF Allocation Fund
MainStay Moderate Allocation Fund
MainStay Moderate ETF Allocation Fund
Manager
New York Life Investment Management LLC
New York, New York
Subadvisors
Candriam4
Strassen, Luxembourg
CBRE Investment Management Listed Real Assets LLC
Radnor, Pennsylvania
Cushing Asset Management, LP
Dallas, Texas
Epoch Investment Partners, Inc.
New York, New York
MacKay Shields LLC4
New York, New York
NYL Investors LLC4
New York, New York
Wellington Management Company LLP
Boston, Massachusetts
Winslow Capital Management, LLC
Minneapolis, Minnesota
Legal Counsel
Dechert LLP
Washington, District of Columbia
Independent Registered Public Accounting Firm
KPMG LLP
Philadelphia, Pennsylvania
Distributor
NYLIFE Distributors LLC4
Jersey City, New Jersey
Custodian
JPMorgan Chase Bank, N.A.
New York, New York
1.
Prior to February 28, 2022, the Fund's name was MainStay MacKay S&P 500 Index Fund.
| 2. | This Fund is registered for sale in AZ, CA, NV, OR, TX, UT, WA and MI (Class A and Class I shares only), and CO, FL, GA, HI, ID, MA, MD, NH, NJ and NY (Class I shares only). |
| 3. | This Fund is registered for sale in CA, CT, DE, FL, MA, NJ, NY and VT. |
| 4. | An affiliate of New York Life Investment Management LLC. |
Not part of the Annual Report
For more information
800-624-6782
newyorklifeinvestments.com
“New York Life Investments” is both a service mark, and the common trade name, of certain investment advisors affiliated with New York Life Insurance Company. The MainStay Funds® are managed by New York Life Investment Management LLC and distributed by NYLIFE Distributors LLC, 30 Hudson Street, Jersey City, NJ 07302, a wholly owned subsidiary of New York Life Insurance Company. NYLIFE Distributors LLC is a Member FINRA/SIPC.
©2022 NYLIFE Distributors LLC. All rights reserved.
| 5013759.2MS229-22 | MSFR11-12/22 |
(NYLIM) NL225
MainStay MacKay California Tax Free Opportunities Fund
Message from the President and Annual Report
October 31, 2022
Sign up for e-delivery of your shareholder reports. For full details on e-delivery, including who can participate and what you can receive via e-delivery,
please log in to newyorklifeinvestments.com/accounts.
| Not FDIC/NCUA Insured | Not a Deposit | May Lose Value | No Bank Guarantee | Not Insured by Any Government Agency |
This page intentionally left blank
Message from the President
A series of economic and geopolitical challenges undermined equity and fixed-income markets during the 12-month reporting period ended October 31, 2022. Stocks and bonds alike trended lower in the face of sharply rising interest rates, increasing inflationary pressures, slowing economic growth and Russia’s invasion of Ukraine.
The reporting period began on a mixed note, with concerns about the spreading Omicron variant of the COVID-19 virus and increasingly hawkish statements from the U.S. Federal Reserve (the “Fed”) regarding mounting inflation, countered by bullish sentiment stemming from U.S. economic growth and strong corporate earnings. In January 2022, markets turned decisively negative as comments from the Fed raised the likelihood of rate hikes as early as March, and Russia issued increasingly aggressive threats toward Ukraine. The onset of Russia’s invasion in February exacerbated global inflationary pressures while increasing investor uncertainty. Domestic supply shortages, international trade imbalances and rising inflation caused GDP (gross domestic product) to contract in the first and second quarters of the year, although employment and consumer spending proved resilient. Prices for petroleum surged to multi-year highs, while many key agricultural chemicals and industrial metals climbed as well. Accelerating inflationary forces prompted the Fed to implement its most aggressive interest rate increases since the 1980s with a series of five sharp rate hikes, raising the federal funds rate from a range of 0.00% to 0.25% in March to 3.00% to 3.25% in September, with additional rate hikes expected before the end of the year. International central banks generally followed suit, raising rates by varying degrees in efforts to curb local inflation, although most increases remained significantly more modest than those in the United States. Relatively high U.S. interest rates and risk-averse international sentiment pushed U.S. dollar values higher compared to most other currencies, with the ensuing negative impact on global prices for food, fuel and other key, U.S.-dollar-denominated products.
The effects of these interrelated challenges were felt throughout U.S. and international financial markets. The S&P 500® Index, a widely regarded benchmark of U.S. market performance, declined by more than 14% during the reporting period. Although the energy sector generated strong gains, bolstered by elevated oil and gas prices, most other industry areas recorded losses. The more cyclical and growth-oriented sectors of consumer discretionary, real estate and information technology delivered the
weakest returns, while the traditionally defensive and value-oriented consumer staples, utilities and health care sectors outperformed. International stocks lagged compared to their U.S. counterparts, with some emerging markets, such as China, suffering particularly steep losses. A few markets, however, including Brazil, Mexico and the United Arab Emirates, ended the reporting period with little change. Fixed-income markets saw bond prices broadly decline as yields rose along with interest rates. Short-term yields rose faster than long-term yields, producing a yield curve inversion from July through the end of the reporting period, with long-term rates remaining below short-term rates. While floating-rate instruments, which feature variable interest rates that allow investors to benefit from a rising rate environment, provided a degree of insulation from inflation-driven trends, they were not immune to the market’s widespread declines.
While the Fed acknowledges the costs of rising rates in terms of weaker GDP growth and unsettled financial markets over the short term, its primary focus continues to be the longer-term economic impact of inflation. With the latest figures as of the date of this report showing that inflation remains above 8%, versus a target rate of just 2%, the Fed clearly has a distance yet to go, making further rate increases and market volatility more likely in the coming months. The question remains as to whether the Fed and other central banks will manage a so-called “soft landing,” curbing inflation while avoiding a persistent economic slowdown. If they prove successful, we expect that favorable inflation trends and increasingly attractive valuations in both equity and bond markets should eventually translate into sustainable improvements in the investment environment.
Whatever actions the Fed takes and however financial markets react, as a MainStay investor, you can depend on us to continue providing the insight, expertise and service that have long defined New York Life Investments. Thank you for trusting us to help you meet your investment needs.
Sincerely,
Kirk C. Lehneis
President
The opinions expressed are as of the date of this report and are subject to change. There is no guarantee that any forecast made will come to pass. This material does not constitute investment advice and is not intended as an endorsement of any specific investment. Past performance is no guarantee of future results.
Not part of the Annual Report
Investors should refer to the Fund’s Summary Prospectus and/or Prospectus and consider the Fund’s investment objectives, strategies, risks, charges and expenses carefully before investing. The Summary Prospectus and/or Prospectus contain this and other information about the Fund. You may obtain copies of the Fund’s Summary Prospectus, Prospectus and Statement of Additional Information, which includes information about the MainStay Funds Trust's Trustees, free of charge, upon request, by calling toll-free 800-624-6782, by writing to NYLIFE Distributors LLC, Attn: MainStay Marketing Department, 30 Hudson Street, Jersey City, NJ 07302 or by sending an e-mail to MainStayShareholderServices@nylim.com. These documents are also available via the MainStay Funds’ website at newyorklifeinvestments.com. Please read the Fund’s Summary Prospectus and/or Prospectus carefully before investing.
Investment and Performance Comparison (Unaudited)
Performance data quoted represents past performance. Past performance is no guarantee of future results. Because of market volatility and other factors, current performance may be lower or higher than the figures shown. Investment return and principal value will fluctuate, and as a result, when shares are redeemed, they may be worth more or less than their original cost. The graph below depicts the historical performance of Class I shares of the Fund. Performance will vary from class to class based on differences in class-specific expenses and sales charges. For performance information current to the most recent month-end, please call 800-624-6782 or visit newyorklifeinvestments.com.
The performance table and graph do not reflect the deduction of taxes that a shareholder would pay on distributions or Fund share redemptions. Total returns reflect maximum applicable sales charges as indicated in the table below, if any, changes in share price, and reinvestment of dividend and capital gain distributions. The graph assumes the initial investment amount shown below and reflects the deduction of all sales charges that would have applied for the period of investment. Performance figures may reflect certain fee waivers and/or expense limitations, without which total returns may have been lower. For more information on share classes and current fee waivers and/or expense limitations (if any), please refer to the Notes to Financial Statements.

| Average Annual Total Returns for the Year-Ended October 31, 2022 |
| Class | Sales Charge | | Inception
Date | One
Year | Five
Years | Since
Inception | Gross
Expense
Ratio1 |
| Class A Shares2 | Maximum 3% Initial Sales Charge | With sales charges | 2/28/2013 | -19.04% | -0.90% | 1.51% | 0.75% |
| | | Excluding sales charges | | -15.22 | 0.01 | 1.99 | 0.75 |
| Investor Class Shares3, 4 | Maximum 2.5% Initial Sales Charge | With sales charges | 2/28/2013 | -18.63 | -0.93 | 1.45 | 0.77 |
| | | Excluding sales charges | | -15.24 | -0.01 | 1.93 | 0.77 |
| Class C Shares | Maximum 1% CDSC | With sales charges | 2/28/2013 | -16.28 | -0.26 | 1.67 | 1.02 |
| | if Redeemed Within One Year of Purchase | Excluding sales charges | | -15.45 | -0.26 | 1.67 | 1.02 |
| Class C2 Shares | Maximum 1% CDSC | With sales charges | 8/31/2020 | -16.41 | N/A | -6.18 | 1.17 |
| | if Redeemed Within One Year of Purchase | Excluding sales charges | | -15.58 | N/A | -6.18 | 1.17 |
| Class I Shares | No Sales Charge | | 2/28/2013 | -15.01 | 0.26 | 2.25 | 0.50 |
| Class R6 Shares | No Sales Charge | | 11/1/2019 | -14.90 | N/A | -3.02 | 0.48 |
| 1. | The gross expense ratios presented reflect the Fund’s “Total Annual Fund Operating Expenses” from the most recent Prospectus, as supplemented, and may differ from other expense ratios disclosed in this report. |
| 2. | Prior to August 10, 2022, the maximum initial sales charge was 4.5%, which is reflected in the applicable average annual total return figures shown. |
| 3. | Prior to June 30, 2020, the maximum initial sales charge was 4.5%, which is reflected in the applicable average annual total return figures shown. |
| 4. | Prior to August 10, 2022, the maximum initial sales charge was 4%, which is reflected in the applicable average annual total return figures shown. |
The footnotes on the next page are an integral part of the table and graph and should be carefully read in conjunction with them.
| Benchmark Performance* | One
Year | Five
Years | Since
Inception |
| Bloomberg California Municipal Bond Index1 | -11.53% | 0.39% | 1.79% |
| Morningstar Muni California Long Category Average2 | -15.02 | -0.27 | 1.43 |
| * | Returns for indices reflect no deductions for fees, expenses or taxes, except for foreign withholding taxes where applicable. Results assume reinvestment of all dividends and capital gains. An investment cannot be made directly in an index. |
| 1. | The Bloomberg California Municipal Bond Index is the Fund's primary broad-based securities market index for comparison purposes. The Bloomberg California Municipal Bond Index is a market value weighted index of California investment grade tax exempt fixed-rate municipal bonds with maturities of one year or more. |
| 2. | The Morningstar Muni California Long Category Average is representative of funds that invest at least 80% of assets in California municipal debt. These portfolios have durations of more than 7.0 years. Results are based on average total returns of similar funds with all dividends and capital gain distributions reinvested. |
The footnotes on the preceding page are an integral part of the table and graph and should be carefully read in conjunction with them.
| 6 | MainStay MacKay California Tax Free Opportunities Fund |
Cost in Dollars of a $1,000 Investment in MainStay MacKay California Tax Free Opportunities Fund (Unaudited)
The example below is intended to describe the fees and expenses borne by shareholders during the six-month period from May 1, 2022 to October 31, 2022, and the impact of those costs on your investment.
Example
As a shareholder of the Fund you incur two types of costs: (1) transaction costs, including exchange fees and sales charges (loads) on purchases (as applicable), and (2) ongoing costs, including management fees, distribution and/or service (12b-1) fees and other Fund expenses (as applicable). This example is intended to help you understand your ongoing costs (in dollars) of investing in the Fund and to compare these costs with the ongoing costs of investing in other mutual funds. The example is based on an investment of $1,000 made at the beginning of the six-month period and held for the entire period from May 1, 2022 to October 31, 2022.
This example illustrates your Fund’s ongoing costs in two ways:
Actual Expenses
The second and third data columns in the table below provide information about actual account values and actual expenses. You may use the information in these columns, together with the amount you invested, to estimate the expenses that you paid during the six months ended October 31, 2022. Simply divide your account value by $1,000 (for example, an
$8,600 account value divided by $1,000 = 8.6), then multiply the result by the number under the heading entitled “Expenses Paid During Period” to estimate the expenses you paid on your account during this period.
Hypothetical Example for Comparison Purposes
The fourth and fifth data columns in the table below provide information about hypothetical account values and hypothetical expenses based on the Fund’s actual expense ratio and an assumed rate of return of 5% per year before expenses, which is not the Fund’s actual return. The hypothetical account values and expenses may not be used to estimate the actual ending account balances or expenses you paid for the six-month period shown. You may use this information to compare the ongoing costs of investing in the Fund with the ongoing costs of investing in other mutual funds. To do so, compare this 5% hypothetical example with the 5% hypothetical examples that appear in the shareholder reports of the other mutual funds.
Please note that the expenses shown in the table are meant to highlight your ongoing costs only and do not reflect any transactional costs, such as exchange fees or sales charges (loads). Therefore, the fourth and fifth data columns of the table are useful in comparing ongoing costs only and will not help you determine the relative total costs of owning different funds. In addition, if these transactional costs were included, your costs would have been higher.
| Share Class | Beginning
Account
Value
5/1/22 | Ending Account
Value (Based
on Actual
Returns and
Expenses)
10/31/22 | Expenses
Paid
During
Period1 | Ending Account
Value (Based
on Hypothetical
5% Annualized
Return and
Actual Expenses)
10/31/22 | Expenses
Paid
During
Period1 | Net Expense
Ratio
During
Period2 |
| Class A Shares | $1,000.00 | $944.60 | $3.68 | $1,021.42 | $3.82 | 0.75% |
| Investor Class Shares | $1,000.00 | $944.50 | $3.82 | $1,021.27 | $3.97 | 0.78% |
| Class C Shares | $1,000.00 | $943.30 | $5.05 | $1,020.01 | $5.24 | 1.03% |
| Class C2 Shares | $1,000.00 | $942.50 | $5.78 | $1,019.26 | $6.01 | 1.18% |
| Class I Shares | $1,000.00 | $945.80 | $2.50 | $1,022.63 | $2.60 | 0.51% |
| Class R6 Shares | $1,000.00 | $945.90 | $2.45 | $1,022.68 | $2.55 | 0.50% |
| 1. | Expenses are equal to the Fund’s annualized expense ratio of each class multiplied by the average account value over the period, divided by 365 and multiplied by 184 (to reflect the six-month period). The table above represents the actual expenses incurred during the six-month period. In addition to the fees and expenses which the Fund bears directly, it also indirectly bears a pro rata share of the fees and expenses of the underlying funds in which it invests. Such indirect expenses are not included in the above-reported expense figures. |
| 2. | Expenses are equal to the Fund's annualized expense ratio to reflect the six-month period. |
Industry Composition as of October 31, 2022 (Unaudited)
| General Obligation | 37.5% |
| Other Revenue | 21.7 |
| Transportation | 12.2 |
| Water & Sewer | 7.3 |
| Hospital | 4.5 |
| Education | 4.4 |
| General | 2.7 |
| Housing | 2.6 |
| Utilities | 1.0% |
| Certificate of Participation/Lease | 0.5 |
| Development | 0.2 |
| Short–Term Investment | 3.7 |
| Other Assets, Less Liabilities | 1.7 |
| | 100.0% |
See Portfolio of Investments beginning on page 11 for specific holdings within these categories. The Fund's holdings are subject to change.
Top Ten Holdings and/or Issuers Held as of October 31, 2022 (excluding short-term investments) (Unaudited)
| 1. | State of California, 2.10%-5.25%, due 11/1/28–4/1/49 |
| 2. | California Municipal Finance Authority, 3.25%-5.30%, due 2/1/27–10/1/54 |
| 3. | City of Los Angeles CA, 3.00%-5.50%, due 5/15/25–5/15/48 |
| 4. | Commonwealth of Puerto Rico, (zero coupon)-5.75%, due 7/1/24–7/1/46 |
| 5. | California Health Facilities Financing Authority, 3.00%-5.00%, due 9/1/30–8/15/51 |
| 6. | San Francisco City & County Airport Commission, 4.00%-5.00%, due 5/1/27–5/1/52 |
| 7. | Puerto Rico Sales Tax Financing Corp., (zero coupon)-5.00%, due 7/1/34–7/1/58 |
| 8. | CSCDA Community Improvement Authority, 2.65%-5.00%, due 12/1/46–5/1/57 |
| 9. | San Francisco Bay Area Rapid Transit District, 4.00%-5.25%, due 8/1/47 |
| 10. | Matching Fund Special Purpose Securitization Corp., 5.00%, due 10/1/30–10/1/39 |
| 8 | MainStay MacKay California Tax Free Opportunities Fund |
Portfolio Management Discussion and Analysis (Unaudited)
Questions answered by portfolio managers John Loffredo, CFA, Robert DiMella, CFA, Michael Petty, David Dowden, Scott Sprauer, Frances Lewis and Michael Denlinger, CFA, of MacKay Shields LLC, the Fund’s Subadvisor.
How did MainStay MacKay California Tax Free Opportunities Fund perform relative to its benchmark and peer group during the 12 months ended October 31, 2022?
For the 12 months ended October 31, 2022, Class I shares of MainStay MacKay California Tax Free Opportunities Fund returned −15.01%, underperforming the −11.53% return of the Fund’s benchmark, the Bloomberg California Municipal Bond Index (the "Index"). Over the same period, Class I shares marginally outperformed the −15.02% return of the Morningstar Muni California Long Category Average.1
What factors affected the Fund’s relative performance during the reporting period?
During the reporting period, both municipal and Treasury rates rose, with the municipal yield curve2 steepening as outflows persisted. As a result, ratios cheapened across the curve, most notably on the long end. The Fund’s yield curve positioning drove underperformance compared to the Index, as the increase in rates resulted in overweight exposure to bonds maturing in 15+ years, detracting from relative returns. In addition, the Fund’s overweight exposure to bonds with coupons of 4% detracted from the return. From a rating perspective, the Fund’s allocation to ultra-high-quality bonds detracted from relative performance; however, the underperformance was partially offset by underweight exposure to BBB-rated3 bonds. An off-Index allocation to Puerto Rico further detracted from performance.
During the reporting period, were there any market events that materially impacted the Fund’s performance or liquidity?
During the reporting period, markets extended their historic drawdown driven by the combination of rising Treasury yields, ongoing monetary policy tightening, and geopolitical uncertainty. The municipal market mirrored this broader sell-off, and many investors reacted by withdrawing money from their municipal
holdings. The municipal market experienced record outflows, which ultimately drove municipal rates higher.
During the reporting period, how was the Fund’s performance materially affected by investments in derivatives?
The Fund, at times, will employ a Treasury futures hedge, typically as a paired strategy with longer maturity bonds, to dampen duration4 and interest-rate sensitivity. During the reporting period, this hedge was additive to Fund performance as municipal exposure on the long end of the curve underperformed the market.
What was the Fund’s duration strategy during the reporting period?
The Fund’s duration was targeted to remain in a neutral range relative to the Fund’s investable universe as outlined in the prospectus. In addition to investment-grade California bonds, the Fund may also invest in bonds of U.S. territories (Puerto Rico, Guam and the U.S. Virgin Islands), and up to 20% of net assets in municipal bonds below investment grade. Since the Fund’s investable universe is broader than the Index, the Fund’s duration may also differ from that of the Index. The Fund ended the reporting period with a longer duration posture than the Index. As of October 31, 2022, the Fund's modified duration5 to worst was 7.69 years, while the benchmark’s modified duration to worst was 6.50 years.
During the reporting period, which sectors were the strongest positive contributors to the Fund’s relative performance and which sectors were particularly weak?
During the reporting period, the Fund’s underweight exposure to the state general obligation and transportation sectors made positive contributions to relative performance. (Contributions take weightings and total returns into account.) Conversely, the Fund’s overweight exposure to local general obligation bonds was the
| 1. | See page 5 for other share class returns, which may be higher or lower than Class I share returns. See page 6 for more information on benchmark and peer group returns. |
| 2. | The yield curve is a line that plots the yields of various securities of similar quality—typically U.S. Treasury issues—across a range of maturities. The U.S. Treasury yield curve serves as a benchmark for other debt and is used in economic forecasting. |
| 3. | An obligation rated ‘BBB’ by Standard & Poor’s (“S&P”) is deemed by S&P to exhibit adequate protection parameters. In the opinion of S&P, however, adverse economic conditions or changing circumstances are more likely to lead to a weakened capacity of the obligor to meet its financial commitment on the obligation. When applied to Fund holdings, ratings are based solely on the creditworthiness of the bonds in the portfolio and are not meant to represent the security or safety of the Fund. |
| 4. | Duration is a measure of the price sensitivity of a fixed-income investment to changes in interest rates. Duration is expressed as a number of years and is considered a more accurate sensitivity gauge than average maturity. |
| 5. | Modified duration is inversely related to the approximate percentage change in price for a given change in yield. Duration to worst is the duration of a bond computed using the bond’s nearest call date or maturity, whichever comes first. This measure ignores future cash flow fluctuations due to embedded optionality. |
most significant detractor from a sector perspective. In addition, overweight exposure to the special tax and housing sectors weakened relative returns.
How did the Fund’s sector weighting change during the reporting period?
During the reporting period, there were no material changes to the weightings in the Fund. There were increases to the state general obligation and special tax sectors. Across maturities, there was an increase in 20- to-25-year bonds. From a credit perspective, there was an increase to non-investment grade bonds. Conversely, there was a decrease to the Fund’s exposure in the prerefunded/ETM (escrowed to maturity) and leasing sectors, as well as bonds maturing in 25+ years.
How was the Fund positioned at the end of the reporting period?
As of October 31, 2022, the Fund continued to hold overweight exposure to the long end of the curve. We believe more compelling ratios on the longer end of the curve will lead to outperformance of longer-maturity bonds over time. In addition, the Fund held overweight exposure to the local general obligation and special tax sectors. The Fund also held overweight exposure to bonds from Puerto Rico and non-investment grade credit, which are not included in the Index. As of the same date, the Fund held underweight exposure to the state general obligation and prerefunded sectors, as well as AAA-rated6 bonds.
| 6. | An obligation rated ‘AAA’ has the highest rating assigned by S&P, and in the opinion of S&P, the obligor’s capacity to meet its financial commitment on the obligation is extremely strong. When applied to Fund holdings, ratings are based solely on the creditworthiness of the bonds in the portfolio and are not meant to represent the security or safety of the Fund. |
The opinions expressed are those of the portfolio managers as of the date of this report and are subject to change. There is no guarantee that any forecasts will come to pass. This material does not constitute investment advice and is not intended as an endorsement of any specific investment.
| 10 | MainStay MacKay California Tax Free Opportunities Fund |
Portfolio of Investments October 31, 2022†
| | Principal
Amount | Value |
| Municipal Bonds 94.6% |
| Long-Term Municipal Bonds 94.4% |
| Certificate of Participation/Lease 0.5% |
| California Municipal Finance Authority, Palomar Health Obligated Group, Certificate of Participation | | |
| Series A, Insured: AGM | | |
| 5.25%, due 11/1/52 (a) | $ 3,000,000 | $ 2,971,260 |
| Mesa Water District, Certificate of Participation | | |
| 4.00%, due 3/15/45 | 1,450,000 | 1,299,503 |
| Oxnard School District, Property Acquisition and Improvement Project, Certificate of Participation | | |
| Insured: BAM | | |
| 5.00%, due 8/1/45 (b) | 975,000 | 1,000,104 |
| | | 5,270,867 |
| Development 0.2% |
| City of Irvine CA, Reassessment District No. 19-1, Special Assessment | | |
| 5.00%, due 9/2/44 | 1,800,000 | 1,836,195 |
| Education 4.4% |
| California Educational Facilities Authority, Loma Linda University, Revenue Bonds | | |
| Series A | | |
| 5.00%, due 4/1/23 | 570,000 | 573,946 |
| Series A | | |
| 5.00%, due 4/1/24 | 280,000 | 286,087 |
| California Educational Facilities Authority, Loyola Marymount University, Green Bond, Revenue Bonds | | |
| Series B | | |
| 5.00%, due 10/1/31 | 525,000 | 555,070 |
| Series B | | |
| 5.00%, due 10/1/35 | 640,000 | 669,268 |
| California Educational Facilities Authority, Mount St. Mary's University, Revenue Bonds | | |
| Series A | | |
| 5.00%, due 10/1/38 | 620,000 | 643,115 |
| California Enterprise Development Authority, Thacher School Project (The), Revenue Bonds | | |
| 4.00%, due 9/1/44 | 3,450,000 | 3,028,432 |
| | Principal
Amount | Value |
| |
| Education (continued) |
| California Infrastructure and Economic Development Bank, Equitable School Revolving Fund LLC Obligated Group, Revenue Bonds | | |
| Series B | | |
| 5.00%, due 11/1/39 | $ 300,000 | $ 304,898 |
| Series B | | |
| 5.00%, due 11/1/44 | 350,000 | 352,848 |
| Series B | | |
| 5.00%, due 11/1/49 | 500,000 | 501,869 |
| California Infrastructure and Economic Development Bank, Equitable School Revolving Fund LLC Obligated Group, Green Bond, Revenue Bonds | | |
| Series B | | |
| 4.00%, due 11/1/45 | 850,000 | 716,346 |
| Series B | | |
| 4.00%, due 11/1/55 | 915,000 | 725,249 |
| California Infrastructure and Economic Development Bank, WFCS Portfolio Projects, Revenue Bonds | | |
| Series A-1 | | |
| 5.00%, due 1/1/56 (c) | 840,000 | 599,807 |
| California Infrastructure and Economic Development Bank, Wonderful Foundations Charter School Portfolio Project, Revenue Bonds | | |
| Series A-1 | | |
| 5.00%, due 1/1/55 (c) | 2,645,000 | 1,896,918 |
| California Municipal Finance Authority, California Baptist University, Revenue Bonds | | |
| Series A | | |
| 5.00%, due 11/1/46 (c) | 1,000,000 | 931,297 |
| California Municipal Finance Authority, California Lutheran University, Revenue Bonds | | |
| 5.00%, due 10/1/31 | 235,000 | 239,136 |
| 5.00%, due 10/1/33 | 225,000 | 227,736 |
| 5.00%, due 10/1/35 | 225,000 | 226,133 |
| 5.00%, due 10/1/36 | 285,000 | 285,893 |
| 5.00%, due 10/1/37 | 310,000 | 310,202 |
| California Municipal Finance Authority, Charter School, King Chavez Academy, Revenue Bonds (c) | | |
| Series A | | |
| 5.00%, due 5/1/36 | 1,275,000 | 1,220,671 |
The notes to the financial statements are an integral part of, and should be read in conjunction with, the financial statements.
11
Portfolio of Investments October 31, 2022† (continued)
| | Principal
Amount | Value |
| Long-Term Municipal Bonds (continued) |
| Education (continued) |
California Municipal Finance Authority, Charter School, King Chavez Academy, Revenue Bonds (c)
(continued) | | |
| Series A | | |
| 5.00%, due 5/1/46 | $ 1,325,000 | $ 1,196,209 |
| California Municipal Finance Authority, Charter School, Palmdale Aerospace Academy Projects (The), Revenue Bonds (c) | | |
| Series A | | |
| 5.00%, due 7/1/36 | 1,300,000 | 1,217,841 |
| Series A | | |
| 5.00%, due 7/1/46 | 795,000 | 696,051 |
| California Municipal Finance Authority, Claremont Graduate University, Revenue Bonds | | |
| Series B | | |
| 5.00%, due 10/1/54 (c) | 1,380,000 | 1,152,541 |
| California Municipal Finance Authority, Creative Center Los Altos Project (The), Revenue Bonds (c) | | |
| Series B | | |
| 4.00%, due 11/1/36 | 400,000 | 314,307 |
| Series B | | |
| 4.50%, due 11/1/46 | 1,600,000 | 1,185,734 |
| California Municipal Finance Authority, National University, Revenue Bonds | | |
| Series A | | |
| 5.00%, due 4/1/31 | 1,000,000 | 1,060,737 |
| California Municipal Finance Authority, Partnerships to Uplift Community Project, Revenue Bonds | | |
| Series A | | |
| 5.30%, due 8/1/47 | 500,000 | 432,087 |
| California Municipal Finance Authority, Southern California Institute of Architecture Project, Revenue Bonds | | |
| 5.00%, due 12/1/38 | 845,000 | 838,600 |
| California Municipal Finance Authority, Southwestern Law School, Revenue Bonds | | |
| 4.00%, due 11/1/32 | 240,000 | 222,062 |
| | Principal
Amount | Value |
| |
| Education (continued) |
| California Public Finance Authority, California University of Science & Medicine Obligated Group, Revenue Bonds | | |
| Series A | | |
| 6.25%, due 7/1/54 (c) | $ 1,000,000 | $ 1,065,022 |
| California School Finance Authority, Aspire Public Schools Obligated Group, Revenue Bonds (c) | | |
| 5.00%, due 8/1/27 | 25,000 | 26,127 |
| 5.00%, due 8/1/27 | 475,000 | 483,589 |
| 5.00%, due 8/1/28 | 50,000 | 52,255 |
| 5.00%, due 8/1/28 | 650,000 | 661,263 |
| 5.00%, due 8/1/36 | 50,000 | 52,255 |
| 5.00%, due 8/1/36 | 550,000 | 550,476 |
| 5.00%, due 8/1/41 | 50,000 | 52,255 |
| 5.00%, due 8/1/41 | 700,000 | 688,024 |
| 5.00%, due 8/1/46 | 75,000 | 78,382 |
| 5.00%, due 8/1/46 | 900,000 | 864,727 |
| California School Finance Authority, Classical Academies Project, Revenue Bonds | | |
| Series A | | |
| 5.00%, due 10/1/37 (c) | 1,485,000 | 1,477,787 |
| California School Finance Authority, Grimmway Schools Obligated Group, Revenue Bonds | | |
| Series A | | |
| 5.00%, due 7/1/46 (c) | 750,000 | 677,589 |
| California School Finance Authority, High Tech High Learning Project, Revenue Bonds (c) | | |
| Series A | | |
| 5.00%, due 7/1/37 | 500,000 | 462,212 |
| Series A | | |
| 5.00%, due 7/1/49 | 500,000 | 431,482 |
| California School Finance Authority, Kipp Social Public Schools Project, Revenue Bonds | | |
| Series A | | |
| 5.00%, due 7/1/34 (c) | 600,000 | 597,971 |
| California School Finance Authority, Vista Charter Public Schools, Revenue Bonds | | |
| Series A | | |
| 4.00%, due 6/1/51 (c) | 1,790,000 | 1,263,840 |
The notes to the financial statements are an integral part of, and should be read in conjunction with, the financial statements.
| 12 | MainStay MacKay California Tax Free Opportunities Fund |
| | Principal
Amount | Value |
| Long-Term Municipal Bonds (continued) |
| Education (continued) |
| California State University, Systemwide, Revenue Bonds | | |
| Series A | | |
| 4.00%, due 11/1/38 | $ 2,865,000 | $ 2,723,704 |
| California Statewide Communities Development Authority, Lancer Plaza Project, Revenue Bonds | | |
| 5.875%, due 11/1/43 | 1,000,000 | 994,629 |
| Del Mar Union School District Community Facilities District No. 99-1, Special Tax | | |
| Insured: BAM | | |
| 4.00%, due 9/1/44 | 1,450,000 | 1,272,819 |
| Irvine Unified School District, Community Facilities District No. 9, Special Tax | | |
| Series A | | |
| 5.00%, due 9/1/33 | 410,000 | 417,448 |
| Series A | | |
| 5.00%, due 9/1/34 | 225,000 | 227,897 |
| Series A | | |
| 5.00%, due 9/1/36 | 550,000 | 554,229 |
| Poway Unified School District, Community Facilities District No. 15, Special Tax | | |
| Insured: BAM | | |
| 5.25%, due 9/1/52 | 1,750,000 | 1,774,822 |
| Rio Elementary School District Community Facilities District, Special Tax | | |
| Insured: BAM | | |
| 5.00%, due 9/1/35 | 500,000 | 517,790 |
| University of California, Revenue Bonds | | |
| Series BE | | |
| 4.00%, due 5/15/47 | 3,500,000 | 3,197,225 |
| | | 43,776,909 |
| General 2.7% |
| Cathedral City Redevelopment Agency Successor Agency, Merged Redevelopment Project Area, Tax Allocation | | |
| Series A, Insured: AGM | | |
| 5.00%, due 8/1/26 | 1,000,000 | 1,025,060 |
| Series A, Insured: AGM | | |
| 5.00%, due 8/1/34 | 1,000,000 | 1,025,381 |
| | Principal
Amount | Value |
| |
| General (continued) |
| City of Irvine CA, Community Facilities District No. 2013-3, Special Tax | | |
| 5.00%, due 9/1/49 | $ 1,385,000 | $ 1,357,390 |
| City of Palm Desert CA, University Park, Special Tax | | |
| 3.00%, due 9/1/31 | 315,000 | 271,488 |
| 4.00%, due 9/1/41 | 450,000 | 380,212 |
| City of Rocklin CA, Community Facilities District No. 10, Special Tax | | |
| 5.00%, due 9/1/39 | 1,125,000 | 1,130,680 |
| City of San Mateo CA, Community Facilities District No. 2008-1, Special Tax | | |
| Insured: BAM | | |
| 5.25%, due 9/1/40 | 4,000,000 | 4,142,414 |
| City of South San Francisco CA, Community Facilities District No. 2021-01, Special Tax | | |
| 4.00%, due 9/1/44 | 500,000 | 399,200 |
| Corona Community Facilities District, Community Facilities District No. 2018-2, Special Tax | | |
| Series A | | |
| 4.625%, due 9/1/37 | 600,000 | 556,086 |
| Series A | | |
| 5.00%, due 9/1/42 | 800,000 | 747,078 |
| Greenfield Redevelopment Agency, Tax Allocation | | |
| Insured: BAM | | |
| 4.00%, due 2/1/26 | 285,000 | 288,049 |
| Madera Redevelopment Agency Successor Agency, Tax Allocation | | |
| Series A | | |
| 5.00%, due 9/1/37 | 1,180,000 | 1,240,367 |
| Mountain View Shoreline Regional Park Community, Tax Allocation | | |
| Series A, Insured: AGM | | |
| 5.00%, due 8/1/36 | 1,645,000 | 1,729,230 |
| River Islands Public Financing Authority, Community Facilities District No. 2003-1, Special Tax | | |
| Series A-1, Insured: AGM | | |
| 4.25%, due 9/1/47 | 3,000,000 | 2,674,582 |
| Series A-1, Insured: AGM | | |
| 5.00%, due 9/1/42 | 1,500,000 | 1,551,155 |
| Series A-1, Insured: AGM | | |
| 5.25%, due 9/1/52 | 1,000,000 | 1,039,313 |
The notes to the financial statements are an integral part of, and should be read in conjunction with, the financial statements.
13
Portfolio of Investments October 31, 2022† (continued)
| | Principal
Amount | Value |
| Long-Term Municipal Bonds (continued) |
| General (continued) |
| Riverside County Public Financing Authority, Desert Communities & Interstate 215 Corridor Projects, Tax Allocation | | |
| Series A, Insured: BAM | | |
| 4.00%, due 10/1/40 | $ 1,000,000 | $ 895,468 |
| Riverside County Public Financing Authority, Project Area No. 1 Desert Communities & Interstate 215 Corridor Project, Tax Allocation | | |
| Series A, Insured: BAM | | |
| 4.00%, due 10/1/32 | 1,050,000 | 1,035,859 |
| Sacramento Area Flood Control Agency, Consolidated Capital Assessment District No. 2, Special Assessment | | |
| 4.00%, due 10/1/47 | 3,700,000 | 3,240,248 |
| San Francisco City & County Redevelopment Agency, Mission Bay South Redevelopment Project, Tax Allocation | | |
| Series C | | |
| 5.00%, due 8/1/36 | 1,250,000 | 1,302,174 |
| South Orange County Public Financing Authority, Special Tax, Senior Lien | | |
| Series A | | |
| 5.00%, due 8/15/32 | 775,000 | 779,843 |
| | | 26,811,277 |
| General Obligation 37.3% |
| Alvord Unified School District, Election 2012, Unlimited General Obligation | | |
| Series A, Insured: AGM | | |
| 5.25%, due 8/1/37 | 825,000 | 838,141 |
| Banning Unified School District, Election 2016, Unlimited General Obligation | | |
| Series A, Insured: AGM | | |
| 4.00%, due 8/1/46 | 500,000 | 431,505 |
| Brawley Union High School District, Election 2018, Unlimited General Obligation | | |
| Series A, Insured: BAM | | |
| 5.00%, due 8/1/44 | 1,280,000 | 1,316,333 |
| Cabrillo Unified School District, Election of 2018, Unlimited General Obligation | | |
| Series B, Insured: AGM-CR | | |
| 5.00%, due 8/1/50 | 3,150,000 | 3,235,833 |
| | Principal
Amount | Value |
| |
| General Obligation (continued) |
| Central Union High School District, Election 2016, Unlimited General Obligation | | |
| 5.25%, due 8/1/46 | $ 2,000,000 | $ 2,066,990 |
| Ceres Unified School District, Unlimited General Obligation | | |
| Insured: BAM | | |
| (zero coupon), due 8/1/37 | 500,000 | 234,530 |
| Chaffey Joint Union High School District, Unlimited General Obligation | | |
| Series D | | |
| 4.00%, due 8/1/49 | 5,000,000 | 4,374,659 |
| Chino Valley Unified School District, Election 2016, Limited General Obligation | | |
| Series B, Insured: AGM-CR | | |
| 3.375%, due 8/1/50 | 9,050,000 | 6,470,961 |
| Chowchilla Elementary School District, Madera County, Unlimited General Obligation | | |
| Series B | | |
| 5.00%, due 8/1/43 | 960,000 | 989,959 |
| City & County of San Francisco CA, Unlimited General Obligation | | |
| Series C-1 | | |
| 4.00%, due 6/15/45 | 3,500,000 | 3,119,815 |
| Coalinga-Huron Joint Unified School District, Election of 2016, Unlimited General Obligation | | |
| Series B, Insured: BAM | | |
| 5.00%, due 8/1/48 | 3,250,000 | 3,320,157 |
| Commonwealth of Puerto Rico, Unlimited General Obligation | | |
| Series A-1 | | |
| (zero coupon), due 7/1/24 | 282,685 | 257,240 |
| Series A-1 | | |
| (zero coupon), due 7/1/33 | 1,089,492 | 555,353 |
| Series A-1 | | |
| 4.00%, due 7/1/35 | 3,350,000 | 2,745,685 |
| Series A-1 | | |
| 4.00%, due 7/1/46 | 750,000 | 546,345 |
| Series A-1 | | |
| 5.375%, due 7/1/25 | 3,942,873 | 3,943,513 |
| Series A-1 | | |
| 5.625%, due 7/1/27 | 8,000,000 | 8,066,130 |
| Series A-1 | | |
| 5.625%, due 7/1/29 | 5,019,176 | 5,056,536 |
The notes to the financial statements are an integral part of, and should be read in conjunction with, the financial statements.
| 14 | MainStay MacKay California Tax Free Opportunities Fund |
| | Principal
Amount | Value |
| Long-Term Municipal Bonds (continued) |
| General Obligation (continued) |
Commonwealth of Puerto Rico, Unlimited General Obligation
(continued) | | |
| Series A-1 | | |
| 5.75%, due 7/1/31 | $ 4,800,000 | $ 4,838,645 |
| Corona-Norco Unified School District, Election 2014, Unlimited General Obligation | | |
| Series C | | |
| 4.00%, due 8/1/49 | 935,000 | 834,312 |
| Cuyama Joint Unified School District, Election 2016, Unlimited General Obligation | | |
| Series B, Insured: AGM | | |
| 5.25%, due 8/1/48 | 500,000 | 519,781 |
| Davis Joint Unified School District, Unlimited General Obligation | | |
| Insured: BAM | | |
| 3.00%, due 8/1/41 | 4,695,000 | 3,460,801 |
| Denair Unified School District, Election 2007, Unlimited General Obligation | | |
| Insured: AGM | | |
| (zero coupon), due 8/1/41 | 4,260,000 | 1,583,441 |
| Desert Community College District, Unlimited General Obligation | | |
| Series A-1 | | |
| 4.00%, due 8/1/51 | 2,000,000 | 1,751,590 |
| Dublin Unified School District, Green Bond, Unlimited General Obligation | | |
| Series C | | |
| 3.00%, due 8/1/41 | 3,000,000 | 2,252,699 |
| El Monte Union High School District, Unlimited General Obligation | | |
| Series A | | |
| 4.00%, due 6/1/38 | 1,195,000 | 1,114,161 |
| El Rancho Unified School District, Election 2016, Unlimited General Obligation | | |
| Series A, Insured: BAM | | |
| 5.25%, due 8/1/46 | 2,745,000 | 2,817,620 |
| Folsom Cordova Unified School District School Facilities Improvement Dist No. 5, Election 2014, Unlimited General Obligation | | |
| Series A | | |
| 5.25%, due 10/1/35 | 4,710,000 | 4,913,716 |
| | Principal
Amount | Value |
| |
| General Obligation (continued) |
| Fort Bragg Unified School District, Election of 2020, Unlimited General Obligation | | |
| Series B | | |
| 5.50%, due 8/1/52 | $ 1,000,000 | $ 1,050,435 |
| Fremont Union High School District, Unlimited General Obligation | | |
| Series B | | |
| 5.00%, due 8/1/32 | 3,260,000 | 3,480,362 |
| Fresno Unified School District, Election 2010, Unlimited General Obligation | | |
| Series F | | |
| 4.00%, due 8/1/32 | 1,475,000 | 1,490,249 |
| Glendale Community College District, Election of 2016, Unlimited General Obligation | | |
| Series B | | |
| 3.00%, due 8/1/47 | 4,500,000 | 3,027,270 |
| Grossmont-Cuyamaca Community College District, Election of 2012, Unlimited General Obligation | | |
| Series B | | |
| 4.00%, due 8/1/47 | 3,000,000 | 2,657,776 |
| Hartnell Community College District, Unlimited General Obligation | | |
| Series A | | |
| (zero coupon), due 8/1/37 | 2,500,000 | 1,349,966 |
| Hayward Unified School District, Unlimited General Obligation | | |
| Insured: BAM | | |
| 4.00%, due 8/1/43 | 3,000,000 | 2,698,002 |
| Holtville Unified School District, Unlimited General Obligation | | |
| Series A, Insured: AGM | | |
| 5.00%, due 8/1/44 | 1,240,000 | 1,281,024 |
| Huntington Beach City School District, Election 2016, Unlimited General Obligation | | |
| Series B | | |
| 4.00%, due 8/1/44 | 1,525,000 | 1,358,943 |
| Series B | | |
| 4.00%, due 8/1/48 | 1,500,000 | 1,323,705 |
| Inglewood Unified School District, Unlimited General Obligation | | |
| Series A, Insured: AGM | | |
| 4.00%, due 8/1/51 | 4,000,000 | 3,412,270 |
The notes to the financial statements are an integral part of, and should be read in conjunction with, the financial statements.
15
Portfolio of Investments October 31, 2022† (continued)
| | Principal
Amount | Value |
| Long-Term Municipal Bonds (continued) |
| General Obligation (continued) |
| Inglewood Unified School District, Election 2012, Unlimited General Obligation | | |
| Series B, Insured: BAM | | |
| 5.00%, due 8/1/25 | $ 250,000 | $ 259,605 |
| Series C, Insured: BAM | | |
| 5.00%, due 8/1/34 | 585,000 | 615,280 |
| Series B, Insured: BAM | | |
| 5.00%, due 8/1/35 | 800,000 | 835,316 |
| Jefferson Union High School District, Unlimited General Obligation | | |
| Series A | | |
| 4.00%, due 8/1/45 | 1,250,000 | 1,093,749 |
| Jurupa Unified School District, Unlimited General Obligation | | |
| Series B | | |
| 5.00%, due 8/1/33 | 1,555,000 | 1,640,850 |
| Series B | | |
| 5.00%, due 8/1/37 | 1,000,000 | 1,047,797 |
| Jurupa Unified School District, Election 2014, Unlimited General Obligation | | |
| Series C | | |
| 4.00%, due 8/1/43 | 1,675,000 | 1,476,236 |
| Series C | | |
| 5.25%, due 8/1/43 | 2,000,000 | 2,115,176 |
| Kerman Unified School District, Election 2016, Unlimited General Obligation | | |
| Insured: BAM | | |
| 5.25%, due 8/1/46 | 1,755,000 | 1,818,070 |
| Kern Community College District, Election 2016, Unlimited General Obligation | | |
| Series C, Insured: BAM | | |
| 3.00%, due 8/1/46 | 3,000,000 | 2,053,611 |
| Kern Community College District, Safety Repair & Improvement, Unlimited General Obligation | | |
| Series C | | |
| 5.75%, due 11/1/34 | 650,000 | 666,781 |
| Lemoore Union High School District, Election 2016, Unlimited General Obligation | | |
| Series A | | |
| 5.50%, due 8/1/42 | 560,000 | 593,353 |
| | Principal
Amount | Value |
| |
| General Obligation (continued) |
| Lennox School District, Election 2016, Unlimited General Obligation | | |
| Insured: AGM | | |
| 4.00%, due 8/1/47 | $ 3,000,000 | $ 2,583,382 |
| Livermore Valley Joint Unified School District, Unlimited General Obligation | | |
| 3.00%, due 8/1/40 | 2,890,000 | 2,179,397 |
| Lodi Unified School District, Election 2016, Unlimited General Obligation | | |
| Series 2020 | | |
| 4.00%, due 8/1/39 | 1,300,000 | 1,209,255 |
| Long Beach Community College District, Unlimited General Obligation | | |
| Series C | | |
| 4.00%, due 8/1/49 | 3,000,000 | 2,595,191 |
| Long Beach Unified School District, Unlimited General Obligation | | |
| Series A | | |
| 4.00%, due 8/1/43 | 6,500,000 | 5,746,439 |
| Long Beach Unified School District, Election 2008, Unlimited General Obligation | | |
| Series F | | |
| 3.00%, due 8/1/47 | 4,000,000 | 2,713,872 |
| Long Beach Unified School District, Election 2016, Unlimited General Obligation | | |
| Series B | | |
| 3.00%, due 8/1/48 | 3,000,000 | 2,013,739 |
| Series A | | |
| 5.00%, due 8/1/33 | 2,825,000 | 2,968,478 |
| Los Angeles Community College District, Unlimited General Obligation | | |
| Series I | | |
| 4.00%, due 8/1/33 | 2,865,000 | 2,894,761 |
| Series I | | |
| 4.00%, due 8/1/34 | 4,000,000 | 4,027,954 |
| Los Angeles Unified School District, Unlimited General Obligation | | |
| Series A | | |
| 5.00%, due 7/1/25 | 1,250,000 | 1,308,361 |
| Series A | | |
| 5.00%, due 7/1/32 | 1,500,000 | 1,641,749 |
| Series A | | |
| 5.00%, due 7/1/33 | 1,000,000 | 1,089,952 |
The notes to the financial statements are an integral part of, and should be read in conjunction with, the financial statements.
| 16 | MainStay MacKay California Tax Free Opportunities Fund |
| | Principal
Amount | Value |
| Long-Term Municipal Bonds (continued) |
| General Obligation (continued) |
| Los Angeles Unified School District, Election 2005, Unlimited General Obligation | | |
| Series M-1 | | |
| 5.25%, due 7/1/42 | $ 2,990,000 | $ 3,143,454 |
| Los Rios Community College District, Unlimited General Obligation | | |
| Series D | | |
| 4.00%, due 8/1/35 | 250,000 | 246,522 |
| Series D | | |
| 4.00%, due 8/1/39 | 1,000,000 | 920,983 |
| Lucia Mar Unified School District, Election 2016, Unlimited General Obligation | | |
| Series C, Insured: BAM | | |
| 3.00%, due 8/1/47 | 7,000,000 | 4,749,276 |
| Marysville Joint Unified School District, Election 2008, Unlimited General Obligation | | |
| Insured: AGM | | |
| (zero coupon), due 8/1/35 | 1,500,000 | 856,441 |
| Insured: AGM | | |
| (zero coupon), due 8/1/36 | 2,000,000 | 1,085,818 |
| Insured: AGM | | |
| (zero coupon), due 8/1/37 | 2,000,000 | 1,018,841 |
| Mendocino Unified School District, Election 2020, Unlimited General Obligation | | |
| Series B | | |
| 3.00%, due 8/1/51 | 1,500,000 | 965,454 |
| Mount Diablo Unified School District, Unlimited General Obligation | | |
| Series B | | |
| 4.00%, due 8/1/29 | 1,000,000 | 1,037,505 |
| Mount San Jacinto Community College District, Election 2014, Unlimited General Obligation | | |
| Series B | | |
| 4.00%, due 8/1/38 | 1,985,000 | 1,871,214 |
| Mountain View-Whisman School District, Election 2020, Unlimited General Obligation | | |
| Series A | | |
| 3.00%, due 9/1/34 | 505,000 | 437,654 |
| Series A | | |
| 3.00%, due 9/1/36 | 750,000 | 621,004 |
| | Principal
Amount | Value |
| |
| General Obligation (continued) |
| Mountain View-Whisman School District, Election 2020, Unlimited General Obligation (continued) | | |
| Series A | | |
| 3.00%, due 9/1/40 | $ 1,160,000 | $ 894,406 |
| Napa Valley Unified School District, Election 2016, Unlimited General Obligation | | |
| Series C, Insured: AGM | | |
| 4.00%, due 8/1/44 | 3,630,000 | 3,250,222 |
| Needles Unified School District, Capital Appreciation, Election 2008, Unlimited General Obligation | | |
| Series B, Insured: AGM | | |
| (zero coupon), due 8/1/45 | 1,250,000 | 914,234 |
| North Orange County Community College District, Election 2014, Unlimited General Obligation | | |
| Series B | | |
| 4.00%, due 8/1/33 | 300,000 | 303,184 |
| North Orange County Community College District, Election of 2014, Unlimited General Obligation | | |
| Series C | | |
| 4.00%, due 8/1/47 | 4,750,000 | 4,158,719 |
| Norwalk-La Mirada Unified School District, Election 2014, Unlimited General Obligation | | |
| Series E | | |
| 3.00%, due 8/1/46 | 2,250,000 | 1,574,395 |
| Ontario Montclair School District, Election of 2016, Unlimited General Obligation | | |
| Series A | | |
| 5.00%, due 8/1/46 | 7,765,000 | 7,985,178 |
| Oxnard Union High School District, Election 2018, Unlimited General Obligation | | |
| Series A | | |
| 4.00%, due 8/1/38 | 1,000,000 | 947,885 |
| Palo Verde Community College District, Election 2014, Unlimited General Obligation | | |
| Series A, Insured: AGM | | |
| 4.00%, due 8/1/45 | 500,000 | 435,398 |
The notes to the financial statements are an integral part of, and should be read in conjunction with, the financial statements.
17
Portfolio of Investments October 31, 2022† (continued)
| | Principal
Amount | Value |
| Long-Term Municipal Bonds (continued) |
| General Obligation (continued) |
| Palomar Community College District, Election 2006, Unlimited General Obligation | | |
| Series B | | |
| (zero coupon), due 8/1/39 | $ 2,000,000 | $ 2,023,580 |
| Peralta Community College District, Unlimited General Obligation | | |
| Series A | | |
| 4.00%, due 8/1/39 | 3,000,000 | 2,679,318 |
| Peralta Community College District, Election of 2006, Unlimited General Obligation | | |
| Series D | | |
| 4.00%, due 8/1/39 | 1,000,000 | 893,106 |
| Pleasant Valley School District, Election of 2018, Unlimited General Obligation | | |
| Series B | | |
| 4.00%, due 8/1/46 | 2,250,000 | 1,991,950 |
| Ravenswood City School District, Election 2018, Unlimited General Obligation | | |
| Insured: AGM | | |
| 5.25%, due 8/1/45 | 3,500,000 | 3,691,494 |
| Redwood City School District, Election 2015, Unlimited General Obligation | | |
| Series C | | |
| 4.00%, due 8/1/44 | 1,800,000 | 1,588,802 |
| 5.25%, due 8/1/44 | 2,000,000 | 2,122,674 |
| Rio Hondo Community College District, Election 2004, Unlimited General Obligation | | |
| Series C | | |
| (zero coupon), due 8/1/42 | 2,000,000 | 2,208,648 |
| Robla School District, Election 2018, Unlimited General Obligation | | |
| Series A, Insured: AGM | | |
| 4.00%, due 8/1/40 | 2,070,000 | 1,868,314 |
| Series A, Insured: AGM | | |
| 5.00%, due 8/1/44 | 1,720,000 | 1,780,651 |
| Sacramento City Unified School District, Election of 2020, Unlimited General Obligation | | |
| Series A, Insured: BAM | | |
| 5.50%, due 8/1/52 | 3,500,000 | 3,756,335 |
| | Principal
Amount | Value |
| |
| General Obligation (continued) |
| Salinas Union High School District, Unlimited General Obligation | | |
| Series A | | |
| 4.00%, due 8/1/47 | $ 4,300,000 | $ 3,732,803 |
| San Bernardino City Unified School District, Election 2012, Unlimited General Obligation | | |
| Series C, Insured: AGM | | |
| 5.00%, due 8/1/34 | 655,000 | 676,375 |
| San Diego Unified School District, Election 2012, Unlimited General Obligation | | |
| Series I | | |
| 4.00%, due 7/1/34 | 1,000,000 | 1,002,105 |
| San Diego Unified School District, Election of 2018, Unlimited General Obligation | | |
| Series F-2 | | |
| 5.00%, due 7/1/40 | 3,020,000 | 3,148,952 |
| San Francisco Bay Area Rapid Transit District, Election of 2016, Unlimited General Obligation | | |
| Series D-1 | | |
| 4.00%, due 8/1/47 | 10,250,000 | 9,162,275 |
| Series D-1 | | |
| 5.25%, due 8/1/47 | 6,750,000 | 7,236,162 |
| San Juan Unified School District, Election 2016, Unlimited General Obligation | | |
| 5.00%, due 8/1/36 | 1,500,000 | 1,606,950 |
| 5.00%, due 8/1/38 | 1,800,000 | 1,917,673 |
| San Juan Unified School District, Election of 2012, Unlimited General Obligation | | |
| Series N | | |
| 4.00%, due 8/1/31 | 1,975,000 | 2,002,262 |
| San Leandro Unified School District, Election 2016, Unlimited General Obligation | | |
| Series B, Insured: BAM | | |
| 5.00%, due 8/1/35 | 500,000 | 530,020 |
| Series B, Insured: BAM | | |
| 5.00%, due 8/1/36 | 1,955,000 | 2,064,354 |
| Series A, Insured: BAM | | |
| 5.25%, due 8/1/42 | 1,000,000 | 1,043,179 |
The notes to the financial statements are an integral part of, and should be read in conjunction with, the financial statements.
| 18 | MainStay MacKay California Tax Free Opportunities Fund |
| | Principal
Amount | Value |
| Long-Term Municipal Bonds (continued) |
| General Obligation (continued) |
| San Lorenzo Valley Unified School District, Election 2020, Unlimited General Obligation | | |
| Series A | | |
| 4.00%, due 8/1/45 | $ 1,000,000 | $ 869,403 |
| San Rafael City Elementary School District, Election 2005, Unlimited General Obligation | | |
| Series C | | |
| 4.00%, due 8/1/47 | 1,720,000 | 1,517,547 |
| San Rafael City Elementary School District, Election of 2022, Unlimited General Obligation | | |
| Series A | | |
| 5.25%, due 8/1/52 | 1,250,000 | 1,311,987 |
| San Rafael City High School District, Election of 2022, Unlimited General Obligation | | |
| Series A | | |
| 5.25%, due 8/1/52 | 2,000,000 | 2,111,236 |
| San Ysidro School District, Unlimited General Obligation | | |
| Insured: AGM | | |
| (zero coupon), due 8/1/47 | 3,000,000 | 813,361 |
| Santa Barbara Unified School District, Election 2010, Unlimited General Obligation | | |
| Series A | | |
| (zero coupon), due 8/1/36 | 1,000,000 | 1,156,252 |
| Santa Clarita Community College District, Election of 2016, Unlimited General Obligation | | |
| 5.25%, due 8/1/48 (a) | 2,000,000 | 2,120,446 |
| Santa Monica Community College District, Election 2016, Unlimited General Obligation | | |
| Series B | | |
| 4.00%, due 8/1/45 | 8,750,000 | 7,771,886 |
| Series A | | |
| 4.00%, due 8/1/47 | 1,250,000 | 1,098,181 |
| Santee School District, Unlimited General Obligation | | |
| 5.00%, due 8/1/48 | 2,205,000 | 2,280,219 |
| Shasta Union High School District, Election 2016, Unlimited General Obligation | | |
| 4.00%, due 8/1/44 | 1,135,000 | 997,090 |
| | Principal
Amount | Value |
| |
| General Obligation (continued) |
| Simi Valley Unified School District, Election 2016, Unlimited General Obligation | | |
| Series B | | |
| 4.00%, due 8/1/33 | $ 175,000 | $ 176,307 |
| Series B | | |
| 4.00%, due 8/1/39 | 350,000 | 322,344 |
| Series B | | |
| 4.00%, due 8/1/40 | 1,455,000 | 1,313,235 |
| Series B | | |
| 5.00%, due 8/1/42 | 1,375,000 | 1,430,529 |
| Series B | | |
| 5.00%, due 8/1/44 | 1,200,000 | 1,244,932 |
| Solano County Community College District, Election 2012, Unlimited General Obligation | | |
| Series E, Insured: AGM-CR | | |
| 3.50%, due 8/1/46 | 2,000,000 | 1,510,631 |
| Southwestern Community College District, Unlimited General Obligation | | |
| Series A | | |
| 4.00%, due 8/1/47 | 2,000,000 | 1,732,560 |
| State of California, Unlimited General Obligation | | |
| 4.00%, due 9/1/34 | 3,500,000 | 3,481,123 |
| State of California, Various Purpose, Unlimited General Obligation | | |
| 3.00%, due 11/1/34 | 3,650,000 | 3,155,279 |
| 4.00%, due 3/1/36 | 3,395,000 | 3,325,754 |
| 4.00%, due 10/1/36 | 4,150,000 | 4,056,912 |
| 4.00%, due 11/1/36 | 2,500,000 | 2,444,730 |
| 4.00%, due 10/1/37 | 4,445,000 | 4,320,670 |
| 4.00%, due 11/1/38 | 4,775,000 | 4,596,916 |
| 4.00%, due 10/1/39 | 3,500,000 | 3,314,117 |
| 4.00%, due 3/1/40 | 5,000,000 | 4,703,822 |
| 4.00%, due 9/1/42 | 6,250,000 | 5,831,542 |
| 4.00%, due 4/1/49 | 1,895,000 | 1,692,793 |
| 5.00%, due 11/1/28 | 5,000,000 | 5,448,676 |
| 5.00%, due 4/1/29 | 1,000,000 | 1,094,851 |
| 5.00%, due 4/1/30 | 1,780,000 | 1,966,042 |
| 5.00%, due 11/1/30 | 7,000,000 | 7,768,602 |
| 5.00%, due 10/1/31 | 1,475,000 | 1,644,878 |
| 5.00%, due 9/1/32 | 1,840,000 | 2,046,868 |
| 5.00%, due 9/1/42 | 3,550,000 | 3,784,039 |
| 5.25%, due 9/1/47 | 4,000,000 | 4,336,184 |
| State of California, Various Purposes, Unlimited General Obligation | | |
| 4.00%, due 10/1/37 | 4,000,000 | 3,888,117 |
The notes to the financial statements are an integral part of, and should be read in conjunction with, the financial statements.
19
Portfolio of Investments October 31, 2022† (continued)
| | Principal
Amount | Value |
| Long-Term Municipal Bonds (continued) |
| General Obligation (continued) |
| Sweetwater Union High School District, Unlimited General Obligation | | |
| Insured: BAM | | |
| 4.00%, due 8/1/47 | $ 3,000,000 | $ 2,590,252 |
| Tahoe Forest Hospital District, California Hospital District, Unlimited General Obligation | | |
| 5.00%, due 8/1/29 | 1,815,000 | 1,916,919 |
| Temecula Valley Unified School District, Election 2012, Unlimited General Obligation | | |
| Series D | | |
| 3.00%, due 8/1/44 | 1,500,000 | 1,093,194 |
| Series C | | |
| 5.25%, due 8/1/44 | 1,000,000 | 1,036,969 |
| Turlock Unified School District, School Facilities Improvement District No. 1, Unlimited General Obligation | | |
| 4.00%, due 8/1/33 | 480,000 | 482,879 |
| 4.00%, due 8/1/34 | 515,000 | 515,361 |
| 4.00%, due 8/1/35 | 545,000 | 537,419 |
| Ukiah Unified School District, Election of 2020, Unlimited General Obligation | | |
| Series B, Insured: AGM | | |
| 5.50%, due 8/1/53 | 2,500,000 | 2,645,922 |
| Vacaville Unified School District, Election 2014, Unlimited General Obligation | | |
| Series C | | |
| 4.00%, due 8/1/31 | 490,000 | 496,077 |
| Series C | | |
| 4.00%, due 8/1/32 | 555,000 | 560,738 |
| Series C | | |
| 4.00%, due 8/1/33 | 625,000 | 628,748 |
| Series D | | |
| 4.00%, due 8/1/36 | 300,000 | 285,058 |
| Series D | | |
| 4.00%, due 8/1/37 | 300,000 | 279,880 |
| Series D | | |
| 4.00%, due 8/1/38 | 500,000 | 459,775 |
| Series D | | |
| 4.00%, due 8/1/40 | 500,000 | 455,894 |
| Series D | | |
| 4.00%, due 8/1/45 | 2,050,000 | 1,811,174 |
| Series C | | |
| 5.00%, due 8/1/39 | 500,000 | 519,600 |
| Series C | | |
| 5.00%, due 8/1/40 | 1,225,000 | 1,271,451 |
| | Principal
Amount | Value |
| |
| General Obligation (continued) |
Vacaville Unified School District, Election 2014, Unlimited General Obligation
(continued) | | |
| Series C | | |
| 5.00%, due 8/1/41 | $ 1,350,000 | $ 1,397,767 |
| Series C | | |
| 5.00%, due 8/1/42 | 1,000,000 | 1,034,251 |
| Val Verde Unified School District, Election of 2020, Unlimited General Obligation | | |
| Series B, Insured: AGM | | |
| 4.00%, due 8/1/51 | 1,000,000 | 853,067 |
| Washington Township Health Care District, Unlimited General Obligation | | |
| Series A | | |
| 4.00%, due 8/1/47 | 3,000,000 | 2,566,666 |
| Series A | | |
| 4.00%, due 8/1/51 | 2,500,000 | 2,105,601 |
| West Contra Costa Unified School District, Election 2010, Unlimited General Obligation | | |
| Series E | | |
| 4.00%, due 8/1/38 | 1,500,000 | 1,392,641 |
| West Contra Costa Unified School District, Election 2012, Unlimited General Obligation | | |
| Series D | | |
| 4.00%, due 8/1/38 | 1,500,000 | 1,392,641 |
| Westminster School District, Election 2008, Unlimited General Obligation | | |
| Series B, Insured: BAM | | |
| (zero coupon), due 8/1/48 | 5,000,000 | 871,710 |
| | | 370,002,291 |
| Hospital 4.5% |
| California Health Facilities Financing Authority, Cedars Sinai Health System, Revenue Bonds | | |
| Series A, Insured: BAM | | |
| 3.00%, due 8/15/51 | 8,390,000 | 5,701,513 |
| Series A | | |
| 5.00%, due 8/15/51 | 750,000 | 761,958 |
| California Health Facilities Financing Authority, Children's Hospital Los Angeles Obligated Group, Revenue Bonds | | |
| Series A | | |
| 5.00%, due 8/15/42 | 500,000 | 478,477 |
The notes to the financial statements are an integral part of, and should be read in conjunction with, the financial statements.
| 20 | MainStay MacKay California Tax Free Opportunities Fund |
| | Principal
Amount | Value |
| Long-Term Municipal Bonds (continued) |
| Hospital (continued) |
| California Health Facilities Financing Authority, Children's Hospital Los Angeles Obligated Group, Revenue Bonds (continued) | | |
| Series A | | |
| 5.00%, due 8/15/47 | $ 1,000,000 | $ 949,937 |
| California Health Facilities Financing Authority, Children's Hospital of Orange County, Revenue Bonds | | |
| Series A | | |
| 4.00%, due 11/1/37 | 500,000 | 461,050 |
| California Health Facilities Financing Authority, El Camino Hospital, Revenue Bonds | | |
| 4.125%, due 2/1/47 | 750,000 | 652,638 |
| California Health Facilities Financing Authority, Kaiser Foundation Hospitals, Revenue Bonds | | |
| Series C | | |
| 5.00%, due 6/1/41 (d) | 750,000 | 820,032 |
| California Health Facilities Financing Authority, Lucile Salter Packard Children's Hospital at Stanford, Revenue Bonds | | |
| Series A | | |
| 4.00%, due 5/15/46 | 1,700,000 | 1,472,446 |
| California Health Facilities Financing Authority, Stanford Health Care Obligated Group, Revenue Bonds | | |
| Series A | | |
| 5.00%, due 11/15/36 | 3,000,000 | 3,113,216 |
| California Health Facilities Financing Authority, Sutter Health Obligated Group, Revenue Bonds | | |
| Series A | | |
| 5.00%, due 11/15/38 | 1,600,000 | 1,636,456 |
| California Municipal Finance Authority, Community Medical Centers, Revenue Bonds | | |
| Series A | | |
| 5.00%, due 2/1/27 | 1,100,000 | 1,134,089 |
| Series A | | |
| 5.00%, due 2/1/37 | 1,000,000 | 1,011,882 |
| California Municipal Finance Authority, Healthright 360, Revenue Bonds | | |
| Series A | | |
| 5.00%, due 11/1/39 (c) | 1,000,000 | 912,790 |
| | Principal
Amount | Value |
| |
| Hospital (continued) |
| California Public Finance Authority, Hoag Memorial Hospital Presbyterian, Revenue Bonds | | |
| Series A | | |
| 4.00%, due 7/15/38 | $ 4,520,000 | $ 4,168,506 |
| California Statewide Communities Development Authority, Enloe Medical Center Obligated Group, Revenue Bonds (a) | | |
| Series A, Insured: AGM | | |
| 5.00%, due 8/15/42 | 1,000,000 | 983,310 |
| Series A, Insured: AGM | | |
| 5.25%, due 8/15/52 | 3,000,000 | 2,971,154 |
| California Statewide Communities Development Authority, Methodist Hospital of Southern California, Revenue Bonds | | |
| 5.00%, due 1/1/48 | 1,000,000 | 945,441 |
| Regents of the University of California Medical Center, Pooled, Revenue Bonds | | |
| Series P | | |
| 4.00%, due 5/15/43 | 8,625,000 | 7,844,645 |
| Series P | | |
| 5.00%, due 5/15/47 | 7,400,000 | 7,468,599 |
| Washington Township Health Care District, Revenue Bonds | | |
| Series B | | |
| 4.00%, due 7/1/36 | 1,380,000 | 1,133,808 |
| | | 44,621,947 |
| Housing 2.6% |
| California Community College Financing Authority, Orange Coast College Project, Revenue Bonds | | |
| 5.00%, due 5/1/29 | 800,000 | 802,285 |
| California Enterprise Development Authority, Provident Group-SDSU Properties LLC M@College Project, Revenue Bonds, First Tier | | |
| Series A | | |
| 5.00%, due 8/1/40 | 650,000 | 619,787 |
| Series A | | |
| 5.00%, due 8/1/45 | 700,000 | 648,836 |
| Series A | | |
| 5.00%, due 8/1/55 | 1,000,000 | 897,958 |
The notes to the financial statements are an integral part of, and should be read in conjunction with, the financial statements.
21
Portfolio of Investments October 31, 2022† (continued)
| | Principal
Amount | Value |
| Long-Term Municipal Bonds (continued) |
| Housing (continued) |
| California Municipal Finance Authority, CHF Davis I LLC, Revenue Bonds | | |
| Insured: BAM | | |
| 5.00%, due 5/15/29 | $ 5,000,000 | $ 5,174,491 |
| California Municipal Finance Authority, Mobile Home Park Caritas Project, Revenue Bonds, Senior Lien | | |
| Series A | | |
| 4.00%, due 8/15/42 | 1,540,000 | 1,336,494 |
| Series A | | |
| 5.00%, due 8/15/29 | 805,000 | 829,061 |
| Series A | | |
| 5.00%, due 8/15/31 | 140,000 | 142,937 |
| California Municipal Finance Authority, P3 Claremont Holdings LLC, Claremont Colleges Project, Revenue Bonds | | |
| Series A | | |
| 5.00%, due 7/1/40 (c) | 1,000,000 | 879,017 |
| California Municipal Finance Authority, Windsor Mobile Country Club, Revenue Bonds | | |
| Series A | | |
| 4.00%, due 11/15/37 | 1,320,000 | 1,167,985 |
| California School Finance Authority, Sonoma County Junior College Project, Revenue Bonds | | |
| Series A | | |
| 4.00%, due 11/1/36 (c) | 2,000,000 | 1,568,381 |
| California Statewide Communities Development Authority, CHF-Irvine LLC, Student Housing, Revenue Bonds | | |
| 5.00%, due 5/15/40 | 1,000,000 | 982,793 |
| 5.00%, due 5/15/47 | 3,500,000 | 3,283,685 |
| California Statewide Communities Development Authority, Provident Group Pomona Properties LLC Project, Revenue Bonds | | |
| Series A | | |
| 5.75%, due 1/15/45 (c) | 400,000 | 395,023 |
| Hastings Campus Housing Finance Authority, Green Bond, Revenue Bonds, Senior Lien (c) | | |
| Series A | | |
| 5.00%, due 7/1/45 | 4,500,000 | 3,704,802 |
| | Principal
Amount | Value |
| |
| Housing (continued) |
| Hastings Campus Housing Finance Authority, Green Bond, Revenue Bonds, Senior Lien (c) (continued) | | |
| Series A | | |
| 5.00%, due 7/1/61 | $ 4,000,000 | $ 3,064,114 |
| | | 25,497,649 |
| Other Revenue 21.7% |
| Alameda County Transportation Commission, Measure BB, Revenue Bonds, Senior Lien | | |
| 5.00%, due 3/1/45 | 2,500,000 | 2,655,400 |
| Anaheim Public Financing Authority, Public Improvement Project, Revenue Bonds | | |
| Series A, Insured: AGM-CR | | |
| 5.00%, due 9/1/28 | 2,250,000 | 2,397,981 |
| California Community Choice Financing Authority, Revenue Bonds | | |
| Series B-1 | | |
| 4.00%, due 2/1/30 | 1,400,000 | 1,348,164 |
| Series B-1 | | |
| 4.00%, due 2/1/31 | 1,000,000 | 950,095 |
| Series A-1 | | |
| 4.00%, due 5/1/53 (d) | 1,000,000 | 960,945 |
| California Community Choice Financing Authority, Clean Energy Project, Revenue Bonds | | |
| Series A | | |
| 4.00%, due 10/1/52 (d) | 4,500,000 | 4,391,884 |
| California Community Choice Financing Authority, Clean Energy Project, Green Bond, Revenue Bonds | | |
| Series B-1 | | |
| 4.00%, due 8/1/27 | 400,000 | 393,146 |
| Series B-1 | | |
| 4.00%, due 8/1/28 | 465,000 | 453,046 |
| Series B-1 | | |
| 4.00%, due 2/1/29 | 650,000 | 631,018 |
| Series B-1 | | |
| 4.00%, due 2/1/52 (d) | 5,250,000 | 4,901,132 |
| California Community Housing Agency, Essential Housing, Revenue Bonds, Senior Lien | | |
| Series A1 | | |
| 4.00%, due 2/1/56 (c) | 6,285,000 | 4,715,968 |
The notes to the financial statements are an integral part of, and should be read in conjunction with, the financial statements.
| 22 | MainStay MacKay California Tax Free Opportunities Fund |
| | Principal
Amount | Value |
| Long-Term Municipal Bonds (continued) |
| Other Revenue (continued) |
| California Community Housing Agency, Fountains at Emerald, Revenue Bonds, Senior Lien | | |
| Series A-1 | | |
| 3.00%, due 8/1/56 (c) | $ 2,700,000 | $ 1,623,554 |
| California Community Housing Agency, Summit at Sausalito Apartments, Revenue Bonds | | |
| Series A-1 | | |
| 3.00%, due 2/1/57 (c) | 500,000 | 303,551 |
| California County Tobacco Securitization Agency, Golden Gate Tobacco Funding Corp., Asset-Backed, Revenue Bonds | | |
| Series A | | |
| 5.00%, due 6/1/47 | 1,275,000 | 1,089,901 |
| California County Tobacco Securitization Agency, Tobacco Settlement, Revenue Bonds, Senior Lien | | |
| Series A | | |
| 4.00%, due 6/1/34 | 300,000 | 276,842 |
| Series A | | |
| 4.00%, due 6/1/35 | 500,000 | 456,669 |
| Series A | | |
| 4.00%, due 6/1/36 | 300,000 | 271,766 |
| Series A | | |
| 4.00%, due 6/1/37 | 275,000 | 246,609 |
| Series A | | |
| 4.00%, due 6/1/38 | 275,000 | 243,883 |
| Series A | | |
| 4.00%, due 6/1/39 | 350,000 | 306,608 |
| Series A | | |
| 4.00%, due 6/1/40 | 500,000 | 431,496 |
| Series A | | |
| 4.00%, due 6/1/49 | 1,500,000 | 1,164,937 |
| California Health Facilities Financing Authority, Lundquist Institute For Biomedical Innovation, Revenue Bonds | | |
| 5.00%, due 9/1/30 | 1,300,000 | 1,332,150 |
| 5.00%, due 9/1/31 | 1,365,000 | 1,390,511 |
| 5.00%, due 9/1/32 | 1,435,000 | 1,450,239 |
| 5.00%, due 9/1/34 | 1,590,000 | 1,597,416 |
| | Principal
Amount | Value |
| |
| Other Revenue (continued) |
| California Infrastructure and Economic Development Bank, California State Teachers' Retirement System, Green Bond, Revenue Bonds | | |
| 5.00%, due 8/1/37 | $ 1,050,000 | $ 1,091,565 |
| 5.00%, due 8/1/38 | 1,200,000 | 1,244,464 |
| California Infrastructure and Economic Development Bank, Salvation Army Western Territory (The), Revenue Bonds | | |
| 4.00%, due 9/1/33 | 1,225,000 | 1,221,359 |
| 4.00%, due 9/1/34 | 1,000,000 | 950,461 |
| California Municipal Finance Authority, Asian Community Center of Sacramento Valley, Inc., Revenue Bonds | | |
| Insured: California Mortgage Insurance | | |
| 5.00%, due 4/1/48 | 1,545,000 | 1,598,313 |
| California Municipal Finance Authority, Orange County Civic Center Infrastructure Program, Revenue Bonds | | |
| Series A | | |
| 5.00%, due 6/1/37 | 2,085,000 | 2,189,750 |
| California Municipal Finance Authority, United Airlines, Inc. Project, Revenue Bonds | | |
| 4.00%, due 7/15/29 (e) | 9,000,000 | 8,358,447 |
| California Pollution Control Financing Authority, Poseidon Resources Channelside LP, Revenue Bonds | | |
| 5.00%, due 7/1/37 (c)(e) | 3,000,000 | 2,815,637 |
| California State Public Works Board, Revenue Bonds | | |
| Series C | | |
| 5.00%, due 8/1/30 | 1,080,000 | 1,191,512 |
| California Statewide Communities Development Authority, A Community of Seniors, Redwoods Project, Revenue Bonds | | |
| Series A, Insured: California Mortgage Insurance | | |
| 5.375%, due 11/15/44 | 535,000 | 547,305 |
The notes to the financial statements are an integral part of, and should be read in conjunction with, the financial statements.
23
Portfolio of Investments October 31, 2022† (continued)
| | Principal
Amount | Value |
| Long-Term Municipal Bonds (continued) |
| Other Revenue (continued) |
| California Statewide Communities Development Authority, California Baptist University, Revenue Bonds | | |
| Series A | | |
| 6.375%, due 11/1/43 (c) | $ 500,000 | $ 506,509 |
| California Statewide Financing Authority, Tobacco Settlement Asset-Backed, Revenue Bonds | | |
| Series C | | |
| (zero coupon), due 6/1/55 (c) | 20,000,000 | 999,654 |
| Children's Trust Fund, Asset-Backed, Revenue Bonds | | |
| Series A | | |
| (zero coupon), due 5/15/50 | 1,500,000 | 258,504 |
| City of Sacramento CA, Transient Occupancy Tax, Revenue Bonds | | |
| Series C | | |
| 5.00%, due 6/1/48 | 4,860,000 | 4,904,908 |
| City of Santa Ana CA, Gas Tax, Revenue Bonds | | |
| 4.00%, due 1/1/38 | 1,360,000 | 1,259,737 |
| City of Victorville CA, Electric, Revenue Bonds | | |
| Series A | | |
| 5.00%, due 5/1/38 | 1,115,000 | 1,118,424 |
| CMFA Special Finance Agency VIII, Revenue Bonds, Senior Lien | | |
| Series A-1 | | |
| 3.00%, due 8/1/56 (c) | 1,000,000 | 600,413 |
| CSCDA Community Improvement Authority, 1818 Platinum Triangle-Anaheim, Revenue Bonds, Senior Lien | | |
| Series A-2 | | |
| 3.25%, due 4/1/57 (c) | 4,000,000 | 2,503,758 |
| CSCDA Community Improvement Authority, City of Orange Portfolio, Revenue Bonds, Senior Lien | | |
| Series A-2 | | |
| 3.00%, due 3/1/57 (c) | 4,800,000 | 2,875,950 |
| CSCDA Community Improvement Authority, Dublin, Revenue Bonds, Senior Lien | | |
| Series A-2 | | |
| 3.00%, due 2/1/57 (c) | 1,250,000 | 746,774 |
| | Principal
Amount | Value |
| |
| Other Revenue (continued) |
| CSCDA Community Improvement Authority, Oceanaire Long Beach, Revenue Bonds | | |
| Series A | | |
| 4.00%, due 9/1/56 (c) | $ 7,000,000 | $ 4,998,181 |
| CSCDA Community Improvement Authority, Pasadena Portfolio, Revenue Bonds, Senior Lien (c) | | |
| Series A-1 | | |
| 2.65%, due 12/1/46 | 1,245,000 | 885,070 |
| Series A-2 | | |
| 3.00%, due 12/1/56 | 1,000,000 | 597,061 |
| CSCDA Community Improvement Authority, Renaissance at City Center, Revenue Bonds | | |
| Series A | | |
| 5.00%, due 7/1/51 (c) | 2,000,000 | 1,703,607 |
| CSCDA Community Improvement Authority, Theo Pasadena, Revenue Bonds, Senior Lien | | |
| Series A-2 | | |
| 3.25%, due 5/1/57 (c) | 4,500,000 | 2,876,949 |
| Del Mar Race Track Authority, Revenue Bonds | | |
| 5.00%, due 10/1/30 | 1,000,000 | 991,586 |
| FHLMC Multifamily VRD Certificates, VRD Certificates, Revenue Bonds | | |
| Series M-057 | | |
| 2.40%, due 10/15/29 | 2,995,000 | 2,730,469 |
| Golden State Tobacco Securitization Corp., Asset-Backed, Revenue Bonds | | |
| Series B-2 | | |
| (zero coupon), due 6/1/66 | 48,750,000 | 4,083,592 |
| Guam Economic Development & Commerce Authority, Tobacco Settlement Asset-Backed, Revenue Bonds | | |
| Series A | | |
| 5.625%, due 6/1/47 | 1,025,000 | 874,540 |
| Guam Government Waterworks Authority, Water and Wastewater System, Revenue Bonds | | |
| 5.25%, due 7/1/33 | 1,100,000 | 1,114,712 |
| 5.50%, due 7/1/43 | 3,500,000 | 3,552,507 |
| Imperial Irrigation District Electric System, Revenue Bonds | | |
| Series C | | |
| 5.00%, due 11/1/37 | 1,000,000 | 1,041,069 |
The notes to the financial statements are an integral part of, and should be read in conjunction with, the financial statements.
| 24 | MainStay MacKay California Tax Free Opportunities Fund |
| | Principal
Amount | Value |
| Long-Term Municipal Bonds (continued) |
| Other Revenue (continued) |
| Imperial Irrigation District Electric System, Revenue Bonds (continued) | | |
| Series B-2 | | |
| 5.00%, due 11/1/41 | $ 5,475,000 | $ 5,670,768 |
| Indio Finance Authority, Revenue Bonds | | |
| Series A, Insured: BAM | | |
| 4.50%, due 11/1/52 | 2,000,000 | 1,883,228 |
| Series A, Insured: BAM | | |
| 5.25%, due 11/1/42 | 1,500,000 | 1,586,706 |
| Livermore Valley Water Financing Authority, Alameda County Flood Control & Water Conservation District Zone No. 7, Revenue Bonds | | |
| Series A | | |
| 5.00%, due 7/1/47 | 3,945,000 | 4,108,225 |
| Lodi Public Financing Authority, Electric System, Revenue Bonds | | |
| Insured: AGM | | |
| 5.00%, due 9/1/31 | 1,330,000 | 1,419,197 |
| Insured: AGM | | |
| 5.00%, due 9/1/32 | 1,650,000 | 1,751,904 |
| Los Angeles County Facilities, Inc., County of Los Angeles, Revenue Bonds | | |
| Series A | | |
| 5.00%, due 12/1/38 | 1,910,000 | 1,998,584 |
| Los Angeles County Metropolitan Transportation Authority, Sales Tax, Revenue Bonds | | |
| Series A | | |
| 4.00%, due 6/1/36 | 3,000,000 | 2,938,792 |
| Series A | | |
| 4.00%, due 6/1/37 | 6,245,000 | 6,072,259 |
| Matching Fund Special Purpose Securitization Corp., Revenue Bonds | | |
| Series A | | |
| 5.00%, due 10/1/30 | 3,140,000 | 3,178,958 |
| Series A | | |
| 5.00%, due 10/1/32 | 3,140,000 | 3,163,555 |
| Series A | | |
| 5.00%, due 10/1/39 | 9,415,000 | 9,283,560 |
| Montclair Financing Authority, Public Facilities Project, Revenue Bonds | | |
| Insured: AGM | | |
| 5.00%, due 10/1/32 | 1,000,000 | 1,025,032 |
| | Principal
Amount | Value |
| |
| Other Revenue (continued) |
| Mountain House Public Financing Authority, Green Bond, Revenue Bonds | | |
| Series B, Insured: BAM | | |
| 4.00%, due 12/1/40 | $ 1,380,000 | $ 1,229,026 |
| Orange County Local Transportation Authority, Sales Tax, Revenue Bonds | | |
| 4.00%, due 2/15/38 | 10,000,000 | 9,423,254 |
| Peninsula Corridor Joint Powers Board, Green Bond, Revenue Bonds | | |
| Series A | | |
| 5.00%, due 6/1/47 | 2,250,000 | 2,360,787 |
| Pico Rivera Public Financing Authority, City of Pico Rivera, Revenue Bonds | | |
| Insured: NATL-RE | | |
| 5.25%, due 9/1/34 | 1,560,000 | 1,649,785 |
| Puerto Rico Sales Tax Financing Corp., Revenue Bonds | | |
| Series A-1 | | |
| (zero coupon), due 7/1/46 | 1,860,000 | 405,117 |
| Series A-1 | | |
| 4.50%, due 7/1/34 | 1,500,000 | 1,363,710 |
| Series A-1 | | |
| 5.00%, due 7/1/58 | 18,000,000 | 15,479,786 |
| Riverside County Transportation Commission, Sales Tax, Revenue Bonds | | |
| Series B | | |
| 4.00%, due 6/1/36 | 5,000,000 | 4,877,749 |
| San Bernardino County Financing Authority, Court House Facilities Project, Revenue Bonds | | |
| Series C, Insured: NATL-RE | | |
| 5.50%, due 6/1/37 | 1,050,000 | 1,006,645 |
| San Diego County Regional Transportation Commission, Green Bond, Revenue Bonds | | |
| Series A | | |
| 5.00%, due 4/1/38 | 1,000,000 | 1,068,270 |
| Series A | | |
| 5.00%, due 4/1/39 | 1,000,000 | 1,065,918 |
| Series A | | |
| 5.00%, due 4/1/44 | 2,800,000 | 2,955,576 |
| San Francisco Bay Area Rapid Transit District, Sales Tax, Revenue Bonds | | |
| Series A | | |
| 4.00%, due 7/1/36 | 1,850,000 | 1,794,758 |
The notes to the financial statements are an integral part of, and should be read in conjunction with, the financial statements.
25
Portfolio of Investments October 31, 2022† (continued)
| | Principal
Amount | Value |
| Long-Term Municipal Bonds (continued) |
| Other Revenue (continued) |
| San Joaquin County Transportation Authority, Sales Tax Revenue, Revenue Bonds | | |
| Series K | | |
| 5.00%, due 3/1/37 | $ 1,705,000 | $ 1,769,593 |
| San Mateo Joint Powers Financing Authority, Capital Projects, Revenue Bonds | | |
| Series A | | |
| 5.00%, due 7/15/43 | 3,000,000 | 3,129,461 |
| South Bayside Waste Management Authority, Green Bond, Revenue Bonds | | |
| Series B, Insured: AGM | | |
| 5.00%, due 9/1/25 (e) | 50,000 | 52,112 |
| Series B, Insured: AGM | | |
| 5.00%, due 9/1/27 (e) | 55,000 | 58,675 |
| Series B, Insured: AGM | | |
| 5.00%, due 9/1/29 (e) | 15,000 | 16,241 |
| Series B, Insured: AGM | | |
| 5.00%, due 9/1/30 (e) | 25,000 | 27,068 |
| Series B, Insured: AGM | | |
| 5.00%, due 9/1/31 (e) | 15,000 | 16,241 |
| Series 2019A, Insured: AGM | | |
| 5.00%, due 9/1/32 | 15,000 | 16,335 |
| Series 2019A, Insured: AGM | | |
| 5.00%, due 9/1/39 | 80,000 | 87,121 |
| Series A, Insured: AGM | | |
| 5.00%, due 9/1/40 | 2,435,000 | 2,528,870 |
| South San Francisco Public Facilities Financing Authority, Multiple Capital Projects at Orange Memorial Park, Revenue Bonds | | |
| Series A | | |
| 5.00%, due 6/1/40 | 1,150,000 | 1,212,160 |
| Series A | | |
| 5.25%, due 6/1/46 | 1,000,000 | 1,058,797 |
| Southern California Public Power Authority, Windy Point/Windy Flats Project, Revenue Bonds | | |
| Series 1 | | |
| 5.00%, due 7/1/30 | 3,125,000 | 3,184,374 |
| Stockton Public Financing Authority, Water Revenue, Green Bonds, Revenue Bonds | | |
| Series A, Insured: BAM | | |
| 4.00%, due 10/1/37 | 2,500,000 | 2,332,307 |
| | Principal
Amount | Value |
| |
| Other Revenue (continued) |
| Stockton Public Financing Authority, Water Revenue, Green Bonds, Revenue Bonds (continued) | | |
| Series A, Insured: BAM | | |
| 5.00%, due 10/1/32 | $ 1,275,000 | $ 1,359,318 |
| Series A, Insured: BAM | | |
| 5.00%, due 10/1/34 | 1,500,000 | 1,581,921 |
| Territory of Guam, Business Privilege Tax, Revenue Bonds | | |
| Series D | | |
| 5.00%, due 11/15/27 | 2,000,000 | 2,002,315 |
| Series D | | |
| 5.00%, due 11/15/33 | 2,300,000 | 2,238,884 |
| Tobacco Securitization Authority of Northern California, Sacramento County Tobacco Securitization Corp., Revenue Bonds, Senior Lien | | |
| 4.00%, due 6/1/49 | 805,000 | 743,407 |
| Tobacco Securitization Authority of Southern California, San Diego County Tobacco Asset Securitization Corp., Asset-Backed, Revenue Bonds | | |
| Series A | | |
| 5.00%, due 6/1/48 | 2,400,000 | 2,311,260 |
| Virgin Islands Public Finance Authority, Gross Receipts Taxes Loan, Revenue Bonds | | |
| Series A | | |
| 5.00%, due 10/1/29 (c) | 1,500,000 | 1,425,345 |
| Series A | | |
| 5.00%, due 10/1/32 | 1,250,000 | 1,156,451 |
| | | 215,487,103 |
| Transportation 12.2% |
| Alameda Corridor Transportation Authority, Revenue Bonds | | |
| Series C, Insured: AGM | | |
| 5.00%, due 10/1/52 | 3,500,000 | 3,497,635 |
| Antonio B Won Pat International Airport Authority, Revenue Bonds (e) | | |
| Series C, Insured: AGM | | |
| 6.00%, due 10/1/34 | 720,000 | 734,429 |
| Series C, Insured: AGM | | |
| 6.00%, due 10/1/34 | 280,000 | 285,611 |
| Bay Area Toll Authority, Revenue Bonds | | |
| Series S-7 | | |
| 4.00%, due 4/1/35 | 3,500,000 | 3,454,690 |
The notes to the financial statements are an integral part of, and should be read in conjunction with, the financial statements.
| 26 | MainStay MacKay California Tax Free Opportunities Fund |
| | Principal
Amount | Value |
| Long-Term Municipal Bonds (continued) |
| Transportation (continued) |
| California Municipal Finance Authority, LAX Integrated Express Solutions LLC, Revenue Bonds, Senior Lien | | |
| Series A | | |
| 5.00%, due 12/31/33 (e) | $ 3,800,000 | $ 3,800,758 |
| California Municipal Finance Authority, LINXS APM Project, Revenue Bonds, Senior Lien | | |
| Series A, Insured: AGM | | |
| 3.25%, due 12/31/32 (e) | 1,000,000 | 851,099 |
| City of Long Beach CA, Airport System, Revenue Bonds | | |
| Series A, Insured: AGM | | |
| 5.00%, due 6/1/33 | 550,000 | 596,695 |
| Series A, Insured: AGM | | |
| 5.00%, due 6/1/34 | 410,000 | 443,402 |
| Series B, Insured: AGM | | |
| 5.00%, due 6/1/35 | 310,000 | 332,665 |
| Series A, Insured: AGM | | |
| 5.00%, due 6/1/36 | 800,000 | 852,733 |
| Series A, Insured: AGM | | |
| 5.00%, due 6/1/37 | 750,000 | 794,089 |
| Series A, Insured: AGM | | |
| 5.00%, due 6/1/38 | 750,000 | 788,495 |
| Series A, Insured: AGM | | |
| 5.00%, due 6/1/39 | 500,000 | 524,243 |
| Series B, Insured: AGM | | |
| 5.00%, due 6/1/40 | 750,000 | 784,202 |
| City of Long Beach CA, Harbor, Revenue Bonds | | |
| Series A | | |
| 5.00%, due 5/15/36 | 1,000,000 | 1,060,709 |
| Series A | | |
| 5.00%, due 5/15/37 | 3,475,000 | 3,667,698 |
| City of Los Angeles CA, Department of Airports, Revenue Bonds | | |
| Series D | | |
| 3.00%, due 5/15/39 (e) | 2,500,000 | 1,894,969 |
| Series B | | |
| 5.00%, due 5/15/25 (e) | 710,000 | 731,356 |
| Series D | | |
| 5.00%, due 5/15/26 (e) | 1,000,000 | 1,030,594 |
| Series D | | |
| 5.00%, due 5/15/31 (e) | 2,815,000 | 2,889,374 |
| Series C | | |
| 5.00%, due 5/15/32 (e) | 1,000,000 | 1,031,247 |
| | Principal
Amount | Value |
| |
| Transportation (continued) |
| City of Los Angeles CA, Department of Airports, Revenue Bonds (continued) | | |
| Series D | ��� | |
| 5.00%, due 5/15/35 (e) | $ 2,000,000 | $ 2,015,593 |
| Series A | | |
| 5.00%, due 5/15/36 | 3,500,000 | 3,715,571 |
| 5.00%, due 5/15/38 (e) | 1,000,000 | 1,000,032 |
| Series A | | |
| 5.25%, due 5/15/48 (e) | 1,375,000 | 1,377,034 |
| City of Los Angeles CA, Department of Airports, Revenue Bonds, Senior Lien | | |
| Series C | | |
| 5.00%, due 5/15/29 (e) | 5,000,000 | 5,221,737 |
| Series A | | |
| 5.00%, due 5/15/40 (e) | 5,000,000 | 5,000,987 |
| Series I | | |
| 5.00%, due 5/15/48 | 6,175,000 | 6,361,164 |
| Series H | | |
| 5.25%, due 5/15/47 (e) | 4,100,000 | 4,150,803 |
| Series G | | |
| 5.50%, due 5/15/38 (e) | 5,000,000 | 5,232,030 |
| City of Palm Springs CA, Airport Passenger Facility Charge, Revenue Bonds | | |
| Insured: BAM | | |
| 5.00%, due 6/1/31 (e) | 1,130,000 | 1,141,351 |
| Foothill-Eastern Transportation Corridor Agency, Revenue Bonds, Senior Lien | | |
| Series A | | |
| 4.00%, due 1/15/46 | 1,500,000 | 1,228,922 |
| Series A | | |
| 4.00%, due 1/15/46 | 7,270,000 | 5,956,173 |
| Norman Y Mineta San Jose International Airport SJC, Revenue Bonds (e) | | |
| Series A | | |
| 5.00%, due 3/1/30 | 1,855,000 | 1,899,515 |
| Series A | | |
| 5.00%, due 3/1/47 | 6,890,000 | 6,647,959 |
| Peninsula Corridor Joint Powers Board, Farebox, Revenue Bonds | | |
| Series A | | |
| 5.00%, due 10/1/32 | 500,000 | 537,347 |
| Series A | | |
| 5.00%, due 10/1/33 | 500,000 | 535,197 |
| Series A | | |
| 5.00%, due 10/1/34 | 500,000 | 533,515 |
| Series A | | |
| 5.00%, due 10/1/35 | 350,000 | 372,686 |
The notes to the financial statements are an integral part of, and should be read in conjunction with, the financial statements.
27
Portfolio of Investments October 31, 2022† (continued)
| | Principal
Amount | Value |
| Long-Term Municipal Bonds (continued) |
| Transportation (continued) |
| Peninsula Corridor Joint Powers Board, Farebox, Revenue Bonds (continued) | | |
| Series A | | |
| 5.00%, due 10/1/44 | $ 4,035,000 | $ 4,139,694 |
| Port of Oakland, Revenue Bonds | | |
| 5.00%, due 5/1/29 (e) | 1,900,000 | 2,000,479 |
| Puerto Rico Highway & Transportation Authority, Revenue Bonds | | |
| Series D, Insured: AGM | | |
| 5.00%, due 7/1/32 | 1,205,000 | 1,213,407 |
| Series G, Insured: AGC-ICC | | |
| 5.00%, due 7/1/42 | 40,000 | 40,279 |
| Insured: AMBAC | | |
| 5.50%, due 7/1/26 | 460,000 | 460,902 |
| Riverside County Transportation Commission, Revenue Bonds, Senior Lien | | |
| Series B-1, Insured: BAM | | |
| 3.00%, due 6/1/49 | 5,000,000 | 3,409,953 |
| San Francisco City & County Airport Commission, San Francisco International Airport, Revenue Bonds | | |
| Series A | | |
| 5.00%, due 5/1/49 (e) | 3,460,000 | 3,323,946 |
| San Francisco City & County Airport Commission, San Francisco International Airport, Revenue Bonds, Second Series | | |
| Series B | | |
| 4.00%, due 5/1/52 | 2,000,000 | 1,665,194 |
| Series H | | |
| 5.00%, due 5/1/27 (e) | 7,000,000 | 7,198,893 |
| Series D | | |
| 5.00%, due 5/1/30 | 2,595,000 | 2,790,286 |
| Series D | | |
| 5.00%, due 5/1/31 | 2,200,000 | 2,353,968 |
| San Francisco Municipal Transportation Agency, Green Bond, Revenue Bonds | | |
| Series C | | |
| 5.00%, due 3/1/51 | 1,170,000 | 1,198,374 |
| San Joaquin Hills Transportation Corridor Agency, Revenue Bonds, Junior Lien | | |
| Series B | | |
| 5.25%, due 1/15/44 | 4,500,000 | 4,508,710 |
| | Principal
Amount | Value |
| |
| Transportation (continued) |
| San Joaquin Hills Transportation Corridor Agency, Revenue Bonds, Senior Lien | | |
| Series A | | |
| 4.00%, due 1/15/50 | $ 3,948,000 | $ 3,259,160 |
| | | 120,537,554 |
| Utilities 1.0% |
| Guam Power Authority, Revenue Bonds | | |
| Series A | | |
| 5.00%, due 10/1/33 | 1,000,000 | 1,016,018 |
| Series A | | |
| 5.00%, due 10/1/40 | 1,000,000 | 1,002,947 |
| Los Angeles Department of Water & Power, Revenue Bonds | | |
| 5.00%, due 7/1/39 | 2,860,000 | 2,999,929 |
| Modesto Irrigation District, Electric System, Revenue Bonds | | |
| Series A | | |
| 5.00%, due 10/1/40 | 1,690,000 | 1,724,299 |
| Puerto Rico Electric Power Authority, Revenue Bonds | | |
| Series UU, Insured: AGC | | |
| 4.25%, due 7/1/27 | 460,000 | 451,451 |
| Series UU, Insured: AGM | | |
| 5.00%, due 7/1/24 | 225,000 | 228,293 |
| Series XX | | |
| 5.25%, due 7/1/40 (f)(g) | 1,000,000 | 752,500 |
| San Francisco City & County Public Utilities Commission Power, Green Bonds, Revenue Bonds | | |
| Series A | | |
| 4.00%, due 11/1/45 | 1,920,000 | 1,750,212 |
| | | 9,925,649 |
| Water & Sewer 7.3% |
| City of Clovis CA, Wastewater, Revenue Bonds | | |
| Insured: AGM | | |
| 5.25%, due 8/1/29 | 500,000 | 526,860 |
| City of Culver City CA, Wastewater Facilities, Revenue Bonds | | |
| Series A | | |
| 4.00%, due 9/1/44 | 1,690,000 | 1,483,493 |
| City of Oxnard CA, Wastewater, Revenue Bonds | | |
| Insured: BAM | | |
| 4.00%, due 6/1/32 | 1,920,000 | 1,946,307 |
The notes to the financial statements are an integral part of, and should be read in conjunction with, the financial statements.
| 28 | MainStay MacKay California Tax Free Opportunities Fund |
| | Principal
Amount | Value |
| Long-Term Municipal Bonds (continued) |
| Water & Sewer (continued) |
| City of Oxnard CA, Wastewater, Revenue Bonds (continued) | | |
| Insured: BAM | | |
| 4.00%, due 6/1/34 | $ 2,080,000 | $ 2,072,309 |
| Insured: BAM | | |
| 5.00%, due 6/1/30 | 1,340,000 | 1,445,245 |
| City of Oxnard CA, Water System, Revenue Bonds | | |
| Insured: BAM | | |
| 5.00%, due 6/1/35 | 1,125,000 | 1,188,203 |
| City of Pasadena CA, Water, Revenue Bonds | | |
| Series A | | |
| 5.00%, due 6/1/38 | 1,480,000 | 1,581,995 |
| City of Vernon CA, Water System, Revenue Bonds | | |
| Series A, Insured: AGM | | |
| 3.375%, due 8/1/40 | 650,000 | 506,559 |
| Series A, Insured: AGM | | |
| 3.50%, due 8/1/45 | 725,000 | 538,792 |
| Series A, Insured: AGM | | |
| 5.00%, due 8/1/30 | 985,000 | 1,049,467 |
| Series A, Insured: AGM | | |
| 5.00%, due 8/1/35 | 1,000,000 | 1,045,965 |
| Colton Utility Authority, Revenue Bonds | | |
| Insured: AGM | | |
| 4.00%, due 3/1/47 | 2,500,000 | 2,152,475 |
| East Bay Municipal Utility District, Water System, Revenue Bonds | | |
| Series A | | |
| 4.00%, due 6/1/33 | 1,060,000 | 1,066,235 |
| Series A | | |
| 5.00%, due 6/1/49 | 3,500,000 | 3,649,757 |
| East Bay Municipal Utility District Water System, Green Bonds, Revenue Bonds | | |
| Series A | | |
| 5.00%, due 6/1/37 | 3,000,000 | 3,297,794 |
| Series A | | |
| 5.00%, due 6/1/38 | 1,800,000 | 1,969,164 |
| Eastern Municipal Water District, Water & Wastewater, Revenue Bonds | | |
| Series A | | |
| 5.00%, due 7/1/45 | 2,850,000 | 2,951,237 |
| | Principal
Amount | Value |
| |
| Water & Sewer (continued) |
| Guam Government Waterworks Authority, Water and Wastewater System, Revenue Bonds | | |
| 5.00%, due 1/1/46 | $ 6,290,000 | $ 6,112,062 |
| Series A | | |
| 5.00%, due 1/1/50 | 2,500,000 | 2,373,194 |
| Los Angeles Department of Water & Power, Revenue Bonds | | |
| Series A | | |
| 5.00%, due 7/1/35 | 1,500,000 | 1,573,194 |
| Series C | | |
| 5.00%, due 7/1/40 | 2,000,000 | 2,110,415 |
| Series C | | |
| 5.00%, due 7/1/41 | 1,035,000 | 1,099,089 |
| Series A | | |
| 5.00%, due 7/1/47 | 1,250,000 | 1,301,820 |
| Metropolitan Water District of Southern California, Waterworks, Revenue Bonds | | |
| Series A | | |
| 5.00%, due 10/1/46 | 3,500,000 | 3,716,704 |
| Oxnard Financing Authority, Waste Water, Revenue Bonds | | |
| Insured: AGM | | |
| 5.00%, due 6/1/34 | 1,000,000 | 1,021,644 |
| Puerto Rico Commonwealth Aqueduct & Sewer Authority, Revenue Bonds (c) | | |
| Series B | | |
| 5.00%, due 7/1/33 | 8,000,000 | 7,471,502 |
| Series B | | |
| 5.00%, due 7/1/37 | 2,225,000 | 2,011,038 |
| Puerto Rico Commonwealth Aqueduct & Sewer Authority, Revenue Bonds, Senior Lien (c) | | |
| Series 2020A | | |
| 5.00%, due 7/1/30 | 1,330,000 | 1,274,328 |
| Series A | | |
| 5.00%, due 7/1/33 | 900,000 | 840,544 |
| Series A | | |
| 5.00%, due 7/1/37 | 450,000 | 406,727 |
| Series A | | |
| 5.00%, due 7/1/37 | 800,000 | 723,070 |
| Rancho Water District Financing Authority, Revenue Bonds | | |
| Series A | | |
| 4.00%, due 8/1/37 | 2,750,000 | 2,679,124 |
The notes to the financial statements are an integral part of, and should be read in conjunction with, the financial statements.
29
Portfolio of Investments October 31, 2022† (continued)
| | Principal
Amount | Value |
| Long-Term Municipal Bonds (continued) |
| Water & Sewer (continued) |
| San Diego County Water Authority, Revenue Bonds | | |
| Series A | | |
| 5.00%, due 5/1/52 | $ 2,065,000 | $ 2,171,126 |
| San Joaquin Area Flood Control Agency, California Smith Canal Area Assessment, Special Assessment | | |
| Insured: AGM | | |
| 3.00%, due 10/1/32 | 660,000 | 579,379 |
| Insured: AGM | | |
| 3.00%, due 10/1/34 | 700,000 | 593,704 |
| Insured: AGM | | |
| 3.25%, due 10/1/40 | 2,000,000 | 1,552,737 |
| Insured: AGM | | |
| 3.375%, due 10/1/45 | 1,250,000 | 933,684 |
| Insured: AGM | | |
| 3.375%, due 10/1/50 | 1,000,000 | 704,984 |
| Santa Margarita-Dana Point Authority, Water District Improvement, Revenue Bonds | | |
| 4.00%, due 8/1/36 | 2,025,000 | 1,974,057 |
| Watereuse Finance Authority, Vallejo Sanitation And Flood Control District Refunding Program, Revenue Bonds | | |
| Series A | | |
| 5.50%, due 5/1/36 | 500,000 | 513,406 |
| West Sacramento Financing Authority, Water Capital Projects, Revenue Bonds | | |
| Insured: BAM | | |
| 4.00%, due 10/1/39 | 300,000 | 271,368 |
| | | 72,480,757 |
Total Long-Term Municipal Bonds
(Cost $1,030,445,540) | | 936,248,198 |
| | Principal
Amount | | Value |
| Short-Term Municipal Notes 0.2% |
| General Obligation 0.2% |
| State of California, Unlimited General Obligation | | | |
| Series A | | | |
| 2.10%, due 5/1/48 (h) | $ 1,700,000 | | $ 1,700,000 |
Total Short-Term Municipal Notes
(Cost $1,700,000) | | | 1,700,000 |
Total Municipal Bonds
(Cost $1,032,145,540) | | | 937,948,198 |
| |
| | Shares | | |
| Short-Term Investment 3.7% |
| Unaffiliated Investment Company 3.7% |
| BlackRock Liquidity Funds MuniCash, 1.826% (i) | 37,154,090 | | 37,150,374 |
Total Short-Term Investment
(Cost $37,150,374) | | | 37,150,374 |
Total Investments
(Cost $1,069,295,914) | 98.3% | | 975,098,572 |
| Other Assets, Less Liabilities | 1.7 | | 16,493,419 |
| Net Assets | 100.0% | | $ 991,591,991 |
| † | Percentages indicated are based on Fund net assets. |
| (a) | Delayed delivery security. |
| (b) | Step coupon—Rate shown was the rate in effect as of October 31, 2022. |
| (c) | May be sold to institutional investors only under Rule 144A or securities offered pursuant to Section 4(a)(2) of the Securities Act of 1933, as amended. |
| (d) | Coupon rate may change based on changes of the underlying collateral or prepayments of principal. Rate shown was the rate in effect as of October 31, 2022. |
| (e) | Interest on these securities was subject to alternative minimum tax. |
| (f) | Issue in default. |
| (g) | Issue in non-accrual status. |
| (h) | Variable-rate demand notes (VRDNs)—Provide the right to sell the security at face value on either that day or within the rate-reset period. VRDNs will normally trade as if the maturity is the earlier put date, even though stated maturity is longer. The interest rate is reset on the put date at a stipulated daily, weekly, monthly, quarterly, or other specified time interval to reflect current market conditions. These securities do not indicate a reference rate and spread in their description. The maturity date shown is the final maturity. |
| (i) | Current yield as of October 31, 2022. |
The notes to the financial statements are an integral part of, and should be read in conjunction with, the financial statements.
| 30 | MainStay MacKay California Tax Free Opportunities Fund |
Futures Contracts
As of October 31, 2022, the Fund held the following futures contracts1:
| Type | Number of
Contracts | Expiration
Date | Value at
Trade Date | Current
Notional
Amount | Unrealized
Appreciation
(Depreciation)2 |
| Short Contracts | | | | | |
| U.S. Treasury 10 Year Notes | (485) | December 2022 | $ (56,939,465) | $ (53,637,969) | $ 3,301,496 |
| U.S. Treasury Long Bonds | (455) | December 2022 | (55,581,340) | (54,827,500) | 753,840 |
| Net Unrealized Appreciation | | | | | $ 4,055,336 |
| 1. | As of October 31, 2022, cash in the amount of $2,699,000 was on deposit with a broker or futures commission merchant for futures transactions. |
| 2. | Represents the difference between the value of the contracts at the time they were opened and the value as of October 31, 2022. |
| Abbreviation(s): |
| AGC—Assured Guaranty Corp. |
| AGM—Assured Guaranty Municipal Corp. |
| AMBAC—Ambac Assurance Corp. |
| BAM—Build America Mutual Assurance Co. |
| CHF—Collegiate Housing Foundation |
| CR—Custodial Receipts |
| FHLMC—Federal Home Loan Mortgage Corp. |
| ICC—Insured Custody Certificates |
| NATL-RE—National Public Finance Guarantee Corp. |
The following is a summary of the fair valuations according to the inputs used as of October 31, 2022, for valuing the Fund’s assets:
| Description | Quoted
Prices in
Active
Markets for
Identical
Assets
(Level 1) | | Significant
Other
Observable
Inputs
(Level 2) | | Significant
Unobservable
Inputs
(Level 3) | | Total |
| Asset Valuation Inputs | | | | | | | |
| Investments in Securities (a) | | | | | | | |
| Municipal Bonds | | | | | | | |
| Long-Term Municipal Bonds | $ — | | $ 936,248,198 | | $ — | | $ 936,248,198 |
| Short-Term Municipal Notes | — | | 1,700,000 | | — | | 1,700,000 |
| Total Municipal Bonds | — | | 937,948,198 | | — | | 937,948,198 |
| Short-Term Investment | | | | | | | |
| Unaffiliated Investment Company | 37,150,374 | | — | | — | | 37,150,374 |
| Total Investments in Securities | 37,150,374 | | 937,948,198 | | — | | 975,098,572 |
| Other Financial Instruments | | | | | | | |
| Futures Contracts (b) | 4,055,336 | | — | | — | | 4,055,336 |
| Total Investments in Securities and Other Financial Instruments | $ 41,205,710 | | $ 937,948,198 | | $ — | | $ 979,153,908 |
| (a) | For a complete listing of investments and their industries, see the Portfolio of Investments. |
| (b) | The value listed for these securities reflects unrealized appreciation (depreciation) as shown on the Portfolio of Investments. |
The notes to the financial statements are an integral part of, and should be read in conjunction with, the financial statements.
31
Statement of Assets and Liabilities as of October 31, 2022
| Assets |
Investment in securities, at value
(identified cost $1,069,295,914) | $ 975,098,572 |
| Cash | 3,034 |
| Cash collateral on deposit at broker for futures contracts | 2,699,000 |
| Receivables: | |
| Investment securities sold | 13,109,710 |
| Interest | 12,588,527 |
| Fund shares sold | 6,280,781 |
| Other assets | 2,333 |
| Total assets | 1,009,781,957 |
| Liabilities |
| Payables: | |
| Investment securities purchased | 8,814,120 |
| Fund shares redeemed | 7,086,785 |
| Variation margin on futures contracts | 1,029,951 |
| Manager (See Note 3) | 375,150 |
| NYLIFE Distributors (See Note 3) | 99,448 |
| Transfer agent (See Note 3) | 48,288 |
| Custodian | 22,819 |
| Professional fees | 22,215 |
| Shareholder communication | 8,766 |
| Trustees | 35 |
| Accrued expenses | 2,096 |
| Distributions payable | 680,293 |
| Total liabilities | 18,189,966 |
| Net assets | $ 991,591,991 |
| Composition of Net Assets |
| Shares of beneficial interest outstanding (par value of $.001 per share) unlimited number of shares authorized | $ 109,931 |
| Additional paid-in-capital | 1,171,208,030 |
| | 1,171,317,961 |
| Total distributable earnings (loss) | (179,725,970) |
| Net assets | $ 991,591,991 |
| Class A | |
| Net assets applicable to outstanding shares | $395,404,661 |
| Shares of beneficial interest outstanding | 43,839,941 |
| Net asset value per share outstanding | $ 9.02 |
| Maximum sales charge (3.00% of offering price) | 0.28 |
| Maximum offering price per share outstanding | $ 9.30 |
| Investor Class | |
| Net assets applicable to outstanding shares | $ 493,330 |
| Shares of beneficial interest outstanding | 54,690 |
| Net asset value per share outstanding | $ 9.02 |
| Maximum sales charge (2.50% of offering price) | 0.23 |
| Maximum offering price per share outstanding | $ 9.25 |
| Class C | |
| Net assets applicable to outstanding shares | $ 34,742,243 |
| Shares of beneficial interest outstanding | 3,851,242 |
| Net asset value and offering price per share outstanding | $ 9.02 |
| Class C2 | |
| Net assets applicable to outstanding shares | $ 361,273 |
| Shares of beneficial interest outstanding | 40,040 |
| Net asset value and offering price per share outstanding | $ 9.02 |
| Class I | |
| Net assets applicable to outstanding shares | $555,048,835 |
| Shares of beneficial interest outstanding | 61,531,148 |
| Net asset value and offering price per share outstanding | $ 9.02 |
| Class R6 | |
| Net assets applicable to outstanding shares | $ 5,541,649 |
| Shares of beneficial interest outstanding | 613,849 |
| Net asset value and offering price per share outstanding | $ 9.03 |
The notes to the financial statements are an integral part of, and should be read in conjunction with, the financial statements.
| 32 | MainStay MacKay California Tax Free Opportunities Fund |
Statement of Operations for the year ended October 31, 2022
| Investment Income (Loss) |
| Income | |
| Interest | $ 33,799,101 |
| Expenses | |
| Manager (See Note 3) | 5,093,379 |
| Distribution/Service—Class A (See Note 3) | 986,088 |
| Distribution/Service—Investor Class (See Note 3) | 1,322 |
| Distribution/Service—Class C (See Note 3) | 233,382 |
| Distribution/Service—Class C2 (See Note 3) | 2,273 |
| Transfer agent (See Note 3) | 299,995 |
| Professional fees | 130,078 |
| Custodian | 110,520 |
| Shareholder communication | 37,183 |
| Registration | 28,503 |
| Trustees | 24,159 |
| Miscellaneous | 51,189 |
| Total expenses before waiver/reimbursement | 6,998,071 |
| Expense waiver/reimbursement from Manager (See Note 3) | (74,546) |
| Net expenses | 6,923,525 |
| Net investment income (loss) | 26,875,576 |
| Realized and Unrealized Gain (Loss) |
| Net realized gain (loss) on: | |
| Unaffiliated investment transactions | (73,603,247) |
| Futures transactions | 16,363,221 |
| Net realized gain (loss) | (57,240,026) |
| Net change in unrealized appreciation (depreciation) on: | |
| Unaffiliated investments | (159,090,083) |
| Futures contracts | 3,815,586 |
| Net change in unrealized appreciation (depreciation) | (155,274,497) |
| Net realized and unrealized gain (loss) | (212,514,523) |
| Net increase (decrease) in net assets resulting from operations | $(185,638,947) |
The notes to the financial statements are an integral part of, and should be read in conjunction with, the financial statements.
33
Statements of Changes in Net Assets
for the years ended October 31, 2022 and October 31, 2021
| | 2022 | 2021 |
| Increase (Decrease) in Net Assets |
| Operations: | | |
| Net investment income (loss) | $ 26,875,576 | $ 23,563,894 |
| Net realized gain (loss) | (57,240,026) | 5,712,825 |
| Net change in unrealized appreciation (depreciation) | (155,274,497) | 16,179,430 |
| Net increase (decrease) in net assets resulting from operations | (185,638,947) | 45,456,149 |
| Distributions to shareholders: | | |
| Class A | (10,778,314) | (9,302,283) |
| Investor Class | (14,429) | (14,682) |
| Class C | (1,136,043) | (1,214,752) |
| Class C2 | (8,264) | (3,396) |
| Class I | (20,503,436) | (17,897,833) |
| Class R6 | (163,799) | (56,750) |
| Total distributions to shareholders | (32,604,285) | (28,489,696) |
| Capital share transactions: | | |
| Net proceeds from sales of shares | 616,148,347 | 418,185,878 |
| Net asset value of shares issued to shareholders in reinvestment of distributions | 23,868,297 | 19,857,013 |
| Cost of shares redeemed | (711,867,843) | (268,437,712) |
| Increase (decrease) in net assets derived from capital share transactions | (71,851,199) | 169,605,179 |
| Net increase (decrease) in net assets | (290,094,431) | 186,571,632 |
| Net Assets |
| Beginning of year | 1,281,686,422 | 1,095,114,790 |
| End of year | $ 991,591,991 | $1,281,686,422 |
The notes to the financial statements are an integral part of, and should be read in conjunction with, the financial statements.
| 34 | MainStay MacKay California Tax Free Opportunities Fund |
Financial Highlights selected per share data and ratios
| | Year Ended October 31, |
| Class A | 2022 | | 2021 | | 2020 | | 2019 | | 2018 |
| Net asset value at beginning of year | $ 10.94 | | $ 10.75 | | $ 10.76 | | $ 10.12 | | $ 10.29 |
| Net investment income (loss) | 0.23(a) | | 0.20(a) | | 0.23 | | 0.28 | | 0.31 |
| Net realized and unrealized gain (loss) | (1.87) | | 0.23 | | 0.03 | | 0.64 | | (0.17) |
| Total from investment operations | (1.64) | | 0.43 | | 0.26 | | 0.92 | | 0.14 |
| Less distributions: | | | | | | | | | |
| From net investment income | (0.28) | | (0.24) | | (0.27) | | (0.28) | | (0.31) |
| Net asset value at end of year | $ 9.02 | | $ 10.94 | | $ 10.75 | | $ 10.76 | | $ 10.12 |
| Total investment return (b) | (15.22)% | | 4.05% | | 2.46% | | 9.20% | | 1.39% |
| Ratios (to average net assets)/Supplemental Data: | | | | | | | | | |
| Net investment income (loss) | 2.23% | | 1.80% | | 1.97% | | 2.65% | | 3.04% |
| Net expenses (c) | 0.75% | | 0.74% | | 0.75% | | 0.75% | | 0.75% |
| Expenses (before waiver/reimbursement) (c) | 0.76% | | 0.76% | | 0.80% | | 0.81% | | 0.82% |
| Portfolio turnover rate | 70%(d) | | 17%(d) | | 29%(d) | | 47%(d) | | 32% |
| Net assets at end of year (in 000’s) | $ 395,405 | | $ 444,628 | | $ 373,966 | | $ 292,589 | | $ 145,668 |
| (a) | Per share data based on average shares outstanding during the year. |
| (b) | Total investment return is calculated exclusive of sales charges and assumes the reinvestment of dividends and distributions. For periods of less than one year, total return is not annualized. |
| (c) | In addition to the fees and expenses which the Fund bears directly, it also indirectly bears a pro-rata share of the fees and expenses of the underlying funds in which it invests. Such indirect expenses are not included in the above expense ratios. |
| (d) | The portfolio turnover rate includes variable rate demand notes. |
| | Year Ended October 31, |
| Investor Class | 2022 | | 2021 | | 2020 | | 2019 | | 2018 |
| Net asset value at beginning of year | $ 10.94 | | $ 10.76 | | $ 10.76 | | $ 10.12 | | $ 10.29 |
| Net investment income (loss) | 0.22(a) | | 0.18(a) | | 0.23 | | 0.28 | | 0.31 |
| Net realized and unrealized gain (loss) | (1.86) | | 0.24 | | 0.04 | | 0.64 | | (0.17) |
| Total from investment operations | (1.64) | | 0.42 | | 0.27 | | 0.92 | | 0.14 |
| Less distributions: | | | | | | | | | |
| From net investment income | (0.28) | | (0.24) | | (0.27) | | (0.28) | | 0.31 |
| Net asset value at end of year | $ 9.02 | | $ 10.94 | | $ 10.76 | | $ 10.76 | | $ 10.12 |
| Total investment return (b) | (15.24)% | | 3.93% | | 2.53% | | 9.18% | | 1.36% |
| Ratios (to average net assets)/Supplemental Data: | | | | | | | | | |
| Net investment income (loss) | 2.22% | | 1.61% | | 1.95% | | 2.65% | | 3.03% |
| Net expenses (c) | 0.77% | | 0.76% | | 0.77% | | 0.77% | | 0.78% |
| Expenses (before waiver/reimbursement) (c) | 0.78% | | 0.78% | | 0.82% | | 0.83% | | 0.85% |
| Portfolio turnover rate | 70%(d) | | 17%(d) | | 29%(d) | | 47%(d) | | 32% |
| Net assets at end of year (in 000's) | $ 493 | | $ 554 | | $ 672 | | $ 506 | | $ 343 |
| (a) | Per share data based on average shares outstanding during the year. |
| (b) | Total investment return is calculated exclusive of sales charges and assumes the reinvestment of dividends and distributions. For periods of less than one year, total return is not annualized. |
| (c) | In addition to the fees and expenses which the Fund bears directly, it also indirectly bears a pro-rata share of the fees and expenses of the underlying funds in which it invests. Such indirect expenses are not included in the above expense ratios. |
| (d) | The portfolio turnover rate includes variable rate demand notes. |
The notes to the financial statements are an integral part of, and should be read in conjunction with, the financial statements.
35
Financial Highlights selected per share data and ratios
| | Year Ended October 31, |
| Class C | 2022 | | 2021 | | 2020 | | 2019 | | 2018 |
| Net asset value at beginning of year | $ 10.94 | | $ 10.76 | | $ 10.77 | | $ 10.12 | | $ 10.29 |
| Net investment income (loss) | 0.20(a) | | 0.17(a) | | 0.19 | | 0.25 | | 0.28 |
| Net realized and unrealized gain (loss) | (1.87) | | 0.22 | | 0.04 | | 0.65 | | (0.17) |
| Total from investment operations | (1.67) | | 0.39 | | 0.23 | | 0.90 | | 0.11 |
| Less distributions: | | | | | | | | | |
| From net investment income | (0.25) | | (0.21) | | (0.24) | | (0.25) | | (0.28) |
| Net asset value at end of year | $ 9.02 | | $ 10.94 | | $ 10.76 | | $ 10.77 | | $ 10.12 |
| Total investment return (b) | (15.45)% | | 3.67% | | 2.18% | | 9.01% | | 1.11% |
| Ratios (to average net assets)/Supplemental Data: | | | | | | | | | |
| Net investment income (loss) | 1.93% | | 1.54% | | 1.70% | | 2.38% | | 2.76% |
| Net expenses (c) | 1.02% | | 1.01% | | 1.02% | | 1.02% | | 1.03% |
| Expenses (before waiver/reimbursement) (c) | 1.03% | | 1.03% | | 1.07% | | 1.08% | | 1.10% |
| Portfolio turnover rate | 70%(d) | | 17%(d) | | 29%(d) | | 47%(d) | | 32% |
| Net assets at end of year (in 000’s) | $ 34,742 | | $ 58,263 | | $ 61,662 | | $ 52,964 | | $ 29,450 |
| (a) | Per share data based on average shares outstanding during the year. |
| (b) | Total investment return is calculated exclusive of sales charges and assumes the reinvestment of dividends and distributions. For periods of less than one year, total return is not annualized. |
| (c) | In addition to the fees and expenses which the Fund bears directly, it also indirectly bears a pro-rata share of the fees and expenses of the underlying funds in which it invests. Such indirect expenses are not included in the above expense ratios. |
| (d) | The portfolio turnover rate includes variable rate demand notes. |
| | Year Ended October 31, | | August 31, 2020^ through
October 31, |
| Class C2 | 2022 | | 2021 | | 2020 |
| Net asset value at beginning of period | $ 10.94 | | $ 10.75 | | $ 10.83 |
| Net investment income (loss) | 0.19(a) | | 0.28(a) | | 0.03 |
| Net realized and unrealized gain (loss) | (1.88) | | 0.11 | | (0.07) |
| Total from investment operations | (1.69) | | 0.39 | | (0.04) |
| Less distributions: | | | | | |
| From net investment income | (0.23) | | (0.20) | | (0.04) |
| Net asset value at end of period | $ 9.02 | | $ 10.94 | | $ 10.75 |
| Total investment return (b) | (15.58)% | | 3.59% | | (0.40)% |
| Ratios (to average net assets)/Supplemental Data: | | | | | |
| Net investment income (loss) | 1.86% | | 2.56% | | 1.49%†† |
| Net expenses (c) | 1.17% | | 1.16% | | 1.16%†† |
| Expenses (before waiver/reimbursement) (c) | 1.18% | | 1.18% | | 1.22%†† |
| Portfolio turnover rate (d) | 70% | | 17% | | 29% |
| Net assets at end of period (in 000’s) | $ 361 | | $ 275 | | $ 25 |
| ^ | Inception date. |
| †† | Annualized. |
| (a) | Per share data based on average shares outstanding during the period. |
| (b) | Total investment return is calculated exclusive of sales charges and assumes the reinvestment of dividends and distributions. For periods of less than one year, total return is not annualized. |
| (c) | In addition to the fees and expenses which the Fund bears directly, it also indirectly bears a pro-rata share of the fees and expenses of the underlying funds in which it invests. Such indirect expenses are not included in the above expense ratios. |
| (d) | The portfolio turnover rate includes variable rate demand notes. |
The notes to the financial statements are an integral part of, and should be read in conjunction with, the financial statements.
| 36 | MainStay MacKay California Tax Free Opportunities Fund |
Financial Highlights selected per share data and ratios
| | Year Ended October 31, |
| Class I | 2022 | | 2021 | | 2020 | | 2019 | | 2018 |
| Net asset value at beginning of year | $ 10.94 | | $ 10.76 | | $ 10.76 | | $ 10.12 | | $ 10.29 |
| Net investment income (loss) | 0.25(a) | | 0.23(a) | | 0.28 | | 0.31 | | 0.34 |
| Net realized and unrealized gain (loss) | (1.87) | | 0.22 | | 0.02 | | 0.64 | | (0.17) |
| Total from investment operations | (1.62) | | 0.45 | | 0.30 | | 0.95 | | 0.17 |
| Less distributions: | | | | | | | | | |
| From net investment income | (0.30) | | (0.27) | | (0.30) | | (0.31) | | (0.34) |
| Net asset value at end of year | $ 9.02 | | $ 10.94 | | $ 10.76 | | $ 10.76 | | $ 10.12 |
| Total investment return (b) | (15.01)% | | 4.21% | | 2.81% | | 9.48% | | 1.65% |
| Ratios (to average net assets)/Supplemental Data: | | | | | | | | | |
| Net investment income (loss) | 2.46% | | 2.05% | | 2.20% | | 2.91% | | 3.29% |
| Net expenses (c) | 0.50% | | 0.49% | | 0.50% | | 0.50% | | 0.50% |
| Expenses (before waiver/reimbursement) (c) | 0.51% | | 0.51% | | 0.55% | | 0.56% | | 0.57% |
| Portfolio turnover rate | 70%(d) | | 17%(d) | | 29%(d) | | 47%(d) | | 32% |
| Net assets at end of year (in 000’s) | $ 555,049 | | $ 776,207 | | $ 655,579 | | $ 429,106 | | $ 228,220 |
| (a) | Per share data based on average shares outstanding during the year. |
| (b) | Total investment return is calculated exclusive of sales charges and assumes the reinvestment of dividends and distributions. Class I shares are not subject to sales charges. For periods of less than one year, total return is not annualized. |
| (c) | In addition to the fees and expenses which the Fund bears directly, it also indirectly bears a pro-rata share of the fees and expenses of the underlying funds in which it invests. Such indirect expenses are not included in the above expense ratios. |
| (d) | The portfolio turnover rate includes variable rate demand notes. |
| | Year Ended October 31, | | November 1, 2019^ through
October 31, |
| Class R6 | 2022 | | 2021 | | 2020 |
| Net asset value at beginning of period | $ 10.94 | | $ 10.76 | | $ 10.77 |
| Net investment income (loss) | 0.26(a) | | 0.21(a) | | 0.25 |
| Net realized and unrealized gain (loss) | (1.87) | | 0.24 | | 0.04 |
| Total from investment operations | (1.61) | | 0.45 | | 0.29 |
| Less distributions: | | | | | |
| From net investment income | (0.30) | | (0.27) | | (0.30) |
| Net asset value at end of period | $ 9.03 | | $ 10.94 | | $ 10.76 |
| Total investment return (b) | (14.90)% | | 4.23% | | 2.83% |
| Ratios (to average net assets)/Supplemental Data: | | | | | |
| Net investment income (loss) | 2.57% | | 1.86% | | 2.25% |
| Net expenses (c) | 0.49% | | 0.47% | | 0.48% |
| Expenses (before waiver/reimbursement) (c) | 0.49% | | 0.49% | | 0.53% |
| Portfolio turnover rate (d) | 70% | | 17% | | 29% |
| Net assets at end of period (in 000’s) | $ 5,542 | | $ 1,759 | | $ 3,211 |
| ^ | Inception date. |
| (a) | Per share data based on average shares outstanding during the period. |
| (b) | Total investment return is calculated exclusive of sales charges and assumes the reinvestment of dividends and distributions. Class R6 shares are not subject to sales charges. For periods of less than one year, total return is not annualized. |
| (c) | In addition to the fees and expenses which the Fund bears directly, it also indirectly bears a pro-rata share of the fees and expenses of the underlying funds in which it invests. Such indirect expenses are not included in the above expense ratios. |
| (d) | The portfolio turnover rate includes variable rate demand notes. |
The notes to the financial statements are an integral part of, and should be read in conjunction with, the financial statements.
37
Notes to Financial Statements
Note 1-Organization and Business
MainStay Funds Trust (the “Trust”) was organized as a Delaware statutory trust on April 28, 2009. The Trust is registered under the Investment Company Act of 1940, as amended (the “1940 Act”), as an open-end management investment company, and is comprised of thirty-three funds (collectively referred to as the “Funds”). These financial statements and notes relate to the MainStay MacKay California Tax Free Opportunities Fund (the "Fund"), a “diversified” fund, as that term is defined in the 1940 Act, as interpreted or modified by regulatory authorities having jurisdiction, from time to time.
The following table lists the Fund's share classes that have been registered and commenced operations:
| Class | Commenced Operations |
| Class A | February 28, 2013 |
| Investor Class | February 28, 2013 |
| Class C | February 28, 2013 |
| Class C2 | August 31, 2020 |
| Class I | February 28, 2013 |
| Class R6 | November 1, 2019 |
| SIMPLE Class | N/A* |
| * | SIMPLE Class shares were registered for sale effective as of August 31, 2020 but have not yet commenced operations. |
Class A and Investor Class shares are offered at net asset value (“NAV”) per share plus an initial sales charge. No initial sales charge applies to investments of $250,000 or more (and certain other qualified purchases) in Class A and Investor Class shares. However, a contingent deferred sales charge (“CDSC”) of 1.00% may be imposed on certain redemptions made within 18 months of the date of purchase on shares that were purchased without an initial sales charge. Class C and Class C2 shares are offered at NAV without an initial sales charge, although a 1.00% CDSC may be imposed on certain redemptions of such shares made within one year of the date of purchase of Class C and Class C2 shares. Class I and Class R6 shares are offered at NAV without a sales charge. SIMPLE Class shares are expected to be offered at NAV without a sales charge if such shares are offered in the future. In addition, depending upon eligibility, Class C and Class C2 shares convert to either Class A or Investor Class shares at the end of the calendar quarter eight years after the date they were purchased. Additionally, Investor Class shares may convert automatically to Class A shares based on a shareholder’s account balance as described in the Fund’s prospectus. Under certain circumstances and as may be permitted by the Trust’s multiple class plan pursuant to Rule 18f-3 under the 1940 Act, specified share classes of the Fund may be converted to one or more other share classes of the Fund as disclosed in the capital share transactions within these Notes. The classes of shares have the same voting (except for issues that relate solely to one class), dividend, liquidation and other rights, and the same terms and conditions, except that under distribution plans pursuant to Rule 12b-1 under the 1940 Act, Class C, Class C2 and SIMPLE Class shares are subject to higher distribution and/or service fees than Class A
and Investor Class shares. Class I and Class R6 shares are not subject to a distribution and/or service fee.
The Fund's investment objective is to seek current income exempt from federal and California income taxes.
Note 2–Significant Accounting Policies
The Fund is an investment company and accordingly follows the investment company accounting and reporting guidance of the Financial Accounting Standards Board (“FASB”) Accounting Standards Codification Topic 946 Financial Services—Investment Companies. The Fund prepares its financial statements in accordance with generally accepted accounting principles (“GAAP”) in the United States of America and follows the significant accounting policies described below.
(A) Securities Valuation. Investments are usually valued as of the close of regular trading on the New York Stock Exchange (the "Exchange") (usually 4:00 p.m. Eastern time) on each day the Fund is open for business ("valuation date").
Effective September 8, 2022, and pursuant to Rule 2a-5 under the 1940 Act, the Board of Trustees of the Trust (the "Board") designated New York Life Investment Management LLC (“New York Life Investments” or the "Manager") as its Valuation Designee (the "Valuation Designee"). The Valuation Designee is responsible for performing fair valuations relating to all investments in the Fund’s portfolio for which market quotations are not readily available; periodically assessing and managing material valuation risks; establishing and applying fair value methodologies; testing fair valuation methodologies; evaluating and overseeing pricing services; segregation of valuation and portfolio management functions; providing quarterly, annual and prompt reporting to the Board, as appropriate; identifying potential conflicts of interest; and maintaining appropriate records. The Valuation Designee has established a valuation committee ("Valuation Committee") to assist in carrying out the Valuation Designee’s responsibilities and establish prices of securities for which market quotations are not readily available. The Fund’s and the Valuation Designee's policies and procedures ("Valuation Procedures") govern the Valuation Designee’s selection and application of methodologies for determining and calculating the fair value of Fund investments. The Valuation Designee may value Fund portfolio securities for which market quotations are not readily available and other Fund assets utilizing inputs from pricing services and other third-party sources (together, “Pricing Sources”). The Valuation Committee meets (in person, via electronic mail or via teleconference) on an ad-hoc basis to determine fair valuations and on a quarterly basis to review fair value events (excluding fair valuations from pricing services), including valuation risks and back-testing results, and preview reports to the Board.
The Valuation Committee establishes prices of securities for which market quotations are not readily available based on such methodologies and measurements on a regular basis after considering information that is reasonably available and deemed relevant by the Valuation Committee. The Board shall oversee the Valuation Designee and review fair valuation
| 38 | MainStay MacKay California Tax Free Opportunities Fund |
materials on a prompt, quarterly and annual basis and approve proposed revisions to the Valuation Procedures.
Investments for which market quotations are not readily available are valued at fair value as determined in good faith pursuant to the Valuation Procedures. A market quotation is readily available only when that quotation is a quoted price (unadjusted) in active markets for identical investments that the Fund can access at the measurement date, provided that a quotation will not be readily available if it is not reliable. Fair value measurements are determined within a framework that establishes a three-tier hierarchy that maximizes the use of observable market data and minimizes the use of unobservable inputs to establish a classification of fair value measurements for disclosure purposes. "Inputs" refer broadly to the assumptions that market participants would use in pricing the asset or liability, including assumptions about risk, such as the risk inherent in a particular valuation technique used to measure fair value using a pricing model and/or the risk inherent in the inputs for the valuation technique. Inputs may be observable or unobservable. Observable inputs reflect the assumptions market participants would use in pricing the asset or liability based on market data obtained from sources independent of the Fund. Unobservable inputs reflect the Fund’s own assumptions about the assumptions market participants would use in pricing the asset or liability based on the information available. The inputs or methodology used for valuing assets or liabilities may not be an indication of the risks associated with investing in those assets or liabilities. The three-tier hierarchy of inputs is summarized below.
| • | Level 1—quoted prices (unadjusted) in active markets for an identical asset or liability |
| • | Level 2—other significant observable inputs (including quoted prices for a similar asset or liability in active markets, interest rates and yield curves, prepayment speeds, credit risk, etc.) |
| • | Level 3—significant unobservable inputs (including the Fund's own assumptions about the assumptions that market participants would use in measuring fair value of an asset or liability) |
The level of an asset or liability within the fair value hierarchy is based on the lowest level of an input, both individually and in the aggregate, that is significant to the fair value measurement. The aggregate value by input level of the Fund’s assets and liabilities as of October 31, 2022, is included at the end of the Portfolio of Investments.
The Fund may use third-party vendor evaluations, whose prices may be derived from one or more of the following standard inputs, among others:
| • Benchmark yields | • Reported trades |
| • Broker/dealer quotes | • Issuer spreads |
| • Two-sided markets | • Benchmark securities |
| • Bids/offers | • Reference data (corporate actions or material event notices) |
| • Industry and economic events | • Comparable bonds |
| • Monthly payment information | |
An asset or liability for which a market quotation is not readily available is valued by methods deemed reasonable in good faith by the Valuation Committee, following the Valuation Procedures to represent fair value. Under these procedures, the Valuation Designee generally uses a market-based approach which may use related or comparable assets or liabilities, recent transactions, market multiples, book values and other relevant information. The Valuation Designee may also use an income-based valuation approach in which the anticipated future cash flows of the asset or liability are discounted to calculate fair value. Discounts may also be applied due to the nature and/or duration of any restrictions on the disposition of the asset or liability. Fair value represents a good faith approximation of the value of a security. Fair value determinations involve the consideration of a number of subjective factors, an analysis of applicable facts and circumstances and the exercise of judgment. As a result, it is possible that the fair value for a security determined in good faith in accordance with the Valuation Procedures may differ from valuations for the same security determined for other funds using their own valuation procedures. Although the Valuation Procedures are designed to value a security at the price the Fund may reasonably expect to receive upon the security's sale in an orderly transaction, there can be no assurance that any fair value determination thereunder would, in fact, approximate the amount that the Fund would actually realize upon the sale of the security or the price at which the security would trade if a reliable market price were readily available. During the year ended October 31, 2022, there were no material changes to the fair value methodologies.
Securities which may be valued in this manner include, but are not limited to: (i) a security for which trading has been halted or suspended or otherwise does not have a readily available market quotation on a given day; (ii) a debt security that has recently gone into default and for which there is not a current market quotation; (iii) a security of an issuer that has entered into a restructuring; (iv) a security that has been delisted from a national exchange; (v) a security subject to trading collars for which no or limited trading takes place; and (vi) a security whose principal market has been temporarily closed at a time when, under normal conditions, it would be open. Securities valued in this manner are generally categorized as Level 2 or 3 in the hierarchy.
Investments in mutual funds, including money market funds, are valued at their respective NAVs at the close of business each day on the valuation date. These securities are generally categorized as Level 1 in the hierarchy.
Futures contracts are valued at the last posted settlement price on the market where such futures are primarily traded. These securities are generally categorized as Level 1 in the hierarchy.
Municipal debt securities are valued at the evaluated mean prices supplied by a pricing agent or broker selected by the Manager, in consultation with the Subadvisor. The evaluations are market-based measurements processed through a pricing application and represents the pricing agent's good faith determination as to what a holder may receive in an orderly transaction under market conditions. The
Notes to Financial Statements (continued)
rules-based logic utilizes valuation techniques that reflect participants' assumptions and vary by asset class and per methodology, maximizing the use of relevant observable data including quoted prices for similar assets, benchmark yield curves and market corroborated inputs. The evaluated bid or mean prices are deemed by the Manager, in consultation with the Subadvisor, to be representative of market values, at the regular close of trading of the Exchange on each valuation date. Municipal debt securities purchased on a delayed delivery basis are marked to market daily until settlement at the forward settlement date. Municipal debt securities are generally categorized as Level 2 in the hierarchy.
Temporary cash investments acquired in excess of 60 days to maturity at the time of purchase are valued using the latest bid prices or using valuations based on a matrix system (which considers such factors as security prices, yields, maturities and ratings), both as furnished by independent pricing services. Temporary cash investments that mature in 60 days or less at the time of purchase ("Short-Term Investments") are valued using the amortized cost method of valuation, unless the use of such method would be inappropriate. The amortized cost method involves valuing a security at its cost on the date of purchase and thereafter assuming a constant amortization to maturity of the difference between such cost and the value on maturity date. Amortized cost approximates the current fair value of a security. Securities valued using the amortized cost method are not valued using quoted prices in an active market and are generally categorized as Level 2 in the hierarchy.
The information above is not intended to reflect an exhaustive list of the methodologies that may be used to value portfolio investments. The Valuation Procedures permit the use of a variety of valuation methodologies in connection with valuing portfolio investments. The methodology used for a specific type of investment may vary based on the market data available or other considerations. The methodologies summarized above may not represent the specific means by which portfolio investments are valued on any particular business day.
(B) Income Taxes. The Fund's policy is to comply with the requirements of the Internal Revenue Code of 1986, as amended (the “Internal Revenue Code”), applicable to regulated investment companies and to distribute all of its taxable income to the shareholders of the Fund within the allowable time limits.
The Manager evaluates the Fund’s tax positions to determine if the tax positions taken meet the minimum recognition threshold in connection with accounting for uncertainties in income tax positions taken or expected to be taken for the purposes of measuring and recognizing tax liabilities in the financial statements. Recognition of tax benefits of an uncertain tax position is permitted only to the extent the position is “more likely than not” to be sustained assuming examination by taxing authorities. The Manager analyzed the Fund's tax positions taken on federal, state and local income tax returns for all open tax years (for up to three tax years) and has concluded that no provisions for federal, state and local income tax are required in the Fund's financial statements. The Fund's federal, state and local income tax and federal excise tax returns for tax years for which the applicable statutes of limitations have not
expired are subject to examination by the Internal Revenue Service and state and local departments of revenue.
(C) Dividends and Distributions to Shareholders. Dividends and distributions are recorded on the ex-dividend date. The Fund intends to declare dividends from net investment income, if any, daily and intends to pay them at least monthly and declares and pays distributions from net realized capital gains, if any, at least annually. Unless a shareholder elects otherwise, all dividends and distributions are reinvested at NAV in the same class of shares of the Fund. Dividends and distributions to shareholders are determined in accordance with federal income tax regulations and may differ from determinations using GAAP.
(D) Security Transactions and Investment Income. The Fund records security transactions on the trade date. Realized gains and losses on security transactions are determined using the identified cost method. Discounts and premiums on securities purchased, other than temporary cash investments that mature in 60 days or less at the time of purchase, for the Fund are accreted and amortized, respectively, on the effective interest rate method.
Investment income and realized and unrealized gains and losses on investments of the Fund are allocated pro rata to the separate classes of shares based upon their relative net assets on the date the income is earned or realized and unrealized gains and losses are incurred.
The Fund may place a debt security on non-accrual status and reduce related interest income by ceasing current accruals and writing off all or a portion of any interest receivables when the collection of all or a portion of such interest has become doubtful. A debt security is removed from non-accrual status when the issuer resumes interest payments or when collectability of interest is reasonably assured.
(E) Expenses. Expenses of the Trust are allocated to the individual Funds in proportion to the net assets of the respective Funds when the expenses are incurred, except where direct allocations of expenses can be made. Expenses (other than transfer agent expenses and fees incurred under the shareholder services plans and/or the distribution plans further discussed in Note 3(B)) are allocated to separate classes of shares pro rata based upon their relative net assets on the date the expenses are incurred. The expenses borne by the Fund, including those of related parties to the Fund, are shown in the Statement of Operations.
Additionally, the Fund may invest in mutual funds, which are subject to management fees and other fees that may cause the costs of investing in mutual funds to be greater than the costs of owning the underlying securities directly. These indirect expenses of mutual funds are not included in the amounts shown as expenses in the Statement of Operations or in the expense ratios included in the Financial Highlights.
(F) Use of Estimates. In preparing financial statements in conformity with GAAP, the Manager makes estimates and assumptions that affect the reported amounts and disclosures in the financial statements. Actual results could differ from those estimates and assumptions.
| 40 | MainStay MacKay California Tax Free Opportunities Fund |
(G) Futures Contracts. A futures contract is an agreement to purchase or sell a specified quantity of an underlying instrument at a specified future date and price, or to make or receive a cash payment based on the value of a financial instrument (e.g., foreign currency, interest rate, security or securities index). The Fund is subject to risks such as market price risk, leverage risk, liquidity risk, counterparty risk, operational risk, legal risk and/or interest rate risk in the normal course of investing in these contracts. Upon entering into a futures contract, the Fund is required to pledge to the broker or futures commission merchant an amount of cash and/or U.S. government securities equal to a certain percentage of the collateral amount, known as the “initial margin.” During the period the futures contract is open, changes in the value of the contract are recognized as unrealized appreciation or depreciation by marking to market such contract on a daily basis to reflect the market value of the contract at the end of each day’s trading. The Fund agrees to receive from or pay to the broker or futures commission merchant an amount of cash equal to the daily fluctuation in the value of the contract. Such receipts or payments are known as “variation margin.” When the futures contract is closed, the Fund records a realized gain or loss equal to the difference between the proceeds from (or cost of) the closing transaction and the Fund's basis in the contract.
The use of futures contracts involves, to varying degrees, elements of market risk in excess of the amount recognized in the Statement of Assets and Liabilities. The contract or notional amounts and variation margin reflect the extent of the Fund's involvement in open futures positions. There are several risks associated with the use of futures contracts as hedging techniques. There can be no assurance that a liquid market will exist at the time when the Fund seeks to close out a futures contract. If no liquid market exists, the Fund would remain obligated to meet margin requirements until the position is closed. Futures contracts may involve a small initial investment relative to the risk assumed, which could result in losses greater than if the Fund did not invest in futures contracts. Futures contracts may be more volatile than direct investments in the instrument underlying the futures and may not correlate to the underlying instrument, causing a given hedge not to achieve its objectives. The Fund's activities in futures contracts have minimal counterparty risk as they are conducted through regulated exchanges that guarantee the futures against default by the counterparty. In the event of a bankruptcy or insolvency of a futures commission merchant that holds margin on behalf of the Fund, the Fund may not be entitled to the return of the entire margin owed to the Fund, potentially resulting in a loss. The Fund may invest in futures contracts to seek enhanced returns or to reduce the risk of loss by hedging certain of its holdings. The Fund's investment in futures contracts and other derivatives may increase the volatility of the Fund's NAVs and may result in a loss to the Fund. Open futures contracts as of October 31, 2022, are shown in the Portfolio of Investments.
(H) Delayed Delivery Transactions. The Fund may purchase or sell securities on a delayed delivery basis. These transactions involve a commitment by the Fund to purchase or sell securities for a predetermined price or yield, with payment and delivery taking place
beyond the customary settlement period. When delayed delivery purchases are outstanding, the Fund will designate liquid assets in an amount sufficient to meet the purchase price. When purchasing a security on a delayed delivery basis, the Fund assumes the rights and risks of ownership of the security, including the risk of price and yield fluctuations, and takes such fluctuations into account when determining its NAV. The Fund may dispose of or renegotiate a delayed delivery transaction after it is entered into, and may sell delayed delivery securities before they are delivered, which may result in a realized gain or loss. When the Fund has sold a security it owns on a delayed delivery basis, the Fund does not participate in future gains and losses with respect to the security. Delayed delivery transactions as of October 31, 2022, are shown in the Portfolio of Investments.
(I) Municipal Bond Risk. The Fund may invest more heavily in municipal bonds from certain cities, states, territories or regions than others, which may increase the Fund’s exposure to losses resulting from economic, political, regulatory occurrences, or declines in tax revenue impacting these particular cities, states, territories or regions. In addition, many state and municipal governments that issue securities are under significant economic and financial stress and may not be able to satisfy their obligations, and these events may be made worse due to economic challenges posed by COVID-19. The Fund may invest a substantial amount of its assets in municipal bonds whose interest is paid solely from revenues of similar projects, such as tobacco settlement bonds. If the Fund concentrates its investments in this manner, it assumes the legal and economic risks relating to such projects and this may have a significant impact on the Fund’s investment performance.
Certain of the issuers in which the Fund may invest have recently experienced, or may experience, significant financial difficulties and repeated credit rating downgrades. On May 3, 2017, the Commonwealth of Puerto Rico (the "Commonwealth") began proceedings pursuant to the Puerto Rico Oversight, Management, and Economic Stability Act (“PROMESA”) to seek bankruptcy-type protections from approximately $74 billion in debt and approximately $48 billion in unfunded pension obligations. In addition, the economic downturn following the outbreak of COVID-19 and the resulting pressure on Puerto Rico’s budget have further contributed to its financial challenges. The federal government has passed certain relief packages, including the Coronavirus Aid, Relief, and Economic Security Act and the American Rescue Plan, which include an aggregate of more than $7 billion in disaster relief funds for the U.S. territories, including Puerto Rico. However, there can be no assurances that the federal funds allocated to the Commonwealth will be sufficient to address the economic challenges arising from COVID-19.
The Commonwealth concluded its Title III restructuring proceedings on behalf of itself and certain instrumentalities effective March 15th, 2022. Approximately $18.75 billion of claims related to debt guaranteed under Puerto Rico's constitution including the Commonwealth of Puerto Rico and Public Building Authority were restructured with issuance of $7.4 billion in new Puerto Rico General Obligation Bonds, $7.1 billion of cash, and $3.5 billion of new Contingent Value instruments. In addition
Notes to Financial Statements (continued)
the Commonwealth's exit from the restructuring proceedings resolved certain claims relating to the Commonwealth Employee Retirement System, Convention Center, Highway Authority, and Infrastructure Financing Authority. Several of Commonwealth's agencies are still under Title III restructuring proceedings including the Highway Authority and Electric Authority.
Puerto Rico’s debt restructuring process and other economic, political, social, environmental or health factors or developments could occur rapidly and may significantly affect the value of municipal securities of Puerto Rico. Due to the ongoing budget impact from COVID-19 on the Commonwealth’s finances, the Federal Oversight and Management Board for Puerto Rico or the Commonwealth itself could seek to revise or even terminate earlier agreements reached with certain creditors prior to the outbreak of COVID-19. Any agreement between the Federal Oversight and Management Board and creditors is subject to approval by the judge overseeing the Title III proceedings. The composition of the Federal Oversight and Management Board has changed during the recent period due to existing members either stepping down or being replaced following the expiration of a member's term. There is no assurance that board members will approve the restructuring agreements the prior board had negotiated.
The Fund’s vulnerability to potential losses associated with such developments may be reduced through investing in municipal securities that feature credit enhancements (such as bond insurance). The bond insurance provider pays both principal and interest when due to the bond holder. The magnitude of Puerto Rico’s debt restructuring or other adverse economic developments could pose significant strains on the ability of municipal securities insurers to meet all future claims. As of October 31, 2022, 20.8% of the Puerto Rico municipal securities held by the Fund were insured.
(J) Indemnifications. Under the Trust’s organizational documents, its officers and trustees are indemnified against certain liabilities that may arise out of performance of their duties to the Trust. Additionally, in the normal course of business, the Fund enters into contracts with third-party service providers that contain a variety of representations and warranties and that may provide general indemnifications. The Fund's maximum exposure under these arrangements is unknown, as this would involve future claims that may be made against the Fund that have not yet occurred. The Manager believes that the risk of loss in connection with these potential indemnification obligations is remote. However, there can be no assurance that material liabilities related to such obligations will not arise in the future, which could adversely impact the Fund.
(K) Quantitative Disclosure of Derivative Holdings. The following tables show additional disclosures related to the Fund's derivative and hedging activities, including how such activities are accounted for and their effect on the Fund's financial positions, performance and cash flows.
The Fund entered into futures contracts to help manage the duration and yield curve positioning of the portfolio. These derivatives are not accounted for as hedging instruments.
Fair value of derivative instruments as of October 31, 2022:
| Asset Derivatives | Interest
Rate
Contracts
Risk | Total |
| Futures Contracts - Net Assets—Net unrealized appreciation on futures contracts (a) | $4,055,336 | $4,055,336 |
| Total Fair Value | $4,055,336 | $4,055,336 |
| (a) | Includes cumulative appreciation (depreciation) of futures contracts as reported in the Portfolio of Investments. Only current day’s variation margin is reported within the Statement of Assets and Liabilities. |
The effect of derivative instruments on the Statement of Operations for the year ended October 31, 2022:
| Net Realized Gain (Loss) from: | Interest
Rate
Contracts
Risk | Total |
| Futures Contracts | $16,363,221 | $16,363,221 |
| Total Net Realized Gain (Loss) | $16,363,221 | $16,363,221 |
| Net Change in Unrealized Appreciation (Depreciation) | Interest
Rate
Contracts
Risk | Total |
| Futures Contracts | $3,815,586 | $3,815,586 |
| Total Net Change in Unrealized Appreciation (Depreciation) | $3,815,586 | $3,815,586 |
| Average Notional Amount | Total |
| Futures Contracts Short | $(88,636,367) |
Note 3–Fees and Related Party Transactions
(A) Manager and Subadvisor. New York Life Investments, a registered investment adviser and an indirect, wholly-owned subsidiary of New York Life Insurance Company ("New York Life"), serves as the Fund's Manager, pursuant to an Amended and Restated Management Agreement ("Management Agreement"). The Manager provides offices, conducts clerical, recordkeeping and bookkeeping services and keeps most of the financial and accounting records required to be maintained by the Fund. Except for the portion of salaries and expenses that are the responsibility of the Fund, the Manager pays the salaries and expenses of all personnel affiliated with the Fund and certain operational expenses of the Fund. During a portion of the year ended October 31, 2022, the Fund reimbursed New York Life Investments in an amount equal to the portion of the compensation of the Chief Compliance Officer attributable to the Fund. MacKay Shields LLC ("MacKay Shields" or the "Subadvisor"), a registered investment adviser and an indirect, wholly-owned subsidiary of
| 42 | MainStay MacKay California Tax Free Opportunities Fund |
New York Life, serves as the Subadvisor to the Fund and is responsible for the day-to-day portfolio management of the Fund. Pursuant to the terms of an Amended and Restated Subadvisory Agreement ("Subadvisory Agreement") between New York Life Investments and MacKay Shields, New York Life Investments pays for the services of the Subadvisor.
Pursuant to the Management Agreement, the Fund pays the Manager a monthly fee for the services performed and the facilities furnished at an annual rate of the Fund’s average daily net assets as follows: 0.45% up to $ 1 billion; 0.43% from $1 billion up to $3 billion and 0.42% in excess of $3 billion. During the year ended October 31, 2022, the effective management fee rate was 0.45% of the Fund’s average daily net assets, exclusive of any applicable waivers/reimbursements.
New York Life Investments has contractually agreed to waive fees and/or reimburse expenses so that Total Annual Fund Operating Expenses (excluding taxes, interest, litigation, extraordinary expenses, brokerage and other transaction expenses relating to the purchase or sale of portfolio investments and acquired (underlying) fund fees and expenses) of Class A shares do not exceed 0.75% of its average daily net assets. New York Life Investments will apply an equivalent waiver or reimbursement, in an equal number of basis points to Investor Class, Class C, Class C2 and Class I shares. New York Life Investments has contractually agreed to waive fees and/or reimburse expenses so that Total Annual Fund Operating Expenses (excluding taxes, interest, litigation, extraordinary expenses, brokerage and other transaction expenses relating to the purchase or sale of portfolio investments, and acquired (underlying) fund fees and expenses) of Class R6 do not exceed those of Class I. These agreements will remain in effect until February 28, 2023, and shall renew automatically for one-year terms unless New York Life Investments provides written notice of termination prior to the start of the next term or upon approval of the Board.
During the year ended October 31, 2022, New York Life Investments earned fees from the Fund in the amount of $5,093,379 and waived fees and/or reimbursed expenses in the amount of $74,546 and paid the Subadvisor fees in the amount of $2,509,416.
JPMorgan Chase Bank, N.A. ("JPMorgan") provides sub-administration and sub-accounting services to the Fund pursuant to an agreement with New York Life Investments. These services include calculating the daily NAVs of the Fund, maintaining the general ledger and sub-ledger accounts for the calculation of the Fund's NAVs, and assisting New York Life Investments in conducting various aspects of the Fund's administrative operations. For providing these services to the Fund, JPMorgan is compensated by New York Life Investments.
Pursuant to an agreement between the Trust and New York Life Investments, New York Life Investments is responsible for providing or procuring certain regulatory reporting services for the Fund. The Fund will reimburse New York Life Investments for the actual costs incurred by New York Life Investments in connection with providing or procuring these services for the Fund.
(B) Distribution and Service Fees. The Trust, on behalf of the Fund, has entered into a distribution agreement with NYLIFE Distributors LLC (the “Distributor”), an affiliate of New York Life Investments. The Fund has adopted distribution plans (the “Plans”) in accordance with the provisions of Rule 12b-1 under the 1940 Act.
Pursuant to the Class A and Investor Class Plans, the Distributor receives a monthly fee from Class A and Investor Class shares at an annual rate of 0.25% of the average daily net assets of the Class A and Investor Class shares for distribution and/or service activities as designated by the Distributor. Pursuant to the Class C Plan, Class C shares pay the Distributor a monthly distribution fee at an annual rate of 0.25% of the average daily net assets of the Class C shares, along with a service fee at an annual rate of 0.25% of the average daily net assets of the Class C shares, for a total 12b-1 fee of 0.50%. Pursuant to the Class C2 Plan, Class C2 shares pay the Distributor a monthly distribution fee at an annual rate of 0.40% of the average daily net assets of the Class C2 shares, along with a service fee at an annual rate of 0.25% of the average daily net assets of the Class C2 shares, for a total 12b-1 fee of 0.65%. Class I and Class R6 shares are not subject to a distribution and/or service fee.
The Plans provide that the distribution and service fees are payable to the Distributor regardless of the amounts actually expended by the Distributor for distribution of the Fund's shares and service activities.
(C) Sales Charges. The Fund was advised by the Distributor that the amount of initial sales charges retained on sales of Class A and Investor Class shares during the year ended October 31, 2022, were $6,631 and $230, respectively.
The Fund was also advised that the Distributor retained CDSCs on redemptions of Class A, Investor Class and Class C shares during the year ended October 31, 2022, of $89,117, $59 and $7,212, respectively.
(D) Transfer, Dividend Disbursing and Shareholder Servicing Agent. NYLIM Service Company LLC, an affiliate of New York Life Investments, is the Fund's transfer, dividend disbursing and shareholder servicing agent pursuant to an agreement between NYLIM Service Company LLC and the Trust. NYLIM Service Company LLC has entered into an agreement with DST Asset Manager Solutions, Inc. ("DST"), pursuant to which DST performs certain transfer agent services on behalf of NYLIM Service Company LLC. New York Life Investments has contractually agreed to limit the transfer agency expenses charged to the Fund’s share classes to a maximum of 0.35% of that share class’s average daily net assets on an annual basis after deducting any applicable Fund or class-level expense reimbursement or small account fees. This agreement will remain in effect until February 28, 2023, and shall renew automatically for one-year terms unless New York Life Investments provides written notice of termination prior to the start of the next term or upon approval of the Board. During the year ended October 31, 2022, transfer agent expenses incurred by the Fund and any
Notes to Financial Statements (continued)
reimbursements, pursuant to the aforementioned Transfer Agency expense limitation agreement, were as follows:
| Class | Expense | Waived |
| Class A | $100,465 | $— |
| Investor Class | 262 | — |
| Class C | 22,870 | — |
| Class C2 | 175 | — |
| Class I | 176,009 | — |
| Class R6 | 214 | — |
(E) Small Account Fee. Shareholders with small accounts adversely impact the cost of providing transfer agency services. In an effort to reduce total transfer agency expenses, the Fund has implemented a small account fee on certain types of accounts. As described in the Fund's prospectus, certain shareholders with an account balance of less than $1,000 ($5,000 for Class A share accounts) are charged an annual per account fee of $20 (assessed semi-annually), the proceeds from which offset transfer agent fees as reflected in the Statement of Operations. This small account fee will not apply to certain types of accounts as described further in the Fund’s prospectus.
(F) Capital. As of October 31, 2022, New York Life and its affiliates beneficially held shares of the Fund with the values and percentages of net assets as follows:
| Class C2 | $21,719 | 6.0% |
| Class R6 | 22,703 | 0.4 |
Note 4-Federal Income Tax
As of October 31, 2022, the cost and unrealized appreciation (depreciation) of the Fund’s investment portfolio, including applicable derivative contracts and other financial instruments, as determined on a federal income tax basis, were as follows:
| | Federal Tax
Cost | Gross
Unrealized
Appreciation | Gross
Unrealized
(Depreciation) | Net
Unrealized
Appreciation/
(Depreciation) |
| Investments in Securities | $1,079,843,400 | $942,726 | $(105,687,554) | $(104,744,828) |
As of October 31, 2022, the components of accumulated gain (loss) on a tax basis were as follows:
Ordinary
income | Undistributed
Tax Exempt
Income | Accumulated
Capital
and Other
Gain (Loss) | Other
Temporary
Differences | Unrealized
Appreciation
(Depreciation) | Total
Accumulated
Gain (Loss) |
| $— | $697,900 | $(74,998,750) | $(680,293) | $(104,744,827) | $(179,725,970) |
The difference between book-basis and tax-basis unrealized appreciation (depreciation) is primarily due to mark to market of futures contracts,
cumulative bond amortization, and wash sales adjustments. The other temporary differences are primarily due to dividends payable.
As of October 31, 2022, for federal income tax purposes, capital loss carryforwards of $74,998,750, as shown in the table below, were available to the extent provided by the regulations to offset future realized gains of the Fund. Accordingly, no capital gains distributions are expected to be paid to shareholders until net gains have been realized in excess of such amounts.
Capital Loss
Available Through | Short-Term
Capital Loss
Amounts (000’s) | Long-Term
Capital Loss
Amounts (000’s) |
| Unlimited | $44,516 | $30,483 |
During the years ended October 31, 2022 and October 31, 2021, the tax character of distributions paid as reflected in the Statements of Changes in Net Assets was as follows:
| | 2022 | 2021 |
| Distributions paid from: | | |
| Ordinary Income | $ 805,072 | $ 768,763 |
| Exempt Interest Dividends | 31,799,213 | 27,720,933 |
| Total | $32,604,285 | $28,489,696 |
Note 5–Custodian
JPMorgan is the custodian of cash and securities held by the Fund. Custodial fees are charged to the Fund based on the Fund's net assets and/or the market value of securities held by the Fund and the number of certain transactions incurred by the Fund.
Note 6–Line of Credit
The Fund and certain other funds managed by New York Life Investments maintain a line of credit with a syndicate of banks in order to secure a source of funds for temporary purposes to meet unanticipated or excessive redemption requests.
Effective July 26, 2022, under the credit agreement (the “Credit Agreement”), the aggregate commitment amount is $600,000,000 with an additional uncommitted amount of $100,000,000. The commitment fee is an annual rate of 0.15% of the average commitment amount payable quarterly, regardless of usage, to JPMorgan, who serves as the agent to the syndicate. The commitment fee is allocated among the Fund and certain other funds managed by New York Life Investments based upon their respective net assets and other factors. Interest on any revolving credit loan is charged based upon the Federal Funds Rate, Daily Simple Secured Overnight Financing Rate ("SOFR") + 0.10%, or the Overnight Bank Funding Rate, whichever is higher. The Credit Agreement expires on July 25, 2023, although the Fund, certain other funds managed by New York Life Investments and the syndicate of banks may renew the Credit Agreement for an additional year on the same or different terms or enter into a credit agreement with a different syndicate of banks. Prior to July 26, 2022, the aggregate commitment amount and the commitment fee were the same as those under the current Credit
| 44 | MainStay MacKay California Tax Free Opportunities Fund |
Agreement. During the year ended October 31, 2022, there were no borrowings made or outstanding with respect to the Fund under the Credit Agreement.
Note 7–Interfund Lending Program
Pursuant to an exemptive order issued by the SEC, the Fund, along with certain other funds managed by New York Life Investments, may participate in an interfund lending program. The interfund lending program provides an alternative credit facility that permits the Fund and certain other funds managed by New York Life Investments to lend or borrow money for temporary purposes directly to or from one another, subject to the conditions of the exemptive order. During the year ended October 31, 2022, there were no interfund loans made or outstanding with respect to the Fund.
Note 8–Purchases and Sales of Securities (in 000’s)
During the year ended October 31, 2022, purchases and sales of securities, other than short-term securities, were $777,857 and $839,897, respectively.
Note 9–Capital Share Transactions
Transactions in capital shares for the years ended October 31, 2022 and October 31, 2021, were as follows:
| Class A | Shares | Amount |
| Year ended October 31, 2022: | | |
| Shares sold | 19,936,744 | $ 191,379,570 |
| Shares issued to shareholders in reinvestment of distributions | 907,820 | 9,005,771 |
| Shares redeemed | (17,665,075) | (174,189,542) |
| Net increase (decrease) in shares outstanding before conversion | 3,179,489 | 26,195,799 |
| Shares converted into Class A (See Note 1) | 1,974 | 19,505 |
| Net increase (decrease) | 3,181,463 | $ 26,215,304 |
| Year ended October 31, 2021: | | |
| Shares sold | 12,129,617 | $ 133,832,552 |
| Shares issued to shareholders in reinvestment of distributions | 689,377 | 7,594,800 |
| Shares redeemed | (6,991,630) | (77,063,811) |
| Net increase (decrease) in shares outstanding before conversion | 5,827,364 | 64,363,541 |
| Shares converted into Class A (See Note 1) | 114,504 | 1,276,207 |
| Shares converted from Class A (See Note 1) | (55,852) | (609,652) |
| Net increase (decrease) | 5,886,016 | $ 65,030,096 |
| |
| Investor Class | Shares | Amount |
| Year ended October 31, 2022: | | |
| Shares sold | 6,891 | $ 69,084 |
| Shares issued to shareholders in reinvestment of distributions | 1,450 | 14,374 |
| Shares redeemed | (6,634) | (65,508) |
| Net increase (decrease) in shares outstanding before conversion | 1,707 | 17,950 |
| Shares converted into Investor Class (See Note 1) | 2,286 | 21,835 |
| Net increase (decrease) | 3,993 | $ 39,785 |
| Year ended October 31, 2021: | | |
| Shares sold | 14,817 | $ 163,273 |
| Shares issued to shareholders in reinvestment of distributions | 1,305 | 14,374 |
| Shares redeemed | (5,242) | (57,745) |
| Net increase (decrease) in shares outstanding before conversion | 10,880 | 119,902 |
| Shares converted into Investor Class (See Note 1) | 367 | 4,024 |
| Shares converted from Investor Class (See Note 1) | (23,046) | (254,911) |
| Net increase (decrease) | (11,799) | $ (130,985) |
| |
| Class C | Shares | Amount |
| Year ended October 31, 2022: | | |
| Shares sold | 446,504 | $ 4,423,363 |
| Shares issued to shareholders in reinvestment of distributions | 90,527 | 901,967 |
| Shares redeemed | (2,008,512) | (20,002,452) |
| Net increase (decrease) in shares outstanding before conversion | (1,471,481) | (14,677,122) |
| Shares converted from Class C (See Note 1) | (4,259) | (41,340) |
| Net increase (decrease) | (1,475,740) | $ (14,718,462) |
| Year ended October 31, 2021: | | |
| Shares sold | 832,531 | $ 9,166,279 |
| Shares issued to shareholders in reinvestment of distributions | 84,200 | 927,733 |
| Shares redeemed | (1,311,739) | (14,451,128) |
| Net increase (decrease) in shares outstanding before conversion | (395,008) | (4,357,116) |
| Shares converted from Class C (See Note 1) | (10,620) | (118,247) |
| Net increase (decrease) | (405,628) | $ (4,475,363) |
| |
Notes to Financial Statements (continued)
| Class C2 | Shares | Amount |
| Year ended October 31, 2022: | | |
| Shares sold | 14,587 | $ 154,974 |
| Shares issued to shareholders in reinvestment of distributions | 840 | 8,264 |
| Shares redeemed | (507) | (4,957) |
| Net increase (decrease) | 14,920 | $ 158,281 |
| Year ended October 31, 2021: | | |
| Shares sold | 22,632 | $ 248,457 |
| Shares issued to shareholders in reinvestment of distributions | 308 | 3,396 |
| Shares redeemed | (136) | (1,496) |
| Net increase (decrease) | 22,804 | $ 250,357 |
| |
| Class I | Shares | Amount |
| Year ended October 31, 2022: | | |
| Shares sold | 41,708,471 | $ 413,825,062 |
| Shares issued to shareholders in reinvestment of distributions | 1,386,084 | 13,782,214 |
| Shares redeemed | (52,515,982) | (515,773,797) |
| Net increase (decrease) in shares outstanding before conversion | (9,421,427) | (88,166,521) |
| Shares converted from Class I (See Note 1) | (20,024) | (206,845) |
| Net increase (decrease) | (9,441,451) | $ (88,373,366) |
| Year ended October 31, 2021: | | |
| Shares sold | 24,818,215 | $ 273,702,977 |
| Shares issued to shareholders in reinvestment of distributions | 1,021,770 | 11,260,199 |
| Shares redeemed | (15,876,495) | (175,130,908) |
| Net increase (decrease) in shares outstanding before conversion | 9,963,490 | 109,832,268 |
| Shares converted into Class I (See Note 1) | 56,613 | 618,065 |
| Net increase (decrease) | 10,020,103 | $ 110,450,333 |
| |
| Class R6 | Shares | Amount |
| Year ended October 31, 2022: | | |
| Shares sold | 606,143 | $ 6,296,294 |
| Shares issued to shareholders in reinvestment of distributions | 15,818 | 155,707 |
| Shares redeemed | (188,889) | (1,831,587) |
| Net increase (decrease) in shares outstanding before conversion | 433,072 | 4,620,414 |
| Shares converted into Class R6 (See Note 1) | 20,024 | 206,845 |
| Net increase (decrease) | 453,096 | $ 4,827,259 |
| Year ended October 31, 2021: | | |
| Shares sold | 97,201 | $ 1,072,340 |
| Shares issued to shareholders in reinvestment of distributions | 5,129 | 56,511 |
| Shares redeemed | (158,095) | (1,732,624) |
| Net increase (decrease) in shares outstanding before conversion | (55,765) | (603,773) |
| Shares converted from Class R6 (See Note 1) | (81,959) | (915,486) |
| Net increase (decrease) | (137,724) | $ (1,519,259) |
Note 10–Other Matters
As of the date of this report, interest rates in the United States and many parts of the world, including certain European countries, are ascending from historically low levels. Thus, the Fund currently faces a heightened level of risk associated with rising interest rates. This could be driven by a variety of factors, including but not limited to central bank monetary policies, changing inflation or real growth rates, general economic conditions, increasing bond issuances or reduced market demand for low yielding investments.
An outbreak of COVID-19, first detected in December 2019, has developed into a global pandemic and has resulted in travel restrictions, closure of international borders, certain businesses and securities markets, restrictions on securities trading activities, prolonged quarantines, supply chain disruptions, and lower consumer demand, as well as general concern and uncertainty. In 2022, many countries lifted some or all restrictions related to COVID-19. However, the continued impact of COVID-19 and related variants is uncertain and could further adversely affect the global economy, national economies, individual issuers and capital markets in unforeseeable ways and result in a substantial and extended economic downturn. Developments that disrupt global economies and financial markets, such as COVID-19, may magnify factors that affect the Fund's performance.
Note 11–Subsequent Events
In connection with the preparation of the financial statements of the Fund as of and for the year ended October 31, 2022, events and transactions subsequent to October 31, 2022, through the date the financial statements were issued have been evaluated by the Manager for possible
| 46 | MainStay MacKay California Tax Free Opportunities Fund |
adjustment and/or disclosure. No subsequent events requiring financial statement adjustment or disclosure have been identified.
Report of Independent Registered Public Accounting Firm
To the Shareholders of the Fund and Board of Trustees
MainStay Funds Trust:
Opinion on the Financial Statements
We have audited the accompanying statement of assets and liabilities of MainStay MacKay California Tax Free Opportunities Fund (the Fund), one of the funds constituting MainStay Funds Trust, including the portfolio of investments, as of October 31, 2022, the related statement of operations for the year then ended, the statements of changes in net assets for each of the years in the two-year period then ended, and the related notes (collectively, the financial statements) and the financial highlights for each of the years or periods in the five-year period then ended. In our opinion, the financial statements and financial highlights present fairly, in all material respects, the financial position of the Fund as of October 31, 2022, the results of its operations for the year then ended, the changes in its net assets for each of the years in the two-year period then ended, and the financial highlights for each of the years or periods in the five-year period then ended, in conformity with U.S. generally accepted accounting principles.
Basis for Opinion
These financial statements and financial highlights are the responsibility of the Fund's management. Our responsibility is to express an opinion on these financial statements and financial highlights based on our audits. We are a public accounting firm registered with the Public Company Accounting Oversight Board (United States) (PCAOB) and are required to be independent with respect to the Fund in accordance with the U.S. federal securities laws and the applicable rules and regulations of the Securities and Exchange Commission and the PCAOB.
We conducted our audits in accordance with the standards of the PCAOB. Those standards require that we plan and perform the audit to obtain reasonable assurance about whether the financial statements and financial highlights are free of material misstatement, whether due to error or fraud. Our audits included performing procedures to assess the risks of material misstatement of the financial statements and financial highlights, whether due to error or fraud, and performing procedures that respond to those risks. Such procedures included examining, on a test basis, evidence regarding the amounts and disclosures in the financial statements and financial highlights. Such procedures also included confirmation of securities owned as of October 31, 2022, by correspondence with custodians and brokers; when replies were not received from brokers, we performed other auditing procedures. Our audits also included evaluating the accounting principles used and significant estimates made by management, as well as evaluating the overall presentation of the financial statements and financial highlights. We believe that our audits provide a reasonable basis for our opinion.

We have served as the auditor of one or more New York Life Investment Management investment companies since 2003.
Philadelphia, Pennsylvania
December 23, 2022
| 48 | MainStay MacKay California Tax Free Opportunities Fund |
Federal Income Tax Information
(Unaudited)
The Fund is required under the Internal Revenue Code to advise shareholders in a written statement as to the federal tax status of dividends paid by the Fund during such fiscal years.
For Federal individual income tax purposes, the Fund designated 97.5% of the ordinary income dividends paid during its fiscal year ended October 31, 2022 as attributable to interest income from Tax Exempt Municipal Bonds. Such dividends are currently exempt from Federal income taxes under Section 103(a) of the Internal Revenue Code.
In February 2023, shareholders will receive an IRS Form 1099-DIV or substitute Form 1099, which will show the federal tax status of the distributions received by shareholders in calendar year 2022. The amounts that will be reported on such 1099-DIV or substitute Form 1099 will be the amounts you are to use on your federal income tax return and will differ from the amounts which we must report for the Fund's fiscal year ended October 31, 2022.
Proxy Voting Policies and Procedures and Proxy Voting Record
The Fund is required to file with the SEC its proxy voting record for the 12-month period ending June 30 on Form N-PX. A description of the policies and procedures that are used to vote proxies relating to portfolio securities of the Fund is available free of charge upon request by calling 800-624-6782 or visiting the SEC’s website at www.sec.gov. The most recent Form N-PX or proxy voting record is available free of charge upon request by calling 800-624-6782; visiting newyorklifeinvestments.com; or visiting the SEC’s website at www.sec.gov.
Shareholder Reports and Quarterly Portfolio Disclosure
The Fund is required to file its complete schedule of portfolio holdings with the SEC 60 days after its first and third fiscal quarter on Form N-PORT. The Fund's holdings report is available free of charge upon request by calling New York Life Investments at 800-624-6782.
Board of Trustees and Officers (Unaudited)
The Trustees and officers of the Fund are listed below. The Board oversees the MainStay Group of Funds (which consists of MainStay Funds and MainStay Funds Trust), MainStay VP Funds Trust, MainStay MacKay DefinedTerm Municipal Opportunities Fund, MainStay CBRE Global Infrastructure Megatrends Fund, the Manager and the Subadvisors, and elects the officers of the Funds who are responsible for the day-to-day operations of the Fund. Information pertaining to the Trustees and officers is set forth below. Each Trustee serves until his or her successor is
elected and qualified or until his or her resignation, death or removal. Under the Board’s retirement policy, unless an exception is made, a Trustee must tender his or her resignation by the end of the calendar year during which he or she reaches the age of 75. The business address of each Trustee and officer listed below is 51 Madison Avenue, New York, New York 10010. None of the Trustees are “interested persons” (as defined by the 1940 Act and rules adopted by the SEC thereunder) of the Fund (“Independent Trustees”).
| | Name and
Year of Birth | Term of Office,
Position(s) Held and
Length of Service | Principal Occupation(s)
During Past Five Years | Number of
Portfolios in
Fund Complex
Overseen by
Trustee | Other Directorships
Held by Trustee |
| | | | | | |
| | David H. Chow
1957 | MainStay Funds: Trustee since 2016, Advisory Board Member (June 2015 to December 2015);MainStay Funds Trust:
Trustee since January 2016, Advisory Board Member (June 2015 to December 2015) | Founder and CEO, DanCourt Management, LLC since 1999 | 78 | MainStay VP Funds Trust: Trustee since January 2016, Advisory Board Member (June 2015 to December 2015) (31 portfolios);
MainStay MacKay DefinedTerm Municipal Opportunities Fund: Trustee since January 2016, Advisory Board Member (June 2015 to December 2015);
MainStay CBRE Global Infrastructure Megatrends Fund: Trustee since June 2021; VanEck Vectors Group of Exchange-Traded Funds: Independent Chairman of the Board of Trustees since 2008 and Trustee since 2006 (56 portfolios); and Berea College of Kentucky: Trustee since 2009, Chair of the Investment Committee since 2018 |
| | Susan B. Kerley
1951 | MainStay Funds: Chairman since 2017 and Trustee since 2007;MainStay Funds Trust:
Chairman since 2017 and Trustee since 1990** | President, Strategic Management Advisors LLC since 1990 | 78 | MainStay VP Funds Trust: Chairman since January 2017 and Trustee since 2007 (31 portfolios)**;
MainStay MacKay DefinedTerm Municipal Opportunities Fund: Chairman since 2017 and Trustee since 2011;
MainStay CBRE Global Infrastructure Megatrends Fund: Trustee since June 2021; and Legg Mason Partners Funds: Trustee since 1991 (45 portfolios) |
| | Alan R. Latshaw
1951 | MainStay Funds: Trustee since 2006;MainStay Funds Trust:
Trustee since 2007*** | Retired; Partner, Ernst & Young LLP (2002 to 2003); Partner, Arthur Andersen LLP (1989 to 2002); Consultant to the MainStay Funds Audit and Compliance Committee (2004 to 2006) | 78 | MainStay VP Funds Trust: Trustee since 2007 (31 portfolios)**;
MainStay MacKay DefinedTerm Municipal Opportunities Fund: Trustee since 2011; and
MainStay CBRE Global Infrastructure Megatrends Fund: Trustee since June 2021 |
| 50 | MainStay MacKay California Tax Free Opportunities Fund |
| | Name and
Year of Birth | Term of Office,
Position(s) Held and
Length of Service | Principal Occupation(s)
During Past Five Years | Number of
Portfolios in
Fund Complex
Overseen by
Trustee | Other Directorships
Held by Trustee |
| | | | | | |
| | Karen Hammond
1956 | MainStay Funds: Trustee since December 2021, Advisory Board Member (June 2021 to December 2021);MainStay Funds Trust:
Trustee since December 2021, Advisory Board Member (June 2021 to December 2021)
| Retired, Managing Director, Devonshire Investors (2007 to 2013); Senior Vice President, Fidelity Management & Research Co. (2005 to 2007); Senior Vice President and Corporate Treasurer, FMR Corp. (2003 to 2005); Chief Operating Officer, Fidelity Investments Japan (2001 to 2003) | 78 | MainStay VP Funds Trust: Trustee since December 2021, Advisory Board Member (June 2021 to December 2021) (31 Portfolios);
MainStay MacKay DefinedTerm Municipal Opportunities Fund: Trustee since December 2021, Advisory Board Member (June 2021 to December 2021);
MainStay CBRE Global Infrastructure Megatrends Fund: Trustee since December 2021, Advisory Board Member (June 2021 to December 2021);
Two Harbors Investment Corp.: Director since 2018;
Rhode Island State Investment Commission: Member since 2017; and
Blue Cross Blue Shield of Rhode Island: Director since 2019 |
| | Jacques P. Perold
1958 | MainStay Funds: Trustee since 2016, Advisory Board Member (June 2015 toDecember 2015);MainStay Funds Trust:
Trustee since January 2016, Advisory Board Member (June 2015 to December 2015) | Founder and Chief Executive Officer, CapShift Advisors LLC (since 2018); President, Fidelity Management & Research Company (2009 to 2014); President and Chief Investment Officer, Geode Capital Management, LLC (2001 to 2009) | 78 | MainStay VP Funds Trust: Trustee since January 2016, Advisory Board Member (June 2015 to December 2015) (31 portfolios);
MainStay MacKay DefinedTerm Municipal Opportunities Fund: Trustee since January 2016, Advisory Board Member (June 2015 to December 2015);
MainStay CBRE Global Infrastructure Megatrends Fund: Trustee since June 2021; Partners in Health: Trustee since 2019; Allstate Corporation: Director since 2015; and MSCI Inc.: Director since 2017 |
| | Richard S. Trutanic
1952 | MainStay Funds: Trustee since 1994;MainStay Funds Trust:
Trustee since 2007*** | Chairman and Chief Executive Officer, Somerset & Company (financial advisory firm) since 2004; Managing Director, The Carlyle Group (private investment firm) (2002 to 2004); Senior Managing Director, Partner and Board Member, Groupe Arnault S.A. (private investment firm) (1999 to 2002) | 78 | MainStay VP Funds Trust: Trustee since 2007 (31 portfolios)**;
MainStay MacKay DefinedTerm Municipal Opportunities Fund: Trustee since 2011; and MainStay CBRE Global Infrastructure Megatrends Fund: Trustee since June 2021 |
| ** | Includes prior service as a Director of MainStay VP Series Fund, Inc., the predecessor to MainStay VP Funds Trust. |
| *** | Includes prior service as a Director/Trustee of certain predecessor entities to MainStay Funds Trust. |
Board of Trustees and Officers (Unaudited) (continued)
| | Name and
Year of Birth | Position(s) Held and
Length of Service | Principal Occupation(s)
During Past Five Years | |
| | | | | |
| | Kirk C. Lehneis
1974 | President, MainStay Funds, MainStay Funds Trust since 2017 | Chief Operating Officer and Senior Managing Director (since 2016), New York Life Investment Management LLC and New York Life Investment Management Holdings LLC; Member of the Board of Managers (since 2017) and Senior Managing Director (since 2018), NYLIFE Distributors LLC; Chairman of the Board and Senior Managing Director, NYLIM Service Company LLC (since 2017); Trustee, President and Principal Executive Officer of IndexIQ Trust, IndexIQ ETF Trust and IndexIQ Active ETF Trust (since January 2018); President, MainStay CBRE Global Infrastructure Megatrends Fund (since 2021), MainStay MacKay DefinedTerm Municipal Opportunities Fund and MainStay VP Funds Trust (since 2017); Senior Managing Director, Global Product Development (From 2015-2016); Managing Director, Product Development (2010 to 2015), New York Life Investment Management LLC | |
| | Jack R. Benintende
1964 | Treasurer and Principal Financial and Accounting Officer, MainStay Funds (since 2007), MainStay Funds Trust (since 2009) | Managing Director, New York Life Investment Management LLC (since 2007); Treasurer and Principal Financial and Accounting Officer, MainStay CBRE Global Infrastructure Megatrends Fund (since 2021), MainStay MacKay DefinedTerm Municipal Opportunities Fund (since 2011) and MainStay VP Funds Trust (since 2007)** and Assistant Treasurer, New York Life Investment Management Holdings LLC (2008 to 2012) | |
| | J. Kevin Gao
1967 | Secretary and Chief Legal Officer, MainStay Funds and MainStay Funds Trust (since 2010) | Managing Director and Associate General Counsel, New York Life Investment Management LLC (since 2010); Secretary and Chief Legal Officer and MainStay CBRE Global Infrastructure Megatrends Fund (since 2021), MainStay MacKay DefinedTerm Municipal Opportunities Fund (since 2011) and MainStay VP Funds Trust (since 2010)** | |
| | Scott T. Harrington
1959 | Vice President— Administration, MainStay Funds (since 2009), MainStay Funds Trust (since 2009) | Managing Director, New York Life Investment Management LLC (including predecessor advisory organizations) (since 2000); Member of the Board of Directors, New York Life Trust Company (since 2009); Vice President—Administration, MainStay CBRE Global Infrastructure Megatrends Fund (since 2021), MainStay MacKay DefinedTerm Municipal Opportunities Fund (since 2011) and MainStay VP Funds Trust (since 2005)** | |
| | Kevin M. Gleason
1967 | Vice President and Chief Compliance Officer, MainStay Funds and MainStay Funds Trust (since June 2022) | Vice President and Chief Compliance Officer, IndexIQ, IndexIQ ETF Trust and Index IQ Active ETF Trust (since June 2022); Vice President and Chief Compliance Officer, MainStay CBRE Global Infrastructure Megatrends Fund, MainStay VP Funds Trust and MainStay MacKay DefinedTerm Municipal Opportunities Fund (since June 2022); Senior Vice President, Voya Investment Management and Chief Compliance Officer, Voya Family of Funds (2012-2022) | |
| * | The officers listed above are considered to be “interested persons” of the MainStay Group of Funds, MainStay VP Funds Trust, MainStay CBRE Global Infrastructure Megatrends Fund and MainStay MacKay DefinedTerm Municipal Opportunities Fund within the meaning of the 1940 Act because of their affiliation with the MainStay Group of Funds, New York Life Insurance Company and/or its affiliates, including New York Life Investment Management LLC, NYLIM Service Company LLC, NYLIFE Securities LLC and/or NYLIFE Distributors LLC, as described in detail in the column captioned “Principal Occupation(s) During Past Five Years.” Officers are elected annually by the Board. |
| ** | Includes prior service as an Officer of MainStay VP Series Fund, Inc., the predecessor to MainStay VP Funds Trust. |
Officers of the Trust (Who are not Trustees)*
| 52 | MainStay MacKay California Tax Free Opportunities Fund |
This page intentionally left blank.
This page intentionally left blank.
Equity
U.S. Equity
MainStay Epoch U.S. Equity Yield Fund
MainStay S&P 500 Index Fund1
MainStay Winslow Large Cap Growth Fund
MainStay WMC Enduring Capital Fund
MainStay WMC Growth Fund
MainStay WMC Small Companies Fund
MainStay WMC Value Fund
International Equity
MainStay Epoch International Choice Fund
MainStay MacKay International Equity Fund
MainStay WMC International Research Equity Fund
Emerging Markets Equity
MainStay Candriam Emerging Markets Equity Fund
Global Equity
MainStay Epoch Capital Growth Fund
MainStay Epoch Global Equity Yield Fund
Fixed Income
Taxable Income
MainStay Candriam Emerging Markets Debt Fund
MainStay Floating Rate Fund
MainStay MacKay High Yield Corporate Bond Fund
MainStay MacKay Short Duration High Yield Fund
MainStay MacKay Strategic Bond Fund
MainStay MacKay Total Return Bond Fund
MainStay MacKay U.S. Infrastructure Bond Fund
MainStay Short Term Bond Fund
Tax-Exempt Income
MainStay MacKay California Tax Free Opportunities Fund2
MainStay MacKay High Yield Municipal Bond Fund
MainStay MacKay New York Tax Free Opportunities Fund3
MainStay MacKay Short Term Municipal Fund
MainStay MacKay Strategic Municipal Allocation Fund
MainStay MacKay Tax Free Bond Fund
Money Market
MainStay Money Market Fund
Mixed Asset
MainStay Balanced Fund
MainStay Income Builder Fund
MainStay MacKay Convertible Fund
Speciality
MainStay CBRE Global Infrastructure Fund
MainStay CBRE Real Estate Fund
MainStay Cushing MLP Premier Fund
Asset Allocation
MainStay Conservative Allocation Fund
MainStay Conservative ETF Allocation Fund
MainStay Defensive ETF Allocation Fund
MainStay Equity Allocation Fund
MainStay Equity ETF Allocation Fund
MainStay ESG Multi-Asset Allocation Fund
MainStay Growth Allocation Fund
MainStay Growth ETF Allocation Fund
MainStay Moderate Allocation Fund
MainStay Moderate ETF Allocation Fund
Manager
New York Life Investment Management LLC
New York, New York
Subadvisors
Candriam4
Strassen, Luxembourg
CBRE Investment Management Listed Real Assets LLC
Radnor, Pennsylvania
Cushing Asset Management, LP
Dallas, Texas
Epoch Investment Partners, Inc.
New York, New York
MacKay Shields LLC4
New York, New York
NYL Investors LLC4
New York, New York
Wellington Management Company LLP
Boston, Massachusetts
Winslow Capital Management, LLC
Minneapolis, Minnesota
Legal Counsel
Dechert LLP
Washington, District of Columbia
Independent Registered Public Accounting Firm
KPMG LLP
Philadelphia, Pennsylvania
Distributor
NYLIFE Distributors LLC4
Jersey City, New Jersey
Custodian
JPMorgan Chase Bank, N.A.
New York, New York
1.
Prior to February 28, 2022, the Fund's name was MainStay MacKay S&P 500 Index Fund.
| 2. | This Fund is registered for sale in AZ, CA, NV, OR, TX, UT, WA and MI (Class A and Class I shares only), and CO, FL, GA, HI, ID, MA, MD, NH, NJ and NY (Class I shares only). |
| 3. | This Fund is registered for sale in CA, CT, DE, FL, MA, NJ, NY and VT. |
| 4. | An affiliate of New York Life Investment Management LLC. |
Not part of the Annual Report
For more information
800-624-6782
newyorklifeinvestments.com
“New York Life Investments” is both a service mark, and the common trade name, of certain investment advisors affiliated with New York Life Insurance Company. The MainStay Funds® are managed by New York Life Investment Management LLC and distributed by NYLIFE Distributors LLC, 30 Hudson Street, Jersey City, NJ 07302, a wholly owned subsidiary of New York Life Insurance Company. NYLIFE Distributors LLC is a Member FINRA/SIPC.
©2022 NYLIFE Distributors LLC. All rights reserved.
| 5013750.2MS229-22 | MSCTF11-12/22 |
(NYLIM) NL237
MainStay MacKay High Yield Municipal Bond Fund
Message from the President and Annual Report
October 31, 2022
Sign up for e-delivery of your shareholder reports. For full details on e-delivery, including who can participate and what you can receive via e-delivery,
please log in to newyorklifeinvestments.com/accounts.
| Not FDIC/NCUA Insured | Not a Deposit | May Lose Value | No Bank Guarantee | Not Insured by Any Government Agency |
This page intentionally left blank
Message from the President
A series of economic and geopolitical challenges undermined equity and fixed-income markets during the 12-month reporting period ended October 31, 2022. Stocks and bonds alike trended lower in the face of sharply rising interest rates, increasing inflationary pressures, slowing economic growth and Russia’s invasion of Ukraine.
The reporting period began on a mixed note, with concerns about the spreading Omicron variant of the COVID-19 virus and increasingly hawkish statements from the U.S. Federal Reserve (the “Fed”) regarding mounting inflation, countered by bullish sentiment stemming from U.S. economic growth and strong corporate earnings. In January 2022, markets turned decisively negative as comments from the Fed raised the likelihood of rate hikes as early as March, and Russia issued increasingly aggressive threats toward Ukraine. The onset of Russia’s invasion in February exacerbated global inflationary pressures while increasing investor uncertainty. Domestic supply shortages, international trade imbalances and rising inflation caused GDP (gross domestic product) to contract in the first and second quarters of the year, although employment and consumer spending proved resilient. Prices for petroleum surged to multi-year highs, while many key agricultural chemicals and industrial metals climbed as well. Accelerating inflationary forces prompted the Fed to implement its most aggressive interest rate increases since the 1980s with a series of five sharp rate hikes, raising the federal funds rate from a range of 0.00% to 0.25% in March to 3.00% to 3.25% in September, with additional rate hikes expected before the end of the year. International central banks generally followed suit, raising rates by varying degrees in efforts to curb local inflation, although most increases remained significantly more modest than those in the United States. Relatively high U.S. interest rates and risk-averse international sentiment pushed U.S. dollar values higher compared to most other currencies, with the ensuing negative impact on global prices for food, fuel and other key, U.S.-dollar-denominated products.
The effects of these interrelated challenges were felt throughout U.S. and international financial markets. The S&P 500® Index, a widely regarded benchmark of U.S. market performance, declined by more than 14% during the reporting period. Although the energy sector generated strong gains, bolstered by elevated oil and gas prices, most other industry areas recorded losses. The more cyclical and growth-oriented sectors of consumer discretionary, real estate and information technology delivered the
weakest returns, while the traditionally defensive and value-oriented consumer staples, utilities and health care sectors outperformed. International stocks lagged compared to their U.S. counterparts, with some emerging markets, such as China, suffering particularly steep losses. A few markets, however, including Brazil, Mexico and the United Arab Emirates, ended the reporting period with little change. Fixed-income markets saw bond prices broadly decline as yields rose along with interest rates. Short-term yields rose faster than long-term yields, producing a yield curve inversion from July through the end of the reporting period, with long-term rates remaining below short-term rates. While floating-rate instruments, which feature variable interest rates that allow investors to benefit from a rising rate environment, provided a degree of insulation from inflation-driven trends, they were not immune to the market’s widespread declines.
While the Fed acknowledges the costs of rising rates in terms of weaker GDP growth and unsettled financial markets over the short term, its primary focus continues to be the longer-term economic impact of inflation. With the latest figures as of the date of this report showing that inflation remains above 8%, versus a target rate of just 2%, the Fed clearly has a distance yet to go, making further rate increases and market volatility more likely in the coming months. The question remains as to whether the Fed and other central banks will manage a so-called “soft landing,” curbing inflation while avoiding a persistent economic slowdown. If they prove successful, we expect that favorable inflation trends and increasingly attractive valuations in both equity and bond markets should eventually translate into sustainable improvements in the investment environment.
Whatever actions the Fed takes and however financial markets react, as a MainStay investor, you can depend on us to continue providing the insight, expertise and service that have long defined New York Life Investments. Thank you for trusting us to help you meet your investment needs.
Sincerely,
Kirk C. Lehneis
President
The opinions expressed are as of the date of this report and are subject to change. There is no guarantee that any forecast made will come to pass. This material does not constitute investment advice and is not intended as an endorsement of any specific investment. Past performance is no guarantee of future results.
Not part of the Annual Report
Investors should refer to the Fund’s Summary Prospectus and/or Prospectus and consider the Fund’s investment objectives, strategies, risks, charges and expenses carefully before investing. The Summary Prospectus and/or Prospectus contain this and other information about the Fund. You may obtain copies of the Fund’s Summary Prospectus, Prospectus and Statement of Additional Information, which includes information about the MainStay Funds Trust's Trustees, free of charge, upon request, by calling toll-free 800-624-6782, by writing to NYLIFE Distributors LLC, Attn: MainStay Marketing Department, 30 Hudson Street, Jersey City, NJ 07302 or by sending an e-mail to MainStayShareholderServices@nylim.com. These documents are also available via the MainStay Funds’ website at newyorklifeinvestments.com. Please read the Fund’s Summary Prospectus and/or Prospectus carefully before investing.
Investment and Performance Comparison (Unaudited)
Performance data quoted represents past performance. Past performance is no guarantee of future results. Because of market volatility and other factors, current performance may be lower or higher than the figures shown. Investment return and principal value will fluctuate, and as a result, when shares are redeemed, they may be worth more or less than their original cost. The graph below depicts the historical performance of Class I shares of the Fund. Performance will vary from class to class based on differences in class-specific expenses and sales charges. For performance information current to the most recent month-end, please call 800-624-6782 or visit newyorklifeinvestments.com.
The performance table and graph do not reflect the deduction of taxes that a shareholder would pay on distributions or Fund share redemptions. Total returns reflect maximum applicable sales charges as indicated in the table below, if any, changes in share price, and reinvestment of dividend and capital gain distributions. The graph assumes the initial investment amount shown below and reflects the deduction of all sales charges that would have applied for the period of investment. Performance figures may reflect certain fee waivers and/or expense limitations, without which total returns may have been lower. For more information on share classes and current fee waivers and/or expense limitations (if any), please refer to the Notes to Financial Statements.
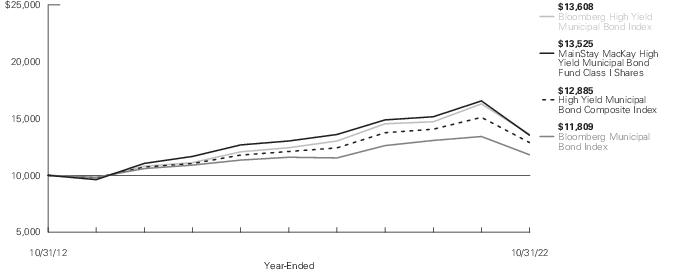
| Average Annual Total Returns for the Year-Ended October 31, 2022 |
| Class | Sales Charge | | Inception
Date | One
Year | Five
Years | Ten Years
or Since
Inception | Gross
Expense
Ratio1 |
| Class A Shares2 | Maximum 3% Initial Sales Charge | With sales charges | 3/31/2010 | -22.15% | -0.41% | 2.34% | 0.85% |
| | | Excluding sales charges | | -18.48 | 0.51 | 2.81 | 0.85 |
| Investor Class Shares3, 4 | Maximum 2.5% Initial Sales Charge | With sales charges | 3/31/2010 | -21.78 | -0.43 | 2.32 | 0.87 |
| | | Excluding sales charges | | -18.52 | 0.49 | 2.79 | 0.87 |
| Class C Shares | Maximum 1% CDSC | With sales charges | 3/31/2010 | -19.94 | -0.26 | 2.02 | 1.62 |
| | if Redeemed Within One Year of Purchase | Excluding sales charges | | -19.15 | -0.26 | 2.02 | 1.62 |
| Class I Shares | No Sales Charge | | 3/31/2010 | -18.28 | 0.76 | 3.07 | 0.60 |
| Class R6 Shares | No Sales Charge | | 11/1/2019 | -18.23 | N/A | -3.09 | 0.55 |
| 1. | The gross expense ratios presented reflect the Fund’s “Total Annual Fund Operating Expenses” from the most recent Prospectus, as supplemented, and may differ from other expense ratios disclosed in this report. |
| 2. | Prior to August 10, 2022, the maximum initial sales charge was 4.5%, which is reflected in the applicable average annual total return figures shown. |
| 3. | Prior to June 30, 2020, the maximum initial sales charge was 4.5%, which is reflected in the applicable average annual total return figures shown. |
| 4. | Prior to August 10, 2022, the maximum initial sales charge was 4%, which is reflected in the applicable average annual total return figures shown. |
The footnotes on the next page are an integral part of the table and graph and should be carefully read in conjunction with them.
| Benchmark Performance* | One
Year | Five
Years | Ten
Years |
| Bloomberg Municipal Bond Index1 | -11.98% | 0.37% | 1.68% |
| Bloomberg High Yield Municipal Bond Index2 | -16.45 | 1.83 | 3.13 |
| High Yield Municipal Bond Composite Index3 | -14.68 | 1.27 | 2.57 |
| Morningstar High Yield Muni Category Average4 | -16.52 | 0.24 | 2.03 |
| * | Returns for indices reflect no deductions for fees, expenses or taxes, except for foreign withholding taxes where applicable. Results assume reinvestment of all dividends and capital gains. An investment cannot be made directly in an index. |
| 1. | The Bloomberg Municipal Bond Index is the Fund's primary broad-based securities market index for comparison purposes. The Bloomberg Municipal Bond Index is considered representative of the broad-based market for investment-grade, tax-exempt bonds with a maturity of at least one year. Bonds subject to the alternative minimum tax or with floating or zero coupons are excluded. |
| 2. | The Fund has selected the Bloomberg High Yield Municipal Bond Index as an additional benchmark. The Bloomberg Municipal High Yield Bond Index is a flagship measure of the non-investment grade and non-rated U.S. dollar-denominated tax-exempt bond market. |
| 3. | The High Yield Municipal Bond Composite Index is the Fund’s secondary benchmark. The High Yield Municipal Bond Composite Index consists of the Bloomberg High Yield Municipal Bond Index and the Bloomberg Municipal Bond Index weighted 60%/40%, respectively. The Bloomberg High Yield Municipal Bond Index is made up of bonds that are non-investment grade, unrated, or rated below Ba1 by Moody’s Investors Service with a remaining maturity of at least one year. |
| 4. | The Morningstar High Yield Muni Category Average is representative of Funds that invest a substantial portion of assets in high-income municipal securities that are not rated or that are rated at the level of or below BBB by a major ratings agency such as Standard & Poor’s or Moody’s. Results are based on average total returns of similar funds with all dividends and capital gain distributions reinvested. |
The footnotes on the preceding page are an integral part of the table and graph and should be carefully read in conjunction with them.
| 6 | MainStay MacKay High Yield Municipal Bond Fund |
Cost in Dollars of a $1,000 Investment in MainStay MacKay High Yield Municipal Bond Fund (Unaudited)
The example below is intended to describe the fees and expenses borne by shareholders during the six-month period from May 1, 2022 to October 31, 2022, and the impact of those costs on your investment.
Example
As a shareholder of the Fund you incur two types of costs: (1) transaction costs, including exchange fees and sales charges (loads) on purchases (as applicable), and (2) ongoing costs, including management fees, distribution and/or service (12b-1) fees and other Fund expenses (as applicable). This example is intended to help you understand your ongoing costs (in dollars) of investing in the Fund and to compare these costs with the ongoing costs of investing in other mutual funds. The example is based on an investment of $1,000 made at the beginning of the six-month period and held for the entire period from May 1, 2022 to October 31, 2022.
This example illustrates your Fund’s ongoing costs in two ways:
Actual Expenses
The second and third data columns in the table below provide information about actual account values and actual expenses. You may use the information in these columns, together with the amount you invested, to estimate the expenses that you paid during the six months ended October 31, 2022. Simply divide your account value by $1,000 (for example, an
$8,600 account value divided by $1,000 = 8.6), then multiply the result by the number under the heading entitled “Expenses Paid During Period” to estimate the expenses you paid on your account during this period.
Hypothetical Example for Comparison Purposes
The fourth and fifth data columns in the table below provide information about hypothetical account values and hypothetical expenses based on the Fund’s actual expense ratio and an assumed rate of return of 5% per year before expenses, which is not the Fund’s actual return. The hypothetical account values and expenses may not be used to estimate the actual ending account balances or expenses you paid for the six-month period shown. You may use this information to compare the ongoing costs of investing in the Fund with the ongoing costs of investing in other mutual funds. To do so, compare this 5% hypothetical example with the 5% hypothetical examples that appear in the shareholder reports of the other mutual funds.
Please note that the expenses shown in the table are meant to highlight your ongoing costs only and do not reflect any transactional costs, such as exchange fees or sales charges (loads). Therefore, the fourth and fifth data columns of the table are useful in comparing ongoing costs only and will not help you determine the relative total costs of owning different funds. In addition, if these transactional costs were included, your costs would have been higher.
| Share Class | Beginning
Account
Value
5/1/22 | Ending Account
Value (Based
on Actual
Returns and
Expenses)
10/31/22 | Expenses
Paid
During
Period1 | Ending Account
Value (Based
on Hypothetical
5% Annualized
Return and
Actual Expenses)
10/31/22 | Expenses
Paid
During
Period1 | Net Expense
Ratio
During
Period2 |
| Class A Shares | $1,000.00 | $903.10 | $4.22 | $1,020.77 | $4.48 | 0.88% |
| Investor Class Shares | $1,000.00 | $902.80 | $4.27 | $1,020.72 | $4.53 | 0.89% |
| Class C Shares | $1,000.00 | $899.30 | $7.85 | $1,016.94 | $8.34 | 1.64% |
| Class I Shares | $1,000.00 | $904.20 | $3.02 | $1,022.03 | $3.21 | 0.63% |
| Class R6 Shares | $1,000.00 | $905.20 | $2.69 | $1,022.38 | $2.85 | 0.56% |
| 1. | Expenses are equal to the Fund’s annualized expense ratio of each class multiplied by the average account value over the period, divided by 365 and multiplied by 184 (to reflect the six-month period). The table above represents the actual expenses incurred during the six-month period. In addition to the fees and expenses which the Fund bears directly, it also indirectly bears a pro rata share of the fees and expenses of the underlying funds in which it invests. Such indirect expenses are not included in the above-reported expense figures. |
| 2. | Expenses are equal to the Fund's annualized expense ratio to reflect the six-month period. |
Portfolio Composition as of October 31, 2022 (Unaudited)
| Puerto Rico | 12.7% |
| Illinois | 11.2 |
| New York | 9.0 |
| California | 7.9 |
| Texas | 5.3 |
| New Jersey | 4.8 |
| Ohio | 4.7 |
| Pennsylvania | 4.5 |
| Florida | 2.9 |
| Colorado | 2.7 |
| U.S. Virgin Islands | 2.7 |
| Wisconsin | 2.3 |
| Michigan | 2.1 |
| Virginia | 1.8 |
| Arizona | 1.6 |
| Alabama | 1.6 |
| District of Columbia | 1.6 |
| Georgia | 1.4 |
| Washington | 1.2 |
| Massachusetts | 1.1 |
| Maryland | 1.1 |
| Utah | 1.1 |
| Kentucky | 1.0 |
| Iowa | 1.0 |
| Minnesota | 1.0 |
| Guam | 0.9 |
| Arkansas | 0.8 |
| North Carolina | 0.8 |
| South Carolina | 0.8 |
| Connecticut | 0.6% |
| Missouri | 0.6 |
| Tennessee | 0.6 |
| North Dakota | 0.5 |
| Delaware | 0.5 |
| Hawaii | 0.5 |
| West Virginia | 0.4 |
| Louisiana | 0.4 |
| Multi–State | 0.3 |
| Nevada | 0.3 |
| Indiana | 0.3 |
| Rhode Island | 0.3 |
| Alaska | 0.2 |
| New Hampshire | 0.2 |
| Montana | 0.2 |
| Kansas | 0.2 |
| Oregon | 0.1 |
| Idaho | 0.1 |
| Maine | 0.1 |
| Oklahoma | 0.1 |
| Vermont | 0.1 |
| Mississippi | 0.1 |
| South Dakota | 0.0‡ |
| Nebraska | 0.0‡ |
| Short–Term Investment | 0.3 |
| Other Assets, Less Liabilities | 1.4 |
| | 100.0% |
| ‡ | Less than one–tenth of a percent. |
See Portfolio of Investments beginning on page 11 for specific holdings within these categories. The Fund's holdings are subject to change.
Top Ten Holdings and/or Issuers Held as of October 31, 2022 (excluding short-term investments) (Unaudited)
| 1. | Metropolitan Pier & Exposition Authority, (zero coupon)-5.00%, due 12/15/31–6/15/57 |
| 2. | Chicago Board of Education, (zero coupon)-7.00%, due 12/1/26–12/1/47 |
| 3. | Commonwealth of Puerto Rico, (zero coupon)-5.75%, due 7/1/24–7/1/46 |
| 4. | Puerto Rico Commonwealth Aqueduct & Sewer Authority, 3.50%-5.00%, due 7/1/26–7/1/47 |
| 5. | Metropolitan Transportation Authority, 4.00%-5.00%, due 11/15/27–11/15/54 |
| 6. | Puerto Rico Sales Tax Financing Corp., (zero coupon)-5.00%, due 7/1/31–7/1/58 |
| 7. | New York Transportation Development Corp., 4.375%-5.375%, due 8/1/31–7/1/46 |
| 8. | Puerto Rico Electric Power Authority, 2.046%-7.00%, due 7/1/19–7/1/43 |
| 9. | Matching Fund Special Purpose Securitization Corp., 5.00%, due 10/1/30–10/1/39 |
| 10. | Public Finance Authority, (zero coupon)-9.00%, due 10/1/24–5/1/71 |
| 8 | MainStay MacKay High Yield Municipal Bond Fund |
Portfolio Management Discussion and Analysis (Unaudited)
Questions answered by portfolio managers John Loffredo, CFA, Robert DiMella, CFA, Michael Petty, David Dowden, Scott Sprauer and Frances Lewis of MacKay Shields LLC, the Fund’s Subadvisor.
How did MainStay MacKay High Yield Municipal Bond Fund perform relative to its benchmarks and peer group during the 12 months ended October 31, 2022?
For the 12 months ended October 31, 2022, Class I shares of MainStay MacKay High Yield Municipal Bond Fund returned −18.28%, underperforming the −11.98% return of the Fund’s primary benchmark, the Bloomberg Municipal Bond Index (the "Index"). During the same period, Class I shares underperformed the −16.45% return of the Fund’s secondary benchmark, the Bloomberg High Yield Municipal Bond Index, and the −14.68% return of the High Yield Municipal Bond Composite Index, an additional benchmark of the Fund. For the 12 months ended October 31, 2022, Class I shares also underperformed the −16.52% return of the Morningstar High Yield Muni Category Average.1
What factors affected the Fund’s relative performance during the reporting period?
During the reporting period, both municipal and U.S. Treasury rates rose, with the municipal yield curve2 steepening as outflows persisted. As a result, ratios cheapened across the curve, most notably on the long end. The Fund’s yield curve positioning led to underperformance relative to the Bloomberg Municipal Bond Index, as the increase in rates resulted in overweight exposure to bonds maturing in 20+ years, detracting from relative performance. The Fund’s overweight exposure to bonds with coupons of 4% also detracted from relative returns. From a rating perspective, the Fund’s overweight exposure to bonds rated BBB3 detracted from relative performance; however, the negative impact of this position was partially offset by the positive effect of the Fund’s underweight exposure to ultra-high-quality bonds. Overweight exposure to holdings from Puerto Rico and Illinois further detracted from performance; however, underweight exposure to Texas holdings helped offset some of those losses.
During the reporting period, were there any market events that materially impacted the Fund’s performance or liquidity?
During the reporting period, markets extended their historic drawdown driven by the combination of rising U.S. Treasury yields, ongoing monetary policy tightening and geopolitical uncertainty. The municipal market mirrored this broader sell-off, and many
investors reacted by withdrawing money from their municipal holdings. The municipal market experienced record outflows, which ultimately drove municipal yields higher.
During the reporting period, how was the Fund’s performance materially affected by investments in derivatives?
During the reporting period, the Fund held a small position in U.S. Treasury futures. This hedge was additive to Fund performance, as municipal exposure on the long end of the curve underperformed the market.
What was the Fund’s duration4 strategy during the reporting period?
The Fund’s duration was targeted to remain in a neutral range relative to the Fund’s investable universe, as outlined in the prospectus. In addition to investment-grade bonds, the Fund normally invests a substantial amount of its assets in municipal securities rated below investment grade. Since the Fund’s investable universe is broader than that of the Bloomberg Municipal Bond Index, the Fund’s duration may also differ from that of the Index. As of October 31, 2022, the Fund's modified duration to worst5 was 10.77 years while the Index’s modified duration to worst was 6.71 years.
During the reporting period, which sectors were the strongest positive contributors to the Fund’s relative performance and which sectors were particularly weak?
During the reporting period, underweight exposure to the state and local general obligation and water & sewer sectors made positive contributions to the Fund’s performance relative to the Bloomberg Municipal Bond Index. (Contributions take weightings and total returns into account.) However, overweight exposure to the tobacco, hospital and special tax sectors detracted from relative results.
How did the Fund’s sector weighting change during the reporting period?
During the reporting period, there were no material changes to the weightings in the Fund. At the margin, there were increases in the Fund’s exposures to the housing and special tax sectors. From a credit perspective, the Fund increased exposures to bonds rated
| 1. | See page 5 for other share class returns, which may be higher or lower than Class I share returns. See page 6 for more information on benchmark and peer group returns. |
| 2. | The yield curve is a line that plots the yields of various securities of similar quality—typically U.S. Treasury issues—across a range of maturities. The U.S. Treasury yield curve serves as a benchmark for other debt and is used in economic forecasting. |
| 3. | An obligation rated ‘BBB’ by Standard & Poor’s (“S&P”) is deemed by S&P to exhibit adequate protection parameters. In the opinion of S&P, however, adverse economic conditions or changing circumstances are more likely to lead to a weakened capacity of the obligor to meet its financial commitment on the obligation. When applied to Fund holdings, ratings are based solely on the creditworthiness of the bonds in the portfolio and are not meant to represent the security or safety of the Fund. |
| 4. | Duration is a measure of the price sensitivity of a fixed-income investment to changes in interest rates. Duration is expressed as a number of years and is considered a more accurate sensitivity gauge than average maturity. |
| 5. | Modified duration is inversely related to the approximate percentage change in price for a given change in yield. Duration to worst is the duration of a bond computed using the bond’s nearest call date or maturity, whichever comes first. This measure ignores future cash flow fluctuations due to embedded optionality. |
A6 and BBB. In addition, there was an increase to bonds maturing 20+ years. Conversely, there were reductions in the Fund’s exposures to the leasing and hospital sectors, along with exposure to Puerto Rico.
How was the Fund positioned at the end of the reporting period?
As of October 31, 2022, relative to the Bloomberg Municipal Bond Index, the Fund maintained overweight exposure to the long end of the curve. We believe more compelling ratios on the longer end of the curve will lead to outperformance of longer maturity bonds over time. In addition, the Fund held overweight exposure to the IDR/PCR (industrial development revenue/pollution control revenue), education and hospital sectors. From a geographic perspective, the Fund held overweight exposure to Puerto Rico and Illinois bonds. Furthermore, the Fund held overweight exposure to non-investment-grade bonds. Also, the Fund held underweight positions in the local general obligation, state general obligation and water & sewer sectors, in addition to underweight positions in ultra-high-quality bonds.
| 6. | An obligation rated ‘A’ by S&P is deemed by S&P to be somewhat more susceptible to the adverse effects of changes in circumstances and economic conditions than obligations in higher-rated categories. In the opinion of S&P, however, the obligor's capacity to meet its financial commitment on the obligation is still strong. When applied to Fund holdings, ratings are based solely on the creditworthiness of the bonds in the portfolio and are not meant to represent the security or safety of the Fund. |
The opinions expressed are those of the portfolio managers as of the date of this report and are subject to change. There is no guarantee that any forecasts will come to pass. This material does not constitute investment advice and is not intended as an endorsement of any specific investment.
| 10 | MainStay MacKay High Yield Municipal Bond Fund |
Portfolio of Investments October 31, 2022†
| | Principal
Amount | Value |
| Municipal Bonds 97.5% |
| Long-Term Municipal Bonds 95.2% |
| Alabama 1.2% |
| Alabama Special Care Facilities Financing Authority-Birmingham AL, Methodist Home for the Aging, Revenue Bonds | | |
| 5.75%, due 6/1/45 | $ 1,250,000 | $ 1,061,419 |
| Cooper Green Mercy Health Services Authority, County of Jefferson Indigent Care Fund, Revenue Bonds | | |
| Series A | | |
| 5.25%, due 9/1/42 | 5,000,000 | 5,136,939 |
| County of Jefferson AL, Sewer, Revenue Bonds, Senior Lien | | |
| Series A, Insured: AGM | | |
| 5.50%, due 10/1/53 | 11,710,000 | 12,045,089 |
| County of Jefferson AL, Sewer, Revenue Bonds, Sub. Lien | | |
| Series D | | |
| 6.00%, due 10/1/42 | 2,500,000 | 2,666,664 |
| Homewood Educational Building Authority, Samford University Project, Revenue Bonds | | |
| Series A | | |
| 4.00%, due 12/1/33 | 400,000 | 372,316 |
| Series A | | |
| 4.00%, due 12/1/35 | 1,000,000 | 897,959 |
| Series A | | |
| 4.00%, due 12/1/36 | 615,000 | 544,200 |
| Series A | | |
| 4.00%, due 12/1/37 | 650,000 | 566,156 |
| Series A | | |
| 4.00%, due 12/1/39 | 1,760,000 | 1,497,783 |
| Series A | | |
| 4.00%, due 12/1/41 | 2,750,000 | 2,299,349 |
| Lower Alabama Gas District (The), Revenue Bonds | | |
| Series A | | |
| 5.00%, due 9/1/46 | 17,660,000 | 16,625,129 |
| Montgomery Educational Building Authority, Faulkner University, Revenue Bonds | | |
| Series A | | |
| 5.00%, due 10/1/43 | 4,830,000 | 4,457,725 |
| Prichard Water Works & Sewer Board, Revenue Bonds | | |
| 4.00%, due 11/1/49 | 6,000,000 | 3,000,000 |
| | Principal
Amount | Value |
| |
| Alabama (continued) |
| Tuscaloosa County Industrial Development Authority, Hunt Refining Project, Revenue Bonds (a) | | |
| Series A | | |
| 4.50%, due 5/1/32 | $ 6,925,723 | $ 5,885,179 |
| Series A | | |
| 5.25%, due 5/1/44 | 43,390,000 | 35,386,094 |
| | | 92,442,001 |
| Alaska 0.2% |
| Alaska Industrial Development & Export Authority, Tanana Chiefs Conference Project, Revenue Bonds | | |
| Series A | | |
| 4.00%, due 10/1/44 | 15,640,000 | 12,885,357 |
| Alaska Industrial Development & Export Authority, Interior Gas Utility Project, Revenue Bonds | | |
| Series A | | |
| 5.00%, due 6/1/40 | 1,795,000 | 1,614,033 |
| Series A | | |
| 5.00%, due 6/1/50 | 3,485,000 | 2,969,641 |
| Northern Tobacco Securitization Corp., Tobacco Settlement Asset-Backed, Revenue Bonds, Senior Lien | | |
| Series A, Class 1 | | |
| 4.00%, due 6/1/50 | 2,255,000 | 1,772,274 |
| | | 19,241,305 |
| Arizona 1.6% |
| Arizona Industrial Development Authority, GreatHearts Arizona Project, Revenue Bonds | | |
| Series A, Insured: SD CRED PROG | | |
| 3.00%, due 7/1/46 | 4,315,000 | 2,913,560 |
| Series A, Insured: SD CRED PROG | | |
| 3.00%, due 7/1/52 | 9,625,000 | 6,100,109 |
| Arizona Industrial Development Authority, Provident Group, NCCU Properties LLC, Central University Project, Revenue Bonds | | |
| Series A, Insured: BAM | | |
| 4.00%, due 6/1/44 | 2,500,000 | 2,156,427 |
The notes to the financial statements are an integral part of, and should be read in conjunction with, the financial statements.
11
Portfolio of Investments October 31, 2022† (continued)
| | Principal
Amount | Value |
| Long-Term Municipal Bonds (continued) |
| Arizona (continued) |
| Arizona Industrial Development Authority, Equitable School Revolving Fund LLC, Revenue Bonds | | |
| Series A | | |
| 4.00%, due 11/1/45 | $ 5,545,000 | $ 4,607,802 |
| Series A | | |
| 4.00%, due 11/1/46 | 1,000,000 | 824,478 |
| Series A | | |
| 4.00%, due 11/1/51 | 3,405,000 | 2,729,671 |
| Arizona Industrial Development Authority, University of Indianapolis, Health Pavilion Project, Revenue Bonds | | |
| Series A | | |
| 4.00%, due 10/1/49 | 1,000,000 | 778,031 |
| Series A | | |
| 5.00%, due 10/1/45 | 1,875,000 | 1,787,032 |
| Arizona Industrial Development Authority, Equitable School Revolving Fund LLC Obligated Group, Revenue Bonds | | |
| 4.00%, due 11/1/49 | 5,115,000 | 4,142,584 |
| Series A | | |
| 4.00%, due 11/1/50 | 910,000 | 733,193 |
| Arizona Industrial Development Authority, Macombs Facility Project, Revenue Bonds | | |
| Series A | | |
| 4.00%, due 7/1/61 | 6,250,000 | 4,231,687 |
| Arizona Industrial Development Authority, Jerome Facility Project, Revenue Bonds | | |
| Series B | | |
| 4.00%, due 7/1/61 | 1,000,000 | 677,070 |
| Arizona Industrial Development Authority, Idaho State Tax Commission, Linder Village Project, Revenue Bonds | | |
| 5.00%, due 6/1/31 (a) | 4,000,000 | 3,852,501 |
| Arizona Industrial Development Authority, Arizona Agribusiness and Equine Center, Inc., Revenue Bonds (a) | | |
| Series B | | |
| 5.00%, due 3/1/37 | 3,280,000 | 3,028,785 |
| | Principal
Amount | Value |
| |
| Arizona (continued) |
| Arizona Industrial Development Authority, Arizona Agribusiness and Equine Center, Inc., Revenue Bonds (a) (continued) | | |
| Series B | | |
| 5.00%, due 3/1/42 | $ 3,435,000 | $ 3,062,839 |
| Arizona Industrial Development Authority, Provident Group-NCCU Properties LLC, Revenue Bonds | | |
| Insured: BAM | | |
| 5.00%, due 6/1/49 | 2,650,000 | 2,700,873 |
| Insured: BAM | | �� |
| 5.00%, due 6/1/54 | 2,850,000 | 2,897,143 |
| Arizona Industrial Development Authority, Mater Academy of Nevada, Bonanza Campus Project, Revenue Bonds | | |
| Series A | | |
| 5.00%, due 12/15/50 (a) | 1,500,000 | 1,332,562 |
| Arizona Industrial Development Authority, Provident Group, Eastern Michigan University Parking Project, Revenue Bonds | | |
| 5.00%, due 5/1/51 | 1,000,000 | 635,791 |
| Arizona Industrial Development Authority, Basis Schools Project, Revenue Bonds | | |
| Series A | | |
| 5.375%, due 7/1/50 (a) | 1,500,000 | 1,424,423 |
| Arizona Industrial Development Authority, American Charter Schools Foundation, Revenue Bonds (a) | | |
| 6.00%, due 7/1/37 | 3,035,000 | 3,074,026 |
| 6.00%, due 7/1/47 | 6,685,000 | 6,649,849 |
| City of Phoenix AZ, Basis Schools Project, Revenue Bonds (a) | | |
| Series A | | |
| 5.00%, due 7/1/35 | 1,700,000 | 1,651,738 |
| Series A | | |
| 5.00%, due 7/1/45 | 1,000,000 | 909,110 |
| Series A | | |
| 5.00%, due 7/1/46 | 3,870,000 | 3,501,525 |
The notes to the financial statements are an integral part of, and should be read in conjunction with, the financial statements.
| 12 | MainStay MacKay High Yield Municipal Bond Fund |
| | Principal
Amount | Value |
| Long-Term Municipal Bonds (continued) |
| Arizona (continued) |
| City of Phoenix AZ, Downtown Phoenix Student Housing LLC, Revenue Bonds | | |
| Series A | | |
| 5.00%, due 7/1/37 | $ 1,000,000 | $ 935,699 |
| Series A | | |
| 5.00%, due 7/1/59 | 2,200,000 | 1,848,565 |
| City of Phoenix AZ, Villa Montessori, Inc. Project, Revenue Bonds | | |
| 5.00%, due 7/1/45 | 2,150,000 | 2,082,538 |
| City of Phoenix AZ, Espiritu Community Development Corp., Revenue Bonds | | |
| Series A | | |
| 6.25%, due 7/1/36 | 845,000 | 764,923 |
| Florence Town, Inc. Industrial Development Authority, Legacy Traditional School Project, Revenue Bonds | | |
| 6.00%, due 7/1/43 (a) | 2,450,000 | 2,492,778 |
| Glendale Industrial Development Authority, Midwestern University Foundation, Revenue Bonds | | |
| Series A | | |
| 2.125%, due 7/1/33 (b) | 2,000,000 | 1,461,863 |
| Glendale Industrial Development Authority, People of Faith, Inc. Obligated Group, Revenue Bonds | | |
| Series A | | |
| 5.00%, due 5/15/56 | 8,250,000 | 6,879,136 |
| Industrial Development Authority of the County of Pima (The), American Leadership Academy, Inc., Revenue Bonds (a) | | |
| 4.00%, due 6/15/41 | 3,500,000 | 2,634,078 |
| 4.00%, due 6/15/51 | 6,000,000 | 4,067,696 |
| 4.00%, due 6/15/57 | 500,000 | 323,803 |
| Industrial Development Authority of the County of Pima (The), Charter Schools Project, Revenue Bonds | | |
| Series Q | | |
| 5.375%, due 7/1/31 | 1,155,000 | 1,105,173 |
| | Principal
Amount | Value |
| |
| Arizona (continued) |
| Industrial Development Authority of the County of Pima (The), American Leadership AC, Revenue Bonds | | |
| 5.625%, due 6/15/45 (a) | $ 3,735,000 | $ 3,475,365 |
| Maricopa County Industrial Development Authority, Legacy Traditional School Project, Revenue Bonds | | |
| Series A | | |
| 4.00%, due 7/1/51 (a) | 1,750,000 | 1,244,055 |
| Maricopa County Industrial Development Authority, Horizon Community Learning Center, Revenue Bonds | | |
| 5.00%, due 7/1/35 | 3,000,000 | 2,799,790 |
| Maricopa County Pollution Control Corp., El Paso Electric Co. Project, Revenue Bonds | | |
| Series A | | |
| 3.60%, due 2/1/40 | 14,000,000 | 11,315,597 |
| Series B | | |
| 3.60%, due 4/1/40 | 8,750,000 | 7,062,543 |
| Pinal County Industrial Development Authority, WOF SW GGP 1 LLC, Revenue Bonds (b) | | |
| Series A | | |
| 5.50%, due 10/1/33 (a) | 7,673,000 | 6,825,749 |
| Series B | | |
| 5.50%, due 10/1/33 | 2,000,000 | 1,779,160 |
| | | 125,501,320 |
| Arkansas 0.8% |
| Arkansas Development Finance Authority, Washington Regional Medical Center, Revenue Bonds | | |
| 4.00%, due 2/1/42 | 4,740,000 | 3,857,606 |
| Arkansas Development Finance Authority, Baptist Health, Revenue Bonds | | |
| 4.00%, due 12/1/44 | 650,000 | 544,319 |
| Arkansas Development Finance Authority, Big River Steel Project, Revenue Bonds | | |
| 4.50%, due 9/1/49 (a)(b) | 73,400,000 | 57,578,601 |
| | | 61,980,526 |
The notes to the financial statements are an integral part of, and should be read in conjunction with, the financial statements.
13
Portfolio of Investments October 31, 2022† (continued)
| | Principal
Amount | Value |
| Long-Term Municipal Bonds (continued) |
| California 7.6% |
| Alameda Corridor Transportation Authority, Revenue Bonds | | |
| Series A, Insured: NATL-RE | | |
| (zero coupon), due 10/1/35 | $ 3,440,000 | $ 1,890,408 |
| Bassett Unified School District, Capital Appreciation, Election 2004, Unlimited General Obligation | | |
| Series C, Insured: NATL-RE | | |
| (zero coupon), due 8/1/41 | 2,050,000 | 788,416 |
| Series C, Insured: NATL-RE | | |
| (zero coupon), due 8/1/42 | 2,000,000 | 725,058 |
| California Community Housing Agency, Fountains at Emerald, Revenue Bonds, Senior Lien | | |
| Series A-1 | | |
| 3.00%, due 8/1/56 (a) | 2,500,000 | 1,503,291 |
| California Community Housing Agency, Summit at Sausalito Apartments, Revenue Bonds | | |
| Series A-1 | | |
| 3.00%, due 2/1/57 (a) | 5,000,000 | 3,035,513 |
| California Community Housing Agency, Essential Housing, Revenue Bonds, Senior Lien | | |
| Series A1 | | |
| 4.00%, due 2/1/56 (a) | 25,000,000 | 18,758,822 |
| California Community Housing Agency, Annadel Apartments, Revenue Bonds | | |
| Series A | | |
| 5.00%, due 4/1/49 (a) | 12,150,000 | 9,836,991 |
| California Community Housing Agency, Verdant at Green Valley Apartments, Revenue Bonds | | |
| Series A | | |
| 5.00%, due 8/1/49 (a) | 5,000,000 | 4,152,928 |
| California Community Housing Agency, Essential Housing, Serenity at Larkspur Apartments, Revenue Bonds | | |
| Series A | | |
| 5.00%, due 2/1/50 (a) | 5,045,000 | 4,184,193 |
| | Principal
Amount | Value |
| |
| California (continued) |
| California Community Housing Agency, Essential Housing Arbors Apartments, Revenue Bonds | | |
| Series A | | |
| 5.00%, due 8/1/50 (a) | $ 7,250,000 | $ 5,963,727 |
| California Health Facilities Financing Authority, CommonSpirit Health, Revenue Bonds | | |
| Series A | | |
| 4.00%, due 4/1/49 | 7,505,000 | 5,792,870 |
| California Health Facilities Financing Authority, Children's Hospital Los Angeles Obligated Group, Revenue Bonds | | |
| Series A | | |
| 5.00%, due 8/15/47 | 5,265,000 | 5,001,418 |
| California Infrastructure and Economic Development Bank, Equitable School Revolving Fund LLC, Revenue Bonds | | |
| Series B | | |
| 4.00%, due 11/1/46 | 3,060,000 | 2,559,412 |
| Series B | | |
| 4.00%, due 11/1/56 | 1,000,000 | 789,051 |
| California Infrastructure and Economic Development Bank, Wonderful Foundations Charter School Portfolio Project, Revenue Bonds | | |
| Series A-1 | | |
| 5.00%, due 1/1/55 (a) | 3,325,000 | 2,384,595 |
| California Municipal Finance Authority, Orchard Park Student Housing Project, Revenue Bonds | | |
| Insured: BAM | | |
| 3.00%, due 5/15/54 | 4,400,000 | 2,731,499 |
| California Municipal Finance Authority, LINXS APM Project, Revenue Bonds, Senior Lien | | |
| Series A, Insured: AGM | | |
| 3.25%, due 12/31/32 (b) | 5,965,000 | 5,076,804 |
| California Municipal Finance Authority, United Airlines, Inc. Project, Revenue Bonds | | |
| 4.00%, due 7/15/29 (b) | 18,775,000 | 17,436,649 |
The notes to the financial statements are an integral part of, and should be read in conjunction with, the financial statements.
| 14 | MainStay MacKay High Yield Municipal Bond Fund |
| | Principal
Amount | Value |
| Long-Term Municipal Bonds (continued) |
| California (continued) |
| California Municipal Finance Authority, HumanGood California, Revenue Bonds | | |
| 4.00%, due 10/1/46 | $ 2,000,000 | $ 1,675,735 |
| California Municipal Finance Authority, William Jessup University, Revenue Bonds (a) | | |
| 5.00%, due 8/1/28 | 1,000,000 | 978,929 |
| 5.00%, due 8/1/48 | 2,675,000 | 2,228,607 |
| California Municipal Finance Authority, LINX APM Project, Revenue Bonds, Senior Lien | | |
| Series A | | |
| 5.00%, due 12/31/43 (b) | 10,745,000 | 10,178,218 |
| California Municipal Finance Authority, Charter School, Palmdale Aerospace Academy Projects (The), Revenue Bonds | | |
| Series A | | |
| 5.00%, due 7/1/46 (a) | 2,665,000 | 2,333,304 |
| California Municipal Finance Authority, CHF-Davis I LLC, West Village Student Housing Project, Revenue Bonds | | |
| 5.00%, due 5/15/48 | 19,500,000 | 17,895,413 |
| 5.00%, due 5/15/51 | 19,500,000 | 17,739,300 |
| California Municipal Finance Authority, Healthright 360, Revenue Bonds | | |
| Series A | | |
| 5.00%, due 11/1/49 (a) | 2,000,000 | 1,727,734 |
| California Municipal Finance Authority, Partnerships to Uplift Community Project, Revenue Bonds | | |
| Series A | | |
| 5.30%, due 8/1/47 | 1,525,000 | 1,317,865 |
| California Municipal Finance Authority, Baptist University, Revenue Bonds | | |
| Series A | | |
| 5.375%, due 11/1/40 (a) | 3,000,000 | 3,011,918 |
| California Public Finance Authority, Enso Village Project, Revenue Bonds (a) | | |
| Series B-2 | | |
| 2.375%, due 11/15/28 | 1,500,000 | 1,353,119 |
| | Principal
Amount | Value |
| |
| California (continued) |
| California Public Finance Authority, Enso Village Project, Revenue Bonds (a) (continued) | | |
| Series A | | |
| 5.00%, due 11/15/51 | $ 725,000 | $ 573,561 |
| California Public Finance Authority, California University of Science & Medicine Obligated Group, Revenue Bonds | | |
| Series A | | |
| 6.25%, due 7/1/54 (a) | 5,515,000 | 5,873,599 |
| California Public Finance Authority, California University of Science & Medicine, Revenue Bonds | | |
| 7.50%, due 7/1/36 (a) | 9,500,000 | 9,114,926 |
| California School Finance Authority, Sonoma County Junior College District Project, Revenue Bonds | | |
| Series A | | |
| 2.75%, due 11/1/60 (a) | 9,700,000 | 4,309,063 |
| California School Finance Authority, Granada Hills Charter High School Obligated Group, Revenue Bonds | | |
| Series A | | |
| 4.00%, due 7/1/48 (a) | 675,000 | 517,597 |
| California School Finance Authority, Vista Charter Public Schools, Revenue Bonds | | |
| Series A | | |
| 4.00%, due 6/1/61 (a) | 4,750,000 | 3,169,146 |
| California School Finance Authority, Hawking STEAM Charter Schools, Inc., Revenue Bonds | | |
| Series A | | |
| 5.00%, due 7/1/42 (a) | 1,360,000 | 1,227,345 |
| California School Finance Authority, High Tech High Learning Project, Revenue Bonds | | |
| Series A | | |
| 5.00%, due 7/1/49 (a) | 3,000,000 | 2,588,889 |
The notes to the financial statements are an integral part of, and should be read in conjunction with, the financial statements.
15
Portfolio of Investments October 31, 2022† (continued)
| | Principal
Amount | Value |
| Long-Term Municipal Bonds (continued) |
| California (continued) |
| California School Finance Authority, Aspire Public Schools Obligated Group, Revenue Bonds | | |
| Series A | | |
| 5.00%, due 8/1/50 (a) | $ 1,800,000 | $ 1,700,377 |
| California School Finance Authority, Teach Public Schools Obligated Group, Revenue Bonds | | |
| Series A | | |
| 5.00%, due 6/1/58 (a) | 2,000,000 | 1,676,686 |
| California Statewide Communities Development Authority, Community Infrastructure Program, Special Assessment | | |
| Series 2021 A | | |
| 4.00%, due 9/2/41 | 1,990,000 | 1,600,761 |
| California Statewide Communities Development Authority, Methodist Hospital of Southern California, Revenue Bonds | | |
| 4.375%, due 1/1/48 | 2,185,000 | 1,826,953 |
| 5.00%, due 1/1/43 | 7,250,000 | 6,998,202 |
| California Statewide Communities Development Authority, Lancer Educational Student Housing Project, Revenue Bonds (a) | | |
| Series A | | |
| 5.00%, due 6/1/36 | 2,250,000 | 2,088,308 |
| Series A | | |
| 5.00%, due 6/1/46 | 2,000,000 | 1,726,687 |
| California Statewide Communities Development Authority, Loma Linda University Medical Center, Revenue Bonds | | |
| Series A | | |
| 5.00%, due 12/1/46 (a) | 18,420,000 | 16,122,317 |
| Series A | | |
| 5.50%, due 12/1/54 | 3,800,000 | 3,697,112 |
| California Statewide Communities Development Authority, Irvine Campus Apartments, Revenue Bonds | | |
| 5.00%, due 5/15/50 | 2,000,000 | 1,859,242 |
| | Principal
Amount | Value |
| |
| California (continued) |
| California Statewide Communities Development Authority, Lancer Plaza Project, Revenue Bonds | | |
| 5.625%, due 11/1/33 | $ 680,000 | $ 680,422 |
| 5.875%, due 11/1/43 | 435,000 | 432,664 |
| California Statewide Communities Development Authority, California Baptist University, Revenue Bonds | | |
| Series A | | |
| 6.375%, due 11/1/43 (a) | 3,235,000 | 3,277,116 |
| California Statewide Financing Authority, Tobacco Settlement Asset-Backed, Revenue Bonds | | |
| Series C | | |
| (zero coupon), due 6/1/55 (a) | 125,700,000 | 6,282,825 |
| Cathedral City Public Financing Authority, Capital Appreciation, Tax Allocation | | |
| Series A, Insured: NATL-RE | | |
| (zero coupon), due 8/1/23 | 925,000 | 901,786 |
| Series A, Insured: NATL-RE | | |
| (zero coupon), due 8/1/26 | 1,085,000 | 937,572 |
| City of Los Angeles CA, Department of Airports, Revenue Bonds, Senior Lien (b) | | |
| Series C | | |
| 4.00%, due 5/15/50 | 2,845,000 | 2,342,366 |
| Series C | | |
| 5.00%, due 5/15/45 | 8,500,000 | 8,511,681 |
| Series G | | |
| 5.00%, due 5/15/47 | 6,000,000 | 6,001,167 |
| City of South San Francisco CA, Community Facilities District No. 2021-01, Special Tax | | |
| 5.00%, due 9/1/52 | 1,500,000 | 1,410,582 |
| CMFA Special Finance Agency XII, Allure Apartments, Revenue Bonds, Senior Lien | | |
| Series A-1 | | |
| 3.25%, due 2/1/57 (a) | 1,500,000 | 934,373 |
| CSCDA Community Improvement Authority, Pasadena Portfolio, Revenue Bonds, Senior Lien | | |
| Series A-2 | | |
| 3.00%, due 12/1/56 (a) | 2,750,000 | 1,641,917 |
The notes to the financial statements are an integral part of, and should be read in conjunction with, the financial statements.
| 16 | MainStay MacKay High Yield Municipal Bond Fund |
| | Principal
Amount | Value |
| Long-Term Municipal Bonds (continued) |
| California (continued) |
| CSCDA Community Improvement Authority, Theo Pasadena, Revenue Bonds, Senior Lien | | |
| Series A-2 | | |
| 3.25%, due 5/1/57 (a) | $ 11,350,000 | $ 7,256,304 |
| CSCDA Community Improvement Authority, Parrallel-Anaheim, Revenue Bonds | | |
| Series A | | |
| 4.00%, due 8/1/56 (a) | 6,040,000 | 4,327,436 |
| CSCDA Community Improvement Authority, Oceanaire Long Beach, Revenue Bonds | | |
| Series A | | |
| 4.00%, due 9/1/56 (a) | 10,160,000 | 7,254,502 |
| CSCDA Community Improvement Authority, Altana Glendale, Revenue Bonds | | |
| Series A | | |
| 4.00%, due 10/1/56 (a) | 9,200,000 | 6,346,720 |
| CSCDA Community Improvement Authority, Escondido Portfolio, Revenue Bonds, Senior Lien | | |
| Series A-2 | | |
| 4.00%, due 6/1/58 (a) | 4,750,000 | 3,386,375 |
| CSCDA Community Improvement Authority, Renaissance at City Center, Revenue Bonds | | |
| Series A | | |
| 5.00%, due 7/1/51 (a) | 10,700,000 | 9,114,300 |
| Foothill-Eastern Transportation Corridor Agency, Revenue Bonds | | |
| Series B-2 | | |
| 3.50%, due 1/15/53 | 13,415,000 | 9,538,673 |
| Foothill-Eastern Transportation Corridor Agency, Revenue Bonds, Junior Lien | | |
| Series C | | |
| 4.00%, due 1/15/43 | 17,154,000 | 14,237,069 |
| Foothill-Eastern Transportation Corridor Agency, Revenue Bonds, Senior Lien | | |
| Series A | | |
| 4.00%, due 1/15/46 | 55,749,000 | 45,674,096 |
| | Principal
Amount | Value |
| |
| California (continued) |
| Golden State Tobacco Securitization Corp., Asset-Backed, Revenue Bonds | | |
| Series B-2 | | |
| (zero coupon), due 6/1/66 (c) | $ 1,253,995,000 | $ 105,042,145 |
| Golden State Tobacco Securitization Corp., Revenue Bonds | | |
| Series B-1 | | |
| 3.85%, due 6/1/50 | 1,500,000 | 1,281,873 |
| Hastings Campus Housing Finance Authority, Green Bond, Revenue Bonds, Senior Lien | | |
| Series A | | |
| 5.00%, due 7/1/61 (a) | 52,100,000 | 39,910,085 |
| Independent Cities Finance Authority, Sales Tax, Revenue Bonds | | |
| Insured: AGM | | |
| 4.00%, due 6/1/51 (a) | 1,250,000 | 1,011,996 |
| Inland Empire Tobacco Securitization Corp., Revenue Bonds | | |
| Series D | | |
| (zero coupon), due 6/1/57 | 249,420,000 | 13,658,164 |
| Riverside County Transportation Commission, Revenue Bonds, Senior Lien | | |
| Series A | | |
| 5.75%, due 6/1/48 | 1,480,000 | 1,502,783 |
| Rohnerville School District, Election 2010, Unlimited General Obligation | | |
| Series B, Insured: AGM | | |
| (zero coupon), due 8/1/42 | 1,000,000 | 364,281 |
| Series B, Insured: AGM | | |
| (zero coupon), due 8/1/47 | 1,000,000 | 268,873 |
| San Diego County Regional Airport Authority, Revenue Bonds (b) | | |
| Series B, Insured: AGM-CR | | |
| 4.00%, due 7/1/51 | 25,645,000 | 20,518,513 |
| Series B | | |
| 4.00%, due 7/1/56 | 1,605,000 | 1,234,809 |
The notes to the financial statements are an integral part of, and should be read in conjunction with, the financial statements.
17
Portfolio of Investments October 31, 2022† (continued)
| | Principal
Amount | Value |
| Long-Term Municipal Bonds (continued) |
| California (continued) |
| San Francisco City & County Redevelopment Agency, Community Facilities District No. 6 Bay Public, Special Tax | | |
| Series C | | |
| (zero coupon), due 8/1/37 | $ 5,015,000 | $ 2,156,309 |
| Series C | | |
| (zero coupon), due 8/1/38 | 2,000,000 | 804,594 |
| San Joaquin Hills Transportation Corridor Agency, Revenue Bonds, Senior Lien | | |
| Series A | | |
| 4.00%, due 1/15/50 | 7,300,000 | 6,026,308 |
| San Joaquin Hills Transportation Corridor Agency, Revenue Bonds, Junior Lien | | |
| Series B | | |
| 5.25%, due 1/15/44 | 15,320,000 | 15,349,653 |
| Santa Ana Unified School District, Capital Appreciation, Election 2008, Unlimited General Obligation | | |
| Series B, Insured: AGC | | |
| (zero coupon), due 8/1/47 | 24,500,000 | 6,328,987 |
| Sierra Kings Health Care District, Unlimited General Obligation | | |
| 5.00%, due 8/1/37 | 2,465,000 | 2,518,954 |
| Stockton Unified School District, Capital Appreciation, Election 2008, Unlimited General Obligation | | |
| Series D, Insured: AGM | | |
| (zero coupon), due 8/1/42 | 8,780,000 | 3,183,004 |
| Sutter Union High School District, Election 2008, Unlimited General Obligation | | |
| Series B | | |
| (zero coupon), due 6/1/50 | 16,260,000 | 2,433,868 |
| Tobacco Securitization Authority of Southern California, San Diego County Tobacco Asset Securitization Corp., Asset-Backed, Revenue Bonds | | |
| Series B-2 | | |
| (zero coupon), due 6/1/54 | 18,700,000 | 3,150,198 |
| | Principal
Amount | Value |
| |
| California (continued) |
| West Contra Costa Healthcare District, Special Tax | | |
| 3.00%, due 7/1/42 | $ 5,670,000 | $ 4,174,491 |
| Westminster School District, Election 2008, Unlimited General Obligation | | |
| Series B, Insured: BAM | | |
| (zero coupon), due 8/1/53 | 20,000,000 | 2,366,752 |
| | | 593,499,144 |
| Colorado 2.7% |
| 3rd and Havana Metropolitan District, Tax Supported, Limited General Obligation | | |
| Series A | | |
| 5.25%, due 12/1/49 | 2,250,000 | 1,899,416 |
| Allison Valley Metropolitan District No. 2, Limited General Obligation | | |
| 4.70%, due 12/1/47 | 2,500,000 | 1,941,603 |
| Arkansas River Power Authority, Revenue Bonds | | |
| Series A | | |
| 5.00%, due 10/1/43 | 14,275,000 | 13,476,070 |
| Broadway Park North Metropolitan District No. 2, Limited General Obligation (a) | | |
| 5.00%, due 12/1/40 | 1,000,000 | 894,549 |
| 5.00%, due 12/1/49 | 1,000,000 | 853,400 |
| Broadway Station Metropolitan District No. 2, Limited General Obligation | | |
| Series A | | |
| 5.125%, due 12/1/48 | 3,000,000 | 2,565,645 |
| Central Platte Valley Metropolitan District, Unlimited General Obligation | | |
| Series A | | |
| 5.375%, due 12/1/33 | 1,500,000 | 1,531,373 |
| Citadel on Colfax Business Improvement District, Revenue Bonds | | |
| Series A | | |
| 5.35%, due 12/1/50 | 1,000,000 | 831,204 |
| City & County of Denver CO, United Airlines, Inc., Project, Revenue Bonds | | |
| 5.00%, due 10/1/32 (b) | 6,800,000 | 6,555,003 |
The notes to the financial statements are an integral part of, and should be read in conjunction with, the financial statements.
| 18 | MainStay MacKay High Yield Municipal Bond Fund |
| | Principal
Amount | Value |
| Long-Term Municipal Bonds (continued) |
| Colorado (continued) |
| City of Fruita CO, Canyons Hospital & Medical Center Project, Revenue Bonds | | |
| Series A | | |
| 5.50%, due 1/1/48 (a) | $ 9,750,000 | $ 8,501,841 |
| Colorado Educational & Cultural Facilities Authority, Northeast Campus Project, Revenue Bonds | | |
| Insured: Moral Obligation State Intercept | | |
| 3.00%, due 8/1/51 | 3,420,000 | 2,130,518 |
| Colorado Educational & Cultural Facilities Authority, New Summit Academy, Revenue Bonds | | |
| Series A | | |
| 4.00%, due 7/1/41 (a) | 1,850,000 | 1,422,206 |
| Colorado Educational & Cultural Facilities Authority, New Vision Charter School, Revenue Bonds | | |
| Series A, Insured: Moral Obligation | | |
| 4.00%, due 6/1/42 | 2,635,000 | 2,265,447 |
| Series A, Insured: Moral Obligation | | |
| 4.00%, due 6/1/52 | 4,750,000 | 3,818,169 |
| Series A, Insured: Moral Obligation | | |
| 4.00%, due 6/1/56 | 6,305,000 | 4,923,800 |
| Colorado Health Facilities Authority, AdventHealth Obligated Group, Revenue Bonds | | |
| Series A | | |
| 3.00%, due 11/15/51 | 17,750,000 | 11,631,481 |
| Colorado Health Facilities Authority, CommonSpirit Health Obligated Group, Revenue Bonds | | |
| Series A-2 | | |
| 3.25%, due 8/1/49 | 11,750,000 | 7,532,651 |
| Colorado Health Facilities Authority, CommonSpirit Health, Revenue Bonds | | |
| Series A-2 | | |
| 4.00%, due 8/1/49 | 21,355,000 | 16,651,642 |
| | Principal
Amount | Value |
| |
| Colorado (continued) |
| Colorado Health Facilities Authority, CommonSpirit Health, Revenue Bonds (continued) | | |
| Series A-2 | | |
| 5.00%, due 8/1/44 | $ 19,005,000 | $ 18,149,790 |
| Colorado Health Facilities Authority, Covenant Living Communities and Services Obligated Group, Revenue Bonds | | |
| Series A | | ��� |
| 5.00%, due 12/1/35 | 3,500,000 | 3,419,487 |
| Series A | | |
| 5.00%, due 12/1/48 | 7,250,000 | 6,566,327 |
| Colorado Health Facilities Authority, Mental Health Center of Denver Project, Revenue Bonds | | |
| Series A | | |
| 5.75%, due 2/1/44 | 4,175,000 | 4,199,571 |
| Copper Ridge Metropolitan District, Revenue Bonds | | |
| 5.00%, due 12/1/39 | 4,250,000 | 3,706,643 |
| Denver Health & Hospital Authority, 550 Acoma, Inc., Certificate of Participation | | |
| 5.00%, due 12/1/48 | 1,755,000 | 1,591,596 |
| Denver Health & Hospital Authority, Revenue Bonds | | |
| Series A | | |
| 5.25%, due 12/1/45 | 4,250,000 | 4,206,305 |
| E-470 Public Highway Authority, Revenue Bonds | | |
| Series B, Insured: NATL-RE | | |
| (zero coupon), due 9/1/25 | 245,000 | 219,019 |
| Series B, Insured: NATL-RE | | |
| (zero coupon), due 9/1/26 | 4,540,000 | 3,886,755 |
| Series B, Insured: NATL-RE | | |
| (zero coupon), due 9/1/29 | 4,510,000 | 3,365,521 |
| Series B, Insured: NATL-RE | | |
| (zero coupon), due 9/1/30 | 500,000 | 355,008 |
| Series B, Insured: NATL-RE | | |
| (zero coupon), due 9/1/35 | 2,245,000 | 1,187,859 |
| Series B, Insured: NATL-RE | | |
| (zero coupon), due 9/1/37 | 1,170,000 | 549,903 |
| Series B, Insured: NATL-RE | | |
| (zero coupon), due 9/1/39 | 515,000 | 215,124 |
The notes to the financial statements are an integral part of, and should be read in conjunction with, the financial statements.
19
Portfolio of Investments October 31, 2022† (continued)
| | Principal
Amount | Value |
| Long-Term Municipal Bonds (continued) |
| Colorado (continued) |
| E-470 Public Highway Authority, Revenue Bonds (continued) | | |
| Series A | | |
| (zero coupon), due 9/1/40 | $ 5,250,000 | $ 2,015,919 |
| Series A | | |
| (zero coupon), due 9/1/41 | 3,925,000 | 1,414,847 |
| Eagle County Airport Terminal Corp., Revenue Bonds | | |
| Series B | | |
| 5.00%, due 5/1/33 (b) | 2,435,000 | 2,437,725 |
| Evan's Place Metropolitan District, Limited General Obligation | | |
| Series A(3) | | |
| 5.00%, due 12/1/50 | 1,500,000 | 1,203,868 |
| Great Western Metropolitan District, Limited General Obligation | | |
| 4.75%, due 12/1/50 | 1,500,000 | 1,216,520 |
| Green Valley Ranch East Metropolitan District No. 6, Limited General Obligation | | |
| Series A | | |
| 5.875%, due 12/1/50 | 1,325,000 | 1,142,809 |
| Jefferson Center Metropolitan District No. 1, Revenue Bonds | | |
| Series B | | |
| 5.75%, due 12/15/50 | 4,615,000 | 4,105,473 |
| Johnstown Plaza Metropolitan District, Limited General Obligation | | |
| 4.25%, due 12/1/46 | 7,500,000 | 5,699,094 |
| Jones District Community Authority Board, Revenue Bonds | | |
| (zero coupon), due 12/1/50 (d) | 5,050,000 | 3,781,613 |
| Karl's Farm Metropolitan District No. 2, Limited General Obligation | | |
| Series A | | |
| 5.625%, due 12/1/50 (a) | 1,485,000 | 1,264,592 |
| Mayfield Metropolitan District, Limited General Obligation | | |
| Series A | | |
| 5.75%, due 12/1/50 | 1,190,000 | 1,060,786 |
| | Principal
Amount | Value |
| |
| Colorado (continued) |
| Mirabelle Metropolitan District No. 2, Limited General Obligation, Senior Lien | | |
| Series A | | |
| 5.00%, due 12/1/49 | $ 1,250,000 | $ 1,032,498 |
| North Range Metropolitan District No. 3, Limited General Obligation | | |
| Series 2020A-3 | | |
| 5.25%, due 12/1/50 | 2,000,000 | 1,616,351 |
| Park Creek Metropolitan District, Revenue Bonds, Senior Lien | | |
| Series A, Insured: AGM | | |
| 4.00%, due 12/1/39 | 3,805,000 | 3,468,317 |
| Series A, Insured: AGM | | |
| 4.00%, due 12/1/46 | 20,950,000 | 17,291,728 |
| Park Creek Metropolitan District, Senior Ltd., Property, Revenue Bonds, Senior Lien | | |
| Series A | | |
| 5.00%, due 12/1/45 | 4,000,000 | 4,034,569 |
| Raindance Metropolitan District No. 1 Non-Potable Water System, Revenue Bonds | | |
| 5.25%, due 12/1/50 | 1,500,000 | 1,241,329 |
| Raindance Metropolitan District No. 2, Limited General Obligation | | |
| Series A | | |
| 5.00%, due 12/1/49 | 2,500,000 | 2,082,982 |
| Southglenn Metropolitan District, Special Revenue, Limited General Obligation | | |
| 5.00%, due 12/1/46 | 2,100,000 | 1,830,219 |
| Sterling Ranch Community Authority Board, Colorado Limited Tax Supported and Special Revenue Senior Bonds, Revenue Bonds | | |
| Series A | | |
| 4.25%, due 12/1/50 | 1,250,000 | 932,910 |
| Village Metropolitan District (The), Special Revenue and Limited Property Tax, Limited General Obligation | | |
| 5.00%, due 12/1/40 | 750,000 | 673,615 |
The notes to the financial statements are an integral part of, and should be read in conjunction with, the financial statements.
| 20 | MainStay MacKay High Yield Municipal Bond Fund |
| | Principal
Amount | Value |
| Long-Term Municipal Bonds (continued) |
| Colorado (continued) |
| Village Metropolitan District (The), Limited General Obligation | | |
| 5.00%, due 12/1/49 | $ 1,000,000 | $ 864,512 |
| Villages at Castle Rock Metropolitan District No. 6, Limited General Obligation | | |
| Series A | | |
| 4.125%, due 12/1/51 (a) | 18,149,000 | 12,345,661 |
| | | 213,802,863 |
| Connecticut 0.6% |
| City of Hartford CT, Unlimited General Obligation | | |
| Series B, Insured: State Guaranteed | | |
| 5.00%, due 4/1/26 | 60,000 | 60,406 |
| Series B, Insured: State Guaranteed | | |
| 5.00%, due 4/1/27 | 500,000 | 503,345 |
| Series B, Insured: State Guaranteed | | |
| 5.00%, due 4/1/30 | 640,000 | 643,974 |
| Series B, Insured: State Guaranteed | | |
| 5.00%, due 4/1/33 | 100,000 | 100,546 |
| City of New Haven CT, Unlimited General Obligation | | |
| Series A | | |
| 4.00%, due 8/1/41 | 2,925,000 | 2,514,403 |
| City of West Haven CT, Unlimited General Obligation | | |
| 4.00%, due 9/15/41 | 1,130,000 | 973,244 |
| Connecticut State Health & Educational Facilities Authority, McLean Issue, Revenue Bonds (a) | | |
| Series B-1 | | |
| 3.25%, due 1/1/27 | 750,000 | 723,012 |
| Series A | | |
| 5.00%, due 1/1/30 | 500,000 | 493,753 |
| Connecticut State Health & Educational Facilities Authority, University of Hartford (The), Revenue Bonds | | |
| Series N | | |
| 4.00%, due 7/1/39 | 5,600,000 | 4,432,701 |
| | Principal
Amount | Value |
| |
| Connecticut (continued) |
| Connecticut State Health & Educational Facilities Authority, University of Hartford (The), Revenue Bonds (continued) | | |
| Series N | | |
| 4.00%, due 7/1/49 | $ 7,500,000 | $ 5,332,366 |
| Series N | | |
| 5.00%, due 7/1/31 | 575,000 | 561,645 |
| Series N | | |
| 5.00%, due 7/1/32 | 575,000 | 556,619 |
| Series N | | |
| 5.00%, due 7/1/33 | 475,000 | 455,866 |
| Series N | | |
| 5.00%, due 7/1/34 | 700,000 | 664,448 |
| Connecticut State Health & Educational Facilities Authority, Jerome Home, Revenue Bonds | | |
| Series E | | |
| 4.00%, due 7/1/51 | 1,250,000 | 928,243 |
| Connecticut State Health & Educational Facilities Authority, Mary Wade Home Obligated Group, Revenue Bonds (a) | | |
| Series A-1 | | |
| 4.50%, due 10/1/34 | 2,350,000 | 2,133,065 |
| Series A-1 | | |
| 5.00%, due 10/1/39 | 1,000,000 | 922,567 |
| Connecticut State Health & Educational Facilities Authority, University of New Haven, Inc., Revenue Bonds | | |
| Series K-3 | | |
| 5.00%, due 7/1/48 | 3,695,000 | 3,163,102 |
| Connecticut State Health & Educational Facilities Authority, Griffin Health Obligated Group, Revenue Bonds | | |
| Series G-1 | | |
| 5.00%, due 7/1/50 (a) | 1,750,000 | 1,438,725 |
| Connecticut State Health & Educational Facilities Authority, Church Home of Hartford Obligated Group, Revenue Bonds | | |
| Series A | | |
| 5.00%, due 9/1/53 (a) | 2,235,000 | 1,873,409 |
The notes to the financial statements are an integral part of, and should be read in conjunction with, the financial statements.
21
Portfolio of Investments October 31, 2022† (continued)
| | Principal
Amount | Value |
| Long-Term Municipal Bonds (continued) |
| Connecticut (continued) |
| Connecticut State Higher Education Supplement Loan Authority, Chesla Loan Program, Revenue Bonds | | |
| Series B, Insured: BAM | | |
| 3.25%, due 11/15/35 (b) | $ 7,190,000 | $ 5,836,576 |
| Hartford Stadium Authority, Stadium Authority Lease, Revenue Bonds | | |
| Series A | | |
| 5.00%, due 2/1/36 | 1,475,000 | 1,408,308 |
| State of Connecticut, Unlimited General Obligation | | |
| Series C | | |
| 5.00%, due 6/15/28 | 4,750,000 | 5,125,720 |
| Series E | | |
| 5.00%, due 9/15/37 | 2,250,000 | 2,341,917 |
| Steel Point Infrastructure Improvement District, Steelpointe Harbor Project, Tax Allocation (a) | | |
| 4.00%, due 4/1/31 | 300,000 | 271,489 |
| 4.00%, due 4/1/36 | 485,000 | 414,936 |
| 4.00%, due 4/1/41 | 575,000 | 464,975 |
| 4.00%, due 4/1/51 | 1,250,000 | 932,846 |
| | | 45,272,206 |
| Delaware 0.5% |
| County of Kent DE, Student Housing & Dining Facility, CHF-Dover LLC, Delaware State University Project, Revenue Bonds | | |
| Series A | | |
| 5.00%, due 7/1/40 | 1,050,000 | 926,056 |
| Series A | | |
| 5.00%, due 7/1/48 | 2,735,000 | 2,285,273 |
| Series A | | |
| 5.00%, due 7/1/53 | 4,090,000 | 3,347,996 |
| Series A | | |
| 5.00%, due 7/1/58 | 6,700,000 | 5,349,756 |
| Delaware State Economic Development Authority, Newark Charter School, Inc. Project, Revenue Bonds | | |
| 4.00%, due 9/1/41 | 1,600,000 | 1,353,561 |
| | Principal
Amount | Value |
| |
| Delaware (continued) |
| Delaware State Health Facilities Authority, Beebe Medical Center, Revenue Bonds | | |
| 4.25%, due 6/1/38 | $ 2,235,000 | $ 1,953,203 |
| 4.375%, due 6/1/48 | 9,400,000 | 7,928,936 |
| 5.00%, due 6/1/37 | 1,000,000 | 1,006,923 |
| 5.00%, due 6/1/43 | 4,750,000 | 4,618,096 |
| Delaware State Health Facilities Authority, Nanticoke Memorial Hospital Project, Revenue Bonds | | |
| 5.00%, due 7/1/32 | 3,555,000 | 3,596,763 |
| Delaware State Health Facilities Authority, Christiana Health Care System Obligated Group, Revenue Bonds | | |
| Series A | | |
| 5.00%, due 10/1/40 | 6,750,000 | 6,875,767 |
| | | 39,242,330 |
| District of Columbia 1.6% |
| District of Columbia, Tobacco Settlement Financing Corp., Asset Backed, Revenue Bonds | | |
| Series A | | |
| (zero coupon), due 6/15/46 | 83,000,000 | 16,083,333 |
| District of Columbia, KIPP DC Project, Revenue Bonds | | |
| 4.00%, due 7/1/49 | 1,375,000 | 1,095,128 |
| District of Columbia, Provident Group-Howard Properties LLC, Revenue Bonds | | |
| 5.00%, due 10/1/30 | 1,500,000 | 1,499,939 |
| 5.00%, due 10/1/45 | 5,105,000 | 4,687,417 |
| District of Columbia, Friendship Public Charter School, Revenue Bonds | | |
| Series A | | |
| 5.00%, due 6/1/46 | 1,400,000 | 1,311,370 |
| District of Columbia, Revenue Bonds | | |
| 5.00%, due 6/1/50 | 4,750,000 | 4,268,408 |
| District of Columbia, International School Obligated Group, Revenue Bonds | | |
| 5.00%, due 7/1/54 | 2,550,000 | 2,254,244 |
The notes to the financial statements are an integral part of, and should be read in conjunction with, the financial statements.
| 22 | MainStay MacKay High Yield Municipal Bond Fund |
| | Principal
Amount | Value |
| Long-Term Municipal Bonds (continued) |
| District of Columbia (continued) |
| District of Columbia, Methodist Home, Revenue Bonds | | |
| Series A | | |
| 5.25%, due 1/1/39 | $ 1,015,000 | $ 861,158 |
| Metropolitan Washington Airports Authority, Dulles Toll Road, Metrorail & Capital Improvement Project, Revenue Bonds, Senior Lien | | |
| Series A, Insured: AGM | | |
| 4.00%, due 10/1/52 | 4,000,000 | 3,279,932 |
| Metropolitan Washington Airports Authority, Dulles Toll Road, Metrorail & Capital Improvement Project, Revenue Bonds, Sub. Lien | | |
| Series B, Insured: AGM | | |
| 4.00%, due 10/1/53 | 13,100,000 | 10,415,778 |
| Metropolitan Washington Airports Authority Dulles Toll Road, Revenue Bonds, Senior Lien | | |
| Series B | | |
| (zero coupon), due 10/1/39 | 5,005,000 | 2,014,188 |
| Metropolitan Washington Airports Authority Dulles Toll Road, Revenue Bonds, Sub. Lien | | |
| Series B | | |
| 4.00%, due 10/1/49 | 100,045,000 | 80,682,451 |
| | | 128,453,346 |
| Florida 2.9% |
| Capital Trust Agency, Wonderful Foundations Charter School, Revenue Bonds | | |
| Series B | | |
| (zero coupon), due 1/1/60 | 16,000,000 | 699,984 |
| Capital Trust Agency, Odyssey Charter School, Inc., Revenue Bonds | | |
| Series A | | |
| 5.50%, due 7/1/47 (a) | 2,000,000 | 1,906,522 |
| Celebration Community Development District, Assessment Area 1 Project, Special Assessment | | |
| 3.125%, due 5/1/41 | 590,000 | 410,812 |
| 4.00%, due 5/1/51 | 845,000 | 637,415 |
| | Principal
Amount | Value |
| |
| Florida (continued) |
| CFM Community Development District, Capital Improvement, Special Assessment | | |
| 3.35%, due 5/1/41 | $ 200,000 | $ 143,405 |
| 4.00%, due 5/1/51 | 290,000 | 218,627 |
| Charlotte County Industrial Development Authority, Town & Country Utility Project, Revenue Bonds | | |
| Series A | | |
| 4.00%, due 10/1/51 (a)(b) | 3,500,000 | 2,350,405 |
| City of Atlantic Beach FL, Fleet Landing Project, Revenue Bonds | | |
| Series A | | |
| 5.00%, due 11/15/48 | 3,000,000 | 2,829,214 |
| Series B | | |
| 5.625%, due 11/15/43 | 1,500,000 | 1,505,115 |
| City of Fort Myers FL, Utility System, Revenue Bonds | | |
| Series A | | |
| 4.00%, due 10/1/49 | 10,275,000 | 8,660,150 |
| City of Orlando FL, Tourist Development Tax, Revenue Bonds, Third Lien | | |
| Series C, Insured: AGC | | |
| 5.50%, due 11/1/38 | 325,000 | 325,335 |
| City of Pompano Beach FL, John Knox Village Project, Revenue Bonds | | |
| Series A | | |
| 4.00%, due 9/1/51 | 650,000 | 461,674 |
| Series A | | |
| 4.00%, due 9/1/56 | 5,165,000 | 3,558,733 |
| City of Tallahassee FL, Tallahassee Memorial HealthCare, Inc., Revenue Bonds | | |
| Series A | | |
| 5.00%, due 12/1/40 | 6,935,000 | 6,717,532 |
| Collier County Educational Facilities Authority, Ave Maria University, Inc. Project, Revenue Bonds | | |
| Series A | | |
| 6.125%, due 6/1/43 | 2,500,000 | 2,497,952 |
The notes to the financial statements are an integral part of, and should be read in conjunction with, the financial statements.
23
Portfolio of Investments October 31, 2022† (continued)
| | Principal
Amount | Value |
| Long-Term Municipal Bonds (continued) |
| Florida (continued) |
| Collier County Health Facilities Authority, Moorings, Inc. Obligated Group (The), Revenue Bonds | | |
| 4.00%, due 5/1/52 | $ 8,000,000 | $ 6,322,940 |
| Cordova Palms Community Development District, Special Assessment | | |
| 3.00%, due 5/1/41 (a) | 1,215,000 | 828,942 |
| County of Osceola FL, Transportation, Revenue Bonds | | |
| Series A-1 | | |
| 4.00%, due 10/1/54 | 4,345,000 | 3,188,948 |
| Series A-1 | | |
| 5.00%, due 10/1/44 | 11,150,000 | 10,346,541 |
| Elevation Pointe Community Development District, Special Assessment | | |
| Series A-1 | | |
| 4.60%, due 5/1/52 | 1,090,000 | 907,575 |
| Epperson North Community Development District, Assessment Area 3, Special Assessment | | |
| Series A | | |
| 3.40%, due 11/1/41 | 2,165,000 | 1,545,673 |
| Epperson North Community Development District, Assessment Area 2, Special Assessment | | |
| 3.50%, due 5/1/41 | 795,000 | 579,751 |
| Escambia County Health Facilities Authority, Baptist Health Care Corp. Obligated Group, Revenue Bonds | | |
| Series A | | |
| 4.00%, due 8/15/50 | 4,865,000 | 3,699,440 |
| Florida Development Finance Corp., Mayflower Retirement Community Centre, Inc., Revenue Bonds | | |
| Series B-1 | | |
| 2.375%, due 6/1/27 (a) | 835,000 | 732,440 |
| | Principal
Amount | Value |
| |
| Florida (continued) |
| Florida Development Finance Corp., UF Health Jacksonville Project, Revenue Bonds | | |
| Series A, Insured: AGM-CR | | |
| 4.00%, due 2/1/52 | $ 14,155,000 | $ 11,587,545 |
| Series A | | |
| 5.00%, due 2/1/40 | 2,600,000 | 2,355,875 |
| Series A | | |
| 5.00%, due 2/1/52 | 6,400,000 | 5,452,320 |
| Florida Development Finance Corp., River City Education Obligated Group, Revenue Bonds | | |
| Series A | | |
| 4.00%, due 7/1/55 | 1,000,000 | 715,587 |
| Florida Development Finance Corp., Florida Charter Foundation, Inc. Project, Revenue Bonds | | |
| Series A | | |
| 4.75%, due 7/15/36 (a) | 4,305,000 | 3,892,672 |
| Florida Development Finance Corp., Mater Academy Project, Revenue Bonds | | |
| Series A | | |
| 5.00%, due 6/15/50 | 3,000,000 | 2,695,609 |
| Series A | | |
| 5.00%, due 6/15/55 | 5,600,000 | 4,958,678 |
| Series A | | |
| 5.00%, due 6/15/56 | 3,000,000 | 2,648,910 |
| Florida Higher Educational Facilities Financial Authority, Ringling College Project, Revenue Bonds | | |
| 4.00%, due 3/1/47 | 6,420,000 | 4,897,421 |
| Florida Higher Educational Facilities Financial Authority, Saint Leo University Project, Revenue Bonds | | |
| 5.00%, due 3/1/44 | 1,370,000 | 1,165,317 |
| 5.00%, due 3/1/49 | 1,630,000 | 1,346,544 |
| Hillsborough County Industrial Development Authority, Tampa General Hospital Project, Revenue Bonds | | |
| Series A | | |
| 4.00%, due 8/1/50 | 77,565,000 | 58,895,345 |
The notes to the financial statements are an integral part of, and should be read in conjunction with, the financial statements.
| 24 | MainStay MacKay High Yield Municipal Bond Fund |
| | Principal
Amount | Value |
| Long-Term Municipal Bonds (continued) |
| Florida (continued) |
| Hillsborough County Industrial Development Authority, Tampa General Hospital Project, Revenue Bonds (continued) | | |
| Series A | | |
| 4.00%, due 8/1/55 | $ 20,035,000 | $ 14,822,634 |
| Lakewood Ranch Stewardship District, Star Farms at Lakewood Ranch Project Phase 1 and 2, Special Assessment | | |
| 3.00%, due 5/1/41 | 430,000 | 306,190 |
| 4.00%, due 5/1/52 | 675,000 | 505,493 |
| Lee County Industrial Development Authority, Preserve Project, Revenue Bonds | | |
| Series A | | |
| 5.75%, due 12/1/52 (a) | 7,125,000 | 4,823,869 |
| Miami Beach Health Facilities Authority, Mount Sinai Medical Center of Florida, Revenue Bonds | | |
| Series B | | |
| 4.00%, due 11/15/46 | 7,000,000 | 5,529,862 |
| Series B | | |
| 4.00%, due 11/15/51 | 3,190,000 | 2,456,228 |
| 5.00%, due 11/15/29 | 1,825,000 | 1,826,197 |
| 5.00%, due 11/15/39 | 2,230,000 | 2,183,760 |
| Mid-Bay Bridge Authority, Revenue Bonds | | |
| Series A | | |
| 5.00%, due 10/1/35 | 1,500,000 | 1,502,347 |
| Series C | | |
| 5.00%, due 10/1/40 | 1,000,000 | 967,689 |
| Mirada II Community Development District, Capital Improvement, Special Assessment | | |
| 3.125%, due 5/1/31 | 500,000 | 421,161 |
| 3.50%, due 5/1/41 | 1,000,000 | 733,802 |
| New Port Tampa Bay Community Development District, Special Assessment | | |
| 3.50%, due 5/1/31 | 310,000 | 268,744 |
| 3.875%, due 5/1/41 | 1,000,000 | 771,030 |
| 4.125%, due 5/1/52 | 365,000 | 279,470 |
| | Principal
Amount | Value |
| |
| Florida (continued) |
| North Powerline Road Community Development District, Special Assessment | | |
| 3.625%, due 5/1/40 | $ 500,000 | $ 380,078 |
| 4.00%, due 5/1/51 | 1,075,000 | 809,454 |
| Osceola County Expressway Authority, Poinciana Parkway Project, Revenue Bonds, Senior Lien | | |
| Series B-2 | | |
| (zero coupon), due 10/1/36 (d) | 3,750,000 | 3,922,454 |
| Palm Beach County Health Facilities Authority, Toby & Leon Cooperman Sinai residencies of Boca Raton, Revenue Bonds | | |
| 4.00%, due 6/1/36 | 4,000,000 | 3,260,668 |
| Pinellas County Educational Facilities Authority, Pinellas Academy Math & Science Project, Revenue Bonds | | |
| Series A | | |
| 5.00%, due 12/15/48 (a) | 3,280,000 | 2,966,322 |
| Polk County Industrial Development Authority, Carpenter's Home Estates, Inc. Project, Revenue Bonds | | |
| Series A | | |
| 5.00%, due 1/1/49 | 1,750,000 | 1,480,467 |
| Series A | | |
| 5.00%, due 1/1/55 | 800,000 | 661,084 |
| Preston Cove Community Development District, Special Assessment | | |
| 4.00%, due 5/1/42 | 1,825,000 | 1,481,056 |
| Sawyers Landing Community Development District, Special Assessment | | |
| 3.75%, due 5/1/31 | 1,550,000 | 1,375,737 |
| 4.125%, due 5/1/41 | 3,055,000 | 2,539,002 |
| Shingle Creek at Bronson Community Development District, Special Assessment | | |
| 3.50%, due 6/15/41 | 1,000,000 | 751,424 |
| Stillwater Community Development District, 2021 Project, Special Assessment (a) | | |
| 3.00%, due 6/15/31 | 410,000 | 342,180 |
| 3.50%, due 6/15/41 | 1,000,000 | 737,384 |
The notes to the financial statements are an integral part of, and should be read in conjunction with, the financial statements.
25
Portfolio of Investments October 31, 2022† (continued)
| | Principal
Amount | Value |
| Long-Term Municipal Bonds (continued) |
| Florida (continued) |
| Tradition Community Development District No. 9, Special Assessment | | |
| 3.00%, due 5/1/41 | $ 1,800,000 | $ 1,228,062 |
| Two Rivers North Community Development District, Special Assessment | | |
| 5.25%, due 5/1/52 | 1,500,000 | 1,345,282 |
| V-Dana Community Development District, Special Assessment | | |
| 3.625%, due 5/1/41 | 1,040,000 | 782,526 |
| V-Dana Community Development District, Assessment Area 1-2020 Project, Special Assessment | | |
| 4.00%, due 5/1/51 (a) | 1,200,000 | 905,522 |
| Veranda Community Development District II, Special Assessment | | |
| 3.60%, due 5/1/41 (a) | 330,000 | 245,846 |
| Windward at Lakewood Ranch Community Development District, Phase 2 Project, Special Assessment | | |
| 4.00%, due 5/1/42 | 1,130,000 | 917,129 |
| 4.25%, due 5/1/52 | 1,360,000 | 1,067,078 |
| | | 226,284,179 |
| Georgia 1.4% |
| Atlanta Urban Redevelopment Agency, Atlanta BeltLine Special Service District, Revenue Bonds | | |
| Insured: BAM | | |
| 3.625%, due 7/1/42 (a) | 5,605,000 | 4,469,658 |
| Development Authority of Cobb County (The), Kennesaw State University Real Estate Foundations Project, Revenue Bonds, Junior Lien | | |
| Series C | | |
| 5.00%, due 7/15/38 | 2,390,000 | 2,258,006 |
| Fulton County Residential Care Facilities for the Elderly Authority, Lenbrook Square Foundation, Inc., Revenue Bonds | | |
| 5.00%, due 7/1/36 | 3,750,000 | 3,581,645 |
| | Principal
Amount | Value |
| |
| Georgia (continued) |
| Gainesville & Hall County Development Authority, Riverside Military Academy, Inc., Revenue Bonds | | |
| 5.125%, due 3/1/52 | $ 1,500,000 | $ 923,499 |
| George L Smith II Congress Center Authority, Convention Centre Hotel, Revenue Bonds, First Tier | | |
| 4.00%, due 1/1/54 | 4,750,000 | 3,582,146 |
| George L Smith II Congress Center Authority, Convention Centre Hotel, Revenue Bonds, Second Tier | | |
| 5.00%, due 1/1/54 (a) | ��� 4,000,000 | 3,050,065 |
| Main Street Natural Gas, Inc., Revenue Bonds | | |
| Series A | | |
| 4.00%, due 5/15/39 | 6,550,000 | 5,629,775 |
| Series A | | |
| 5.00%, due 5/15/38 | 3,500,000 | 3,404,486 |
| Municipal Electric Authority of Georgia, Project One Subordinated Bonds, Revenue Bonds | | |
| Series A, Insured: BAM | | |
| 4.00%, due 1/1/49 | 14,300,000 | 12,029,539 |
| Municipal Electric Authority of Georgia, Plant Vogtle Units 3 & 4 Project, Revenue Bonds | | |
| Series B | | |
| 4.00%, due 1/1/49 | 54,975,000 | 43,462,641 |
| Series A | | |
| 5.00%, due 1/1/56 | 17,300,000 | 16,150,232 |
| Series A | | |
| 5.00%, due 1/1/63 | 7,315,000 | 6,496,571 |
| Private Colleges & Universities Authority, Mercer University Project, Revenue Bonds | | |
| 5.00%, due 10/1/45 | 5,750,000 | 5,621,203 |
| | | 110,659,466 |
| Guam 0.9% |
| Antonio B Won Pat International Airport Authority, Revenue Bonds (b) | | |
| Series C | | |
| 6.375%, due 10/1/43 | 1,550,000 | 1,586,234 |
The notes to the financial statements are an integral part of, and should be read in conjunction with, the financial statements.
| 26 | MainStay MacKay High Yield Municipal Bond Fund |
| | Principal
Amount | Value |
| Long-Term Municipal Bonds (continued) |
| Guam (continued) |
| Antonio B Won Pat International Airport Authority, Revenue Bonds (b) (continued) | | |
| Series C | | |
| 6.375%, due 10/1/43 | $ 1,450,000 | $ 1,483,896 |
| Guam Department of Education, John F. Kennedy High School Refunding & Energy Efficiency Project, Certificate of Participation | | |
| Series A | | |
| 4.25%, due 2/1/30 | 1,190,000 | 1,088,964 |
| Series A | | |
| 5.00%, due 2/1/40 | 4,875,000 | 4,372,484 |
| Guam Government Waterworks Authority, Water and Wastewater System, Revenue Bonds | | |
| 5.00%, due 7/1/40 | 8,770,000 | 8,779,972 |
| 5.00%, due 1/1/46 | 3,950,000 | 3,838,259 |
| 5.50%, due 7/1/43 | 13,315,000 | 13,514,753 |
| Port Authority of Guam, Revenue Bonds | | |
| Series A | | |
| 5.00%, due 7/1/48 | 4,950,000 | 5,003,548 |
| Territory of Guam, Business Privilege Tax, Revenue Bonds | | |
| Series F | | |
| 4.00%, due 1/1/36 | 5,920,000 | 5,007,788 |
| Series F | | |
| 4.00%, due 1/1/42 | 4,310,000 | 3,387,763 |
| Series D | | |
| 5.00%, due 11/15/29 | 1,455,000 | 1,452,706 |
| Series D | | |
| 5.00%, due 11/15/34 | 4,630,000 | 4,453,866 |
| Series D | | |
| 5.00%, due 11/15/35 | 5,700,000 | 5,450,605 |
| Series D | | |
| 5.00%, due 11/15/39 | 9,870,000 | 9,169,125 |
| | | 68,589,963 |
| Hawaii 0.5% |
| Kauai County Community Facilities District, Kukui'ula Development Project, Special Tax | | |
| 4.375%, due 5/15/42 | 2,300,000 | 1,917,438 |
| 5.00%, due 5/15/51 | 5,635,000 | 5,133,620 |
| | Principal
Amount | Value |
| |
| Hawaii (continued) |
| Kauai County Community Facilities District, Community Facilities District No. 2008-1, Special Tax | | |
| 5.00%, due 5/15/44 | $ 1,775,000 | $ 1,702,043 |
| 5.00%, due 5/15/49 | 2,750,000 | 2,588,894 |
| State of Hawaii Department of Budget & Finance, Hawaiian Electric Co., Inc., Revenue Bonds (b) | | |
| Insured: AGM-CR | | |
| 3.50%, due 10/1/49 | 25,275,000 | 18,113,106 |
| Series B | | |
| 4.00%, due 3/1/37 | 3,950,000 | 3,472,727 |
| State of Hawaii Department of Budget & Finance, Chaminade University of Honolulu, Revenue Bonds | | |
| Series A | | |
| 5.00%, due 1/1/45 (a) | 1,500,000 | 1,226,962 |
| State of Hawaii Department of Budget & Finance, Hawaii Pacific University, Revenue Bonds (a) | | |
| Series A | | |
| 6.625%, due 7/1/33 | 2,085,000 | 2,092,461 |
| Series A | | |
| 6.875%, due 7/1/43 | 4,340,000 | 4,354,156 |
| | | 40,601,407 |
| Idaho 0.1% |
| Idaho Health Facilities Authority, Madison Memorial Hospital, Revenue Bonds | | |
| 5.00%, due 9/1/37 | 1,000,000 | 955,721 |
| Idaho Housing & Finance Association, Gem Prep: Meridian Project, Revenue Bonds | | |
| Series A, Insured: School Bond Guaranty | | |
| 4.00%, due 5/1/57 | 4,365,000 | 3,295,855 |
| | | 4,251,576 |
| Illinois 11.2% |
| Bridgeview Finance Corp., Sales Tax, Revenue Bonds | | |
| Series A | | |
| 5.00%, due 12/1/37 | 1,260,000 | 962,935 |
The notes to the financial statements are an integral part of, and should be read in conjunction with, the financial statements.
27
Portfolio of Investments October 31, 2022† (continued)
| | Principal
Amount | Value |
| Long-Term Municipal Bonds (continued) |
| Illinois (continued) |
| Bridgeview Finance Corp., Sales Tax, Revenue Bonds (continued) | | |
| Series A | | |
| 5.00%, due 12/1/42 | $ 7,250,000 | $ 5,183,892 |
| Chicago Board of Education, Capital Appreciation, School Reform, Unlimited General Obligation | | |
| Series A, Insured: NATL-RE | | |
| (zero coupon), due 12/1/27 | 5,175,000 | 4,061,032 |
| Series B-1, Insured: NATL-RE | | |
| (zero coupon), due 12/1/30 | 13,050,000 | 8,690,492 |
| Series A, Insured: NATL-RE | | |
| (zero coupon), due 12/1/31 | 170,000 | 106,509 |
| Series B-1, Insured: NATL-RE | | |
| (zero coupon), due 12/1/31 | 1,095,000 | 686,045 |
| Chicago Board of Education, Unlimited General Obligation | | |
| Series B | | |
| 4.00%, due 12/1/40 | 1,765,000 | 1,410,076 |
| Series A | | |
| 4.00%, due 12/1/42 | 2,965,000 | 2,302,053 |
| Series A | | |
| 4.00%, due 12/1/43 | 4,000,000 | 3,076,742 |
| Series A | | |
| 4.00%, due 12/1/47 | 45,635,000 | 33,794,365 |
| Series A | | |
| 5.00%, due 12/1/30 | 3,500,000 | 3,421,379 |
| Series B | | |
| 5.00%, due 12/1/31 | 4,700,000 | 4,568,079 |
| Series B | | |
| 5.00%, due 12/1/32 | 1,250,000 | 1,203,617 |
| Series B | | |
| 5.00%, due 12/1/33 | 2,050,000 | 1,966,185 |
| Series G | | |
| 5.00%, due 12/1/34 | 1,915,000 | 1,817,166 |
| Series H | | |
| 5.00%, due 12/1/36 | 4,430,000 | 4,155,876 |
| Series A | | |
| 5.00%, due 12/1/37 | 13,555,000 | 12,432,638 |
| Series A | | |
| 5.00%, due 12/1/40 | 6,740,000 | 6,082,150 |
| Series G | | |
| 5.00%, due 12/1/44 | 2,785,000 | 2,452,709 |
| Series D | | |
| 5.00%, due 12/1/46 | 6,200,000 | 5,400,100 |
| | Principal
Amount | Value |
| |
| Illinois (continued) |
Chicago Board of Education, Unlimited General Obligation
(continued) | | |
| Series H | | |
| 5.00%, due 12/1/46 | $ 6,700,000 | $ 5,844,259 |
| Series A | | |
| 5.00%, due 12/1/47 | 29,345,000 | 25,329,571 |
| Series C | | |
| 5.25%, due 12/1/39 | 1,405,000 | 1,302,497 |
| Series B | | |
| 6.50%, due 12/1/46 | 1,900,000 | 1,962,936 |
| Series A | | |
| 7.00%, due 12/1/44 | 11,075,000 | 11,570,107 |
| Chicago Board of Education, Revenue Bonds | | |
| 5.00%, due 4/1/46 | 4,700,000 | 4,288,703 |
| 6.00%, due 4/1/46 | 34,200,000 | 34,820,751 |
| Chicago Board of Education, Dedicated Capital Improvement, Unlimited General Obligation | | |
| Series C | | |
| 5.00%, due 12/1/34 | 2,270,000 | 2,153,392 |
| Series B | | |
| 7.00%, due 12/1/42 (a) | 9,700,000 | 10,365,127 |
| Series A | | |
| 7.00%, due 12/1/46 (a) | 3,700,000 | 3,929,527 |
| Chicago Board of Education, Dedicated Capital Improvement, Revenue Bonds | | |
| 5.00%, due 4/1/35 | 1,615,000 | 1,578,020 |
| 5.00%, due 4/1/36 | 1,270,000 | 1,235,753 |
| 5.00%, due 4/1/37 | 435,000 | 420,481 |
| 5.00%, due 4/1/42 | 3,500,000 | 3,278,416 |
| Chicago Board of Education, School Reform Board, Unlimited General Obligation | | |
| Series A, Insured: AGC-ICC FGIC | | |
| 5.50%, due 12/1/26 | 18,900,000 | 19,581,160 |
| Chicago O'Hare International Airport, TRIPS Obligated Group, Revenue Bonds (b) | | |
| 5.00%, due 7/1/38 | 1,500,000 | 1,437,151 |
| 5.00%, due 7/1/48 | 4,750,000 | 4,322,959 |
| Chicago Transit Authority Sales Tax Receipts Fund, Revenue Bonds, Second Lien | | |
| 5.00%, due 12/1/46 | 8,750,000 | 8,324,994 |
The notes to the financial statements are an integral part of, and should be read in conjunction with, the financial statements.
| 28 | MainStay MacKay High Yield Municipal Bond Fund |
| | Principal
Amount | Value |
| Long-Term Municipal Bonds (continued) |
| Illinois (continued) |
| City of Chicago IL, City Colleges Capital Improvement Project, Unlimited General Obligation | | |
| Insured: NATL-RE | | |
| (zero coupon), due 1/1/34 | $ 300,000 | $ 170,341 |
| City of Chicago IL, Unlimited General Obligation | | |
| Series A | | |
| 4.00%, due 1/1/35 | 2,325,000 | 1,979,709 |
| Series A | | |
| 5.00%, due 1/1/33 | 7,500,000 | 7,190,314 |
| Series C | | |
| 5.00%, due 1/1/38 | 2,410,000 | 2,282,212 |
| Series A | | |
| 5.00%, due 1/1/39 | 5,750,000 | 5,414,948 |
| Series A | | |
| 5.00%, due 1/1/40 | 3,950,000 | 3,698,768 |
| Series A | | |
| 5.00%, due 1/1/44 | 11,250,000 | 10,339,897 |
| Series A | | |
| 5.50%, due 1/1/49 | 18,150,000 | 17,588,216 |
| Series A | | |
| 6.00%, due 1/1/38 | 39,020,000 | 39,753,997 |
| City of Chicago IL, Waterworks, Revenue Bonds, Second Lien | | |
| 4.00%, due 11/1/37 | 14,800,000 | 13,568,556 |
| City of Chicago IL, Taxable Project, Unlimited General Obligation | | |
| Series B | | |
| 5.50%, due 1/1/31 | 2,360,000 | 2,360,914 |
| Series D | | |
| 5.50%, due 1/1/37 | 3,500,000 | 3,443,268 |
| Series D | | |
| 5.50%, due 1/1/40 | 1,245,000 | 1,216,527 |
| Series A | | |
| 5.75%, due 1/1/34 | 3,600,000 | 3,582,111 |
| City of Galesburg IL, Knox College Project, Revenue Bonds | | |
| Series A | | |
| 4.00%, due 10/1/46 | 5,750,000 | 4,688,459 |
| Illinois Finance Authority, Midwestern University Foundation, Revenue Bonds | | |
| Series A | | |
| 2.25%, due 7/1/33 (b) | 500,000 | 373,790 |
| | Principal
Amount | Value |
| |
| Illinois (continued) |
| Illinois Finance Authority, Bradley University, Revenue Bonds | | |
| Series A | | |
| 4.00%, due 8/1/46 | $ 1,500,000 | $ 1,160,363 |
| Series A | | |
| 4.00%, due 8/1/51 | 2,500,000 | 1,869,789 |
| Illinois Finance Authority, University of Illinois Health Services, Revenue Bonds | | |
| 4.00%, due 10/1/50 | 19,565,000 | 15,015,858 |
| Illinois Finance Authority, Learn Charter School Project, Revenue Bonds | | |
| 4.00%, due 11/1/51 | 1,000,000 | 758,512 |
| 4.00%, due 11/1/56 | 750,000 | 550,204 |
| Illinois Finance Authority, Rosalind Franklin University of Medicine & Science, Revenue Bonds | | |
| Series C | | |
| 4.25%, due 8/1/42 | 2,900,000 | 2,452,566 |
| Illinois Finance Authority, Noble Network Charter Schools, Revenue Bonds | | |
| 5.00%, due 9/1/32 | 1,830,000 | 1,846,184 |
| 6.25%, due 9/1/39 | 150,000 | 151,867 |
| Illinois Finance Authority, Friendship Village Schaumburg, Revenue Bonds (e)(f) | | |
| 5.00%, due 2/15/37 | 7,375,000 | 3,613,750 |
| 5.125%, due 2/15/45 | 5,715,000 | 2,800,350 |
| Illinois Finance Authority, Columbia College Chicago, Revenue Bonds | | |
| Series A | | |
| 5.00%, due 12/1/37 | 9,750,000 | 9,869,867 |
| Illinois Finance Authority, Christian Homes, Inc., Revenue Bonds | | |
| 5.00%, due 5/15/40 | 1,265,000 | 1,081,114 |
| Illinois Finance Authority, Student Housing & Academic Facility, CHF-Chicago LLC, University of Illinois at Chicago Project, Revenue Bonds | | |
| Series A | | |
| 5.00%, due 2/15/47 | 6,250,000 | 5,286,694 |
| Series A | | |
| 5.00%, due 2/15/50 | 1,835,000 | 1,532,100 |
The notes to the financial statements are an integral part of, and should be read in conjunction with, the financial statements.
29
Portfolio of Investments October 31, 2022† (continued)
| | Principal
Amount | Value |
| Long-Term Municipal Bonds (continued) |
| Illinois (continued) |
| Illinois Finance Authority, Franciscan Communities, Inc., Revenue Bonds | | |
| Series A | | |
| 5.00%, due 5/15/47 | $ 1,155,000 | $ 1,003,607 |
| Illinois Finance Authority, Chicago International School Project, Revenue Bonds | | |
| Series A | | |
| 5.00%, due 12/1/47 | 3,000,000 | 2,809,846 |
| Illinois Finance Authority, Rosalind Franklin University of Medicine and Science, Revenue Bonds | | |
| 5.00%, due 8/1/49 | 1,300,000 | 1,230,753 |
| Illinois Finance Authority, Roosevelt University Project, Revenue Bonds | | |
| 5.50%, due 4/1/32 | 2,000,000 | 1,879,440 |
| Illinois Finance Authority, Roosevelt University, Revenue Bonds (a) | | |
| Series A | | |
| 6.00%, due 4/1/38 | 3,130,000 | 2,961,386 |
| Series A | | |
| 6.125%, due 4/1/49 | 2,355,000 | 2,182,482 |
| Metropolitan Pier & Exposition Authority, McCormick Place Expansion Project, Revenue Bonds | | |
| Series A, Insured: NATL-RE | | |
| (zero coupon), due 12/15/31 | 5,000,000 | 3,148,041 |
| Series A, Insured: NATL-RE | | |
| (zero coupon), due 12/15/32 | 18,445,000 | 10,932,982 |
| Series A, Insured: NATL-RE | | |
| (zero coupon), due 6/15/33 | 25,720,000 | 14,772,133 |
| Series A, Insured: NATL-RE | | |
| (zero coupon), due 12/15/33 | 12,350,000 | 6,873,497 |
| Series A, Insured: NATL-RE | | |
| (zero coupon), due 6/15/34 | 45,815,000 | 24,629,874 |
| Series A, Insured: NATL-RE | | |
| (zero coupon), due 12/15/36 | 34,195,000 | 15,711,919 |
| Series A, Insured: NATL-RE | | |
| (zero coupon), due 6/15/37 | 6,000,000 | 2,666,006 |
| Series A, Insured: NATL-RE | | |
| (zero coupon), due 12/15/37 | 64,100,000 | 27,661,804 |
| Series B | | |
| (zero coupon), due 12/15/50 | 35,130,000 | 6,368,774 |
| | Principal
Amount | Value |
| |
| Illinois (continued) |
| Metropolitan Pier & Exposition Authority, McCormick Place Expansion Project, Revenue Bonds (continued) | | |
| Series B, Insured: AGM-CR | | |
| (zero coupon), due 12/15/50 | $ 10,000,000 | $ 2,135,810 |
| Series B | | |
| (zero coupon), due 12/15/51 | 55,300,000 | 9,411,562 |
| Series B | | |
| (zero coupon), due 12/15/54 | 57,160,000 | 8,031,860 |
| (zero coupon), due 12/15/56 | 29,650,000 | 3,662,733 |
| Series B, Insured: AGM | | |
| (zero coupon), due 12/15/56 | 35,995,000 | 5,497,156 |
| Series A, Insured: BAM | | |
| 4.00%, due 12/15/42 | 2,500,000 | 1,998,380 |
| 4.00%, due 12/15/47 | 13,125,000 | 10,129,234 |
| Series A | | |
| 4.00%, due 6/15/50 | 22,200,000 | 16,779,153 |
| 4.00%, due 6/15/52 | 14,675,000 | 10,946,209 |
| 5.00%, due 6/15/42 | 1,000,000 | 946,724 |
| Series A | | |
| 5.00%, due 12/15/45 | 1,430,000 | 1,326,840 |
| 5.00%, due 6/15/50 | 17,600,000 | 16,132,655 |
| Series A | | |
| 5.00%, due 6/15/57 | 2,000,000 | 1,811,620 |
| Metropolitan Pier & Exposition Authority, McCormick Place Expansion Project, Capital Appreciation, Revenue Bonds | | |
| Insured: NATL-RE | | |
| (zero coupon), due 6/15/38 | 9,600,000 | 3,997,056 |
| Series B-1, Insured: AGM | | |
| (zero coupon), due 6/15/43 | 850,000 | 282,098 |
| Series B-1, Insured: AGM | | |
| (zero coupon), due 6/15/44 | 72,470,000 | 22,652,231 |
| Series B-1, Insured: AGM | | |
| (zero coupon), due 6/15/45 | 8,000,000 | 2,345,982 |
| Metropolitan Pier & Exposition Authority, Mccormick Place Expansion Project, Revenue Bonds | | |
| Series A | | |
| (zero coupon), due 12/15/38 | 3,750,000 | 1,487,571 |
| Series A | | |
| (zero coupon), due 6/15/39 | 3,600,000 | 1,370,876 |
| Series A | | |
| (zero coupon), due 6/15/40 | 3,500,000 | 1,245,543 |
The notes to the financial statements are an integral part of, and should be read in conjunction with, the financial statements.
| 30 | MainStay MacKay High Yield Municipal Bond Fund |
| | Principal
Amount | Value |
| Long-Term Municipal Bonds (continued) |
| Illinois (continued) |
| Northern Illinois University, Auxiliary Facilities System, Revenue Bonds | | |
| Series B, Insured: BAM | | |
| 4.00%, due 4/1/37 | $ 1,300,000 | $ 1,147,903 |
| Series B, Insured: BAM | | |
| 4.00%, due 4/1/39 | 1,300,000 | 1,125,164 |
| Series B, Insured: BAM | | |
| 4.00%, due 4/1/41 | 1,350,000 | 1,148,524 |
| Sangamon County Water Reclamation District, Alternative Revenue Source, Unlimited General Obligation | | |
| Series A, Insured: BAM | | |
| 4.00%, due 1/1/44 | 4,750,000 | 4,182,863 |
| Series A, Insured: BAM | | |
| 4.00%, due 1/1/49 | 13,750,000 | 11,720,478 |
| State of Illinois, Unlimited General Obligation | | |
| Series B | | |
| 4.00%, due 12/1/39 | 9,460,000 | 7,768,562 |
| Insured: BAM | | |
| 4.00%, due 6/1/41 | 25,355,000 | 21,144,381 |
| Series C | | |
| 4.00%, due 10/1/41 | 7,650,000 | 6,124,896 |
| Series C | | |
| 4.00%, due 10/1/42 | 8,750,000 | 6,897,714 |
| Series C | | |
| 4.25%, due 10/1/45 | 23,500,000 | 18,786,485 |
| Series A | | |
| 4.50%, due 12/1/41 | 6,525,000 | 5,593,073 |
| Series A | | |
| 5.00%, due 12/1/25 | 3,270,000 | 3,295,838 |
| Series D | | |
| 5.00%, due 11/1/26 | 3,995,000 | 4,023,728 |
| Series D | | |
| 5.00%, due 11/1/27 | 10,700,000 | 10,742,107 |
| Series A | | |
| 5.00%, due 12/1/27 | 2,315,000 | 2,323,657 |
| Series B | | |
| 5.00%, due 12/1/27 | 9,115,000 | 9,149,086 |
| 5.00%, due 2/1/28 | 2,700,000 | 2,707,471 |
| Series C | | |
| 5.00%, due 11/1/29 | 14,335,000 | 14,347,460 |
| Series A | | |
| 5.00%, due 12/1/31 | 1,485,000 | 1,477,447 |
| | Principal
Amount | Value |
| |
| Illinois (continued) |
| State of Illinois, Unlimited General Obligation (continued) | | |
| Series A | | |
| 5.00%, due 12/1/39 | $ 2,400,000 | $ 2,269,878 |
| Series A | | |
| 5.00%, due 5/1/40 | 2,000,000 | 1,877,911 |
| 5.75%, due 5/1/45 | 17,020,000 | 17,073,119 |
| State of Illinois, Rebuild Illinois Program, Unlimited General Obligation | | |
| Series C | | |
| 4.00%, due 11/1/41 | 19,500,000 | 15,603,693 |
| University of Illinois, Facilities System, Revenue Bonds | | |
| Series A, Insured: BAM | | |
| 3.00%, due 4/1/37 | 3,710,000 | 2,840,914 |
| Series A, Insured: BAM | | |
| 3.00%, due 4/1/38 | 3,825,000 | 2,868,138 |
| Series A, Insured: BAM | | |
| 3.00%, due 4/1/39 | 2,435,000 | 1,792,489 |
| Series A, Insured: BAM | | |
| 3.00%, due 4/1/40 | 3,805,000 | 2,750,323 |
| Upper Illinois River Valley Development Authority, Morris Hospital Obligated Group, Revenue Bonds | | |
| 5.00%, due 12/1/48 | 14,905,000 | 14,078,503 |
| Village of Bridgeview IL, Unlimited General Obligation | | |
| Series A | | |
| 5.125%, due 12/1/44 | 100,000 | 85,323 |
| Series A | | |
| 5.50%, due 12/1/43 | 1,545,000 | 1,394,890 |
| Series A | | |
| 5.50%, due 12/1/43 | 1,260,000 | 1,137,580 |
| Series A | | |
| 5.625%, due 12/1/41 | 3,940,000 | 3,658,165 |
| Series A | | |
| 5.75%, due 12/1/35 | 2,705,000 | 2,626,335 |
| Village of Oak Lawn IL, Corporate Purpose, Unlimited General Obligation | | |
| Insured: NATL-RE | | |
| 4.40%, due 12/1/26 | 400,000 | 399,376 |
| Insured: NATL-RE | | |
| 4.45%, due 12/1/28 | 430,000 | 427,541 |
| Insured: NATL-RE | | |
| 4.50%, due 12/1/30 | 475,000 | 459,130 |
The notes to the financial statements are an integral part of, and should be read in conjunction with, the financial statements.
31
Portfolio of Investments October 31, 2022† (continued)
| | Principal
Amount | Value |
| Long-Term Municipal Bonds (continued) |
| Illinois (continued) |
| Village of Oak Lawn IL, Corporate Purpose, Unlimited General Obligation (continued) | | |
| Insured: NATL-RE | | |
| 4.50%, due 12/1/32 | $ 520,000 | $ 512,819 |
| Insured: NATL-RE | | |
| 4.50%, due 12/1/34 | 575,000 | 551,687 |
| Village of Riverdale IL, Unlimited General Obligation | | |
| 8.00%, due 10/1/36 | 1,660,000 | 1,662,728 |
| Village of Romeoville IL, Lewis University, Revenue Bonds | | |
| Series B | | |
| 4.125%, due 10/1/41 | 1,000,000 | 864,720 |
| Series B | | |
| 4.125%, due 10/1/46 | 2,100,000 | 1,744,914 |
| Series B | | |
| 5.00%, due 10/1/36 | 1,000,000 | 1,004,298 |
| Series B | | |
| 5.00%, due 10/1/39 | 1,275,000 | 1,276,248 |
| | | 870,852,485 |
| Indiana 0.3% |
| City of Valparaiso IN, Pratt Paper LLC Project, Revenue Bonds | | |
| 7.00%, due 1/1/44 (b) | 5,200,000 | 5,320,423 |
| Gary Chicago International Airport Authority, Revenue Bonds | | |
| 5.00%, due 2/1/29 | 1,170,000 | 1,173,963 |
| 5.25%, due 2/1/34 | 750,000 | 753,409 |
| Indiana Finance Authority, University of Indianapolis Education Facilities Project, Revenue Bonds | | |
| 5.00%, due 10/1/43 | 2,000,000 | 1,936,540 |
| Indiana Finance Authority, BHI Senior Living, Inc., Revenue Bonds | | |
| Series A | | |
| 5.00%, due 11/15/48 | 4,750,000 | 4,207,741 |
| Series A | | |
| 5.00%, due 11/15/53 | 4,150,000 | 3,615,717 |
| | Principal
Amount | Value |
| |
| Indiana (continued) |
| Indiana Finance Authority, United States Steel Corp., Revenue Bonds | | |
| Series A | | |
| 6.75%, due 5/1/39 (b) | $ 1,250,000 | $ 1,375,453 |
| Town of Upland IN, Taylor University Project, Revenue Bonds | | |
| 4.00%, due 9/1/39 | 2,030,000 | 1,792,808 |
| 4.00%, due 9/1/46 | 3,000,000 | 2,505,805 |
| | | 22,681,859 |
| Iowa 1.0% |
| City of Coralville IA, Annual Appropriation, Revenue Bonds | | |
| Series B | | |
| 4.25%, due 5/1/37 | 890,000 | 890,000 |
| City of Coralville IA, Annual Appropriation, Tax Allocation | | |
| Series C | | |
| 4.50%, due 5/1/47 | 2,930,000 | 2,432,113 |
| City of Coralville IA, Revenue Bonds | | |
| Series C | | |
| 5.00%, due 5/1/42 | 7,000,000 | 6,183,592 |
| Iowa Finance Authority, Lifespace Communities, Inc., Revenue Bonds | | |
| Series A-1 | | |
| 4.00%, due 5/15/55 | 3,500,000 | 2,267,881 |
| Iowa Finance Authority, Iowa Fertilizer Co. LLC, Revenue Bonds | | |
| 5.00%, due 12/1/50 | 15,485,000 | 13,431,673 |
| 5.00%, due 12/1/50 (g) | 7,015,000 | 6,254,765 |
| Iowa Higher Education Loan Authority, Des Moines University Project, Revenue Bonds | | |
| 4.00%, due 10/1/45 | 3,000,000 | 2,425,230 |
| 4.00%, due 10/1/50 | 10,750,000 | 8,403,763 |
| Iowa Tobacco Settlement Authority, Capital Appreciation, Revenue Bonds | | |
| Series B-2 | | |
| (zero coupon), due 6/1/65 | 164,535,000 | 14,721,029 |
The notes to the financial statements are an integral part of, and should be read in conjunction with, the financial statements.
| 32 | MainStay MacKay High Yield Municipal Bond Fund |
| | Principal
Amount | Value |
| Long-Term Municipal Bonds (continued) |
| Iowa (continued) |
| Iowa Tobacco Settlement Authority, Revenue Bonds | | |
| Series A-2 | | |
| 4.00%, due 6/1/49 | $ 6,750,000 | $ 5,257,700 |
| Series B-1 | | |
| 4.00%, due 6/1/49 | 4,490,000 | 4,102,210 |
| State of Iowa Board of Regents, University of Iowa Hospitals & Clinics, Revenue Bonds | | |
| Series B | | |
| 3.00%, due 9/1/61 | 8,750,000 | 5,359,185 |
| Xenia Rural Water District, Capital Loan Notes, Revenue Bonds | | |
| 5.00%, due 12/1/36 | 3,000,000 | 3,196,523 |
| 5.00%, due 12/1/41 | 3,000,000 | 3,196,523 |
| | | 78,122,187 |
| Kansas 0.2% |
| City of Manhattan KS, Meadowlark Hills Retirement Community, Revenue Bonds | | |
| Series A | | |
| 4.00%, due 6/1/46 | 1,000,000 | 713,665 |
| Wyandotte County-Kansas City Unified Government, Vacation Village Project Area 4 - Major Multi-Sport Athletic Complex Project, Revenue Bonds | | |
| (zero coupon), due 9/1/34 (a) | 55,575,000 | 15,835,974 |
| | | 16,549,639 |
| Kentucky 1.0% |
| City of Campbellsville KY, Campbellsville University Project, Revenue Bonds | | |
| 5.00%, due 3/1/39 | 4,480,000 | 3,707,043 |
| City of Columbia KY, Lindsey Wilson College Project, Revenue Bonds | | |
| 5.00%, due 12/1/33 | 3,605,000 | 3,685,562 |
| City of Henderson KY, Pratt Paper LLC Project, Revenue Bonds (a)(b) | | |
| Series A | | |
| 4.45%, due 1/1/42 | 5,750,000 | 4,846,883 |
| Series B | | |
| 4.45%, due 1/1/42 | 9,250,000 | 7,797,160 |
| | Principal
Amount | Value |
| |
| Kentucky (continued) |
| City of Henderson KY, Pratt Paper LLC Project, Revenue Bonds (a)(b) (continued) | | |
| Series A | | |
| 4.70%, due 1/1/52 | $ 8,150,000 | $ 6,688,825 |
| Series B | | |
| 4.70%, due 1/1/52 | 4,350,000 | 3,570,109 |
| Kentucky Economic Development Finance Authority, Next Generation Kentucky Information Highway Project, Revenue Bonds, Senior Lien | | |
| Series A | | |
| 5.00%, due 7/1/32 | 6,200,000 | 6,206,277 |
| Kentucky Economic Development Finance Authority, Owensboro Health, Revenue Bonds | | |
| Series A | | |
| 5.00%, due 6/1/41 | 4,175,000 | 3,881,403 |
| Series A | | |
| 5.00%, due 6/1/45 | 9,475,000 | 8,525,292 |
| Kentucky Economic Development Finance Authority, CommonSpirit Health Obligated Group, Revenue Bonds | | |
| Series A-1 | | |
| 5.00%, due 8/1/44 | 4,750,000 | 4,536,254 |
| Series A-2 | | |
| 5.00%, due 8/1/44 | 3,500,000 | 3,342,503 |
| Kentucky Municipal Power Agency, Prairie State Project, Revenue Bonds | | |
| Series A | | |
| 4.00%, due 9/1/45 | 20,945,000 | 17,619,839 |
| Louisville/Jefferson County Metropolitan Government, Norton Healthcare, Inc., Revenue Bonds | | |
| Series A | | |
| 4.00%, due 10/1/34 | 1,565,000 | 1,463,733 |
| | | 75,870,883 |
| Louisiana 0.2% |
| Calcasieu Parish Memorial Hospital Service District, Lake Charles Memorial Hospital Project, Revenue Bonds | | |
| 5.00%, due 12/1/39 | 1,475,000 | 1,404,187 |
The notes to the financial statements are an integral part of, and should be read in conjunction with, the financial statements.
33
Portfolio of Investments October 31, 2022† (continued)
| | Principal
Amount | Value |
| Long-Term Municipal Bonds (continued) |
| Louisiana (continued) |
| City of New Orleans LA, Water System, Revenue Bonds | | |
| 5.00%, due 12/1/44 | $ 5,250,000 | $ 5,434,581 |
| Louisiana Local Government Environmental Facilities & Community Development Authority, Peoples of Bastrop LLC Project, Revenue Bonds | | |
| 5.625%, due 6/15/51 (a) | 2,500,000 | 1,969,310 |
| Louisiana Public Facilities Authority, Ochsner Clinic Foundation Obligated Group, Revenue Bonds | | |
| 5.00%, due 5/15/47 | 4,750,000 | 4,659,707 |
| | | 13,467,785 |
| Maine 0.1% |
| City of Portland ME, General Airport, Green Bond, Revenue Bonds | | |
| 4.00%, due 1/1/40 | 1,400,000 | 1,210,595 |
| Maine Health & Higher Educational Facilities Authority, Northern Light Health Obligated Group, Revenue Bonds | | |
| 5.00%, due 7/1/33 | 3,575,000 | 3,614,640 |
| 5.00%, due 7/1/43 | 2,590,000 | 2,618,718 |
| | | 7,443,953 |
| Maryland 1.1% |
| County of Baltimore MD, Oak Crest Village, Inc. Facility, Revenue Bonds | | |
| 4.00%, due 1/1/45 | 1,750,000 | 1,445,819 |
| 4.00%, due 1/1/50 | 2,500,000 | 2,008,388 |
| County of Frederick MD, Oakdale Lake Linganore Project, Tax Allocation | | |
| 3.75%, due 7/1/39 | 1,410,000 | 1,097,370 |
| County of Frederick MD, Mount St Mary's University, Inc., Revenue Bonds (a) | | |
| Series A | | |
| 5.00%, due 9/1/37 | 3,000,000 | 2,771,603 |
| Series A | | |
| 5.00%, due 9/1/45 | 500,000 | 434,880 |
| | Principal
Amount | Value |
| |
| Maryland (continued) |
| Maryland Economic Development Corp., Port Convington Project, Tax Allocation | | |
| 3.25%, due 9/1/30 | $ 1,250,000 | $ 1,087,442 |
| 4.00%, due 9/1/50 | 4,000,000 | 2,981,331 |
| Maryland Economic Development Corp., SSA Baltimore Project, Revenue Bonds | | |
| 3.997%, due 4/1/34 | 11,600,000 | 9,085,271 |
| Maryland Economic Development Corp., Purple Line Light Project, Green Bond, Revenue Bonds | | |
| Series B | | |
| 5.25%, due 6/30/52 (b) | 35,000,000 | 34,053,310 |
| Maryland Health & Higher Educational Facilities Authority, Adventist Healthcare, Revenue Bonds | | |
| Series B | | |
| 4.00%, due 1/1/51 | 20,310,000 | 15,527,659 |
| Maryland Health & Higher Educational Facilities Authority, Stevenson University, Inc. Project, Revenue Bonds | | |
| Series A | | |
| 4.00%, due 6/1/51 | 1,000,000 | 758,721 |
| 4.00%, due 6/1/55 | 1,000,000 | 738,478 |
| Maryland Health & Higher Educational Facilities Authority, Broadmead Issue, Revenue Bonds | | |
| Series A | | |
| 5.00%, due 7/1/38 | 1,000,000 | 1,022,557 |
| Series A | | |
| 5.00%, due 7/1/48 | 3,000,000 | 3,022,640 |
| Maryland Health & Higher Educational Facilities Authority, Meritus Medical Center Issue, Revenue Bonds | | |
| 5.00%, due 7/1/45 | 4,000,000 | 3,793,188 |
| Maryland Health & Higher Educational Facilities Authority, Green Street Academy Inc., Revenue Bonds (a) | | |
| Series A | | |
| 5.125%, due 7/1/37 | 1,260,000 | 1,146,493 |
| Series A | | |
| 5.375%, due 7/1/52 | 1,530,000 | 1,317,228 |
The notes to the financial statements are an integral part of, and should be read in conjunction with, the financial statements.
| 34 | MainStay MacKay High Yield Municipal Bond Fund |
| | Principal
Amount | Value |
| Long-Term Municipal Bonds (continued) |
| Maryland (continued) |
| Maryland Health & Higher Educational Facilities Authority, Edenwald Issue, Revenue Bonds | | |
| 5.25%, due 1/1/37 | $ 1,000,000 | $ 1,006,587 |
| | | 83,298,965 |
| Massachusetts 1.0% |
| Massachusetts Development Finance Agency, Seven Hills Foundation Obligated Group, Revenue Bonds | | |
| 4.00%, due 9/1/34 | 1,000,000 | 888,379 |
| Massachusetts Development Finance Agency, Wellforce Obligated Group, Revenue Bonds | | |
| Series A | | |
| 4.00%, due 7/1/44 | 15,200,000 | 12,044,734 |
| Series C, Insured: AGM | | |
| 4.00%, due 10/1/45 | 2,150,000 | 1,757,692 |
| Massachusetts Development Finance Agency, Equitable School Revolving Fund LLC, Revenue Bonds | | |
| Series C | | |
| 4.00%, due 11/1/51 | 1,355,000 | 1,103,361 |
| Massachusetts Development Finance Agency, Linden Ponds, Inc., Revenue Bonds (a) | | |
| 5.00%, due 11/15/33 | 3,000,000 | 3,015,268 |
| 5.125%, due 11/15/46 | 5,700,000 | 5,474,539 |
| Massachusetts Development Finance Agency, Milford Regional Medical Center, Revenue Bonds (a) | | |
| Series G | | |
| 5.00%, due 7/15/35 | 270,000 | 253,053 |
| Series G | | |
| 5.00%, due 7/15/36 | 235,000 | 218,938 |
| Series G | | |
| 5.00%, due 7/15/37 | 245,000 | 226,438 |
| Series G | | |
| 5.00%, due 7/15/46 | 1,100,000 | 948,515 |
| | Principal
Amount | Value |
| |
| Massachusetts (continued) |
| Massachusetts Development Finance Agency, Western New England University, Revenue Bonds | | |
| 5.00%, due 9/1/40 | $ 1,325,000 | $ 1,300,273 |
| 5.00%, due 9/1/45 | 1,175,000 | 1,127,414 |
| Massachusetts Development Finance Agency, Dexter Southfield, Revenue Bonds | | |
| 5.00%, due 5/1/41 | 2,750,000 | 2,787,148 |
| Massachusetts Development Finance Agency, Ascentria Care Alliance Project, Revenue Bonds | | |
| 5.00%, due 7/1/41 (a) | 3,925,000 | 3,274,780 |
| Massachusetts Development Finance Agency, UMass Dartmouth Student Housing Project, Revenue Bonds | | |
| 5.00%, due 10/1/43 | 2,000,000 | 1,660,066 |
| 5.00%, due 10/1/48 | 7,750,000 | 6,211,867 |
| 5.00%, due 10/1/54 | 15,600,000 | 12,174,452 |
| Massachusetts Development Finance Agency, UMass Memorial Health Care Obligated Group, Revenue Bonds | | |
| Series L | | |
| 5.00%, due 7/1/44 | 8,205,000 | 7,846,749 |
| Series I | | |
| 5.00%, due 7/1/46 | 2,000,000 | 1,895,941 |
| Massachusetts Development Finance Agency, UMass Boston Student Housing Project, Revenue Bonds | | |
| 5.00%, due 10/1/48 | 10,165,000 | 8,566,891 |
| Massachusetts Educational Financing Authority, Educational Loan, Revenue Bonds (b) | | |
| Series B | | |
| 2.00%, due 7/1/37 | 3,600,000 | 2,797,435 |
| Series C | | |
| 3.00%, due 7/1/51 | 4,000,000 | 2,399,690 |
| Massachusetts Educational Financing Authority, Revenue Bonds, Senior Lien | | |
| Series B | | |
| 3.00%, due 7/1/35 (b) | 1,580,000 | 1,578,015 |
| | | 79,551,638 |
The notes to the financial statements are an integral part of, and should be read in conjunction with, the financial statements.
35
Portfolio of Investments October 31, 2022† (continued)
| | Principal
Amount | Value |
| Long-Term Municipal Bonds (continued) |
| Michigan 2.1% |
| Calhoun County Hospital Finance Authority, Oaklawn Hospital, Revenue Bonds | | |
| 5.00%, due 2/15/41 | $ 3,260,000 | $ 3,012,105 |
| 5.00%, due 2/15/47 | 3,000,000 | 2,641,389 |
| Chandler Park Academy, Revenue Bonds | | |
| 5.125%, due 11/1/30 | 1,050,000 | 1,011,709 |
| 5.125%, due 11/1/35 | 605,000 | 560,650 |
| City of Detroit MI, Unlimited General Obligation | | |
| Insured: AMBAC | | |
| 4.60%, due 4/1/24 | 20,150 | 19,608 |
| 5.00%, due 4/1/27 | 850,000 | 868,961 |
| 5.00%, due 4/1/31 | 1,000,000 | 1,011,332 |
| 5.00%, due 4/1/33 | 1,200,000 | 1,203,553 |
| 5.00%, due 4/1/35 | 1,000,000 | 991,253 |
| 5.00%, due 4/1/37 | 1,100,000 | 1,080,420 |
| 5.00%, due 4/1/38 | 850,000 | 827,777 |
| Insured: AMBAC | | |
| 5.25%, due 4/1/24 | 45,725 | 44,890 |
| 5.50%, due 4/1/45 | 1,100,000 | 1,094,671 |
| 5.50%, due 4/1/50 | 2,070,000 | 2,075,387 |
| City of Detroit MI, Water Supply System, Revenue Bonds, Second Lien | | |
| Series B, Insured: NATL-RE | | |
| 5.00%, due 7/1/34 | 10,000 | 10,015 |
| Detroit Service Learning Academy, Revenue Bonds | | |
| 4.00%, due 7/1/31 | 1,930,000 | 1,705,559 |
| 4.00%, due 7/1/41 | 3,850,000 | 2,837,915 |
| Michigan Finance Authority, Tobacco Settlement Asset-Backed, Capital Appreciation, Revenue Bonds, Senior Lien | | |
| Series B | | |
| (zero coupon), due 6/1/45 | 48,800,000 | 9,831,663 |
| Michigan Finance Authority, Tobacco Settlement Asset-Backed, Revenue Bonds, Senior Lien | | |
| Series B-2, Class 2 | | |
| (zero coupon), due 6/1/65 | 190,150,000 | 12,792,379 |
| | Principal
Amount | Value |
| |
| Michigan (continued) |
| Michigan Finance Authority, Calvin University Obligated Group, Revenue Bonds | | |
| 4.00%, due 9/1/46 | $ 4,720,000 | $ 3,766,391 |
| Michigan Finance Authority, Wayne County Criminal Justice Center Project, Revenue Bonds, Senior Lien | | |
| 4.00%, due 11/1/48 | 6,750,000 | 5,672,047 |
| Michigan Finance Authority, Henry Ford Health System, Revenue Bonds | | |
| 4.00%, due 11/15/50 | 4,995,000 | 3,920,354 |
| Michigan Finance Authority, Great Lakes Water Authority Sewage Disposal System, Revenue Bonds | | |
| Series C | | |
| 5.00%, due 7/1/34 | 1,000,000 | 1,015,443 |
| Series C | | |
| 5.00%, due 7/1/35 | 2,000,000 | 2,028,373 |
| Michigan Finance Authority, Local Government Loan Program, Revenue Bonds | | |
| Series D-4 | | |
| 5.00%, due 7/1/34 | 1,000,000 | 1,011,529 |
| Michigan Finance Authority, College for Creative Studies, Revenue Bonds | | |
| 5.00%, due 12/1/36 | 1,000,000 | 972,115 |
| 5.00%, due 12/1/40 | 1,700,000 | 1,616,262 |
| 5.00%, due 12/1/45 | 4,450,000 | 4,118,429 |
| Michigan Finance Authority, Lawrence Technological University, Revenue Bonds | | |
| 5.00%, due 2/1/37 | 1,550,000 | 1,414,404 |
| 5.25%, due 2/1/32 | 3,600,000 | 3,495,730 |
| Michigan Finance Authority, Local Government Loan Program, Public Lightning Local Project, Revenue Bonds | | |
| Series B | | |
| 5.00%, due 7/1/44 | 4,000,000 | 3,761,806 |
| Michigan Finance Authority, Landmark Academy, Revenue Bonds | | |
| 5.00%, due 6/1/45 | 2,920,000 | 2,410,936 |
The notes to the financial statements are an integral part of, and should be read in conjunction with, the financial statements.
| 36 | MainStay MacKay High Yield Municipal Bond Fund |
| | Principal
Amount | Value |
| Long-Term Municipal Bonds (continued) |
| Michigan (continued) |
| Michigan Finance Authority, Presbyterian Villages of Michigan Obligated Group, Revenue Bonds | | |
| 5.50%, due 11/15/45 | $ 1,025,000 | $ 885,910 |
| Michigan Finance Authority, Universal Learning Academy, Revenue Bonds | | |
| 5.75%, due 11/1/40 | 2,630,000 | 2,513,688 |
| Michigan Finance Authority, Public School Academy-Voyageur, Revenue Bonds | | |
| 5.90%, due 7/15/46 (a) | 1,955,000 | 1,518,084 |
| Michigan Municipal Bond Authority, Local Government Loan Program, Revenue Bonds | | |
| Series A, Insured: AMBAC | | |
| 4.50%, due 5/1/31 | 305,000 | 284,910 |
| Michigan Strategic Fund, Holland Home Obligated Group, Revenue Bonds | | |
| 5.00%, due 11/15/42 | 6,015,000 | 5,583,508 |
| Michigan Strategic Fund, State of Michigan Department of Transportation, Revenue Bonds | | |
| 5.00%, due 6/30/48 (b) | 18,930,000 | 16,513,705 |
| Michigan Tobacco Settlement Finance Authority, Tobacco Settlement Asset-Backed, Capital Appreciation, Revenue Bonds | | |
| Series B | | |
| (zero coupon), due 6/1/46 | 284,930,000 | 28,327,541 |
| Series B | | |
| (zero coupon), due 6/1/52 | 23,420,000 | 2,165,113 |
| Series C | | |
| (zero coupon), due 6/1/58 | 573,230,000 | 22,687,469 |
| Richfield Public School Academy, Revenue Bonds | | |
| 4.00%, due 9/1/30 | 750,000 | 672,439 |
| Summit Academy North, Michigan Public School Academy, Revenue Bonds | | |
| 4.00%, due 11/1/41 | 2,875,000 | 2,233,830 |
| | | 162,211,252 |
| | Principal
Amount | Value |
| |
| Minnesota 1.0% |
| City of Crookston MN, Riverview Healthcare Project, Revenue Bonds | | |
| 5.00%, due 5/1/51 | $ 4,000,000 | $ 3,377,412 |
| City of Forest Lake MN, Lakes International Language Academy Project, Revenue Bonds | | |
| Series A | | |
| 5.375%, due 8/1/50 | 1,250,000 | 1,130,894 |
| City of Ham Lake MN, Parnassus Preparatory School Project, Revenue Bonds | | |
| Series A | | |
| 5.00%, due 11/1/47 | 3,500,000 | 3,025,435 |
| City of Independence MN, Global Academy Project, Revenue Bonds | | |
| Series A | | |
| 4.00%, due 7/1/51 | 1,400,000 | 972,342 |
| Series A | | |
| 4.00%, due 7/1/56 | 1,080,000 | 726,774 |
| City of Minneapolis MN, Twin Cities International School Project, Revenue Bonds | | |
| Series A | | |
| 5.00%, due 12/1/47 (a) | 3,835,000 | 3,327,374 |
| City of Rochester MN, Samaritan Bethany, Inc. Project, Revenue Bonds | | |
| Series A | | |
| 5.00%, due 8/1/48 | 2,000,000 | 1,629,306 |
| Duluth Economic Development Authority, Essentia Health Obligated Group, Revenue Bonds | | |
| Series A | | |
| 5.00%, due 2/15/53 | 15,550,000 | 14,750,212 |
| Series A | | |
| 5.25%, due 2/15/58 | 39,405,000 | 38,028,367 |
| Duluth Economic Development Authority, St. Luke's Hospital of Duluth, Revenue Bonds | | |
| Series B | | |
| 5.25%, due 6/15/42 | 4,000,000 | 3,778,839 |
| Series B | | |
| 5.25%, due 6/15/47 | 3,000,000 | 2,786,100 |
The notes to the financial statements are an integral part of, and should be read in conjunction with, the financial statements.
37
Portfolio of Investments October 31, 2022† (continued)
| | Principal
Amount | Value |
| Long-Term Municipal Bonds (continued) |
| Minnesota (continued) |
Duluth Economic Development Authority, St. Luke's Hospital of Duluth, Revenue Bonds
(continued) | | |
| Series B | | |
| 5.25%, due 6/15/52 | $ 5,000,000 | $ 4,583,200 |
| Duluth Economic Development Authority, Cambia Hills of Bethel Project, Revenue Bonds | | |
| 5.625%, due 12/1/55 (c)(e)(f) | 6,000,000 | 1,440,000 |
| | | 79,556,255 |
| Mississippi 0.1% |
| Mississippi Business Finance Corp., System Energy Resources, Inc. Project, Revenue Bonds | | |
| 2.375%, due 6/1/44 | 7,750,000 | 4,633,555 |
| Missouri 0.5% |
| Branson Industrial Development Authority, Tax Increment, Branson Landing-Retail Project, Tax Allocation | | |
| 5.50%, due 6/1/29 | 3,055,000 | 2,734,640 |
| Cape Girardeau County Industrial Development Authority, Southeast Health, Revenue Bonds | | |
| 4.00%, due 3/1/41 | 2,225,000 | 1,760,508 |
| City of Lees Summit MO, Department of Airports, Summit Fair Project, Tax Allocation | | |
| 4.875%, due 11/1/37 (a) | 3,045,000 | 2,575,939 |
| Health & Educational Facilities Authority of the State of Missouri, Maryville University of St. Louis, Revenue Bonds | | |
| Series A | | |
| 4.00%, due 6/15/41 | 3,300,000 | 2,798,598 |
| Series A | | |
| 5.00%, due 6/15/45 | 3,520,000 | 3,423,345 |
| | Principal
Amount | Value |
| |
| Missouri (continued) |
| Health & Educational Facilities Authority of the State of Missouri, Lutheran Senior Services Project, Revenue Bonds | | |
| 4.00%, due 2/1/42 | $ 3,750,000 | $ 2,896,780 |
| Health & Educational Facilities Authority of the State of Missouri, AT Still University of Health Sciences, Revenue Bonds | | |
| Series A | | |
| 4.00%, due 10/1/43 | 1,125,000 | 987,193 |
| Health & Educational Facilities Authority of the State of Missouri, Lake Regional Health System, Revenue Bonds | | |
| 4.00%, due 2/15/51 | 2,125,000 | 1,603,222 |
| Health & Educational Facilities Authority of the State of Missouri, Capital Region Medical Center, Revenue Bonds | | |
| 5.00%, due 11/1/40 | 2,000,000 | 1,659,277 |
| Kansas City Land Clearance Redevelopment Authority, Convention Center Hotel Project, Tax Allocation | | |
| Series B | | |
| 5.00%, due 2/1/40 (a) | 4,700,000 | 3,434,619 |
| Lees Summit Industrial Development Authority, Fair Community Improvement District, Special Assessment | | |
| 5.00%, due 5/1/35 | 955,000 | 826,320 |
| 6.00%, due 5/1/42 | 2,800,000 | 2,396,159 |
| Maryland Heights Industrial Development Authority, St. Louis Community Ice Center Project, Revenue Bonds | | |
| Series A | | |
| 5.00%, due 3/15/49 | 7,500,000 | 6,072,982 |
| St. Louis County Industrial Development Authority, Nazareth Living Center Project, Revenue Bonds | | |
| Series A | | |
| 5.125%, due 8/15/45 | 1,900,000 | 1,584,345 |
The notes to the financial statements are an integral part of, and should be read in conjunction with, the financial statements.
| 38 | MainStay MacKay High Yield Municipal Bond Fund |
| | Principal
Amount | Value |
| Long-Term Municipal Bonds (continued) |
| Missouri (continued) |
| St. Louis Land Clearance for Redevelopment Authority, Scottrade Center Project, Revenue Bonds | | |
| Series A | | |
| 5.00%, due 4/1/48 | $ 3,250,000 | $ 3,267,946 |
| | | 38,021,873 |
| Montana 0.2% |
| County of Gallatin MT, Bozeman Fiber Project, Revenue Bonds (a) | | |
| Series A | | |
| 4.00%, due 10/15/41 | 3,000,000 | 2,231,189 |
| Series A | | |
| 4.00%, due 10/15/51 | 4,000,000 | 2,674,186 |
| Montana Facility Finance Authority, Montana Children's Home and Hospital, Revenue Bonds | | |
| Series A | | |
| 4.00%, due 7/1/50 | 9,750,000 | 7,358,356 |
| Montana Facility Finance Authority, Kalispell Regional Medical Center, Revenue Bonds | | |
| Series B | | |
| 5.00%, due 7/1/48 | 5,515,000 | 5,204,005 |
| | | 17,467,736 |
| Nebraska 0.0% ‡ |
| County of Douglas NE, Creighton University, Revenue Bonds | | |
| Series A | | |
| 3.00%, due 7/1/51 | 2,500,000 | 1,537,372 |
| Nevada 0.3% |
| City of Reno NV, Sales Tax, Transportation Rail Access Corridor Project, Revenue Bonds | | |
| Series C | | |
| (zero coupon), due 7/1/58 (a) | 15,500,000 | 1,594,355 |
| City of Reno NV, Sales Tax, Transportation Rail Access Corridor Project, Revenue Bonds, First Lien | | |
| Series A | | |
| 4.00%, due 6/1/43 | 2,500,000 | 2,092,208 |
| | Principal
Amount | Value |
| |
| Nevada (continued) |
| City of Reno NV, Sales Tax, Revenue Bonds | | |
| Series D | | |
| (zero coupon), due 7/1/58 (a) | $ 9,000,000 | $ 845,273 |
| Las Vegas Convention & Visitors Authority, Revenue Bonds | | |
| Series B | | |
| 4.00%, due 7/1/39 | 4,460,000 | 3,998,605 |
| Series B | | |
| 4.00%, due 7/1/40 | 4,390,000 | 3,893,020 |
| Las Vegas Redevelopment Agency, Tax Allocation | | |
| 5.00%, due 6/15/45 | 2,750,000 | 2,721,344 |
| State of Nevada Department of Business & Industry, Somerset Academy of Las Vegas, Revenue Bonds (a) | | |
| Series A | | |
| 5.00%, due 12/15/38 | 1,000,000 | 936,781 |
| Series A | | |
| 5.00%, due 12/15/48 | 3,465,000 | 3,064,539 |
| Tahoe-Douglas Visitors Authority, Revenue Bonds | | |
| 5.00%, due 7/1/34 | 2,000,000 | 1,962,136 |
| 5.00%, due 7/1/40 | 2,500,000 | 2,356,806 |
| | | 23,465,067 |
| New Hampshire 0.2% |
| Manchester Housing and Redevelopment Authority, Inc., Revenue Bonds | | |
| Series B, Insured: ACA | | |
| (zero coupon), due 1/1/26 | 1,995,000 | 1,706,942 |
| Manchester Housing and Redevelopment Authority, Inc., Meals & Rooms Tax, Revenue Bonds | | |
| Series B, Insured: ACA | | |
| (zero coupon), due 1/1/27 | 2,380,000 | 1,930,561 |
| New Hampshire Business Finance Authority, Springpoint Senior Living Project, Revenue Bonds | | |
| 4.00%, due 1/1/41 | 3,175,000 | 2,575,254 |
| 4.00%, due 1/1/51 | 4,600,000 | 3,441,981 |
The notes to the financial statements are an integral part of, and should be read in conjunction with, the financial statements.
39
Portfolio of Investments October 31, 2022† (continued)
| | Principal
Amount | Value |
| Long-Term Municipal Bonds (continued) |
| New Hampshire (continued) |
| New Hampshire Business Finance Authority, Ascentria Care Alliance Project, Revenue Bonds (a) | | |
| 5.00%, due 7/1/51 | $ 2,000,000 | $ 1,531,923 |
| 5.00%, due 7/1/56 | 910,000 | 677,408 |
| New Hampshire Business Finance Authority, The Vista Project, Revenue Bonds | | |
| Series A | | |
| 5.75%, due 7/1/54 (a) | 1,500,000 | 1,320,636 |
| New Hampshire Health and Education Facilities Authority Act, Catholic Medical Center, Revenue Bonds | | |
| 5.00%, due 7/1/44 | 3,000,000 | 2,767,749 |
| New Hampshire Health and Education Facilities Authority Act, Kendal at Hanover, Revenue Bonds | | |
| 5.00%, due 10/1/46 | 1,800,000 | 1,702,875 |
| | | 17,655,329 |
| New Jersey 3.9% |
| Camden County Improvement Authority (The), Camden School Prep Project, Revenue Bonds | | |
| 5.00%, due 7/15/52 (a) | 2,000,000 | 1,775,970 |
| City of Atlantic City NJ, Unlimited General Obligation | | |
| Insured: AGM | | |
| 4.00%, due 11/1/26 | 805,000 | 802,355 |
| Essex County Improvement Authority, North Star Academy Charter School of New York Inc. Project, Revenue Bonds (a) | | |
| 4.00%, due 7/15/60 | 11,955,000 | 8,569,949 |
| Series A | | |
| 4.00%, due 8/1/60 | 3,755,000 | 2,691,418 |
| Essex County Improvement Authority, New Jersey Institute of Technology, NIJIT Student Housing Project, Revenue Bonds | | |
| Series A, Insured: BAM | | |
| 4.00%, due 8/1/60 | 2,250,000 | 1,809,652 |
| | Principal
Amount | Value |
| |
| New Jersey (continued) |
| New Jersey Economic Development Authority, Motor Vehicle Surcharge, Revenue Bonds | | |
| Series A | | |
| 4.00%, due 7/1/34 | $ 1,000,000 | $ 914,603 |
| New Jersey Economic Development Authority, New Jersey Transit Transportation Project, Revenue Bonds | | |
| Series A | | |
| 4.00%, due 11/1/39 | 2,000,000 | 1,733,620 |
| Series A | | |
| 4.00%, due 11/1/44 | 11,250,000 | 9,294,459 |
| Series A | | |
| 5.00%, due 11/1/35 | 4,500,000 | 4,523,070 |
| Series A | | |
| 5.00%, due 11/1/36 | 3,500,000 | 3,500,050 |
| New Jersey Economic Development Authority, School Facilities Construction, Revenue Bonds | | |
| Series QQQ | | |
| 4.00%, due 6/15/50 | 7,715,000 | 6,172,818 |
| Series LLL | | |
| 5.00%, due 6/15/36 | 5,250,000 | 5,252,975 |
| Series LLL | | |
| 5.00%, due 6/15/44 | 1,000,000 | 962,600 |
| Series LLL | | |
| 5.00%, due 6/15/49 | 6,840,000 | 6,532,448 |
| New Jersey Economic Development Authority, Provident Group-Kean Properties LLC, Revenue Bonds | | |
| Series A | | |
| 5.00%, due 7/1/37 | 500,000 | 446,259 |
| Series A | | |
| 5.00%, due 1/1/50 | 3,100,000 | 2,540,682 |
| New Jersey Economic Development Authority, State Government Buildings Project, Revenue Bonds | | |
| Series C | | |
| 5.00%, due 6/15/42 | 8,960,000 | 8,703,434 |
The notes to the financial statements are an integral part of, and should be read in conjunction with, the financial statements.
| 40 | MainStay MacKay High Yield Municipal Bond Fund |
| | Principal
Amount | Value |
| Long-Term Municipal Bonds (continued) |
| New Jersey (continued) |
| New Jersey Economic Development Authority, Port Newark Container Terminal LLC, Revenue Bonds | | |
| 5.00%, due 10/1/47 (b) | $ 9,750,000 | $ 9,042,730 |
| New Jersey Economic Development Authority, Provident Group-Rowan Properties LLC, Revenue Bonds | | |
| Series A | | |
| 5.00%, due 1/1/48 | 12,110,000 | 9,761,182 |
| New Jersey Economic Development Authority, The Goethals Bridge Replacement Project, Revenue Bonds (b) | | |
| 5.125%, due 1/1/34 | 3,000,000 | 2,926,794 |
| Insured: AGM | | |
| 5.125%, due 7/1/42 | 1,705,000 | 1,626,647 |
| 5.375%, due 1/1/43 | 2,000,000 | 1,925,993 |
| New Jersey Economic Development Authority, Continental Airlines, Inc. Project, Revenue Bonds | | |
| Series B | | |
| 5.625%, due 11/15/30 (b) | 10,585,000 | 10,447,339 |
| New Jersey Economic Development Authority, Team Academy Charter School Project, Revenue Bonds | | |
| 6.00%, due 10/1/43 | 2,055,000 | 2,079,601 |
| New Jersey Educational Facilities Authority, St Elizabeth University, Revenue Bonds | | |
| Series D | | |
| 5.00%, due 7/1/46 | 2,190,000 | 1,853,905 |
| New Jersey Transportation Trust Fund Authority, Transportation System, Revenue Bonds | | |
| Series 2020AA | | |
| 4.00%, due 6/15/36 | 2,750,000 | 2,482,913 |
| Series AA | | |
| 4.00%, due 6/15/38 | 10,450,000 | 9,195,260 |
| Series AA | | |
| 4.00%, due 6/15/45 | 34,455,000 | 28,329,786 |
| | Principal
Amount | Value |
| |
| New Jersey (continued) |
| New Jersey Transportation Trust Fund Authority, Revenue Bonds | | |
| Series AA | | |
| 4.00%, due 6/15/40 | $ 11,500,000 | $ 9,890,307 |
| Series A | | |
| 4.00%, due 6/15/41 | 3,000,000 | 2,553,635 |
| Series BB | | |
| 4.00%, due 6/15/46 | 8,610,000 | 7,027,874 |
| Series BB | | |
| 4.00%, due 6/15/50 | 22,355,000 | 17,886,372 |
| Series AA | | |
| 5.00%, due 6/15/50 | 9,270,000 | 8,834,928 |
| New Jersey Transportation Trust Fund Authority, Transportation Program, Revenue Bonds | | |
| Series BB | | |
| 4.00%, due 6/15/40 | 1,250,000 | 1,075,033 |
| Series BB | | |
| 4.00%, due 6/15/42 | 12,450,000 | 10,457,655 |
| Series BB | | |
| 4.00%, due 6/15/50 | 7,245,000 | 5,796,769 |
| New Jersey Turnpike Authority, Revenue Bonds | | |
| Series E | | |
| 5.00%, due 1/1/45 | 8,580,000 | 8,676,242 |
| South Jersey Port Corp., Marine Terminal, Revenue Bonds (b) | | |
| Series B | | |
| 5.00%, due 1/1/42 | 16,150,000 | 14,893,121 |
| Series B | | |
| 5.00%, due 1/1/48 | 10,460,000 | 9,329,448 |
| South Jersey Port Corp., Revenue Bonds | | |
| Series A | | |
| 5.00%, due 1/1/49 | 12,155,000 | 11,465,333 |
| South Jersey Transportation Authority, Revenue Bonds | | |
| Series A, Insured: AGM-CR | | |
| 4.00%, due 11/1/50 | 24,400,000 | 19,933,553 |
| Series A | | |
| 5.00%, due 11/1/39 | 500,000 | 501,556 |
| Series A | | |
| 5.00%, due 11/1/45 | 10,250,000 | 9,886,810 |
| Tobacco Settlement Financing Corp., Revenue Bonds | | |
| Series A | | |
| 5.00%, due 6/1/46 | 5,175,000 | 4,980,642 |
The notes to the financial statements are an integral part of, and should be read in conjunction with, the financial statements.
41
Portfolio of Investments October 31, 2022† (continued)
| | Principal
Amount | Value |
| Long-Term Municipal Bonds (continued) |
| New Jersey (continued) |
Tobacco Settlement Financing Corp., Revenue Bonds
(continued) | | |
| Series B | | |
| 5.00%, due 6/1/46 | $ 19,300,000 | $ 17,745,692 |
| | | 306,833,482 |
| New York 8.9% |
| Brooklyn Arena Local Development Corp., Barclays Center Project, Revenue Bonds | | |
| Series A, Insured: AGM | | |
| 3.00%, due 7/15/43 | 2,135,000 | 1,464,792 |
| Build NYC Resource Corp., Pratt Paper, Inc. Project, Revenue Bonds | | |
| 5.00%, due 1/1/35 (a)(b) | 1,500,000 | 1,500,811 |
| Build NYC Resource Corp., Metropolitan Lighthouse Charter School Project, Revenue Bonds | | |
| Series A | | |
| 5.00%, due 6/1/47 (a) | 1,225,000 | 1,058,656 |
| Build NYC Resource Corp., Hellenic Classical Charter Schools, Revenue Bonds | | |
| Series A | | |
| 5.00%, due 12/1/51 (a) | 2,125,000 | 1,667,273 |
| City of New Rochelle NY, Iona College Project, Revenue Bonds | | |
| Series A | | |
| 5.00%, due 7/1/40 | 3,455,000 | 3,459,820 |
| Dutchess County Local Development Corp., Bard College Project, Revenue Bonds | | |
| Series A | | |
| 5.00%, due 7/1/51 (a) | 6,700,000 | 5,723,111 |
| Erie Tobacco Asset Securitization Corp., Tobacco Settlement, Asset-Backed, Revenue Bonds | | |
| Series B | | |
| (zero coupon), due 6/1/47 | 38,000,000 | 6,747,375 |
| | Principal
Amount | Value |
| |
| New York (continued) |
| Genesee County Funding Corp. (The), Rochester Regional Health Obligated Group, Revenue Bonds | | |
| Series A | | |
| 5.25%, due 12/1/52 | $ 7,000,000 | $ 6,564,102 |
| Huntington Local Development Corp., Fountaingate Gardens Project, Revenue Bonds | | |
| Series B | | |
| 4.00%, due 7/1/27 | 5,750,000 | 5,430,708 |
| Series A | | |
| 5.25%, due 7/1/56 | 3,160,000 | 2,431,183 |
| Jefferson County Civic Facility Development Corp., Samaritan Medical Center Project, Revenue Bonds | | |
| Series A | | |
| 4.00%, due 11/1/42 | 2,075,000 | 1,578,649 |
| Series A | | |
| 4.00%, due 11/1/47 | 1,530,000 | 1,113,682 |
| Metropolitan Transportation Authority, Green Bond, Revenue Bonds | | |
| Series A-1 | | |
| 4.00%, due 11/15/45 | 31,750,000 | 25,062,066 |
| Series E | | |
| 4.00%, due 11/15/45 | 5,000,000 | 3,946,782 |
| Series A-1 | | |
| 4.00%, due 11/15/46 | 21,445,000 | 16,772,937 |
| Series A-1 | | |
| 4.00%, due 11/15/46 | 10,000,000 | 7,821,374 |
| Series A-3, Insured: AGM | | |
| 4.00%, due 11/15/46 | 7,600,000 | 6,274,621 |
| Series A-1 | | |
| 4.00%, due 11/15/47 | 5,500,000 | 4,268,751 |
| Series D-2 | | |
| 4.00%, due 11/15/47 | 16,250,000 | 12,612,218 |
| Series A-1 | | |
| 4.00%, due 11/15/48 | 6,440,000 | 4,961,431 |
| Series A-1 | | |
| 4.00%, due 11/15/49 | 43,630,000 | 33,464,101 |
| 4.00%, due 11/15/50 | 5,315,000 | 4,050,282 |
| Series A-1, Insured: AGM | | |
| 4.00%, due 11/15/50 | 8,550,000 | 6,905,125 |
| Series A-1 | | |
| 4.00%, due 11/15/50 | 800,000 | 609,466 |
The notes to the financial statements are an integral part of, and should be read in conjunction with, the financial statements.
| 42 | MainStay MacKay High Yield Municipal Bond Fund |
| | Principal
Amount | Value |
| Long-Term Municipal Bonds (continued) |
| New York (continued) |
| Metropolitan Transportation Authority, Green Bond, Revenue Bonds (continued) | | |
| Series A-1 | | |
| 4.00%, due 11/15/52 | $ 13,880,000 | $ 10,450,789 |
| Series A-1, Insured: AGM | | |
| 4.00%, due 11/15/54 | 20,285,000 | 16,115,179 |
| Series A-2 | | |
| 5.00%, due 11/15/27 | 3,150,000 | 3,195,085 |
| Series B | | |
| 5.00%, due 11/15/28 | 1,190,000 | 1,213,543 |
| Series C | | |
| 5.00%, due 11/15/42 | 5,120,000 | 4,841,834 |
| Series D-1 | | |
| 5.00%, due 11/15/44 | 14,300,000 | 13,364,427 |
| Metropolitan Transportation Authority, Revenue Bonds | | |
| Series D | | |
| 5.00%, due 11/15/27 | 2,055,000 | 2,084,413 |
| Series B | | |
| 5.00%, due 11/15/40 | 14,750,000 | 14,076,429 |
| Monroe County Industrial Development Corp., St. Ann's Community Project, Revenue Bonds | | |
| 5.00%, due 1/1/50 | 3,000,000 | 2,266,034 |
| MTA Hudson Rail Yards Trust Obligations, Election 2016, Revenue Bonds | | |
| Series A | | |
| 5.00%, due 11/15/56 | 7,150,000 | 6,951,550 |
| Nassau County Tobacco Settlement Corp., Tobacco Settlement, Asset-Backed, Revenue Bonds | | |
| Series A-3 | | |
| 5.00%, due 6/1/35 | 2,075,000 | 1,840,453 |
| Series A-3 | | |
| 5.125%, due 6/1/46 | 12,855,000 | 11,090,564 |
| New York City Industrial Development Agency, Queens Baseball Stadium Project, Revenue Bonds | | |
| Series A, Insured: AGM | | |
| 3.00%, due 1/1/46 | 12,615,000 | 8,260,028 |
| | Principal
Amount | Value |
| |
| New York (continued) |
| New York City Industrial Development Agency, Yankee Stadium Project, Revenue Bonds | | |
| Series A, Insured: AGM | | |
| 3.00%, due 3/1/49 | $ 1,750,000 | $ 1,148,752 |
| Series A, Insured: AGM-CR | | |
| 3.00%, due 3/1/49 | 17,800,000 | 11,665,995 |
| New York City Transitional Finance Authority, Future Tax Secured, Revenue Bonds | | |
| Series E-1 | | |
| 4.00%, due 2/1/49 | 59,635,000 | 50,525,217 |
| New York Convention Center Development Corp., Hotel Unit Fee, Revenue Bonds, Senior Lien | | |
| Series A | | |
| (zero coupon), due 11/15/47 | 10,000,000 | 2,444,346 |
| New York Counties Tobacco Trust V, Pass Through, Capital Appreciation, Revenue Bonds | | |
| Series S-1 | | |
| (zero coupon), due 6/1/38 | 2,500,000 | 890,239 |
| New York Liberty Development Corp., 1 World Trade Center, Revenue Bonds | | |
| Insured: BAM | | |
| 2.75%, due 2/15/44 | 14,750,000 | 9,715,014 |
| New York Liberty Development Corp., Green Bond, Revenue Bonds | | |
| Series A, Insured: BAM | | |
| 3.00%, due 11/15/51 | 3,750,000 | 2,422,606 |
| New York Liberty Development Corp., 3 World Trade Center LLC, Revenue Bonds (a) | | |
| Class 1 | | |
| 5.00%, due 11/15/44 | 45,950,000 | 40,371,992 |
| Class 2 | | |
| 5.15%, due 11/15/34 | 4,150,000 | 3,963,482 |
| Class 2 | | |
| 5.375%, due 11/15/40 | 6,200,000 | 5,914,188 |
| New York State Dormitory Authority, State Personal Income Tax, Revenue Bonds | | |
| Series A | | |
| 3.00%, due 3/15/49 | 9,750,000 | 6,545,625 |
The notes to the financial statements are an integral part of, and should be read in conjunction with, the financial statements.
43
Portfolio of Investments October 31, 2022† (continued)
| | Principal
Amount | Value |
| Long-Term Municipal Bonds (continued) |
| New York (continued) |
| New York State Dormitory Authority, Montefiore Obligated Group, Revenue Bonds | | |
| Series A | | |
| 4.00%, due 8/1/37 | $ 3,250,000 | $ 2,596,635 |
| Series A | | |
| 4.00%, due 8/1/38 | 1,750,000 | 1,379,422 |
| Series A | | |
| 4.00%, due 9/1/50 | 6,950,000 | 4,792,109 |
| New York State Dormitory Authority, NYU Langone Hospitals Obligated Group, Revenue Bonds | | |
| Series A | | |
| 4.00%, due 7/1/50 | 4,240,000 | 3,454,389 |
| Series A | | |
| 4.00%, due 7/1/53 | 4,310,000 | 3,474,919 |
| New York State Dormitory Authority, Orange Regional Medical Center Obligated Group, Revenue Bonds (a) | | |
| 5.00%, due 12/1/29 | 1,000,000 | 990,662 |
| 5.00%, due 12/1/30 | 1,200,000 | 1,184,655 |
| New York State Thruway Authority, State Personal Income Tax, Revenue Bonds | | |
| Series A-1 | | |
| 3.00%, due 3/15/48 | 8,600,000 | 5,953,069 |
| Series A-1 | | |
| 3.00%, due 3/15/51 | 43,645,000 | 29,536,902 |
| Series A-1 | | |
| 4.00%, due 3/15/53 | 15,075,000 | 12,438,443 |
| Series C | | |
| 4.125%, due 3/15/57 | 5,500,000 | 4,569,588 |
| New York State Urban Development Corp., Personal Income Tax, Revenue Bonds | | |
| Series E | | |
| 4.00%, due 3/15/43 | 6,250,000 | 5,484,900 |
| New York Transportation Development Corp., Delta Air Lines, Inc. - LaGuardia Airport Terminals C&D Redevelopment Project, Revenue Bonds (b) | | |
| 4.375%, due 10/1/45 | 56,435,000 | 46,932,915 |
| 5.00%, due 10/1/35 | 21,110,000 | 20,349,808 |
| 5.00%, due 10/1/40 | 19,880,000 | 18,755,534 |
| | Principal
Amount | Value |
| |
| New York (continued) |
| New York Transportation Development Corp., Terminal 4 JFK International Airport Project, Revenue Bonds (b) | | |
| 5.00%, due 12/1/34 | $ 10,000,000 | $ 9,557,598 |
| 5.00%, due 12/1/36 | 5,000,000 | 4,732,204 |
| 5.00%, due 12/1/38 | 12,990,000 | 12,132,283 |
| 5.00%, due 12/1/40 | 17,510,000 | 16,061,804 |
| 5.00%, due 12/1/41 | 18,500,000 | 16,799,295 |
| New York Transportation Development Corp., LaGuardia Airport Terminal B Redevelopment Project, Revenue Bonds (b) | | |
| Series A | | |
| 5.00%, due 7/1/41 | 19,985,000 | 18,688,081 |
| 5.00%, due 7/1/46 | 12,375,000 | 11,314,414 |
| New York Transportation Development Corp., American Airlines, Inc. John F. Kennedy International Airport Project, Revenue Bonds (b) | | |
| 5.25%, due 8/1/31 | 4,120,000 | 4,090,828 |
| 5.375%, due 8/1/36 | 3,445,000 | 3,354,953 |
| Oneida County Local Development Corp., Mohawk Valley Health System Project, Revenue Bonds | | |
| Series A, Insured: AGM | | |
| 3.00%, due 12/1/40 | 3,755,000 | 2,709,767 |
| Series A, Insured: AGM | | |
| 3.00%, due 12/1/44 | 6,500,000 | 4,416,664 |
| Orange County Funding Corp., Mount St. Mary College, Revenue Bonds | | |
| Series A | | |
| 5.00%, due 7/1/42 | 1,430,000 | 1,402,747 |
| Port Authority of New York & New Jersey, Revenue Bonds (b) | | |
| Series 223 | | |
| 4.00%, due 7/15/46 | 9,620,000 | 7,924,428 |
| Series 223 | | |
| 4.00%, due 7/15/51 | 2,745,000 | 2,215,903 |
| Riverhead Industrial Development Agency, Riverhead Charter School, Revenue Bonds | | |
| Series A | | |
| 7.00%, due 8/1/43 | 1,500,000 | 1,522,885 |
The notes to the financial statements are an integral part of, and should be read in conjunction with, the financial statements.
| 44 | MainStay MacKay High Yield Municipal Bond Fund |
| | Principal
Amount | Value |
| Long-Term Municipal Bonds (continued) |
| New York (continued) |
| Rockland Tobacco Asset Securitization Corp., Tobacco Settlement, Asset-Backed, Revenue Bonds | | |
| Series B | | |
| (zero coupon), due 8/15/50 (a) | $ 13,000,000 | $ 1,906,239 |
| Southold Local Development Corp., Peconic Landing, Inc. Project, Revenue Bonds | | |
| 4.00%, due 12/1/45 | 815,000 | 636,576 |
| Suffolk Tobacco Asset Securitization Corp., Tobacco Settlement, Asset Backed, Revenue Bonds | | |
| Series B-2 | | |
| (zero coupon), due 6/1/66 | 61,885,000 | 5,165,665 |
| Tompkins County Development Corp., Kendal at Ithaca Project, Revenue Bonds | | |
| Series 2014A | | |
| 5.00%, due 7/1/44 | 915,000 | 886,692 |
| Triborough Bridge & Tunnel Authority, Payroll Mobility Tax, Revenue Bonds, Senior Lien | | |
| Series C-3 | | |
| 3.00%, due 5/15/51 | 9,000,000 | 5,923,996 |
| Westchester County Local Development Corp., Pace University, Revenue Bonds | | |
| Series A | | |
| 5.50%, due 5/1/42 | 5,955,000 | 5,895,482 |
| | | 696,079,554 |
| North Carolina 0.8% |
| North Carolina Department of Transportation, I-77 Hot Lanes Project, Revenue Bonds | | |
| 5.00%, due 6/30/54 (b) | 9,750,000 | 8,787,943 |
| North Carolina Medical Care Commission, The Forest at Duke Project, Revenue Bonds | | |
| 4.00%, due 9/1/41 | 1,320,000 | 1,068,118 |
| 4.00%, due 9/1/46 | 1,585,000 | 1,218,936 |
| 4.00%, due 9/1/51 | 500,000 | 370,728 |
| | Principal
Amount | Value |
| |
| North Carolina (continued) |
| North Carolina Medical Care Commission, Plantation Village, Inc., Revenue Bonds | | |
| Series A | | |
| 4.00%, due 1/1/52 | $ 3,450,000 | $ 2,482,622 |
| North Carolina Medical Care Commission, United Methodist Retirement Homes, Revenue Bonds | | |
| Series A | | |
| 5.00%, due 10/1/47 | 3,850,000 | 4,021,347 |
| North Carolina Medical Care Commission, Pines at Davidson Project (The), Revenue Bonds | | |
| Series A | | |
| 5.00%, due 1/1/49 | 4,250,000 | 3,995,978 |
| North Carolina Turnpike Authority, Triangle Expressway System, Revenue Bonds, Senior Lien | | |
| Insured: AGM | | |
| 3.00%, due 1/1/42 | 2,370,000 | 1,720,688 |
| 5.00%, due 1/1/49 | 24,000,000 | 22,196,266 |
| Insured: AGM | | |
| 5.00%, due 1/1/49 | 4,750,000 | 4,793,165 |
| North Carolina Turnpike Authority, Monroe Expressway Toll, Revenue Bonds | | |
| Series A | | |
| 5.00%, due 7/1/51 | 2,745,000 | 2,527,684 |
| Series A | | |
| 5.00%, due 7/1/54 | 7,005,000 | 6,370,961 |
| | | 59,554,436 |
| North Dakota 0.5% |
| City of Grand Forks ND, Altru Health System Obligated Group, Revenue Bonds | | |
| Insured: AGM | | |
| 3.00%, due 12/1/46 | 5,250,000 | 3,638,900 |
| 4.00%, due 12/1/51 | 3,955,000 | 2,947,722 |
| County of Cass ND, Essentia Health Obligated Group, Revenue Bonds | | |
| Series B | | |
| 5.25%, due 2/15/53 | 9,250,000 | 9,078,478 |
The notes to the financial statements are an integral part of, and should be read in conjunction with, the financial statements.
45
Portfolio of Investments October 31, 2022† (continued)
| | Principal
Amount | Value |
| Long-Term Municipal Bonds (continued) |
| North Dakota (continued) |
| County of Ward ND, Trinity Health Obligated Group, Revenue Bonds | | |
| Series C | | |
| 5.00%, due 6/1/48 | $ 27,940,000 | $ 22,371,262 |
| | | 38,036,362 |
| Ohio 4.6% |
| Akron Bath Copley Joint Township Hospital District, Summa Health System Obligated Group, Revenue Bonds | | |
| 5.25%, due 11/15/46 | 20,225,000 | 19,241,305 |
| American Municipal Power, Inc., Prairie State Energy Campus Project, Revenue Bonds | | |
| 4.00%, due 2/15/39 | 17,795,000 | 15,730,344 |
| Buckeye Tobacco Settlement Financing Authority, Revenue Bonds, Senior Lien | | |
| Series A-2, Class 1 | | |
| 4.00%, due 6/1/48 | 1,500,000 | 1,189,412 |
| Series B-2, Class 2 | | |
| 5.00%, due 6/1/55 | 183,615,000 | 154,762,198 |
| Cleveland-Cuyahoga County Port Authority, Euclid Avenue Development Corp. Project, Revenue Bonds | | |
| 4.00%, due 8/1/44 | 12,420,000 | 10,301,446 |
| Cleveland-Cuyahoga County Port Authority, Centers for Dialysis Care Project, Revenue Bonds | | |
| Series A | | |
| 5.00%, due 12/1/42 | 4,955,000 | 4,530,818 |
| Series A | | |
| 5.00%, due 12/1/47 | 1,435,000 | 1,267,289 |
| Cleveland-Cuyahoga County Port Authority, Starwood Wasserman University Heights Holding LLC, Revenue Bonds (c)(e)(f) | | |
| Series A | | |
| 7.00%, due 12/1/18 | 710,000 | 184,600 |
| Series A | | |
| 7.35%, due 12/1/31 | 6,000,000 | 1,560,000 |
| | Principal
Amount | Value |
| |
| Ohio (continued) |
| County of Cuyahoga OH, MetroHealth System (The), Revenue Bonds | | |
| 4.75%, due 2/15/47 | $ 1,440,000 | $ 1,266,844 |
| 5.00%, due 2/15/37 | 5,100,000 | 5,080,910 |
| 5.00%, due 2/15/52 | 7,885,000 | 7,171,266 |
| 5.00%, due 2/15/57 | 8,360,000 | 7,386,417 |
| 5.50%, due 2/15/57 | 32,930,000 | 32,016,466 |
| County of Cuyahoga OH, MetroHealth System, Revenue Bonds | | |
| 5.50%, due 2/15/52 | 550,000 | 535,585 |
| County of Hamilton OH, Life Enriching Communities Project, Revenue Bonds | | |
| 5.00%, due 1/1/42 | 1,080,000 | 948,946 |
| 5.00%, due 1/1/46 | 2,090,000 | 1,795,086 |
| County of Lucas OH, Promedica Healthcare Obligated Group, Revenue Bonds | | |
| Series A | | |
| 5.25%, due 11/15/48 | 10,000,000 | 6,933,835 |
| County of Montgomery OH, Kettering Health Network Obligated Group, Revenue Bonds | | |
| 4.00%, due 8/1/51 | 3,265,000 | 2,596,003 |
| Franklin County Convention Facilities Authority, Greater Columbus Convention Center Hotel Expansion Project, Revenue Bonds | | |
| 5.00%, due 12/1/51 | 4,250,000 | 3,827,085 |
| Ohio Air Quality Development Authority, Ohio Valley Electric Corp., Revenue Bonds | | |
| Series A | | |
| 3.25%, due 9/1/29 | 1,500,000 | 1,336,624 |
| Ohio Air Quality Development Authority, Pratt Paper LLC Project, Revenue Bonds | | |
| 4.50%, due 1/15/48 (a)(b) | 3,750,000 | 3,035,984 |
| Ohio Higher Educational Facility Commission, Tiffin University Project, Revenue Bonds | | |
| 4.00%, due 11/1/49 | 4,750,000 | 3,213,120 |
| 5.00%, due 11/1/44 | 750,000 | 630,703 |
The notes to the financial statements are an integral part of, and should be read in conjunction with, the financial statements.
| 46 | MainStay MacKay High Yield Municipal Bond Fund |
| | Principal
Amount | Value |
| Long-Term Municipal Bonds (continued) |
| Ohio (continued) |
| Ohio Higher Educational Facility Commission, University of Findlay (The), Revenue Bonds | | |
| 5.00%, due 3/1/39 | $ 1,675,000 | $ 1,564,055 |
| 5.00%, due 3/1/44 | 9,360,000 | 8,500,592 |
| Ohio Higher Educational Facility Commission, Menorah Park Obligated Group, Revenue Bonds | | |
| 5.25%, due 1/1/48 | 4,045,000 | 2,870,654 |
| Ohio Higher Educational Facility Commission, Cleveland Institute of Art (The), Revenue Bonds | | |
| 5.25%, due 12/1/48 | 1,000,000 | 876,725 |
| 5.50%, due 12/1/53 | 1,215,000 | 1,089,139 |
| State of Ohio, University Hospitals Health System, Revenue Bonds | | |
| Series A | | |
| 4.00%, due 1/15/50 | 52,375,000 | 41,142,778 |
| Toledo-Lucas County Port Authority, University of Toledo Parking Project, Revenue Bonds | | |
| 4.00%, due 1/1/57 | 6,250,000 | 4,365,892 |
| Toledo-Lucas County Port Authority, University of Toledo Project, Revenue Bonds | | |
| Series A | | |
| 5.00%, due 7/1/34 | 1,400,000 | 1,319,498 |
| Series A | | |
| 5.00%, due 7/1/39 | 2,000,000 | 1,818,433 |
| Series A | | |
| 5.00%, due 7/1/46 | 9,540,000 | 8,233,910 |
| | | 358,323,962 |
| Oklahoma 0.1% |
| Norman Regional Hospital Authority, Norman Regional Hospital Authority Obligated Group, Revenue Bonds | | |
| 4.00%, due 9/1/37 | 2,215,000 | 1,877,673 |
| 5.00%, due 9/1/37 | 3,500,000 | 3,432,856 |
| | Principal
Amount | Value |
| |
| Oklahoma (continued) |
| Oklahoma Development Finance Authority, Provident Oklahoma Education Resources, Inc. Cross Village Student Housing Project, Revenue Bonds (e)(f) | | |
| Series A | | |
| 5.00%, due 8/1/47 | $ 6,525,171 | $ 6,525 |
| Series A | | |
| 5.25%, due 8/1/57 | 8,192,966 | 8,193 |
| Tulsa County Industrial Authority, Montereau, Inc., Project, Revenue Bonds | | |
| 5.25%, due 11/15/45 | 1,250,000 | 1,192,180 |
| | | 6,517,427 |
| Oregon 0.1% |
| Astoria Hospital Facilities Authority, Columbia Memorial Hospital Obligated Group, Revenue Bonds | | |
| 3.50%, due 8/1/42 | 845,000 | 640,627 |
| County of Yamhill OR, George Fox University Project, Revenue Bonds | | |
| 4.00%, due 12/1/51 | 3,200,000 | 2,529,458 |
| Medford Hospital Facilities Authority, Rogue Valley Manor, Revenue Bonds | | |
| Series 2013A | | |
| 5.00%, due 10/1/42 | 4,355,000 | 4,364,260 |
| Oregon State Facilities Authority, Samaritan Health, Revenue Bonds | | |
| Series A | | |
| 5.00%, due 10/1/46 | 2,810,000 | 2,604,098 |
| Oregon State Facilities Authority, College Housing Northwest Project, Revenue Bonds | | |
| Series A | | |
| 5.00%, due 10/1/48 (a) | 1,560,000 | 1,288,763 |
| | | 11,427,206 |
| Pennsylvania 4.5% |
| Allegheny County Airport Authority, Revenue Bonds (b) | | |
| Series A, Insured: AGM | | |
| 4.00%, due 1/1/46 | 6,525,000 | 5,257,899 |
| Series A, Insured: AGM-CR | | |
| 4.00%, due 1/1/56 | 34,650,000 | 26,829,949 |
The notes to the financial statements are an integral part of, and should be read in conjunction with, the financial statements.
47
Portfolio of Investments October 31, 2022† (continued)
| | Principal
Amount | Value |
| Long-Term Municipal Bonds (continued) |
| Pennsylvania (continued) |
| Allegheny County Hospital Development Authority, Allegheny Health Network Obligated Group, Revenue Bonds | | |
| Series A | | |
| 4.00%, due 4/1/44 | $ 16,100,000 | $ 13,180,991 |
| Allegheny County Industrial Development Authority, Urban Academy of Greater Pittsburgh Charter School, Revenue Bonds | | |
| Series A | | |
| 4.00%, due 6/15/41 (a) | 1,895,000 | 1,424,456 |
| Allegheny County Industrial Development Authority, Propel Charter School - Sunrise, Revenue Bonds | | |
| 6.00%, due 7/15/38 | 3,100,000 | 3,127,710 |
| Allentown Neighborhood Improvement Zone Development Authority, City Center Project, Revenue Bonds (a) | | |
| 5.00%, due 5/1/42 | 14,950,000 | 12,822,802 |
| 5.00%, due 5/1/42 | 6,565,000 | 5,630,883 |
| 5.125%, due 5/1/32 | 4,300,000 | 3,998,186 |
| 5.25%, due 5/1/42 | 1,110,000 | 970,173 |
| 5.375%, due 5/1/42 | 4,225,000 | 3,742,592 |
| Allentown Neighborhood Improvement Zone Development Authority, Revenue Bonds | | |
| 5.00%, due 5/1/42 | 3,500,000 | 3,095,459 |
| 6.00%, due 5/1/42 (a) | 4,500,000 | 4,244,294 |
| Bucks County Industrial Development Authority, Grand View Hospital Project, Revenue Bonds | | |
| 4.00%, due 7/1/46 | 10,150,000 | 7,094,080 |
| 5.00%, due 7/1/40 | 3,155,000 | 2,776,362 |
| Cambria County General Financing Authority, St. Francis University, Revenue Bonds | | |
| Series TT5 | | |
| 4.00%, due 4/1/46 | 2,035,000 | 1,575,198 |
| | Principal
Amount | Value |
| |
| Pennsylvania (continued) |
| Chambersburg Area Municipal Authority, Wilson College, Revenue Bonds | | |
| 5.50%, due 10/1/33 | $ 1,230,000 | $ 1,171,738 |
| 5.75%, due 10/1/38 | 3,450,000 | 3,231,230 |
| 5.75%, due 10/1/43 | 2,290,000 | 2,077,984 |
| Chester County Industrial Development Authority, Woodlands at Greystone Project, Special Assessment | | |
| 5.125%, due 3/1/48 (a) | 944,000 | 838,169 |
| City of Erie PA Higher Education Building Authority, Mercyhurst University Project, Revenue Bonds (a) | | |
| 5.00%, due 9/15/27 | 705,000 | 684,509 |
| 5.00%, due 9/15/28 | 740,000 | 714,746 |
| 5.00%, due 9/15/29 | 150,000 | 143,854 |
| 5.00%, due 9/15/37 | 640,000 | 675,216 |
| 5.00%, due 9/15/37 | 2,755,000 | 2,387,074 |
| Commonwealth Financing Authority, Tobacco Master Settlement Payment, Revenue Bonds | | |
| Insured: AGM | | |
| 4.00%, due 6/1/39 | 13,700,000 | 12,493,482 |
| Cumberland County Municipal Authority, Revenue Bonds | | |
| Series A | | |
| 5.00%, due 1/1/39 | 195,000 | 210,862 |
| Series A | | |
| 5.00%, due 1/1/39 | 1,805,000 | 1,769,593 |
| Dauphin County General Authority, Harrisburg University Science Technology Project (The), Revenue Bonds (a) | | |
| 5.00%, due 10/15/34 | 5,850,000 | 5,327,832 |
| 5.125%, due 10/15/41 | 4,700,000 | 4,098,493 |
| 5.875%, due 10/15/40 | 3,700,000 | 3,547,549 |
| 6.25%, due 10/15/53 | 9,250,000 | 8,919,128 |
| Delaware County Authority, Cabrini University, Revenue Bonds | | |
| 5.00%, due 7/1/42 | 1,405,000 | 1,228,559 |
| Franklin County Industrial Development Authority, Menno-Haven, Inc. Project, Revenue Bonds | | |
| 5.00%, due 12/1/39 | 375,000 | 309,703 |
The notes to the financial statements are an integral part of, and should be read in conjunction with, the financial statements.
| 48 | MainStay MacKay High Yield Municipal Bond Fund |
| | Principal
Amount | Value |
| Long-Term Municipal Bonds (continued) |
| Pennsylvania (continued) |
| Franklin County Industrial Development Authority, Menno-Haven, Inc. Project, Revenue Bonds (continued) | | |
| 5.00%, due 12/1/49 | $ 1,020,000 | $ 794,091 |
| General Authority of Southcentral Pennsylvania, York Academy Regional Charter School Project, Revenue Bonds (a) | | |
| Series A | | |
| 6.00%, due 7/15/38 | 2,930,000 | 2,938,089 |
| Series A | | |
| 6.50%, due 7/15/48 | 4,200,000 | 4,259,254 |
| Huntingdon County General Authority, AICUP Financing Program, Revenue Bonds | | |
| Series OO2 | | |
| 5.00%, due 5/1/46 | 4,005,000 | 4,012,473 |
| Lancaster County Hospital Authority, St. Anne's Retirement Community, Inc. Project, Revenue Bonds | | |
| 5.00%, due 3/1/45 | 500,000 | 404,186 |
| 5.00%, due 3/1/50 | 750,000 | 587,943 |
| Lancaster Higher Education Authority, Elizabethtown College Project, Revenue Bonds | | |
| Series A | | |
| 5.00%, due 10/1/51 | 3,000,000 | 2,652,049 |
| Lancaster Industrial Development Authority, Willow Valley Communities Project, Revenue Bonds | | |
| 4.00%, due 12/1/44 | 1,550,000 | 1,351,262 |
| 4.00%, due 12/1/49 | 1,900,000 | 1,607,924 |
| 5.00%, due 12/1/44 | 1,675,000 | 1,695,766 |
| 5.00%, due 12/1/49 | 2,365,000 | 2,383,735 |
| Lancaster Industrial Development Authority, Landis Homes Retirement Community, Revenue Bonds | | |
| 4.00%, due 7/1/56 | 2,780,000 | 1,952,379 |
| Montgomery County Higher Education and Health Authority, Thomas Jefferson University Project, Revenue Bonds | | |
| 4.00%, due 9/1/44 | 3,000,000 | 2,549,640 |
| | Principal
Amount | Value |
| |
| Pennsylvania (continued) |
Montgomery County Higher Education and Health Authority, Thomas Jefferson University Project, Revenue Bonds
(continued) | | |
| 4.00%, due 9/1/49 | $ 16,910,000 | $ 13,966,113 |
| Series A | | |
| 4.00%, due 9/1/49 | 1,660,000 | 1,373,444 |
| 4.00%, due 9/1/51 | 4,000,000 | 3,169,149 |
| Montgomery County Higher Education and Health Authority, Philadelphia Presbyterian Homes Project, Revenue Bonds | | |
| 4.00%, due 12/1/48 | 3,995,000 | 2,965,051 |
| Montgomery County Higher Education and Health Authority, Thomas Jefferson University, Revenue Bonds | | |
| Series B | | |
| 5.00%, due 5/1/57 | 9,750,000 | 9,093,633 |
| Montgomery County Industrial Development Authority, ACTS Retirement-Life Communities, Inc. Obligated Group, Revenue Bonds | | |
| 5.00%, due 11/15/36 | 4,750,000 | 4,582,708 |
| New Wilmington Municipal Authority, Westminster College Project, Revenue Bonds | | |
| Series PP1 | | |
| 5.25%, due 5/1/46 | 3,700,000 | 3,700,747 |
| Northeastern Pennsylvania Hospital and Education Authority, King's College Project, Revenue Bonds | | |
| 5.00%, due 5/1/44 | 1,000,000 | 911,339 |
| 5.00%, due 5/1/49 | 1,350,000 | 1,203,513 |
| Pennsylvania Economic Development Financing Authority, Rapid Bridge Replacement Project, Revenue Bonds | | |
| 4.125%, due 12/31/38 | 4,000,000 | 3,355,392 |
| Pennsylvania Higher Educational Facilities Authority, University of Pennsylvania Health System, Revenue Bonds | | |
| 4.00%, due 8/15/49 | 10,085,000 | 8,542,089 |
The notes to the financial statements are an integral part of, and should be read in conjunction with, the financial statements.
49
Portfolio of Investments October 31, 2022† (continued)
| | Principal
Amount | Value |
| Long-Term Municipal Bonds (continued) |
| Pennsylvania (continued) |
| Pennsylvania Higher Educational Facilities Authority, Holy Family University, Revenue Bonds | | |
| Series A | | |
| 6.25%, due 9/1/33 | $ 1,560,000 | $ 1,596,889 |
| Series A | | |
| 6.50%, due 9/1/38 | 1,000,000 | 1,025,261 |
| Pennsylvania Turnpike Commission, Revenue Bonds | | |
| Series B | | |
| 4.00%, due 12/1/46 | 6,770,000 | 5,587,692 |
| Series A, Insured: BAM | | |
| 4.00%, due 12/1/50 | 46,765,000 | 39,302,035 |
| Series A | | |
| 4.00%, due 12/1/51 | 8,940,000 | 7,550,770 |
| Series B | | |
| 4.00%, due 12/1/51 | 335,000 | 273,557 |
| Series C | | |
| 4.00%, due 12/1/51 | 13,935,000 | 11,769,572 |
| Series C | | |
| 5.00%, due 12/1/44 | 16,135,000 | 16,136,844 |
| Philadelphia Authority for Industrial Development, Russell Byers Charter School, Revenue Bonds | | |
| Series A | | |
| 5.00%, due 5/1/40 | 1,105,000 | 1,050,477 |
| Series A | | |
| 5.00%, due 5/1/50 | 3,130,000 | 2,849,348 |
| Philadelphia Authority for Industrial Development, MaST Charter School Project, Revenue Bonds | | |
| Series A | | |
| 5.00%, due 8/1/40 | 600,000 | 565,531 |
| Series A | | |
| 5.00%, due 8/1/50 | 1,050,000 | 945,919 |
| Philadelphia Authority for Industrial Development, University of the Arts (The), Revenue Bonds | | |
| 5.00%, due 3/15/45 (a) | 5,250,000 | 4,420,168 |
| Philadelphia Authority for Industrial Development, Philadelphia Performing Arts Charter School, Revenue Bonds | | |
| Series A | | |
| 5.00%, due 6/15/50 (a) | 1,700,000 | 1,423,953 |
| | Principal
Amount | Value |
| |
| Pennsylvania (continued) |
| Philadelphia Authority for Industrial Development, International Education & Community Initiatives Project, Revenue Bonds (a) | | |
| Series A | | |
| 5.125%, due 6/1/38 | $ 2,000,000 | $ 1,814,923 |
| Series A | | |
| 5.25%, due 6/1/48 | 3,085,000 | 2,665,370 |
| Philadelphia Authority for Industrial Development, Greater Philadelphia Health Action, Inc., Revenue Bonds | | |
| Series A | | |
| 6.50%, due 6/1/45 | 2,200,000 | 2,080,679 |
| Philadelphia Authority for Industrial Development, First Philadelphia Preparatory Charter School, Revenue Bonds | | |
| Series A | | |
| 7.25%, due 6/15/43 | 4,200,000 | 4,364,158 |
| Philadelphia Authority for Industrial Development, Tacony Academy Charter School, Revenue Bonds | | |
| 7.375%, due 6/15/43 | 1,500,000 | 1,525,391 |
| Scranton Redevelopment Authority, Revenue Bonds | | |
| Series A, Insured: MUN GOVT GTD | | |
| 5.00%, due 11/15/28 | 8,750,000 | 8,198,409 |
| Scranton-Lackawanna Health and Welfare Authority, Marywood University Project, Revenue Bonds | | |
| 5.00%, due 6/1/36 | 1,000,000 | 914,904 |
| 5.00%, due 6/1/46 | 2,625,000 | 2,225,719 |
| Susquehanna Area Regional Airport Authority, Revenue Bonds | | |
| Series B, Insured: BAM | | |
| 4.00%, due 1/1/33 | 3,000,000 | 2,845,959 |
| Wilkes-Barre Finance Authority, Wilkes University Project, Revenue Bonds | | |
| 4.00%, due 3/1/42 | 2,500,000 | 1,921,614 |
| | | 348,707,866 |
The notes to the financial statements are an integral part of, and should be read in conjunction with, the financial statements.
| 50 | MainStay MacKay High Yield Municipal Bond Fund |
| | Principal
Amount | Value |
| Long-Term Municipal Bonds (continued) |
| Puerto Rico 12.6% |
| Children's Trust Fund, Asset-Backed, Revenue Bonds | | |
| Series A | | |
| (zero coupon), due 5/15/50 | $ 44,000,000 | $ 7,582,788 |
| Series B | | |
| (zero coupon), due 5/15/57 | 98,000,000 | 4,223,222 |
| 5.375%, due 5/15/33 | 220,000 | 219,987 |
| 5.50%, due 5/15/39 | 1,475,000 | 1,474,903 |
| 5.625%, due 5/15/43 | 36,990,000 | 36,987,429 |
| Commonwealth of Puerto Rico, Unlimited General Obligation | | |
| Series A-1 | | |
| (zero coupon), due 7/1/24 | 6,925,453 | 6,302,078 |
| Series A-1 | | |
| (zero coupon), due 7/1/33 | 26,622,270 | 13,570,319 |
| Series A-1 | | |
| 4.00%, due 7/1/33 | 25,445,206 | 21,584,916 |
| Series A-1 | | |
| 4.00%, due 7/1/35 | 48,787,833 | 39,986,874 |
| Series A-1 | | |
| 4.00%, due 7/1/41 | 22,921,604 | 17,491,877 |
| Series A-1 | | |
| 4.00%, due 7/1/46 | 10,341,254 | 7,533,187 |
| Series A-1 | | |
| 5.375%, due 7/1/25 | 7,639,625 | 7,640,865 |
| Series A-1 | | |
| 5.625%, due 7/1/27 | 17,679,294 | 17,825,436 |
| Series A-1 | | |
| 5.625%, due 7/1/29 | 17,743,021 | 17,875,091 |
| Series A-1 | | |
| 5.75%, due 7/1/31 | 21,553,851 | 21,727,381 |
| Commonwealth of Puerto Rico | | |
| (zero coupon), due 11/1/43 | 104,247,000 | 47,693,002 |
| GDB Debt Recovery Authority of Puerto Rico, Revenue Bonds | | |
| 7.50%, due 8/20/40 | 113,630,829 | 98,148,629 |
| Puerto Rico Commonwealth Aqueduct & Sewer Authority, Revenue Bonds, Senior Lien (a) | | |
| Series C | | |
| 3.50%, due 7/1/26 | 14,800,000 | 13,483,096 |
| Series A | | |
| 5.00%, due 7/1/27 | 345,000 | 338,915 |
| Series 2020A | | |
| 5.00%, due 7/1/30 | 41,705,000 | 39,959,283 |
| Series 2020A | | |
| 5.00%, due 7/1/35 | 37,100,000 | 34,100,443 |
| | Principal
Amount | Value |
| |
| Puerto Rico (continued) |
Puerto Rico Commonwealth Aqueduct & Sewer Authority, Revenue Bonds, Senior Lien (a)
(continued) | | |
| Series A | | |
| 5.00%, due 7/1/37 | $ 6,000,000 | $ 5,423,025 |
| Series A | | |
| 5.00%, due 7/1/47 | 98,880,000 | 84,743,304 |
| Puerto Rico Commonwealth Aqueduct & Sewer Authority, Revenue Bonds (a) | | |
| Series B | | |
| 5.00%, due 7/1/33 | 12,115,000 | 11,314,655 |
| Series B | | |
| 5.00%, due 7/1/37 | 28,830,000 | 26,057,635 |
| Puerto Rico Electric Power Authority, Revenue Bonds | | |
| Series DDD | | |
| 3.30%, due 7/1/19 (c)(e)(f) | 1,015,000 | 743,487 |
| Series ZZ | | |
| 4.25%, due 7/1/20 (c)(e)(f) | 1,355,000 | 997,619 |
| Series CCC | | |
| 4.25%, due 7/1/23 (e)(f) | 1,150,000 | 861,062 |
| Series CCC | | |
| 4.375%, due 7/1/22 (c)(e)(f) | 115,000 | 85,531 |
| Series CCC | | |
| 4.60%, due 7/1/24 (e)(f) | 200,000 | 149,750 |
| Series CCC | | |
| 4.625%, due 7/1/25 (e)(f) | 1,085,000 | 812,394 |
| Series XX | | |
| 4.75%, due 7/1/26 (e)(f) | 320,000 | 239,600 |
| Series ZZ | | |
| 4.75%, due 7/1/27 (e)(f) | 405,000 | 303,244 |
| Series A | | |
| 4.80%, due 7/1/29 (e)(f) | 690,000 | 516,638 |
| Series DDD | | |
| 5.00%, due 7/1/20 (c)(e)(f) | 3,250,000 | 2,429,375 |
| Series TT | | |
| 5.00%, due 7/1/20 (c)(e)(f) | 2,195,000 | 1,640,762 |
| Series CCC | | |
| 5.00%, due 7/1/21 (c)(e)(f) | 470,000 | 351,325 |
| Series DDD | | |
| 5.00%, due 7/1/21 (c)(e)(f) | 275,000 | 205,563 |
| Series TT | | |
| 5.00%, due 7/1/21 (c)(e)(f) | 1,215,000 | 908,212 |
| Series RR, Insured: NATL-RE | | |
| 5.00%, due 7/1/23 | 4,330,000 | 4,326,349 |
The notes to the financial statements are an integral part of, and should be read in conjunction with, the financial statements.
51
Portfolio of Investments October 31, 2022† (continued)
| | Principal
Amount | Value |
| Long-Term Municipal Bonds (continued) |
| Puerto Rico (continued) |
Puerto Rico Electric Power Authority, Revenue Bonds
(continued) | | |
| Series TT | | |
| 5.00%, due 7/1/23 (e)(f) | $ 365,000 | $ 274,663 |
| Series CCC | | |
| 5.00%, due 7/1/24 (e)(f) | 1,845,000 | 1,388,362 |
| Series RR, Insured: NATL-RE | | |
| 5.00%, due 7/1/24 | 115,000 | 114,775 |
| Series TT | | |
| 5.00%, due 7/1/24 (e)(f) | 295,000 | 221,988 |
| Series CCC | | |
| 5.00%, due 7/1/25 (e)(f) | 575,000 | 432,688 |
| Series SS, Insured: NATL-RE | | |
| 5.00%, due 7/1/25 | 770,000 | 766,481 |
| Series TT | | |
| 5.00%, due 7/1/25 (e)(f) | 1,030,000 | 775,075 |
| Series TT | | |
| 5.00%, due 7/1/26 (e)(f) | 1,050,000 | 790,125 |
| Series TT, Insured: AGM-CR | | |
| 5.00%, due 7/1/27 | 150,000 | 152,804 |
| Series TT | | |
| 5.00%, due 7/1/27 (e)(f) | 1,250,000 | 940,625 |
| Series WW | | |
| 5.00%, due 7/1/28 (e)(f) | 380,000 | 285,950 |
| Series TT | | |
| 5.00%, due 7/1/32 (e)(f) | 9,320,000 | 7,013,300 |
| Series A | | |
| 5.00%, due 7/1/42 (e)(f) | 8,755,000 | 6,588,137 |
| Series A | | |
| 5.05%, due 7/1/42 (e)(f) | 825,000 | 618,750 |
| Series ZZ | | |
| 5.25%, due 7/1/20 (c)(e)(f) | 225,000 | 168,188 |
| Series ZZ | | |
| 5.25%, due 7/1/23 (e)(f) | 620,000 | 466,550 |
| Series AAA | | |
| 5.25%, due 7/1/24 (e)(f) | 3,000,000 | 2,257,500 |
| Series WW | | |
| 5.25%, due 7/1/25 (e)(f) | 1,605,000 | 1,207,762 |
| Series AAA | | |
| 5.25%, due 7/1/26 (e)(f) | 110,000 | 82,775 |
| Series ZZ | | |
| 5.25%, due 7/1/26 (e)(f) | 3,520,000 | 2,648,800 |
| Series VV, Insured: NATL-RE | | |
| 5.25%, due 7/1/29 | 630,000 | 625,219 |
| Series AAA | | |
| 5.25%, due 7/1/30 (e)(f) | 985,000 | 741,212 |
| | Principal
Amount | Value |
| |
| Puerto Rico (continued) |
Puerto Rico Electric Power Authority, Revenue Bonds
(continued) | | |
| Series VV, Insured: NATL-RE | | |
| 5.25%, due 7/1/30 | $ 3,850,000 | $ 3,808,601 |
| Series VV, Insured: NATL-RE | | |
| 5.25%, due 7/1/32 | 345,000 | 338,751 |
| Series WW | | |
| 5.25%, due 7/1/33 (e)(f) | 8,310,000 | 6,253,275 |
| Series XX | | |
| 5.25%, due 7/1/35 (e)(f) | 2,265,000 | 1,704,412 |
| Series XX | | |
| 5.25%, due 7/1/40 (e)(f) | 18,255,000 | 13,736,887 |
| Series BBB | | |
| 5.40%, due 7/1/28 (e)(f) | 9,615,000 | 7,235,287 |
| Series WW | | |
| 5.50%, due 7/1/38 (e)(f) | 11,595,000 | 8,768,719 |
| Series XX | | |
| 5.75%, due 7/1/36 (e)(f) | 4,055,000 | 3,081,800 |
| Series A | | |
| 6.75%, due 7/1/36 (e)(f) | 11,550,000 | 8,864,625 |
| Series A | | |
| 7.00%, due 7/1/33 (e)(f) | 1,500,000 | 1,155,000 |
| Series A | | |
| 7.00%, due 7/1/43 (e)(f) | 4,750,000 | 3,645,625 |
| Puerto Rico Electric Power Authority, Build America Bonds, Revenue Bonds (e)(f) | | |
| Series EEE | | |
| 5.95%, due 7/1/30 | 25,885,000 | 19,543,175 |
| Series EEE | | |
| 6.05%, due 7/1/32 | 12,265,000 | 9,260,075 |
| Series YY | | |
| 6.125%, due 7/1/40 | 45,450,000 | 34,314,750 |
| Series EEE | | |
| 6.25%, due 7/1/40 | 10,165,000 | 7,674,575 |
| Puerto Rico Highway & Transportation Authority, Revenue Bonds | | |
| Insured: AMBAC | | |
| (zero coupon), due 7/1/27 | 200,000 | 156,743 |
| Series A, Insured: NATL-RE | | |
| 4.75%, due 7/1/38 | 1,070,000 | 1,003,489 |
| Series A, Insured: AGM-CR | | |
| 4.75%, due 7/1/38 | 650,000 | 650,126 |
| Insured: AGC-ICC | | |
| 5.00%, due 7/1/23 | 2,870,000 | 2,890,023 |
The notes to the financial statements are an integral part of, and should be read in conjunction with, the financial statements.
| 52 | MainStay MacKay High Yield Municipal Bond Fund |
| | Principal
Amount | Value |
| Long-Term Municipal Bonds (continued) |
| Puerto Rico (continued) |
| Puerto Rico Highway & Transportation Authority, Revenue Bonds (continued) | | |
| Insured: NATL-RE | | |
| 5.00%, due 7/1/28 | $ 460,000 | $ 451,806 |
| Series N, Insured: AMBAC | | |
| 5.25%, due 7/1/30 | 3,680,000 | 3,588,043 |
| Series N, Insured: AMBAC | | |
| 5.25%, due 7/1/31 | 9,045,000 | 8,790,040 |
| Series N, Insured: NATL-RE | | |
| 5.25%, due 7/1/33 | 7,240,000 | 7,083,443 |
| Series CC, Insured: NATL-RE | | |
| 5.50%, due 7/1/28 | 6,750,000 | 6,792,687 |
| Series CC, Insured: NATL-RE | | |
| 5.50%, due 7/1/29 | 4,760,000 | 4,789,754 |
| Puerto Rico Municipal Finance Agency, Revenue Bonds | | |
| Series A, Insured: AGM | | |
| 5.00%, due 8/1/27 | 2,530,000 | 2,566,041 |
| Puerto Rico Sales Tax Financing Corp., Revenue Bonds | | |
| Series A-1 | | |
| (zero coupon), due 7/1/31 | 1,842,000 | 1,126,407 |
| (zero coupon), due 8/1/54 | 516,302 | 128,330 |
| Series A-2 | | |
| 4.329%, due 7/1/40 | 14,750,000 | 12,407,749 |
| Series A-1 | | |
| 4.50%, due 7/1/34 | 725,000 | 659,127 |
| Series A-1 | | |
| 4.75%, due 7/1/53 | 28,272,000 | 23,650,908 |
| Series A-2 | | |
| 4.784%, due 7/1/58 | 24,965,000 | 20,675,247 |
| Series A-1 | | |
| 5.00%, due 7/1/58 | 153,147,000 | 131,704,598 |
| | | 984,921,098 |
| Rhode Island 0.3% |
| Providence Redevelopment Agency, Port Providence Lease, Certificate of Participation | | |
| Series A, Insured: AGC | | |
| (zero coupon), due 9/1/24 | 1,735,000 | 1,609,365 |
| Series A, Insured: AGC | | |
| (zero coupon), due 9/1/26 | 685,000 | 582,272 |
| Series A, Insured: AGC | | |
| (zero coupon), due 9/1/29 | 1,835,000 | 1,363,861 |
| | Principal
Amount | Value |
| |
| Rhode Island (continued) |
Providence Redevelopment Agency, Port Providence Lease, Certificate of Participation
(continued) | | |
| Series A, Insured: AGC | | |
| (zero coupon), due 9/1/30 | $ 1,835,000 | $ 1,296,905 |
| Series A, Insured: AGC | | |
| (zero coupon), due 9/1/32 | 1,500,000 | 953,924 |
| Series A, Insured: AGC | | |
| (zero coupon), due 9/1/34 | 1,000,000 | 568,856 |
| Series A, Insured: AGC | | |
| (zero coupon), due 9/1/35 | 360,000 | 193,016 |
| Series A, Insured: AGC | | |
| (zero coupon), due 9/1/36 | 470,000 | 239,154 |
| Rhode Island Health and Educational Building Corp., Lifespan Obligated Group, Revenue Bonds | | |
| 5.00%, due 5/15/39 | 750,000 | 706,959 |
| Rhode Island Turnpike & Bridge Authority, Motor Fuel Tax, Revenue Bonds | | |
| Series A | | |
| 4.00%, due 10/1/44 | 1,500,000 | 1,288,258 |
| Tobacco Settlement Financing Corp., Revenue Bonds | | |
| Series A | | |
| (zero coupon), due 6/1/52 | 95,620,000 | 12,849,980 |
| | | 21,652,550 |
| South Carolina 0.8% |
| South Carolina Jobs-Economic Development Authority, Bishop Gadsden Episcopal Retirement Community, Revenue Bonds | | |
| Series A | | |
| 4.00%, due 4/1/54 | 1,160,000 | 769,096 |
| Series A | | |
| 5.00%, due 4/1/54 | 3,000,000 | 2,490,190 |
| South Carolina Jobs-Economic Development Authority, Green Charter School Project, Revenue Bonds | | |
| Series A | | |
| 4.00%, due 6/1/56 (a) | 3,530,000 | 2,330,618 |
The notes to the financial statements are an integral part of, and should be read in conjunction with, the financial statements.
53
Portfolio of Investments October 31, 2022† (continued)
| | Principal
Amount | Value |
| Long-Term Municipal Bonds (continued) |
| South Carolina (continued) |
| South Carolina Jobs-Economic Development Authority, Woodlands at Furman Project, Revenue Bonds | | |
| Series A | | |
| 5.00%, due 11/15/54 | $ 1,000,000 | $ 818,400 |
| 5.25%, due 11/15/47 | 5,125,000 | 4,575,391 |
| 5.25%, due 11/15/52 | 1,625,000 | 1,427,710 |
| South Carolina Public Service Authority, Santee Cooper Project, Revenue Bonds | | |
| Series B, Insured: BAM | | |
| 4.00%, due 12/1/46 | 5,960,000 | 5,047,087 |
| Series B, Insured: BAM | | |
| 4.00%, due 12/1/48 | 21,089,000 | 17,682,570 |
| Series B, Insured: BAM | | |
| 4.00%, due 12/1/50 | 4,805,000 | 3,997,137 |
| Series B, Insured: BAM | | |
| 4.00%, due 12/1/54 | 5,182,000 | 4,260,949 |
| Series B, Insured: BAM | | |
| 4.00%, due 12/1/55 | 14,796,000 | 12,143,574 |
| South Carolina Public Service Authority, Revenue Bonds | | |
| Series B | | |
| 5.00%, due 12/1/56 | 5,555,000 | 5,289,762 |
| | | 60,832,484 |
| South Dakota 0.0% ‡ |
| South Dakota Health & Educational Facilities Authority, Sanford Obligated Group, Revenue Bonds | | |
| Series E | | |
| 5.00%, due 11/1/42 | 3,150,000 | 3,150,000 |
| Tennessee 0.6% |
| Chattanooga-Hamilton County Hospital Authority, Revenue Bonds | | |
| Series A | | |
| 5.00%, due 10/1/44 | 6,250,000 | 5,944,626 |
| | Principal
Amount | Value |
| |
| Tennessee (continued) |
| Metropolitan Government Nashville & Davidson County Health & Educational Facilities Board, Trevecca Nazarene University Project, Revenue Bonds | | |
| Series B | | |
| 4.00%, due 10/1/41 | $ 2,265,000 | $ 1,795,344 |
| Series B | | |
| 4.00%, due 10/1/51 | 2,830,000 | 2,049,763 |
| Metropolitan Government Nashville & Davidson County Health & Educational Facilities Board, Belmont University, Revenue Bonds | | |
| 4.00%, due 5/1/46 | 3,000,000 | 2,415,825 |
| 4.00%, due 5/1/51 | 13,600,000 | 10,679,577 |
| Metropolitan Government Nashville & Davidson County Health & Educational Facilities Board, Lipscomb University Project, Revenue Bonds | | |
| Series A | | |
| 5.00%, due 10/1/45 | 11,610,000 | 10,635,803 |
| Series A | | |
| 5.25%, due 10/1/58 | 8,750,000 | 8,008,976 |
| Metropolitan Government Nashville & Davidson County Health & Educational Facilities Board, Revenue Bonds | | |
| 5.00%, due 10/1/48 | 2,800,000 | 2,501,970 |
| | | 44,031,884 |
| Texas 4.8% |
| Bexar County Health Facilities Development Corp., Army Retirement Residence Foundation Project, Revenue Bonds | | |
| 5.00%, due 7/15/41 | 3,300,000 | 2,948,804 |
| Calhoun County Navigation Industrial Development Authority, Max Midstream Texas LLC Project, Revenue Bonds, Senior Lien (a) | | |
| Series A | | |
| 3.625%, due 7/1/26 (b) | 15,055,000 | 13,338,436 |
| Series B | | |
| 6.50%, due 7/1/26 | 13,950,000 | 12,886,805 |
The notes to the financial statements are an integral part of, and should be read in conjunction with, the financial statements.
| 54 | MainStay MacKay High Yield Municipal Bond Fund |
| | Principal
Amount | Value |
| Long-Term Municipal Bonds (continued) |
| Texas (continued) |
| Central Texas Regional Mobility Authority, Manor Expressway Project, Revenue Bonds, Senior Lien | | |
| (zero coupon), due 1/1/23 | $ 1,000,000 | $ 993,870 |
| Central Texas Regional Mobility Authority, Capital Appreciation, Revenue Bonds | | |
| (zero coupon), due 1/1/33 | 315,000 | 190,332 |
| (zero coupon), due 1/1/34 | 3,275,000 | 1,873,783 |
| (zero coupon), due 1/1/35 | 3,700,000 | 1,977,320 |
| (zero coupon), due 1/1/36 | 2,000,000 | 1,008,811 |
| (zero coupon), due 1/1/39 | 3,500,000 | 1,466,536 |
| Central Texas Regional Mobility Authority, Revenue Bonds | | |
| 4.00%, due 1/1/41 | 6,000,000 | 5,120,453 |
| Central Texas Regional Mobility Authority, Revenue Bonds, Sub. Lien | | |
| 5.00%, due 1/1/42 | 2,500,000 | 2,506,978 |
| Central Texas Turnpike System, Revenue Bonds | | |
| Series C | | |
| 5.00%, due 8/15/42 | 11,700,000 | 11,739,791 |
| City of Arlington TX, Tax Increment Reinvestment Zone No. 5, Tax Allocation | | |
| 4.00%, due 8/15/50 | 2,355,000 | 1,830,868 |
| City of Houston TX, Airport System, United Airlines Inc. Project, Revenue Bonds (b) | | |
| 4.00%, due 7/15/41 | 4,100,000 | 3,158,460 |
| Series B-1 | | |
| 5.00%, due 7/15/30 | 2,000,000 | 1,972,229 |
| City of Lago Vista TX, Tessera on Lake Travis Public Improvement District Project, Special Assessment | | |
| Series B | | |
| 4.875%, due 9/1/50 (a) | 1,250,000 | 1,057,779 |
| Clifton Higher Education Finance Corp., IDEA Public Schools, Revenue Bonds | | |
| Series A | | |
| 4.00%, due 8/15/47 | 4,030,000 | 3,327,538 |
| 6.00%, due 8/15/43 | 3,500,000 | 3,541,137 |
| | Principal
Amount | Value |
| |
| Texas (continued) |
| Clifton Higher Education Finance Corp., Uplift Education, Revenue Bonds | | |
| Series A | | |
| 5.00%, due 12/1/45 | $ 2,500,000 | $ 2,335,234 |
| Danbury Higher Education Authority, Inc., Golden Rule School, Inc., Revenue Bonds | | |
| Series A | | |
| 4.00%, due 8/15/49 | 3,750,000 | 2,769,373 |
| Decatur Hospital Authority, Wise Regional Health System, Revenue Bonds | | |
| Series A | | |
| 5.25%, due 9/1/44 | 3,250,000 | 3,134,401 |
| Grand Parkway Transportation Corp., Revenue Bonds, First Tier | | |
| Series C, Insured: AGM-CR | | |
| 4.00%, due 10/1/49 | 73,390,000 | 62,258,829 |
| Harris County Cultural Education Facilities Finance Corp., YMCA Greater Houston Area, Revenue Bonds | | |
| Series A | | |
| 5.00%, due 6/1/33 | 900,000 | 818,361 |
| Series A | | |
| 5.00%, due 6/1/38 | 1,960,000 | 1,688,341 |
| Harris County-Houston Sports Authority, Revenue Bonds, Junior Lien | | |
| Series H, Insured: NATL-RE | | |
| (zero coupon), due 11/15/24 | 175,000 | 162,880 |
| Series H, Insured: NATL-RE | | |
| (zero coupon), due 11/15/24 | 795,000 | 723,005 |
| Series H, Insured: NATL-RE | | |
| (zero coupon), due 11/15/26 | 65,000 | 56,171 |
| Series H, Insured: NATL-RE | | |
| (zero coupon), due 11/15/26 | 535,000 | 440,904 |
| Series H, Insured: NATL-RE | | |
| (zero coupon), due 11/15/29 | 10,000 | 7,697 |
| Series H, Insured: NATL-RE | | |
| (zero coupon), due 11/15/29 | 725,000 | 511,958 |
| Series H, Insured: NATL-RE | | |
| (zero coupon), due 11/15/32 | 250,000 | 148,116 |
| Series H, Insured: NATL-RE | | |
| (zero coupon), due 11/15/33 | 185,000 | 102,420 |
The notes to the financial statements are an integral part of, and should be read in conjunction with, the financial statements.
55
Portfolio of Investments October 31, 2022† (continued)
| | Principal
Amount | Value |
| Long-Term Municipal Bonds (continued) |
| Texas (continued) |
| Harris County-Houston Sports Authority, Revenue Bonds, Junior Lien (continued) | | |
| Series H, Insured: NATL-RE | | |
| (zero coupon), due 11/15/38 | $ 1,395,000 | $ 555,116 |
| Series H, Insured: NATL-RE | | |
| (zero coupon), due 11/15/39 | 1,525,000 | 566,798 |
| Series H, Insured: NATL-RE | | |
| (zero coupon), due 11/15/40 | 1,855,000 | 644,354 |
| Series H, Insured: NATL-RE | | |
| (zero coupon), due 11/15/41 | 700,000 | 226,891 |
| Harris County-Houston Sports Authority, Revenue Bonds, Third Lien | | |
| Series A-3, Insured: NATL-RE | | |
| (zero coupon), due 11/15/32 | 1,670,000 | 942,743 |
| Series A-3, Insured: NATL-RE | | |
| (zero coupon), due 11/15/33 | 890,000 | 472,876 |
| Series A-3, Insured: NATL-RE | | |
| (zero coupon), due 11/15/34 | 220,000 | 114,012 |
| Series A-3, Insured: NATL-RE | | |
| (zero coupon), due 11/15/34 | 2,320,000 | 1,159,036 |
| Harris County-Houston Sports Authority, Revenue Bonds, Senior Lien | | |
| Series A, Insured: AGM NATL-RE | | |
| (zero coupon), due 11/15/34 | 2,035,000 | 1,071,493 |
| Series A, Insured: AGM NATL-RE | | |
| (zero coupon), due 11/15/38 | 36,015,000 | 14,503,936 |
| Series A, Insured: AGM NATL-RE | | |
| (zero coupon), due 11/15/40 | 1,310,000 | 461,322 |
| Hemphill County Hospital District, Limited General Obligation | | |
| 4.625%, due 2/1/39 | 2,765,000 | 2,362,175 |
| Love Field Airport Modernization Corp., Revenue Bonds | | |
| Insured: AGM | | |
| 4.00%, due 11/1/38 (b) | 5,225,000 | 4,560,453 |
| Montgomery County Toll Road Authority, Revenue Bonds, Senior Lien | | |
| 5.00%, due 9/15/48 | 2,500,000 | 2,299,861 |
| | Principal
Amount | Value |
| |
| Texas (continued) |
| New Hope Cultural Education Facilities Finance Corp., Jubilee Academic Center, Inc., Revenue Bonds (a) | | |
| 4.00%, due 8/15/36 | $ 1,000,000 | $ 829,012 |
| 4.00%, due 8/15/41 | 6,390,000 | 4,973,187 |
| 4.00%, due 8/15/51 | 2,880,000 | 2,043,570 |
| 4.00%, due 8/15/56 | 5,000,000 | 3,414,243 |
| New Hope Cultural Education Facilities Finance Corp., CHF-Collegiate Housing Denton LLC, Revenue Bonds | | |
| Series B-1, Insured: AGM | | |
| 4.00%, due 7/1/48 | 1,000,000 | 821,900 |
| New Hope Cultural Education Facilities Finance Corp., Westminster Project, Revenue Bonds | | |
| 4.00%, due 11/1/49 | 1,600,000 | 1,193,701 |
| New Hope Cultural Education Facilities Finance Corp., Quality Senior Housing Foundation of East Texas, Inc., Revenue Bonds | | |
| Series A-1 | | |
| 4.00%, due 12/1/54 | 555,000 | 350,673 |
| Series A-1 | | |
| 5.00%, due 12/1/54 | 2,770,000 | 2,260,221 |
| New Hope Cultural Education Facilities Finance Corp., Cumberland Academy, Inc., Revenue Bonds | | |
| Series A | | |
| 5.00%, due 8/15/40 (a) | 4,750,000 | 4,263,283 |
| New Hope Cultural Education Facilities Finance Corp., Southwest Preparatory School, Revenue Bonds | | |
| Series A | | |
| 5.00%, due 8/15/50 (a) | 3,930,000 | 3,299,338 |
| New Hope Cultural Education Facilities Finance Corp., Wesleyan Homes, Inc., Project, Revenue Bonds | | |
| 5.00%, due 1/1/55 | 1,500,000 | 1,045,322 |
The notes to the financial statements are an integral part of, and should be read in conjunction with, the financial statements.
| 56 | MainStay MacKay High Yield Municipal Bond Fund |
| | Principal
Amount | Value |
| Long-Term Municipal Bonds (continued) |
| Texas (continued) |
| New Hope Cultural Education Facilities Finance Corp., Legacy at Midtown Park Project, Revenue Bonds | | |
| Series A | | |
| 5.50%, due 7/1/54 | $ 2,500,000 | $ 1,881,119 |
| North East Texas Regional Mobility Authority, Revenue Bonds, Senior Lien | | |
| Series B | | |
| 5.00%, due 1/1/41 | 5,750,000 | 5,265,794 |
| Series B | | |
| 5.00%, due 1/1/46 | 3,535,000 | 3,135,219 |
| North Texas Tollway Authority, Revenue Bonds, Second Tier | | |
| Series B, Insured: BAM | | |
| 3.00%, due 1/1/46 | 18,000,000 | 12,787,972 |
| 5.00%, due 1/1/50 | 1,750,000 | 1,725,320 |
| Port Freeport, Revenue Bonds, Senior Lien | | |
| Series A | | |
| 4.00%, due 6/1/38 (b) | 1,650,000 | 1,474,265 |
| Series A | | |
| 4.00%, due 6/1/39 (b) | 1,620,000 | 1,433,560 |
| 4.00%, due 6/1/51 | 2,535,000 | 1,984,462 |
| Port of Port Arthur Navigation District, Port Improvement, Unlimited General Obligation | | |
| 4.00%, due 3/1/47 | 4,200,000 | 3,569,224 |
| Red River Education Finance Corp., Houston Baptist University Project, Revenue Bonds | | |
| 5.50%, due 10/1/46 | 6,000,000 | 5,975,021 |
| San Antonio Education Facilities Corp., University of the Incarnate Word, Revenue Bonds | | |
| Series A | | |
| 4.00%, due 4/1/51 | 4,000,000 | 3,000,907 |
| Tarrant County Cultural Education Facilities Finance Corp., Barton Creek Senior Living Center Project, Revenue Bonds | | |
| 5.00%, due 11/15/40 | 1,500,000 | 1,421,237 |
| | Principal
Amount | Value |
| |
| Texas (continued) |
| Tarrant County Cultural Education Facilities Finance Corp., Buckner Retirement Services, Revenue Bonds | | |
| Series B | | |
| 5.00%, due 11/15/40 | $ 1,250,000 | $ 1,252,202 |
| Tarrant County Cultural Education Facilities Finance Corp., Buckner Retirement Services, Inc. Project, Revenue Bonds | | |
| 5.00%, due 11/15/46 | 3,025,000 | 2,929,885 |
| Texas Private Activity Bond Surface Transportation Corp., North Tarrant Express Managed Lanes Project, Revenue Bonds, Senior Lien | | |
| Series A | | |
| 4.00%, due 12/31/39 | 9,250,000 | 7,780,481 |
| Texas Private Activity Bond Surface Transportation Corp., Blueridge Transportation Group LLC, Revenue Bonds, Senior Lien (b) | | |
| 5.00%, due 12/31/50 | 4,985,000 | 4,659,495 |
| 5.00%, due 12/31/55 | 10,140,000 | 9,306,370 |
| Texas Private Activity Bond Surface Transportation Corp., NTE Mobility Partners Segments 3 LLC, Revenue Bonds, Senior Lien (b) | | |
| 5.00%, due 6/30/58 | 92,655,000 | 82,802,595 |
| 6.75%, due 6/30/43 | 11,400,000 | 11,603,068 |
| Texas Transportation Commission, State Highway 249, Revenue Bonds, First Tier | | |
| (zero coupon), due 8/1/43 | 3,750,000 | 1,054,078 |
| (zero coupon), due 8/1/44 | 4,200,000 | 1,101,051 |
| (zero coupon), due 8/1/46 | 1,000,000 | 228,648 |
| (zero coupon), due 8/1/47 | 2,000,000 | 427,092 |
| (zero coupon), due 8/1/48 | 1,000,000 | 200,061 |
| (zero coupon), due 8/1/50 | 1,500,000 | 262,875 |
| Series A | | |
| 5.00%, due 8/1/57 | 9,750,000 | 8,921,437 |
| | | 376,716,574 |
The notes to the financial statements are an integral part of, and should be read in conjunction with, the financial statements.
57
Portfolio of Investments October 31, 2022† (continued)
| | Principal
Amount | Value |
| Long-Term Municipal Bonds (continued) |
| U.S. Virgin Islands 2.7% |
| Matching Fund Special Purpose Securitization Corp., Revenue Bonds | | |
| Series A | | |
| 5.00%, due 10/1/30 | $ 24,065,000 | $ 24,363,577 |
| Series A | | |
| 5.00%, due 10/1/32 | 38,430,000 | 38,718,283 |
| Series A | | �� |
| 5.00%, due 10/1/39 | 106,075,000 | 104,594,119 |
| Virgin Islands Public Finance Authority, Gross Receipts Taxes Loan, Revenue Bonds | | |
| Series C | | |
| 5.00%, due 10/1/30 (a) | 16,870,000 | 15,872,227 |
| Series A | | |
| 5.00%, due 10/1/32 | 15,200,000 | 14,062,440 |
| Series A | | |
| 5.00%, due 10/1/34 (a) | 2,600,000 | 2,369,647 |
| Series C | | |
| 5.00%, due 10/1/39 (a) | 9,610,000 | 8,467,457 |
| | | 208,447,750 |
| Utah 1.1% |
| Black Desert Public Infrastructure District, Limited General Obligation (a) | | |
| Series A | | |
| 3.75%, due 3/1/41 | 410,000 | 298,956 |
| Series A | | |
| 4.00%, due 3/1/51 | 2,725,000 | 1,867,834 |
| City of Salt Lake City UT, Airport, Revenue Bonds | | |
| Series A | | |
| 5.00%, due 7/1/46 (b) | 6,800,000 | 6,498,698 |
| Medical School Campus Public Infrastructure District, Limited General Obligation (a) | | |
| Series A | | |
| 5.25%, due 2/1/40 | 1,430,000 | 1,131,807 |
| Series A | | |
| 5.50%, due 2/1/50 | 2,915,000 | 2,246,481 |
| Mida Golf and Equestrian Center Public Infrastructure District, Limited General Obligation (a) | | |
| 4.50%, due 6/1/51 | 8,700,000 | 6,160,119 |
| 4.625%, due 6/1/57 | 2,000,000 | 1,393,841 |
| | Principal
Amount | Value |
| |
| Utah (continued) |
| Mida Mountain Village Public Infrastructure District, Assessment Area No. 2, Special Assessment | | |
| 4.00%, due 8/1/50 (a) | $ 2,000,000 | $ 1,425,626 |
| Mida Mountain Village Public Infrastructure District, Special Assessment (a) | | |
| Series A | | |
| 4.50%, due 8/1/40 | 1,500,000 | 1,296,187 |
| Series A | | |
| 5.00%, due 8/1/50 | 5,000,000 | 4,243,140 |
| Military Installation Development Authority, Revenue Bonds | | |
| Series A-1 | | |
| 4.00%, due 6/1/36 | 4,000,000 | 3,227,537 |
| Series A-1 | | |
| 4.00%, due 6/1/41 | 2,430,000 | 1,842,715 |
| Series A-1 | | |
| 4.00%, due 6/1/52 | 14,600,000 | 10,105,351 |
| UIPA Crossroads Public Infrastructure District, Tax Allocation | | |
| 4.375%, due 6/1/52 (a) | 5,500,000 | 4,225,833 |
| Utah Charter School Finance Authority, Spectrum Academy Project, Revenue Bonds | | |
| Insured: UT CSCE | | |
| 4.00%, due 4/15/45 | 2,975,000 | 2,445,319 |
| Insured: UT CSCE | | |
| 4.00%, due 4/15/50 | 3,395,000 | 2,733,018 |
| Utah Charter School Finance Authority, North Star Academy Project, Revenue Bonds | | |
| Insured: UT CSCE | | |
| 4.00%, due 4/15/45 | 2,020,000 | 1,642,568 |
| Utah Charter School Finance Authority, Vista School, Revenue Bonds | | |
| Series 2020A, Insured: UT CSCE | | |
| 4.00%, due 10/15/45 | 1,870,000 | 1,517,710 |
| Series 2020A, Insured: UT CSCE | | |
| 4.00%, due 10/15/54 | 4,750,000 | 3,734,200 |
The notes to the financial statements are an integral part of, and should be read in conjunction with, the financial statements.
| 58 | MainStay MacKay High Yield Municipal Bond Fund |
| | Principal
Amount | Value |
| Long-Term Municipal Bonds (continued) |
| Utah (continued) |
| Utah Charter School Finance Authority, Providence Hall Project, Revenue Bonds | | |
| Series A, Insured: UT CSCE | | |
| 4.00%, due 10/15/51 | $ 3,000,000 | $ 2,379,989 |
| Utah Infrastructure Agency, Revenue Bonds | | |
| 3.00%, due 10/15/45 | 4,425,000 | 2,643,584 |
| 5.00%, due 10/15/46 | 3,450,000 | 3,078,166 |
| Utah Infrastructure Agency, Telecommunication, Revenue Bonds | | |
| 4.00%, due 10/15/36 | 1,000,000 | 834,594 |
| 4.00%, due 10/15/42 | 3,470,000 | 2,680,692 |
| Series A | | |
| 5.00%, due 10/15/32 | 1,615,000 | 1,583,389 |
| Series A | | |
| 5.00%, due 10/15/34 | 3,135,000 | 3,031,199 |
| Series A | | |
| 5.00%, due 10/15/37 | 1,100,000 | 1,046,947 |
| Series A | | |
| 5.00%, due 10/15/40 | 3,880,000 | 3,622,260 |
| Series A | | |
| 5.375%, due 10/15/40 | 6,010,000 | 5,864,075 |
| | | 84,801,835 |
| Vermont 0.1% |
| Vermont Economic Development Authority, Wake Robin Corp. Project, Revenue Bonds | | |
| Series A | | |
| 4.00%, due 5/1/45 | 2,350,000 | 1,649,725 |
| Vermont Student Assistance Corp., Education Loan, Revenue Bonds | | |
| Series B | | |
| 4.50%, due 6/15/45 (b) | 3,500,000 | 2,782,143 |
| | | 4,431,868 |
| Virginia 1.8% |
| Farmville Industrial Development Authority, Longwood University Student Project, Revenue Bonds | | |
| Series A | | |
| 5.00%, due 1/1/48 | 6,750,000 | 5,990,425 |
| Series A | | |
| 5.00%, due 1/1/55 | 16,300,000 | 14,132,592 |
| | Principal
Amount | Value |
| |
| Virginia (continued) |
| Farmville Industrial Development Authority, Longwood University Student Housing Project, Revenue Bonds | | |
| Series A | | |
| 5.00%, due 1/1/59 | $ 7,355,000 | $ 6,282,623 |
| Henrico County Economic Development Authority, LifeSpire of Virginia, Residential Care Facility, Revenue Bonds | | |
| Series C | | |
| 5.00%, due 12/1/47 | 2,200,000 | 2,065,406 |
| James City County Economic Development Authority, Williamsburg Landing, Inc., Revenue Bonds | | |
| Series A | | |
| 4.00%, due 12/1/50 | 3,235,000 | 2,241,367 |
| Lynchburg Economic Development Authority, Randolph College Project, Revenue Bonds | | |
| 5.00%, due 9/1/48 | 3,455,000 | 3,268,765 |
| Newport News Economic Development Authority, LifeSpire of Virginia Obligated Group, Revenue Bonds | | |
| 5.00%, due 12/1/38 | 2,575,000 | 2,521,976 |
| Roanoke Economic Development Authority, Lynchburg College, Revenue Bonds | | |
| Series A | | |
| 4.00%, due 9/1/48 | 4,640,000 | 3,638,473 |
| Salem Economic Development Authority, Educational Facilities, Roanoke College, Revenue Bonds | | |
| 4.00%, due 4/1/45 | 1,000,000 | 809,441 |
| 5.00%, due 4/1/49 | 1,000,000 | 951,128 |
| Tobacco Settlement Financing Corp., Tobacco Settlement Asset-Backed, Revenue Bonds | | |
| Series 2007A-1 | | |
| 6.706%, due 6/1/46 | 31,920,000 | 27,286,499 |
| Virginia College Building Authority, Regent University Project, Revenue Bonds | | |
| 3.00%, due 6/1/41 | 2,250,000 | 1,484,186 |
| 4.00%, due 6/1/36 | 1,300,000 | 1,104,144 |
The notes to the financial statements are an integral part of, and should be read in conjunction with, the financial statements.
59
Portfolio of Investments October 31, 2022† (continued)
| | Principal
Amount | Value |
| Long-Term Municipal Bonds (continued) |
| Virginia (continued) |
| Virginia College Building Authority, Marymount University Project, Green Bond, Revenue Bonds | | |
| Series B | | |
| 5.00%, due 7/1/45 (a) | $ 1,945,000 | $ 1,737,838 |
| Virginia Small Business Financing Authority, 95 Express Lanes LLC, Revenue Bonds, Senior Lien (b) | | |
| 4.00%, due 1/1/39 | 1,120,000 | 944,269 |
| 4.00%, due 7/1/39 | 3,380,000 | 2,839,539 |
| 4.00%, due 1/1/48 | 8,100,000 | 6,157,087 |
| 5.00%, due 1/1/36 | 1,345,000 | 1,324,901 |
| 5.00%, due 1/1/38 | 3,000,000 | 2,919,269 |
| Virginia Small Business Financing Authority, National Senior Campuses, Inc., Revenue Bonds | | |
| 4.00%, due 1/1/45 | 8,850,000 | 7,251,859 |
| Virginia Small Business Financing Authority, National Senior Campuses Inc. Obligated Group, Revenue Bonds | | |
| 4.00%, due 1/1/51 | 5,750,000 | 4,567,003 |
| Virginia Small Business Financing Authority, Capital Beltway Express LLC, Revenue Bonds, Senior Lien (b) | | |
| 5.00%, due 12/31/47 | 15,125,000 | 14,544,026 |
| 5.00%, due 12/31/52 | 3,875,000 | 3,692,765 |
| Virginia Small Business Financing Authority, Transform 66 P3 Project, Revenue Bonds, Senior Lien | | |
| 5.00%, due 12/31/52 (b) | 23,900,000 | 21,821,462 |
| | | 139,577,043 |
| Washington 1.2% |
| Pend Oreille County Public Utility District No. 1 Box Canyon, Revenue Bonds | | |
| 4.00%, due 1/1/41 | 3,000,000 | 2,544,576 |
| Pend Oreille County Public Utility District No. 1 Box Canyon, Green Bond, Revenue Bonds | | |
| 5.00%, due 1/1/48 | 5,180,000 | 4,924,722 |
| | Principal
Amount | Value |
| |
| Washington (continued) |
| Port of Seattle, Intermediate Lien, Revenue Bonds | | |
| Series C | | |
| 5.00%, due 8/1/46 (b) | $ 18,250,000 | $ 17,463,434 |
| Port of Seattle Industrial Development Corp., Delta Air Lines, Inc., Revenue Bonds | | |
| 5.00%, due 4/1/30 (b) | 1,825,000 | 1,802,314 |
| Washington Economic Development Finance Authority, North Pacific Paper Co. Recycling Project, Green Bond, Revenue Bonds | | |
| Series A | | |
| 5.625%, due 12/1/40 (a)(b) | 4,000,000 | 3,735,329 |
| Washington Higher Education Facilities Authority, Whitworth University Project, Revenue Bonds | | |
| 4.00%, due 10/1/38 | 1,665,000 | 1,434,340 |
| Series A | | |
| 5.00%, due 10/1/40 | 3,000,000 | 3,023,103 |
| Washington Higher Education Facilities Authority, Seattle Pacific University Project, Revenue Bonds | | |
| Series A | | |
| 5.00%, due 10/1/45 | 3,550,000 | 3,330,040 |
| Washington State Convention Center Public Facilities District, Lodging Tax, Revenue Bonds | | |
| Series B | | |
| 3.00%, due 7/1/43 | 5,565,000 | 3,666,343 |
| Series B | | |
| 3.00%, due 7/1/48 | 8,250,000 | 4,903,214 |
| Series B | | |
| 3.00%, due 7/1/48 | 2,465,000 | 1,512,215 |
| Series B | | |
| 3.00%, due 7/1/58 | 13,760,000 | 7,696,565 |
| Series B | | |
| 3.00%, due 7/1/58 | 4,000,000 | 2,182,129 |
| 4.00%, due 7/1/58 | 8,910,000 | 6,335,964 |
| Series B | | |
| 4.00%, due 7/1/58 | 5,155,000 | 3,665,757 |
| Series B | | |
| 4.00%, due 7/1/58 | 1,750,000 | 1,274,579 |
| Series A | | |
| 5.00%, due 7/1/58 | 5,715,000 | 5,176,209 |
The notes to the financial statements are an integral part of, and should be read in conjunction with, the financial statements.
| 60 | MainStay MacKay High Yield Municipal Bond Fund |
| | Principal
Amount | Value |
| Long-Term Municipal Bonds (continued) |
| Washington (continued) |
| Washington State Housing Finance Commission, Eliseo Project, Revenue Bonds (a) | | |
| Series A | | |
| 4.00%, due 1/1/41 | $ 4,620,000 | $ 3,518,341 |
| Series A | | |
| 4.00%, due 1/1/57 | 9,785,000 | 6,561,178 |
| Washington State Housing Finance Commission, Riverview Retirement Community, Revenue Bonds | | |
| 5.00%, due 1/1/48 | 3,000,000 | 2,567,759 |
| Whidbey Island Public Hospital District, Whidbey General Hospital, Limited General Obligation | | |
| 3.75%, due 12/1/32 | 100,000 | 79,773 |
| 4.00%, due 12/1/37 | 290,000 | 218,375 |
| Whidbey Island Public Hospital District, Unlimited General Obligation | | |
| 5.375%, due 12/1/39 | 9,670,000 | 7,838,256 |
| 5.50%, due 12/1/33 | 2,070,000 | 1,816,672 |
| | | 97,271,187 |
| West Virginia 0.4% |
| County of Ohio WV, Special District Excise Tax, The Highlands Project, Revenue Bonds | | |
| Series B | | |
| 4.25%, due 3/1/35 | 4,000,000 | 3,535,569 |
| Glenville State College, Board of Governors, Revenue Bonds | | |
| 5.25%, due 6/1/47 | 4,000,000 | 3,199,845 |
| Monongalia County Commission Excise Tax District, University Town Centre, Revenue Bonds | | |
| Series A | | |
| 4.125%, due 6/1/43 (a) | 1,000,000 | 827,496 |
| Monongalia County Commission Excise Tax District, University Town Center, Revenue Bonds | | |
| Series A | | |
| 5.50%, due 6/1/37 (a) | 4,000,000 | 3,925,165 |
| | Principal
Amount | Value |
| |
| West Virginia (continued) |
| West Virginia Hospital Finance Authority, Cabell Huntington Hospital Obligated Group, Revenue Bonds | | |
| Series A | | |
| 4.00%, due 1/1/37 | $ 4,875,000 | $ 4,178,146 |
| Series A | | |
| 4.00%, due 1/1/38 | 2,500,000 | 2,110,759 |
| Series A | | |
| 4.125%, due 1/1/47 | 13,350,000 | 10,373,180 |
| | | 28,150,160 |
| Wisconsin 2.3% |
| Public Finance Authority, Wonderful Foundations Charter School, Revenue Bonds (a) | | |
| Series B | | |
| (zero coupon), due 1/1/60 | 71,700,000 | 3,136,803 |
| Series A-1 | | |
| 5.00%, due 1/1/55 | 15,965,000 | 11,300,492 |
| Public Finance Authority, Methodist University, Inc. (The), Revenue Bonds (a) | | |
| 4.00%, due 3/1/26 | 755,000 | 724,890 |
| 4.00%, due 3/1/30 | 950,000 | 853,737 |
| Public Finance Authority, North Carolina Leadership Charter Academy, Inc., Revenue Bonds | | |
| Series A | | |
| 4.00%, due 6/15/29 (a) | 270,000 | 248,191 |
| Public Finance Authority, National Gypsum Co., Revenue Bonds | | |
| 4.00%, due 8/1/35 (b) | 4,000,000 | 3,272,121 |
| Public Finance Authority, Roseman University of Health Sciences, Revenue Bonds | | |
| 4.00%, due 4/1/42 (a) | 1,000,000 | 747,355 |
| 4.00%, due 4/1/52 (a) | 3,000,000 | 2,030,575 |
| 5.00%, due 4/1/30 (a) | 700,000 | 685,552 |
| 5.00%, due 4/1/40 (a) | 300,000 | 270,243 |
| 5.00%, due 4/1/50 (a) | 1,000,000 | 836,955 |
| 5.875%, due 4/1/45 | 6,350,000 | 6,116,304 |
| Public Finance Authority, Fellowship Senior Living Project, Revenue Bonds | | |
| Series A | | |
| 4.00%, due 1/1/46 | 11,410,000 | 8,870,723 |
The notes to the financial statements are an integral part of, and should be read in conjunction with, the financial statements.
61
Portfolio of Investments October 31, 2022† (continued)
| | Principal
Amount | Value |
| Long-Term Municipal Bonds (continued) |
| Wisconsin (continued) |
Public Finance Authority, Fellowship Senior Living Project, Revenue Bonds
(continued) | | |
| Series A | | |
| 4.00%, due 1/1/52 | $ 3,130,000 | $ 2,334,688 |
| Public Finance Authority, WakeMed Obligated Group, Revenue Bonds | | |
| Series A | | |
| 4.00%, due 10/1/49 | 6,750,000 | 5,315,001 |
| Public Finance Authority, Appalachian State University Project, Revenue Bonds | | |
| Series A, Insured: AGM | | |
| 4.00%, due 7/1/50 | 1,000,000 | 793,443 |
| Series A, Insured: AGM | | |
| 4.00%, due 7/1/55 | 1,250,000 | 976,131 |
| Series A, Insured: AGM | | |
| 4.00%, due 7/1/59 | 1,600,000 | 1,239,503 |
| Public Finance Authority, UNC Health Southeastern, Revenue Bonds | | |
| Series A | | |
| 4.00%, due 2/1/51 | 3,970,000 | 3,014,860 |
| Public Finance Authority, Fargo-Moorhead Metropolitan Area Flood Risk Management Project, Revenue Bonds | | |
| 4.00%, due 9/30/51 (b) | 14,945,000 | 10,650,408 |
| Public Finance Authority, College Achieve Paterson Charter School Project, Revenue Bonds | | |
| Series A | | |
| 4.00%, due 6/15/52 (a) | 1,565,000 | 1,076,660 |
| Public Finance Authority, Fargo Moorhead Met Area Flood, Green Bond, Revenue Bonds | | |
| 4.00%, due 3/31/56 (b) | 5,545,000 | 3,813,108 |
| Public Finance Authority, Appalachian Regional Healthcare System Obligated Group, Revenue Bonds | | |
| 4.00%, due 7/1/56 | 2,250,000 | 1,611,354 |
| Public Finance Authority, Givens Estates, Revenue Bonds | | |
| 4.00%, due 12/1/56 | 4,750,000 | 3,608,572 |
| | Principal
Amount | Value |
| |
| Wisconsin (continued) |
| Public Finance Authority, Ultimate Medical Academy Project, Revenue Bonds (a) | | |
| Series A | | |
| 5.00%, due 10/1/24 | $ 2,200,000 | $ 2,188,034 |
| Series A | | |
| 5.00%, due 10/1/28 | 1,000,000 | 971,074 |
| Series A | | |
| 5.00%, due 10/1/29 | 2,000,000 | 1,931,031 |
| Series A | | |
| 5.00%, due 10/1/34 | 1,090,000 | 1,005,085 |
| Series A | | |
| 5.00%, due 10/1/39 | 16,500,000 | 14,616,504 |
| Public Finance Authority, Bancroft NeuroHealth Project, Revenue Bonds | | |
| Series A | | |
| 5.00%, due 6/1/36 (a) | 750,000 | 690,130 |
| Public Finance Authority, Carmelite System, Inc. Obligated Group (The), Revenue Bonds | | |
| 5.00%, due 1/1/40 | 4,085,000 | 3,903,354 |
| 5.00%, due 1/1/45 | 3,060,000 | 2,846,651 |
| Public Finance Authority, TRIPS Obligated Group, Revenue Bonds | | |
| Series B | | |
| 5.00%, due 7/1/42 (b) | 2,750,000 | 2,581,171 |
| Public Finance Authority, NC A&T Real Estate Foundation LLC Project, Revenue Bonds | | |
| Series A | | |
| 5.00%, due 6/1/44 | 1,350,000 | 1,180,371 |
| Series A | | |
| 5.00%, due 6/1/49 | 6,875,000 | 5,867,511 |
| Series B | | |
| 5.00%, due 6/1/49 | 2,720,000 | 2,321,401 |
| Public Finance Authority, Guilford College, Revenue Bonds | | |
| Series A | | |
| 5.00%, due 1/1/48 | 2,000,000 | 1,712,201 |
| 5.50%, due 1/1/47 | 5,910,000 | 5,551,462 |
| Public Finance Authority, Coral Academy of Science Las Vegas, Revenue Bonds | | |
| Series A | | |
| 5.00%, due 7/1/48 | 2,000,000 | 1,763,738 |
The notes to the financial statements are an integral part of, and should be read in conjunction with, the financial statements.
| 62 | MainStay MacKay High Yield Municipal Bond Fund |
| | Principal
Amount | Value |
| Long-Term Municipal Bonds (continued) |
| Wisconsin (continued) |
| Public Finance Authority, Wilson Preparatory Academy, Revenue Bonds | | |
| Series A | | |
| 5.00%, due 6/15/49 (a) | $ 1,100,000 | $ 940,350 |
| Public Finance Authority, College Achieve Central Charter School, Revenue Bonds | | |
| Series A | | |
| 5.00%, due 6/15/51 (a) | 2,145,000 | 1,762,607 |
| Public Finance Authority, Grand Hyatt San Antonio Hotel Acquisition Project, Revenue Bonds, Senior Lien | | |
| Series A | | |
| 5.00%, due 2/1/52 | 4,000,000 | 3,381,660 |
| Public Finance Authority, The Franklin School Of Innovation, Inc., Revenue Bonds | | |
| 5.00%, due 1/1/57 (a) | 3,200,000 | 2,462,840 |
| Public Finance Authority, Nevada State College, Revenue Bonds (a) | | |
| Series A | | |
| 5.00%, due 5/1/60 | 6,555,000 | 5,217,711 |
| Series B | | |
| 9.00%, due 5/1/71 | 3,035,000 | 2,985,879 |
| Public Finance Authority, Wingate University, Revenue Bonds | | |
| Series A | | |
| 5.25%, due 10/1/38 | 3,250,000 | 3,121,448 |
| Public Finance Authority, CHF-Cullowhee, LLC - Western Carolina University Project, Revenue Bonds | | |
| Series A | | |
| 5.25%, due 7/1/47 | 2,000,000 | 1,808,000 |
| Public Finance Authority, Lake Erie College Project, Revenue Bonds | | |
| Series A | | |
| 5.875%, due 10/1/54 (a) | 2,000,000 | 1,513,869 |
| Public Finance Authority, Affinity Living Group NC-12 Obligated Group, Revenue Bonds | | |
| 6.75%, due 11/1/24 (a) | 9,700,000 | 8,248,643 |
| | Principal
Amount | Value |
| |
| Wisconsin (continued) |
| Public Finance Authority, Irving Convention Center Hotel Project, Revenue Bonds | | |
| Series A-2 | | |
| 7.00%, due 1/1/50 (a) | $ 12,690,000 | $ 13,019,314 |
| Wisconsin Health & Educational Facilities Authority, St. Camillus Health System, Inc., Revenue Bonds | | |
| Series B-3 | | |
| 2.25%, due 11/1/26 | 230,000 | 216,812 |
| Series B-2 | | |
| 2.55%, due 11/1/27 | 3,000,000 | 2,777,666 |
| Wisconsin Health & Educational Facilities Authority, HOPE Christian Schools, Revenue Bonds | | |
| 3.00%, due 12/1/31 | 615,000 | 490,603 |
| Wisconsin Health & Educational Facilities Authority, Children's Hospital of Wisconsin Obligated Group, Revenue Bonds | | |
| 3.00%, due 8/15/52 | 2,000,000 | 1,290,499 |
| Wisconsin Health & Educational Facilities Authority, Rogers Memorial Hospital Inc. Obligated Group, Revenue Bonds | | |
| Series A | | |
| 5.00%, due 7/1/49 | 600,000 | 562,447 |
| Wisconsin Health & Educational Facilities Authority, Sauk-Prairie Memorial Hospital Inc. Obligated Group, Revenue Bonds | | |
| Series A | | |
| 5.375%, due 2/1/48 | 3,200,000 | 3,199,872 |
| | | 175,657,607 |
Total Long-Term Municipal Bonds
(Cost $8,744,843,479) | | 7,417,331,800 |
| Short-Term Municipal Notes 2.3% |
| Alabama 0.4% |
| Black Belt Energy Gas District, Gas Project No.7, Revenue Bonds | | |
| Series C-2 | | |
| 2.59%, due 10/1/52 (h) | 28,020,000 | 26,195,469 |
The notes to the financial statements are an integral part of, and should be read in conjunction with, the financial statements.
63
Portfolio of Investments October 31, 2022† (continued)
| | Principal
Amount | Value |
| Short-Term Municipal Notes (continued) |
| Alabama (continued) |
| Hoover Industrial Development Board, United States Steel Corp., Green Bond, Revenue Bonds | | |
| 6.375%, due 11/1/50 (b)(h) | $ 3,140,000 | $ 3,410,966 |
| | | 29,606,435 |
| California 0.3% |
| Northern California Gas Authority No. 1, Gas Project, Revenue Bonds | | |
| Series B | | |
| 3.228%, due 7/1/27 (h) | 26,365,000 | 25,448,903 |
| Louisiana 0.2% |
| Parish of St. John the Baptist LA, Marathon Oil Corp. Project, Revenue Bonds | | |
| Series B-2 | | |
| 2.375%, due 6/1/37 (h) | 12,200,000 | 11,116,524 |
| New Jersey 0.8% |
| New Jersey Turnpike Authority, Revenue Bonds | | |
| Series D-1 | | |
| 2.90%, due 1/1/24 (h) | 64,900,000 | 64,818,726 |
| Puerto Rico 0.1% |
| Puerto Rico Electric Power Authority, Revenue Bonds | | |
| Series UU, Insured: AGM | | |
| 2.046%, due 7/1/29 (h) | 4,690,000 | 4,405,707 |
| Texas 0.5% |
| Texas Municipal Gas Acquisition & Supply Corp. II, Revenue Bonds | | |
| Series C | | |
| 2.863%, due 9/15/27 (h) | 42,775,000 | 41,075,096 |
| | Principal
Amount | Value |
| |
| Virginia 0.0% ‡ |
| Virginia Small Business Financing Authority, University Real Estate Foundation, Revenue Bonds | | |
| 1.63%, due 7/1/30 (h) | $ 55,000 | $ 55,000 |
Total Short-Term Municipal Notes
(Cost $181,773,899) | | 176,526,391 |
Total Municipal Bonds
(Cost $8,926,617,378) | | 7,593,858,191 |
| |
| Long-Term Bonds 0.2% |
| Corporate Bonds 0.2% |
| Commercial Services 0.1% |
| Howard University | | |
| Series 21A | | |
| 4.756%, due 10/1/51 | 5,250,000 | 3,728,239 |
| Wildflower Improvement Association | | |
| 6.625%, due 3/1/31 (a) | 4,606,555 | 4,322,791 |
| | | 8,051,030 |
| Healthcare-Services 0.1% |
| Toledo Hospital (The) | | |
| Series B | | |
| 5.325%, due 11/15/28 | 1,500,000 | 991,170 |
| 6.015%, due 11/15/48 | 5,450,000 | 3,603,813 |
| | | 4,594,983 |
Total Corporate Bonds
(Cost $14,296,091) | | 12,646,013 |
Total Long-Term Bonds
(Cost $14,296,091) | | 12,646,013 |
| |
| | Shares | Value |
| Closed-End Funds 0.6% |
| California 0.0% ‡ |
| BlackRock MuniHoldings California Quality Fund, Inc. | 221,731 | 2,232,831 |
| Massachusetts 0.1% |
| BlackRock Municipal Income Fund, Inc. | 218,677 | 2,276,428 |
| DWS Municipal Income Trust | 131,002 | 1,041,466 |
| Pioneer Municipal High Income Advantage Fund, Inc. | 229,935 | 1,710,716 |
The notes to the financial statements are an integral part of, and should be read in conjunction with, the financial statements.
| 64 | MainStay MacKay High Yield Municipal Bond Fund |
| | Shares | Value |
| Closed-End Funds (continued) |
| Massachusetts (continued) |
| Pioneer Municipal High Income Fund Trust | 256,214 | $ 2,044,588 |
| | | 7,073,198 |
| Michigan 0.0% ‡ |
| BlackRock MuniYield Michigan Quality Fund, Inc. | 273,852 | 2,922,001 |
| Multi-State 0.3% |
| BlackRock Municipal 2030 Target Term Trust | 427,334 | 8,790,260 |
| BlackRock MuniHoldings Fund, Inc. | 146,484 | 1,573,238 |
| BlackRock MuniYield Quality Fund II, Inc. | 588,091 | 5,539,817 |
| BlackRock MuniYield Quality Fund, Inc. | 287,227 | 3,050,351 |
| | | 18,953,666 |
| New Jersey 0.1% |
| BlackRock MuniHoldings New Jersey Quality Fund, Inc. | 328,957 | 3,536,288 |
| New York 0.1% |
| BlackRock MuniHoldings New York Quality Fund, Inc. | 525,108 | 4,857,249 |
| BlackRock MuniYield New York Quality Fund, Inc. | 543,595 | 4,881,483 |
| BlackRock New York Municipal Income Trust | 26,795 | 244,638 |
| | | 9,983,370 |
| Pennsylvania 0.0% ‡ |
| Invesco Pennsylvania Value Municipal Income Trust | 50,154 | 464,928 |
Total Closed-End Funds
(Cost $61,872,109) | | 45,166,282 |
| | Shares | | Value |
| Short-Term Investment 0.3% |
| Unaffiliated Investment Company 0.3% |
| BlackRock Liquidity Funds MuniCash, 1.826% (i) | 25,762,144 | | $ 25,759,568 |
Total Short-Term Investment
(Cost $25,759,568) | | | 25,759,568 |
Total Investments
(Cost $9,028,545,146) | 98.6% | | 7,677,430,054 |
| Other Assets, Less Liabilities | 1.4 | | 109,768,066 |
| Net Assets | 100.0% | | $ 7,787,198,120 |
| † | Percentages indicated are based on Fund net assets. |
| ‡ | Less than one-tenth of a percent. |
| (a) | May be sold to institutional investors only under Rule 144A or securities offered pursuant to Section 4(a)(2) of the Securities Act of 1933, as amended. |
| (b) | Interest on these securities was subject to alternative minimum tax. |
| (c) | Illiquid security—As of October 31, 2022, the total market value deemed illiquid under procedures approved by the Board of Trustees was $115,756,807, which represented 1.5% of the Fund’s net assets.(Unaudited) |
| (d) | Step coupon—Rate shown was the rate in effect as of October 31, 2022. |
| (e) | Issue in default. |
| (f) | Issue in non-accrual status. |
| (g) | Coupon rate may change based on changes of the underlying collateral or prepayments of principal. Rate shown was the rate in effect as of October 31, 2022. |
| (h) | Variable-rate demand notes (VRDNs)—Provide the right to sell the security at face value on either that day or within the rate-reset period. VRDNs will normally trade as if the maturity is the earlier put date, even though stated maturity is longer. The interest rate is reset on the put date at a stipulated daily, weekly, monthly, quarterly, or other specified time interval to reflect current market conditions. These securities do not indicate a reference rate and spread in their description. The maturity date shown is the final maturity. |
| (i) | Current yield as of October 31, 2022. |
Futures Contracts
As of October 31, 2022, the Fund held the following futures contracts1:
| Type | Number of
Contracts | Expiration
Date | Value at
Trade Date | Current
Notional
Amount | Unrealized
Appreciation
(Depreciation)2 |
| Short Contracts | | | | | |
| U.S. Treasury 10 Year Notes | (6,500) | December 2022 | $ (743,193,324) | $ (718,859,375) | $ 24,333,949 |
The notes to the financial statements are an integral part of, and should be read in conjunction with, the financial statements.
65
Portfolio of Investments October 31, 2022† (continued)
| Type | Number of
Contracts | Expiration
Date | Value at
Trade Date | Current
Notional
Amount | Unrealized
Appreciation
(Depreciation)2 |
| U.S. Treasury Long Bonds | (2,300) | December 2022 | $ (313,805,519) | $ (277,150,000) | $ 36,655,519 |
| Net Unrealized Appreciation | | | | | $ 60,989,468 |
| 1. | As of October 31, 2022, cash in the amount of $21,740,000 was on deposit with a broker or futures commission merchant for futures transactions. |
| 2. | Represents the difference between the value of the contracts at the time they were opened and the value as of October 31, 2022. |
| Abbreviation(s): |
| ACA—ACA Financial Guaranty Corp. |
| AGC—Assured Guaranty Corp. |
| AGM—Assured Guaranty Municipal Corp. |
| AMBAC—Ambac Assurance Corp. |
| BAM—Build America Mutual Assurance Co. |
| CHF—Collegiate Housing Foundation |
| CR—Custodial Receipts |
| FGIC—Financial Guaranty Insurance Company |
| ICC—Insured Custody Certificates |
| MUN GOVT GTD—Municipal Government Guaranteed |
| NATL-RE—National Public Finance Guarantee Corp. |
| SD CRED PROG—School District Credit Enhancement Program |
| UT CSCE—Utah Charter School Credit Enhancement Program |
The notes to the financial statements are an integral part of, and should be read in conjunction with, the financial statements.
| 66 | MainStay MacKay High Yield Municipal Bond Fund |
The following is a summary of the fair valuations according to the inputs used as of October 31, 2022, for valuing the Fund’s assets:
| Description | Quoted
Prices in
Active
Markets for
Identical
Assets
(Level 1) | | Significant
Other
Observable
Inputs
(Level 2) | | Significant
Unobservable
Inputs
(Level 3) | | Total |
| Asset Valuation Inputs | | | | | | | |
| Investments in Securities (a) | | | | | | | |
| Municipal Bonds | | | | | | | |
| Long-Term Municipal Bonds | $ — | | $ 7,417,331,800 | | $ — | | $ 7,417,331,800 |
| Short-Term Municipal Notes | — | | 176,526,391 | | — | | 176,526,391 |
| Total Municipal Bonds | — | | 7,593,858,191 | | — | | 7,593,858,191 |
| Long-Term Bonds | | | | | | | |
| Corporate Bonds | — | | 12,646,013 | | — | | 12,646,013 |
| Total Corporate Bonds | — | | 12,646,013 | | — | | 12,646,013 |
| Closed-End Funds | 45,166,282 | | — | | — | | 45,166,282 |
| Short-Term Investment | | | | | | | |
| Unaffiliated Investment Company | 25,759,568 | | — | | — | | 25,759,568 |
| Total Investments in Securities | 70,925,850 | | 7,606,504,204 | | — | | 7,677,430,054 |
| Other Financial Instruments | | | | | | | |
| Futures Contracts (b) | 60,989,468 | | — | | — | | 60,989,468 |
| Total Investments in Securities and Other Financial Instruments | $ 131,915,318 | | $ 7,606,504,204 | | $ — | | $ 7,738,419,522 |
| (a) | For a complete listing of investments and their industries, see the Portfolio of Investments. |
| (b) | The value listed for these securities reflects unrealized appreciation (depreciation) as shown on the Portfolio of Investments. |
The notes to the financial statements are an integral part of, and should be read in conjunction with, the financial statements.
67
Statement of Assets and Liabilities as of October 31, 2022
| Assets |
Investment in securities, at value
(identified cost $9,028,545,146) | $ 7,677,430,054 |
| Cash | 1,879 |
| Cash collateral on deposit at broker for futures contracts | 21,740,000 |
| Due from custodian | 10,864,117 |
| Receivables: | |
| Fund shares sold | 122,563,428 |
| Dividends and interest | 112,686,641 |
| Investment securities sold | 64,716,295 |
| Other assets | 286,929 |
| Total assets | 8,010,289,343 |
| Liabilities |
| Payables: | |
| Fund shares redeemed | 141,308,941 |
| Investment securities purchased | 64,659,820 |
| Manager (See Note 3) | 3,677,874 |
| Variation margin on futures contracts | 2,344,369 |
| Transfer agent (See Note 3) | 857,616 |
| NYLIFE Distributors (See Note 3) | 573,238 |
| Shareholder communication | 189,664 |
| Professional fees | 152,751 |
| Custodian | 83,682 |
| Trustees | 3,639 |
| Accrued expenses | 57,926 |
| Distributions payable | 9,181,703 |
| Total liabilities | 223,091,223 |
| Net assets | $ 7,787,198,120 |
| Composition of Net Assets |
| Shares of beneficial interest outstanding (par value of $.001 per share) unlimited number of shares authorized | $ 731,972 |
| Additional paid-in-capital | 9,490,324,458 |
| | 9,491,056,430 |
| Total distributable earnings (loss) | (1,703,858,310) |
| Net assets | $ 7,787,198,120 |
| Class A | |
| Net assets applicable to outstanding shares | $1,751,790,661 |
| Shares of beneficial interest outstanding | 164,675,133 |
| Net asset value per share outstanding | $ 10.64 |
| Maximum sales charge (3.00% of offering price) | 0.33 |
| Maximum offering price per share outstanding | $ 10.97 |
| Investor Class | |
| Net assets applicable to outstanding shares | $ 3,748,579 |
| Shares of beneficial interest outstanding | 352,799 |
| Net asset value per share outstanding | $ 10.63 |
| Maximum sales charge (2.50% of offering price) | 0.27 |
| Maximum offering price per share outstanding | $ 10.90 |
| Class C | |
| Net assets applicable to outstanding shares | $ 202,196,493 |
| Shares of beneficial interest outstanding | 19,053,995 |
| Net asset value and offering price per share outstanding | $ 10.61 |
| Class I | |
| Net assets applicable to outstanding shares | $4,904,132,182 |
| Shares of beneficial interest outstanding | 460,901,809 |
| Net asset value and offering price per share outstanding | $ 10.64 |
| Class R6 | |
| Net assets applicable to outstanding shares | $ 925,330,205 |
| Shares of beneficial interest outstanding | 86,988,291 |
| Net asset value and offering price per share outstanding | $ 10.64 |
The notes to the financial statements are an integral part of, and should be read in conjunction with, the financial statements.
| 68 | MainStay MacKay High Yield Municipal Bond Fund |
Statement of Operations for the year ended October 31, 2022
| Investment Income (Loss) |
| Income | |
| Interest | $ 395,799,987 |
| Dividends | 3,066,834 |
| Total income | 398,866,821 |
| Expenses | |
| Manager (See Note 3) | 56,129,216 |
| Distribution/Service—Class A (See Note 3) | 6,000,418 |
| Distribution/Service—Investor Class (See Note 3) | 11,397 |
| Distribution/Service—Class C (See Note 3) | 2,821,380 |
| Transfer agent (See Note 3) | 5,527,278 |
| Professional fees | 751,210 |
| Registration | 470,920 |
| Custodian | 404,156 |
| Shareholder communication | 345,894 |
| Trustees | 237,023 |
| Miscellaneous | 422,699 |
| Total expenses | 73,121,591 |
| Net investment income (loss) | 325,745,230 |
| Realized and Unrealized Gain (Loss) |
| Net realized gain (loss) on: | |
| Unaffiliated investment transactions | (371,271,268) |
| In-kind Transactions | 16,858,371 |
| Futures transactions | 57,429,264 |
| Net realized gain (loss) | (296,983,633) |
| Net change in unrealized appreciation (depreciation) on: | |
| Unaffiliated investments | (2,203,620,405) |
| Futures contracts | 60,628,727 |
| Net change in unrealized appreciation (depreciation) | (2,142,991,678) |
| Net realized and unrealized gain (loss) | (2,439,975,311) |
| Net increase (decrease) in net assets resulting from operations | $(2,114,230,081) |
The notes to the financial statements are an integral part of, and should be read in conjunction with, the financial statements.
69
Statements of Changes in Net Assets
for the years ended October 31, 2022 and October 31, 2021
| | 2022 | 2021 |
| Increase (Decrease) in Net Assets |
| Operations: | | |
| Net investment income (loss) | $ 325,745,230 | $ 304,470,388 |
| Net realized gain (loss) | (296,983,633) | 21,128,424 |
| Net change in unrealized appreciation (depreciation) | (2,142,991,678) | 518,344,344 |
| Net increase (decrease) in net assets resulting from operations | (2,114,230,081) | 843,943,156 |
| Distributions to shareholders: | | |
| Class A | (76,320,100) | (71,248,699) |
| Investor Class | (145,969) | (155,076) |
| Class C | (6,843,792) | (7,721,003) |
| Class I | (233,072,302) | (217,243,784) |
| Class R6 | (43,550,777) | (32,089,827) |
| Total distributions to shareholders | (359,932,940) | (328,458,389) |
| Capital share transactions: | | |
| Net proceeds from sales of shares | 6,094,387,364 | 4,914,449,892 |
| Net asset value of shares issued to shareholders in reinvestment of distributions | 247,680,574 | 220,954,069 |
| Cost of shares redeemed | (7,962,906,928) | (1,977,955,717) |
| Redemptions in-kind | (294,446,031) | — |
| Increase (decrease) in net assets derived from capital share transactions | (1,915,285,021) | 3,157,448,244 |
| Net increase (decrease) in net assets | (4,389,448,042) | 3,672,933,011 |
| Net Assets |
| Beginning of year | 12,176,646,162 | 8,503,713,151 |
| End of year | $ 7,787,198,120 | $12,176,646,162 |
The notes to the financial statements are an integral part of, and should be read in conjunction with, the financial statements.
| 70 | MainStay MacKay High Yield Municipal Bond Fund |
Financial Highlights selected per share data and ratios
| | Year Ended October 31, |
| Class A | 2022 | | 2021 | | 2020 | | 2019 | | 2018 |
| Net asset value at beginning of year | $ 13.49 | | $ 12.75 | | $ 12.98 | | $ 12.33 | | $ 12.32 |
| Net investment income (loss) | 0.36(a) | | 0.36(a) | | 0.40 | | 0.47 | | 0.48 |
| Net realized and unrealized gain (loss) | (2.81) | | 0.77 | | (0.20) | | 0.66 | | 0.01 |
| Total from investment operations | (2.45) | | 1.13 | | 0.20 | | 1.13 | | 0.49 |
| Less distributions: | | | | | | | | | |
| From net investment income | (0.40) | | (0.39) | | (0.43) | | (0.47) | | (0.48) |
| From net realized gain on investments | — | | — | | (0.00)‡ | | (0.01) | | — |
| Total distributions | (0.40) | | (0.39) | | (0.43) | | (0.48) | | (0.48) |
| Net asset value at end of year | $ 10.64 | | $ 13.49 | | $ 12.75 | | $ 12.98 | | $ 12.33 |
| Total investment return (b) | (18.48)% | | 8.93% | | 1.60% | | 9.28% | | 4.03% |
| Ratios (to average net assets)/Supplemental Data: | | | | | | | | | |
| Net investment income (loss) | 2.86% | | 2.66% | | 3.15% | | 3.69% | | 3.84% |
| Net expenses (c) | 0.86% | | 0.84% | | 0.86% | | 0.87% | | 0.87% |
| Portfolio turnover rate | 56% (d)(e) | | 14%(d) | | 37%(d) | | 27%(d) | | 32% |
| Net assets at end of year (in 000’s) | $ 1,751,791 | | $ 2,696,103 | | $ 2,073,226 | | $ 2,210,862 | | $ 1,616,061 |
| ‡ | Less than one cent per share. |
| (a) | Per share data based on average shares outstanding during the year. |
| (b) | Total investment return is calculated exclusive of sales charges and assumes the reinvestment of dividends and distributions. For periods of less than one year, total return is not annualized. |
| (c) | In addition to the fees and expenses which the Fund bears directly, it also indirectly bears a pro-rata share of the fees and expenses of the underlying funds in which it invests. Such indirect expenses are not included in the above expense ratios. |
| (d) | The portfolio turnover rate includes variable rate demand notes. |
| (e) | The portfolio turnover rate excludes in-kind transactions. |
| | Year Ended October 31, |
| Investor Class | 2022 | | 2021 | | 2020 | | 2019 | | 2018 |
| Net asset value at beginning of year | $ 13.47 | | $ 12.73 | | $ 12.96 | | $ 12.32 | | $ 12.30 |
| Net investment income (loss) | 0.36(a) | | 0.36(a) | | 0.40 | | 0.47 | | 0.48 |
| Net realized and unrealized gain (loss) | (2.80) | | 0.77 | | (0.20) | | 0.65 | | 0.02 |
| Total from investment operations | (2.44) | | 1.13 | | 0.20 | | 1.12 | | 0.50 |
| Less distributions: | | | | | | | | | |
| From net investment income | (0.40) | | (0.39) | | (0.43) | | (0.47) | | (0.48) |
| From net realized gain on investments | — | | — | | (0.00)‡ | | (0.01) | | — |
| Total distributions | (0.40) | | (0.39) | | (0.43) | | (0.48) | | (0.48) |
| Net asset value at end of year | $ 10.63 | | $ 13.47 | | $ 12.73 | | $ 12.96 | | $ 12.32 |
| Total investment return (b) | (18.52)% | | 8.92% | | 1.59% | | 9.19% | | 4.10% |
| Ratios (to average net assets)/Supplemental Data: | | | | | | | | | |
| Net investment income (loss) | 2.88% | | 2.69% | | 3.15% | | 3.69% | | 3.85% |
| Net expenses (c) | 0.87% | | 0.86% | | 0.87% | | 0.88% | | 0.89% |
| Portfolio turnover rate | 56% (d)(e) | | 14%(d) | | 37%(d) | | 27%(d) | | 32% |
| Net assets at end of year (in 000's) | $ 3,749 | | $ 5,107 | | $ 5,211 | | $ 5,449 | | $ 4,383 |
| ‡ | Less than one cent per share. |
| (a) | Per share data based on average shares outstanding during the year. |
| (b) | Total investment return is calculated exclusive of sales charges and assumes the reinvestment of dividends and distributions. For periods of less than one year, total return is not annualized. |
| (c) | In addition to the fees and expenses which the Fund bears directly, it also indirectly bears a pro-rata share of the fees and expenses of the underlying funds in which it invests. Such indirect expenses are not included in the above expense ratios. |
| (d) | The portfolio turnover rate includes variable rate demand notes. |
| (e) | The portfolio turnover rate excludes in-kind transactions. |
The notes to the financial statements are an integral part of, and should be read in conjunction with, the financial statements.
71
Financial Highlights selected per share data and ratios
| | Year Ended October 31, |
| Class C | 2022 | | 2021 | | 2020 | | 2019 | | 2018 |
| Net asset value at beginning of year | $ 13.46 | | $ 12.71 | | $ 12.95 | | $ 12.30 | | $ 12.29 |
| Net investment income (loss) | 0.26(a) | | 0.26(a) | | 0.29 | | 0.37 | | 0.39 |
| Net realized and unrealized gain (loss) | (2.80) | | 0.78 | | (0.20) | | 0.66 | | 0.01 |
| Total from investment operations | (2.54) | | 1.04 | | 0.09 | | 1.03 | | 0.40 |
| Less distributions: | | | | | | | | | |
| From net investment income | (0.31) | | (0.29) | | (0.33) | | (0.37) | | (0.39) |
| From net realized gain on investments | — | | — | | (0.00)‡ | | (0.01) | | — |
| Total distributions | (0.31) | | (0.29) | | (0.33) | | (0.38) | | (0.39) |
| Net asset value at end of year | $ 10.61 | | $ 13.46 | | $ 12.71 | | $ 12.95 | | $ 12.30 |
| Total investment return (b) | (19.15)% | | 8.20% | | 0.75% | | 8.47% | | 3.24% |
| Ratios (to average net assets)/Supplemental Data: | | | | | | | | | |
| Net investment income (loss) | 2.11% | | 1.95% | | 2.41% | | 2.94% | | 3.11% |
| Net expenses (c) | 1.62% | | 1.61% | | 1.62% | | 1.63% | | 1.63% |
| Portfolio turnover rate | 56% (d)(e) | | 14%(d) | | 37%(d) | | 27%(d) | | 32% |
| Net assets at end of year (in 000’s) | $ 202,196 | | $ 340,700 | | $ 355,498 | | $ 433,318 | | $ 396,092 |
| ‡ | Less than one cent per share. |
| (a) | Per share data based on average shares outstanding during the year. |
| (b) | Total investment return is calculated exclusive of sales charges and assumes the reinvestment of dividends and distributions. For periods of less than one year, total return is not annualized. |
| (c) | In addition to the fees and expenses which the Fund bears directly, it also indirectly bears a pro-rata share of the fees and expenses of the underlying funds in which it invests. Such indirect expenses are not included in the above expense ratios. |
| (d) | The portfolio turnover rate includes variable rate demand notes. |
| (e) | The portfolio turnover rate excludes in-kind transactions. |
| | Year Ended October 31, |
| Class I | 2022 | | 2021 | | 2020 | | 2019 | | 2018 |
| Net asset value at beginning of year | $ 13.49 | | $ 12.75 | | $ 12.98 | | $ 12.34 | | $ 12.32 |
| Net investment income (loss) | 0.39(a) | | 0.39(a) | | 0.45 | | 0.50 | | 0.51 |
| Net realized and unrealized gain (loss) | (2.81) | | 0.77 | | (0.22) | | 0.65 | | 0.02 |
| Total from investment operations | (2.42) | | 1.16 | | 0.23 | | 1.15 | | 0.53 |
| Less distributions: | | | | | | | | | |
| From net investment income | (0.43) | | (0.42) | | (0.46) | | (0.50) | | (0.51) |
| From net realized gain on investments | — | | — | | (0.00)‡ | | (0.01) | | — |
| Total distributions | (0.43) | | (0.42) | | (0.46) | | (0.51) | | (0.51) |
| Net asset value at end of year | $ 10.64 | | $ 13.49 | | $ 12.75 | | $ 12.98 | | $ 12.34 |
| Total investment return (b) | (18.28)% | | 9.20% | | 1.86% | | 9.46% | | 4.38% |
| Ratios (to average net assets)/Supplemental Data: | | | | | | | | | |
| Net investment income (loss) | 3.10% | | 2.90% | | 3.38% | | 3.93% | | 4.09% |
| Net expenses (c) | 0.60% | | 0.59% | | 0.61% | | 0.62% | | 0.62% |
| Portfolio turnover rate | 56% (d)(e) | | 14%(d) | | 37%(d) | | 27%(d) | | 32% |
| Net assets at end of year (in 000’s) | $ 4,904,132 | | $ 7,894,324 | | $ 6,063,243 | | $ 4,415,639 | | $ 3,024,665 |
| ‡ | Less than one cent per share. |
| (a) | Per share data based on average shares outstanding during the year. |
| (b) | Total investment return is calculated exclusive of sales charges and assumes the reinvestment of dividends and distributions. Class I shares are not subject to sales charges. For periods of less than one year, total return is not annualized. |
| (c) | In addition to the fees and expenses which the Fund bears directly, it also indirectly bears a pro-rata share of the fees and expenses of the underlying funds in which it invests. Such indirect expenses are not included in the above expense ratios. |
| (d) | The portfolio turnover rate includes variable rate demand notes. |
| (e) | The portfolio turnover rate excludes in-kind transactions. |
The notes to the financial statements are an integral part of, and should be read in conjunction with, the financial statements.
| 72 | MainStay MacKay High Yield Municipal Bond Fund |
Financial Highlights selected per share data and ratios
| | Year Ended October 31, | | November 1, 2019^ through
October 31, |
| Class R6 | 2022 | | 2021 | | 2020 |
| Net asset value at beginning of period | $ 13.49 | | $ 12.74 | | $ 12.98 |
| Net investment income (loss) (a) | 0.40 | | 0.39 | | 0.43 |
| Net realized and unrealized gain (loss) | (2.81) | | 0.79 | | (0.21) |
| Total from investment operations | (2.41) | | 1.18 | | 0.22 |
| Less distributions: | | | | | |
| From net investment income | (0.44) | | (0.43) | | (0.46) |
| From net realized gain on investments | — | | — | | (0.00)‡ |
| Total distributions | (0.44) | | (0.43) | | (0.46) |
| Net asset value at end of period | $ 10.64 | | $ 13.49 | | $ 12.74 |
| Total investment return (b) | (18.23)% | | 9.34% | | 1.80% |
| Ratios (to average net assets)/Supplemental Data: | | | | | |
| Net investment income (loss) | 3.22% | | 2.91% | | 3.40% |
| Net expenses (c) | 0.55% | | 0.54% | | 0.56% |
| Portfolio turnover rate (d) | 56%(e) | | 14% | | 37% |
| Net assets at end of period (in 000’s) | $ 925,330 | | $ 1,240,412 | | $ 6,535 |
| ^ | Inception date. |
| ‡ | Less than one cent per share. |
| (a) | Per share data based on average shares outstanding during the period. |
| (b) | Total investment return is calculated exclusive of sales charges and assumes the reinvestment of dividends and distributions. Class R6 shares are not subject to sales charges. For periods of less than one year, total return is not annualized. |
| (c) | In addition to the fees and expenses which the Fund bears directly, it also indirectly bears a pro-rata share of the fees and expenses of the underlying funds in which it invests. Such indirect expenses are not included in the above expense ratios. |
| (d) | The portfolio turnover rate includes variable rate demand notes. |
| (e) | The portfolio turnover rate excludes in-kind transactions. |
The notes to the financial statements are an integral part of, and should be read in conjunction with, the financial statements.
73
Notes to Financial Statements
Note 1-Organization and Business
MainStay Funds Trust (the “Trust”) was organized as a Delaware statutory trust on April 28, 2009. The Trust is registered under the Investment Company Act of 1940, as amended (the “1940 Act”), as an open-end management investment company, and is comprised of thirty-three funds (collectively referred to as the “Funds”). These financial statements and notes relate to the MainStay MacKay High Yield Municipal Bond Fund (the "Fund"), a “diversified” fund, as that term is defined in the 1940 Act, as interpreted or modified by regulatory authorities having jurisdiction, from time to time.
The following table lists the Fund's share classes that have been registered and commenced operations:
| Class | Commenced Operations |
| Class A | March 31, 2010 |
| Investor Class | March 31, 2010 |
| Class C | March 31, 2010 |
| Class I | March 31, 2010 |
| Class R6 | November 1, 2019 |
| SIMPLE Class | N/A* |
| * | SIMPLE Class shares were registered for sale effective as of August 31, 2020 but have not yet commenced operations. |
Class A and Investor Class shares are offered at net asset value (“NAV”) per share plus an initial sales charge. No initial sales charge applies to investments of $250,000 or more (and certain other qualified purchases) in Class A and Investor Class shares. However, a contingent deferred sales charge (“CDSC”) of 1.00% may be imposed on certain redemptions made within 18 months of the date of purchase on shares that were purchased without an initial sales charge. Class C shares are offered at NAV without an initial sales charge, although a 1.00% CDSC may be imposed on certain redemptions of such shares made within one year of the date of purchase of Class C shares. Class I and Class R6 shares are offered at NAV without a sales charge. SIMPLE Class shares are expected to be offered at NAV without a sales charge if such shares are offered in the future. In addition, depending upon eligibility, Class C shares convert to either Class A or Investor Class shares at the end of the calendar quarter eight years after the date they were purchased. Investor Class shares may convert automatically to Class A shares. Under certain circumstances and as may be permitted by the Trust’s multiple class plan pursuant to Rule 18f-3 under the 1940 Act, specified share classes of the Fund may be converted to one or more other share classes of the Fund as disclosed in the capital share transactions within these Notes. The classes of shares have the same voting (except for issues that relate solely to one class), dividend, liquidation and other rights, and the same terms and conditions, except that under distribution plans pursuant to Rule 12b-1 under the 1940 Act, Class C and SIMPLE Class shares are subject to higher distribution and/or service fees than Class A and Investor Class shares. Class I and Class R6 shares are not subject to a distribution and/or service fee.
The Fund's investment objective is to seek a high level of current income exempt from federal income taxes. The Fund’s secondary investment objective is total return.
Note 2–Significant Accounting Policies
The Fund is an investment company and accordingly follows the investment company accounting and reporting guidance of the Financial Accounting Standards Board (“FASB”) Accounting Standards Codification Topic 946 Financial Services—Investment Companies. The Fund prepares its financial statements in accordance with generally accepted accounting principles (“GAAP”) in the United States of America and follows the significant accounting policies described below.
(A) Securities Valuation. Investments are usually valued as of the close of regular trading on the New York Stock Exchange (the "Exchange") (usually 4:00 p.m. Eastern time) on each day the Fund is open for business ("valuation date").
Effective September 8, 2022, and pursuant to Rule 2a-5 under the 1940 Act, the Board of Trustees of the Trust (the "Board") designated New York Life Investment Management LLC (“New York Life Investments” or the "Manager") as its Valuation Designee (the "Valuation Designee"). The Valuation Designee is responsible for performing fair valuations relating to all investments in the Fund’s portfolio for which market quotations are not readily available; periodically assessing and managing material valuation risks; establishing and applying fair value methodologies; testing fair valuation methodologies; evaluating and overseeing pricing services; segregation of valuation and portfolio management functions; providing quarterly, annual and prompt reporting to the Board, as appropriate; identifying potential conflicts of interest; and maintaining appropriate records. The Valuation Designee has established a valuation committee ("Valuation Committee") to assist in carrying out the Valuation Designee’s responsibilities and establish prices of securities for which market quotations are not readily available. The Fund’s and the Valuation Designee's policies and procedures ("Valuation Procedures") govern the Valuation Designee’s selection and application of methodologies for determining and calculating the fair value of Fund investments. The Valuation Designee may value Fund portfolio securities for which market quotations are not readily available and other Fund assets utilizing inputs from pricing services and other third-party sources (together, “Pricing Sources”). The Valuation Committee meets (in person, via electronic mail or via teleconference) on an ad-hoc basis to determine fair valuations and on a quarterly basis to review fair value events (excluding fair valuations from pricing services), including valuation risks and back-testing results, and preview reports to the Board.
The Valuation Committee establishes prices of securities for which market quotations are not readily available based on such methodologies and measurements on a regular basis after considering information that is reasonably available and deemed relevant by the Valuation Committee. The Board shall oversee the Valuation Designee and review fair valuation materials on a prompt, quarterly and annual basis and approve proposed revisions to the Valuation Procedures.
| 74 | MainStay MacKay High Yield Municipal Bond Fund |
Investments for which market quotations are not readily available are valued at fair value as determined in good faith pursuant to the Valuation Procedures. A market quotation is readily available only when that quotation is a quoted price (unadjusted) in active markets for identical investments that the Fund can access at the measurement date, provided that a quotation will not be readily available if it is not reliable. Fair value measurements are determined within a framework that establishes a three-tier hierarchy that maximizes the use of observable market data and minimizes the use of unobservable inputs to establish a classification of fair value measurements for disclosure purposes. "Inputs" refer broadly to the assumptions that market participants would use in pricing the asset or liability, including assumptions about risk, such as the risk inherent in a particular valuation technique used to measure fair value using a pricing model and/or the risk inherent in the inputs for the valuation technique. Inputs may be observable or unobservable. Observable inputs reflect the assumptions market participants would use in pricing the asset or liability based on market data obtained from sources independent of the Fund. Unobservable inputs reflect the Fund’s own assumptions about the assumptions market participants would use in pricing the asset or liability based on the information available. The inputs or methodology used for valuing assets or liabilities may not be an indication of the risks associated with investing in those assets or liabilities. The three-tier hierarchy of inputs is summarized below.
| • | Level 1—quoted prices (unadjusted) in active markets for an identical asset or liability |
| • | Level 2—other significant observable inputs (including quoted prices for a similar asset or liability in active markets, interest rates and yield curves, prepayment speeds, credit risk, etc.) |
| • | Level 3—significant unobservable inputs (including the Fund's own assumptions about the assumptions that market participants would use in measuring fair value of an asset or liability) |
The level of an asset or liability within the fair value hierarchy is based on the lowest level of an input, both individually and in the aggregate, that is significant to the fair value measurement. The aggregate value by input level of the Fund’s assets and liabilities as of October 31, 2022, is included at the end of the Portfolio of Investments.
The Fund may use third-party vendor evaluations, whose prices may be derived from one or more of the following standard inputs, among others:
| • Benchmark yields | • Reported trades |
| • Broker/dealer quotes | • Issuer spreads |
| • Two-sided markets | • Benchmark securities |
| • Bids/offers | • Reference data (corporate actions or material event notices) |
| • Industry and economic events | • Comparable bonds |
| • Monthly payment information | |
An asset or liability for which a market quotation is not readily available is valued by methods deemed reasonable in good faith by the Valuation Committee, following the Valuation Procedures to represent fair value.
Under these procedures, the Valuation Designee generally uses a market-based approach which may use related or comparable assets or liabilities, recent transactions, market multiples, book values and other relevant information. The Valuation Designee may also use an income-based valuation approach in which the anticipated future cash flows of the asset or liability are discounted to calculate fair value. Discounts may also be applied due to the nature and/or duration of any restrictions on the disposition of the asset or liability. Fair value represents a good faith approximation of the value of a security. Fair value determinations involve the consideration of a number of subjective factors, an analysis of applicable facts and circumstances and the exercise of judgment. As a result, it is possible that the fair value for a security determined in good faith in accordance with the Valuation Procedures may differ from valuations for the same security determined for other funds using their own valuation procedures. Although the Valuation Procedures are designed to value a security at the price the Fund may reasonably expect to receive upon the security's sale in an orderly transaction, there can be no assurance that any fair value determination thereunder would, in fact, approximate the amount that the Fund would actually realize upon the sale of the security or the price at which the security would trade if a reliable market price were readily available. During the year ended October 31, 2022, there were no material changes to the fair value methodologies.
Securities which may be valued in this manner include, but are not limited to: (i) a security for which trading has been halted or suspended or otherwise does not have a readily available market quotation on a given day; (ii) a debt security that has recently gone into default and for which there is not a current market quotation; (iii) a security of an issuer that has entered into a restructuring; (iv) a security that has been delisted from a national exchange; (v) a security subject to trading collars for which no or limited trading takes place; and (vi) a security whose principal market has been temporarily closed at a time when, under normal conditions, it would be open. Securities valued in this manner are generally categorized as Level 2 or 3 in the hierarchy.
Investments in mutual funds, including money market funds, are valued at their respective NAVs at the close of business each day on the valuation date. These securities are generally categorized as Level 1 in the hierarchy.
Futures contracts are valued at the last posted settlement price on the market where such futures are primarily traded. These securities are generally categorized as Level 1 in the hierarchy.
Municipal debt securities are valued at the evaluated mean prices supplied by a pricing agent or broker selected by the Manager, in consultation with the Subadvisor. The evaluations are market-based measurements processed through a pricing application and represents the pricing agent's good faith determination as to what a holder may receive in an orderly transaction under market conditions. The rules-based logic utilizes valuation techniques that reflect participants' assumptions and vary by asset class and per methodology, maximizing the use of relevant observable data including quoted prices for similar
Notes to Financial Statements (continued)
assets, benchmark yield curves and market corroborated inputs. The evaluated bid or mean prices are deemed by the Manager, in consultation with the Subadvisor, to be representative of market values, at the regular close of trading of the Exchange on each valuation date. Municipal debt securities purchased on a delayed delivery basis are marked to market daily until settlement at the forward settlement date. Municipal debt securities are generally categorized as Level 2 in the hierarchy.
In calculating NAV, each closed-end fund is valued at market value, which will generally be determined using the last reported official closing or last trading price on the exchange or market on which the security is primarily traded at the time of valuation. Price information on closed-end funds is taken from the exchange where the security is primarily traded. In addition, because closed-end funds and exchange-traded funds trade on a secondary market, their shares may trade at a premium or discount to the actual net asset value of their portfolio securities and their shares may have greater volatility because of the potential lack of liquidity. These closed-end funds are generally categorized as Level 1 in the hierarchy.
Temporary cash investments acquired in excess of 60 days to maturity at the time of purchase are valued using the latest bid prices or using valuations based on a matrix system (which considers such factors as security prices, yields, maturities and ratings), both as furnished by independent pricing services. Temporary cash investments that mature in 60 days or less at the time of purchase ("Short-Term Investments") are valued using the amortized cost method of valuation, unless the use of such method would be inappropriate. The amortized cost method involves valuing a security at its cost on the date of purchase and thereafter assuming a constant amortization to maturity of the difference between such cost and the value on maturity date. Amortized cost approximates the current fair value of a security. Securities valued using the amortized cost method are not valued using quoted prices in an active market and are generally categorized as Level 2 in the hierarchy.
The information above is not intended to reflect an exhaustive list of the methodologies that may be used to value portfolio investments. The Valuation Procedures permit the use of a variety of valuation methodologies in connection with valuing portfolio investments. The methodology used for a specific type of investment may vary based on the market data available or other considerations. The methodologies summarized above may not represent the specific means by which portfolio investments are valued on any particular business day.
A portfolio investment may be classified as an illiquid investment under the Trust's written liquidity risk management program and related procedures (“Liquidity Program”). Illiquidity of an investment might prevent the sale of such investment at a time when the Manager or the Subadvisor might wish to sell, and these investments could have the effect of decreasing the overall level of the Fund's liquidity. Further, the lack of an established secondary market may make it more difficult to value illiquid investments, requiring the Fund to rely on judgments that may be somewhat subjective in measuring value, which could vary materially from the amount that the Fund could realize upon disposition. Difficulty in selling illiquid investments may result in a loss or may be
costly to the Fund. An illiquid investment is any investment that the Manager or Subadvisor reasonably expects cannot be sold or disposed of in current market conditions in seven calendar days or less without the sale or disposition significantly changing the market value of the investment. The liquidity classification of each investment will be made using information obtained after reasonable inquiry and taking into account, among other things, relevant market, trading and investment-specific considerations in accordance with the Liquidity Program. Illiquid investments are often fair valued in accordance with the Fund's procedures described above. The liquidity of the Fund's investments was determined as of October 31, 2022, and can change at any time. Illiquid investments as of October 31, 2022, are shown in the Portfolio of Investments.
(B) Income Taxes. The Fund's policy is to comply with the requirements of the Internal Revenue Code of 1986, as amended (the “Internal Revenue Code”), applicable to regulated investment companies and to distribute all of its taxable income to the shareholders of the Fund within the allowable time limits.
The Manager evaluates the Fund’s tax positions to determine if the tax positions taken meet the minimum recognition threshold in connection with accounting for uncertainties in income tax positions taken or expected to be taken for the purposes of measuring and recognizing tax liabilities in the financial statements. Recognition of tax benefits of an uncertain tax position is permitted only to the extent the position is “more likely than not” to be sustained assuming examination by taxing authorities. The Manager analyzed the Fund's tax positions taken on federal, state and local income tax returns for all open tax years (for up to three tax years) and has concluded that no provisions for federal, state and local income tax are required in the Fund's financial statements. The Fund's federal, state and local income tax and federal excise tax returns for tax years for which the applicable statutes of limitations have not expired are subject to examination by the Internal Revenue Service and state and local departments of revenue.
(C) Dividends and Distributions to Shareholders. Dividends and distributions are recorded on the ex-dividend date. The Fund intends to declare dividends from net investment income, if any, daily and intends to pay them at least monthly and declares and pays distributions from net realized capital gains, if any, at least annually. Unless a shareholder elects otherwise, all dividends and distributions are reinvested at NAV in the same class of shares of the Fund. Dividends and distributions to shareholders are determined in accordance with federal income tax regulations and may differ from determinations using GAAP.
(D) Security Transactions and Investment Income. The Fund records security transactions on the trade date. Realized gains and losses on security transactions are determined using the identified cost method. Discounts and premiums on securities purchased, other than temporary cash investments that mature in 60 days or less at the time of purchase, for the Fund are accreted and amortized, respectively, on the effective interest rate method.
| 76 | MainStay MacKay High Yield Municipal Bond Fund |
Investment income and realized and unrealized gains and losses on investments of the Fund are allocated pro rata to the separate classes of shares based upon their relative net assets on the date the income is earned or realized and unrealized gains and losses are incurred.
The Fund may place a debt security on non-accrual status and reduce related interest income by ceasing current accruals and writing off all or a portion of any interest receivables when the collection of all or a portion of such interest has become doubtful. A debt security is removed from non-accrual status when the issuer resumes interest payments or when collectability of interest is reasonably assured.
(E) Expenses. Expenses of the Trust are allocated to the individual Funds in proportion to the net assets of the respective Funds when the expenses are incurred, except where direct allocations of expenses can be made. Expenses (other than transfer agent expenses and fees incurred under the shareholder services plans and/or the distribution plans further discussed in Note 3(B)) are allocated to separate classes of shares pro rata based upon their relative net assets on the date the expenses are incurred. The expenses borne by the Fund, including those of related parties to the Fund, are shown in the Statement of Operations.
Additionally, the Fund may invest in mutual funds, which are subject to management fees and other fees that may cause the costs of investing in mutual funds to be greater than the costs of owning the underlying securities directly. These indirect expenses of mutual funds are not included in the amounts shown as expenses in the Statement of Operations or in the expense ratios included in the Financial Highlights.
(F) Use of Estimates. In preparing financial statements in conformity with GAAP, the Manager makes estimates and assumptions that affect the reported amounts and disclosures in the financial statements. Actual results could differ from those estimates and assumptions.
(G) Futures Contracts. A futures contract is an agreement to purchase or sell a specified quantity of an underlying instrument at a specified future date and price, or to make or receive a cash payment based on the value of a financial instrument (e.g., foreign currency, interest rate, security or securities index). The Fund is subject to risks such as market price risk, leverage risk, liquidity risk, counterparty risk, operational risk, legal risk and/or interest rate risk in the normal course of investing in these contracts. Upon entering into a futures contract, the Fund is required to pledge to the broker or futures commission merchant an amount of cash and/or U.S. government securities equal to a certain percentage of the collateral amount, known as the “initial margin.” During the period the futures contract is open, changes in the value of the contract are recognized as unrealized appreciation or depreciation by marking to market such contract on a daily basis to reflect the market value of the contract at the end of each day’s trading. The Fund agrees to receive from or pay to the broker or futures commission merchant an amount of cash equal to the daily fluctuation in the value of the contract. Such receipts or payments are known as “variation margin.” When the futures contract is closed, the Fund records a realized gain or loss equal
to the difference between the proceeds from (or cost of) the closing transaction and the Fund's basis in the contract.
The use of futures contracts involves, to varying degrees, elements of market risk in excess of the amount recognized in the Statement of Assets and Liabilities. The contract or notional amounts and variation margin reflect the extent of the Fund's involvement in open futures positions. There are several risks associated with the use of futures contracts as hedging techniques. There can be no assurance that a liquid market will exist at the time when the Fund seeks to close out a futures contract. If no liquid market exists, the Fund would remain obligated to meet margin requirements until the position is closed. Futures contracts may involve a small initial investment relative to the risk assumed, which could result in losses greater than if the Fund did not invest in futures contracts. Futures contracts may be more volatile than direct investments in the instrument underlying the futures and may not correlate to the underlying instrument, causing a given hedge not to achieve its objectives. The Fund's activities in futures contracts have minimal counterparty risk as they are conducted through regulated exchanges that guarantee the futures against default by the counterparty. In the event of a bankruptcy or insolvency of a futures commission merchant that holds margin on behalf of the Fund, the Fund may not be entitled to the return of the entire margin owed to the Fund, potentially resulting in a loss. The Fund may invest in futures contracts to seek enhanced returns or to reduce the risk of loss by hedging certain of its holdings. The Fund's investment in futures contracts and other derivatives may increase the volatility of the Fund's NAVs and may result in a loss to the Fund. Open futures contracts as of October 31, 2022, are shown in the Portfolio of Investments.
(H) Municipal Bond Risk. The Fund may invest more heavily in municipal bonds from certain cities, states, territories or regions than others, which may increase the Fund’s exposure to losses resulting from economic, political, regulatory occurrences, or declines in tax revenue impacting these particular cities, states, territories or regions. In addition, many state and municipal governments that issue securities are under significant economic and financial stress and may not be able to satisfy their obligations, and these events may be made worse due to economic challenges posed by COVID-19. The Fund may invest a substantial amount of its assets in municipal bonds whose interest is paid solely from revenues of similar projects, such as tobacco settlement bonds. If the Fund concentrates its investments in this manner, it assumes the legal and economic risks relating to such projects and this may have a significant impact on the Fund’s investment performance.
Certain of the issuers in which the Fund may invest have recently experienced, or may experience, significant financial difficulties and repeated credit rating downgrades. On May 3, 2017, the Commonwealth of Puerto Rico (the "Commonwealth") began proceedings pursuant to the Puerto Rico Oversight, Management, and Economic Stability Act (“PROMESA”) to seek bankruptcy-type protections from approximately $74 billion in debt and approximately $48 billion in unfunded pension obligations. In addition, the economic downturn following the outbreak of
Notes to Financial Statements (continued)
COVID-19 and the resulting pressure on Puerto Rico’s budget have further contributed to its financial challenges. The federal government has passed certain relief packages, including the Coronavirus Aid, Relief, and Economic Security Act and the American Rescue Plan, which include an aggregate of more than $7 billion in disaster relief funds for the U.S. territories, including Puerto Rico. However, there can be no assurances that the federal funds allocated to the Commonwealth will be sufficient to address the economic challenges arising from COVID-19.
The Commonwealth concluded its Title III restructuring proceedings on behalf of itself and certain instrumentalities effective March 15th, 2022. Approximately $18.75 billion of claims related to debt guaranteed under Puerto Rico's constitution including the Commonwealth of Puerto Rico and Public Building Authority were restructured with issuance of $7.4 billion in new Puerto Rico General Obligation Bonds, $7.1 billion of cash, and $3.5 billion of new Contingent Value instruments. In addition the Commonwealth's exit from the restructuring proceedings resolved certain claims relating to the Commonwealth Employee Retirement System, Convention Center, Highway Authority, and Infrastructure Financing Authority. Several of Commonwealth's agencies are still under Title III restructuring proceedings including the Highway Authority and Electric Authority.
Puerto Rico’s debt restructuring process and other economic, political, social, environmental or health factors or developments could occur rapidly and may significantly affect the value of municipal securities of Puerto Rico. Due to the ongoing budget impact from COVID-19 on the Commonwealth’s finances, the Federal Oversight and Management Board for Puerto Rico or the Commonwealth itself could seek to revise or even terminate earlier agreements reached with certain creditors prior to the outbreak of COVID-19. Any agreement between the Federal Oversight and Management Board and creditors is subject to approval by the judge overseeing the Title III proceedings. The composition of the Federal Oversight and Management Board has changed during the recent period due to existing members either stepping down or being replaced following the expiration of a member's term. There is no assurance that board members will approve the restructuring agreements the prior board had negotiated.
The Fund’s vulnerability to potential losses associated with such developments may be reduced through investing in municipal securities that feature credit enhancements (such as bond insurance). The bond insurance provider pays both principal and interest when due to the bond holder. The magnitude of Puerto Rico’s debt restructuring or other adverse economic developments could pose significant strains on the ability of municipal securities insurers to meet all future claims. As of October 31, 2022, 19.8% of the Puerto Rico municipal securities held by the Fund were insured.
(I) Indemnifications. Under the Trust’s organizational documents, its officers and trustees are indemnified against certain liabilities that may arise out of performance of their duties to the Trust. Additionally, in the normal course of business, the Fund enters into contracts with third-party service providers that contain a variety of representations and warranties
and that may provide general indemnifications. The Fund's maximum exposure under these arrangements is unknown, as this would involve future claims that may be made against the Fund that have not yet occurred. The Manager believes that the risk of loss in connection with these potential indemnification obligations is remote. However, there can be no assurance that material liabilities related to such obligations will not arise in the future, which could adversely impact the Fund.
(J) Quantitative Disclosure of Derivative Holdings. The following tables show additional disclosures related to the Fund's derivative and hedging activities, including how such activities are accounted for and their effect on the Fund's financial positions, performance and cash flows.
The Fund entered into futures contracts to help manage the duration and yield curve positioning of the portfolio. These derivatives are not accounted for as hedging instruments.
Fair value of derivative instruments as of October 31, 2022:
| Asset Derivatives | Interest
Rate
Contracts
Risk | Total |
| Futures Contracts - Net Assets—Net unrealized appreciation on futures contracts (a) | $60,989,468 | $60,989,468 |
| Total Fair Value | $60,989,468 | $60,989,468 |
| (a) | Includes cumulative appreciation (depreciation) of futures contracts as reported in the Portfolio of Investments. Only current day’s variation margin is reported within the Statement of Assets and Liabilities. |
The effect of derivative instruments on the Statement of Operations for the year ended October 31, 2022:
| Net Realized Gain (Loss) from: | Interest
Rate
Contracts
Risk | Total |
| Futures Contracts | $57,429,264 | $57,429,264 |
| Total Net Realized Gain (Loss) | $57,429,264 | $57,429,264 |
| Net Change in Unrealized Appreciation (Depreciation) | Interest
Rate
Contracts
Risk | Total |
| Futures Contracts | $60,628,727 | $60,628,727 |
| Total Net Change in Unrealized Appreciation (Depreciation) | $60,628,727 | $60,628,727 |
| Average Notional Amount | Total |
| Futures Contracts Short | $(421,649,609) |
| 78 | MainStay MacKay High Yield Municipal Bond Fund |
Note 3–Fees and Related Party Transactions
(A) Manager and Subadvisor. New York Life Investments, a registered investment adviser and an indirect, wholly-owned subsidiary of New York Life Insurance Company ("New York Life"), serves as the Fund's Manager, pursuant to an Amended and Restated Management Agreement ("Management Agreement"). The Manager provides offices, conducts clerical, recordkeeping and bookkeeping services and keeps most of the financial and accounting records required to be maintained by the Fund. Except for the portion of salaries and expenses that are the responsibility of the Fund, the Manager pays the salaries and expenses of all personnel affiliated with the Fund and certain operational expenses of the Fund. During a portion of the year ended October 31, 2022, the Fund reimbursed New York Life Investments in an amount equal to the portion of the compensation of the Chief Compliance Officer attributable to the Fund. MacKay Shields LLC ("MacKay Shields" or the "Subadvisor"), a registered investment adviser and an indirect, wholly-owned subsidiary of New York Life, serves as the Subadvisor to the Fund and is responsible for the day-to-day portfolio management of the Fund. Pursuant to the terms of an Amended and Restated Subadvisory Agreement ("Subadvisory Agreement") between New York Life Investments and MacKay Shields, New York Life Investments pays for the services of the Subadvisor.
Effective February 28, 2022, pursuant to the Management Agreement, the Fund pays the Manager a monthly fee for the services performed and the facilities furnished at an annual rate of the Fund’s average daily net assets as follows: 0.55% up to $1 billion; 0.54% from $1 billion to $3 billion; 0.53% from $3 billion to $5 billion; 0.52% from $5 billion to $7 billion and 0.51% from $7 billion to $9 billion; 0.50% from $9 billion to $11 billion; 0.49% from $11 billion to $13 billion; 0.48% in excess of $13 billion. During the year ended October 31, 2022, the effective management fee rate was 0.52% of the Fund’s average daily net assets, exclusive of any applicable waivers/reimbursements.
Prior to February 28, 2022, the Fund paid the Manager a monthly fee for the services performed and the facilities furnished at an annual rate of the Fund’s average daily net assets as follows: 0.55% up to $ 1 billion; 0.54% from $1 billion to $3 billion; 0.53% from $3 billion to $5 billion; 0.52% from $5 billion to $7 billion; 0.51% from $7 billion to $9 billion and 0.50% in excess of $9 billion.
New York Life Investments has contractually agreed to waive fees and/or reimburse expenses so that Total Annual Fund Operating Expenses (excluding taxes, interest, litigation, extraordinary expenses, brokerage and other transaction expenses relating to the purchase or sale of portfolio investments and acquired (underlying) fund fees and expenses) of Class A shares do not exceed 0.875% of its average daily net assets. New York Life Investments will apply an equivalent waiver or reimbursement, in an equal number of basis points to Investor Class, Class C and Class I shares. New York Life Investments has contractually agreed to waive fees and/or reimburse expenses so that Total Annual Fund Operating Expenses (excluding taxes, interest, litigation, extraordinary expenses, brokerage and other transaction expenses
relating to the purchase or sale of portfolio investments, and acquired (underlying) fund fees and expenses) of Class R6 do not exceed those of Class I. These agreements will remain in effect until February 28, 2023, and shall renew automatically for one-year terms unless New York Life Investments provides written notice of termination prior to the start of the next term or upon approval of the Board.
During the year ended October 31, 2022, New York Life Investments earned fees from the Fund in the amount of $56,129,216 and paid the Subadvisor fees in the amount of $28,065,375. There were no waived fees and/or reimbursed expenses.
JPMorgan Chase Bank, N.A. ("JPMorgan") provides sub-administration and sub-accounting services to the Fund pursuant to an agreement with New York Life Investments. These services include calculating the daily NAVs of the Fund, maintaining the general ledger and sub-ledger accounts for the calculation of the Fund's NAVs, and assisting New York Life Investments in conducting various aspects of the Fund's administrative operations. For providing these services to the Fund, JPMorgan is compensated by New York Life Investments.
Pursuant to an agreement between the Trust and New York Life Investments, New York Life Investments is responsible for providing or procuring certain regulatory reporting services for the Fund. The Fund will reimburse New York Life Investments for the actual costs incurred by New York Life Investments in connection with providing or procuring these services for the Fund.
(B) Distribution and Service Fees. The Trust, on behalf of the Fund, has entered into a distribution agreement with NYLIFE Distributors LLC (the “Distributor”), an affiliate of New York Life Investments. The Fund has adopted distribution plans (the “Plans”) in accordance with the provisions of Rule 12b-1 under the 1940 Act.
Pursuant to the Class A and Investor Class Plans, the Distributor receives a monthly fee from the Class A and Investor Class shares at an annual rate of 0.25% of the average daily net assets of the Class A and Investor Class shares for distribution and/or service activities as designated by the Distributor. Pursuant to the Class C Plan, Class C shares pay the Distributor a monthly distribution fee at an annual rate of 0.75% of the average daily net assets of the Class C shares, along with a service fee at an annual rate of 0.25% of the average daily net assets of the Class C shares, for a total 12b-1 fee of 1.00%. Class I and Class R6 shares are not subject to a distribution and/or service fee.
The Plans provide that the distribution and service fees are payable to the Distributor regardless of the amounts actually expended by the Distributor for distribution of the Fund's shares and service activities.
(C) Sales Charges. The Fund was advised by the Distributor that the amount of initial sales charges retained on sales of Class A and Investor Class shares during the year ended October 31, 2022, were $76,339 and $2,340, respectively.
Notes to Financial Statements (continued)
The Fund was also advised that the Distributor retained CDSCs on redemptions of Class A, Investor Class and Class C shares during the year ended October 31, 2022, of $640,562, $4 and $30,708, respectively.
(D) Transfer, Dividend Disbursing and Shareholder Servicing Agent. NYLIM Service Company LLC, an affiliate of New York Life Investments, is the Fund's transfer, dividend disbursing and shareholder servicing agent pursuant to an agreement between NYLIM Service Company LLC and the Trust. NYLIM Service Company LLC has entered into an agreement with DST Asset Manager Solutions, Inc. ("DST"), pursuant to which DST performs certain transfer agent services on behalf of NYLIM Service Company LLC. New York Life Investments has contractually agreed to limit the transfer agency expenses charged to the Fund’s share classes to a maximum of 0.35% of that share class’s average daily net assets on an annual basis after deducting any applicable Fund or class-level expense reimbursement or small account fees. This agreement will remain in effect until February 28, 2023, and shall renew automatically for one-year terms unless New York Life Investments provides written notice of termination prior to the start of the next term or upon approval of the Board. During the year ended October 31, 2022, transfer agent expenses incurred by the Fund and any reimbursements, pursuant to the aforementioned Transfer Agency expense limitation agreement, were as follows:
| Class | Expense | Waived |
| Class A | $1,377,252 | $— |
| Investor Class | 3,243 | — |
| Class C | 199,708 | — |
| Class I | 3,897,829 | — |
| Class R6 | 49,246 | — |
(E) Small Account Fee. Shareholders with small accounts adversely impact the cost of providing transfer agency services. In an effort to reduce total transfer agency expenses, the Fund has implemented a small account fee on certain types of accounts. As described in the Fund's prospectus, certain shareholders with an account balance of less than $1,000 ($5,000 for Class A share accounts) are charged an annual per account fee of $20 (assessed semi-annually), the proceeds from which offset transfer agent fees as reflected in the Statement of Operations. This small account fee will not apply to certain types of accounts as described further in the Fund’s prospectus.
(F) Capital. As of October 31, 2022, New York Life and its affiliates beneficially held shares of the Fund with the values and percentages of net assets as follows:
| ‡ | Less than one-tenth of a percent. |
Note 4-Federal Income Tax
As of October 31, 2022, the cost and unrealized appreciation (depreciation) of the Fund’s investment portfolio, including applicable derivative contracts and other financial instruments, as determined on a federal income tax basis, were as follows:
| | Federal Tax
Cost | Gross
Unrealized
Appreciation | Gross
Unrealized
(Depreciation) | Net
Unrealized
Appreciation/
(Depreciation) |
| Investments in Securities | $9,098,933,434 | $43,068,450 | $(1,464,571,830) | $(1,421,503,380) |
As of October 31, 2022, the components of accumulated gain (loss) on a tax basis were as follows:
Ordinary
income | Undistributed
Tax Exempt
Income | Accumulated
Capital
and Other
Gain (Loss) | Other
Temporary
Differences | Unrealized
Appreciation
(Depreciation) | Total
Accumulated
Gain (Loss) |
| $— | $61,666,845 | $(319,876,944) | $(24,144,831) | $(1,421,503,380) | $(1,703,858,310) |
The difference between book-basis and tax-basis unrealized appreciation (depreciation) is primarily due to mark to market of futures, wash sale, and cumulative bond amortization adjustment. The other temporary differences are primarily due to dividends payable and defaulted bond income.
The following table discloses the current year reclassifications between total distributable earnings (loss) and additional paid-in capital arising from permanent differences; net assets as of October 31, 2022 were not affected.
| | Total
Distributable
Earnings (Loss) | Additional
Paid-In
Capital |
| | $(15,520,465) | $15,520,465 |
The reclassifications for the Fund are primarily due to redemption in-kind adjustments.
As of October 31, 2022, for federal income tax purposes, capital loss carryforwards of $319,876,944, as shown in the table below, were available to the extent provided by the regulations to offset future realized gains of the Fund. Accordingly, no capital gains distributions are expected to be paid to shareholders until net gains have been realized in excess of such amounts.
Capital Loss
Available Through | Short-Term
Capital Loss
Amounts (000’s) | Long-Term
Capital Loss
Amounts (000’s) |
| Unlimited | $228,473 | $91,404 |
| 80 | MainStay MacKay High Yield Municipal Bond Fund |
During the years ended October 31, 2022 and October 31, 2021, the tax character of distributions paid as reflected in the Statements of Changes in Net Assets was as follows:
| | 2022 | 2021 |
| Distributions paid from: | | |
| Ordinary Income | $ 27,882,361 | $ 37,325,613 |
| Exempt Interest Dividends | 332,050,579 | 291,132,776 |
| Total | $359,932,940 | $328,458,389 |
Note 5–Custodian
JPMorgan is the custodian of cash and securities held by the Fund. Custodial fees are charged to the Fund based on the Fund's net assets and/or the market value of securities held by the Fund and the number of certain transactions incurred by the Fund.
Note 6–Line of Credit
The Fund and certain other funds managed by New York Life Investments maintain a line of credit with a syndicate of banks in order to secure a source of funds for temporary purposes to meet unanticipated or excessive redemption requests.
Effective July 26, 2022, under the credit agreement (the “Credit Agreement”), the aggregate commitment amount is $600,000,000 with an additional uncommitted amount of $100,000,000. The commitment fee is an annual rate of 0.15% of the average commitment amount payable quarterly, regardless of usage, to JPMorgan, who serves as the agent to the syndicate. The commitment fee is allocated among the Fund and certain other funds managed by New York Life Investments based upon their respective net assets and other factors. Interest on any revolving credit loan is charged based upon the Federal Funds Rate, Daily Simple Secured Overnight Financing Rate ("SOFR") + 0.10%, or the Overnight Bank Funding Rate, whichever is higher. The Credit Agreement expires on July 25, 2023, although the Fund, certain other funds managed by New York Life Investments and the syndicate of banks may renew the Credit Agreement for an additional year on the same or different terms or enter into a credit agreement with a different syndicate of banks. Prior to July 26, 2022, the aggregate commitment amount and the commitment fee were the same as those under the current Credit Agreement. During the year ended October 31, 2022, there were no borrowings made or outstanding with respect to the Fund under the Credit Agreement.
Note 7–Interfund Lending Program
Pursuant to an exemptive order issued by the SEC, the Fund, along with certain other funds managed by New York Life Investments, may participate in an interfund lending program. The interfund lending program provides an alternative credit facility that permits the Fund and certain other funds managed by New York Life Investments to lend or borrow money for temporary purposes directly to or from one another, subject to the conditions of the exemptive order. During the year ended
October 31, 2022, there were no interfund loans made or outstanding with respect to the Fund.
Note 8–Purchases and Sales of Securities (in 000’s)
During the year ended October 31, 2022, purchases and sales of securities, other than short-term securities, were $5,884,079 and $7,302,005, respectively.
The Fund may purchase securities from or sell securities to other portfolios managed by the Subadvisor. These interportfolio transactions are primarily used for cash management purposes and are made pursuant to Rule 17a-7 under the 1940 Act. The Rule 17a-7 transactions during the year ended October 31, 2022, were as follows:
Purchases
(000's) | Sales
(000's) | Realized
Gain / (Loss)
(000's) |
| $1,601 | $1,618 | $(384) |
Note 9–Capital Share Transactions
Transactions in capital shares for the years ended October 31, 2022 and October 31, 2021, were as follows:
| Class A | Shares | Amount |
| Year ended October 31, 2022: | | |
| Shares sold | 179,714,632 | $ 2,169,853,689 |
| Shares issued to shareholders in reinvestment of distributions | 5,398,927 | 65,734,399 |
| Shares redeemed | (201,191,940) | (2,380,543,511) |
| Shares redeemed in connection with in-kind transactions | (22,519,084) | (294,446,031) |
| Net increase (decrease) in shares outstanding before conversion | (38,597,465) | (439,401,454) |
| Shares converted into Class A (See Note 1) | 3,711,349 | 45,615,641 |
| Shares converted from Class A (See Note 1) | (311,546) | (3,772,990) |
| Net increase (decrease) | (35,197,662) | $ (397,558,803) |
| Year ended October 31, 2021: | | |
| Shares sold | 63,834,874 | $ 857,681,513 |
| Shares issued to shareholders in reinvestment of distributions | 4,486,821 | 60,352,813 |
| Shares redeemed | (32,301,553) | (434,713,985) |
| Net increase (decrease) in shares outstanding before conversion | 36,020,142 | 483,320,341 |
| Shares converted into Class A (See Note 1) | 1,356,462 | 18,372,583 |
| Shares converted from Class A (See Note 1) | (166,586) | (2,213,344) |
| Net increase (decrease) | 37,210,018 | $ 499,479,580 |
| |
Notes to Financial Statements (continued)
| Investor Class | Shares | Amount |
| Year ended October 31, 2022: | | |
| Shares sold | 92,787 | $ 1,178,888 |
| Shares issued to shareholders in reinvestment of distributions | 11,741 | 142,182 |
| Shares redeemed | (82,666) | (1,021,684) |
| Net increase (decrease) in shares outstanding before conversion | 21,862 | 299,386 |
| Shares converted into Investor Class (See Note 1) | 11,037 | 135,526 |
| Shares converted from Investor Class (See Note 1) | (59,147) | (748,641) |
| Net increase (decrease) | (26,248) | $ (313,729) |
| Year ended October 31, 2021: | | |
| Shares sold | 101,103 | $ 1,362,027 |
| Shares issued to shareholders in reinvestment of distributions | 11,231 | 150,674 |
| Shares redeemed | (48,062) | (647,173) |
| Net increase (decrease) in shares outstanding before conversion | 64,272 | 865,528 |
| Shares converted into Investor Class (See Note 1) | 25,002 | 334,099 |
| Shares converted from Investor Class (See Note 1) | (119,553) | (1,606,920) |
| Net increase (decrease) | (30,279) | $ (407,293) |
| |
| Class C | Shares | Amount |
| Year ended October 31, 2022: | | |
| Shares sold | 2,413,582 | $ 29,806,079 |
| Shares issued to shareholders in reinvestment of distributions | 484,254 | 5,854,802 |
| Shares redeemed | (9,068,981) | (109,411,843) |
| Net increase (decrease) in shares outstanding before conversion | (6,171,145) | (73,750,962) |
| Shares converted into Class C (See Note 1) | 782 | 10,609 |
| Shares converted from Class C (See Note 1) | (94,933) | (1,127,464) |
| Net increase (decrease) | (6,265,296) | $ (74,867,817) |
| Year ended October 31, 2021: | | |
| Shares sold | 4,227,102 | $ 56,654,941 |
| Shares issued to shareholders in reinvestment of distributions | 474,352 | 6,351,408 |
| Shares redeemed | (7,069,067) | (94,605,893) |
| Net increase (decrease) in shares outstanding before conversion | (2,367,613) | (31,599,544) |
| Shares converted from Class C (See Note 1) | (272,471) | (3,638,702) |
| Net increase (decrease) | (2,640,084) | $ (35,238,246) |
| |
| Class I | Shares | Amount |
| Year ended October 31, 2022: | | |
| Shares sold | 281,989,510 | $ 3,456,526,376 |
| Shares issued to shareholders in reinvestment of distributions | 14,323,947 | 174,363,390 |
| Shares redeemed | (388,088,367) | (4,644,748,540) |
| Net increase (decrease) in shares outstanding before conversion | (91,774,910) | (1,013,858,774) |
| Shares converted into Class I (See Note 1) | 1,206,028 | 15,314,351 |
| Shares converted from Class I (See Note 1) | (33,636,572) | (420,626,039) |
| Net increase (decrease) | (124,205,454) | $(1,419,170,462) |
| Year ended October 31, 2021: | | |
| Shares sold | 249,788,253 | $ 3,351,468,000 |
| Shares issued to shareholders in reinvestment of distributions | 11,408,132 | 153,585,870 |
| Shares redeemed | (93,681,080) | (1,260,597,272) |
| Net increase (decrease) in shares outstanding before conversion | 167,515,305 | 2,244,456,598 |
| Shares converted into Class I (See Note 1) | 729,158 | 9,898,899 |
| Shares converted from Class I (See Note 1) | (58,709,452) | (761,381,503) |
| Net increase (decrease) | 109,535,011 | $ 1,492,973,994 |
| |
| Class R6 | Shares | Amount |
| Year ended October 31, 2022: | | |
| Shares sold | 35,564,395 | $ 437,022,332 |
| Shares issued to shareholders in reinvestment of distributions | 132,818 | 1,585,801 |
| Shares redeemed | (69,848,536) | (827,181,350) |
| Net increase (decrease) in shares outstanding before conversion | (34,151,323) | (388,573,217) |
| Shares converted into Class R6 (See Note 1) | 33,540,978 | 419,577,752 |
| Shares converted from Class R6 (See Note 1) | (4,369,016) | (54,378,745) |
| Net increase (decrease) | (4,979,361) | $ (23,374,210) |
| Year ended October 31, 2021: | | |
| Shares sold | 48,176,592 | $ 647,283,411 |
| Shares issued to shareholders in reinvestment of distributions | 38,049 | 513,304 |
| Shares redeemed | (13,961,483) | (187,391,394) |
| Net increase (decrease) in shares outstanding before conversion | 34,253,158 | 460,405,321 |
| Shares converted into Class R6 (See Note 1) | 58,770,374 | 761,592,585 |
| Shares converted from Class R6 (See Note 1) | (1,568,897) | (21,357,697) |
| Net increase (decrease) | 91,454,635 | $ 1,200,640,209 |
| 82 | MainStay MacKay High Yield Municipal Bond Fund |
Note 10–Other Matters
As of the date of this report, interest rates in the United States and many parts of the world, including certain European countries, are ascending from historically low levels. Thus, the Fund currently faces a heightened level of risk associated with rising interest rates. This could be driven by a variety of factors, including but not limited to central bank monetary policies, changing inflation or real growth rates, general economic conditions, increasing bond issuances or reduced market demand for low yielding investments.
An outbreak of COVID-19, first detected in December 2019, has developed into a global pandemic and has resulted in travel restrictions, closure of international borders, certain businesses and securities markets, restrictions on securities trading activities, prolonged quarantines, supply chain disruptions, and lower consumer demand, as well as general concern and uncertainty. In 2022, many countries lifted some or all restrictions related to COVID-19. However, the continued impact of COVID-19 and related variants is uncertain and could further adversely affect the global economy, national economies, individual issuers and capital markets in unforeseeable ways and result in a substantial and extended economic downturn. Developments that disrupt global economies and financial markets, such as COVID-19, may magnify factors that affect the Fund's performance.
Note 11–Subsequent Events
In connection with the preparation of the financial statements of the Fund as of and for the year ended October 31, 2022, events and transactions subsequent to October 31, 2022, through the date the financial statements were issued have been evaluated by the Manager for possible adjustment and/or disclosure. No subsequent events requiring financial statement adjustment or disclosure have been identified.
Report of Independent Registered Public Accounting Firm
To the Shareholders of the Fund and Board of Trustees
MainStay Funds Trust:
Opinion on the Financial Statements
We have audited the accompanying statement of assets and liabilities of MainStay MacKay High Yield Municipal Bond Fund (the Fund), one of the funds constituting MainStay Funds Trust, including the portfolio of investments, as of October 31, 2022, the related statement of operations for the year then ended, the statements of changes in net assets for each of the years in the two-year period then ended, and the related notes (collectively, the financial statements) and the financial highlights for each of the years or periods in the five-year period then ended. In our opinion, the financial statements and financial highlights present fairly, in all material respects, the financial position of the Fund as of October 31, 2022, the results of its operations for the year then ended, the changes in its net assets for each of the years in the two-year period then ended, and the financial highlights for each of the years or periods in the five-year period then ended, in conformity with U.S. generally accepted accounting principles.
Basis for Opinion
These financial statements and financial highlights are the responsibility of the Fund's management. Our responsibility is to express an opinion on these financial statements and financial highlights based on our audits. We are a public accounting firm registered with the Public Company Accounting Oversight Board (United States) (PCAOB) and are required to be independent with respect to the Fund in accordance with the U.S. federal securities laws and the applicable rules and regulations of the Securities and Exchange Commission and the PCAOB.
We conducted our audits in accordance with the standards of the PCAOB. Those standards require that we plan and perform the audit to obtain reasonable assurance about whether the financial statements and financial highlights are free of material misstatement, whether due to error or fraud. Our audits included performing procedures to assess the risks of material misstatement of the financial statements and financial highlights, whether due to error or fraud, and performing procedures that respond to those risks. Such procedures included examining, on a test basis, evidence regarding the amounts and disclosures in the financial statements and financial highlights. Such procedures also included confirmation of securities owned as of October 31, 2022, by correspondence with custodians and brokers; when replies were not received from brokers, we performed other auditing procedures. Our audits also included evaluating the accounting principles used and significant estimates made by management, as well as evaluating the overall presentation of the financial statements and financial highlights. We believe that our audits provide a reasonable basis for our opinion.

We have served as the auditor of one or more New York Life Investment Management investment companies since 2003.
Philadelphia, Pennsylvania
December 23, 2022
| 84 | MainStay MacKay High Yield Municipal Bond Fund |
Federal Income Tax Information
(Unaudited)
The Fund is required under the Internal Revenue Code to advise shareholders in a written statement as to the federal tax status of dividends paid by the Fund during such fiscal years.
For Federal individual income tax purposes, the Fund designated 92.3% of the ordinary income dividends paid during its fiscal year ended October 31, 2022 as attributable to interest income from Tax Exempt Municipal Bonds. Such dividends are currently exempt from Federal income taxes under Section 103(a) of the Internal Revenue Code.
For the fiscal year ended October 31, 2022, the Fund designated approximately $3,066,834 under the Internal Revenue Code as qualified dividend income eligible for reduced tax rates.
The dividends paid by the Fund during the fiscal year ended October 31, 2022 should be multiplied by 11.00% to arrive at the amount eligible for the corporate dividend-received deduction.
In February 2023, shareholders will receive an IRS Form 1099-DIV or substitute Form 1099, which will show the federal tax status of the distributions received by shareholders in calendar year 2022. The amounts that will be reported on such 1099-DIV or substitute Form 1099 will be the amounts you are to use on your federal income tax return and will differ from the amounts which we must report for the Fund's fiscal year ended October 31, 2022.
Proxy Voting Policies and Procedures and Proxy Voting Record
The Fund is required to file with the SEC its proxy voting record for the 12-month period ending June 30 on Form N-PX. A description of the policies and procedures that are used to vote proxies relating to portfolio securities of the Fund is available free of charge upon request by calling 800-624-6782 or visiting the SEC’s website at www.sec.gov. The most recent Form N-PX or proxy voting record is available free of charge upon request by calling 800-624-6782; visiting newyorklifeinvestments.com; or visiting the SEC’s website at www.sec.gov.
Shareholder Reports and Quarterly Portfolio Disclosure
The Fund is required to file its complete schedule of portfolio holdings with the SEC 60 days after its first and third fiscal quarter on Form N-PORT. The Fund's holdings report is available free of charge upon request by calling New York Life Investments at 800-624-6782.
Board of Trustees and Officers (Unaudited)
The Trustees and officers of the Fund are listed below. The Board oversees the MainStay Group of Funds (which consists of MainStay Funds and MainStay Funds Trust), MainStay VP Funds Trust, MainStay MacKay DefinedTerm Municipal Opportunities Fund, MainStay CBRE Global Infrastructure Megatrends Fund, the Manager and the Subadvisors, and elects the officers of the Funds who are responsible for the day-to-day operations of the Fund. Information pertaining to the Trustees and officers is set forth below. Each Trustee serves until his or her successor is
elected and qualified or until his or her resignation, death or removal. Under the Board’s retirement policy, unless an exception is made, a Trustee must tender his or her resignation by the end of the calendar year during which he or she reaches the age of 75. The business address of each Trustee and officer listed below is 51 Madison Avenue, New York, New York 10010. None of the Trustees are “interested persons” (as defined by the 1940 Act and rules adopted by the SEC thereunder) of the Fund (“Independent Trustees”).
| | Name and
Year of Birth | Term of Office,
Position(s) Held and
Length of Service | Principal Occupation(s)
During Past Five Years | Number of
Portfolios in
Fund Complex
Overseen by
Trustee | Other Directorships
Held by Trustee |
| | | | | | |
| | David H. Chow
1957 | MainStay Funds: Trustee since 2016, Advisory Board Member (June 2015 to December 2015);MainStay Funds Trust:
Trustee since January 2016, Advisory Board Member (June 2015 to December 2015) | Founder and CEO, DanCourt Management, LLC since 1999 | 78 | MainStay VP Funds Trust: Trustee since January 2016, Advisory Board Member (June 2015 to December 2015) (31 portfolios);
MainStay MacKay DefinedTerm Municipal Opportunities Fund: Trustee since January 2016, Advisory Board Member (June 2015 to December 2015);
MainStay CBRE Global Infrastructure Megatrends Fund: Trustee since June 2021; VanEck Vectors Group of Exchange-Traded Funds: Independent Chairman of the Board of Trustees since 2008 and Trustee since 2006 (56 portfolios); and Berea College of Kentucky: Trustee since 2009, Chair of the Investment Committee since 2018 |
| | Susan B. Kerley
1951 | MainStay Funds: Chairman since 2017 and Trustee since 2007;MainStay Funds Trust:
Chairman since 2017 and Trustee since 1990** | President, Strategic Management Advisors LLC since 1990 | 78 | MainStay VP Funds Trust: Chairman since January 2017 and Trustee since 2007 (31 portfolios)**;
MainStay MacKay DefinedTerm Municipal Opportunities Fund: Chairman since 2017 and Trustee since 2011;
MainStay CBRE Global Infrastructure Megatrends Fund: Trustee since June 2021; and Legg Mason Partners Funds: Trustee since 1991 (45 portfolios) |
| | Alan R. Latshaw
1951 | MainStay Funds: Trustee since 2006;MainStay Funds Trust:
Trustee since 2007*** | Retired; Partner, Ernst & Young LLP (2002 to 2003); Partner, Arthur Andersen LLP (1989 to 2002); Consultant to the MainStay Funds Audit and Compliance Committee (2004 to 2006) | 78 | MainStay VP Funds Trust: Trustee since 2007 (31 portfolios)**;
MainStay MacKay DefinedTerm Municipal Opportunities Fund: Trustee since 2011; and
MainStay CBRE Global Infrastructure Megatrends Fund: Trustee since June 2021 |
| 86 | MainStay MacKay High Yield Municipal Bond Fund |
| | Name and
Year of Birth | Term of Office,
Position(s) Held and
Length of Service | Principal Occupation(s)
During Past Five Years | Number of
Portfolios in
Fund Complex
Overseen by
Trustee | Other Directorships
Held by Trustee |
| | | | | | |
| | Karen Hammond
1956 | MainStay Funds: Trustee since December 2021, Advisory Board Member (June 2021 to December 2021);MainStay Funds Trust:
Trustee since December 2021, Advisory Board Member (June 2021 to December 2021)
| Retired, Managing Director, Devonshire Investors (2007 to 2013); Senior Vice President, Fidelity Management & Research Co. (2005 to 2007); Senior Vice President and Corporate Treasurer, FMR Corp. (2003 to 2005); Chief Operating Officer, Fidelity Investments Japan (2001 to 2003) | 78 | MainStay VP Funds Trust: Trustee since December 2021, Advisory Board Member (June 2021 to December 2021) (31 Portfolios);
MainStay MacKay DefinedTerm Municipal Opportunities Fund: Trustee since December 2021, Advisory Board Member (June 2021 to December 2021);
MainStay CBRE Global Infrastructure Megatrends Fund: Trustee since December 2021, Advisory Board Member (June 2021 to December 2021);
Two Harbors Investment Corp.: Director since 2018;
Rhode Island State Investment Commission: Member since 2017; and
Blue Cross Blue Shield of Rhode Island: Director since 2019 |
| | Jacques P. Perold
1958 | MainStay Funds: Trustee since 2016, Advisory Board Member (June 2015 toDecember 2015);MainStay Funds Trust:
Trustee since January 2016, Advisory Board Member (June 2015 to December 2015) | Founder and Chief Executive Officer, CapShift Advisors LLC (since 2018); President, Fidelity Management & Research Company (2009 to 2014); President and Chief Investment Officer, Geode Capital Management, LLC (2001 to 2009) | 78 | MainStay VP Funds Trust: Trustee since January 2016, Advisory Board Member (June 2015 to December 2015) (31 portfolios);
MainStay MacKay DefinedTerm Municipal Opportunities Fund: Trustee since January 2016, Advisory Board Member (June 2015 to December 2015);
MainStay CBRE Global Infrastructure Megatrends Fund: Trustee since June 2021; Partners in Health: Trustee since 2019; Allstate Corporation: Director since 2015; and MSCI Inc.: Director since 2017 |
| | Richard S. Trutanic
1952 | MainStay Funds: Trustee since 1994;MainStay Funds Trust:
Trustee since 2007*** | Chairman and Chief Executive Officer, Somerset & Company (financial advisory firm) since 2004; Managing Director, The Carlyle Group (private investment firm) (2002 to 2004); Senior Managing Director, Partner and Board Member, Groupe Arnault S.A. (private investment firm) (1999 to 2002) | 78 | MainStay VP Funds Trust: Trustee since 2007 (31 portfolios)**;
MainStay MacKay DefinedTerm Municipal Opportunities Fund: Trustee since 2011; and MainStay CBRE Global Infrastructure Megatrends Fund: Trustee since June 2021 |
| ** | Includes prior service as a Director of MainStay VP Series Fund, Inc., the predecessor to MainStay VP Funds Trust. |
| *** | Includes prior service as a Director/Trustee of certain predecessor entities to MainStay Funds Trust. |
Board of Trustees and Officers (Unaudited) (continued)
| | Name and
Year of Birth | Position(s) Held and
Length of Service | Principal Occupation(s)
During Past Five Years | |
| | | | | |
| | Kirk C. Lehneis
1974 | President, MainStay Funds, MainStay Funds Trust since 2017 | Chief Operating Officer and Senior Managing Director (since 2016), New York Life Investment Management LLC and New York Life Investment Management Holdings LLC; Member of the Board of Managers (since 2017) and Senior Managing Director (since 2018), NYLIFE Distributors LLC; Chairman of the Board and Senior Managing Director, NYLIM Service Company LLC (since 2017); Trustee, President and Principal Executive Officer of IndexIQ Trust, IndexIQ ETF Trust and IndexIQ Active ETF Trust (since January 2018); President, MainStay CBRE Global Infrastructure Megatrends Fund (since 2021), MainStay MacKay DefinedTerm Municipal Opportunities Fund and MainStay VP Funds Trust (since 2017); Senior Managing Director, Global Product Development (From 2015-2016); Managing Director, Product Development (2010 to 2015), New York Life Investment Management LLC | |
| | Jack R. Benintende
1964 | Treasurer and Principal Financial and Accounting Officer, MainStay Funds (since 2007), MainStay Funds Trust (since 2009) | Managing Director, New York Life Investment Management LLC (since 2007); Treasurer and Principal Financial and Accounting Officer, MainStay CBRE Global Infrastructure Megatrends Fund (since 2021), MainStay MacKay DefinedTerm Municipal Opportunities Fund (since 2011) and MainStay VP Funds Trust (since 2007)** and Assistant Treasurer, New York Life Investment Management Holdings LLC (2008 to 2012) | |
| | J. Kevin Gao
1967 | Secretary and Chief Legal Officer, MainStay Funds and MainStay Funds Trust (since 2010) | Managing Director and Associate General Counsel, New York Life Investment Management LLC (since 2010); Secretary and Chief Legal Officer and MainStay CBRE Global Infrastructure Megatrends Fund (since 2021), MainStay MacKay DefinedTerm Municipal Opportunities Fund (since 2011) and MainStay VP Funds Trust (since 2010)** | |
| | Scott T. Harrington
1959 | Vice President— Administration, MainStay Funds (since 2009), MainStay Funds Trust (since 2009) | Managing Director, New York Life Investment Management LLC (including predecessor advisory organizations) (since 2000); Member of the Board of Directors, New York Life Trust Company (since 2009); Vice President—Administration, MainStay CBRE Global Infrastructure Megatrends Fund (since 2021), MainStay MacKay DefinedTerm Municipal Opportunities Fund (since 2011) and MainStay VP Funds Trust (since 2005)** | |
| | Kevin M. Gleason
1967 | Vice President and Chief Compliance Officer, MainStay Funds and MainStay Funds Trust (since June 2022) | Vice President and Chief Compliance Officer, IndexIQ, IndexIQ ETF Trust and Index IQ Active ETF Trust (since June 2022); Vice President and Chief Compliance Officer, MainStay CBRE Global Infrastructure Megatrends Fund, MainStay VP Funds Trust and MainStay MacKay DefinedTerm Municipal Opportunities Fund (since June 2022); Senior Vice President, Voya Investment Management and Chief Compliance Officer, Voya Family of Funds (2012-2022) | |
| * | The officers listed above are considered to be “interested persons” of the MainStay Group of Funds, MainStay VP Funds Trust, MainStay CBRE Global Infrastructure Megatrends Fund and MainStay MacKay DefinedTerm Municipal Opportunities Fund within the meaning of the 1940 Act because of their affiliation with the MainStay Group of Funds, New York Life Insurance Company and/or its affiliates, including New York Life Investment Management LLC, NYLIM Service Company LLC, NYLIFE Securities LLC and/or NYLIFE Distributors LLC, as described in detail in the column captioned “Principal Occupation(s) During Past Five Years.” Officers are elected annually by the Board. |
| ** | Includes prior service as an Officer of MainStay VP Series Fund, Inc., the predecessor to MainStay VP Funds Trust. |
Officers of the Trust (Who are not Trustees)*
| 88 | MainStay MacKay High Yield Municipal Bond Fund |
This page intentionally left blank.
This page intentionally left blank.
Equity
U.S. Equity
MainStay Epoch U.S. Equity Yield Fund
MainStay S&P 500 Index Fund1
MainStay Winslow Large Cap Growth Fund
MainStay WMC Enduring Capital Fund
MainStay WMC Growth Fund
MainStay WMC Small Companies Fund
MainStay WMC Value Fund
International Equity
MainStay Epoch International Choice Fund
MainStay MacKay International Equity Fund
MainStay WMC International Research Equity Fund
Emerging Markets Equity
MainStay Candriam Emerging Markets Equity Fund
Global Equity
MainStay Epoch Capital Growth Fund
MainStay Epoch Global Equity Yield Fund
Fixed Income
Taxable Income
MainStay Candriam Emerging Markets Debt Fund
MainStay Floating Rate Fund
MainStay MacKay High Yield Corporate Bond Fund
MainStay MacKay Short Duration High Yield Fund
MainStay MacKay Strategic Bond Fund
MainStay MacKay Total Return Bond Fund
MainStay MacKay U.S. Infrastructure Bond Fund
MainStay Short Term Bond Fund
Tax-Exempt Income
MainStay MacKay California Tax Free Opportunities Fund2
MainStay MacKay High Yield Municipal Bond Fund
MainStay MacKay New York Tax Free Opportunities Fund3
MainStay MacKay Short Term Municipal Fund
MainStay MacKay Strategic Municipal Allocation Fund
MainStay MacKay Tax Free Bond Fund
Money Market
MainStay Money Market Fund
Mixed Asset
MainStay Balanced Fund
MainStay Income Builder Fund
MainStay MacKay Convertible Fund
Speciality
MainStay CBRE Global Infrastructure Fund
MainStay CBRE Real Estate Fund
MainStay Cushing MLP Premier Fund
Asset Allocation
MainStay Conservative Allocation Fund
MainStay Conservative ETF Allocation Fund
MainStay Defensive ETF Allocation Fund
MainStay Equity Allocation Fund
MainStay Equity ETF Allocation Fund
MainStay ESG Multi-Asset Allocation Fund
MainStay Growth Allocation Fund
MainStay Growth ETF Allocation Fund
MainStay Moderate Allocation Fund
MainStay Moderate ETF Allocation Fund
Manager
New York Life Investment Management LLC
New York, New York
Subadvisors
Candriam4
Strassen, Luxembourg
CBRE Investment Management Listed Real Assets LLC
Radnor, Pennsylvania
Cushing Asset Management, LP
Dallas, Texas
Epoch Investment Partners, Inc.
New York, New York
MacKay Shields LLC4
New York, New York
NYL Investors LLC4
New York, New York
Wellington Management Company LLP
Boston, Massachusetts
Winslow Capital Management, LLC
Minneapolis, Minnesota
Legal Counsel
Dechert LLP
Washington, District of Columbia
Independent Registered Public Accounting Firm
KPMG LLP
Philadelphia, Pennsylvania
Distributor
NYLIFE Distributors LLC4
Jersey City, New Jersey
Custodian
JPMorgan Chase Bank, N.A.
New York, New York
1.
Prior to February 28, 2022, the Fund's name was MainStay MacKay S&P 500 Index Fund.
| 2. | This Fund is registered for sale in AZ, CA, NV, OR, TX, UT, WA and MI (Class A and Class I shares only), and CO, FL, GA, HI, ID, MA, MD, NH, NJ and NY (Class I shares only). |
| 3. | This Fund is registered for sale in CA, CT, DE, FL, MA, NJ, NY and VT. |
| 4. | An affiliate of New York Life Investment Management LLC. |
Not part of the Annual Report
For more information
800-624-6782
newyorklifeinvestments.com
“New York Life Investments” is both a service mark, and the common trade name, of certain investment advisors affiliated with New York Life Insurance Company. The MainStay Funds® are managed by New York Life Investment Management LLC and distributed by NYLIFE Distributors LLC, 30 Hudson Street, Jersey City, NJ 07302, a wholly owned subsidiary of New York Life Insurance Company. NYLIFE Distributors LLC is a Member FINRA/SIPC.
©2022 NYLIFE Distributors LLC. All rights reserved.
| 5013761.2MS229-22 | MSMHY11-12/22 |
(NYLIM) NL243
MainStay MacKay New York Tax Free Opportunities Fund
Message from the President and Annual Report
October 31, 2022
Sign up for e-delivery of your shareholder reports. For full details on e-delivery, including who can participate and what you can receive via e-delivery,
please log in to newyorklifeinvestments.com/accounts.
| Not FDIC/NCUA Insured | Not a Deposit | May Lose Value | No Bank Guarantee | Not Insured by Any Government Agency |
This page intentionally left blank
Message from the President
A series of economic and geopolitical challenges undermined equity and fixed-income markets during the 12-month reporting period ended October 31, 2022. Stocks and bonds alike trended lower in the face of sharply rising interest rates, increasing inflationary pressures, slowing economic growth and Russia’s invasion of Ukraine.
The reporting period began on a mixed note, with concerns about the spreading Omicron variant of the COVID-19 virus and increasingly hawkish statements from the U.S. Federal Reserve (the “Fed”) regarding mounting inflation, countered by bullish sentiment stemming from U.S. economic growth and strong corporate earnings. In January 2022, markets turned decisively negative as comments from the Fed raised the likelihood of rate hikes as early as March, and Russia issued increasingly aggressive threats toward Ukraine. The onset of Russia’s invasion in February exacerbated global inflationary pressures while increasing investor uncertainty. Domestic supply shortages, international trade imbalances and rising inflation caused GDP (gross domestic product) to contract in the first and second quarters of the year, although employment and consumer spending proved resilient. Prices for petroleum surged to multi-year highs, while many key agricultural chemicals and industrial metals climbed as well. Accelerating inflationary forces prompted the Fed to implement its most aggressive interest rate increases since the 1980s with a series of five sharp rate hikes, raising the federal funds rate from a range of 0.00% to 0.25% in March to 3.00% to 3.25% in September, with additional rate hikes expected before the end of the year. International central banks generally followed suit, raising rates by varying degrees in efforts to curb local inflation, although most increases remained significantly more modest than those in the United States. Relatively high U.S. interest rates and risk-averse international sentiment pushed U.S. dollar values higher compared to most other currencies, with the ensuing negative impact on global prices for food, fuel and other key, U.S.-dollar-denominated products.
The effects of these interrelated challenges were felt throughout U.S. and international financial markets. The S&P 500® Index, a widely regarded benchmark of U.S. market performance, declined by more than 14% during the reporting period. Although the energy sector generated strong gains, bolstered by elevated oil and gas prices, most other industry areas recorded losses. The more cyclical and growth-oriented sectors of consumer discretionary, real estate and information technology delivered the
weakest returns, while the traditionally defensive and value-oriented consumer staples, utilities and health care sectors outperformed. International stocks lagged compared to their U.S. counterparts, with some emerging markets, such as China, suffering particularly steep losses. A few markets, however, including Brazil, Mexico and the United Arab Emirates, ended the reporting period with little change. Fixed-income markets saw bond prices broadly decline as yields rose along with interest rates. Short-term yields rose faster than long-term yields, producing a yield curve inversion from July through the end of the reporting period, with long-term rates remaining below short-term rates. While floating-rate instruments, which feature variable interest rates that allow investors to benefit from a rising rate environment, provided a degree of insulation from inflation-driven trends, they were not immune to the market’s widespread declines.
While the Fed acknowledges the costs of rising rates in terms of weaker GDP growth and unsettled financial markets over the short term, its primary focus continues to be the longer-term economic impact of inflation. With the latest figures as of the date of this report showing that inflation remains above 8%, versus a target rate of just 2%, the Fed clearly has a distance yet to go, making further rate increases and market volatility more likely in the coming months. The question remains as to whether the Fed and other central banks will manage a so-called “soft landing,” curbing inflation while avoiding a persistent economic slowdown. If they prove successful, we expect that favorable inflation trends and increasingly attractive valuations in both equity and bond markets should eventually translate into sustainable improvements in the investment environment.
Whatever actions the Fed takes and however financial markets react, as a MainStay investor, you can depend on us to continue providing the insight, expertise and service that have long defined New York Life Investments. Thank you for trusting us to help you meet your investment needs.
Sincerely,
Kirk C. Lehneis
President
The opinions expressed are as of the date of this report and are subject to change. There is no guarantee that any forecast made will come to pass. This material does not constitute investment advice and is not intended as an endorsement of any specific investment. Past performance is no guarantee of future results.
Not part of the Annual Report
Investors should refer to the Fund’s Summary Prospectus and/or Prospectus and consider the Fund’s investment objectives, strategies, risks, charges and expenses carefully before investing. The Summary Prospectus and/or Prospectus contain this and other information about the Fund. You may obtain copies of the Fund’s Summary Prospectus, Prospectus and Statement of Additional Information, which includes information about the MainStay Funds Trust's Trustees, free of charge, upon request, by calling toll-free 800-624-6782, by writing to NYLIFE Distributors LLC, Attn: MainStay Marketing Department, 30 Hudson Street, Jersey City, NJ 07302 or by sending an e-mail to MainStayShareholderServices@nylim.com. These documents are also available via the MainStay Funds’ website at newyorklifeinvestments.com. Please read the Fund’s Summary Prospectus and/or Prospectus carefully before investing.
Investment and Performance Comparison (Unaudited)
Performance data quoted represents past performance. Past performance is no guarantee of future results. Because of market volatility and other factors, current performance may be lower or higher than the figures shown. Investment return and principal value will fluctuate, and as a result, when shares are redeemed, they may be worth more or less than their original cost. The graph below depicts the historical performance of Class I shares of the Fund. Performance will vary from class to class based on differences in class-specific expenses and sales charges. For performance information current to the most recent month-end, please call 800-624-6782 or visit newyorklifeinvestments.com.
The performance table and graph do not reflect the deduction of taxes that a shareholder would pay on distributions or Fund share redemptions. Total returns reflect maximum applicable sales charges as indicated in the table below, if any, changes in share price, and reinvestment of dividend and capital gain distributions. The graph assumes the initial investment amount shown below and reflects the deduction of all sales charges that would have applied for the period of investment. Performance figures may reflect certain fee waivers and/or expense limitations, without which total returns may have been lower. For more information on share classes and current fee waivers and/or expense limitations (if any), please refer to the Notes to Financial Statements.
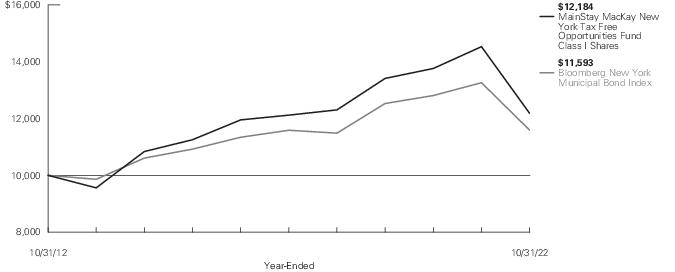
| Average Annual Total Returns for the Year-Ended October 31, 2022 |
| Class | Sales Charge | | Inception
Date | One
Year | Five
Years | Ten Years
or Since
Inception | Gross
Expense
Ratio1 |
| Class A Shares2 | Maximum 3% Initial Sales Charge | With sales charges | 5/14/2012 | -20.12% | -1.06% | 1.27% | 0.75% |
| | | Excluding sales charges | | -16.36 | -0.14 | 1.74 | 0.75 |
| Investor Class Shares3, 4 | Maximum 2.5% Initial Sales Charge | With sales charges | 5/14/2012 | -19.71 | -1.07 | 1.22 | 0.77 |
| | | Excluding sales charges | | -16.37 | -0.16 | 1.68 | 0.77 |
| Class C Shares | Maximum 1% CDSC | With sales charges | 5/14/2012 | -17.39 | -0.41 | 1.43 | 1.02 |
| | if Redeemed Within One Year of Purchase | Excluding sales charges | | -16.58 | -0.41 | 1.43 | 1.02 |
| Class C2 Shares | Maximum 1% CDSC | With sales charges | 8/31/2020 | -17.61 | N/A | -6.31 | 1.17 |
| | if Redeemed Within One Year of Purchase | Excluding sales charges | | -16.80 | N/A | -6.31 | 1.17 |
| Class I Shares | No Sales Charge | | 5/14/2012 | -16.15 | 0.11 | 1.99 | 0.50 |
| Class R6 Shares | No Sales Charge | | 11/1/2019 | -16.14 | N/A | -3.14 | 0.48 |
| 1. | The gross expense ratios presented reflect the Fund’s “Total Annual Fund Operating Expenses” from the most recent Prospectus, as supplemented, and may differ from other expense ratios disclosed in this report. |
| 2. | Prior to August 10, 2022, the maximum initial sales charge was 4.5%, which is reflected in the applicable average annual total return figures shown. |
| 3. | Prior to June 30, 2020, the maximum initial sales charge was 4.5%, which is reflected in the applicable average annual total return figures shown. |
| 4. | Prior to August 10, 2022, the maximum initial sales charge was 4%, which is reflected in the applicable average annual total return figures shown. |
The footnotes on the next page are an integral part of the table and graph and should be carefully read in conjunction with them.
| Benchmark Performance* | One
Year | Five
Years | Ten
Years | Since
Inception |
| Bloomberg New York Municipal Bond Index1 | -12.58% | 0.01% | 1.49% | 1.66% |
| Morningstar Muni New York Long Category Average2 | -15.76 | -0.37 | 1.03 | 1.30 |
| * | Returns for indices reflect no deductions for fees, expenses or taxes, except for foreign withholding taxes where applicable. Results assume reinvestment of all dividends and capital gains. An investment cannot be made directly in an index. |
| 1. | The Bloomberg New York Municipal Bond Index is the Fund's primary broad-based securities market index for comparison purposes. The Bloomberg New York Municipal Bond Index is a market value-weighted index of New York investment grade tax exempt fixed-rate municipal bonds with maturities of one year or more. |
| 2. | The Morningstar Muni New York Long Category Average is representative of funds that invest at least 80% of assets in New York municipal debt. These portfolios have durations of more than 7.0 years. Results are based on average total returns of similar funds with all dividends and capital gain distributions reinvested. |
The footnotes on the preceding page are an integral part of the table and graph and should be carefully read in conjunction with them.
| 6 | MainStay MacKay New York Tax Free Opportunities Fund |
Cost in Dollars of a $1,000 Investment in MainStay MacKay New York Tax Free Opportunities Fund (Unaudited)
The example below is intended to describe the fees and expenses borne by shareholders during the six-month period from May 1, 2022 to October 31, 2022, and the impact of those costs on your investment.
Example
As a shareholder of the Fund you incur two types of costs: (1) transaction costs, including exchange fees and sales charges (loads) on purchases (as applicable), and (2) ongoing costs, including management fees, distribution and/or service (12b-1) fees and other Fund expenses (as applicable). This example is intended to help you understand your ongoing costs (in dollars) of investing in the Fund and to compare these costs with the ongoing costs of investing in other mutual funds. The example is based on an investment of $1,000 made at the beginning of the six-month period and held for the entire period from May 1, 2022 to October 31, 2022.
This example illustrates your Fund’s ongoing costs in two ways:
Actual Expenses
The second and third data columns in the table below provide information about actual account values and actual expenses. You may use the information in these columns, together with the amount you invested, to estimate the expenses that you paid during the six months ended October 31, 2022. Simply divide your account value by $1,000 (for example, an
$8,600 account value divided by $1,000 = 8.6), then multiply the result by the number under the heading entitled “Expenses Paid During Period” to estimate the expenses you paid on your account during this period.
Hypothetical Example for Comparison Purposes
The fourth and fifth data columns in the table below provide information about hypothetical account values and hypothetical expenses based on the Fund’s actual expense ratio and an assumed rate of return of 5% per year before expenses, which is not the Fund’s actual return. The hypothetical account values and expenses may not be used to estimate the actual ending account balances or expenses you paid for the six-month period shown. You may use this information to compare the ongoing costs of investing in the Fund with the ongoing costs of investing in other mutual funds. To do so, compare this 5% hypothetical example with the 5% hypothetical examples that appear in the shareholder reports of the other mutual funds.
Please note that the expenses shown in the table are meant to highlight your ongoing costs only and do not reflect any transactional costs, such as exchange fees or sales charges (loads). Therefore, the fourth and fifth data columns of the table are useful in comparing ongoing costs only and will not help you determine the relative total costs of owning different funds. In addition, if these transactional costs were included, your costs would have been higher.
| Share Class | Beginning
Account
Value
5/1/22 | Ending Account
Value (Based
on Actual
Returns and
Expenses)
10/31/22 | Expenses
Paid
During
Period1 | Ending Account
Value (Based
on Hypothetical
5% Annualized
Return and
Actual Expenses)
10/31/22 | Expenses
Paid
During
Period1 | Net Expense
Ratio
During
Period2 |
| Class A Shares | $1,000.00 | $929.30 | $3.65 | $1,021.42 | $3.82 | 0.75% |
| Investor Class Shares | $1,000.00 | $929.20 | $3.70 | $1,021.37 | $3.87 | 0.76% |
| Class C Shares | $1,000.00 | $928.00 | $4.91 | $1,020.11 | $5.14 | 1.01% |
| Class C2 Shares | $1,000.00 | $926.30 | $5.63 | $1,019.36 | $5.90 | 1.16% |
| Class I Shares | $1,000.00 | $929.50 | $2.43 | $1,022.68 | $2.55 | 0.50% |
| Class R6 Shares | $1,000.00 | $929.50 | $2.43 | $1,022.68 | $2.55 | 0.50% |
| 1. | Expenses are equal to the Fund’s annualized expense ratio of each class multiplied by the average account value over the period, divided by 365 and multiplied by 184 (to reflect the six-month period). The table above represents the actual expenses incurred during the six-month period. In addition to the fees and expenses which the Fund bears directly, it also indirectly bears a pro rata share of the fees and expenses of the underlying funds in which it invests. Such indirect expenses are not included in the above-reported expense figures. |
| 2. | Expenses are equal to the Fund's annualized expense ratio to reflect the six-month period. |
Industry Composition as of October 31, 2022 (Unaudited)
| Other Revenue | 33.7% |
| Transportation | 16.6 |
| Education | 15.0 |
| General Obligation | 9.6 |
| Hospital | 8.7 |
| Water & Sewer | 4.9 |
| Utilities | 3.0 |
| Housing | 1.7% |
| Certificate of Participation/Lease | 0.1 |
| Closed–End Funds | 0.2 |
| Short–Term Investment | 6.0 |
| Other Assets, Less Liabilities | 0.5 |
| | 100.0% |
See Portfolio of Investments beginning on page 11 for specific holdings within these categories. The Fund's holdings are subject to change.
Top Ten Holdings and/or Issuers Held as of October 31, 2022 (excluding short-term investments) (Unaudited)
| 1. | New York State Dormitory Authority, 3.00%-5.00%, due 3/15/31–7/1/53 |
| 2. | Metropolitan Transportation Authority, 1.60%-5.00%, due 11/15/27–11/15/54 |
| 3. | New York City Industrial Development Agency, (zero coupon)-5.00%, due 7/1/28–3/1/49 |
| 4. | New York Transportation Development Corp., 4.00%-5.25%, due 12/1/29–4/30/53 |
| 5. | City of New York NY, 1.60%-5.25%, due 4/1/30–8/1/50 |
| 6. | Build NYC Resource Corp., 4.00%-5.50%, due 7/1/30–7/1/56 |
| 7. | Port Authority of New York & New Jersey, 4.00%-5.50%, due 10/15/34–7/15/50 |
| 8. | New York Liberty Development Corp., 2.75%-5.50%, due 10/1/37–9/15/52 |
| 9. | Triborough Bridge & Tunnel Authority, 4.00%-5.50%, due 11/15/44–11/15/57 |
| 10. | Monroe County Industrial Development Corp., 4.00%-5.00%, due 6/1/24–7/1/50 |
| 8 | MainStay MacKay New York Tax Free Opportunities Fund |
Portfolio Management Discussion and Analysis (Unaudited)
Questions answered by portfolio managers John Loffredo, CFA, Robert DiMella, CFA, Michael Petty, David Dowden, Scott Sprauer, Frances Lewis and Michael Denlinger of MacKay Shields LLC, the Fund’s Subadvisor.
How did MainStay MacKay New York Tax Free Opportunities Fund perform relative to its benchmark and peer group during the 12 months ended October 31, 2022?
For the 12 months ended October 31, 2022, Class I shares of MainStay MacKay New York Tax Free Opportunities Fund returned −16.15%, underperforming the −12.58% return of the Fund’s benchmark, the Bloomberg New York Municipal Bond Index (the "Index"). Over the same period, Class I shares also underperformed the −15.76% return of the Morningstar Muni New York Long Category Average.1
Were there any changes to the Fund during the reporting period?
Effective February 28, 2022, Michael Denlinger was added as a portfolio manager of the Fund.
What factors affected the Fund’s relative performance during the reporting period?
During the reporting period, both municipal and Treasury rates rose, with the municipal yield curve2 steepening as outflows persisted. As a result, ratios cheapened across the curve, most notably on the long end. The Fund’s yield curve positioning drove underperformance compared to the Index, as the increase in rates resulted in overweight exposure to bonds maturing in 15+ years, detracting from relative returns. In addition, the Fund’s overweight exposure to bonds with coupons of 4% detracted from the return. From a rating perspective, the Fund’s overweight allocation to bonds rated BBB-BB detracted from relative performance; however, the underperformance was partially offset by underweight exposure to bonds rated AAA.3 An off-Index allocation to Puerto Rico further detracted from performance.
During the reporting period, were there any market events that materially impacted the Fund’s performance or liquidity?
During the reporting period, markets extended their historic drawdown driven by the combination of rising Treasury yields, ongoing monetary policy tightening and geopolitical uncertainty. The municipal market mirrored this broader sell-off, and many
investors reacted by withdrawing money from their municipal holdings. The municipal market experienced record outflows, which ultimately drove municipal yields higher.
During the reporting period, how was the Fund’s performance materially affected by investments in derivatives?
The Fund will employ Treasury futures hedges at times, typically as a paired strategy with longer maturity bonds, to dampen duration4 and interest-rate sensitivity. During the reporting period, this hedge was additive to Fund performance, as municipal exposure on the long end of the curve underperformed the market.
What was the Fund’s duration strategy during the reporting period?
The Fund’s duration was targeted to remain in a neutral range relative to the Fund’s investable universe, as outlined in the prospectus. In addition to investment-grade New York bonds, the Fund may invest in bonds of U.S. territories (Puerto Rico, Guam and the U.S. Virgin Islands) and up to 20% of net assets in municipal bonds below investment grade. Since the Fund’s investable universe is broader than the Index, the Fund’s duration may also differ from that of the Index. The Fund ended the reporting period with a longer duration posture than the Index. As of October 31, 2022, the Fund's modified duration to worst5 was 8.33 years while the Index’s modified duration to worst was 6.89 years.
During the reporting period, which sectors were the strongest positive contributors to the Fund’s relative performance and which sectors were particularly weak?
During the reporting period, the Fund’s underweight exposure to the special tax, housing and the water and sewer sectors made positive contributions to relative performance. (Contributions take weightings and total returns into account.) Conversely, the Fund’s overweight exposures to the hospital and education sectors were the most significant detractors from relative returns.
| 1. | See page 5 for other share class returns, which may be higher or lower than Class I share returns. See page 6 for more information on benchmark and peer group returns. |
| 2. | The yield curve is a line that plots the yields of various securities of similar quality—typically U.S. Treasury issues—across a range of maturities. The U.S. Treasury yield curve serves as a benchmark for other debt and is used in economic forecasting. |
| 3. | An obligation rated ‘AAA’ has the highest rating assigned by Standard & Poor’s (“S&P”), and in the opinion of S&P, the obligor’s capacity to meet its financial commitment on the obligation is extremely strong. An obligation rated ‘BBB’ by S&P is deemed by S&P to exhibit adequate protection parameters. In the opinion of S&P, however, adverse economic conditions or changing circumstances are more likely to lead to a weakened capacity of the obligor to meet its financial commitment on the obligation. An obligation rated ‘BB’ by S&P is deemed by S&P to be less vulnerable to nonpayment than other speculative issues. In the opinion of S&P, however, the obligor faces major ongoing uncertainties or exposure to adverse business, financial or economic conditions which could lead to the obligor’s inadequate capacity to meet its financial commitment on the obligation. When applied to Fund holdings, ratings are based solely on the creditworthiness of the bonds in the portfolio and are not meant to represent the security or safety of the Fund. |
| 4. | Duration is a measure of the price sensitivity of a fixed-income investment to changes in interest rates. Duration is expressed as a number of years and is considered a more accurate sensitivity gauge than average maturity. |
| 5. | Modified duration is inversely related to the approximate percentage change in price for a given change in yield. Duration to worst is the duration of a bond computed using the bond’s nearest call date or maturity, whichever comes first. This measure ignores future cash flow fluctuations due to embedded optionality. |
What were some of the Fund’s largest purchases and sales during the reporting period?
As the Fund remains focused on diversification and liquidity, no individual purchase or sale was considered significant, although sector overweights or security structure, in their entirety, would have an impact.
How did the Fund’s sector weighting change during the reporting period?
During the reporting period, there were no material changes to the weightings in the Fund. There were increases to the transportation, state general obligation and local general obligation sectors. In addition, there was an increase in bonds rated AAA-AA.6 Conversely, there was a decrease in the Fund’s exposure to the electric, IDR/PCR (industrial development revenue/pollution control revenue) and water & sewer sectors. Across the credit spectrum, there was a decrease in exposure to non-investment-grade bonds.
How was the Fund positioned at the end of the reporting period?
As of October 31, 2022, the Fund continued to hold overweight exposure to the long end of the curve. We believe more compelling ratios on the longer end of the curve will lead to outperformance of longer-maturity bonds over time. In addition, the Fund held overweight exposure to the education and hospital sectors. The Fund also held overweight exposure to non-investment-grade credits, as well as credits from U.S. territories that are not in the Index. Also, the Fund held underweight exposure to the special tax and water & sewer sectors, as well as AAA-rated bonds.
| 6. | An obligation rated ‘AA’ by S&P is deemed by S&P to differ from the highest-rated obligations only to a small degree. In the opinion of S&P, the obligor's capacity to meet its financial commitment on the obligation is very strong. When applied to Fund holdings, ratings are based solely on the creditworthiness of the bonds in the portfolio and are not meant to represent the security or safety of the Fund. |
The opinions expressed are those of the portfolio managers as of the date of this report and are subject to change. There is no guarantee that any forecasts will come to pass. This material does not constitute investment advice and is not intended as an endorsement of any specific investment.
| 10 | MainStay MacKay New York Tax Free Opportunities Fund |
Portfolio of Investments October 31, 2022†
| | Principal
Amount | Value |
| Municipal Bonds 93.3% |
| Long-Term Municipal Bonds 90.0% |
| Certificate of Participation/Lease 0.1% |
| Rensselaer City School District, Certificate of Participation | | |
| Insured: AGM State Aid Withholding | | |
| 4.00%, due 6/1/34 | $ 650,000 | $ 634,136 |
| Insured: AGM State Aid Withholding | | |
| 4.00%, due 6/1/35 | 850,000 | 825,370 |
| | | 1,459,506 |
| Education 15.0% |
| Albany Capital Resource Corp., Albany College of Pharmacy and Health Sciences, Revenue Bonds | | |
| Series A | | |
| 5.00%, due 12/1/33 | 150,000 | 149,923 |
| Albany Capital Resource Corp., Albany Leadership Charter High School For Girls Project, Revenue Bonds | | |
| 5.00%, due 6/1/49 | 2,380,000 | 2,012,845 |
| Albany Capital Resource Corp., Brighter Choice Elementary Charter Schools, Revenue Bonds | | |
| Series A | | |
| 4.00%, due 4/1/37 | 2,065,000 | 1,684,049 |
| Albany Capital Resource Corp., Equitable School Revolving Fund LLC, Revenue Bonds | | |
| Series D | | |
| 4.00%, due 11/1/46 | 3,000,000 | 2,509,227 |
| Amherst Development Corp., Daemen College Project, Revenue Bonds | | |
| 4.00%, due 10/1/37 | 1,000,000 | 821,352 |
| 5.00%, due 10/1/43 | 2,000,000 | 1,793,773 |
| 5.00%, due 10/1/48 | 2,000,000 | 1,746,074 |
| Buffalo & Erie County Industrial Land Development Corp., D'Youville College Project, Revenue Bonds | | |
| Series A | | |
| 4.00%, due 11/1/40 | 1,000,000 | 866,044 |
| 4.00%, due 11/1/45 | 4,000,000 | 3,319,272 |
| Series A | | |
| 4.00%, due 11/1/50 | 1,000,000 | 804,471 |
| | Principal
Amount | Value |
| |
| Education (continued) |
| Buffalo & Erie County Industrial Land Development Corp., Tapestry Charter School Project, Revenue Bonds | | |
| Series A | | |
| 5.00%, due 8/1/47 | $ 500,000 | $ 433,029 |
| Series A | | |
| 5.00%, due 8/1/52 | 3,995,000 | 3,394,801 |
| Build NYC Resource Corp., Brilla College Preparatory Charter Schools, Revenue Bonds | | |
| Series A | | |
| 4.00%, due 11/1/41 (a) | 2,000,000 | 1,531,343 |
| Build NYC Resource Corp., Children's Aid Society Project, Revenue Bonds | | |
| 5.00%, due 7/1/45 | 1,120,000 | 1,134,191 |
| Build NYC Resource Corp., Grand Concourse Academy Charter School Project, Revenue Bonds | | |
| Series A | | |
| 5.00%, due 7/1/42 | 600,000 | 565,913 |
| Series A | | |
| 5.00%, due 7/1/56 | 550,000 | 484,863 |
| Build NYC Resource Corp., Inwood Academy Leadership Charter School Project, Revenue Bonds (a) | | |
| Series A | | |
| 5.125%, due 5/1/38 | 800,000 | 745,280 |
| Series A | | |
| 5.50%, due 5/1/48 | 1,500,000 | 1,391,633 |
| Build NYC Resource Corp., Manhattan College Project, Revenue Bonds | | |
| 4.00%, due 8/1/42 | 1,500,000 | 1,223,006 |
| 5.00%, due 8/1/47 | 240,000 | 234,418 |
| Build NYC Resource Corp., Metropolitan College of New York, Revenue Bonds | | |
| 5.50%, due 11/1/44 | 2,500,000 | 2,258,157 |
| Build NYC Resource Corp., Metropolitan Lighthouse Charter School Project, Revenue Bonds (a) | | |
| Series A | | |
| 5.00%, due 6/1/32 | 1,000,000 | 965,990 |
| Series A | | |
| 5.00%, due 6/1/37 | 1,500,000 | 1,391,282 |
| Series A | | |
| 5.00%, due 6/1/47 | 3,100,000 | 2,679,049 |
The notes to the financial statements are an integral part of, and should be read in conjunction with, the financial statements.
11
Portfolio of Investments October 31, 2022† (continued)
| | Principal
Amount | Value |
| Long-Term Municipal Bonds (continued) |
| Education (continued) |
Build NYC Resource Corp., Metropolitan Lighthouse Charter School Project, Revenue Bonds (a)
(continued) | | |
| Series A | | |
| 5.00%, due 6/1/52 | $ 1,500,000 | $ 1,271,559 |
| Build NYC Resource Corp., New World Preparatory Charter School Project, Revenue Bonds | | |
| Series A | | |
| 4.00%, due 6/15/51 | 2,180,000 | 1,507,927 |
| Series A | | |
| 4.00%, due 6/15/56 | 660,000 | 438,931 |
| Build NYC Resource Corp., New York Law School Project, Revenue Bonds | | |
| 5.00%, due 7/1/30 | 3,865,000 | 3,879,959 |
| 5.00%, due 7/1/33 | 1,520,000 | 1,505,852 |
| Build NYC Resource Corp., Shefa School Project, Revenue Bonds | | |
| Series A | | |
| 5.00%, due 6/15/51 (a) | 2,500,000 | 2,178,296 |
| County of Cattaraugus NY, St. Bonaventure University Project, Revenue Bonds | | |
| Series A | | |
| 5.00%, due 5/1/44 | 1,200,000 | 1,205,454 |
| Dutchess County Local Development Corp., Bard College Project, Revenue Bonds (a) | | |
| Series A | | |
| 5.00%, due 7/1/40 | 1,100,000 | 994,432 |
| Series A | | |
| 5.00%, due 7/1/51 | 1,000,000 | 854,196 |
| Dutchess County Local Development Corp., Culinary Institute of America Project (The), Revenue Bonds | | |
| Series A-1 | | |
| 5.00%, due 7/1/31 | 375,000 | 379,512 |
| Series A-1 | | |
| 5.00%, due 7/1/33 | 700,000 | 701,729 |
| Dutchess County Local Development Corp., Marist College Project, Revenue Bonds | | |
| Series A | | |
| 5.00%, due 7/1/39 | 1,000,000 | 1,001,002 |
| 5.00%, due 7/1/43 | 2,000,000 | 2,001,679 |
| | Principal
Amount | Value |
| |
| Education (continued) |
| Dutchess County Local Development Corp., Marist College Project, Revenue Bonds (continued) | | |
| 5.00%, due 7/1/48 | $ 4,000,000 | $ 3,932,478 |
| Hempstead Town Local Development Corp., Molloy College Project, Revenue Bonds | | |
| 5.00%, due 7/1/38 | 870,000 | 855,195 |
| 5.00%, due 7/1/43 | 1,020,000 | 979,130 |
| 5.00%, due 7/1/48 | 1,100,000 | 1,035,066 |
| Monroe County Industrial Development Corp., Nazareth College of Rochester, Revenue Bonds | | |
| Series A | | |
| 4.00%, due 10/1/47 | 1,695,000 | 1,366,640 |
| Monroe County Industrial Development Corp., St. John Fisher College, Revenue Bonds | | |
| Series A | | |
| 5.00%, due 6/1/24 | 330,000 | 330,333 |
| Monroe County Industrial Development Corp., University of Rochester Project, Revenue Bonds | | |
| Series C | | |
| 4.00%, due 7/1/43 | 3,000,000 | 2,585,894 |
| Series D | | |
| 4.00%, due 7/1/43 | 2,470,000 | 2,129,053 |
| Series A | | |
| 4.00%, due 7/1/50 | 7,000,000 | 5,845,157 |
| New York City Educational Construction Fund, Revenue Bonds | | |
| Series B, Insured: State Intercept | | |
| 5.00%, due 4/1/38 | 3,380,000 | 3,494,994 |
| Series B, Insured: State Intercept | | |
| 5.00%, due 4/1/52 | 5,000,000 | 5,046,251 |
| New York State Dormitory Authority, Brooklyn Law School, Revenue Bonds | | |
| Series A | | |
| 5.00%, due 7/1/33 | 1,650,000 | 1,671,955 |
| New York State Dormitory Authority, Fordham University, Revenue Bonds | | |
| 4.00%, due 7/1/46 | 4,830,000 | 4,101,569 |
| 4.00%, due 7/1/50 | 8,500,000 | 7,089,711 |
| Series A | | |
| 5.00%, due 7/1/41 | 1,075,000 | 1,097,541 |
The notes to the financial statements are an integral part of, and should be read in conjunction with, the financial statements.
| 12 | MainStay MacKay New York Tax Free Opportunities Fund |
| | Principal
Amount | Value |
| Long-Term Municipal Bonds (continued) |
| Education (continued) |
| New York State Dormitory Authority, Friends of The Bay Shore-Brightwaters Public Library, Inc., Revenue Bonds | | |
| Insured: AMBAC | | |
| 4.625%, due 7/1/36 | $ 200,000 | $ 193,383 |
| New York State Dormitory Authority, Iona College, Revenue Bonds | | |
| Series A | | |
| 5.00%, due 7/1/46 | 550,000 | 527,056 |
| Series A | | |
| 5.00%, due 7/1/51 | 1,300,000 | 1,229,096 |
| New York State Dormitory Authority, New School (The), Revenue Bonds | | |
| Series A | | |
| 5.00%, due 7/1/35 | 15,000 | 15,626 |
| Series A | | |
| 5.00%, due 7/1/35 | 195,000 | 195,890 |
| New York State Dormitory Authority, New York University, Revenue Bonds | | |
| Series A | | |
| 4.00%, due 7/1/43 | 2,950,000 | 2,607,699 |
| Series A | | |
| 4.00%, due 7/1/45 | 2,000,000 | 1,742,805 |
| Series A | | |
| 4.00%, due 7/1/46 | 4,000,000 | 3,457,645 |
| New York State Dormitory Authority, Pace University, Revenue Bonds | | |
| Series A | | |
| 4.00%, due 5/1/33 | 400,000 | 355,221 |
| Series A | | |
| 4.25%, due 5/1/42 | 450,000 | 369,882 |
| New York State Dormitory Authority, Rockefeller University (The), Revenue Bonds | | |
| Series C | | |
| 4.00%, due 7/1/49 | 7,055,000 | 6,098,973 |
| New York State Dormitory Authority, St. John's University, Revenue Bonds | | |
| Series A | | |
| 4.00%, due 7/1/48 | 5,250,000 | 4,342,004 |
| New York State Dormitory Authority, St. Joseph's College, Revenue Bonds | | |
| 4.00%, due 7/1/40 | 200,000 | 169,979 |
| | Principal
Amount | Value |
| |
| Education (continued) |
| New York State Dormitory Authority, St. Joseph's College, Revenue Bonds (continued) | | |
| 5.00%, due 7/1/51 | $ 1,475,000 | $ 1,413,254 |
| New York State Dormitory Authority, St. Lawrence-Lewis Board of Cooperative Educational Services, Revenue Bonds | | |
| Series A | | |
| 4.00%, due 8/15/42 | 5,500,000 | 4,784,228 |
| Series B, Insured: BAM | | |
| 4.00%, due 8/15/45 | 4,320,000 | 3,715,394 |
| Series B, Insured: BAM | | |
| 4.00%, due 8/15/50 | 1,340,000 | 1,124,951 |
| New York State Dormitory Authority, Touro College and University System Obligated Group, Revenue Bonds | | |
| 5.00%, due 1/1/42 | 5,000,000 | 5,366,243 |
| Oneida County Local Development Corp., Utica College Project, Revenue Bonds | | |
| 5.00%, due 7/1/49 | 3,250,000 | 2,912,326 |
| Onondaga County Trust for Cultural Resources, Syracuse University Project, Revenue Bonds | | |
| 4.00%, due 12/1/47 | 2,100,000 | 1,807,988 |
| Orange County Funding Corp., Mount St. Mary College, Revenue Bonds | | |
| Series A | | |
| 5.00%, due 7/1/42 | 1,010,000 | 990,752 |
| Riverhead Industrial Development Agency, Riverhead Charter School, Revenue Bonds | | |
| Series A | | |
| 7.00%, due 8/1/43 | 925,000 | 939,112 |
| Series 2013A | | |
| 7.00%, due 8/1/48 | 730,000 | 740,777 |
| Schenectady County Capital Resource Corp., Union College Project, Revenue Bonds | | |
| 5.25%, due 7/1/52 | 1,000,000 | 1,017,823 |
| St. Lawrence County Industrial Development Agency, Clarkson University Project, Revenue Bonds | | |
| 5.00%, due 9/1/47 | 2,975,000 | 2,881,460 |
The notes to the financial statements are an integral part of, and should be read in conjunction with, the financial statements.
13
Portfolio of Investments October 31, 2022† (continued)
| | Principal
Amount | Value |
| Long-Term Municipal Bonds (continued) |
| Education (continued) |
| St. Lawrence County Industrial Development Agency, St. Lawrence University, Revenue Bonds | | |
| Series A | | |
| 4.00%, due 7/1/43 | $ 3,000,000 | $ 2,510,380 |
| Syracuse Industrial Development Agency, Syracuse City School District Project, Revenue Bonds | | |
| Series A, Insured: State Aid Withholding | | |
| 3.25%, due 5/1/34 | 1,000,000 | 886,461 |
| Series 2020A, Insured: State Aid Withholding | | |
| 4.00%, due 5/1/36 | 1,500,000 | 1,430,943 |
| Troy Capital Resource Corp., Rensselaer Polytechnic Institute, Revenue Bonds | | |
| 5.00%, due 8/1/32 | 1,000,000 | 1,023,889 |
| Yonkers Economic Development Corp., Charter School of Educational Excellence Project, Revenue Bonds | | |
| Series A | | |
| 4.00%, due 10/15/29 | 200,000 | 182,313 |
| Series A | | |
| 5.00%, due 10/15/39 | 1,680,000 | 1,506,023 |
| Series A | | |
| 5.00%, due 10/15/49 | 640,000 | 540,735 |
| 5.00%, due 10/15/50 | 1,350,000 | 1,134,514 |
| Yonkers Industrial Development Agency, New Community School Project, Revenue Bonds | | |
| Insured: State Aid Withholding | | |
| 4.00%, due 5/1/41 | 2,280,000 | 1,998,889 |
| Insured: State Aid Withholding | | |
| 4.00%, due 5/1/51 | 6,000,000 | 4,945,522 |
| | | 158,780,716 |
| General Obligation 8.7% |
| City of Buffalo NY, Limited General Obligation | | |
| Series A | | |
| 5.00%, due 4/1/27 | 500,000 | 525,570 |
| Series A | | |
| 5.00%, due 4/1/28 | 400,000 | 419,797 |
| | Principal
Amount | Value |
| |
| General Obligation (continued) |
| City of Glens Falls NY, Public Improvement, Limited General Obligation | | |
| Insured: AGM | | |
| 4.00%, due 1/15/31 | $ 500,000 | $ 504,943 |
| Insured: AGM | | |
| 4.00%, due 1/15/32 | 315,000 | 316,958 |
| Insured: AGM | | |
| 4.00%, due 1/15/33 | 250,000 | 250,517 |
| City of New York NY, Unlimited General Obligation | | |
| Series A-1, Insured: BAM | | |
| 4.00%, due 8/1/44 | 3,140,000 | 2,752,105 |
| Series A-1 | | |
| 4.00%, due 8/1/50 | 2,000,000 | 1,695,589 |
| Series D-1 | | |
| 5.25%, due 5/1/42 | 1,500,000 | 1,586,790 |
| Series A-1 | | |
| 5.25%, due 9/1/43 | 13,000,000 | 13,723,059 |
| Series B-1 | | |
| 5.25%, due 10/1/43 | 3,000,000 | 3,168,056 |
| City of Newburgh NY, Limited General Obligation | | |
| Series A, Insured: AGM | | |
| 3.50%, due 7/15/36 | 725,000 | 592,495 |
| City of Ogdensburg NY, Public Improvement, Limited General Obligation | | |
| 5.50%, due 4/15/23 | 40,000 | 40,016 |
| 5.50%, due 4/15/24 | 45,000 | 44,936 |
| 5.50%, due 4/15/26 | 50,000 | 49,260 |
| 5.50%, due 4/15/28 | 55,000 | 52,859 |
| City of Plattsburgh NY, Public Improvement, Limited General Obligation | | |
| Series B, Insured: AGM | | |
| 5.00%, due 9/15/24 | 510,000 | 522,213 |
| Series B, Insured: AGM | | |
| 5.00%, due 9/15/25 | 470,000 | 486,462 |
| Series B, Insured: AGM | | |
| 5.00%, due 9/15/26 | 395,000 | 413,081 |
| City of Poughkeepsie NY, Public Improvement, Limited General Obligation | | |
| 5.00%, due 6/1/31 | 600,000 | 611,361 |
The notes to the financial statements are an integral part of, and should be read in conjunction with, the financial statements.
| 14 | MainStay MacKay New York Tax Free Opportunities Fund |
| | Principal
Amount | Value |
| Long-Term Municipal Bonds (continued) |
| General Obligation (continued) |
| City of Yonkers NY, Limited General Obligation | | |
| Series B, Insured: AGM State Aid Withholding | | |
| 3.00%, due 2/15/39 | $ 600,000 | $ 464,710 |
| Series A, Insured: BAM | | |
| 4.00%, due 9/1/31 | 1,500,000 | 1,516,482 |
| Series A, Insured: BAM | | |
| 4.00%, due 5/1/35 | 1,550,000 | 1,514,813 |
| Series A, Insured: AGM | | |
| 4.00%, due 2/15/36 | 700,000 | 654,599 |
| Series B, Insured: AGM State Aid Withholding | | |
| 4.00%, due 2/15/36 | 740,000 | 692,004 |
| Series A, Insured: BAM | | |
| 4.00%, due 5/1/36 | 1,700,000 | 1,618,133 |
| Series A, Insured: BAM | | |
| 4.00%, due 5/1/37 | 2,000,000 | 1,861,778 |
| Series B, Insured: AGM State Aid Withholding | | |
| 4.00%, due 2/15/38 | 1,300,000 | 1,191,061 |
| Series A, Insured: AGM | | |
| 5.00%, due 2/15/32 | 850,000 | 908,924 |
| Series B, Insured: AGM State Aid Withholding | | |
| 5.00%, due 2/15/32 | 855,000 | 914,271 |
| Series A, Insured: AGM | | |
| 5.00%, due 2/15/34 | 600,000 | 636,789 |
| Series B, Insured: AGM State Aid Withholding | | |
| 5.00%, due 2/15/34 | 750,000 | 795,986 |
| City of Yonkers NY, Unlimited General Obligation | | |
| Series B, Insured: BAM State Aid Withholding | | |
| 4.00%, due 5/1/39 | 2,000,000 | 1,797,740 |
| Commonwealth of Puerto Rico, Unlimited General Obligation | | |
| Series A-1 | | |
| (zero coupon), due 7/1/24 | 350,745 | 319,174 |
| Series A-1 | | |
| (zero coupon), due 7/1/33 | 1,351,801 | 689,061 |
| Series A-1 | | |
| 4.00%, due 7/1/35 | 3,921,443 | 3,214,044 |
| Series A-1 | | |
| 4.00%, due 7/1/46 | 1,000,000 | 728,460 |
| | Principal
Amount | Value |
| |
| General Obligation (continued) |
Commonwealth of Puerto Rico, Unlimited General Obligation
(continued) | | |
| Series A-1 | | |
| 5.375%, due 7/1/25 | $ 1,169,884 | $ 1,170,074 |
| Series A-1 | | |
| 5.625%, due 7/1/27 | 1,159,287 | 1,168,870 |
| Series A-1 | | |
| 5.625%, due 7/1/29 | 1,140,480 | 1,148,969 |
| Series A-1 | | |
| 5.75%, due 7/1/31 | 1,107,737 | 1,116,655 |
| County of Clinton NY, Limited General Obligation | | |
| Insured: AGM | | |
| 4.00%, due 6/1/38 (b) | 1,500,000 | 1,326,694 |
| County of Nassau NY, Limited General Obligation | | |
| Series B, Insured: AGM | | |
| 5.00%, due 4/1/44 | 4,870,000 | 4,978,112 |
| Series B, Insured: AGM | | |
| 5.00%, due 4/1/49 | 5,000,000 | 5,074,883 |
| County of Onondaga NY, Limited General Obligation | | |
| 3.00%, due 6/1/39 | 2,150,000 | 1,671,565 |
| 3.25%, due 4/15/34 | 1,250,000 | 1,114,095 |
| County of Rockland NY, Limited General Obligation | | |
| Insured: BAM | | |
| 5.00%, due 6/1/24 | 500,000 | 512,682 |
| Insured: BAM | | |
| 5.00%, due 6/1/25 | 560,000 | 584,398 |
| Insured: BAM | | |
| 5.00%, due 6/1/26 | 550,000 | 582,411 |
| County of Rockland NY, Various Purpose, Limited General Obligation | | |
| Insured: AGM | | |
| 4.00%, due 5/1/44 | 915,000 | 799,492 |
| Insured: AGM | | |
| 4.00%, due 5/1/45 | 950,000 | 822,081 |
| Insured: AGM | | |
| 4.00%, due 5/1/46 | 985,000 | 846,821 |
| Insured: AGM | | |
| 4.00%, due 5/1/48 | 1,065,000 | 910,410 |
The notes to the financial statements are an integral part of, and should be read in conjunction with, the financial statements.
15
Portfolio of Investments October 31, 2022† (continued)
| | Principal
Amount | Value |
| Long-Term Municipal Bonds (continued) |
| General Obligation (continued) |
| County of Suffolk NY, Public Improvement, Limited General Obligation | | |
| Series B, Insured: AGM | | |
| 3.00%, due 10/15/32 | $ 5,480,000 | $ 4,733,662 |
| Series B, Insured: AGM | | |
| 3.00%, due 10/15/33 | 2,400,000 | 2,002,011 |
| Series A, Insured: AGM | | |
| 3.25%, due 6/1/36 | 715,000 | 600,492 |
| Series A, Insured: AGM | | |
| 3.25%, due 6/1/37 | 725,000 | 595,712 |
| Series A, Insured: BAM | | |
| 4.00%, due 4/1/33 | 2,190,000 | 2,187,228 |
| Harrison Central School District, Unlimited General Obligation | | |
| Insured: State Aid Withholding | | |
| 3.50%, due 3/15/44 | 1,015,000 | 835,780 |
| Insured: State Aid Withholding | | |
| 3.50%, due 3/15/45 | 1,055,000 | 858,944 |
| Insured: State Aid Withholding | | |
| 3.55%, due 3/15/47 | 1,130,000 | 918,351 |
| Lackawanna City School District, Unlimited General Obligation | | |
| Insured: BAM State Aid Withholding | | |
| 4.00%, due 6/15/32 | 745,000 | 747,681 |
| Niagara Falls City School District, Unlimited General Obligation | | |
| Insured: BAM State Aid Withholding | | |
| 5.00%, due 6/15/27 | 960,000 | 1,023,825 |
| Poughkeepsie School District, New York School District Refunding, Unlimited General Obligation | | |
| Insured: AGM State Aid Withholding | | |
| 3.00%, due 5/1/33 | 400,000 | 357,173 |
| Town of Oyster Bay NY, Public Improvement, Limited General Obligation | | |
| 4.00%, due 2/15/26 | 3,440,000 | 3,484,515 |
| Series A, Insured: BAM | | |
| 5.00%, due 1/15/28 | 500,000 | 509,028 |
| Village of Valley Stream NY, Various Purpose, Limited General Obligation | | |
| Insured: BAM | | |
| 4.00%, due 4/1/33 | 490,000 | 484,448 |
| Insured: BAM | | |
| 4.00%, due 4/1/34 | 510,000 | 501,640 |
| | Principal
Amount | Value |
| |
| General Obligation (continued) |
| Village of Valley Stream NY, Various Purpose, Limited General Obligation (continued) | | |
| Insured: BAM | | |
| 4.00%, due 4/1/35 | $ 530,000 | $ 516,602 |
| Insured: BAM | | |
| 4.00%, due 4/1/36 | 550,000 | 520,479 |
| Insured: BAM | | |
| 4.00%, due 4/1/37 | 570,000 | 530,657 |
| | | 92,510,536 |
| Hospital 8.7% |
| Brookhaven Local Development Corp., Long Island Community Hospital Health Care Services Foundation, Revenue Bonds | | |
| Series A, Insured: AGM-CR | | |
| 3.375%, due 10/1/40 | 7,990,000 | 6,345,989 |
| Brookhaven Local Development Corp., Long Island Community Hospital Project, Revenue Bonds | | |
| Series A | | |
| 4.00%, due 10/1/45 | 3,500,000 | 2,906,306 |
| Series A | | |
| 5.00%, due 10/1/33 | 1,000,000 | 1,018,216 |
| Series A | | |
| 5.00%, due 10/1/35 | 1,000,000 | 1,014,309 |
| Series A | | |
| 5.00%, due 10/1/50 | 6,250,000 | 5,869,130 |
| Broome County Local Development Corp., United Health Services Hospitals Obligated Group, Revenue Bonds | | |
| Insured: AGM | | |
| 3.00%, due 4/1/50 | 6,835,000 | 4,274,372 |
| Insured: AGM | | |
| 4.00%, due 4/1/39 | 700,000 | 619,252 |
| Insured: AGM | | |
| 4.00%, due 4/1/50 | 4,265,000 | 3,500,424 |
| Build NYC Resource Corp., Children's Aid Society Project (The), Revenue Bonds | | |
| 4.00%, due 7/1/44 | 600,000 | 500,016 |
| 4.00%, due 7/1/49 | 1,300,000 | 1,058,799 |
The notes to the financial statements are an integral part of, and should be read in conjunction with, the financial statements.
| 16 | MainStay MacKay New York Tax Free Opportunities Fund |
| | Principal
Amount | Value |
| Long-Term Municipal Bonds (continued) |
| Hospital (continued) |
| Dutchess County Local Development Corp., Health Quest Systems, Inc., Revenue Bonds | | |
| Series B | | |
| 4.00%, due 7/1/41 | $ 7,350,000 | $ 5,860,473 |
| Genesee County Funding Corp. (The), Rochester Regional Health Obligated Group, Revenue Bonds | | |
| Series A | | |
| 5.00%, due 12/1/24 | 200,000 | 203,438 |
| Series A | | |
| 5.00%, due 12/1/25 | 215,000 | 220,264 |
| Series A | | |
| 5.00%, due 12/1/26 | 340,000 | 349,946 |
| Series A | | |
| 5.00%, due 12/1/27 | 400,000 | 413,039 |
| Series A | | |
| 5.00%, due 12/1/28 | 600,000 | 621,330 |
| Jefferson County Civic Facility Development Corp., Samaritan Medical Center Project, Revenue Bonds | | |
| Series A | | |
| 4.00%, due 11/1/31 | 2,705,000 | 2,392,704 |
| Monroe County Industrial Development Corp., Highland Hospital, Revenue Bonds | | |
| 4.00%, due 7/1/40 | 3,100,000 | 2,722,777 |
| Monroe County Industrial Development Corp., Rochester General Hospital (The), Revenue Bonds | | |
| 4.00%, due 12/1/37 | 1,000,000 | 841,211 |
| Series A | | |
| 5.00%, due 12/1/32 | 540,000 | 540,183 |
| Series A | | |
| 5.00%, due 12/1/42 | 1,000,000 | 966,176 |
| Monroe County Industrial Development Corp., Rochester Regional Health Project, Revenue Bonds | | |
| Series A | | |
| 4.00%, due 12/1/46 | 750,000 | 576,175 |
| | Principal
Amount | Value |
| |
| Hospital (continued) |
| Nassau County Local Economic Assistance Corp., Catholic Health Services of Long Island Obligated Group, Revenue Bonds | | |
| 5.00%, due 7/1/34 | $ 250,000 | $ 252,015 |
| New York State Dormitory Authority, Garnet Health Medical Center Obligated Group, Revenue Bonds (a) | | |
| 5.00%, due 12/1/32 | 800,000 | 783,061 |
| 5.00%, due 12/1/34 | 3,500,000 | 3,368,912 |
| New York State Dormitory Authority, Maimonides Medical Center, Revenue Bonds | | |
| Insured: FHA 241 | | |
| 3.00%, due 2/1/50 | 14,000,000 | 9,465,567 |
| New York State Dormitory Authority, Memorial Sloan-Kettering Cancer Center, Revenue Bonds | | |
| Series 1 | | |
| 4.00%, due 7/1/37 | 470,000 | 433,812 |
| New York State Dormitory Authority, Northwell Health Obligated Group, Revenue Bonds | | |
| Series B-3 | | |
| 5.00%, due 5/1/48 (c) | 5,000,000 | 5,156,645 |
| New York State Dormitory Authority, NYU Langone Hospitals Obligated Group, Revenue Bonds | | |
| Series A | | |
| 3.00%, due 7/1/48 | 750,000 | 474,778 |
| Series A | | |
| 4.00%, due 7/1/40 | 1,000,000 | 887,140 |
| Series A | | |
| 4.00%, due 7/1/50 | 3,005,000 | 2,448,217 |
| Series A | | |
| 4.00%, due 7/1/53 | 8,450,000 | 6,812,777 |
| New York State Dormitory Authority, Orange Regional Medical Center Obligated Group, Revenue Bonds | | |
| 5.00%, due 12/1/35 (a) | 100,000 | 95,766 |
| Oneida County Local Development Corp., Mohawk Valley Health System Project, Revenue Bonds | | |
| Series A, Insured: AGM | | |
| 3.00%, due 12/1/44 | 4,150,000 | 2,819,870 |
| Series A, Insured: AGM | | |
| 4.00%, due 12/1/32 | 1,000,000 | 943,985 |
The notes to the financial statements are an integral part of, and should be read in conjunction with, the financial statements.
17
Portfolio of Investments October 31, 2022† (continued)
| | Principal
Amount | Value |
| Long-Term Municipal Bonds (continued) |
| Hospital (continued) |
Oneida County Local Development Corp., Mohawk Valley Health System Project, Revenue Bonds
(continued) | | |
| Series A, Insured: AGM | | |
| 4.00%, due 12/1/33 | $ 1,255,000 | $ 1,173,342 |
| Series A, Insured: AGM | | |
| 4.00%, due 12/1/34 | 1,585,000 | 1,472,691 |
| Series A, Insured: AGM | | |
| 4.00%, due 12/1/36 | 1,650,000 | 1,509,033 |
| Series A, Insured: AGM | | |
| 4.00%, due 12/1/37 | 1,155,000 | 1,047,824 |
| Series A, Insured: AGM | | |
| 4.00%, due 12/1/37 | 1,270,000 | 1,120,707 |
| Series A, Insured: AGM | | |
| 4.00%, due 12/1/46 | 4,000,000 | 3,296,190 |
| Series A, Insured: AGM | | |
| 4.00%, due 12/1/49 | 4,000,000 | 3,329,270 |
| Suffolk County Economic Development Corp., Catholic Health Services of Long Island Obligated Group, Revenue Bonds | | |
| Series C | | |
| 5.00%, due 7/1/33 | 250,000 | 252,393 |
| Westchester County Local Development Corp., Westchester Medical Center, Revenue Bonds | | |
| 5.00%, due 11/1/46 | 2,500,000 | 2,262,740 |
| | | 92,221,264 |
| Housing 1.7% |
| Albany Capital Resource Corp., Empire Commons Student Housing, Inc., Revenue Bonds | | |
| Series A | | |
| 5.00%, due 5/1/29 | 600,000 | 609,220 |
| Series A | | |
| 5.00%, due 5/1/30 | 350,000 | 354,588 |
| Series A | | |
| 5.00%, due 5/1/31 | 200,000 | 202,428 |
| Amherst Development Corp., UBF Faculty-Student Housing Corp., Revenue Bonds | | |
| Insured: BAM | | |
| 4.00%, due 10/1/42 | 4,945,000 | 4,321,672 |
| Series A, Insured: AGM | | |
| 5.00%, due 10/1/45 | 2,000,000 | 2,061,562 |
| | Principal
Amount | Value |
| |
| Housing (continued) |
| New York City Housing Development Corp., College of Staten Island Residences, Revenue Bonds | | |
| Series A, Insured: AGM | | |
| 3.25%, due 7/1/27 | $ 2,950,000 | $ 2,931,248 |
| New York State Dormitory Authority, University Facilities, Revenue Bonds | | |
| Series 2019A | | |
| 4.00%, due 7/1/49 | 3,050,000 | 2,524,332 |
| Series A | | |
| 5.00%, due 7/1/43 | 1,500,000 | 1,541,463 |
| Onondaga Civic Development Corp., Onondaga Community College Housing Development Corp., Revenue Bonds | | |
| Series A | | |
| 5.00%, due 10/1/24 | 400,000 | 398,614 |
| Series A | | |
| 5.00%, due 10/1/25 | 250,000 | 247,722 |
| Westchester County Local Development Corp., Purchase Housing Corp. II Project, Revenue Bonds | | |
| 5.00%, due 6/1/29 | 185,000 | 188,247 |
| 5.00%, due 6/1/30 | 330,000 | 334,703 |
| 5.00%, due 6/1/31 | 320,000 | 323,508 |
| 5.00%, due 6/1/37 | 1,000,000 | 980,691 |
| 5.00%, due 6/1/42 | 1,000,000 | 955,466 |
| | | 17,975,464 |
| Other Revenue 33.7% |
| Battery Park City Authority, Green Bond, Revenue Bonds, Senior Lien | | |
| Series A | | |
| 4.00%, due 11/1/44 | 4,355,000 | 3,847,933 |
| Brookhaven Local Development Corp., Jefferson's Ferry Project, Revenue Bonds | | |
| Series A | | |
| 4.00%, due 11/1/55 | 3,565,000 | 2,685,200 |
| 5.25%, due 11/1/36 | 1,130,000 | 1,140,527 |
| Broome County Local Development Corp., Good Shepherd Village at Endwell, Revenue Bonds | | |
| 4.00%, due 7/1/31 | 1,565,000 | 1,375,168 |
| 4.00%, due 7/1/36 | 2,100,000 | 1,705,145 |
| 4.00%, due 1/1/47 | 1,160,000 | 816,901 |
The notes to the financial statements are an integral part of, and should be read in conjunction with, the financial statements.
| 18 | MainStay MacKay New York Tax Free Opportunities Fund |
| | Principal
Amount | Value |
| Long-Term Municipal Bonds (continued) |
| Other Revenue (continued) |
| Build NYC Resource Corp., Bronx Charter School for Excellence Project, Revenue Bonds | | |
| Series A | | |
| 5.50%, due 4/1/43 | $ 1,160,000 | $ 1,161,571 |
| Build NYC Resource Corp., Pratt Paper, Inc. Project, Revenue Bonds | | |
| 5.00%, due 1/1/35 (a)(b) | 4,305,000 | 4,307,327 |
| Build NYC Resource Corp., Royal Charter Properties, Inc., Revenue Bonds | | |
| Insured: AGM | | |
| 4.75%, due 12/15/32 | 2,000,000 | 1,999,950 |
| Chautauqua Tobacco Asset Securitization Corp., Revenue Bonds | | |
| 5.00%, due 6/1/34 | 750,000 | 693,484 |
| Children's Trust Fund, Asset-Backed, Revenue Bonds | | |
| Series A | | |
| (zero coupon), due 5/15/50 | 2,500,000 | 430,840 |
| 5.625%, due 5/15/43 | 2,300,000 | 2,299,840 |
| City of New York NY, Alvin Ailey Dance Foundation, Inc., Revenue Bonds | | |
| Series A | | |
| 4.00%, due 7/1/46 | 1,515,000 | 1,286,196 |
| City of New York NY, Museum of Modern Art (The), Revenue Bonds | | |
| Series 2016-ONE-E | | |
| 4.00%, due 4/1/30 | 1,200,000 | 1,218,524 |
| Development Authority of the North Country, Solid Waste Management System, Revenue Bonds | | |
| Insured: AGM | | |
| 3.25%, due 9/1/39 | 550,000 | 436,658 |
| Insured: AGM | | |
| 3.25%, due 9/1/40 | 570,000 | 445,035 |
| Insured: AGM | | |
| 3.25%, due 9/1/42 | 610,000 | 461,920 |
| Insured: AGM | | |
| 3.25%, due 9/1/43 | 630,000 | 469,430 |
| Insured: AGM | | |
| 3.25%, due 9/1/44 | 650,000 | 478,508 |
| Insured: AGM | | |
| 3.375%, due 9/1/38 | 535,000 | 439,493 |
| Insured: AGM | | |
| 3.50%, due 9/1/37 | 515,000 | 441,004 |
| | Principal
Amount | Value |
| |
| Other Revenue (continued) |
| Dutchess County Local Development Corp., Health Quest Systems, Inc., Revenue Bonds | | |
| Series A | | |
| 5.00%, due 7/1/34 | $ 500,000 | $ 513,457 |
| Dutchess County Resource Recovery Agency, Solid Waste System, Revenue Bonds (b) | | |
| 5.00%, due 1/1/25 | 1,000,000 | 1,029,710 |
| 5.00%, due 1/1/26 | 1,000,000 | 1,042,210 |
| Erie Tobacco Asset Securitization Corp., Tobacco Settlement, Asset-Backed, Revenue Bonds | | |
| Series B | | |
| (zero coupon), due 6/1/47 | 18,000,000 | 3,196,125 |
| GDB Debt Recovery Authority of Puerto Rico, Revenue Bonds | | |
| 7.50%, due 8/20/40 | 2,211,123 | 1,909,857 |
| Guam Government Waterworks Authority, Water and Wastewater System, Revenue Bonds | | |
| 5.25%, due 7/1/33 | 1,230,000 | 1,246,451 |
| 5.50%, due 7/1/43 | 1,725,000 | 1,750,879 |
| Hudson Yards Infrastructure Corp., Revenue Bonds | | |
| Series A | | |
| 5.00%, due 2/15/31 | 8,380,000 | 8,800,755 |
| Hudson Yards Infrastructure Corp., Second Indenture, Revenue Bonds | | |
| Series A, Insured: AGM | | |
| 4.00%, due 2/15/47 | 4,000,000 | 3,404,061 |
| Series A, Insured: BAM | | |
| 5.00%, due 2/15/42 | 7,500,000 | 7,616,508 |
| Huntington Local Development Corp., Fountaingate Gardens Project, Revenue Bonds | | |
| Series A | | |
| 5.00%, due 7/1/36 | 900,000 | 771,581 |
| Series A | | |
| 5.25%, due 7/1/56 | 2,500,000 | 1,923,404 |
| Long Island Power Authority, Electric System, Revenue Bonds | | |
| Series A | | |
| 4.00%, due 9/1/37 | 3,890,000 | 3,605,137 |
| Series A | | |
| 4.00%, due 9/1/38 | 2,000,000 | 1,830,966 |
| Series A | | |
| 4.00%, due 9/1/40 | 550,000 | 496,660 |
The notes to the financial statements are an integral part of, and should be read in conjunction with, the financial statements.
19
Portfolio of Investments October 31, 2022† (continued)
| | Principal
Amount | Value |
| Long-Term Municipal Bonds (continued) |
| Other Revenue (continued) |
Long Island Power Authority, Electric System, Revenue Bonds
(continued) | | |
| 5.00%, due 9/1/37 | $ 2,000,000 | $ 2,069,705 |
| 5.00%, due 9/1/38 | 1,000,000 | 1,032,108 |
| 5.00%, due 9/1/39 | 1,000,000 | 1,030,265 |
| Series A | | |
| 5.00%, due 9/1/44 | 2,000,000 | 2,030,307 |
| Series B | | |
| 5.00%, due 9/1/45 | 1,000,000 | 1,025,114 |
| Series B | | |
| 5.00%, due 9/1/46 | 245,000 | 248,674 |
| 5.00%, due 9/1/47 | 2,000,000 | 2,015,473 |
| Matching Fund Special Purpose Securitization Corp., Revenue Bonds | | |
| Series A | | |
| 5.00%, due 10/1/30 | 3,140,000 | 3,178,958 |
| Series A | | |
| 5.00%, due 10/1/32 | 3,140,000 | 3,163,555 |
| Series A | | |
| 5.00%, due 10/1/39 | 9,415,000 | 9,283,560 |
| Metropolitan Transportation Authority, Dedicated Tax Fund, Revenue Bonds | | |
| Series A | | |
| 5.00%, due 11/15/49 | 4,000,000 | 4,054,427 |
| Monroe County Industrial Development Corp., St. Ann's Community Project, Revenue Bonds | | |
| 5.00%, due 1/1/50 | 4,900,000 | 3,701,189 |
| Nassau County Tobacco Settlement Corp., Tobacco Settlement, Asset-Backed, Revenue Bonds | | |
| Series A-3 | | |
| 5.00%, due 6/1/35 | 750,000 | 665,224 |
| New York City Housing Development Corp., Capital Fund Grant Program, Revenue Bonds | | |
| Series A | | |
| 5.00%, due 7/1/23 | 1,300,000 | 1,315,701 |
| | Principal
Amount | Value |
| |
| Other Revenue (continued) |
| New York City Housing Development Corp., Multi-Family Housing, Sustainable Neighborhood, Revenue Bonds | | |
| Series E-1-A | | |
| 3.40%, due 11/1/47 | $ 3,000,000 | $ 2,106,115 |
| Series G | | |
| 3.85%, due 11/1/45 | 595,000 | 461,427 |
| Series L-2-A | | |
| 4.00%, due 5/1/44 | 1,505,000 | 1,252,021 |
| Series I-1-A | | |
| 4.05%, due 11/1/41 | 1,000,000 | 865,226 |
| Series I-1-A | | |
| 4.15%, due 11/1/46 | 3,250,000 | 2,718,187 |
| New York City Housing Development Corp., Multi-Family Housing, Sustainable Neighborhood, Green Bond, Revenue Bonds | | |
| Series G-1 | | |
| 3.70%, due 11/1/47 | 1,000,000 | 741,997 |
| New York City Industrial Development Agency, Queens Baseball Stadium Project, Revenue Bonds | | |
| Insured: AGM | | |
| 3.00%, due 1/1/39 | 6,955,000 | 5,104,783 |
| Insured: AGM | | |
| 3.00%, due 1/1/40 | 4,295,000 | 3,082,993 |
| Series A, Insured: AGM | | |
| 3.00%, due 1/1/46 | 21,195,000 | 13,878,026 |
| New York City Industrial Development Agency, TRIPS Obligated Group, Revenue Bonds | | |
| Series A | | |
| 5.00%, due 7/1/28 | 1,500,000 | 1,496,970 |
| New York City Industrial Development Agency, Yankee Stadium Project, Revenue Bonds | | |
| Series A, Insured: AGC | | |
| (zero coupon), due 3/1/40 | 380,000 | 152,177 |
| Series A, Insured: AGC | | |
| (zero coupon), due 3/1/44 | 1,065,000 | 331,158 |
| Series A, Insured: AGC | | |
| (zero coupon), due 3/1/45 | 200,000 | 58,549 |
| Series A, Insured: AGC | | |
| (zero coupon), due 3/1/46 | 4,080,000 | 1,124,425 |
| Series A, Insured: AGC | | |
| (zero coupon), due 3/1/47 | 1,115,000 | 289,686 |
The notes to the financial statements are an integral part of, and should be read in conjunction with, the financial statements.
| 20 | MainStay MacKay New York Tax Free Opportunities Fund |
| | Principal
Amount | Value |
| Long-Term Municipal Bonds (continued) |
| Other Revenue (continued) |
| New York City Industrial Development Agency, Yankee Stadium Project, Revenue Bonds (continued) | | |
| Series A, Insured: AGM-CR | | |
| 3.00%, due 3/1/49 | $ 10,980,000 | $ 7,196,215 |
| Series A, Insured: AGM | | |
| 4.00%, due 3/1/45 | 6,500,000 | 5,375,781 |
| Series A, Insured: AGM | | |
| 5.00%, due 3/1/29 | 2,000,000 | 2,117,353 |
| New York City Transitional Finance Authority, Building Aid, Revenue Bonds | | |
| Series S-1A, Insured: State Aid Withholding | | |
| 3.00%, due 7/15/38 | 8,000,000 | 6,290,216 |
| Series S-1, Insured: State Aid Withholding | | |
| 4.00%, due 7/15/36 | 1,500,000 | 1,426,527 |
| Series S-1A, Insured: State Aid Withholding | | |
| 4.00%, due 7/15/40 | 2,265,000 | 2,050,205 |
| Series S-3, Insured: State Aid Withholding | | |
| 4.00%, due 7/15/46 | 2,905,000 | 2,514,515 |
| Series S-3, Insured: State Aid Withholding | | |
| 5.00%, due 7/15/43 | 2,500,000 | 2,539,287 |
| New York City Transitional Finance Authority, Future Tax Secured, Revenue Bonds | | |
| Series A-1 | | |
| 4.00%, due 11/1/35 | 3,825,000 | 3,630,196 |
| Series C-1 | | |
| 4.00%, due 11/1/42 | 3,000,000 | 2,656,593 |
| Series C | | |
| 4.00%, due 5/1/44 | 4,000,000 | 3,494,876 |
| Series E-1 | | |
| 4.00%, due 2/1/46 | 5,440,000 | 4,682,605 |
| Series C-1 | | |
| 5.00%, due 2/1/51 | 5,000,000 | 5,079,328 |
| New York Convention Center Development Corp., Hotel Unit Fee, Revenue Bonds, Senior Lien | | |
| Series A | | |
| (zero coupon), due 11/15/47 | 6,500,000 | 1,588,825 |
| | Principal
Amount | Value |
| |
| Other Revenue (continued) |
| New York Convention Center Development Corp., Hotel Unit Fee Secured, Revenue Bonds | | |
| 5.00%, due 11/15/40 | $ 1,620,000 | $ 1,623,095 |
| New York Convention Center Development Corp., Hotel Unit Fee Secured, Revenue Bonds, Sub. Lien | | |
| Series B, Insured: BAM | | |
| (zero coupon), due 11/15/41 | 2,320,000 | 822,445 |
| New York Convention Center Development Corp., New York City Hotel Unit Fee, Revenue Bonds, Sub. Lien | | |
| Series B, Insured: BAM | | ��� |
| (zero coupon), due 11/15/43 | 4,800,000 | 1,504,621 |
| New York Counties Tobacco Trust IV, Settlement Pass Through, Revenue Bonds | | |
| Series A | | |
| 5.00%, due 6/1/42 | 1,000,000 | 853,251 |
| Series A | | |
| 5.00%, due 6/1/45 | 245,000 | 204,545 |
| Series A | | |
| 6.25%, due 6/1/41 (a) | 4,800,000 | 4,676,344 |
| New York Counties Tobacco Trust V, Pass Through, Capital Appreciation, Revenue Bonds | | |
| Series S-1 | | |
| (zero coupon), due 6/1/38 | 1,600,000 | 569,753 |
| New York Counties Tobacco Trust VI, Tobacco Settlement Pass Through, Revenue Bonds | | |
| Series B | | |
| 5.00%, due 6/1/30 | 135,000 | 136,605 |
| New York Liberty Development Corp., 1 World Trade Center, Revenue Bonds | | |
| Insured: BAM | | |
| 2.75%, due 2/15/44 | 8,000,000 | 5,269,160 |
| 4.00%, due 2/15/43 | 6,665,000 | 5,632,562 |
| New York Liberty Development Corp., 3 World Trade Center LLC, Revenue Bonds (a) | | |
| Class 1 | | |
| 5.00%, due 11/15/44 | 5,660,000 | 4,972,916 |
| Class 2 | | |
| 5.375%, due 11/15/40 | 1,500,000 | 1,430,852 |
The notes to the financial statements are an integral part of, and should be read in conjunction with, the financial statements.
21
Portfolio of Investments October 31, 2022† (continued)
| | Principal
Amount | Value |
| Long-Term Municipal Bonds (continued) |
| Other Revenue (continued) |
| New York Liberty Development Corp., 7 World Trade Center Project, Revenue Bonds | | |
| 3.25%, due 9/15/52 | $ 1,250,000 | $ 843,225 |
| 3.50%, due 9/15/52 | 1,225,000 | 834,886 |
| New York Liberty Development Corp., Goldman Sachs Headquarters LLC, Revenue Bonds | | |
| 5.50%, due 10/1/37 | 700,000 | 736,730 |
| New York Liberty Development Corp., Green Bond, Revenue Bonds | | |
| Series A, Insured: BAM | | |
| 3.00%, due 11/15/51 | 13,810,000 | 8,921,652 |
| New York State Dormitory Authority, Oceanside Library, Revenue Bonds | | |
| 4.00%, due 7/1/52 | 10,000,000 | 8,407,407 |
| New York State Dormitory Authority, State Personal Income Tax, Revenue Bonds | | |
| Series A | | |
| 4.00%, due 3/15/39 | 8,000,000 | 7,309,817 |
| Series E | | |
| 4.00%, due 3/15/45 | 2,000,000 | 1,737,885 |
| Series A | | |
| 4.00%, due 3/15/47 | 5,500,000 | 4,718,105 |
| Series C | | |
| 5.00%, due 3/15/31 | 3,620,000 | 3,688,544 |
| New York State Housing Finance Agency, Revenue Bonds | | |
| Series C, Insured: FHA 542(C) | | |
| 4.20%, due 11/1/54 | 12,795,000 | 10,751,004 |
| New York State Urban Development Corp., Personal Income Tax, Revenue Bonds | | |
| Series A | | |
| 4.00%, due 3/15/38 | 3,000,000 | 2,769,046 |
| Series E | | |
| 4.00%, due 3/15/38 | 3,000,000 | 2,769,046 |
| Series E | | |
| 4.00%, due 3/15/43 | 2,885,000 | 2,531,830 |
| New York State Urban Development Corp., Sales Tax, Revenue Bonds | | |
| Series A | | |
| 4.00%, due 3/15/42 | 9,500,000 | 8,487,453 |
| | Principal
Amount | Value |
| |
| Other Revenue (continued) |
| New York Transportation Development Corp., American Airlines, Inc. John F. Kennedy International Airport Project, Revenue Bonds | | |
| 5.25%, due 8/1/31 (b) | $ 1,420,000 | $ 1,409,946 |
| New York Transportation Development Corp., Delta Air Lines, Inc. - LaGuardia Airport Terminals C&D Redevelopment Project, Revenue Bonds (b) | | |
| 4.375%, due 10/1/45 | 6,200,000 | 5,156,092 |
| 5.00%, due 10/1/35 | 3,000,000 | 2,891,967 |
| New York Transportation Development Corp., New York State Thruway Serive Areas Project, Revenue Bonds (b) | | |
| 4.00%, due 10/31/41 | 3,880,000 | 3,178,359 |
| 4.00%, due 4/30/53 | 11,320,000 | 8,326,349 |
| Niagara Tobacco Asset Securitization Corp., Tobacco Settlement, Asset-Backed, Revenue Bonds | | |
| 5.25%, due 5/15/40 | 500,000 | 488,113 |
| Puerto Rico Municipal Finance Agency, Revenue Bonds | | |
| Series C, Insured: AGC | | |
| 5.25%, due 8/1/23 | 100,000 | 101,459 |
| Puerto Rico Sales Tax Financing Corp., Revenue Bonds | | |
| Series A-1 | | |
| 5.00%, due 7/1/58 | 16,909,000 | 14,541,539 |
| Rensselaer Housing Authority, Van Rensselaer & Renwyck Apartments, Revenue Bonds | | |
| Series 2012A | | |
| 5.00%, due 12/1/47 | 175,000 | 175,242 |
| Rockland Tobacco Asset Securitization Corp., Tobacco Settlement, Asset-Backed, Revenue Bonds | | |
| Series B | | |
| (zero coupon), due 8/15/50 (a) | 13,000,000 | 1,906,239 |
| Schenectady Metroplex Development Authority, General Resolution Bonds, Revenue Bonds | | |
| Series A, Insured: AGM | | |
| 5.50%, due 8/1/33 | 1,000,000 | 1,016,269 |
The notes to the financial statements are an integral part of, and should be read in conjunction with, the financial statements.
| 22 | MainStay MacKay New York Tax Free Opportunities Fund |
| | Principal
Amount | Value |
| Long-Term Municipal Bonds (continued) |
| Other Revenue (continued) |
| Southold Local Development Corp., Peconic Landing, Inc. Project, Revenue Bonds | | |
| 5.00%, due 12/1/45 | $ 1,625,000 | $ 1,531,572 |
| State of New York Mortgage Agency, Homeowner Mortgage, Revenue Bonds | | |
| Series 208 | | |
| 4.00%, due 10/1/48 | 1,595,000 | 1,574,303 |
| Series 213 | | |
| 4.25%, due 10/1/47 | 595,000 | 589,221 |
| Suffolk County Economic Development Corp., Peconic Landing at Southold, Inc., Revenue Bonds | | |
| Series A | | |
| 5.00%, due 12/1/29 | 175,000 | 177,703 |
| Series A | | |
| 5.00%, due 12/1/34 | 165,000 | 164,254 |
| Series A | | |
| 5.00%, due 12/1/40 | 175,000 | 169,527 |
| Suffolk Tobacco Asset Securitization Corp., Tobacco Settlement, Asset Backed, Revenue Bonds | | |
| Series A-1 | | |
| 0.67%, due 6/1/23 | 1,585,000 | 1,547,305 |
| Series A-1 | | |
| 1.015%, due 6/1/24 | 1,000,000 | 942,293 |
| Series A-2 | | |
| 4.00%, due 6/1/37 | 1,250,000 | 1,111,294 |
| Series A-2 | | |
| 4.00%, due 6/1/38 | 1,000,000 | 878,499 |
| Series A-2 | | |
| 4.00%, due 6/1/39 | 1,250,000 | 1,087,050 |
| Series A-2 | | |
| 4.00%, due 6/1/40 | 1,250,000 | 1,076,791 |
| Series B-1 | | |
| 4.00%, due 6/1/50 | 4,250,000 | 3,818,718 |
| Territory of Guam, Business Privilege Tax, Revenue Bonds | | |
| Series D | | |
| 4.00%, due 11/15/39 | 880,000 | 682,152 |
| Series D | | |
| 5.00%, due 11/15/27 | 2,825,000 | 2,828,271 |
| Series D | | |
| 5.00%, due 11/15/28 | 200,000 | 200,011 |
| | Principal
Amount | Value |
| |
| Other Revenue (continued) |
| Territory of Guam, Section 30, Revenue Bonds | | |
| Series A | | |
| 5.00%, due 12/1/36 | $ 1,020,000 | $ 970,152 |
| Tompkins County Development Corp., Kendal at Ithaca Project, Revenue Bonds | | |
| Series 2014A | | |
| 5.00%, due 7/1/44 | 690,000 | 668,653 |
| TSASC, Inc., Tobacco Settlement Bonds, Revenue Bonds | | |
| Series A | | |
| 5.00%, due 6/1/41 | 2,000,000 | 1,994,763 |
| Series B | | |
| 5.00%, due 6/1/48 | 9,890,000 | 8,457,714 |
| Virgin Islands Public Finance Authority, Gross Receipts Taxes Loan, Revenue Bonds | | |
| Series A | | |
| 5.00%, due 10/1/29 (a) | 1,000,000 | 950,230 |
| Series A | | |
| 5.00%, due 10/1/32 | 1,000,000 | 925,161 |
| Series A, Insured: AGM-CR | | |
| 5.00%, due 10/1/32 | 1,200,000 | 1,205,108 |
| Westchester County Local Development Corp., Kendal on Hudson Project, Revenue Bonds | | |
| Series B | | |
| 5.00%, due 1/1/51 | 2,500,000 | 2,251,023 |
| Westchester County Local Development Corp., Miriam Osborn Memorial Home Association Project, Revenue Bonds | | |
| 5.00%, due 7/1/27 | 270,000 | 279,033 |
| 5.00%, due 7/1/28 | 270,000 | 280,634 |
| 5.00%, due 7/1/29 | 100,000 | 103,844 |
| 5.00%, due 7/1/34 | 200,000 | 204,659 |
| Westchester County Local Development Corp., Pace University, Revenue Bonds | | |
| Series A | | |
| 5.50%, due 5/1/42 | 3,265,000 | 3,232,367 |
The notes to the financial statements are an integral part of, and should be read in conjunction with, the financial statements.
23
Portfolio of Investments October 31, 2022† (continued)
| | Principal
Amount | Value |
| Long-Term Municipal Bonds (continued) |
| Other Revenue (continued) |
| Westchester Tobacco Asset Securitization Corp., Tobacco Settlement, Asset-Backed, Revenue Bonds, Senior Lien | | |
| Series B | | |
| 5.00%, due 6/1/41 | $ 250,000 | $ 251,106 |
| | | 357,946,701 |
| Transportation 14.7% |
| Albany County Airport Authority, Revenue Bonds | | |
| 4.00%, due 12/15/44 | 835,000 | 702,038 |
| Series A | | |
| 5.00%, due 12/15/43 | 1,750,000 | 1,731,578 |
| Series A | | |
| 5.00%, due 12/15/48 | 2,585,000 | 2,504,829 |
| Antonio B Won Pat International Airport Authority, Revenue Bonds (b) | | |
| Series C, Insured: AGM | | |
| 6.00%, due 10/1/34 | 720,000 | 734,429 |
| Series C, Insured: AGM | | |
| 6.00%, due 10/1/34 | 280,000 | 285,611 |
| Buffalo & Fort Erie Public Bridge Authority, Revenue Bonds | | |
| 5.00%, due 1/1/47 | 2,095,000 | 2,112,316 |
| Metropolitan Transportation Authority, Revenue Bonds | | |
| Series D | | |
| 4.00%, due 11/15/42 | 1,230,000 | 1,000,776 |
| Series D | | |
| 5.00%, due 11/15/29 | 550,000 | 561,143 |
| Series B | | |
| 5.00%, due 11/15/40 | 2,500,000 | 2,385,835 |
| Series E | | |
| 5.00%, due 11/15/42 | 685,000 | 685,449 |
| Series B, Insured: BAM | | |
| 5.00%, due 11/15/52 | 9,000,000 | 9,016,408 |
| Metropolitan Transportation Authority, Climate Certified Green Bond, Revenue Bonds | | |
| Series C, Insured: AGM | | |
| 4.00%, due 11/15/47 | 6,720,000 | 5,510,897 |
| Metropolitan Transportation Authority, Green Bond, Revenue Bonds | | |
| Series A-1, Insured: AGM | | |
| 4.00%, due 11/15/42 | 2,180,000 | 1,863,713 |
| | Principal
Amount | Value |
| |
| Transportation (continued) |
Metropolitan Transportation Authority, Green Bond, Revenue Bonds
(continued) | | |
| Series C, Insured: AGM | | |
| 4.00%, due 11/15/46 | $ 1,600,000 | $ 1,320,973 |
| Series D-2 | | |
| 4.00%, due 11/15/47 | 2,000,000 | 1,552,273 |
| Series C, Insured: AGM | | |
| 4.00%, due 11/15/48 | 1,200,000 | 977,710 |
| Series D-2 | | |
| 4.00%, due 11/15/48 | 300,000 | 231,123 |
| Series A-1 | | |
| 4.00%, due 11/15/49 | 2,000,000 | 1,533,995 |
| Series A-1, Insured: AGM | | |
| 4.00%, due 11/15/50 | 2,500,000 | 2,019,042 |
| Series A-1 | | |
| 4.00%, due 11/15/52 | 1,460,000 | 1,099,291 |
| Series A-1, Insured: AGM | | |
| 4.00%, due 11/15/54 | 3,500,000 | 2,780,534 |
| Series A-2 | | |
| 5.00%, due 11/15/27 | 590,000 | 598,445 |
| Series C | | |
| 5.00%, due 11/15/42 | 2,325,000 | 2,198,685 |
| MTA Hudson Rail Yards Trust Obligations, Election 2016, Revenue Bonds | | |
| Series A | | |
| 5.00%, due 11/15/56 | 7,205,000 | 7,005,024 |
| New York State Bridge Authority, Revenue Bonds | | |
| Series A | | |
| 4.00%, due 1/1/38 | 200,000 | 183,506 |
| Series A | | |
| 4.00%, due 1/1/39 | 275,000 | 250,991 |
| Series A | | |
| 4.00%, due 1/1/40 | 325,000 | 294,210 |
| Series A | | |
| 4.00%, due 1/1/41 | 200,000 | 180,197 |
| Series A | | |
| 4.00%, due 1/1/46 | 1,000,000 | 876,816 |
| New York State Thruway Authority, Revenue Bonds | | |
| Series L | | |
| 4.00%, due 1/1/36 | 4,000,000 | 3,733,997 |
| Series B, Insured: AGM | | |
| 4.00%, due 1/1/45 | 4,450,000 | 3,760,602 |
| Series N | | |
| 4.00%, due 1/1/47 | 5,500,000 | 4,565,654 |
The notes to the financial statements are an integral part of, and should be read in conjunction with, the financial statements.
| 24 | MainStay MacKay New York Tax Free Opportunities Fund |
| | Principal
Amount | Value |
| Long-Term Municipal Bonds (continued) |
| Transportation (continued) |
| New York State Thruway Authority, General Revenue Junior Indebtedness Obligation, Revenue Bonds, Junior Lien | | |
| Series B, Insured: BAM | | |
| 4.00%, due 1/1/45 | $ 9,050,000 | $ 7,605,818 |
| New York Transportation Development Corp., JFK International Air Terminal LLC, Revenue Bonds | | |
| 5.00%, due 12/1/29 (b) | 1,250,000 | 1,247,120 |
| New York Transportation Development Corp., LaGuardia Airport Terminal B Redevelopment Project, Revenue Bonds | | |
| Series A | | |
| 5.00%, due 7/1/41 (b) | 3,000,000 | 2,805,316 |
| New York Transportation Development Corp., Terminal 4 John F. Kennedy International Airport Project, Revenue Bonds | | |
| 4.00%, due 12/1/38 (b) | 1,275,000 | 1,052,354 |
| Series A | | |
| 4.00%, due 12/1/42 (b) | 1,350,000 | 1,059,195 |
| Series C | | |
| 4.00%, due 12/1/42 | 7,090,000 | 5,699,393 |
| Series A | | |
| 5.00%, due 12/1/36 (b) | 1,600,000 | 1,515,802 |
| 5.00%, due 12/1/37 (b) | 3,500,000 | 3,299,339 |
| Niagara Frontier Transportation Authority, Buffalo Niagara International Airport, Revenue Bonds (b) | | |
| Series A | | |
| 5.00%, due 4/1/24 | 490,000 | 498,209 |
| Series A | | |
| 5.00%, due 4/1/27 | 610,000 | 614,550 |
| Series A | | |
| 5.00%, due 4/1/29 | 325,000 | 327,171 |
| Series A | | |
| 5.00%, due 4/1/29 | 600,000 | 613,708 |
| Series A | | |
| 5.00%, due 4/1/30 | 375,000 | 383,378 |
| Series A | | |
| 5.00%, due 4/1/31 | 350,000 | 356,728 |
| Series A | | |
| 5.00%, due 4/1/32 | 400,000 | 406,240 |
| | Principal
Amount | Value |
| |
| Transportation (continued) |
| Niagara Frontier Transportation Authority, Buffalo Niagara International Airport, Revenue Bonds (b) (continued) | | |
| Series A | | |
| 5.00%, due 4/1/34 | $ 450,000 | $ 446,459 |
| Series A | | |
| 5.00%, due 4/1/35 | 400,000 | 392,894 |
| Series A | | |
| 5.00%, due 4/1/36 | 600,000 | 586,006 |
| Series A | | |
| 5.00%, due 4/1/38 | 375,000 | 365,583 |
| Ogdensburg Bridge and Port Authority, Revenue Bonds | | |
| 5.75%, due 7/1/47 (a) | 2,090,000 | 1,720,269 |
| Port Authority of Guam, Revenue Bonds | | |
| Series B | | |
| 5.00%, due 7/1/36 (b) | 625,000 | 635,413 |
| Series B | | |
| 5.00%, due 7/1/37 (b) | 200,000 | 202,779 |
| Series A | | |
| 5.00%, due 7/1/48 | 1,235,000 | 1,248,360 |
| Port Authority of New York & New Jersey, Revenue Bonds (b) | | |
| Series 218 | | |
| 4.00%, due 11/1/41 | 2,030,000 | 1,748,094 |
| Series 223 | | |
| 4.00%, due 7/15/46 | 3,000,000 | 2,471,235 |
| Series 221 | | |
| 4.00%, due 7/15/50 | 3,000,000 | 2,431,695 |
| Series 231 | | |
| 5.50%, due 8/1/47 | 4,000,000 | 4,184,851 |
| Port Authority of New York & New Jersey, Revenue Bonds, Third Series | | |
| Series 193 | | |
| 5.00%, due 10/15/34 (b) | 5,775,000 | 5,829,731 |
| Port Authority of New York & New Jersey, Consolidated 178th, Revenue Bonds | | |
| Series 178 | | |
| 5.00%, due 12/1/38 (b) | 1,500,000 | 1,511,319 |
| Port Authority of New York & New Jersey, Consolidated 1st, Revenue Bonds | | |
| Series 207 | | |
| 5.00%, due 9/15/48 (b) | 2,500,000 | 2,293,473 |
The notes to the financial statements are an integral part of, and should be read in conjunction with, the financial statements.
25
Portfolio of Investments October 31, 2022† (continued)
| | Principal
Amount | Value |
| Long-Term Municipal Bonds (continued) |
| Transportation (continued) |
| Port Authority of New York & New Jersey, Consolidated 214th, Revenue Bonds (b) | | |
| Series 214 | | |
| 4.00%, due 9/1/37 | $ 2,955,000 | $ 2,627,640 |
| Series 214 | | |
| 4.00%, due 9/1/39 | 4,350,000 | 3,799,302 |
| Port Authority of New York & New Jersey, Consolidated 218th, Revenue Bonds | | |
| Series 218 | | |
| 4.00%, due 11/1/47 (b) | 5,500,000 | 4,507,731 |
| Puerto Rico Highway & Transportation Authority, Revenue Bonds | | |
| Insured: AGC-ICC | | |
| 5.00%, due 7/1/23 | 340,000 | 342,372 |
| Syracuse Regional Airport Authority, Revenue Bonds (b) | | |
| 4.00%, due 7/1/35 | 350,000 | 313,998 |
| 4.00%, due 7/1/36 | 435,000 | 385,910 |
| 5.00%, due 7/1/26 | 1,000,000 | 1,020,579 |
| 5.00%, due 7/1/31 | 1,000,000 | 1,023,426 |
| 5.00%, due 7/1/32 | 1,000,000 | 1,019,054 |
| 5.00%, due 7/1/33 | 750,000 | 759,237 |
| Triborough Bridge & Tunnel Authority, Revenue Bonds | | |
| Series B | | |
| 5.00%, due 11/15/45 | 2,000,000 | 2,036,379 |
| Triborough Bridge & Tunnel Authority, MTA Bridges & Tunnels, Revenue Bonds | | |
| Series A | | |
| 4.00%, due 11/15/44 | 1,105,000 | 934,158 |
| Series A | | |
| 4.00%, due 11/15/54 | 5,000,000 | 4,092,898 |
| Series A | | |
| 5.00%, due 11/15/54 | 4,000,000 | 4,051,654 |
| Series A | | |
| 5.00%, due 11/15/56 | 1,000,000 | 1,009,382 |
| Series A | | |
| 5.50%, due 11/15/57 | 10,000,000 | 10,597,851 |
| | | 156,332,143 |
| | Principal
Amount | Value |
| |
| Utilities 2.5% |
| Guam Power Authority, Revenue Bonds | | |
| Series A | | |
| 5.00%, due 10/1/33 | $ 1,055,000 | $ 1,071,900 |
| Series A | | |
| 5.00%, due 10/1/38 | 350,000 | 352,575 |
| Series A | | |
| 5.00%, due 10/1/40 | 3,600,000 | 3,610,608 |
| Long Island Power Authority, Electric System, Revenue Bonds | | |
| Series A, Insured: AGM | | |
| (zero coupon), due 12/1/26 | 1,500,000 | 1,288,409 |
| New York Power Authority, Green Bond, Revenue Bonds | | |
| Series A | | |
| 4.00%, due 11/15/60 | 3,335,000 | 2,733,951 |
| New York Power Authority, Green Transmission Project, Revenue Bonds | | |
| Series A, Insured: AGM | | |
| 4.00%, due 11/15/47 | 7,710,000 | 6,590,233 |
| Puerto Rico Electric Power Authority, Revenue Bonds | | |
| Series TT, Insured: NATL-RE | | |
| 5.00%, due 7/1/23 | 265,000 | 264,777 |
| Series TT, Insured: NATL-RE | | |
| 5.00%, due 7/1/26 | 215,000 | 213,687 |
| Series XX | | |
| 5.25%, due 7/1/40 (d)(e) | 5,630,000 | 4,236,575 |
| Utility Debt Securitization Authority, Revenue Bonds | | |
| 5.00%, due 12/15/38 | 5,500,000 | 5,760,125 |
| | | 26,122,840 |
| Water & Sewer 4.9% |
| Albany Municipal Water Finance Authority, Revenue Bonds | | |
| Series A | | |
| 4.00%, due 12/1/45 | 3,000,000 | 2,688,958 |
| Buffalo Municipal Water Finance Authority, Revenue Bonds | | |
| Series A, Insured: AGM | | |
| 4.00%, due 7/1/51 | 2,000,000 | 1,651,771 |
| Great Neck North Water Authority, Revenue Bonds | | |
| Series A | | |
| 4.00%, due 1/1/32 | 250,000 | 245,833 |
The notes to the financial statements are an integral part of, and should be read in conjunction with, the financial statements.
| 26 | MainStay MacKay New York Tax Free Opportunities Fund |
| | Principal
Amount | Value |
| Long-Term Municipal Bonds (continued) |
| Water & Sewer (continued) |
| Great Neck North Water Authority, Revenue Bonds (continued) | | |
| Series A | | |
| 4.00%, due 1/1/33 | $ 425,000 | $ 406,350 |
| Series A | | |
| 4.00%, due 1/1/34 | 250,000 | 234,727 |
| Guam Government Waterworks Authority, Water and Wastewater System, Revenue Bonds | | |
| Series A | | |
| 5.00%, due 7/1/35 | 4,000,000 | 4,016,019 |
| 5.00%, due 1/1/46 | 3,365,000 | 3,269,808 |
| Series A | | |
| 5.00%, due 1/1/50 | 9,975,000 | 9,469,045 |
| Monroe County Water Authority, Water System, Revenue Bonds | | |
| 3.50%, due 3/1/45 | 2,000,000 | 1,595,197 |
| 5.00%, due 8/1/37 | 750,000 | 751,252 |
| New York City Municipal Water Finance Authority, Water & Sewer System Second General Resolution, Revenue Bonds | | |
| Series FF-1 | | |
| 4.00%, due 6/15/49 | 3,000,000 | 2,554,253 |
| Series DD | | |
| 5.00%, due 6/15/34 | 1,000,000 | 1,006,470 |
| Series GG-1 | | |
| 5.00%, due 6/15/48 | 1,000,000 | 1,022,935 |
| Series AA-1 | | |
| 5.00%, due 6/15/50 | 755,000 | 772,868 |
| Niagara Falls Public Water Authority, Water & Sewer System, Revenue Bonds | | |
| Series A | | |
| 5.00%, due 7/15/34 | 770,000 | 807,431 |
| Onondaga County Water Authority, Revenue Bonds | | |
| Series A | | |
| 4.00%, due 9/15/36 | 1,375,000 | 1,290,448 |
| Series A | | |
| 4.00%, due 9/15/37 | 1,945,000 | 1,786,976 |
| Series A | | |
| 4.00%, due 9/15/39 | 700,000 | 633,033 |
| | Principal
Amount | Value |
| |
| Water & Sewer (continued) |
| Puerto Rico Commonwealth Aqueduct & Sewer Authority, Revenue Bonds (a) | | |
| Series B | | |
| 5.00%, due 7/1/24 | $ 2,850,000 | $ 2,842,483 |
| Series B | | |
| 5.00%, due 7/1/29 | 870,000 | 841,910 |
| Series B | | |
| 5.00%, due 7/1/33 | 6,000,000 | 5,603,626 |
| Puerto Rico Commonwealth Aqueduct & Sewer Authority, Revenue Bonds, Senior Lien | | |
| Series A | | |
| 5.00%, due 7/1/47 (a) | 2,500,000 | 2,142,579 |
| Saratoga County Water Authority, Revenue Bonds | | |
| 4.00%, due 9/1/48 | 4,600,000 | 3,990,511 |
| Upper Mohawk Valley Regional Water Finance Authority, Green Bond, Revenue Bonds | | |
| Series A, Insured: AGM | | |
| 4.00%, due 4/1/46 | 2,675,000 | 2,369,187 |
| | | 51,993,670 |
Total Long-Term Municipal Bonds
(Cost $1,108,179,939) | | 955,342,840 |
| Short-Term Municipal Notes 3.3% |
| General Obligation 0.9% |
| City of New York NY, Unlimited General Obligation | | |
| Series D-4 | | |
| 1.60%, due 12/1/47 (f) | 10,000,000 | 10,000,000 |
| Transportation 1.9% |
| Metropolitan Transportation Authority, Revenue Bonds | | |
| Series E-1 | | |
| 1.60%, due 11/15/50 (f) | 20,000,000 | 20,000,000 |
The notes to the financial statements are an integral part of, and should be read in conjunction with, the financial statements.
27
Portfolio of Investments October 31, 2022† (continued)
| | Principal
Amount | | Value |
| Short-Term Municipal Notes (continued) |
| Utility 0.5% |
| Puerto Rico Electric Power Authority, Revenue Bonds | | | |
| Series UU, Insured: AGM | | | |
| 2.046%, due 7/1/29 (f) | $ 5,000,000 | | $ 4,696,916 |
Total Short-Term Municipal Notes
(Cost $34,764,078) | | | 34,696,916 |
Total Municipal Bonds
(Cost $1,142,944,017) | | | 990,039,756 |
| |
| | Shares | | |
| Closed-End Funds 0.2% |
| New York 0.2% |
| BlackRock New York Municipal Income Trust | 12,602 | | 115,056 |
| Eaton Vance New York Municipal Bond Fund | 13,241 | | 110,960 |
| Nuveen New York AMT-Free Quality Municipal Income Fund | 205,883 | | 1,968,241 |
Total Closed-End Funds
(Cost $3,194,012) | | | 2,194,257 |
| Short-Term Investment 6.0% |
| Unaffiliated Investment Company 6.0% |
| BlackRock Liquidity Funds MuniCash, 1.826% (g) | 63,895,577 | | 63,889,188 |
Total Short-Term Investment
(Cost $63,889,188) | | | 63,889,188 |
Total Investments
(Cost $1,210,027,217) | 99.5% | | 1,056,123,201 |
| Other Assets, Less Liabilities | 0.5 | | 4,849,343 |
| Net Assets | 100.0% | | $ 1,060,972,544 |
| † | Percentages indicated are based on Fund net assets. |
| (a) | May be sold to institutional investors only under Rule 144A or securities offered pursuant to Section 4(a)(2) of the Securities Act of 1933, as amended. |
| (b) | Interest on these securities was subject to alternative minimum tax. |
| (c) | Coupon rate may change based on changes of the underlying collateral or prepayments of principal. Rate shown was the rate in effect as of October 31, 2022. |
| (d) | Issue in default. |
| (e) | Issue in non-accrual status. |
| (f) | Variable-rate demand notes (VRDNs)—Provide the right to sell the security at face value on either that day or within the rate-reset period. VRDNs will normally trade as if the maturity is the earlier put date, even though stated maturity is longer. The interest rate is reset on the put date at a stipulated daily, weekly, monthly, quarterly, or other specified time interval to reflect current market conditions. These securities do not indicate a reference rate and spread in their description. The maturity date shown is the final maturity. |
| (g) | Current yield as of October 31, 2022. |
Futures Contracts
As of October 31, 2022, the Fund held the following futures contracts1:
| Type | Number of
Contracts | Expiration
Date | Value at
Trade Date | Current
Notional
Amount | Unrealized
Appreciation
(Depreciation)2 |
| Short Contracts | | | | | |
| U.S. Treasury 10 Year Notes | (900) | December 2022 | $ (105,660,861) | $ (99,534,375) | $ 6,126,486 |
The notes to the financial statements are an integral part of, and should be read in conjunction with, the financial statements.
| 28 | MainStay MacKay New York Tax Free Opportunities Fund |
| Type | Number of
Contracts | Expiration
Date | Value at
Trade Date | Current
Notional
Amount | Unrealized
Appreciation
(Depreciation)2 |
| U.S. Treasury Long Bonds | (485) | December 2022 | $ (63,782,029) | $ (58,442,500) | $ 5,339,529 |
| Net Unrealized Appreciation | | | | | $ 11,466,015 |
| 1. | As of October 31, 2022, cash in the amount of $3,643,000 was on deposit with a broker or futures commission merchant for futures transactions. |
| 2. | Represents the difference between the value of the contracts at the time they were opened and the value as of October 31, 2022. |
| Abbreviation(s): |
| AGC—Assured Guaranty Corp. |
| AGM—Assured Guaranty Municipal Corp. |
| AMBAC—Ambac Assurance Corp. |
| BAM—Build America Mutual Assurance Co. |
| CR—Custodial Receipts |
| FHA—Federal Housing Administration |
| ICC—Insured Custody Certificates |
| NATL-RE—National Public Finance Guarantee Corp. |
The following is a summary of the fair valuations according to the inputs used as of October 31, 2022, for valuing the Fund’s assets:
| Description | Quoted
Prices in
Active
Markets for
Identical
Assets
(Level 1) | | Significant
Other
Observable
Inputs
(Level 2) | | Significant
Unobservable
Inputs
(Level 3) | | Total |
| Asset Valuation Inputs | | | | | | | |
| Investments in Securities (a) | | | | | | | |
| Municipal Bonds | | | | | | | |
| Long-Term Municipal Bonds | $ — | | $ 955,342,840 | | $ — | | $ 955,342,840 |
| Short-Term Municipal Notes | — | | 34,696,916 | | — | | 34,696,916 |
| Total Municipal Bonds | — | | 990,039,756 | | — | | 990,039,756 |
| Closed-End Funds | 2,194,257 | | — | | — | | 2,194,257 |
| Short-Term Investment | | | | | | | |
| Unaffiliated Investment Company | 63,889,188 | | — | | — | | 63,889,188 |
| Total Investments in Securities | 66,083,445 | | 990,039,756 | | — | | 1,056,123,201 |
| Other Financial Instruments | | | | | | | |
| Futures Contracts (b) | 11,466,015 | | — | | — | | 11,466,015 |
| Total Investments in Securities and Other Financial Instruments | $ 77,549,460 | | $ 990,039,756 | | $ — | | $ 1,067,589,216 |
| (a) | For a complete listing of investments and their industries, see the Portfolio of Investments. |
| (b) | The value listed for these securities reflects unrealized appreciation (depreciation) as shown on the Portfolio of Investments. |
The notes to the financial statements are an integral part of, and should be read in conjunction with, the financial statements.
29
Statement of Assets and Liabilities as of October 31, 2022
| Assets |
Investment in securities, at value
(identified cost $1,210,027,217) | $1,056,123,201 |
| Cash | 215 |
| Cash collateral on deposit at broker for futures contracts | 3,643,000 |
| Receivables: | |
| Dividends and interest | 14,082,243 |
| Fund shares sold | 12,430,429 |
| Investment securities sold | 1,745,971 |
| Variation margin on futures contracts | 729,380 |
| Other assets | 12,982 |
| Total assets | 1,088,767,421 |
| Liabilities |
| Payables: | |
| Fund shares redeemed | 24,378,290 |
| Investment securities purchased | 2,111,299 |
| Manager (See Note 3) | 413,252 |
| NYLIFE Distributors (See Note 3) | 188,862 |
| Transfer agent (See Note 3) | 73,277 |
| Shareholder communication | 23,045 |
| Professional fees | 22,823 |
| Custodian | 21,636 |
| Trustees | 369 |
| Accrued expenses | 9,691 |
| Distributions payable | 552,333 |
| Total liabilities | 27,794,877 |
| Net assets | $1,060,972,544 |
| Composition of Net Assets |
| Shares of beneficial interest outstanding (par value of $.001 per share) unlimited number of shares authorized | $ 119,359 |
| Additional paid-in-capital | 1,275,825,285 |
| | 1,275,944,644 |
| Total distributable earnings (loss) | (214,972,100) |
| Net assets | $1,060,972,544 |
| Class A | |
| Net assets applicable to outstanding shares | $690,832,075 |
| Shares of beneficial interest outstanding | 77,724,935 |
| Net asset value per share outstanding | $ 8.89 |
| Maximum sales charge (3.00% of offering price) | 0.27 |
| Maximum offering price per share outstanding | $ 9.16 |
| Investor Class | |
| Net assets applicable to outstanding shares | $ 300,966 |
| Shares of beneficial interest outstanding | 33,862 |
| Net asset value per share outstanding | $ 8.89 |
| Maximum sales charge (2.50% of offering price) | 0.23 |
| Maximum offering price per share outstanding | $ 9.12 |
| Class C | |
| Net assets applicable to outstanding shares | $ 73,021,933 |
| Shares of beneficial interest outstanding | 8,214,631 |
| Net asset value and offering price per share outstanding | $ 8.89 |
| Class C2 | |
| Net assets applicable to outstanding shares | $ 1,637,515 |
| Shares of beneficial interest outstanding | 184,305 |
| Net asset value and offering price per share outstanding | $ 8.88 |
| Class I | |
| Net assets applicable to outstanding shares | $294,456,052 |
| Shares of beneficial interest outstanding | 33,120,075 |
| Net asset value and offering price per share outstanding | $ 8.89 |
| Class R6 | |
| Net assets applicable to outstanding shares | $ 724,003 |
| Shares of beneficial interest outstanding | 81,426 |
| Net asset value and offering price per share outstanding | $ 8.89 |
The notes to the financial statements are an integral part of, and should be read in conjunction with, the financial statements.
| 30 | MainStay MacKay New York Tax Free Opportunities Fund |
Statement of Operations for the year ended October 31, 2022
| Investment Income (Loss) |
| Income | |
| Interest | $ 38,732,625 |
| Dividends | 130,037 |
| Total income | 38,862,662 |
| Expenses | |
| Manager (See Note 3) | 5,554,077 |
| Distribution/Service—Class A (See Note 3) | 2,043,604 |
| Distribution/Service—Investor Class (See Note 3) | 869 |
| Distribution/Service—Class C (See Note 3) | 472,957 |
| Distribution/Service—Class C2 (See Note 3) | 12,463 |
| Transfer agent (See Note 3) | 454,953 |
| Professional fees | 135,797 |
| Custodian | 100,029 |
| Shareholder communication | 43,501 |
| Registration | 40,744 |
| Trustees | 27,400 |
| Miscellaneous | 56,131 |
| Total expenses before waiver/reimbursement | 8,942,525 |
| Expense waiver/reimbursement from Manager (See Note 3) | (174,570) |
| Net expenses | 8,767,955 |
| Net investment income (loss) | 30,094,707 |
| Realized and Unrealized Gain (Loss) |
| Net realized gain (loss) on: | |
| Unaffiliated investment transactions | (47,902,637) |
| Futures transactions | 10,046,436 |
| Net realized gain (loss) | (37,856,201) |
| Net change in unrealized appreciation (depreciation) on: | |
| Unaffiliated investments | (222,317,681) |
| Futures contracts | 11,445,814 |
| Net change in unrealized appreciation (depreciation) | (210,871,867) |
| Net realized and unrealized gain (loss) | (248,728,068) |
| Net increase (decrease) in net assets resulting from operations | $(218,633,361) |
The notes to the financial statements are an integral part of, and should be read in conjunction with, the financial statements.
31
Statements of Changes in Net Assets
for the years ended October 31, 2022 and October 31, 2021
| | 2022 | 2021 |
| Increase (Decrease) in Net Assets |
| Operations: | | |
| Net investment income (loss) | $ 30,094,707 | $ 25,909,535 |
| Net realized gain (loss) | (37,856,201) | 538,926 |
| Net change in unrealized appreciation (depreciation) | (210,871,867) | 32,703,974 |
| Net increase (decrease) in net assets resulting from operations | (218,633,361) | 59,152,435 |
| Distributions to shareholders: | | |
| Class A | (23,036,677) | (19,009,606) |
| Investor Class | (9,823) | (9,566) |
| Class C | (2,420,147) | (2,288,913) |
| Class C2 | (46,357) | (24,498) |
| Class I | (10,162,463) | (8,089,706) |
| Class R6 | (24,025) | (27,918) |
| Total distributions to shareholders | (35,699,492) | (29,450,207) |
| Capital share transactions: | | |
| Net proceeds from sales of shares | 1,065,321,666 | 497,461,170 |
| Net asset value of shares issued to shareholders in reinvestment of distributions | 29,183,591 | 23,618,819 |
| Cost of shares redeemed | (1,155,538,985) | (234,382,554) |
| Increase (decrease) in net assets derived from capital share transactions | (61,033,728) | 286,697,435 |
| Net increase (decrease) in net assets | (315,366,581) | 316,399,663 |
| Net Assets |
| Beginning of year | 1,376,339,125 | 1,059,939,462 |
| End of year | $ 1,060,972,544 | $1,376,339,125 |
The notes to the financial statements are an integral part of, and should be read in conjunction with, the financial statements.
| 32 | MainStay MacKay New York Tax Free Opportunities Fund |
Financial Highlights selected per share data and ratios
| | Year Ended October 31, |
| Class A | 2022 | | 2021 | | 2020 | | 2019 | | 2018 |
| Net asset value at beginning of year | $ 10.94 | | $ 10.63 | | $ 10.68 | | $ 10.12 | | $ 10.34 |
| Net investment income (loss) | 0.24(a) | | 0.22(a) | | 0.29 | | 0.32 | | 0.34 |
| Net realized and unrealized gain (loss) | (2.00) | | 0.34 | | (0.04) | | 0.56 | | (0.22) |
| Total from investment operations | (1.76) | | 0.56 | | 0.25 | | 0.88 | | 0.12 |
| Less distributions: | | | | | | | | | |
| From net investment income | (0.29) | | (0.25) | | (0.30) | | (0.32) | | (0.34) |
| Net asset value at end of year | $ 8.89 | | $ 10.94 | | $ 10.63 | | $ 10.68 | | $ 10.12 |
| Total investment return (b) | (16.36)% | | 5.32% | | 2.35% | | 8.84% | | 1.17% |
| Ratios (to average net assets)/Supplemental Data: | | | | | | | | | |
| Net investment income (loss) | 2.37% | | 2.02% | | 2.38% | | 3.00% | | 3.31% |
| Net expenses (c) | 0.75% | | 0.75% | | 0.75% | | 0.75% | | 0.75% |
| Expenses (before waiver/reimbursement) (c) | 0.76% | | 0.76% | | 0.80% | | 0.82% | | 0.82% |
| Portfolio turnover rate | 53%(d) | | 10%(d) | | 29%(d) | | 28%(d) | | 33% |
| Net assets at end of year (in 000’s) | $ 690,832 | | $ 907,662 | | $ 688,870 | | $ 462,499 | | $ 186,579 |
| (a) | Per share data based on average shares outstanding during the year. |
| (b) | Total investment return is calculated exclusive of sales charges and assumes the reinvestment of dividends and distributions. For periods of less than one year, total return is not annualized. |
| (c) | In addition to the fees and expenses which the Fund bears directly, it also indirectly bears a pro-rata share of the fees and expenses of the underlying funds in which it invests. Such indirect expenses are not included in the above expense ratios. |
| (d) | The portfolio turnover rate includes variable rate demand notes. |
| | Year Ended October 31, |
| Investor Class | 2022 | | 2021 | | 2020 | | 2019 | | 2018 |
| Net asset value at beginning of year | $ 10.94 | | $ 10.63 | | $ 10.68 | | $ 10.13 | | $ 10.34 |
| Net investment income (loss) | 0.24(a) | | 0.22(a) | | 0.25 | | 0.32 | | 0.34 |
| Net realized and unrealized gain (loss) | (2.00) | | 0.34 | | 0.00‡ | | 0.55 | | (0.21) |
| Total from investment operations | (1.76) | | 0.56 | | 0.25 | | 0.87 | | 0.13 |
| Less distributions: | | | | | | | | | |
| From net investment income | (0.29) | | (0.25) | | (0.30) | | (0.32) | | (0.34) |
| Net asset value at end of year | $ 8.89 | | $ 10.94 | | $ 10.63 | | $ 10.68 | | $ 10.13 |
| Total investment return (b) | (16.37)% | | 5.32% | | 2.33% | | 8.72% | | 1.25% |
| Ratios (to average net assets)/Supplemental Data: | | | | | | | | | |
| Net investment income (loss) | 2.37% | | 2.03% | | 2.39% | | 3.06% | | 3.29% |
| Net expenses (c) | 0.76% | | 0.76% | | 0.77% | | 0.77% | | 0.78% |
| Expenses (before waiver/reimbursement) (c) | 0.77% | | 0.77% | | 0.82% | | 0.84% | | 0.85% |
| Portfolio turnover rate | 53%(d) | | 10%(d) | | 29%(d) | | 28%(d) | | 33% |
| Net assets at end of year (in 000's) | $ 301 | | $ 375 | | $ 414 | | $ 463 | | $ 385 |
| ‡ | Less than one cent per share. |
| (a) | Per share data based on average shares outstanding during the year. |
| (b) | Total investment return is calculated exclusive of sales charges and assumes the reinvestment of dividends and distributions. For periods of less than one year, total return is not annualized. |
| (c) | In addition to the fees and expenses which the Fund bears directly, it also indirectly bears a pro-rata share of the fees and expenses of the underlying funds in which it invests. Such indirect expenses are not included in the above expense ratios. |
| (d) | The portfolio turnover rate includes variable rate demand notes. |
The notes to the financial statements are an integral part of, and should be read in conjunction with, the financial statements.
33
Financial Highlights selected per share data and ratios
| | Year Ended October 31, |
| Class C | 2022 | | 2021 | | 2020 | | 2019 | | 2018 |
| Net asset value at beginning of year | $ 10.94 | | $ 10.63 | | $ 10.68 | | $ 10.12 | | $ 10.34 |
| Net investment income (loss) | 0.21(a) | | 0.19(a) | | 0.24 | | 0.30 | | 0.31 |
| Net realized and unrealized gain (loss) | (2.00) | | 0.35 | | (0.02) | | 0.56 | | (0.22) |
| Total from investment operations | (1.79) | | 0.54 | | 0.22 | | 0.86 | | 0.09 |
| Less distributions: | | | | | | | | | |
| From net investment income | (0.26) | | (0.23) | | (0.27) | | (0.30) | | (0.31) |
| Net asset value at end of year | $ 8.89 | | $ 10.94 | | $ 10.63 | | $ 10.68 | | $ 10.12 |
| Total investment return (b) | (16.58)% | | 5.05% | | 2.08% | | 8.55% | | 0.90% |
| Ratios (to average net assets)/Supplemental Data: | | | | | | | | | |
| Net investment income (loss) | 2.11% | | 1.77% | | 2.13% | | 2.77% | | 3.04% |
| Net expenses (c) | 1.01% | | 1.01% | | 1.02% | | 1.02% | | 1.03% |
| Expenses (before waiver/reimbursement) (c) | 1.02% | | 1.02% | | 1.07% | | 1.09% | | 1.10% |
| Portfolio turnover rate | 53%(d) | | 10%(d) | | 29%(d) | | 28%(d) | | 33% |
| Net assets at end of year (in 000’s) | $ 73,022 | | $ 111,681 | | $ 107,117 | | $ 90,553 | | $ 54,258 |
| (a) | Per share data based on average shares outstanding during the year. |
| (b) | Total investment return is calculated exclusive of sales charges and assumes the reinvestment of dividends and distributions. For periods of less than one year, total return is not annualized. |
| (c) | In addition to the fees and expenses which the Fund bears directly, it also indirectly bears a pro-rata share of the fees and expenses of the underlying funds in which it invests. Such indirect expenses are not included in the above expense ratios. |
| (d) | The portfolio turnover rate includes variable rate demand notes. |
| | Year Ended October 31, | | August 31, 2020^ through
October 31, |
| Class C2 | 2022 | | 2021 | | 2020 |
| Net asset value at beginning of period | $ 10.94 | | $ 10.63 | | $ 10.72 |
| Net investment income (loss) | 0.20(a) | | 0.17(a) | | 0.04 |
| Net realized and unrealized gain (loss) | (2.02) | | 0.35 | | (0.09) |
| Total from investment operations | (1.82) | | 0.52 | | (0.05) |
| Less distributions: | | | | | |
| From net investment income | (0.24) | | (0.21) | | (0.04) |
| Net asset value at end of period | $ 8.88 | | $ 10.94 | | $ 10.63 |
| Total investment return (b) | (16.80)% | | 4.89% | | (0.50)% |
| Ratios (to average net assets)/Supplemental Data: | | | | | |
| Net investment income (loss) | 1.96% | | 1.55% | | 1.32%†† |
| Net expenses (c) | 1.16% | | 1.15% | | 1.17%†† |
| Expenses (before waiver/reimbursement) (c) | 1.17% | | 1.16% | | 1.22%†† |
| Portfolio turnover rate (d) | 53% | | 10% | | 29% |
| Net assets at end of period (in 000’s) | $ 1,638 | | $ 1,861 | | $ 315 |
| ^ | Inception date. |
| †† | Annualized. |
| (a) | Per share data based on average shares outstanding during the period. |
| (b) | Total investment return is calculated exclusive of sales charges and assumes the reinvestment of dividends and distributions. For periods of less than one year, total return is not annualized. |
| (c) | In addition to the fees and expenses which the Fund bears directly, it also indirectly bears a pro-rata share of the fees and expenses of the underlying funds in which it invests. Such indirect expenses are not included in the above expense ratios. |
| (d) | The portfolio turnover rate includes variable rate demand notes. |
The notes to the financial statements are an integral part of, and should be read in conjunction with, the financial statements.
| 34 | MainStay MacKay New York Tax Free Opportunities Fund |
Financial Highlights selected per share data and ratios
| | Year Ended October 31, |
| Class I | 2022 | | 2021 | | 2020 | | 2019 | | 2018 |
| Net asset value at beginning of year | $ 10.94 | | $ 10.63 | | $ 10.68 | | $ 10.13 | | $ 10.34 |
| Net investment income (loss) | 0.26(a) | | 0.25(a) | | 0.32 | | 0.35 | | 0.37 |
| Net realized and unrealized gain (loss) | (2.00) | | 0.34 | | (0.05) | | 0.55 | | (0.21) |
| Total from investment operations | (1.74) | | 0.59 | | 0.27 | | 0.90 | | 0.16 |
| Less distributions: | | | | | | | | | |
| From net investment income | (0.31) | | (0.28) | | (0.32) | | (0.35) | | (0.37) |
| Net asset value at end of year | $ 8.89 | | $ 10.94 | | $ 10.63 | | $ 10.68 | | $ 10.13 |
| Total investment return (b) | (16.15)% | | 5.59% | | 2.61% | | 9.01% | | 1.53% |
| Ratios (to average net assets)/Supplemental Data: | | | | | | | | | |
| Net investment income (loss) | 2.63% | | 2.27% | | 2.64% | | 3.37% | | 3.54% |
| Net expenses (c) | 0.50% | | 0.50% | | 0.50% | | 0.50% | | 0.50% |
| Expenses (before waiver/reimbursement) (c) | 0.51% | | 0.51% | | 0.55% | | 0.57% | | 0.57% |
| Portfolio turnover rate | 53%(d) | | 10%(d) | | 29%(d) | | 28%(d) | | 33% |
| Net assets at end of year (in 000’s) | $ 294,456 | | $ 353,955 | | $ 261,819 | | $ 161,203 | | $ 181,059 |
| (a) | Per share data based on average shares outstanding during the year. |
| (b) | Total investment return is calculated exclusive of sales charges and assumes the reinvestment of dividends and distributions. Class I shares are not subject to sales charges. For periods of less than one year, total return is not annualized. |
| (c) | In addition to the fees and expenses which the Fund bears directly, it also indirectly bears a pro-rata share of the fees and expenses of the underlying funds in which it invests. Such indirect expenses are not included in the above expense ratios. |
| (d) | The portfolio turnover rate includes variable rate demand notes. |
| | Year Ended October 31, | | November 1, 2019^ through
October 31, |
| Class R6 | 2022 | | 2021 | | 2020 |
| Net asset value at beginning of period | $ 10.94 | | $ 10.63 | | $ 10.69 |
| Net investment income (loss) | 0.27(a) | | 0.26(a) | | 0.29 |
| Net realized and unrealized gain (loss) | (2.01) | | 0.33 | | (0.03) |
| Total from investment operations | (1.74) | | 0.59 | | 0.26 |
| Less distributions: | | | | | |
| From net investment income | (0.31) | | (0.28) | | (0.32) |
| Net asset value at end of period | $ 8.89 | | $ 10.94 | | $ 10.63 |
| Total investment return (b) | (16.14)% | | 5.61% | | 2.60% |
| Ratios (to average net assets)/Supplemental Data: | | | | | |
| Net investment income (loss) | 2.67% | | 2.34% | | 2.39% |
| Net expenses (c) | 0.48% | | 0.47% | | 0.48% |
| Expenses (before waiver/reimbursement) (c) | 0.48% | | 0.49% | | 0.54% |
| Portfolio turnover rate (d) | 53% | | 10% | | 29% |
| Net assets at end of period (in 000’s) | $ 724 | | $ 806 | | $ 1,404 |
| ^ | Inception date. |
| (a) | Per share data based on average shares outstanding during the period. |
| (b) | Total investment return is calculated exclusive of sales charges and assumes the reinvestment of dividends and distributions. Class R6 shares are not subject to sales charges. For periods of less than one year, total return is not annualized. |
| (c) | In addition to the fees and expenses which the Fund bears directly, it also indirectly bears a pro-rata share of the fees and expenses of the underlying funds in which it invests. Such indirect expenses are not included in the above expense ratios. |
| (d) | The portfolio turnover rate includes variable rate demand notes. |
The notes to the financial statements are an integral part of, and should be read in conjunction with, the financial statements.
35
Notes to Financial Statements
Note 1-Organization and Business
MainStay Funds Trust (the “Trust”) was organized as a Delaware statutory trust on April 28, 2009. The Trust is registered under the Investment Company Act of 1940, as amended (the “1940 Act”), as an open-end management investment company, and is comprised of thirty-three funds (collectively referred to as the “Funds”). These financial statements and notes relate to the MainStay MacKay New York Tax Free Opportunities Fund (the "Fund"), a “diversified” fund, as that term is defined in the 1940 Act, as interpreted or modified by regulatory authorities having jurisdiction, from time to time.
The following table lists the Fund's share classes that have been registered and commenced operations:
| Class | Commenced Operations |
| Class A | May 14, 2012 |
| Investor Class | May 14, 2012 |
| Class C | May 14, 2012 |
| Class C2 | August 31, 2020 |
| Class I | May 14, 2012 |
| Class R6 | November 1, 2019 |
| SIMPLE Class | N/A* |
| * | SIMPLE Class shares were registered for sale effective as of August 31, 2020 but have not yet commenced operations. |
Class A and Investor Class shares are offered at net asset value (“NAV”) per share plus an initial sales charge. No initial sales charge applies to investments of $250,000 or more (and certain other qualified purchases) in Class A and Investor Class shares. However, a contingent deferred sales charge (“CDSC”) of 1.00% may be imposed on certain redemptions made within 18 months of the date of purchase on shares that were purchased without an initial sales charge. Class C and Class C2 shares are offered at NAV without an initial sales charge, although a 1.00% CDSC may be imposed on certain redemptions of such shares made within one year of the date of purchase of Class C and Class C2 shares. Class I and Class R6 shares are offered at NAV without a sales charge. SIMPLE Class shares are expected to be offered at NAV without a sales charge if such shares are offered in the future. In addition, depending upon eligibility, Class C and Class C2 shares convert to either Class A or Investor Class shares at the end of the calendar quarter eight years after the date they were purchased. Additionally, Investor Class shares may convert automatically to Class A shares based on a shareholder’s account balance as described in the Fund’s prospectus. Under certain circumstances and as may be permitted by the Trust’s multiple class plan pursuant to Rule 18f-3 under the 1940 Act, specified share classes of the Fund may be converted to one or more other share classes of the Fund as disclosed in the capital share transactions within these Notes. The classes of shares have the same voting (except for issues that relate solely to one class), dividend, liquidation and other rights, and the same terms and conditions, except that under distribution plans pursuant to Rule 12b-1 under the 1940 Act, Class C, Class C2 and SIMPLE Class shares are subject to higher distribution and/or service fees than Class A
and Investor Class shares. Class I and Class R6 shares are not subject to a distribution and/or service fee.
The Fund's investment objective is to seek current income exempt from federal and New York state and, in some cases, New York local income taxes.
Note 2–Significant Accounting Policies
The Fund is an investment company and accordingly follows the investment company accounting and reporting guidance of the Financial Accounting Standards Board (“FASB”) Accounting Standards Codification Topic 946 Financial Services—Investment Companies. The Fund prepares its financial statements in accordance with generally accepted accounting principles (“GAAP”) in the United States of America and follows the significant accounting policies described below.
(A) Securities Valuation. Investments are usually valued as of the close of regular trading on the New York Stock Exchange (the "Exchange") (usually 4:00 p.m. Eastern time) on each day the Fund is open for business ("valuation date").
Effective September 8, 2022, and pursuant to Rule 2a-5 under the 1940 Act, the Board of Trustees of the Trust (the "Board") designated New York Life Investment Management LLC (“New York Life Investments” or the "Manager") as its Valuation Designee (the "Valuation Designee"). The Valuation Designee is responsible for performing fair valuations relating to all investments in the Fund’s portfolio for which market quotations are not readily available; periodically assessing and managing material valuation risks; establishing and applying fair value methodologies; testing fair valuation methodologies; evaluating and overseeing pricing services; segregation of valuation and portfolio management functions; providing quarterly, annual and prompt reporting to the Board, as appropriate; identifying potential conflicts of interest; and maintaining appropriate records. The Valuation Designee has established a valuation committee ("Valuation Committee") to assist in carrying out the Valuation Designee’s responsibilities and establish prices of securities for which market quotations are not readily available. The Fund’s and the Valuation Designee's policies and procedures ("Valuation Procedures") govern the Valuation Designee’s selection and application of methodologies for determining and calculating the fair value of Fund investments. The Valuation Designee may value Fund portfolio securities for which market quotations are not readily available and other Fund assets utilizing inputs from pricing services and other third-party sources (together, “Pricing Sources”). The Valuation Committee meets (in person, via electronic mail or via teleconference) on an ad-hoc basis to determine fair valuations and on a quarterly basis to review fair value events (excluding fair valuations from pricing services), including valuation risks and back-testing results, and preview reports to the Board.
The Valuation Committee establishes prices of securities for which market quotations are not readily available based on such methodologies and measurements on a regular basis after considering information that is reasonably available and deemed relevant by the Valuation Committee.
| 36 | MainStay MacKay New York Tax Free Opportunities Fund |
The Board shall oversee the Valuation Designee and review fair valuation materials on a prompt, quarterly and annual basis and approve proposed revisions to the Valuation Procedures.
Investments for which market quotations are not readily available are valued at fair value as determined in good faith pursuant to the Valuation Procedures. A market quotation is readily available only when that quotation is a quoted price (unadjusted) in active markets for identical investments that the Fund can access at the measurement date, provided that a quotation will not be readily available if it is not reliable. Fair value measurements are determined within a framework that establishes a three-tier hierarchy that maximizes the use of observable market data and minimizes the use of unobservable inputs to establish a classification of fair value measurements for disclosure purposes. "Inputs" refer broadly to the assumptions that market participants would use in pricing the asset or liability, including assumptions about risk, such as the risk inherent in a particular valuation technique used to measure fair value using a pricing model and/or the risk inherent in the inputs for the valuation technique. Inputs may be observable or unobservable. Observable inputs reflect the assumptions market participants would use in pricing the asset or liability based on market data obtained from sources independent of the Fund. Unobservable inputs reflect the Fund’s own assumptions about the assumptions market participants would use in pricing the asset or liability based on the information available. The inputs or methodology used for valuing assets or liabilities may not be an indication of the risks associated with investing in those assets or liabilities. The three-tier hierarchy of inputs is summarized below.
| • | Level 1—quoted prices (unadjusted) in active markets for an identical asset or liability |
| • | Level 2—other significant observable inputs (including quoted prices for a similar asset or liability in active markets, interest rates and yield curves, prepayment speeds, credit risk, etc.) |
| • | Level 3—significant unobservable inputs (including the Fund's own assumptions about the assumptions that market participants would use in measuring fair value of an asset or liability) |
The level of an asset or liability within the fair value hierarchy is based on the lowest level of an input, both individually and in the aggregate, that is significant to the fair value measurement. The aggregate value by input level of the Fund’s assets and liabilities as of October 31, 2022, is included at the end of the Portfolio of Investments.
The Fund may use third-party vendor evaluations, whose prices may be derived from one or more of the following standard inputs, among others:
| • Benchmark yields | • Reported trades |
| • Broker/dealer quotes | • Issuer spreads |
| • Two-sided markets | • Benchmark securities |
| • Bids/offers | • Reference data (corporate actions or material event notices) |
| • Industry and economic events | • Comparable bonds |
| • Monthly payment information | |
An asset or liability for which a market quotation is not readily available is valued by methods deemed reasonable in good faith by the Valuation Committee, following the Valuation Procedures to represent fair value. Under these procedures, the Valuation Designee generally uses a market-based approach which may use related or comparable assets or liabilities, recent transactions, market multiples, book values and other relevant information. The Valuation Designee may also use an income-based valuation approach in which the anticipated future cash flows of the asset or liability are discounted to calculate fair value. Discounts may also be applied due to the nature and/or duration of any restrictions on the disposition of the asset or liability. Fair value represents a good faith approximation of the value of a security. Fair value determinations involve the consideration of a number of subjective factors, an analysis of applicable facts and circumstances and the exercise of judgment. As a result, it is possible that the fair value for a security determined in good faith in accordance with the Valuation Procedures may differ from valuations for the same security determined for other funds using their own valuation procedures. Although the Valuation Procedures are designed to value a security at the price the Fund may reasonably expect to receive upon the security's sale in an orderly transaction, there can be no assurance that any fair value determination thereunder would, in fact, approximate the amount that the Fund would actually realize upon the sale of the security or the price at which the security would trade if a reliable market price were readily available. During the year ended October 31, 2022, there were no material changes to the fair value methodologies.
Securities which may be valued in this manner include, but are not limited to: (i) a security for which trading has been halted or suspended or otherwise does not have a readily available market quotation on a given day; (ii) a debt security that has recently gone into default and for which there is not a current market quotation; (iii) a security of an issuer that has entered into a restructuring; (iv) a security that has been delisted from a national exchange; (v) a security subject to trading collars for which no or limited trading takes place; and (vi) a security whose principal market has been temporarily closed at a time when, under normal conditions, it would be open. Securities valued in this manner are generally categorized as Level 2 or 3 in the hierarchy.
Notes to Financial Statements (continued)
Investments in mutual funds, including money market funds, are valued at their respective NAVs at the close of business each day on the valuation date. These securities are generally categorized as Level 1 in the hierarchy.
Futures contracts are valued at the last posted settlement price on the market where such futures are primarily traded. These securities are generally categorized as Level 1 in the hierarchy.
Municipal debt securities are valued at the evaluated mean prices supplied by a pricing agent or broker selected by the Manager, in consultation with the Subadvisor. The evaluations are market-based measurements processed through a pricing application and represents the pricing agent's good faith determination as to what a holder may receive in an orderly transaction under market conditions. The rules-based logic utilizes valuation techniques that reflect participants' assumptions and vary by asset class and per methodology, maximizing the use of relevant observable data including quoted prices for similar assets, benchmark yield curves and market corroborated inputs. The evaluated bid or mean prices are deemed by the Manager, in consultation with the Subadvisor, to be representative of market values, at the regular close of trading of the Exchange on each valuation date. Municipal debt securities purchased on a delayed delivery basis are marked to market daily until settlement at the forward settlement date. Municipal debt securities are generally categorized as Level 2 in the hierarchy.
In calculating NAV, each closed-end fund is valued at market value, which will generally be determined using the last reported official closing or last trading price on the exchange or market on which the security is primarily traded at the time of valuation. Price information on closed-end funds is taken from the exchange where the security is primarily traded. In addition, because closed-end funds and exchange-traded funds trade on a secondary market, their shares may trade at a premium or discount to the actual net asset value of their portfolio securities and their shares may have greater volatility because of the potential lack of liquidity. These closed-end funds are generally categorized as Level 1 in the hierarchy.
Temporary cash investments acquired in excess of 60 days to maturity at the time of purchase are valued using the latest bid prices or using valuations based on a matrix system (which considers such factors as security prices, yields, maturities and ratings), both as furnished by independent pricing services. Temporary cash investments that mature in 60 days or less at the time of purchase ("Short-Term Investments") are valued using the amortized cost method of valuation, unless the use of such method would be inappropriate. The amortized cost method involves valuing a security at its cost on the date of purchase and thereafter assuming a constant amortization to maturity of the difference between such cost and the value on maturity date. Amortized cost approximates the current fair value of a security. Securities valued using the amortized cost method are not valued using quoted prices in an active market and are generally categorized as Level 2 in the hierarchy.
The information above is not intended to reflect an exhaustive list of the methodologies that may be used to value portfolio investments. The Valuation Procedures permit the use of a variety of valuation
methodologies in connection with valuing portfolio investments. The methodology used for a specific type of investment may vary based on the market data available or other considerations. The methodologies summarized above may not represent the specific means by which portfolio investments are valued on any particular business day.
(B) Income Taxes. The Fund's policy is to comply with the requirements of the Internal Revenue Code of 1986, as amended (the “Internal Revenue Code”), applicable to regulated investment companies and to distribute all of its taxable income to the shareholders of the Fund within the allowable time limits.
The Manager evaluates the Fund’s tax positions to determine if the tax positions taken meet the minimum recognition threshold in connection with accounting for uncertainties in income tax positions taken or expected to be taken for the purposes of measuring and recognizing tax liabilities in the financial statements. Recognition of tax benefits of an uncertain tax position is permitted only to the extent the position is “more likely than not” to be sustained assuming examination by taxing authorities. The Manager analyzed the Fund's tax positions taken on federal, state and local income tax returns for all open tax years (for up to three tax years) and has concluded that no provisions for federal, state and local income tax are required in the Fund's financial statements. The Fund's federal, state and local income tax and federal excise tax returns for tax years for which the applicable statutes of limitations have not expired are subject to examination by the Internal Revenue Service and state and local departments of revenue.
(C) Dividends and Distributions to Shareholders. Dividends and distributions are recorded on the ex-dividend date. The Fund intends to declare dividends from net investment income, if any, daily and intends to pay them at least monthly and declares and pays distributions from net realized capital gains, if any, at least annually. Unless a shareholder elects otherwise, all dividends and distributions are reinvested at NAV in the same class of shares of the Fund. Dividends and distributions to shareholders are determined in accordance with federal income tax regulations and may differ from determinations using GAAP.
(D) Security Transactions and Investment Income. The Fund records security transactions on the trade date. Realized gains and losses on security transactions are determined using the identified cost method. Interest income is accrued as earned using the effective interest rate method. Discounts and premiums on securities purchased for the Fund are accreted and amortized, respectively, on the effective interest rate method over the life of the respective securities.
Investment income and realized and unrealized gains and losses on investments of the Fund are allocated pro rata to the separate classes of shares based upon their relative net assets on the date the income is earned or realized and unrealized gains and losses are incurred.
The Fund may place a debt security on non-accrual status and reduce related interest income by ceasing current accruals and writing off all or a portion of any interest receivables when the collection of all or a portion of such interest has become doubtful. A debt security is removed from
| 38 | MainStay MacKay New York Tax Free Opportunities Fund |
non-accrual status when the issuer resumes interest payments or when collectability of interest is reasonably assured.
(E) Expenses. Expenses of the Trust are allocated to the individual Funds in proportion to the net assets of the respective Funds when the expenses are incurred, except where direct allocations of expenses can be made. Expenses (other than transfer agent expenses and fees incurred under the shareholder services plans and/or the distribution plans further discussed in Note 3(B)) are allocated to separate classes of shares pro rata based upon their relative net assets on the date the expenses are incurred. The expenses borne by the Fund, including those of related parties to the Fund, are shown in the Statement of Operations.
Additionally, the Fund may invest in mutual funds, which are subject to management fees and other fees that may cause the costs of investing in mutual funds to be greater than the costs of owning the underlying securities directly. These indirect expenses of mutual funds are not included in the amounts shown as expenses in the Statement of Operations or in the expense ratios included in the Financial Highlights.
(F) Use of Estimates. In preparing financial statements in conformity with GAAP, the Manager makes estimates and assumptions that affect the reported amounts and disclosures in the financial statements. Actual results could differ from those estimates and assumptions.
(G) Futures Contracts. A futures contract is an agreement to purchase or sell a specified quantity of an underlying instrument at a specified future date and price, or to make or receive a cash payment based on the value of a financial instrument (e.g., foreign currency, interest rate, security or securities index). The Fund is subject to risks such as market price risk, leverage risk, liquidity risk, counterparty risk, operational risk, legal risk and/or interest rate risk in the normal course of investing in these contracts. Upon entering into a futures contract, the Fund is required to pledge to the broker or futures commission merchant an amount of cash and/or U.S. government securities equal to a certain percentage of the collateral amount, known as the “initial margin.” During the period the futures contract is open, changes in the value of the contract are recognized as unrealized appreciation or depreciation by marking to market such contract on a daily basis to reflect the market value of the contract at the end of each day’s trading. The Fund agrees to receive from or pay to the broker or futures commission merchant an amount of cash equal to the daily fluctuation in the value of the contract. Such receipts or payments are known as “variation margin.” When the futures contract is closed, the Fund records a realized gain or loss equal to the difference between the proceeds from (or cost of) the closing transaction and the Fund's basis in the contract.
The use of futures contracts involves, to varying degrees, elements of market risk in excess of the amount recognized in the Statement of Assets and Liabilities. The contract or notional amounts and variation margin reflect the extent of the Fund's involvement in open futures positions. There are several risks associated with the use of futures contracts as hedging techniques. There can be no assurance that a liquid market will exist at the time when the Fund seeks to close out a futures
contract. If no liquid market exists, the Fund would remain obligated to meet margin requirements until the position is closed. Futures contracts may involve a small initial investment relative to the risk assumed, which could result in losses greater than if the Fund did not invest in futures contracts. Futures contracts may be more volatile than direct investments in the instrument underlying the futures and may not correlate to the underlying instrument, causing a given hedge not to achieve its objectives. The Fund's activities in futures contracts have minimal counterparty risk as they are conducted through regulated exchanges that guarantee the futures against default by the counterparty. In the event of a bankruptcy or insolvency of a futures commission merchant that holds margin on behalf of the Fund, the Fund may not be entitled to the return of the entire margin owed to the Fund, potentially resulting in a loss. The Fund may invest in futures contracts to seek enhanced returns or to reduce the risk of loss by hedging certain of its holdings. The Fund's investment in futures contracts and other derivatives may increase the volatility of the Fund's NAVs and may result in a loss to the Fund. Open futures contracts as of October 31, 2022, are shown in the Portfolio of Investments.
(H) Municipal Bond Risk. The Fund may invest more heavily in municipal bonds from certain cities, states, territories or regions than others, which may increase the Fund’s exposure to losses resulting from economic, political, regulatory occurrences, or declines in tax revenue impacting these particular cities, states, territories or regions. In addition, many state and municipal governments that issue securities are under significant economic and financial stress and may not be able to satisfy their obligations, and these events may be made worse due to economic challenges posed by COVID-19. The Fund may invest a substantial amount of its assets in municipal bonds whose interest is paid solely from revenues of similar projects, such as tobacco settlement bonds. If the Fund concentrates its investments in this manner, it assumes the legal and economic risks relating to such projects and this may have a significant impact on the Fund’s investment performance.
Certain of the issuers in which the Fund may invest have recently experienced, or may experience, significant financial difficulties and repeated credit rating downgrades. On May 3, 2017, the Commonwealth of Puerto Rico (the "Commonwealth") began proceedings pursuant to the Puerto Rico Oversight, Management, and Economic Stability Act (“PROMESA”) to seek bankruptcy-type protections from approximately $74 billion in debt and approximately $48 billion in unfunded pension obligations. In addition, the economic downturn following the outbreak of COVID-19 and the resulting pressure on Puerto Rico’s budget have further contributed to its financial challenges. The federal government has passed certain relief packages, including the Coronavirus Aid, Relief, and Economic Security Act and the American Rescue Plan, which include an aggregate of more than $7 billion in disaster relief funds for the U.S. territories, including Puerto Rico. However, there can be no assurances that the federal funds allocated to the Commonwealth will be sufficient to address the economic challenges arising from COVID-19.
Notes to Financial Statements (continued)
The Commonwealth concluded its Title III restructuring proceedings on behalf of itself and certain instrumentalities effective March 15th, 2022. Approximately $18.75 billion of claims related to debt guaranteed under Puerto Rico's constitution including the Commonwealth of Puerto Rico and Public Building Authority were restructured with issuance of $7.4 billion in new Puerto Rico General Obligation Bonds, $7.1 billion of cash, and $3.5 billion of new Contingent Value instruments. In addition the Commonwealth's exit from the restructuring proceedings resolved certain claims relating to the Commonwealth Employee Retirement System, Convention Center, Highway Authority, and Infrastructure Financing Authority. Several of Commonwealth's agencies are still under Title III restructuring proceedings including the Highway Authority and Electric Authority.
Puerto Rico’s debt restructuring process and other economic, political, social, environmental or health factors or developments could occur rapidly and may significantly affect the value of municipal securities of Puerto Rico. Due to the ongoing budget impact from COVID-19 on the Commonwealth’s finances, the Federal Oversight and Management Board for Puerto Rico or the Commonwealth itself could seek to revise or even terminate earlier agreements reached with certain creditors prior to the outbreak of COVID-19. Any agreement between the Federal Oversight and Management Board and creditors is subject to approval by the judge overseeing the Title III proceedings. The composition of the Federal Oversight and Management Board has changed during the recent period due to existing members either stepping down or being replaced following the expiration of a member's term. There is no assurance that board members will approve the restructuring agreements the prior board had negotiated.
The Fund’s vulnerability to potential losses associated with such developments may be reduced through investing in municipal securities that feature credit enhancements (such as bond insurance). The bond insurance provider pays both principal and interest when due to the bond holder. The magnitude of Puerto Rico’s debt restructuring or other adverse economic developments could pose significant strains on the ability of municipal securities insurers to meet all future claims. As of October 31, 2022, 22.7% of the Puerto Rico municipal securities held by the Fund were insured.
(I) Indemnifications. Under the Trust’s organizational documents, its officers and trustees are indemnified against certain liabilities that may arise out of performance of their duties to the Trust. Additionally, in the normal course of business, the Fund enters into contracts with third-party service providers that contain a variety of representations and warranties and that may provide general indemnifications. The Fund's maximum exposure under these arrangements is unknown, as this would involve future claims that may be made against the Fund that have not yet occurred. The Manager believes that the risk of loss in connection with these potential indemnification obligations is remote. However, there can be no assurance that material liabilities related to such obligations will not arise in the future, which could adversely impact the Fund.
(J) Quantitative Disclosure of Derivative Holdings. The following tables show additional disclosures related to the Fund's derivative and hedging activities, including how such activities are accounted for and their effect on the Fund's financial positions, performance and cash flows.
The Fund entered into futures contracts to help manage the duration and yield curve positioning of the portfolio. These derivatives are not accounted for as hedging instruments.
Fair value of derivative instruments as of October 31, 2022:
| Asset Derivatives | Interest
Rate
Contracts
Risk | Total |
| Futures Contracts - Net Assets—Net unrealized appreciation on futures contracts (a) | $11,466,015 | $11,466,015 |
| Total Fair Value | $11,466,015 | $11,466,015 |
| (a) | Includes cumulative appreciation (depreciation) of futures contracts as reported in the Portfolio of Investments. Only current day’s variation margin is reported within the Statement of Assets and Liabilities. |
The effect of derivative instruments on the Statement of Operations for the year ended October 31, 2022:
| Net Realized Gain (Loss) from: | Interest
Rate
Contracts
Risk | Total |
| Futures Contracts | $10,046,436 | $10,046,436 |
| Total Net Realized Gain (Loss) | $10,046,436 | $10,046,436 |
| Net Change in Unrealized Appreciation (Depreciation) | Interest
Rate
Contracts
Risk | Total |
| Futures Contracts | $11,445,814 | $11,445,814 |
| Total Net Change in Unrealized Appreciation (Depreciation) | $11,445,814 | $11,445,814 |
| Average Notional Amount | Total |
| Futures Contracts Short | $(89,858,287) |
Note 3–Fees and Related Party Transactions
(A) Manager and Subadvisor. New York Life Investments, a registered investment adviser and an indirect, wholly-owned subsidiary of New York Life Insurance Company ("New York Life"), serves as the Fund's Manager, pursuant to an Amended and Restated Management Agreement ("Management Agreement"). The Manager provides offices, conducts clerical, recordkeeping and bookkeeping services and keeps most of the financial and accounting records required to be maintained by the Fund. Except for the portion of salaries and expenses that are the responsibility of the Fund, the Manager pays the salaries and expenses of all personnel
| 40 | MainStay MacKay New York Tax Free Opportunities Fund |
affiliated with the Fund and certain operational expenses of the Fund. During a portion of the year ended October 31, 2022, the Fund reimbursed New York Life Investments in an amount equal to the portion of the compensation of the Chief Compliance Officer attributable to the Fund. MacKay Shields LLC ("MacKay Shields" or the "Subadvisor"), a registered investment adviser and an indirect, wholly-owned subsidiary of New York Life, serves as the Subadvisor to the Fund and is responsible for the day-to-day portfolio management of the Fund. Pursuant to the terms of an Amended and Restated Subadvisory Agreement ("Subadvisory Agreement") between New York Life Investments and MacKay Shields, New York Life Investments pays for the services of the Subadvisor.
Pursuant to the Management Agreement, the Fund pays the Manager a monthly fee for the services performed and the facilities furnished at an annual rate of the Fund’s average daily net assets as follows: 0.45% on assets up to $1 billion; 0.43% on assets from $1 billion to $3 billion; and 0.42% on assets over $3 billion. During the year ended October 31, 2022, the effective management fee rate was 0.45% of the Fund’s average daily net assets, exclusive of any applicable waivers/reimbursements.
New York Life Investments has contractually agreed to waive fees and/or reimburse expenses so that Total Annual Fund Operating Expenses (excluding taxes, interest, litigation, extraordinary expenses, brokerage and other transaction expenses relating to the purchase or sale of portfolio investments and acquired (underlying) fund fees and expenses) of Class A shares do not exceed 0.75% of its average daily net assets. New York Life Investments will apply an equivalent waiver or reimbursement, in an equal number of basis points to Investor Class, Class C, Class C2 and Class I shares. New York Life Investments has contractually agreed to waive fees and/or reimburse expenses so that Total Annual Fund Operating Expenses (excluding taxes, interest, litigation, extraordinary expenses, brokerage and other transaction expenses relating to the purchase or sale of portfolio investments, and acquired (underlying) fund fees and expenses) of Class R6 do not exceed those of Class I. These agreements will remain in effect until February 28, 2023, and shall renew automatically for one-year terms unless New York Life Investments provides written notice of termination prior to the start of the next term or upon approval of the Board.
During the year ended October 31, 2022, New York Life Investments earned fees from the Fund in the amount of $5,554,077 and waived fees and/or reimbursed expenses in the amount of $174,570 and paid the Subadvisor fees of $2,689,738.
JPMorgan Chase Bank, N.A. ("JPMorgan") provides sub-administration and sub-accounting services to the Fund pursuant to an agreement with New York Life Investments. These services include calculating the daily NAVs of the Fund, maintaining the general ledger and sub-ledger accounts for the calculation of the Fund's NAVs, and assisting New York Life Investments in conducting various aspects of the Fund's administrative operations. For providing these services to the Fund, JPMorgan is compensated by New York Life Investments.
Pursuant to an agreement between the Trust and New York Life Investments, New York Life Investments is responsible for providing or procuring certain regulatory reporting services for the Fund. The Fund will reimburse New York Life Investments for the actual costs incurred by New York Life Investments in connection with providing or procuring these services for the Fund.
(B) Distribution and Service Fees. The Trust, on behalf of the Fund, has entered into a distribution agreement with NYLIFE Distributors LLC (the “Distributor”), an affiliate of New York Life Investments. The Fund has adopted distribution plans (the “Plans”) in accordance with the provisions of Rule 12b-1 under the 1940 Act.
Pursuant to the Class A and Investor Class Plans, the Distributor receives a monthly fee from the Class A and Investor Class shares at an annual rate of 0.25% of the average daily net assets of the Class A and Investor Class shares for distribution and/or service activities as designated by the Distributor. Pursuant to the Class C Plan, Class C shares pay the Distributor a monthly distribution fee at an annual rate of 0.25% of the average daily net assets of the Class C shares along with a service fee at an annual rate of 0.25% of the average daily net assets of the Class C shares, for a total 12b-1 fee of 0.50%. Pursuant to the Class C2 Plan, Class C2 shares pay the Distributor a monthly distribution fee at an annual rate of 0.40% of the average daily net assets of the Class C2 shares, along with a service fee at an annual rate of 0.25% of the average daily net assets of the Class C shares, for a total 12b-1 fee of 0.65%. Class I and Class R6 shares are not subject to a distribution and/or service fee.
The Plans provide that the distribution and service fees are payable to the Distributor regardless of the amounts actually expended by the Distributor for distribution of the Fund's shares and service activities.
(C) Sales Charges. The Fund was advised by the Distributor that the amount of initial sales charges retained on sales of Class A and Investor Class shares during the year ended October 31, 2022, were $6,019 and $125, respectively.
The Fund was also advised that the Distributor retained CDSCs on redemptions of Class A and Class C shares during the year ended October 31, 2022, of $190,393 and $7,964, respectively.
(D) Transfer, Dividend Disbursing and Shareholder Servicing Agent. NYLIM Service Company LLC, an affiliate of New York Life Investments, is the Fund's transfer, dividend disbursing and shareholder servicing agent pursuant to an agreement between NYLIM Service Company LLC and the Trust. NYLIM Service Company LLC has entered into an agreement with DST Asset Manager Solutions, Inc. ("DST"), pursuant to which DST performs certain transfer agent services on behalf of NYLIM Service Company LLC. New York Life Investments has contractually agreed to limit the transfer agency expenses charged to the Fund’s share classes to a maximum of 0.35% of that share class’s average daily net assets on an annual basis after deducting any applicable Fund or class-level expense reimbursement or small account fees. This agreement will remain in effect until February 28, 2023, and
Notes to Financial Statements (continued)
shall renew automatically for one-year terms unless New York Life Investments provides written notice of termination prior to the start of the next term or upon approval of the Board. During the year ended October 31, 2022, transfer agent expenses incurred by the Fund and any reimbursements, pursuant to the aforementioned Transfer Agency expense limitation agreement, were as follows:
| Class | Expense | Waived |
| Class A | $291,168 | $— |
| Investor Class | 166 | — |
| Class C | 44,884 | — |
| Class C2 | 912 | — |
| Class I | 117,792 | — |
| Class R6 | 31 | — |
(E) Small Account Fee. Shareholders with small accounts adversely impact the cost of providing transfer agency services. In an effort to reduce total transfer agency expenses, the Fund has implemented a small account fee on certain types of accounts. As described in the Fund's prospectus, certain shareholders with an account balance of less than $1,000 ($5,000 for Class A share accounts) are charged an annual per account fee of $20 (assessed semi-annually), the proceeds from which offset transfer agent fees as reflected in the Statement of Operations. This small account fee will not apply to certain types of accounts as described further in the Fund’s prospectus.
(F) Capital. As of October 31, 2022, New York Life and its affiliates beneficially held shares of the Fund with the values and percentages of net assets as follows:
| Class C2 | $21,651 | 1.3% |
| Class R6 | 22,626 | 3.1 |
Note 4-Federal Income Tax
As of October 31, 2022, the cost and unrealized appreciation (depreciation) of the Fund’s investment portfolio, including applicable derivative contracts and other financial instruments, as determined on a federal income tax basis, were as follows:
| | Federal Tax
Cost | Gross
Unrealized
Appreciation | Gross
Unrealized
(Depreciation) | Net
Unrealized
Appreciation/
(Depreciation) |
| Investments in Securities | $1,221,527,182 | $1,167,678 | $(166,571,659) | $(165,403,981) |
As of October 31, 2022, the components of accumulated gain (loss) on a tax basis were as follows:
Ordinary
income | Undistributed
Tax Exempt
Income | Accumulated
Capital
and Other
Gain (Loss) | Other
Temporary
Differences | Unrealized
Appreciation
(Depreciation) | Total
Accumulated
Gain (Loss) |
| $— | $534,024 | $(49,549,810) | $(552,333) | $(165,403,981) | $(214,972,100) |
The difference between book-basis and tax-basis unrealized appreciation (depreciation) is primarily due to mark to market of futures, wash sale, and cumulative bond amortization adjustments. The other temporary differences are primarily due to dividends payable.
As of October 31, 2022, for federal income tax purposes, capital loss carryforwards of $49,549,810, as shown in the table below, were available to the extent provided by the regulations to offset future realized gains of the Fund. Accordingly, no capital gains distributions are expected to be paid to shareholders until net gains have been realized in excess of such amounts.
Capital Loss
Available Through | Short-Term
Capital Loss
Amounts (000’s) | Long-Term
Capital Loss
Amounts (000’s) |
| Unlimited | $26,930 | $22,620 |
During the years ended October 31, 2022 and October 31, 2021, the tax character of distributions paid as reflected in the Statements of Changes in Net Assets was as follows:
| | 2022 | 2021 |
| Distributions paid from: | | |
| Ordinary Income | $ 811,027 | $ 828,027 |
| Exempt Interest Dividends | 34,888,465 | 28,622,180 |
| Total | $35,699,492 | $29,450,207 |
Note 5–Custodian
JPMorgan is the custodian of cash and securities held by the Fund. Custodial fees are charged to the Fund based on the Fund's net assets and/or the market value of securities held by the Fund and the number of certain transactions incurred by the Fund.
Note 6–Line of Credit
The Fund and certain other funds managed by New York Life Investments maintain a line of credit with a syndicate of banks in order to secure a source of funds for temporary purposes to meet unanticipated or excessive redemption requests.
Effective July 26, 2022, under the credit agreement (the “Credit Agreement”), the aggregate commitment amount is $600,000,000 with an additional uncommitted amount of $100,000,000. The commitment fee is an annual rate of 0.15% of the average commitment amount payable quarterly, regardless of usage, to JPMorgan, who serves as the agent to the syndicate. The commitment fee is allocated among the Fund and certain other funds managed by New York Life Investments based
| 42 | MainStay MacKay New York Tax Free Opportunities Fund |
upon their respective net assets and other factors. Interest on any revolving credit loan is charged based upon the Federal Funds Rate, Daily Simple Secured Overnight Financing Rate ("SOFR") + 0.10%, or the Overnight Bank Funding Rate, whichever is higher. The Credit Agreement expires on July 25, 2023, although the Fund, certain other funds managed by New York Life Investments and the syndicate of banks may renew the Credit Agreement for an additional year on the same or different terms or enter into a credit agreement with a different syndicate of banks. Prior to July 26, 2022, the aggregate commitment amount and the commitment fee were the same as those under the current Credit Agreement. During the year ended October 31, 2022, there were no borrowings made or outstanding with respect to the Fund under the Credit Agreement.
Note 7–Interfund Lending Program
Pursuant to an exemptive order issued by the SEC, the Fund, along with certain other funds managed by New York Life Investments, may participate in an interfund lending program. The interfund lending program provides an alternative credit facility that permits the Fund and certain other funds managed by New York Life Investments to lend or borrow money for temporary purposes directly to or from one another, subject to the conditions of the exemptive order. During the year ended October 31, 2022, there were no interfund loans made or outstanding with respect to the Fund.
Note 8–Purchases and Sales of Securities (in 000’s)
During the year ended October 31, 2022, purchases and sales of securities, other than short-term securities, were $621,317 and $651,238, respectively.
Note 9–Capital Share Transactions
Transactions in capital shares for the years ended October 31, 2022 and October 31, 2021, were as follows:
| Class A | Shares | Amount |
| Year ended October 31, 2022: | | |
| Shares sold | 87,298,953 | $ 844,637,242 |
| Shares issued to shareholders in reinvestment of distributions | 2,025,106 | 20,047,685 |
| Shares redeemed | (94,566,928) | (915,687,479) |
| Net increase (decrease) in shares outstanding before conversion | (5,242,869) | (51,002,552) |
| Shares converted into Class A (See Note 1) | 11,505 | 111,557 |
| Shares converted from Class A (See Note 1) | (7,371) | (74,414) |
| Net increase (decrease) | (5,238,735) | $ (50,965,409) |
| Year ended October 31, 2021: | | |
| Shares sold | 30,707,409 | $ 336,841,389 |
| Shares issued to shareholders in reinvestment of distributions | 1,485,376 | 16,302,415 |
| Shares redeemed | (14,026,396) | (153,419,189) |
| Net increase (decrease) in shares outstanding before conversion | 18,166,389 | 199,724,615 |
| Shares converted into Class A (See Note 1) | 33,907 | 372,896 |
| Shares converted from Class A (See Note 1) | (41,200) | (449,580) |
| Net increase (decrease) | 18,159,096 | $ 199,647,931 |
| |
| Investor Class | Shares | Amount |
| Year ended October 31, 2022: | | |
| Shares sold | 30,048 | $ 300,879 |
| Shares issued to shareholders in reinvestment of distributions | 931 | 9,203 |
| Shares redeemed | (29,134) | (289,595) |
| Net increase (decrease) in shares outstanding before conversion | 1,845 | 20,487 |
| Shares converted into Investor Class (See Note 1) | 353 | 3,710 |
| Shares converted from Investor Class (See Note 1) | (2,575) | (26,300) |
| Net increase (decrease) | (377) | $ (2,103) |
| Year ended October 31, 2021: | | |
| Shares sold | 8,730 | $ 96,126 |
| Shares issued to shareholders in reinvestment of distributions | 834 | 9,151 |
| Shares redeemed | (9,876) | (109,165) |
| Net increase (decrease) in shares outstanding before conversion | (312) | (3,888) |
| Shares converted into Investor Class (See Note 1) | 369 | 4,087 |
| Shares converted from Investor Class (See Note 1) | (4,762) | (52,231) |
| Net increase (decrease) | (4,705) | $ (52,032) |
| |
Notes to Financial Statements (continued)
| Class C | Shares | Amount |
| Year ended October 31, 2022: | | |
| Shares sold | 915,604 | $ 9,185,855 |
| Shares issued to shareholders in reinvestment of distributions | 179,004 | 1,774,437 |
| Shares redeemed | (3,077,812) | (30,367,036) |
| Net increase (decrease) in shares outstanding before conversion | (1,983,204) | (19,406,744) |
| Shares converted from Class C (See Note 1) | (8,930) | (85,257) |
| Net increase (decrease) | (1,992,134) | $ (19,492,001) |
| Year ended October 31, 2021: | | |
| Shares sold | 1,889,563 | $ 20,739,205 |
| Shares issued to shareholders in reinvestment of distributions | 146,546 | 1,607,772 |
| Shares redeemed | (1,858,247) | (20,372,010) |
| Net increase (decrease) in shares outstanding before conversion | 177,862 | 1,974,967 |
| Shares converted from Class C (See Note 1) | (46,574) | (511,252) |
| Net increase (decrease) | 131,288 | $ 1,463,715 |
| |
| Class C2 | Shares | Amount |
| Year ended October 31, 2022: | | |
| Shares sold | 50,559 | $ 530,063 |
| Shares issued to shareholders in reinvestment of distributions | 4,690 | 46,357 |
| Shares redeemed | (41,066) | (396,237) |
| Net increase (decrease) | 14,183 | $ 180,183 |
| Year ended October 31, 2021: | | |
| Shares sold | 159,307 | $ 1,741,853 |
| Shares issued to shareholders in reinvestment of distributions | 2,230 | 24,498 |
| Shares redeemed | (21,068) | (234,045) |
| Net increase (decrease) | 140,469 | $ 1,532,306 |
| |
| Class I | Shares | Amount |
| Year ended October 31, 2022: | | |
| Shares sold | 21,497,011 | $ 210,615,126 |
| Shares issued to shareholders in reinvestment of distributions | 736,274 | 7,281,884 |
| Shares redeemed | (21,464,030) | (208,798,438) |
| Net increase (decrease) in shares outstanding before conversion | 769,255 | 9,098,572 |
| Shares converted into Class I (See Note 1) | 7,019 | 70,704 |
| Net increase (decrease) | 776,274 | $ 9,169,276 |
| Year ended October 31, 2021: | | |
| Shares sold | 12,579,814 | $ 138,042,597 |
| Shares issued to shareholders in reinvestment of distributions | 514,497 | 5,647,065 |
| Shares redeemed | (5,432,002) | (59,576,804) |
| Net increase (decrease) in shares outstanding before conversion | 7,662,309 | 84,112,858 |
| Shares converted into Class I (See Note 1) | 58,252 | 636,080 |
| Net increase (decrease) | 7,720,561 | $ 84,748,938 |
| |
| Class R6 | Shares | Amount |
| Year ended October 31, 2022: | | |
| Shares sold | 5,363 | $ 52,501 |
| Shares issued to shareholders in reinvestment of distributions | 2,433 | 24,025 |
| Shares redeemed | (18) | (200) |
| Net increase (decrease) | 7,778 | $ 76,326 |
| Year ended October 31, 2021: | | |
| Shares issued to shareholders in reinvestment of distributions | 2,546 | $ 27,918 |
| Shares redeemed | (60,941) | (671,341) |
| Net increase (decrease) | (58,395) | $ (643,423) |
Note 10–Other Matters
As of the date of this report, interest rates in the United States and many parts of the world, including certain European countries, are ascending from historically low levels. Thus, the Fund currently faces a heightened level of risk associated with rising interest rates. This could be driven by a variety of factors, including but not limited to central bank monetary policies, changing inflation or real growth rates, general economic conditions, increasing bond issuances or reduced market demand for low yielding investments.
An outbreak of COVID-19, first detected in December 2019, has developed into a global pandemic and has resulted in travel restrictions, closure of international borders, certain businesses and securities markets, restrictions on securities trading activities, prolonged quarantines, supply chain disruptions, and lower consumer demand, as well as general concern and uncertainty. In 2022, many countries lifted some or all restrictions related to COVID-19. However, the continued impact of COVID-19 and related variants is uncertain and could further adversely affect the global economy, national economies, individual issuers and capital markets in unforeseeable ways and result in a
| 44 | MainStay MacKay New York Tax Free Opportunities Fund |
substantial and extended economic downturn. Developments that disrupt global economies and financial markets, such as COVID-19, may magnify factors that affect the Fund's performance.
Note 11–Subsequent Events
In connection with the preparation of the financial statements of the Fund as of and for the year ended October 31, 2022, events and transactions subsequent to October 31, 2022, through the date the financial statements were issued have been evaluated by the Manager for possible adjustment and/or disclosure. No subsequent events requiring financial statement adjustment or disclosure have been identified.
Report of Independent Registered Public Accounting Firm
To the Shareholders of the Fund and Board of Trustees
MainStay Funds Trust:
Opinion on the Financial Statements
We have audited the accompanying statement of assets and liabilities of MainStay MacKay New York Tax Free Opportunities Fund (the Fund), one of the funds constituting MainStay Funds Trust, including the portfolio of investments, as of October 31, 2022, the related statement of operations for the year then ended, the statements of changes in net assets for each of the years in the two-year period then ended, and the related notes (collectively, the financial statements) and the financial highlights for each of the years or periods in the five-year period then ended. In our opinion, the financial statements and financial highlights present fairly, in all material respects, the financial position of the Fund as of October 31, 2022, the results of its operations for the year then ended, the changes in its net assets for each of the years in the two-year period then ended, and the financial highlights for each of the years or periods in the five-year period then ended, in conformity with U.S. generally accepted accounting principles.
Basis for Opinion
These financial statements and financial highlights are the responsibility of the Fund's management. Our responsibility is to express an opinion on these financial statements and financial highlights based on our audits. We are a public accounting firm registered with the Public Company Accounting Oversight Board (United States) (PCAOB) and are required to be independent with respect to the Fund in accordance with the U.S. federal securities laws and the applicable rules and regulations of the Securities and Exchange Commission and the PCAOB.
We conducted our audits in accordance with the standards of the PCAOB. Those standards require that we plan and perform the audit to obtain reasonable assurance about whether the financial statements and financial highlights are free of material misstatement, whether due to error or fraud. Our audits included performing procedures to assess the risks of material misstatement of the financial statements and financial highlights, whether due to error or fraud, and performing procedures that respond to those risks. Such procedures included examining, on a test basis, evidence regarding the amounts and disclosures in the financial statements and financial highlights. Such procedures also included confirmation of securities owned as of October 31, 2022, by correspondence with custodians and brokers; when replies were not received from brokers, we performed other auditing procedures. Our audits also included evaluating the accounting principles used and significant estimates made by management, as well as evaluating the overall presentation of the financial statements and financial highlights. We believe that our audits provide a reasonable basis for our opinion.

We have served as the auditor of one or more New York Life Investment Management investment companies since 2003.
Philadelphia, Pennsylvania
December 23, 2022
| 46 | MainStay MacKay New York Tax Free Opportunities Fund |
Federal Income Tax Information
(Unaudited)
The Fund is required under the Internal Revenue Code to advise shareholders in a written statement as to the federal tax status of dividends paid by the Fund during such fiscal years.
For Federal individual income tax purposes, the Fund designated 97.7% of the ordinary income dividends paid during its fiscal year ended October 31, 2022 as attributable to interest income from Tax Exempt Municipal Bonds. Such dividends are currently exempt from Federal income taxes under Section 103(a) of the Internal Revenue Code.
For the fiscal year ended October 31, 2022, the Fund designated approximately $130,037 under the Internal Revenue Code as qualified dividend income eligible for reduced tax rates.
The dividends paid by the Fund during the fiscal year ended October 31, 2022 should be multiplied by 16.03% to arrive at the amount eligible for the corporate dividend-received deduction.
In February 2023, shareholders will receive an IRS Form 1099-DIV or substitute Form 1099, which will show the federal tax status of the distributions received by shareholders in calendar year 2022. The amounts that will be reported on such 1099-DIV or substitute Form 1099 will be the amounts you are to use on your federal income tax return and will differ from the amounts which we must report for the Fund's fiscal year ended October 31, 2022.
Proxy Voting Policies and Procedures and Proxy Voting Record
The Fund is required to file with the SEC its proxy voting record for the 12-month period ending June 30 on Form N-PX. A description of the policies and procedures that are used to vote proxies relating to portfolio securities of the Fund is available free of charge upon request by calling 800-624-6782 or visiting the SEC’s website at www.sec.gov. The most recent Form N-PX or proxy voting record is available free of charge upon request by calling 800-624-6782; visiting newyorklifeinvestments.com; or visiting the SEC’s website at www.sec.gov.
Shareholder Reports and Quarterly Portfolio Disclosure
The Fund is required to file its complete schedule of portfolio holdings with the SEC 60 days after its first and third fiscal quarter on Form N-PORT. The Fund's holdings report is available free of charge upon request by calling New York Life Investments at 800-624-6782.
Board of Trustees and Officers (Unaudited)
The Trustees and officers of the Fund are listed below. The Board oversees the MainStay Group of Funds (which consists of MainStay Funds and MainStay Funds Trust), MainStay VP Funds Trust, MainStay MacKay DefinedTerm Municipal Opportunities Fund, MainStay CBRE Global Infrastructure Megatrends Fund, the Manager and the Subadvisors, and elects the officers of the Funds who are responsible for the day-to-day operations of the Fund. Information pertaining to the Trustees and officers is set forth below. Each Trustee serves until his or her successor is
elected and qualified or until his or her resignation, death or removal. Under the Board’s retirement policy, unless an exception is made, a Trustee must tender his or her resignation by the end of the calendar year during which he or she reaches the age of 75. The business address of each Trustee and officer listed below is 51 Madison Avenue, New York, New York 10010. None of the Trustees are “interested persons” (as defined by the 1940 Act and rules adopted by the SEC thereunder) of the Fund (“Independent Trustees”).
| | Name and
Year of Birth | Term of Office,
Position(s) Held and
Length of Service | Principal Occupation(s)
During Past Five Years | Number of
Portfolios in
Fund Complex
Overseen by
Trustee | Other Directorships
Held by Trustee |
| | | | | | |
| | David H. Chow
1957 | MainStay Funds: Trustee since 2016, Advisory Board Member (June 2015 to December 2015);MainStay Funds Trust:
Trustee since January 2016, Advisory Board Member (June 2015 to December 2015) | Founder and CEO, DanCourt Management, LLC since 1999 | 78 | MainStay VP Funds Trust: Trustee since January 2016, Advisory Board Member (June 2015 to December 2015) (31 portfolios);
MainStay MacKay DefinedTerm Municipal Opportunities Fund: Trustee since January 2016, Advisory Board Member (June 2015 to December 2015);
MainStay CBRE Global Infrastructure Megatrends Fund: Trustee since June 2021; VanEck Vectors Group of Exchange-Traded Funds: Independent Chairman of the Board of Trustees since 2008 and Trustee since 2006 (56 portfolios); and Berea College of Kentucky: Trustee since 2009, Chair of the Investment Committee since 2018 |
| | Susan B. Kerley
1951 | MainStay Funds: Chairman since 2017 and Trustee since 2007;MainStay Funds Trust:
Chairman since 2017 and Trustee since 1990** | President, Strategic Management Advisors LLC since 1990 | 78 | MainStay VP Funds Trust: Chairman since January 2017 and Trustee since 2007 (31 portfolios)**;
MainStay MacKay DefinedTerm Municipal Opportunities Fund: Chairman since 2017 and Trustee since 2011;
MainStay CBRE Global Infrastructure Megatrends Fund: Trustee since June 2021; and Legg Mason Partners Funds: Trustee since 1991 (45 portfolios) |
| | Alan R. Latshaw
1951 | MainStay Funds: Trustee since 2006;MainStay Funds Trust:
Trustee since 2007*** | Retired; Partner, Ernst & Young LLP (2002 to 2003); Partner, Arthur Andersen LLP (1989 to 2002); Consultant to the MainStay Funds Audit and Compliance Committee (2004 to 2006) | 78 | MainStay VP Funds Trust: Trustee since 2007 (31 portfolios)**;
MainStay MacKay DefinedTerm Municipal Opportunities Fund: Trustee since 2011; and
MainStay CBRE Global Infrastructure Megatrends Fund: Trustee since June 2021 |
| 48 | MainStay MacKay New York Tax Free Opportunities Fund |
| | Name and
Year of Birth | Term of Office,
Position(s) Held and
Length of Service | Principal Occupation(s)
During Past Five Years | Number of
Portfolios in
Fund Complex
Overseen by
Trustee | Other Directorships
Held by Trustee |
| | | | | | |
| | Karen Hammond
1956 | MainStay Funds: Trustee since December 2021, Advisory Board Member (June 2021 to December 2021);MainStay Funds Trust:
Trustee since December 2021, Advisory Board Member (June 2021 to December 2021)
| Retired, Managing Director, Devonshire Investors (2007 to 2013); Senior Vice President, Fidelity Management & Research Co. (2005 to 2007); Senior Vice President and Corporate Treasurer, FMR Corp. (2003 to 2005); Chief Operating Officer, Fidelity Investments Japan (2001 to 2003) | 78 | MainStay VP Funds Trust: Trustee since December 2021, Advisory Board Member (June 2021 to December 2021) (31 Portfolios);
MainStay MacKay DefinedTerm Municipal Opportunities Fund: Trustee since December 2021, Advisory Board Member (June 2021 to December 2021);
MainStay CBRE Global Infrastructure Megatrends Fund: Trustee since December 2021, Advisory Board Member (June 2021 to December 2021);
Two Harbors Investment Corp.: Director since 2018;
Rhode Island State Investment Commission: Member since 2017; and
Blue Cross Blue Shield of Rhode Island: Director since 2019 |
| | Jacques P. Perold
1958 | MainStay Funds: Trustee since 2016, Advisory Board Member (June 2015 toDecember 2015);MainStay Funds Trust:
Trustee since January 2016, Advisory Board Member (June 2015 to December 2015) | Founder and Chief Executive Officer, CapShift Advisors LLC (since 2018); President, Fidelity Management & Research Company (2009 to 2014); President and Chief Investment Officer, Geode Capital Management, LLC (2001 to 2009) | 78 | MainStay VP Funds Trust: Trustee since January 2016, Advisory Board Member (June 2015 to December 2015) (31 portfolios);
MainStay MacKay DefinedTerm Municipal Opportunities Fund: Trustee since January 2016, Advisory Board Member (June 2015 to December 2015);
MainStay CBRE Global Infrastructure Megatrends Fund: Trustee since June 2021; Partners in Health: Trustee since 2019; Allstate Corporation: Director since 2015; and MSCI Inc.: Director since 2017 |
| | Richard S. Trutanic
1952 | MainStay Funds: Trustee since 1994;MainStay Funds Trust:
Trustee since 2007*** | Chairman and Chief Executive Officer, Somerset & Company (financial advisory firm) since 2004; Managing Director, The Carlyle Group (private investment firm) (2002 to 2004); Senior Managing Director, Partner and Board Member, Groupe Arnault S.A. (private investment firm) (1999 to 2002) | 78 | MainStay VP Funds Trust: Trustee since 2007 (31 portfolios)**;
MainStay MacKay DefinedTerm Municipal Opportunities Fund: Trustee since 2011; and MainStay CBRE Global Infrastructure Megatrends Fund: Trustee since June 2021 |
| ** | Includes prior service as a Director of MainStay VP Series Fund, Inc., the predecessor to MainStay VP Funds Trust. |
| *** | Includes prior service as a Director/Trustee of certain predecessor entities to MainStay Funds Trust. |
| | |
Board of Trustees and Officers (Unaudited) (continued)
| | Name and
Year of Birth | Term of Office,
Position(s) Held and
Length of Service | Principal Occupation(s)
During Past Five Years | Number of
Portfolios in
Fund Complex
Overseen by
Trustee | Other Directorships
Held by Trustee |
| | | | | | |
| | Karen Hammond
1956 | MainStay Funds: Advisory Board Member since June 2021;MainStay Funds Trust:
Advisory Board Member since June 2021 | Retired, Managing Director, Devonshire Investors (2007 to 2013); Senior Vice President, Fidelity Management & Research Co. (2005 to 2007); Senior Vice President and Corporate Treasurer, FMR Corp. (2003 to 2005); Chief Operating Officer, Fidelity Investments Japan (2001 to 2003) | 78 | MainStay VP Funds Trust: Advisory Board Member since June 2021 (31 portfolios);
MainStay MacKay DefinedTerm Municipal Opportunities Fund: Advisory Board Member since June 2021;
MainStay CBRE Global Infrastructure Megatrends Fund: Advisory Board Member since June 2021;
Two Harbors Investment Corp: Trustee since 2018, Chair of the Special Committee since 2019; Rhode Island School of Design: Trustee and Chair of the Finance Committee since 2015 |
| 50 | MainStay MacKay New York Tax Free Opportunities Fund |
| | Name and
Year of Birth | Position(s) Held and
Length of Service | Principal Occupation(s)
During Past Five Years | |
| | | | | |
| | Kirk C. Lehneis
1974 | President, MainStay Funds, MainStay Funds Trust since 2017 | Chief Operating Officer and Senior Managing Director (since 2016), New York Life Investment Management LLC and New York Life Investment Management Holdings LLC; Member of the Board of Managers (since 2017) and Senior Managing Director (since 2018), NYLIFE Distributors LLC; Chairman of the Board and Senior Managing Director, NYLIM Service Company LLC (since 2017); Trustee, President and Principal Executive Officer of IndexIQ Trust, IndexIQ ETF Trust and IndexIQ Active ETF Trust (since January 2018); President, MainStay CBRE Global Infrastructure Megatrends Fund (since 2021), MainStay MacKay DefinedTerm Municipal Opportunities Fund and MainStay VP Funds Trust (since 2017); Senior Managing Director, Global Product Development (From 2015-2016); Managing Director, Product Development (2010 to 2015), New York Life Investment Management LLC | |
| | Jack R. Benintende
1964 | Treasurer and Principal Financial and Accounting Officer, MainStay Funds (since 2007), MainStay Funds Trust (since 2009) | Managing Director, New York Life Investment Management LLC (since 2007); Treasurer and Principal Financial and Accounting Officer, MainStay CBRE Global Infrastructure Megatrends Fund (since 2021), MainStay MacKay DefinedTerm Municipal Opportunities Fund (since 2011) and MainStay VP Funds Trust (since 2007)** and Assistant Treasurer, New York Life Investment Management Holdings LLC (2008 to 2012) | |
| | J. Kevin Gao
1967 | Secretary and Chief Legal Officer, MainStay Funds and MainStay Funds Trust (since 2010) | Managing Director and Associate General Counsel, New York Life Investment Management LLC (since 2010); Secretary and Chief Legal Officer and MainStay CBRE Global Infrastructure Megatrends Fund (since 2021), MainStay MacKay DefinedTerm Municipal Opportunities Fund (since 2011) and MainStay VP Funds Trust (since 2010)** | |
| | Scott T. Harrington
1959 | Vice President— Administration, MainStay Funds (since 2009), MainStay Funds Trust (since 2009) | Managing Director, New York Life Investment Management LLC (including predecessor advisory organizations) (since 2000); Member of the Board of Directors, New York Life Trust Company (since 2009); Vice President—Administration, MainStay CBRE Global Infrastructure Megatrends Fund (since 2021), MainStay MacKay DefinedTerm Municipal Opportunities Fund (since 2011) and MainStay VP Funds Trust (since 2005)** | |
| | Kevin M. Gleason
1967 | Vice President and Chief Compliance Officer, MainStay Funds and MainStay Funds Trust (since June 2022) | Vice President and Chief Compliance Officer, IndexIQ, IndexIQ ETF Trust and Index IQ Active ETF Trust (since June 2022); Vice President and Chief Compliance Officer, MainStay CBRE Global Infrastructure Megatrends Fund, MainStay VP Funds Trust and MainStay MacKay DefinedTerm Municipal Opportunities Fund (since June 2022); Senior Vice President, Voya Investment Management and Chief Compliance Officer, Voya Family of Funds (2012-2022) | |
| * | The officers listed above are considered to be “interested persons” of the MainStay Group of Funds, MainStay VP Funds Trust, MainStay CBRE Global Infrastructure Megatrends Fund and MainStay MacKay DefinedTerm Municipal Opportunities Fund within the meaning of the 1940 Act because of their affiliation with the MainStay Group of Funds, New York Life Insurance Company and/or its affiliates, including New York Life Investment Management LLC, NYLIM Service Company LLC, NYLIFE Securities LLC and/or NYLIFE Distributors LLC, as described in detail in the column captioned “Principal Occupation(s) During Past Five Years.” Officers are elected annually by the Board. |
| ** | Includes prior service as an Officer of MainStay VP Series Fund, Inc., the predecessor to MainStay VP Funds Trust. |
Officers of the Trust (Who are not Trustees)*
This page intentionally left blank.
This page intentionally left blank.
This page intentionally left blank.
Equity
U.S. Equity
MainStay Epoch U.S. Equity Yield Fund
MainStay S&P 500 Index Fund1
MainStay Winslow Large Cap Growth Fund
MainStay WMC Enduring Capital Fund
MainStay WMC Growth Fund
MainStay WMC Small Companies Fund
MainStay WMC Value Fund
International Equity
MainStay Epoch International Choice Fund
MainStay MacKay International Equity Fund
MainStay WMC International Research Equity Fund
Emerging Markets Equity
MainStay Candriam Emerging Markets Equity Fund
Global Equity
MainStay Epoch Capital Growth Fund
MainStay Epoch Global Equity Yield Fund
Fixed Income
Taxable Income
MainStay Candriam Emerging Markets Debt Fund
MainStay Floating Rate Fund
MainStay MacKay High Yield Corporate Bond Fund
MainStay MacKay Short Duration High Yield Fund
MainStay MacKay Strategic Bond Fund
MainStay MacKay Total Return Bond Fund
MainStay MacKay U.S. Infrastructure Bond Fund
MainStay Short Term Bond Fund
Tax-Exempt Income
MainStay MacKay California Tax Free Opportunities Fund2
MainStay MacKay High Yield Municipal Bond Fund
MainStay MacKay New York Tax Free Opportunities Fund3
MainStay MacKay Short Term Municipal Fund
MainStay MacKay Strategic Municipal Allocation Fund
MainStay MacKay Tax Free Bond Fund
Money Market
MainStay Money Market Fund
Mixed Asset
MainStay Balanced Fund
MainStay Income Builder Fund
MainStay MacKay Convertible Fund
Speciality
MainStay CBRE Global Infrastructure Fund
MainStay CBRE Real Estate Fund
MainStay Cushing MLP Premier Fund
Asset Allocation
MainStay Conservative Allocation Fund
MainStay Conservative ETF Allocation Fund
MainStay Defensive ETF Allocation Fund
MainStay Equity Allocation Fund
MainStay Equity ETF Allocation Fund
MainStay ESG Multi-Asset Allocation Fund
MainStay Growth Allocation Fund
MainStay Growth ETF Allocation Fund
MainStay Moderate Allocation Fund
MainStay Moderate ETF Allocation Fund
Manager
New York Life Investment Management LLC
New York, New York
Subadvisors
Candriam4
Strassen, Luxembourg
CBRE Investment Management Listed Real Assets LLC
Radnor, Pennsylvania
Cushing Asset Management, LP
Dallas, Texas
Epoch Investment Partners, Inc.
New York, New York
MacKay Shields LLC4
New York, New York
NYL Investors LLC4
New York, New York
Wellington Management Company LLP
Boston, Massachusetts
Winslow Capital Management, LLC
Minneapolis, Minnesota
Legal Counsel
Dechert LLP
Washington, District of Columbia
Independent Registered Public Accounting Firm
KPMG LLP
Philadelphia, Pennsylvania
Distributor
NYLIFE Distributors LLC4
Jersey City, New Jersey
Custodian
JPMorgan Chase Bank, N.A.
New York, New York
1.
Prior to February 28, 2022, the Fund's name was MainStay MacKay S&P 500 Index Fund.
| 2. | This Fund is registered for sale in AZ, CA, NV, OR, TX, UT, WA and MI (Class A and Class I shares only), and CO, FL, GA, HI, ID, MA, MD, NH, NJ and NY (Class I shares only). |
| 3. | This Fund is registered for sale in CA, CT, DE, FL, MA, NJ, NY and VT. |
| 4. | An affiliate of New York Life Investment Management LLC. |
Not part of the Annual Report
For more information
800-624-6782
newyorklifeinvestments.com
“New York Life Investments” is both a service mark, and the common trade name, of certain investment advisors affiliated with New York Life Insurance Company. The MainStay Funds® are managed by New York Life Investment Management LLC and distributed by NYLIFE Distributors LLC, 30 Hudson Street, Jersey City, NJ 07302, a wholly owned subsidiary of New York Life Insurance Company. NYLIFE Distributors LLC is a Member FINRA/SIPC.
©2022 NYLIFE Distributors LLC. All rights reserved.
| 5013746.2 MS229-22 | MSNTF11-12/22 |
(NYLIM) NL222
MainStay S&P 500 Index Fund
(formerly known as MainStay MacKay S&P 500 Index Fund)
Message from the President and Annual Report
October 31, 2022
Sign up for e-delivery of your shareholder reports. For full details on e-delivery, including who can participate and what you can receive via e-delivery,
please log in to newyorklifeinvestments.com/accounts.
| Not FDIC/NCUA Insured | Not a Deposit | May Lose Value | No Bank Guarantee | Not Insured by Any Government Agency |
This page intentionally left blank
Message from the President
A series of economic and geopolitical challenges undermined equity and fixed-income markets during the 12-month reporting period ended October 31, 2022. Stocks and bonds alike trended lower in the face of sharply rising interest rates, increasing inflationary pressures, slowing economic growth and Russia’s invasion of Ukraine.
The reporting period began on a mixed note, with concerns about the spreading Omicron variant of the COVID-19 virus and increasingly hawkish statements from the U.S. Federal Reserve (the “Fed”) regarding mounting inflation, countered by bullish sentiment stemming from U.S. economic growth and strong corporate earnings. In January 2022, markets turned decisively negative as comments from the Fed raised the likelihood of rate hikes as early as March, and Russia issued increasingly aggressive threats toward Ukraine. The onset of Russia’s invasion in February exacerbated global inflationary pressures while increasing investor uncertainty. Domestic supply shortages, international trade imbalances and rising inflation caused GDP (gross domestic product) to contract in the first and second quarters of the year, although employment and consumer spending proved resilient. Prices for petroleum surged to multi-year highs, while many key agricultural chemicals and industrial metals climbed as well. Accelerating inflationary forces prompted the Fed to implement its most aggressive interest rate increases since the 1980s with a series of five sharp rate hikes, raising the federal funds rate from a range of 0.00% to 0.25% in March to 3.00% to 3.25% in September, with additional rate hikes expected before the end of the year. International central banks generally followed suit, raising rates by varying degrees in efforts to curb local inflation, although most increases remained significantly more modest than those in the United States. Relatively high U.S. interest rates and risk-averse international sentiment pushed U.S. dollar values higher compared to most other currencies, with the ensuing negative impact on global prices for food, fuel and other key, U.S.-dollar-denominated products.
The effects of these interrelated challenges were felt throughout U.S. and international financial markets. The S&P 500® Index, a widely regarded benchmark of U.S. market performance, declined by more than 14% during the reporting period. Although the energy sector generated strong gains, bolstered by elevated oil and gas prices, most other industry areas recorded losses. The more cyclical and growth-oriented sectors of consumer discretionary, real estate and information technology delivered the
weakest returns, while the traditionally defensive and value-oriented consumer staples, utilities and health care sectors outperformed. International stocks lagged compared to their U.S. counterparts, with some emerging markets, such as China, suffering particularly steep losses. A few markets, however, including Brazil, Mexico and the United Arab Emirates, ended the reporting period with little change. Fixed-income markets saw bond prices broadly decline as yields rose along with interest rates. Short-term yields rose faster than long-term yields, producing a yield curve inversion from July through the end of the reporting period, with long-term rates remaining below short-term rates. While floating-rate instruments, which feature variable interest rates that allow investors to benefit from a rising rate environment, provided a degree of insulation from inflation-driven trends, they were not immune to the market’s widespread declines.
While the Fed acknowledges the costs of rising rates in terms of weaker GDP growth and unsettled financial markets over the short term, its primary focus continues to be the longer-term economic impact of inflation. With the latest figures as of the date of this report showing that inflation remains above 8%, versus a target rate of just 2%, the Fed clearly has a distance yet to go, making further rate increases and market volatility more likely in the coming months. The question remains as to whether the Fed and other central banks will manage a so-called “soft landing,” curbing inflation while avoiding a persistent economic slowdown. If they prove successful, we expect that favorable inflation trends and increasingly attractive valuations in both equity and bond markets should eventually translate into sustainable improvements in the investment environment.
Whatever actions the Fed takes and however financial markets react, as a MainStay investor, you can depend on us to continue providing the insight, expertise and service that have long defined New York Life Investments. Thank you for trusting us to help you meet your investment needs.
Sincerely,
Kirk C. Lehneis
President
The opinions expressed are as of the date of this report and are subject to change. There is no guarantee that any forecast made will come to pass. This material does not constitute investment advice and is not intended as an endorsement of any specific investment. Past performance is no guarantee of future results.
Not part of the Annual Report
Investors should refer to the Fund’s Summary Prospectus and/or Prospectus and consider the Fund’s investment objectives, strategies, risks, charges and expenses carefully before investing. The Summary Prospectus and/or Prospectus contain this and other information about the Fund. You may obtain copies of the Fund’s Summary Prospectus, Prospectus and Statement of Additional Information, which includes information about the MainStay Funds Trust's Trustees, free of charge, upon request, by calling toll-free 800-624-6782, by writing to NYLIFE Distributors LLC, Attn: MainStay Marketing Department, 30 Hudson Street, Jersey City, NJ 07302 or by sending an e-mail to MainStayShareholderServices@nylim.com. These documents are also available via the MainStay Funds’ website at newyorklifeinvestments.com. Please read the Fund’s Summary Prospectus and/or Prospectus carefully before investing.
Investment and Performance Comparison (Unaudited)
Performance data quoted represents past performance. Past performance is no guarantee of future results. Because of market volatility and other factors, current performance may be lower or higher than the figures shown. Investment return and principal value will fluctuate, and as a result, when shares are redeemed, they may be worth more or less than their original cost. The graph below depicts the historical performance of Class I shares of the Fund. Performance will vary from class to class based on differences in class-specific expenses and sales charges. For performance information current to the most recent month-end, please call 800-624-6782 or visit newyorklifeinvestments.com.
The performance table and graph do not reflect the deduction of taxes that a shareholder would pay on distributions or Fund share redemptions. Total returns reflect maximum applicable sales charges as indicated in the table below, if any, changes in share price, and reinvestment of dividend and capital gain distributions. The graph assumes the initial investment amount shown below and reflects the deduction of all sales charges that would have applied for the period of investment. Performance figures may reflect certain fee waivers and/or expense limitations, without which total returns may have been lower. For more information on share classes and current fee waivers and/or expense limitations (if any), please refer to the Notes to Financial Statements.

| Average Annual Total Returns for the Year-Ended October 31, 2022 |
| Class | Sales Charge | | Inception
Date | One
Year | Five
Years | Ten Years
or Since
Inception | Gross
Expense
Ratio1 |
| Class A Shares2 | Maximum 1.5% Initial Sales Charge | With sales charges | 1/2/2004 | -16.31% | 9.23% | 11.84% | 0.50% |
| | | Excluding sales charges | | -15.03 | 9.90 | 12.18 | 0.50 |
| Investor Class Shares2, 3 | Maximum 1% Initial Sales Charge | With sales charges | 2/28/2008 | -16.03 | 9.04 | 11.68 | 0.82 |
| | | Excluding sales charges | | -15.18 | 9.70 | 12.02 | 0.82 |
| Class I Shares | No Sales Charge | | 1/2/1991 | -14.82 | 10.17 | 12.46 | 0.25 |
| SIMPLE Class Shares | No Sales Charge | | 8/31/2020 | -15.39 | N/A | 5.35 | 1.07 |
| 1. | The gross expense ratios presented reflect the Fund’s “Total Annual Fund Operating Expenses” from the most recent Prospectus, as supplemented, and may differ from other expense ratios disclosed in this report. |
| 2. | Prior to March 19, 2020, the maximum initial sales charge for Class A Shares and Investor Class Shares was 3%, which is reflected in the applicable average annual total return figures shown. |
| 3. | Prior to June 30, 2020, the maximum initial sales charge was 1.5%, which is reflected in the applicable average annual total return figures shown. |
The footnotes on the next page are an integral part of the table and graph and should be carefully read in conjunction with them.
| Benchmark Performance* | One
Year | Five
Years | Ten
Years |
| S&P 500® Index1 | -14.61% | 10.44% | 12.79% |
| Morningstar Large Blend Category Average2 | -14.69 | 8.51 | 10.81 |
| * | Returns for indices reflect no deductions for fees, expenses or taxes, except for foreign withholding taxes where applicable. Results assume reinvestment of all dividends and capital gains. An investment cannot be made directly in an index. |
| 1. | The S&P 500® Index is the Fund's primary broad-based securities market index for comparison purposes. Information Regarding Standard & Poor's® "Standard & Poor's®," "S&P®," "S&P 500®," "Standard & Poor's 500," and "500" are trademarks of The McGraw-Hill Companies, Inc. The MainStay S&P 500 Index Fund is not sponsored, endorsed, sold or promoted by Standard & Poor's, and Standard & Poor's makes no representation regarding the advisability of investing in the Fund. |
| 2. | The Morningstar Large Blend Category Average is representative of funds that represent the overall U.S. stock market in size, growth rates and price. Stocks in the top 70% of the capitalization of the U.S. equity market are defined as large cap. The blend style is assigned to portfolios where neither growth nor value characteristics predominate. These portfolios tend to invest across the spectrum of U.S. industries, and owing to their broad exposure, the portfolios' returns are often similar to those of the S&P 500® Index. Results are based on average total returns of similar funds with all dividends and capital gain distributions reinvested. |
The footnotes on the preceding page are an integral part of the table and graph and should be carefully read in conjunction with them.
| 6 | MainStay S&P 500 Index Fund |
Cost in Dollars of a $1,000 Investment in MainStay S&P 500 Index Fund (Unaudited)
The example below is intended to describe the fees and expenses borne by shareholders during the six-month period from May 1, 2022 to October 31, 2022, and the impact of those costs on your investment.
Example
As a shareholder of the Fund you incur two types of costs: (1) transaction costs, including exchange fees and sales charges (loads) on purchases (as applicable), and (2) ongoing costs, including management fees, distribution and/or service (12b-1) fees and other Fund expenses (as applicable). This example is intended to help you understand your ongoing costs (in dollars) of investing in the Fund and to compare these costs with the ongoing costs of investing in other mutual funds. The example is based on an investment of $1,000 made at the beginning of the six-month period and held for the entire period from May 1, 2022 to October 31, 2022.
This example illustrates your Fund’s ongoing costs in two ways:
Actual Expenses
The second and third data columns in the table below provide information about actual account values and actual expenses. You may use the information in these columns, together with the amount you invested, to estimate the expenses that you paid during the six months ended October 31, 2022. Simply divide your account value by $1,000 (for example, an
$8,600 account value divided by $1,000 = 8.6), then multiply the result by the number under the heading entitled “Expenses Paid During Period” to estimate the expenses you paid on your account during this period.
Hypothetical Example for Comparison Purposes
The fourth and fifth data columns in the table below provide information about hypothetical account values and hypothetical expenses based on the Fund’s actual expense ratio and an assumed rate of return of 5% per year before expenses, which is not the Fund’s actual return. The hypothetical account values and expenses may not be used to estimate the actual ending account balances or expenses you paid for the six-month period shown. You may use this information to compare the ongoing costs of investing in the Fund with the ongoing costs of investing in other mutual funds. To do so, compare this 5% hypothetical example with the 5% hypothetical examples that appear in the shareholder reports of the other mutual funds.
Please note that the expenses shown in the table are meant to highlight your ongoing costs only and do not reflect any transactional costs, such as exchange fees or sales charges (loads). Therefore, the fourth and fifth data columns of the table are useful in comparing ongoing costs only and will not help you determine the relative total costs of owning different funds. In addition, if these transactional costs were included, your costs would have been higher.
| Share Class | Beginning
Account
Value
5/1/22 | Ending Account
Value (Based
on Actual
Returns and
Expenses)
10/31/22 | Expenses
Paid
During
Period1 | Ending Account
Value (Based
on Hypothetical
5% Annualized
Return and
Actual Expenses)
10/31/22 | Expenses
Paid
During
Period1 | Net Expense
Ratio
During
Period2 |
| Class A Shares | $1,000.00 | $942.70 | $2.60 | $1,022.53 | $2.70 | 0.53% |
| Investor Class Shares | $1,000.00 | $941.80 | $3.43 | $1,021.68 | $3.57 | 0.70% |
| Class I Shares | $1,000.00 | $943.80 | $1.37 | $1,023.79 | $1.43 | 0.28% |
| SIMPLE Class Shares | $1,000.00 | $940.60 | $4.65 | $1,020.42 | $4.84 | 0.95% |
| 1. | Expenses are equal to the Fund’s annualized expense ratio of each class multiplied by the average account value over the period, divided by 365 and multiplied by 184 (to reflect the six-month period). The table above represents the actual expenses incurred during the six-month period. In addition to the fees and expenses which the Fund bears directly, it also indirectly bears a pro rata share of the fees and expenses of the underlying funds in which it invests. Such indirect expenses are not included in the above-reported expense figures. |
| 2. | Expenses are equal to the Fund's annualized expense ratio to reflect the six-month period. |
Industry Composition as of October 31, 2022 (Unaudited)
| Software | 8.2% |
| Technology Hardware, Storage & Peripherals | 7.3 |
| Oil, Gas & Consumable Fuels | 4.9 |
| Semiconductors & Semiconductor Equipment | 4.7 |
| Pharmaceuticals | 4.7 |
| IT Services | 4.5 |
| Interactive Media & Services | 4.0 |
| Banks | 3.9 |
| Health Care Providers & Services | 3.7 |
| Capital Markets | 3.0 |
| Internet & Direct Marketing Retail | 2.9 |
| Health Care Equipment & Supplies | 2.7 |
| Equity Real Estate Investment Trusts | 2.6 |
| Biotechnology | 2.3 |
| Insurance | 2.3 |
| Specialty Retail | 2.3 |
| Automobiles | 2.2 |
| Hotels, Restaurants & Leisure | 2.0 |
| Electric Utilities | 1.9 |
| Beverages | 1.9 |
| Life Sciences Tools & Services | 1.8 |
| Aerospace & Defense | 1.8 |
| Chemicals | 1.8 |
| Machinery | 1.8 |
| Diversified Financial Services | 1.6 |
| Food & Staples Retailing | 1.6 |
| Entertainment | 1.4 |
| Household Products | 1.4 |
| Food Products | 1.2 |
| Diversified Telecommunication Services | 0.9 |
| Industrial Conglomerates | 0.9 |
| Multi–Utilities | 0.9 |
| Road & Rail | 0.9 |
| Communications Equipment | 0.8% |
| Media | 0.7 |
| Tobacco | 0.7 |
| Electronic Equipment, Instruments & Components | 0.6 |
| Air Freight & Logistics | 0.6 |
| Electrical Equipment | 0.5 |
| Consumer Finance | 0.5 |
| Multiline Retail | 0.5 |
| Commercial Services & Supplies | 0.5 |
| Building Products | 0.4 |
| Textiles, Apparel & Luxury Goods | 0.4 |
| Energy Equipment & Services | 0.4 |
| Professional Services | 0.4 |
| Metals & Mining | 0.3 |
| Household Durables | 0.3 |
| Wireless Telecommunication Services | 0.3 |
| Containers & Packaging | 0.3 |
| Trading Companies & Distributors | 0.2 |
| Airlines | 0.2 |
| Distributors | 0.2 |
| Personal Products | 0.1 |
| Construction Materials | 0.1 |
| Auto Components | 0.1 |
| Water Utilities | 0.1 |
| Real Estate Management & Development | 0.1 |
| Construction & Engineering | 0.1 |
| Independent Power and Renewable Electricity Producers | 0.1 |
| Gas Utilities | 0.0‡ |
| Leisure Products | 0.0‡ |
| Short–Term Investments | 0.4 |
| Other Assets, Less Liabilities | 0.1 |
| | 100.0% |
| ‡ | Less than one–tenth of a percent. |
See Portfolio of Investments beginning on page 10 for specific holdings within these categories. The Fund's holdings are subject to change.
Top Ten Holdings and/or Issuers Held as of October 31, 2022 (excluding short-term investments) (Unaudited)
| 1. | Apple, Inc. |
| 2. | Microsoft Corp. |
| 3. | Alphabet, Inc. |
| 4. | Amazon.com, Inc. |
| 5. | Tesla, Inc. |
| 6. | Berkshire Hathaway, Inc., Class B |
| 7. | UnitedHealth Group, Inc. |
| 8. | Exxon Mobil Corp. |
| 9. | Johnson & Johnson |
| 10. | JPMorgan Chase & Co. |
| 8 | MainStay S&P 500 Index Fund |
Portfolio Management Discussion and Analysis (Unaudited)
Questions answered by portfolio manager Francis J. Ok of IndexIQ Advisors LLC, the Fund’s Subadvisor.
How did MainStay S&P 500 Index Fund perform relative to its benchmark and peer group during the 12 months ended October 31, 2022?
For the 12 months ended October 31, 2022, Class I shares of MainStay S&P 500 Index Fund returned −14.82%, underperforming the −14.61% return of the Fund’s primary benchmark, the S&P 500® Index (the “Index”). Over the same period, Class I shares underperformed the −14.69% return of the Morningstar Large Blend Category Average.1
What factors affected the Fund’s relative performance during the reporting period?
Although the Fund seeks investment results that correspond to the total return performance of common stocks in the aggregate, as represented by the Index, the Fund’s relative performance will typically lag that of the Index, as it did during the reporting period, because the Fund incurs operating expenses that the Index does not.
Were there any changes to the Fund during the reporting period?
Effective February 28, 2022, the Fund changed its name from MainStay MacKay S&P 500 Index Fund to MainStay S&P 500 Index Fund. Effective June 10, 2022, Francis J. Ok, the portfolio manager from MacKay Shields LLC (“MacKay Shields”) who manages the day-to-day investment operations of the Fund, transitioned from MacKay Shields to IndexIQ Advisors LLC ("IndexIQ"), which is a wholly owned, indirect subsidiary of New York Life Investment Management Holdings LLC. For more information on this transition refer to the prospectus supplement dated June 10, 2022.
What factors affected the Fund’s performance during the reporting period?
Although the Fund seeks investment results that correspond to the total return performance of common stocks in the aggregate, as represented by the Index, the Fund’s relative performance will typically lag behind that of the Index, as it did during the reporting period, because the Fund incurs operating expenses that the Index does not.
During the reporting period, how was the Fund’s performance materially affected by investments in derivatives?
The Fund invests in futures contracts to provide an efficient means of maintaining liquidity while remaining fully invested in the market. During the reporting period, the Fund's investment in futures contracts had a negative impact on performance.
During the reporting period, which S&P 500® Index industries had the highest total returns and which industries had the lowest total returns?
The strongest performing Index industry groups during the reporting period in terms of total returns included oil gas &
consumable fuels, energy equipment & services and wireless telecommunication services. During the same period, the industry groups with the lowest total returns included interactive media & services, textiles apparel & luxury goods and entertainment.
During the reporting period, which S&P 500® Index industries made the strongest positive contributions to the Fund’s absolute performance and which industries made the weakest contributions?
The industry groups that made the strongest positive contributions to the Fund’s absolute performance during the reporting period were oil gas & consumable fuels, health care providers & services and pharmaceuticals. (Contributions take weightings and total returns into account.) During the same period, the industry groups that made the weakest contributions to the Fund’s absolute performance included software, interactive media & services and semiconductor & semiconductor equipment.
During the reporting period, which individual stocks in the S&P 500® Index had the highest total returns and which stocks had the lowest total returns?
The Index stocks producing the highest total returns during the reporting period included Occidental Petroleum, Devon Energy, and CF Industries. Conversely, the Index stocks with the lowest total returns over the same period were Generac, Match Group and Align Technology.
During the reporting period, which S&P 500® Index stocks made the strongest positive contributions to the Fund’s absolute performance and which stocks made the weakest contributions?
The strongest positive contributors to the Fund’s absolute performance during the reporting period were ExxonMobil, Chevron and UnitedHealth Group. During the same period, the stocks that made the weakest contributions to the Fund’s absolute performance were Microsoft, Amazon.com and Tesla.
Were there any changes in the S&P 500® Index during the reporting period?
During the reporting period, there were 19 additions and 20 deletions to the Index.
| 1. | See page 5 for other share class returns, which may be higher or lower than Class I share returns. See page 6 for more information on benchmark and peer group returns. |
The opinions expressed are those of the portfolio manager as of the date of this report and are subject to change. There is no guarantee that any forecasts will come to pass. This material does not constitute investment advice and is not intended as an endorsement of any specific investment.
Portfolio of Investments October 31, 2022†
| | Shares | Value |
| Common Stocks 99.5% |
| Aerospace & Defense 1.8% |
| Boeing Co. (The) (a) | 18,476 | $ 2,633,015 |
| General Dynamics Corp. | 7,444 | 1,859,511 |
| Howmet Aerospace, Inc. | 12,238 | 435,061 |
| Huntington Ingalls Industries, Inc. | 1,322 | 339,847 |
| L3Harris Technologies, Inc. | 6,334 | 1,561,141 |
| Lockheed Martin Corp. | 7,811 | 3,801,457 |
| Northrop Grumman Corp. | 4,814 | 2,642,934 |
| Raytheon Technologies Corp. | 48,873 | 4,634,138 |
| Textron, Inc. | 7,002 | 479,217 |
| TransDigm Group, Inc. | 1,705 | 981,671 |
| | | 19,367,992 |
| Air Freight & Logistics 0.6% |
| CH Robinson Worldwide, Inc. | 4,101 | 400,750 |
| Expeditors International of Washington, Inc. | 5,415 | 529,858 |
| FedEx Corp. | 7,913 | 1,268,295 |
| United Parcel Service, Inc., Class B | 24,225 | 4,064,228 |
| | | 6,263,131 |
| Airlines 0.2% |
| Alaska Air Group, Inc. (a) | 4,196 | 186,554 |
| American Airlines Group, Inc. (a) | 21,510 | 305,012 |
| Delta Air Lines, Inc. (a) | 21,224 | 720,130 |
| Southwest Airlines Co. (a) | 19,640 | 713,914 |
| United Airlines Holdings, Inc. (a) | 10,815 | 465,910 |
| | | 2,391,520 |
| Auto Components 0.1% |
| Aptiv plc (a) | 8,968 | 816,716 |
| BorgWarner, Inc. | 7,839 | 294,197 |
| | | 1,110,913 |
| Automobiles 2.2% |
| Ford Motor Co. | 130,726 | 1,747,807 |
| General Motors Co. | 48,262 | 1,894,283 |
| Tesla, Inc. (a) | 88,161 | 20,060,154 |
| | | 23,702,244 |
| Banks 3.9% |
| Bank of America Corp. | 231,394 | 8,339,440 |
| Citigroup, Inc. | 64,106 | 2,939,901 |
| Citizens Financial Group, Inc. | 16,406 | 671,005 |
| Comerica, Inc. | 4,330 | 305,265 |
| Fifth Third Bancorp | 22,713 | 810,627 |
| First Republic Bank | 6,048 | 726,365 |
| Huntington Bancshares, Inc. | 47,737 | 724,648 |
| JPMorgan Chase & Co. | 97,069 | 12,219,046 |
| | Shares | Value |
| |
| Banks (continued) |
| KeyCorp | 30,871 | $ 551,665 |
| M&T Bank Corp. | 5,813 | 978,735 |
| PNC Financial Services Group, Inc. (The) | 13,575 | 2,196,842 |
| Regions Financial Corp. | 30,929 | 678,892 |
| Signature Bank | 2,083 | 330,218 |
| SVB Financial Group (a) | 1,956 | 451,758 |
| Truist Financial Corp. | 43,904 | 1,966,460 |
| U.S. Bancorp | 44,754 | 1,899,807 |
| Wells Fargo & Co. | 125,551 | 5,774,090 |
| Zions Bancorp NA | 4,981 | 258,713 |
| | | 41,823,477 |
| Beverages 1.9% |
| Brown-Forman Corp., Class B | 6,052 | 411,536 |
| Coca-Cola Co. (The) | 128,832 | 7,710,595 |
| Constellation Brands, Inc., Class A | 5,274 | 1,303,100 |
| Keurig Dr Pepper, Inc. | 28,123 | 1,092,297 |
| Molson Coors Beverage Co., Class B | 6,229 | 314,129 |
| Monster Beverage Corp. (a) | 12,731 | 1,193,149 |
| PepsiCo, Inc. | 45,681 | 8,294,756 |
| | | 20,319,562 |
| Biotechnology 2.3% |
| AbbVie, Inc. | 58,525 | 8,568,060 |
| Amgen, Inc. | 17,706 | 4,786,817 |
| Biogen, Inc. (a) | 4,803 | 1,361,362 |
| Gilead Sciences, Inc. | 41,487 | 3,255,070 |
| Incyte Corp. (a) | 6,111 | 454,292 |
| Moderna, Inc. (a) | 11,136 | 1,674,075 |
| Regeneron Pharmaceuticals, Inc. (a) | 3,548 | 2,656,565 |
| Vertex Pharmaceuticals, Inc. (a) | 8,489 | 2,648,568 |
| | | 25,404,809 |
| Building Products 0.4% |
| Allegion plc | 2,907 | 304,566 |
| AO Smith Corp. | 4,253 | 232,979 |
| Carrier Global Corp. | 27,857 | 1,107,594 |
| Fortune Brands Home & Security, Inc. | 4,280 | 258,170 |
| Johnson Controls International plc | 22,800 | 1,318,752 |
| Masco Corp. | 7,465 | 345,406 |
| Trane Technologies plc | 7,670 | 1,224,362 |
| | | 4,791,829 |
| Capital Markets 3.0% |
| Ameriprise Financial, Inc. | 3,580 | 1,106,650 |
| Bank of New York Mellon Corp. (The) | 24,341 | 1,025,000 |
| BlackRock, Inc. | 4,991 | 3,223,737 |
| Cboe Global Markets, Inc. | 3,511 | 437,120 |
| Charles Schwab Corp. (The) | 50,543 | 4,026,761 |
The notes to the financial statements are an integral part of, and should be read in conjunction with, the financial statements.
| 10 | MainStay S&P 500 Index Fund |
| | Shares | Value |
| Common Stocks (continued) |
| Capital Markets (continued) |
| CME Group, Inc. | 11,897 | $ 2,061,750 |
| FactSet Research Systems, Inc. | 1,257 | 534,841 |
| Franklin Resources, Inc. | 9,403 | 220,500 |
| Goldman Sachs Group, Inc. (The) | 11,299 | 3,892,618 |
| Intercontinental Exchange, Inc. | 18,485 | 1,766,611 |
| Invesco Ltd. | 15,057 | 230,673 |
| MarketAxess Holdings, Inc. | 1,246 | 304,074 |
| Moody's Corp. | 5,224 | 1,383,681 |
| Morgan Stanley | 44,326 | 3,642,267 |
| MSCI, Inc. | 2,665 | 1,249,512 |
| Nasdaq, Inc. | 11,219 | 698,271 |
| Northern Trust Corp. | 6,898 | 581,846 |
| Raymond James Financial, Inc. | 6,430 | 759,640 |
| S&P Global, Inc. | 11,277 | 3,622,736 |
| State Street Corp. | 12,168 | 900,432 |
| T. Rowe Price Group, Inc. | 7,470 | 793,015 |
| | | 32,461,735 |
| Chemicals 1.8% |
| Air Products and Chemicals, Inc. | 7,342 | 1,838,437 |
| Albemarle Corp. | 3,877 | 1,085,056 |
| Celanese Corp. | 3,299 | 317,100 |
| CF Industries Holdings, Inc. | 6,596 | 700,891 |
| Corteva, Inc. | 23,786 | 1,554,177 |
| Dow, Inc. | 23,772 | 1,111,103 |
| DuPont de Nemours, Inc. | 16,580 | 948,376 |
| Eastman Chemical Co. | 4,065 | 312,233 |
| Ecolab, Inc. | 8,207 | 1,289,073 |
| FMC Corp. | 4,169 | 495,694 |
| International Flavors & Fragrances, Inc. | 8,439 | 823,731 |
| Linde plc | 16,496 | 4,905,086 |
| LyondellBasell Industries NV, Class A | 8,422 | 643,862 |
| Mosaic Co. (The) | 11,428 | 614,255 |
| PPG Industries, Inc. | 7,778 | 888,092 |
| Sherwin-Williams Co. (The) | 7,807 | 1,756,809 |
| | | 19,283,975 |
| Commercial Services & Supplies 0.5% |
| Cintas Corp. | 2,847 | 1,217,235 |
| Copart, Inc. (a) | 7,080 | 814,342 |
| Republic Services, Inc. | 6,797 | 901,418 |
| Rollins, Inc. | 7,661 | 322,375 |
| Waste Management, Inc. | 12,450 | 1,971,706 |
| | | 5,227,076 |
| Communications Equipment 0.8% |
| Arista Networks, Inc. (a)(b) | 8,158 | 985,976 |
| Cisco Systems, Inc. | 137,068 | 6,226,999 |
| | Shares | Value |
| |
| Communications Equipment (continued) |
| F5, Inc. (a) | 1,972 | $ 281,819 |
| Juniper Networks, Inc. | 10,678 | 326,747 |
| Motorola Solutions, Inc. | 5,524 | 1,379,398 |
| | | 9,200,939 |
| Construction & Engineering 0.1% |
| Quanta Services, Inc. | 4,734 | 672,417 |
| Construction Materials 0.1% |
| Martin Marietta Materials, Inc. | 2,065 | 693,799 |
| Vulcan Materials Co. | 4,399 | 720,116 |
| | | 1,413,915 |
| Consumer Finance 0.5% |
| American Express Co. | 19,854 | 2,947,326 |
| Capital One Financial Corp. | 12,705 | 1,346,984 |
| Discover Financial Services | 9,042 | 944,528 |
| Synchrony Financial | 15,946 | 567,040 |
| | | 5,805,878 |
| Containers & Packaging 0.3% |
| Amcor plc | 49,742 | 576,012 |
| Avery Dennison Corp. | 2,690 | 456,089 |
| Ball Corp. | 10,404 | 513,854 |
| International Paper Co. | 11,983 | 402,749 |
| Packaging Corp. of America | 3,103 | 373,012 |
| Sealed Air Corp. | 4,807 | 228,909 |
| Westrock Co. | 8,417 | 286,683 |
| | | 2,837,308 |
| Distributors 0.2% |
| Genuine Parts Co. | 4,681 | 832,563 |
| LKQ Corp. | 8,628 | 480,062 |
| Pool Corp. | 1,310 | 398,541 |
| | | 1,711,166 |
| Diversified Financial Services 1.6% |
| Berkshire Hathaway, Inc., Class B (a) | 59,741 | 17,628,972 |
| Diversified Telecommunication Services 0.9% |
| AT&T, Inc. | 235,873 | 4,299,965 |
| Lumen Technologies, Inc. | 31,529 | 232,053 |
| Verizon Communications, Inc. | 139,012 | 5,194,879 |
| | | 9,726,897 |
| Electric Utilities 1.9% |
| Alliant Energy Corp. | 8,306 | 433,324 |
| American Electric Power Co., Inc. | 17,005 | 1,495,080 |
| Constellation Energy Corp. | 10,819 | 1,022,828 |
The notes to the financial statements are an integral part of, and should be read in conjunction with, the financial statements.
11
Portfolio of Investments October 31, 2022† (continued)
| | Shares | Value |
| Common Stocks (continued) |
| Electric Utilities (continued) |
| Duke Energy Corp. | 25,486 | $ 2,374,785 |
| Edison International | 12,626 | 758,065 |
| Entergy Corp. | 6,733 | 721,374 |
| Evergy, Inc. | 7,597 | 464,405 |
| Eversource Energy | 11,467 | 874,703 |
| Exelon Corp. | 32,828 | 1,266,833 |
| FirstEnergy Corp. | 17,968 | 677,573 |
| NextEra Energy, Inc. | 65,035 | 5,040,212 |
| NRG Energy, Inc. | 7,783 | 345,565 |
| PG&E Corp. (a) | 53,240 | 794,873 |
| Pinnacle West Capital Corp. | 3,742 | 251,500 |
| PPL Corp. | 24,368 | 645,508 |
| Southern Co. (The) | 35,186 | 2,303,979 |
| Xcel Energy, Inc. | 18,106 | 1,178,882 |
| | | 20,649,489 |
| Electrical Equipment 0.5% |
| AMETEK, Inc. | 7,599 | 985,287 |
| Eaton Corp. plc | 13,184 | 1,978,523 |
| Emerson Electric Co. | 19,572 | 1,694,935 |
| Generac Holdings, Inc. (a) | 2,113 | 244,918 |
| Rockwell Automation, Inc. | 3,821 | 975,501 |
| | | 5,879,164 |
| Electronic Equipment, Instruments & Components 0.6% |
| Amphenol Corp., Class A | 19,689 | 1,493,017 |
| CDW Corp. | 4,477 | 773,670 |
| Corning, Inc. | 25,182 | 810,105 |
| Keysight Technologies, Inc. (a) | 5,956 | 1,037,237 |
| TE Connectivity Ltd. | 10,587 | 1,294,049 |
| Teledyne Technologies, Inc. (a) | 1,551 | 617,267 |
| Trimble, Inc. (a) | 8,198 | 493,192 |
| Zebra Technologies Corp., Class A (a) | 1,714 | 485,439 |
| | | 7,003,976 |
| Energy Equipment & Services 0.4% |
| Baker Hughes Co. | 33,489 | 926,306 |
| Halliburton Co. | 30,020 | 1,093,328 |
| Schlumberger NV | 46,817 | 2,435,889 |
| | | 4,455,523 |
| Entertainment 1.4% |
| Activision Blizzard, Inc. | 23,564 | 1,715,459 |
| Electronic Arts, Inc. | 8,743 | 1,101,268 |
| Live Nation Entertainment, Inc. (a) | 4,703 | 374,406 |
| Netflix, Inc. (a) | 14,720 | 4,296,474 |
| Take-Two Interactive Software, Inc. (a) | 5,186 | 614,437 |
| Walt Disney Co. (The) (a) | 60,344 | 6,429,050 |
| | Shares | Value |
| |
| Entertainment (continued) |
| Warner Bros Discovery, Inc. (a) | 73,122 | $ 950,586 |
| | | 15,481,680 |
| Equity Real Estate Investment Trusts 2.6% |
| Alexandria Real Estate Equities, Inc. | 4,915 | 714,149 |
| American Tower Corp. | 15,411 | 3,193,005 |
| AvalonBay Communities, Inc. | 4,628 | 810,455 |
| Boston Properties, Inc. | 4,721 | 343,217 |
| Camden Property Trust | 3,526 | 407,429 |
| Crown Castle, Inc. | 14,334 | 1,910,149 |
| Digital Realty Trust, Inc. | 9,513 | 953,678 |
| Equinix, Inc. | 3,015 | 1,707,817 |
| Equity Residential | 11,205 | 706,139 |
| Essex Property Trust, Inc. | 2,156 | 479,149 |
| Extra Space Storage, Inc. | 4,433 | 786,592 |
| Federal Realty Investment Trust | 2,410 | 238,542 |
| Healthpeak Properties, Inc. | 17,860 | 423,818 |
| Host Hotels & Resorts, Inc. | 23,663 | 446,757 |
| Invitation Homes, Inc. | 19,193 | 608,226 |
| Iron Mountain, Inc. | 9,622 | 481,774 |
| Kimco Realty Corp. | 20,472 | 437,691 |
| Mid-America Apartment Communities, Inc. | 3,821 | 601,616 |
| Prologis, Inc. | 30,559 | 3,384,409 |
| Public Storage | 5,229 | 1,619,683 |
| Realty Income Corp. | 20,442 | 1,272,923 |
| Regency Centers Corp. | 5,098 | 308,480 |
| SBA Communications Corp. | 3,571 | 963,813 |
| Simon Property Group, Inc. | 10,835 | 1,180,798 |
| UDR, Inc. | 10,110 | 401,974 |
| Ventas, Inc. | 13,231 | 517,729 |
| VICI Properties, Inc. | 31,879 | 1,020,766 |
| Vornado Realty Trust (b) | 5,332 | 125,782 |
| Welltower, Inc. | 15,338 | 936,232 |
| Weyerhaeuser Co. | 24,505 | 757,940 |
| | | 27,740,732 |
| Food & Staples Retailing 1.6% |
| Costco Wholesale Corp. | 14,662 | 7,352,993 |
| Kroger Co. (The) | 21,554 | 1,019,288 |
| Sysco Corp. | 16,864 | 1,459,748 |
| Walgreens Boots Alliance, Inc. | 23,744 | 866,656 |
| Walmart, Inc. | 47,181 | 6,715,272 |
| | | 17,413,957 |
| Food Products 1.2% |
| Archer-Daniels-Midland Co. | 18,555 | 1,799,464 |
| Campbell Soup Co. | 6,666 | 352,698 |
| Conagra Brands, Inc. | 15,891 | 583,200 |
The notes to the financial statements are an integral part of, and should be read in conjunction with, the financial statements.
| 12 | MainStay S&P 500 Index Fund |
| | Shares | Value |
| Common Stocks (continued) |
| Food Products (continued) |
| General Mills, Inc. | 19,718 | $ 1,608,594 |
| Hershey Co. (The) | 4,861 | 1,160,661 |
| Hormel Foods Corp. | 9,580 | 444,991 |
| J M Smucker Co. (The) | 3,527 | 531,378 |
| Kellogg Co. | 8,443 | 648,591 |
| Kraft Heinz Co. (The) | 26,366 | 1,014,300 |
| Lamb Weston Holdings, Inc. | 4,757 | 410,149 |
| McCormick & Co., Inc. (Non-Voting) | 8,291 | 652,004 |
| Mondelez International, Inc., Class A | 45,366 | 2,789,102 |
| Tyson Foods, Inc., Class A | 9,586 | 655,203 |
| | | 12,650,335 |
| Gas Utilities 0.0% ‡ |
| Atmos Energy Corp. | 4,630 | 493,327 |
| Health Care Equipment & Supplies 2.7% |
| Abbott Laboratories | 57,966 | 5,735,156 |
| ABIOMED, Inc. (a) | 1,505 | 379,380 |
| Align Technology, Inc. (a) | 2,404 | 467,097 |
| Baxter International, Inc. | 16,670 | 906,014 |
| Becton Dickinson and Co. | 9,440 | 2,227,557 |
| Boston Scientific Corp. (a) | 47,387 | 2,042,854 |
| Cooper Cos., Inc. (The) | 1,633 | 446,446 |
| Dentsply Sirona, Inc. | 7,132 | 219,808 |
| DexCom, Inc. (a) | 12,995 | 1,569,536 |
| Edwards Lifesciences Corp. (a) | 20,520 | 1,486,264 |
| Hologic, Inc. (a) | 8,264 | 560,299 |
| IDEXX Laboratories, Inc. (a) | 2,756 | 991,278 |
| Intuitive Surgical, Inc. (a) | 11,821 | 2,913,522 |
| Medtronic plc | 43,981 | 3,841,301 |
| ResMed, Inc. | 4,847 | 1,084,225 |
| STERIS plc | 3,311 | 571,412 |
| Stryker Corp. | 11,145 | 2,554,880 |
| Teleflex, Inc. | 1,553 | 333,212 |
| Zimmer Biomet Holdings, Inc. | 6,945 | 787,216 |
| | | 29,117,457 |
| Health Care Providers & Services 3.7% |
| AmerisourceBergen Corp. | 5,145 | 808,897 |
| Cardinal Health, Inc. | 9,017 | 684,390 |
| Centene Corp. (a) | 18,920 | 1,610,660 |
| Cigna Corp. | 10,099 | 3,262,583 |
| CVS Health Corp. | 43,455 | 4,115,189 |
| DaVita, Inc. (a) | 1,843 | 134,557 |
| Elevance Health, Inc. | 7,944 | 4,343,541 |
| HCA Healthcare, Inc. | 7,125 | 1,549,474 |
| Henry Schein, Inc. (a) | 4,505 | 308,412 |
| | Shares | Value |
| |
| Health Care Providers & Services (continued) |
| Humana, Inc. | 4,189 | $ 2,337,797 |
| Laboratory Corp. of America Holdings | 2,992 | 663,805 |
| McKesson Corp. | 4,758 | 1,852,623 |
| Molina Healthcare, Inc. (a) | 1,923 | 690,088 |
| Quest Diagnostics, Inc. | 3,860 | 554,489 |
| UnitedHealth Group, Inc. | 30,962 | 17,188,554 |
| Universal Health Services, Inc., Class B | 2,175 | 252,017 |
| | | 40,357,076 |
| Hotels, Restaurants & Leisure 2.0% |
| Booking Holdings, Inc. (a) | 1,314 | 2,456,497 |
| Caesars Entertainment, Inc. (a) | 7,097 | 310,352 |
| Carnival Corp. (a)(b) | 32,673 | 296,017 |
| Chipotle Mexican Grill, Inc. (a) | 919 | 1,376,965 |
| Darden Restaurants, Inc. | 4,057 | 580,719 |
| Domino's Pizza, Inc. | 1,188 | 394,701 |
| Expedia Group, Inc. (a) | 5,032 | 470,341 |
| Hilton Worldwide Holdings, Inc. | 9,079 | 1,228,026 |
| Las Vegas Sands Corp. (a) | 10,876 | 413,397 |
| Marriott International, Inc., Class A | 9,131 | 1,461,964 |
| McDonald's Corp. | 24,353 | 6,640,089 |
| MGM Resorts International | 10,800 | 384,156 |
| Norwegian Cruise Line Holdings Ltd. (a)(b) | 13,948 | 235,582 |
| Royal Caribbean Cruises Ltd. (a) | 7,261 | 387,592 |
| Starbucks Corp. | 37,979 | 3,288,602 |
| Wynn Resorts Ltd. (a) | 3,426 | 218,921 |
| Yum! Brands, Inc. | 9,418 | 1,113,678 |
| | | 21,257,599 |
| Household Durables 0.3% |
| DR Horton, Inc. | 10,467 | 804,703 |
| Garmin Ltd. | 5,107 | 449,620 |
| Lennar Corp., Class A | 8,440 | 681,108 |
| Mohawk Industries, Inc. (a) | 1,745 | 165,339 |
| Newell Brands, Inc. | 12,458 | 172,045 |
| NVR, Inc. (a) | 102 | 432,251 |
| PulteGroup, Inc. | 7,663 | 306,443 |
| Whirlpool Corp. | 1,804 | 249,385 |
| | | 3,260,894 |
| Household Products 1.4% |
| Church & Dwight Co., Inc. | 8,040 | 596,005 |
| Clorox Co. (The) | 4,077 | 595,405 |
| Colgate-Palmolive Co. | 27,610 | 2,038,722 |
| Kimberly-Clark Corp. | 11,175 | 1,390,841 |
| Procter & Gamble Co. (The) | 79,095 | 10,651,724 |
| | | 15,272,697 |
The notes to the financial statements are an integral part of, and should be read in conjunction with, the financial statements.
13
Portfolio of Investments October 31, 2022† (continued)
| | Shares | Value |
| Common Stocks (continued) |
| Independent Power and Renewable Electricity Producers 0.1% |
| AES Corp. (The) | 22,109 | $ 578,371 |
| Industrial Conglomerates 0.9% |
| 3M Co. | 18,325 | 2,305,102 |
| General Electric Co. | 36,296 | 2,824,192 |
| Honeywell International, Inc. | 22,299 | 4,549,442 |
| | | 9,678,736 |
| Insurance 2.3% |
| Aflac, Inc. | 19,034 | 1,239,304 |
| Allstate Corp. (The) | 8,947 | 1,129,559 |
| American International Group, Inc. | 25,170 | 1,434,690 |
| Aon plc, Class A | 6,982 | 1,965,363 |
| Arch Capital Group Ltd. (a) | 3,663 | 210,623 |
| Arthur J. Gallagher & Co. | 6,962 | 1,302,451 |
| Assurant, Inc. | 1,761 | 239,250 |
| Brown & Brown, Inc. | 7,760 | 456,210 |
| Chubb Ltd. | 13,824 | 2,970,639 |
| Cincinnati Financial Corp. | 5,270 | 544,496 |
| Everest Re Group Ltd. | 1,304 | 420,749 |
| Globe Life, Inc. | 2,999 | 346,445 |
| Hartford Financial Services Group, Inc. (The) | 10,696 | 774,497 |
| Lincoln National Corp. | 5,127 | 276,192 |
| Loews Corp. | 6,620 | 377,472 |
| Marsh & McLennan Cos., Inc. | 16,518 | 2,667,492 |
| MetLife, Inc. | 22,177 | 1,623,578 |
| Principal Financial Group, Inc. | 7,672 | 676,133 |
| Progressive Corp. (The) | 19,361 | 2,485,952 |
| Prudential Financial, Inc. | 12,313 | 1,295,205 |
| Travelers Cos., Inc. (The) | 7,855 | 1,448,933 |
| W R Berkley Corp. | 6,761 | 502,883 |
| Willis Towers Watson plc | 3,640 | 794,284 |
| | | 25,182,400 |
| Interactive Media & Services 4.0% |
| Alphabet, Inc. (a) | | |
| Class A | 198,470 | 18,757,400 |
| Class C | 177,478 | 16,800,067 |
| |
| Match Group, Inc. (a) | 9,367 | 404,654 |
| Meta Platforms, Inc., Class A (a) | 75,491 | 7,032,742 |
| | | 42,994,863 |
| Internet & Direct Marketing Retail 2.9% |
| Amazon.com, Inc. (a) | 293,375 | 30,053,335 |
| eBay, Inc. | 18,184 | 724,450 |
| | Shares | Value |
| |
| Internet & Direct Marketing Retail (continued) |
| Etsy, Inc. (a) | 4,191 | $ 393,577 |
| | | 31,171,362 |
| IT Services 4.5% |
| Accenture plc, Class A | 20,938 | 5,944,298 |
| Akamai Technologies, Inc. (a) | 5,262 | 464,792 |
| Automatic Data Processing, Inc. | 13,754 | 3,324,342 |
| Broadridge Financial Solutions, Inc. | 3,880 | 582,233 |
| Cognizant Technology Solutions Corp., Class A | 17,139 | 1,066,903 |
| DXC Technology Co. (a) | 7,609 | 218,759 |
| EPAM Systems, Inc. (a) | 1,899 | 664,650 |
| Fidelity National Information Services, Inc. | 20,124 | 1,670,091 |
| Fiserv, Inc. (a) | 21,170 | 2,175,006 |
| FleetCor Technologies, Inc. (a) | 2,483 | 462,136 |
| Gartner, Inc. (a) | 2,618 | 790,427 |
| Global Payments, Inc. | 9,174 | 1,048,221 |
| International Business Machines Corp. | 29,896 | 4,134,318 |
| Jack Henry & Associates, Inc. | 2,412 | 480,133 |
| Mastercard, Inc., Class A | 28,242 | 9,268,459 |
| Paychex, Inc. | 10,603 | 1,254,441 |
| PayPal Holdings, Inc. (a) | 38,280 | 3,199,442 |
| VeriSign, Inc. (a) | 3,089 | 619,221 |
| Visa, Inc., Class A | 54,120 | 11,211,499 |
| | | 48,579,371 |
| Leisure Products 0.0% ‡ |
| Hasbro, Inc. | 4,297 | 280,379 |
| Life Sciences Tools & Services 1.8% |
| Agilent Technologies, Inc. | 9,887 | 1,367,866 |
| Bio-Rad Laboratories, Inc., Class A (a) | 709 | 249,362 |
| Bio-Techne Corp. | 1,299 | 384,842 |
| Charles River Laboratories International, Inc. (a) | 1,684 | 357,429 |
| Danaher Corp. | 21,671 | 5,453,941 |
| Illumina, Inc. (a) | 5,200 | 1,189,864 |
| IQVIA Holdings, Inc. (a) | 6,173 | 1,294,293 |
| Mettler-Toledo International, Inc. (a) | 745 | 942,373 |
| PerkinElmer, Inc. | 4,178 | 558,097 |
| Thermo Fisher Scientific, Inc. | 12,968 | 6,665,163 |
| Waters Corp. (a) | 1,982 | 592,955 |
| West Pharmaceutical Services, Inc. | 2,451 | 563,975 |
| | | 19,620,160 |
| Machinery 1.8% |
| Caterpillar, Inc. | 17,474 | 3,782,422 |
| Cummins, Inc. | 4,667 | 1,141,128 |
The notes to the financial statements are an integral part of, and should be read in conjunction with, the financial statements.
| 14 | MainStay S&P 500 Index Fund |
| | Shares | Value |
| Common Stocks (continued) |
| Machinery (continued) |
| Deere & Co. | 9,206 | $ 3,643,919 |
| Dover Corp. | 4,752 | 621,039 |
| Fortive Corp. | 11,774 | 752,359 |
| IDEX Corp. | 2,498 | 555,330 |
| Illinois Tool Works, Inc. | 9,326 | 1,991,381 |
| Ingersoll Rand, Inc. | 13,345 | 673,922 |
| Nordson Corp. | 1,789 | 402,525 |
| Otis Worldwide Corp. | 13,910 | 982,602 |
| PACCAR, Inc. | 11,510 | 1,114,513 |
| Parker-Hannifin Corp. | 4,249 | 1,234,844 |
| Pentair plc | 5,444 | 233,820 |
| Snap-on, Inc. | 1,763 | 391,474 |
| Stanley Black & Decker, Inc. | 4,893 | 384,052 |
| Westinghouse Air Brake Technologies Corp. | 6,020 | 561,546 |
| Xylem, Inc. | 5,964 | 610,893 |
| | | 19,077,769 |
| Media 0.7% |
| Charter Communications, Inc., Class A (a) | 3,669 | 1,348,798 |
| Comcast Corp., Class A | 145,767 | 4,626,644 |
| DISH Network Corp., Class A (a) | 8,308 | 123,872 |
| Fox Corp. | | |
| Class A | 10,145 | 292,886 |
| Class B | 4,658 | 126,698 |
| |
| Interpublic Group of Cos., Inc. (The) | 12,943 | 385,572 |
| News Corp. | | |
| Class A | 12,763 | 215,312 |
| Class B | 3,954 | 67,732 |
| |
| Omnicom Group, Inc. | 6,780 | 493,245 |
| Paramount Global, Class B (b) | 16,715 | 306,219 |
| | | 7,986,978 |
| Metals & Mining 0.3% |
| Freeport-McMoRan, Inc. | 47,334 | 1,500,014 |
| Newmont Corp. | 26,271 | 1,111,789 |
| Nucor Corp. | 8,665 | 1,138,408 |
| | | 3,750,211 |
| Multiline Retail 0.5% |
| Dollar General Corp. | 7,514 | 1,916,446 |
| Dollar Tree, Inc. (a) | 6,987 | 1,107,439 |
| Target Corp. | 15,349 | 2,521,073 |
| | | 5,544,958 |
| Multi-Utilities 0.9% |
| Ameren Corp. | 8,552 | 697,159 |
| | Shares | Value |
| |
| Multi-Utilities (continued) |
| CenterPoint Energy, Inc. | 20,837 | $ 596,147 |
| CMS Energy Corp. | 9,606 | 548,022 |
| Consolidated Edison, Inc. | 11,737 | 1,032,386 |
| Dominion Energy, Inc. | 27,556 | 1,928,093 |
| DTE Energy Co. | 6,413 | 718,961 |
| NiSource, Inc. | 13,437 | 345,197 |
| Public Service Enterprise Group, Inc. | 16,512 | 925,828 |
| Sempra Energy | 10,404 | 1,570,380 |
| WEC Energy Group, Inc. | 10,441 | 953,577 |
| | | 9,315,750 |
| Oil, Gas & Consumable Fuels 4.9% |
| APA Corp. | 10,808 | 491,332 |
| Chevron Corp. | 59,609 | 10,783,268 |
| ConocoPhillips | 42,138 | 5,313,180 |
| Coterra Energy, Inc. | 26,335 | 819,809 |
| Devon Energy Corp. | 21,674 | 1,676,484 |
| Diamondback Energy, Inc. | 5,884 | 924,435 |
| EOG Resources, Inc. | 19,398 | 2,648,215 |
| EQT Corp. | 12,233 | 511,829 |
| Exxon Mobil Corp. | 137,950 | 15,286,239 |
| Hess Corp. | 9,224 | 1,301,322 |
| Kinder Morgan, Inc. | 65,626 | 1,189,143 |
| Marathon Oil Corp. | 22,428 | 682,933 |
| Marathon Petroleum Corp. | 16,505 | 1,875,298 |
| Occidental Petroleum Corp. | 24,666 | 1,790,752 |
| ONEOK, Inc. | 14,791 | 877,402 |
| Phillips 66 | 15,923 | 1,660,610 |
| Pioneer Natural Resources Co. | 7,900 | 2,025,639 |
| Targa Resources Corp. | 7,552 | 516,330 |
| Valero Energy Corp. | 13,041 | 1,637,297 |
| Williams Cos., Inc. (The) | 40,334 | 1,320,132 |
| | | 53,331,649 |
| Personal Products 0.1% |
| Estee Lauder Cos., Inc. (The), Class A | 7,673 | 1,538,360 |
| Pharmaceuticals 4.7% |
| Bristol-Myers Squibb Co. | 70,678 | 5,475,425 |
| Catalent, Inc. (a) | 5,932 | 389,910 |
| Eli Lilly and Co. | 26,104 | 9,451,997 |
| Johnson & Johnson | 87,027 | 15,140,087 |
| Merck & Co., Inc. | 83,853 | 8,485,924 |
| Organon & Co. | 8,418 | 220,383 |
| Pfizer, Inc. | 185,771 | 8,647,640 |
| Viatris, Inc. | 40,137 | 406,588 |
| Zoetis, Inc. | 15,496 | 2,336,487 |
| | | 50,554,441 |
The notes to the financial statements are an integral part of, and should be read in conjunction with, the financial statements.
15
Portfolio of Investments October 31, 2022† (continued)
| | Shares | Value |
| Common Stocks (continued) |
| Professional Services 0.4% |
| CoStar Group, Inc. (a) | 13,106 | $ 1,084,128 |
| Equifax, Inc. | 4,051 | 686,807 |
| Jacobs Solutions, Inc. | 4,224 | 486,689 |
| Leidos Holdings, Inc. | 4,520 | 459,187 |
| Robert Half International, Inc. | 3,627 | 277,320 |
| Verisk Analytics, Inc. | 5,195 | 949,802 |
| | | 3,943,933 |
| Real Estate Management & Development 0.1% |
| CBRE Group, Inc., Class A (a) | 10,631 | 754,163 |
| Road & Rail 0.9% |
| CSX Corp. | 70,876 | 2,059,657 |
| JB Hunt Transport Services, Inc. | 2,749 | 470,272 |
| Norfolk Southern Corp. | 7,774 | 1,773,016 |
| Old Dominion Freight Line, Inc. | 3,034 | 833,136 |
| Union Pacific Corp. | 20,671 | 4,075,081 |
| | | 9,211,162 |
| Semiconductors & Semiconductor Equipment 4.7% |
| Advanced Micro Devices, Inc. (a) | 53,435 | 3,209,306 |
| Analog Devices, Inc. | 17,206 | 2,453,920 |
| Applied Materials, Inc. | 28,796 | 2,542,399 |
| Broadcom, Inc. | 13,367 | 6,284,094 |
| Enphase Energy, Inc. (a) | 4,484 | 1,376,588 |
| Intel Corp. | 135,910 | 3,863,921 |
| KLA Corp. | 4,694 | 1,485,416 |
| Lam Research Corp. | 4,534 | 1,835,273 |
| Microchip Technology, Inc. | 18,287 | 1,129,039 |
| Micron Technology, Inc. | 36,515 | 1,975,462 |
| Monolithic Power Systems, Inc. | 1,471 | 499,331 |
| NVIDIA Corp. | 82,884 | 11,186,853 |
| NXP Semiconductors NV | 8,692 | 1,269,727 |
| ON Semiconductor Corp. (a) | 14,340 | 880,906 |
| Qorvo, Inc. (a) | 3,416 | 294,049 |
| QUALCOMM, Inc. | 37,172 | 4,373,658 |
| Skyworks Solutions, Inc. | 5,311 | 456,799 |
| SolarEdge Technologies, Inc. (a) | 1,842 | 423,715 |
| Teradyne, Inc. | 5,190 | 422,207 |
| Texas Instruments, Inc. | 30,244 | 4,858,094 |
| | | 50,820,757 |
| Software 8.2% |
| Adobe, Inc. (a) | 15,491 | 4,933,883 |
| ANSYS, Inc. (a) | 2,882 | 637,383 |
| Autodesk, Inc. (a) | 7,192 | 1,541,246 |
| Cadence Design Systems, Inc. (a) | 9,065 | 1,372,350 |
| | Shares | Value |
| |
| Software (continued) |
| Ceridian HCM Holding, Inc. (a) | 5,066 | $ 335,318 |
| Fortinet, Inc. (a) | 21,663 | 1,238,257 |
| Intuit, Inc. | 9,337 | 3,991,567 |
| Microsoft Corp. | 246,859 | 57,303,380 |
| NortonLifeLock, Inc. | 19,598 | 441,543 |
| Oracle Corp. | 50,280 | 3,925,360 |
| Paycom Software, Inc. (a) | 1,609 | 556,714 |
| PTC, Inc. (a) | 3,499 | 412,287 |
| Roper Technologies, Inc. | 3,509 | 1,454,621 |
| Salesforce, Inc. (a) | 32,935 | 5,354,902 |
| ServiceNow, Inc. (a) | 6,686 | 2,813,068 |
| Synopsys, Inc. (a) | 5,063 | 1,481,181 |
| Tyler Technologies, Inc. (a) | 1,376 | 444,902 |
| | | 88,237,962 |
| Specialty Retail 2.3% |
| Advance Auto Parts, Inc. | 2,007 | 381,169 |
| AutoZone, Inc. (a) | 645 | 1,633,708 |
| Bath & Body Works, Inc. | 7,557 | 252,253 |
| Best Buy Co., Inc. | 6,633 | 453,763 |
| CarMax, Inc. (a) | 5,268 | 331,937 |
| Home Depot, Inc. (The) | 34,019 | 10,074,046 |
| Lowe's Cos., Inc. | 21,155 | 4,124,167 |
| O'Reilly Automotive, Inc. (a) | 2,110 | 1,766,429 |
| Ross Stores, Inc. | 11,583 | 1,108,377 |
| TJX Cos., Inc. (The) | 38,782 | 2,796,182 |
| Tractor Supply Co. | 3,674 | 807,435 |
| Ulta Beauty, Inc. (a) | 1,715 | 719,220 |
| | | 24,448,686 |
| Technology Hardware, Storage & Peripherals 7.3% |
| Apple, Inc. (c) | 500,031 | 76,674,754 |
| Hewlett Packard Enterprise Co. | 43,008 | 613,724 |
| HP, Inc. | 30,123 | 831,997 |
| NetApp, Inc. | 7,273 | 503,801 |
| Seagate Technology Holdings plc | 6,465 | 321,052 |
| Western Digital Corp. (a) | 10,366 | 356,279 |
| | | 79,301,607 |
| Textiles, Apparel & Luxury Goods 0.4% |
| NIKE, Inc., Class B | 41,827 | 3,876,526 |
| Ralph Lauren Corp. | 1,420 | 131,620 |
| Tapestry, Inc. | 8,335 | 264,053 |
| VF Corp. | 10,930 | 308,772 |
| | | 4,580,971 |
| Tobacco 0.7% |
| Altria Group, Inc. | 59,608 | 2,758,062 |
The notes to the financial statements are an integral part of, and should be read in conjunction with, the financial statements.
| 16 | MainStay S&P 500 Index Fund |
| | Shares | Value |
| Common Stocks (continued) |
| Tobacco (continued) |
| Philip Morris International, Inc. | 51,311 | $ 4,712,916 |
| | | 7,470,978 |
| Trading Companies & Distributors 0.2% |
| Fastenal Co. | 19,022 | 919,333 |
| United Rentals, Inc. (a) | 2,317 | 731,500 |
| WW Grainger, Inc. | 1,499 | 875,941 |
| | | 2,526,774 |
| Water Utilities 0.1% |
| American Water Works Co., Inc. | 6,017 | 874,511 |
| Wireless Telecommunication Services 0.3% |
| T-Mobile US, Inc. (a) | 19,924 | 3,019,681 |
Total Common Stocks (d)
(Cost $253,996,792) | | 1,076,556,604 |
| |
| Short-Term Investments 0.4% |
| Affiliated Investment Company 0.0% ‡ |
| MainStay U.S. Government Liquidity Fund, 2.905% (e) | 20,643 | 20,643 |
| Unaffiliated Investment Company 0.0% ‡ |
| Invesco Government & Agency Portfolio, 3.163% (e)(f) | 465,920 | 465,920 |
| |
| | Principal
Amount | | Value |
| U.S. Treasury Debt 0.4% |
| U.S. Treasury Bills | | | |
| 3.077%, due 12/15/22 (c)(g) | $ 4,400,000 | | $ 4,381,191 |
Total Short-Term Investments
(Cost $4,870,145) | | | 4,867,754 |
Total Investments
(Cost $258,866,937) | 99.9% | | 1,081,424,358 |
| Other Assets, Less Liabilities | 0.1 | | 880,353 |
| Net Assets | 100.0% | | $ 1,082,304,711 |
| † | Percentages indicated are based on Fund net assets. |
| ‡ | Less than one-tenth of a percent. |
| (a) | Non-income producing security. |
| (b) | All or a portion of this security was held on loan. As of October 31, 2022, the aggregate market value of securities on loan was $440,429. The Fund received cash collateral with a value of $465,920. (See Note 2(H)) |
| (c) | Represents a security, or portion thereof, which was maintained at the broker as collateral for futures contracts. |
| (d) | The combined market value of common stocks and notional value of Standard & Poor’s 500 Index futures contracts represents 100.0% of the Fund’s net assets. |
| (e) | Current yield as of October 31, 2022. |
| (f) | Represents a security purchased with cash collateral received for securities on loan. |
| (g) | Interest rate shown represents yield to maturity. |
Investments in Affiliates (in 000's)
Investments in issuers considered to be affiliate(s) of the Fund during the year ended October 31, 2022 for purposes of Section 2(a)(3) of the Investment Company Act of 1940, as amended, were as follows:
| Affiliated Investment Companies | Value,
Beginning
of Year | Purchases
at Cost | Proceeds
from
Sales | Net
Realized
Gain/(Loss)
on Sales | Change in
Unrealized
Appreciation/
(Depreciation) | Value,
End of
Year | Dividend
Income | Other
Distributions | Shares
End of
Year |
| MainStay U.S. Government Liquidity Fund | $ 106 | $ 18,860 | $ (18,945) | $ — | $ — | $ 21 | $ 1 | $ — | 21 |
Futures Contracts
As of October 31, 2022, the Fund held the following futures contracts:
| Type | Number of
Contracts | Expiration
Date | Value at
Trade Date | Current
Notional
Amount | Unrealized
Appreciation
(Depreciation)1 |
| Long Contracts | | | | | |
| S&P 500 E-Mini Index | 27 | December 2022 | $ 5,107,571 | $ 5,242,050 | $ 134,479 |
| 1. | Represents the difference between the value of the contracts at the time they were opened and the value as of October 31, 2022. |
The notes to the financial statements are an integral part of, and should be read in conjunction with, the financial statements.
17
Portfolio of Investments October 31, 2022† (continued)
The following is a summary of the fair valuations according to the inputs used as of October 31, 2022, for valuing the Fund’s assets:
| Description | Quoted
Prices in
Active
Markets for
Identical
Assets
(Level 1) | | Significant
Other
Observable
Inputs
(Level 2) | | Significant
Unobservable
Inputs
(Level 3) | | Total |
| Asset Valuation Inputs | | | | | | | |
| Investments in Securities (a) | | | | | | | |
| Common Stocks | $ 1,076,556,604 | | $ — | | $ — | | $ 1,076,556,604 |
| Short-Term Investments | | | | | | | |
| Affiliated Investment Company | 20,643 | | — | | — | | 20,643 |
| Unaffiliated Investment Company | 465,920 | | — | | — | | 465,920 |
| U.S. Treasury Debt | — | | 4,381,191 | | — | | 4,381,191 |
| Total Short-Term Investments | 486,563 | | 4,381,191 | | — | | 4,867,754 |
| Total Investments in Securities | 1,077,043,167 | | 4,381,191 | | — | | 1,081,424,358 |
| Other Financial Instruments | | | | | | | |
| Futures Contracts (b) | 134,479 | | — | | — | | 134,479 |
| Total Investments in Securities and Other Financial Instruments | $ 1,077,177,646 | | $ 4,381,191 | | $ — | | $ 1,081,558,837 |
| (a) | For a complete listing of investments and their industries, see the Portfolio of Investments. |
| (b) | The value listed for these securities reflects unrealized appreciation (depreciation) as shown on the Portfolio of Investments. |
The notes to the financial statements are an integral part of, and should be read in conjunction with, the financial statements.
| 18 | MainStay S&P 500 Index Fund |
Statement of Assets and Liabilities as of October 31, 2022
| Assets |
Investment in unaffiliated securities, at value
(identified cost $258,846,294) including securities on loan of $440,429 | $1,081,403,715 |
Investment in affiliated investment companies, at value
(identified cost $20,643) | 20,643 |
| Cash | 1,355,355 |
| Receivables: | |
| Dividends | 791,036 |
| Fund shares sold | 447,091 |
| Securities lending | 176 |
| Other assets | 2,284 |
| Total assets | 1,084,020,300 |
| Liabilities |
| Cash collateral received for securities on loan | 465,920 |
| Payables: | |
| Fund shares redeemed | 472,046 |
| Investment securities purchased | 210,686 |
| NYLIFE Distributors (See Note 3) | 165,016 |
| Transfer agent (See Note 3) | 162,494 |
| Manager (See Note 3) | 137,696 |
| Variation margin on futures contracts | 32,595 |
| Shareholder communication | 29,135 |
| Professional fees | 22,166 |
| Custodian | 14,204 |
| Accrued expenses | 3,631 |
| Total liabilities | 1,715,589 |
| Net assets | $1,082,304,711 |
| Composition of Net Assets |
| Shares of beneficial interest outstanding (par value of $.001 per share) unlimited number of shares authorized | $ 22,183 |
| Additional paid-in-capital | 163,889,926 |
| | 163,912,109 |
| Total distributable earnings (loss) | 918,392,602 |
| Net assets | $1,082,304,711 |
| Class A | |
| Net assets applicable to outstanding shares | $763,995,558 |
| Shares of beneficial interest outstanding | 15,739,643 |
| Net asset value per share outstanding | $ 48.54 |
| Maximum sales charge (1.50% of offering price) | 0.74 |
| Maximum offering price per share outstanding | $ 49.28 |
| Investor Class | |
| Net assets applicable to outstanding shares | $ 45,101,564 |
| Shares of beneficial interest outstanding | 932,061 |
| Net asset value per share outstanding | $ 48.39 |
| Maximum sales charge (1.00% of offering price) | 0.49 |
| Maximum offering price per share outstanding | $ 48.88 |
| Class I | |
| Net assets applicable to outstanding shares | $273,022,302 |
| Shares of beneficial interest outstanding | 5,506,972 |
| Net asset value and offering price per share outstanding | $ 49.58 |
| SIMPLE Class | |
| Net assets applicable to outstanding shares | $ 185,287 |
| Shares of beneficial interest outstanding | 3,826 |
| Net asset value and offering price per share outstanding | $ 48.43 |
The notes to the financial statements are an integral part of, and should be read in conjunction with, the financial statements.
19
Statement of Operations for the year ended October 31, 2022
| Investment Income (Loss) |
| Income | |
| Dividends-unaffiliated (net of foreign tax withholding of $4,173) | $ 18,320,955 |
| Interest | 86,802 |
| Securities lending, net | 18,280 |
| Dividends-affiliated | 1,377 |
| Total income | 18,427,414 |
| Expenses | |
| Distribution/Service—Class A (See Note 3) | 2,088,154 |
| Distribution/Service—Investor Class (See Note 3) | 125,728 |
| Distribution/Service—SIMPLE Class (See Note 3) | 666 |
| Manager (See Note 3) | 1,962,897 |
| Transfer agent (See Note 3) | 900,843 |
| Professional fees | 133,395 |
| Registration | 84,949 |
| Custodian | 42,951 |
| Shareholder communication | 31,936 |
| Trustees | 25,272 |
| Miscellaneous | 218,936 |
| Total expenses before waiver/reimbursement | 5,615,727 |
| Expense waiver/reimbursement from Manager (See Note 3) | (46,136) |
| Net expenses | 5,569,591 |
| Net investment income (loss) | 12,857,823 |
| Realized and Unrealized Gain (Loss) |
| Net realized gain (loss) on: | |
| Unaffiliated investment transactions | 97,900,252 |
| Futures transactions | (2,397,012) |
| Net realized gain (loss) | 95,503,240 |
| Net change in unrealized appreciation (depreciation) on: | |
| Unaffiliated investments | (304,418,597) |
| Futures contracts | (9,824) |
| Net change in unrealized appreciation (depreciation) | (304,428,421) |
| Net realized and unrealized gain (loss) | (208,925,181) |
| Net increase (decrease) in net assets resulting from operations | $(196,067,358) |
The notes to the financial statements are an integral part of, and should be read in conjunction with, the financial statements.
| 20 | MainStay S&P 500 Index Fund |
Statements of Changes in Net Assets
for the years ended October 31, 2022 and October 31, 2021
| | 2022 | 2021 |
| Increase (Decrease) in Net Assets |
| Operations: | | |
| Net investment income (loss) | $ 12,857,823 | $ 13,729,351 |
| Net realized gain (loss) | 95,503,240 | 52,080,324 |
| Net change in unrealized appreciation (depreciation) | (304,428,421) | 391,282,536 |
| Net increase (decrease) in net assets resulting from operations | (196,067,358) | 457,092,211 |
| Distributions to shareholders: | | |
| Class A | (39,561,389) | (56,038,250) |
| Investor Class | (2,447,460) | (5,128,675) |
| Class I | (21,892,265) | (41,144,122) |
| SIMPLE Class | (2,833) | (1,984) |
| Total distributions to shareholders | (63,903,947) | (102,313,031) |
| Capital share transactions: | | |
| Net proceeds from sales of shares | 141,247,690 | 218,385,665 |
| Net asset value of shares issued to shareholders in reinvestment of distributions | 62,992,377 | 101,126,869 |
| Cost of shares redeemed | (298,133,932) | (332,173,529) |
| Increase (decrease) in net assets derived from capital share transactions | (93,893,865) | (12,660,995) |
| Net increase (decrease) in net assets | (353,865,170) | 342,118,185 |
| Net Assets |
| Beginning of year | 1,436,169,881 | 1,094,051,696 |
| End of year | $1,082,304,711 | $1,436,169,881 |
The notes to the financial statements are an integral part of, and should be read in conjunction with, the financial statements.
21
Financial Highlights selected per share data and ratios
| | Year Ended October 31, |
| Class A | 2022 | | 2021 | | 2020 | | 2019 | | 2018 |
| Net asset value at beginning of year | $ 59.77 | | $ 45.82 | | $ 49.60 | | $ 49.27 | | $ 53.27 |
| Net investment income (loss) (a) | 0.52 | | 0.49 | | 0.58 | | 0.67 | | 0.69 |
| Net realized and unrealized gain (loss) | (9.12) | | 17.71 | | 3.44 | | 5.52 | | 2.61 |
| Total from investment operations | (8.60) | | 18.20 | | 4.02 | | 6.19 | | 3.30 |
| Less distributions: | | | | | | | | | |
| From net investment income | (0.53) | | (0.55) | | (0.91) | | (0.77) | | (0.79) |
| From net realized gain on investments | (2.10) | | (3.70) | | (6.89) | | (5.09) | | (6.51) |
| Total distributions | (2.63) | | (4.25) | | (7.80) | | (5.86) | | (7.30) |
| Net asset value at end of year | $ 48.54 | | $ 59.77 | | $ 45.82 | | $ 49.60 | | $ 49.27 |
| Total investment return (b) | (15.03)% | | 42.19% | | 9.21% | | 13.80% | | 6.77% |
| Ratios (to average net assets)/Supplemental Data: | | | | | | | | | |
| Net investment income (loss) | 0.99% | | 0.92% | | 1.32% | | 1.44% | | 1.39% |
| Net expenses (c) | 0.52% | | 0.50% | | 0.54% | | 0.54% | | 0.54% |
| Expenses (before waiver/reimbursement) (c) | 0.52% | | 0.50% | | 0.54% | | 0.54% | | 0.54% |
| Portfolio turnover rate | 2% | | 5% | | 15% | | 3% | | 3% |
| Net assets at end of year (in 000’s) | $ 763,996 | | $ 894,565 | | $ 602,036 | | $ 559,780 | | $ 511,043 |
| (a) | Per share data based on average shares outstanding during the year. |
| (b) | Total investment return is calculated exclusive of sales charges and assumes the reinvestment of dividends and distributions. For periods of less than one year, total return is not annualized. |
| (c) | In addition to the fees and expenses which the Fund bears directly, it also indirectly bears a pro-rata share of the fees and expenses of the underlying funds in which it invests. Such indirect expenses are not included in the above expense ratios. |
| | Year Ended October 31, |
| Investor Class | 2022 | | 2021 | | 2020 | | 2019 | | 2018 |
| Net asset value at beginning of year | $ 59.55 | | $ 45.68 | | $ 49.50 | | $ 49.18 | | $ 53.18 |
| Net investment income (loss) (a) | 0.43 | | 0.40 | | 0.51 | | 0.59 | | 0.62 |
| Net realized and unrealized gain (loss) | (9.10) | | 17.63 | | 3.43 | | 5.52 | | 2.58 |
| Total from investment operations | (8.67) | | 18.03 | | 3.94 | | 6.11 | | 3.20 |
| Less distributions: | | | | | | | | | |
| From net investment income | (0.39) | | (0.46) | | (0.87) | | (0.70) | | (0.69) |
| From net realized gain on investments | (2.10) | | (3.70) | | (6.89) | | (5.09) | | (6.51) |
| Total distributions | (2.49) | | (4.16) | | (7.76) | | (5.79) | | (7.20) |
| Net asset value at end of year | $ 48.39 | | $ 59.55 | | $ 45.68 | | $ 49.50 | | $ 49.18 |
| Total investment return (b) | (15.18)% | | 41.89% | | 9.03% | | 13.62% | | 6.58% |
| Ratios (to average net assets)/Supplemental Data: | | | | | | | | | |
| Net investment income (loss) | 0.80% | | 0.75% | | 1.16% | | 1.26% | | 1.23% |
| Net expenses (c) | 0.70% | | 0.70% | | 0.70% | | 0.70% | | 0.70% |
| Expenses (before waiver/reimbursement) (c) | 0.79% | | 0.82% | | 0.88% | | 0.89% | | 0.87% |
| Portfolio turnover rate | 2% | | 5% | | 15% | | 3% | | 3% |
| Net assets at end of year (in 000's) | $ 45,102 | | $ 58,363 | | $ 55,546 | | $ 54,505 | | $ 41,907 |
| (a) | Per share data based on average shares outstanding during the year. |
| (b) | Total investment return is calculated exclusive of sales charges and assumes the reinvestment of dividends and distributions. For periods of less than one year, total return is not annualized. |
| (c) | In addition to the fees and expenses which the Fund bears directly, it also indirectly bears a pro-rata share of the fees and expenses of the underlying funds in which it invests. Such indirect expenses are not included in the above expense ratios. |
The notes to the financial statements are an integral part of, and should be read in conjunction with, the financial statements.
| 22 | MainStay S&P 500 Index Fund |
Financial Highlights selected per share data and ratios
| | Year Ended October 31, |
| Class I | 2022 | | 2021 | | 2020 | | 2019 | | 2018 |
| Net asset value at beginning of year | $ 60.97 | | $ 46.66 | | $ 50.38 | | $ 49.97 | | $ 53.93 |
| Net investment income (loss) (a) | 0.67 | | 0.64 | | 0.70 | | 0.81 | | 0.83 |
| Net realized and unrealized gain (loss) | (9.30) | | 18.03 | | 3.50 | | 5.59 | | 2.64 |
| Total from investment operations | (8.63) | | 18.67 | | 4.20 | | 6.40 | | 3.47 |
| Less distributions: | | | | | | | | | |
| From net investment income | (0.66) | | (0.66) | | (1.03) | | (0.90) | | (0.92) |
| From net realized gain on investments | (2.10) | | (3.70) | | (6.89) | | (5.09) | | (6.51) |
| Total distributions | (2.76) | | (4.36) | | (7.92) | | (5.99) | | (7.43) |
| Net asset value at end of year | $ 49.58 | | $ 60.97 | | $ 46.66 | | $ 50.38 | | $ 49.97 |
| Total investment return (b) | (14.82)% | | 42.56% | | 9.47% | | 14.08% | | 7.05% |
| Ratios (to average net assets)/Supplemental Data: | | | | | | | | | |
| Net investment income (loss) | 1.23% | | 1.19% | | 1.56% | | 1.74% | | 1.64% |
| Net expenses (c) | 0.26% | | 0.25% | | 0.29% | | 0.29% | | 0.29% |
| Expenses (before waiver/reimbursement) (c) | 0.26% | | 0.25% | | 0.29% | | 0.29% | | 0.29% |
| Portfolio turnover rate | 2% | | 5% | | 15% | | 3% | | 3% |
| Net assets at end of year (in 000’s) | $ 273,022 | | $ 483,174 | | $ 436,446 | | $ 399,842 | | $ 592,457 |
| (a) | Per share data based on average shares outstanding during the year. |
| (b) | Total investment return is calculated exclusive of sales charges and assumes the reinvestment of dividends and distributions. Class I shares are not subject to sales charges. For periods of less than one year, total return is not annualized. |
| (c) | In addition to the fees and expenses which the Fund bears directly, it also indirectly bears a pro-rata share of the fees and expenses of the underlying funds in which it invests. Such indirect expenses are not included in the above expense ratios. |
| | Year Ended October 31, | | August 31, 2020^ through
October 31, |
| SIMPLE Class | 2022 | | 2021 | | 2020 |
| Net asset value at beginning of period | $ 59.73 | | $ 45.65 | | $ 48.83* |
| Net investment income (loss) (a) | 0.29 | | 0.21 | | 0.02 |
| Net realized and unrealized gain (loss) | (9.11) | | 17.74 | | (3.20) |
| Total from investment operations | (8.82) | | 17.95 | | (3.18) |
| Less distributions: | | | | | |
| From net investment income | (0.38) | | (0.17) | | — |
| From net realized gain on investments | (2.10) | | (3.70) | | — |
| Total distributions | (2.48) | | (3.87) | | — |
| Net asset value at end of period | $ 48.43 | | $ 59.73 | | $ 45.65 |
| Total investment return (b) | (15.39)% | | 41.54% | | (6.51)% |
| Ratios (to average net assets)/Supplemental Data: | | | | | |
| Net investment income (loss) | 0.56% | | 0.39% | | 0.30%†† |
| Net expenses (c) | 0.95% | | 0.95% | | 0.95%†† |
| Expenses (before waiver/reimbursement) (c) | 1.04% | | 1.06% | | 1.15%†† |
| Portfolio turnover rate | 2% | | 5% | | 15% |
| Net assets at end of period (in 000’s) | $ 185 | | $ 68 | | $ 23 |
| ^ | Inception date. |
| * | Based on the net asset value of Investor Class as of August 31, 2020. |
| †† | Annualized. |
| (a) | Per share data based on average shares outstanding during the period. |
| (b) | Total investment return is calculated exclusive of sales charges and assumes the reinvestment of dividends and distributions. SIMPLE Class shares are not subject to sales charges. For periods of less than one year, total return is not annualized. |
| (c) | In addition to the fees and expenses which the Fund bears directly, it also indirectly bears a pro-rata share of the fees and expenses of the underlying funds in which it invests. Such indirect expenses are not included in the above expense ratios. |
The notes to the financial statements are an integral part of, and should be read in conjunction with, the financial statements.
23
Notes to Financial Statements
Note 1-Organization and Business
MainStay Funds Trust (the “Trust”) was organized as a Delaware statutory trust on April 28, 2009. The Trust is registered under the Investment Company Act of 1940, as amended (the “1940 Act”), as an open-end management investment company, and is comprised of thirty-three funds (collectively referred to as the “Funds”). These financial statements and notes relate to the MainStay S&P 500 Index Fund (formerly known as MainStay MacKay S&P 500 Index Fund) (the "Fund"), a “diversified” fund, as that term is defined in the 1940 Act, as interpreted or modified by regulatory authorities having jurisdiction, from time to time.
The following table lists the Fund's share classes that have been registered and commenced operations:
| Class | Commenced Operations |
| Class A | January 2, 2004 |
| Investor Class | February 28, 2008 |
| Class I | January 2, 1991 |
| SIMPLE Class | August 31, 2020 |
| Class R6 | N/A* |
| * | Class R6 shares were registered for sale effective as of February 28, 2017 but have not yet commenced operations. |
Class A and Investor Class shares are offered at net asset value (“NAV”) per share plus an initial sales charge. No initial sales charge applies to investments of $1 million or more (and certain other qualified purchases) in Class A and Investor Class shares. However, a contingent deferred sales charge (“CDSC”) of 1.00% may be imposed on certain redemptions made within 18 months of the date of purchase on shares that were purchased without an initial sales charge. Class I and SIMPLE Class shares are offered at NAV without a sales charge. Class R6 shares are expected to be offered at NAV without a sales charge if such shares are offered in the future. Investor Class shares may convert automatically to Class A shares. SIMPLE Class shares convert to Class A shares, or Investor Class shares if you are not eligible to hold Class A shares, at the end of the calendar quarter, ten years after the date they were purchased. Share class conversions are based on the relevant NAVs of the two classes at the time of the conversion, and no sales load or other charge is imposed. Under certain circumstances and as may be permitted by the Trust’s multiple class plan pursuant to Rule 18f-3 under the 1940 Act, specified share classes of the Fund may be converted to one or more other share classes of the Fund as disclosed in the capital share transactions within these Notes. The classes of shares have the same voting (except for issues that relate solely to one class), dividend, liquidation and other rights, and the same terms and conditions, except that under distribution plans pursuant to Rule 12b-1 under the 1940 Act, Class A, Investor Class and SIMPLE Class shares are subject to a distribution and/or service fee. Class I and Class R6 shares are not subject to a distribution and/or service fee.
The Fund's investment objective is to seek investment results that correspond to the total return performance (reflecting reinvestment of
dividends) of common stocks in the aggregate, as represented by the S&P 500® Index.
Note 2–Significant Accounting Policies
The Fund is an investment company and accordingly follows the investment company accounting and reporting guidance of the Financial Accounting Standards Board (“FASB”) Accounting Standards Codification Topic 946 Financial Services—Investment Companies. The Fund prepares its financial statements in accordance with generally accepted accounting principles (“GAAP”) in the United States of America and follows the significant accounting policies described below.
(A) Securities Valuation. Investments are usually valued as of the close of regular trading on the New York Stock Exchange (the "Exchange") (usually 4:00 p.m. Eastern time) on each day the Fund is open for business ("valuation date").
Effective September 8, 2022, and pursuant to Rule 2a-5 under the 1940 Act, the Board of Trustees of the Trust (the "Board") designated New York Life Investment Management LLC (“New York Life Investments” or the "Manager") as its Valuation Designee (the "Valuation Designee"). The Valuation Designee is responsible for performing fair valuations relating to all investments in the Fund’s portfolio for which market quotations are not readily available; periodically assessing and managing material valuation risks; establishing and applying fair value methodologies; testing fair valuation methodologies; evaluating and overseeing pricing services; segregation of valuation and portfolio management functions; providing quarterly, annual and prompt reporting to the Board, as appropriate; identifying potential conflicts of interest; and maintaining appropriate records. The Valuation Designee has established a valuation committee ("Valuation Committee") to assist in carrying out the Valuation Designee’s responsibilities and establish prices of securities for which market quotations are not readily available. The Fund’s and the Valuation Designee's policies and procedures ("Valuation Procedures") govern the Valuation Designee’s selection and application of methodologies for determining and calculating the fair value of Fund investments. The Valuation Designee may value Fund portfolio securities for which market quotations are not readily available and other Fund assets utilizing inputs from pricing services and other third-party sources (together, “Pricing Sources”). The Valuation Committee meets (in person, via electronic mail or via teleconference) on an ad-hoc basis to determine fair valuations and on a quarterly basis to review fair value events (excluding fair valuations from pricing services), including valuation risks and back-testing results, and preview reports to the Board.
The Valuation Committee establishes prices of securities for which market quotations are not readily available based on such methodologies and measurements on a regular basis after considering information that is reasonably available and deemed relevant by the Valuation Committee. The Board shall oversee the Valuation Designee and review fair valuation materials on a prompt, quarterly and annual basis and approve proposed revisions to the Valuation Procedures.
| 24 | MainStay S&P 500 Index Fund |
Investments for which market quotations are not readily available are valued at fair value as determined in good faith pursuant to the Valuation Procedures. A market quotation is readily available only when that quotation is a quoted price (unadjusted) in active markets for identical investments that the Fund can access at the measurement date, provided that a quotation will not be readily available if it is not reliable. Fair value measurements are determined within a framework that establishes a three-tier hierarchy that maximizes the use of observable market data and minimizes the use of unobservable inputs to establish a classification of fair value measurements for disclosure purposes. "Inputs" refer broadly to the assumptions that market participants would use in pricing the asset or liability, including assumptions about risk, such as the risk inherent in a particular valuation technique used to measure fair value using a pricing model and/or the risk inherent in the inputs for the valuation technique. Inputs may be observable or unobservable. Observable inputs reflect the assumptions market participants would use in pricing the asset or liability based on market data obtained from sources independent of the Fund. Unobservable inputs reflect the Fund’s own assumptions about the assumptions market participants would use in pricing the asset or liability based on the information available. The inputs or methodology used for valuing assets or liabilities may not be an indication of the risks associated with investing in those assets or liabilities. The three-tier hierarchy of inputs is summarized below.
| • | Level 1—quoted prices (unadjusted) in active markets for an identical asset or liability |
| • | Level 2—other significant observable inputs (including quoted prices for a similar asset or liability in active markets, interest rates and yield curves, prepayment speeds, credit risk, etc.) |
| • | Level 3—significant unobservable inputs (including the Fund's own assumptions about the assumptions that market participants would use in measuring fair value of an asset or liability) |
The level of an asset or liability within the fair value hierarchy is based on the lowest level of an input, both individually and in the aggregate, that is significant to the fair value measurement. The aggregate value by input level of the Fund’s assets and liabilities as of October 31, 2022, is included at the end of the Portfolio of Investments.
The Fund may use third-party vendor evaluations, whose prices may be derived from one or more of the following standard inputs, among others:
| • Broker/dealer quotes | • Benchmark securities |
| • Two-sided markets | • Reference data (corporate actions or material event notices) |
| • Bids/offers | • Monthly payment information |
| • Industry and economic events | • Reported trades |
An asset or liability for which a market quotation is not readily available is valued by methods deemed reasonable in good faith by the Valuation Committee, following the Valuation Procedures to represent fair value. Under these procedures, the Valuation Designee generally uses a market-based approach which may use related or comparable assets or
liabilities, recent transactions, market multiples, book values and other relevant information. The Valuation Designee may also use an income-based valuation approach in which the anticipated future cash flows of the asset or liability are discounted to calculate fair value. Discounts may also be applied due to the nature and/or duration of any restrictions on the disposition of the asset or liability. Fair value represents a good faith approximation of the value of a security. Fair value determinations involve the consideration of a number of subjective factors, an analysis of applicable facts and circumstances and the exercise of judgment. As a result, it is possible that the fair value for a security determined in good faith in accordance with the Valuation Procedures may differ from valuations for the same security determined for other funds using their own valuation procedures. Although the Valuation Procedures are designed to value a security at the price the Fund may reasonably expect to receive upon the security's sale in an orderly transaction, there can be no assurance that any fair value determination thereunder would, in fact, approximate the amount that the Fund would actually realize upon the sale of the security or the price at which the security would trade if a reliable market price were readily available. During the year ended October 31, 2022, there were no material changes to the fair value methodologies.
Securities which may be valued in this manner include, but are not limited to: (i) a security for which trading has been halted or suspended or otherwise does not have a readily available market quotation on a given day; (ii) a debt security that has recently gone into default and for which there is not a current market quotation; (iii) a security of an issuer that has entered into a restructuring; (iv) a security that has been delisted from a national exchange; (v) a security subject to trading collars for which no or limited trading takes place; and (vi) a security whose principal market has been temporarily closed at a time when, under normal conditions, it would be open. Securities valued in this manner are generally categorized as Level 2 or 3 in the hierarchy.
Equity securities are valued at the last quoted sales prices as of the close of regular trading on the relevant exchange on each valuation date. Securities that are not traded on the valuation date are valued at the mean of the last quoted bid and ask prices. Prices are normally taken from the principal market in which each security trades. These securities are generally categorized as Level 1 in the hierarchy.
Investments in mutual funds, including money market funds, are valued at their respective NAVs at the close of business each day on the valuation date. These securities are generally categorized as Level 1 in the hierarchy.
Futures contracts are valued at the last posted settlement price on the market where such futures are primarily traded. These securities are generally categorized as Level 1 in the hierarchy.
Temporary cash investments acquired in excess of 60 days to maturity at the time of purchase are valued using the latest bid prices or using valuations based on a matrix system (which considers such factors as security prices, yields, maturities and ratings), both as furnished by independent pricing services. Temporary cash investments that mature in
Notes to Financial Statements (continued)
60 days or less at the time of purchase ("Short-Term Investments") are valued using the amortized cost method of valuation, unless the use of such method would be inappropriate. The amortized cost method involves valuing a security at its cost on the date of purchase and thereafter assuming a constant amortization to maturity of the difference between such cost and the value on maturity date. Amortized cost approximates the current fair value of a security. Securities valued using the amortized cost method are not valued using quoted prices in an active market and are generally categorized as Level 2 in the hierarchy.
The information above is not intended to reflect an exhaustive list of the methodologies that may be used to value portfolio investments. The Valuation Procedures permit the use of a variety of valuation methodologies in connection with valuing portfolio investments. The methodology used for a specific type of investment may vary based on the market data available or other considerations. The methodologies summarized above may not represent the specific means by which portfolio investments are valued on any particular business day.
(B) Income Taxes. The Fund's policy is to comply with the requirements of the Internal Revenue Code of 1986, as amended (the “Internal Revenue Code”), applicable to regulated investment companies and to distribute all of its taxable income to the shareholders of the Fund within the allowable time limits.
The Manager evaluates the Fund’s tax positions to determine if the tax positions taken meet the minimum recognition threshold in connection with accounting for uncertainties in income tax positions taken or expected to be taken for the purposes of measuring and recognizing tax liabilities in the financial statements. Recognition of tax benefits of an uncertain tax position is permitted only to the extent the position is “more likely than not” to be sustained assuming examination by taxing authorities. The Manager analyzed the Fund's tax positions taken on federal, state and local income tax returns for all open tax years (for up to three tax years) and has concluded that no provisions for federal, state and local income tax are required in the Fund's financial statements. The Fund's federal, state and local income tax and federal excise tax returns for tax years for which the applicable statutes of limitations have not expired are subject to examination by the Internal Revenue Service and state and local departments of revenue.
(C) Dividends and Distributions to Shareholders. Dividends and distributions are recorded on the ex-dividend date. The Fund intends to declare and pay dividends from net investment income and distributions from net realized capital and currency gains, if any, at least annually. Unless a shareholder elects otherwise, all dividends and distributions are reinvested at NAV in the same class of shares of the Fund. Dividends and distributions to shareholders are determined in accordance with federal income tax regulations and may differ from determinations using GAAP.
(D) Security Transactions and Investment Income. The Fund records security transactions on the trade date. Realized gains and losses on security transactions are determined using the identified cost method. Dividend income is recognized on the ex-dividend date, net of any foreign
tax withheld at the source, and interest income is accrued as earned using the effective interest rate method. Distributions received from real estate investment trusts may be classified as dividends, capital gains and/or return of capital.
Investment income and realized and unrealized gains and losses on investments of the Fund are allocated pro rata to the separate classes of shares based upon their relative net assets on the date the income is earned or realized and unrealized gains and losses are incurred.
(E) Expenses. Expenses of the Trust are allocated to the individual Funds in proportion to the net assets of the respective Funds when the expenses are incurred, except where direct allocations of expenses can be made. Expenses (other than transfer agent expenses and fees incurred under the shareholder services plans and/or the distribution plans further discussed in Note 3(B)) are allocated to separate classes of shares pro rata based upon their relative net assets on the date the expenses are incurred. The expenses borne by the Fund, including those of related parties to the Fund, are shown in the Statement of Operations.
Additionally, the Fund may invest in mutual funds, which are subject to management fees and other fees that may cause the costs of investing in mutual funds to be greater than the costs of owning the underlying securities directly. These indirect expenses of mutual funds are not included in the amounts shown as expenses in the Statement of Operations or in the expense ratios included in the Financial Highlights.
(F) Use of Estimates. In preparing financial statements in conformity with GAAP, the Manager makes estimates and assumptions that affect the reported amounts and disclosures in the financial statements. Actual results could differ from those estimates and assumptions.
(G) Futures Contracts. A futures contract is an agreement to purchase or sell a specified quantity of an underlying instrument at a specified future date and price, or to make or receive a cash payment based on the value of a financial instrument (e.g., foreign currency, interest rate, security or securities index). The Fund is subject to risks such as market price risk, leverage risk, liquidity risk, counterparty risk, operational risk, legal risk and/or interest rate risk in the normal course of investing in these contracts. Upon entering into a futures contract, the Fund is required to pledge to the broker or futures commission merchant an amount of cash and/or U.S. government securities equal to a certain percentage of the collateral amount, known as the “initial margin.” During the period the futures contract is open, changes in the value of the contract are recognized as unrealized appreciation or depreciation by marking to market such contract on a daily basis to reflect the market value of the contract at the end of each day’s trading. The Fund agrees to receive from or pay to the broker or futures commission merchant an amount of cash equal to the daily fluctuation in the value of the contract. Such receipts or payments are known as “variation margin.” When the futures contract is closed, the Fund records a realized gain or loss equal to the difference between the proceeds from (or cost of) the closing transaction and the Fund's basis in the contract.
| 26 | MainStay S&P 500 Index Fund |
The use of futures contracts involves, to varying degrees, elements of market risk in excess of the amount recognized in the Statement of Assets and Liabilities. The contract or notional amounts and variation margin reflect the extent of the Fund's involvement in open futures positions. There are several risks associated with the use of futures contracts as hedging techniques. There can be no assurance that a liquid market will exist at the time when the Fund seeks to close out a futures contract. If no liquid market exists, the Fund would remain obligated to meet margin requirements until the position is closed. Futures contracts may involve a small initial investment relative to the risk assumed, which could result in losses greater than if the Fund did not invest in futures contracts. Futures contracts may be more volatile than direct investments in the instrument underlying the futures and may not correlate to the underlying instrument, causing a given hedge not to achieve its objectives. The Fund's activities in futures contracts have minimal counterparty risk as they are conducted through regulated exchanges that guarantee the futures against default by the counterparty. In the event of a bankruptcy or insolvency of a futures commission merchant that holds margin on behalf of the Fund, the Fund may not be entitled to the return of the entire margin owed to the Fund, potentially resulting in a loss. The Fund may invest in futures contracts to seek enhanced returns or to reduce the risk of loss by hedging certain of its holdings. The Fund's investment in futures contracts and other derivatives may increase the volatility of the Fund's NAVs and may result in a loss to the Fund. Open futures contracts as of October 31, 2022, are shown in the Portfolio of Investments.
(H) Securities Lending. In order to realize additional income, the Fund may engage in securities lending, subject to the limitations set forth in the 1940 Act and relevant guidance by the staff of the Securities and Exchange Commission (“SEC”). If the Fund engages in securities lending, the Fund will lend through its custodian, JPMorgan Chase Bank, N.A., ("JPMorgan"), acting as securities lending agent on behalf of the Fund. Under the current arrangement, JPMorgan will manage the Fund's collateral in accordance with the securities lending agency agreement between the Fund and JPMorgan, and indemnify the Fund against counterparty risk. The loans will be collateralized by cash (which may be invested in a money market fund) and/or non-cash collateral (which may include U.S. Treasury securities and/or U.S. government agency securities issued or guaranteed by the United States government or its agencies or instrumentalities) at least equal at all times to the market value of the securities loaned. Non-cash collateral held at year end is segregated and cannot be transferred by the Fund. The Fund bears the risk of delay in recovery of, or loss of rights in, the securities loaned. The Fund may also record a realized gain or loss on securities deemed sold due to a borrower’s inability to return securities on loan. The Fund bears the risk of any loss on investment of cash collateral. The Fund will receive compensation for lending its securities in the form of fees or it will retain a portion of interest earned on the investment of any cash collateral. The Fund will also continue to receive interest and dividends on the securities loaned and any gain or loss in the market price of the securities loaned that may occur during the term of the loan will be for the account of the
Fund. Income earned from securities lending activities, if any, is reflected in the Statement of Operations. Securities on loan as of October 31, 2022, are shown in the Portfolio of Investments.
(I) Securities Risk. The ability of issuers of debt securities held by the Fund to meet their obligations may be affected by, among other things, economic or political developments in a specific country, industry or region. Debt securities are also subject to the risks associated with changes in interest rates.
(J) Large Transaction Risks. From time to time, the Fund may receive large purchase or redemption orders from affiliated or unaffiliated mutual funds or other investors. Such large transactions could have adverse effects on the Fund’s performance if the Fund were required to sell securities or invest cash at times when it otherwise would not do so. This activity could also accelerate the realization of capital gains and increase the Fund’s transaction costs. The Fund has adopted procedures designed to mitigate the negative impacts of such large transactions, but there can be no assurance that these procedures will be effective.
(K) Indemnifications. Under the Trust’s organizational documents, its officers and trustees are indemnified against certain liabilities that may arise out of performance of their duties to the Trust. Additionally, in the normal course of business, the Fund enters into contracts with third-party service providers that contain a variety of representations and warranties and that may provide general indemnifications. The Fund's maximum exposure under these arrangements is unknown, as this would involve future claims that may be made against the Fund that have not yet occurred. The Manager believes that the risk of loss in connection with these potential indemnification obligations is remote. However, there can be no assurance that material liabilities related to such obligations will not arise in the future, which could adversely impact the Fund.
(L) Quantitative Disclosure of Derivative Holdings. The following tables show additional disclosures related to the Fund's derivative and hedging activities, including how such activities are accounted for and their effect on the Fund's financial positions, performance and cash flows.
The Fund entered into futures contracts to provide an efficient means of maintaining liquidity while remaining fully invested in the market. These derivatives are not accounted for as hedging instruments.
Fair value of derivative instruments as of October 31, 2022:
| Asset Derivatives | Equity
Contracts
Risk | Total |
| Futures Contracts - Net Assets—Net unrealized appreciation on futures contracts (a) | $134,479 | $134,479 |
| Total Fair Value | $134,479 | $134,479 |
| (a) | Includes cumulative appreciation (depreciation) of futures contracts as reported in the Portfolio of Investments. Only current day’s variation margin is reported within the Statement of Assets and Liabilities. |
Notes to Financial Statements (continued)
The effect of derivative instruments on the Statement of Operations for the year ended October 31, 2022:
| Net Realized Gain (Loss) from: | Equity
Contracts
Risk | Total |
| Futures Contracts | $(2,397,012) | $(2,397,012) |
| Total Net Realized Gain (Loss) | $(2,397,012) | $(2,397,012) |
| Net Change in Unrealized Appreciation (Depreciation) | Equity
Contracts
Risk | Total |
| Futures Contracts | $(9,824) | $(9,824) |
| Total Net Change in Unrealized Appreciation (Depreciation) | $(9,824) | $(9,824) |
| Average Notional Amount | Total |
| Futures Contracts Long | $9,842,813 |
Note 3–Fees and Related Party Transactions
(A) Manager and Subadvisor. New York Life Investments, a registered investment adviser and an indirect, wholly-owned subsidiary of New York Life Insurance Company ("New York Life"), serves as the Fund's Manager, pursuant to an Amended and Restated Management Agreement ("Management Agreement"). The Manager provides offices, conducts clerical, recordkeeping and bookkeeping services and keeps most of the financial and accounting records required to be maintained by the Fund. Except for the portion of salaries and expenses that are the responsibility of the Fund, the Manager pays the salaries and expenses of all personnel affiliated with the Fund and certain operational expenses of the Fund. During a portion of the year ended October 31, 2022, the Fund reimbursed New York Life Investments in an amount equal to the portion of the compensation of the Chief Compliance Officer attributable to the Fund. The Fund’s subadvisor changed effective June 10, 2022, due to the replacement of MacKay Shields LLC ("MacKay Shields") as the Fund’s subadvisor and the appointment of IndexIQ Advisors LLC (“IndexIQ” or the “Subadvisor”) as the Fund’s subadvisor. The Fund's portfolio manager did not change due to the change in subadvisor. IndexIQ, a registered investment adviser and an affiliate of New York Life Investments, is responsible for the day-to-day portfolio management of the Fund. Pursuant to the terms of an Amended and Restated Subadvisory Agreement ("Subadvisory Agreement") between New York Life Investments and IndexIQ, New York Life Investments pays for the services of the Subadvisor.
Pursuant to the Management Agreement, the Fund pays the Manager a monthly fee for the services performed and the facilities furnished at an annual rate of the Fund’s average daily net assets as follows: 0.16% up to $2.5 billion and 0.15% in excess of $2.5 billion. During the year ended October 31, 2022, the effective management fee rate was 0.16% of the Fund’s average daily net assets, exclusive of any applicable waivers/reimbursements.
New York Life Investments has contractually agreed to waive fees and/or reimburse expenses so that Total Annual Fund Operating Expenses (excluding taxes, interest, litigation, extraordinary expenses, brokerage and other transaction expenses relating to the purchase or sale of portfolio investments, and acquired (underlying) fund fees and expenses) for Class A shares do not exceed 0.60% of the Fund’s average daily net assets. New York Life Investments will apply an equivalent waiver or reimbursement, in an equal number of basis points, to the other share classes of the Fund. This agreement will remain in effect until February 28, 2023, and shall renew automatically for one-year terms unless New York Life Investments provides written notice of termination prior to the start of the next term or upon approval of the Board.
Additionally, New York Life Investments has agreed to further voluntarily waive fees and/or reimburse expenses of the appropriate class of the Fund so that Total Annual Fund Operating Expenses (excluding taxes, interest, litigation, extraordinary expenses, brokerage and other transaction expenses relating to the purchase and sale of portfolio investments, and acquired (underlying) fund fees and expenses) for Investor Class and SIMPLE Class shares of the Fund do not exceed 0.70% and 0.95%, respectively, of the Fund’s average daily net assets. This voluntary waiver or reimbursement may be discontinued at any time without notice.
During the year ended October 31, 2022, New York Life Investments earned fees from the Fund in the amount of $1,962,897 and waived fees and/or reimbursed expenses in the amount of $46,136 and paid MacKay Shields and IndexIQ fees of $622,335 and $336,046, respectively.
JPMorgan provides sub-administration and sub-accounting services to the Fund pursuant to an agreement with New York Life Investments. These services include calculating the daily NAVs of the Fund, maintaining the general ledger and sub-ledger accounts for the calculation of the Fund's NAVs, and assisting New York Life Investments in conducting various aspects of the Fund's administrative operations. For providing these services to the Fund, JPMorgan is compensated by New York Life Investments.
Pursuant to an agreement between the Trust and New York Life Investments, New York Life Investments is responsible for providing or procuring certain regulatory reporting services for the Fund. The Fund will reimburse New York Life Investments for the actual costs incurred by New York Life Investments in connection with providing or procuring these services for the Fund.
(B) Distribution and Service Fees. The Trust, on behalf of the Fund, has entered into a distribution agreement with NYLIFE Distributors LLC (the “Distributor”), an affiliate of New York Life Investments. The Fund has adopted distribution plans (the “Plans”) in accordance with the provisions of Rule 12b-1 under the 1940 Act.
Pursuant to the Class A and Investor Class Plans, the Distributor receives a monthly fee from the Class A and Investor Class shares at an annual rate of 0.25% of the average daily net assets of the Class A and Investor Class shares for distribution and/or service activities as designated by the
| 28 | MainStay S&P 500 Index Fund |
Distributor. Pursuant to the SIMPLE Class Plan, SIMPLE Class shares pay the Distributor a monthly distribution fee at an annual rate of 0.25% of the average daily net assets of the SIMPLE Class shares, along with a service fee at an annual rate of 0.25% of the average daily net assets of the SIMPLE Class shares, for a total 12b-1 fee of 0.50%. Class I shares are not subject to a distribution and/or service fee.
The Plans provide that the distribution and service fees are payable to the Distributor regardless of the amounts actually expended by the Distributor for distribution of the Fund's shares and service activities.
(C) Sales Charges. The Fund was advised by the Distributor that the amount of initial sales charges retained on sales of Class A and Investor Class shares during the year ended October 31, 2022, were $137,913 and $11,428, respectively.
The Fund was also advised that the Distributor retained CDSCs on redemptions of Class A and Investor Class shares during the year ended October 31, 2022, of $4,316 and $80, respectively.
(D) Transfer, Dividend Disbursing and Shareholder Servicing Agent. NYLIM Service Company LLC, an affiliate of New York Life Investments, is the Fund's transfer, dividend disbursing and shareholder servicing agent pursuant to an agreement between NYLIM Service Company LLC and the Trust. NYLIM Service Company LLC has entered into an agreement with DST Asset Manager Solutions, Inc. ("DST"), pursuant to which DST performs certain transfer agent services on behalf of NYLIM Service Company LLC. New York Life Investments has contractually agreed to limit the transfer agency expenses charged to the Fund’s share classes to a maximum of 0.35% of that share class’s average daily net assets on an annual basis after deducting any applicable Fund or class-level expense reimbursement or small account fees. This agreement will remain in effect until February 28, 2023, and shall renew automatically for one-year terms unless New York Life Investments provides written notice of termination prior to the start of the next term or upon approval of the Board. During the year ended October 31, 2022, transfer agent expenses incurred by the Fund and any reimbursements, pursuant to the aforementioned Transfer Agency expense limitation agreement, were as follows:
| Class | Expense | Waived |
| Class A | $519,693 | $— |
| Investor Class | 169,778 | — |
| Class I | 210,929 | — |
| SIMPLE Class | 443 | — |
(E) Small Account Fee. Shareholders with small accounts adversely impact the cost of providing transfer agency services. In an effort to reduce total transfer agency expenses, the Fund has implemented a small account fee on certain types of accounts. As described in the Fund's prospectus, certain shareholders with an account balance of less than $1,000 ($5,000 for Class A share accounts) are charged an annual per account fee of $20 (assessed semi-annually), the proceeds from which offset transfer agent fees as reflected in the Statement of Operations.
This small account fee will not apply to certain types of accounts as described further in the Fund’s prospectus.
(F) Capital. As of October 31, 2022, New York Life and its affiliates beneficially held shares of the Fund with the values and percentages of net assets as follows:
| Class I | $8,414,033 | 3.1% |
| SIMPLE Class | 27,989 | 15.1 |
Note 4-Federal Income Tax
As of October 31, 2022, the cost and unrealized appreciation (depreciation) of the Fund’s investment portfolio, including applicable derivative contracts and other financial instruments, as determined on a federal income tax basis, were as follows:
| | Federal Tax
Cost | Gross
Unrealized
Appreciation | Gross
Unrealized
(Depreciation) | Net
Unrealized
Appreciation/
(Depreciation) |
| Investments in Securities | $260,705,840 | $832,468,495 | $(11,749,978) | $820,718,517 |
As of October 31, 2022, the components of accumulated gain (loss) on a tax basis were as follows:
Ordinary
income | Accumulated
Capital
and Other
Gain (Loss) | Other
Temporary
Differences | Unrealized
Appreciation
(Depreciation) | Total
Accumulated
Gain (Loss) |
| $10,456,432 | $87,217,653 | $— | $820,718,517 | $918,392,602 |
The difference between book-basis and tax-basis unrealized appreciation (depreciation) is primarily due to wash sale adjustments and mark to market of futures contracts.
The following table discloses the current year reclassifications between total distributable earnings (loss) and additional paid-in capital arising from permanent differences; net assets as of October 31, 2022 were not affected.
| | Total
Distributable
Earnings (Loss) | Additional
Paid-In
Capital |
| | $(7,103,601) | $7,103,601 |
The reclassifications for the Fund are primarily due to equalization.
During the years ended October 31, 2022 and October 31, 2021, the tax character of distributions paid as reflected in the Statements of Changes in Net Assets was as follows:
| | 2022 | 2021 |
| Distributions paid from: | | |
| Ordinary Income | $24,571,153 | $ 19,032,979 |
| Long-Term Capital Gains | 39,332,794 | 83,280,052 |
| Total | $63,903,947 | $102,313,031 |
Notes to Financial Statements (continued)
Note 5–Custodian
JPMorgan is the custodian of cash and securities held by the Fund. Custodial fees are charged to the Fund based on the Fund's net assets and/or the market value of securities held by the Fund and the number of certain transactions incurred by the Fund.
Note 6–Line of Credit
The Fund and certain other funds managed by New York Life Investments maintain a line of credit with a syndicate of banks in order to secure a source of funds for temporary purposes to meet unanticipated or excessive redemption requests.
Effective July 26, 2022, under the credit agreement (the “Credit Agreement”), the aggregate commitment amount is $600,000,000 with an additional uncommitted amount of $100,000,000. The commitment fee is an annual rate of 0.15% of the average commitment amount payable quarterly, regardless of usage, to JPMorgan, who serves as the agent to the syndicate. The commitment fee is allocated among the Fund and certain other funds managed by New York Life Investments based upon their respective net assets and other factors. Interest on any revolving credit loan is charged based upon the Federal Funds Rate, Daily Simple Secured Overnight Financing Rate ("SOFR") + 0.10%, or the Overnight Bank Funding Rate, whichever is higher. The Credit Agreement expires on July 25, 2023, although the Fund, certain other funds managed by New York Life Investments and the syndicate of banks may renew the Credit Agreement for an additional year on the same or different terms or enter into a credit agreement with a different syndicate of banks. Prior to July 26, 2022, the aggregate commitment amount and the commitment fee were the same as those under the current Credit Agreement. During the year ended October 31, 2022, there were no borrowings made or outstanding with respect to the Fund under the Credit Agreement.
Note 7–Interfund Lending Program
Pursuant to an exemptive order issued by the SEC, the Fund, along with certain other funds managed by New York Life Investments, may participate in an interfund lending program. The interfund lending program provides an alternative credit facility that permits the Fund and certain other funds managed by New York Life Investments to lend or borrow money for temporary purposes directly to or from one another, subject to the conditions of the exemptive order. During the year ended October 31, 2022, there were no interfund loans made or outstanding with respect to the Fund.
Note 8–Purchases and Sales of Securities (in 000’s)
During the year ended October 31, 2022, purchases and sales of securities, other than short-term securities, were $24,260 and $171,648, respectively.
Note 9–Capital Share Transactions
Transactions in capital shares for the years ended October 31, 2022 and October 31, 2021, were as follows:
| Class A | Shares | Amount |
| Year ended October 31, 2022: | | |
| Shares sold | 1,934,863 | $ 103,966,523 |
| Shares issued to shareholders in reinvestment of distributions | 681,394 | 38,730,442 |
| Shares redeemed | (1,972,053) | (103,647,452) |
| Net increase (decrease) in shares outstanding before conversion | 644,204 | 39,049,513 |
| Shares converted into Class A (See Note 1) | 135,732 | 7,705,065 |
| Shares converted from Class A (See Note 1) | (7,302) | (391,955) |
| Net increase (decrease) | 772,634 | $ 46,362,623 |
| Year ended October 31, 2021: | | |
| Shares sold | 2,338,699 | $ 124,181,704 |
| Shares issued to shareholders in reinvestment of distributions | 1,163,866 | 54,969,414 |
| Shares redeemed | (2,112,025) | (111,330,020) |
| Net increase (decrease) in shares outstanding before conversion | 1,390,540 | 67,821,098 |
| Shares converted into Class A (See Note 1) | 438,333 | 22,796,174 |
| Shares converted from Class A (See Note 1) | (654) | (33,352) |
| Net increase (decrease) | 1,828,219 | $ 90,583,920 |
| |
| Investor Class | Shares | Amount |
| Year ended October 31, 2022: | | |
| Shares sold | 142,813 | $ 7,662,662 |
| Shares issued to shareholders in reinvestment of distributions | 43,087 | 2,445,630 |
| Shares redeemed | (99,249) | (5,308,943) |
| Net increase (decrease) in shares outstanding before conversion | 86,651 | 4,799,349 |
| Shares converted into Investor Class (See Note 1) | 1,364 | 74,345 |
| Shares converted from Investor Class (See Note 1) | (136,000) | (7,705,065) |
| Net increase (decrease) | (47,985) | $ (2,831,371) |
| Year ended October 31, 2021: | | |
| Shares sold | 215,863 | $ 11,330,614 |
| Shares issued to shareholders in reinvestment of distributions | 108,660 | 5,122,224 |
| Shares redeemed | (121,766) | (6,383,419) |
| Net increase (decrease) in shares outstanding before conversion | 202,757 | 10,069,419 |
| Shares converted into Investor Class (See Note 1) | 655 | 33,352 |
| Shares converted from Investor Class (See Note 1) | (439,434) | (22,796,174) |
| Net increase (decrease) | (236,022) | $ (12,693,403) |
| |
| 30 | MainStay S&P 500 Index Fund |
| Class I | Shares | Amount |
| Year ended October 31, 2022: | | |
| Shares sold | 539,861 | $ 29,470,154 |
| Shares issued to shareholders in reinvestment of distributions | 376,549 | 21,813,472 |
| Shares redeemed | (3,339,414) | (189,167,876) |
| Net increase (decrease) in shares outstanding before conversion | (2,423,004) | (137,884,250) |
| Shares converted into Class I (See Note 1) | 5,825 | 317,610 |
| Net increase (decrease) | (2,417,179) | $(137,566,640) |
| Year ended October 31, 2021: | | |
| Shares sold | 1,578,904 | $ 82,841,231 |
| Shares issued to shareholders in reinvestment of distributions | 853,614 | 41,033,248 |
| Shares redeemed | (3,861,408) | (214,460,090) |
| Net increase (decrease) | (1,428,890) | $ (90,585,611) |
| |
| SIMPLE Class | Shares | Amount |
| Year ended October 31, 2022: | | |
| Shares sold | 2,829 | $ 148,351 |
| Shares issued to shareholders in reinvestment of distributions | 50 | 2,833 |
| Shares redeemed | (186) | (9,661) |
| Net increase (decrease) | 2,693 | $ 141,523 |
| Year ended October 31, 2021: | | |
| Shares sold | 579 | $ 32,116 |
| Shares issued to shareholders in reinvestment of distributions | 42 | 1,983 |
| Net increase (decrease) | 621 | $ 34,099 |
Note 10–Other Matters
As of the date of this report, interest rates in the United States and many parts of the world, including certain European countries, are ascending from historically low levels. Thus, the Fund currently faces a heightened level of risk associated with rising interest rates. This could be driven by a variety of factors, including but not limited to central bank monetary policies, changing inflation or real growth rates, general economic conditions, increasing bond issuances or reduced market demand for low yielding investments.
An outbreak of COVID-19, first detected in December 2019, has developed into a global pandemic and has resulted in travel restrictions, closure of international borders, certain businesses and securities markets, restrictions on securities trading activities, prolonged quarantines, supply chain disruptions, and lower consumer demand, as well as general concern and uncertainty. In 2022, many countries lifted some or all restrictions related to COVID-19. However, the continued impact of COVID-19 and related variants is uncertain and could further adversely affect the global economy, national economies, individual issuers and capital markets in unforeseeable ways and result in a substantial and extended economic downturn. Developments that disrupt
global economies and financial markets, such as COVID-19, may magnify factors that affect the Fund's performance.
Note 11–Subsequent Events
In connection with the preparation of the financial statements of the Fund as of and for the year ended October 31, 2022, events and transactions subsequent to October 31, 2022, through the date the financial statements were issued have been evaluated by the Manager for possible adjustment and/or disclosure. No subsequent events requiring financial statement adjustment or disclosure have been identified.
Report of Independent Registered Public Accounting Firm
To the Shareholders of the Fund and Board of Trustees
MainStay Funds Trust:
Opinion on the Financial Statements
We have audited the accompanying statement of assets and liabilities of MainStay S&P 500 Index Fund (formerly, MainStay MacKay S&P 500 Index Fund) (the Fund), one of the funds constituting MainStay Funds Trust, including the portfolio of investments, as of October 31, 2022, the related statement of operations for the year then ended, the statements of changes in net assets for each of the years in the two-year period then ended, and the related notes (collectively, the financial statements) and the financial highlights for each of the years or periods in the five-year period then ended. In our opinion, the financial statements and financial highlights present fairly, in all material respects, the financial position of the Fund as of October 31, 2022, the results of its operations for the year then ended, the changes in its net assets for each of the years in the two-year period then ended, and the financial highlights for each of the years or periods in the five-year period then ended, in conformity with U.S. generally accepted accounting principles.
Basis for Opinion
These financial statements and financial highlights are the responsibility of the Fund's management. Our responsibility is to express an opinion on these financial statements and financial highlights based on our audits. We are a public accounting firm registered with the Public Company Accounting Oversight Board (United States) (PCAOB) and are required to be independent with respect to the Fund in accordance with the U.S. federal securities laws and the applicable rules and regulations of the Securities and Exchange Commission and the PCAOB.
We conducted our audits in accordance with the standards of the PCAOB. Those standards require that we plan and perform the audit to obtain reasonable assurance about whether the financial statements and financial highlights are free of material misstatement, whether due to error or fraud. Our audits included performing procedures to assess the risks of material misstatement of the financial statements and financial highlights, whether due to error or fraud, and performing procedures that respond to those risks. Such procedures included examining, on a test basis, evidence regarding the amounts and disclosures in the financial statements and financial highlights. Such procedures also included confirmation of securities owned as of October 31, 2022, by correspondence with custodians, the transfer agent and brokers; when replies were not received from brokers, we performed other auditing procedures. Our audits also included evaluating the accounting principles used and significant estimates made by management, as well as evaluating the overall presentation of the financial statements and financial highlights. We believe that our audits provide a reasonable basis for our opinion.

We have served as the auditor of one or more New York Life Investment Management investment companies since 2003.
Philadelphia, Pennsylvania
December 23, 2022
| 32 | MainStay S&P 500 Index Fund |
Federal Income Tax Information
(Unaudited)
The Fund is required under the Internal Revenue Code to advise shareholders in a written statement as to the federal tax status of dividends paid by the Fund during such fiscal years. Accordingly, the Fund paid $39,301,794 as long term capital gain distributions.
For the fiscal year ended October 31, 2022, the Fund designated approximately $19,285,420 under the Internal Revenue Code as qualified dividend income eligible for reduced tax rates.
The dividends paid by the Fund during the fiscal year ended October 31, 2022 should be multiplied by 75.98% to arrive at the amount eligible for the corporate dividend-received deduction.
In February 2023, shareholders will receive an IRS Form 1099-DIV or substitute Form 1099, which will show the federal tax status of the distributions received by shareholders in calendar year 2022. The amounts that will be reported on such 1099-DIV or substitute Form 1099 will be the amounts you are to use on your federal income tax return and will differ from the amounts which we must report for the Fund's fiscal year ended October 31, 2022.
Proxy Voting Policies and Procedures and Proxy Voting Record
The Fund is required to file with the SEC its proxy voting record for the 12-month period ending June 30 on Form N-PX. A description of the policies and procedures that are used to vote proxies relating to portfolio securities of the Fund is available free of charge upon request by calling 800-624-6782 or visiting the SEC’s website at www.sec.gov. The most recent Form N-PX or proxy voting record is available free of charge upon request by calling 800-624-6782; visiting newyorklifeinvestments.com; or visiting the SEC’s website at www.sec.gov.
Shareholder Reports and Quarterly Portfolio Disclosure
The Fund is required to file its complete schedule of portfolio holdings with the SEC 60 days after its first and third fiscal quarter on Form N-PORT. The Fund's holdings report is available free of charge upon request by calling New York Life Investments at 800-624-6782.
Board of Trustees and Officers (Unaudited)
The Trustees and officers of the Fund are listed below. The Board oversees the MainStay Group of Funds (which consists of MainStay Funds and MainStay Funds Trust), MainStay VP Funds Trust, MainStay MacKay DefinedTerm Municipal Opportunities Fund, MainStay CBRE Global Infrastructure Megatrends Fund, the Manager and the Subadvisors, and elects the officers of the Funds who are responsible for the day-to-day operations of the Fund. Information pertaining to the Trustees and officers is set forth below. Each Trustee serves until his or her successor is
elected and qualified or until his or her resignation, death or removal. Under the Board’s retirement policy, unless an exception is made, a Trustee must tender his or her resignation by the end of the calendar year during which he or she reaches the age of 75. The business address of each Trustee and officer listed below is 51 Madison Avenue, New York, New York 10010. None of the Trustees are “interested persons” (as defined by the 1940 Act and rules adopted by the SEC thereunder) of the Fund (“Independent Trustees”).
| | Name and
Year of Birth | Term of Office,
Position(s) Held and
Length of Service | Principal Occupation(s)
During Past Five Years | Number of
Portfolios in
Fund Complex
Overseen by
Trustee | Other Directorships
Held by Trustee |
| | | | | | |
| | David H. Chow
1957 | MainStay Funds: Trustee since 2016, Advisory Board Member (June 2015 to December 2015);MainStay Funds Trust:
Trustee since January 2016, Advisory Board Member (June 2015 to December 2015) | Founder and CEO, DanCourt Management, LLC since 1999 | 78 | MainStay VP Funds Trust: Trustee since January 2016, Advisory Board Member (June 2015 to December 2015) (31 portfolios);
MainStay MacKay DefinedTerm Municipal Opportunities Fund: Trustee since January 2016, Advisory Board Member (June 2015 to December 2015);
MainStay CBRE Global Infrastructure Megatrends Fund: Trustee since June 2021; VanEck Vectors Group of Exchange-Traded Funds: Independent Chairman of the Board of Trustees since 2008 and Trustee since 2006 (56 portfolios); and Berea College of Kentucky: Trustee since 2009, Chair of the Investment Committee since 2018 |
| | Susan B. Kerley
1951 | MainStay Funds: Chairman since 2017 and Trustee since 2007;MainStay Funds Trust:
Chairman since 2017 and Trustee since 1990** | President, Strategic Management Advisors LLC since 1990 | 78 | MainStay VP Funds Trust: Chairman since January 2017 and Trustee since 2007 (31 portfolios)**;
MainStay MacKay DefinedTerm Municipal Opportunities Fund: Chairman since 2017 and Trustee since 2011;
MainStay CBRE Global Infrastructure Megatrends Fund: Trustee since June 2021; and Legg Mason Partners Funds: Trustee since 1991 (45 portfolios) |
| | Alan R. Latshaw
1951 | MainStay Funds: Trustee since 2006;MainStay Funds Trust:
Trustee since 2007*** | Retired; Partner, Ernst & Young LLP (2002 to 2003); Partner, Arthur Andersen LLP (1989 to 2002); Consultant to the MainStay Funds Audit and Compliance Committee (2004 to 2006) | 78 | MainStay VP Funds Trust: Trustee since 2007 (31 portfolios)**;
MainStay MacKay DefinedTerm Municipal Opportunities Fund: Trustee since 2011; and
MainStay CBRE Global Infrastructure Megatrends Fund: Trustee since June 2021 |
| 34 | MainStay S&P 500 Index Fund |
| | Name and
Year of Birth | Term of Office,
Position(s) Held and
Length of Service | Principal Occupation(s)
During Past Five Years | Number of
Portfolios in
Fund Complex
Overseen by
Trustee | Other Directorships
Held by Trustee |
| | | | | | |
| | Karen Hammond
1956 | MainStay Funds: Trustee since December 2021, Advisory Board Member (June 2021 to December 2021);MainStay Funds Trust:
Trustee since December 2021, Advisory Board Member (June 2021 to December 2021)
| Retired, Managing Director, Devonshire Investors (2007 to 2013); Senior Vice President, Fidelity Management & Research Co. (2005 to 2007); Senior Vice President and Corporate Treasurer, FMR Corp. (2003 to 2005); Chief Operating Officer, Fidelity Investments Japan (2001 to 2003) | 78 | MainStay VP Funds Trust: Trustee since December 2021, Advisory Board Member (June 2021 to December 2021) (31 Portfolios);
MainStay MacKay DefinedTerm Municipal Opportunities Fund: Trustee since December 2021, Advisory Board Member (June 2021 to December 2021);
MainStay CBRE Global Infrastructure Megatrends Fund: Trustee since December 2021, Advisory Board Member (June 2021 to December 2021);
Two Harbors Investment Corp.: Director since 2018;
Rhode Island State Investment Commission: Member since 2017; and
Blue Cross Blue Shield of Rhode Island: Director since 2019 |
| | Jacques P. Perold
1958 | MainStay Funds: Trustee since 2016, Advisory Board Member (June 2015 toDecember 2015);MainStay Funds Trust:
Trustee since January 2016, Advisory Board Member (June 2015 to December 2015) | Founder and Chief Executive Officer, CapShift Advisors LLC (since 2018); President, Fidelity Management & Research Company (2009 to 2014); President and Chief Investment Officer, Geode Capital Management, LLC (2001 to 2009) | 78 | MainStay VP Funds Trust: Trustee since January 2016, Advisory Board Member (June 2015 to December 2015) (31 portfolios);
MainStay MacKay DefinedTerm Municipal Opportunities Fund: Trustee since January 2016, Advisory Board Member (June 2015 to December 2015);
MainStay CBRE Global Infrastructure Megatrends Fund: Trustee since June 2021; Partners in Health: Trustee since 2019; Allstate Corporation: Director since 2015; and MSCI Inc.: Director since 2017 |
| | Richard S. Trutanic
1952 | MainStay Funds: Trustee since 1994;MainStay Funds Trust:
Trustee since 2007*** | Chairman and Chief Executive Officer, Somerset & Company (financial advisory firm) since 2004; Managing Director, The Carlyle Group (private investment firm) (2002 to 2004); Senior Managing Director, Partner and Board Member, Groupe Arnault S.A. (private investment firm) (1999 to 2002) | 78 | MainStay VP Funds Trust: Trustee since 2007 (31 portfolios)**;
MainStay MacKay DefinedTerm Municipal Opportunities Fund: Trustee since 2011; and MainStay CBRE Global Infrastructure Megatrends Fund: Trustee since June 2021 |
| ** | Includes prior service as a Director of MainStay VP Series Fund, Inc., the predecessor to MainStay VP Funds Trust. |
| *** | Includes prior service as a Director/Trustee of certain predecessor entities to MainStay Funds Trust. |
Board of Trustees and Officers (Unaudited) (continued)
| | Name and
Year of Birth | Position(s) Held and
Length of Service | Principal Occupation(s)
During Past Five Years | |
| | | | | |
| | Kirk C. Lehneis
1974 | President, MainStay Funds, MainStay Funds Trust since 2017 | Chief Operating Officer and Senior Managing Director (since 2016), New York Life Investment Management LLC and New York Life Investment Management Holdings LLC; Member of the Board of Managers (since 2017) and Senior Managing Director (since 2018), NYLIFE Distributors LLC; Chairman of the Board and Senior Managing Director, NYLIM Service Company LLC (since 2017); Trustee, President and Principal Executive Officer of IndexIQ Trust, IndexIQ ETF Trust and IndexIQ Active ETF Trust (since January 2018); President, MainStay CBRE Global Infrastructure Megatrends Fund (since 2021), MainStay MacKay DefinedTerm Municipal Opportunities Fund and MainStay VP Funds Trust (since 2017); Senior Managing Director, Global Product Development (From 2015-2016); Managing Director, Product Development (2010 to 2015), New York Life Investment Management LLC | |
| | Jack R. Benintende
1964 | Treasurer and Principal Financial and Accounting Officer, MainStay Funds (since 2007), MainStay Funds Trust (since 2009) | Managing Director, New York Life Investment Management LLC (since 2007); Treasurer and Principal Financial and Accounting Officer, MainStay CBRE Global Infrastructure Megatrends Fund (since 2021), MainStay MacKay DefinedTerm Municipal Opportunities Fund (since 2011) and MainStay VP Funds Trust (since 2007)** and Assistant Treasurer, New York Life Investment Management Holdings LLC (2008 to 2012) | |
| | J. Kevin Gao
1967 | Secretary and Chief Legal Officer, MainStay Funds and MainStay Funds Trust (since 2010) | Managing Director and Associate General Counsel, New York Life Investment Management LLC (since 2010); Secretary and Chief Legal Officer and MainStay CBRE Global Infrastructure Megatrends Fund (since 2021), MainStay MacKay DefinedTerm Municipal Opportunities Fund (since 2011) and MainStay VP Funds Trust (since 2010)** | |
| | Scott T. Harrington
1959 | Vice President— Administration, MainStay Funds (since 2009), MainStay Funds Trust (since 2009) | Managing Director, New York Life Investment Management LLC (including predecessor advisory organizations) (since 2000); Member of the Board of Directors, New York Life Trust Company (since 2009); Vice President—Administration, MainStay CBRE Global Infrastructure Megatrends Fund (since 2021), MainStay MacKay DefinedTerm Municipal Opportunities Fund (since 2011) and MainStay VP Funds Trust (since 2005)** | |
| | Kevin M. Gleason
1967 | Vice President and Chief Compliance Officer, MainStay Funds and MainStay Funds Trust (since June 2022) | Vice President and Chief Compliance Officer, IndexIQ, IndexIQ ETF Trust and Index IQ Active ETF Trust (since June 2022); Vice President and Chief Compliance Officer, MainStay CBRE Global Infrastructure Megatrends Fund, MainStay VP Funds Trust and MainStay MacKay DefinedTerm Municipal Opportunities Fund (since June 2022); Senior Vice President, Voya Investment Management and Chief Compliance Officer, Voya Family of Funds (2012-2022) | |
| * | The officers listed above are considered to be “interested persons” of the MainStay Group of Funds, MainStay VP Funds Trust, MainStay CBRE Global Infrastructure Megatrends Fund and MainStay MacKay DefinedTerm Municipal Opportunities Fund within the meaning of the 1940 Act because of their affiliation with the MainStay Group of Funds, New York Life Insurance Company and/or its affiliates, including New York Life Investment Management LLC, NYLIM Service Company LLC, NYLIFE Securities LLC and/or NYLIFE Distributors LLC, as described in detail in the column captioned “Principal Occupation(s) During Past Five Years.” Officers are elected annually by the Board. |
| ** | Includes prior service as an Officer of MainStay VP Series Fund, Inc., the predecessor to MainStay VP Funds Trust. |
Officers of the Trust (Who are not Trustees)*
| 36 | MainStay S&P 500 Index Fund |
This page intentionally left blank.
This page intentionally left blank.
Equity
U.S. Equity
MainStay Epoch U.S. Equity Yield Fund
MainStay S&P 500 Index Fund1
MainStay Winslow Large Cap Growth Fund
MainStay WMC Enduring Capital Fund
MainStay WMC Growth Fund
MainStay WMC Small Companies Fund
MainStay WMC Value Fund
International Equity
MainStay Epoch International Choice Fund
MainStay MacKay International Equity Fund
MainStay WMC International Research Equity Fund
Emerging Markets Equity
MainStay Candriam Emerging Markets Equity Fund
Global Equity
MainStay Epoch Capital Growth Fund
MainStay Epoch Global Equity Yield Fund
Fixed Income
Taxable Income
MainStay Candriam Emerging Markets Debt Fund
MainStay Floating Rate Fund
MainStay MacKay High Yield Corporate Bond Fund
MainStay MacKay Short Duration High Yield Fund
MainStay MacKay Strategic Bond Fund
MainStay MacKay Total Return Bond Fund
MainStay MacKay U.S. Infrastructure Bond Fund
MainStay Short Term Bond Fund
Tax-Exempt Income
MainStay MacKay California Tax Free Opportunities Fund2
MainStay MacKay High Yield Municipal Bond Fund
MainStay MacKay New York Tax Free Opportunities Fund3
MainStay MacKay Short Term Municipal Fund
MainStay MacKay Strategic Municipal Allocation Fund
MainStay MacKay Tax Free Bond Fund
Money Market
MainStay Money Market Fund
Mixed Asset
MainStay Balanced Fund
MainStay Income Builder Fund
MainStay MacKay Convertible Fund
Speciality
MainStay CBRE Global Infrastructure Fund
MainStay CBRE Real Estate Fund
MainStay Cushing MLP Premier Fund
Asset Allocation
MainStay Conservative Allocation Fund
MainStay Conservative ETF Allocation Fund
MainStay Defensive ETF Allocation Fund
MainStay Equity Allocation Fund
MainStay Equity ETF Allocation Fund
MainStay ESG Multi-Asset Allocation Fund
MainStay Growth Allocation Fund
MainStay Growth ETF Allocation Fund
MainStay Moderate Allocation Fund
MainStay Moderate ETF Allocation Fund
Manager
New York Life Investment Management LLC
New York, New York
Subadvisors
Candriam4
Strassen, Luxembourg
CBRE Investment Management Listed Real Assets LLC
Radnor, Pennsylvania
Cushing Asset Management, LP
Dallas, Texas
Epoch Investment Partners, Inc.
New York, New York
MacKay Shields LLC4
New York, New York
NYL Investors LLC4
New York, New York
Wellington Management Company LLP
Boston, Massachusetts
Winslow Capital Management, LLC
Minneapolis, Minnesota
Legal Counsel
Dechert LLP
Washington, District of Columbia
Independent Registered Public Accounting Firm
KPMG LLP
Philadelphia, Pennsylvania
Distributor
NYLIFE Distributors LLC4
Jersey City, New Jersey
Custodian
JPMorgan Chase Bank, N.A.
New York, New York
1.
Prior to February 28, 2022, the Fund's name was MainStay MacKay S&P 500 Index Fund.
| 2. | This Fund is registered for sale in AZ, CA, NV, OR, TX, UT, WA and MI (Class A and Class I shares only), and CO, FL, GA, HI, ID, MA, MD, NH, NJ and NY (Class I shares only). |
| 3. | This Fund is registered for sale in CA, CT, DE, FL, MA, NJ, NY and VT. |
| 4. | An affiliate of New York Life Investment Management LLC. |
Not part of the Annual Report
For more information
800-624-6782
newyorklifeinvestments.com
“New York Life Investments” is both a service mark, and the common trade name, of certain investment advisors affiliated with New York Life Insurance Company. The MainStay Funds® are managed by New York Life Investment Management LLC and distributed by NYLIFE Distributors LLC, 30 Hudson Street, Jersey City, NJ 07302, a wholly owned subsidiary of New York Life Insurance Company. NYLIFE Distributors LLC is a Member FINRA/SIPC.
©2022 NYLIFE Distributors LLC. All rights reserved.
| 5013946.2MS229-22 | MSSP11-12/22 |
(NYLIM) NL226
MainStay MacKay Short Duration High Yield Fund
Message from the President and Annual Report
October 31, 2022
Sign up for e-delivery of your shareholder reports. For full details on e-delivery, including who can participate and what you can receive via e-delivery,
please log in to newyorklifeinvestments.com/accounts.
| Not FDIC/NCUA Insured | Not a Deposit | May Lose Value | No Bank Guarantee | Not Insured by Any Government Agency |
This page intentionally left blank
Message from the President
A series of economic and geopolitical challenges undermined equity and fixed-income markets during the 12-month reporting period ended October 31, 2022. Stocks and bonds alike trended lower in the face of sharply rising interest rates, increasing inflationary pressures, slowing economic growth and Russia’s invasion of Ukraine.
The reporting period began on a mixed note, with concerns about the spreading Omicron variant of the COVID-19 virus and increasingly hawkish statements from the U.S. Federal Reserve (the “Fed”) regarding mounting inflation, countered by bullish sentiment stemming from U.S. economic growth and strong corporate earnings. In January 2022, markets turned decisively negative as comments from the Fed raised the likelihood of rate hikes as early as March, and Russia issued increasingly aggressive threats toward Ukraine. The onset of Russia’s invasion in February exacerbated global inflationary pressures while increasing investor uncertainty. Domestic supply shortages, international trade imbalances and rising inflation caused GDP (gross domestic product) to contract in the first and second quarters of the year, although employment and consumer spending proved resilient. Prices for petroleum surged to multi-year highs, while many key agricultural chemicals and industrial metals climbed as well. Accelerating inflationary forces prompted the Fed to implement its most aggressive interest rate increases since the 1980s with a series of five sharp rate hikes, raising the federal funds rate from a range of 0.00% to 0.25% in March to 3.00% to 3.25% in September, with additional rate hikes expected before the end of the year. International central banks generally followed suit, raising rates by varying degrees in efforts to curb local inflation, although most increases remained significantly more modest than those in the United States. Relatively high U.S. interest rates and risk-averse international sentiment pushed U.S. dollar values higher compared to most other currencies, with the ensuing negative impact on global prices for food, fuel and other key, U.S.-dollar-denominated products.
The effects of these interrelated challenges were felt throughout U.S. and international financial markets. The S&P 500® Index, a widely regarded benchmark of U.S. market performance, declined by more than 14% during the reporting period. Although the energy sector generated strong gains, bolstered by elevated oil and gas prices, most other industry areas recorded losses. The more cyclical and growth-oriented sectors of consumer discretionary, real estate and information technology delivered the
weakest returns, while the traditionally defensive and value-oriented consumer staples, utilities and health care sectors outperformed. International stocks lagged compared to their U.S. counterparts, with some emerging markets, such as China, suffering particularly steep losses. A few markets, however, including Brazil, Mexico and the United Arab Emirates, ended the reporting period with little change. Fixed-income markets saw bond prices broadly decline as yields rose along with interest rates. Short-term yields rose faster than long-term yields, producing a yield curve inversion from July through the end of the reporting period, with long-term rates remaining below short-term rates. While floating-rate instruments, which feature variable interest rates that allow investors to benefit from a rising rate environment, provided a degree of insulation from inflation-driven trends, they were not immune to the market’s widespread declines.
While the Fed acknowledges the costs of rising rates in terms of weaker GDP growth and unsettled financial markets over the short term, its primary focus continues to be the longer-term economic impact of inflation. With the latest figures as of the date of this report showing that inflation remains above 8%, versus a target rate of just 2%, the Fed clearly has a distance yet to go, making further rate increases and market volatility more likely in the coming months. The question remains as to whether the Fed and other central banks will manage a so-called “soft landing,” curbing inflation while avoiding a persistent economic slowdown. If they prove successful, we expect that favorable inflation trends and increasingly attractive valuations in both equity and bond markets should eventually translate into sustainable improvements in the investment environment.
Whatever actions the Fed takes and however financial markets react, as a MainStay investor, you can depend on us to continue providing the insight, expertise and service that have long defined New York Life Investments. Thank you for trusting us to help you meet your investment needs.
Sincerely,
Kirk C. Lehneis
President
The opinions expressed are as of the date of this report and are subject to change. There is no guarantee that any forecast made will come to pass. This material does not constitute investment advice and is not intended as an endorsement of any specific investment. Past performance is no guarantee of future results.
Not part of the Annual Report
Investors should refer to the Fund’s Summary Prospectus and/or Prospectus and consider the Fund’s investment objectives, strategies, risks, charges and expenses carefully before investing. The Summary Prospectus and/or Prospectus contain this and other information about the Fund. You may obtain copies of the Fund’s Summary Prospectus, Prospectus and Statement of Additional Information, which includes information about the MainStay Funds Trust's Trustees, free of charge, upon request, by calling toll-free 800-624-6782, by writing to NYLIFE Distributors LLC, Attn: MainStay Marketing Department, 30 Hudson Street, Jersey City, NJ 07302 or by sending an e-mail to MainStayShareholderServices@nylim.com. These documents are also available via the MainStay Funds’ website at newyorklifeinvestments.com. Please read the Fund’s Summary Prospectus and/or Prospectus carefully before investing.
Investment and Performance Comparison (Unaudited)
Performance data quoted represents past performance. Past performance is no guarantee of future results. Because of market volatility and other factors, current performance may be lower or higher than the figures shown. Investment return and principal value will fluctuate, and as a result, when shares are redeemed, they may be worth more or less than their original cost. The graph below depicts the historical performance of Class I shares of the Fund. Performance will vary from class to class based on differences in class-specific expenses and sales charges. For performance information current to the most recent month-end, please call 800-624-6782 or visit newyorklifeinvestments.com.
The performance table and graph do not reflect the deduction of taxes that a shareholder would pay on distributions or Fund share redemptions. Total returns reflect maximum applicable sales charges as indicated in the table below, if any, changes in share price, and reinvestment of dividend and capital gain distributions. The graph assumes the initial investment amount shown below and reflects the deduction of all sales charges that would have applied for the period of investment. Performance figures may reflect certain fee waivers and/or expense limitations, without which total returns may have been lower. For more information on share classes and current fee waivers and/or expense limitations (if any), please refer to the Notes to Financial Statements.

| Average Annual Total Returns for the Year-Ended October 31, 2022 |
| Class | Sales Charge | | Inception
Date | One
Year | Five
Years | Since
Inception | Gross
Expense
Ratio1 |
| Class A Shares | Maximum 3% Initial Sales Charge | With sales charges | 12/17/2012 | -6.55% | 1.87% | 3.22% | 1.01% |
| | | Excluding sales charges | | -3.66 | 2.49 | 3.53 | 1.01 |
| Investor Class Shares2 | Maximum 2.5% Initial Sales Charge | With sales charges | 12/17/2012 | -6.14 | 1.80 | 3.11 | 1.10 |
| | | Excluding sales charges | | -3.73 | 2.42 | 3.43 | 1.10 |
| Class C Shares | Maximum 1% CDSC | With sales charges | 12/17/2012 | -5.39 | 1.65 | 2.67 | 1.85 |
| | if Redeemed Within 18 months of Purchase | Excluding sales charges | | -4.46 | 1.65 | 2.67 | 1.85 |
| Class I Shares | No Sales Charge | | 12/17/2012 | -3.52 | 2.73 | 3.78 | 0.76 |
| Class R2 Shares | No Sales Charge | | 12/17/2012 | -3.75 | 2.39 | 3.43 | 1.11 |
| Class R3 Shares | No Sales Charge | | 2/29/2016 | -3.99 | 2.11 | 3.84 | 1.36 |
| 1. | The gross expense ratios presented reflect the Fund’s “Total Annual Fund Operating Expenses” from the most recent Prospectus, as supplemented, and may differ from other expense ratios disclosed in this report. |
| 2. | Prior to June 30, 2020, the maximum initial sales charge was 3%, which is reflected in the applicable average annual total return figures shown. |
The footnotes on the next page are an integral part of the table and graph and should be carefully read in conjunction with them.
| Benchmark Performance* | One
Year | Five
Years | Since
Inception |
| ICE BofA 1-5 Year BB-B U.S. High Yield Corporate Cash Pay Index1 | -5.94% | 2.60% | 3.69% |
| Morningstar High Yield Bond Category Average2 | -11.11 | 1.19 | 2.94 |
| * | Returns for indices reflect no deductions for fees, expenses or taxes, except for foreign withholding taxes where applicable. Results assume reinvestment of all dividends and capital gains. An investment cannot be made directly in an index. |
| 1. | ICE BofA 1-5 Year BB-B U.S. High Yield Corporate Cash Pay Index is the Fund's primary broad-based securities market index for comparison purposes. The ICE BofA 1-5 Year BB-B U.S. High Yield Corporate Cash Pay Index generally tracks the performance of BB-B rated U.S. dollar-denominated corporate bonds publicly issued in the U.S. domestic market with maturities of 1 to 5 years. |
| 2. | The Morningstar High Yield Bond Category Average is representative of funds that concentrate on lower-quality bonds, which are riskier than those of higher-quality companies. These portfolios primarily invest in U.S. high-income debt securities where at least 65% or more of bond assets are not rated or are rated by a major agency such as Standard & Poor’s or Moody’s at the level of BB and below. Results are based on average total returns of similar funds with all dividends and capital gain distributions reinvested. |
The footnotes on the preceding page are an integral part of the table and graph and should be carefully read in conjunction with them.
| 6 | MainStay MacKay Short Duration High Yield Fund |
Cost in Dollars of a $1,000 Investment in MainStay MacKay Short Duration High Yield Fund (Unaudited)
The example below is intended to describe the fees and expenses borne by shareholders during the six-month period from May 1, 2022 to October 31, 2022, and the impact of those costs on your investment.
Example
As a shareholder of the Fund you incur two types of costs: (1) transaction costs, including exchange fees and sales charges (loads) on purchases (as applicable), and (2) ongoing costs, including management fees, distribution and/or service (12b-1) fees and other Fund expenses (as applicable). This example is intended to help you understand your ongoing costs (in dollars) of investing in the Fund and to compare these costs with the ongoing costs of investing in other mutual funds. The example is based on an investment of $1,000 made at the beginning of the six-month period and held for the entire period from May 1, 2022 to October 31, 2022.
This example illustrates your Fund’s ongoing costs in two ways:
Actual Expenses
The second and third data columns in the table below provide information about actual account values and actual expenses. You may use the information in these columns, together with the amount you invested, to estimate the expenses that you paid during the six months ended October 31, 2022. Simply divide your account value by $1,000 (for example, an
$8,600 account value divided by $1,000 = 8.6), then multiply the result by the number under the heading entitled “Expenses Paid During Period” to estimate the expenses you paid on your account during this period.
Hypothetical Example for Comparison Purposes
The fourth and fifth data columns in the table below provide information about hypothetical account values and hypothetical expenses based on the Fund’s actual expense ratio and an assumed rate of return of 5% per year before expenses, which is not the Fund’s actual return. The hypothetical account values and expenses may not be used to estimate the actual ending account balances or expenses you paid for the six-month period shown. You may use this information to compare the ongoing costs of investing in the Fund with the ongoing costs of investing in other mutual funds. To do so, compare this 5% hypothetical example with the 5% hypothetical examples that appear in the shareholder reports of the other mutual funds.
Please note that the expenses shown in the table are meant to highlight your ongoing costs only and do not reflect any transactional costs, such as exchange fees or sales charges (loads). Therefore, the fourth and fifth data columns of the table are useful in comparing ongoing costs only and will not help you determine the relative total costs of owning different funds. In addition, if these transactional costs were included, your costs would have been higher.
| Share Class | Beginning
Account
Value
5/1/22 | Ending Account
Value (Based
on Actual
Returns and
Expenses)
10/31/22 | Expenses
Paid
During
Period1 | Ending Account
Value (Based
on Hypothetical
5% Annualized
Return and
Actual Expenses)
10/31/22 | Expenses
Paid
During
Period1 | Net Expense
Ratio
During
Period2 |
| Class A Shares | $1,000.00 | $984.00 | $5.15 | $1,020.01 | $5.24 | 1.03% |
| Investor Class Shares | $1,000.00 | $983.60 | $5.55 | $1,019.61 | $5.65 | 1.11% |
| Class C Shares | $1,000.00 | $979.90 | $9.28 | $1,015.83 | $9.45 | 1.86% |
| Class I Shares | $1,000.00 | $985.20 | $3.95 | $1,021.22 | $4.02 | 0.79% |
| Class R2 Shares | $1,000.00 | $983.50 | $5.70 | $1,019.46 | $5.80 | 1.14% |
| Class R3 Shares | $1,000.00 | $982.30 | $6.95 | $1,018.20 | $7.07 | 1.39% |
| 1. | Expenses are equal to the Fund’s annualized expense ratio of each class multiplied by the average account value over the period, divided by 365 and multiplied by 184 (to reflect the six-month period). The table above represents the actual expenses incurred during the six-month period. In addition to the fees and expenses which the Fund bears directly, it also indirectly bears a pro rata share of the fees and expenses of the underlying funds in which it invests. Such indirect expenses are not included in the above-reported expense figures. |
| 2. | Expenses are equal to the Fund's annualized expense ratio to reflect the six-month period. |
Portfolio Composition as of October 31, 2022 (Unaudited)
See Portfolio of Investments beginning on page 11 for specific holdings within these categories. The Fund's holdings are subject to change.
Top Ten Holdings and/or Issuers Held as of October 31, 2022 (excluding short-term investments) (Unaudited)
| 1. | HCA, Inc., 5.375%-8.36%, due 12/15/23–2/15/26 |
| 2. | VICI Properties LP, 3.50%-5.625%, due 5/1/24–6/15/25 |
| 3. | Carnival Corp., 5.75%-10.50%, due 2/1/26–3/1/27 |
| 4. | Sprint Corp., 7.875%, due 9/15/23 |
| 5. | T-Mobile US, Inc., 2.25%-5.375%, due 2/15/26–2/1/28 |
| 6. | FS Energy and Power Fund, 7.50%, due 8/15/23 |
| 7. | Ford Motor Credit Co. LLC, 2.30%-5.584%, due 11/17/23–8/10/26 |
| 8. | Churchill Downs, Inc., 5.50%-5.76%, due 12/27/24–4/1/27 |
| 9. | TransDigm, Inc., 6.25%-8.00%, due 12/15/25–3/15/26 |
| 10. | DISH Network Corp., 2.375%-3.375%, due 3/15/24–8/15/26 |
| 8 | MainStay MacKay Short Duration High Yield Fund |
Portfolio Management Discussion and Analysis (Unaudited)
Questions answered by portfolio manager Andrew Susser of MacKay Shields LLC, the Fund’s Subadvisor.
How did MainStay MacKay Short Duration High Yield Fund perform relative to its benchmark and peer group during the 12 months ended October 31, 2022?
For the 12 months ended October 31, 2022, Class I shares of MainStay MacKay Short Duration High Yield Fund returned −3.52%, outperforming the −5.94% return of the Fund’s benchmark, the ICE BofA 1–5 Year BB-B U.S. High Yield Corporate Cash Pay Index (the "Index"). Over the same period, Class I shares also outperformed the −11.11% return of the Morningstar High Yield Bond Category Average.1
What factors affected the Fund’s relative performance during the reporting period?
The high-yield market finished 2021 on a high note, performing well in December. However, the positive sentiment at the end of 2021 did not spill over into the new year, as risk assets sold-off on inflationary fears, expected tighter monetary policy, and the mounting tensions and eventual invasion of Ukraine by Russia. The Index declined more than 2% in the first quarter of 2022. The selling pressure in risk assets picked up steam in the second quarter of 2022 as interest rate fears gave way to fears of a recession, causing the Index to decline over 5%, while the ICE BofA U.S. High Yield Index2 fell 9.97%, and S&P 500® Index3 fell 16.11%.
The high-yield market started the third quarter of 2022 in rally mode, up almost 8% for the first half of the quarter, before inflation and employment data led to dramatically higher rates. The 5-Year Treasury rate increased 105 basis points to 4.06% by the end of the quarter. (A basis point is one one-hundredth of a percentage point.) Relatively speaking, the Index held up well, scrounging up a slightly positive rate of return for the quarter (+0.20%) compared to the S&P 500® Index and the Bloomberg U.S. Aggregate Bond Index,4which declined 5.28% and 4.75%, respectively. By the end of the reporting period, the Index return compared favorably to the ICE BofA U.S. High Yield Index decline of more than 12%.
Although returns were down for the reporting period on an absolute basis, the Fund materially outperformed the Index, primarily due to strong security selection in the energy, healthcare and media sectors.
During the reporting period, were there any market events that materially impacted the Fund’s performance or liquidity?
The sell-off in risk assets, coupled with the sharp move higher in U.S. Treasury yields, had a negative impact on the high-yield market and impacted the Fund's return during the reporting period.
What was the Fund’s duration5 strategy during the reporting period?
The Fund’s duration is the result of our bottom-up fundamental analysis and is a residual of the investment process. However, the Fund did maintain a lower duration than the Index throughout the reporting period, which was beneficial to returns. As of October 31, 2022, the Fund’s modified duration to worst6 was 1.99 years, while the modified duration to worst of the Index was 3.01 years.
During the reporting period, which sectors were the strongest positive contributors to the Fund’s relative performance and which sectors were particularly weak?
A top contributor to the Fund’s relative performance came from security selection in health care. (Contributions take weightings and total returns into account.) Not owning the bonds of Community Health and being underweight on Bausch Health Companies bolstered returns. A slight overweight and strong selection in the energy sector also contributed positively during the reporting period, led by holdings in oil & gas exploration & production company Talos Energy, and service provider Nine Energy Service. Security selection and an underweight exposure to financials was further helpful in gradually increasing returns.
What were some of the Fund’s largest purchases and sales during the reporting period?
During the reporting period, the Fund closed out positions in real estate investment trust MGM Growth Properties, media company Meredith and managed health care provider Molina Healthcare. The Fund initiated positions in recreational vehicle manufacturer Winnebago Industries, personal services company Service Corporation International and health care company Owens & Minor.
| 1. | See page 5 for other share class returns, which may be higher or lower than Class I share returns. See page 6 for more information on benchmark and peer group returns. |
| 2. | The ICE BofA U.S. High Yield Index is an unmanaged index that tracks the performance of U.S. dollar denominated, below investment-grade rated corporate debt publicly issued in the U.S. domestic market. Results assume reinvestment of all dividends and capital gains. An investment cannot be made directly in an index. |
| 3. | The S&P 500® Index is widely regarded as the standard index for measuring large-cap U.S. stock market performance. Results assume reinvestment of all dividends and capital gains. An investment cannot be made directly in an index. |
| 4. | The Bloomberg U.S. Aggregate Bond Index is a broad-based benchmark that measures the performance of the investment grade, U.S. dollar-denominated, fixed-rate taxable bond market, including Treasurys, government-related and corporate securities, mortgage-backed securities (agency fixed-rate and hybrid adjustable rate mortgage pass-throughs), asset-backed securities, and commercial mortgage-backed securities. Results assume reinvestment of all dividends and capital gains. An investment cannot be made directly in an index. |
| 5. | Duration is a measure of the price sensitivity of a fixed-income investment to changes in interest rates. Duration is expressed as a number of years and is considered a more accurate sensitivity gauge than average maturity. |
| 6. | Modified duration is inversely related to the approximate percentage change in price for a given change in yield. Duration to worst is the duration of a bond computed using the bond’s nearest call date or maturity, whichever comes first. This measure ignores future cash flow fluctuations due to embedded optionality. |
How did the Fund’s sector weightings change during the reporting period?
During the reporting period there were no material changes to the sector weightings in the Fund. On the margin, we slightly increased basic industry, real estate and health care exposure and trimmed exposure to telecom, automotive and services.
How was the Fund positioned at the end of the reporting period?
As of October 31, 2022, relative to the Index, the Fund held overweight exposure to energy, basic industry, materials and health care, and underweight exposure to telecom, capital goods and services.
The opinions expressed are those of the portfolio manager as of the date of this report and are subject to change. There is no guarantee that any forecasts will come to pass. This material does not constitute investment advice and is not intended as an endorsement of any specific investment.
| 10 | MainStay MacKay Short Duration High Yield Fund |
Portfolio of Investments October 31, 2022†
| | Principal
Amount | Value |
| Long-Term Bonds 91.7% |
| Convertible Bonds 1.8% |
| Investment Companies 0.1% |
| Ares Capital Corp. | | |
| 4.625%, due 3/1/24 | $ 2,000,000 | $ 2,178,750 |
| Media 1.6% |
| DISH Network Corp. | | |
| 2.375%, due 3/15/24 | 21,650,000 | 19,717,737 |
| 3.375%, due 8/15/26 | 2,685,000 | 1,863,390 |
| | | 21,581,127 |
| Oil & Gas 0.1% |
| Gulfport Energy Operating Corp. | | |
| 10.00% (10.00% Cash or 15.00% PIK), due 12/29/49 (a)(b) | 260,000 | 1,602,068 |
Total Convertible Bonds
(Cost $25,508,683) | | 25,361,945 |
| Corporate Bonds 74.3% |
| Advertising 0.3% |
| Outfront Media Capital LLC | | |
| 6.25%, due 6/15/25 (c) | 4,000,000 | 3,944,440 |
| Aerospace & Defense 2.0% |
| F-Brasile SpA | | |
| Series XR | | |
| 7.375%, due 8/15/26 (c) | 3,400,000 | 2,686,000 |
| TransDigm UK Holdings plc | | |
| 6.875%, due 5/15/26 | 3,100,000 | 3,025,647 |
| TransDigm, Inc. (c) | | |
| 6.25%, due 3/15/26 | 11,985,000 | 11,822,124 |
| 8.00%, due 12/15/25 | 10,005,000 | 10,180,087 |
| | | 27,713,858 |
| Airlines 0.7% |
| American Airlines, Inc. | | |
| 5.50%, due 4/20/26 (c) | 1,500,000 | 1,428,483 |
| Delta Air Lines, Inc. | | |
| 4.50%, due 10/20/25 (c) | 2,000,000 | 1,948,873 |
| 7.00%, due 5/1/25 (c) | 4,375,000 | 4,435,319 |
| 7.375%, due 1/15/26 | 1,500,000 | 1,531,485 |
| Spirit Loyalty Cayman Ltd. | | |
| 8.00%, due 9/20/25 (c) | 541,669 | 550,227 |
| | | 9,894,387 |
| | Principal
Amount | Value |
| |
| Auto Manufacturers 2.8% |
| Ford Motor Credit Co. LLC | | |
| 2.30%, due 2/10/25 | $ 5,000,000 | $ 4,522,500 |
| 2.70%, due 8/10/26 | 3,200,000 | 2,772,736 |
| 3.37%, due 11/17/23 | 4,000,000 | 3,860,770 |
| 3.375%, due 11/13/25 | 7,000,000 | 6,350,470 |
| 3.664%, due 9/8/24 | 1,150,000 | 1,090,091 |
| 5.125%, due 6/16/25 | 3,000,000 | 2,894,400 |
| 5.584%, due 3/18/24 | 840,000 | 827,301 |
| JB Poindexter & Co., Inc. | | |
| 7.125%, due 4/15/26 (c) | 17,031,000 | 16,234,460 |
| | | 38,552,728 |
| Auto Parts & Equipment 1.6% |
| Adient Global Holdings Ltd. | | |
| 4.875%, due 8/15/26 (c) | 6,000,000 | 5,370,000 |
| IHO Verwaltungs GmbH (b)(c) | | |
| 4.75% (4.75% Cash or 5.50% PIK), due 9/15/26 | 6,760,000 | 5,692,712 |
| 6.00% (6.00% Cash or 6.75% PIK), due 5/15/27 | 12,460,000 | 10,700,025 |
| | | 21,762,737 |
| Building Materials 0.6% |
| Koppers, Inc. | | |
| 6.00%, due 2/15/25 (c) | 5,730,000 | 5,128,350 |
| Summit Materials LLC | | |
| 6.50%, due 3/15/27 (c) | 3,730,000 | 3,579,057 |
| | | 8,707,407 |
| Chemicals 1.7% |
| Avient Corp. | | |
| 5.25%, due 3/15/23 | 1,750,000 | 1,745,553 |
| 5.75%, due 5/15/25 (c) | 6,845,000 | 6,700,707 |
| Cheever Escrow Issuer LLC | | |
| 7.125%, due 10/1/27 (c) | 1,356,000 | 1,244,808 |
| GPD Cos., Inc. | | |
| 10.125%, due 4/1/26 (c) | 7,385,000 | 6,602,477 |
| Iris Holdings, Inc. | | |
| 8.75% (8.75% Cash or 9.50% PIK), due 2/15/26 (b)(c) | 3,000,000 | 2,637,923 |
| NOVA Chemicals Corp. | | |
| 4.875%, due 6/1/24 (c) | 2,150,000 | 2,090,875 |
| SCIL IV LLC | | |
| 5.375%, due 11/1/26 (c) | 3,325,000 | 2,643,142 |
| | | 23,665,485 |
| Coal 0.2% |
| Coronado Finance Pty. Ltd. | | |
| 10.75%, due 5/15/26 (c) | 2,800,000 | 2,915,500 |
The notes to the financial statements are an integral part of, and should be read in conjunction with, the financial statements.
11
Portfolio of Investments October 31, 2022† (continued)
| | Principal
Amount | Value |
| Corporate Bonds (continued) |
| Commercial Services 2.6% |
| Alta Equipment Group, Inc. | | |
| 5.625%, due 4/15/26 (c) | $ 5,000,000 | $ 4,318,550 |
| Ashtead Capital, Inc. | | |
| 4.375%, due 8/15/27 (c) | 2,000,000 | 1,806,042 |
| Graham Holdings Co. | | |
| 5.75%, due 6/1/26 (c) | 8,100,000 | 7,897,500 |
| Herc Holdings, Inc. | | |
| 5.50%, due 7/15/27 (c) | 2,000,000 | 1,892,500 |
| Ritchie Bros Auctioneers, Inc. | | |
| 5.375%, due 1/15/25 (c) | 7,785,000 | 7,668,225 |
| Service Corp. International | | |
| 7.50%, due 4/1/27 | 3,150,000 | 3,247,481 |
| Williams Scotsman International, Inc. | | |
| 6.125%, due 6/15/25 (c) | 8,219,000 | 8,202,809 |
| | | 35,033,107 |
| Distribution & Wholesale 0.2% |
| G-III Apparel Group Ltd. | | |
| 7.875%, due 8/15/25 (c) | 3,500,000 | 3,314,955 |
| Diversified Financial Services 1.4% |
| AG TTMT Escrow Issuer LLC | | |
| 8.625%, due 9/30/27 (c) | 3,500,000 | 3,513,125 |
| Credit Acceptance Corp. | | |
| 5.125%, due 12/31/24 (c) | 6,555,000 | 6,095,368 |
| Enact Holdings, Inc. | | |
| 6.50%, due 8/15/25 (c) | 3,260,000 | 3,211,426 |
| Oxford Finance LLC | | |
| 6.375%, due 2/1/27 (c) | 1,000,000 | 915,000 |
| PRA Group, Inc. | | |
| 7.375%, due 9/1/25 (c) | 2,650,000 | 2,534,843 |
| StoneX Group, Inc. | | |
| 8.625%, due 6/15/25 (c) | 3,050,000 | 3,011,875 |
| | | 19,281,637 |
| Electric 1.3% |
| DPL, Inc. | | |
| 4.125%, due 7/1/25 | 3,650,000 | 3,445,673 |
| NextEra Energy Operating Partners LP (c) | | |
| 3.875%, due 10/15/26 | 3,500,000 | 3,244,325 |
| 4.25%, due 7/15/24 | 4,030,000 | 3,907,166 |
| NRG Energy, Inc. | | |
| 6.625%, due 1/15/27 | 1,500,000 | 1,500,675 |
| | Principal
Amount | Value |
| |
| Electric (continued) |
| Vistra Corp. (c)(d)(e) | | |
| 7.00% (5 Year Treasury Constant Maturity Rate + 5.74%), due 12/15/26 | $ 1,500,000 | $ 1,326,907 |
| 8.00% (5 Year Treasury Constant Maturity Rate + 6.93%), due 10/15/26 | 4,100,000 | 3,895,000 |
| | | 17,319,746 |
| Electrical Components & Equipment 0.6% |
| WESCO Distribution, Inc. | | |
| 7.125%, due 6/15/25 (c) | 7,650,000 | 7,724,205 |
| Entertainment 3.5% |
| Churchill Downs, Inc. | | |
| 5.50%, due 4/1/27 (c) | 19,375,000 | 18,518,238 |
| International Game Technology plc (c) | | |
| 4.125%, due 4/15/26 | 9,950,000 | 9,233,600 |
| 6.25%, due 1/15/27 | 1,630,000 | 1,614,939 |
| 6.50%, due 2/15/25 | 1,363,000 | 1,364,145 |
| Live Nation Entertainment, Inc. | | |
| 6.50%, due 5/15/27 (c) | 6,420,000 | 6,385,410 |
| Vail Resorts, Inc. | | |
| 6.25%, due 5/15/25 (c) | 10,582,000 | 10,529,090 |
| | | 47,645,422 |
| Food 0.4% |
| B&G Foods, Inc. | | |
| 5.25%, due 4/1/25 | 4,300,000 | 3,907,711 |
| Post Holdings, Inc. | | |
| 5.75%, due 3/1/27 (c) | 350,000 | 338,331 |
| United Natural Foods, Inc. | | |
| 6.75%, due 10/15/28 (c) | 1,000,000 | 965,870 |
| | | 5,211,912 |
| Food Service 0.9% |
| Aramark Services, Inc. | | |
| 6.375%, due 5/1/25 (c) | 12,185,000 | 12,054,103 |
| Forest Products & Paper 0.1% |
| Mercer International, Inc. | | |
| 5.50%, due 1/15/26 | 1,000,000 | 936,855 |
| Smurfit Kappa Treasury Funding DAC | | |
| 7.50%, due 11/20/25 | 1,000,000 | 1,044,115 |
| | | 1,980,970 |
The notes to the financial statements are an integral part of, and should be read in conjunction with, the financial statements.
| 12 | MainStay MacKay Short Duration High Yield Fund |
| | Principal
Amount | Value |
| Corporate Bonds (continued) |
| Gas 0.4% |
| AmeriGas Partners LP | | |
| 5.625%, due 5/20/24 | $ 6,000,000 | $ 5,863,101 |
| Healthcare-Services 4.5% |
| Catalent Pharma Solutions, Inc. | | |
| 5.00%, due 7/15/27 (c) | 5,216,000 | 4,903,927 |
| Encompass Health Corp. | | |
| 5.75%, due 9/15/25 | 4,335,000 | 4,295,524 |
| HCA, Inc. | | |
| 5.375%, due 2/1/25 | 13,100,000 | 12,934,612 |
| 5.875%, due 2/15/26 | 2,000,000 | 1,980,688 |
| 7.50%, due 12/15/23 | 10,000,000 | 10,224,023 |
| 7.58%, due 9/15/25 | 5,623,000 | 5,817,082 |
| 8.36%, due 4/15/24 | 10,000,000 | 10,219,164 |
| IQVIA, Inc. | | |
| 5.00%, due 10/15/26 (c) | 5,515,000 | 5,257,339 |
| ModivCare, Inc. | | |
| 5.875%, due 11/15/25 (c) | 6,000,000 | 5,699,553 |
| | | 61,331,912 |
| Holding Companies-Diversified 0.8% |
| Stena International SA | | |
| 6.125%, due 2/1/25 (c) | 12,220,000 | 11,431,258 |
| Home Builders 1.3% |
| Adams Homes, Inc. | | |
| 7.50%, due 2/15/25 (c) | 6,895,000 | 5,578,361 |
| Century Communities, Inc. | | |
| 6.75%, due 6/1/27 | 3,000,000 | 2,863,800 |
| Installed Building Products, Inc. | | |
| 5.75%, due 2/1/28 (c) | 4,000,000 | 3,535,000 |
| Meritage Homes Corp. | | |
| 5.125%, due 6/6/27 | 1,000,000 | 895,404 |
| 6.00%, due 6/1/25 | 1,000,000 | 970,945 |
| STL Holding Co. LLC | | |
| 7.50%, due 2/15/26 (c) | 1,645,000 | 1,433,387 |
| Winnebago Industries, Inc. | | |
| 6.25%, due 7/15/28 (c) | 2,575,000 | 2,396,173 |
| | | 17,673,070 |
| Household Products & Wares 0.2% |
| Central Garden & Pet Co. | | |
| 5.125%, due 2/1/28 | 2,000,000 | 1,829,787 |
| Spectrum Brands, Inc. | | |
| 5.75%, due 7/15/25 | 1,000,000 | 986,680 |
| | | 2,816,467 |
| | Principal
Amount | Value |
| |
| Housewares 0.1% |
| Newell Brands, Inc. | | |
| 4.875%, due 6/1/25 | $ 1,750,000 | $ 1,689,555 |
| Insurance 0.5% |
| NMI Holdings, Inc. | | |
| 7.375%, due 6/1/25 (c) | 6,485,000 | 6,478,774 |
| Internet 1.5% |
| Netflix, Inc. | | |
| 5.75%, due 3/1/24 | 4,980,000 | 4,980,000 |
| 5.875%, due 2/15/25 | 665,000 | 668,325 |
| NortonLifeLock, Inc. (c) | | |
| 5.00%, due 4/15/25 | 7,175,000 | 6,962,799 |
| 6.75%, due 9/30/27 | 2,000,000 | 1,971,590 |
| Uber Technologies, Inc. | | |
| 7.50%, due 5/15/25 (c) | 6,345,000 | 6,348,173 |
| | | 20,930,887 |
| Investment Companies 2.6% |
| FS Energy and Power Fund | | |
| 7.50%, due 8/15/23 (c) | 22,844,000 | 22,912,532 |
| Icahn Enterprises LP | | |
| 4.75%, due 9/15/24 | 12,500,000 | 12,164,125 |
| | | 35,076,657 |
| Iron & Steel 0.9% |
| Allegheny Ludlum LLC | | |
| 6.95%, due 12/15/25 | 2,430,000 | 2,369,348 |
| Mineral Resources Ltd. (c) | | |
| 8.00%, due 11/1/27 | 1,500,000 | 1,475,565 |
| 8.125%, due 5/1/27 | 8,625,000 | 8,581,875 |
| | | 12,426,788 |
| Leisure Time 2.4% |
| Carnival Corp. (c) | | |
| 5.75%, due 3/1/27 | 10,900,000 | 7,553,537 |
| 7.625%, due 3/1/26 | 9,660,000 | 7,263,837 |
| 10.50%, due 2/1/26 | 16,500,000 | 16,169,340 |
| Lindblad Expeditions LLC | | |
| 6.75%, due 2/15/27 (c) | 1,825,000 | 1,623,513 |
| | | 32,610,227 |
| Lodging 1.4% |
| Boyd Gaming Corp. | | |
| 4.75%, due 12/1/27 | 5,300,000 | 4,882,996 |
| Genting New York LLC | | |
| 3.30%, due 2/15/26 (c) | 1,000,000 | 876,693 |
The notes to the financial statements are an integral part of, and should be read in conjunction with, the financial statements.
13
Portfolio of Investments October 31, 2022† (continued)
| | Principal
Amount | Value |
| Corporate Bonds (continued) |
| Lodging (continued) |
| Hilton Domestic Operating Co., Inc. | | |
| 5.375%, due 5/1/25 (c) | $ 5,590,000 | $ 5,506,150 |
| Hilton Worldwide Finance LLC | | |
| 4.875%, due 4/1/27 | 1,315,000 | 1,249,250 |
| Hyatt Hotels Corp. | | |
| 5.625%, due 4/23/25 (f) | 4,070,000 | 3,998,553 |
| Marriott International, Inc. | | |
| Series Z | | |
| 4.15%, due 12/1/23 | 1,500,000 | 1,482,244 |
| Series EE | | |
| 5.75%, due 5/1/25 | 932,000 | 940,405 |
| | | 18,936,291 |
| Machinery-Diversified 0.6% |
| Briggs & Stratton Corp. Escrow Claim Shares | | |
| 6.875%, due 12/15/20 (g)(h) | 3,425,000 | 34,250 |
| Stevens Holding Co., Inc. | | |
| 6.125%, due 10/1/26 (c) | 3,000,000 | 3,003,900 |
| TK Elevator U.S. Newco, Inc. | | |
| 5.25%, due 7/15/27 (c) | 5,613,000 | 5,030,651 |
| | | 8,068,801 |
| Media 3.2% |
| CCO Holdings LLC (c) | | |
| 5.00%, due 2/1/28 | 7,000,000 | 6,335,000 |
| 5.125%, due 5/1/27 | 1,500,000 | 1,389,720 |
| 5.50%, due 5/1/26 | 13,485,000 | 12,979,312 |
| CSC Holdings LLC | | |
| 5.25%, due 6/1/24 | 9,250,000 | 8,972,500 |
| DIRECTV Financing LLC | | |
| 5.875%, due 8/15/27 (c) | 6,750,000 | 6,079,050 |
| LCPR Senior Secured Financing DAC | | |
| 6.75%, due 10/15/27 (c) | 5,475,000 | 5,105,438 |
| Sterling Entertainment Enterprises LLC | | |
| 10.25%, due 1/15/25 (a)(h)(i) | 3,000,000 | 2,754,000 |
| | | 43,615,020 |
| Metal Fabricate & Hardware 0.1% |
| Advanced Drainage Systems, Inc. | | |
| 5.00%, due 9/30/27 (c) | 1,000,000 | 927,240 |
| Mining 1.9% |
| Arconic Corp. | | |
| 6.00%, due 5/15/25 (c) | 3,000,000 | 2,970,570 |
| | Principal
Amount | Value |
| |
| Mining (continued) |
| Century Aluminum Co. | | |
| 7.50%, due 4/1/28 (c) | $ 6,135,000 | $ 5,263,585 |
| Compass Minerals International, Inc. | | |
| 4.875%, due 7/15/24 (c) | 10,310,000 | 9,769,441 |
| First Quantum Minerals Ltd. | | |
| 7.50%, due 4/1/25 (c) | 2,500,000 | 2,425,000 |
| IAMGOLD Corp. | | |
| 5.75%, due 10/15/28 (c) | 1,000,000 | 670,000 |
| Novelis Corp. | | |
| 3.25%, due 11/15/26 (c) | 5,000,000 | 4,376,183 |
| | | 25,474,779 |
| Miscellaneous—Manufacturing 1.1% |
| Amsted Industries, Inc. | | |
| 5.625%, due 7/1/27 (c) | 3,000,000 | 2,775,000 |
| EnPro Industries, Inc. | | |
| 5.75%, due 10/15/26 | 1,000,000 | 955,000 |
| FXI Holdings, Inc. (c) | | |
| 7.875%, due 11/1/24 | 960,000 | 823,661 |
| 12.25%, due 11/15/26 | 73,000 | 63,306 |
| Gates Global LLC | | |
| 6.25%, due 1/15/26 (c) | 1,500,000 | 1,440,000 |
| Hillenbrand, Inc. | | |
| 5.00%, due 9/15/26 (f) | 6,080,000 | 5,724,240 |
| 5.75%, due 6/15/25 | 3,515,000 | 3,488,637 |
| | | 15,269,844 |
| Oil & Gas 7.1% |
| Ascent Resources Utica Holdings LLC (c) | | |
| 7.00%, due 11/1/26 | 3,900,000 | 3,841,500 |
| 9.00%, due 11/1/27 | 1,556,000 | 1,898,320 |
| California Resources Corp. | | |
| 7.125%, due 2/1/26 (c) | 4,520,000 | 4,433,261 |
| Chevron USA, Inc. | | |
| 3.90%, due 11/15/24 | 4,550,000 | 4,468,572 |
| Chord Energy Corp. | | |
| 6.375%, due 6/1/26 (c) | 2,780,000 | 2,715,782 |
| Civitas Resources, Inc. | | |
| 5.00%, due 10/15/26 (c) | 1,045,000 | 961,860 |
| Colgate Energy Partners III LLC | | |
| 7.75%, due 2/15/26 (c) | 3,000,000 | 2,984,134 |
| Encino Acquisition Partners Holdings LLC | | |
| 8.50%, due 5/1/28 (c) | 3,715,000 | 3,480,544 |
| EQT Corp. | | |
| 6.125%, due 2/1/25 (f) | 7,850,000 | 7,869,390 |
| Gulfport Energy Corp. | | |
| 8.00%, due 5/17/26 | 88,094 | 87,830 |
The notes to the financial statements are an integral part of, and should be read in conjunction with, the financial statements.
| 14 | MainStay MacKay Short Duration High Yield Fund |
| | Principal
Amount | Value |
| Corporate Bonds (continued) |
| Oil & Gas (continued) |
| Gulfport Energy Corp. (continued) | | |
| 8.00%, due 5/17/26 (c) | $ 4,510,560 | $ 4,497,028 |
| Gulfport Energy Operating Corp. Escrow Claim Shares (g)(i) | | |
| 6.00%, due 10/15/24 | 2,245,000 | — |
| 6.625%, due 5/1/23 | 4,452,000 | — |
| Hess Corp. | | |
| 3.50%, due 7/15/24 | 910,000 | 877,506 |
| Laredo Petroleum, Inc. | | |
| 10.125%, due 1/15/28 | 2,750,000 | 2,701,875 |
| Matador Resources Co. | | |
| 5.875%, due 9/15/26 | 7,220,000 | 7,093,650 |
| Occidental Petroleum Corp. | | |
| 5.50%, due 12/1/25 | 2,000,000 | 2,006,000 |
| 5.55%, due 3/15/26 | 1,000,000 | 1,015,000 |
| 5.875%, due 9/1/25 | 3,160,000 | 3,183,700 |
| 8.00%, due 7/15/25 | 5,000,000 | 5,278,050 |
| Parkland Corp. | | |
| 5.875%, due 7/15/27 (c) | 2,070,000 | 1,944,858 |
| PDC Energy, Inc. | | |
| 5.75%, due 5/15/26 | 2,775,000 | 2,660,282 |
| 6.125%, due 9/15/24 | 2,450,000 | 2,425,689 |
| Permian Resources Operating LLC | | |
| 5.375%, due 1/15/26 (c) | 6,100,000 | 5,634,875 |
| Range Resources Corp. | | |
| 4.875%, due 5/15/25 | 3,000,000 | 2,893,785 |
| ROCC Holdings LLC | | |
| 9.25%, due 8/15/26 (c) | 1,546,000 | 1,525,175 |
| Southwestern Energy Co. | | |
| 5.70%, due 1/23/25 (f) | 2,199,000 | 2,161,083 |
| Talos Production, Inc. | | |
| 12.00%, due 1/15/26 | 11,410,000 | 12,099,735 |
| Transocean Guardian Ltd. | | |
| 5.875%, due 1/15/24 (c) | 922,750 | 896,978 |
| Transocean Pontus Ltd. | | |
| 6.125%, due 8/1/25 (c) | 3,690,400 | 3,552,342 |
| Transocean Poseidon Ltd. | | |
| 6.875%, due 2/1/27 (c) | 2,397,500 | 2,295,606 |
| | | 97,484,410 |
| Oil & Gas Services 0.6% |
| Bristow Group, Inc. | | |
| 6.875%, due 3/1/28 (c) | 3,000,000 | 2,776,858 |
| Nine Energy Service, Inc. | | |
| 8.75%, due 11/1/23 (c) | 3,775,000 | 3,293,347 |
| | Principal
Amount | Value |
| |
| Oil & Gas Services (continued) |
| Weatherford International Ltd. | | |
| 11.00%, due 12/1/24 (c) | $ 2,334,000 | $ 2,398,893 |
| | | 8,469,098 |
| Packaging & Containers 0.3% |
| Cascades, Inc. | | |
| 5.125%, due 1/15/26 (c) | 4,831,000 | 4,338,625 |
| Pharmaceuticals 0.9% |
| 1375209 BC Ltd. | | |
| 9.00%, due 1/30/28 (c) | 3,000,000 | 2,902,500 |
| Bausch Health Cos., Inc. (c) | | |
| 11.00%, due 9/30/28 | 4,435,000 | 3,414,950 |
| 14.00%, due 10/15/30 | 176,000 | 100,760 |
| Endo DAC | | |
| 5.875%, due 10/15/24 (c)(g)(j) | 4,150,000 | 3,279,286 |
| Prestige Brands, Inc. | | |
| 5.125%, due 1/15/28 (c) | 2,500,000 | 2,323,175 |
| | | 12,020,671 |
| Pipelines 5.5% |
| Antero Midstream Partners LP | | |
| 5.75%, due 3/1/27 (c) | 5,835,000 | 5,556,671 |
| EQM Midstream Partners LP | | |
| 4.125%, due 12/1/26 | 675,000 | 596,456 |
| 6.00%, due 7/1/25 (c) | 2,195,000 | 2,125,890 |
| FTAI Infra Escrow Holdings LLC | | |
| 10.50%, due 6/1/27 (c) | 2,700,000 | 2,647,350 |
| Genesis Energy LP | | |
| 5.625%, due 6/15/24 | 2,050,000 | 2,003,875 |
| 6.25%, due 5/15/26 | 2,190,000 | 2,049,150 |
| 6.50%, due 10/1/25 | 3,640,000 | 3,490,456 |
| Hess Midstream Operations LP | | |
| 5.625%, due 2/15/26 (c) | 6,349,000 | 6,226,909 |
| Holly Energy Partners LP | | |
| 6.375%, due 4/15/27 (c) | 1,500,000 | 1,443,698 |
| New Fortress Energy, Inc. | | |
| 6.50%, due 9/30/26 (c) | 1,500,000 | 1,455,000 |
| NGL Energy Operating LLC | | |
| 7.50%, due 2/1/26 (c) | 2,550,000 | 2,306,828 |
| NuStar Logistics LP | | |
| 5.75%, due 10/1/25 | 1,500,000 | 1,446,347 |
| PBF Logistics LP | | |
| 6.875%, due 5/15/23 | 4,000,000 | 4,002,000 |
| Plains All American Pipeline LP | | |
| Series B | | |
| 6.125%, due 11/28/22 (e)(k) | 18,663,000 | 15,499,621 |
The notes to the financial statements are an integral part of, and should be read in conjunction with, the financial statements.
15
Portfolio of Investments October 31, 2022† (continued)
| | Principal
Amount | Value |
| Corporate Bonds (continued) |
| Pipelines (continued) |
| Rockies Express Pipeline LLC | | |
| 3.60%, due 5/15/25 (c) | $ 2,905,000 | $ 2,701,650 |
| Ruby Pipeline LLC | | |
| 8.00%, due 4/1/22 (c)(f)(g)(j) | 7,697,879 | 6,562,442 |
| Summit Midstream Holdings LLC | | |
| 8.50%, due 10/15/26 (c) | 6,880,000 | 6,604,800 |
| TransMontaigne Partners LP | | |
| 6.125%, due 2/15/26 | 4,600,000 | 3,932,997 |
| Western Midstream Operating LP | | |
| 4.65%, due 7/1/26 | 4,315,000 | 4,088,463 |
| | | 74,740,603 |
| Real Estate 0.9% |
| Newmark Group, Inc. | | |
| 6.125%, due 11/15/23 | 12,225,000 | 12,185,146 |
| Real Estate Investment Trusts 3.1% |
| GLP Capital LP | | |
| 5.25%, due 6/1/25 | 2,500,000 | 2,410,845 |
| 5.375%, due 11/1/23 | 3,110,000 | 3,074,981 |
| 5.375%, due 4/15/26 | 700,000 | 668,192 |
| MPT Operating Partnership LP | | |
| 5.00%, due 10/15/27 | 2,000,000 | 1,711,560 |
| 5.25%, due 8/1/26 | 3,500,000 | 3,156,720 |
| VICI Properties LP (c) | | |
| 3.50%, due 2/15/25 | 9,615,000 | 8,941,718 |
| 4.625%, due 6/15/25 | 2,985,000 | 2,797,563 |
| 5.625%, due 5/1/24 | 19,681,000 | 19,430,264 |
| | | 42,191,843 |
| Retail 2.5% |
| 1011778 B.C. Unlimited Liability Co. | | |
| 3.875%, due 1/15/28 (c) | 1,000,000 | 878,925 |
| CEC Entertainment LLC | | |
| 6.75%, due 5/1/26 (c) | 2,505,000 | 2,343,090 |
| Dave & Buster's, Inc. | | |
| 7.625%, due 11/1/25 (c) | 2,160,000 | 2,154,838 |
| KFC Holding Co. | | |
| 4.75%, due 6/1/27 (c) | 8,457,000 | 8,072,968 |
| Murphy Oil USA, Inc. | | |
| 5.625%, due 5/1/27 | 1,000,000 | 959,630 |
| NMG Holding Co., Inc. | | |
| 7.125%, due 4/1/26 (c) | 15,883,000 | 15,092,503 |
| Patrick Industries, Inc. | | |
| 7.50%, due 10/15/27 (c) | 2,906,000 | 2,662,395 |
| Penske Automotive Group, Inc. | | |
| 3.50%, due 9/1/25 | 3,075,000 | 2,858,457 |
| | Principal
Amount | Value |
| |
| Retail (continued) |
| Ultra Resources, Inc. Escrow Claim Shares | | |
| 6.875%, due 4/15/22 (a)(g)(i) | $ 4,455,000 | $ — |
| | | 35,022,806 |
| Software 2.2% |
| ACI Worldwide, Inc. | | |
| 5.75%, due 8/15/26 (c) | 1,500,000 | 1,425,000 |
| Camelot Finance SA | | |
| 4.50%, due 11/1/26 (c) | 9,750,000 | 9,109,039 |
| CWT Travel Group, Inc. | | |
| 8.50%, due 11/19/26 (c) | 1,608,846 | 1,371,541 |
| PTC, Inc. | | |
| 3.625%, due 2/15/25 (c) | 10,320,000 | 9,835,270 |
| SS&C Technologies, Inc. | | |
| 5.50%, due 9/30/27 (c) | 3,925,000 | 3,649,430 |
| Veritas US, Inc. | | |
| 7.50%, due 9/1/25 (c) | 5,000,000 | 4,209,153 |
| | | 29,599,433 |
| Telecommunications 5.3% |
| Connect Finco SARL | | |
| 6.75%, due 10/1/26 (c) | 5,670,000 | 5,329,800 |
| Quebecor Media, Inc. | | |
| 5.75%, due 1/15/23 | 6,920,000 | 6,915,848 |
| Sprint Corp. | | |
| 7.875%, due 9/15/23 | 29,145,000 | 29,623,066 |
| Switch Ltd. | | |
| 3.75%, due 9/15/28 (c) | 920,000 | 929,200 |
| T-Mobile US, Inc. | | |
| 2.25%, due 2/15/26 | 24,000,000 | 21,547,774 |
| 4.75%, due 2/1/28 | 7,555,000 | 7,150,656 |
| 5.375%, due 4/15/27 | 570,000 | 562,324 |
| | | 72,058,668 |
| Toys, Games & Hobbies 0.9% |
| Mattel, Inc. | | |
| 3.15%, due 3/15/23 | 3,760,000 | 3,715,291 |
| 3.375%, due 4/1/26 (c) | 5,469,000 | 4,988,363 |
| 5.875%, due 12/15/27 (c) | 3,890,000 | 3,774,778 |
| | | 12,478,432 |
| Transportation 0.6% |
| Watco Cos. LLC | | |
| 6.50%, due 6/15/27 (c) | 7,140,000 | 6,719,794 |
The notes to the financial statements are an integral part of, and should be read in conjunction with, the financial statements.
| 16 | MainStay MacKay Short Duration High Yield Fund |
| | Principal
Amount | Value |
| Corporate Bonds (continued) |
| Transportation (continued) |
| XPO Escrow Sub LLC | | |
| 7.50%, due 11/15/27 (c) | $ 1,500,000 | $ 1,496,250 |
| | | 8,216,044 |
Total Corporate Bonds
(Cost $1,085,163,584) | | 1,016,149,049 |
| Loan Assignments 15.6% |
| Aerospace & Defense 0.3% |
| SkyMiles IP Ltd. | |
| Initial Term Loan | |
| 7.993% (3 Month LIBOR + 3.75%), due 10/20/27 (d) | 4,500,000 | 4,534,376 |
| Automobile 0.5% |
| Dealer Tire LLC | |
| Term Loan B1 | |
| 7.365% (1 Month LIBOR + 4.25%), due 12/12/25 (d) | 4,084,500 | 4,008,937 |
| Tenneco, Inc. | |
| Tranche Term Loan B | |
| 6.206% (1 Week LIBOR + 3.00%), due 10/1/25 (d) | 2,909,320 | 2,891,864 |
| | | 6,900,801 |
| Banking 0.2% |
| Jane Street Group LLC | |
| Dollar Term Loan | |
| 6.504% (1 Month LIBOR + 2.75%), due 1/26/28 (d) | 2,474,811 | 2,401,599 |
| Beverage, Food & Tobacco 0.5% |
| B&G Foods, Inc. | |
| Tranche Term Loan B4 | |
| 6.254% (1 Month LIBOR + 2.50%), due 10/10/26 (d) | 3,303,333 | 3,103,069 |
| United Natural Foods, Inc. | |
| Initial Term Loan | |
| 7.093% (1 Month LIBOR + 3.25%), due 10/22/25 (d) | 4,378,361 | 4,338,956 |
| | | 7,442,025 |
| | Principal
Amount | Value |
| |
| Chemicals 0.1% |
| ASP Unifrax Holdings, Inc. | |
| First Lien USD Term Loan | |
| 7.424% (3 Month LIBOR + 3.75%), due 12/12/25 (d) | $ 1,984,536 | $ 1,810,889 |
| Chemicals, Plastics & Rubber 1.6% |
| Avient Corp. | |
| Term Loan B6 | |
| 7.344% (3 Month LIBOR + 3.25%), due 8/29/29 (d) | 3,600,000 | 3,573,000 |
| Innophos Holdings, Inc. | |
| Initial Term Loan | |
| 7.004% (1 Month LIBOR + 3.25%), due 2/5/27 (d) | 4,192,500 | 4,056,244 |
| Jazz Pharmaceuticals plc | |
| Initial Dollar Term Loan | |
| 7.254% (1 Month LIBOR + 3.50%), due 5/5/28 (d) | 9,239,234 | 9,120,861 |
| SCIH Salt Holdings, Inc. | |
| First Lien Incremental Term Loan B1 | |
| 8.415% (3 Month LIBOR + 4.00%), due 3/16/27 (d) | 6,008,108 | 5,652,626 |
| | | 22,402,731 |
| Construction & Buildings 0.1% |
| Installed Building Products, Inc. | |
| Initial Term Loan | |
| 6.004% (1 Month LIBOR + 2.25%), due 12/14/28 (d) | 1,389,500 | 1,357,079 |
| Electronics 1.1% |
| Camelot U.S. Acquisition 1 Co. (d) | |
| Initial Term Loan | |
| 6.754% (1 Month LIBOR + 3.00%), due 10/30/26 | 8,124,566 | 7,972,231 |
| Amendment No. 2 Incremental Term Loan | |
| 6.754% (1 Month LIBOR + 3.00%), due 10/30/26 | 2,631,375 | 2,584,668 |
| WEX, Inc. | |
| Term Loan B | |
| 6.004% (1 Month LIBOR + 2.25%), due 3/31/28 (d) | 5,008,576 | 4,899,459 |
| | | 15,456,358 |
The notes to the financial statements are an integral part of, and should be read in conjunction with, the financial statements.
17
Portfolio of Investments October 31, 2022† (continued)
| | Principal
Amount | Value |
| Loan Assignments (continued) |
| Entertainment 0.2% |
| NAI Entertainment Holdings LLC | |
| Tranche Term Loan B | |
| 6.26% (1 Month LIBOR + 2.50%), due 5/8/25 (d) | $ 3,261,667 | $ 3,098,583 |
| Finance 0.8% |
| Mileage Plus Holdings LLC | |
| Initial Term Loan | |
| 8.777% (3 Month LIBOR + 5.25%), due 6/21/27 (d) | 2,375,000 | 2,421,510 |
| RealTruck Group, Inc. | |
| Initial Term Loan | |
| 7.254% (1 Month LIBOR + 3.50%), due 1/31/28 (d) | 6,211,178 | 5,318,321 |
| Schweitzer-Mauduit International, Inc. | |
| Term Loan B | |
| 7.563% (1 Month LIBOR + 3.75%), due 4/20/28 (d) | 3,308,125 | 3,076,556 |
| | | 10,816,387 |
| Healthcare & Pharmaceuticals 0.3% |
| Owens & Minor, Inc. | |
| Term Loan B1 7.579% - 7.831% | |
| (1 Month LIBOR + 3.75%, 6 Month LIBOR + 3.75%), due 3/29/29 (d) | 3,681,500 | 3,598,666 |
| Healthcare, Education & Childcare 1.3% |
| LifePoint Health, Inc. | |
| First Lien Term Loan B | |
| 8.165% (3 Month LIBOR + 3.75%), due 11/16/25 (d) | 11,413,139 | 10,047,637 |
| Organon & Co. | |
| Dollar Term Loan | |
| 6.188% (3 Month LIBOR + 3.00%), due 6/2/28 (d) | 8,377,500 | 8,153,100 |
| | | 18,200,737 |
| Hotels, Motels, Inns & Gaming 0.7% |
| Churchill Downs, Inc. | |
| Facility Term Loan B | |
| 5.76% (1 Month LIBOR + 2.00%), due 12/27/24 (d) | 3,810,000 | 3,775,474 |
| | Principal
Amount | Value |
| |
| Hotels, Motels, Inns & Gaming (continued) |
| Four Seasons Holdings, Inc. | |
| First Lien 2013 Term Loan | |
| 5.754% (1 Month LIBOR + 2.00%), due 11/30/23 (d) | $ 5,328,823 | $ 5,316,455 |
| | | 9,091,929 |
| Insurance 0.7% |
| USI, Inc. | |
| 2017 New Term Loan | |
| 6.424% (3 Month LIBOR + 2.75%), due 5/16/24 (d) | 9,801,785 | 9,664,971 |
| Leisure, Amusement, Motion Pictures & Entertainment 0.1% |
| NASCAR Holdings LLC | |
| Initial Term Loan | |
| 5.615% (1 Month LIBOR + 2.50%), due 10/19/26 (d) | 1,980,585 | 1,970,682 |
| Manufacturing 0.7% |
| Adient U.S. LLC | |
| Term Loan B1 | |
| 7.004% (1 Month LIBOR + 3.25%), due 4/10/28 (d) | 9,381,250 | 9,041,180 |
| Media 1.9% |
| Block Communications, Inc. | |
| Term Loan | |
| 5.924% (3 Month LIBOR + 2.25%), due 2/25/27 (d) | 11,456,250 | 11,227,125 |
| DIRECTV Financing LLC | |
| Closing Date Term Loan | |
| 8.754% (1 Month LIBOR + 5.00%), due 8/2/27 (d) | 10,073,871 | 9,551,984 |
| Lamar Media Corp. | |
| Term Loan B | |
| 5.102% (3 Month LIBOR + 1.50%), due 2/5/27 (d) | 5,000,000 | 4,816,665 |
| | | 25,595,774 |
| Oil & Gas 0.8% |
| Ascent Resources Utica Holdings LLC | |
| Second Lien Term Loan | |
| 12.941% (3 Month LIBOR + 9.00%), due 11/1/25 (d) | 3,240,000 | 3,396,599 |
| PetroQuest Energy LLC (a)(i) | |
| Term Loan | |
| TBD, due 1/1/28 | 312,269 | 312,269 |
The notes to the financial statements are an integral part of, and should be read in conjunction with, the financial statements.
| 18 | MainStay MacKay Short Duration High Yield Fund |
| | Principal
Amount | Value |
| Loan Assignments (continued) |
| Oil & Gas (continued) |
| PetroQuest Energy LLC (a)(i) (continued) | |
| 2020 Term Loan | |
| 10.628% (9.21% PIK), due 9/19/26 (b) | $ 240,039 | $ 240,039 |
| Term Loan | |
| 11.254% (10.62% PIK) (1 Month LIBOR + 7.50%), due 11/8/23 (b)(d) | 3,722,441 | 3,722,441 |
| TransMontaigne Operating Co. LP | |
| Tranche Term Loan B 6.989% - 7.072% | |
| (1 Month LIBOR + 3.50%), due 11/17/28 (d) | 2,977,500 | 2,869,565 |
| | | 10,540,913 |
| Personal, Food & Miscellaneous Services 0.4% |
| KFC Holding Co. | |
| 2021 Term Loan B | |
| 5.193% (1 Month LIBOR + 1.75%), due 3/15/28 (d) | 2,598,618 | 2,560,288 |
| WW International, Inc. | |
| Initial Term Loan | |
| 7.26% (1 Month LIBOR + 3.50%), due 4/13/28 (d) | 4,393,625 | 2,789,952 |
| | | 5,350,240 |
| Retail 1.4% |
| Great Outdoors Group LLC | |
| Term Loan B2 | |
| 7.504% (1 Month LIBOR + 3.75%), due 3/6/28 (d) | 19,712,589 | 18,521,614 |
| Software 0.4% |
| TIBCO Software, Inc. | |
| First Lien Dollar Term Loan B | |
| 8.153% (3 Month LIBOR + 4.50%), due 3/30/29 (d) | 5,457,000 | 4,967,818 |
| Telecommunications 0.6% |
| Connect Finco SARL | |
| Amendement No.1 Refinancing Term Loan | |
| 7.26% (1 Month LIBOR + 3.50%), due 12/11/26 (d) | 8,677,500 | 8,373,788 |
| | Principal
Amount | Value |
| |
| Utilities 0.9% |
| Constellation Renewables LLC | |
| Term Loan | |
| 5.57% (3 Month LIBOR + 2.50%), due 12/15/27 (d) | $ 2,767,423 | $ 2,737,153 |
| PG&E Corp. | |
| Term Loan | |
| 6.813% (1 Month LIBOR + 3.00%), due 6/23/25 (d) | 9,251,692 | 9,085,161 |
| | | 11,822,314 |
Total Loan Assignments
(Cost $219,949,927) | | 212,961,454 |
Total Long-Term Bonds
(Cost $1,330,622,194) | | 1,254,472,448 |
| |
| | Shares | |
| Common Stocks 1.0% |
| Electrical Equipment 0.0% ‡ |
| Energy Technologies, Inc. (a)(i)(l) | 2,021 | 404,200 |
| Hotels, Restaurants & Leisure 0.2% |
| Carlson Travel, Inc. (a)(h)(l) | 300,593 | 2,029,003 |
| Carlson Travel, Inc. (a)(h)(i)(l) | 3,199 | — |
| | | 2,029,003 |
| Independent Power and Renewable Electricity Producers 0.2% |
| GenOn Energy, Inc. (h) | 20,915 | 2,196,075 |
| Oil, Gas & Consumable Fuels 0.6% |
| Gulfport Energy Corp. (l) | 73,218 | 6,553,743 |
| PetroQuest Energy, Inc. (a)(i)(l) | 1,186,630 | — |
| Talos Energy, Inc. (l) | 91,517 | 1,947,482 |
| | | 8,501,225 |
Total Common Stocks
(Cost $19,532,212) | | 13,130,503 |
| Preferred Stocks 0.2% |
| Electrical Equipment 0.2% |
| Energy Technologies Ltd. (a)(i)(l) | 4,501 | 2,925,650 |
The notes to the financial statements are an integral part of, and should be read in conjunction with, the financial statements.
19
Portfolio of Investments October 31, 2022† (continued)
| | Shares | | Value |
| Preferred Stocks (continued) |
| Oil, Gas & Consumable Fuels 0.0% ‡ |
| Gulfport Energy Operating Corp., 10.00%(10.00% Cash or 15.00% PIK) (a)(b)(h)(i)(l) | 9 | | $ 49,910 |
Total Preferred Stocks
(Cost $4,304,472) | | | 2,975,560 |
Total Investments
(Cost $1,354,458,878) | 92.9% | | 1,270,578,511 |
| Other Assets, Less Liabilities | 7.1 | | 97,044,806 |
| Net Assets | 100.0% | | $ 1,367,623,317 |
| † | Percentages indicated are based on Fund net assets. |
| ‡ | Less than one-tenth of a percent. |
| (a) | Illiquid security—As of October 31, 2022, the total market value deemed illiquid under procedures approved by the Board of Trustees was $14,039,580, which represented 1.0% of the Fund’s net assets.(Unaudited) |
| (b) | PIK ("Payment-in-Kind")—issuer may pay interest or dividends with additional securities and/or in cash. |
| (c) | May be sold to institutional investors only under Rule 144A or securities offered pursuant to Section 4(a)(2) of the Securities Act of 1933, as amended. |
| (d) | Floating rate—Rate shown was the rate in effect as of October 31, 2022. |
| (e) | Security is perpetual and, thus, does not have a predetermined maturity date. The date shown, if applicable, reflects the next call date. |
| (f) | Step coupon—Rate shown was the rate in effect as of October 31, 2022. |
| (g) | Issue in non-accrual status. |
| (h) | Restricted security. (See Note 5) |
| (i) | Security in which significant unobservable inputs (Level 3) were used in determining fair value. |
| (j) | Issue in default. |
| (k) | Fixed to floating rate—Rate shown was the rate in effect as of October 31, 2022. |
| (l) | Non-income producing security. |
| Abbreviation(s): |
| LIBOR—London Interbank Offered Rate |
| TBD—To Be Determined |
| USD—United States Dollar |
The following is a summary of the fair valuations according to the inputs used as of October 31, 2022, for valuing the Fund’s assets:
| Description | Quoted
Prices in
Active
Markets for
Identical
Assets
(Level 1) | | Significant
Other
Observable
Inputs
(Level 2) | | Significant
Unobservable
Inputs
(Level 3) | | Total |
| Asset Valuation Inputs | | | | | | | |
| Investments in Securities (a) | | | | | | | |
| Long-Term Bonds | | | | | | | |
| Convertible Bonds | $ — | | $ 25,361,945 | | $ — | | $ 25,361,945 |
| Corporate Bonds | — | | 1,013,395,049 | | 2,754,000 | | 1,016,149,049 |
| Loan Assignments | — | | 208,686,705 | | 4,274,749 | | 212,961,454 |
| Total Long-Term Bonds | — | | 1,247,443,699 | | 7,028,749 | | 1,254,472,448 |
| Common Stocks | 8,501,225 | | 4,225,078 | | 404,200 | | 13,130,503 |
| Preferred Stocks | — | | — | | 2,975,560 | | 2,975,560 |
| Total Investments in Securities | $ 8,501,225 | | $ 1,251,668,777 | | $ 10,408,509 | | $ 1,270,578,511 |
| (a) | For a complete listing of investments and their industries, see the Portfolio of Investments. |
The notes to the financial statements are an integral part of, and should be read in conjunction with, the financial statements.
| 20 | MainStay MacKay Short Duration High Yield Fund |
Statement of Assets and Liabilities as of October 31, 2022
| Assets |
Investment in securities, at value
(identified cost $1,354,458,878) | $1,270,578,511 |
| Cash | 62,620,472 |
| Receivables: | |
| Fund shares sold | 23,347,026 |
| Interest | 18,419,188 |
| Other assets | 190,722 |
| Total assets | 1,375,155,919 |
| Liabilities |
| Payables: | |
| Investment securities purchased | 3,671,401 |
| Fund shares redeemed | 2,060,484 |
| Manager (See Note 3) | 730,771 |
| Transfer agent (See Note 3) | 218,956 |
| NYLIFE Distributors (See Note 3) | 86,345 |
| Shareholder communication | 65,582 |
| Professional fees | 25,521 |
| Custodian | 11,219 |
| Trustees | 367 |
| Accrued expenses | 12,738 |
| Distributions payable | 649,218 |
| Total liabilities | 7,532,602 |
| Net assets | $1,367,623,317 |
| Composition of Net Assets |
| Shares of beneficial interest outstanding (par value of $.001 per share) unlimited number of shares authorized | $ 150,431 |
| Additional paid-in-capital | 1,509,938,255 |
| | 1,510,088,686 |
| Total distributable earnings (loss) | (142,465,369) |
| Net assets | $1,367,623,317 |
| Class A | |
| Net assets applicable to outstanding shares | $ 300,908,514 |
| Shares of beneficial interest outstanding | 33,103,883 |
| Net asset value per share outstanding | $ 9.09 |
| Maximum sales charge (3.00% of offering price) | 0.28 |
| Maximum offering price per share outstanding | $ 9.37 |
| Investor Class | |
| Net assets applicable to outstanding shares | $ 5,400,407 |
| Shares of beneficial interest outstanding | 594,056 |
| Net asset value per share outstanding | $ 9.09 |
| Maximum sales charge (2.50% of offering price) | 0.23 |
| Maximum offering price per share outstanding | $ 9.32 |
| Class C | |
| Net assets applicable to outstanding shares | $ 25,772,234 |
| Shares of beneficial interest outstanding | 2,835,794 |
| Net asset value and offering price per share outstanding | $ 9.09 |
| Class I | |
| Net assets applicable to outstanding shares | $1,034,872,955 |
| Shares of beneficial interest outstanding | 113,823,426 |
| Net asset value and offering price per share outstanding | $ 9.09 |
| Class R2 | |
| Net assets applicable to outstanding shares | $ 494,711 |
| Shares of beneficial interest outstanding | 54,435 |
| Net asset value and offering price per share outstanding | $ 9.09 |
| Class R3 | |
| Net assets applicable to outstanding shares | $ 174,496 |
| Shares of beneficial interest outstanding | 19,197 |
| Net asset value and offering price per share outstanding | $ 9.09 |
The notes to the financial statements are an integral part of, and should be read in conjunction with, the financial statements.
21
Statement of Operations for the year ended October 31, 2022
| Investment Income (Loss) |
| Income | |
| Interest | $ 70,786,516 |
| Dividends | 171 |
| Total income | 70,786,687 |
| Expenses | |
| Manager (See Note 3) | 9,348,853 |
| Transfer agent (See Note 3) | 1,283,039 |
| Distribution/Service—Class A (See Note 3) | 759,537 |
| Distribution/Service—Investor Class (See Note 3) | 14,068 |
| Distribution/Service—Class C (See Note 3) | 301,396 |
| Distribution/Service—Class R2 (See Note 3) | 1,247 |
| Distribution/Service—Class R3 (See Note 3) | 797 |
| Professional fees | 149,391 |
| Registration | 128,783 |
| Shareholder communication | 93,054 |
| Custodian | 45,084 |
| Trustees | 29,632 |
| Shareholder service (See Note 3) | 658 |
| Miscellaneous | 64,646 |
| Total expenses before waiver/reimbursement | 12,220,185 |
| Expense waiver/reimbursement from Manager (See Note 3) | (6,391) |
| Net expenses | 12,213,794 |
| Net investment income (loss) | 58,572,893 |
| Realized and Unrealized Gain (Loss) |
| Net realized gain (loss) on investments | 1,650,212 |
| Net change in unrealized appreciation (depreciation) on investments | (114,848,772) |
| Net realized and unrealized gain (loss) | (113,198,560) |
| Net increase (decrease) in net assets resulting from operations | $ (54,625,667) |
The notes to the financial statements are an integral part of, and should be read in conjunction with, the financial statements.
| 22 | MainStay MacKay Short Duration High Yield Fund |
Statements of Changes in Net Assets
for the years ended October 31, 2022 and October 31, 2021
| | 2022 | 2021 |
| Increase (Decrease) in Net Assets |
| Operations: | | |
| Net investment income (loss) | $ 58,572,893 | $ 60,401,260 |
| Net realized gain (loss) | 1,650,212 | 1,838,672 |
| Net change in unrealized appreciation (depreciation) | (114,848,772) | 60,074,865 |
| Net increase (decrease) in net assets resulting from operations | (54,625,667) | 122,314,797 |
| Distributions to shareholders: | | |
| Class A | (12,418,690) | (11,650,467) |
| Investor Class | (224,189) | (245,169) |
| Class C | (955,093) | (1,236,855) |
| Class I | (46,971,570) | (51,314,390) |
| Class R2 | (19,878) | (20,875) |
| Class R3 | (6,002) | (5,564) |
| | (60,595,422) | (64,473,320) |
| Distributions to shareholders from return of capital: | | |
| Class A | — | (98,233) |
| Investor Class | — | (2,067) |
| Class C | — | (10,429) |
| Class I | — | (432,668) |
| Class R2 | — | (176) |
| Class R3 | — | (47) |
| | — | (543,620) |
| Total distributions to shareholders | (60,595,422) | (65,016,940) |
| Capital share transactions: | | |
| Net proceeds from sales of shares | 809,391,209 | 606,008,870 |
| Net asset value of shares issued to shareholders in reinvestment of distributions | 53,702,017 | 58,664,287 |
| Cost of shares redeemed | (873,263,765) | (630,696,309) |
| Increase (decrease) in net assets derived from capital share transactions | (10,170,539) | 33,976,848 |
| Net increase (decrease) in net assets | (125,391,628) | 91,274,705 |
| Net Assets |
| Beginning of year | 1,493,014,945 | 1,401,740,240 |
| End of year | $1,367,623,317 | $1,493,014,945 |
The notes to the financial statements are an integral part of, and should be read in conjunction with, the financial statements.
23
Financial Highlights selected per share data and ratios
| | Year Ended October 31, |
| Class A | 2022 | | 2021 | | 2020 | | 2019 | | 2018 |
| Net asset value at beginning of year | $ 9.83 | | $ 9.45 | | $ 9.84 | | $ 9.76 | | $ 9.96 |
| Net investment income (loss) | 0.37(a) | | 0.37(a) | | 0.42 | | 0.44 | | 0.42 |
| Net realized and unrealized gain (loss) | (0.73) | | 0.42 | | (0.37) | | 0.08 | | (0.21) |
| Total from investment operations | (0.36) | | 0.79 | | 0.05 | | 0.52 | | 0.21 |
| Less distributions: | | | | | | | | | |
| From net investment income | (0.38) | | (0.41) | | (0.44) | | (0.44) | | (0.41) |
| Return of capital | — | | (0.00)‡ | | — | | — | | — |
| Total distributions | (0.38) | | (0.41) | | (0.44) | | (0.44) | | (0.41) |
| Net asset value at end of year | $ 9.09 | | $ 9.83 | | $ 9.45 | | $ 9.84 | | $ 9.76 |
| Total investment return (b) | (3.66)% | | 8.40% | | 0.65% | | 5.40% | | 2.09% |
| Ratios (to average net assets)/Supplemental Data: | | | | | | | | | |
| Net investment income (loss) | 3.92% | | 3.78% | | 4.46% | | 4.48% | | 4.06% |
| Net expenses (c) | 1.02%(d) | | 1.01% | | 1.02% | | 1.04% | | 1.05% |
| Expenses (before waiver/reimbursement) (c) | 1.02% | | 1.01% | | 1.02% | | 1.04% | | 1.07% |
| Portfolio turnover rate | 30% | | 47% | | 64% | | 32% | | 62% |
| Net assets at end of year (in 000’s) | $ 300,909 | | $ 303,646 | | $ 252,753 | | $ 237,475 | | $ 180,140 |
| ‡ | Less than one cent per share. |
| (a) | Per share data based on average shares outstanding during the year. |
| (b) | Total investment return is calculated exclusive of sales charges and assumes the reinvestment of dividends and distributions. For periods of less than one year, total return is not annualized. |
| (c) | In addition to the fees and expenses which the Fund bears directly, it also indirectly bears a pro-rata share of the fees and expenses of the underlying funds in which it invests. Such indirect expenses are not included in the above expense ratios. |
| (d) | Expense waiver/reimbursement less than 0.01%. |
| | Year Ended October 31, |
| Investor Class | 2022 | | 2021 | | 2020 | | 2019 | | 2018 |
| Net asset value at beginning of year | $ 9.83 | | $ 9.46 | | $ 9.84 | | $ 9.76 | | $ 9.96 |
| Net investment income (loss) | 0.36(a) | | 0.37(a) | | 0.42 | | 0.43 | | 0.40 |
| Net realized and unrealized gain (loss) | (0.72) | | 0.40 | | (0.36) | | 0.08 | | (0.20) |
| Total from investment operations | (0.36) | | 0.77 | | 0.06 | | 0.51 | | 0.20 |
| Less distributions: | | | | | | | | | |
| From net investment income | (0.38) | | (0.40) | | (0.44) | | (0.43) | | (0.40) |
| Return of capital | — | | (0.00)‡ | | — | | — | | — |
| Total distributions | (0.38) | | (0.40) | | (0.44) | | (0.43) | | (0.40) |
| Net asset value at end of year | $ 9.09 | | $ 9.83 | | $ 9.46 | | $ 9.84 | | $ 9.76 |
| Total investment return (b) | (3.73)% | | 8.18% | | 0.67% | | 5.33% | | 2.05% |
| Ratios (to average net assets)/Supplemental Data: | | | | | | | | | |
| Net investment income (loss) | 3.82% | | 3.72% | | 4.38% | | 4.40% | | 4.03% |
| Net expenses (c) | 1.10% | | 1.10% | | 1.11% | | 1.11% | | 1.09% |
| Expenses (before waiver/reimbursement) (c) | 1.10% | | 1.10% | | 1.11% | | 1.11% | | 1.11% |
| Portfolio turnover rate | 30% | | 47% | | 64% | | 32% | | 62% |
| Net assets at end of year (in 000's) | $ 5,400 | | $ 5,780 | | $ 6,278 | | $ 7,156 | | $ 6,193 |
| ‡ | Less than one cent per share. |
| (a) | Per share data based on average shares outstanding during the year. |
| (b) | Total investment return is calculated exclusive of sales charges and assumes the reinvestment of dividends and distributions. For periods of less than one year, total return is not annualized. |
| (c) | In addition to the fees and expenses which the Fund bears directly, it also indirectly bears a pro-rata share of the fees and expenses of the underlying funds in which it invests. Such indirect expenses are not included in the above expense ratios. |
The notes to the financial statements are an integral part of, and should be read in conjunction with, the financial statements.
| 24 | MainStay MacKay Short Duration High Yield Fund |
Financial Highlights selected per share data and ratios
| | Year Ended October 31, |
| Class C | 2022 | | 2021 | | 2020 | | 2019 | | 2018 |
| Net asset value at beginning of year | $ 9.83 | | $ 9.45 | | $ 9.84 | | $ 9.76 | | $ 9.96 |
| Net investment income (loss) | 0.29(a) | | 0.29(a) | | 0.34 | | 0.36 | | 0.32 |
| Net realized and unrealized gain (loss) | (0.72) | | 0.41 | | (0.37) | | 0.08 | | (0.19) |
| Total from investment operations | (0.43) | | 0.70 | | (0.03) | | 0.44 | | 0.13 |
| Less distributions: | | | | | | | | | |
| From net investment income | (0.31) | | (0.32) | | (0.36) | | (0.36) | | (0.33) |
| Return of capital | — | | (0.00)‡ | | — | | — | | — |
| Total distributions | (0.31) | | (0.32) | | (0.36) | | (0.36) | | (0.33) |
| Net asset value at end of year | $ 9.09 | | $ 9.83 | | $ 9.45 | | $ 9.84 | | $ 9.76 |
| Total investment return (b) | (4.46)% | | 7.48% | | (0.19)% | | 4.54% | | 1.29% |
| Ratios (to average net assets)/Supplemental Data: | | | | | | | | | |
| Net investment income (loss) | 3.05% | | 2.98% | | 3.64% | | 3.65% | | 3.28% |
| Net expenses (c) | 1.85% | | 1.85% | | 1.86% | | 1.86% | | 1.84% |
| Expenses (before waiver/reimbursement) (c) | 1.85% | | 1.85% | | 1.86% | | 1.86% | | 1.86% |
| Portfolio turnover rate | 30% | | 47% | | 64% | | 32% | | 62% |
| Net assets at end of year (in 000’s) | $ 25,772 | | $ 35,636 | | $ 40,948 | | $ 48,550 | | $ 48,415 |
| ‡ | Less than one cent per share. |
| (a) | Per share data based on average shares outstanding during the year. |
| (b) | Total investment return is calculated exclusive of sales charges and assumes the reinvestment of dividends and distributions. For periods of less than one year, total return is not annualized. |
| (c) | In addition to the fees and expenses which the Fund bears directly, it also indirectly bears a pro-rata share of the fees and expenses of the underlying funds in which it invests. Such indirect expenses are not included in the above expense ratios. |
| | Year Ended October 31, |
| Class I | 2022 | | 2021 | | 2020 | | 2019 | | 2018 |
| Net asset value at beginning of year | $ 9.84 | | $ 9.46 | | $ 9.84 | | $ 9.76 | | $ 9.97 |
| Net investment income (loss) | 0.39(a) | | 0.40(a) | | 0.45 | | 0.46 | | 0.43 |
| Net realized and unrealized gain (loss) | (0.73) | | 0.41 | | (0.36) | | 0.08 | | (0.21) |
| Total from investment operations | (0.34) | | 0.81 | | 0.09 | | 0.54 | | 0.22 |
| Less distributions: | | | | | | | | | |
| From net investment income | (0.41) | | (0.43) | | (0.47) | | (0.46) | | (0.43) |
| Return of capital | — | | (0.00)‡ | | — | | — | | — |
| Total distributions | (0.41) | | (0.43) | | (0.47) | | (0.46) | | (0.43) |
| Net asset value at end of year | $ 9.09 | | $ 9.84 | | $ 9.46 | | $ 9.84 | | $ 9.76 |
| Total investment return (b) | (3.52)% | | 8.66% | | 1.01% | | 5.67% | | 2.26% |
| Ratios (to average net assets)/Supplemental Data: | | | | | | | | | |
| Net investment income (loss) | 4.14% | | 4.05% | | 4.72% | | 4.73% | | 4.31% |
| Net expenses (c) | 0.77% | | 0.76% | | 0.77% | | 0.79% | | 0.80% |
| Expenses (before waiver/reimbursement) (c) | 0.77% | | 0.76% | | 0.77% | | 0.79% | | 0.82% |
| Portfolio turnover rate | 30% | | 47% | | 64% | | 32% | | 62% |
| Net assets at end of year (in 000’s) | $ 1,034,873 | | $ 1,147,287 | | $ 1,101,084 | | $ 1,268,856 | | $ 771,533 |
| ‡ | Less than one cent per share. |
| (a) | Per share data based on average shares outstanding during the year. |
| (b) | Total investment return is calculated exclusive of sales charges and assumes the reinvestment of dividends and distributions. Class I shares are not subject to sales charges. For periods of less than one year, total return is not annualized. |
| (c) | In addition to the fees and expenses which the Fund bears directly, it also indirectly bears a pro-rata share of the fees and expenses of the underlying funds in which it invests. Such indirect expenses are not included in the above expense ratios. |
The notes to the financial statements are an integral part of, and should be read in conjunction with, the financial statements.
25
Financial Highlights selected per share data and ratios
| | Year Ended October 31, |
| Class R2 | 2022 | | 2021 | | 2020 | | 2019 | | 2018 |
| Net asset value at beginning of year | $ 9.83 | | $ 9.45 | | $ 9.84 | | $ 9.76 | | $ 9.96 |
| Net investment income (loss) | 0.36(a) | | 0.36(a) | | 0.41 | | 0.40 | | 0.39 |
| Net realized and unrealized gain (loss) | (0.72) | | 0.41 | | (0.37) | | 0.11 | | (0.20) |
| Total from investment operations | (0.36) | | 0.77 | | 0.04 | | 0.51 | | 0.19 |
| Less distributions: | | | | | | | | | |
| From net investment income | (0.38) | | (0.39) | | (0.43) | | (0.43) | | (0.39) |
| Return of capital | — | | (0.00)‡ | | — | | — | | — |
| Total distributions | (0.38) | | (0.39) | | (0.43) | | (0.43) | | (0.39) |
| Net asset value at end of year | $ 9.09 | | $ 9.83 | | $ 9.45 | | $ 9.84 | | $ 9.76 |
| Total investment return (b) | (3.75)% | | 8.29% | | 0.55% | | 5.31% | | 1.99% |
| Ratios (to average net assets)/Supplemental Data: | | | | | | | | | |
| Net investment income (loss) | 3.82% | | 3.71% | | 4.36% | | 4.34% | | 3.97% |
| Net expenses (c) | 1.12% | | 1.11% | | 1.12% | | 1.14% | | 1.15% |
| Expenses (before waiver/reimbursement) (c) | 1.12% | | 1.11% | | 1.12% | | 1.14% | | 1.17% |
| Portfolio turnover rate | 30% | | 47% | | 64% | | 32% | | 62% |
| Net assets at end of year (in 000’s) | $ 495 | | $ 508 | | $ 523 | | $ 538 | | $ 63 |
| ‡ | Less than one cent per share. |
| (a) | Per share data based on average shares outstanding during the year. |
| (b) | Total investment return is calculated exclusive of sales charges and assumes the reinvestment of dividends and distributions. Class R2 shares are not subject to sales charges. For periods of less than one year, total return is not annualized. |
| (c) | In addition to the fees and expenses which the Fund bears directly, it also indirectly bears a pro-rata share of the fees and expenses of the underlying funds in which it invests. Such indirect expenses are not included in the above expense ratios. |
| | Year Ended October 31, |
| Class R3 | 2022 | | 2021 | | 2020 | | 2019 | | 2018 |
| Net asset value at beginning of year | $ 9.83 | | $ 9.46 | | $ 9.84 | | $ 9.76 | | $ 9.97 |
| Net investment income (loss) | 0.34(a) | | 0.34(a) | | 0.40 | | 0.39 | | 0.37 |
| Net realized and unrealized gain (loss) | (0.73) | | 0.40 | | (0.37) | | 0.09 | | (0.21) |
| Total from investment operations | (0.39) | | 0.74 | | 0.03 | | 0.48 | | 0.16 |
| Less distributions: | | | | | | | | | |
| From net investment income | (0.35) | | (0.37) | | (0.41) | | (0.40) | | (0.37) |
| Return of capital | — | | (0.00)‡ | | — | | — | | — |
| Total distributions | (0.35) | | (0.37) | | (0.41) | | (0.40) | | (0.37) |
| Net asset value at end of year | $ 9.09 | | $ 9.83 | | $ 9.46 | | $ 9.84 | | $ 9.76 |
| Total investment return (b) | (3.99)% | | 7.89% | | 0.41% | | 5.05% | | 1.61% |
| Ratios (to average net assets)/Supplemental Data: | | | | | | | | | |
| Net investment income (loss) | 3.59% | | 3.45% | | 4.13% | | 4.12% | | 3.72% |
| Net expenses (c) | 1.37% | | 1.36% | | 1.36% | | 1.39% | | 1.40% |
| Expenses (before waiver/reimbursement) (c) | 1.37% | | 1.36% | | 1.36% | | 1.39% | | 1.42% |
| Portfolio turnover rate | 30% | | 47% | | 64% | | 32% | | 62% |
| Net assets at end of year (in 000’s) | $ 174 | | $ 158 | | $ 154 | | $ 201 | | $ 58 |
| ‡ | Less than one cent per share. |
| (a) | Per share data based on average shares outstanding during the year. |
| (b) | Total investment return is calculated exclusive of sales charges and assumes the reinvestment of dividends and distributions. Class R3 shares are not subject to sales charges. For periods of less than one year, total return is not annualized. |
| (c) | In addition to the fees and expenses which the Fund bears directly, it also indirectly bears a pro-rata share of the fees and expenses of the underlying funds in which it invests. Such indirect expenses are not included in the above expense ratios. |
The notes to the financial statements are an integral part of, and should be read in conjunction with, the financial statements.
| 26 | MainStay MacKay Short Duration High Yield Fund |
Notes to Financial Statements
Note 1-Organization and Business
MainStay Funds Trust (the “Trust”) was organized as a Delaware statutory trust on April 28, 2009. The Trust is registered under the Investment Company Act of 1940, as amended (the “1940 Act”), as an open-end management investment company, and is comprised of thirty-three funds (collectively referred to as the “Funds”). These financial statements and notes relate to the MainStay MacKay Short Duration High Yield Fund (the "Fund"), a “diversified” fund, as that term is defined in the 1940 Act, as interpreted or modified by regulatory authorities having jurisdiction, from time to time.
The following table lists the Fund's share classes that have been registered and commenced operations:
| Class | Commenced Operations |
| Class A | December 17, 2012 |
| Investor Class | December 17, 2012 |
| Class C | December 17, 2012 |
| Class I | December 17, 2012 |
| Class R2 | December 17, 2012 |
| Class R3 | February 29, 2016 |
| Class R6 | N/A* |
| SIMPLE Class | N/A* |
| * | Class R6 shares were registered for sale effective as of February 28, 2017 and SIMPLE Class shares were registered for sale effective as of August 31, 2020 but have not yet commenced operations. |
Class A and Investor Class shares are offered at net asset value (“NAV”) per share plus an initial sales charge. No initial sales charge applies to investments of $250,000 or more (and certain other qualified purchases) in Class A and Investor Class shares. Effective April 15, 2019, a contingent deferred sales charge (“CDSC”) of 1.00% may be imposed on certain redemptions of Class A and Investor Class shares made within 18 months of the date of purchase on shares that were purchased without an initial sales charge. For purchases of Class A and Investor Class shares made from August 1, 2017 through April 14, 2019, a CDSC of 1.00% may be imposed on certain redemptions (for investments of $500,000 which paid no initial sales charge) of such shares within 18 months of the date of purchase on shares that were purchased without an initial sales charge. Class C shares are offered at NAV without an initial sales charge and a 1.00% CDSC may be imposed on certain redemptions of such shares made within 18 months of the date of purchase of Class C shares. Investments in Class C shares are subject to a purchase maximum of $250,000. Class I, Class R2 and Class R3 shares are offered at NAV without a sales charge. Class R6 and SIMPLE Class shares are expected to be offered at NAV without a sales charge if such shares are offered in the future. In addition, depending upon eligibility, Class C shares convert to either Class A or Investor Class shares at the end of the calendar quarter eight years after the date they were purchased. Additionally, Investor Class shares may convert automatically to Class A shares. Under certain circumstances and as may be permitted by the Trust’s multiple class plan pursuant to Rule 18f-3 under the 1940 Act, specified share classes of the Fund may be converted to one or more
other share classes of the Fund as disclosed in the capital share transactions within these Notes. The classes of shares have the same voting (except for issues that relate solely to one class), dividend, liquidation and other rights, and the same terms and conditions, except that under a distribution plan pursuant to Rule 12b-1 under the 1940 Act, Class C shares are subject to higher distribution and/or service fees than Class A, Investor Class, Class R2, Class R3 and SIMPLE Class shares. Class I and Class R6 shares are not subject to a distribution and/or service fee. Class R2 and Class R3 shares are subject to a shareholder service fee, which is in addition to fees paid under the distribution plans for Class R2 and Class R3 shares.
The Fund's investment objective is to seek high current income. Capital appreciation is a secondary objective.
Note 2–Significant Accounting Policies
The Fund is an investment company and accordingly follows the investment company accounting and reporting guidance of the Financial Accounting Standards Board (“FASB”) Accounting Standards Codification Topic 946 Financial Services—Investment Companies. The Fund prepares its financial statements in accordance with generally accepted accounting principles (“GAAP”) in the United States of America and follows the significant accounting policies described below.
(A) Securities Valuation. Investments are usually valued as of the close of regular trading on the New York Stock Exchange (the "Exchange") (usually 4:00 p.m. Eastern time) on each day the Fund is open for business ("valuation date").
Effective September 8, 2022, and pursuant to Rule 2a-5 under the 1940 Act, the Board of Trustees of the Trust (the "Board") designated New York Life Investment Management LLC (“New York Life Investments” or the "Manager") as its Valuation Designee (the "Valuation Designee"). The Valuation Designee is responsible for performing fair valuations relating to all investments in the Fund’s portfolio for which market quotations are not readily available; periodically assessing and managing material valuation risks; establishing and applying fair value methodologies; testing fair valuation methodologies; evaluating and overseeing pricing services; segregation of valuation and portfolio management functions; providing quarterly, annual and prompt reporting to the Board, as appropriate; identifying potential conflicts of interest; and maintaining appropriate records. The Valuation Designee has established a valuation committee ("Valuation Committee") to assist in carrying out the Valuation Designee’s responsibilities and establish prices of securities for which market quotations are not readily available. The Fund’s and the Valuation Designee's policies and procedures ("Valuation Procedures") govern the Valuation Designee’s selection and application of methodologies for determining and calculating the fair value of Fund investments. The Valuation Designee may value Fund portfolio securities for which market quotations are not readily available and other Fund assets utilizing inputs from pricing services and other third-party sources (together, “Pricing Sources”). The Valuation Committee meets (in person, via electronic mail or via teleconference) on an ad-hoc basis to determine fair valuations and
Notes to Financial Statements (continued)
on a quarterly basis to review fair value events (excluding fair valuations from pricing services), including valuation risks and back-testing results, and preview reports to the Board.
The Valuation Committee establishes prices of securities for which market quotations are not readily available based on such methodologies and measurements on a regular basis after considering information that is reasonably available and deemed relevant by the Valuation Committee. The Board shall oversee the Valuation Designee and review fair valuation materials on a prompt, quarterly and annual basis and approve proposed revisions to the Valuation Procedures.
Investments for which market quotations are not readily available are valued at fair value as determined in good faith pursuant to the Valuation Procedures. A market quotation is readily available only when that quotation is a quoted price (unadjusted) in active markets for identical investments that the Fund can access at the measurement date, provided that a quotation will not be readily available if it is not reliable. Fair value measurements are determined within a framework that establishes a three-tier hierarchy that maximizes the use of observable market data and minimizes the use of unobservable inputs to establish a classification of fair value measurements for disclosure purposes. "Inputs" refer broadly to the assumptions that market participants would use in pricing the asset or liability, including assumptions about risk, such as the risk inherent in a particular valuation technique used to measure fair value using a pricing model and/or the risk inherent in the inputs for the valuation technique. Inputs may be observable or unobservable. Observable inputs reflect the assumptions market participants would use in pricing the asset or liability based on market data obtained from sources independent of the Fund. Unobservable inputs reflect the Fund’s own assumptions about the assumptions market participants would use in pricing the asset or liability based on the information available. The inputs or methodology used for valuing assets or liabilities may not be an indication of the risks associated with investing in those assets or liabilities. The three-tier hierarchy of inputs is summarized below.
| • | Level 1—quoted prices (unadjusted) in active markets for an identical asset or liability |
| • | Level 2—other significant observable inputs (including quoted prices for a similar asset or liability in active markets, interest rates and yield curves, prepayment speeds, credit risk, etc.) |
| • | Level 3—significant unobservable inputs (including the Fund's own assumptions about the assumptions that market participants would use in measuring fair value of an asset or liability) |
The level of an asset or liability within the fair value hierarchy is based on the lowest level of an input, both individually and in the aggregate, that is significant to the fair value measurement. The aggregate value by input level of the Fund’s assets and liabilities as of October 31, 2022, is included at the end of the Portfolio of Investments.
The Fund may use third-party vendor evaluations, whose prices may be derived from one or more of the following standard inputs, among others:
| • Benchmark yields | • Reported trades |
| • Broker/dealer quotes | • Issuer spreads |
| • Two-sided markets | • Benchmark securities |
| • Bids/offers | • Reference data (corporate actions or material event notices) |
| • Industry and economic events | • Comparable bonds |
| • Monthly payment information | |
An asset or liability for which a market quotation is not readily available is valued by methods deemed reasonable in good faith by the Valuation Committee, following the Valuation Procedures to represent fair value. Under these procedures, the Valuation Designee generally uses a market-based approach which may use related or comparable assets or liabilities, recent transactions, market multiples, book values and other relevant information. The Valuation Designee may also use an income-based valuation approach in which the anticipated future cash flows of the asset or liability are discounted to calculate fair value. Discounts may also be applied due to the nature and/or duration of any restrictions on the disposition of the asset or liability. Fair value represents a good faith approximation of the value of a security. Fair value determinations involve the consideration of a number of subjective factors, an analysis of applicable facts and circumstances and the exercise of judgment. As a result, it is possible that the fair value for a security determined in good faith in accordance with the Valuation Procedures may differ from valuations for the same security determined for other funds using their own valuation procedures. Although the Valuation Procedures are designed to value a security at the price the Fund may reasonably expect to receive upon the security's sale in an orderly transaction, there can be no assurance that any fair value determination thereunder would, in fact, approximate the amount that the Fund would actually realize upon the sale of the security or the price at which the security would trade if a reliable market price were readily available. During the year ended October 31, 2022, there were no material changes to the fair value methodologies.
Securities which may be valued in this manner include, but are not limited to: (i) a security for which trading has been halted or suspended or otherwise does not have a readily available market quotation on a given day; (ii) a debt security that has recently gone into default and for which there is not a current market quotation; (iii) a security of an issuer that has entered into a restructuring; (iv) a security that has been delisted from a national exchange; (v) a security subject to trading collars for which no or limited trading takes place; and (vi) a security whose principal market has been temporarily closed at a time when, under normal conditions, it would be open. Securities valued in this manner are generally categorized as Level 2 or 3 in the hierarchy.
Equity securities are valued at the last quoted sales prices as of the close of regular trading on the relevant exchange on each valuation date. Securities that are not traded on the valuation date are valued at the
| 28 | MainStay MacKay Short Duration High Yield Fund |
mean of the last quoted bid and ask prices. Prices are normally taken from the principal market in which each security trades. These securities are generally categorized as Level 1 in the hierarchy.
Debt securities (other than convertible and municipal bonds) are valued at the evaluated bid prices (evaluated mean prices in the case of convertible and municipal bonds) supplied by a pricing agent or broker selected by the Valuation Designee, in consultation with the Subadvisor. The evaluations are market-based measurements processed through a pricing application and represents the pricing agent’s good faith determination as to what a holder may receive in an orderly transaction under market conditions. The rules-based logic utilizes valuation techniques that reflect participants’ assumptions and vary by asset class and per methodology, maximizing the use of relevant observable data including quoted prices for similar assets, benchmark yield curves and market corroborated inputs. The evaluated bid or mean prices are deemed by the Valuation Designee, in consultation with the Subadvisor, to be representative of market values at the regular close of trading of the Exchange on each valuation date. Debt securities purchased on a delayed delivery basis are marked to market daily until settlement at the forward settlement date. Debt securities, including corporate bonds, U.S. government and federal agency bonds, municipal bonds, foreign bonds, convertible bonds, asset-backed securities and mortgage-backed securities are generally categorized as Level 2 in the hierarchy.
Loan assignments, participations and commitments are valued at the average of bid quotations obtained from the engaged independent pricing service and are generally categorized as Level 2 in the hierarchy. Certain loan assignments, participations and commitments may be valued by utilizing significant unobservable inputs obtained from the pricing service and are generally categorized as Level 3 in the hierarchy. No securities held by the Fund as of October 31, 2022 were fair valued utilizing significant unobservable inputs obtained from the pricing service.
The information above is not intended to reflect an exhaustive list of the methodologies that may be used to value portfolio investments. The Valuation Procedures permit the use of a variety of valuation methodologies in connection with valuing portfolio investments. The methodology used for a specific type of investment may vary based on the market data available or other considerations. The methodologies summarized above may not represent the specific means by which portfolio investments are valued on any particular business day.
A portfolio investment may be classified as an illiquid investment under the Trust's written liquidity risk management program and related procedures (“Liquidity Program”). Illiquidity of an investment might prevent the sale of such investment at a time when the Manager or the Subadvisor might wish to sell, and these investments could have the effect of decreasing the overall level of the Fund's liquidity. Further, the lack of an established secondary market may make it more difficult to value illiquid investments, requiring the Fund to rely on judgments that may be somewhat subjective in measuring value, which could vary materially from the amount that the Fund could realize upon disposition. Difficulty in selling illiquid investments may result in a loss or may be
costly to the Fund. An illiquid investment is any investment that the Manager or Subadvisor reasonably expects cannot be sold or disposed of in current market conditions in seven calendar days or less without the sale or disposition significantly changing the market value of the investment. The liquidity classification of each investment will be made using information obtained after reasonable inquiry and taking into account, among other things, relevant market, trading and investment-specific considerations in accordance with the Liquidity Program. Illiquid investments are often fair valued in accordance with the Fund's procedures described above. The liquidity of the Fund's investments was determined as of October 31, 2022, and can change at any time. Illiquid investments as of October 31, 2022, are shown in the Portfolio of Investments.
(B) Income Taxes. The Fund's policy is to comply with the requirements of the Internal Revenue Code of 1986, as amended (the “Internal Revenue Code”), applicable to regulated investment companies and to distribute all of its taxable income to the shareholders of the Fund within the allowable time limits.
The Manager evaluates the Fund’s tax positions to determine if the tax positions taken meet the minimum recognition threshold in connection with accounting for uncertainties in income tax positions taken or expected to be taken for the purposes of measuring and recognizing tax liabilities in the financial statements. Recognition of tax benefits of an uncertain tax position is permitted only to the extent the position is “more likely than not” to be sustained assuming examination by taxing authorities. The Manager analyzed the Fund's tax positions taken on federal, state and local income tax returns for all open tax years (for up to three tax years) and has concluded that no provisions for federal, state and local income tax are required in the Fund's financial statements. The Fund's federal, state and local income tax and federal excise tax returns for tax years for which the applicable statutes of limitations have not expired are subject to examination by the Internal Revenue Service and state and local departments of revenue.
(C) Dividends and Distributions to Shareholders. Dividends and distributions are recorded on the ex-dividend date. The Fund intends to declare and pay dividends from net investment income, if any, at least monthly and distributions from net realized capital and currency gains, if any, at least annually. Unless a shareholder elects otherwise, all dividends and distributions are reinvested at NAV in the same class of shares of the Fund. Dividends and distributions to shareholders are determined in accordance with federal income tax regulations and may differ from determinations using GAAP.
(D) Security Transactions and Investment Income. The Fund records security transactions on the trade date. Realized gains and losses on security transactions are determined using the identified cost method. Dividend income is recognized on the ex-dividend date, net of any foreign tax withheld at the source, and interest income is accrued as earned using the effective interest rate method. Distributions received from real estate investment trusts may be classified as dividends, capital gains and/or return of capital. Discounts and premiums on securities purchased
Notes to Financial Statements (continued)
for the Fund are accreted and amortized, respectively, on the effective interest rate method. Income from payment-in-kind securities is accreted daily based on the effective interest method.
Investment income and realized and unrealized gains and losses on investments of the Fund are allocated pro rata to the separate classes of shares based upon their relative net assets on the date the income is earned or realized and unrealized gains and losses are incurred.
The Fund may place a debt security on non-accrual status and reduce related interest income by ceasing current accruals and writing off all or a portion of any interest receivables when the collection of all or a portion of such interest has become doubtful. A debt security is removed from non-accrual status when the issuer resumes interest payments or when collectability of interest is reasonably assured.
(E) Expenses. Expenses of the Trust are allocated to the individual Funds in proportion to the net assets of the respective Funds when the expenses are incurred, except where direct allocations of expenses can be made. Expenses (other than transfer agent expenses and fees incurred under the shareholder services plans and/or the distribution plans further discussed in Note 3(B)) are allocated to separate classes of shares pro rata based upon their relative net assets on the date the expenses are incurred. The expenses borne by the Fund, including those of related parties to the Fund, are shown in the Statement of Operations.
(F) Use of Estimates. In preparing financial statements in conformity with GAAP, the Manager makes estimates and assumptions that affect the reported amounts and disclosures in the financial statements. Actual results could differ from those estimates and assumptions.
(G) Loan Assignments, Participations and Commitments. The Fund may invest in loan assignments and participations ("loans"). Commitments are agreements to make money available to a borrower in a specified amount, at a specified rate and within a specified time. The Fund records an investment when the borrower withdraws money on a commitment or when a funded loan is purchased (trade date) and records interest as earned. These loans pay interest at rates that are periodically reset by reference to a base lending rate plus a spread. These base lending rates are generally the prime rate offered by a designated U.S. bank, the London Interbank Offered Rate ("LIBOR") or an alternative reference rate.
The loans in which the Fund may invest are generally readily marketable, but may be subject to some restrictions on resale. For example, the Fund may be contractually obligated to receive approval from the agent bank and/or borrower prior to the sale of these investments. If the Fund purchases an assignment from a lender, the Fund will generally have direct contractual rights against the borrower in favor of the lender. If the Fund purchases a participation interest either from a lender or a participant, the Fund typically will have established a direct contractual relationship with the seller of the participation interest, but not with the borrower. Consequently, the Fund is subject to the credit risk of the lender or participant who sold the participation interest to the Fund, in addition to the usual credit risk of the borrower. In the event that the borrower, selling
participant or intermediate participants become insolvent or enter into bankruptcy, the Fund may incur certain costs and delays in realizing payment, or may suffer a loss of principal and/or interest.
Unfunded commitments represent the remaining obligation of the Fund to the borrower. At any point in time, up to the maturity date of the issue, the borrower may demand the unfunded portion. Unfunded amounts, if any, are marked to market and any unrealized gains or losses are recorded in the Statement of Assets and Liabilities. As of October 31, 2022, the Fund did not hold any unfunded commitments.
(H) Debt Securities Risk. The ability of issuers of debt securities held by the Fund to meet their obligations may be affected by, among other things, economic or political developments in a specific country, industry or region. Debt securities are also subject to the risks associated with changes in interest rates. The Fund primarily invests in high-yield debt securities (commonly referred to as “junk bonds”), which are considered speculative because they present a greater risk of loss, including default, than higher rated debt securities. These securities pay investors a premium—a higher interest rate or yield than investment grade debt securities—because of the increased risk of loss. These securities can also be subject to greater price volatility. In times of unusual or adverse market, economic or political conditions, these securities may experience higher than normal default rates.
The loans in which the Fund invests are usually rated below investment grade, or if unrated, determined by the Subadvisor to be of comparable quality (commonly referred to as “junk bonds”) and are generally considered speculative because they present a greater risk of loss, including default, than higher quality debt securities. Moreover, such securities may, under certain circumstances, be particularly susceptible to liquidity and valuation risks.
Although certain loans are collateralized, there is no guarantee that the value of the collateral will be sufficient to repay the loan. In a recession or serious credit event, the value of these investments could decline significantly. As a result, the Fund’s NAVs could go down and you could lose money.
In addition, loans generally are subject to extended settlement periods that may be longer than seven days. As a result, the Fund may be adversely affected by selling other investments at an unfavorable time and/or under unfavorable conditions or engaging in borrowing transactions, such as borrowing against its credit facility, to raise cash to meet redemption obligations or pursue other investment opportunities.
In certain circumstances, loans may not be deemed to be securities. As a result, the Fund may not have the protection of the anti-fraud provisions of the federal securities laws. In such cases, the Fund generally must rely on the contractual provisions in the loan agreement and common-law fraud protections under applicable state law.
(I) LIBOR Replacement Risk. The Fund may invest in certain debt securities, derivatives or other financial instruments that utilize the LIBOR, as a “benchmark” or “reference rate” for various interest rate
| 30 | MainStay MacKay Short Duration High Yield Fund |
calculations. As of January 1, 2022, the United Kingdom Financial Conduct Authority, which regulates LIBOR, ceased its active encouragement of banks to provide the quotations needed to sustain most LIBOR rates due to the absence of an active market for interbank unsecured lending and other reasons. However, the United Kingdom Financial Conduct Authority, the LIBOR administrator and other regulators announced that certain sterling and yen LIBOR settings would be calculated on a "synthetic" basis through the end of 2022 and the most widely used tenors of U.S. dollar LIBOR will continue until mid-2023. As a result, it is anticipated that the remaining LIBOR settings will be discontinued or will no longer be sufficiently robust to be representative of its underlying market around that time. Various financial industry groups will plan for that transition and certain regulators and industry groups have taken actions to establish alternative reference rates (e.g., the Secured Overnight Financing Rate, which measures the cost of overnight borrowings through repurchase agreement transactions collateralized with U.S. Treasury securities and is intended to replace U.S. dollar LIBOR with certain adjustments). However, there are challenges to converting certain contracts and transactions to a new benchmark and neither the full effects of the transition process nor its ultimate outcome is known.
The elimination of LIBOR or changes to other reference rates or any other changes or reforms to the determination or supervision of reference rates could have an adverse impact on the market for, or value of, any securities or payments linked to those reference rates, which may adversely affect the Fund's performance and/or net asset value. Uncertainty and risk also remain regarding the willingness and ability of issuers and lenders to include enhanced provisions in new and existing contracts or instruments. Consequently, the transition away from LIBOR to other reference rates may lead to increased volatility and illiquidity in markets that are tied to LIBOR, fluctuations in values of LIBOR-related investments or investments in issuers that utilize LIBOR, increased difficulty in borrowing or refinancing and diminished effectiveness of hedging strategies, adversely affecting the Fund's performance. Furthermore, the risks associated with the expected discontinuation of LIBOR and transition may be exacerbated if the work necessary to effect an orderly transition to an alternative reference rate is not completed in a timely manner. While the transition away from LIBOR has already begun with no material adverse effect to the Fund's performance, the transition is expected to last through mid-2023 for some LIBOR tenors. The usefulness of LIBOR as a benchmark could deteriorate anytime during this transition period.
(J) Indemnifications. Under the Trust’s organizational documents, its officers and trustees are indemnified against certain liabilities that may arise out of performance of their duties to the Trust. Additionally, in the normal course of business, the Fund enters into contracts with third-party service providers that contain a variety of representations and warranties and that may provide general indemnifications. The Fund's maximum exposure under these arrangements is unknown, as this would involve future claims that may be made against the Fund that have not yet occurred. The Manager believes that the risk of loss in connection with these potential indemnification obligations is remote. However, there can
be no assurance that material liabilities related to such obligations will not arise in the future, which could adversely impact the Fund.
Note 3–Fees and Related Party Transactions
(A) Manager and Subadvisor. New York Life Investments, a registered investment adviser and an indirect, wholly-owned subsidiary of New York Life Insurance Company ("New York Life"), serves as the Fund's Manager, pursuant to an Amended and Restated Management Agreement ("Management Agreement"). The Manager provides offices, conducts clerical, recordkeeping and bookkeeping services and keeps most of the financial and accounting records required to be maintained by the Fund. Except for the portion of salaries and expenses that are the responsibility of the Fund, the Manager pays the salaries and expenses of all personnel affiliated with the Fund and certain operational expenses of the Fund. During a portion of the year ended October 31, 2022, the Fund reimbursed New York Life Investments in an amount equal to the portion of the compensation of the Chief Compliance Officer attributable to the Fund. MacKay Shields LLC ("MacKay Shields" or the "Subadvisor"), a registered investment adviser and an indirect, wholly-owned subsidiary of New York Life, serves as the Subadvisor to the Fund and is responsible for the day-to-day portfolio management of the Fund. Pursuant to the terms of an Amended and Restated Subadvisory Agreement ("Subadvisory Agreement") between New York Life Investments and MacKay Shields, New York Life Investments pays for the services of the Subadvisor.
Pursuant to the Management Agreement, the Fund pays the Manager a monthly fee for the services performed and the facilities furnished at an annual rate of 0.65% of the Fund's average daily net assets.
New York Life Investments has contractually agreed to waive fees and/or reimburse expenses so that the Total Annual Operating Expenses (excluding taxes, interest, litigation, extraordinary expenses, brokerage and other transaction expenses relating to the purchase or sale of portfolio investments and acquired (underlying) fund fees and expenses) do not exceed the following percentages of average daily net assets: Class A, 1.02%; Investor Class, 1.13%; Class C, 1.88%; Class I, 0.78%; Class R2, 1.13% and Class R3, 1.38%. The contractual expense limitation for Class A became effective December 13, 2021. The contractual expense limitations for Class C, Class I, Investor Class, Class R2, and Class R3 became effective February 28, 2022. This agreement will remain in effect until February 28, 2023, and shall renew automatically for one-year terms unless New York Life Investments provides written notice of termination prior to the start of the next term or upon approval of the Board.
Prior to December 13, 2021, New York Life Investments had contractually agreed to waive fees and/or reimburse expenses so that Total Annual Fund Operating Expenses (excluding taxes, interest, litigation, extraordinary expenses, brokerage and other transaction expenses relating to the purchase or sale of portfolio investments, and acquired (underlying) fund fees and expenses) for Class A shares did not exceed 1.05% of the Fund’s average daily net assets. New York Life Investments
Notes to Financial Statements (continued)
applied an equivalent waiver or reimbursement, in an equal number of basis points, to the other share classes of the Fund.
During the year ended October 31, 2022, New York Life Investments earned fees from the Fund in the amount of $9,348,853 and waived fees and/or reimbursed certain class specific expenses in the amount of $6,391 and paid the Subadvisor fees in the amount of $4,671,226.
JPMorgan provides sub-administration and sub-accounting services to the Fund pursuant to an agreement with New York Life Investments. These services include calculating the daily NAVs of the Fund, maintaining the general ledger and sub-ledger accounts for the calculation of the Fund's NAVs, and assisting New York Life Investments in conducting various aspects of the Fund's administrative operations. For providing these services to the Fund, JPMorgan is compensated by New York Life Investments.
Pursuant to an agreement between the Trust and New York Life Investments, New York Life Investments is responsible for providing or procuring certain regulatory reporting services for the Fund. The Fund will reimburse New York Life Investments for the actual costs incurred by New York Life Investments in connection with providing or procuring these services for the Fund.
(B) Distribution and Service Fees. The Trust, on behalf of the Fund, has entered into a distribution agreement with NYLIFE Distributors LLC (the “Distributor”), an affiliate of New York Life Investments. The Fund has adopted distribution plans (the “Plans”) in accordance with the provisions of Rule 12b-1 under the 1940 Act.
Pursuant to the Class A, Investor Class and Class R2 Plans, the Distributor receives a monthly fee from the Class A, Investor Class and Class R2 shares at an annual rate of 0.25% of the average daily net assets of the Class A, Investor Class and Class R2 shares for distribution and/or service activities as designated by the Distributor. Pursuant to the Class C Plan, Class C shares pay the Distributor a monthly distribution fee at an annual rate of 0.75% of the average daily net assets of the Class C shares, along with a service fee at an annual rate of 0.25% of the average daily net assets of the Class C shares, for a total 12b-1 fee of 1.00%. Pursuant to the Class R3 Plan, Class R3 shares pay the Distributor a monthly distribution fee at an annual rate of 0.25% of the average daily net assets of the Class R3 shares, along with a service fee at an annual rate of 0.25% of the average daily net assets of the Class R3 shares, for a total 12b-1 fee of 0.50%. Class I shares are not subject to a distribution and/or service fee.
The Plans provide that the distribution and service fees are payable to the Distributor regardless of the amounts actually expended by the Distributor for distribution of the Fund's shares and service activities.
In accordance with the Shareholder Services Plans for the Class R2 and Class R3 shares, the Manager has agreed to provide, through its affiliates or independent third parties, various shareholder and administrative support services to shareholders of the Class R2 and Class R3 shares. For its services, the Manager, its affiliates or independent third-party
service providers are entitled to a shareholder service fee accrued daily and paid monthly at an annual rate of 0.10% of the average daily net assets of the Class R2 and Class R3 shares. This is in addition to any fees paid under the Class R2 and Class R3 Plans.
During the year ended October 31, 2022, shareholder service fees incurred by the Fund were as follows:
(C) Sales Charges. The Fund was advised by the Distributor that the amount of initial sales charges retained on sales of Class A and Investor Class shares during the year ended October 31, 2022, were $20,357 and $538, respectively.
The Fund was also advised that the Distributor retained CDSCs on redemptions of Class A and Class C shares during the year ended October 31, 2022, of $39,612 and $14,449, respectively.
(D) Transfer, Dividend Disbursing and Shareholder Servicing Agent. NYLIM Service Company LLC, an affiliate of New York Life Investments, is the Fund's transfer, dividend disbursing and shareholder servicing agent pursuant to an agreement between NYLIM Service Company LLC and the Trust. NYLIM Service Company LLC has entered into an agreement with DST Asset Manager Solutions, Inc. ("DST"), pursuant to which DST performs certain transfer agent services on behalf of NYLIM Service Company LLC. New York Life Investments has contractually agreed to limit the transfer agency expenses charged to the Fund’s share classes to a maximum of 0.35% of that share class’s average daily net assets on an annual basis after deducting any applicable Fund or class-level expense reimbursement or small account fees. This agreement will remain in effect until February 28, 2023, and shall renew automatically for one-year terms unless New York Life Investments provides written notice of termination prior to the start of the next term or upon approval of the Board. During the year ended October 31, 2022, transfer agent expenses incurred by the Fund and any reimbursements, pursuant to the aforementioned Transfer Agency expense limitation agreement, were as follows:
| Class | Expense | Waived |
| Class A | $266,490 | $— |
| Investor Class | 9,461 | — |
| Class C | 50,642 | — |
| Class I | 955,868 | — |
| Class R2 | 438 | — |
| Class R3 | 140 | — |
(E) Small Account Fee. Shareholders with small accounts adversely impact the cost of providing transfer agency services. In an effort to reduce total transfer agency expenses, the Fund has implemented a small account fee on certain types of accounts. As described in the Fund's prospectus, certain shareholders with an account balance of less than
| 32 | MainStay MacKay Short Duration High Yield Fund |
$1,000 ($5,000 for Class A share accounts) are charged an annual per account fee of $20 (assessed semi-annually), the proceeds from which offset transfer agent fees as reflected in the Statement of Operations. This small account fee will not apply to certain types of accounts as described further in the Fund’s prospectus.
(F) Capital. As of October 31, 2022, New York Life and its affiliates beneficially held shares of the Fund with the values and percentages of net assets as follows:
| Class A | $5,640,367 | 1.9% |
| Class I | 6,486,452 | 0.6 |
| Class R2 | 34,740 | 7.0 |
| Class R3 | 32,034 | 18.4 |
Note 4-Federal Income Tax
As of October 31, 2022, the cost and unrealized appreciation (depreciation) of the Fund’s investment portfolio, including applicable derivative contracts and other financial instruments, as determined on a federal income tax basis, were as follows:
| | Federal Tax
Cost | Gross
Unrealized
Appreciation | Gross
Unrealized
(Depreciation) | Net
Unrealized
Appreciation/
(Depreciation) |
| Investments in Securities | $1,356,538,676 | $8,631,364 | $(94,591,529) | $(85,960,165) |
As of October 31, 2022, the components of accumulated gain (loss) on a tax basis were as follows:
Ordinary
income | Accumulated
Capital
and Other
Gain (Loss) | Other
Temporary
Differences | Unrealized
Appreciation
(Depreciation) | Total
Accumulated
Gain (Loss) |
| $768,774 | $(56,624,197) | $(649,781) | $(85,960,165) | $(142,465,369) |
The difference between book-basis and tax-basis unrealized appreciation (depreciation) is primarily due to cumulative bond amortization and wash sales adjustments. The other temporary differences are primarily due to dividends payable.
As of October 31, 2022, for federal income tax purposes, capital loss carryforwards of $56,624,197, as shown in the table below, were available to the extent provided by the regulations to offset future realized gains of the Fund. Accordingly, no capital gains distributions are expected to be paid to shareholders until net gains have been realized in excess of such amounts.
Capital Loss
Available Through | Short-Term
Capital Loss
Amounts (000’s) | Long-Term
Capital Loss
Amounts (000’s) |
| Unlimited | $21,706 | $34,918 |
During the years ended October 31, 2022 and October 31, 2021, the tax character of distributions paid as reflected in the Statements of Changes in Net Assets was as follows:
| | 2022 | 2021 |
| Distributions paid from: | | |
| Ordinary Income | $60,595,422 | $64,473,320 |
| Return of Capital | — | 543,620 |
| Total | $60,595,422 | $65,016,940 |
Notes to Financial Statements (continued)
Note 5–Restricted Securities
Restricted securities are subject to legal or contractual restrictions on resale. Private placement securities are generally considered to be restricted except for those securities traded between qualified institutional investors under the provisions of Rule 144A of the Securities Act of 1933, as amended. Disposal of restricted securities may involve time consuming negotiations and expenses, and prompt sale at an acceptable price may be difficult to achieve.
As of October 31, 2022, restricted securities held by the Fund were as follows:
| Security | Date(s) of
Acquisition | Principal
Amount/
Shares | Cost | 10/31/22
Value | Percent of
Net Assets |
| Briggs & Stratton Corp. Escrow Claim Shares |
Corporate Bond
6.875%, due 12/15/20 | 2/26/21 | $ 3,425,000 | $ 3,724,482 | $ 34,250 | 0.0%‡ |
| Carlson Travel, Inc. |
| Common Stock | 9/4/20-12/3/2021 | 303,792 | 7,618,700 | 2,029,003 | 0.1 |
| GenOn Energy, Inc. |
| Common Stock | 12/14/2018 | 20,915 | 2,342,005 | 2,196,075 | 0.2 |
| Gulfport Energy Operating Corp. |
| Preferred Stock | 8/2/21 | 9 | 9,000 | 49,910 | 0.0‡ |
| Sterling Entertainment Enterprises LLC |
Corporate Bond
10.25%, due 1/15/25 | 12/28/17 | $ 3,000,000 | 2,982,301 | 2,754,000 | 0.2 |
| Total | | | $ 16,676,488 | $ 7,063,238 | 0.5% |
| ‡ | Less than one-tenth of a percent. |
Note 6–Custodian
JPMorgan is the custodian of cash and securities held by the Fund. Custodial fees are charged to the Fund based on the Fund's net assets and/or the market value of securities held by the Fund and the number of certain transactions incurred by the Fund.
Note 7–Line of Credit
The Fund and certain other funds managed by New York Life Investments maintain a line of credit with a syndicate of banks in order to secure a source of funds for temporary purposes to meet unanticipated or excessive redemption requests.
Effective July 26, 2022, under the credit agreement (the “Credit Agreement”), the aggregate commitment amount is $600,000,000 with an additional uncommitted amount of $100,000,000. The commitment fee is an annual rate of 0.15% of the average commitment amount payable quarterly, regardless of usage, to JPMorgan, who serves as the agent to the syndicate. The commitment fee is allocated among the Fund and certain other funds managed by New York Life Investments based upon their respective net assets and other factors. Interest on any revolving credit loan is charged based upon the Federal Funds Rate, Daily Simple Secured Overnight Financing Rate ("SOFR") + 0.10%, or the Overnight Bank Funding Rate, whichever is higher. The Credit Agreement expires on July 25, 2023, although the Fund, certain other funds managed by New York Life Investments and the syndicate of banks may renew the Credit Agreement for an additional year on the same or
different terms or enter into a credit agreement with a different syndicate of banks. Prior to July 26, 2022, the aggregate commitment amount and the commitment fee were the same as those under the current Credit Agreement. During the year ended October 31, 2022, there were no borrowings made or outstanding with respect to the Fund under the Credit Agreement.
Note 8–Interfund Lending Program
Pursuant to an exemptive order issued by the SEC, the Fund, along with certain other funds managed by New York Life Investments, may participate in an interfund lending program. The interfund lending program provides an alternative credit facility that permits the Fund and certain other funds managed by New York Life Investments to lend or borrow money for temporary purposes directly to or from one another, subject to the conditions of the exemptive order. During the year ended October 31, 2022, there were no interfund loans made or outstanding with respect to the Fund.
Note 9–Purchases and Sales of Securities (in 000’s)
During the year ended October 31, 2022, purchases and sales of securities, other than short-term securities, were $401,490 and $435,295, respectively.
The Fund may purchase securities from or sell securities to other portfolios managed by the Subadvisor. These interportfolio transactions are primarily used for cash management purposes and are made
| 34 | MainStay MacKay Short Duration High Yield Fund |
pursuant to Rule 17a-7 under the 1940 Act. During the year ended October 31, 2022, such purchases were $131.
Note 10–Capital Share Transactions
Transactions in capital shares for the years ended October 31, 2022 and October 31, 2021, were as follows:
| Class A | Shares | Amount |
| Year ended October 31, 2022: | | |
| Shares sold | 10,759,390 | $ 102,085,502 |
| Shares issued to shareholders in reinvestment of distributions | 1,197,905 | 11,220,427 |
| Shares redeemed | (9,890,216) | (93,600,874) |
| Net increase (decrease) in shares outstanding before conversion | 2,067,079 | 19,705,055 |
| Shares converted into Class A (See Note 1) | 204,711 | 1,935,164 |
| Shares converted from Class A (See Note 1) | (47,057) | (443,280) |
| Net increase (decrease) | 2,224,733 | $ 21,196,939 |
| Year ended October 31, 2021: | | |
| Shares sold | 11,422,448 | $ 112,383,723 |
| Shares issued to shareholders in reinvestment of distributions | 1,081,072 | 10,611,900 |
| Shares redeemed | (8,609,366) | (84,625,893) |
| Net increase (decrease) in shares outstanding before conversion | 3,894,154 | 38,369,730 |
| Shares converted into Class A (See Note 1) | 256,440 | 2,523,351 |
| Shares converted from Class A (See Note 1) | (6,174) | (60,255) |
| Net increase (decrease) | 4,144,420 | $ 40,832,826 |
| |
| Investor Class | Shares | Amount |
| Year ended October 31, 2022: | | |
| Shares sold | 158,271 | $ 1,508,923 |
| Shares issued to shareholders in reinvestment of distributions | 23,312 | 218,463 |
| Shares redeemed | (91,983) | (868,082) |
| Net increase (decrease) in shares outstanding before conversion | 89,600 | 859,304 |
| Shares converted into Investor Class (See Note 1) | 31,348 | 295,183 |
| Shares converted from Investor Class (See Note 1) | (114,600) | (1,084,877) |
| Net increase (decrease) | 6,348 | $ 69,610 |
| Year ended October 31, 2021: | | |
| Shares sold | 125,366 | $ 1,231,649 |
| Shares issued to shareholders in reinvestment of distributions | 24,316 | 238,519 |
| Shares redeemed | (109,279) | (1,072,920) |
| Net increase (decrease) in shares outstanding before conversion | 40,403 | 397,248 |
| Shares converted into Investor Class (See Note 1) | 26,156 | 256,882 |
| Shares converted from Investor Class (See Note 1) | (142,642) | (1,401,817) |
| Net increase (decrease) | (76,083) | $ (747,687) |
| |
| Class C | Shares | Amount |
| Year ended October 31, 2022: | | |
| Shares sold | 484,002 | $ 4,528,538 |
| Shares issued to shareholders in reinvestment of distributions | 84,579 | 793,895 |
| Shares redeemed | (1,240,110) | (11,709,219) |
| Net increase (decrease) in shares outstanding before conversion | (671,529) | (6,386,786) |
| Shares converted from Class C (See Note 1) | (117,521) | (1,109,859) |
| Net increase (decrease) | (789,050) | $ (7,496,645) |
| Year ended October 31, 2021: | | |
| Shares sold | 731,242 | $ 7,190,890 |
| Shares issued to shareholders in reinvestment of distributions | 110,728 | 1,085,653 |
| Shares redeemed | (1,411,601) | (13,863,092) |
| Net increase (decrease) in shares outstanding before conversion | (569,631) | (5,586,549) |
| Shares converted from Class C (See Note 1) | (137,877) | (1,357,747) |
| Net increase (decrease) | (707,508) | $ (6,944,296) |
| |
Notes to Financial Statements (continued)
| Class I | Shares | Amount |
| Year ended October 31, 2022: | | |
| Shares sold | 74,265,593 | $ 701,221,844 |
| Shares issued to shareholders in reinvestment of distributions | 4,416,935 | 41,443,426 |
| Shares redeemed | (81,546,049) | (767,067,867) |
| Net increase (decrease) in shares outstanding before conversion | (2,863,521) | (24,402,597) |
| Shares converted into Class I (See Note 1) | 46,364 | 437,491 |
| Shares converted from Class I (See Note 1) | (3,295) | (29,822) |
| Net increase (decrease) | (2,820,452) | $ (23,994,928) |
| Year ended October 31, 2021: | | |
| Shares sold | 49,369,096 | $ 485,164,928 |
| Shares issued to shareholders in reinvestment of distributions | 4,758,187 | 46,701,553 |
| Shares redeemed | (53,916,155) | (531,045,127) |
| Net increase (decrease) in shares outstanding before conversion | 211,128 | 821,354 |
| Shares converted into Class I (See Note 1) | 5,350 | 52,504 |
| Net increase (decrease) | 216,478 | $ 873,858 |
| |
| Class R2 | Shares | Amount |
| Year ended October 31, 2022: | | |
| Shares sold | 2,492 | $ 23,414 |
| Shares issued to shareholders in reinvestment of distributions | 2,123 | 19,878 |
| Shares redeemed | (1,892) | (17,723) |
| Net increase (decrease) | 2,723 | $ 25,569 |
| Year ended October 31, 2021: | | |
| Shares sold | 558 | $ 5,450 |
| Shares issued to shareholders in reinvestment of distributions | 2,146 | 21,051 |
| Shares redeemed | (4,981) | (49,010) |
| Net increase (decrease) in shares outstanding before conversion | (2,277) | (22,509) |
| Shares converted from Class R2 (See Note 1) | (1,315) | (12,918) |
| Net increase (decrease) | (3,592) | $ (35,427) |
| |
| Class R3 | Shares | Amount |
| Year ended October 31, 2022: | | |
| Shares sold | 2,515 | $ 22,988 |
| Shares issued to shareholders in reinvestment of distributions | 633 | 5,928 |
| Net increase (decrease) | 3,148 | $ 28,916 |
| Year ended October 31, 2021: | | |
| Shares sold | 3,265 | $ 32,230 |
| Shares issued to shareholders in reinvestment of distributions | 572 | 5,611 |
| Shares redeemed | (4,088) | (40,267) |
| Net increase (decrease) | (251) | $ (2,426) |
Note 11–Other Matters
As of the date of this report, interest rates in the United States and many parts of the world, including certain European countries, are ascending from historically low levels. Thus, the Fund currently faces a heightened level of risk associated with rising interest rates. This could be driven by a variety of factors, including but not limited to central bank monetary policies, changing inflation or real growth rates, general economic conditions, increasing bond issuances or reduced market demand for low yielding investments.
An outbreak of COVID-19, first detected in December 2019, has developed into a global pandemic and has resulted in travel restrictions, closure of international borders, certain businesses and securities markets, restrictions on securities trading activities, prolonged quarantines, supply chain disruptions, and lower consumer demand, as well as general concern and uncertainty. In 2022, many countries lifted some or all restrictions related to COVID-19. However, the continued impact of COVID-19 and related variants is uncertain and could further adversely affect the global economy, national economies, individual issuers and capital markets in unforeseeable ways and result in a substantial and extended economic downturn. Developments that disrupt global economies and financial markets, such as COVID-19, may magnify factors that affect the Fund's performance.
Note 12–Subsequent Events
In connection with the preparation of the financial statements of the Fund as of and for the year ended October 31, 2022, events and transactions subsequent to October 31, 2022, through the date the financial statements were issued have been evaluated by the Manager for possible adjustment and/or disclosure. No subsequent events requiring financial statement adjustment or disclosure have been identified.
| 36 | MainStay MacKay Short Duration High Yield Fund |
Report of Independent Registered Public Accounting Firm
To the Shareholders of the Fund and Board of Trustees
MainStay Funds Trust:
Opinion on the Financial Statements
We have audited the accompanying statement of assets and liabilities of MainStay MacKay Short Duration High Yield Fund (the Fund), one of the funds constituting MainStay Funds Trust, including the portfolio of investments, as of October 31, 2022, the related statement of operations for the year then ended, the statements of changes in net assets for each of the years in the two-year period then ended, and the related notes (collectively, the financial statements) and the financial highlights for each of the years in the five-year period then ended. In our opinion, the financial statements and financial highlights present fairly, in all material respects, the financial position of the Fund as of October 31, 2022, the results of its operations for the year then ended, the changes in its net assets for each of the years in the two-year period then ended, and the financial highlights for each of the years in the five-year period then ended, in conformity with U.S. generally accepted accounting principles.
Basis for Opinion
These financial statements and financial highlights are the responsibility of the Fund's management. Our responsibility is to express an opinion on these financial statements and financial highlights based on our audits. We are a public accounting firm registered with the Public Company Accounting Oversight Board (United States) (PCAOB) and are required to be independent with respect to the Fund in accordance with the U.S. federal securities laws and the applicable rules and regulations of the Securities and Exchange Commission and the PCAOB.
We conducted our audits in accordance with the standards of the PCAOB. Those standards require that we plan and perform the audit to obtain reasonable assurance about whether the financial statements and financial highlights are free of material misstatement, whether due to error or fraud. Our audits included performing procedures to assess the risks of material misstatement of the financial statements and financial highlights, whether due to error or fraud, and performing procedures that respond to those risks. Such procedures included examining, on a test basis, evidence regarding the amounts and disclosures in the financial statements and financial highlights. Such procedures also included confirmation of securities owned as of October 31, 2022, by correspondence with custodians and agent banks; when replies were not received from agent banks, we performed other auditing procedures. Our audits also included evaluating the accounting principles used and significant estimates made by management, as well as evaluating the overall presentation of the financial statements and financial highlights. We believe that our audits provide a reasonable basis for our opinion.

We have served as the auditor of one or more New York Life Investment Management investment companies since 2003.
Philadelphia, Pennsylvania
December 23, 2022
Federal Income Tax Information
(Unaudited)
The Fund is required under the Internal Revenue Code to advise shareholders in a written statement as to the federal tax status of dividends paid by the Fund during such fiscal years.
In February 2023, shareholders will receive an IRS Form 1099-DIV or substitute Form 1099, which will show the federal tax status of the distributions received by shareholders in calendar year 2022. The amounts that will be reported on such 1099-DIV or substitute Form 1099 will be the amounts you are to use on your federal income tax return and will differ from the amounts which we must report for the Fund's fiscal year ended October 31, 2022.
Proxy Voting Policies and Procedures and Proxy Voting Record
The Fund is required to file with the SEC its proxy voting record for the 12-month period ending June 30 on Form N-PX. A description of the policies and procedures that are used to vote proxies relating to portfolio securities of the Fund is available free of charge upon request by calling 800-624-6782 or visiting the SEC’s website at www.sec.gov. The most recent Form N-PX or proxy voting record is available free of charge upon request by calling 800-624-6782; visiting newyorklifeinvestments.com; or visiting the SEC’s website at www.sec.gov.
Shareholder Reports and Quarterly Portfolio Disclosure
The Fund is required to file its complete schedule of portfolio holdings with the SEC 60 days after its first and third fiscal quarter on Form N-PORT. The Fund's holdings report is available free of charge upon request by calling New York Life Investments at 800-624-6782.
| 38 | MainStay MacKay Short Duration High Yield Fund |
Board of Trustees and Officers (Unaudited)
The Trustees and officers of the Fund are listed below. The Board oversees the MainStay Group of Funds (which consists of MainStay Funds and MainStay Funds Trust), MainStay VP Funds Trust, MainStay MacKay DefinedTerm Municipal Opportunities Fund, MainStay CBRE Global Infrastructure Megatrends Fund, the Manager and the Subadvisors, and elects the officers of the Funds who are responsible for the day-to-day operations of the Fund. Information pertaining to the Trustees and officers is set forth below. Each Trustee serves until his or her successor is
elected and qualified or until his or her resignation, death or removal. Under the Board’s retirement policy, unless an exception is made, a Trustee must tender his or her resignation by the end of the calendar year during which he or she reaches the age of 75. The business address of each Trustee and officer listed below is 51 Madison Avenue, New York, New York 10010. None of the Trustees are “interested persons” (as defined by the 1940 Act and rules adopted by the SEC thereunder) of the Fund (“Independent Trustees”).
| | Name and
Year of Birth | Term of Office,
Position(s) Held and
Length of Service | Principal Occupation(s)
During Past Five Years | Number of
Portfolios in
Fund Complex
Overseen by
Trustee | Other Directorships
Held by Trustee |
| | | | | | |
| | David H. Chow
1957 | MainStay Funds: Trustee since 2016, Advisory Board Member (June 2015 to December 2015);MainStay Funds Trust:
Trustee since January 2016, Advisory Board Member (June 2015 to December 2015) | Founder and CEO, DanCourt Management, LLC since 1999 | 78 | MainStay VP Funds Trust: Trustee since January 2016, Advisory Board Member (June 2015 to December 2015) (31 portfolios);
MainStay MacKay DefinedTerm Municipal Opportunities Fund: Trustee since January 2016, Advisory Board Member (June 2015 to December 2015);
MainStay CBRE Global Infrastructure Megatrends Fund: Trustee since June 2021; VanEck Vectors Group of Exchange-Traded Funds: Independent Chairman of the Board of Trustees since 2008 and Trustee since 2006 (56 portfolios); and Berea College of Kentucky: Trustee since 2009, Chair of the Investment Committee since 2018 |
| | Susan B. Kerley
1951 | MainStay Funds: Chairman since 2017 and Trustee since 2007;MainStay Funds Trust:
Chairman since 2017 and Trustee since 1990** | President, Strategic Management Advisors LLC since 1990 | 78 | MainStay VP Funds Trust: Chairman since January 2017 and Trustee since 2007 (31 portfolios)**;
MainStay MacKay DefinedTerm Municipal Opportunities Fund: Chairman since 2017 and Trustee since 2011;
MainStay CBRE Global Infrastructure Megatrends Fund: Trustee since June 2021; and Legg Mason Partners Funds: Trustee since 1991 (45 portfolios) |
| | Alan R. Latshaw
1951 | MainStay Funds: Trustee since 2006;MainStay Funds Trust:
Trustee since 2007*** | Retired; Partner, Ernst & Young LLP (2002 to 2003); Partner, Arthur Andersen LLP (1989 to 2002); Consultant to the MainStay Funds Audit and Compliance Committee (2004 to 2006) | 78 | MainStay VP Funds Trust: Trustee since 2007 (31 portfolios)**;
MainStay MacKay DefinedTerm Municipal Opportunities Fund: Trustee since 2011; and
MainStay CBRE Global Infrastructure Megatrends Fund: Trustee since June 2021 |
Board of Trustees and Officers (Unaudited) (continued)
| | Name and
Year of Birth | Term of Office,
Position(s) Held and
Length of Service | Principal Occupation(s)
During Past Five Years | Number of
Portfolios in
Fund Complex
Overseen by
Trustee | Other Directorships
Held by Trustee |
| | | | | | |
| | Karen Hammond
1956 | MainStay Funds: Trustee since December 2021, Advisory Board Member (June 2021 to December 2021);MainStay Funds Trust:
Trustee since December 2021, Advisory Board Member (June 2021 to December 2021)
| Retired, Managing Director, Devonshire Investors (2007 to 2013); Senior Vice President, Fidelity Management & Research Co. (2005 to 2007); Senior Vice President and Corporate Treasurer, FMR Corp. (2003 to 2005); Chief Operating Officer, Fidelity Investments Japan (2001 to 2003) | 78 | MainStay VP Funds Trust: Trustee since December 2021, Advisory Board Member (June 2021 to December 2021) (31 Portfolios);
MainStay MacKay DefinedTerm Municipal Opportunities Fund: Trustee since December 2021, Advisory Board Member (June 2021 to December 2021);
MainStay CBRE Global Infrastructure Megatrends Fund: Trustee since December 2021, Advisory Board Member (June 2021 to December 2021);
Two Harbors Investment Corp.: Director since 2018;
Rhode Island State Investment Commission: Member since 2017; and
Blue Cross Blue Shield of Rhode Island: Director since 2019 |
| | Jacques P. Perold
1958 | MainStay Funds: Trustee since 2016, Advisory Board Member (June 2015 toDecember 2015);MainStay Funds Trust:
Trustee since January 2016, Advisory Board Member (June 2015 to December 2015) | Founder and Chief Executive Officer, CapShift Advisors LLC (since 2018); President, Fidelity Management & Research Company (2009 to 2014); President and Chief Investment Officer, Geode Capital Management, LLC (2001 to 2009) | 78 | MainStay VP Funds Trust: Trustee since January 2016, Advisory Board Member (June 2015 to December 2015) (31 portfolios);
MainStay MacKay DefinedTerm Municipal Opportunities Fund: Trustee since January 2016, Advisory Board Member (June 2015 to December 2015);
MainStay CBRE Global Infrastructure Megatrends Fund: Trustee since June 2021; Partners in Health: Trustee since 2019; Allstate Corporation: Director since 2015; and MSCI Inc.: Director since 2017 |
| | Richard S. Trutanic
1952 | MainStay Funds: Trustee since 1994;MainStay Funds Trust:
Trustee since 2007*** | Chairman and Chief Executive Officer, Somerset & Company (financial advisory firm) since 2004; Managing Director, The Carlyle Group (private investment firm) (2002 to 2004); Senior Managing Director, Partner and Board Member, Groupe Arnault S.A. (private investment firm) (1999 to 2002) | 78 | MainStay VP Funds Trust: Trustee since 2007 (31 portfolios)**;
MainStay MacKay DefinedTerm Municipal Opportunities Fund: Trustee since 2011; and MainStay CBRE Global Infrastructure Megatrends Fund: Trustee since June 2021 |
| ** | Includes prior service as a Director of MainStay VP Series Fund, Inc., the predecessor to MainStay VP Funds Trust. |
| *** | Includes prior service as a Director/Trustee of certain predecessor entities to MainStay Funds Trust. |
| 40 | MainStay MacKay Short Duration High Yield Fund |
| | Name and
Year of Birth | Position(s) Held and
Length of Service | Principal Occupation(s)
During Past Five Years | |
| | | | | |
| | Kirk C. Lehneis
1974 | President, MainStay Funds, MainStay Funds Trust since 2017 | Chief Operating Officer and Senior Managing Director (since 2016), New York Life Investment Management LLC and New York Life Investment Management Holdings LLC; Member of the Board of Managers (since 2017) and Senior Managing Director (since 2018), NYLIFE Distributors LLC; Chairman of the Board and Senior Managing Director, NYLIM Service Company LLC (since 2017); Trustee, President and Principal Executive Officer of IndexIQ Trust, IndexIQ ETF Trust and IndexIQ Active ETF Trust (since January 2018); President, MainStay CBRE Global Infrastructure Megatrends Fund (since 2021), MainStay MacKay DefinedTerm Municipal Opportunities Fund and MainStay VP Funds Trust (since 2017); Senior Managing Director, Global Product Development (From 2015-2016); Managing Director, Product Development (2010 to 2015), New York Life Investment Management LLC | |
| | Jack R. Benintende
1964 | Treasurer and Principal Financial and Accounting Officer, MainStay Funds (since 2007), MainStay Funds Trust (since 2009) | Managing Director, New York Life Investment Management LLC (since 2007); Treasurer and Principal Financial and Accounting Officer, MainStay CBRE Global Infrastructure Megatrends Fund (since 2021), MainStay MacKay DefinedTerm Municipal Opportunities Fund (since 2011) and MainStay VP Funds Trust (since 2007)** and Assistant Treasurer, New York Life Investment Management Holdings LLC (2008 to 2012) | |
| | J. Kevin Gao
1967 | Secretary and Chief Legal Officer, MainStay Funds and MainStay Funds Trust (since 2010) | Managing Director and Associate General Counsel, New York Life Investment Management LLC (since 2010); Secretary and Chief Legal Officer and MainStay CBRE Global Infrastructure Megatrends Fund (since 2021), MainStay MacKay DefinedTerm Municipal Opportunities Fund (since 2011) and MainStay VP Funds Trust (since 2010)** | |
| | Scott T. Harrington
1959 | Vice President— Administration, MainStay Funds (since 2009), MainStay Funds Trust (since 2009) | Managing Director, New York Life Investment Management LLC (including predecessor advisory organizations) (since 2000); Member of the Board of Directors, New York Life Trust Company (since 2009); Vice President—Administration, MainStay CBRE Global Infrastructure Megatrends Fund (since 2021), MainStay MacKay DefinedTerm Municipal Opportunities Fund (since 2011) and MainStay VP Funds Trust (since 2005)** | |
| | Kevin M. Gleason
1967 | Vice President and Chief Compliance Officer, MainStay Funds and MainStay Funds Trust (since June 2022) | Vice President and Chief Compliance Officer, IndexIQ, IndexIQ ETF Trust and Index IQ Active ETF Trust (since June 2022); Vice President and Chief Compliance Officer, MainStay CBRE Global Infrastructure Megatrends Fund, MainStay VP Funds Trust and MainStay MacKay DefinedTerm Municipal Opportunities Fund (since June 2022); Senior Vice President, Voya Investment Management and Chief Compliance Officer, Voya Family of Funds (2012-2022) | |
| * | The officers listed above are considered to be “interested persons” of the MainStay Group of Funds, MainStay VP Funds Trust, MainStay CBRE Global Infrastructure Megatrends Fund and MainStay MacKay DefinedTerm Municipal Opportunities Fund within the meaning of the 1940 Act because of their affiliation with the MainStay Group of Funds, New York Life Insurance Company and/or its affiliates, including New York Life Investment Management LLC, NYLIM Service Company LLC, NYLIFE Securities LLC and/or NYLIFE Distributors LLC, as described in detail in the column captioned “Principal Occupation(s) During Past Five Years.” Officers are elected annually by the Board. |
| ** | Includes prior service as an Officer of MainStay VP Series Fund, Inc., the predecessor to MainStay VP Funds Trust. |
Officers of the Trust (Who are not Trustees)*
This page intentionally left blank.
Equity
U.S. Equity
MainStay Epoch U.S. Equity Yield Fund
MainStay S&P 500 Index Fund1
MainStay Winslow Large Cap Growth Fund
MainStay WMC Enduring Capital Fund
MainStay WMC Growth Fund
MainStay WMC Small Companies Fund
MainStay WMC Value Fund
International Equity
MainStay Epoch International Choice Fund
MainStay MacKay International Equity Fund
MainStay WMC International Research Equity Fund
Emerging Markets Equity
MainStay Candriam Emerging Markets Equity Fund
Global Equity
MainStay Epoch Capital Growth Fund
MainStay Epoch Global Equity Yield Fund
Fixed Income
Taxable Income
MainStay Candriam Emerging Markets Debt Fund
MainStay Floating Rate Fund
MainStay MacKay High Yield Corporate Bond Fund
MainStay MacKay Short Duration High Yield Fund
MainStay MacKay Strategic Bond Fund
MainStay MacKay Total Return Bond Fund
MainStay MacKay U.S. Infrastructure Bond Fund
MainStay Short Term Bond Fund
Tax-Exempt Income
MainStay MacKay California Tax Free Opportunities Fund2
MainStay MacKay High Yield Municipal Bond Fund
MainStay MacKay New York Tax Free Opportunities Fund3
MainStay MacKay Short Term Municipal Fund
MainStay MacKay Strategic Municipal Allocation Fund
MainStay MacKay Tax Free Bond Fund
Money Market
MainStay Money Market Fund
Mixed Asset
MainStay Balanced Fund
MainStay Income Builder Fund
MainStay MacKay Convertible Fund
Speciality
MainStay CBRE Global Infrastructure Fund
MainStay CBRE Real Estate Fund
MainStay Cushing MLP Premier Fund
Asset Allocation
MainStay Conservative Allocation Fund
MainStay Conservative ETF Allocation Fund
MainStay Defensive ETF Allocation Fund
MainStay Equity Allocation Fund
MainStay Equity ETF Allocation Fund
MainStay ESG Multi-Asset Allocation Fund
MainStay Growth Allocation Fund
MainStay Growth ETF Allocation Fund
MainStay Moderate Allocation Fund
MainStay Moderate ETF Allocation Fund
Manager
New York Life Investment Management LLC
New York, New York
Subadvisors
Candriam4
Strassen, Luxembourg
CBRE Investment Management Listed Real Assets LLC
Radnor, Pennsylvania
Cushing Asset Management, LP
Dallas, Texas
Epoch Investment Partners, Inc.
New York, New York
MacKay Shields LLC4
New York, New York
NYL Investors LLC4
New York, New York
Wellington Management Company LLP
Boston, Massachusetts
Winslow Capital Management, LLC
Minneapolis, Minnesota
Legal Counsel
Dechert LLP
Washington, District of Columbia
Independent Registered Public Accounting Firm
KPMG LLP
Philadelphia, Pennsylvania
Distributor
NYLIFE Distributors LLC4
Jersey City, New Jersey
Custodian
JPMorgan Chase Bank, N.A.
New York, New York
1.
Prior to February 28, 2022, the Fund's name was MainStay MacKay S&P 500 Index Fund.
| 2. | This Fund is registered for sale in AZ, CA, NV, OR, TX, UT, WA and MI (Class A and Class I shares only), and CO, FL, GA, HI, ID, MA, MD, NH, NJ and NY (Class I shares only). |
| 3. | This Fund is registered for sale in CA, CT, DE, FL, MA, NJ, NY and VT. |
| 4. | An affiliate of New York Life Investment Management LLC. |
Not part of the Annual Report
For more information
800-624-6782
newyorklifeinvestments.com
“New York Life Investments” is both a service mark, and the common trade name, of certain investment advisors affiliated with New York Life Insurance Company. The MainStay Funds® are managed by New York Life Investment Management LLC and distributed by NYLIFE Distributors LLC, 30 Hudson Street, Jersey City, NJ 07302, a wholly owned subsidiary of New York Life Insurance Company. NYLIFE Distributors LLC is a Member FINRA/SIPC.
©2022 NYLIFE Distributors LLC. All rights reserved.
| 5013766.2MS229-22 | MSSHY11-12/22 |
(NYLIM) NL232
MainStay MacKay Total Return Bond Fund
Message from the President and Annual Report
October 31, 2022
Sign up for e-delivery of your shareholder reports. For full details on e-delivery, including who can participate and what you can receive via e-delivery,
please log in to newyorklifeinvestments.com/accounts.
| Not FDIC/NCUA Insured | Not a Deposit | May Lose Value | No Bank Guarantee | Not Insured by Any Government Agency |
This page intentionally left blank
Message from the President
A series of economic and geopolitical challenges undermined equity and fixed-income markets during the 12-month reporting period ended October 31, 2022. Stocks and bonds alike trended lower in the face of sharply rising interest rates, increasing inflationary pressures, slowing economic growth and Russia’s invasion of Ukraine.
The reporting period began on a mixed note, with concerns about the spreading Omicron variant of the COVID-19 virus and increasingly hawkish statements from the U.S. Federal Reserve (the “Fed”) regarding mounting inflation, countered by bullish sentiment stemming from U.S. economic growth and strong corporate earnings. In January 2022, markets turned decisively negative as comments from the Fed raised the likelihood of rate hikes as early as March, and Russia issued increasingly aggressive threats toward Ukraine. The onset of Russia’s invasion in February exacerbated global inflationary pressures while increasing investor uncertainty. Domestic supply shortages, international trade imbalances and rising inflation caused GDP (gross domestic product) to contract in the first and second quarters of the year, although employment and consumer spending proved resilient. Prices for petroleum surged to multi-year highs, while many key agricultural chemicals and industrial metals climbed as well. Accelerating inflationary forces prompted the Fed to implement its most aggressive interest rate increases since the 1980s with a series of five sharp rate hikes, raising the federal funds rate from a range of 0.00% to 0.25% in March to 3.00% to 3.25% in September, with additional rate hikes expected before the end of the year. International central banks generally followed suit, raising rates by varying degrees in efforts to curb local inflation, although most increases remained significantly more modest than those in the United States. Relatively high U.S. interest rates and risk-averse international sentiment pushed U.S. dollar values higher compared to most other currencies, with the ensuing negative impact on global prices for food, fuel and other key, U.S.-dollar-denominated products.
The effects of these interrelated challenges were felt throughout U.S. and international financial markets. The S&P 500® Index, a widely regarded benchmark of U.S. market performance, declined by more than 14% during the reporting period. Although the energy sector generated strong gains, bolstered by elevated oil and gas prices, most other industry areas recorded losses. The more cyclical and growth-oriented sectors of consumer discretionary, real estate and information technology delivered the
weakest returns, while the traditionally defensive and value-oriented consumer staples, utilities and health care sectors outperformed. International stocks lagged compared to their U.S. counterparts, with some emerging markets, such as China, suffering particularly steep losses. A few markets, however, including Brazil, Mexico and the United Arab Emirates, ended the reporting period with little change. Fixed-income markets saw bond prices broadly decline as yields rose along with interest rates. Short-term yields rose faster than long-term yields, producing a yield curve inversion from July through the end of the reporting period, with long-term rates remaining below short-term rates. While floating-rate instruments, which feature variable interest rates that allow investors to benefit from a rising rate environment, provided a degree of insulation from inflation-driven trends, they were not immune to the market’s widespread declines.
While the Fed acknowledges the costs of rising rates in terms of weaker GDP growth and unsettled financial markets over the short term, its primary focus continues to be the longer-term economic impact of inflation. With the latest figures as of the date of this report showing that inflation remains above 8%, versus a target rate of just 2%, the Fed clearly has a distance yet to go, making further rate increases and market volatility more likely in the coming months. The question remains as to whether the Fed and other central banks will manage a so-called “soft landing,” curbing inflation while avoiding a persistent economic slowdown. If they prove successful, we expect that favorable inflation trends and increasingly attractive valuations in both equity and bond markets should eventually translate into sustainable improvements in the investment environment.
Whatever actions the Fed takes and however financial markets react, as a MainStay investor, you can depend on us to continue providing the insight, expertise and service that have long defined New York Life Investments. Thank you for trusting us to help you meet your investment needs.
Sincerely,
Kirk C. Lehneis
President
The opinions expressed are as of the date of this report and are subject to change. There is no guarantee that any forecast made will come to pass. This material does not constitute investment advice and is not intended as an endorsement of any specific investment. Past performance is no guarantee of future results.
Not part of the Annual Report
Investors should refer to the Fund’s Summary Prospectus and/or Prospectus and consider the Fund’s investment objectives, strategies, risks, charges and expenses carefully before investing. The Summary Prospectus and/or Prospectus contain this and other information about the Fund. You may obtain copies of the Fund’s Summary Prospectus, Prospectus and Statement of Additional Information, which includes information about the MainStay Funds Trust's Trustees, free of charge, upon request, by calling toll-free 800-624-6782, by writing to NYLIFE Distributors LLC, Attn: MainStay Marketing Department, 30 Hudson Street, Jersey City, NJ 07302 or by sending an e-mail to MainStayShareholderServices@nylim.com. These documents are also available via the MainStay Funds’ website at newyorklifeinvestments.com. Please read the Fund’s Summary Prospectus and/or Prospectus carefully before investing.
Investment and Performance Comparison (Unaudited)
Performance data quoted represents past performance. Past performance is no guarantee of future results. Because of market volatility and other factors, current performance may be lower or higher than the figures shown. Investment return and principal value will fluctuate, and as a result, when shares are redeemed, they may be worth more or less than their original cost. The graph below depicts the historical performance of Class I shares of the Fund. Performance will vary from class to class based on differences in class-specific expenses and sales charges. For performance information current to the most recent month-end, please call 800-624-6782 or visit newyorklifeinvestments.com.
The performance table and graph do not reflect the deduction of taxes that a shareholder would pay on distributions or Fund share redemptions. Total returns reflect maximum applicable sales charges as indicated in the table below, if any, changes in share price, and reinvestment of dividend and capital gain distributions. The graph assumes the initial investment amount shown below and reflects the deduction of all sales charges that would have applied for the period of investment. Performance figures may reflect certain fee waivers and/or expense limitations, without which total returns may have been lower. For more information on share classes and current fee waivers and/or expense limitations (if any), please refer to the Notes to Financial Statements.

| Average Annual Total Returns for the Year-Ended October 31, 2022 |
| Class | Sales Charge | | Inception
Date | One
Year | Five
Years | Ten Years
or Since
Inception | Gross
Expense
Ratio1 |
| Class A Shares | Maximum 4.5% Initial Sales Charge | With sales charges | 1/2/2004 | -22.10% | -1.84% | 0.07% | 0.79% |
| | | Excluding sales charges | | -18.43 | -0.93 | 0.54 | 0.79 |
| Investor Class Shares2 | Maximum 4% Initial Sales Charge | With sales charges | 2/28/2008 | -21.90 | -2.05 | -0.05 | 1.00 |
| | | Excluding sales charges | | -18.65 | -1.14 | 0.41 | 1.00 |
| Class B Shares3 | Maximum 5% CDSC | With sales charges | 1/2/2004 | -23.17 | -2.23 | -0.34 | 1.75 |
| | if Redeemed Within the First Six Years of Purchase | Excluding sales charges | | -19.34 | -1.88 | -0.34 | 1.75 |
| Class C Shares | Maximum 1% CDSC | With sales charges | 1/2/2004 | -20.09 | -1.87 | -0.34 | 1.75 |
| | if Redeemed Within One Year of Purchase | Excluding sales charges | | -19.32 | -1.87 | -0.34 | 1.75 |
| Class I Shares | No Sales Charge | | 1/2/1991 | -18.30 | -0.67 | 0.83 | 0.54 |
| Class R1 Shares | No Sales Charge | | 6/29/2012 | -18.31 | -0.77 | 0.73 | 0.64 |
| Class R2 Shares | No Sales Charge | | 6/29/2012 | -18.52 | -1.00 | 0.48 | 0.89 |
| Class R3 Shares | No Sales Charge | | 2/29/2016 | -18.71 | -1.26 | 0.06 | 1.14 |
| Class R6 Shares | No Sales Charge | | 12/29/2014 | -18.20 | -0.61 | 0.59 | 0.49 |
| SIMPLE Class Shares | No Sales Charge | | 8/31/2020 | -18.85 | N/A | -8.89 | 1.25 |
| 1. | The gross expense ratios presented reflect the Fund’s “Total Annual Fund Operating Expenses” from the most recent Prospectus, as supplemented, and may differ from other expense ratios disclosed in this report. |
| 2. | Prior to June 30, 2020, the maximum initial sales charge was 4.5%, which is reflected in the applicable average annual total return figures shown. |
| 3. | Class B shares are closed to all new purchases as well as additional investments by existing Class B shareholders. |
The footnotes on the next page are an integral part of the table and graph and should be carefully read in conjunction with them.
| Benchmark Performance* | One
Year | Five
Years | Ten
Years |
| Bloomberg U.S. Aggregate Bond Index1 | -15.68% | -0.54% | 0.74% |
| Morningstar Intermediate Core-Plus Bond Category Average2 | -15.92 | -0.41 | 1.00 |
| * | Returns for indices reflect no deductions for fees, expenses or taxes, except for foreign withholding taxes where applicable. Results assume reinvestment of all dividends and capital gains. An investment cannot be made directly in an index. |
| 1. | The Bloomberg U.S. Aggregate Bond Index is a broad-based benchmark that measures performance of the investment-grade, U.S. dollar denominated, fixed-rate taxable bond market, including Treasurys, government-related and corporate securities, mortgage-backed securities (agency fixed-rate and hybrid adjustable-rate mortgage pass-throughs), asset-backed securities and commercial mortgage-backed securities. |
| 2. | The Morningstar Intermediate Core-Plus Bond Category Average is representative of funds that invest primarily in investment-grade U.S. fixed-income issues including government, corporate, and securitized debt, but generally have greater flexibility than core offerings to hold non-core sectors such as corporate high yield, bank loan, emerging-markets debt, and non-U.S. currency exposures. Their durations (a measure of interest-rate sensitivity) typically range between 75% and 125% of the three-year average of the effective duration of the Morningstar Core Bond Index. Results are based on average total returns of similar funds with all dividends and capital gain distributions reinvested. |
The footnotes on the preceding page are an integral part of the table and graph and should be carefully read in conjunction with them.
| 6 | MainStay MacKay Total Return Bond Fund |
Cost in Dollars of a $1,000 Investment in MainStay MacKay Total Return Bond Fund (Unaudited)
The example below is intended to describe the fees and expenses borne by shareholders during the six-month period from May 1, 2022 to October 31, 2022, and the impact of those costs on your investment.
Example
As a shareholder of the Fund you incur two types of costs: (1) transaction costs, including exchange fees and sales charges (loads) on purchases (as applicable), and (2) ongoing costs, including management fees, distribution and/or service (12b-1) fees and other Fund expenses (as applicable). This example is intended to help you understand your ongoing costs (in dollars) of investing in the Fund and to compare these costs with the ongoing costs of investing in other mutual funds. The example is based on an investment of $1,000 made at the beginning of the six-month period and held for the entire period from May 1, 2022 to October 31, 2022.
This example illustrates your Fund’s ongoing costs in two ways:
Actual Expenses
The second and third data columns in the table below provide information about actual account values and actual expenses. You may use the information in these columns, together with the amount you invested, to estimate the expenses that you paid during the six months ended October 31, 2022. Simply divide your account value by $1,000 (for example, an
$8,600 account value divided by $1,000 = 8.6), then multiply the result by the number under the heading entitled “Expenses Paid During Period” to estimate the expenses you paid on your account during this period.
Hypothetical Example for Comparison Purposes
The fourth and fifth data columns in the table below provide information about hypothetical account values and hypothetical expenses based on the Fund’s actual expense ratio and an assumed rate of return of 5% per year before expenses, which is not the Fund’s actual return. The hypothetical account values and expenses may not be used to estimate the actual ending account balances or expenses you paid for the six-month period shown. You may use this information to compare the ongoing costs of investing in the Fund with the ongoing costs of investing in other mutual funds. To do so, compare this 5% hypothetical example with the 5% hypothetical examples that appear in the shareholder reports of the other mutual funds.
Please note that the expenses shown in the table are meant to highlight your ongoing costs only and do not reflect any transactional costs, such as exchange fees or sales charges (loads). Therefore, the fourth and fifth data columns of the table are useful in comparing ongoing costs only and will not help you determine the relative total costs of owning different funds. In addition, if these transactional costs were included, your costs would have been higher.
| Share Class | Beginning
Account
Value
5/1/22 | Ending Account
Value (Based
on Actual
Returns and
Expenses)
10/31/22 | Expenses
Paid
During
Period1 | Ending Account
Value (Based
on Hypothetical
5% Annualized
Return and
Actual Expenses)
10/31/22 | Expenses
Paid
During
Period1 | Net Expense
Ratio
During
Period2 |
| Class A Shares | $1,000.00 | $912.40 | $3.47 | $1,021.58 | $3.67 | 0.72% |
| Investor Class Shares | $1,000.00 | $910.60 | $4.86 | $1,020.11 | $5.14 | 1.01% |
| Class B Shares | $1,000.00 | $906.70 | $8.46 | $1,016.33 | $8.94 | 1.76% |
| Class C Shares | $1,000.00 | $906.80 | $8.46 | $1,016.33 | $8.94 | 1.76% |
| Class I Shares | $1,000.00 | $912.70 | $2.12 | $1,022.99 | $2.24 | 0.44% |
| Class R1 Shares | $1,000.00 | $913.20 | $2.70 | $1,022.38 | $2.85 | 0.56% |
| Class R2 Shares | $1,000.00 | $912.00 | $3.95 | $1,021.07 | $4.18 | 0.82% |
| Class R3 Shares | $1,000.00 | $910.80 | $5.15 | $1,019.81 | $5.45 | 1.07% |
| Class R6 Shares | $1,000.00 | $913.80 | $2.07 | $1,023.04 | $2.19 | 0.43% |
| SIMPLE Class Shares | $1,000.00 | $909.40 | $6.06 | $1,018.85 | $6.41 | 1.26% |
| 1. | Expenses are equal to the Fund’s annualized expense ratio of each class multiplied by the average account value over the period, divided by 365 and multiplied by 184 (to reflect the six-month period). The table above represents the actual expenses incurred during the six-month period. In addition to the fees and expenses which the Fund bears directly, it also indirectly bears a pro rata share of the fees and expenses of the underlying funds in which it invests. Such indirect expenses are not included in the above-reported expense figures. |
| 2. | Expenses are equal to the Fund's annualized expense ratio to reflect the six-month period. |
Portfolio Composition as of October 31, 2022 (Unaudited)
‡ Less than one-tenth of a percent.
See Portfolio of Investments beginning on page 11 for specific holdings within these categories. The Fund's holdings are subject to change.
Top Ten Holdings and/or Issuers Held as of October 31, 2022 (excluding short-term investments) (Unaudited)
| 1. | U.S. Treasury Bonds, 3.00%-3.375%, due 8/15/42–8/15/52 |
| 2. | GNMA, (zero coupon)-3.50%, due 8/20/49–2/20/52 |
| 3. | U.S. Treasury Notes, 2.75%-4.375%, due 10/31/24–8/15/32 |
| 4. | FNMA, (zero coupon)-7.586%, due 5/25/30–2/25/52 |
| 5. | UMBS, 30 Year, 2.50%-6.50%, due 7/1/39–9/1/52 |
| 6. | Bank of America Corp., 2.087%-4.30%, due 1/28/25–4/22/32 |
| 7. | JPMorgan Chase & Co., 2.182%-4.60%, due 2/1/25–4/23/29 |
| 8. | UMBS, 30 Year, 3.00%-3.50%, due 3/1/52–7/1/52 |
| 9. | Morgan Stanley, 2.484%-5.00%, due 11/24/25–9/16/36 |
| 10. | CF Hippolyta Issuer LLC, 1.53%-1.98%, due 7/15/60–3/15/61 |
| 8 | MainStay MacKay Total Return Bond Fund |
Portfolio Management Discussion and Analysis (Unaudited)
Questions answered by portfolio managers Stephen R. Cianci, CFA, Neil Moriarty III and Lesya Paisley, CFA, of MacKay Shields LLC, the Fund’s Subadvisor.
How did MainStay MacKay Total Return Bond Fund perform relative to its benchmark and peer group during the 12 months ended October 31, 2022?
For the 12 months ended October 31, 2022, Class I shares of MainStay MacKay Total Return Bond Fund returned −18.30%, underperforming the −15.68% return of the Fund’s benchmark, the Bloomberg U.S. Aggregate Bond Index (the “Index”). Over the same period, Class I shares also underperformed the −15.92% return of the Morningstar Intermediate Core-Plus Bond Category Average.1
Were there any changes to the Fund during the reporting period?
Effective February 28, 2022, Lesya Paisley was added as a portfolio manager of the Fund.
What factors affected the Fund’s relative performance during the reporting period?
The performance of the Index during the period was primarily driven by substantial increases in interest rates, described in greater detail below. The Fund underperformed the Index largely due to overweight allocations to high-grade and high-yield corporates, preferred debt and emerging-market credit, which detracted from relative returns as spreads2 widened. Conversely, the Fund’s yield curve3 positioning and allocation to securitized product made positive contributions to relative performance. (Contributions take weightings and total returns into account.)
During the reporting period, were there any market events that materially impacted the Fund’s performance or liquidity?
Along with the ongoing war in Ukraine, the defining occurrence of the reporting period was the rapid repricing of expectations for global monetary policy, especially in the United States. An exceptionally strong labor market, together with concerns regarding long-term inflation and few signs of a letup in underlying inflation pressures, led U.S. Federal Reserve officials to significantly adjust their outlook on monetary policy, and markets followed suit. With most major central banks continuing to battle high inflation through stepped-up policy rate increases, risk-free as well as risk assets performed poorly. Widespread, substantial global monetary tightening occurred during the reporting period with numerous central banks quickly tightening policies within a relatively short period of time.
During the reporting period, how was the Fund’s performance materially affected by investments in derivatives?
During the reporting period, the Fund used U.S. Treasury futures as an overall adjustment to its duration4 and yield curve positioning. On a stand-alone absolute basis, these positions detracted from overall returns.
What was the Fund’s duration strategy during the reporting period?
The Fund’s strategy was to keep duration neutral to the Index through the first half of the reporting period, then to add duration as yields rose. As of October 31, 2022, the effective duration for the Fund was 6.50 years relative to the 6.10 years for the benchmark.
During the reporting period, which sectors were the strongest positive contributors to the Fund’s relative performance and which sectors were particularly weak?
During the reporting period, as stated above, the Fund’s yield curve and securitized product positioning contributed positively to returns relative to the Index. Conversely, high-grade and high-yield corporate bond positions detracted from relative performance. Within the Fund’s corporate exposure, the banking, retailers, electric and midstream industries were among the most significant detractors.
What were some of the Fund’s largest purchases and sales during the reporting period?
During the reporting period, the Fund added credits issued by private equity firm Starwood Capital Group. During the same period, the Fund reduced its exposure to investment bank and financial services providers Bank of America and JP Morgan Chase. In addition, the Fund sold its shares of Progress Residential Trust to provide liquidity to the Fund.
How did the Fund’s sector weightings change during the reporting period?
During the reporting period, the Fund increased its exposure to agency mortgages and consumer asset-backed securities. During the same period, the Fund trimmed its exposure to bank loans and emerging-market bonds.
| 1. | See page 5 for other share class returns, which may be higher or lower than Class I share returns. See page 6 for more information on benchmark and peer group returns. |
| 2. | The terms “spread” and “yield spread” may refer to the difference in yield between a security or type of security and comparable U.S. Treasury issues. The terms may also refer to the difference in yield between two specific securities or types of securities at a given time. |
| 3. | The yield curve is a line that plots the yields of various securities of similar quality—typically U.S. Treasury issues—across a range of maturities. The U.S. Treasury yield curve serves as a benchmark for other debt and is used in economic forecasting. |
| 4. | Duration is a measure of the price sensitivity of a fixed-income investment to changes in interest rates. Duration is expressed as a number of years and is considered a more accurate sensitivity gauge than average maturity. |
How was the Fund positioned at the end of the reporting period?
As of October 31, 2022, relative to the Index, the Fund held overweight exposure to high-grade and high-yield corporate bonds, as well as securitized product. As of the same date, the Fund held underweight exposure to U.S. Treasury securities and agency mortgages.
The opinions expressed are those of the portfolio managers as of the date of this report and are subject to change. There is no guarantee that any forecasts will come to pass. This material does not constitute investment advice and is not intended as an endorsement of any specific investment.
| 10 | MainStay MacKay Total Return Bond Fund |
Portfolio of Investments October 31, 2022†
| | Principal
Amount | Value |
| Long-Term Bonds 97.4% |
| Asset-Backed Securities 11.5% |
| Automobile Asset-Backed Securities 4.2% |
| American Credit Acceptance Receivables Trust | |
| Series 2022-1, Class D | | |
| 2.46%, due 3/13/28 (a) | $ 1,885,000 | $ 1,671,549 |
| Avis Budget Rental Car Funding AESOP LLC | |
| Series 2020-2A, Class A | | |
| 2.02%, due 2/20/27 (a) | 1,435,000 | 1,268,937 |
| CPS Auto Receivables Trust | |
| Series 2021-C, Class E | | |
| 3.21%, due 9/15/28 (a) | 800,000 | 688,276 |
| Drive Auto Receivables Trust | |
| Series 2021-2, Class D | | |
| 1.39%, due 3/15/29 | 1,990,000 | 1,799,552 |
| Flagship Credit Auto Trust (a) | |
| Series 2020-1, Class E | | |
| 3.52%, due 6/15/27 | 1,950,000 | 1,730,223 |
| Series 2019-2, Class E | | |
| 4.52%, due 12/15/26 | 1,910,000 | 1,765,747 |
| GLS Auto Receivables Issuer Trust (a) | |
| Series 2021-3A, Class C | | |
| 1.11%, due 9/15/26 | 2,700,000 | 2,509,928 |
| Series 2021-2A, Class D | | |
| 1.42%, due 4/15/27 | 1,010,000 | 906,914 |
| Series 2021-4A, Class C | | |
| 1.94%, due 10/15/27 | 1,310,000 | 1,211,352 |
| Hertz Vehicle Financing III LP (a) | |
| Series 2021-2A, Class B | | |
| 2.12%, due 12/27/27 | 860,000 | 722,511 |
| Series 2021-2A, Class D | | |
| 4.34%, due 12/27/27 | 2,910,000 | 2,329,016 |
| Hertz Vehicle Financing LLC (a) | |
| Series 2021-1A, Class B | | |
| 1.56%, due 12/26/25 | 870,000 | 791,615 |
| Series 2021-1A, Class C | | |
| 2.05%, due 12/26/25 | 890,000 | 797,006 |
| J.P. Morgan Chase Bank NA | |
| Series 2020-1, Class B | | |
| 0.991%, due 1/25/28 (a) | 154,364 | 151,442 |
| | | 18,344,068 |
| Other Asset-Backed Securities 7.3% |
| American Airlines Pass-Through Trust | |
| Series 2019-1, Class AA | | |
| 3.15%, due 2/15/32 | 1,166,979 | 954,907 |
| Series 2016-2, Class A | | |
| 3.65%, due 6/15/28 | 1,484,000 | 1,121,254 |
| | Principal
Amount | Value |
| |
| Other Asset-Backed Securities (continued) |
| American Airlines Pass-Through Trust (continued) | |
| Series 2019-1, Class B | | |
| 3.85%, due 2/15/28 | $ 971,463 | $ 788,196 |
| Series 2013-2, Class A | | |
| 4.95%, due 1/15/23 | 1,655,365 | 1,638,474 |
| AMSR Trust | |
| Series 2020-SFR4, Class A | | |
| 1.355%, due 11/17/37 (a) | 2,130,000 | 1,862,720 |
| British Airways Pass-Through Trust | |
| Series 2021-1, Class A | | |
| 2.90%, due 3/15/35 (a) | 1,851,417 | 1,475,067 |
| CF Hippolyta Issuer LLC (a) | |
| Series 2021-1A, Class A1 | | |
| 1.53%, due 3/15/61 | 2,011,946 | 1,724,759 |
| Series 2020-1, Class A1 | | |
| 1.69%, due 7/15/60 | 1,333,139 | 1,171,989 |
| Series 2021-1A, Class B1 | | |
| 1.98%, due 3/15/61 | 1,949,672 | 1,637,440 |
| CVS Pass-Through Trust | |
| 5.789%, due 1/10/26 (a) | 25,638 | 25,470 |
| DB Master Finance LLC (a) | |
| Series 2021-1A, Class A23 | | |
| 2.791%, due 11/20/51 | 2,262,900 | 1,679,970 |
| Series 2019-1A, Class A23 | | |
| 4.352%, due 5/20/49 | 311,370 | 274,097 |
| FirstKey Homes Trust (a) | |
| Series 2020-SFR2, Class A | | |
| 1.266%, due 10/19/37 | 634,117 | 554,930 |
| Series 2020-SFR1, Class A | | |
| 1.339%, due 8/17/37 | 947,427 | 835,464 |
| Series 2021-SFR1, Class B | | |
| 1.788%, due 8/17/38 | 3,205,000 | 2,677,770 |
| JetBlue Pass-Through Trust | |
| Series 2019-1, Class AA | | |
| 2.75%, due 5/15/32 | 2,319,138 | 1,841,744 |
| Navient Private Education Refi Loan Trust | |
| Series 2020-HA, Class B | | |
| 2.78%, due 1/15/69 (a) | 2,580,000 | 2,006,833 |
| New Economy Assets Phase 1 Sponsor LLC (a) | |
| Series 2021-1, Class A1 | | |
| 1.91%, due 10/20/61 | 2,500,000 | 2,094,658 |
| Series 2021-1, Class B1 | | |
| 2.41%, due 10/20/61 | 1,240,000 | 1,004,281 |
| PFS Financing Corp. | |
| Series 2022-D, Class A | | |
| 4.27%, due 8/15/27 (a) | 965,000 | 920,067 |
The notes to the financial statements are an integral part of, and should be read in conjunction with, the financial statements.
11
Portfolio of Investments October 31, 2022† (continued)
| | Principal
Amount | Value |
| Asset-Backed Securities (continued) |
| Other Asset-Backed Securities (continued) |
| Progress Residential | |
| Series 2021-SFR1, Class B | | |
| 1.303%, due 4/17/38 (a) | $ 800,000 | $ 672,205 |
| Progress Residential Trust | |
| Series 2021-SFR4, Class B | | |
| 1.808%, due 5/17/38 (a) | 1,215,000 | 1,034,496 |
| Taco Bell Funding LLC | |
| Series 2021-1A, Class A23 | | |
| 2.542%, due 8/25/51 (a) | 2,416,738 | 1,764,069 |
| United Airlines Pass-Through Trust | |
| Series 2020-1, Class A | | |
| 5.875%, due 10/15/27 | 1,575,234 | 1,519,908 |
| | | 31,280,768 |
Total Asset-Backed Securities
(Cost $57,752,312) | | 49,624,836 |
| Corporate Bonds 40.4% |
| Aerospace & Defense 0.3% |
| Boeing Co. (The) | | |
| 3.75%, due 2/1/50 | 770,000 | 492,674 |
| Howmet Aerospace, Inc. | | |
| 3.00%, due 1/15/29 | 890,000 | 740,818 |
| | | 1,233,492 |
| Agriculture 0.8% |
| Altria Group, Inc. | | |
| 2.45%, due 2/4/32 | 1,850,000 | 1,314,716 |
| 4.80%, due 2/14/29 | 285,000 | 262,365 |
| BAT Capital Corp. | | |
| 3.734%, due 9/25/40 | 1,800,000 | 1,133,243 |
| BAT International Finance plc | | |
| 4.448%, due 3/16/28 | 945,000 | 836,975 |
| | | 3,547,299 |
| Airlines 1.5% |
| American Airlines, Inc. (a) | | |
| 5.50%, due 4/20/26 | 1,445,000 | 1,376,105 |
| 5.75%, due 4/20/29 | 860,000 | 782,600 |
| Delta Air Lines, Inc. (a) | | |
| 4.50%, due 10/20/25 | 1,115,000 | 1,086,497 |
| 4.75%, due 10/20/28 | 1,855,000 | 1,725,681 |
| Mileage Plus Holdings LLC | | |
| 6.50%, due 6/20/27 (a) | 1,710,000 | 1,690,514 |
| | | 6,661,397 |
| | Principal
Amount | Value |
| |
| Auto Manufacturers 2.0% |
| Ford Motor Credit Co. LLC | | |
| 2.30%, due 2/10/25 | $ 1,450,000 | $ 1,311,525 |
| 4.125%, due 8/17/27 | 1,445,000 | 1,283,232 |
| General Motors Co. | | |
| 5.60%, due 10/15/32 | 410,000 | 372,105 |
| General Motors Financial Co., Inc. | | |
| 2.70%, due 6/10/31 | 1,600,000 | 1,190,553 |
| 4.30%, due 4/6/29 | 940,000 | 825,605 |
| Nissan Motor Acceptance Co. LLC (a) | | |
| 1.125%, due 9/16/24 | 1,015,000 | 906,255 |
| 1.85%, due 9/16/26 | 2,915,000 | 2,286,957 |
| Volkswagen Group of America Finance LLC | | |
| 4.60%, due 6/8/29 (a)(b) | 645,000 | 585,359 |
| | | 8,761,591 |
| Banks 14.8% |
| Banco Santander SA | | |
| 5.294%, due 8/18/27 | 1,400,000 | 1,291,080 |
| Bank of America Corp. | | |
| 2.087%, due 6/14/29 (c) | 1,110,000 | 898,220 |
| 2.496%, due 2/13/31 (c) | 1,755,000 | 1,378,848 |
| 2.687%, due 4/22/32 (c) | 305,000 | 235,720 |
| 3.419%, due 12/20/28 (c) | 283,000 | 249,821 |
| 3.593%, due 7/21/28 (c) | 1,385,000 | 1,243,820 |
| 3.705%, due 4/24/28 (c) | 1,275,000 | 1,153,428 |
| 4.25%, due 10/22/26 | 1,550,000 | 1,464,106 |
| Series MM | | |
| 4.30%, due 1/28/25 (c)(d) | 1,045,000 | 864,999 |
| Barclays plc (d)(e) | | |
| 4.375% (5 Year Treasury Constant Maturity Rate + 3.41%), due 3/15/28 | 2,405,000 | 1,596,221 |
| 8.00% (5 Year Treasury Constant Maturity Rate + 5.431%), due 3/15/29 | 625,000 | 559,909 |
| BNP Paribas SA (a)(d)(e) | | |
| 4.625% (5 Year Treasury Constant Maturity Rate + 3.34%), due 2/25/31 | 2,135,000 | 1,475,819 |
| 7.75% (5 Year Treasury Constant Maturity Rate + 4.899%), due 8/16/29 | 640,000 | 603,415 |
| Citigroup, Inc. | | |
| 2.52%, due 11/3/32 (c) | 915,000 | 684,552 |
| 3.887%, due 1/10/28 (c) | 2,099,000 | 1,921,573 |
The notes to the financial statements are an integral part of, and should be read in conjunction with, the financial statements.
| 12 | MainStay MacKay Total Return Bond Fund |
| | Principal
Amount | Value |
| Corporate Bonds (continued) |
| Banks (continued) |
| Citigroup, Inc. (continued) | | |
| Series Y | | |
| 4.15% (5 Year Treasury Constant Maturity Rate + 3.00%), due 11/15/26 (b)(d)(e) | $ 870,000 | $ 679,553 |
| 5.30%, due 5/6/44 | 1,474,000 | 1,242,132 |
| Citizens Bank NA | | |
| 6.064%, due 10/24/25 (c) | 860,000 | 866,125 |
| Credit Agricole SA | | |
| 4.75% (5 Year Treasury Constant Maturity Rate + 3.237%), due 3/23/29 (a)(d)(e) | 2,030,000 | 1,457,701 |
| Credit Suisse Group AG | | |
| 3.091%, due 5/14/32 (a)(c) | 2,070,000 | 1,419,790 |
| Deutsche Bank AG | | |
| 3.035%, due 5/28/32 (c) | 890,000 | 626,002 |
| 4.276% (SOFR + 1.219%), due 11/16/27 (e) | 1,515,000 | 1,303,036 |
| First Horizon Bank | | |
| 5.75%, due 5/1/30 | 1,606,000 | 1,532,036 |
| First Horizon Corp. | | |
| 4.00%, due 5/26/25 | 2,320,000 | 2,221,539 |
| Goldman Sachs Group, Inc. (The) | | |
| 1.948%, due 10/21/27 (c) | 1,305,000 | 1,108,768 |
| 1.992%, due 1/27/32 (c) | 1,460,000 | 1,065,320 |
| 2.615%, due 4/22/32 (c) | 1,010,000 | 770,391 |
| 6.75%, due 10/1/37 | 1,385,000 | 1,369,342 |
| HSBC Holdings plc (c) | | |
| 3.973%, due 5/22/30 | 1,265,000 | 1,042,742 |
| 7.336%, due 11/3/26 | 715,000 | 716,979 |
| JPMorgan Chase & Co. | | |
| 2.182%, due 6/1/28 (c) | 1,030,000 | 871,291 |
| 3.782%, due 2/1/28 (c) | 1,565,000 | 1,429,698 |
| 4.005%, due 4/23/29 (c) | 2,405,000 | 2,167,760 |
| 4.246% (SOFR + 1.18%), due 2/24/28 (e) | 1,590,000 | 1,539,613 |
| Series HH | | |
| 4.60%, due 2/1/25 (c)(d) | 857,000 | 764,787 |
| Lloyds Banking Group plc | | |
| 4.582%, due 12/10/25 | 2,643,000 | 2,422,472 |
| 4.976% (1 Year Treasury Constant Maturity Rate + 2.30%), due 8/11/33 (e) | 680,000 | 581,801 |
| Macquarie Group Ltd. | | |
| 2.871%, due 1/14/33 (a)(c) | 1,770,000 | 1,305,981 |
| | Principal
Amount | Value |
| |
| Banks (continued) |
| Mizuho Financial Group, Inc. | | |
| 3.261% (1 Year Treasury Constant Maturity Rate + 1.25%), due 5/22/30 (e) | $ 1,030,000 | $ 856,588 |
| Morgan Stanley | | |
| 2.484%, due 9/16/36 (c) | 2,195,000 | 1,554,022 |
| 2.511%, due 10/20/32 (c) | 510,000 | 383,973 |
| 3.591%, due 7/22/28 (c) | 1,255,000 | 1,124,825 |
| 5.00%, due 11/24/25 | 1,940,000 | 1,935,490 |
| NatWest Group plc | | |
| 3.073% (1 Year Treasury Constant Maturity Rate + 2.55%), due 5/22/28 (e) | 1,985,000 | 1,685,357 |
| Societe Generale SA (a)(e) | | |
| 3.337% (1 Year Treasury Constant Maturity Rate + 1.60%), due 1/21/33 | 1,440,000 | 1,055,603 |
| 4.75% (5 Year Treasury Constant Maturity Rate + 3.931%), due 5/26/26 (d) | 1,585,000 | 1,218,072 |
| 5.375% (5 Year Treasury Constant Maturity Rate + 4.514%), due 11/18/30 (d) | 1,515,000 | 1,097,393 |
| SVB Financial Group | | |
| Series C | | |
| 4.00% (5 Year Treasury Constant Maturity Rate + 3.202%), due 5/15/26 (d)(e) | 1,285,000 | 899,238 |
| UBS Group AG (a)(e) | | |
| 4.375% (5 Year Treasury Constant Maturity Rate + 3.313%), due 2/10/31 (d) | 1,520,000 | 1,055,868 |
| 4.751% (1 Year Treasury Constant Maturity Rate + 1.75%), due 5/12/28 | 770,000 | 705,619 |
| Wachovia Corp. | | |
| 5.50%, due 8/1/35 | 735,000 | 668,756 |
| Wells Fargo & Co. (c) | | |
| 2.879%, due 10/30/30 | 1,455,000 | 1,193,774 |
| 3.526%, due 3/24/28 | 1,430,000 | 1,287,649 |
| 4.897%, due 7/25/33 | 700,000 | 640,462 |
| Wells Fargo Bank NA | | |
| 5.85%, due 2/1/37 | 335,000 | 318,317 |
| Westpac Banking Corp. | | |
| 3.02% (5 Year Treasury Constant Maturity Rate + 1.53%), due 11/18/36 (e) | 2,538,000 | 1,795,524 |
| | | 63,602,920 |
The notes to the financial statements are an integral part of, and should be read in conjunction with, the financial statements.
13
Portfolio of Investments October 31, 2022† (continued)
| | Principal
Amount | Value |
| Corporate Bonds (continued) |
| Building Materials 0.1% |
| Cemex SAB de CV | | |
| 7.375%, due 6/5/27 (a) | $ 650,000 | $ 643,500 |
| Chemicals 0.6% |
| Braskem Netherlands Finance BV | | |
| 4.50%, due 1/10/28 (a) | 1,135,000 | 985,475 |
| Huntsman International LLC | | |
| 4.50%, due 5/1/29 | 1,964,000 | 1,710,625 |
| | | 2,696,100 |
| Commercial Services 0.4% |
| Ashtead Capital, Inc. | | |
| 4.00%, due 5/1/28 (a) | 865,000 | 759,505 |
| California Institute of Technology | | |
| 3.65%, due 9/1/19 | 772,000 | 457,248 |
| Carriage Services, Inc. | | |
| 4.25%, due 5/15/29 (a) | 515,000 | 396,334 |
| | | 1,613,087 |
| Computers 1.1% |
| Dell International LLC | | |
| 3.375%, due 12/15/41 (a) | 1,450,000 | 899,897 |
| 4.90%, due 10/1/26 | 1,912,000 | 1,835,198 |
| 5.30%, due 10/1/29 | 765,000 | 716,181 |
| 8.10%, due 7/15/36 | 570,000 | 603,834 |
| NCR Corp. (a) | | |
| 5.00%, due 10/1/28 | 603,000 | 506,701 |
| 6.125%, due 9/1/29 | 380,000 | 362,173 |
| | | 4,923,984 |
| Diversified Financial Services 3.1% |
| AerCap Ireland Capital DAC | | |
| 2.45%, due 10/29/26 | 2,300,000 | 1,942,225 |
| Aircastle Ltd. | | |
| 5.25% (5 Year Treasury Constant Maturity Rate + 4.41%), due 6/15/26 (a)(d)(e) | 2,665,000 | 1,993,017 |
| Ally Financial, Inc. | | |
| Series C | | |
| 4.70% (7 Year Treasury Constant Maturity Rate + 3.481%), due 5/15/28 (d)(e) | 1,005,000 | 675,862 |
| 8.00%, due 11/1/31 | 1,205,000 | 1,235,861 |
| Aviation Capital Group LLC | | |
| 1.95%, due 1/30/26 (a) | 1,330,000 | 1,110,911 |
| Avolon Holdings Funding Ltd. (a) | | |
| 2.125%, due 2/21/26 | 1,385,000 | 1,135,537 |
| | Principal
Amount | Value |
| |
| Diversified Financial Services (continued) |
Avolon Holdings Funding Ltd. (a)
(continued) | | |
| 3.25%, due 2/15/27 | $ 1,740,000 | $ 1,421,527 |
| Banco BTG Pactual SA | | |
| 2.75%, due 1/11/26 (a) | 1,150,000 | 1,006,250 |
| Capital One Financial Corp. | | |
| 5.247%, due 7/26/30 (c) | 685,000 | 627,621 |
| Nomura Holdings, Inc. | | |
| 5.099%, due 7/3/25 | 1,415,000 | 1,385,207 |
| OneMain Finance Corp. | | |
| 3.50%, due 1/15/27 | 1,145,000 | 938,458 |
| | | 13,472,476 |
| Electric 3.1% |
| AEP Texas, Inc. | | |
| 4.70%, due 5/15/32 | 915,000 | 832,899 |
| Alabama Power Co. | | |
| 3.00%, due 3/15/52 | 1,325,000 | 834,314 |
| Arizona Public Service Co. | | |
| 2.20%, due 12/15/31 | 1,765,000 | 1,301,462 |
| 3.35%, due 5/15/50 | 1,625,000 | 1,007,695 |
| Calpine Corp. | | |
| 5.125%, due 3/15/28 (a) | 1,125,000 | 997,441 |
| Duquesne Light Holdings, Inc. | | |
| 3.616%, due 8/1/27 (a) | 990,000 | 873,806 |
| Edison International | | |
| Series B | | |
| 5.00% (5 Year Treasury Constant Maturity Rate + 3.901%), due 12/15/26 (d)(e) | 2,440,000 | 1,976,400 |
| National Rural Utilities Cooperative Finance Corp. | | |
| 5.80%, due 1/15/33 | 830,000 | 840,018 |
| Nevada Power Co. | | |
| Series GG | | |
| 5.90%, due 5/1/53 | 415,000 | 409,674 |
| NSTAR Electric Co. | | |
| 4.95%, due 9/15/52 | 450,000 | 402,639 |
| Ohio Power Co. | | |
| Series R | | |
| 2.90%, due 10/1/51 | 900,000 | 537,342 |
| Pacific Gas and Electric Co. | | |
| 3.50%, due 8/1/50 | 2,235,000 | 1,363,319 |
| Southern California Edison Co. | | |
| 4.00%, due 4/1/47 | 1,235,000 | 881,045 |
| Southwestern Electric Power Co. | | |
| 3.25%, due 11/1/51 | 1,060,000 | 654,628 |
The notes to the financial statements are an integral part of, and should be read in conjunction with, the financial statements.
| 14 | MainStay MacKay Total Return Bond Fund |
| | Principal
Amount | Value |
| Corporate Bonds (continued) |
| Electric (continued) |
| Wisconsin Electric Power Co. | | |
| 4.75%, due 9/30/32 | $ 495,000 | $ 470,741 |
| | | 13,383,423 |
| Entertainment 0.2% |
| Warnermedia Holdings, Inc. | | |
| 4.279%, due 3/15/32 (a) | 1,045,000 | 844,097 |
| Environmental Control 0.2% |
| Waste Connections, Inc. | | |
| 2.20%, due 1/15/32 (b) | 985,000 | 757,836 |
| Food 1.0% |
| JBS USA LUX SA | | |
| 5.75%, due 4/1/33 (a) | 1,095,000 | 986,748 |
| Kraft Heinz Foods Co. | | |
| 5.00%, due 7/15/35 | 731,000 | 671,137 |
| MARB BondCo plc | | |
| 3.95%, due 1/29/31 (a) | 1,520,000 | 1,125,849 |
| Smithfield Foods, Inc. (a) | | |
| 4.25%, due 2/1/27 | 1,190,000 | 1,075,885 |
| 5.20%, due 4/1/29 | 580,000 | 534,822 |
| | | 4,394,441 |
| Gas 0.5% |
| National Fuel Gas Co. | | |
| 2.95%, due 3/1/31 | 1,820,000 | 1,364,678 |
| Piedmont Natural Gas Co., Inc. | | |
| 5.05%, due 5/15/52 | 835,000 | 700,576 |
| | | 2,065,254 |
| Home Builders 0.4% |
| Lennar Corp. | | |
| 4.75%, due 11/29/27 | 331,000 | 306,099 |
| Thor Industries, Inc. | | |
| 4.00%, due 10/15/29 (a) | 375,000 | 303,292 |
| Toll Brothers Finance Corp. | | |
| 3.80%, due 11/1/29 | 1,343,000 | 1,090,490 |
| | | 1,699,881 |
| Insurance 1.0% |
| Athene Global Funding | | |
| 2.50%, due 3/24/28 (a) | 1,605,000 | 1,319,929 |
| Liberty Mutual Group, Inc. | | |
| 3.951%, due 10/15/50 (a) | 2,210,000 | 1,421,229 |
| | Principal
Amount | Value |
| |
| Insurance (continued) |
| Nippon Life Insurance Co. | | |
| 3.40% (5 Year Treasury Constant Maturity Rate + 2.612%), due 1/23/50 (a)(e) | $ 540,000 | $ 429,405 |
| Willis North America, Inc. | | |
| 2.95%, due 9/15/29 | 1,165,000 | 942,606 |
| | | 4,113,169 |
| Internet 0.2% |
| Expedia Group, Inc. | | |
| 3.25%, due 2/15/30 | 1,040,000 | 838,154 |
| Lodging 0.2% |
| Las Vegas Sands Corp. | | |
| 3.20%, due 8/8/24 | 1,070,000 | 1,018,834 |
| Media 0.2% |
| DISH DBS Corp. | | |
| 5.75%, due 12/1/28 (a) | 885,000 | 713,531 |
| Grupo Televisa SAB | | |
| 5.25%, due 5/24/49 | 370,000 | 304,584 |
| | | 1,018,115 |
| Miscellaneous—Manufacturing 0.3% |
| Textron Financial Corp. | | |
| 4.64% (3 Month LIBOR + 1.735%), due 2/15/42 (a)(e) | 1,685,000 | 1,157,530 |
| Oil & Gas 1.0% |
| Gazprom PJSC Via Gaz Capital SA | | |
| 4.95%, due 2/6/28 (a)(f) | 1,521,000 | 806,130 |
| Marathon Petroleum Corp. | | |
| 6.50%, due 3/1/41 | 1,605,000 | 1,563,062 |
| Southwestern Energy Co. | | |
| 4.75%, due 2/1/32 | 437,000 | 377,218 |
| Valero Energy Corp. | | |
| 6.625%, due 6/15/37 | 1,620,000 | 1,622,524 |
| | | 4,368,934 |
| Packaging & Containers 0.3% |
| Berry Global, Inc. | | |
| 4.875%, due 7/15/26 (a) | 2,000 | 1,879 |
| Owens-Brockway Glass Container, Inc. | | |
| 6.625%, due 5/13/27 (a) | 1,201,000 | 1,146,936 |
| | | 1,148,815 |
The notes to the financial statements are an integral part of, and should be read in conjunction with, the financial statements.
15
Portfolio of Investments October 31, 2022† (continued)
| | Principal
Amount | Value |
| Corporate Bonds (continued) |
| Pharmaceuticals 0.5% |
| Teva Pharmaceutical Finance Netherlands III BV | | |
| 3.15%, due 10/1/26 | $ 2,533,000 | $ 2,140,385 |
| Pipelines 2.7% |
| Cheniere Corpus Christi Holdings LLC | | |
| 2.742%, due 12/31/39 | 1,385,000 | 1,027,714 |
| DT Midstream, Inc. | | |
| 4.30%, due 4/15/32 (a) | 1,125,000 | 966,420 |
| Energy Transfer LP | | |
| 4.95%, due 6/15/28 | 582,000 | 542,095 |
| 5.35%, due 5/15/45 | 940,000 | 738,812 |
| Enterprise Products Operating LLC | | |
| 3.95%, due 1/31/60 | 760,000 | 504,744 |
| 4.20%, due 1/31/50 | 380,000 | 279,268 |
| Flex Intermediate Holdco LLC | | |
| 3.363%, due 6/30/31 (a) | 2,120,000 | 1,634,750 |
| Hess Midstream Operations LP (a) | | |
| 4.25%, due 2/15/30 | 565,000 | 483,160 |
| 5.50%, due 10/15/30 | 440,000 | 396,968 |
| 5.625%, due 2/15/26 | 726,000 | 712,039 |
| Holly Energy Partners LP | | |
| 6.375%, due 4/15/27 (a) | 640,000 | 615,978 |
| Sabine Pass Liquefaction LLC | | |
| 5.875%, due 6/30/26 | 1,160,000 | 1,153,824 |
| Targa Resources Corp. | | |
| 4.20%, due 2/1/33 | 640,000 | 534,278 |
| Western Midstream Operating LP | | |
| 5.50%, due 2/1/50 (g) | 1,240,000 | 965,316 |
| Williams Cos., Inc. (The) | | |
| 3.50%, due 10/15/51 | 1,400,000 | 896,249 |
| | | 11,451,615 |
| Real Estate 0.2% |
| Realogy Group LLC | | |
| 5.25%, due 4/15/30 (a)(b) | 1,145,000 | 793,966 |
| Real Estate Investment Trusts 1.1% |
| Alexandria Real Estate Equities, Inc. | | |
| 3.375%, due 8/15/31 | 1,255,000 | 1,034,051 |
| Invitation Homes Operating Partnership LP | | |
| 2.00%, due 8/15/31 | 1,490,000 | 1,045,949 |
| Iron Mountain, Inc. (a) | | |
| 4.875%, due 9/15/29 | 185,000 | 159,054 |
| 5.25%, due 7/15/30 (b) | 1,240,000 | 1,069,888 |
| | Principal
Amount | Value |
| |
| Real Estate Investment Trusts (continued) |
| Office Properties Income Trust | | |
| 2.40%, due 2/1/27 | $ 2,025,000 | $ 1,391,522 |
| | | 4,700,464 |
| Retail 1.2% |
| AutoNation, Inc. | | |
| 4.75%, due 6/1/30 | 1,720,000 | 1,480,985 |
| Nordstrom, Inc. | | |
| 4.00%, due 3/15/27 | 368,000 | 311,999 |
| 4.25%, due 8/1/31 | 1,365,000 | 990,990 |
| QVC, Inc. | | |
| 4.375%, due 9/1/28 | 1,730,000 | 1,254,250 |
| Victoria's Secret & Co. | | |
| 4.625%, due 7/15/29 (a) | 1,415,000 | 1,125,632 |
| | | 5,163,856 |
| Software 0.3% |
| Fidelity National Information Services, Inc. | | |
| 5.10%, due 7/15/32 (b) | 505,000 | 475,339 |
| MSCI, Inc. | | |
| 3.25%, due 8/15/33 (a)(b) | 805,000 | 622,304 |
| Oracle Corp. | | |
| 3.65%, due 3/25/41 | 595,000 | 402,934 |
| | | 1,500,577 |
| Telecommunications 1.1% |
| Altice France SA | | |
| 5.125%, due 7/15/29 (a) | 1,340,000 | 1,009,255 |
| AT&T, Inc. | | |
| 3.85%, due 6/1/60 | 1,262,000 | 832,514 |
| Sprint Spectrum Co. LLC | | |
| 4.738%, due 3/20/25 (a) | 2,346,881 | 2,313,759 |
| T-Mobile US, Inc. | | |
| 2.625%, due 2/15/29 | 450,000 | 371,985 |
| | | 4,527,513 |
Total Corporate Bonds
(Cost $212,825,585) | | 174,242,705 |
| Foreign Government Bonds 2.5% |
| Brazil 0.2% |
| Brazil Government Bond | | |
| 3.75%, due 9/12/31 | 765,000 | 628,569 |
| Chile 0.6% |
| Chile Government Bond | | |
| 2.55%, due 7/27/33 (b) | 1,135,000 | 843,961 |
The notes to the financial statements are an integral part of, and should be read in conjunction with, the financial statements.
| 16 | MainStay MacKay Total Return Bond Fund |
| | Principal
Amount | Value |
| Foreign Government Bonds (continued) |
| Chile (continued) |
| Empresa Nacional del Petroleo | | |
| 3.45%, due 9/16/31 (a) | $ 2,115,000 | $ 1,643,905 |
| | | 2,487,866 |
| Colombia 0.2% |
| Colombia Government Bond | | |
| 3.25%, due 4/22/32 | 1,485,000 | 985,522 |
| Mexico 1.5% |
| Comision Federal de Electricidad | | |
| 3.875%, due 7/26/33 (a) | 2,725,000 | 1,941,562 |
| Mexico Government Bond | | |
| 3.75%, due 4/19/71 | 2,130,000 | 1,231,787 |
| Petroleos Mexicanos | | |
| 6.50%, due 3/13/27 | 2,730,000 | 2,393,939 |
| 6.75%, due 9/21/47 | 1,635,000 | 984,729 |
| | | 6,552,017 |
Total Foreign Government Bonds
(Cost $14,767,925) | | 10,653,974 |
| Loan Assignments 0.2% |
| Diversified/Conglomerate Service 0.2% |
| TruGreen LP | |
| First Lien Second Refinancing Term Loan | |
| 7.754% (1 Month LIBOR + 4.00%), due 11/2/27 (e) | 602,434 | 555,746 |
Total Loan Assignments
(Cost $598,094) | | 555,746 |
| Mortgage-Backed Securities 25.0% |
| Agency (Collateralized Mortgage Obligations) 7.3% |
| FHLMC | |
| REMIC, Series 5200, Class SA | | |
| 0.503% (SOFR 30A + 3.50%), due 2/25/52 (e)(h) | 2,074,248 | 59,650 |
| REMIC, Series 5021, Class SA | | |
| 0.553% (SOFR 30A + 3.55%), due 10/25/50 (e)(h) | 2,443,279 | 83,504 |
| REMIC, Series 5038, Class KA | | |
| 1.50%, due 11/25/50 | 571,119 | 431,173 |
| REMIC, Series 4913, Class UA | | |
| 3.00%, due 3/15/49 | 1,344,741 | 1,199,631 |
| REMIC, Series 5070, Class PI | | |
| 3.00%, due 8/25/50 (h) | 1,351,537 | 223,517 |
| | Principal
Amount | Value |
| |
| Agency (Collateralized Mortgage Obligations) (continued) |
| FHLMC (continued) | |
| REMIC, Series 5011, Class MI | | |
| 3.00%, due 9/25/50 (h) | $ 1,497,437 | $ 242,616 |
| REMIC, Series 5094, Class IP | | |
| 3.00%, due 4/25/51 (h) | 1,148,219 | 176,804 |
| REMIC, Series 5160 | | |
| 3.00%, due 10/25/51 (h) | 1,396,700 | 172,334 |
| FHLMC, Strips | |
| Series 311 | | |
| (zero coupon), due 8/15/43 | 552,125 | 400,099 |
| Series 311, Class S1 | | |
| 2.538% (1 Month LIBOR + 5.95%), due 8/15/43 (e)(h) | 1,616,614 | 141,812 |
| Series 358 | | |
| 3.50%, due 10/15/47 (h) | 273,794 | 45,695 |
| FNMA | |
| REMIC, Series 2022-3, Class YS | | |
| (zero coupon) (SOFR 30A + 2.55%), due 2/25/52 (e)(h) | 8,659,035 | 123,971 |
| REMIC, Series 2022-5, Class SN | | |
| (zero coupon) (SOFR 30A + 1.80%), due 2/25/52 (e)(h) | 1,026,988 | 4,231 |
| REMIC, Series 2020-49, Class PB | | |
| 1.75%, due 7/25/50 | 435,331 | 338,649 |
| REMIC, Series 2021-40, Class SI | | |
| 2.364% (1 Month LIBOR + 5.95%), due 9/25/47 (e)(h) | 2,022,854 | 177,193 |
| REMIC, Series 2016-57, Class SN | | |
| 2.464% (1 Month LIBOR + 6.05%), due 6/25/46 (e)(h) | 1,663,041 | 155,829 |
| REMIC, Series 2021-34, Class MI | | |
| 2.50%, due 3/25/51 (h) | 6,645,882 | 870,071 |
| REMIC, Series 2021-12, Class JI | | |
| 2.50%, due 3/25/51 (h) | 1,070,654 | 163,014 |
| REMIC, Series 2021-10, Class LI | | |
| 2.50%, due 3/25/51 (h) | 719,652 | 110,077 |
| REMIC, Series 2021-54, Class HI | | |
| 2.50%, due 6/25/51 (h) | 499,201 | 62,266 |
| REMIC, Series 2013-77, Class CY | | |
| 3.00%, due 7/25/43 | 2,145,260 | 1,907,921 |
| REMIC, Series 2021-53, Class GI | | |
| 3.00%, due 7/25/48 (h) | 8,003,263 | 1,296,461 |
| REMIC, Series 2019-13, Class PE | | |
| 3.00%, due 3/25/49 | 1,275,520 | 1,132,283 |
| REMIC, Series 2021-85, Class BI | | |
| 3.00%, due 12/25/51 (h) | 3,074,750 | 479,505 |
| REMIC, Series 2021-12, Class GC | | |
| 3.50%, due 7/25/50 | 1,647,287 | 1,501,409 |
The notes to the financial statements are an integral part of, and should be read in conjunction with, the financial statements.
17
Portfolio of Investments October 31, 2022† (continued)
| | Principal
Amount | Value |
| Mortgage-Backed Securities (continued) |
| Agency (Collateralized Mortgage Obligations) (continued) |
| FNMA (continued) | |
| REMIC, Series 2021-8, Class ID | | |
| 3.50%, due 3/25/51 (h) | $ 1,914,591 | $ 384,630 |
| GNMA | |
| Series 2019-136, Class YS | | |
| (zero coupon) (1 Month LIBOR + 2.83%), due 11/20/49 (e)(h) | 2,279,225 | 6,001 |
| Series 2020-5, Class AS | | |
| (zero coupon) (1 Month LIBOR + 2.82%), due 1/20/50 (e)(h) | 1,188,302 | 5,696 |
| Series 2021-77, Class SN | | |
| (zero coupon) (1 Month LIBOR + 2.60%), due 5/20/51 (e)(h) | 5,990,249 | 26,404 |
| Series 2021-122, Class SA | | |
| (zero coupon) (SOFR 30A + 2.60%), due 7/20/51 (e)(h) | 2,811,108 | 24,098 |
| Series 2021-213, Class ES | | |
| (zero coupon) (SOFR 30A + 1.70%), due 12/20/51 (e)(h) | 14,073,094 | 39,554 |
| Series 2022-19, Class SG | | |
| (zero coupon) (SOFR 30A + 2.45%), due 1/20/52 (e)(h) | 4,775,202 | 47,187 |
| Series 2022-24, Class SC | | |
| (zero coupon) (SOFR 30A + 2.37%), due 2/20/52 (e)(h) | 24,442,513 | 236,217 |
| Series 2022-6, Class AS | | |
| 0.22% (SOFR 30A + 3.14%), due 1/20/52 (e)(h) | 564,121 | 8,165 |
| Series 2021-158, Class SB | | |
| 0.78% (SOFR 30A + 3.70%), due 9/20/51 (e)(h) | 2,933,312 | 124,691 |
| Series 2020-115, Class YA | | |
| 1.00%, due 8/20/50 | 1,419,610 | 1,072,192 |
| Series 2020-129, Class AG | | |
| 1.00%, due 9/20/50 | 1,983,911 | 1,477,143 |
| Series 2020-166, Class CA | | |
| 1.00%, due 11/20/50 | 1,006,847 | 754,533 |
| Series 2022-34, Class HS | | |
| 1.18% (SOFR 30A + 4.10%), due 2/20/52 (e)(h) | 4,641,819 | 165,089 |
| Series 2021-41, Class FS | | |
| 2.00% (SOFR 30A + 0.20%), due 10/20/50 (e)(h) | 2,885,362 | 331,962 |
| Series 2020-166, Class IC | | |
| 2.00%, due 11/20/50 (h) | 1,328,425 | 140,796 |
| Series 2021-97, Class IN | | |
| 2.50%, due 8/20/49 (h) | 3,479,970 | 378,835 |
| | Principal
Amount | Value |
| |
| Agency (Collateralized Mortgage Obligations) (continued) |
| GNMA (continued) | |
| Series 2022-1, Class IA | | |
| 2.50%, due 6/20/50 (h) | $ 490,635 | $ 69,446 |
| Series 2021-1, Class PI | | |
| 2.50%, due 12/20/50 (h) | 608,906 | 80,078 |
| Series 2021-25, Class LI | | |
| 2.50%, due 2/20/51 (h) | 8,410,063 | 1,043,833 |
| Series 2021-83, Class FM | | |
| 2.50% (SOFR 30A + 0.51%), due 5/20/51 (e) | 2,426,242 | 2,028,968 |
| Series 2022-83 | | |
| 2.50%, due 11/20/51 (h) | 1,169,901 | 155,012 |
| Series 2021-44, Class IQ | | |
| 3.00%, due 3/20/51 (h) | 3,155,111 | 461,203 |
| Series 2021-98, Class KI | | |
| 3.00%, due 6/20/51 (h) | 6,457,750 | 983,639 |
| Series 2021-97, Class FA | | |
| 3.00% (SOFR 30A + 0.40%), due 6/20/51 (e) | 647,305 | 568,144 |
| Series 2021-122, Class FA | | |
| 3.00% (SOFR 30A + 0.40%), due 7/20/51 (e) | 1,488,799 | 1,252,932 |
| Series 2021-136, Class TI | | |
| 3.00%, due 8/20/51 (h) | 1,387,690 | 204,186 |
| Series 2021-139, Class IA | | |
| 3.00%, due 8/20/51 (h) | 8,137,153 | 1,337,587 |
| Series 2022-10, Class NF | | |
| 3.00% (SOFR 30A + 0.50%), due 1/20/52 (e) | 692,542 | 603,496 |
| Series 2021-125, Class AF | | |
| 3.17% (SOFR 30A + 0.25%), due 7/20/51 (e) | 1,462,748 | 1,294,863 |
| Series 2021-96, Class FG | | |
| 3.22% (SOFR 30A + 0.30%), due 6/20/51 (e) | 1,523,338 | 1,343,693 |
| Series 2022-6, Class CF | | |
| 3.28% (SOFR 30A + 0.36%), due 1/20/52 (e) | 564,121 | 503,518 |
| Series 2019-136, Class YF | | |
| 3.50% (1 Month LIBOR + 0.67%), due 11/20/49 (e) | 1,102,207 | 963,631 |
| Series 2019-145, Class LF | | |
| 3.50% (1 Month LIBOR + 0.67%), due 11/20/49 (e) | 1,318,429 | 1,147,105 |
| Series 2020-5, Class AF | | |
| 3.50% (1 Month LIBOR + 0.68%), due 1/20/50 (e) | 591,533 | 512,765 |
| | | 31,277,007 |
The notes to the financial statements are an integral part of, and should be read in conjunction with, the financial statements.
| 18 | MainStay MacKay Total Return Bond Fund |
| | Principal
Amount | Value |
| Mortgage-Backed Securities (continued) |
| Commercial Mortgage Loans (Collateralized Mortgage Obligations) 10.0% |
| BAMLL Commercial Mortgage Securities Trust (a)(e) | |
| Series 2022-DKLX, Class D | | |
| 6.376% (1 Month SOFR + 3.00%), due 1/15/39 | $ 400,000 | $ 373,366 |
| Series 2022-DKLX, Class F | | |
| 8.333% (1 Month SOFR + 4.957%), due 1/15/39 | 800,000 | 735,911 |
| Bayview Commercial Asset Trust | |
| Series 2006-4A, Class A1 | | |
| 3.931% (1 Month LIBOR + 0.345%), due 12/25/36 (a)(e) | 23,988 | 21,929 |
| BX Commercial Mortgage Trust (a) | |
| Series 2020-VIVA, Class D | | |
| 3.549%, due 3/11/44 (i) | 1,975,000 | 1,428,336 |
| Series 2021-VOLT, Class C | | |
| 4.512% (1 Month LIBOR + 1.10%), due 9/15/36 (e) | 1,485,000 | 1,369,795 |
| Series 2021-ACNT, Class D | | |
| 5.263% (1 Month LIBOR + 1.85%), due 11/15/38 (e) | 2,285,000 | 2,146,810 |
| Series 2021-VOLT, Class E | | |
| 5.412% (1 Month LIBOR + 2.00%), due 9/15/36 (e) | 2,400,000 | 2,206,322 |
| BX Trust (a) | |
| Series 2019-OC11, Class C | | |
| 3.856%, due 12/9/41 | 2,209,000 | 1,745,415 |
| Series 2019-OC11, Class E | | |
| 3.944%, due 12/9/41 (i) | 2,394,000 | 1,771,755 |
| Series 2021-MFM1, Class A | | |
| 4.112% (1 Month LIBOR + 0.70%), due 1/15/34 (e) | 370,000 | 354,333 |
| Series 2022-PSB, Class C | | |
| 7.073% (1 Month SOFR + 3.697%), due 8/15/39 (e) | 550,000 | 547,948 |
| Series 2022-PSB, Class D | | |
| 8.069% (1 Month SOFR + 4.693%), due 8/15/39 (e) | 465,000 | 462,820 |
| BXHPP Trust | |
| Series 2021-FILM, Class B | | |
| 4.312% (1 Month LIBOR + 0.90%), due 8/15/36 (a)(e) | 500,000 | 463,141 |
| Commercial Mortgage Trust | |
| Series 2013-CR8, Class A4 | | |
| 3.334%, due 6/10/46 | 46,238 | 45,880 |
| Series 2013-CR9, Class B | | |
| 4.29%, due 7/10/45 (a)(i) | 2,380,000 | 2,289,396 |
| | Principal
Amount | Value |
| |
| Commercial Mortgage Loans (Collateralized Mortgage Obligations) (continued) |
| CSMC WEST Trust | |
| Series 2020-WEST, Class A | | |
| 3.04%, due 2/15/35 (a) | $ 2,060,000 | $ 1,604,132 |
| Extended Stay America Trust (a)(e) | |
| Series 2021-ESH, Class B | | |
| 4.793% (1 Month LIBOR + 1.38%), due 7/15/38 | 117,143 | 111,130 |
| Series 2021-ESH, Class C | | |
| 5.113% (1 Month LIBOR + 1.70%), due 7/15/38 | 2,215,956 | 2,096,658 |
| FREMF Mortgage Trust (a)(i) | |
| Series 2019-K99, Class B | | |
| 3.645%, due 10/25/52 | 215,000 | 185,568 |
| Series 2017-K69, Class B | | |
| 3.727%, due 10/25/49 | 370,000 | 333,841 |
| Series 2019-K98, Class C | | |
| 3.738%, due 10/25/52 | 1,200,000 | 1,025,248 |
| Series 2015-K42, Class B | | |
| 3.848%, due 1/25/48 | 400,000 | 383,315 |
| Series 2017-K63, Class C | | |
| 3.877%, due 2/25/50 | 1,725,000 | 1,560,907 |
| Series 2019-K94, Class C | | |
| 3.966%, due 7/25/52 | 970,000 | 832,954 |
| Series 2019-K94, Class B | | |
| 3.966%, due 7/25/52 | 1,560,000 | 1,374,443 |
| Series 2018-K77, Class C | | |
| 4.161%, due 5/25/51 | 1,375,000 | 1,234,898 |
| Series 2018-K76, Class C | | |
| 4.208%, due 6/25/51 | 2,508,000 | 2,260,212 |
| Series 2018-K76, Class B | | |
| 4.208%, due 6/25/51 | 630,000 | 577,243 |
| Series 2018-K86, Class C | | |
| 4.294%, due 11/25/51 | 1,105,000 | 985,154 |
| J.P. Morgan Chase Commercial Mortgage Securities Trust (a) | |
| Series 2021-2NU, Class A | | |
| 1.974%, due 1/5/40 | 1,400,000 | 1,119,102 |
| Series 2021-410T, Class A | | |
| 2.287%, due 3/5/42 | 2,085,000 | 1,675,433 |
| Multifamily Connecticut Avenue Securities Trust | |
| Series 2019-01, Class M10 | | |
| 6.836% (1 Month LIBOR + 3.25%), due 10/25/49 (a)(e) | 1,751,710 | 1,613,710 |
| One Bryant Park Trust | |
| Series 2019-OBP, Class A | | |
| 2.516%, due 9/15/54 (a) | 1,165,000 | 927,954 |
The notes to the financial statements are an integral part of, and should be read in conjunction with, the financial statements.
19
Portfolio of Investments October 31, 2022† (continued)
| | Principal
Amount | Value |
| Mortgage-Backed Securities (continued) |
| Commercial Mortgage Loans (Collateralized Mortgage Obligations) (continued) |
| SLG Office Trust | |
| Series 2021-OVA, Class A | | |
| 2.585%, due 7/15/41 (a) | $ 925,000 | $ 719,364 |
| SMRT | |
| Series 2022-MINI, Class D | | |
| 5.326% (1 Month SOFR + 1.95%), due 1/15/39 (a)(e) | 1,050,000 | 976,638 |
| UBS-Barclays Commercial Mortgage Trust | |
| Series 2013-C6, Class B | | |
| 3.875%, due 4/10/46 (a)(j) | 2,730,000 | 2,641,735 |
| Wells Fargo Commercial Mortgage Trust | |
| Series 2018-AUS, Class A | | |
| 4.058%, due 8/17/36 (a)(i) | 1,505,000 | 1,364,066 |
| WFRBS Commercial Mortgage Trust | |
| Series 2014-C21, Class AS | | |
| 3.891%, due 8/15/47 | 1,815,000 | 1,712,781 |
| | | 43,279,643 |
| Whole Loan (Collateralized Mortgage Obligations) 7.7% |
| Connecticut Avenue Securities Trust (a)(e) | |
| Series 2020-R02, Class 2M2 | | |
| 5.586% (1 Month LIBOR + 2.00%), due 1/25/40 | 318,551 | 312,821 |
| Series 2022-R04, Class 1M2 | | |
| 6.097% (SOFR 30A + 3.10%), due 3/25/42 | 900,000 | 842,776 |
| FHLMC STACR REMIC Trust (a)(e) | |
| Series 2022-DNA1, Class M1B | | |
| 4.847% (SOFR 30A + 1.85%), due 1/25/42 | 1,345,000 | 1,207,136 |
| Series 2020-DNA6, Class M2 | | |
| 4.997% (SOFR 30A + 2.00%), due 12/25/50 | 465,506 | 457,823 |
| Series 2021-HQA2, Class M2 | | |
| 5.047% (SOFR 30A + 2.05%), due 12/25/33 | 1,575,000 | 1,387,230 |
| Series 2021-HQA1, Class M2 | | |
| 5.247% (SOFR 30A + 2.25%), due 8/25/33 | 1,925,000 | 1,760,145 |
| Series 2022-DNA2, Class M1B | | |
| 5.397% (SOFR 30A + 2.40%), due 2/25/42 | 265,000 | 243,800 |
| Series 2022-DNA3, Class M1B | | |
| 5.897% (SOFR 30A + 2.90%), due 4/25/42 | 1,255,000 | 1,164,013 |
| | Principal
Amount | Value |
| |
| Whole Loan (Collateralized Mortgage Obligations) (continued) |
| FHLMC STACR REMIC Trust (a)(e) (continued) | |
| Series 2021-HQA2, Class B1 | | |
| 6.147% (SOFR 30A + 3.15%), due 12/25/33 | $ 855,000 | $ 680,875 |
| Series 2021-HQA3, Class B1 | | |
| 6.347% (SOFR 30A + 3.35%), due 9/25/41 | 2,980,000 | 2,547,118 |
| FHLMC STACR Trust (a)(e) | |
| Series 2018-DNA2, Class B1 | | |
| 7.286% (1 Month LIBOR + 3.70%), due 12/25/30 | 2,276,414 | 2,237,465 |
| Series 2019-DNA2, Class B1 | | |
| 7.936% (1 Month LIBOR + 4.35%), due 3/25/49 | 2,925,000 | 2,924,999 |
| Series 2019-DNA1, Class B1 | | |
| 8.236% (1 Month LIBOR + 4.65%), due 1/25/49 | 1,585,000 | 1,619,868 |
| FNMA (e) | |
| Series 2018-C01, Class 1B1 | | |
| 7.136% (1 Month LIBOR + 3.55%), due 7/25/30 | 2,730,000 | 2,721,568 |
| Series 2017-C07, Class 1B1 | | |
| 7.586% (1 Month LIBOR + 4.00%), due 5/25/30 | 860,000 | 869,137 |
| J.P. Morgan Mortgage Trust (a)(j) | |
| Series 2021-LTV2, Class A1 | | |
| 2.519%, due 5/25/52 | 839,415 | 643,544 |
| Series 2022-INV3, Class A3B | | |
| 3.00%, due 9/25/52 | 1,090,086 | 874,751 |
| New Residential Mortgage Loan Trust (a) | |
| Series 2019-5A, Class B7 | | |
| 4.359%, due 8/25/59 (i) | 4,845,752 | 2,899,231 |
| Series 2019-4A, Class B6 | | |
| 4.667%, due 12/25/58 (j) | 4,460,370 | 2,619,889 |
| Series 2019-2A, Class B6 | | |
| 4.891%, due 12/25/57 (j) | 1,686,182 | 1,046,518 |
| STACR Trust (a)(e) | |
| Series 2018-HRP2, Class M3 | | |
| 5.986% (1 Month LIBOR + 2.40%), due 2/25/47 | 2,122,932 | 2,051,033 |
| Series 2018-HRP2, Class B1 | | |
| 7.786% (1 Month LIBOR + 4.20%), due 2/25/47 | 2,290,000 | 2,222,396 |
| | | 33,334,136 |
Total Mortgage-Backed Securities
(Cost $119,499,832) | | 107,890,786 |
The notes to the financial statements are an integral part of, and should be read in conjunction with, the financial statements.
| 20 | MainStay MacKay Total Return Bond Fund |
| | Principal
Amount | Value |
| U.S. Government & Federal Agencies 17.8% |
| Federal Home Loan Mortgage Corporation (Mortgage Pass-Through Securities) 2.4% |
| FHLMC Gold Pools, 30 Year | | |
| 3.50%, due 1/1/44 | $ 897,172 | $ 815,011 |
| 3.50%, due 11/1/45 | 887,013 | 804,841 |
| 3.50%, due 3/1/46 | 1,626,422 | 1,477,467 |
| 4.00%, due 10/1/48 | 717,433 | 666,442 |
| 6.50%, due 4/1/37 | 33,443 | 35,268 |
| FHLMC Gold Pools, Other | | |
| 4.00%, due 6/1/42 | 1,005,865 | 936,819 |
| UMBS, 30 Year | | |
| 3.00%, due 3/1/52 | 1,483,915 | 1,268,219 |
| 3.00%, due 4/1/52 | 3,261,300 | 2,779,499 |
| 3.50%, due 7/1/52 | 1,948,211 | 1,714,215 |
| | | 10,497,781 |
| Federal National Mortgage Association (Mortgage Pass-Through Securities) 3.0% |
| FNMA, Other | | |
| 4.00%, due 3/1/42 | 551,561 | 511,964 |
| 4.00%, due 1/1/43 | 1,027,518 | 954,029 |
| 6.00%, due 4/1/37 | 4,597 | 4,650 |
| UMBS, 30 Year | | |
| 2.50%, due 8/1/50 | 421,517 | 349,002 |
| 3.00%, due 12/1/47 | 175,637 | 152,524 |
| 3.00%, due 2/1/52 | 947,979 | 808,161 |
| 3.00%, due 3/1/52 | 1,215,356 | 1,036,050 |
| 3.00%, due 3/1/52 | 1,498,271 | 1,277,223 |
| 3.50%, due 12/1/44 | 735,790 | 667,014 |
| 3.50%, due 9/1/52 | 463,044 | 407,448 |
| 4.00%, due 6/1/52 | 1,964,109 | 1,787,769 |
| 4.00%, due 6/1/52 | 2,284,464 | 2,078,932 |
| 4.00%, due 7/1/52 | 1,163,869 | 1,059,373 |
| 5.50%, due 7/1/41 | 1,246,111 | 1,275,176 |
| 6.00%, due 7/1/39 | 251,073 | 257,837 |
| 6.50%, due 10/1/39 | 252,851 | 262,167 |
| | | 12,889,319 |
| United States Treasury Bonds 8.6% |
| U.S. Treasury Bonds | | |
| 3.00%, due 8/15/52 | 24,870,000 | 19,915,430 |
| 3.375%, due 8/15/42 | 19,780,000 | 17,063,340 |
| | | 36,978,770 |
| | Principal
Amount | | Value |
| |
| United States Treasury Inflation - Indexed Notes 0.1% |
| U.S. Treasury Inflation Linked Notes (k) | | | |
| 0.125%, due 1/15/30 | $ 155,405 | | $ 139,077 |
| 0.875%, due 1/15/29 | 369,476 | | 351,774 |
| | | | 490,851 |
| United States Treasury Notes 3.7% |
| U.S. Treasury Notes | | | |
| 2.75%, due 8/15/32 | 5,075,000 | | 4,541,332 |
| 4.00%, due 10/31/29 | 2,355,000 | | 2,332,922 |
| 4.125%, due 10/31/27 | 4,105,000 | | 4,083,513 |
| 4.375%, due 10/31/24 | 4,925,000 | | 4,914,611 |
| | | | 15,872,378 |
Total U.S. Government & Federal Agencies
(Cost $85,896,266) | | | 76,729,099 |
Total Long-Term Bonds
(Cost $491,340,014) | | | 419,697,146 |
| |
| | Shares | | |
| Common Stocks 0.0% ‡ |
| Commercial Services & Supplies 0.0% ‡ |
| Quad/Graphics, Inc. (l) | 1 | | 3 |
Total Common Stocks
(Cost $0) | | | 3 |
| Short-Term Investments 2.3% |
| Affiliated Investment Company 1.9% |
| MainStay U.S. Government Liquidity Fund, 2.905% (m) | 8,161,650 | | 8,161,650 |
| Unaffiliated Investment Company 0.4% |
| Invesco Government & Agency Portfolio, 3.163% (m)(n) | 1,826,403 | | 1,826,403 |
Total Short-Term Investments
(Cost $9,988,053) | | | 9,988,053 |
Total Investments
(Cost $501,328,067) | 99.7% | | 429,685,202 |
| Other Assets, Less Liabilities | 0.3 | | 1,451,895 |
| Net Assets | 100.0% | | $ 431,137,097 |
The notes to the financial statements are an integral part of, and should be read in conjunction with, the financial statements.
21
Portfolio of Investments October 31, 2022† (continued)
| † | Percentages indicated are based on Fund net assets. |
| ‡ | Less than one-tenth of a percent. |
| (a) | May be sold to institutional investors only under Rule 144A or securities offered pursuant to Section 4(a)(2) of the Securities Act of 1933, as amended. |
| (b) | All or a portion of this security was held on loan. As of October 31, 2022, the aggregate market value of securities on loan was $1,762,860. The Fund received cash collateral with a value of $1,826,403. (See Note 2(J)) |
| (c) | Fixed to floating rate—Rate shown was the rate in effect as of October 31, 2022. |
| (d) | Security is perpetual and, thus, does not have a predetermined maturity date. The date shown, if applicable, reflects the next call date. |
| (e) | Floating rate—Rate shown was the rate in effect as of October 31, 2022. |
| (f) | Illiquid security—As of October 31, 2022, the total market value deemed illiquid under procedures approved by the Board of Trustees was $806,130, which represented 0.2% of the Fund’s net assets.(Unaudited) |
| (g) | Step coupon—Rate shown was the rate in effect as of October 31, 2022. |
| (h) | Collateralized Mortgage Obligation Interest Only Strip—Pays a fixed or variable rate of interest based on mortgage loans or mortgage pass-through securities. The principal amount of the underlying pool represents the notional amount on which the current interest was calculated. The value of these stripped securities may be particularly sensitive to changes in prevailing interest rates and are typically more sensitive to changes in prepayment rates than traditional mortgage-backed securities. |
| (i) | Collateral strip rate—A bond whose interest was based on the weighted net interest rate of the collateral. The coupon rate adjusts periodically based on a predetermined schedule. Rate shown was the rate in effect as of October 31, 2022. |
| (j) | Coupon rate may change based on changes of the underlying collateral or prepayments of principal. Rate shown was the rate in effect as of October 31, 2022. |
| (k) | Treasury Inflation Protected Security—Pays a fixed rate of interest on a principal amount that is continuously adjusted for inflation based on the Consumer Price Index-Urban Consumers. |
| (l) | Non-income producing security. |
| (m) | Current yield as of October 31, 2022. |
| (n) | Represents a security purchased with cash collateral received for securities on loan. |
The notes to the financial statements are an integral part of, and should be read in conjunction with, the financial statements.
| 22 | MainStay MacKay Total Return Bond Fund |
Investments in Affiliates (in 000's)
Investments in issuers considered to be affiliate(s) of the Fund during the year ended October 31, 2022 for purposes of Section 2(a)(3) of the Investment Company Act of 1940, as amended, were as follows:
| Affiliated Investment Companies | Value,
Beginning
of Year | Purchases
at Cost | Proceeds
from
Sales | Net
Realized
Gain/(Loss)
on Sales | Change in
Unrealized
Appreciation/
(Depreciation) | Value,
End of
Year | Dividend
Income | Other
Distributions | Shares
End of
Year |
| MainStay U.S. Government Liquidity Fund | $ 23,661 | $ 899,603 | $ (915,102) | $ — | $ — | $ 8,162 | $ 40 | $ — | 8,162 |
Futures Contracts
As of October 31, 2022, the Fund held the following futures contracts1:
| Type | Number of
Contracts | Expiration
Date | Value at
Trade Date | Current
Notional
Amount | Unrealized
Appreciation
(Depreciation)2 |
| Long Contracts | | | | | |
| U.S. Treasury 2 Year Notes | 306 | December 2022 | $ 63,756,433 | $ 62,541,140 | $ (1,215,293) |
| U.S. Treasury 10 Year Notes | 340 | December 2022 | 39,451,657 | 37,601,875 | (1,849,782) |
| U.S. Treasury 10 Year Ultra Bonds | 188 | December 2022 | 22,315,892 | 21,805,063 | (510,829) |
| U.S. Treasury Long Bonds | 38 | December 2022 | 4,607,683 | 4,579,000 | (28,683) |
| Total Long Contracts | | | | | (3,604,587) |
| Short Contracts | | | | | |
| U.S. Treasury 5 Year Notes | (33) | December 2022 | (3,552,529) | (3,517,594) | 34,935 |
| U.S. Treasury Ultra Bonds | (37) | December 2022 | (4,929,764) | (4,723,281) | 206,483 |
| Total Short Contracts | | | | | 241,418 |
| Net Unrealized Depreciation | | | | | $ (3,363,169) |
| 1. | As of October 31, 2022, cash in the amount of $1,474,200 was on deposit with a broker or futures commission merchant for futures transactions. |
| 2. | Represents the difference between the value of the contracts at the time they were opened and the value as of October 31, 2022. |
| Abbreviation(s): |
| FHLMC—Federal Home Loan Mortgage Corp. |
| FNMA—Federal National Mortgage Association |
| FREMF—Freddie Mac Multifamily |
| GNMA—Government National Mortgage Association |
| LIBOR—London Interbank Offered Rate |
| REMIC—Real Estate Mortgage Investment Conduit |
| SOFR—Secured Overnight Financing Rate |
| UMBS—Uniform Mortgage Backed Securities |
The notes to the financial statements are an integral part of, and should be read in conjunction with, the financial statements.
23
Portfolio of Investments October 31, 2022† (continued)
The following is a summary of the fair valuations according to the inputs used as of October 31, 2022, for valuing the Fund’s assets and liabilities:
| Description | Quoted
Prices in
Active
Markets for
Identical
Assets
(Level 1) | | Significant
Other
Observable
Inputs
(Level 2) | | Significant
Unobservable
Inputs
(Level 3) | | Total |
| Asset Valuation Inputs | | | | | | | |
| Investments in Securities (a) | | | | | | | |
| Long-Term Bonds | | | | | | | |
| Asset-Backed Securities | $ — | | $ 49,624,836 | | $ — | | $ 49,624,836 |
| Corporate Bonds | — | | 174,242,705 | | — | | 174,242,705 |
| Foreign Government Bonds | — | | 10,653,974 | | — | | 10,653,974 |
| Loan Assignments | — | | 555,746 | | — | | 555,746 |
| Mortgage-Backed Securities | — | | 107,890,786 | | — | | 107,890,786 |
| U.S. Government & Federal Agencies | — | | 76,729,099 | | — | | 76,729,099 |
| Total Long-Term Bonds | — | | 419,697,146 | | — | | 419,697,146 |
| Common Stocks | 3 | | — | | — | | 3 |
| Short-Term Investments | | | | | | | |
| Affiliated Investment Company | 8,161,650 | | — | | — | | 8,161,650 |
| Unaffiliated Investment Company | 1,826,403 | | — | | — | | 1,826,403 |
| Total Short-Term Investments | 9,988,053 | | — | | — | | 9,988,053 |
| Total Investments in Securities | 9,988,056 | | 419,697,146 | | — | | 429,685,202 |
| Other Financial Instruments | | | | | | | |
| Futures Contracts (b) | 241,418 | | — | | — | | 241,418 |
| Total Investments in Securities and Other Financial Instruments | $ 10,229,474 | | $ 419,697,146 | | $ — | | $ 429,926,620 |
| Liability Valuation Inputs | | | | | | | |
| Other Financial Instruments | | | | | | | |
| Futures Contracts (b) | $ (3,604,587) | | $ — | | $ — | | $ (3,604,587) |
| (a) | For a complete listing of investments and their industries, see the Portfolio of Investments. |
| (b) | The value listed for these securities reflects unrealized appreciation (depreciation) as shown on the Portfolio of Investments. |
The notes to the financial statements are an integral part of, and should be read in conjunction with, the financial statements.
| 24 | MainStay MacKay Total Return Bond Fund |
Statement of Assets and Liabilities as of October 31, 2022
| Assets |
Investment in unaffiliated securities, at value
(identified cost $493,166,417) including securities on loan of $1,762,860 | $ 421,523,552 |
Investment in affiliated investment companies, at value
(identified cost $8,161,650) | 8,161,650 |
| Cash | 33,266 |
Cash denominated in foreign currencies
(identified cost $133) | 111 |
| Cash collateral on deposit at broker for futures contracts | 1,474,200 |
| Receivables: | |
| Interest | 3,185,503 |
| Investment securities sold | 909,767 |
| Fund shares sold | 152,016 |
| Securities lending | 1,275 |
| Other assets | 41,018 |
| Total assets | 435,482,358 |
| Liabilities |
| Cash collateral due to broker for TBA | 37,533 |
| Cash collateral received for securities on loan | 1,826,403 |
| Payables: | |
| Investment securities purchased | 1,566,541 |
| Variation margin on futures contracts | 418,196 |
| Fund shares redeemed | 159,592 |
| Manager (See Note 3) | 137,916 |
| Transfer agent (See Note 3) | 53,804 |
| Shareholder communication | 42,269 |
| Professional fees | 25,276 |
| NYLIFE Distributors (See Note 3) | 17,554 |
| Custodian | 12,648 |
| Trustees | 5,008 |
| Accrued expenses | 27,594 |
| Distributions payable | 14,927 |
| Total liabilities | 4,345,261 |
| Net assets | $ 431,137,097 |
| Composition of Net Assets |
| Shares of beneficial interest outstanding (par value of $.001 per share) unlimited number of shares authorized | $ 50,316 |
| Additional paid-in-capital | 531,285,733 |
| | 531,336,049 |
| Total distributable earnings (loss) | (100,198,952) |
| Net assets | $ 431,137,097 |
| Class A | |
| Net assets applicable to outstanding shares | $ 54,483,591 |
| Shares of beneficial interest outstanding | 6,359,029 |
| Net asset value per share outstanding | $ 8.57 |
| Maximum sales charge (4.50% of offering price) | 0.40 |
| Maximum offering price per share outstanding | $ 8.97 |
| Investor Class | |
| Net assets applicable to outstanding shares | $ 4,663,194 |
| Shares of beneficial interest outstanding | 540,987 |
| Net asset value per share outstanding | $ 8.62 |
| Maximum sales charge (4.00% of offering price) | 0.36 |
| Maximum offering price per share outstanding | $ 8.98 |
| Class B | |
| Net assets applicable to outstanding shares | $ 606,458 |
| Shares of beneficial interest outstanding | 70,659 |
| Net asset value and offering price per share outstanding | $ 8.58 |
| Class C | |
| Net assets applicable to outstanding shares | $ 4,480,291 |
| Shares of beneficial interest outstanding | 521,277 |
| Net asset value and offering price per share outstanding | $ 8.59 |
| Class I | |
| Net assets applicable to outstanding shares | $ 94,121,810 |
| Shares of beneficial interest outstanding | 10,980,770 |
| Net asset value and offering price per share outstanding | $ 8.57 |
| Class R1 | |
| Net assets applicable to outstanding shares | $ 23,978 |
| Shares of beneficial interest outstanding | 2,799 |
| Net asset value and offering price per share outstanding | $ 8.57 |
| Class R2 | |
| Net assets applicable to outstanding shares | $ 27,160 |
| Shares of beneficial interest outstanding | 3,171 |
| Net asset value and offering price per share outstanding | $ 8.57 |
| Class R3 | |
| Net assets applicable to outstanding shares | $ 482,918 |
| Shares of beneficial interest outstanding | 56,377 |
| Net asset value and offering price per share outstanding | $ 8.57 |
| Class R6 | |
| Net assets applicable to outstanding shares | $272,227,274 |
| Shares of beneficial interest outstanding | 31,778,842 |
| Net asset value and offering price per share outstanding | $ 8.57 |
| SIMPLE Class | |
| Net assets applicable to outstanding shares | $ 20,423 |
| Shares of beneficial interest outstanding | 2,370 |
| Net asset value and offering price per share outstanding | $ 8.62 |
The notes to the financial statements are an integral part of, and should be read in conjunction with, the financial statements.
25
Statement of Operations for the year ended October 31, 2022
| Investment Income (Loss) |
| Income | |
| Interest | $ 22,095,257 |
| Securities lending, net | 57,185 |
| Dividends-affiliated | 40,208 |
| Total income | 22,192,650 |
| Expenses | |
| Manager (See Note 3) | 2,900,163 |
| Distribution/Service—Class A (See Note 3) | 176,685 |
| Distribution/Service—Investor Class (See Note 3) | 14,180 |
| Distribution/Service—Class B (See Note 3) | 8,353 |
| Distribution/Service—Class C (See Note 3) | 72,088 |
| Distribution/Service—Class R2 (See Note 3) | 76 |
| Distribution/Service—Class R3 (See Note 3) | 2,360 |
| Distribution/Service—SIMPLE Class (See Note 3) | 114 |
| Transfer agent (See Note 3) | 168,164 |
| Registration | 135,030 |
| Professional fees | 98,856 |
| Custodian | 58,579 |
| Trustees | 15,068 |
| Shareholder communication | 8,552 |
| Shareholder service (See Note 3) | 529 |
| Miscellaneous | 57,252 |
| Total expenses before waiver/reimbursement | 3,716,049 |
| Expense waiver/reimbursement from Manager (See Note 3) | (270,463) |
| Net expenses | 3,445,586 |
| Net investment income (loss) | 18,747,064 |
| Realized and Unrealized Gain (Loss) |
| Net realized gain (loss) on: | |
| Unaffiliated investment transactions | (19,528,246) |
| Futures transactions | (155,261) |
| Foreign currency transactions | (2) |
| Net realized gain (loss) | (19,683,509) |
| Net change in unrealized appreciation (depreciation) on: | |
| Unaffiliated investments | (109,127,989) |
| Futures contracts | (4,252,280) |
| Translation of other assets and liabilities in foreign currencies | (18) |
| Net change in unrealized appreciation (depreciation) | (113,380,287) |
| Net realized and unrealized gain (loss) | (133,063,796) |
| Net increase (decrease) in net assets resulting from operations | $(114,316,732) |
The notes to the financial statements are an integral part of, and should be read in conjunction with, the financial statements.
| 26 | MainStay MacKay Total Return Bond Fund |
Statements of Changes in Net Assets
for the years ended October 31, 2022 and October 31, 2021
| | 2022 | 2021 |
| Increase (Decrease) in Net Assets |
| Operations: | | |
| Net investment income (loss) | $ 18,747,064 | $ 34,878,905 |
| Net realized gain (loss) | (19,683,509) | 24,110,893 |
| Net change in unrealized appreciation (depreciation) | (113,380,287) | (27,632,885) |
| Net increase (decrease) in net assets resulting from operations | (114,316,732) | 31,356,913 |
| Distributions to shareholders: | | |
| Class A | (4,775,382) | (3,167,863) |
| Investor Class | (357,428) | (232,732) |
| Class B | (47,409) | (35,371) |
| Class C | (435,071) | (378,150) |
| Class I | (8,345,013) | (25,753,664) |
| Class R1 | (1,751) | (1,022) |
| Class R2 | (1,910) | (1,173) |
| Class R3 | (28,420) | (10,661) |
| Class R6 | (28,552,302) | (23,894,507) |
| SIMPLE Class | (1,336) | (723) |
| | (42,546,022) | (53,475,866) |
| Distributions to shareholders from return of capital: | | |
| Class A | (19,314) | — |
| Investor Class | (1,446) | — |
| Class B | (192) | — |
| Class C | (1,760) | — |
| Class I | (33,752) | — |
| Class R1 | (7) | — |
| Class R2 | (8) | — |
| Class R3 | (115) | — |
| Class R6 | (115,483) | — |
| SIMPLE Class | (5) | — |
| | (172,082) | — |
| Total distributions to shareholders | (42,718,104) | (53,475,866) |
| Capital share transactions: | | |
| Net proceeds from sales of shares | 60,162,268 | 246,839,503 |
| Net asset value of shares issued to shareholders in reinvestment of distributions | 42,385,916 | 53,266,148 |
| Cost of shares redeemed | (883,780,161) | (433,410,211) |
| Increase (decrease) in net assets derived from capital share transactions | (781,231,977) | (133,304,560) |
| Net increase (decrease) in net assets | (938,266,813) | (155,423,513) |
| | 2022 | 2021 |
| Net Assets |
| Beginning of year | $1,369,403,910 | $1,524,827,423 |
| End of year | $ 431,137,097 | $1,369,403,910 |
The notes to the financial statements are an integral part of, and should be read in conjunction with, the financial statements.
27
Financial Highlights selected per share data and ratios
| | Year Ended October 31, |
| Class A | 2022 | | 2021 | | 2020 | | 2019 | | 2018 |
| Net asset value at beginning of year | $ 11.18 | | $ 11.35 | | $ 10.91 | | $ 10.10 | | $ 10.64 |
| Net investment income (loss) | 0.29(a) | | 0.24(a) | | 0.24 | | 0.27 | | 0.25(a) |
| Net realized and unrealized gain (loss) | (2.26) | | (0.03) | | 0.47 | | 0.82 | | (0.54) |
| Total from investment operations | (1.97) | | 0.21 | | 0.71 | | 1.09 | | (0.29) |
| Less distributions: | | | | | | | | | |
| From net investment income | (0.31) | | (0.25) | | (0.27) | | (0.28) | | (0.25) |
| From net realized gain on investments | (0.33) | | (0.13) | | — | | — | | — |
| Return of capital | (0.00)‡ | | — | | — | | — | | (0.00)‡ |
| Total distributions | (0.64) | | (0.38) | | (0.27) | | (0.28) | | (0.25) |
| Net asset value at end of year | $ 8.57 | | $ 11.18 | | $ 11.35 | | $ 10.91 | | $ 10.10 |
| Total investment return (b) | (18.43)% | | 1.86% | | 6.55% | | 10.88% | | (2.78)% |
| Ratios (to average net assets)/Supplemental Data: | | | | | | | | | |
| Net investment income (loss) | 2.89% | | 2.14% | | 2.30% | | 2.63% | | 2.40% |
| Net expenses (c) | 0.78% | | 0.83% | | 0.85% | | 0.88% | | 0.90% |
| Expenses (before waiver/reimbursement) (c) | 0.83% | | 0.83% | | 0.85% | | 0.89% | | 0.90% |
| Portfolio turnover rate | 98%(d) | | 111%(d) | | 123% | | 100%(d) | | 95%(d) |
| Net assets at end of year (in 000’s) | $ 54,484 | | $ 87,764 | | $ 92,997 | | $ 56,473 | | $ 44,527 |
| ‡ | Less than one cent per share. |
| (a) | Per share data based on average shares outstanding during the year. |
| (b) | Total investment return is calculated exclusive of sales charges and assumes the reinvestment of dividends and distributions. For periods of less than one year, total return is not annualized. |
| (c) | In addition to the fees and expenses which the Fund bears directly, it also indirectly bears a pro-rata share of the fees and expenses of the underlying funds in which it invests. Such indirect expenses are not included in the above expense ratios. |
| (d) | The portfolio turnover rates not including mortgage dollar rolls were 96%, 108%, 96% and 63% for the years ended October 31, 2022, 2021, 2019 and 2018, respectively. |
| | Year Ended October 31, |
| Investor Class | 2022 | | 2021 | | 2020 | | 2019 | | 2018 |
| Net asset value at beginning of year | $ 11.24 | | $ 11.42 | | $ 10.97 | | $ 10.15 | | $ 10.70 |
| Net investment income (loss) | 0.26(a) | | 0.22(a) | | 0.24 | | 0.26 | | 0.24(a) |
| Net realized and unrealized gain (loss) | (2.27) | | (0.04) | | 0.46 | | 0.82 | | (0.56) |
| Total from investment operations | (2.01) | | 0.18 | | 0.70 | | 1.08 | | (0.32) |
| Less distributions: | | | | | | | | | |
| From net investment income | (0.28) | | (0.23) | | (0.25) | | (0.26) | | (0.23) |
| From net realized gain on investments | (0.33) | | (0.13) | | — | | — | | — |
| Return of capital | (0.00)‡ | | — | | — | | — | | (0.00)‡ |
| Total distributions | (0.61) | | (0.36) | | (0.25) | | (0.26) | | (0.23) |
| Net asset value at end of year | $ 8.62 | | $ 11.24 | | $ 11.42 | | $ 10.97 | | $ 10.15 |
| Total investment return (b) | (18.65)% | | 1.54% | | 6.40% | | 10.74% | | (2.99)% |
| Ratios (to average net assets)/Supplemental Data: | | | | | | | | | |
| Net investment income (loss) | 2.65% | | 1.93% | | 2.11% | | 2.46% | | 2.27% |
| Net expenses (c) | 1.04% | | 1.04% | | 1.05% | | 1.05% | | 1.04% |
| Expenses (before waiver/reimbursement) (c) | 1.09% | | 1.04% | | 1.05% | | 1.06% | | 1.05% |
| Portfolio turnover rate | 98%(d) | | 111%(d) | | 123% | | 100%(d) | | 95%(d) |
| Net assets at end of year (in 000's) | $ 4,663 | | $ 6,894 | | $ 7,558 | | $ 6,557 | | $ 5,514 |
| ‡ | Less than one cent per share. |
| (a) | Per share data based on average shares outstanding during the year. |
| (b) | Total investment return is calculated exclusive of sales charges and assumes the reinvestment of dividends and distributions. For periods of less than one year, total return is not annualized. |
| (c) | In addition to the fees and expenses which the Fund bears directly, it also indirectly bears a pro-rata share of the fees and expenses of the underlying funds in which it invests. Such indirect expenses are not included in the above expense ratios. |
| (d) | The portfolio turnover rates not including mortgage dollar rolls were 96%, 108%, 96% and 63% for the years ended October 31, 2022, 2021, 2019 and 2018, respectively. |
The notes to the financial statements are an integral part of, and should be read in conjunction with, the financial statements.
| 28 | MainStay MacKay Total Return Bond Fund |
Financial Highlights selected per share data and ratios
| | Year Ended October 31, |
| Class B | 2022 | | 2021 | | 2020 | | 2019 | | 2018 |
| Net asset value at beginning of year | $ 11.20 | | $ 11.37 | | $ 10.92 | | $ 10.11 | | $ 10.65 |
| Net investment income (loss) | 0.19(a) | | 0.13(a) | | 0.18 | | 0.20 | | 0.16(a) |
| Net realized and unrealized gain (loss) | (2.28) | | (0.03) | | 0.43 | | 0.79 | | (0.55) |
| Total from investment operations | (2.09) | | 0.10 | | 0.61 | | 0.99 | | (0.39) |
| Less distributions: | | | | | | | | | |
| From net investment income | (0.20) | | (0.14) | | (0.16) | | (0.18) | | (0.15) |
| From net realized gain on investments | (0.33) | | (0.13) | | — | | — | | — |
| Return of capital | (0.00)‡ | | — | | — | | — | | (0.00)‡ |
| Total distributions | (0.53) | | (0.27) | | (0.16) | | (0.18) | | (0.15) |
| Net asset value at end of year | $ 8.58 | | $ 11.20 | | $ 11.37 | | $ 10.92 | | $ 10.11 |
| Total investment return (b) | (19.34)% | | 0.85% | | 5.64% | | 9.85% | | (3.64)% |
| Ratios (to average net assets)/Supplemental Data: | | | | | | | | | |
| Net investment income (loss) | 1.88% | | 1.17% | | 1.36% | | 1.73% | | 1.51% |
| Net expenses (c) | 1.79% | | 1.79% | | 1.80% | | 1.80% | | 1.79% |
| Expenses (before waiver/reimbursement) (c) | 1.84% | | 1.79% | | 1.80% | | 1.81% | | 1.80% |
| Portfolio turnover rate | 98%(d) | | 111%(d) | | 123% | | 100%(d) | | 95%(d) |
| Net assets at end of year (in 000’s) | $ 606 | | $ 1,087 | | $ 1,838 | | $ 2,515 | | $ 2,987 |
| ‡ | Less than one cent per share. |
| (a) | Per share data based on average shares outstanding during the year. |
| (b) | Total investment return is calculated exclusive of sales charges and assumes the reinvestment of dividends and distributions. For periods of less than one year, total return is not annualized. |
| (c) | In addition to the fees and expenses which the Fund bears directly, it also indirectly bears a pro-rata share of the fees and expenses of the underlying funds in which it invests. Such indirect expenses are not included in the above expense ratios. |
| (d) | The portfolio turnover rates not including mortgage dollar rolls were 96%, 108%, 96% and 63% for the years ended October 31, 2022, 2021, 2019 and 2018, respectively. |
| | Year Ended October 31, |
| Class C | 2022 | | 2021 | | 2020 | | 2019 | | 2018 |
| Net asset value at beginning of year | $ 11.21 | | $ 11.38 | | $ 10.93 | | $ 10.12 | | $ 10.66 |
| Net investment income (loss) | 0.18(a) | | 0.13(a) | | 0.14 | | 0.20 | | 0.16(a) |
| Net realized and unrealized gain (loss) | (2.27) | | (0.03) | | 0.47 | | 0.79 | | (0.55) |
| Total from investment operations | (2.09) | | 0.10 | | 0.61 | | 0.99 | | (0.39) |
| Less distributions: | | | | | | | | | |
| From net investment income | (0.20) | | (0.14) | | (0.16) | | (0.18) | | (0.15) |
| From net realized gain on investments | (0.33) | | (0.13) | | — | | — | | — |
| Return of capital | (0.00)‡ | | — | | — | | — | | (0.00)‡ |
| Total distributions | (0.53) | | (0.27) | | (0.16) | | (0.18) | | (0.15) |
| Net asset value at end of year | $ 8.59 | | $ 11.21 | | $ 11.38 | | $ 10.93 | | $ 10.12 |
| Total investment return (b) | (19.32)% | | 0.85% | | 5.64% | | 9.84% | | (3.64)% |
| Ratios (to average net assets)/Supplemental Data: | | | | | | | | | |
| Net investment income (loss) | 1.83% | | 1.17% | | 1.35% | | 1.74% | | 1.51% |
| Net expenses (c) | 1.79% | | 1.79% | | 1.80% | | 1.80% | | 1.79% |
| Expenses (before waiver/reimbursement) (c) | 1.84% | | 1.79% | | 1.80% | | 1.81% | | 1.80% |
| Portfolio turnover rate | 98%(d) | | 111%(d) | | 123% | | 100%(d) | | 95%(d) |
| Net assets at end of year (in 000’s) | $ 4,480 | | $ 10,449 | | $ 18,434 | | $ 11,916 | | $ 14,837 |
| ‡ | Less than one cent per share. |
| (a) | Per share data based on average shares outstanding during the year. |
| (b) | Total investment return is calculated exclusive of sales charges and assumes the reinvestment of dividends and distributions. For periods of less than one year, total return is not annualized. |
| (c) | In addition to the fees and expenses which the Fund bears directly, it also indirectly bears a pro-rata share of the fees and expenses of the underlying funds in which it invests. Such indirect expenses are not included in the above expense ratios. |
| (d) | The portfolio turnover rates not including mortgage dollar rolls were 96%, 108%, 96% and 63% for the years ended October 31, 2022, 2021, 2019 and 2018, respectively. |
The notes to the financial statements are an integral part of, and should be read in conjunction with, the financial statements.
29
Financial Highlights selected per share data and ratios
| | Year Ended October 31, |
| Class I | 2022 | | 2021 | | 2020 | | 2019 | | 2018 |
| Net asset value at beginning of year | $ 11.18 | | $ 11.36 | | $ 10.91 | | $ 10.10 | | $ 10.64 |
| Net investment income (loss) | 0.30(a) | | 0.27(a) | | 0.29 | | 0.31 | | 0.28(a) |
| Net realized and unrealized gain (loss) | (2.25) | | (0.04) | | 0.45 | | 0.81 | | (0.54) |
| Total from investment operations | (1.95) | | 0.23 | | 0.74 | | 1.12 | | (0.26) |
| Less distributions: | | | | | | | | | |
| From net investment income | (0.33) | | (0.28) | | (0.29) | | (0.31) | | (0.28) |
| From net realized gain on investments | (0.33) | | (0.13) | | — | | — | | — |
| Return of capital | (0.00)‡ | | — | | — | | — | | (0.00)‡ |
| Total distributions | (0.66) | | (0.41) | | (0.29) | | (0.31) | | (0.28) |
| Net asset value at end of year | $ 8.57 | | $ 11.18 | | $ 11.36 | | $ 10.91 | | $ 10.10 |
| Total investment return (b) | (18.30)% | | 2.11% | | 6.91% | | 11.20% | | (2.49)% |
| Ratios (to average net assets)/Supplemental Data: | | | | | | | | | |
| Net investment income (loss) | 3.01% | | 2.39% | | 2.56% | | 2.93% | | 2.70% |
| Net expenses (c) | 0.53% | | 0.58% | | 0.60% | | 0.60% | | 0.60% |
| Expenses (before waiver/reimbursement) (c) | 0.58% | | 0.58% | | 0.60% | | 0.64% | | 0.65% |
| Portfolio turnover rate | 98%(d) | | 111%(d) | | 123% | | 100%(d) | | 95%(d) |
| Net assets at end of year (in 000’s) | $ 94,122 | | $ 720,466 | | $ 686,829 | | $ 1,056,594 | | $ 1,016,022 |
| ‡ | Less than one cent per share. |
| (a) | Per share data based on average shares outstanding during the year. |
| (b) | Total investment return is calculated exclusive of sales charges and assumes the reinvestment of dividends and distributions. Class I shares are not subject to sales charges. For periods of less than one year, total return is not annualized. |
| (c) | In addition to the fees and expenses which the Fund bears directly, it also indirectly bears a pro-rata share of the fees and expenses of the underlying funds in which it invests. Such indirect expenses are not included in the above expense ratios. |
| (d) | The portfolio turnover rates not including mortgage dollar rolls were 96%, 108%, 96% and 63% for the years ended October 31, 2022, 2021, 2019 and 2018, respectively. |
The notes to the financial statements are an integral part of, and should be read in conjunction with, the financial statements.
| 30 | MainStay MacKay Total Return Bond Fund |
Financial Highlights selected per share data and ratios
| | Year Ended October 31, |
| Class R1 | 2022 | | 2021 | | 2020 | | 2019 | | 2018 |
| Net asset value at beginning of year | $ 11.18 | | $ 11.35 | | $ 10.90 | | $ 10.10 | | $ 10.64 |
| Net investment income (loss) | 0.31(a) | | 0.26(a) | | 0.26 | | 0.29 | | 0.27(a) |
| Net realized and unrealized gain (loss) | (2.27) | | (0.03) | | 0.47 | | 0.80 | | (0.54) |
| Total from investment operations | (1.96) | | 0.23 | | 0.73 | | 1.09 | | (0.27) |
| Less distributions: | | | | | | | | | |
| From net investment income | (0.32) | | (0.27) | | (0.28) | | (0.29) | | (0.27) |
| From net realized gain on investments | (0.33) | | (0.13) | | — | | — | | — |
| Return of capital | (0.00)‡ | | — | | — | | — | | (0.00)‡ |
| Total distributions | (0.65) | | (0.40) | | (0.28) | | (0.29) | | (0.27) |
| Net asset value at end of year | $ 8.57 | | $ 11.18 | | $ 11.35 | | $ 10.90 | | $ 10.10 |
| Total investment return (b) | (18.31)% | | 2.01% | | 6.81% | | 10.98% | | (2.59)% |
| Ratios (to average net assets)/Supplemental Data: | | | | | | | | | |
| Net investment income (loss) | 3.10% | | 2.29% | | 2.47% | | 2.97% | | 2.61% |
| Net expenses (c) | 0.61% | | 0.68% | | 0.70% | | 0.70% | | 0.70% |
| Expenses (before waiver/reimbursement) (c) | 0.67% | | 0.68% | | 0.70% | | 0.74% | | 0.75% |
| Portfolio turnover rate | 98%(d) | | 111%(d) | | 123% | | 100%(d) | | 95%(d) |
| Net assets at end of year (in 000’s) | $ 24 | | $ 29 | | $ 29 | | $ 27 | | $ 4,148 |
| ‡ | Less than one cent per share. |
| (a) | Per share data based on average shares outstanding during the year. |
| (b) | Total investment return is calculated exclusive of sales charges and assumes the reinvestment of dividends and distributions. Class R1 shares are not subject to sales charges. For periods of less than one year, total return is not annualized. |
| (c) | In addition to the fees and expenses which the Fund bears directly, it also indirectly bears a pro-rata share of the fees and expenses of the underlying funds in which it invests. Such indirect expenses are not included in the above expense ratios. |
| (d) | The portfolio turnover rates not including mortgage dollar rolls were 96%, 108%, 96% and 63% for the years ended October 31, 2022, 2021, 2019 and 2018, respectively. |
The notes to the financial statements are an integral part of, and should be read in conjunction with, the financial statements.
31
Financial Highlights selected per share data and ratios
| | Year Ended October 31, |
| Class R2 | 2022 | | 2021 | | 2020 | | 2019 | | 2018 |
| Net asset value at beginning of year | $ 11.18 | | $ 11.35 | | $ 10.90 | | $ 10.09 | | $ 10.63 |
| Net investment income (loss) | 0.28(a) | | 0.23(a) | | 0.25 | | 0.27 | | 0.24(a) |
| Net realized and unrealized gain (loss) | (2.26) | | (0.03) | | 0.46 | | 0.81 | | (0.54) |
| Total from investment operations | (1.98) | | 0.20 | | 0.71 | | 1.08 | | (0.30) |
| Less distributions: | | | | | | | | | |
| From net investment income | (0.30) | | (0.24) | | (0.26) | | (0.27) | | (0.24) |
| From net realized gain on investments | (0.33) | | (0.13) | | — | | — | | — |
| Return of capital | (0.00)‡ | | — | | — | | — | | (0.00)‡ |
| Total distributions | (0.63) | | (0.37) | | (0.26) | | (0.27) | | (0.24) |
| Net asset value at end of year | $ 8.57 | | $ 11.18 | | $ 11.35 | | $ 10.90 | | $ 10.09 |
| Total investment return (b) | (18.52)% | | 1.75% | | 6.54% | | 10.82% | | (2.83)% |
| Ratios (to average net assets)/Supplemental Data: | | | | | | | | | |
| Net investment income (loss) | 2.85% | | 2.02% | | 2.21% | | 2.57% | | 2.35% |
| Net expenses (c) | 0.87% | | 0.93% | | 0.95% | | 0.95% | | 0.95% |
| Expenses (before waiver/reimbursement) (c) | 0.93% | | 0.93% | | 0.95% | | 0.99% | | 1.00% |
| Portfolio turnover rate | 98%(d) | | 111%(d) | | 123% | | 100%(d) | | 95%(d) |
| Net assets at end of year (in 000’s) | $ 27 | | $ 33 | | $ 87 | | $ 81 | | $ 73 |
| ‡ | Less than one cent per share. |
| (a) | Per share data based on average shares outstanding during the year. |
| (b) | Total investment return is calculated exclusive of sales charges and assumes the reinvestment of dividends and distributions. Class R2 shares are not subject to sales charges. For periods of less than one year, total return is not annualized. |
| (c) | In addition to the fees and expenses which the Fund bears directly, it also indirectly bears a pro-rata share of the fees and expenses of the underlying funds in which it invests. Such indirect expenses are not included in the above expense ratios. |
| (d) | The portfolio turnover rates not including mortgage dollar rolls were 96%, 108%, 96% and 63% for the years ended October 31, 2022, 2021, 2019 and 2018, respectively. |
The notes to the financial statements are an integral part of, and should be read in conjunction with, the financial statements.
| 32 | MainStay MacKay Total Return Bond Fund |
Financial Highlights selected per share data and ratios
| | Year Ended October 31, |
| Class R3 | 2022 | | 2021 | | 2020 | | 2019 | | 2018 |
| Net asset value at beginning of year | $ 11.18 | | $ 11.35 | | $ 10.90 | | $ 10.10 | | $ 10.64 |
| Net investment income (loss) | 0.26(a) | | 0.20(a) | | 0.22 | | 0.24 | | 0.22(a) |
| Net realized and unrealized gain (loss) | (2.27) | | (0.03) | | 0.46 | | 0.80 | | (0.54) |
| Total from investment operations | (2.01) | | 0.17 | | 0.68 | | 1.04 | | (0.32) |
| Less distributions: | | | | | | | | | |
| From net investment income | (0.27) | | (0.21) | | (0.23) | | (0.24) | | (0.22) |
| From net realized gain on investments | (0.33) | | (0.13) | | — | | — | | — |
| Return of capital | (0.00)‡ | | — | | — | | — | | (0.00)‡ |
| Total distributions | (0.60) | | (0.34) | | (0.23) | | (0.24) | | (0.22) |
| Net asset value at end of year | $ 8.57 | | $ 11.18 | | $ 11.35 | | $ 10.90 | | $ 10.10 |
| Total investment return (b) | (18.71)% | | 1.50% | | 6.28% | | 10.44% | | (3.08)% |
| Ratios (to average net assets)/Supplemental Data: | | | | | | | | | |
| Net investment income (loss) | 2.62% | | 1.79% | | 1.96% | | 2.30% | | 2.15% |
| Net expenses (c) | 1.11% | | 1.18% | | 1.20% | | 1.20% | | 1.20% |
| Expenses (before waiver/reimbursement) (c) | 1.17% | | 1.18% | | 1.20% | | 1.24% | | 1.24% |
| Portfolio turnover rate | 98%(d) | | 111%(d) | | 123% | | 100%(d) | | 95%(d) |
| Net assets at end of year (in 000’s) | $ 483 | | $ 509 | | $ 329 | | $ 251 | | $ 173 |
| ‡ | Less than one cent per share. |
| (a) | Per share data based on average shares outstanding during the year. |
| (b) | Total investment return is calculated exclusive of sales charges and assumes the reinvestment of dividends and distributions. Class R3 shares are not subject to sales charges. For periods of less than one year, total return is not annualized. |
| (c) | In addition to the fees and expenses which the Fund bears directly, it also indirectly bears a pro-rata share of the fees and expenses of the underlying funds in which it invests. Such indirect expenses are not included in the above expense ratios. |
| (d) | The portfolio turnover rates not including mortgage dollar rolls were 96%, 108%, 96% and 63% for the years ended October 31, 2022, 2021, 2019 and 2018, respectively. |
The notes to the financial statements are an integral part of, and should be read in conjunction with, the financial statements.
33
Financial Highlights selected per share data and ratios
| | Year Ended October 31, |
| Class R6 | 2022 | | 2021 | | 2020 | | 2019 | | 2018 |
| Net asset value at beginning of year | $ 11.18 | | $ 11.35 | | $ 10.91 | | $ 10.10 | | $ 10.64 |
| Net investment income (loss) | 0.31(a) | | 0.27(a) | | 0.28 | | 0.30 | | 0.29(a) |
| Net realized and unrealized gain (loss) | (2.26) | | (0.02) | | 0.46 | | 0.82 | | (0.54) |
| Total from investment operations | (1.95) | | 0.25 | | 0.74 | | 1.12 | | (0.25) |
| Less distributions: | | | | | | | | | |
| From net investment income | (0.33) | | (0.29) | | (0.30) | | (0.31) | | (0.29) |
| From net realized gain on investments | (0.33) | | (0.13) | | — | | — | | — |
| Return of capital | (0.00)‡ | | — | | — | | — | | (0.00)‡ |
| Total distributions | (0.66) | | (0.42) | | (0.30) | | (0.31) | | (0.29) |
| Net asset value at end of year | $ 8.57 | | $ 11.18 | | $ 11.35 | | $ 10.91 | | $ 10.10 |
| Total investment return (b) | (18.20)% | | 2.16% | | 6.89% | | 11.27% | | (2.42)% |
| Ratios (to average net assets)/Supplemental Data: | | | | | | | | | |
| Net investment income (loss) | 3.13% | | 2.43% | | 2.61% | | 2.98% | | 2.81% |
| Net expenses (c) | 0.50% | | 0.53% | | 0.53% | | 0.53% | | 0.53% |
| Expenses (before waiver/reimbursement) (c) | 0.54% | | 0.53% | | 0.53% | | 0.53% | | 0.53% |
| Portfolio turnover rate | 98%(d) | | 111%(d) | | 123% | | 100%(d) | | 95%(d) |
| Net assets at end of year (in 000’s) | $ 272,227 | | $ 542,147 | | $ 716,703 | | $ 185,733 | | $ 119,963 |
| ‡ | Less than one cent per share. |
| (a) | Per share data based on average shares outstanding during the year. |
| (b) | Total investment return is calculated exclusive of sales charges and assumes the reinvestment of dividends and distributions. Class R6 shares are not subject to sales charges. For periods of less than one year, total return is not annualized. |
| (c) | In addition to the fees and expenses which the Fund bears directly, it also indirectly bears a pro-rata share of the fees and expenses of the underlying funds in which it invests. Such indirect expenses are not included in the above expense ratios. |
| (d) | The portfolio turnover rates not including mortgage dollar rolls were 96%, 108%, 96% and 63% for the years ended October 31, 2022, 2021, 2019 and 2018, respectively. |
The notes to the financial statements are an integral part of, and should be read in conjunction with, the financial statements.
| 34 | MainStay MacKay Total Return Bond Fund |
Financial Highlights selected per share data and ratios
| | Year Ended October 31, | | August 31, 2020^ through
October 31, |
| SIMPLE Class | 2022 | | 2021 | | 2020 |
| Net asset value at beginning of period | $ 11.24 | | $ 11.41 | | $ 11.52* |
| Net investment income (loss) | 0.24(a) | | 0.19(a) | | 0.03 |
| Net realized and unrealized gain (loss) | (2.28) | | (0.03) | | (0.11) |
| Total from investment operations | (2.04) | | 0.16 | | (0.08) |
| Less distributions: | | | | | |
| From net investment income | (0.25) | | (0.20) | | (0.03) |
| From net realized gain on investments | (0.33) | | (0.13) | | — |
| Return of capital | (0.00)‡ | | — | | — |
| Total distributions | (0.58) | | (0.33) | | (0.03) |
| Net asset value at end of period | $ 8.62 | | $ 11.24 | | $ 11.41 |
| Total investment return (b) | (18.85)% | | 1.39% | | (0.66)% |
| Ratios (to average net assets)/Supplemental Data: | | | | | |
| Net investment income (loss) | 2.43% | | 1.69% | | 1.80%†† |
| Net expenses (c) | 1.28% | | 1.29% | | 1.26%†† |
| Expenses (before waiver/reimbursement) (c) | 1.33% | | 1.29% | | 1.26%†† |
| Portfolio turnover rate | 98%(d) | | 111%(d) | | 123% |
| Net assets at end of period (in 000’s) | $ 20 | | $ 25 | | $ 25 |
| ^ | Inception date. |
| ‡ | Less than one cent per share. |
| * | Based on the net asset value of Investor Class as of August 31, 2020. |
| †† | Annualized. |
| (a) | Per share data based on average shares outstanding during the period. |
| (b) | Total investment return is calculated exclusive of sales charges and assumes the reinvestment of dividends and distributions. SIMPLE Class shares are not subject to sales charges. For periods of less than one year, total return is not annualized. |
| (c) | In addition to the fees and expenses which the Fund bears directly, it also indirectly bears a pro-rata share of the fees and expenses of the underlying funds in which it invests. Such indirect expenses are not included in the above expense ratios. |
| (d) | The portfolio turnover rate not including mortgage dollar rolls was 96% and 108% for the years ended October 31, 2022 and 2021 respectively. |
The notes to the financial statements are an integral part of, and should be read in conjunction with, the financial statements.
35
Notes to Financial Statements
Note 1-Organization and Business
MainStay Funds Trust (the “Trust”) was organized as a Delaware statutory trust on April 28, 2009. The Trust is registered under the Investment Company Act of 1940, as amended (the “1940 Act”), as an open-end management investment company, and is comprised of thirty-three funds (collectively referred to as the “Funds”). These financial statements and notes relate to the MainStay MacKay Total Return Bond Fund (the "Fund"), a “diversified” fund, as that term is defined in the 1940 Act, as interpreted or modified by regulatory authorities having jurisdiction, from time to time.
The following table lists the Fund's share classes that have been registered and commenced operations:
| Class | Commenced Operations |
| Class A | January 2, 2004 |
| Investor Class | February 28, 2008 |
| Class B | January 2, 2004 |
| Class C | January 2, 2004 |
| Class I | January 2, 1991 |
| Class R1 | June 29, 2012 |
| Class R2 | June 29, 2012 |
| Class R3 | February 29, 2016 |
| Class R6 | December 29, 2014 |
| SIMPLE Class | August 31, 2020 |
Class B shares of the MainStay Group of Funds are closed to all new purchases as well as additional investments by existing Class B shareholders. Existing Class B shareholders may continue to reinvest dividends and capital gains distributions, as well as exchange their Class B shares for Class B shares of other funds in the MainStay Group of Funds as permitted by the current exchange privileges. Class B shareholders continue to be subject to any applicable contingent deferred sales charge ("CDSC") at the time of redemption. All other features of the Class B shares, including but not limited to the fees and expenses applicable to Class B shares, remain unchanged. Unless redeemed, Class B shareholders will remain in Class B shares of their respective fund until the Class B shares are converted to Class A or Investor Class shares pursuant to the applicable conversion schedule.
Class A and Investor Class shares are offered at net asset value (“NAV”) per share plus an initial sales charge. No initial sales charge applies to investments of $1 million or more (and certain other qualified purchases) in Class A and Investor Class shares. However, a CDSC of 1.00% may be imposed on certain redemptions made within 18 months of the date of purchase on shares that were purchased without an initial sales charge. Class C shares are offered at NAV without an initial sales charge, although a 1.00% CDSC may be imposed on certain redemptions of such shares made within one year of the date of purchase of Class C shares. When Class B shares were offered, they were offered at NAV without an initial sales charge, although a CDSC that declines depending on the number of years a shareholder held its Class B shares may be imposed on certain redemptions of such shares made within six years of the date
of purchase of such shares. Class I, Class R1, Class R2, Class R3, Class R6 and SIMPLE Class shares are offered at NAV without a sales charge. Depending upon eligibility, Class B shares convert to either Class A or Investor Class shares at the end of the calendar quarter eight years after the date they were purchased. In addition, depending upon eligibility, Class C shares convert to either Class A or Investor Class shares at the end of the calendar quarter eight years after the date they were purchased. Additionally, Investor Class shares may convert automatically to Class A shares. SIMPLE Class shares convert to Class A shares, or Investor Class shares if you are not eligible to hold Class A shares, at the end of the calendar quarter, ten years after the date they were purchased. Share class conversions are based on the relevant NAVs of the two classes at the time of the conversion, and no sales load or other charge is imposed. Under certain circumstances and as may be permitted by the Trust’s multiple class plan pursuant to Rule 18f-3 under the 1940 Act, specified share classes of the Fund may be converted to one or more other share classes of the Fund as disclosed in the capital share transactions within these Notes. The classes of shares have the same voting (except for issues that relate solely to one class), dividend, liquidation and other rights, and the same terms and conditions, except that under distribution plans pursuant to Rule 12b-1 under the 1940 Act, Class B and Class C shares are subject to higher distribution and/or service fees than Class A, Investor Class, Class R2, Class R3 and SIMPLE Class shares. Class I, Class R1 and Class R6 shares are not subject to a distribution and/or service fee. Class R1, Class R2 and Class R3 shares are subject to a shareholder service fee, which is in addition to fees paid under the distribution plans for Class R2 and Class R3 shares.
The Fund's investment objective is to seek total return.
Note 2–Significant Accounting Policies
The Fund is an investment company and accordingly follows the investment company accounting and reporting guidance of the Financial Accounting Standards Board (“FASB”) Accounting Standards Codification Topic 946 Financial Services—Investment Companies. The Fund prepares its financial statements in accordance with generally accepted accounting principles (“GAAP”) in the United States of America and follows the significant accounting policies described below.
(A) Securities Valuation. Investments are usually valued as of the close of regular trading on the New York Stock Exchange (the "Exchange") (usually 4:00 p.m. Eastern time) on each day the Fund is open for business ("valuation date").
Effective September 8, 2022, and pursuant to Rule 2a-5 under the 1940 Act, the Board of Trustees of the Trust (the "Board") designated New York Life Investment Management LLC (“New York Life Investments” or the "Manager") as its Valuation Designee (the "Valuation Designee"). The Valuation Designee is responsible for performing fair valuations relating to all investments in the Fund’s portfolio for which market quotations are not readily available; periodically assessing and managing material valuation risks; establishing and applying fair value methodologies; testing fair valuation methodologies; evaluating and overseeing pricing services;
| 36 | MainStay MacKay Total Return Bond Fund |
segregation of valuation and portfolio management functions; providing quarterly, annual and prompt reporting to the Board, as appropriate; identifying potential conflicts of interest; and maintaining appropriate records. The Valuation Designee has established a valuation committee ("Valuation Committee") to assist in carrying out the Valuation Designee’s responsibilities and establish prices of securities for which market quotations are not readily available. The Fund’s and the Valuation Designee's policies and procedures ("Valuation Procedures") govern the Valuation Designee’s selection and application of methodologies for determining and calculating the fair value of Fund investments. The Valuation Designee may value Fund portfolio securities for which market quotations are not readily available and other Fund assets utilizing inputs from pricing services and other third-party sources (together, “Pricing Sources”). The Valuation Committee meets (in person, via electronic mail or via teleconference) on an ad-hoc basis to determine fair valuations and on a quarterly basis to review fair value events (excluding fair valuations from pricing services), including valuation risks and back-testing results, and preview reports to the Board.
The Valuation Committee establishes prices of securities for which market quotations are not readily available based on such methodologies and measurements on a regular basis after considering information that is reasonably available and deemed relevant by the Valuation Committee. The Board shall oversee the Valuation Designee and review fair valuation materials on a prompt, quarterly and annual basis and approve proposed revisions to the Valuation Procedures.
Investments for which market quotations are not readily available are valued at fair value as determined in good faith pursuant to the Valuation Procedures. A market quotation is readily available only when that quotation is a quoted price (unadjusted) in active markets for identical investments that the Fund can access at the measurement date, provided that a quotation will not be readily available if it is not reliable. Fair value measurements are determined within a framework that establishes a three-tier hierarchy that maximizes the use of observable market data and minimizes the use of unobservable inputs to establish a classification of fair value measurements for disclosure purposes. "Inputs" refer broadly to the assumptions that market participants would use in pricing the asset or liability, including assumptions about risk, such as the risk inherent in a particular valuation technique used to measure fair value using a pricing model and/or the risk inherent in the inputs for the valuation technique. Inputs may be observable or unobservable. Observable inputs reflect the assumptions market participants would use in pricing the asset or liability based on market data obtained from sources independent of the Fund. Unobservable inputs reflect the Fund’s own assumptions about the assumptions market participants would use in pricing the asset or liability based on the information available. The inputs or methodology used for valuing assets or liabilities may not be an indication of the risks associated with investing in those assets or liabilities. The three-tier hierarchy of inputs is summarized below.
| • | Level 1—quoted prices (unadjusted) in active markets for an identical asset or liability |
| • | Level 2—other significant observable inputs (including quoted prices for a similar asset or liability in active markets, interest rates and yield curves, prepayment speeds, credit risk, etc.) |
| • | Level 3—significant unobservable inputs (including the Fund's own assumptions about the assumptions that market participants would use in measuring fair value of an asset or liability) |
The level of an asset or liability within the fair value hierarchy is based on the lowest level of an input, both individually and in the aggregate, that is significant to the fair value measurement. The aggregate value by input level of the Fund’s assets and liabilities as of October 31, 2022, is included at the end of the Portfolio of Investments.
The Fund may use third-party vendor evaluations, whose prices may be derived from one or more of the following standard inputs, among others:
| • Benchmark yields | • Reported trades |
| • Broker/dealer quotes | • Issuer spreads |
| • Two-sided markets | • Benchmark securities |
| • Bids/offers | • Reference data (corporate actions or material event notices) |
| • Industry and economic events | • Comparable bonds |
| • Monthly payment information | |
An asset or liability for which a market quotation is not readily available is valued by methods deemed reasonable in good faith by the Valuation Committee, following the Valuation Procedures to represent fair value. Under these procedures, the Valuation Designee generally uses a market-based approach which may use related or comparable assets or liabilities, recent transactions, market multiples, book values and other relevant information. The Valuation Designee may also use an income-based valuation approach in which the anticipated future cash flows of the asset or liability are discounted to calculate fair value. Discounts may also be applied due to the nature and/or duration of any restrictions on the disposition of the asset or liability. Fair value represents a good faith approximation of the value of a security. Fair value determinations involve the consideration of a number of subjective factors, an analysis of applicable facts and circumstances and the exercise of judgment. As a result, it is possible that the fair value for a security determined in good faith in accordance with the Valuation Procedures may differ from valuations for the same security determined for other funds using their own valuation procedures. Although the Valuation Procedures are designed to value a security at the price the Fund may reasonably expect to receive upon the security's sale in an orderly transaction, there can be no assurance that any fair value determination thereunder would, in fact, approximate the amount that the Fund would actually realize upon the sale of the security or the price at which the security would trade if a reliable market price were readily available. During the year ended October 31, 2022, there were no material changes to the fair value methodologies.
Securities which may be valued in this manner include, but are not limited to: (i) a security for which trading has been halted or suspended or
Notes to Financial Statements (continued)
otherwise does not have a readily available market quotation on a given day; (ii) a debt security that has recently gone into default and for which there is not a current market quotation; (iii) a security of an issuer that has entered into a restructuring; (iv) a security that has been delisted from a national exchange; (v) a security subject to trading collars for which no or limited trading takes place; and (vi) a security whose principal market has been temporarily closed at a time when, under normal conditions, it would be open. Securities valued in this manner are generally categorized as Level 2 or 3 in the hierarchy.
Equity securities are valued at the last quoted sales prices as of the close of regular trading on the relevant exchange on each valuation date. Securities that are not traded on the valuation date are valued at the mean of the last quoted bid and ask prices. Prices are normally taken from the principal market in which each security trades. These securities are generally categorized as Level 1 in the hierarchy.
Investments in mutual funds, including money market funds, are valued at their respective NAVs at the close of business each day on the valuation date. These securities are generally categorized as Level 1 in the hierarchy.
Futures contracts are valued at the last posted settlement price on the market where such futures are primarily traded. These securities are generally categorized as Level 1 in the hierarchy.
Debt securities (other than convertible and municipal bonds) are valued at the evaluated bid prices (evaluated mean prices in the case of convertible and municipal bonds) supplied by a pricing agent or broker selected by the Valuation Designee, in consultation with the Subadvisor. The evaluations are market-based measurements processed through a pricing application and represents the pricing agent’s good faith determination as to what a holder may receive in an orderly transaction under market conditions. The rules-based logic utilizes valuation techniques that reflect participants’ assumptions and vary by asset class and per methodology, maximizing the use of relevant observable data including quoted prices for similar assets, benchmark yield curves and market corroborated inputs. The evaluated bid or mean prices are deemed by the Valuation Designee, in consultation with the Subadvisor, to be representative of market values at the regular close of trading of the Exchange on each valuation date. Debt securities purchased on a delayed delivery basis are marked to market daily until settlement at the forward settlement date. Debt securities, including corporate bonds, U.S. government and federal agency bonds, municipal bonds, foreign bonds, convertible bonds, asset-backed securities and mortgage-backed securities are generally categorized as Level 2 in the hierarchy.
Loan assignments, participations and commitments are valued at the average of bid quotations obtained from the engaged independent pricing service and are generally categorized as Level 2 in the hierarchy. Certain loan assignments, participations and commitments may be valued by utilizing significant unobservable inputs obtained from the pricing service and are generally categorized as Level 3 in the hierarchy. No securities held by the Fund as of October 31, 2022 were fair valued utilizing significant unobservable inputs obtained from the pricing service.
Temporary cash investments acquired in excess of 60 days to maturity at the time of purchase are valued using the latest bid prices or using valuations based on a matrix system (which considers such factors as security prices, yields, maturities and ratings), both as furnished by independent pricing services. Temporary cash investments that mature in 60 days or less at the time of purchase ("Short-Term Investments") are valued using the amortized cost method of valuation, unless the use of such method would be inappropriate. The amortized cost method involves valuing a security at its cost on the date of purchase and thereafter assuming a constant amortization to maturity of the difference between such cost and the value on maturity date. Amortized cost approximates the current fair value of a security. Securities valued using the amortized cost method are not valued using quoted prices in an active market and are generally categorized as Level 2 in the hierarchy.
The information above is not intended to reflect an exhaustive list of the methodologies that may be used to value portfolio investments. The Valuation Procedures permit the use of a variety of valuation methodologies in connection with valuing portfolio investments. The methodology used for a specific type of investment may vary based on the market data available or other considerations. The methodologies summarized above may not represent the specific means by which portfolio investments are valued on any particular business day.
A portfolio investment may be classified as an illiquid investment under the Trust's written liquidity risk management program and related procedures (“Liquidity Program”). Illiquidity of an investment might prevent the sale of such investment at a time when the Manager or the Subadvisor might wish to sell, and these investments could have the effect of decreasing the overall level of the Fund's liquidity. Further, the lack of an established secondary market may make it more difficult to value illiquid investments, requiring the Fund to rely on judgments that may be somewhat subjective in measuring value, which could vary materially from the amount that the Fund could realize upon disposition. Difficulty in selling illiquid investments may result in a loss or may be costly to the Fund. An illiquid investment is any investment that the Manager or Subadvisor reasonably expects cannot be sold or disposed of in current market conditions in seven calendar days or less without the sale or disposition significantly changing the market value of the investment. The liquidity classification of each investment will be made using information obtained after reasonable inquiry and taking into account, among other things, relevant market, trading and investment-specific considerations in accordance with the Liquidity Program. Illiquid investments are often fair valued in accordance with the Fund's procedures described above. The liquidity of the Fund's investments was determined as of October 31, 2022, and can change at any time. Illiquid investments as of October 31, 2022, are shown in the Portfolio of Investments.
(B) Income Taxes. The Fund's policy is to comply with the requirements of the Internal Revenue Code of 1986, as amended (the “Internal Revenue Code”), applicable to regulated investment companies
| 38 | MainStay MacKay Total Return Bond Fund |
and to distribute all of its taxable income to the shareholders of the Fund within the allowable time limits.
The Manager evaluates the Fund’s tax positions to determine if the tax positions taken meet the minimum recognition threshold in connection with accounting for uncertainties in income tax positions taken or expected to be taken for the purposes of measuring and recognizing tax liabilities in the financial statements. Recognition of tax benefits of an uncertain tax position is permitted only to the extent the position is “more likely than not” to be sustained assuming examination by taxing authorities. The Manager analyzed the Fund's tax positions taken on federal, state and local income tax returns for all open tax years (for up to three tax years) and has concluded that no provisions for federal, state and local income tax are required in the Fund's financial statements. The Fund's federal, state and local income tax and federal excise tax returns for tax years for which the applicable statutes of limitations have not expired are subject to examination by the Internal Revenue Service and state and local departments of revenue.
(C) Dividends and Distributions to Shareholders. Dividends and distributions are recorded on the ex-dividend date. The Fund intends to declare and pay dividends from net investment income, if any, at least monthly and distributions from net realized capital and currency gains, if any, at least annually. Unless a shareholder elects otherwise, all dividends and distributions are reinvested at NAV in the same class of shares of the Fund. Dividends and distributions to shareholders are determined in accordance with federal income tax regulations and may differ from determinations using GAAP.
(D) Security Transactions and Investment Income. The Fund records security transactions on the trade date. Realized gains and losses on security transactions are determined using the identified cost method. Interest income is accrued as earned using the effective interest rate method and includes any realized gains and losses from repayments of principal on mortgage-backed securities. Distributions received from real estate investment trusts may be classified as dividends, capital gains and/or return of capital. Discounts and premiums on securities purchased for the Fund are accreted and amortized, respectively. Income from payment-in-kind securities is accreted daily based on the effective interest method.
Investment income and realized and unrealized gains and losses on investments of the Fund are allocated pro rata to the separate classes of shares based upon their relative net assets on the date the income is earned or realized and unrealized gains and losses are incurred.
The Fund may place a debt security on non-accrual status and reduce related interest income by ceasing current accruals and writing off all or a portion of any interest receivables when the collection of all or a portion of such interest has become doubtful. A debt security is removed from non-accrual status when the issuer resumes interest payments or when collectability of interest is reasonably assured.
(E) Expenses. Expenses of the Trust are allocated to the individual Funds in proportion to the net assets of the respective Funds when the expenses are incurred, except where direct allocations of expenses can be made. Expenses (other than transfer agent expenses and fees incurred under the shareholder services plans and/or the distribution plans further discussed in Note 3(B)) are allocated to separate classes of shares pro rata based upon their relative net assets on the date the expenses are incurred. The expenses borne by the Fund, including those of related parties to the Fund, are shown in the Statement of Operations.
Additionally, the Fund may invest in mutual funds, which are subject to management fees and other fees that may cause the costs of investing in mutual funds to be greater than the costs of owning the underlying securities directly. These indirect expenses of mutual funds are not included in the amounts shown as expenses in the Statement of Operations or in the expense ratios included in the Financial Highlights.
(F) Use of Estimates. In preparing financial statements in conformity with GAAP, the Manager makes estimates and assumptions that affect the reported amounts and disclosures in the financial statements. Actual results could differ from those estimates and assumptions.
(G) Futures Contracts. A futures contract is an agreement to purchase or sell a specified quantity of an underlying instrument at a specified future date and price, or to make or receive a cash payment based on the value of a financial instrument (e.g., foreign currency, interest rate, security or securities index). The Fund is subject to risks such as market price risk, leverage risk, liquidity risk, counterparty risk, operational risk, legal risk and/or interest rate risk in the normal course of investing in these contracts. Upon entering into a futures contract, the Fund is required to pledge to the broker or futures commission merchant an amount of cash and/or U.S. government securities equal to a certain percentage of the collateral amount, known as the “initial margin.” During the period the futures contract is open, changes in the value of the contract are recognized as unrealized appreciation or depreciation by marking to market such contract on a daily basis to reflect the market value of the contract at the end of each day’s trading. The Fund agrees to receive from or pay to the broker or futures commission merchant an amount of cash equal to the daily fluctuation in the value of the contract. Such receipts or payments are known as “variation margin.” When the futures contract is closed, the Fund records a realized gain or loss equal to the difference between the proceeds from (or cost of) the closing transaction and the Fund's basis in the contract.
The use of futures contracts involves, to varying degrees, elements of market risk in excess of the amount recognized in the Statement of Assets and Liabilities. The contract or notional amounts and variation margin reflect the extent of the Fund's involvement in open futures positions. There are several risks associated with the use of futures contracts as hedging techniques. There can be no assurance that a liquid market will exist at the time when the Fund seeks to close out a futures contract. If no liquid market exists, the Fund would remain obligated to meet margin requirements until the position is closed. Futures contracts may involve a small initial investment relative to the risk assumed, which
Notes to Financial Statements (continued)
could result in losses greater than if the Fund did not invest in futures contracts. Futures contracts may be more volatile than direct investments in the instrument underlying the futures and may not correlate to the underlying instrument, causing a given hedge not to achieve its objectives. The Fund's activities in futures contracts have minimal counterparty risk as they are conducted through regulated exchanges that guarantee the futures against default by the counterparty. In the event of a bankruptcy or insolvency of a futures commission merchant that holds margin on behalf of the Fund, the Fund may not be entitled to the return of the entire margin owed to the Fund, potentially resulting in a loss. The Fund may invest in futures contracts to seek enhanced returns or to reduce the risk of loss by hedging certain of its holdings. The Fund's investment in futures contracts and other derivatives may increase the volatility of the Fund's NAVs and may result in a loss to the Fund. Open futures contracts as of October 31, 2022, are shown in the Portfolio of Investments.
(H) Loan Assignments, Participations and Commitments. The Fund may invest in loan assignments and participations ("loans"). Commitments are agreements to make money available to a borrower in a specified amount, at a specified rate and within a specified time. The Fund records an investment when the borrower withdraws money on a commitment or when a funded loan is purchased (trade date) and records interest as earned. These loans pay interest at rates that are periodically reset by reference to a base lending rate plus a spread. These base lending rates are generally the prime rate offered by a designated U.S. bank, the London Interbank Offered Rate ("LIBOR") or an alternative reference rate.
The loans in which the Fund may invest are generally readily marketable, but may be subject to some restrictions on resale. For example, the Fund may be contractually obligated to receive approval from the agent bank and/or borrower prior to the sale of these investments. If the Fund purchases an assignment from a lender, the Fund will generally have direct contractual rights against the borrower in favor of the lender. If the Fund purchases a participation interest either from a lender or a participant, the Fund typically will have established a direct contractual relationship with the seller of the participation interest, but not with the borrower. Consequently, the Fund is subject to the credit risk of the lender or participant who sold the participation interest to the Fund, in addition to the usual credit risk of the borrower. In the event that the borrower, selling participant or intermediate participants become insolvent or enter into bankruptcy, the Fund may incur certain costs and delays in realizing payment, or may suffer a loss of principal and/or interest.
Unfunded commitments represent the remaining obligation of the Fund to the borrower. At any point in time, up to the maturity date of the issue, the borrower may demand the unfunded portion. Unfunded amounts, if any, are marked to market and any unrealized gains or losses are recorded in the Statement of Assets and Liabilities. As of October 31, 2022, the Fund did not hold any unfunded commitments.
(I) Foreign Currency Transactions. The Fund's books and records are maintained in U.S. dollars. Prices of securities denominated in foreign currency amounts are translated into U.S. dollars at the mean between the buying and selling rates last quoted by any major U.S. bank at the following dates:
(i) market value of investment securities, other assets and liabilities— at the valuation date; and
(ii) purchases and sales of investment securities, income and expenses—at the date of such transactions.
The assets and liabilities that are denominated in foreign currency amounts are presented at the exchange rates and market values at the close of the period. The realized and unrealized changes in net assets arising from fluctuations in exchange rates and market prices of securities are not separately presented.
Net realized gain (loss) on foreign currency transactions represents net currency gains or losses realized as a result of differences between the amounts of securities sale proceeds or purchase cost, dividends, interest and withholding taxes as recorded on the Fund's books, and the U.S. dollar equivalent amount actually received or paid. Net currency gains or losses from valuing such foreign currency denominated assets and liabilities, other than investments at valuation date exchange rates, are reflected in unrealized foreign exchange gains or losses.
(J) Securities Lending. In order to realize additional income, the Fund may engage in securities lending, subject to the limitations set forth in the 1940 Act and relevant guidance by the staff of the Securities and Exchange Commission (“SEC”). If the Fund engages in securities lending, the Fund will lend through its custodian, JPMorgan Chase Bank, N.A., ("JPMorgan"), acting as securities lending agent on behalf of the Fund. Under the current arrangement, JPMorgan will manage the Fund's collateral in accordance with the securities lending agency agreement between the Fund and JPMorgan, and indemnify the Fund against counterparty risk. The loans will be collateralized by cash (which may be invested in a money market fund) and/or non-cash collateral (which may include U.S. Treasury securities and/or U.S. government agency securities issued or guaranteed by the United States government or its agencies or instrumentalities) at least equal at all times to the market value of the securities loaned. Non-cash collateral held at year end is segregated and cannot be transferred by the Fund. The Fund bears the risk of delay in recovery of, or loss of rights in, the securities loaned. The Fund may also record a realized gain or loss on securities deemed sold due to a borrower’s inability to return securities on loan. The Fund bears the risk of any loss on investment of cash collateral. The Fund will receive compensation for lending its securities in the form of fees or it will retain a portion of interest earned on the investment of any cash collateral. The Fund will also continue to receive interest and dividends on the securities loaned and any gain or loss in the market price of the securities loaned that may occur during the term of the loan will be for the account of the Fund. Income earned from securities lending activities, if any, is reflected
| 40 | MainStay MacKay Total Return Bond Fund |
in the Statement of Operations. Securities on loan as of October 31, 2022, are shown in the Portfolio of Investments.
(K) Dollar Rolls. The Fund may enter into dollar roll transactions in which it sells mortgage-backed securities ("MBS") from its portfolio to a counterparty from whom it simultaneously agrees to buy a similar security on a delayed delivery basis. The Fund generally transfers MBS where the MBS are "to be announced," therefore, the Fund accounts for these transactions as purchases and sales.
When accounted for as purchase and sales, the securities sold in connection with the dollar rolls are removed from the portfolio and a realized gain or loss is recognized. The securities the Fund has agreed to acquire are included at market value in the Portfolio of Investments and liabilities for such purchase commitments are included as payables for investments purchased. During the roll period, the Fund foregoes principal and interest paid on the securities. The Fund is compensated by the difference between the current sales price and the forward price for the future as well as by the earnings on the cash proceeds of the initial sale. Dollar rolls may be renewed without physical delivery of the securities subject to the contract. Dollar roll transactions involve certain risks, including the risk that the securities returned to the Fund at the end of the roll period, while substantially similar, could be inferior to what was initially sold to the counterparty.
(L) Foreign Securities Risk. The ability of issuers of debt securities held by the Fund to meet their obligations may be affected by, among other things, economic or political developments in a specific country, industry or region. Debt securities are also subject to the risks associated with changes in interest rates. The Fund may invest in foreign securities, which carry certain risks that are in addition to the usual risks inherent in domestic securities. These risks include those resulting from currency fluctuations, future adverse political or economic developments and possible imposition of currency exchange blockages or other foreign governmental laws or restrictions. These risks are likely to be greater in emerging markets than in developed markets. The ability of issuers of debt securities held by the Fund to meet their obligations may be affected by, among other things, economic or political developments in a specific country, industry or region.
(M) LIBOR Replacement Risk. The Fund may invest in certain debt securities, derivatives or other financial instruments that utilize the London Interbank Offered Rate ("LIBOR"), as a “benchmark” or “reference rate” for various interest rate calculations. As of January 1, 2022, the United Kingdom Financial Conduct Authority, which regulates LIBOR, ceased its active encouragement of banks to provide the quotations needed to sustain most LIBOR rates due to the absence of an active market for interbank unsecured lending and other reasons. However, the United Kingdom Financial Conduct Authority, the LIBOR administrator and other regulators announced that certain sterling and yen LIBOR settings would be calculated on a "synthetic" basis through the end of 2022 and the most widely used tenors of U.S. dollar LIBOR will continue until mid-2023. As a result, it is anticipated that the remaining LIBOR settings will be discontinued or will no longer be sufficiently robust to be
representative of its underlying market around that time. Various financial industry groups will plan for that transition and certain regulators and industry groups have taken actions to establish alternative reference rates (e.g., the Secured Overnight Financing Rate, which measures the cost of overnight borrowings through repurchase agreement transactions collateralized with U.S. Treasury securities and is intended to replace U.S. dollar LIBOR with certain adjustments). However, there are challenges to converting certain contracts and transactions to a new benchmark and neither the full effects of the transition process nor its ultimate outcome is known.
The elimination of LIBOR or changes to other reference rates or any other changes or reforms to the determination or supervision of reference rates could have an adverse impact on the market for, or value of, any securities or payments linked to those reference rates, which may adversely affect the Fund's performance and/or net asset value. Uncertainty and risk also remain regarding the willingness and ability of issuers and lenders to include enhanced provisions in new and existing contracts or instruments. Consequently, the transition away from LIBOR to other reference rates may lead to increased volatility and illiquidity in markets that are tied to LIBOR, fluctuations in values of LIBOR-related investments or investments in issuers that utilize LIBOR, increased difficulty in borrowing or refinancing and diminished effectiveness of hedging strategies, adversely affecting the Fund's performance. Furthermore, the risks associated with the expected discontinuation of LIBOR and transition may be exacerbated if the work necessary to effect an orderly transition to an alternative reference rate is not completed in a timely manner. While the transition away from LIBOR has already begun with no material adverse effect to the Fund's performance, the transition is expected to last through mid-2023 for some LIBOR tenors. The usefulness of LIBOR as a benchmark could deteriorate anytime during this transition period.
(N) Large Transaction Risks. From time to time, the Fund may receive large purchase or redemption orders from affiliated or unaffiliated mutual funds or other investors. Such large transactions could have adverse effects on the Fund’s performance if the Fund were required to sell securities or invest cash at times when it otherwise would not do so. This activity could also accelerate the realization of capital gains and increase the Fund’s transaction costs. The Fund has adopted procedures designed to mitigate the negative impacts of such large transactions, but there can be no assurance that these procedures will be effective.
(O) Indemnifications. Under the Trust’s organizational documents, its officers and trustees are indemnified against certain liabilities that may arise out of performance of their duties to the Trust. Additionally, in the normal course of business, the Fund enters into contracts with third-party service providers that contain a variety of representations and warranties and that may provide general indemnifications. The Fund's maximum exposure under these arrangements is unknown, as this would involve future claims that may be made against the Fund that have not yet occurred. The Manager believes that the risk of loss in connection with these potential indemnification obligations is remote. However, there can
Notes to Financial Statements (continued)
be no assurance that material liabilities related to such obligations will not arise in the future, which could adversely impact the Fund.
(P) Quantitative Disclosure of Derivative Holdings. The following tables show additional disclosures related to the Fund's derivative and hedging activities, including how such activities are accounted for and their effect on the Fund's financial positions, performance and cash flows.
The Fund entered into futures contracts to help manage the duration and yield curve positioning of the portfolio while minimizing the exposure to wider bid/ask spreads in traditional bonds. These derivatives are not accounted for as hedging instruments.
Fair value of derivative instruments as of October 31, 2022:
| Asset Derivatives | Interest
Rate
Contracts
Risk | Total |
| Futures Contracts - Net Assets—Net unrealized appreciation on futures contracts (a) | $241,418 | $241,418 |
| Total Fair Value | $241,418 | $241,418 |
| (a) | Includes cumulative appreciation (depreciation) of futures contracts as reported in the Portfolio of Investments. Only current day’s variation margin is reported within the Statement of Assets and Liabilities. |
| Liability Derivatives | Interest
Rate
Contracts
Risk | Total |
| Futures Contracts - Net Assets—Net unrealized depreciation on futures contracts (a) | $(3,604,587) | $(3,604,587) |
| Total Fair Value | $(3,604,587) | $(3,604,587) |
| (a) | Includes cumulative appreciation (depreciation) of futures contracts as reported in the Portfolio of Investments. Only current day’s variation margin is reported within the Statement of Assets and Liabilities. |
The effect of derivative instruments on the Statement of Operations for the year ended October 31, 2022:
| Net Realized Gain (Loss) from: | Interest
Rate
Contracts
Risk | Total |
| Futures Contracts | $(155,261) | $(155,261) |
| Total Net Realized Gain (Loss) | $(155,261) | $(155,261) |
| Net Change in Unrealized Appreciation (Depreciation) | Interest
Rate
Contracts
Risk | Total |
| Futures Contracts | $(4,252,280) | $(4,252,280) |
| Total Net Change in Unrealized Appreciation (Depreciation) | $(4,252,280) | $(4,252,280) |
| Average Notional Amount | Total |
| Futures Contracts Long | $143,744,240 |
| Futures Contracts Short | $ (41,649,566) |
Note 3–Fees and Related Party Transactions
(A) Manager and Subadvisor. New York Life Investments, a registered investment adviser and an indirect, wholly-owned subsidiary of New York Life Insurance Company ("New York Life"), serves as the Fund's Manager, pursuant to an Amended and Restated Management Agreement ("Management Agreement"). The Manager provides offices, conducts clerical, recordkeeping and bookkeeping services and keeps most of the financial and accounting records required to be maintained by the Fund. Except for the portion of salaries and expenses that are the responsibility of the Fund, the Manager pays the salaries and expenses of all personnel affiliated with the Fund and certain operational expenses of the Fund. During a portion of the year ended October 31, 2022, the Fund reimbursed New York Life Investments in an amount equal to the portion of the compensation of the Chief Compliance Officer attributable to the Fund. MacKay Shields LLC ("MacKay Shields" or the "Subadvisor"), a registered investment adviser and an indirect, wholly-owned subsidiary of New York Life, serves as the Subadvisor to the Fund and is responsible for the day-to-day portfolio management of the Fund. Pursuant to the terms of an Amended and Restated Subadvisory Agreement ("Subadvisory Agreement") between New York Life Investments and MacKay Shields, New York Life Investments pays for the services of the Subadvisor.
Effective February 28, 2022, pursuant to the Management Agreement, the Fund pays the Manager a monthly fee for the services performed and the facilities furnished at an annual rate of the Fund’s average daily net assets as follows: 0.45% up to $1 billion; 0.44% from $1 billion to $3 billion; and 0.43% in excess of $3 billion. During the year ended October 31, 2022, the effective management fee rate was 0.47% of the Fund’s average daily net assets, exclusive of any applicable waivers/reimbursements.
Prior to February 28, 2022, the Fund paid the Manager a monthly fee for the services performed and the facilities furnished at an annual rate of the Fund’s average daily net assets as follows: 0.50% up to $ 1 billion; 0.475% from $1 billion to $3 billion; and 0.465% in excess of $3 billion.
Effective February 28, 2022, New York Life Investments has contractually agreed to waive fees and/or reimburse expenses so that Total Annual Fund Operating Expenses (excluding taxes, interest, litigation, extraordinary expenses, brokerage and other transaction expenses relating to the purchase or sale of portfolio investments and acquired (underlying) fund fees and expenses) do not exceed the following percentages of daily net assets: 0.88% for Class A shares and 0.45% for Class I shares. New York Life Investments will apply an equivalent waiver or reimbursement, in an equal number of basis points of the Class A shares waiver/reimbursement to Investor Class shares, Class B shares, Class C shares, Class R1 shares, Class R2 shares, Class R3 shares and
| 42 | MainStay MacKay Total Return Bond Fund |
SIMPLE Class shares. New York Life Investments has also contractually agreed to waive fees and/or reimburse expenses so that Total Annual Fund Operating Expenses (excluding taxes, interest, litigation, extraordinary expenses, brokerage and other transaction expenses relating to the purchase or sale of portfolio investments, and acquired (underlying) fund fees and expenses) of Class R6 do not exceed those of Class I. These agreements will remain in effect until February 28, 2023, and shall renew automatically for one-year terms unless New York Life Investments provides written notice of termination prior to the start of the next term or upon approval of the Board.
Prior to February 28, 2022, New York Life Investments had contractually agreed to waive fees and/or reimburse expenses so that Total Annual Fund Operating Expenses (excluding taxes, interest, litigation, extraordinary expenses, brokerage and other transaction expenses relating to the purchase or sale of portfolio investments and acquired (underlying) fund fees and expenses) did not exceed the following percentages of daily net assets: 0.88% for Class A shares and 0.60% for Class I shares. New York Life Investments applied an equivalent waiver or reimbursement, in an equal number of basis points of the Class A shares waiver/reimbursement to Investor Class shares, Class B shares, Class C shares, Class R1 shares, Class R2 shares, Class R3 shares and SIMPLE Class shares. In addition, prior to February 28, 2022, New York Life Investments agreed to waive fees and/or reimburse expenses so that the Total Annual Fund Operating Expenses (excluding taxes, interest, litigation, extraordinary expenses, brokerage and other transaction expenses relating to the purchase or sale of portfolio investments, and acquired (underlying) fund fees and expenses) for Class R6 shares did not exceed those of Class I.
Additionally, New York Life Investments has agreed to further voluntarily waive fees and/or reimburse expenses of the appropriate class of the Fund so that Total Annual Fund Operating Expenses (excluding taxes, interest, litigation, extraordinary expenses, brokerage and other transaction expenses relating to the purchase and sale of portfolio investments, and acquired (underlying) fund fees and expenses) of Class R1, Class R2 and Class R3 shares of the Fund do not exceed 0.70%, 0.95% and 1.20%, respectively, of the Fund’s average daily net assets. This voluntary waiver or reimbursement may be discontinued at any time without notice.
During the year ended October 31, 2022, New York Life Investments earned fees from the Fund in the amount of $2,900,163 and waived fees and/or reimbursed expenses in the amount of $270,463 and paid the Subadvisor fees in the amount of $1,316,175.
JPMorgan provides sub-administration and sub-accounting services to the Fund pursuant to an agreement with New York Life Investments. These services include calculating the daily NAVs of the Fund, maintaining the general ledger and sub-ledger accounts for the calculation of the Fund's NAVs, and assisting New York Life Investments in conducting various aspects of the Fund's administrative operations. For providing these services to the Fund, JPMorgan is compensated by New York Life Investments.
Pursuant to an agreement between the Trust and New York Life Investments, New York Life Investments is responsible for providing or procuring certain regulatory reporting services for the Fund. The Fund will reimburse New York Life Investments for the actual costs incurred by New York Life Investments in connection with providing or procuring these services for the Fund.
(B) Distribution and Service Fees. The Trust, on behalf of the Fund, has entered into a distribution agreement with NYLIFE Distributors LLC (the “Distributor”), an affiliate of New York Life Investments. The Fund has adopted distribution plans (the “Plans”) in accordance with the provisions of Rule 12b-1 under the 1940 Act.
Pursuant to the Class A, Investor Class and Class R2 Plans, the Distributor receives a monthly fee from the Class A, Investor Class and Class R2 shares at an annual rate of 0.25% of the average daily net assets of the Class A, Investor Class and Class R2 shares for distribution and/or service activities as designated by the Distributor. Pursuant to the Class B and Class C Plans, Class B and Class C shares pay the Distributor a monthly distribution fee at an annual rate of 0.75% of the average daily net assets of the Class B and Class C shares, along with a service fee at an annual rate of 0.25% of the average daily net assets of the Class B and Class C shares, for a total 12b-1 fee of 1.00%. Pursuant to the Class R3 and SIMPLE Class Plans, Class R3 and SIMPLE Class shares pay the Distributor a monthly distribution fee at an annual rate of 0.25% of the average daily net assets of the Class R3 and SIMPLE Class shares, along with a service fee at an annual rate of 0.25% of the average daily net assets of the Class R3 and SIMPLE Class shares, for a total 12b-1 fee of 0.50%. Class I, Class R1 and Class R6 shares are not subject to a distribution and/or service fee.
The Plans provide that the distribution and service fees are payable to the Distributor regardless of the amounts actually expended by the Distributor for distribution of the Fund's shares and service activities.
In accordance with the Shareholder Services Plans for the Class R1, Class R2 and Class R3 shares, the Manager has agreed to provide, through its affiliates or independent third parties, various shareholder and administrative support services to shareholders of the Class R1, Class R2 and Class R3 shares. For its services, the Manager, its affiliates or independent third-party service providers are entitled to a shareholder service fee accrued daily and paid monthly at an annual rate of 0.10% of the average daily net assets of the Class R1, Class R2 and Class R3 shares. This is in addition to any fees paid under the Class R2 and Class R3 Plans.
During the year ended October 31, 2022, shareholder service fees incurred by the Fund were as follows:
| |
| Class R1 | $ 27 |
| Class R2 | 30 |
| Class R3 | 472 |
Notes to Financial Statements (continued)
(C) Sales Charges. The Fund was advised by the Distributor that the amount of initial sales charges retained on sales of Class A and Investor Class shares during the year ended October 31, 2022, were $11,494 and $709, respectively.
The Fund was also advised that the Distributor retained CDSCs on redemptions of Class B and Class C shares during the year ended October 31, 2022, of $101 and $830, respectively.
(D) Transfer, Dividend Disbursing and Shareholder Servicing Agent. NYLIM Service Company LLC, an affiliate of New York Life Investments, is the Fund's transfer, dividend disbursing and shareholder servicing agent pursuant to an agreement between NYLIM Service Company LLC and the Trust. NYLIM Service Company LLC has entered into an agreement with DST Asset Manager Solutions, Inc. ("DST"), pursuant to which DST performs certain transfer agent services on behalf of NYLIM Service Company LLC. New York Life Investments has contractually agreed to limit the transfer agency expenses charged to the Fund’s share classes to a maximum of 0.35% of that share class’s average daily net assets on an annual basis after deducting any applicable Fund or class-level expense reimbursement or small account fees. This agreement will remain in effect until February 28, 2023, and shall renew automatically for one-year terms unless New York Life Investments provides written notice of termination prior to the start of the next term or upon approval of the Board. During the year ended October 31, 2022, transfer agent expenses incurred by the Fund and any reimbursements, pursuant to the aforementioned Transfer Agency expense limitation agreement, were as follows:
| Class | Expense | Waived |
| Class A | $33,362 | $— |
| Investor Class | 17,387 | — |
| Class B | 2,564 | — |
| Class C | 22,091 | — |
| Class I | 77,167 | — |
| Class R1 | 12 | — |
| Class R2 | 14 | — |
| Class R3 | 205 | — |
| Class R6 | 15,292 | — |
| SIMPLE Class | 70 | — |
(E) Small Account Fee. Shareholders with small accounts adversely impact the cost of providing transfer agency services. In an effort to reduce total transfer agency expenses, the Fund has implemented a small account fee on certain types of accounts. As described in the Fund's prospectus, certain shareholders with an account balance of less than $1,000 ($5,000 for Class A share accounts) are charged an annual per account fee of $20 (assessed semi-annually), the proceeds from which offset transfer agent fees as reflected in the Statement of Operations. This small account fee will not apply to certain types of accounts as described further in the Fund’s prospectus.
(F) Capital. As of October 31, 2022, New York Life and its affiliates beneficially held shares of the Fund with the values and percentages of net assets as follows:
| Class I | $357,705 | 0.4% |
| Class R1 | 23,903 | 99.7 |
| Class R2 | 27,086 | 99.7 |
| Class R3 | 25,035 | 5.2 |
| Class R6 | 26,099 | 0.0‡ |
| SIMPLE Class | 20,376 | 99.8 |
| ‡ | Less than one-tenth of a percent. |
Note 4-Federal Income Tax
As of October 31, 2022, the cost and unrealized appreciation (depreciation) of the Fund’s investment portfolio, including applicable derivative contracts and other financial instruments, as determined on a federal income tax basis, were as follows:
| | Federal Tax
Cost | Gross
Unrealized
Appreciation | Gross
Unrealized
(Depreciation) | Net
Unrealized
Appreciation/
(Depreciation) |
| Investments in Securities | $501,814,634 | $925,286 | $(73,054,718) | $(72,129,432) |
As of October 31, 2022, the components of accumulated gain (loss) on a tax basis were as follows:
Ordinary
income | Accumulated
Capital
and Other
Gain (Loss) | Other
Temporary
Differences | Unrealized
Appreciation
(Depreciation) | Total
Accumulated
Gain (Loss) |
| $— | $(27,959,308) | $(14,927) | $(72,224,717) | $(100,198,952) |
The difference between book-basis and tax-basis unrealized appreciation (depreciation) is primarily due to straddle loss deferral, mark to market on futures contracts, wash sale and cumulative bond amortization adjustments. The other temporary differences are primarily due to dividends payable.
As of October 31, 2022, for federal income tax purposes, capital loss carryforwards of $27,956,211, as shown in the table below, were available to the extent provided by the regulations to offset future realized gains of the Fund. Accordingly, no capital gains distributions are expected to be paid to shareholders until net gains have been realized in excess of such amounts.
Capital Loss
Available Through | Short-Term
Capital Loss
Amounts (000’s) | Long-Term
Capital Loss
Amounts (000’s) |
| Unlimited | $20,222 | $7,734 |
| 44 | MainStay MacKay Total Return Bond Fund |
During the years ended October 31, 2022 and October 31, 2021, the tax character of distributions paid as reflected in the Statements of Changes in Net Assets was as follows:
| | 2022 | 2021 |
| Distributions paid from: | | |
| Ordinary Income | $23,740,154 | $53,475,866 |
| Long-Term Capital Gains | 18,805,868 | — |
| Return of Capital | 172,082 | — |
| Total | $42,718,104 | $53,475,866 |
Note 5–Custodian
JPMorgan is the custodian of cash and securities held by the Fund. Custodial fees are charged to the Fund based on the Fund's net assets and/or the market value of securities held by the Fund and the number of certain transactions incurred by the Fund.
Note 6–Line of Credit
The Fund and certain other funds managed by New York Life Investments maintain a line of credit with a syndicate of banks in order to secure a source of funds for temporary purposes to meet unanticipated or excessive redemption requests.
Effective July 26, 2022, under the credit agreement (the “Credit Agreement”), the aggregate commitment amount is $600,000,000 with an additional uncommitted amount of $100,000,000. The commitment fee is an annual rate of 0.15% of the average commitment amount payable quarterly, regardless of usage, to JPMorgan, who serves as the agent to the syndicate. The commitment fee is allocated among the Fund and certain other funds managed by New York Life Investments based upon their respective net assets and other factors. Interest on any revolving credit loan is charged based upon the Federal Funds Rate, Daily Simple Secured Overnight Financing Rate ("SOFR") + 0.10%, or the Overnight Bank Funding Rate, whichever is higher. The Credit Agreement expires on July 25, 2023, although the Fund, certain other funds managed by New York Life Investments and the syndicate of banks may renew the Credit Agreement for an additional year on the same or different terms or enter into a credit agreement with a different syndicate of banks. Prior to July 26, 2022, the aggregate commitment amount and the commitment fee were the same as those under the current Credit Agreement. During the year ended October 31, 2022, there were no borrowings made or outstanding with respect to the Fund under the Credit Agreement.
Note 7–Interfund Lending Program
Pursuant to an exemptive order issued by the SEC, the Fund, along with certain other funds managed by New York Life Investments, may participate in an interfund lending program. The interfund lending program provides an alternative credit facility that permits the Fund and certain other funds managed by New York Life Investments to lend or borrow money for temporary purposes directly to or from one another,
subject to the conditions of the exemptive order. During the year ended October 31, 2022, there were no interfund loans made or outstanding with respect to the Fund.
Note 8–Purchases and Sales of Securities (in 000’s)
During the year ended October 31, 2022, purchases and sales of U.S. government securities were $355,714 and $491,776, respectively. Purchases and sales of securities, other than U.S. government securities and short-term securities, were $247,709 and $909,981, respectively.
Note 9–Capital Share Transactions
Transactions in capital shares for the years ended October 31, 2022 and October 31, 2021, were as follows:
| Class A | Shares | Amount |
| Year ended October 31, 2022: | | |
| Shares sold | 789,544 | $ 8,073,585 |
| Shares issued to shareholders in reinvestment of distributions | 437,720 | 4,500,205 |
| Shares redeemed | (2,750,861) | (27,384,604) |
| Net increase (decrease) in shares outstanding before conversion | (1,523,597) | (14,810,814) |
| Shares converted into Class A (See Note 1) | 33,307 | 341,580 |
| Net increase (decrease) | (1,490,290) | $ (14,469,234) |
| Year ended October 31, 2021: | | |
| Shares sold | 2,260,020 | $ 25,590,021 |
| Shares issued to shareholders in reinvestment of distributions | 263,448 | 2,981,303 |
| Shares redeemed | (3,060,427) | (34,411,605) |
| Net increase (decrease) in shares outstanding before conversion | (536,959) | (5,840,281) |
| Shares converted into Class A (See Note 1) | 194,947 | 2,182,908 |
| Net increase (decrease) | (342,012) | $ (3,657,373) |
| |
Notes to Financial Statements (continued)
| Investor Class | Shares | Amount |
| Year ended October 31, 2022: | | |
| Shares sold | 18,401 | $ 187,043 |
| Shares issued to shareholders in reinvestment of distributions | 34,395 | 355,385 |
| Shares redeemed | (116,449) | (1,174,918) |
| Net increase (decrease) in shares outstanding before conversion | (63,653) | (632,490) |
| Shares converted into Investor Class (See Note 1) | 11,696 | 117,451 |
| Shares converted from Investor Class (See Note 1) | (20,166) | (213,878) |
| Net increase (decrease) | (72,123) | $ (728,917) |
| Year ended October 31, 2021: | | |
| Shares sold | 75,590 | $ 859,257 |
| Shares issued to shareholders in reinvestment of distributions | 19,814 | 225,480 |
| Shares redeemed | (108,873) | (1,235,375) |
| Net increase (decrease) in shares outstanding before conversion | (13,469) | (150,638) |
| Shares converted into Investor Class (See Note 1) | 61,170 | 687,297 |
| Shares converted from Investor Class (See Note 1) | (96,625) | (1,096,170) |
| Net increase (decrease) | (48,924) | $ (559,511) |
| |
| Class B | Shares | Amount |
| Year ended October 31, 2022: | | |
| Shares sold | 215 | $ 2,273 |
| Shares issued to shareholders in reinvestment of distributions | 4,337 | 45,048 |
| Shares redeemed | (21,775) | (214,657) |
| Net increase (decrease) in shares outstanding before conversion | (17,223) | (167,336) |
| Shares converted from Class B (See Note 1) | (9,185) | (91,192) |
| Net increase (decrease) | (26,408) | $ (258,528) |
| Year ended October 31, 2021: | | |
| Shares sold | 11,728 | $ 132,191 |
| Shares issued to shareholders in reinvestment of distributions | 2,964 | 33,697 |
| Shares redeemed | (55,906) | (630,652) |
| Net increase (decrease) in shares outstanding before conversion | (41,214) | (464,764) |
| Shares converted from Class B (See Note 1) | (23,433) | (266,870) |
| Net increase (decrease) | (64,647) | $ (731,634) |
| |
| Class C | Shares | Amount |
| Year ended October 31, 2022: | | |
| Shares sold | 43,235 | $ 437,164 |
| Shares issued to shareholders in reinvestment of distributions | 41,654 | 435,954 |
| Shares redeemed | (476,819) | (4,733,579) |
| Net increase (decrease) in shares outstanding before conversion | (391,930) | (3,860,461) |
| Shares converted from Class C (See Note 1) | (18,813) | (184,493) |
| Net increase (decrease) | (410,743) | $ (4,044,954) |
| Year ended October 31, 2021: | | |
| Shares sold | 148,429 | $ 1,693,193 |
| Shares issued to shareholders in reinvestment of distributions | 33,112 | 377,071 |
| Shares redeemed | (738,618) | (8,285,459) |
| Net increase (decrease) in shares outstanding before conversion | (557,077) | (6,215,195) |
| Shares converted from Class C (See Note 1) | (130,752) | (1,452,114) |
| Net increase (decrease) | (687,829) | $ (7,667,309) |
| |
| Class I | Shares | Amount |
| Year ended October 31, 2022: | | |
| Shares sold | 2,135,672 | $ 21,568,533 |
| Shares issued to shareholders in reinvestment of distributions | 815,917 | 8,370,485 |
| Shares redeemed | (56,387,869) | (623,435,691) |
| Net increase (decrease) in shares outstanding before conversion | (53,436,280) | (593,496,673) |
| Shares converted into Class I (See Note 1) | 3,262 | 30,532 |
| Net increase (decrease) | (53,433,018) | $(593,466,141) |
| Year ended October 31, 2021: | | |
| Shares sold | 12,093,691 | $ 136,796,966 |
| Shares issued to shareholders in reinvestment of distributions | 2,275,535 | 25,746,253 |
| Shares redeemed | (10,428,368) | (118,152,762) |
| Net increase (decrease) | 3,940,858 | $ 44,390,457 |
| |
| Class R1 | Shares | Amount |
| Year ended October 31, 2022: | | |
| Shares issued to shareholders in reinvestment of distributions | 173 | $ 1,758 |
| Net increase (decrease) | 173 | $ 1,758 |
| Year ended October 31, 2021: | | |
| Shares issued to shareholders in reinvestment of distributions | 90 | $ 1,021 |
| Net increase (decrease) | 90 | $ 1,021 |
| |
| 46 | MainStay MacKay Total Return Bond Fund |
| Class R2 | Shares | Amount |
| Year ended October 31, 2022: | | |
| Shares issued to shareholders in reinvestment of distributions | 188 | $ 1,917 |
| Net increase (decrease) | 188 | $ 1,917 |
| Year ended October 31, 2021: | | |
| Shares issued to shareholders in reinvestment of distributions | 104 | $ 1,173 |
| Net increase (decrease) in shares outstanding before conversion | 104 | 1,173 |
| Shares converted from Class R2 (See Note 1) | (4,762) | (55,051) |
| Net increase (decrease) | (4,658) | $ (53,878) |
| |
| Class R3 | Shares | Amount |
| Year ended October 31, 2022: | | |
| Shares sold | 12,519 | $ 120,023 |
| Shares issued to shareholders in reinvestment of distributions | 591 | 6,037 |
| Shares redeemed | (2,289) | (23,247) |
| Net increase (decrease) | 10,821 | $ 102,813 |
| Year ended October 31, 2021: | | |
| Shares sold | 24,213 | $ 274,076 |
| Shares issued to shareholders in reinvestment of distributions | 434 | 4,920 |
| Shares redeemed | (8,055) | (90,866) |
| Net increase (decrease) | 16,592 | $ 188,130 |
| |
| Class R6 | Shares | Amount |
| Year ended October 31, 2022: | | |
| Shares sold | 3,239,611 | $ 29,773,647 |
| Shares issued to shareholders in reinvestment of distributions | 2,775,072 | 28,667,785 |
| Shares redeemed | (22,728,520) | (226,813,465) |
| Net increase (decrease) | (16,713,837) | $(168,372,033) |
| Year ended October 31, 2021: | | |
| Shares sold | 7,210,759 | $ 81,493,799 |
| Shares issued to shareholders in reinvestment of distributions | 2,110,987 | 23,894,507 |
| Shares redeemed | (23,956,446) | (270,603,492) |
| Net increase (decrease) | (14,634,700) | $(165,215,186) |
| |
| SIMPLE Class | Shares | Amount |
| Year ended October 31, 2022: | | |
| Shares issued to shareholders in reinvestment of distributions | 130 | $ 1,342 |
| Net increase (decrease) | 130 | $ 1,342 |
| Year ended October 31, 2021: | | |
| Shares issued to shareholders in reinvestment of distributions | 63 | $ 723 |
| Net increase (decrease) | 63 | $ 723 |
Note 10–Other Matters
As of the date of this report, interest rates in the United States and many parts of the world, including certain European countries, are ascending from historically low levels. Thus, the Fund currently faces a heightened level of risk associated with rising interest rates. This could be driven by a variety of factors, including but not limited to central bank monetary policies, changing inflation or real growth rates, general economic conditions, increasing bond issuances or reduced market demand for low yielding investments.
An outbreak of COVID-19, first detected in December 2019, has developed into a global pandemic and has resulted in travel restrictions, closure of international borders, certain businesses and securities markets, restrictions on securities trading activities, prolonged quarantines, supply chain disruptions, and lower consumer demand, as well as general concern and uncertainty. In 2022, many countries lifted some or all restrictions related to COVID-19. However, the continued impact of COVID-19 and related variants is uncertain and could further adversely affect the global economy, national economies, individual issuers and capital markets in unforeseeable ways and result in a substantial and extended economic downturn. Developments that disrupt global economies and financial markets, such as COVID-19, may magnify factors that affect the Fund's performance.
Note 11–Subsequent Events
In connection with the preparation of the financial statements of the Fund as of and for the year ended October 31, 2022, events and transactions subsequent to October 31, 2022, through the date the financial statements were issued have been evaluated by the Manager for possible adjustment and/or disclosure. No subsequent events requiring financial statement adjustment or disclosure have been identified.
Report of Independent Registered Public Accounting Firm
To the Shareholders of the Fund and Board of Trustees
MainStay Funds Trust:
Opinion on the Financial Statements
We have audited the accompanying statement of assets and liabilities of MainStay MacKay Total Return Bond Fund (the Fund), one of the funds constituting MainStay Funds Trust, including the portfolio of investments, as of October 31, 2022, the related statement of operations for the year then ended, the statements of changes in net assets for each of the years in the two-year period then ended, and the related notes (collectively, the financial statements) and the financial highlights for each of the years or periods in the five-year period then ended. In our opinion, the financial statements and financial highlights present fairly, in all material respects, the financial position of the Fund as of October 31, 2022, the results of its operations for the year then ended, the changes in its net assets for each of the years in the two-year period then ended, and the financial highlights for each of the years or periods in the five-year period then ended, in conformity with U.S. generally accepted accounting principles.
Basis for Opinion
These financial statements and financial highlights are the responsibility of the Fund's management. Our responsibility is to express an opinion on these financial statements and financial highlights based on our audits. We are a public accounting firm registered with the Public Company Accounting Oversight Board (United States) (PCAOB) and are required to be independent with respect to the Fund in accordance with the U.S. federal securities laws and the applicable rules and regulations of the Securities and Exchange Commission and the PCAOB.
We conducted our audits in accordance with the standards of the PCAOB. Those standards require that we plan and perform the audit to obtain reasonable assurance about whether the financial statements and financial highlights are free of material misstatement, whether due to error or fraud. Our audits included performing procedures to assess the risks of material misstatement of the financial statements and financial highlights, whether due to error or fraud, and performing procedures that respond to those risks. Such procedures included examining, on a test basis, evidence regarding the amounts and disclosures in the financial statements and financial highlights. Such procedures also included confirmation of securities owned as of October 31, 2022, by correspondence with custodians, the transfer agent, agent banks and brokers; when replies were not received from agent banks and brokers, we performed other auditing procedures. Our audits also included evaluating the accounting principles used and significant estimates made by management, as well as evaluating the overall presentation of the financial statements and financial highlights. We believe that our audits provide a reasonable basis for our opinion.

We have served as the auditor of one or more New York Life Investment Management investment companies since 2003.
Philadelphia, Pennsylvania
December 23, 2022
| 48 | MainStay MacKay Total Return Bond Fund |
Federal Income Tax Information
(Unaudited)
The Fund is required under the Internal Revenue Code to advise shareholders in a written statement as to the federal tax status of dividends paid by the Fund during such fiscal years. Accordingly, the Fund paid $18,806,210 as long term capital gain distributions.
In February 2023, shareholders will receive an IRS Form 1099-DIV or substitute Form 1099, which will show the federal tax status of the distributions received by shareholders in calendar year 2022. The amounts that will be reported on such 1099-DIV or substitute Form 1099 will be the amounts you are to use on your federal income tax return and will differ from the amounts which we must report for the Fund's fiscal year ended October 31, 2022.
Proxy Voting Policies and Procedures and Proxy Voting Record
The Fund is required to file with the SEC its proxy voting record for the 12-month period ending June 30 on Form N-PX. A description of the policies and procedures that are used to vote proxies relating to portfolio securities of the Fund is available free of charge upon request by calling 800-624-6782 or visiting the SEC’s website at www.sec.gov. The most recent Form N-PX or proxy voting record is available free of charge upon request by calling 800-624-6782; visiting newyorklifeinvestments.com; or visiting the SEC’s website at www.sec.gov.
Shareholder Reports and Quarterly Portfolio Disclosure
The Fund is required to file its complete schedule of portfolio holdings with the SEC 60 days after its first and third fiscal quarter on Form N-PORT. The Fund's holdings report is available free of charge upon request by calling New York Life Investments at 800-624-6782.
Board of Trustees and Officers (Unaudited)
The Trustees and officers of the Fund are listed below. The Board oversees the MainStay Group of Funds (which consists of MainStay Funds and MainStay Funds Trust), MainStay VP Funds Trust, MainStay MacKay DefinedTerm Municipal Opportunities Fund, MainStay CBRE Global Infrastructure Megatrends Fund, the Manager and the Subadvisors, and elects the officers of the Funds who are responsible for the day-to-day operations of the Fund. Information pertaining to the Trustees and officers is set forth below. Each Trustee serves until his or her successor is
elected and qualified or until his or her resignation, death or removal. Under the Board’s retirement policy, unless an exception is made, a Trustee must tender his or her resignation by the end of the calendar year during which he or she reaches the age of 75. The business address of each Trustee and officer listed below is 51 Madison Avenue, New York, New York 10010. None of the Trustees are “interested persons” (as defined by the 1940 Act and rules adopted by the SEC thereunder) of the Fund (“Independent Trustees”).
| | Name and
Year of Birth | Term of Office,
Position(s) Held and
Length of Service | Principal Occupation(s)
During Past Five Years | Number of
Portfolios in
Fund Complex
Overseen by
Trustee | Other Directorships
Held by Trustee |
| | | | | | |
| | David H. Chow
1957 | MainStay Funds: Trustee since 2016, Advisory Board Member (June 2015 to December 2015);MainStay Funds Trust:
Trustee since January 2016, Advisory Board Member (June 2015 to December 2015) | Founder and CEO, DanCourt Management, LLC since 1999 | 78 | MainStay VP Funds Trust: Trustee since January 2016, Advisory Board Member (June 2015 to December 2015) (31 portfolios);
MainStay MacKay DefinedTerm Municipal Opportunities Fund: Trustee since January 2016, Advisory Board Member (June 2015 to December 2015);
MainStay CBRE Global Infrastructure Megatrends Fund: Trustee since June 2021; VanEck Vectors Group of Exchange-Traded Funds: Independent Chairman of the Board of Trustees since 2008 and Trustee since 2006 (56 portfolios); and Berea College of Kentucky: Trustee since 2009, Chair of the Investment Committee since 2018 |
| | Susan B. Kerley
1951 | MainStay Funds: Chairman since 2017 and Trustee since 2007;MainStay Funds Trust:
Chairman since 2017 and Trustee since 1990** | President, Strategic Management Advisors LLC since 1990 | 78 | MainStay VP Funds Trust: Chairman since January 2017 and Trustee since 2007 (31 portfolios)**;
MainStay MacKay DefinedTerm Municipal Opportunities Fund: Chairman since 2017 and Trustee since 2011;
MainStay CBRE Global Infrastructure Megatrends Fund: Trustee since June 2021; and Legg Mason Partners Funds: Trustee since 1991 (45 portfolios) |
| | Alan R. Latshaw
1951 | MainStay Funds: Trustee since 2006;MainStay Funds Trust:
Trustee since 2007*** | Retired; Partner, Ernst & Young LLP (2002 to 2003); Partner, Arthur Andersen LLP (1989 to 2002); Consultant to the MainStay Funds Audit and Compliance Committee (2004 to 2006) | 78 | MainStay VP Funds Trust: Trustee since 2007 (31 portfolios)**;
MainStay MacKay DefinedTerm Municipal Opportunities Fund: Trustee since 2011; and
MainStay CBRE Global Infrastructure Megatrends Fund: Trustee since June 2021 |
| 50 | MainStay MacKay Total Return Bond Fund |
| | Name and
Year of Birth | Term of Office,
Position(s) Held and
Length of Service | Principal Occupation(s)
During Past Five Years | Number of
Portfolios in
Fund Complex
Overseen by
Trustee | Other Directorships
Held by Trustee |
| | | | | | |
| | Karen Hammond
1956 | MainStay Funds: Trustee since December 2021, Advisory Board Member (June 2021 to December 2021);MainStay Funds Trust:
Trustee since December 2021, Advisory Board Member (June 2021 to December 2021)
| Retired, Managing Director, Devonshire Investors (2007 to 2013); Senior Vice President, Fidelity Management & Research Co. (2005 to 2007); Senior Vice President and Corporate Treasurer, FMR Corp. (2003 to 2005); Chief Operating Officer, Fidelity Investments Japan (2001 to 2003) | 78 | MainStay VP Funds Trust: Trustee since December 2021, Advisory Board Member (June 2021 to December 2021) (31 Portfolios);
MainStay MacKay DefinedTerm Municipal Opportunities Fund: Trustee since December 2021, Advisory Board Member (June 2021 to December 2021);
MainStay CBRE Global Infrastructure Megatrends Fund: Trustee since December 2021, Advisory Board Member (June 2021 to December 2021);
Two Harbors Investment Corp.: Director since 2018;
Rhode Island State Investment Commission: Member since 2017; and
Blue Cross Blue Shield of Rhode Island: Director since 2019 |
| | Jacques P. Perold
1958 | MainStay Funds: Trustee since 2016, Advisory Board Member (June 2015 toDecember 2015);MainStay Funds Trust:
Trustee since January 2016, Advisory Board Member (June 2015 to December 2015) | Founder and Chief Executive Officer, CapShift Advisors LLC (since 2018); President, Fidelity Management & Research Company (2009 to 2014); President and Chief Investment Officer, Geode Capital Management, LLC (2001 to 2009) | 78 | MainStay VP Funds Trust: Trustee since January 2016, Advisory Board Member (June 2015 to December 2015) (31 portfolios);
MainStay MacKay DefinedTerm Municipal Opportunities Fund: Trustee since January 2016, Advisory Board Member (June 2015 to December 2015);
MainStay CBRE Global Infrastructure Megatrends Fund: Trustee since June 2021; Partners in Health: Trustee since 2019; Allstate Corporation: Director since 2015; and MSCI Inc.: Director since 2017 |
| | Richard S. Trutanic
1952 | MainStay Funds: Trustee since 1994;MainStay Funds Trust:
Trustee since 2007*** | Chairman and Chief Executive Officer, Somerset & Company (financial advisory firm) since 2004; Managing Director, The Carlyle Group (private investment firm) (2002 to 2004); Senior Managing Director, Partner and Board Member, Groupe Arnault S.A. (private investment firm) (1999 to 2002) | 78 | MainStay VP Funds Trust: Trustee since 2007 (31 portfolios)**;
MainStay MacKay DefinedTerm Municipal Opportunities Fund: Trustee since 2011; and MainStay CBRE Global Infrastructure Megatrends Fund: Trustee since June 2021 |
| ** | Includes prior service as a Director of MainStay VP Series Fund, Inc., the predecessor to MainStay VP Funds Trust. |
| *** | Includes prior service as a Director/Trustee of certain predecessor entities to MainStay Funds Trust. |
Board of Trustees and Officers (Unaudited) (continued)
| | Name and
Year of Birth | Position(s) Held and
Length of Service | Principal Occupation(s)
During Past Five Years | |
| | | | | |
| | Kirk C. Lehneis
1974 | President, MainStay Funds, MainStay Funds Trust since 2017 | Chief Operating Officer and Senior Managing Director (since 2016), New York Life Investment Management LLC and New York Life Investment Management Holdings LLC; Member of the Board of Managers (since 2017) and Senior Managing Director (since 2018), NYLIFE Distributors LLC; Chairman of the Board and Senior Managing Director, NYLIM Service Company LLC (since 2017); Trustee, President and Principal Executive Officer of IndexIQ Trust, IndexIQ ETF Trust and IndexIQ Active ETF Trust (since January 2018); President, MainStay CBRE Global Infrastructure Megatrends Fund (since 2021), MainStay MacKay DefinedTerm Municipal Opportunities Fund and MainStay VP Funds Trust (since 2017); Senior Managing Director, Global Product Development (From 2015-2016); Managing Director, Product Development (2010 to 2015), New York Life Investment Management LLC | |
| | Jack R. Benintende
1964 | Treasurer and Principal Financial and Accounting Officer, MainStay Funds (since 2007), MainStay Funds Trust (since 2009) | Managing Director, New York Life Investment Management LLC (since 2007); Treasurer and Principal Financial and Accounting Officer, MainStay CBRE Global Infrastructure Megatrends Fund (since 2021), MainStay MacKay DefinedTerm Municipal Opportunities Fund (since 2011) and MainStay VP Funds Trust (since 2007)** and Assistant Treasurer, New York Life Investment Management Holdings LLC (2008 to 2012) | |
| | J. Kevin Gao
1967 | Secretary and Chief Legal Officer, MainStay Funds and MainStay Funds Trust (since 2010) | Managing Director and Associate General Counsel, New York Life Investment Management LLC (since 2010); Secretary and Chief Legal Officer and MainStay CBRE Global Infrastructure Megatrends Fund (since 2021), MainStay MacKay DefinedTerm Municipal Opportunities Fund (since 2011) and MainStay VP Funds Trust (since 2010)** | |
| | Scott T. Harrington
1959 | Vice President— Administration, MainStay Funds (since 2009), MainStay Funds Trust (since 2009) | Managing Director, New York Life Investment Management LLC (including predecessor advisory organizations) (since 2000); Member of the Board of Directors, New York Life Trust Company (since 2009); Vice President—Administration, MainStay CBRE Global Infrastructure Megatrends Fund (since 2021), MainStay MacKay DefinedTerm Municipal Opportunities Fund (since 2011) and MainStay VP Funds Trust (since 2005)** | |
| | Kevin M. Gleason
1967 | Vice President and Chief Compliance Officer, MainStay Funds and MainStay Funds Trust (since June 2022) | Vice President and Chief Compliance Officer, IndexIQ, IndexIQ ETF Trust and Index IQ Active ETF Trust (since June 2022); Vice President and Chief Compliance Officer, MainStay CBRE Global Infrastructure Megatrends Fund, MainStay VP Funds Trust and MainStay MacKay DefinedTerm Municipal Opportunities Fund (since June 2022); Senior Vice President, Voya Investment Management and Chief Compliance Officer, Voya Family of Funds (2012-2022) | |
| * | The officers listed above are considered to be “interested persons” of the MainStay Group of Funds, MainStay VP Funds Trust, MainStay CBRE Global Infrastructure Megatrends Fund and MainStay MacKay DefinedTerm Municipal Opportunities Fund within the meaning of the 1940 Act because of their affiliation with the MainStay Group of Funds, New York Life Insurance Company and/or its affiliates, including New York Life Investment Management LLC, NYLIM Service Company LLC, NYLIFE Securities LLC and/or NYLIFE Distributors LLC, as described in detail in the column captioned “Principal Occupation(s) During Past Five Years.” Officers are elected annually by the Board. |
| ** | Includes prior service as an Officer of MainStay VP Series Fund, Inc., the predecessor to MainStay VP Funds Trust. |
Officers of the Trust (Who are not Trustees)*
| 52 | MainStay MacKay Total Return Bond Fund |
This page intentionally left blank.
This page intentionally left blank.
Equity
U.S. Equity
MainStay Epoch U.S. Equity Yield Fund
MainStay S&P 500 Index Fund1
MainStay Winslow Large Cap Growth Fund
MainStay WMC Enduring Capital Fund
MainStay WMC Growth Fund
MainStay WMC Small Companies Fund
MainStay WMC Value Fund
International Equity
MainStay Epoch International Choice Fund
MainStay MacKay International Equity Fund
MainStay WMC International Research Equity Fund
Emerging Markets Equity
MainStay Candriam Emerging Markets Equity Fund
Global Equity
MainStay Epoch Capital Growth Fund
MainStay Epoch Global Equity Yield Fund
Fixed Income
Taxable Income
MainStay Candriam Emerging Markets Debt Fund
MainStay Floating Rate Fund
MainStay MacKay High Yield Corporate Bond Fund
MainStay MacKay Short Duration High Yield Fund
MainStay MacKay Strategic Bond Fund
MainStay MacKay Total Return Bond Fund
MainStay MacKay U.S. Infrastructure Bond Fund
MainStay Short Term Bond Fund
Tax-Exempt Income
MainStay MacKay California Tax Free Opportunities Fund2
MainStay MacKay High Yield Municipal Bond Fund
MainStay MacKay New York Tax Free Opportunities Fund3
MainStay MacKay Short Term Municipal Fund
MainStay MacKay Strategic Municipal Allocation Fund
MainStay MacKay Tax Free Bond Fund
Money Market
MainStay Money Market Fund
Mixed Asset
MainStay Balanced Fund
MainStay Income Builder Fund
MainStay MacKay Convertible Fund
Speciality
MainStay CBRE Global Infrastructure Fund
MainStay CBRE Real Estate Fund
MainStay Cushing MLP Premier Fund
Asset Allocation
MainStay Conservative Allocation Fund
MainStay Conservative ETF Allocation Fund
MainStay Defensive ETF Allocation Fund
MainStay Equity Allocation Fund
MainStay Equity ETF Allocation Fund
MainStay ESG Multi-Asset Allocation Fund
MainStay Growth Allocation Fund
MainStay Growth ETF Allocation Fund
MainStay Moderate Allocation Fund
MainStay Moderate ETF Allocation Fund
Manager
New York Life Investment Management LLC
New York, New York
Subadvisors
Candriam4
Strassen, Luxembourg
CBRE Investment Management Listed Real Assets LLC
Radnor, Pennsylvania
Cushing Asset Management, LP
Dallas, Texas
Epoch Investment Partners, Inc.
New York, New York
MacKay Shields LLC4
New York, New York
NYL Investors LLC4
New York, New York
Wellington Management Company LLP
Boston, Massachusetts
Winslow Capital Management, LLC
Minneapolis, Minnesota
Legal Counsel
Dechert LLP
Washington, District of Columbia
Independent Registered Public Accounting Firm
KPMG LLP
Philadelphia, Pennsylvania
Distributor
NYLIFE Distributors LLC4
Jersey City, New Jersey
Custodian
JPMorgan Chase Bank, N.A.
New York, New York
1.
Prior to February 28, 2022, the Fund's name was MainStay MacKay S&P 500 Index Fund.
| 2. | This Fund is registered for sale in AZ, CA, NV, OR, TX, UT, WA and MI (Class A and Class I shares only), and CO, FL, GA, HI, ID, MA, MD, NH, NJ and NY (Class I shares only). |
| 3. | This Fund is registered for sale in CA, CT, DE, FL, MA, NJ, NY and VT. |
| 4. | An affiliate of New York Life Investment Management LLC. |
Not part of the Annual Report
For more information
800-624-6782
newyorklifeinvestments.com
“New York Life Investments” is both a service mark, and the common trade name, of certain investment advisors affiliated with New York Life Insurance Company. The MainStay Funds® are managed by New York Life Investment Management LLC and distributed by NYLIFE Distributors LLC, 30 Hudson Street, Jersey City, NJ 07302, a wholly owned subsidiary of New York Life Insurance Company. NYLIFE Distributors LLC is a Member FINRA/SIPC.
©2022 NYLIFE Distributors LLC. All rights reserved.
| 5013953.2MS229-22 | MSTRB11-12/22 |
(NYLIM) NL229
MainStay Short Term Bond Fund
Message from the President and Annual Report
October 31, 2022
Sign up for e-delivery of your shareholder reports. For full details on e-delivery, including who can participate and what you can receive via e-delivery,
please log in to newyorklifeinvestments.com/accounts.
| Not FDIC/NCUA Insured | Not a Deposit | May Lose Value | No Bank Guarantee | Not Insured by Any Government Agency |
This page intentionally left blank
Message from the President
A series of economic and geopolitical challenges undermined equity and fixed-income markets during the 12-month reporting period ended October 31, 2022. Stocks and bonds alike trended lower in the face of sharply rising interest rates, increasing inflationary pressures, slowing economic growth and Russia’s invasion of Ukraine.
The reporting period began on a mixed note, with concerns about the spreading Omicron variant of the COVID-19 virus and increasingly hawkish statements from the U.S. Federal Reserve (the “Fed”) regarding mounting inflation, countered by bullish sentiment stemming from U.S. economic growth and strong corporate earnings. In January 2022, markets turned decisively negative as comments from the Fed raised the likelihood of rate hikes as early as March, and Russia issued increasingly aggressive threats toward Ukraine. The onset of Russia’s invasion in February exacerbated global inflationary pressures while increasing investor uncertainty. Domestic supply shortages, international trade imbalances and rising inflation caused GDP (gross domestic product) to contract in the first and second quarters of the year, although employment and consumer spending proved resilient. Prices for petroleum surged to multi-year highs, while many key agricultural chemicals and industrial metals climbed as well. Accelerating inflationary forces prompted the Fed to implement its most aggressive interest rate increases since the 1980s with a series of five sharp rate hikes, raising the federal funds rate from a range of 0.00% to 0.25% in March to 3.00% to 3.25% in September, with additional rate hikes expected before the end of the year. International central banks generally followed suit, raising rates by varying degrees in efforts to curb local inflation, although most increases remained significantly more modest than those in the United States. Relatively high U.S. interest rates and risk-averse international sentiment pushed U.S. dollar values higher compared to most other currencies, with the ensuing negative impact on global prices for food, fuel and other key, U.S.-dollar-denominated products.
The effects of these interrelated challenges were felt throughout U.S. and international financial markets. The S&P 500® Index, a widely regarded benchmark of U.S. market performance, declined by more than 14% during the reporting period. Although the energy sector generated strong gains, bolstered by elevated oil and gas prices, most other industry areas recorded losses. The more cyclical and growth-oriented sectors of consumer discretionary, real estate and information technology delivered the
weakest returns, while the traditionally defensive and value-oriented consumer staples, utilities and health care sectors outperformed. International stocks lagged compared to their U.S. counterparts, with some emerging markets, such as China, suffering particularly steep losses. A few markets, however, including Brazil, Mexico and the United Arab Emirates, ended the reporting period with little change. Fixed-income markets saw bond prices broadly decline as yields rose along with interest rates. Short-term yields rose faster than long-term yields, producing a yield curve inversion from July through the end of the reporting period, with long-term rates remaining below short-term rates. While floating-rate instruments, which feature variable interest rates that allow investors to benefit from a rising rate environment, provided a degree of insulation from inflation-driven trends, they were not immune to the market’s widespread declines.
While the Fed acknowledges the costs of rising rates in terms of weaker GDP growth and unsettled financial markets over the short term, its primary focus continues to be the longer-term economic impact of inflation. With the latest figures as of the date of this report showing that inflation remains above 8%, versus a target rate of just 2%, the Fed clearly has a distance yet to go, making further rate increases and market volatility more likely in the coming months. The question remains as to whether the Fed and other central banks will manage a so-called “soft landing,” curbing inflation while avoiding a persistent economic slowdown. If they prove successful, we expect that favorable inflation trends and increasingly attractive valuations in both equity and bond markets should eventually translate into sustainable improvements in the investment environment.
Whatever actions the Fed takes and however financial markets react, as a MainStay investor, you can depend on us to continue providing the insight, expertise and service that have long defined New York Life Investments. Thank you for trusting us to help you meet your investment needs.
Sincerely,
Kirk C. Lehneis
President
The opinions expressed are as of the date of this report and are subject to change. There is no guarantee that any forecast made will come to pass. This material does not constitute investment advice and is not intended as an endorsement of any specific investment. Past performance is no guarantee of future results.
Not part of the Annual Report
Investors should refer to the Fund’s Summary Prospectus and/or Prospectus and consider the Fund’s investment objectives, strategies, risks, charges and expenses carefully before investing. The Summary Prospectus and/or Prospectus contain this and other information about the Fund. You may obtain copies of the Fund’s Summary Prospectus, Prospectus and Statement of Additional Information, which includes information about the MainStay Funds Trust's Trustees, free of charge, upon request, by calling toll-free 800-624-6782, by writing to NYLIFE Distributors LLC, Attn: MainStay Marketing Department, 30 Hudson Street, Jersey City, NJ 07302 or by sending an e-mail to MainStayShareholderServices@nylim.com. These documents are also available via the MainStay Funds’ website at newyorklifeinvestments.com. Please read the Fund’s Summary Prospectus and/or Prospectus carefully before investing.
Investment and Performance Comparison (Unaudited)
Performance data quoted represents past performance. Past performance is no guarantee of future results. Because of market volatility and other factors, current performance may be lower or higher than the figures shown. Investment return and principal value will fluctuate, and as a result, when shares are redeemed, they may be worth more or less than their original cost. The graph below depicts the historical performance of Class I shares of the Fund. Performance will vary from class to class based on differences in class-specific expenses and sales charges. For performance information current to the most recent month-end, please call 800-624-6782 or visit newyorklifeinvestments.com.
The performance table and graph do not reflect the deduction of taxes that a shareholder would pay on distributions or Fund share redemptions. Total returns reflect maximum applicable sales charges as indicated in the table below, if any, changes in share price, and reinvestment of dividend and capital gain distributions. The graph assumes the initial investment amount shown below and reflects the deduction of all sales charges that would have applied for the period of investment. Performance figures may reflect certain fee waivers and/or expense limitations, without which total returns may have been lower. For more information on share classes and current fee waivers and/or expense limitations (if any), please refer to the Notes to Financial Statements.

| Average Annual Total Returns for the Year-Ended October 31, 2022 |
| Class | Sales Charge | | Inception
Date | One
Year | Five
Years | Ten Years
or Since
Inception | Gross
Expense
Ratio1 |
| Class A Shares2 | Maximum 1.0% Initial Sales Charge | With sales charges | 1/2/2004 | -7.02% | 0.12% | 0.73% | 0.77% |
| | | Excluding sales charges | | -6.08 | 0.73 | 1.03 | 0.77 |
| Investor Class Shares2, 3 | Maximum 0.5% Initial Sales Charge | With sales charges | 2/28/2008 | -6.75 | -0.09 | 0.52 | 1.29 |
| | | Excluding sales charges | | -6.28 | 0.52 | 0.83 | 1.29 |
| Class I Shares | No Sales Charge | | 1/2/1991 | -5.74 | 1.04 | 1.36 | 0.52 |
| SIMPLE Class Shares | No Sales Charge | | 8/31/2020 | -6.49 | N/A | -3.05 | 1.54 |
| 1. | The gross expense ratios presented reflect the Fund’s “Total Annual Fund Operating Expenses” from the most recent Prospectus, as supplemented, and may differ from other expense ratios disclosed in this report. |
| 2. | Prior to February 28, 2020, the maximum initial sales charge applicable was 3.0%, which is reflected in the average annual total return figures shown. |
| 3. | Prior to June 30, 2020, the maximum initial sales charge was 1.0%, which is reflected in the average annual total return figures shown. |
The footnotes on the next page are an integral part of the table and graph and should be carefully read in conjunction with them.
| Benchmark Performance* | One
Year | Five
Years | Ten
Years |
| Bloomberg 1-3 Year U.S. Government/Credit Bond Index1 | -4.88% | 0.68% | 0.79% |
| Morningstar U.S. Fund Short-Term Bond Category Average2 | -6.81 | 0.42 | 0.78 |
| * | Returns for indices reflect no deductions for fees, expenses or taxes, except for foreign withholding taxes where applicable. Results assume reinvestment of all dividends and capital gains. An investment cannot be made directly in an index. |
| 1. | The Bloomberg 1-3 Year U.S. Government/Credit Bond Index is the Fund's primary broad-based securities market index for comparison purposes. The Bloomberg 1-3 Year U.S. Government/Credit Bond Index is an unmanaged index comprised of investment grade, U.S. dollar denominated, fixed-rate Treasurys, government-related and corporate securities, with maturities of one to three years. Results assume reinvestment of all income. |
| 2. | The Morningstar U.S. Fund Short-Term Bond Category Average is representative of funds that invest primarily in corporate and other investment-grade U.S. fixed-income issues and typically have durations of 1.0 to 3.5 years. These portfolios are attractive to fairly conservative investors, because they are less sensitive to interest rates than portfolios with longer durations. Morningstar calculates monthly breakpoints using the effective duration of the Morningstar Core Bond Index in determining duration assignment. Short-term is defined as 25% to 75% of the three-year average effective duration of the MCBI. Results are based on average total returns of similar funds with all dividends and capital gain distributions reinvested. |
The footnotes on the preceding page are an integral part of the table and graph and should be carefully read in conjunction with them.
| 6 | MainStay Short Term Bond Fund |
Cost in Dollars of a $1,000 Investment in MainStay Short Term Bond Fund (Unaudited)
The example below is intended to describe the fees and expenses borne by shareholders during the six-month period from May 1, 2022 to October 31, 2022, and the impact of those costs on your investment.
Example
As a shareholder of the Fund you incur two types of costs: (1) transaction costs, including exchange fees and sales charges (loads) on purchases (as applicable), and (2) ongoing costs, including management fees, distribution and/or service (12b-1) fees and other Fund expenses (as applicable). This example is intended to help you understand your ongoing costs (in dollars) of investing in the Fund and to compare these costs with the ongoing costs of investing in other mutual funds. The example is based on an investment of $1,000 made at the beginning of the six-month period and held for the entire period from May 1, 2022 to October 31, 2022.
This example illustrates your Fund’s ongoing costs in two ways:
Actual Expenses
The second and third data columns in the table below provide information about actual account values and actual expenses. You may use the information in these columns, together with the amount you invested, to estimate the expenses that you paid during the six months ended October 31, 2022. Simply divide your account value by $1,000 (for example, an
$8,600 account value divided by $1,000 = 8.6), then multiply the result by the number under the heading entitled “Expenses Paid During Period” to estimate the expenses you paid on your account during this period.
Hypothetical Example for Comparison Purposes
The fourth and fifth data columns in the table below provide information about hypothetical account values and hypothetical expenses based on the Fund’s actual expense ratio and an assumed rate of return of 5% per year before expenses, which is not the Fund’s actual return. The hypothetical account values and expenses may not be used to estimate the actual ending account balances or expenses you paid for the six-month period shown. You may use this information to compare the ongoing costs of investing in the Fund with the ongoing costs of investing in other mutual funds. To do so, compare this 5% hypothetical example with the 5% hypothetical examples that appear in the shareholder reports of the other mutual funds.
Please note that the expenses shown in the table are meant to highlight your ongoing costs only and do not reflect any transactional costs, such as exchange fees or sales charges (loads). Therefore, the fourth and fifth data columns of the table are useful in comparing ongoing costs only and will not help you determine the relative total costs of owning different funds. In addition, if these transactional costs were included, your costs would have been higher.
| Share Class | Beginning
Account
Value
5/1/22 | Ending Account
Value (Based
on Actual
Returns and
Expenses)
10/31/22 | Expenses
Paid
During
Period1 | Ending Account
Value (Based
on Hypothetical
5% Annualized
Return and
Actual Expenses)
10/31/22 | Expenses
Paid
During
Period1 | Net Expense
Ratio
During
Period2 |
| Class A Shares | $1,000.00 | $976.20 | $3.89 | $1,021.27 | $3.97 | 0.78% |
| Investor Class Shares | $1,000.00 | $975.70 | $4.58 | $1,020.57 | $4.69 | 0.92% |
| Class I Shares | $1,000.00 | $978.10 | $1.99 | $1,023.19 | $2.04 | 0.40% |
| SIMPLE Class Shares | $1,000.00 | $974.40 | $5.82 | $1,019.31 | $5.96 | 1.17% |
| 1. | Expenses are equal to the Fund’s annualized expense ratio of each class multiplied by the average account value over the period, divided by 365 and multiplied by 184 (to reflect the six-month period). The table above represents the actual expenses incurred during the six-month period. In addition to the fees and expenses which the Fund bears directly, it also indirectly bears a pro rata share of the fees and expenses of the underlying funds in which it invests. Such indirect expenses are not included in the above-reported expense figures. |
| 2. | Expenses are equal to the Fund's annualized expense ratio to reflect the six-month period. |
Portfolio Composition as of October 31, 2022 (Unaudited)
See Portfolio of Investments beginning on page 11 for specific holdings within these categories. The Fund's holdings are subject to change.
Top Ten Holdings and/or Issuers Held as of October 31, 2022 (excluding short-term investments) (Unaudited)
| 1. | U.S. Treasury Notes, 0.125%-4.375%, due 6/30/23–8/15/32 |
| 2. | FHLB, 4.00%-5.00%, due 5/26/27–9/14/27 |
| 3. | Morgan Stanley, 3.62%-6.138%, due 4/17/25–4/20/28 |
| 4. | Bank of America Corp., 4.20%-4.948%, due 8/26/24–7/22/28 |
| 5. | Voya CLO Ltd., 5.393 - 7.492%, due 4/15/31–10/20/34 |
| 6. | FHLMC, Multifamily Structured Pass-Through Certificates, 1.038%-1.691%, due 3/25/30–10/25/30 |
| 7. | Avis Budget Rental Car Funding AESOP LLC, 2.97%-3.70%, due 3/20/24–9/20/24 |
| 8. | Commercial Mortgage Trust, 2.987%, due 4/12/35 |
| 9. | Pacific Gas and Electric Co., 3.25%-5.45%, due 2/16/24–3/1/29 |
| 10. | NextEra Energy Capital Holdings, Inc., 3.47%, due 11/3/23 |
| 8 | MainStay Short Term Bond Fund |
Portfolio Management Discussion and Analysis (Unaudited)
Questions answered by portfolio managers Kenneth Sommer and AJ Rzad, CFA, of NYL Investors LLC, the Fund’s Subadvisor.
How did MainStay Short Term Bond Fund perform relative to its benchmark and peer group during the 12 months ended October 31, 2022?
For the 12 months ended October 31, 2022, Class I shares of MainStay Short Term Bond Fund returned −5.74%, underperforming the −4.88% return of the Fund’s benchmark, the Bloomberg 1–3 Year U.S. Government/Credit Bond Index (the “Index”). Over the same period, Class I shares outperformed the −6.81% return of the Morningstar U.S. Fund Short-Term Bond Category Average.1
What factors affected the Fund’s relative performance during the reporting period?
Relative to the Index, the Fund held overweight positions in corporate securities, asset-backed securities (“ABS”) and commercial mortgage-backed securities (“CMBS”) throughout the reporting period. To facilitate these overweight positions, the Fund maintained underweight exposure to the U.S. Treasury sector. Option-adjusted spreads2 (OAS) on the Index tightened 11 basis points during the reporting period. (A basis point is one one-hundredth of a percentage point.) ABS, both fixed rate and floating rate, was the worst-performing sector during the reporting period, followed by the corporate sector. Overweight positions relative to the Index in CMBS also detracted from performance during the reporting period. Underweight exposure relative to the Index in U.S. Treasury securities helped to increase performance.
During the reporting period, how was the Fund’s performance materially affected by investments in derivatives?
During the reporting period, the Fund’s use of derivatives was limited to interest rate derivatives in order to keep the duration3 of the Fund in line with the portfolio manager’s target. These interest rate derivatives had a positive impact on performance.
What was the Fund’s duration strategy during the reporting period?
During the reporting period, the Fund generally maintained a duration shorter than that of the Index in the front end of the yield curve4 (0-2 year) and a longer duration than the Index in the longer end of the yield curve (5-10 year). This strategy helped
increase the Fund’s performance as U.S. Federal Reserve (“Fed”) officials tightened monetary policy at the fastest pace since 2000 in order to reign in out-of-control inflation. As of October 31, 2022, the Fund’s duration was 1.88 years compared to a duration of 1.88 years for the Index.
During the reporting period, which sectors were the strongest positive contributors to the Fund’s relative performance and which sectors were particularly weak?
During the reporting period, the Fund maintained overweight exposure compared to the Index in the financial subsector, detracting from performance relative to the Index. Among industrials, performance in the automotive and technology subsectors were particularly weak, with bonds issued by Nissan Motor, Hyundai Capital, and VMware among the Fund’s worst performers. Within financials, the finance company and banking subsectors had the most negative impact on relative performance, particularly holdings in Citigroup, Credit Suisse Group, AerCap Ireland Capital and Aircastle. Among securitized products, ABS was the worst-performing sector. Within the floating-rate subcomponent of the ABS sector, AAA and AA-rated collateralized loan obligations detracted from relative performance.5 Within the fixed-rate subcomponent of the ABS sector, equipment, student loan and specialty finance securities detracted the most. In the CMBS sector, the Fund’s overweight position relative to the Index in the agency and non-agency subcomponents detracted from performance. Conversely, the Fund’s relatively underweight exposure to the sovereign, supranational and foreign agency subsectors slightly helped increase performance. Underweight exposure to the U.S. Treasury sector also helped increase performance.
What were some of the Fund’s largest purchases and sales during the reporting period?
The largest additions to the Fund during the reporting period included bonds issued by Pacific Gas and Electric, Intercontinental Exchange, Bank of America, Morgan Stanley and Capital One Financial. The largest reductions during the same period included bonds issued by Citigroup, Verizon Communications, NatWest Markets, Boeing and Humana.
| 1. | See page 5 for other share class returns, which may be higher or lower than Class I share returns. See page 6 for more information on benchmark and peer group returns. |
| 2. | The terms “spread” and “yield spread” may refer to the difference in yield between a security or type of security and comparable U.S. Treasury issues. The terms may also refer to the difference in yield between two specific securities or types of securities at a given time. |
| 3. | Duration is a measure of the price sensitivity of a fixed-income investment to changes in interest rates. Duration is expressed as a number of years and is considered a more accurate sensitivity gauge than average maturity. |
| 4. | The yield curve is a line that plots the yields of various securities of similar quality—typically U.S. Treasury issues—across a range of maturities. The U.S. Treasury yield curve serves as a benchmark for other debt and is used in economic forecasting. |
| 5. | An obligation rated ‘AAA’ has the highest rating assigned by Standard & Poor’s (“S&P”), and in the opinion of S&P, the obligor’s capacity to meet its financial commitment on the obligation is extremely strong. An obligation rated ‘AA’ by S&P is deemed by S&P to differ from the highest-rated obligations only to a small degree. In the opinion of S&P, the obligor's capacity to meet its financial commitment on the obligation is very strong. When applied to Fund holdings, ratings are based solely on the creditworthiness of the bonds in the portfolio and are not meant to represent the security or safety of the Fund. |
How did the Fund’s weightings change during the reporting period?
The Fund reduced its corporate credit allocation during the first quarter of 2022, particularly in the industrial subcomponent, in anticipation that the significant increase in rate volatility, due to the Fed’s removal of accommodation, would likely continue into the foreseeable future. As this environment would likely put upward pressure on credit spreads, the Fund subsequently reduced its allocation to the asset class in order to improve portfolio flexibility in uncertain times. During the period, the Fund also reduced its U.S. government agency exposure. Within the ABS sector, the Fund reduced its allocation to AAA and AA collateralized loan obligations in the first quarter of 2022 due to their relative outperformance versus other fixed income asset classes. Throughout the reporting period, as the Fund reduced its asset allocation in corporate credit and ABS, it increased the allocation to U.S. Treasury securities.
How was the Fund positioned at the end of the reporting period?
As of October 31, 2022, the Fund held its most significantly overweight exposure relative to the Index in ABS. Within the corporate sector, the Fund held overweight positions in financials and utilities. The Fund also held overweight positions in mortgage-backed securities and CMBS. As of the same date, the Fund held relatively underweight positions in the sovereign, supranational, foreign agency and foreign local government sectors, as well as in U.S. Treasury securities.
The opinions expressed are those of the portfolio managers as of the date of this report and are subject to change. There is no guarantee that any forecasts will come to pass. This material does not constitute investment advice and is not intended as an endorsement of any specific investment.
| 10 | MainStay Short Term Bond Fund |
Portfolio of Investments October 31, 2022†
| | Principal
Amount | Value |
| Long-Term Bonds 96.1% |
| Asset-Backed Securities 13.0% |
| Automobile Asset-Backed Securities 4.0% |
| Avis Budget Rental Car Funding AESOP LLC (a) | |
| Series 2017-2A, Class A | | |
| 2.97%, due 3/20/24 | $ 625,000 | $ 621,907 |
| Series 2018-1A, Class A | | |
| 3.70%, due 9/20/24 | 750,000 | 738,687 |
| Carvana Auto Receivables Trust | |
| Series 2022-P3, Class A3 | | |
| 4.61%, due 11/10/27 | 500,000 | 484,902 |
| Ford Credit Auto Owner Trust | |
| Series 2018-2, Class A | | |
| 3.47%, due 1/15/30 (a) | 1,000,000 | 987,174 |
| Ford Credit Floorplan Master Owner Trust | |
| Series 2019-2, Class A | | |
| 3.06%, due 4/15/26 | 750,000 | 721,762 |
| | | 3,554,432 |
| Other Asset-Backed Securities 9.0% |
| Amur Equipment Finance Receivables XI LLC | |
| Series 2022-2A, Class A2 | | |
| 5.30%, due 6/21/28 (a) | 214,000 | 211,119 |
| Apidos CLO XXX | |
| Series XXXA, Class A2 | | |
| 5.794% (3 Month LIBOR + 1.60%), due 10/18/31 (a)(b) | 500,000 | 470,289 |
| Aqua Finance Trust | |
| Series 2021-A, Class A | | |
| 1.54%, due 7/17/46 (a) | 438,319 | 395,431 |
| ARES XXXVIII CLO Ltd. | |
| Series 2015-38A, Class BR | | |
| 5.643% (3 Month LIBOR + 1.40%), due 4/20/30 (a)(b) | 500,000 | 464,899 |
| College Avenue Student Loans LLC (a) | |
| Series 2021-A, Class A2 | | |
| 1.60%, due 7/25/51 | 308,092 | 252,386 |
| Series 2021-B, Class A2 | | |
| 1.76%, due 6/25/52 | 264,486 | 223,579 |
| Cook Park CLO Ltd. | |
| Series 2018-1A, Class B | | |
| 5.479% (3 Month LIBOR + 1.40%), due 4/17/30 (a)(b) | 500,000 | 469,062 |
| EDvestinU Private Education Loan Issue No. 3 LLC | |
| Series 2021-A, Class A | | |
| 1.80%, due 11/25/45 (a) | 352,741 | 292,924 |
| HINNT LLC | |
| Series 2022-A, Class A | | |
| 4.25%, due 5/15/41 (a) | 415,380 | 393,927 |
| | Principal
Amount | Value |
| |
| Other Asset-Backed Securities (continued) |
| Marlin Receivables LLC | |
| Series 2022-1A, Class A2 | | |
| 4.53%, due 9/20/25 (a) | $ 300,000 | $ 294,502 |
| MVW Owner Trust | |
| Series 2017-1A, Class A | | |
| 2.42%, due 12/20/34 (a) | 27,319 | 26,627 |
| Neuberger Berman CLO XIV Ltd. | |
| Series 2013-14A, Class BR2 | | |
| 5.874% (3 Month LIBOR + 1.50%), due 1/28/30 (a)(b) | 500,000 | 475,279 |
| NMEF Funding LLC | |
| Series 2022-B, Class A2 | | |
| 6.07%, due 6/15/29 (a) | 233,000 | 232,231 |
| Oak Street Investment Grade Net Lease Fund | |
| Series 2020-1A, Class A1 | | |
| 1.85%, due 11/20/50 (a) | 308,337 | 267,805 |
| Palmer Square CLO Ltd. | |
| Series 2015-2A, Class A2R2 | | |
| 5.793% (3 Month LIBOR + 1.55%), due 7/20/30 (a)(b) | 500,000 | 473,997 |
| Romark CLO IV Ltd. | |
| Series 2021-4A, Class A1 | | |
| 5.079% (3 Month LIBOR + 1.17%), due 7/10/34 (a)(b) | 500,000 | 479,798 |
| Tribute Rail LLC | |
| Series 2022-1, Class A | | |
| 4.76%, due 5/17/52 (a) | 492,178 | 466,521 |
| Vantage Data Centers Issuer LLC | |
| Series 2020-1A, Class A2 | | |
| 1.645%, due 9/15/45 (a) | 350,000 | 306,864 |
| Vibrant CLO X Ltd. | |
| Series 2018-10A, Class A1 | | |
| 5.443% (3 Month LIBOR + 1.20%), due 10/20/31 (a)(b) | 500,000 | 484,068 |
| Voya CLO Ltd. (a)(b) | |
| Series 2021-2A, Class A | | |
| 5.393% (3 Month LIBOR + 1.15%), due 10/20/34 | 500,000 | 477,418 |
| Series 2019-1A, Class BR | | |
| 5.629% (3 Month LIBOR + 1.55%), due 4/15/31 | 500,000 | 468,413 |
| Series 2022-4A, Class A | | |
| 6.342% (3 Month SOFR + 2.15%), due 10/20/33 (c) | 250,000 | 249,525 |
The notes to the financial statements are an integral part of, and should be read in conjunction with, the financial statements.
11
Portfolio of Investments October 31, 2022† (continued)
| | Principal
Amount | Value |
| Asset-Backed Securities (continued) |
| Other Asset-Backed Securities (continued) |
| Voya CLO Ltd. (a)(b) (continued) | |
| Series 2022-4A, Class B | | |
| 7.492% (3 Month SOFR + 3.30%), due 10/20/33 (c) | $ 250,000 | $ 250,000 |
| | | 8,126,664 |
Total Asset-Backed Securities
(Cost $12,303,960) | | 11,681,096 |
| Corporate Bonds 31.2% |
| Auto Manufacturers 1.7% |
| American Honda Finance Corp. | | |
| 0.55%, due 7/12/24 | 700,000 | 648,926 |
| Ford Motor Credit Co. LLC | | |
| 3.664%, due 9/8/24 | 600,000 | 568,743 |
| General Motors Financial Co., Inc. | | |
| 6.05%, due 10/10/25 | 325,000 | 322,244 |
| | | 1,539,913 |
| Banks 13.5% |
| Banco Santander SA | | |
| 2.746%, due 5/28/25 | 200,000 | 181,411 |
| 5.294%, due 8/18/27 | 400,000 | 368,880 |
| Bank of America Corp. | | |
| 4.20%, due 8/26/24 | 700,000 | 684,521 |
| 4.827%, due 7/22/26 (d) | 510,000 | 496,660 |
| 4.948%, due 7/22/28 (d) | 315,000 | 300,456 |
| Citigroup, Inc. | | |
| 5.61%, due 9/29/26 (d) | 320,000 | 315,760 |
| Citizens Bank NA | | |
| 6.064%, due 10/24/25 (d) | 500,000 | 503,561 |
| Cooperatieve Rabobank UA | | |
| 4.655% (1 Year Treasury Constant Maturity Rate + 1.75%), due 8/22/28 (a)(b) | 310,000 | 286,740 |
| Goldman Sachs Group, Inc. (The) | | |
| 5.70%, due 11/1/24 | 455,000 | 455,031 |
| HSBC Holdings plc | | |
| 7.336%, due 11/3/26 (d) | 655,000 | 656,813 |
| Huntington National Bank (The) | | |
| 4.008%, due 5/16/25 (d) | 325,000 | 316,740 |
| JPMorgan Chase & Co. (d) | | |
| 1.561%, due 12/10/25 | 600,000 | 547,176 |
| 4.323%, due 4/26/28 | 395,000 | 367,426 |
| | Principal
Amount | Value |
| |
| Banks (continued) |
| Lloyds Banking Group plc (b) | | |
| 0.695% (1 Year Treasury Constant Maturity Rate + 0.55%), due 5/11/24 | $ 550,000 | $ 533,343 |
| 4.716% (1 Year Treasury Constant Maturity Rate + 1.75%), due 8/11/26 | 230,000 | 217,615 |
| M&T Bank Corp. | | |
| 4.553%, due 8/16/28 (d) | 250,000 | 235,280 |
| Mizuho Financial Group, Inc. | | |
| 5.414% (1 Year Treasury Constant Maturity Rate + 2.05%), due 9/13/28 (b) | 215,000 | 207,298 |
| Morgan Stanley (d) | | |
| 3.62%, due 4/17/25 | 600,000 | 579,594 |
| 4.21%, due 4/20/28 | 310,000 | 287,028 |
| 4.679%, due 7/17/26 | 290,000 | 281,148 |
| 6.138%, due 10/16/26 | 640,000 | 641,925 |
| Nordea Bank Abp | | |
| 5.375%, due 9/22/27 (a) | 325,000 | 313,167 |
| Royal Bank of Canada | | |
| 5.66%, due 10/25/24 | 360,000 | 360,665 |
| Santander Holdings USA, Inc. | | |
| 5.807%, due 9/9/26 (d) | 150,000 | 145,272 |
| Standard Chartered plc | | |
| 0.991% (1 Year Treasury Constant Maturity Rate + 0.78%), due 1/12/25 (a)(b) | 450,000 | 418,331 |
| Sumitomo Mitsui Financial Group, Inc. | | |
| 2.696%, due 7/16/24 | 950,000 | 904,742 |
| Swedbank AB | | |
| 5.337%, due 9/20/27 (a) | 290,000 | 275,978 |
| Toronto-Dominion Bank (The) | | |
| 4.285%, due 9/13/24 | 295,000 | 289,042 |
| U.S. Bancorp | | |
| 5.727%, due 10/21/26 (d) | 480,000 | 481,331 |
| UBS Group AG | | |
| 1.364% (1 Year Treasury Constant Maturity Rate + 1.08%), due 1/30/27 (a)(b) | 275,000 | 229,962 |
| Wells Fargo & Co. | | |
| 4.54%, due 8/15/26 (d) | 285,000 | 274,163 |
| | | 12,157,059 |
| Commercial Services 0.2% |
| PayPal Holdings, Inc. | | |
| 3.90%, due 6/1/27 | 195,000 | 185,240 |
The notes to the financial statements are an integral part of, and should be read in conjunction with, the financial statements.
| 12 | MainStay Short Term Bond Fund |
| | Principal
Amount | Value |
| Corporate Bonds (continued) |
| Diversified Financial Services 5.1% |
| AerCap Ireland Capital DAC | | |
| 1.65%, due 10/29/24 | $ 890,000 | $ 807,796 |
| Air Lease Corp. | | |
| 0.80%, due 8/18/24 | 650,000 | 591,877 |
| Aircastle Ltd. | | |
| 2.85%, due 1/26/28 (a) | 217,000 | 163,776 |
| American Express Co. | | |
| 3.95%, due 8/1/25 | 800,000 | 768,468 |
| Antares Holdings LP | | |
| 3.95%, due 7/15/26 (a) | 250,000 | 212,738 |
| Blackstone Holdings Finance Co. LLC | | |
| 5.90%, due 11/3/27 (a) | 305,000 | 304,375 |
| Capital One Financial Corp. (d) | | |
| 4.166%, due 5/9/25 | 500,000 | 480,508 |
| 4.985%, due 7/24/26 | 290,000 | 278,636 |
| Intercontinental Exchange, Inc. | | |
| 3.65%, due 5/23/25 | 670,000 | 648,264 |
| 4.00%, due 9/15/27 | 350,000 | 331,785 |
| | | 4,588,223 |
| Electric 5.9% |
| Duke Energy Corp. | | |
| 4.30%, due 3/15/28 | 260,000 | 244,392 |
| Enel Finance America LLC | | |
| 7.10%, due 10/14/27 (a) | 200,000 | 199,416 |
| Eversource Energy | | |
| Series T | | |
| 3.307% (SOFR + 0.25%), due 8/15/23 (b) | 750,000 | 745,901 |
| NextEra Energy Capital Holdings, Inc. | | |
| 3.47% (SOFR + 0.40%), due 11/3/23 (b) | 1,000,000 | 988,098 |
| OGE Energy Corp. | | |
| 0.703%, due 5/26/23 | 1,000,000 | 974,349 |
| Pacific Gas and Electric Co. | | |
| 3.25%, due 2/16/24 | 695,000 | 671,704 |
| 4.20%, due 3/1/29 | 161,000 | 139,696 |
| 5.45%, due 6/15/27 | 190,000 | 179,155 |
| Southern California Edison Co. | | |
| 1.10%, due 4/1/24 | 333,000 | 313,224 |
| Series 20C | | |
| 1.20%, due 2/1/26 | 240,000 | 209,940 |
| Southern Co. (The) | | |
| 5.15%, due 10/6/25 | 240,000 | 238,900 |
| | Principal
Amount | Value |
| |
| Electric (continued) |
| Virginia Electric and Power Co. | | |
| Series B | | |
| 3.75%, due 5/15/27 | $ 410,000 | $ 384,539 |
| | | 5,289,314 |
| Entertainment 0.8% |
| Warnermedia Holdings, Inc. (a) | | |
| 3.428%, due 3/15/24 | 600,000 | 578,718 |
| 3.755%, due 3/15/27 | 160,000 | 142,333 |
| | | 721,051 |
| Food 0.1% |
| Nestle Holdings, Inc. | | |
| 4.25%, due 10/1/29 (a) | 150,000 | 143,576 |
| Gas 0.4% |
| CenterPoint Energy Resources Corp. | | |
| 0.70%, due 3/2/23 | 375,000 | 369,796 |
| Insurance 0.2% |
| Corebridge Financial, Inc. | | |
| 3.50%, due 4/4/25 (a) | 200,000 | 188,485 |
| Investment Companies 0.2% |
| Blackstone Private Credit Fund | | |
| 7.05%, due 9/29/25 (a) | 210,000 | 208,165 |
| Iron & Steel 0.1% |
| Steel Dynamics, Inc. | | |
| 2.40%, due 6/15/25 | 125,000 | 115,543 |
| Media 1.3% |
| Charter Communications Operating LLC | | |
| 4.50%, due 2/1/24 | 750,000 | 738,660 |
| Discovery Communications LLC | | |
| 3.80%, due 3/13/24 | 420,000 | 407,990 |
| | | 1,146,650 |
| Pipelines 1.5% |
| Kinder Morgan Energy Partners LP | | |
| 4.15%, due 2/1/24 | 445,000 | 439,351 |
| ONEOK, Inc. | | |
| 5.85%, due 1/15/26 | 335,000 | 333,136 |
| Plains All American Pipeline LP | | |
| 3.85%, due 10/15/23 | 600,000 | 589,279 |
| | | 1,361,766 |
The notes to the financial statements are an integral part of, and should be read in conjunction with, the financial statements.
13
Portfolio of Investments October 31, 2022† (continued)
| | Principal
Amount | Value |
| Corporate Bonds (continued) |
| Software 0.2% |
| Oracle Corp. | | |
| 2.30%, due 3/25/28 | $ 180,000 | $ 150,572 |
Total Corporate Bonds
(Cost $29,306,807) | | 28,165,353 |
| Foreign Government Bond 0.4% |
| Supranational 0.4% |
| International Bank for Reconstruction & Development | | |
| 0.85%, due 2/10/27 | 375,000 | 321,103 |
Total Foreign Government Bond
(Cost $375,000) | | 321,103 |
| Mortgage-Backed Securities 6.3% |
| Commercial Mortgage Loans (Collateralized Mortgage Obligations) 4.8% |
| BWAY Mortgage Trust | |
| Series 2013-1515, Class A2 | | |
| 3.454%, due 3/10/33 (a) | 500,000 | 467,375 |
| Commercial Mortgage Trust | |
| Series 2013-SFS, Class A2 | | |
| 2.987%, due 4/12/35 (a)(e) | 1,100,000 | 1,079,086 |
| FHLMC, Multifamily Structured Pass-Through Certificates (e)(f) | |
| Series K120, Class X1 | | |
| 1.038%, due 10/25/30 | 9,215,724 | 559,425 |
| Series K112, Class X1 | | |
| 1.432%, due 5/25/30 | 3,619,616 | 297,829 |
| Series K108, Class X1 | | |
| 1.691%, due 3/25/30 | 5,796,682 | 552,174 |
| GS Mortgage Securities Corp. II | |
| Series 2012-BWTR, Class A | | |
| 2.954%, due 11/5/34 (a) | 500,000 | 464,058 |
| Houston Galleria Mall Trust | |
| Series 2015-HGLR, Class A1A1 | | |
| 3.087%, due 3/5/37 (a) | 500,000 | 456,560 |
| Queens Center Mortgage Trust | |
| Series 2013-QCA, Class A | | |
| 3.275%, due 1/11/37 (a) | 500,000 | 463,517 |
| | | 4,340,024 |
| Whole Loan (Collateralized Mortgage Obligations) 1.5% |
| COLT Mortgage Loan Trust | |
| Series 2021-5, Class A1 | | |
| 1.726%, due 11/26/66 (a)(g) | 444,709 | 363,870 |
| | Principal
Amount | Value |
| |
| Whole Loan (Collateralized Mortgage Obligations) (continued) |
| GCAT Trust (a) | |
| Series 2022-NQM3, Class A1 | | |
| 4.348%, due 4/25/67 (g) | $ 385,984 | $ 351,632 |
| Series 2022-NQM4, Class A1 | | |
| 5.269%, due 8/25/67 (h) | 394,453 | 372,158 |
| New Residential Mortgage Loan Trust | |
| Series 2022-NQM4, Class A1 | | |
| 5.00%, due 6/25/62 (a)(h) | 288,267 | 274,488 |
| | | 1,362,148 |
Total Mortgage-Backed Securities
(Cost $6,274,827) | | 5,702,172 |
| U.S. Government & Federal Agencies 45.2% |
| Federal Home Loan Mortgage Corporation (Mortgage Pass-Through Securities) 4.5% |
| FHLB | | |
| 4.00%, due 5/26/27 | 650,000 | 620,735 |
| 4.50%, due 7/26/27 | 600,000 | 588,868 |
| 4.70%, due 6/30/27 | 650,000 | 645,096 |
| 5.00%, due 9/14/27 | 400,000 | 396,646 |
| FHLMC | | |
| 4.00%, due 5/27/27 | 350,000 | 340,643 |
| 4.05%, due 7/25/25 | 225,000 | 221,139 |
| 4.10%, due 8/12/24 | 325,000 | 321,033 |
| UMBS, 20 Year | | |
| 4.50%, due 8/1/42 | 989,428 | 938,824 |
| | | 4,072,984 |
| United States Treasury Notes 40.7% |
| U.S. Treasury Notes | | |
| 0.125%, due 10/15/23 | 350,000 | 335,207 |
| 1.375%, due 9/30/23 | 1,990,000 | 1,933,332 |
| 2.625%, due 6/30/23 | 8,525,000 | 8,424,431 |
| 2.75%, due 8/15/32 | 4,200,000 | 3,758,344 |
| 3.875%, due 9/30/29 | 210,000 | 206,259 |
| 4.25%, due 9/30/24 | 11,775,000 | 11,715,205 |
| 4.25%, due 10/15/25 | 3,670,000 | 3,650,503 |
| 4.375%, due 10/31/24 | 6,685,000 | 6,670,899 |
| | | 36,694,180 |
Total U.S. Government & Federal Agencies
(Cost $41,363,294) | | 40,767,164 |
Total Long-Term Bonds
(Cost $89,623,888) | | 86,636,888 |
| |
The notes to the financial statements are an integral part of, and should be read in conjunction with, the financial statements.
| 14 | MainStay Short Term Bond Fund |
| | Shares | | Value |
| Short-Term Investment 13.8% |
| Unaffiliated Investment Company 13.8% |
| JPMorgan U.S. Government Money Market Fund, IM Class, 2.832% (i) | 12,399,434 | | $ 12,399,434 |
Total Short-Term Investment
(Cost $12,399,434) | | | 12,399,434 |
Total Investments
(Cost $102,023,322) | 109.9% | | 99,036,322 |
| Other Assets, Less Liabilities | (9.9) | | (8,886,409) |
| Net Assets | 100.0% | | $ 90,149,913 |
| † | Percentages indicated are based on Fund net assets. |
| (a) | May be sold to institutional investors only under Rule 144A or securities offered pursuant to Section 4(a)(2) of the Securities Act of 1933, as amended. |
| (b) | Floating rate—Rate shown was the rate in effect as of October 31, 2022. |
| (c) | Delayed delivery security. |
| (d) | Fixed to floating rate—Rate shown was the rate in effect as of October 31, 2022. |
| (e) | Collateral strip rate—A bond whose interest was based on the weighted net interest rate of the collateral. The coupon rate adjusts periodically based on a predetermined schedule. Rate shown was the rate in effect as of October 31, 2022. |
| (f) | Collateralized Mortgage Obligation Interest Only Strip—Pays a fixed or variable rate of interest based on mortgage loans or mortgage pass-through securities. The principal amount of the underlying pool represents the notional amount on which the current interest was calculated. The value of these stripped securities may be particularly sensitive to changes in prevailing interest rates and are typically more sensitive to changes in prepayment rates than traditional mortgage-backed securities. |
| (g) | Coupon rate may change based on changes of the underlying collateral or prepayments of principal. Rate shown was the rate in effect as of October 31, 2022. |
| (h) | Step coupon—Rate shown was the rate in effect as of October 31, 2022. |
| (i) | Current yield as of October 31, 2022. |
Futures Contracts
As of October 31, 2022, the Fund held the following futures contracts1:
| Type | Number of
Contracts | Expiration
Date | Value at
Trade Date | Current
Notional
Amount | Unrealized
Appreciation
(Depreciation)2 |
| Long Contracts | | | | | |
| U.S. Treasury 2 Year Notes | 94 | December 2022 | $ 19,229,443 | $ 19,211,984 | $ (17,459) |
| Short Contracts | | | | | |
| U.S. Treasury 5 Year Notes | (24) | December 2022 | (2,581,905) | (2,558,250) | 23,655 |
The notes to the financial statements are an integral part of, and should be read in conjunction with, the financial statements.
15
Portfolio of Investments October 31, 2022† (continued)
| Type | Number of
Contracts | Expiration
Date | Value at
Trade Date | Current
Notional
Amount | Unrealized
Appreciation
(Depreciation)2 |
| U.S. Treasury 10 Year Notes | (7) | December 2022 | $ (772,362) | $ (774,156) | $ (1,794) |
| U.S. Treasury 10 Year Ultra Bonds | (39) | December 2022 | (4,546,404) | (4,523,390) | 23,014 |
| U.S. Treasury Long Bonds | (2) | December 2022 | (260,372) | (241,000) | 19,372 |
| Total Short Contracts | | | | | 64,247 |
| Net Unrealized Appreciation | | | | | $ 46,788 |
| 1. | As of October 31, 2022, cash in the amount of $169,310 was on deposit with a broker or futures commission merchant for futures transactions. |
| 2. | Represents the difference between the value of the contracts at the time they were opened and the value as of October 31, 2022. |
| Abbreviation(s): |
| CLO—Collateralized Loan Obligation |
| FHLB—Federal Home Loan Bank |
| FHLMC—Federal Home Loan Mortgage Corp. |
| LIBOR—London Interbank Offered Rate |
| SOFR—Secured Overnight Financing Rate |
| UMBS—Uniform Mortgage Backed Securities |
The following is a summary of the fair valuations according to the inputs used as of October 31, 2022, for valuing the Fund’s assets and liabilities:
| Description | Quoted
Prices in
Active
Markets for
Identical
Assets
(Level 1) | | Significant
Other
Observable
Inputs
(Level 2) | | Significant
Unobservable
Inputs
(Level 3) | | Total |
| Asset Valuation Inputs | | | | | | | |
| Investments in Securities (a) | | | | | | | |
| Long-Term Bonds | | | | | | | |
| Asset-Backed Securities | $ — | | $ 11,681,096 | | $ — | | $ 11,681,096 |
| Corporate Bonds | — | | 28,165,353 | | — | | 28,165,353 |
| Foreign Government Bond | — | | 321,103 | | — | | 321,103 |
| Mortgage-Backed Securities | — | | 5,702,172 | | — | | 5,702,172 |
| U.S. Government & Federal Agencies | — | | 40,767,164 | | — | | 40,767,164 |
| Total Long-Term Bonds | — | | 86,636,888 | | — | | 86,636,888 |
| Short-Term Investment | | | | | | | |
| Unaffiliated Investment Company | 12,399,434 | | — | | — | | 12,399,434 |
| Total Investments in Securities | 12,399,434 | | 86,636,888 | | — | | 99,036,322 |
| Other Financial Instruments | | | | | | | |
| Futures Contracts (b) | 66,041 | | — | | — | | 66,041 |
| Total Investments in Securities and Other Financial Instruments | $ 12,465,475 | | $ 86,636,888 | | $ — | | $ 99,102,363 |
| Liability Valuation Inputs | | | | | | | |
| Other Financial Instruments | | | | | | | |
| Futures Contracts (b) | $ (19,253) | | $ — | | $ — | | $ (19,253) |
| (a) | For a complete listing of investments and their industries, see the Portfolio of Investments. |
| (b) | The value listed for these securities reflects unrealized appreciation (depreciation) as shown on the Portfolio of Investments. |
The notes to the financial statements are an integral part of, and should be read in conjunction with, the financial statements.
| 16 | MainStay Short Term Bond Fund |
Statement of Assets and Liabilities as of October 31, 2022
| Assets |
Investment in securities, at value
(identified cost $102,023,322) | $ 99,036,322 |
| Cash | 3,007,322 |
| Cash collateral on deposit at broker for futures contracts | 169,310 |
| Receivables: | |
| Investment securities sold | 4,129,666 |
| Fund shares sold | 1,583,250 |
| Interest | 421,734 |
| Variation margin on futures contracts | 8,172 |
| Other assets | 32,444 |
| Total assets | 108,388,220 |
| Liabilities |
| Payables: | |
| Investment securities purchased | 18,088,326 |
| Fund shares redeemed | 71,343 |
| Transfer agent (See Note 3) | 15,018 |
| NYLIFE Distributors (See Note 3) | 12,101 |
| Shareholder communication | 11,215 |
| Custodian | 10,119 |
| Professional fees | 9,802 |
| Manager (See Note 3) | 8,767 |
| Accrued expenses | 7,796 |
| Distributions payable | 3,820 |
| Total liabilities | 18,238,307 |
| Net assets | $ 90,149,913 |
| Composition of Net Assets |
| Shares of beneficial interest outstanding (par value of $.001 per share) unlimited number of shares authorized | $ 9,980 |
| Additional paid-in-capital | 96,033,623 |
| | 96,043,603 |
| Total distributable earnings (loss) | (5,893,690) |
| Net assets | $ 90,149,913 |
| Class A | |
| Net assets applicable to outstanding shares | $54,971,422 |
| Shares of beneficial interest outstanding | 6,088,816 |
| Net asset value per share outstanding | $ 9.03 |
| Maximum sales charge (1.00% of offering price) | 0.09 |
| Maximum offering price per share outstanding | $ 9.12 |
| Investor Class | |
| Net assets applicable to outstanding shares | $ 2,395,959 |
| Shares of beneficial interest outstanding | 263,602 |
| Net asset value per share outstanding | $ 9.09 |
| Maximum sales charge (0.50% of offering price) | 0.05 |
| Maximum offering price per share outstanding | $ 9.14 |
| Class I | |
| Net assets applicable to outstanding shares | $32,750,081 |
| Shares of beneficial interest outstanding | 3,623,927 |
| Net asset value and offering price per share outstanding | $ 9.04 |
| SIMPLE Class | |
| Net assets applicable to outstanding shares | $ 32,451 |
| Shares of beneficial interest outstanding | 3,571 |
| Net asset value and offering price per share outstanding | $ 9.09 |
The notes to the financial statements are an integral part of, and should be read in conjunction with, the financial statements.
17
Statement of Operations for the year ended October 31, 2022
| Investment Income (Loss) |
| Income | |
| Interest | $ 1,696,577 |
| Dividends | 3,743 |
| Total income | 1,700,320 |
| Expenses | |
| Manager (See Note 3) | 195,554 |
| Distribution/Service—Class A (See Note 3) | 142,762 |
| Distribution/Service—Investor Class (See Note 3) | 6,599 |
| Distribution/Service—SIMPLE Class (See Note 3) | 136 |
| Transfer agent (See Note 3) | 85,624 |
| Registration | 76,320 |
| Professional fees | 74,540 |
| Custodian | 42,223 |
| Shareholder communication | 12,177 |
| Trustees | 1,560 |
| Miscellaneous | 9,109 |
| Total expenses before waiver/reimbursement | 646,604 |
| Expense waiver/reimbursement from Manager (See Note 3) | (112,251) |
| Net expenses | 534,353 |
| Net investment income (loss) | 1,165,967 |
| Realized and Unrealized Gain (Loss) |
| Net realized gain (loss) on: | |
| Investment transactions | (3,602,467) |
| Futures transactions | 782,613 |
| Net realized gain (loss) | (2,819,854) |
| Net change in unrealized appreciation (depreciation) on: | |
| Investments | (3,050,811) |
| Futures contracts | (70,208) |
| Net change in unrealized appreciation (depreciation) | (3,121,019) |
| Net realized and unrealized gain (loss) | (5,940,873) |
| Net increase (decrease) in net assets resulting from operations | $(4,774,906) |
The notes to the financial statements are an integral part of, and should be read in conjunction with, the financial statements.
| 18 | MainStay Short Term Bond Fund |
Statements of Changes in Net Assets
for the years ended October 31, 2022 and October 31, 2021
| | 2022 | 2021 |
| Increase (Decrease) in Net Assets |
| Operations: | | |
| Net investment income (loss) | $ 1,165,967 | $ 813,697 |
| Net realized gain (loss) | (2,819,854) | 226,851 |
| Net change in unrealized appreciation (depreciation) | (3,121,019) | (623,886) |
| Net increase (decrease) in net assets resulting from operations | (4,774,906) | 416,662 |
| Distributions to shareholders: | | |
| Class A | (962,450) | (4,530,754) |
| Investor Class | (39,806) | (306,970) |
| Class I | (477,164) | (2,904,018) |
| SIMPLE Class | (375) | (2,239) |
| Total distributions to shareholders | (1,479,795) | (7,743,981) |
| Capital share transactions: | | |
| Net proceeds from sales of shares | 60,298,526 | 102,736,580 |
| Net asset value of shares issued to shareholders in reinvestment of distributions | 1,347,322 | 7,660,736 |
| Cost of shares redeemed | (74,124,094) | (74,370,352) |
| Increase (decrease) in net assets derived from capital share transactions | (12,478,246) | 36,026,964 |
| Net increase (decrease) in net assets | (18,732,947) | 28,699,645 |
| Net Assets |
| Beginning of year | 108,882,860 | 80,183,215 |
| End of year | $ 90,149,913 | $108,882,860 |
The notes to the financial statements are an integral part of, and should be read in conjunction with, the financial statements.
19
Financial Highlights selected per share data and ratios
| | Year Ended October 31, |
| Class A | 2022 | | 2021 | | 2020 | | 2019 | | 2018 |
| Net asset value at beginning of year | $ 9.78 | | $ 10.72 | | $ 10.91 | | $ 10.09 | | $ 10.66 |
| Net investment income (loss) | 0.14(a) | | 0.07(a) | | 0.15 | | 0.27 | | 0.24 |
| Net realized and unrealized gain (loss) | (0.74) | | (0.01) | | 0.05 | | 0.82 | | (0.54) |
| Total from investment operations | (0.60) | | 0.06 | | 0.20 | | 1.09 | | (0.30) |
| Less distributions: | | | | | | | | | |
| From net investment income | (0.13) | | (0.08) | | (0.17) | | (0.27) | | (0.24) |
| From net realized gain on investments | (0.02) | | (0.92) | | (0.22) | | — | | (0.03) |
| Total distributions | (0.15) | | (1.00) | | (0.39) | | (0.27) | | (0.27) |
| Net asset value at end of year | $ 9.03 | | $ 9.78 | | $ 10.72 | | $ 10.91 | | $ 10.09 |
| Total investment return (b) | (6.08)% | | 0.59% | | 2.00% | | 10.77% | | (2.82)% |
| Ratios (to average net assets)/Supplemental Data: | | | | | | | | | |
| Net investment income (loss) | 1.45% | | 0.70% | | 1.32% | | 2.50% | | 2.26% |
| Net expenses (c) | 0.76% | | 0.72% | | 0.72% | | 0.60% | | 0.63% |
| Expenses (before waiver/reimbursement) (c) | 0.88% | | 0.77% | | 0.75% | | 0.60% | | 0.63% |
| Portfolio turnover rate | 279%(d) | | 236% | | 299%(d) | | 75%(d) | | 103%(d) |
| Net assets at end of year (in 000’s) | $ 54,971 | | $ 60,444 | | $ 43,452 | | $ 23,771 | | $ 17,506 |
| (a) | Per share data based on average shares outstanding during the year. |
| (b) | Total investment return is calculated exclusive of sales charges and assumes the reinvestment of dividends and distributions. For periods of less than one year, total return is not annualized. |
| (c) | In addition to the fees and expenses which the Fund bears directly, it also indirectly bears a pro-rata share of the fees and expenses of the underlying funds in which it invests. Such indirect expenses are not included in the above expense ratios. |
| (d) | The portfolio turnover rates not including mortgage dollar rolls were 271%, 298%, 72% and 72% for the years ended October 31, 2022, 2020, 2019 and 2018, respectively. |
| | Year Ended October 31, |
| Investor Class | 2022 | | 2021 | | 2020 | | 2019 | | 2018 |
| Net asset value at beginning of year | $ 9.85 | | $ 10.79 | | $ 10.97 | | $ 10.15 | | $ 10.71 |
| Net investment income (loss) | 0.12(a) | | 0.05(a) | | 0.13 | | 0.23 | | 0.21 |
| Net realized and unrealized gain (loss) | (0.74) | | — | | 0.06 | | 0.82 | | (0.53) |
| Total from investment operations | (0.62) | | 0.05 | | 0.19 | | 1.05 | | (0.32) |
| Less distributions: | | | | | | | | | |
| From net investment income | (0.12) | | (0.07) | | (0.15) | | (0.23) | | (0.21) |
| From net realized gain on investments | (0.02) | | (0.92) | | (0.22) | | — | | (0.03) |
| Total distributions | (0.14) | | (0.99) | | (0.37) | | (0.23) | | (0.24) |
| Net asset value at end of year | $ 9.09 | | $ 9.85 | | $ 10.79 | | $ 10.97 | | $ 10.15 |
| Total investment return (b) | (6.28)% | | 0.44% | | 1.76% | | 10.46% | | (2.99)% |
| Ratios (to average net assets)/Supplemental Data: | | | | | | | | | |
| Net investment income (loss) | 1.27% | | 0.51% | | 1.18% | | 2.18% | | 1.98% |
| Net expenses (c) | 0.92% | | 0.92% | | 0.92% | | 0.92% | | 0.92% |
| Expenses (before waiver/reimbursement) (c) | 1.32% | | 1.29% | | 1.22% | | 1.12% | | 1.13% |
| Portfolio turnover rate | 279%(d) | | 236% | | 299%(d) | | 75%(d) | | 103%(d) |
| Net assets at end of year (in 000's) | $ 2,396 | | $ 3,124 | | $ 3,376 | | $ 3,433 | | $ 2,850 |
| (a) | Per share data based on average shares outstanding during the year. |
| (b) | Total investment return is calculated exclusive of sales charges and assumes the reinvestment of dividends and distributions. For periods of less than one year, total return is not annualized. |
| (c) | In addition to the fees and expenses which the Fund bears directly, it also indirectly bears a pro-rata share of the fees and expenses of the underlying funds in which it invests. Such indirect expenses are not included in the above expense ratios. |
| (d) | The portfolio turnover rates not including mortgage dollar rolls were 271%, 298%, 72% and 72% for the years ended October 31, 2022, 2020, 2019 and 2018, respectively. |
The notes to the financial statements are an integral part of, and should be read in conjunction with, the financial statements.
| 20 | MainStay Short Term Bond Fund |
Financial Highlights selected per share data and ratios
| | Year Ended October 31, |
| Class I | 2022 | | 2021 | | 2020 | | 2019 | | 2018 |
| Net asset value at beginning of year | $ 9.79 | | $ 10.74 | | $ 10.92 | | $ 10.10 | | $ 10.67 |
| Net investment income (loss) | 0.16(a) | | 0.10(a) | | 0.25 | | 0.29 | | 0.25 |
| Net realized and unrealized gain (loss) | (0.72) | | (0.01) | | (0.01) | | 0.82 | | (0.52) |
| Total from investment operations | (0.56) | | 0.09 | | 0.24 | | 1.11 | | (0.27) |
| Less distributions: | | | | | | | | | |
| From net investment income | (0.17) | | (0.12) | | (0.20) | | (0.29) | | (0.27) |
| From net realized gain on investments | (0.02) | | (0.92) | | (0.22) | | — | | (0.03) |
| Total distributions | (0.19) | | (1.04) | | (0.42) | | (0.29) | | (0.30) |
| Net asset value at end of year | $ 9.04 | | $ 9.79 | | $ 10.74 | | $ 10.92 | | $ 10.10 |
| Total investment return (b) | (5.74)% | | 0.87% | | 2.29% | | 11.14% | | (2.57)% |
| Ratios (to average net assets)/Supplemental Data: | | | | | | | | | |
| Net investment income (loss) | 1.64% | | 1.02% | | 1.78% | | 2.77% | | 2.58% |
| Net expenses (c) | 0.40% | | 0.40% | | 0.40% | | 0.35% | | 0.37% |
| Expenses (before waiver/reimbursement) (c) | 0.60% | | 0.52% | | 0.48% | | 0.35% | | 0.37% |
| Portfolio turnover rate | 279%(d) | | 236% | | 299%(d) | | 75%(d) | | 103%(d) |
| Net assets at end of year (in 000’s) | $ 32,750 | | $ 45,291 | | $ 33,330 | | $ 290,411 | | $ 285,216 |
| (a) | Per share data based on average shares outstanding during the year. |
| (b) | Total investment return is calculated exclusive of sales charges and assumes the reinvestment of dividends and distributions. Class I shares are not subject to sales charges. For periods of less than one year, total return is not annualized. |
| (c) | In addition to the fees and expenses which the Fund bears directly, it also indirectly bears a pro-rata share of the fees and expenses of the underlying funds in which it invests. Such indirect expenses are not included in the above expense ratios. |
| (d) | The portfolio turnover rates not including mortgage dollar rolls were 271%, 298%, 72% and 72% for the years ended October 31, 2022, 2020, 2019 and 2018, respectively. |
The notes to the financial statements are an integral part of, and should be read in conjunction with, the financial statements.
21
Financial Highlights selected per share data and ratios
| | Year Ended October 31, | | August 31, 2020^ through
October 31, |
| SIMPLE Class | 2022 | | 2021 | | 2020 |
| Net asset value at beginning of period | $ 9.85 | | $ 10.79 | | $ 10.82* |
| Net investment income (loss) (a) | 0.11 | | 0.03 | | 0.01 |
| Net realized and unrealized gain (loss) | (0.75) | | (0.01) | | (0.03) |
| Total from investment operations | (0.64) | | 0.02 | | (0.02) |
| Less distributions: | | | | | |
| From net investment income | (0.10) | | (0.04) | | (0.01) |
| From net realized gain on investments | (0.02) | | (0.92) | | — |
| Total distributions | (0.12) | | (0.96) | | (0.01) |
| Net asset value at end of period | $ 9.09 | | $ 9.85 | | $ 10.79 |
| Total investment return (b) | (6.49)% | | 0.18% | | (0.17)% |
| Ratios (to average net assets)/Supplemental Data: | | | | | |
| Net investment income (loss) | 1.16% | | 0.27% | | 0.38%†† |
| Net expenses (c) | 1.17% | | 1.17% | | 1.17%†† |
| Expenses (before waiver/reimbursement) (c) | 1.56% | | 1.54% | | 1.55%†† |
| Portfolio turnover rate | 279%(d) | | 236% | | 299%(d) |
| Net assets at end of period (in 000’s) | $ 32 | | $ 25 | | $ 25 |
| ^ | Inception date. |
| * | Based on the net asset value of Investor Class as of August 31, 2020. |
| †† | Annualized. |
| (a) | Per share data based on average shares outstanding during the period. |
| (b) | Total investment return is calculated exclusive of sales charges and assumes the reinvestment of dividends and distributions. SIMPLE Class shares are not subject to sales charges. For periods of less than one year, total return is not annualized. |
| (c) | In addition to the fees and expenses which the Fund bears directly, it also indirectly bears a pro-rata share of the fees and expenses of the underlying funds in which it invests. Such indirect expenses are not included in the above expense ratios. |
| (d) | The portfolio turnover rate not including mortgage dollar rolls was 271% and 298% for the year ended October 31, 2022 and 2020. |
The notes to the financial statements are an integral part of, and should be read in conjunction with, the financial statements.
| 22 | MainStay Short Term Bond Fund |
Notes to Financial Statements
Note 1-Organization and Business
MainStay Funds Trust (the “Trust”) was organized as a Delaware statutory trust on April 28, 2009. The Trust is registered under the Investment Company Act of 1940, as amended (the “1940 Act”), as an open-end management investment company, and is comprised of thirty-three funds (collectively referred to as the “Funds”). These financial statements and notes relate to the MainStay Short Term Bond Fund (the "Fund"), a “diversified” fund, as that term is defined in the 1940 Act, as interpreted or modified by regulatory authorities having jurisdiction, from time to time.
The following table lists the Fund's share classes that have been registered and commenced operations:
| Class | Commenced Operations |
| Class A | January 2, 2004 |
| Investor Class | February 28, 2008 |
| Class I | January 2, 1991 |
| SIMPLE Class | August 31, 2020 |
| Class R6 | N/A* |
| * | Class R6 shares were registered for sale effective as of February 28, 2017 but have not yet commenced operations. |
Class A and Investor Class shares are offered at net asset value (“NAV”) per share plus an initial sales charge. No initial sales charge applies to investments of $250,000 or more (and certain other qualified purchases) in Class A and Investor Class shares. However, a contingent deferred sales charge (“CDSC”) of 0.50% may be imposed on certain redemptions made within 12 months of the date of purchase on shares that were purchased without an initial sales charge. Class I and SIMPLE Class shares are offered at NAV without a sales charge. Class R6 shares are currently expected to be offered at NAV without a sales charge. Additionally, Investor Class shares may convert automatically to Class A shares. SIMPLE Class shares convert to Class A shares, or Investor Class shares if you are not eligible to hold Class A shares, at the end of the calendar quarter, ten years after the date they were purchased. Share class conversions are based on the relevant NAVs of the two classes at the time of the conversion, and no sales load or other charge is imposed. Under certain circumstances and as may be permitted by the Trust’s multiple class plan pursuant to Rule 18f-3 under the 1940 Act, specified share classes of the Fund may be converted to one or more other share classes of the Fund as disclosed in the capital share transactions within these Notes. The classes of shares have the same voting (except for issues that relate solely to one class), dividend, liquidation and other rights, and the same terms and conditions, except that under distribution plans pursuant to Rule 12b-1 under the 1940 Act, Class A, Investor Class and SIMPLE Class shares are subject to a distribution and/or service fee. Class I and Class R6 shares are not subject to a distribution and/or service fee.
The Fund's investment objective is to seek current income consistent with capital preservation.
Note 2–Significant Accounting Policies
The Fund is an investment company and accordingly follows the investment company accounting and reporting guidance of the Financial Accounting Standards Board (“FASB”) Accounting Standards Codification Topic 946 Financial Services—Investment Companies. The Fund prepares its financial statements in accordance with generally accepted accounting principles (“GAAP”) in the United States of America and follows the significant accounting policies described below.
(A) Securities Valuation. Investments are usually valued as of the close of regular trading on the New York Stock Exchange (the "Exchange") (usually 4:00 p.m. Eastern time) on each day the Fund is open for business ("valuation date").
Effective September 8, 2022, and pursuant to Rule 2a-5 under the 1940 Act, the Board of Trustees of the Trust (the "Board") designated New York Life Investment Management LLC (“New York Life Investments” or the "Manager") as its Valuation Designee (the "Valuation Designee"). The Valuation Designee is responsible for performing fair valuations relating to all investments in the Fund’s portfolio for which market quotations are not readily available; periodically assessing and managing material valuation risks; establishing and applying fair value methodologies; testing fair valuation methodologies; evaluating and overseeing pricing services; segregation of valuation and portfolio management functions; providing quarterly, annual and prompt reporting to the Board, as appropriate; identifying potential conflicts of interest; and maintaining appropriate records. The Valuation Designee has established a valuation committee ("Valuation Committee") to assist in carrying out the Valuation Designee’s responsibilities and establish prices of securities for which market quotations are not readily available. The Fund’s and the Valuation Designee's policies and procedures ("Valuation Procedures") govern the Valuation Designee’s selection and application of methodologies for determining and calculating the fair value of Fund investments. The Valuation Designee may value Fund portfolio securities for which market quotations are not readily available and other Fund assets utilizing inputs from pricing services and other third-party sources (together, “Pricing Sources”). The Valuation Committee meets (in person, via electronic mail or via teleconference) on an ad-hoc basis to determine fair valuations and on a quarterly basis to review fair value events (excluding fair valuations from pricing services), including valuation risks and back-testing results, and preview reports to the Board.
The Valuation Committee establishes prices of securities for which market quotations are not readily available based on such methodologies and measurements on a regular basis after considering information that is reasonably available and deemed relevant by the Valuation Committee. The Board shall oversee the Valuation Designee and review fair valuation materials on a prompt, quarterly and annual basis and approve proposed revisions to the Valuation Procedures.
Investments for which market quotations are not readily available are valued at fair value as determined in good faith pursuant to the Valuation Procedures. A market quotation is readily available only when that
Notes to Financial Statements (continued)
quotation is a quoted price (unadjusted) in active markets for identical investments that the Fund can access at the measurement date, provided that a quotation will not be readily available if it is not reliable. Fair value measurements are determined within a framework that establishes a three-tier hierarchy that maximizes the use of observable market data and minimizes the use of unobservable inputs to establish a classification of fair value measurements for disclosure purposes. "Inputs" refer broadly to the assumptions that market participants would use in pricing the asset or liability, including assumptions about risk, such as the risk inherent in a particular valuation technique used to measure fair value using a pricing model and/or the risk inherent in the inputs for the valuation technique. Inputs may be observable or unobservable. Observable inputs reflect the assumptions market participants would use in pricing the asset or liability based on market data obtained from sources independent of the Fund. Unobservable inputs reflect the Fund’s own assumptions about the assumptions market participants would use in pricing the asset or liability based on the information available. The inputs or methodology used for valuing assets or liabilities may not be an indication of the risks associated with investing in those assets or liabilities. The three-tier hierarchy of inputs is summarized below.
| • | Level 1—quoted prices (unadjusted) in active markets for an identical asset or liability |
| • | Level 2—other significant observable inputs (including quoted prices for a similar asset or liability in active markets, interest rates and yield curves, prepayment speeds, credit risk, etc.) |
| • | Level 3—significant unobservable inputs (including the Fund's own assumptions about the assumptions that market participants would use in measuring fair value of an asset or liability) |
The level of an asset or liability within the fair value hierarchy is based on the lowest level of an input, both individually and in the aggregate, that is significant to the fair value measurement. The aggregate value by input level of the Fund’s assets and liabilities as of October 31, 2022, is included at the end of the Portfolio of Investments.
The Fund may use third-party vendor evaluations, whose prices may be derived from one or more of the following standard inputs, among others:
| • Benchmark yields | • Reported trades |
| • Broker/dealer quotes | • Issuer spreads |
| • Two-sided markets | • Benchmark securities |
| • Bids/offers | • Reference data (corporate actions or material event notices) |
| • Industry and economic events | • Comparable bonds |
| • Monthly payment information | |
An asset or liability for which a market quotation is not readily available is valued by methods deemed reasonable in good faith by the Valuation Committee, following the Valuation Procedures to represent fair value. Under these procedures, the Valuation Designee generally uses a market-based approach which may use related or comparable assets or liabilities, recent transactions, market multiples, book values and other
relevant information. The Valuation Designee may also use an income-based valuation approach in which the anticipated future cash flows of the asset or liability are discounted to calculate fair value. Discounts may also be applied due to the nature and/or duration of any restrictions on the disposition of the asset or liability. Fair value represents a good faith approximation of the value of a security. Fair value determinations involve the consideration of a number of subjective factors, an analysis of applicable facts and circumstances and the exercise of judgment. As a result, it is possible that the fair value for a security determined in good faith in accordance with the Valuation Procedures may differ from valuations for the same security determined for other funds using their own valuation procedures. Although the Valuation Procedures are designed to value a security at the price the Fund may reasonably expect to receive upon the security's sale in an orderly transaction, there can be no assurance that any fair value determination thereunder would, in fact, approximate the amount that the Fund would actually realize upon the sale of the security or the price at which the security would trade if a reliable market price were readily available. During the year ended October 31, 2022, there were no material changes to the fair value methodologies.
Securities which may be valued in this manner include, but are not limited to: (i) a security for which trading has been halted or suspended or otherwise does not have a readily available market quotation on a given day; (ii) a debt security that has recently gone into default and for which there is not a current market quotation; (iii) a security of an issuer that has entered into a restructuring; (iv) a security that has been delisted from a national exchange; (v) a security subject to trading collars for which no or limited trading takes place; and (vi) a security whose principal market has been temporarily closed at a time when, under normal conditions, it would be open. Securities valued in this manner are generally categorized as Level 2 or 3 in the hierarchy.
Investments in mutual funds, including money market funds, are valued at their respective NAVs at the close of business each day on the valuation date. These securities are generally categorized as Level 1 in the hierarchy.
Futures contracts are valued at the last posted settlement price on the market where such futures are primarily traded. These securities are generally categorized as Level 1 in the hierarchy.
Debt securities (other than convertible and municipal bonds) are valued at the evaluated bid prices (evaluated mean prices in the case of convertible and municipal bonds) supplied by a pricing agent or broker selected by the Valuation Designee, in consultation with the Subadvisor. The evaluations are market-based measurements processed through a pricing application and represents the pricing agent’s good faith determination as to what a holder may receive in an orderly transaction under market conditions. The rules-based logic utilizes valuation techniques that reflect participants’ assumptions and vary by asset class and per methodology, maximizing the use of relevant observable data including quoted prices for similar assets, benchmark yield curves and market corroborated inputs. The evaluated bid or mean prices are deemed by the Valuation
| 24 | MainStay Short Term Bond Fund |
Designee, in consultation with the Subadvisor, to be representative of market values at the regular close of trading of the Exchange on each valuation date. Debt securities purchased on a delayed delivery basis are marked to market daily until settlement at the forward settlement date. Debt securities, including corporate bonds, U.S. government and federal agency bonds, municipal bonds, foreign bonds, convertible bonds, asset-backed securities and mortgage-backed securities are generally categorized as Level 2 in the hierarchy.
Temporary cash investments acquired in excess of 60 days to maturity at the time of purchase are valued using the latest bid prices or using valuations based on a matrix system (which considers such factors as security prices, yields, maturities and ratings), both as furnished by independent pricing services. Temporary cash investments that mature in 60 days or less at the time of purchase ("Short-Term Investments") are valued using the amortized cost method of valuation, unless the use of such method would be inappropriate. The amortized cost method involves valuing a security at its cost on the date of purchase and thereafter assuming a constant amortization to maturity of the difference between such cost and the value on maturity date. Amortized cost approximates the current fair value of a security. Securities valued using the amortized cost method are not valued using quoted prices in an active market and are generally categorized as Level 2 in the hierarchy.
The information above is not intended to reflect an exhaustive list of the methodologies that may be used to value portfolio investments. The Valuation Procedures permit the use of a variety of valuation methodologies in connection with valuing portfolio investments. The methodology used for a specific type of investment may vary based on the market data available or other considerations. The methodologies summarized above may not represent the specific means by which portfolio investments are valued on any particular business day.
(B) Income Taxes. The Fund's policy is to comply with the requirements of the Internal Revenue Code of 1986, as amended (the “Internal Revenue Code”), applicable to regulated investment companies and to distribute all of its taxable income to the shareholders of the Fund within the allowable time limits.
The Manager evaluates the Fund’s tax positions to determine if the tax positions taken meet the minimum recognition threshold in connection with accounting for uncertainties in income tax positions taken or expected to be taken for the purposes of measuring and recognizing tax liabilities in the financial statements. Recognition of tax benefits of an uncertain tax position is permitted only to the extent the position is “more likely than not” to be sustained assuming examination by taxing authorities. The Manager analyzed the Fund's tax positions taken on federal, state and local income tax returns for all open tax years (for up to three tax years) and has concluded that no provisions for federal, state and local income tax are required in the Fund's financial statements. The Fund's federal, state and local income tax and federal excise tax returns for tax years for which the applicable statutes of limitations have not expired are subject to examination by the Internal Revenue Service and state and local departments of revenue.
(C) Dividends and Distributions to Shareholders. Dividends and distributions are recorded on the ex-dividend date. The Fund intends to declare and pay dividends from net investment income, if any, at least monthly and distributions from net realized capital and currency gains, if any, at least annually. Unless a shareholder elects otherwise, all dividends and distributions are reinvested at NAV in the same class of shares of the Fund. Dividends and distributions to shareholders are determined in accordance with federal income tax regulations and may differ from determinations using GAAP.
(D) Security Transactions and Investment Income. The Fund records security transactions on the trade date. Realized gains and losses on security transactions are determined using the identified cost method. Interest income is accrued as earned using the effective interest rate method and includes any realized gains and losses from repayments of principal on mortgage-backed securities. Distributions received from real estate investment trusts may be classified as dividends, capital gains and/or return of capital. Discounts and premiums on securities purchased, other than temporary cash investments that mature in 60 days or less at the time of purchase, for the Fund are accreted and amortized, respectively, on the effective interest rate method.
Investment income and realized and unrealized gains and losses on investments of the Fund are allocated pro rata to the separate classes of shares based upon their relative net assets on the date the income is earned or realized and unrealized gains and losses are incurred.
The Fund may place a debt security on non-accrual status and reduce related interest income by ceasing current accruals and writing off all or a portion of any interest receivables when the collection of all or a portion of such interest has become doubtful. A debt security is removed from non-accrual status when the issuer resumes interest payments or when collectability of interest is reasonably assured.
(E) Expenses. Expenses of the Trust are allocated to the individual Funds in proportion to the net assets of the respective Funds when the expenses are incurred, except where direct allocations of expenses can be made. Expenses (other than transfer agent expenses and fees incurred under the shareholder services plans and/or the distribution plans further discussed in Note 3(B)) are allocated to separate classes of shares pro rata based upon their relative net assets on the date the expenses are incurred. The expenses borne by the Fund, including those of related parties to the Fund, are shown in the Statement of Operations.
Additionally, the Fund may invest in mutual funds, which are subject to management fees and other fees that may cause the costs of investing in mutual funds to be greater than the costs of owning the underlying securities directly. These indirect expenses of mutual funds are not included in the amounts shown as expenses in the Statement of Operations or in the expense ratios included in the Financial Highlights.
(F) Use of Estimates. In preparing financial statements in conformity with GAAP, the Manager makes estimates and assumptions that affect the reported amounts and disclosures in the financial statements. Actual results could differ from those estimates and assumptions.
Notes to Financial Statements (continued)
(G) Futures Contracts. A futures contract is an agreement to purchase or sell a specified quantity of an underlying instrument at a specified future date and price, or to make or receive a cash payment based on the value of a financial instrument (e.g., foreign currency, interest rate, security or securities index). The Fund is subject to risks such as market price risk, leverage risk, liquidity risk, counterparty risk, operational risk, legal risk and/or interest rate risk in the normal course of investing in these contracts. Upon entering into a futures contract, the Fund is required to pledge to the broker or futures commission merchant an amount of cash and/or U.S. government securities equal to a certain percentage of the collateral amount, known as the “initial margin.” During the period the futures contract is open, changes in the value of the contract are recognized as unrealized appreciation or depreciation by marking to market such contract on a daily basis to reflect the market value of the contract at the end of each day’s trading. The Fund agrees to receive from or pay to the broker or futures commission merchant an amount of cash equal to the daily fluctuation in the value of the contract. Such receipts or payments are known as “variation margin.” When the futures contract is closed, the Fund records a realized gain or loss equal to the difference between the proceeds from (or cost of) the closing transaction and the Fund's basis in the contract.
The use of futures contracts involves, to varying degrees, elements of market risk in excess of the amount recognized in the Statement of Assets and Liabilities. The contract or notional amounts and variation margin reflect the extent of the Fund's involvement in open futures positions. There are several risks associated with the use of futures contracts as hedging techniques. There can be no assurance that a liquid market will exist at the time when the Fund seeks to close out a futures contract. If no liquid market exists, the Fund would remain obligated to meet margin requirements until the position is closed. Futures contracts may involve a small initial investment relative to the risk assumed, which could result in losses greater than if the Fund did not invest in futures contracts. Futures contracts may be more volatile than direct investments in the instrument underlying the futures and may not correlate to the underlying instrument, causing a given hedge not to achieve its objectives. The Fund's activities in futures contracts have minimal counterparty risk as they are conducted through regulated exchanges that guarantee the futures against default by the counterparty. In the event of a bankruptcy or insolvency of a futures commission merchant that holds margin on behalf of the Fund, the Fund may not be entitled to the return of the entire margin owed to the Fund, potentially resulting in a loss. The Fund may invest in futures contracts to seek enhanced returns or to reduce the risk of loss by hedging certain of its holdings. The Fund's investment in futures contracts and other derivatives may increase the volatility of the Fund's NAVs and may result in a loss to the Fund. Open futures contracts as of October 31, 2022, are shown in the Portfolio of Investments.
(H) Securities Lending. In order to realize additional income, the Fund may engage in securities lending, subject to the limitations set forth in the 1940 Act and relevant guidance by the staff of the Securities and Exchange Commission (“SEC”). If the Fund engages in securities lending,
the Fund will lend through its custodian, JPMorgan Chase Bank, N.A., ("JPMorgan"), acting as securities lending agent on behalf of the Fund. Under the current arrangement, JPMorgan will manage the Fund's collateral in accordance with the securities lending agency agreement between the Fund and JPMorgan, and indemnify the Fund against counterparty risk. The loans will be collateralized by cash (which may be invested in a money market fund) and/or non-cash collateral (which may include U.S. Treasury securities and/or U.S. government agency securities issued or guaranteed by the United States government or its agencies or instrumentalities) at least equal at all times to the market value of the securities loaned. Non-cash collateral held at year end is segregated and cannot be transferred by the Fund. The Fund bears the risk of delay in recovery of, or loss of rights in, the securities loaned. The Fund may also record a realized gain or loss on securities deemed sold due to a borrower’s inability to return securities on loan. The Fund bears the risk of any loss on investment of cash collateral. The Fund will receive compensation for lending its securities in the form of fees or it will retain a portion of interest earned on the investment of any cash collateral. The Fund will also continue to receive interest and dividends on the securities loaned and any gain or loss in the market price of the securities loaned that may occur during the term of the loan will be for the account of the Fund. Income earned from securities lending activities, if any, is reflected in the Statement of Operations. As of October 31, 2022, the Fund did not have any portfolio securities on loan.
(I) Dollar Rolls. The Fund may enter into dollar roll transactions in which it sells mortgage-backed securities ("MBS") from its portfolio to a counterparty from whom it simultaneously agrees to buy a similar security on a delayed delivery basis. The Fund generally transfers MBS where the MBS are "to be announced," therefore, the Fund accounts for these transactions as purchases and sales.
When accounted for as purchase and sales, the securities sold in connection with the dollar rolls are removed from the portfolio and a realized gain or loss is recognized. The securities the Fund has agreed to acquire are included at market value in the Portfolio of Investments and liabilities for such purchase commitments are included as payables for investments purchased. During the roll period, the Fund foregoes principal and interest paid on the securities. The Fund is compensated by the difference between the current sales price and the forward price for the future as well as by the earnings on the cash proceeds of the initial sale. Dollar rolls may be renewed without physical delivery of the securities subject to the contract. Dollar roll transactions involve certain risks, including the risk that the securities returned to the Fund at the end of the roll period, while substantially similar, could be inferior to what was initially sold to the counterparty.
(J) Delayed Delivery Transactions. The Fund may purchase or sell securities on a delayed delivery basis. These transactions involve a commitment by the Fund to purchase or sell securities for a predetermined price or yield, with payment and delivery taking place beyond the customary settlement period. When delayed delivery purchases are outstanding, the Fund will designate liquid assets in an
| 26 | MainStay Short Term Bond Fund |
amount sufficient to meet the purchase price. When purchasing a security on a delayed delivery basis, the Fund assumes the rights and risks of ownership of the security, including the risk of price and yield fluctuations, and takes such fluctuations into account when determining its NAV. The Fund may dispose of or renegotiate a delayed delivery transaction after it is entered into, and may sell delayed delivery securities before they are delivered, which may result in a realized gain or loss. When the Fund has sold a security it owns on a delayed delivery basis, the Fund does not participate in future gains and losses with respect to the security. Delayed delivery transactions as of October 31, 2022, are shown in the Portfolio of Investments.
(K) Debt Securities Risk. Investments in the Fund are not guaranteed, even though some of the Fund’s underlying investments are guaranteed by the U.S. government or its agencies or instrumentalities. The principal risk of mortgage-related and asset-backed securities is that the underlying debt may be prepaid ahead of schedule, if interest rates fall, thereby reducing the value of the Fund’s investment. If interest rates rise, less of the debt may be prepaid and the Fund may lose money. The Fund is subject to interest-rate risk and its holdings in bonds can lose principal value when interest rates rise. Bonds are also subject to credit risk, in which the bond issuer may fail to pay interest and principal in a timely manner.
The Fund may invest in foreign debt securities, which carry certain risks that are in addition to the usual risks inherent in domestic debt securities. These risks include those resulting from currency fluctuations, future adverse political or economic developments and possible imposition of currency exchange blockages or other foreign governmental laws or restrictions. These risks are likely to be greater in emerging markets than in developed markets. The ability of issuers of securities held by the Fund to meet their obligations may be affected by, among other things, economic or political developments in a specific country, industry or region.
(L) LIBOR Replacement Risk. The Fund may invest in certain debt securities, derivatives or other financial instruments that utilize the London Interbank Offered Rate ("LIBOR"), as a “benchmark” or “reference rate” for various interest rate calculations. As of January 1, 2022, the United Kingdom Financial Conduct Authority, which regulates LIBOR, ceased its active encouragement of banks to provide the quotations needed to sustain most LIBOR rates due to the absence of an active market for interbank unsecured lending and other reasons. However, the United Kingdom Financial Conduct Authority, the LIBOR administrator and other regulators announced that certain sterling and yen LIBOR settings would be calculated on a "synthetic" basis through the end of 2022 and the most widely used tenors of U.S. dollar LIBOR will continue until mid-2023. As a result, it is anticipated that the remaining LIBOR settings will be discontinued or will no longer be sufficiently robust to be representative of its underlying market around that time. Various financial industry groups will plan for that transition and certain regulators and industry groups have taken actions to establish alternative reference rates (e.g., the Secured Overnight Financing Rate, which measures the cost of
overnight borrowings through repurchase agreement transactions collateralized with U.S. Treasury securities and is intended to replace U.S. dollar LIBOR with certain adjustments). However, there are challenges to converting certain contracts and transactions to a new benchmark and neither the full effects of the transition process nor its ultimate outcome is known.
The elimination of LIBOR or changes to other reference rates or any other changes or reforms to the determination or supervision of reference rates could have an adverse impact on the market for, or value of, any securities or payments linked to those reference rates, which may adversely affect the Fund's performance and/or net asset value. Uncertainty and risk also remain regarding the willingness and ability of issuers and lenders to include enhanced provisions in new and existing contracts or instruments. Consequently, the transition away from LIBOR to other reference rates may lead to increased volatility and illiquidity in markets that are tied to LIBOR, fluctuations in values of LIBOR-related investments or investments in issuers that utilize LIBOR, increased difficulty in borrowing or refinancing and diminished effectiveness of hedging strategies, adversely affecting the Fund's performance. Furthermore, the risks associated with the expected discontinuation of LIBOR and transition may be exacerbated if the work necessary to effect an orderly transition to an alternative reference rate is not completed in a timely manner. While the transition away from LIBOR has already begun with no material adverse effect to the Fund's performance, the transition is expected to last through mid-2023 for some LIBOR tenors. The usefulness of LIBOR as a benchmark could deteriorate anytime during this transition period.
(M) Indemnifications. Under the Trust’s organizational documents, its officers and trustees are indemnified against certain liabilities that may arise out of performance of their duties to the Trust. Additionally, in the normal course of business, the Fund enters into contracts with third-party service providers that contain a variety of representations and warranties and that may provide general indemnifications. The Fund's maximum exposure under these arrangements is unknown, as this would involve future claims that may be made against the Fund that have not yet occurred. The Manager believes that the risk of loss in connection with these potential indemnification obligations is remote. However, there can be no assurance that material liabilities related to such obligations will not arise in the future, which could adversely impact the Fund.
(N) Quantitative Disclosure of Derivative Holdings. The following tables show additional disclosures related to the Fund's derivative and hedging activities, including how such activities are accounted for and their effect on the Fund's financial positions, performance and cash flows.
The Fund entered into futures contracts to hedge against anticipated changes in interest rates that might otherwise have an adverse effect upon the value of the Fund's securities as well as help manage the duration and yield curve positioning of the portolio. These derivatives are not accounted for as hedging instruments.
Notes to Financial Statements (continued)
Fair value of derivative instruments as of October 31, 2022:
| Asset Derivatives | Interest
Rate
Contracts
Risk | Total |
| Futures Contracts - Net Assets—Net unrealized appreciation on futures contracts (a) | $66,041 | $66,041 |
| Total Fair Value | $66,041 | $66,041 |
| (a) | Includes cumulative appreciation (depreciation) of futures contracts as reported in the Portfolio of Investments. Only current day’s variation margin is reported within the Statement of Assets and Liabilities. |
| Liability Derivatives | Interest
Rate
Contracts
Risk | Total |
| Futures Contracts - Net Assets—Net unrealized depreciation on futures contracts (a) | $(19,253) | $(19,253) |
| Total Fair Value | $(19,253) | $(19,253) |
| (a) | Includes cumulative appreciation (depreciation) of futures contracts as reported in the Portfolio of Investments. Only current day’s variation margin is reported within the Statement of Assets and Liabilities. |
The effect of derivative instruments on the Statement of Operations for the year ended October 31, 2022:
| Net Realized Gain (Loss) from: | Interest
Rate
Contracts
Risk | Total |
| Futures Contracts | $782,613 | $782,613 |
| Total Net Realized Gain (Loss) | $782,613 | $782,613 |
| Net Change in Unrealized Appreciation (Depreciation) | Interest
Rate
Contracts
Risk | Total |
| Futures Contracts | $(70,208) | $(70,208) |
| Total Net Change in Unrealized Appreciation (Depreciation) | $(70,208) | $(70,208) |
| Average Notional Amount | Total |
| Futures Contracts Long | $ 15,942,556 |
| Futures Contracts Short | $(11,995,313) |
Note 3–Fees and Related Party Transactions
(A) Manager and Subadvisor. New York Life Investments, a registered investment adviser and an indirect, wholly-owned subsidiary of New York Life Insurance Company ("New York Life"), serves as the Fund's Manager pursuant to an Amended and Restated Management Agreement ("Management Agreement"). The Manager provides offices, conducts clerical, recordkeeping and bookkeeping services and keeps most of the financial and accounting records required to be maintained by the Fund. Except for the portion of salaries and expenses that are the responsibility
of the Fund, the Manager pays the salaries and expenses of all personnel affiliated with the Fund and certain operational expenses of the Fund. During a portion of the year ended October 31, 2022, the Fund reimbursed New York Life Investments in an amount equal to the portion of the compensation of the Chief Compliance Officer attributable to the Fund. NYL Investors LLC ("NYL Investors" or ''Subadvisor''), a registered investment adviser and a direct, wholly-owned subsidiary of New York Life, serves as the Subadvisor to the Fund and is responsible for the day-to-day portfolio management of the Fund. Pursuant to the terms of a Subadvisory Agreement ("Subadvisory Agreement") between New York Life Investments and NYL Investors, New York Life Investments pays for the services of the Subadvisor.
Pursuant to the Management Agreement, the Fund pays the Manager a monthly fee for the services performed and the facilities furnished at an annual rate of the Fund’s average daily net assets as follows: 0.25% up to $1 billion and 0.20% in excess of $1 billion. During the year ended October 31, 2022, the effective management fee rate was 0.25% of the Fund’s average daily net assets, exclusive of any applicable waivers/reimbursements.
New York Life Investments has contractually agreed to waive fees and/or reimburse expenses so that Total Annual Fund Operating Expenses (excluding taxes, interest, litigation, extraordinary expenses, brokerage and other transaction expenses relating to the purchase or sale of portfolio investments and acquired (underlying) fund fees and expenses) do not exceed the following percentages of average daily net assets: Class A, 0.82%; Investor Class, 0.92%; Class I, 0.40% and SIMPLE Class, 1.17%. This agreement will remain in effect until February 28, 2023, and shall renew automatically for one-year terms unless New York Life Investments provides written notice of termination prior to the start of the next term or upon approval of the Board.
During the year ended October 31, 2022, New York Life Investments earned fees from the Fund in the amount of $195,554 and waived fees and/or reimbursed expenses in the amount of $112,251 and paid the Subadvisor fees of $41,651.
JPMorgan provides sub-administration and sub-accounting services to the Fund pursuant to an agreement with New York Life Investments. These services include calculating the daily NAVs of the Fund, maintaining the general ledger and sub-ledger accounts for the calculation of the Fund's NAVs, and assisting New York Life Investments in conducting various aspects of the Fund's administrative operations. For providing these services to the Fund, JPMorgan is compensated by New York Life Investments.
Pursuant to an agreement between the Trust and New York Life Investments, New York Life Investments is responsible for providing or procuring certain regulatory reporting services for the Fund. The Fund will reimburse New York Life Investments for the actual costs incurred by New York Life Investments in connection with providing or procuring these services for the Fund.
| 28 | MainStay Short Term Bond Fund |
(B) Distribution and Service Fees. The Trust, on behalf of the Fund, has entered into a distribution agreement with NYLIFE Distributors LLC (the “Distributor”), an affiliate of New York Life Investments. The Fund has adopted distribution plans (the “Plans”) in accordance with the provisions of Rule 12b-1 under the 1940 Act.
Pursuant to the Class A and Investor Class Plans, the Distributor receives a monthly fee from the Class A and Investor Class shares at an annual rate of 0.25% of the average daily net assets of the Class A and Investor Class shares for distribution and/or service activities as designated by the Distributor. Pursuant to the SIMPLE Class Plan, SIMPLE Class shares pay the Distributor a monthly distribution fee at an annual rate of 0.25% of the average daily net assets of the SIMPLE Class shares, along with a service fee at an annual rate of 0.25% of the average daily net assets of the SIMPLE Class shares, for a total 12b-1 fee of 0.50%. Class I shares are not subject to a distribution and/or service fee.
The Plans provide that the distribution and service fees are payable to the Distributor regardless of the amounts actually expended by the Distributor for distribution of the Fund's shares and service activities.
(C) Sales Charges. The Fund was advised by the Distributor that the amount of initial sales charges retained on sales of Class A and Investor Class shares during the year ended October 31, 2022, were $938 and $71, respectively.
The Fund was also advised that the Distributor retained CDSCs on redemptions of Class A shares during the year ended October 31, 2022, of $13,037.
(D) Transfer, Dividend Disbursing and Shareholder Servicing Agent. NYLIM Service Company LLC, an affiliate of New York Life Investments, is the Fund's transfer, dividend disbursing and shareholder servicing agent pursuant to an agreement between NYLIM Service Company LLC and the Trust. NYLIM Service Company LLC has entered into an agreement with DST Asset Manager Solutions, Inc. ("DST"), pursuant to which DST performs certain transfer agent services on behalf of NYLIM Service Company LLC. New York Life Investments has contractually agreed to limit the transfer agency expenses charged to the Fund’s share classes to a maximum of 0.35% of that share class’s average daily net assets on an annual basis after deducting any applicable Fund or class-level expense reimbursement or small account fees. This agreement will remain in effect until February 28, 2023, and shall renew automatically for one-year terms unless New York Life Investments provides written notice of termination prior to the start of the next term or upon approval of the Board. During the year ended October 31, 2022, transfer agent expenses incurred by the Fund and any
reimbursements, pursuant to the aforementioned Transfer Agency expense limitation agreement, were as follows:
| Class | Expense | Waived |
| Class A | $54,560 | $— |
| Investor Class | 14,256 | — |
| Class I | 16,663 | — |
| SIMPLE Class | 145 | — |
(E) Small Account Fee. Shareholders with small accounts adversely impact the cost of providing transfer agency services. In an effort to reduce total transfer agency expenses, the Fund has implemented a small account fee on certain types of accounts. As described in the Fund's prospectus, certain shareholders with an account balance of less than $1,000 ($5,000 for Class A share accounts) are charged an annual per account fee of $20 (assessed semi-annually), the proceeds from which offset transfer agent fees as reflected in the Statement of Operations. This small account fee will not apply to certain types of accounts as described further in the Fund’s prospectus.
(F) Capital. As of October 31, 2022, New York Life and its affiliates beneficially held shares of the Fund with the values and percentages of net assets as follows:
Note 4-Federal Income Tax
As of October 31, 2022, the cost and unrealized appreciation (depreciation) of the Fund’s investment portfolio, including applicable derivative contracts and other financial instruments, as determined on a federal income tax basis, were as follows:
| | Federal Tax
Cost | Gross
Unrealized
Appreciation | Gross
Unrealized
(Depreciation) | Net
Unrealized
Appreciation/
(Depreciation) |
| Investments in Securities | $102,044,733 | $6,783 | $(3,015,194) | $(3,008,411) |
As of October 31, 2022, the components of accumulated gain (loss) on a tax basis were as follows:
Ordinary
income | Accumulated
Capital
and Other
Gain (Loss) | Other
Temporary
Differences | Unrealized
Appreciation
(Depreciation) | Total
Accumulated
Gain (Loss) |
| $— | $(2,881,459) | $(3,820) | $(3,008,411) | $(5,893,690) |
The difference between book-basis and tax-basis unrealized appreciation (depreciation) is primarily due to the mark to market of futures contracts, cumulative bond amortization and wash sales adjustments. The other temporary differences are primarily due to dividends payable.
The following table discloses the current year reclassifications between total distributable earnings (loss) and additional paid-in capital arising
Notes to Financial Statements (continued)
from permanent differences; net assets as of October 31, 2022 were not affected.
| | Total
Distributable
Earnings (Loss) | Additional
Paid-In
Capital |
| | $35,951 | $(35,951) |
The reclassifications for the Fund are primarily due to distribution in excess of income.
As of October 31, 2022, for federal income tax purposes, capital loss carryforwards of $2,881,459, as shown in the table below, were available to the extent provided by the regulations to offset future realized gains of the Fund. Accordingly, no capital gains distributions are expected to be paid to shareholders until net gains have been realized in excess of such amounts.
Capital Loss
Available Through | Short-Term
Capital Loss
Amounts (000’s) | Long-Term
Capital Loss
Amounts (000’s) |
| Unlimited | $1,372 | $1,510 |
During the years ended October 31, 2022 and October 31, 2021, the tax character of distributions paid as reflected in the Statements of Changes in Net Assets was as follows:
| | 2022 | 2021 |
| Distributions paid from: | | |
| Ordinary Income | $1,203,524 | $3,910,597 |
| Long-Term Capital Gains | 276,271 | 3,833,384 |
| Total | $1,479,795 | $7,743,981 |
Note 5–Custodian
JPMorgan is the custodian of cash and securities held by the Fund. Custodial fees are charged to the Fund based on the Fund's net assets and/or the market value of securities held by the Fund and the number of certain transactions incurred by the Fund.
Note 6–Line of Credit
The Fund and certain other funds managed by New York Life Investments maintain a line of credit with a syndicate of banks in order to secure a source of funds for temporary purposes to meet unanticipated or excessive redemption requests.
Effective July 26, 2022, under the credit agreement (the “Credit Agreement”), the aggregate commitment amount is $600,000,000 with an additional uncommitted amount of $100,000,000. The commitment fee is an annual rate of 0.15% of the average commitment amount payable quarterly, regardless of usage, to JPMorgan, who serves as the agent to the syndicate. The commitment fee is allocated among the Fund and certain other funds managed by New York Life Investments based upon their respective net assets and other factors. Interest on any revolving credit loan is charged based upon the Federal Funds Rate, Daily Simple Secured Overnight Financing Rate ("SOFR") + 0.10%, or the
Overnight Bank Funding Rate, whichever is higher. The Credit Agreement expires on July 25, 2023, although the Fund, certain other funds managed by New York Life Investments and the syndicate of banks may renew the Credit Agreement for an additional year on the same or different terms or enter into a credit agreement with a different syndicate of banks. Prior to July 26, 2022, the aggregate commitment amount and the commitment fee were the same as those under the current Credit Agreement. During the year ended October 31, 2022, there were no borrowings made or outstanding with respect to the Fund under the Credit Agreement.
Note 7–Interfund Lending Program
Pursuant to an exemptive order issued by the SEC, the Fund, along with certain other funds managed by New York Life Investments, may participate in an interfund lending program. The interfund lending program provides an alternative credit facility that permits the Fund and certain other funds managed by New York Life Investments to lend or borrow money for temporary purposes directly to or from one another, subject to the conditions of the exemptive order. During the year ended October 31, 2022, there were no interfund loans made or outstanding with respect to the Fund.
Note 8–Purchases and Sales of Securities (in 000’s)
During the year ended October 31, 2022, purchases and sales of U.S. government securities were $157,232 and $131,328, respectively. Purchases and sales of securities, other than U.S. government securities and short-term securities, were $53,172 and $100,698, respectively.
Note 9–Capital Share Transactions
Transactions in capital shares for the years ended October 31, 2022 and October 31, 2021, were as follows:
| 30 | MainStay Short Term Bond Fund |
| Class A | Shares | Amount |
| Year ended October 31, 2022: | | |
| Shares sold | 3,689,130 | $ 34,875,937 |
| Shares issued to shareholders in reinvestment of distributions | 102,112 | 953,061 |
| Shares redeemed | (3,903,521) | (36,945,586) |
| Net increase (decrease) in shares outstanding before conversion | (112,279) | (1,116,588) |
| Shares converted into Class A (See Note 1) | 21,538 | 200,420 |
| Net increase (decrease) | (90,741) | $ (916,168) |
| Year ended October 31, 2021: | | |
| Shares sold | 6,267,414 | $ 62,326,081 |
| Shares issued to shareholders in reinvestment of distributions | 456,726 | 4,505,179 |
| Shares redeemed | (4,664,488) | (46,192,645) |
| Net increase (decrease) in shares outstanding before conversion | 2,059,652 | 20,638,615 |
| Shares converted into Class A (See Note 1) | 68,485 | 675,884 |
| Shares converted from Class A (See Note 1) | (356) | (3,504) |
| Net increase (decrease) | 2,127,781 | $ 21,310,995 |
| |
| Investor Class | Shares | Amount |
| Year ended October 31, 2022: | | |
| Shares sold | 45,619 | $ 432,794 |
| Shares issued to shareholders in reinvestment of distributions | 4,154 | 39,036 |
| Shares redeemed | (81,996) | (788,606) |
| Net increase (decrease) in shares outstanding before conversion | (32,223) | (316,776) |
| Shares converted from Investor Class (See Note 1) | (21,390) | (200,420) |
| Net increase (decrease) | (53,613) | $ (517,196) |
| Year ended October 31, 2021: | | |
| Shares sold | 115,111 | $ 1,149,157 |
| Shares issued to shareholders in reinvestment of distributions | 30,321 | 301,216 |
| Shares redeemed | (73,332) | (736,599) |
| Net increase (decrease) in shares outstanding before conversion | 72,100 | 713,774 |
| Shares converted into Investor Class (See Note 1) | 354 | 3,504 |
| Shares converted from Investor Class (See Note 1) | (68,020) | (675,884) |
| Net increase (decrease) | 4,434 | $ 41,394 |
| |
| Class I | Shares | Amount |
| Year ended October 31, 2022: | | |
| Shares sold | 2,731,378 | $ 24,980,514 |
| Shares issued to shareholders in reinvestment of distributions | 38,073 | 354,850 |
| Shares redeemed | (3,771,982) | (36,389,902) |
| Net increase (decrease) | (1,002,531) | $(11,054,538) |
| Year ended October 31, 2021: | | |
| Shares sold | 3,953,859 | $ 39,261,342 |
| Shares issued to shareholders in reinvestment of distributions | 288,798 | 2,852,102 |
| Shares redeemed | (2,720,084) | (27,441,108) |
| Net increase (decrease) | 1,522,573 | $ 14,672,336 |
| |
| SIMPLE Class | Shares | Amount |
| Year ended October 31, 2022: | | |
| Shares sold | 993 | $ 9,281 |
| Shares issued to shareholders in reinvestment of distributions | 40 | 375 |
| Net increase (decrease) | 1,033 | $ 9,656 |
| Year ended October 31, 2021: | | |
| Shares issued to shareholders in reinvestment of distributions | 225 | $ 2,239 |
| Net increase (decrease) | 225 | $ 2,239 |
Note 10–Other Matters
As of the date of this report, interest rates in the United States and many parts of the world, including certain European countries, are ascending from historically low levels. Thus, the Fund currently faces a heightened level of risk associated with rising interest rates. This could be driven by a variety of factors, including but not limited to central bank monetary policies, changing inflation or real growth rates, general economic conditions, increasing bond issuances or reduced market demand for low yielding investments.
An outbreak of COVID-19, first detected in December 2019, has developed into a global pandemic and has resulted in travel restrictions, closure of international borders, certain businesses and securities markets, restrictions on securities trading activities, prolonged quarantines, supply chain disruptions, and lower consumer demand, as well as general concern and uncertainty. In 2022, many countries lifted some or all restrictions related to COVID-19. However, the continued impact of COVID-19 and related variants is uncertain and could further adversely affect the global economy, national economies, individual issuers and capital markets in unforeseeable ways and result in a substantial and extended economic downturn. Developments that disrupt global economies and financial markets, such as COVID-19, may magnify factors that affect the Fund's performance.
Notes to Financial Statements (continued)
Note 11–Subsequent Events
In connection with the preparation of the financial statements of the Fund as of and for the year ended October 31, 2022, events and transactions subsequent to October 31, 2022, through the date the financial statements were issued have been evaluated by the Manager for possible adjustment and/or disclosure. No subsequent events requiring financial statement adjustment or disclosure have been identified.
| 32 | MainStay Short Term Bond Fund |
Report of Independent Registered Public Accounting Firm
To the Shareholders of the Fund and Board of Trustees
MainStay Funds Trust:
Opinion on the Financial Statements
We have audited the accompanying statement of assets and liabilities of MainStay Short Term Bond Fund (the Fund), one of the funds constituting MainStay Funds Trust, including the portfolio of investments, as of October 31, 2022, the related statement of operations for the year then ended, the statements of changes in net assets for each of the years in the two-year period then ended, and the related notes (collectively, the financial statements) and the financial highlights for each of the years or periods in the five-year period then ended. In our opinion, the financial statements and financial highlights present fairly, in all material respects, the financial position of the Fund as of October 31, 2022, the results of its operations for the year then ended, the changes in its net assets for each of the years in the two-year period then ended, and the financial highlights for each of the years or periods in the five-year period then ended, in conformity with U.S. generally accepted accounting principles.
Basis for Opinion
These financial statements and financial highlights are the responsibility of the Fund's management. Our responsibility is to express an opinion on these financial statements and financial highlights based on our audits. We are a public accounting firm registered with the Public Company Accounting Oversight Board (United States) (PCAOB) and are required to be independent with respect to the Fund in accordance with the U.S. federal securities laws and the applicable rules and regulations of the Securities and Exchange Commission and the PCAOB.
We conducted our audits in accordance with the standards of the PCAOB. Those standards require that we plan and perform the audit to obtain reasonable assurance about whether the financial statements and financial highlights are free of material misstatement, whether due to error or fraud. Our audits included performing procedures to assess the risks of material misstatement of the financial statements and financial highlights, whether due to error or fraud, and performing procedures that respond to those risks. Such procedures included examining, on a test basis, evidence regarding the amounts and disclosures in the financial statements and financial highlights. Such procedures also included confirmation of securities owned as of October 31, 2022, by correspondence with custodians and brokers; when replies were not received from brokers, we performed other auditing procedures. Our audits also included evaluating the accounting principles used and significant estimates made by management, as well as evaluating the overall presentation of the financial statements and financial highlights. We believe that our audits provide a reasonable basis for our opinion.

We have served as the auditor of one or more New York Life Investment Management investment companies since 2003.
Philadelphia, Pennsylvania
December 23, 2022
Federal Income Tax Information
(Unaudited)
The Fund is required under the Internal Revenue Code to advise shareholders in a written statement as to the federal tax status of dividends paid by the Fund during such fiscal years. Accordingly, the Fund paid $276,334 as long term capital gain distributions.
For the fiscal year ended October 31, 2022, the Fund designated approximately $2,679 under the Internal Revenue Code as qualified dividend income eligible for reduced tax rates.
The dividends paid by the Fund during the fiscal year ended October 31, 2022 should be multiplied by 0.22% to arrive at the amount eligible for the corporate dividend-received deduction.
In February 2023, shareholders will receive an IRS Form 1099-DIV or substitute Form 1099, which will show the federal tax status of the distributions received by shareholders in calendar year 2022. The amounts that will be reported on such 1099-DIV or substitute Form 1099 will be the amounts you are to use on your federal income tax return and will differ from the amounts which we must report for the Fund's fiscal year ended October 31, 2022.
Proxy Voting Policies and Procedures and Proxy Voting Record
The Fund is required to file with the SEC its proxy voting record for the 12-month period ending June 30 on Form N-PX. A description of the policies and procedures that are used to vote proxies relating to portfolio securities of the Fund is available free of charge upon request by calling 800-624-6782 or visiting the SEC’s website at www.sec.gov. The most recent Form N-PX or proxy voting record is available free of charge upon request by calling 800-624-6782; visiting newyorklifeinvestments.com; or visiting the SEC’s website at www.sec.gov.
Shareholder Reports and Quarterly Portfolio Disclosure
The Fund is required to file its complete schedule of portfolio holdings with the SEC 60 days after its first and third fiscal quarter on Form N-PORT. The Fund's holdings report is available free of charge upon request by calling New York Life Investments at 800-624-6782.
| 34 | MainStay Short Term Bond Fund |
Board of Trustees and Officers (Unaudited)
The Trustees and officers of the Fund are listed below. The Board oversees the MainStay Group of Funds (which consists of MainStay Funds and MainStay Funds Trust), MainStay VP Funds Trust, MainStay MacKay DefinedTerm Municipal Opportunities Fund, MainStay CBRE Global Infrastructure Megatrends Fund, the Manager and the Subadvisors, and elects the officers of the Funds who are responsible for the day-to-day operations of the Fund. Information pertaining to the Trustees and officers is set forth below. Each Trustee serves until his or her successor is
elected and qualified or until his or her resignation, death or removal. Under the Board’s retirement policy, unless an exception is made, a Trustee must tender his or her resignation by the end of the calendar year during which he or she reaches the age of 75. The business address of each Trustee and officer listed below is 51 Madison Avenue, New York, New York 10010. None of the Trustees are “interested persons” (as defined by the 1940 Act and rules adopted by the SEC thereunder) of the Fund (“Independent Trustees”).
| | Name and
Year of Birth | Term of Office,
Position(s) Held and
Length of Service | Principal Occupation(s)
During Past Five Years | Number of
Portfolios in
Fund Complex
Overseen by
Trustee | Other Directorships
Held by Trustee |
| | | | | | |
| | David H. Chow
1957 | MainStay Funds: Trustee since 2016, Advisory Board Member (June 2015 to December 2015);MainStay Funds Trust:
Trustee since January 2016, Advisory Board Member (June 2015 to December 2015) | Founder and CEO, DanCourt Management, LLC since 1999 | 78 | MainStay VP Funds Trust: Trustee since January 2016, Advisory Board Member (June 2015 to December 2015) (31 portfolios);
MainStay MacKay DefinedTerm Municipal Opportunities Fund: Trustee since January 2016, Advisory Board Member (June 2015 to December 2015);
MainStay CBRE Global Infrastructure Megatrends Fund: Trustee since June 2021; VanEck Vectors Group of Exchange-Traded Funds: Independent Chairman of the Board of Trustees since 2008 and Trustee since 2006 (56 portfolios); and Berea College of Kentucky: Trustee since 2009, Chair of the Investment Committee since 2018 |
| | Susan B. Kerley
1951 | MainStay Funds: Chairman since 2017 and Trustee since 2007;MainStay Funds Trust:
Chairman since 2017 and Trustee since 1990** | President, Strategic Management Advisors LLC since 1990 | 78 | MainStay VP Funds Trust: Chairman since January 2017 and Trustee since 2007 (31 portfolios)**;
MainStay MacKay DefinedTerm Municipal Opportunities Fund: Chairman since 2017 and Trustee since 2011;
MainStay CBRE Global Infrastructure Megatrends Fund: Trustee since June 2021; and Legg Mason Partners Funds: Trustee since 1991 (45 portfolios) |
| | Alan R. Latshaw
1951 | MainStay Funds: Trustee since 2006;MainStay Funds Trust:
Trustee since 2007*** | Retired; Partner, Ernst & Young LLP (2002 to 2003); Partner, Arthur Andersen LLP (1989 to 2002); Consultant to the MainStay Funds Audit and Compliance Committee (2004 to 2006) | 78 | MainStay VP Funds Trust: Trustee since 2007 (31 portfolios)**;
MainStay MacKay DefinedTerm Municipal Opportunities Fund: Trustee since 2011; and
MainStay CBRE Global Infrastructure Megatrends Fund: Trustee since June 2021 |
Board of Trustees and Officers (Unaudited) (continued)
| | Name and
Year of Birth | Term of Office,
Position(s) Held and
Length of Service | Principal Occupation(s)
During Past Five Years | Number of
Portfolios in
Fund Complex
Overseen by
Trustee | Other Directorships
Held by Trustee |
| | | | | | |
| | Karen Hammond
1956 | MainStay Funds: Trustee since December 2021, Advisory Board Member (June 2021 to December 2021);MainStay Funds Trust:
Trustee since December 2021, Advisory Board Member (June 2021 to December 2021)
| Retired, Managing Director, Devonshire Investors (2007 to 2013); Senior Vice President, Fidelity Management & Research Co. (2005 to 2007); Senior Vice President and Corporate Treasurer, FMR Corp. (2003 to 2005); Chief Operating Officer, Fidelity Investments Japan (2001 to 2003) | 78 | MainStay VP Funds Trust: Trustee since December 2021, Advisory Board Member (June 2021 to December 2021) (31 Portfolios);
MainStay MacKay DefinedTerm Municipal Opportunities Fund: Trustee since December 2021, Advisory Board Member (June 2021 to December 2021);
MainStay CBRE Global Infrastructure Megatrends Fund: Trustee since December 2021, Advisory Board Member (June 2021 to December 2021);
Two Harbors Investment Corp.: Director since 2018;
Rhode Island State Investment Commission: Member since 2017; and
Blue Cross Blue Shield of Rhode Island: Director since 2019 |
| | Jacques P. Perold
1958 | MainStay Funds: Trustee since 2016, Advisory Board Member (June 2015 toDecember 2015);MainStay Funds Trust:
Trustee since January 2016, Advisory Board Member (June 2015 to December 2015) | Founder and Chief Executive Officer, CapShift Advisors LLC (since 2018); President, Fidelity Management & Research Company (2009 to 2014); President and Chief Investment Officer, Geode Capital Management, LLC (2001 to 2009) | 78 | MainStay VP Funds Trust: Trustee since January 2016, Advisory Board Member (June 2015 to December 2015) (31 portfolios);
MainStay MacKay DefinedTerm Municipal Opportunities Fund: Trustee since January 2016, Advisory Board Member (June 2015 to December 2015);
MainStay CBRE Global Infrastructure Megatrends Fund: Trustee since June 2021; Partners in Health: Trustee since 2019; Allstate Corporation: Director since 2015; and MSCI Inc.: Director since 2017 |
| | Richard S. Trutanic
1952 | MainStay Funds: Trustee since 1994;MainStay Funds Trust:
Trustee since 2007*** | Chairman and Chief Executive Officer, Somerset & Company (financial advisory firm) since 2004; Managing Director, The Carlyle Group (private investment firm) (2002 to 2004); Senior Managing Director, Partner and Board Member, Groupe Arnault S.A. (private investment firm) (1999 to 2002) | 78 | MainStay VP Funds Trust: Trustee since 2007 (31 portfolios)**;
MainStay MacKay DefinedTerm Municipal Opportunities Fund: Trustee since 2011; and MainStay CBRE Global Infrastructure Megatrends Fund: Trustee since June 2021 |
| ** | Includes prior service as a Director of MainStay VP Series Fund, Inc., the predecessor to MainStay VP Funds Trust. |
| *** | Includes prior service as a Director/Trustee of certain predecessor entities to MainStay Funds Trust. |
| 36 | MainStay Short Term Bond Fund |
| | Name and
Year of Birth | Position(s) Held and
Length of Service | Principal Occupation(s)
During Past Five Years | |
| | | | | |
| | Kirk C. Lehneis
1974 | President, MainStay Funds, MainStay Funds Trust since 2017 | Chief Operating Officer and Senior Managing Director (since 2016), New York Life Investment Management LLC and New York Life Investment Management Holdings LLC; Member of the Board of Managers (since 2017) and Senior Managing Director (since 2018), NYLIFE Distributors LLC; Chairman of the Board and Senior Managing Director, NYLIM Service Company LLC (since 2017); Trustee, President and Principal Executive Officer of IndexIQ Trust, IndexIQ ETF Trust and IndexIQ Active ETF Trust (since January 2018); President, MainStay CBRE Global Infrastructure Megatrends Fund (since 2021), MainStay MacKay DefinedTerm Municipal Opportunities Fund and MainStay VP Funds Trust (since 2017); Senior Managing Director, Global Product Development (From 2015-2016); Managing Director, Product Development (2010 to 2015), New York Life Investment Management LLC | |
| | Jack R. Benintende
1964 | Treasurer and Principal Financial and Accounting Officer, MainStay Funds (since 2007), MainStay Funds Trust (since 2009) | Managing Director, New York Life Investment Management LLC (since 2007); Treasurer and Principal Financial and Accounting Officer, MainStay CBRE Global Infrastructure Megatrends Fund (since 2021), MainStay MacKay DefinedTerm Municipal Opportunities Fund (since 2011) and MainStay VP Funds Trust (since 2007)** and Assistant Treasurer, New York Life Investment Management Holdings LLC (2008 to 2012) | |
| | J. Kevin Gao
1967 | Secretary and Chief Legal Officer, MainStay Funds and MainStay Funds Trust (since 2010) | Managing Director and Associate General Counsel, New York Life Investment Management LLC (since 2010); Secretary and Chief Legal Officer and MainStay CBRE Global Infrastructure Megatrends Fund (since 2021), MainStay MacKay DefinedTerm Municipal Opportunities Fund (since 2011) and MainStay VP Funds Trust (since 2010)** | |
| | Scott T. Harrington
1959 | Vice President— Administration, MainStay Funds (since 2009), MainStay Funds Trust (since 2009) | Managing Director, New York Life Investment Management LLC (including predecessor advisory organizations) (since 2000); Member of the Board of Directors, New York Life Trust Company (since 2009); Vice President—Administration, MainStay CBRE Global Infrastructure Megatrends Fund (since 2021), MainStay MacKay DefinedTerm Municipal Opportunities Fund (since 2011) and MainStay VP Funds Trust (since 2005)** | |
| | Kevin M. Gleason
1967 | Vice President and Chief Compliance Officer, MainStay Funds and MainStay Funds Trust (since June 2022) | Vice President and Chief Compliance Officer, IndexIQ, IndexIQ ETF Trust and Index IQ Active ETF Trust (since June 2022); Vice President and Chief Compliance Officer, MainStay CBRE Global Infrastructure Megatrends Fund, MainStay VP Funds Trust and MainStay MacKay DefinedTerm Municipal Opportunities Fund (since June 2022); Senior Vice President, Voya Investment Management and Chief Compliance Officer, Voya Family of Funds (2012-2022) | |
| * | The officers listed above are considered to be “interested persons” of the MainStay Group of Funds, MainStay VP Funds Trust, MainStay CBRE Global Infrastructure Megatrends Fund and MainStay MacKay DefinedTerm Municipal Opportunities Fund within the meaning of the 1940 Act because of their affiliation with the MainStay Group of Funds, New York Life Insurance Company and/or its affiliates, including New York Life Investment Management LLC, NYLIM Service Company LLC, NYLIFE Securities LLC and/or NYLIFE Distributors LLC, as described in detail in the column captioned “Principal Occupation(s) During Past Five Years.” Officers are elected annually by the Board. |
| ** | Includes prior service as an Officer of MainStay VP Series Fund, Inc., the predecessor to MainStay VP Funds Trust. |
Officers of the Trust (Who are not Trustees)*
This page intentionally left blank.
Equity
U.S. Equity
MainStay Epoch U.S. Equity Yield Fund
MainStay S&P 500 Index Fund1
MainStay Winslow Large Cap Growth Fund
MainStay WMC Enduring Capital Fund
MainStay WMC Growth Fund
MainStay WMC Small Companies Fund
MainStay WMC Value Fund
International Equity
MainStay Epoch International Choice Fund
MainStay MacKay International Equity Fund
MainStay WMC International Research Equity Fund
Emerging Markets Equity
MainStay Candriam Emerging Markets Equity Fund
Global Equity
MainStay Epoch Capital Growth Fund
MainStay Epoch Global Equity Yield Fund
Fixed Income
Taxable Income
MainStay Candriam Emerging Markets Debt Fund
MainStay Floating Rate Fund
MainStay MacKay High Yield Corporate Bond Fund
MainStay MacKay Short Duration High Yield Fund
MainStay MacKay Strategic Bond Fund
MainStay MacKay Total Return Bond Fund
MainStay MacKay U.S. Infrastructure Bond Fund
MainStay Short Term Bond Fund
Tax-Exempt Income
MainStay MacKay California Tax Free Opportunities Fund2
MainStay MacKay High Yield Municipal Bond Fund
MainStay MacKay New York Tax Free Opportunities Fund3
MainStay MacKay Short Term Municipal Fund
MainStay MacKay Strategic Municipal Allocation Fund
MainStay MacKay Tax Free Bond Fund
Money Market
MainStay Money Market Fund
Mixed Asset
MainStay Balanced Fund
MainStay Income Builder Fund
MainStay MacKay Convertible Fund
Speciality
MainStay CBRE Global Infrastructure Fund
MainStay CBRE Real Estate Fund
MainStay Cushing MLP Premier Fund
Asset Allocation
MainStay Conservative Allocation Fund
MainStay Conservative ETF Allocation Fund
MainStay Defensive ETF Allocation Fund
MainStay Equity Allocation Fund
MainStay Equity ETF Allocation Fund
MainStay ESG Multi-Asset Allocation Fund
MainStay Growth Allocation Fund
MainStay Growth ETF Allocation Fund
MainStay Moderate Allocation Fund
MainStay Moderate ETF Allocation Fund
Manager
New York Life Investment Management LLC
New York, New York
Subadvisors
Candriam4
Strassen, Luxembourg
CBRE Investment Management Listed Real Assets LLC
Radnor, Pennsylvania
Cushing Asset Management, LP
Dallas, Texas
Epoch Investment Partners, Inc.
New York, New York
MacKay Shields LLC4
New York, New York
NYL Investors LLC4
New York, New York
Wellington Management Company LLP
Boston, Massachusetts
Winslow Capital Management, LLC
Minneapolis, Minnesota
Legal Counsel
Dechert LLP
Washington, District of Columbia
Independent Registered Public Accounting Firm
KPMG LLP
Philadelphia, Pennsylvania
Distributor
NYLIFE Distributors LLC4
Jersey City, New Jersey
Custodian
JPMorgan Chase Bank, N.A.
New York, New York
1.
Prior to February 28, 2022, the Fund's name was MainStay MacKay S&P 500 Index Fund.
| 2. | This Fund is registered for sale in AZ, CA, NV, OR, TX, UT, WA and MI (Class A and Class I shares only), and CO, FL, GA, HI, ID, MA, MD, NH, NJ and NY (Class I shares only). |
| 3. | This Fund is registered for sale in CA, CT, DE, FL, MA, NJ, NY and VT. |
| 4. | An affiliate of New York Life Investment Management LLC. |
Not part of the Annual Report
For more information
800-624-6782
newyorklifeinvestments.com
“New York Life Investments” is both a service mark, and the common trade name, of certain investment advisors affiliated with New York Life Insurance Company. The MainStay Funds® are managed by New York Life Investment Management LLC and distributed by NYLIFE Distributors LLC, 30 Hudson Street, Jersey City, NJ 07302, a wholly owned subsidiary of New York Life Insurance Company. NYLIFE Distributors LLC is a Member FINRA/SIPC.
©2022 NYLIFE Distributors LLC. All rights reserved.
| 5013897.2MS229-22 | MSSTB11-12/22 |
(NYLIM) NL228
MainStay U.S. Government Liquidity Fund
Annual Report
October 31, 2022
Sign up for e-delivery of your shareholder reports. For full details on e-delivery, including who can participate and what you can receive via e-delivery,
please log in to newyorklifeinvestments.com/accounts.
| Not FDIC/NCUA Insured | Not a Deposit | May Lose Value | No Bank Guarantee | Not Insured by Any Government Agency |
This page intentionally left blank
Investors should refer to the Fund’s Summary Prospectus and/or Prospectus and consider the Fund’s investment objectives, strategies, risks, charges and expenses carefully before investing. The Summary Prospectus and/or Prospectus contain this and other information about the Fund. You may obtain copies of the Fund’s Summary Prospectus, Prospectus and Statement of Additional Information, which includes information about the MainStay Funds Trust's Trustees, free of charge, upon request, by calling toll-free 800-624-6782, by writing to NYLIFE Distributors LLC, Attn: MainStay Marketing Department, 30 Hudson Street, Jersey City, NJ 07302 or by sending an e-mail to MainStayShareholderServices@nylim.com. These documents are also available via the MainStay Funds’ website at newyorklifeinvestments.com. Please read the Fund’s Summary Prospectus and/or Prospectus carefully before investing.
Cost in Dollars of a $1,000 Investment in MainStay U.S. Government Liquidity Fund (Unaudited)
The example below is intended to describe the fees and expenses borne by shareholders during the six-month period from May 1, 2022 to October 31, 2022, and the impact of those costs on your investment.
Example
As a shareholder of the Fund you incur two types of costs: (1) transaction costs, including exchange fees and sales charges (loads) on purchases (as applicable), and (2) ongoing costs, including management fees, distribution and/or service (12b-1) fees and other Fund expenses (as applicable). This example is intended to help you understand your ongoing costs (in dollars) of investing in the Fund and to compare these costs with the ongoing costs of investing in other mutual funds. The example is based on an investment of $1,000 made at the beginning of the six-month period and held for the entire period from May 1, 2022 to October 31, 2022.
This example illustrates your Fund’s ongoing costs in two ways:
Actual Expenses
The second and third data columns in the table below provide information about actual account values and actual expenses. You may use the information in these columns, together with the amount you invested, to estimate the expenses that you paid during the six months ended October 31, 2022. Simply divide your account value by $1,000 (for example, an $8,600 account value divided by $1,000 = 8.6), then
multiply the result by the number under the heading entitled “Expenses Paid During Period” to estimate the expenses you paid on your account during this period.
Hypothetical Example for Comparison Purposes
The fourth and fifth data columns in the table below provide information about hypothetical account values and hypothetical expenses based on the Fund’s actual expense ratio and an assumed rate of return of 5% per year before expenses, which is not the Fund’s actual return. The hypothetical account values and expenses may not be used to estimate the actual ending account balances or expenses you paid for the six-month period shown. You may use this information to compare the ongoing costs of investing in the Fund with the ongoing costs of investing in other mutual funds. To do so, compare this 5% hypothetical example with the 5% hypothetical examples that appear in the shareholder reports of the other mutual funds.
Please note that the expenses shown in the table are meant to highlight your ongoing costs only and do not reflect any transactional costs, such as exchange fees or sales charges (loads). Therefore, the fourth and fifth data columns of the table are useful in comparing ongoing costs only and will not help you determine the relative total costs of owning different funds. In addition, if these transactional costs were included, your costs would have been higher.
| Share Class | Beginning
Account
Value
5/1/22 | Ending Account
Value (Based
on Actual
Returns and
Expenses)
10/31/22 | Expenses
Paid
During
Period1 | Ending Account
Value (Based
on Hypothetical
5% Annualized
Return and
Actual Expenses)
10/31/22 | Expenses
Paid
During
Period1 | Net Expense
Ratio
During
Period2 |
| Class I Shares | $1,000.00 | $1,007.40 | $0.76 | $1,024.45 | $0.77 | 0.15% |
| 1. | Expenses are equal to the Fund’s annualized expense ratio of each class multiplied by the average account value over the period, divided by 365 and multiplied by 184 (to reflect the six-month period). The table above represents the actual expenses incurred during the six-month period. In addition to the fees and expenses which the Fund bears directly, it also indirectly bears a pro rata share of the fees and expenses of the underlying funds in which it invests. Such indirect expenses are not included in the above-reported expense figures. |
| 2. | Expenses are equal to the Fund's annualized expense ratio to reflect the six-month period. |
| 4 | MainStay U.S. Government Liquidity Fund |
Portfolio Composition as of October 31, 2022 (Unaudited)
| Other Assets, Less Liabilities | -5.6 |
See Portfolio of Investments beginning on page 6 for specific holdings within these categories. The Fund's holdings are subject to change.
Portfolio of Investments October 31, 2022†
| | Principal
Amount | | Value |
| Short-Term Investments 105.6% |
| U.S. Treasury Debt 105.6% |
| U.S. Treasury Bills (a) | | | |
| 0.000%, due 11/29/22 | $ 75,000,000 | | $ 74,791,283 |
| 2.725%, due 11/1/22 | 206,688,000 | | 206,688,000 |
| 2.832%, due 11/8/22 | 410,819,000 | | 410,593,483 |
| 3.092%, due 11/15/22 | 410,125,000 | | 409,633,092 |
| 3.326%, due 11/22/22 | 309,457,000 | | 308,858,029 |
Total Short-Term Investments
(Cost $1,410,563,887) | 105.6% | | 1,410,563,887 |
| Other Assets, Less Liabilities | (5.6) | | (74,906,619) |
| Net Assets | 100.0% | | $ 1,335,657,268 |
| † | Percentages indicated are based on Fund net assets. |
| (a) | Interest rate shown represents yield to maturity. |
The following is a summary of the fair valuations according to the inputs used as of October 31, 2022, for valuing the Fund’s assets:
| Description | Quoted
Prices in
Active
Markets for
Identical
Assets
(Level 1) | | Significant
Other
Observable
Inputs
(Level 2) | | Significant
Unobservable
Inputs
(Level 3) | | Total |
| Asset Valuation Inputs | | | | | | | |
| Investments in Securities (a) | | | | | | | |
| Short-Term Investments | | | | | | | |
| U.S. Treasury Debt | $ — | | $ 1,410,563,887 | | $ — | | $ 1,410,563,887 |
| (a) | For a complete listing of investments and their industries, see the Portfolio of Investments. |
The notes to the financial statements are an integral part of, and should be read in conjunction with, the financial statements.
| 6 | MainStay U.S. Government Liquidity Fund |
Statement of Assets and Liabilities as of October 31, 2022
| Assets |
Investment in securities, at value
(amortized cost $1,410,563,887) | $1,410,563,887 |
| Cash | 65,277 |
| Receivables: | |
| Fund shares sold | 1,675 |
| Other assets | 2,297 |
| Total assets | 1,410,633,136 |
| Liabilities |
| Payables: | |
| Investment securities purchased | 74,791,283 |
| Manager (See Note 3) | 128,429 |
| Professional fees | 28,206 |
| Shareholder communication | 9,803 |
| Custodian | 6,012 |
| Accrued expenses | 12,135 |
| Total liabilities | 74,975,868 |
| Net assets | $1,335,657,268 |
| Composition of Net Assets |
| Shares of beneficial interest outstanding (par value of $.001 per share) unlimited number of shares authorized | $ 1,335,570 |
| Additional paid-in-capital | 1,334,332,158 |
| | 1,335,667,728 |
| Total distributable earnings (loss) | (10,460) |
| Net assets | $1,335,657,268 |
| Class I | |
| Net assets applicable to outstanding shares | $1,335,657,268 |
| Shares of beneficial interest outstanding | 1,335,569,637 |
| Net asset value per share outstanding | $ 1.00 |
The notes to the financial statements are an integral part of, and should be read in conjunction with, the financial statements.
7
Statement of Operations for the year ended October 31, 2022
| Investment Income (Loss) |
| Income | |
| Interest | $10,745,372 |
| Expenses | |
| Manager (See Note 3) | 1,550,746 |
| Professional fees | 131,403 |
| Registration | 94,841 |
| Trustees | 30,070 |
| Custodian | 24,051 |
| Shareholder communication | 3,466 |
| Miscellaneous | 33,975 |
| Total expenses before waiver/reimbursement | 1,868,552 |
| Expense waiver/reimbursement from Manager (See Note 3) | (457,894) |
| Net expenses | 1,410,658 |
| Net investment income (loss) | 9,334,714 |
| Realized Gain (Loss) |
| Net realized gain (loss) on investments | (65,853) |
| Net increase (decrease) in net assets resulting from operations | $ 9,268,861 |
The notes to the financial statements are an integral part of, and should be read in conjunction with, the financial statements.
| 8 | MainStay U.S. Government Liquidity Fund |
Statements of Changes in Net Assets
for the years ended October 31, 2022 and October 31, 2021
| | 2022 | 2021 |
| Increase (Decrease) in Net Assets |
| Operations: | | |
| Net investment income (loss) | $ 9,334,714 | $ 129,779 |
| Net realized gain (loss) | (65,853) | 5,063 |
| Net increase (decrease) in net assets resulting from operations | 9,268,861 | 134,842 |
| Distributions to shareholders | (9,334,713) | (129,740) |
| Capital share transactions: | | |
| Net proceeds from sales of shares | 13,330,125,923 | 16,007,977,798 |
| Net asset value of shares issued to shareholders in reinvestment of distributions | 9,256,470 | 124,927 |
| Cost of shares redeemed | (14,523,717,926) | (14,127,149,875) |
| Increase (decrease) in net assets derived from capital share transactions | (1,184,335,533) | 1,880,952,850 |
| Net increase (decrease) in net assets | (1,184,401,385) | 1,880,957,952 |
| Net Assets |
| Beginning of year | 2,520,058,653 | 639,100,701 |
| End of year | $ 1,335,657,268 | $ 2,520,058,653 |
The notes to the financial statements are an integral part of, and should be read in conjunction with, the financial statements.
9
Financial Highlights selected per share data and ratios
| | Year Ended October 31, | | July 2, 2018^ through
October 31,
2018 |
| Class I | 2022 | | 2021 | | 2020 | | 2019 | |
| Net asset value at beginning of period | $ 1.00 | | $ 1.00 | | $ 1.00 | | $ 1.00 | | $ 1.00 |
| Net investment income (loss) | 0.01 | | 0.00‡ | | 0.01 | | 0.02 | | 0.01 |
| Total from investment operations | 0.01 | | 0.00‡ | | 0.01 | | 0.02 | | 0.01 |
| Less distributions: | | | | | | | | | |
| From net investment income | (0.01) | | (0.00)‡ | | (0.01) | | (0.02) | | (0.01) |
| Net asset value at end of period | $ 1.00 | | $ 1.00 | | $ 1.00 | | $ 1.00 | | $ 1.00 |
| Total investment return (a) | 0.76% | | 0.01% | | 0.55% | | 2.14% | | 0.61% |
| Ratios (to average net assets)/Supplemental Data: | | | | | | | | | |
| Net investment income (loss) | 0.72% | | 0.01% | | 0.62% | | 2.11% | | 1.82%†† |
| Net expenses | 0.11% | | 0.03% | | 0.13% | | 0.15% | | 0.15%†† |
| Expenses (before waiver/reimbursement) | 0.14% | | 0.14% | | 0.13% | | 0.15% | | 0.16%†† |
| Net assets at end of period (in 000’s) | $ 1,335,657 | | $ 2,520,059 | | $ 639,101 | | $ 914,477 | | $ 868,444 |
| ^ | Inception date. |
| ‡ | Less than one cent per share. |
| †† | Annualized. |
| (a) | Total investment return is calculated exclusive of sales charges and assumes the reinvestment of distributions. For periods of less than one year, total return is not annualized. |
The notes to the financial statements are an integral part of, and should be read in conjunction with, the financial statements.
| 10 | MainStay U.S. Government Liquidity Fund |
Notes to Financial Statements
Note 1-Organization and Business
MainStay Funds Trust (the “Trust”) was organized as a Delaware statutory trust on April 28, 2009. The Trust is registered under the Investment Company Act of 1940, as amended (the “1940 Act”), as an open-end management investment company, and is comprised of thirty-three funds (collectively referred to as the “Funds”). These financial statements and notes relate to the MainStay U.S. Government Liquidity Fund (the "Fund"), a “diversified” fund, as that term is defined in the 1940 Act, as interpreted or modified by regulatory authorities having jurisdiction, from time to time.
The following table lists the Fund's share classes that have been registered and commenced operations:
| Class | Commenced Operations |
| Class I | July 2, 2018 |
Shares of the Fund are offered and are redeemed at a price equal to their net asset value (“NAV”) per share. No sales or redemption charge is applicable to the purchase or redemption of the Fund’s shares.
The Fund's investment objective is to seek a high level of current income while preserving capital and maintaining liquidity.
Note 2–Significant Accounting Policies
The Fund is an investment company and accordingly follows the investment company accounting and reporting guidance of the Financial Accounting Standards Board (“FASB”) Accounting Standards Codification Topic 946 Financial Services—Investment Companies. The Fund prepares its financial statements in accordance with generally accepted accounting principles (“GAAP”) in the United States of America and follows the significant accounting policies described below.
(A) Valuation of Shares. You could lose money by investing in the Fund. Although the Fund seeks to preserve the value of your investment at $1.00 per share by using the amortized cost method of valuation, it cannot guarantee it will do so. The Fund may impose a fee upon the sale of your shares or may temporarily suspend your ability to sell shares if the Fund's liquidity falls below required minimums because of market conditions or other factors. An investment in the Fund is not insured or guaranteed by the Federal Deposit Insurance Corporation or any other government agency. The Fund's sponsor has no legal obligation to provide financial support to the Fund, and you should not expect that the sponsor will provide financial support to the Fund at any time.
(B) Securities Valuation. Securities are valued using the amortized cost method of valuation, unless the use of such method would be inappropriate per the requirements of Rule 2a-7 under the 1940 Act. The amortized cost method involves valuing a security at its cost on the date of purchase and thereafter assuming a constant amortization to maturity of the difference between such cost and the value on maturity date. Amortized cost approximates the current fair value of a security.
Effective September 8, 2022, and pursuant to Rule 2a-5 under the 1940 Act, the Board of Trustees of the Trust (the "Board") designated New York Life Investment Management LLC (“New York Life Investments” or the "Manager") as its Valuation Designee (the "Valuation Designee"). The Valuation Designee is responsible for performing fair valuations relating to all investments in the Fund’s portfolio for which market quotations are not readily available; periodically assessing and managing material valuation risks; establishing and applying fair value methodologies; testing fair valuation methodologies; evaluating and overseeing pricing services; segregation of valuation and portfolio management functions; providing quarterly, annual and prompt reporting to the Board, as appropriate; identifying potential conflicts of interest; and maintaining appropriate records. The Valuation Designee has established a valuation committee ("Valuation Committee") to assist in carrying out the Valuation Designee’s responsibilities and establish prices of securities for which market quotations are not readily available. The Fund’s and the Valuation Designee's policies and procedures ("Valuation Procedures") govern the Valuation Designee’s selection and application of methodologies for determining and calculating the fair value of Fund investments. The Valuation Designee may value Fund portfolio securities for which market quotations are not readily available and other Fund assets utilizing inputs from pricing services and other third-party sources (together, “Pricing Sources”). The Valuation Committee meets (in person, via electronic mail or via teleconference) on an ad-hoc basis to determine fair valuations and on a quarterly basis to review fair value events (excluding fair valuations from pricing services), including valuation risks and back-testing results, and preview reports to the Board.
The Valuation Committee establishes prices of securities for which market quotations are not readily available based on such methodologies and measurements on a regular basis after considering information that is reasonably available and deemed relevant by the Valuation Committee. The Board shall oversee the Valuation Designee and review fair valuation materials on a prompt, quarterly and annual basis and approve proposed revisions to the Valuation Procedures.
Investments for which market quotations are not readily available are valued at fair value as determined in good faith pursuant to the Valuation Procedures. A market quotation is readily available only when that quotation is a quoted price (unadjusted) in active markets for identical investments that the Fund can access at the measurement date, provided that a quotation will not be readily available if it is not reliable. Fair value measurements are determined within a framework that establishes a three-tier hierarchy that maximizes the use of observable market data and minimizes the use of unobservable inputs to establish a classification of fair value measurements for disclosure purposes. "Inputs" refer broadly to the assumptions that market participants would use in pricing the asset or liability, including assumptions about risk, such as the risk inherent in a particular valuation technique used to measure fair value using a pricing model and/or the risk inherent in the inputs for the valuation technique. Inputs may be observable or unobservable. Observable inputs reflect the assumptions market participants would use in pricing the asset or liability based on market data obtained from
Notes to Financial Statements (continued)
sources independent of the Fund. Unobservable inputs reflect the Fund’s own assumptions about the assumptions market participants would use in pricing the asset or liability based on the information available. The inputs or methodology used for valuing assets or liabilities may not be an indication of the risks associated with investing in those assets or liabilities. The three-tier hierarchy of inputs is summarized below.
| • | Level 1—quoted prices (unadjusted) in active markets for an identical asset or liability |
| • | Level 2—other significant observable inputs (including quoted prices for a similar asset or liability in active markets, interest rates and yield curves, prepayment speeds, credit risk, etc.) |
| • | Level 3—significant unobservable inputs (including the Fund's own assumptions about the assumptions that market participants would use in measuring fair value of an asset or liability) |
Securities valued at amortized cost are not obtained from a quoted price in an active market and are generally categorized as Level 2 in the hierarchy. The level of an asset or liability within the fair value hierarchy is based on the lowest level of an input, both individually and in the aggregate, that is significant to the fair value measurement. As of October 31, 2022, the aggregate value by input level of the Fund’s assets and liabilities is included at the end of the Portfolio of Investments.
The Fund may use third-party vendor evaluations, whose prices may be derived from one or more of the following standard inputs, among others:
| • Benchmark yields | • Reported trades |
| • Broker/dealer quotes | • Issuer spreads |
| • Two-sided markets | • Benchmark securities |
| • Bids/offers | • Reference data (corporate actions or material event notices) |
| • Industry and economic events | • Comparable bonds |
| • Monthly payment information | |
An asset or liability for which a market quotation is not readily available is valued by methods deemed reasonable in good faith by the Valuation Committee, following the Valuation Procedures to represent fair value. Under these procedures, the Valuation Designee generally uses a market-based approach which may use related or comparable assets or liabilities, recent transactions, market multiples, book values and other relevant information. The Valuation Designee may also use an income-based valuation approach in which the anticipated future cash flows of the asset or liability are discounted to calculate fair value. Discounts may also be applied due to the nature and/or duration of any restrictions on the disposition of the asset or liability. Fair value represents a good faith approximation of the value of a security. Fair value determinations involve the consideration of a number of subjective factors, an analysis of applicable facts and circumstances and the exercise of judgment. As a result, it is possible that the fair value for a security determined in good faith in accordance with the Valuation Procedures may differ from valuations for the same security determined for other funds using their own valuation procedures. Although the
Valuation Procedures are designed to value a security at the price the Fund may reasonably expect to receive upon the security's sale in an orderly transaction, there can be no assurance that any fair value determination thereunder would, in fact, approximate the amount that the Fund would actually realize upon the sale of the security or the price at which the security would trade if a reliable market price were readily available. During the year ended October 31, 2022, there were no material changes to the fair value methodologies.
Securities which may be valued in this manner include, but are not limited to: (i) a security for which trading has been halted or suspended or otherwise does not have a readily available market quotation on a given day; (ii) a debt security that has recently gone into default and for which there is not a current market quotation; (iii) a security of an issuer that has entered into a restructuring; (iv) a security that has been delisted from a national exchange; (v) a security subject to trading collars for which no or limited trading takes place; and (vi) a security whose principal market has been temporarily closed at a time when, under normal conditions, it would be open. Securities valued in this manner are generally categorized as Level 2 or 3 in the hierarchy.
The information above is not intended to reflect an exhaustive list of the methodologies that may be used to value portfolio investments. The Valuation Procedures permit the use of a variety of valuation methodologies in connection with valuing portfolio investments. The methodology used for a specific type of investment may vary based on the market data available or other considerations. The methodologies summarized above may not represent the specific means by which portfolio investments are valued on any particular business day.
(C) Income Taxes. The Fund's policy is to comply with the requirements of the Internal Revenue Code of 1986, as amended (the “Internal Revenue Code”), applicable to regulated investment companies and to distribute all of its taxable income to the shareholders of the Fund within the allowable time limits.
The Manager evaluates the Fund’s tax positions to determine if the tax positions taken meet the minimum recognition threshold in connection with accounting for uncertainties in income tax positions taken or expected to be taken for the purposes of measuring and recognizing tax liabilities in the financial statements. Recognition of tax benefits of an uncertain tax position is permitted only to the extent the position is “more likely than not” to be sustained assuming examination by taxing authorities. The Manager analyzed the Fund's tax positions taken on federal, state and local income tax returns for all open tax years (for up to three tax years) and has concluded that no provisions for federal, state and local income tax are required in the Fund's financial statements. The Fund's federal, state and local income tax and federal excise tax returns for tax years for which the applicable statutes of limitations have not expired are subject to examination by the Internal Revenue Service and state and local departments of revenue.
| 12 | MainStay U.S. Government Liquidity Fund |
(D) Dividends and Distributions to Shareholders. Dividends and distributions are recorded on the ex-dividend date. The Fund intends to declare dividends from net investment income, if any, daily and intends to pay them at least monthly and declares and pays distributions from net realized capital and currency gains, if any, at least annually. Unless a shareholder elects otherwise, all dividends and distributions are reinvested at NAV in the same class of shares of the Fund. Dividends and distributions to shareholders are determined in accordance with federal income tax regulations and may differ from determinations using GAAP.
(E) Security Transactions and Investment Income. The Fund records security transactions on the trade date. Realized gains and losses on security transactions are determined using the identified cost method. Interest income is accrued daily and discounts and premiums on securities purchased for the Fund are accreted and amortized, respectively, on the straight-line method. The straight-line method approximates the effective interest rate for short-term investments.
The Fund may place a debt security on non-accrual status and reduce related interest income by ceasing current accruals and writing off all or a portion of any interest receivables when the collection of all or a portion of such interest has become doubtful. A debt security is removed from non-accrual status when the issuer resumes interest payments or when collectability of interest is reasonably assured.
(F) Expenses. Expenses of the Trust are allocated to the individual Funds in proportion to the net assets of the respective Funds when the expenses are incurred, except where direct allocations of expenses can be made. Expenses (other than transfer agent expenses) are allocated to separate classes of shares pro rata based upon their relative net assets on the date the expenses are incurred.The expenses borne by the Fund, including those of related parties to the Fund, are shown in the Statement of Operations.
(G) Use of Estimates. In preparing financial statements in conformity with GAAP, the Manager makes estimates and assumptions that affect the reported amounts and disclosures in the financial statements. Actual results could differ from those estimates and assumptions.
(H) Debt Securities Risk. The Fund’s investments may include securities such as variable rate notes and floaters. If expectations about changes in interest rates, or assessments of an issuer’s credit worthiness or market conditions are incorrect, investments in these types of securities could lose money for the Fund. The ability of issuers of debt securities, including the U.S. government, held by the Fund to meet their obligations may be affected by, among other things, economic or political developments in a specific country, industry or region.
(I) LIBOR Replacement Risk. The Fund may invest in certain debt securities, derivatives or other financial instruments that utilize the London Interbank Offered Rate ("LIBOR"), as a “benchmark” or “reference rate” for various interest rate calculations. As of January 1, 2022, the United Kingdom Financial Conduct Authority, which regulates LIBOR, ceased its active encouragement of banks to provide the quotations needed to sustain most LIBOR rates due to the absence of an active
market for interbank unsecured lending and other reasons. However, the United Kingdom Financial Conduct Authority, the LIBOR administrator and other regulators announced that certain sterling and yen LIBOR settings would be calculated on a "synthetic" basis through the end of 2022 and the most widely used tenors of U.S. dollar LIBOR will continue until mid-2023. As a result, it is anticipated that the remaining LIBOR settings will be discontinued or will no longer be sufficiently robust to be representative of its underlying market around that time. Various financial industry groups will plan for that transition and certain regulators and industry groups have taken actions to establish alternative reference rates (e.g., the Secured Overnight Financing Rate, which measures the cost of overnight borrowings through repurchase agreement transactions collateralized with U.S. Treasury securities and is intended to replace U.S. dollar LIBOR with certain adjustments). However, there are challenges to converting certain contracts and transactions to a new benchmark and neither the full effects of the transition process nor its ultimate outcome is known.
The elimination of LIBOR or changes to other reference rates or any other changes or reforms to the determination or supervision of reference rates could have an adverse impact on the market for, or value of, any securities or payments linked to those reference rates, which may adversely affect the Fund's performance and/or net asset value. Uncertainty and risk also remain regarding the willingness and ability of issuers and lenders to include enhanced provisions in new and existing contracts or instruments. Consequently, the transition away from LIBOR to other reference rates may lead to increased volatility and illiquidity in markets that are tied to LIBOR, fluctuations in values of LIBOR-related investments or investments in issuers that utilize LIBOR, increased difficulty in borrowing or refinancing and diminished effectiveness of hedging strategies, adversely affecting the Fund's performance. Furthermore, the risks associated with the expected discontinuation of LIBOR and transition may be exacerbated if the work necessary to effect an orderly transition to an alternative reference rate is not completed in a timely manner. While the transition away from LIBOR has already begun with no material adverse effect to the Fund's performance, the transition is expected to last through mid-2023 for some LIBOR tenors. The usefulness of LIBOR as a benchmark could deteriorate anytime during this transition period.
(J) Indemnifications. Under the Trust’s organizational documents, its officers and trustees are indemnified against certain liabilities that may arise out of performance of their duties to the Trust. Additionally, in the normal course of business, the Fund enters into contracts with third-party service providers that contain a variety of representations and warranties and that may provide general indemnifications. The Fund's maximum exposure under these arrangements is unknown, as this would involve future claims that may be made against the Fund that have not yet occurred. The Manager believes that the risk of loss in connection with these potential indemnification obligations is remote. However, there can be no assurance that material liabilities related to such obligations will not arise in the future, which could adversely impact the Fund.
Notes to Financial Statements (continued)
Note 3–Fees and Related Party Transactions
(A) Manager and Subadvisor. New York Life Investments, a registered investment adviser and an indirect, wholly-owned subsidiary of New York Life Insurance Company ("New York Life"), serves as the Fund's Manager pursuant to a Management Agreement ("Management Agreement"). The Manager provides offices, conducts clerical, recordkeeping and bookkeeping services and keeps most of the financial and accounting records required to be maintained by the Fund. Except for the portion of salaries and expenses that are the responsibility of the Fund, the Manager pays the salaries and expenses of all personnel affiliated with the Fund and certain operational expenses of the Fund. During a portion of the year ended October 31, 2022, the Fund reimbursed New York Life Investments in an amount equal to the portion of the compensation of the Chief Compliance Officer attributable to the Fund. NYL Investors LLC ("NYL Investors" or ''Subadvisor''), a registered investment adviser and a direct, wholly-owned subsidiary of New York Life, serves as the Subadvisor to the Fund and is responsible for the day-to-day portfolio management of the Fund. Pursuant to the terms of a Subadvisory Agreement ("Subadvisory Agreement") between New York Life Investments and NYL Investors, New York Life Investments pays for the services of the Subadvisor.
Pursuant to the Management Agreement, the Fund pays the Manager a monthly fee for the services performed and the facilities furnished at an annual rate of 0.12% of the Fund's average daily net assets.
New York Life Investments has contractually agreed to waive fees and/or reimburse expenses so that Total Annual Fund Operating Expenses (excluding taxes, interest, litigation, extraordinary expenses, brokerage and other transaction expenses relating to the purchase or sale of portfolio investments and acquired (underlying) fund fees and expenses) for Class I shares do not exceed 0.15% of average daily net assets. This agreement will remain in effect until February 28, 2023, and shall renew automatically for one-year terms unless New York Life Investments provides written notice of termination prior to the start of the next term or upon approval of the Board.
New York Life Investments may voluntarily waive fees or reimburse expenses of the Fund to the extent it deems appropriate to enhance the yield of the Fund’s during periods when expenses have a significant impact on the yield of the Fund, as applicable, because of low interest rates. This expense limitation policy is voluntary and in addition to any contractual arrangements that may be in place with respect to the Fund and described in the Fund’s prospectus.
During the year ended October 31, 2022, New York Life Investments earned fees from the Fund in the amount of $1,550,746 and waived fees and/or reimbursed expenses in the amount of $457,894 and paid the Subadvisor fees of $775,457.
JPMorgan Chase Bank, N.A. ("JPMorgan") provides sub-administration and sub-accounting services to the Fund pursuant to an agreement with New York Life Investments. These services include calculating the daily NAVs of the Fund, maintaining the general ledger and sub-ledger
accounts for the calculation of the Fund's NAVs, and assisting New York Life Investments in conducting various aspects of the Fund's administrative operations. For providing these services to the Fund, JPMorgan is compensated by New York Life Investments.
Pursuant to an agreement between the Trust and New York Life Investments, New York Life Investments is responsible for providing or procuring certain regulatory reporting services for the Fund. The Fund will reimburse New York Life Investments for the actual costs incurred by New York Life Investments in connection with providing or procuring these services for the Fund.
(B) Transfer, Dividend Disbursing and Shareholder Servicing Agent. NYLIM Service Company LLC, an affiliate of New York Life Investments, is the Fund's transfer, dividend disbursing and shareholder servicing agent pursuant to an agreement between NYLIM Service Company LLC and the Trust. NYLIM Service Company LLC has entered into an agreement with DST Asset Manager Solutions, Inc. ("DST"), pursuant to which DST performs certain transfer agent services on behalf of NYLIM Service Company LLC. New York Life Investments has contractually agreed to limit the transfer agency expenses charged to the Fund’s share classes to a maximum of 0.35% of that share class’s average daily net assets on an annual basis after deducting any applicable Fund or class-level expense reimbursement or small account fees. This agreement will remain in effect until February 28, 2023 and shall renew automatically for one-year terms unless New York Life Investments provides written notice of termination prior to the start of the next term or upon approval of the Board. During the year ended October 31, 2022, the Fund did not record any transfer agent expenses.
Note 4-Federal Income Tax
The amortized cost also represents the aggregate cost for federal income tax purposes.
As of October 31, 2022, the components of accumulated gain (loss) on a tax basis were as follows:
Ordinary
income | Accumulated
Capital
and Other
Gain (Loss) | Other
Temporary
Differences | Unrealized
Appreciation
(Depreciation) | Total
Accumulated
Gain (Loss) |
| $70,814 | $(65,853) | $(15,421) | $— | $(10,460) |
The other temporary differences are primarily due to amortization of organizational costs.
The following table discloses the current year reclassifications between total distributable earnings (loss) and additional paid-in capital arising
| 14 | MainStay U.S. Government Liquidity Fund |
from permanent differences; net assets as of October 31, 2022 were not affected.
| | Total
Distributable
Earnings (Loss) | Additional
Paid-In
Capital |
| | $2,409 | $(2,409) |
The reclassifications for the Fund are primarily due to different book and tax treatment of excise taxes paid.
As of October 31, 2022, for federal income tax purposes, capital loss carryforwards of $65,853, as shown in the table below, were available to the extent provided by the regulations to offset future realized gains of the Fund. Accordingly, no capital gains distributions are expected to be paid to shareholders until net gains have been realized in excess of such amounts.
Capital Loss
Available Through | Short-Term
Capital Loss
Amounts (000’s) | Long-Term
Capital Loss
Amounts (000’s) |
| Unlimited | $66 | $— |
During the years ended October 31, 2022 and October 31, 2021, the tax character of distributions paid as reflected in the Statements of Changes in Net Assets was as follows:
| | 2022 | 2021 |
| Distributions paid from: | | |
| Ordinary Income | $9,334,713 | $129,740 |
Note 5–Custodian
JPMorgan is the custodian of cash and securities held by the Fund. Custodial fees are charged to the Fund based on the Fund's net assets and/or the market value of securities held by the Fund and the number of certain transactions incurred by the Fund.
Note 6–Capital Share Transactions
Transactions in capital shares for the years ended October 31, 2022 and October 31, 2021, were as follows:
| Class I (at $1 per share) | Shares |
| Year ended October 31, 2022: | |
| Shares sold | 13,330,125,923 |
| Shares issued to shareholders in reinvestment of distributions | 9,256,470 |
| Shares redeemed | (14,523,717,926) |
| Net increase (decrease) | (1,184,335,533) |
| Year ended October 31, 2021: | |
| Shares sold | 16,007,977,798 |
| Shares issued to shareholders in reinvestment of distributions | 124,927 |
| Shares redeemed | (14,127,149,875) |
| Net increase (decrease) | 1,880,952,850 |
Note 7–Other Matters
As of the date of this report, interest rates in the United States and many parts of the world, including certain European countries, are ascending from historically low levels. Thus, the Fund currently faces a heightened level of risk associated with rising interest rates. This could be driven by a variety of factors, including but not limited to central bank monetary policies, changing inflation or real growth rates, general economic conditions, increasing bond issuances or reduced market demand for low yielding investments.
An outbreak of COVID-19, first detected in December 2019, has developed into a global pandemic and has resulted in travel restrictions, closure of international borders, certain businesses and securities markets, restrictions on securities trading activities, prolonged quarantines, supply chain disruptions, and lower consumer demand, as well as general concern and uncertainty. In 2022, many countries lifted some or all restrictions related to COVID-19. However, the continued impact of COVID-19 and related variants is uncertain and could further adversely affect the global economy, national economies, individual issuers and capital markets in unforeseeable ways and result in a substantial and extended economic downturn. Developments that disrupt global economies and financial markets, such as COVID-19, may magnify factors that affect the Fund's performance.
Note 8–Subsequent Events
In connection with the preparation of the financial statements of the Fund as of and for the year ended October 31, 2022, events and transactions subsequent to October 31, 2022, through the date the financial statements were issued have been evaluated by the Manager for possible adjustment and/or disclosure. No subsequent events requiring financial statement adjustment or disclosure have been identified.
Report of Independent Registered Public Accounting Firm
To the Shareholders of the Fund and Board of Trustees
MainStay Funds Trust:
Opinion on the Financial Statements
We have audited the accompanying statement of assets and liabilities of MainStay U.S. Government Liquidity Fund (the Fund), one of the funds constituting MainStay Funds Trust, including the portfolio of investments, as of October 31, 2022, the related statement of operations for the year then ended, the statements of changes in net assets for each of the years in the two-year period then ended, and the related notes (collectively, the financial statements) and the financial highlights for each of the years in the four-year period then ended and the period from July 2, 2018 (commencement of operations) through October 31, 2018. In our opinion, the financial statements and financial highlights present fairly, in all material respects, the financial position of the Fund as of October 31, 2022, the results of its operations for the year then ended, the changes in its net assets for each of the years in the two-year period then ended, and the financial highlights for each of the years in the four-year period then ended and the period July 2, 2018 through October 31, 2018, in conformity with U.S. generally accepted accounting principles.
Basis for Opinion
These financial statements and financial highlights are the responsibility of the Fund's management. Our responsibility is to express an opinion on these financial statements and financial highlights based on our audits. We are a public accounting firm registered with the Public Company Accounting Oversight Board (United States) (PCAOB) and are required to be independent with respect to the Fund in accordance with the U.S. federal securities laws and the applicable rules and regulations of the Securities and Exchange Commission and the PCAOB.
We conducted our audits in accordance with the standards of the PCAOB. Those standards require that we plan and perform the audit to obtain reasonable assurance about whether the financial statements and financial highlights are free of material misstatement, whether due to error or fraud. Our audits included performing procedures to assess the risks of material misstatement of the financial statements and financial highlights, whether due to error or fraud, and performing procedures that respond to those risks. Such procedures included examining, on a test basis, evidence regarding the amounts and disclosures in the financial statements and financial highlights. Such procedures also included confirmation of securities owned as of October 31, 2022, by correspondence with the custodian and the broker; when replies were not received from the broker, we performed other auditing procedures. Our audits also included evaluating the accounting principles used and significant estimates made by management, as well as evaluating the overall presentation of the financial statements and financial highlights. We believe that our audits provide a reasonable basis for our opinion.

We have served as the auditor of one or more New York Life Investment Management investment companies since 2003.
Philadelphia, Pennsylvania
December 23, 2022
| 16 | MainStay U.S. Government Liquidity Fund |
Federal Income Tax Information
(Unaudited)
In February 2023, shareholders will receive an IRS Form 1099-DIV or substitute Form 1099, which will show the federal tax status of the distributions received by shareholders in calendar year 2022. The amounts that will be reported on such 1099-DIV or substitute Form 1099 will be the amounts you are to use on your federal income tax return and will differ from the amounts which we must report for the Fund's fiscal year ended October 31, 2022.
Proxy Voting Policies and Procedures and Proxy Voting Record
The Fund is required to file with the SEC its proxy voting record for the 12-month period ending June 30 on Form N-PX. A description of the policies and procedures that are used to vote proxies relating to portfolio securities of the Fund is available free of charge upon request by calling 800-624-6782 or visiting the SEC’s website at www.sec.gov. The most recent Form N-PX or proxy voting record is available free of charge upon request by calling 800-624-6782; visiting newyorklifeinvestments.com; or visiting the SEC’s website at www.sec.gov.
Shareholder Reports and Quarterly Portfolio Disclosure
The Fund is required to file a Form N-MFP every month disclosing its portfolio holdings. The Fund's Form N-MFP is available free of charge upon request by calling New York Life Investments at 800-624-6782.
Board of Trustees and Officers (Unaudited)
The Trustees and officers of the Fund are listed below. The Board oversees the MainStay Group of Funds (which consists of MainStay Funds and MainStay Funds Trust), MainStay VP Funds Trust, MainStay MacKay DefinedTerm Municipal Opportunities Fund, MainStay CBRE Global Infrastructure Megatrends Fund, the Manager and the Subadvisors, and elects the officers of the Funds who are responsible for the day-to-day operations of the Fund. Information pertaining to the Trustees and officers is set forth below. Each Trustee serves until his or her successor is
elected and qualified or until his or her resignation, death or removal. Under the Board’s retirement policy, unless an exception is made, a Trustee must tender his or her resignation by the end of the calendar year during which he or she reaches the age of 75. The business address of each Trustee and officer listed below is 51 Madison Avenue, New York, New York 10010. None of the Trustees are “interested persons” (as defined by the 1940 Act and rules adopted by the SEC thereunder) of the Fund (“Independent Trustees”).
| | Name and
Year of Birth | Term of Office,
Position(s) Held and
Length of Service | Principal Occupation(s)
During Past Five Years | Number of
Portfolios in
Fund Complex
Overseen by
Trustee | Other Directorships
Held by Trustee |
| | | | | | |
| | David H. Chow
1957 | MainStay Funds: Trustee since 2016, Advisory Board Member (June 2015 to December 2015);MainStay Funds Trust:
Trustee since January 2016, Advisory Board Member (June 2015 to December 2015) | Founder and CEO, DanCourt Management, LLC since 1999 | 78 | MainStay VP Funds Trust: Trustee since January 2016, Advisory Board Member (June 2015 to December 2015) (31 portfolios);
MainStay MacKay DefinedTerm Municipal Opportunities Fund: Trustee since January 2016, Advisory Board Member (June 2015 to December 2015);
MainStay CBRE Global Infrastructure Megatrends Fund: Trustee since June 2021; VanEck Vectors Group of Exchange-Traded Funds: Independent Chairman of the Board of Trustees since 2008 and Trustee since 2006 (56 portfolios); and Berea College of Kentucky: Trustee since 2009, Chair of the Investment Committee since 2018 |
| | Susan B. Kerley
1951 | MainStay Funds: Chairman since 2017 and Trustee since 2007;MainStay Funds Trust:
Chairman since 2017 and Trustee since 1990** | President, Strategic Management Advisors LLC since 1990 | 78 | MainStay VP Funds Trust: Chairman since January 2017 and Trustee since 2007 (31 portfolios)**;
MainStay MacKay DefinedTerm Municipal Opportunities Fund: Chairman since 2017 and Trustee since 2011;
MainStay CBRE Global Infrastructure Megatrends Fund: Trustee since June 2021; and Legg Mason Partners Funds: Trustee since 1991 (45 portfolios) |
| | Alan R. Latshaw
1951 | MainStay Funds: Trustee since 2006;MainStay Funds Trust:
Trustee since 2007*** | Retired; Partner, Ernst & Young LLP (2002 to 2003); Partner, Arthur Andersen LLP (1989 to 2002); Consultant to the MainStay Funds Audit and Compliance Committee (2004 to 2006) | 78 | MainStay VP Funds Trust: Trustee since 2007 (31 portfolios)**;
MainStay MacKay DefinedTerm Municipal Opportunities Fund: Trustee since 2011; and
MainStay CBRE Global Infrastructure Megatrends Fund: Trustee since June 2021 |
| 18 | MainStay U.S. Government Liquidity Fund |
| | Name and
Year of Birth | Term of Office,
Position(s) Held and
Length of Service | Principal Occupation(s)
During Past Five Years | Number of
Portfolios in
Fund Complex
Overseen by
Trustee | Other Directorships
Held by Trustee |
| | | | | | |
| | Karen Hammond
1956 | MainStay Funds: Trustee since December 2021, Advisory Board Member (June 2021 to December 2021);MainStay Funds Trust:
Trustee since December 2021, Advisory Board Member (June 2021 to December 2021)
| Retired, Managing Director, Devonshire Investors (2007 to 2013); Senior Vice President, Fidelity Management & Research Co. (2005 to 2007); Senior Vice President and Corporate Treasurer, FMR Corp. (2003 to 2005); Chief Operating Officer, Fidelity Investments Japan (2001 to 2003) | 78 | MainStay VP Funds Trust: Trustee since December 2021, Advisory Board Member (June 2021 to December 2021) (31 Portfolios);
MainStay MacKay DefinedTerm Municipal Opportunities Fund: Trustee since December 2021, Advisory Board Member (June 2021 to December 2021);
MainStay CBRE Global Infrastructure Megatrends Fund: Trustee since December 2021, Advisory Board Member (June 2021 to December 2021);
Two Harbors Investment Corp.: Director since 2018;
Rhode Island State Investment Commission: Member since 2017; and
Blue Cross Blue Shield of Rhode Island: Director since 2019 |
| | Jacques P. Perold
1958 | MainStay Funds: Trustee since 2016, Advisory Board Member (June 2015 toDecember 2015);MainStay Funds Trust:
Trustee since January 2016, Advisory Board Member (June 2015 to December 2015) | Founder and Chief Executive Officer, CapShift Advisors LLC (since 2018); President, Fidelity Management & Research Company (2009 to 2014); President and Chief Investment Officer, Geode Capital Management, LLC (2001 to 2009) | 78 | MainStay VP Funds Trust: Trustee since January 2016, Advisory Board Member (June 2015 to December 2015) (31 portfolios);
MainStay MacKay DefinedTerm Municipal Opportunities Fund: Trustee since January 2016, Advisory Board Member (June 2015 to December 2015);
MainStay CBRE Global Infrastructure Megatrends Fund: Trustee since June 2021; Partners in Health: Trustee since 2019; Allstate Corporation: Director since 2015; and MSCI Inc.: Director since 2017 |
| | Richard S. Trutanic
1952 | MainStay Funds: Trustee since 1994;MainStay Funds Trust:
Trustee since 2007*** | Chairman and Chief Executive Officer, Somerset & Company (financial advisory firm) since 2004; Managing Director, The Carlyle Group (private investment firm) (2002 to 2004); Senior Managing Director, Partner and Board Member, Groupe Arnault S.A. (private investment firm) (1999 to 2002) | 78 | MainStay VP Funds Trust: Trustee since 2007 (31 portfolios)**;
MainStay MacKay DefinedTerm Municipal Opportunities Fund: Trustee since 2011; and MainStay CBRE Global Infrastructure Megatrends Fund: Trustee since June 2021 |
| ** | Includes prior service as a Director of MainStay VP Series Fund, Inc., the predecessor to MainStay VP Funds Trust. |
| *** | Includes prior service as a Director/Trustee of certain predecessor entities to MainStay Funds Trust. |
Board of Trustees and Officers (Unaudited) (continued)
| | Name and
Year of Birth | Position(s) Held and
Length of Service | Principal Occupation(s)
During Past Five Years | |
| | | | | |
| | Kirk C. Lehneis
1974 | President, MainStay Funds, MainStay Funds Trust since 2017 | Chief Operating Officer and Senior Managing Director (since 2016), New York Life Investment Management LLC and New York Life Investment Management Holdings LLC; Member of the Board of Managers (since 2017) and Senior Managing Director (since 2018), NYLIFE Distributors LLC; Chairman of the Board and Senior Managing Director, NYLIM Service Company LLC (since 2017); Trustee, President and Principal Executive Officer of IndexIQ Trust, IndexIQ ETF Trust and IndexIQ Active ETF Trust (since January 2018); President, MainStay CBRE Global Infrastructure Megatrends Fund (since 2021), MainStay MacKay DefinedTerm Municipal Opportunities Fund and MainStay VP Funds Trust (since 2017); Senior Managing Director, Global Product Development (From 2015-2016); Managing Director, Product Development (2010 to 2015), New York Life Investment Management LLC | |
| | Jack R. Benintende
1964 | Treasurer and Principal Financial and Accounting Officer, MainStay Funds (since 2007), MainStay Funds Trust (since 2009) | Managing Director, New York Life Investment Management LLC (since 2007); Treasurer and Principal Financial and Accounting Officer, MainStay CBRE Global Infrastructure Megatrends Fund (since 2021), MainStay MacKay DefinedTerm Municipal Opportunities Fund (since 2011) and MainStay VP Funds Trust (since 2007)** and Assistant Treasurer, New York Life Investment Management Holdings LLC (2008 to 2012) | |
| | J. Kevin Gao
1967 | Secretary and Chief Legal Officer, MainStay Funds and MainStay Funds Trust (since 2010) | Managing Director and Associate General Counsel, New York Life Investment Management LLC (since 2010); Secretary and Chief Legal Officer and MainStay CBRE Global Infrastructure Megatrends Fund (since 2021), MainStay MacKay DefinedTerm Municipal Opportunities Fund (since 2011) and MainStay VP Funds Trust (since 2010)** | |
| | Scott T. Harrington
1959 | Vice President— Administration, MainStay Funds (since 2009), MainStay Funds Trust (since 2009) | Managing Director, New York Life Investment Management LLC (including predecessor advisory organizations) (since 2000); Member of the Board of Directors, New York Life Trust Company (since 2009); Vice President—Administration, MainStay CBRE Global Infrastructure Megatrends Fund (since 2021), MainStay MacKay DefinedTerm Municipal Opportunities Fund (since 2011) and MainStay VP Funds Trust (since 2005)** | |
| | Kevin M. Gleason
1967 | Vice President and Chief Compliance Officer, MainStay Funds and MainStay Funds Trust (since June 2022) | Vice President and Chief Compliance Officer, IndexIQ, IndexIQ ETF Trust and Index IQ Active ETF Trust (since June 2022); Vice President and Chief Compliance Officer, MainStay CBRE Global Infrastructure Megatrends Fund, MainStay VP Funds Trust and MainStay MacKay DefinedTerm Municipal Opportunities Fund (since June 2022); Senior Vice President, Voya Investment Management and Chief Compliance Officer, Voya Family of Funds (2012-2022) | |
| * | The officers listed above are considered to be “interested persons” of the MainStay Group of Funds, MainStay VP Funds Trust, MainStay CBRE Global Infrastructure Megatrends Fund and MainStay MacKay DefinedTerm Municipal Opportunities Fund within the meaning of the 1940 Act because of their affiliation with the MainStay Group of Funds, New York Life Insurance Company and/or its affiliates, including New York Life Investment Management LLC, NYLIM Service Company LLC, NYLIFE Securities LLC and/or NYLIFE Distributors LLC, as described in detail in the column captioned “Principal Occupation(s) During Past Five Years.” Officers are elected annually by the Board. |
| ** | Includes prior service as an Officer of MainStay VP Series Fund, Inc., the predecessor to MainStay VP Funds Trust. |
Officers of the Trust (Who are not Trustees)*
| 20 | MainStay U.S. Government Liquidity Fund |
This page intentionally left blank.
This page intentionally left blank.
Equity
U.S. Equity
MainStay Epoch U.S. Equity Yield Fund
MainStay S&P 500 Index Fund1
MainStay Winslow Large Cap Growth Fund
MainStay WMC Enduring Capital Fund
MainStay WMC Growth Fund
MainStay WMC Small Companies Fund
MainStay WMC Value Fund
International Equity
MainStay Epoch International Choice Fund
MainStay MacKay International Equity Fund
MainStay WMC International Research Equity Fund
Emerging Markets Equity
MainStay Candriam Emerging Markets Equity Fund
Global Equity
MainStay Epoch Capital Growth Fund
MainStay Epoch Global Equity Yield Fund
Fixed Income
Taxable Income
MainStay Candriam Emerging Markets Debt Fund
MainStay Floating Rate Fund
MainStay MacKay High Yield Corporate Bond Fund
MainStay MacKay Short Duration High Yield Fund
MainStay MacKay Strategic Bond Fund
MainStay MacKay Total Return Bond Fund
MainStay MacKay U.S. Infrastructure Bond Fund
MainStay Short Term Bond Fund
Tax-Exempt Income
MainStay MacKay California Tax Free Opportunities Fund2
MainStay MacKay High Yield Municipal Bond Fund
MainStay MacKay New York Tax Free Opportunities Fund3
MainStay MacKay Short Term Municipal Fund
MainStay MacKay Strategic Municipal Allocation Fund
MainStay MacKay Tax Free Bond Fund
Money Market
MainStay Money Market Fund
Mixed Asset
MainStay Balanced Fund
MainStay Income Builder Fund
MainStay MacKay Convertible Fund
Speciality
MainStay CBRE Global Infrastructure Fund
MainStay CBRE Real Estate Fund
MainStay Cushing MLP Premier Fund
Asset Allocation
MainStay Conservative Allocation Fund
MainStay Conservative ETF Allocation Fund
MainStay Defensive ETF Allocation Fund
MainStay Equity Allocation Fund
MainStay Equity ETF Allocation Fund
MainStay ESG Multi-Asset Allocation Fund
MainStay Growth Allocation Fund
MainStay Growth ETF Allocation Fund
MainStay Moderate Allocation Fund
MainStay Moderate ETF Allocation Fund
Manager
New York Life Investment Management LLC
New York, New York
Subadvisors
Candriam4
Strassen, Luxembourg
CBRE Investment Management Listed Real Assets LLC
Radnor, Pennsylvania
Cushing Asset Management, LP
Dallas, Texas
Epoch Investment Partners, Inc.
New York, New York
MacKay Shields LLC4
New York, New York
NYL Investors LLC4
New York, New York
Wellington Management Company LLP
Boston, Massachusetts
Winslow Capital Management, LLC
Minneapolis, Minnesota
Legal Counsel
Dechert LLP
Washington, District of Columbia
Independent Registered Public Accounting Firm
KPMG LLP
Philadelphia, Pennsylvania
Distributor
NYLIFE Distributors LLC4
Jersey City, New Jersey
Custodian
JPMorgan Chase Bank, N.A.
New York, New York
1.
Prior to February 28, 2022, the Fund's name was MainStay MacKay S&P 500 Index Fund.
| 2. | This Fund is registered for sale in AZ, CA, NV, OR, TX, UT, WA and MI (Class A and Class I shares only), and CO, FL, GA, HI, ID, MA, MD, NH, NJ and NY (Class I shares only). |
| 3. | This Fund is registered for sale in CA, CT, DE, FL, MA, NJ, NY and VT. |
| 4. | An affiliate of New York Life Investment Management LLC. |
Not part of the Annual Report
For more information
800-624-6782
newyorklifeinvestments.com
“New York Life Investments” is both a service mark, and the common trade name, of certain investment advisors affiliated with New York Life Insurance Company. The MainStay Funds® are managed by New York Life Investment Management LLC and distributed by NYLIFE Distributors LLC, 30 Hudson Street, Jersey City, NJ 07302, a wholly owned subsidiary of New York Life Insurance Company. NYLIFE Distributors LLC is a Member FINRA/SIPC.
| ©2022 NYLIFE Distributors LLC. All rights reserved. | MSUGL11a-12/22 |
MainStay WMC Growth Fund
Message from the President and Annual Report
October 31, 2022
Sign up for e-delivery of your shareholder reports. For full details on e-delivery, including who can participate and what you can receive via e-delivery,
please log in to newyorklifeinvestments.com/accounts.
| Not FDIC/NCUA Insured | Not a Deposit | May Lose Value | No Bank Guarantee | Not Insured by Any Government Agency |
This page intentionally left blank
Message from the President
A series of economic and geopolitical challenges undermined equity and fixed-income markets during the 12-month reporting period ended October 31, 2022. Stocks and bonds alike trended lower in the face of sharply rising interest rates, increasing inflationary pressures, slowing economic growth and Russia’s invasion of Ukraine.
The reporting period began on a mixed note, with concerns about the spreading Omicron variant of the COVID-19 virus and increasingly hawkish statements from the U.S. Federal Reserve (the “Fed”) regarding mounting inflation, countered by bullish sentiment stemming from U.S. economic growth and strong corporate earnings. In January 2022, markets turned decisively negative as comments from the Fed raised the likelihood of rate hikes as early as March, and Russia issued increasingly aggressive threats toward Ukraine. The onset of Russia’s invasion in February exacerbated global inflationary pressures while increasing investor uncertainty. Domestic supply shortages, international trade imbalances and rising inflation caused GDP (gross domestic product) to contract in the first and second quarters of the year, although employment and consumer spending proved resilient. Prices for petroleum surged to multi-year highs, while many key agricultural chemicals and industrial metals climbed as well. Accelerating inflationary forces prompted the Fed to implement its most aggressive interest rate increases since the 1980s with a series of five sharp rate hikes, raising the federal funds rate from a range of 0.00% to 0.25% in March to 3.00% to 3.25% in September, with additional rate hikes expected before the end of the year. International central banks generally followed suit, raising rates by varying degrees in efforts to curb local inflation, although most increases remained significantly more modest than those in the United States. Relatively high U.S. interest rates and risk-averse international sentiment pushed U.S. dollar values higher compared to most other currencies, with the ensuing negative impact on global prices for food, fuel and other key, U.S.-dollar-denominated products.
The effects of these interrelated challenges were felt throughout U.S. and international financial markets. The S&P 500® Index, a widely regarded benchmark of U.S. market performance, declined by more than 14% during the reporting period. Although the energy sector generated strong gains, bolstered by elevated oil and gas prices, most other industry areas recorded losses. The more cyclical and growth-oriented sectors of consumer discretionary, real estate and information technology delivered the
weakest returns, while the traditionally defensive and value-oriented consumer staples, utilities and health care sectors outperformed. International stocks lagged compared to their U.S. counterparts, with some emerging markets, such as China, suffering particularly steep losses. A few markets, however, including Brazil, Mexico and the United Arab Emirates, ended the reporting period with little change. Fixed-income markets saw bond prices broadly decline as yields rose along with interest rates. Short-term yields rose faster than long-term yields, producing a yield curve inversion from July through the end of the reporting period, with long-term rates remaining below short-term rates. While floating-rate instruments, which feature variable interest rates that allow investors to benefit from a rising rate environment, provided a degree of insulation from inflation-driven trends, they were not immune to the market’s widespread declines.
While the Fed acknowledges the costs of rising rates in terms of weaker GDP growth and unsettled financial markets over the short term, its primary focus continues to be the longer-term economic impact of inflation. With the latest figures as of the date of this report showing that inflation remains above 8%, versus a target rate of just 2%, the Fed clearly has a distance yet to go, making further rate increases and market volatility more likely in the coming months. The question remains as to whether the Fed and other central banks will manage a so-called “soft landing,” curbing inflation while avoiding a persistent economic slowdown. If they prove successful, we expect that favorable inflation trends and increasingly attractive valuations in both equity and bond markets should eventually translate into sustainable improvements in the investment environment.
Whatever actions the Fed takes and however financial markets react, as a MainStay investor, you can depend on us to continue providing the insight, expertise and service that have long defined New York Life Investments. Thank you for trusting us to help you meet your investment needs.
Sincerely,
Kirk C. Lehneis
President
The opinions expressed are as of the date of this report and are subject to change. There is no guarantee that any forecast made will come to pass. This material does not constitute investment advice and is not intended as an endorsement of any specific investment. Past performance is no guarantee of future results.
Not part of the Annual Report
Investors should refer to the Fund’s Summary Prospectus and/or Prospectus and consider the Fund’s investment objectives, strategies, risks, charges and expenses carefully before investing. The Summary Prospectus and/or Prospectus contain this and other information about the Fund. You may obtain copies of the Fund’s Summary Prospectus, Prospectus and Statement of Additional Information, which includes information about the MainStay Funds Trust's Trustees, free of charge, upon request, by calling toll-free 800-624-6782, by writing to NYLIFE Distributors LLC, Attn: MainStay Marketing Department, 30 Hudson Street, Jersey City, NJ 07302 or by sending an e-mail to MainStayShareholderServices@nylim.com. These documents are also available via the MainStay Funds’ website at newyorklifeinvestments.com. Please read the Fund’s Summary Prospectus and/or Prospectus carefully before investing.
Investment and Performance Comparison (Unaudited)
Performance data quoted represents past performance. Past performance is no guarantee of future results. Because of market volatility and other factors, current performance may be lower or higher than the figures shown. Investment return and principal value will fluctuate, and as a result, when shares are redeemed, they may be worth more or less than their original cost. The graph below depicts the historical performance of Class I shares of the Fund. Performance will vary from class to class based on differences in class-specific expenses and sales charges. For performance information current to the most recent month-end, please call 800-624-6782 or visit newyorklifeinvestments.com.
The performance table and graph do not reflect the deduction of taxes that a shareholder would pay on distributions or Fund share redemptions. Total returns reflect maximum applicable sales charges as indicated in the table below, if any, changes in share price, and reinvestment of dividend and capital gain distributions. The graph assumes the initial investment amount shown below and reflects the deduction of all sales charges that would have applied for the period of investment. Performance figures may reflect certain fee waivers and/or expense limitations, without which total returns may have been lower. For more information on share classes and current fee waivers and/or expense limitations (if any), please refer to the Notes to Financial Statements.
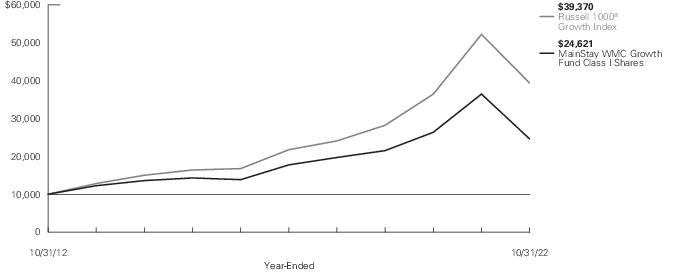
| Average Annual Total Returns for the Year-Ended October 31, 2022 |
| Class | Sales Charge | | Inception
Date1 | One
Year | Five
Years | Ten Years
or Since
Inception | Gross
Expense
Ratio2 |
| Class A Shares | Maximum 5.5% Initial Sales Charge | With sales charges | 8/7/2006 | -36.37% | 5.27% | 8.53% | 1.02% |
| | | Excluding sales charges | | -32.66 | 6.47 | 9.15 | 1.02 |
| Investor Class Shares3 | Maximum 5% Initial Sales Charge | With sales charges | 1/18/2013 | -36.22 | 4.98 | 7.82 | 1.40 |
| | | Excluding sales charges | | -32.86 | 6.17 | 8.45 | 1.40 |
| Class B Shares4 | Maximum 5% CDSC | With sales charges | 1/18/2013 | -35.90 | 5.12 | 7.64 | 2.15 |
| | if Redeemed Within First Six Years of Purchase | Excluding sales charges | | -33.36 | 5.38 | 7.64 | 2.15 |
| Class C Shares | Maximum 1% CDSC | With sales charges | 1/18/2013 | -33.88 | 5.37 | 7.63 | 2.15 |
| | if Redeemed Within One Year of Purchase | Excluding sales charges | | -33.37 | 5.37 | 7.63 | 2.15 |
| Class I Shares | No Sales Charge | | 11/2/2009 | -32.46 | 6.76 | 9.43 | 0.77 |
| Class R2 Shares | No Sales Charge | | 1/18/2013 | -32.74 | 6.36 | 8.59 | 1.12 |
| Class R6 Shares | No Sales Charge | | 4/26/2021 | -32.46 | N/A | -18.28 | 0.72 |
| 1. | Effective March 5, 2021, the Fund replaced its subadvisor and modified its principal investment strategies. The performance information in the graph and table from April 1, 2019 through March 5, 2021 reflects that of the Fund's prior subadvisor and principal investment strategies. Performance information shown in this report prior to April 1, 2019 reflects that of a different previous subadvisor to the fund, investment objective and principal investment strategies. |
| 2. | The gross expense ratios presented reflect the Fund’s “Total Annual Fund Operating Expenses” from the most recent Prospectus, as supplemented, and may differ from other expense ratios disclosed in this report. |
| 3. | Prior to June 30, 2020, the maximum initial sales charge was 5.5%, which is reflected in the applicable average annual total return figures shown. |
| 4. | Class B shares are closed to all new purchases as well as additional investments by existing Class B shareholders. |
The footnotes on the next page are an integral part of the table and graph and should be carefully read in conjunction with them.
| Benchmark Performance* | One
Year | Five
Years | Ten
Years |
| Russell 1000® Growth Index1 | -24.60% | 12.59% | 14.69% |
| Morningstar Large Growth Category Average2 | -28.57 | 9.11 | 11.95 |
| * | Returns for indices reflect no deductions for fees, expenses or taxes, except for foreign withholding taxes where applicable. Results assume reinvestment of all dividends and capital gains. An investment cannot be made directly in an index. |
| 1. | The Russell 1000® Growth Index is the Fund's primary benchmark. The Russell 1000® Growth Index is a broad-based benchmark that measures the performance of the large-cap growth segment of the U.S. equity universe. It includes those Russell 1000® Index companies with higher price-to-book ratios and higher forecasted growth values. |
| 2. | The Morningstar Large Growth Category Average is representative of funds that invest primarily in big U.S. companies that are projected to grow faster than other large-cap stocks. Stocks in the top 70% of the capitalization of the U.S. equity market are defined as large cap. Growth is defined based on fast growth and high valuations. Most of these funds focus on companies in rapidly expanding industries. Results are based on average total returns of similar funds with all dividends and capital gain distributions reinvested. |
The footnotes on the preceding page are an integral part of the table and graph and should be carefully read in conjunction with them.
| 6 | MainStay WMC Growth Fund |
Cost in Dollars of a $1,000 Investment in MainStay WMC Growth Fund (Unaudited)
The example below is intended to describe the fees and expenses borne by shareholders during the six-month period from May 1, 2022 to October 31, 2022, and the impact of those costs on your investment.
Example
As a shareholder of the Fund you incur two types of costs: (1) transaction costs, including exchange fees and sales charges (loads) on purchases (as applicable), and (2) ongoing costs, including management fees, distribution and/or service (12b-1) fees and other Fund expenses (as applicable). This example is intended to help you understand your ongoing costs (in dollars) of investing in the Fund and to compare these costs with the ongoing costs of investing in other mutual funds. The example is based on an investment of $1,000 made at the beginning of the six-month period and held for the entire period from May 1, 2022 to October 31, 2022.
This example illustrates your Fund’s ongoing costs in two ways:
Actual Expenses
The second and third data columns in the table below provide information about actual account values and actual expenses. You may use the information in these columns, together with the amount you invested, to estimate the expenses that you paid during the six months ended October 31, 2022. Simply divide your account value by $1,000 (for example, an
$8,600 account value divided by $1,000 = 8.6), then multiply the result by the number under the heading entitled “Expenses Paid During Period” to estimate the expenses you paid on your account during this period.
Hypothetical Example for Comparison Purposes
The fourth and fifth data columns in the table below provide information about hypothetical account values and hypothetical expenses based on the Fund’s actual expense ratio and an assumed rate of return of 5% per year before expenses, which is not the Fund’s actual return. The hypothetical account values and expenses may not be used to estimate the actual ending account balances or expenses you paid for the six-month period shown. You may use this information to compare the ongoing costs of investing in the Fund with the ongoing costs of investing in other mutual funds. To do so, compare this 5% hypothetical example with the 5% hypothetical examples that appear in the shareholder reports of the other mutual funds.
Please note that the expenses shown in the table are meant to highlight your ongoing costs only and do not reflect any transactional costs, such as exchange fees or sales charges (loads). Therefore, the fourth and fifth data columns of the table are useful in comparing ongoing costs only and will not help you determine the relative total costs of owning different funds. In addition, if these transactional costs were included, your costs would have been higher.
| Share Class | Beginning
Account
Value
5/1/22 | Ending Account
Value (Based
on Actual
Returns and
Expenses)
10/31/22 | Expenses
Paid
During
Period1 | Ending Account
Value (Based
on Hypothetical
5% Annualized
Return and
Actual Expenses)
10/31/22 | Expenses
Paid
During
Period1 | Net Expense
Ratio
During
Period2 |
| Class A Shares | $1,000.00 | $884.50 | $5.08 | $1,019.81 | $ 5.45 | 1.07% |
| Investor Class Shares | $1,000.00 | $883.20 | $6.36 | $1,018.45 | $ 6.82 | 1.34% |
| Class B Shares | $1,000.00 | $880.00 | $9.95 | $1,014.62 | $10.66 | 2.10% |
| Class C Shares | $1,000.00 | $879.90 | $9.95 | $1,014.62 | $10.66 | 2.10% |
| Class I Shares | $1,000.00 | $885.90 | $3.57 | $1,021.42 | $ 3.82 | 0.75% |
| Class R2 Shares | $1,000.00 | $884.00 | $5.56 | $1,019.31 | $ 5.96 | 1.17% |
| Class R6 Shares | $1,000.00 | $885.90 | $3.52 | $1,021.47 | $ 3.77 | 0.74% |
| 1. | Expenses are equal to the Fund’s annualized expense ratio of each class multiplied by the average account value over the period, divided by 365 and multiplied by 184 (to reflect the six-month period). The table above represents the actual expenses incurred during the six-month period. In addition to the fees and expenses which the Fund bears directly, it also indirectly bears a pro rata share of the fees and expenses of the underlying funds in which it invests. Such indirect expenses are not included in the above-reported expense figures. |
| 2. | Expenses are equal to the Fund's annualized expense ratio to reflect the six-month period. |
Industry Composition as of October 31, 2022 (Unaudited)
| Software | 16.4% |
| IT Services | 13.3 |
| Technology Hardware, Storage & Peripherals | 9.5 |
| Internet & Direct Marketing Retail | 5.6 |
| Interactive Media & Services | 5.5 |
| Health Care Equipment & Supplies | 5.2 |
| Semiconductors & Semiconductor Equipment | 4.8 |
| Health Care Providers & Services | 4.6 |
| Capital Markets | 3.9 |
| Life Sciences Tools & Services | 3.7 |
| Aerospace & Defense | 2.8 |
| Professional Services | 2.6 |
| Hotels, Restaurants & Leisure | 2.4 |
| Beverages | 2.3 |
| Textiles, Apparel & Luxury Goods | 2.2% |
| Insurance | 1.9 |
| Equity Real Estate Investment Trusts | 1.8 |
| Energy Equipment & Services | 1.7 |
| Specialty Retail | 1.5 |
| Consumer Finance | 1.4 |
| Pharmaceuticals | 1.4 |
| Automobiles | 1.3 |
| Road & Rail | 1.1 |
| Machinery | 0.3 |
| Short–Term Investment | 2.8 |
| Other Assets, Less Liabilities | 0.0‡ |
| | 100.0% |
| ‡ | Less than one–tenth of a percent. |
See Portfolio of Investments beginning on page 11 for specific holdings within these categories. The Fund's holdings are subject to change.
Top Ten Holdings and/or Issuers Held as of October 31, 2022 (excluding short-term investments) (Unaudited)
| 1. | Apple, Inc. |
| 2. | Microsoft Corp. |
| 3. | Amazon.com, Inc. |
| 4. | Mastercard, Inc., Class A |
| 5. | Alphabet, Inc., Class C |
| 6. | UnitedHealth Group, Inc. |
| 7. | Constellation Brands, Inc., Class A |
| 8. | Salesforce, Inc. |
| 9. | Global Payments, Inc. |
| 10. | Boston Scientific Corp. |
| 8 | MainStay WMC Growth Fund |
Portfolio Management Discussion and Analysis (Unaudited)
Questions answered by portfolio manager Andrew J. Shilling of Wellington Management Company LLP, the Fund’s Subadvisor.
How did MainStay WMC Growth Fund perform relative to its benchmark and peer group during the 12 months ended October 31, 2022?
For the 12 months ended October 31, 2022, Class I shares of Mainstay WMC Growth Fund returned −32.46%, underperforming the −24.60% return of the Fund’s benchmark, the Russell 1000® Growth Index (the “Index”). Over the same period, Class I shares also underperformed the −28.57% return of the Morningstar Large Growth Category Average.1
What factors affected the Fund’s relative performance during the reporting period?
The Fund underperformed the Index during the reporting period primarily due to security selection. Stock selection in the information technology sector detracted most from relative results, while selection in industrials and health care also weighed on relative returns. Favorable selection in communication services, consumer staples and energy slightly offset weak relative performance in other sectors. As a result of our bottom-up stock selection process, sector allocation made a modestly positive contribution to relative performance. (Contributions take weightings and total returns into account.) Underweight exposure to consumer staples weighed on relative results, but was positively offset by the Fund’s underweight exposure to consumer discretionary.
During the reporting period, which sectors were the strongest positive contributors to the Fund’s relative performance and which sectors were particularly weak?
During the reporting period, the communication services sector provided the strongest positive contributions to relative performance, while the information technology sector detracted most.
During the reporting period, which individual stocks made the strongest positive contributions to the Fund’s absolute performance and which stocks detracted the most?
The individual stocks that made the strongest contributions to the Fund’s absolute performance included UnitedHealth Group and Schlumberger. Shares of UnitedHealth Group, a managed health care and insurance company, rose during the reporting period as the company reported strong results in January, in line with expectations. The share price of Schlumberger, an oilfield services company, also rose after delivering strong quarterly results. In the final month of the reporting period, the company had its strongest quarterly profit since 2015, with results that topped estimates and equipment sales that surged with high oil and gas prices. Oil and gas producers are increasing production as crude prices sit near
eight-year highs, boosting demand for Schlumberger's equipment, services and technology. Both positions were still held as of the end of the reporting period.
At the issuer level, the holdings that detracted most significantly from the Fund’s absolute performance were Microsoft and Alphabet. Shares of Microsoft, a technology corporation producing computer software and consumer electronics, declined during the reporting period amid a broad sell-off in high-growth names triggered by tighter monetary policy. Microsoft delivered strong results across its product line, while management set an optimistic tone, providing guidance that confirmed the fundamental strength of the company’s businesses. Shares of Alphabet, an interactive media & services company, fell after the company reported first-quarter 2022 results that missed consensus revenue estimates, driven by disappointing ad revenue. Later in the reporting period, Alphabet’s quarterly release cited slowing growth across segments compared to the prior reporting period. The Fund held underweight exposure in these Index constituents at the end of the reporting period.
What were some of the Fund’s largest purchases and sales during the reporting period?
The Fund eliminated several positions during the reporting period, most notably Meta Platforms, a U.S.-based social networking operator. We believe Meta’s stalled earnings during the COVID-19 pandemic will likely continue to create challenging earnings and revenue comparables for the stock; the company is also likely to face increasing difficulties due to tighter privacy rules, as well as increased competition from fast-growing competitor TikTok. Meta was one of the largest sales during the reporting period.
During the same period, the Fund added to its position in Tesla, a leading electric vehicle (EV) manufacturer. Historically, the Fund has not held positions in Tesla, a large Index constituent, for a variety of reasons including operational and financing challenges in 2020 and an extended valuation due to strong performance. However, the Fund initiated this position at a more attractive valuation after recent declines in the stock price. We believe Tesla may benefit from the recent infrastructure bill’s support of EV adoption. While remaining mindful of valuation, we decided to reduce the size of the Fund’s underweight allocation. Tesla was one of the largest purchases during the reporting period.
How did the Fund’s sector and weightings change during the reporting period?
The Fund’s largest increase in sector exposure relative to the Index was in the consumer discretionary sector, while the most significant decrease was in the information technology sector.
| 1. | See page 5 for other share class returns, which may be higher or lower than Class I share returns. See page 6 for more information on benchmark and peer group returns. |
How was the Fund positioned at the end of the reporting period?
As of October 31, 2022, the Fund held its largest overweight positions in financials and health care. As of the same date, the Fund’s most significant underweight exposures were in consumer staples and consumer discretionary.
The opinions expressed are those of the portfolio manager as of the date of this report and are subject to change. There is no guarantee that any forecasts will come to pass. This material does not constitute investment advice and is not intended as an endorsement of any specific investment.
| 10 | MainStay WMC Growth Fund |
Portfolio of Investments October 31, 2022†
| | Shares | Value |
| Common Stocks 97.2% |
| Aerospace & Defense 2.8% |
| Airbus SE, ADR | 157,632 | $ 4,260,793 |
| General Dynamics Corp. | 29,107 | 7,270,928 |
| Northrop Grumman Corp. | 13,774 | 7,562,064 |
| | | 19,093,785 |
| Automobiles 1.3% |
| Tesla, Inc. (a) | 39,729 | 9,039,937 |
| Beverages 2.3% |
| Constellation Brands, Inc., Class A | 63,833 | 15,771,858 |
| Capital Markets 3.9% |
| Blackstone, Inc. | 79,200 | 7,218,288 |
| Charles Schwab Corp. (The) | 101,660 | 8,099,252 |
| S&P Global, Inc. | 35,364 | 11,360,685 |
| | | 26,678,225 |
| Consumer Finance 1.4% |
| American Express Co. | 65,378 | 9,705,364 |
| Energy Equipment & Services 1.7% |
| Schlumberger NV | 230,228 | 11,978,763 |
| Equity Real Estate Investment Trusts 1.8% |
| American Tower Corp. | 44,964 | 9,316,091 |
| Equinix, Inc. | 5,381 | 3,048,014 |
| | | 12,364,105 |
| Health Care Equipment & Supplies 5.2% |
| ABIOMED, Inc. (a) | 34,816 | 8,776,417 |
| Align Technology, Inc. (a) | 17,003 | 3,303,683 |
| Boston Scientific Corp. (a) | 297,639 | 12,831,217 |
| Insulet Corp. (a) | 10,414 | 2,695,248 |
| Stryker Corp. | 38,291 | 8,777,829 |
| | | 36,384,394 |
| Health Care Providers & Services 4.6% |
| Elevance Health, Inc. | 14,729 | 8,053,375 |
| UnitedHealth Group, Inc. | 43,374 | 24,079,076 |
| | | 32,132,451 |
| Hotels, Restaurants & Leisure 2.4% |
| Airbnb, Inc., Class A (a) | 78,903 | 8,435,520 |
| Hilton Worldwide Holdings, Inc. | 62,695 | 8,480,125 |
| | | 16,915,645 |
| | Shares | Value |
| |
| Insurance 1.9% |
| Marsh & McLennan Cos., Inc. | 43,266 | $ 6,987,026 |
| Progressive Corp. (The) | 49,644 | 6,374,290 |
| | | 13,361,316 |
| Interactive Media & Services 5.5% |
| Alphabet, Inc., Class C (a) | 296,042 | 28,023,336 |
| ZoomInfo Technologies, Inc., Class A (a) | 221,240 | 9,851,817 |
| | | 37,875,153 |
| Internet & Direct Marketing Retail 5.6% |
| Amazon.com, Inc. (a) | 334,184 | 34,233,809 |
| Etsy, Inc. (a) | 48,109 | 4,517,916 |
| | | 38,751,725 |
| IT Services 13.3% |
| Block, Inc., Class A (a) | 125,723 | 7,552,181 |
| Fidelity National Information Services, Inc. | 73,365 | 6,088,561 |
| FleetCor Technologies, Inc. (a) | 62,227 | 11,581,689 |
| Global Payments, Inc. | 118,492 | 13,538,896 |
| Mastercard, Inc., Class A | 102,109 | 33,510,132 |
| MongoDB, Inc. (a) | 27,669 | 5,064,257 |
| Okta, Inc. (a) | 42,004 | 2,357,264 |
| Snowflake, Inc., Class A (a) | 11,339 | 1,817,642 |
| Visa, Inc., Class A | 52,157 | 10,804,844 |
| | | 92,315,466 |
| Life Sciences Tools & Services 3.7% |
| Agilent Technologies, Inc. | 59,002 | 8,162,927 |
| Danaher Corp. | 23,215 | 5,842,519 |
| Illumina, Inc. (a) | 33,869 | 7,749,904 |
| Mettler-Toledo International, Inc. (a) | 3,257 | 4,119,877 |
| | | 25,875,227 |
| Machinery 0.3% |
| IDEX Corp. | 10,389 | 2,309,579 |
| Pharmaceuticals 1.4% |
| Zoetis, Inc. | 62,826 | 9,472,904 |
| Professional Services 2.6% |
| Equifax, Inc. | 48,192 | 8,170,472 |
| TransUnion | 161,595 | 9,577,735 |
| | | 17,748,207 |
| Road & Rail 1.1% |
| Uber Technologies, Inc. (a) | 280,692 | 7,457,986 |
| Semiconductors & Semiconductor Equipment 4.8% |
| Advanced Micro Devices, Inc. (a) | 70,766 | 4,250,206 |
The notes to the financial statements are an integral part of, and should be read in conjunction with, the financial statements.
11
Portfolio of Investments October 31, 2022† (continued)
| | Shares | Value |
| Common Stocks (continued) |
| Semiconductors & Semiconductor Equipment (continued) |
| ASML Holding NV (Registered) | 7,428 | $ 3,509,136 |
| Marvell Technology, Inc. | 126,196 | 5,007,457 |
| Microchip Technology, Inc. | 114,988 | 7,099,359 |
| Monolithic Power Systems, Inc. | 7,699 | 2,613,426 |
| NVIDIA Corp. | 78,773 | 10,631,992 |
| | | 33,111,576 |
| Software 16.4% |
| Adobe, Inc. (a) | 9,230 | 2,939,755 |
| Autodesk, Inc. (a) | 48,178 | 10,324,545 |
| Ceridian HCM Holding, Inc. (a) | 99,834 | 6,608,013 |
| Intuit, Inc. | 15,298 | 6,539,895 |
| Microsoft Corp. | 272,527 | 63,261,693 |
| nCino, Inc. (a) | 108,761 | 3,423,796 |
| Salesforce, Inc. (a) | 85,310 | 13,870,553 |
| ServiceNow, Inc. (a) | 16,156 | 6,797,475 |
| | | 113,765,725 |
| Specialty Retail 1.5% |
| TJX Cos., Inc. (The) | 139,406 | 10,051,173 |
| Technology Hardware, Storage & Peripherals 9.5% |
| Apple, Inc. | 430,573 | 66,024,064 |
| | Shares | | Value |
| |
| Textiles, Apparel & Luxury Goods 2.2% |
| Lululemon Athletica, Inc. (a) | 27,532 | | $ 9,059,129 |
| NIKE, Inc., Class B | 69,731 | | 6,462,669 |
| | | | 15,521,798 |
Total Common Stocks
(Cost $592,966,945) | | | 673,706,426 |
| Short-Term Investment 2.8% |
| Affiliated Investment Company 2.8% |
| MainStay U.S. Government Liquidity Fund, 2.905% (b) | 19,516,025 | | 19,516,025 |
Total Short-Term Investment
(Cost $19,516,025) | | | 19,516,025 |
Total Investments
(Cost $612,482,970) | 100.0% | | 693,222,451 |
| Other Assets, Less Liabilities | 0.0‡ | | 281,488 |
| Net Assets | 100.0% | | $ 693,503,939 |
| † | Percentages indicated are based on Fund net assets. |
| ‡ | Less than one-tenth of a percent. |
| (a) | Non-income producing security. |
| (b) | Current yield as of October 31, 2022. |
Investments in Affiliates (in 000's)
Investments in issuers considered to be affiliate(s) of the Fund during the year ended October 31, 2022 for purposes of Section 2(a)(3) of the Investment Company Act of 1940, as amended, were as follows:
| Affiliated Investment Companies | Value,
Beginning
of Year | Purchases
at Cost | Proceeds
from
Sales | Net
Realized
Gain/(Loss)
on Sales | Change in
Unrealized
Appreciation/
(Depreciation) | Value,
End of
Year | Dividend
Income | Other
Distributions | Shares
End of
Year |
| MainStay U.S. Government Liquidity Fund | $ 4,342 | $ 259,439 | $ (244,265) | $ — | $ — | $ 19,516 | $ 241 | $ — | 19,516 |
| Abbreviation(s): |
| ADR—American Depositary Receipt |
The notes to the financial statements are an integral part of, and should be read in conjunction with, the financial statements.
| 12 | MainStay WMC Growth Fund |
The following is a summary of the fair valuations according to the inputs used as of October 31, 2022, for valuing the Fund’s assets:
| Description | Quoted
Prices in
Active
Markets for
Identical
Assets
(Level 1) | | Significant
Other
Observable
Inputs
(Level 2) | | Significant
Unobservable
Inputs
(Level 3) | | Total |
| Asset Valuation Inputs | | | | | | | |
| Investments in Securities (a) | | | | | | | |
| Common Stocks | $ 673,706,426 | | $ — | | $ — | | $ 673,706,426 |
| Short-Term Investment | | | | | | | |
| Affiliated Investment Company | 19,516,025 | | — | | — | | 19,516,025 |
| Total Investments in Securities | $ 693,222,451 | | $ — | | $ — | | $ 693,222,451 |
| (a) | For a complete listing of investments and their industries, see the Portfolio of Investments. |
The notes to the financial statements are an integral part of, and should be read in conjunction with, the financial statements.
13
Statement of Assets and Liabilities as of October 31, 2022
| Assets |
Investment in unaffiliated securities, at value
(identified cost $592,966,945) | $673,706,426 |
Investment in affiliated investment companies, at value
(identified cost $19,516,025) | 19,516,025 |
| Receivables: | |
| Investment securities sold | 8,006,721 |
| Dividends | 318,264 |
| Fund shares sold | 58,310 |
| Other assets | 287,250 |
| Total assets | 701,892,996 |
| Liabilities |
| Payables: | |
| Investment securities purchased | 7,546,575 |
| Manager (See Note 3) | 389,064 |
| Transfer agent (See Note 3) | 139,824 |
| Fund shares redeemed | 127,659 |
| NYLIFE Distributors (See Note 3) | 112,847 |
| Shareholder communication | 43,069 |
| Professional fees | 16,080 |
| Custodian | 6,726 |
| Securities lending | 43 |
| Accrued expenses | 7,170 |
| Total liabilities | 8,389,057 |
| Net assets | $693,503,939 |
| Composition of Net Assets |
| Shares of beneficial interest outstanding (par value of $.001 per share) unlimited number of shares authorized | $ 23,026 |
| Additional paid-in-capital | 664,835,312 |
| | 664,858,338 |
| Total distributable earnings (loss) | 28,645,601 |
| Net assets | $693,503,939 |
| Class A | |
| Net assets applicable to outstanding shares | $453,404,744 |
| Shares of beneficial interest outstanding | 15,144,434 |
| Net asset value per share outstanding | $ 29.94 |
| Maximum sales charge (5.50% of offering price) | 1.74 |
| Maximum offering price per share outstanding | $ 31.68 |
| Investor Class | |
| Net assets applicable to outstanding shares | $ 59,377,164 |
| Shares of beneficial interest outstanding | 2,038,978 |
| Net asset value per share outstanding | $ 29.12 |
| Maximum sales charge (5.00% of offering price) | 1.53 |
| Maximum offering price per share outstanding | $ 30.65 |
| Class B | |
| Net assets applicable to outstanding shares | $ 6,967,490 |
| Shares of beneficial interest outstanding | 268,407 |
| Net asset value and offering price per share outstanding | $ 25.96 |
| Class C | |
| Net assets applicable to outstanding shares | $ 1,317,657 |
| Shares of beneficial interest outstanding | 50,788 |
| Net asset value and offering price per share outstanding | $ 25.94 |
| Class I | |
| Net assets applicable to outstanding shares | $ 38,498,093 |
| Shares of beneficial interest outstanding | 1,233,219 |
| Net asset value and offering price per share outstanding | $ 31.22 |
| Class R2 | |
| Net assets applicable to outstanding shares | $ 72,090 |
| Shares of beneficial interest outstanding | 2,438 |
| Net asset value and offering price per share outstanding | $ 29.57 |
| Class R6 | |
| Net assets applicable to outstanding shares | $133,866,701 |
| Shares of beneficial interest outstanding | 4,287,801 |
| Net asset value and offering price per share outstanding | $ 31.22 |
The notes to the financial statements are an integral part of, and should be read in conjunction with, the financial statements.
| 14 | MainStay WMC Growth Fund |
Statement of Operations for the year ended October 31, 2022
| Investment Income (Loss) |
| Income | |
| Dividends-unaffiliated (net of foreign tax withholding of $11,243) | $ 3,958,998 |
| Dividends-affiliated | 241,168 |
| Securities lending, net | 10,093 |
| Total income | 4,210,259 |
| Expenses | |
| Manager (See Note 3) | 5,505,500 |
| Distribution/Service—Class A (See Note 3) | 1,407,197 |
| Distribution/Service—Investor Class (See Note 3) | 182,048 |
| Distribution/Service—Class B (See Note 3) | 105,553 |
| Distribution/Service—Class C (See Note 3) | 19,833 |
| Distribution/Service—Class R2 (See Note 3) | 261 |
| Transfer agent (See Note 3) | 720,950 |
| Registration | 116,184 |
| Professional fees | 108,401 |
| Shareholder communication | 65,711 |
| Custodian | 26,576 |
| Trustees | 17,046 |
| Shareholder service (See Note 3) | 104 |
| Miscellaneous | 36,486 |
| Total expenses before waiver/reimbursement | 8,311,850 |
| Expense waiver/reimbursement from Manager (See Note 3) | (35,441) |
| Net expenses | 8,276,409 |
| Net investment income (loss) | (4,066,150) |
| Realized and Unrealized Gain (Loss) |
| Net realized gain (loss) on unaffiliated investments | (48,101,981) |
| Net change in unrealized appreciation (depreciation) on unaffiliated investments | (275,635,718) |
| Net realized and unrealized gain (loss) | (323,737,699) |
| Net increase (decrease) in net assets resulting from operations | $(327,803,849) |
The notes to the financial statements are an integral part of, and should be read in conjunction with, the financial statements.
15
Statements of Changes in Net Assets
for the years ended October 31, 2022 and October 31, 2021
| | 2022 | 2021 |
| Increase (Decrease) in Net Assets |
| Operations: | | |
| Net investment income (loss) | $ (4,066,150) | $ (4,194,902) |
| Net realized gain (loss) | (48,101,981) | 232,956,473 |
| Net change in unrealized appreciation (depreciation) | (275,635,718) | 45,378,743 |
| Net increase (decrease) in net assets resulting from operations | (327,803,849) | 274,140,314 |
| Distributions to shareholders: | | |
| Class A | (148,562,186) | (21,717,936) |
| Investor Class | (19,547,990) | (4,060,646) |
| Class B | (3,546,291) | (733,259) |
| Class C | (629,845) | (136,353) |
| Class I | (2,803,527) | (3,507,825) |
| Class R2 | (29,799) | (4,524) |
| Class R6 | (30,350,578) | — |
| Total distributions to shareholders | (205,470,216) | (30,160,543) |
| Capital share transactions: | | |
| Net proceeds from sales of shares | 100,778,400 | 98,162,403 |
| Net asset value of shares issued to shareholders in reinvestment of distributions | 204,082,226 | 29,968,024 |
| Cost of shares redeemed | (81,836,017) | (119,629,555) |
| Increase (decrease) in net assets derived from capital share transactions | 223,024,609 | 8,500,872 |
| Net increase (decrease) in net assets | (310,249,456) | 252,480,643 |
| Net Assets |
| Beginning of year | 1,003,753,395 | 751,272,752 |
| End of year | $ 693,503,939 | $1,003,753,395 |
The notes to the financial statements are an integral part of, and should be read in conjunction with, the financial statements.
| 16 | MainStay WMC Growth Fund |
Financial Highlights selected per share data and ratios
| | Year Ended October 31, |
| Class A | 2022 | | 2021 | | 2020 | | 2019 | | 2018 |
| Net asset value at beginning of year | $ 56.51 | | $ 42.56 | | $ 36.07 | | $ 36.41 | | $ 34.18 |
| Net investment income (loss) (a) | (0.19) | | (0.23) | | (0.00)‡ | | 0.10 | | 0.09 |
| Net realized and unrealized gain (loss) | (14.75) | | 15.93 | | 7.78 | | 2.87 | | 3.47 |
| Total from investment operations | (14.94) | | 15.70 | | 7.78 | | 2.97 | | 3.56 |
| Less distributions: | | | | | | | | | |
| From net investment income | — | | — | | (0.16) | | (0.06) | | (0.02) |
| From net realized gain on investments | (11.63) | | (1.75) | | (1.13) | | (3.25) | | (1.31) |
| Total distributions | (11.63) | | (1.75) | | (1.29) | | (3.31) | | (1.33) |
| Net asset value at end of year | $ 29.94 | | $ 56.51 | | $ 42.56 | | $ 36.07 | | $ 36.41 |
| Total investment return (b) | (32.66)% | | 37.87% | | 22.21% | | 8.90% | | 10.74% |
| Ratios (to average net assets)/Supplemental Data: | | | | | | | | | |
| Net investment income (loss) | (0.53)% | | (0.46)% | | 0.01% | | 0.30% | | 0.23% |
| Net expenses (c) | 1.04% | | 1.02% | | 1.04% | | 1.06% | | 1.06% |
| Portfolio turnover rate | 42% | | 53% | | 150% | | 153% | | 116% |
| Net assets at end of year (in 000’s) | $ 453,405 | | $ 725,468 | | $ 531,715 | | $ 436,508 | | $ 431,854 |
| ‡ | Less than one cent per share. |
| (a) | Per share data based on average shares outstanding during the year. |
| (b) | Total investment return is calculated exclusive of sales charges and assumes the reinvestment of dividends and distributions. For periods of less than one year, total return is not annualized. |
| (c) | In addition to the fees and expenses which the Fund bears directly, it also indirectly bears a pro-rata share of the fees and expenses of the underlying funds in which it invests. Such indirect expenses are not included in the above expense ratios. |
| | Year Ended October 31, |
| Investor Class | 2022 | | 2021 | | 2020 | | 2019 | | 2018 |
| Net asset value at beginning of year | $ 55.42 | | $ 41.89 | | $ 35.53 | | $ 35.94 | | $ 33.82 |
| Net investment income (loss) (a) | (0.29) | | (0.35) | | (0.10) | | 0.01 | | 0.00‡ |
| Net realized and unrealized gain (loss) | (14.38) | | 15.63 | | 7.65 | | 2.83 | | 3.43 |
| Total from investment operations | (14.67) | | 15.28 | | 7.55 | | 2.84 | | 3.43 |
| Less distributions: | | | | | | | | | |
| From net investment income | — | | — | | (0.06) | | — | | — |
| From net realized gain on investments | (11.63) | | (1.75) | | (1.13) | | (3.25) | | (1.31) |
| Total distributions | (11.63) | | (1.75) | | (1.19) | | (3.25) | | (1.31) |
| Net asset value at end of year | $ 29.12 | | $ 55.42 | | $ 41.89 | | $ 35.53 | | $ 35.94 |
| Total investment return (b) | (32.86)% | | 37.46% | | 21.84% | | 8.61% | | 10.47% |
| Ratios (to average net assets)/Supplemental Data: | | | | | | | | | |
| Net investment income (loss) | (0.81)% | | (0.71)% | | (0.26)% | | 0.03% | | 0.01% |
| Net expenses (c) | 1.33% | | 1.32% | | 1.34% | | 1.33% | | 1.31% |
| Expenses (before waiver/reimbursement) (c) | 1.36% | | 1.40% | | 1.41% | | 1.42% | | 1.37% |
| Portfolio turnover rate | 42% | | 53% | | 150% | | 153% | | 116% |
| Net assets at end of year (in 000's) | $ 59,377 | | $ 93,624 | | $ 97,709 | | $ 110,762 | | $ 108,043 |
| ‡ | Less than one cent per share. |
| (a) | Per share data based on average shares outstanding during the year. |
| (b) | Total investment return is calculated exclusive of sales charges and assumes the reinvestment of dividends and distributions. For periods of less than one year, total return is not annualized. |
| (c) | In addition to the fees and expenses which the Fund bears directly, it also indirectly bears a pro-rata share of the fees and expenses of the underlying funds in which it invests. Such indirect expenses are not included in the above expense ratios. |
The notes to the financial statements are an integral part of, and should be read in conjunction with, the financial statements.
17
Financial Highlights selected per share data and ratios
| | Year Ended October 31, |
| Class B | 2022 | | 2021 | | 2020 | | 2019 | | 2018 |
| Net asset value at beginning of year | $ 51.01 | | $ 38.96 | | $ 33.31 | | $ 34.13 | | $ 32.42 |
| Net investment income (loss) (a) | (0.51) | | (0.67) | | (0.36) | | (0.22) | | (0.26) |
| Net realized and unrealized gain (loss) | (12.91) | | 14.47 | | 7.14 | | 2.65 | | 3.28 |
| Total from investment operations | (13.42) | | 13.80 | | 6.78 | | 2.43 | | 3.02 |
| Less distributions: | | | | | | | | | |
| From net realized gain on investments | (11.63) | | (1.75) | | (1.13) | | (3.25) | | (1.31) |
| Net asset value at end of year | $ 25.96 | | $ 51.01 | | $ 38.96 | | $ 33.31 | | $ 34.13 |
| Total investment return (b) | (33.36)% | | 36.44% | | 20.93% | | 7.79% | | 9.63% |
| Ratios (to average net assets)/Supplemental Data: | | | | | | | | | |
| Net investment income (loss) | (1.57)% | | (1.46)% | | (1.01)% | | (0.69)% | | (0.74)% |
| Net expenses (c) | 2.08% | | 2.07% | | 2.08% | | 2.08% | | 2.06% |
| Expenses (before waiver/reimbursement) (c) | 2.11% | | 2.15% | | 2.15% | | 2.18% | | 2.12% |
| Portfolio turnover rate | 42% | | 53% | | 150% | | 153% | | 116% |
| Net assets at end of year (in 000’s) | $ 6,967 | | $ 15,574 | | $ 16,382 | | $ 18,749 | | $ 23,554 |
| (a) | Per share data based on average shares outstanding during the year. |
| (b) | Total investment return is calculated exclusive of sales charges and assumes the reinvestment of dividends and distributions. For periods of less than one year, total return is not annualized. |
| (c) | In addition to the fees and expenses which the Fund bears directly, it also indirectly bears a pro-rata share of the fees and expenses of the underlying funds in which it invests. Such indirect expenses are not included in the above expense ratios. |
| | Year Ended October 31, |
| Class C | 2022 | | 2021 | | 2020 | | 2019 | | 2018 |
| Net asset value at beginning of year | $ 50.99 | | $ 38.95 | | $ 33.30 | | $ 34.12 | | $ 32.41 |
| Net investment income (loss) (a) | (0.51) | | (0.67) | | (0.36) | | (0.21) | | (0.27) |
| Net realized and unrealized gain (loss) | (12.91) | | 14.46 | | 7.14 | | 2.64 | | 3.29 |
| Total from investment operations | (13.42) | | 13.79 | | 6.78 | | 2.43 | | 3.02 |
| Less distributions: | | | | | | | | | |
| From net realized gain on investments | (11.63) | | (1.75) | | (1.13) | | (3.25) | | (1.31) |
| Net asset value at end of year | $ 25.94 | | $ 50.99 | | $ 38.95 | | $ 33.30 | | $ 34.12 |
| Total investment return (b) | (33.37)% | | 36.42% | | 20.94% | | 7.80% | | 9.63% |
| Ratios (to average net assets)/Supplemental Data: | | | | | | | | | |
| Net investment income (loss) | (1.56)% | | (1.46)% | | (1.02)% | | (0.67)% | | (0.77)% |
| Net expenses (c) | 2.08% | | 2.07% | | 2.08% | | 2.08% | | 2.06% |
| Expenses (before waiver/reimbursement) (c) | 2.11% | | 2.15% | | 2.15% | | 2.18% | | 2.12% |
| Portfolio turnover rate | 42% | | 53% | | 150% | | 153% | | 116% |
| Net assets at end of year (in 000’s) | $ 1,318 | | $ 2,880 | | $ 3,068 | | $ 3,144 | | $ 5,331 |
| (a) | Per share data based on average shares outstanding during the year. |
| (b) | Total investment return is calculated exclusive of sales charges and assumes the reinvestment of dividends and distributions. For periods of less than one year, total return is not annualized. |
| (c) | In addition to the fees and expenses which the Fund bears directly, it also indirectly bears a pro-rata share of the fees and expenses of the underlying funds in which it invests. Such indirect expenses are not included in the above expense ratios. |
The notes to the financial statements are an integral part of, and should be read in conjunction with, the financial statements.
| 18 | MainStay WMC Growth Fund |
Financial Highlights selected per share data and ratios
| | Year Ended October 31, |
| Class I | 2022 | | 2021 | | 2020 | | 2019 | | 2018 |
| Net asset value at beginning of year | $ 58.27 | | $ 43.72 | | $ 37.01 | | $ 37.28 | | $ 34.96 |
| Net investment income (loss) (a) | (0.07) | | 0.02 | | 0.11 | | 0.19 | | 0.18 |
| Net realized and unrealized gain (loss) | (15.35) | | 16.28 | | 7.97 | | 2.95 | | 3.55 |
| Total from investment operations | (15.42) | | 16.30 | | 8.08 | | 3.14 | | 3.73 |
| Less distributions: | | | | | | | | | |
| From net investment income | — | | — | | (0.24) | | (0.16) | | (0.10) |
| From net realized gain on investments | (11.63) | | (1.75) | | (1.13) | | (3.25) | | (1.31) |
| Total distributions | (11.63) | | (1.75) | | (1.37) | | (3.41) | | (1.41) |
| Net asset value at end of year | $ 31.22 | | $ 58.27 | | $ 43.72 | | $ 37.01 | | $ 37.28 |
| Total investment return (b) | (32.46)% | | 38.25% | | 22.53% | | 9.18% | | 11.03% |
| Ratios (to average net assets)/Supplemental Data: | | | | | | | | | |
| Net investment income (loss) | (0.20)% | | 0.04% | | 0.28% | | 0.53% | | 0.49% |
| Net expenses (c) | 0.75% | | 0.77% | | 0.79% | | 0.81% | | 0.81% |
| Expenses (before waiver/reimbursement) (c) | 0.79% | | 0.78% | | 0.79% | | 0.81% | | 0.81% |
| Portfolio turnover rate | 42% | | 53% | | 150% | | 153% | | 116% |
| Net assets at end of year (in 000’s) | $ 38,498 | | $ 14,025 | | $ 102,290 | | $ 139,588 | | $ 87,866 |
| (a) | Per share data based on average shares outstanding during the year. |
| (b) | Total investment return is calculated exclusive of sales charges and assumes the reinvestment of dividends and distributions. Class I shares are not subject to sales charges. For periods of less than one year, total return is not annualized. |
| (c) | In addition to the fees and expenses which the Fund bears directly, it also indirectly bears a pro-rata share of the fees and expenses of the underlying funds in which it invests. Such indirect expenses are not included in the above expense ratios. |
| | Year Ended October 31, |
| Class R2 | 2022 | | 2021 | | 2020 | | 2019 | | 2018 |
| Net asset value at beginning of year | $ 56.01 | | $ 42.24 | | $ 35.81 | | $ 36.16 | | $ 33.97 |
| Net investment income (loss) (a) | (0.23) | | (0.28) | | (0.04) | | 0.07 | | 0.05 |
| Net realized and unrealized gain (loss) | (14.58) | | 15.80 | | 7.72 | | 2.86 | | 3.45 |
| Total from investment operations | (14.81) | | 15.52 | | 7.68 | | 2.93 | | 3.50 |
| Less distributions: | | | | | | | | | |
| From net investment income | — | | — | | (0.12) | | (0.03) | | — |
| From net realized gain on investments | (11.63) | | (1.75) | | (1.13) | | (3.25) | | (1.31) |
| Total distributions | (11.63) | | (1.75) | | (1.25) | | (3.28) | | (1.31) |
| Net asset value at end of year | $ 29.57 | | $ 56.01 | | $ 42.24 | | $ 35.81 | | $ 36.16 |
| Total investment return (b) | (32.74)% | | 37.72% | | 22.08% | | 8.81% | | 10.64% |
| Ratios (to average net assets)/Supplemental Data: | | | | | | | | | |
| Net investment income (loss) | (0.63)% | | (0.55)% | | (0.11)% | | 0.21% | | 0.13% |
| Net expenses (c) | 1.14% | | 1.12% | | 1.14% | | 1.16% | | 1.16% |
| Portfolio turnover rate | 42% | | 53% | | 150% | | 153% | | 116% |
| Net assets at end of year (in 000’s) | $ 72 | | $ 143 | | $ 109 | | $ 59 | | $ 58 |
| (a) | Per share data based on average shares outstanding during the year. |
| (b) | Total investment return is calculated exclusive of sales charges and assumes the reinvestment of dividends and distributions. Class R2 shares are not subject to sales charges. For periods of less than one year, total return is not annualized. |
| (c) | In addition to the fees and expenses which the Fund bears directly, it also indirectly bears a pro-rata share of the fees and expenses of the underlying funds in which it invests. Such indirect expenses are not included in the above expense ratios. |
The notes to the financial statements are an integral part of, and should be read in conjunction with, the financial statements.
19
Financial Highlights selected per share data and ratios
| | Year Ended October 31, | | April 26, 2021^ through
October 31, |
| Class R6 | 2022 | | 2021 |
| Net asset value at beginning of period | $ 58.27 | | $ 53.43 |
| Net investment income (loss) (a) | (0.08) | | (0.19) |
| Net realized and unrealized gain (loss) | (15.34) | | 5.03 |
| Total from investment operations | (15.42) | | 4.84 |
| Less distributions: | | | |
| From net realized gain on investments | (11.63) | | — |
| Net asset value at end of period | $ 31.22 | | $ 58.27 |
| Total investment return (b) | (32.46)% | | 9.06% |
| Ratios (to average net assets)/Supplemental Data: | | | |
| Net investment income (loss) | (0.20)% | | (0.37)%†† |
| Net expenses (c) | 0.72% | | 0.71%†† |
| Expenses (before waiver/reimbursement) (c) | 0.72% | | 0.72%†† |
| Portfolio turnover rate | 42% | | 53% |
| Net assets at end of period (in 000’s) | $ 133,867 | | $ 152,039 |
| ^ | Inception date. |
| †† | Annualized. |
| (a) | Per share data based on average shares outstanding during the period. |
| (b) | Total investment return is calculated exclusive of sales charges and assumes the reinvestment of dividends and distributions. Class R6 shares are not subject to sales charges. For periods of less than one year, total return is not annualized. |
| (c) | In addition to the fees and expenses which the Fund bears directly, it also indirectly bears a pro-rata share of the fees and expenses of the underlying funds in which it invests. Such indirect expenses are not included in the above expense ratios. |
The notes to the financial statements are an integral part of, and should be read in conjunction with, the financial statements.
| 20 | MainStay WMC Growth Fund |
Notes to Financial Statements
Note 1-Organization and Business
MainStay Funds Trust (the “Trust”) was organized as a Delaware statutory trust on April 28, 2009. The Trust is registered under the Investment Company Act of 1940, as amended (the “1940 Act”), as an open-end management investment company, and is comprised of thirty-three funds (collectively referred to as the “Funds”). These financial statements and notes relate to the MainStay WMC Growth Fund (the "Fund"), a “diversified” fund, as that term is defined in the 1940 Act, as interpreted or modified by regulatory authorities having jurisdiction, from time to time.
The following table lists the Fund's share classes that have been registered and commenced operations:
| Class | Commenced Operations |
| Class A | August 7, 2006 |
| Investor Class | January 18, 2013 |
| Class B | January 18, 2013 |
| Class C | January 18, 2013 |
| Class I | November 2, 2009 |
| Class R2 | January 18, 2013 |
| Class R6 | April 26, 2021 |
| SIMPLE Class | N/A* |
| * | SIMPLE Class shares were registered for sale effective as of August 31, 2020 but have not yet commenced operations. |
Class B shares of the MainStay Group of Funds are closed to all new purchases as well as additional investments by existing Class B shareholders. Existing Class B shareholders may continue to reinvest dividends and capital gains distributions, as well as exchange their Class B shares for Class B shares of other funds in the MainStay Group of Funds as permitted by the current exchange privileges. Class B shareholders continue to be subject to any applicable contingent deferred sales charge ("CDSC") at the time of redemption. All other features of the Class B shares, including but not limited to the fees and expenses applicable to Class B shares, remain unchanged. Unless redeemed, Class B shareholders will remain in Class B shares of their respective fund until the Class B shares are converted to Class A or Investor Class shares pursuant to the applicable conversion schedule.
Class A and Investor Class shares are offered at net asset value (“NAV”) per share plus an initial sales charge. No initial sales charge applies to investments of $1 million or more (and certain other qualified purchases) in Class A and Investor Class shares. However, a CDSC of 1.00% may be imposed on certain redemptions made within 18 months of the date of purchase on shares that were purchased without an initial sales charge. Class C shares are offered at NAV without an initial sales charge, although a 1.00% CDSC may be imposed on certain redemptions of such shares made within one year of the date of purchase of Class C shares. When Class B shares were offered, they were offered at NAV without an initial sales charge, although a CDSC that declines depending on the number of years a shareholder held its Class B shares may be imposed on certain redemptions of such shares made within six years of the date of purchase of such shares. Class I, Class R2 and Class R6 shares are
offered at NAV without a sales charge. SIMPLE Class shares are expected to be offered at NAV without a sales charge if such shares are offered in the future. Depending upon eligibility, Class B shares convert to either Class A or Investor Class shares at the end of the calendar quarter eight years after the date they were purchased. In addition, depending upon eligibility, Class C shares convert to either Class A or Investor Class shares at the end of the calendar quarter eight years after the date they were purchased. Additionally, Investor Class shares may convert automatically to Class A shares. Under certain circumstances and as may be permitted by the Trust’s multiple class plan pursuant to Rule 18f-3 under the 1940 Act, specified share classes of the Fund may be converted to one or more other share classes of the Fund as disclosed in the capital share transactions within these Notes. The classes of shares have the same voting (except for issues that relate solely to one class), dividend, liquidation and other rights, and the same terms and conditions, except that under a distribution plan pursuant to Rule 12b-1 under the 1940 Act, Class B and Class C shares are subject to higher distribution and/or service fees than Class A, Investor Class, Class R2 and SIMPLE Class shares. Class I and Class R6 shares are not subject to a distribution and/or service fee. Class R2 shares are subject to a shareholder service fee. This is in addition to any fees paid under a distribution plan, where applicable.
The Fund's investment objective is to seek long-term growth of capital.
Note 2–Significant Accounting Policies
The Fund is an investment company and accordingly follows the investment company accounting and reporting guidance of the Financial Accounting Standards Board (“FASB”) Accounting Standards Codification Topic 946 Financial Services—Investment Companies. The Fund prepares its financial statements in accordance with generally accepted accounting principles (“GAAP”) in the United States of America and follows the significant accounting policies described below.
(A) Securities Valuation. Investments are usually valued as of the close of regular trading on the New York Stock Exchange (the "Exchange") (usually 4:00 p.m. Eastern time) on each day the Fund is open for business ("valuation date").
Effective September 8, 2022, and pursuant to Rule 2a-5 under the 1940 Act, the Board of Trustees of the Trust (the "Board") designated New York Life Investment Management LLC (“New York Life Investments” or the "Manager") as its Valuation Designee (the "Valuation Designee"). The Valuation Designee is responsible for performing fair valuations relating to all investments in the Fund’s portfolio for which market quotations are not readily available; periodically assessing and managing material valuation risks; establishing and applying fair value methodologies; testing fair valuation methodologies; evaluating and overseeing pricing services; segregation of valuation and portfolio management functions; providing quarterly, annual and prompt reporting to the Board, as appropriate; identifying potential conflicts of interest; and maintaining appropriate records. The Valuation Designee has established a valuation committee ("Valuation Committee") to assist in carrying out the Valuation Designee’s
Notes to Financial Statements (continued)
responsibilities and establish prices of securities for which market quotations are not readily available. The Fund’s and the Valuation Designee's policies and procedures ("Valuation Procedures") govern the Valuation Designee’s selection and application of methodologies for determining and calculating the fair value of Fund investments. The Valuation Designee may value Fund portfolio securities for which market quotations are not readily available and other Fund assets utilizing inputs from pricing services and other third-party sources (together, “Pricing Sources”). The Valuation Committee meets (in person, via electronic mail or via teleconference) on an ad-hoc basis to determine fair valuations and on a quarterly basis to review fair value events (excluding fair valuations from pricing services), including valuation risks and back-testing results, and preview reports to the Board.
The Valuation Committee establishes prices of securities for which market quotations are not readily available based on such methodologies and measurements on a regular basis after considering information that is reasonably available and deemed relevant by the Valuation Committee. The Board shall oversee the Valuation Designee and review fair valuation materials on a prompt, quarterly and annual basis and approve proposed revisions to the Valuation Procedures.
Investments for which market quotations are not readily available are valued at fair value as determined in good faith pursuant to the Valuation Procedures. A market quotation is readily available only when that quotation is a quoted price (unadjusted) in active markets for identical investments that the Fund can access at the measurement date, provided that a quotation will not be readily available if it is not reliable. Fair value measurements are determined within a framework that establishes a three-tier hierarchy that maximizes the use of observable market data and minimizes the use of unobservable inputs to establish a classification of fair value measurements for disclosure purposes. "Inputs" refer broadly to the assumptions that market participants would use in pricing the asset or liability, including assumptions about risk, such as the risk inherent in a particular valuation technique used to measure fair value using a pricing model and/or the risk inherent in the inputs for the valuation technique. Inputs may be observable or unobservable. Observable inputs reflect the assumptions market participants would use in pricing the asset or liability based on market data obtained from sources independent of the Fund. Unobservable inputs reflect the Fund’s own assumptions about the assumptions market participants would use in pricing the asset or liability based on the information available. The inputs or methodology used for valuing assets or liabilities may not be an indication of the risks associated with investing in those assets or liabilities. The three-tier hierarchy of inputs is summarized below.
| • | Level 1—quoted prices (unadjusted) in active markets for an identical asset or liability |
| • | Level 2—other significant observable inputs (including quoted prices for a similar asset or liability in active markets, interest rates and yield curves, prepayment speeds, credit risk, etc.) |
| • | Level 3—significant unobservable inputs (including the Fund's own assumptions about the assumptions that market participants would use in measuring fair value of an asset or liability) |
The level of an asset or liability within the fair value hierarchy is based on the lowest level of an input, both individually and in the aggregate, that is significant to the fair value measurement. The aggregate value by input level of the Fund’s assets and liabilities as of October 31, 2022, is included at the end of the Portfolio of Investments.
The Fund may use third-party vendor evaluations, whose prices may be derived from one or more of the following standard inputs, among others:
| • Broker/dealer quotes | • Benchmark securities |
| • Two-sided markets | • Reference data (corporate actions or material event notices) |
| • Bids/offers | • Monthly payment information |
| • Industry and economic events | • Reported trades |
An asset or liability for which a market quotation is not readily available is valued by methods deemed reasonable in good faith by the Valuation Committee, following the Valuation Procedures to represent fair value. Under these procedures, the Valuation Designee generally uses a market-based approach which may use related or comparable assets or liabilities, recent transactions, market multiples, book values and other relevant information. The Valuation Designee may also use an income-based valuation approach in which the anticipated future cash flows of the asset or liability are discounted to calculate fair value. Discounts may also be applied due to the nature and/or duration of any restrictions on the disposition of the asset or liability. Fair value represents a good faith approximation of the value of a security. Fair value determinations involve the consideration of a number of subjective factors, an analysis of applicable facts and circumstances and the exercise of judgment. As a result, it is possible that the fair value for a security determined in good faith in accordance with the Valuation Procedures may differ from valuations for the same security determined for other funds using their own valuation procedures. Although the Valuation Procedures are designed to value a security at the price the Fund may reasonably expect to receive upon the security's sale in an orderly transaction, there can be no assurance that any fair value determination thereunder would, in fact, approximate the amount that the Fund would actually realize upon the sale of the security or the price at which the security would trade if a reliable market price were readily available. During the year ended October 31, 2022, there were no material changes to the fair value methodologies.
Securities which may be valued in this manner include, but are not limited to: (i) a security for which trading has been halted or suspended or otherwise does not have a readily available market quotation on a given day; (ii) a debt security that has recently gone into default and for which there is not a current market quotation; (iii) a security of an issuer that has entered into a restructuring; (iv) a security that has been delisted from a national exchange; (v) a security subject to trading collars for which no or limited trading takes place; and (vi) a security whose principal
| 22 | MainStay WMC Growth Fund |
market has been temporarily closed at a time when, under normal conditions, it would be open. Securities valued in this manner are generally categorized as Level 2 or 3 in the hierarchy.
Equity securities are valued at the last quoted sales prices as of the close of regular trading on the relevant exchange on each valuation date. Securities that are not traded on the valuation date are valued at the mean of the last quoted bid and ask prices. Prices are normally taken from the principal market in which each security trades. These securities are generally categorized as Level 1 in the hierarchy.
Investments in mutual funds, including money market funds, are valued at their respective NAVs at the close of business each day on the valuation date. These securities are generally categorized as Level 1 in the hierarchy.
Temporary cash investments acquired in excess of 60 days to maturity at the time of purchase are valued using the latest bid prices or using valuations based on a matrix system (which considers such factors as security prices, yields, maturities and ratings), both as furnished by independent pricing services. Temporary cash investments that mature in 60 days or less at the time of purchase ("Short-Term Investments") are valued using the amortized cost method of valuation, unless the use of such method would be inappropriate. The amortized cost method involves valuing a security at its cost on the date of purchase and thereafter assuming a constant amortization to maturity of the difference between such cost and the value on maturity date. Amortized cost approximates the current fair value of a security. Securities valued using the amortized cost method are not valued using quoted prices in an active market and are generally categorized as Level 2 in the hierarchy.
The information above is not intended to reflect an exhaustive list of the methodologies that may be used to value portfolio investments. The Valuation Procedures permit the use of a variety of valuation methodologies in connection with valuing portfolio investments. The methodology used for a specific type of investment may vary based on the market data available or other considerations. The methodologies summarized above may not represent the specific means by which portfolio investments are valued on any particular business day.
(B) Income Taxes. The Fund's policy is to comply with the requirements of the Internal Revenue Code of 1986, as amended (the “Internal Revenue Code”), applicable to regulated investment companies and to distribute all of its taxable income to the shareholders of the Fund within the allowable time limits.
The Manager evaluates the Fund’s tax positions to determine if the tax positions taken meet the minimum recognition threshold in connection with accounting for uncertainties in income tax positions taken or expected to be taken for the purposes of measuring and recognizing tax liabilities in the financial statements. Recognition of tax benefits of an uncertain tax position is permitted only to the extent the position is “more likely than not” to be sustained assuming examination by taxing authorities. The Manager analyzed the Fund's tax positions taken on federal, state and local income tax returns for all open tax years (for up to
three tax years) and has concluded that no provisions for federal, state and local income tax are required in the Fund's financial statements. The Fund's federal, state and local income tax and federal excise tax returns for tax years for which the applicable statutes of limitations have not expired are subject to examination by the Internal Revenue Service and state and local departments of revenue.
(C) Dividends and Distributions to Shareholders. Dividends and distributions are recorded on the ex-dividend date. The Fund intends to declare and pay dividends from net investment income and distributions from net realized capital and currency gains, if any, at least annually. Unless a shareholder elects otherwise, all dividends and distributions are reinvested at NAV in the same class of shares of the Fund. Dividends and distributions to shareholders are determined in accordance with federal income tax regulations and may differ from determinations using GAAP.
(D) Security Transactions and Investment Income. The Fund records security transactions on the trade date. Realized gains and losses on security transactions are determined using the identified cost method. Dividend income is recognized on the ex-dividend date, net of any foreign tax withheld at the source, and interest income is accrued as earned using the effective interest rate method. Distributions received from real estate investment trusts may be classified as dividends, capital gains and/or return of capital.
Investment income and realized and unrealized gains and losses on investments of the Fund are allocated pro rata to the separate classes of shares based upon their relative net assets on the date the income is earned or realized and unrealized gains and losses are incurred.
(E) Expenses. Expenses of the Trust are allocated to the individual Funds in proportion to the net assets of the respective Funds when the expenses are incurred, except where direct allocations of expenses can be made. Expenses (other than transfer agent expenses and fees incurred under the shareholder services plans and/or the distribution plans further discussed in Note 3(B)) are allocated to separate classes of shares pro rata based upon their relative net assets on the date the expenses are incurred. The expenses borne by the Fund, including those of related parties to the Fund, are shown in the Statement of Operations.
Additionally, the Fund may invest in mutual funds, which are subject to management fees and other fees that may cause the costs of investing in mutual funds to be greater than the costs of owning the underlying securities directly. These indirect expenses of mutual funds are not included in the amounts shown as expenses in the Statement of Operations or in the expense ratios included in the Financial Highlights.
(F) Use of Estimates. In preparing financial statements in conformity with GAAP, the Manager makes estimates and assumptions that affect the reported amounts and disclosures in the financial statements. Actual results could differ from those estimates and assumptions.
(G) Securities Lending. In order to realize additional income, the Fund may engage in securities lending, subject to the limitations set forth in the 1940 Act and relevant guidance by the staff of the Securities and
Notes to Financial Statements (continued)
Exchange Commission (“SEC”). If the Fund engages in securities lending, the Fund will lend through its custodian, JPMorgan Chase Bank, N.A., ("JPMorgan"), acting as securities lending agent on behalf of the Fund. Under the current arrangement, JPMorgan will manage the Fund's collateral in accordance with the securities lending agency agreement between the Fund and JPMorgan, and indemnify the Fund against counterparty risk. The loans will be collateralized by cash (which may be invested in a money market fund) and/or non-cash collateral (which may include U.S. Treasury securities and/or U.S. government agency securities issued or guaranteed by the United States government or its agencies or instrumentalities) at least equal at all times to the market value of the securities loaned. Non-cash collateral held at year end is segregated and cannot be transferred by the Fund. The Fund bears the risk of delay in recovery of, or loss of rights in, the securities loaned. The Fund may also record a realized gain or loss on securities deemed sold due to a borrower’s inability to return securities on loan. The Fund bears the risk of any loss on investment of cash collateral. The Fund will receive compensation for lending its securities in the form of fees or it will retain a portion of interest earned on the investment of any cash collateral. The Fund will also continue to receive interest and dividends on the securities loaned and any gain or loss in the market price of the securities loaned that may occur during the term of the loan will be for the account of the Fund. Income earned from securities lending activities, if any, is reflected in the Statement of Operations. As of October 31, 2022, the Fund did not have any portfolio securities on loan.
(H) Indemnifications. Under the Trust’s organizational documents, its officers and trustees are indemnified against certain liabilities that may arise out of performance of their duties to the Trust. Additionally, in the normal course of business, the Fund enters into contracts with third-party service providers that contain a variety of representations and warranties and that may provide general indemnifications. The Fund's maximum exposure under these arrangements is unknown, as this would involve future claims that may be made against the Fund that have not yet occurred. The Manager believes that the risk of loss in connection with these potential indemnification obligations is remote. However, there can be no assurance that material liabilities related to such obligations will not arise in the future, which could adversely impact the Fund.
Note 3–Fees and Related Party Transactions
(A) Manager and Subadvisor. New York Life Investments, a registered investment adviser and an indirect, wholly-owned subsidiary of New York Life Insurance Company ("New York Life"), serves as the Fund's Manager, pursuant to an Amended and Restated Management Agreement ("Management Agreement"). The Manager provides offices, conducts clerical, recordkeeping and bookkeeping services and keeps most of the financial and accounting records required to be maintained by the Fund. Except for the portion of salaries and expenses that are the responsibility of the Fund, the Manager pays the salaries and expenses of all personnel affiliated with the Fund and certain operational expenses of the Fund. During a portion of the year ended October 31, 2022, the Fund reimbursed New York Life Investments in an amount equal to the portion
of the compensation of the Chief Compliance Officer attributable to the Fund. Wellington Management Company LLP ("Wellington" or the "Subadvisor"), a registered investment adviser, serves as the Subadvisor to the Fund and is responsible for the day-to-day portfolio management of the Fund. Pursuant to the terms of a Subadvisory Agreement ("Subadvisory Agreement") between New York Life Investments and Wellington, New York Life Investments pays for the services of the Subadvisor.
Pursuant to the Management Agreement, the Fund pays the Manager a monthly fee for the services performed and the facilities furnished at an annual rate of the Fund’s average daily net assets as follows: 0.70% up to $500 million; 0.65% from $500 million to $1 billion; 0.625% from $1 billion to $2 billion; and 0.60% in excess of $2 billion. During the year ended October 31, 2022, the effective management fee rate was 0.68% of the Fund’s average daily net assets, exclusive of any applicable waivers/reimbursements.
New York Life Investments has contractually agreed to waive fees and/or reimburse expenses so that Total Annual Fund Operating Expenses (excluding taxes, interest, litigation, extraordinary expenses, brokerage and other transaction expenses relating to the purchase or sale of portfolio investments, and acquired (underlying) fund fees and expenses) for Class I shares do not exceed 0.75% of its average daily net assets. In addition, New York Life Investments will waive fees and/or reimburse expenses so that Total Annual Fund Operating Expenses (excluding taxes, interest, litigation, extraordinary expenses, brokerage and other transaction expenses relating to the purchase or sale of portfolio investments, and acquired (underlying) fund fees and expenses) for Class R6 do not exceed those of Class I. This agreement will remain in effect until February 28, 2023, and shall renew automatically for one-year terms unless New York Life Investments provides written notice of termination prior to the start of the next term or upon approval of the Board.
Additionally, New York Life Investments has agreed to further voluntarily waive fees and/or reimburse expenses of the appropriate class of the Fund so that Total Annual Fund Operating Expenses (excluding taxes, interest, litigation, extraordinary expenses, brokerage and other transaction expenses relating to the purchase and sale of portfolio investments, and acquired (underlying) fund fees and expenses) of Class I shares do not exceed 0.92%. This voluntary waiver or reimbursement may be discontinued at any time without notice.
During the year ended October 31, 2022, New York Life Investments earned fees from the Fund in the amount of $5,505,500 and waived fees and/or reimbursed expenses, including the waiver/reimbursement of certain class specific expenses in the amount of $35,441 and paid the Subadvisor fees in the amount of $2,264,847.
JPMorgan provides sub-administration and sub-accounting services to the Fund pursuant to an agreement with New York Life Investments. These services include calculating the daily NAVs of the Fund, maintaining the general ledger and sub-ledger accounts for the calculation of the Fund's NAVs, and assisting New York Life Investments
| 24 | MainStay WMC Growth Fund |
in conducting various aspects of the Fund's administrative operations. For providing these services to the Fund, JPMorgan is compensated by New York Life Investments.
Pursuant to an agreement between the Trust and New York Life Investments, New York Life Investments is responsible for providing or procuring certain regulatory reporting services for the Fund. The Fund will reimburse New York Life Investments for the actual costs incurred by New York Life Investments in connection with providing or procuring these services for the Fund.
(B) Distribution and Service Fees. The Trust, on behalf of the Fund, has entered into a distribution agreement with NYLIFE Distributors LLC (the “Distributor”), an affiliate of New York Life Investments. The Fund has adopted distribution plans (the “Plans”) in accordance with the provisions of Rule 12b-1 under the 1940 Act.
Pursuant to the Class A, Investor Class and Class R2 Plans, the Distributor receives a monthly fee from the Class A, Investor Class and Class R2 shares at an annual rate of 0.25% of the average daily net assets of the Class A, Investor Class and Class R2 shares for distribution and/or service activities as designated by the Distributor. Pursuant to the Class B and Class C Plans, Class B and Class C shares pay the Distributor a monthly distribution fee at an annual rate of 0.75% of the average daily net assets of the Class B and Class C shares, along with a service fee at an annual rate of 0.25% of the average daily net assets of the Class B and Class C shares, for a total 12b-1 fee of 1.00%. Class I and Class R6 shares are not subject to a distribution and/or service fee.
The Plans provide that the distribution and service fees are payable to the Distributor regardless of the amounts actually expended by the Distributor for distribution of the Fund's shares and service activities.
In accordance with the Shareholder Services Plans for the Class R2 shares, the Manager has agreed to provide, through its affiliates or independent third parties, various shareholder and administrative support services to shareholders of the Class R2 shares. For its services, the Manager, its affiliates or independent third-party service providers are entitled to a shareholder service fee accrued daily and paid monthly at an annual rate of 0.10% of the average daily net assets of the Class R2 shares. This is in addition to any fees paid under the Class R2 Plan.
During the year ended October 31, 2022, shareholder service fees incurred by the Fund were as follows:
(C) Sales Charges. The Fund was advised by the Distributor that the amount of initial sales charges retained on sales of Class A and Investor Class shares during the year ended October 31, 2022, were $26,828 and $5,703, respectively.
The Fund was also advised that the Distributor retained CDSCs on redemptions of Class A, Class B and Class C shares during the year ended October 31, 2022, of $1,183, $596 and $88, respectively.
(D) Transfer, Dividend Disbursing and Shareholder Servicing Agent. NYLIM Service Company LLC, an affiliate of New York Life Investments, is the Fund's transfer, dividend disbursing and shareholder servicing agent pursuant to an agreement between NYLIM Service Company LLC and the Trust. NYLIM Service Company LLC has entered into an agreement with DST Asset Manager Solutions, Inc. ("DST"), pursuant to which DST performs certain transfer agent services on behalf of NYLIM Service Company LLC. New York Life Investments has contractually agreed to limit the transfer agency expenses charged to the Fund’s share classes to a maximum of 0.35% of that share class’s average daily net assets on an annual basis after deducting any applicable Fund or class-level expense reimbursement or small account fees. This agreement will remain in effect until February 28, 2023, and shall renew automatically for one-year terms unless New York Life Investments provides written notice of termination prior to the start of the next term or upon approval of the Board. During the year ended October 31, 2022, transfer agent expenses incurred by the Fund and any reimbursements, pursuant to the aforementioned Transfer Agency expense limitation agreement, were as follows:
| Class | Expense | Waived |
| Class A | $378,204 | $ — |
| Investor Class | 279,536 | (24,673) |
| Class B | 40,596 | (3,648) |
| Class C | 7,625 | (683) |
| Class I | 9,023 | — |
| Class R2 | 69 | — |
| Class R6 | 5,897 | — |
(E) Small Account Fee. Shareholders with small accounts adversely impact the cost of providing transfer agency services. In an effort to reduce total transfer agency expenses, the Fund has implemented a small account fee on certain types of accounts. As described in the Fund's prospectus, certain shareholders with an account balance of less than $1,000 ($5,000 for Class A share accounts) are charged an annual per account fee of $20 (assessed semi-annually), the proceeds from which offset transfer agent fees as reflected in the Statement of Operations. This small account fee will not apply to certain types of accounts as described further in the Fund’s prospectus.
(F) Capital. As of October 31, 2022, New York Life and its affiliates beneficially held shares of the Fund with the values and percentages of net assets as follows:
| Class R2 | $56,017 | 77.7% |
| Class R6 | 18,414 | 0.0‡ |
| ‡ | Less than one-tenth of a percent. |
Notes to Financial Statements (continued)
Note 4-Federal Income Tax
As of October 31, 2022, the cost and unrealized appreciation (depreciation) of the Fund’s investment portfolio, including applicable derivative contracts and other financial instruments, as determined on a federal income tax basis, were as follows:
| | Federal Tax
Cost | Gross
Unrealized
Appreciation | Gross
Unrealized
(Depreciation) | Net
Unrealized
Appreciation/
(Depreciation) |
| Investments in Securities | $619,206,305 | $157,187,531 | $(83,171,385) | $74,016,146 |
As of October 31, 2022, the components of accumulated gain (loss) on a tax basis were as follows:
Ordinary
income | Accumulated
Capital
and Other
Gain (Loss) | Other
Temporary
Differences | Unrealized
Appreciation
(Depreciation) | Total
Accumulated
Gain (Loss) |
| $— | $(45,370,546) | $— | $74,016,147 | $28,645,601 |
The difference between book-basis and tax-basis unrealized appreciation (depreciation) is primarily due to wash sale adjustments.
The following table discloses the current year reclassifications between total distributable earnings (loss) and additional paid-in capital arising from permanent differences; net assets as of October 31, 2022 were not affected.
| | Total
Distributable
Earnings (Loss) | Additional
Paid-In
Capital |
| | $1,159,427 | $(1,159,427) |
The reclassifications for the Fund are primarily due to net operating loss.
As of October 31, 2022, for federal income tax purposes, capital loss carryforwards of $42,616,227, as shown in the table below, were available to the extent provided by the regulations to offset future realized gains of the Fund. Accordingly, no capital gains distributions are expected to be paid to shareholders until net gains have been realized in excess of such amounts.
Capital Loss
Available Through | Short-Term
Capital Loss
Amounts (000’s) | Long-Term
Capital Loss
Amounts (000’s) |
| Unlimited | $42,616 | $— |
During the years ended October 31, 2022 and October 31, 2021, the tax character of distributions paid as reflected in the Statements of Changes in Net Assets was as follows:
| | 2022 | 2021 |
| Distributions paid from: | | |
| Ordinary Income | $ 74,525,288 | $ 990 |
| Long-Term Capital Gains | 130,944,928 | 30,159,553 |
| Total | $205,470,216 | $30,160,543 |
Note 5–Custodian
JPMorgan is the custodian of cash and securities held by the Fund. Custodial fees are charged to the Fund based on the Fund's net assets and/or the market value of securities held by the Fund and the number of certain transactions incurred by the Fund.
Note 6–Line of Credit
The Fund and certain other funds managed by New York Life Investments maintain a line of credit with a syndicate of banks in order to secure a source of funds for temporary purposes to meet unanticipated or excessive redemption requests.
Effective July 26, 2022, under the credit agreement (the “Credit Agreement”), the aggregate commitment amount is $600,000,000 with an additional uncommitted amount of $100,000,000. The commitment fee is an annual rate of 0.15% of the average commitment amount payable quarterly, regardless of usage, to JPMorgan, who serves as the agent to the syndicate. The commitment fee is allocated among the Fund and certain other funds managed by New York Life Investments based upon their respective net assets and other factors. Interest on any revolving credit loan is charged based upon the Federal Funds Rate, Daily Simple Secured Overnight Financing Rate ("SOFR") + 0.10%, or the Overnight Bank Funding Rate, whichever is higher. The Credit Agreement expires on July 25, 2023, although the Fund, certain other funds managed by New York Life Investments and the syndicate of banks may renew the Credit Agreement for an additional year on the same or different terms or enter into a credit agreement with a different syndicate of banks. Prior to July 26, 2022, the aggregate commitment amount and the commitment fee were the same as those under the current Credit Agreement. During the year ended October 31, 2022, there were no borrowings made or outstanding with respect to the Fund under the Credit Agreement.
Note 7–Interfund Lending Program
Pursuant to an exemptive order issued by the SEC, the Fund, along with certain other funds managed by New York Life Investments, may participate in an interfund lending program. The interfund lending program provides an alternative credit facility that permits the Fund and certain other funds managed by New York Life Investments to lend or borrow money for temporary purposes directly to or from one another, subject to the conditions of the exemptive order. During the year ended October 31, 2022, there were no interfund loans made or outstanding with respect to the Fund.
Note 8–Purchases and Sales of Securities (in 000’s)
During the year ended October 31, 2022, purchases and sales of securities, other than short-term securities, were $333,984 and $336,488, respectively.
The Fund may purchase securities from or sell securities to other portfolios managed by the Subadvisor. These interportfolio transactions
| 26 | MainStay WMC Growth Fund |
are primarily used for cash management purposes and are made pursuant to Rule 17a-7 under the 1940 Act. The Rule 17a-7 transactions during the year ended October 31, 2022, were as follows:
Sales
(000's) | Realized
Gain / (Loss)
(000's) |
| $1,767 | $(814) |
Note 9–Capital Share Transactions
Transactions in capital shares for the years ended October 31, 2022 and October 31, 2021, were as follows:
| Class A | Shares | Amount |
| Year ended October 31, 2022: | | |
| Shares sold | 333,429 | $ 13,175,004 |
| Shares issued to shareholders in reinvestment of distributions | 3,431,447 | 147,312,452 |
| Shares redeemed | (1,572,361) | (57,271,433) |
| Net increase (decrease) in shares outstanding before conversion | 2,192,515 | 103,216,023 |
| Shares converted into Class A (See Note 1) | 116,622 | 4,283,183 |
| Shares converted from Class A (See Note 1) | (2,162) | (66,808) |
| Net increase (decrease) | 2,306,975 | $ 107,432,398 |
| Year ended October 31, 2021: | | |
| Shares sold | 382,539 | $ 19,473,241 |
| Shares issued to shareholders in reinvestment of distributions | 472,038 | 21,548,548 |
| Shares redeemed | (1,215,428) | (61,668,171) |
| Net increase (decrease) in shares outstanding before conversion | (360,851) | (20,646,382) |
| Shares converted into Class A (See Note 1) | 709,356 | 35,772,789 |
| Shares converted from Class A (See Note 1) | (3,534) | (172,666) |
| Net increase (decrease) | 344,971 | $ 14,953,741 |
| |
| Investor Class | Shares | Amount |
| Year ended October 31, 2022: | | |
| Shares sold | 29,527 | $ 1,064,009 |
| Shares issued to shareholders in reinvestment of distributions | 465,396 | 19,486,115 |
| Shares redeemed | (125,946) | (4,520,015) |
| Net increase (decrease) in shares outstanding before conversion | 368,977 | 16,030,109 |
| Shares converted into Investor Class (See Note 1) | 13,285 | 458,733 |
| Shares converted from Investor Class (See Note 1) | (32,562) | (1,254,984) |
| Net increase (decrease) | 349,700 | $ 15,233,858 |
| Year ended October 31, 2021: | | |
| Shares sold | 43,568 | $ 2,153,613 |
| Shares issued to shareholders in reinvestment of distributions | 90,206 | 4,049,334 |
| Shares redeemed | (148,204) | (7,294,895) |
| Net increase (decrease) in shares outstanding before conversion | (14,430) | (1,091,948) |
| Shares converted into Investor Class (See Note 1) | 17,786 | 866,719 |
| Shares converted from Investor Class (See Note 1) | (646,596) | (32,054,024) |
| Net increase (decrease) | (643,240) | $ (32,279,253) |
| |
| Class B | Shares | Amount |
| Year ended October 31, 2022: | | |
| Shares sold | 4,388 | $ 151,833 |
| Shares issued to shareholders in reinvestment of distributions | 94,215 | 3,540,609 |
| Shares redeemed | (27,830) | (875,537) |
| Net increase (decrease) in shares outstanding before conversion | 70,773 | 2,816,905 |
| Shares converted from Class B (See Note 1) | (107,659) | (3,344,032) |
| Net increase (decrease) | (36,886) | $ (527,127) |
| Year ended October 31, 2021: | | |
| Shares sold | 2,096 | $ 95,091 |
| Shares issued to shareholders in reinvestment of distributions | 17,551 | 730,276 |
| Shares redeemed | (40,468) | (1,851,073) |
| Net increase (decrease) in shares outstanding before conversion | (20,821) | (1,025,706) |
| Shares converted from Class B (See Note 1) | (94,321) | (4,281,257) |
| Net increase (decrease) | (115,142) | $ (5,306,963) |
| |
Notes to Financial Statements (continued)
| Class C | Shares | Amount |
| Year ended October 31, 2022: | | |
| Shares sold | 6,189 | $ 204,515 |
| Shares issued to shareholders in reinvestment of distributions | 16,769 | 629,845 |
| Shares redeemed | (24,068) | (767,826) |
| Net increase (decrease) in shares outstanding before conversion | (1,110) | 66,534 |
| Shares converted from Class C (See Note 1) | (4,580) | (142,901) |
| Net increase (decrease) | (5,690) | $ (76,367) |
| Year ended October 31, 2021: | | |
| Shares sold | 6,203 | $ 287,892 |
| Shares issued to shareholders in reinvestment of distributions | 3,278 | 136,353 |
| Shares redeemed | (25,498) | (1,169,393) |
| Net increase (decrease) in shares outstanding before conversion | (16,017) | (745,148) |
| Shares converted from Class C (See Note 1) | (6,281) | (282,428) |
| Net increase (decrease) | (22,298) | $ (1,027,576) |
| |
| Class I | Shares | Amount |
| Year ended October 31, 2022: | | |
| Shares sold | 1,027,421 | $ 31,447,404 |
| Shares issued to shareholders in reinvestment of distributions | 61,206 | 2,732,828 |
| Shares redeemed | (98,160) | (3,645,210) |
| Net increase (decrease) in shares outstanding before conversion | 990,467 | 30,535,022 |
| Shares converted into Class I (See Note 1) | 2,074 | 66,809 |
| Net increase (decrease) | 992,541 | $ 30,601,831 |
| Year ended October 31, 2021: | | |
| Shares sold | 296,664 | $ 15,059,733 |
| Shares issued to shareholders in reinvestment of distributions | 74,526 | 3,498,989 |
| Shares redeemed | (977,008) | (47,135,526) |
| Net increase (decrease) in shares outstanding before conversion | (605,818) | (28,576,804) |
| Shares converted into Class I (See Note 1) | 3,000 | 150,867 |
| Shares converted from Class I (See Note 1) | (1,496,360) | (79,950,534) |
| Net increase (decrease) | (2,099,178) | $(108,376,471) |
| |
| Class R2 | Shares | Amount |
| Year ended October 31, 2022: | | |
| Shares sold | 585 | $ 21,669 |
| Shares issued to shareholders in reinvestment of distributions | 702 | 29,799 |
| Shares redeemed | (1,405) | (46,338) |
| Net increase (decrease) | (118) | $ 5,130 |
| Year ended October 31, 2021: | | |
| Shares sold | 113 | $ 5,628 |
| Shares issued to shareholders in reinvestment of distributions | 100 | 4,524 |
| Shares redeemed | (232) | (11,228) |
| Net increase (decrease) | (19) | $ (1,076) |
| |
| Class R6 | Shares | Amount |
| Year ended October 31, 2022: | | |
| Shares sold | 1,420,681 | $ 54,713,966 |
| Shares issued to shareholders in reinvestment of distributions | 679,896 | 30,350,578 |
| Shares redeemed | (422,178) | (14,709,658) |
| Net increase (decrease) | 1,678,399 | $ 70,354,886 |
| Year ended October 31, 2021:(a) | | |
| Shares sold | 1,121,606 | $ 61,087,205 |
| Shares redeemed | (8,564) | (499,269) |
| Net increase (decrease) in shares outstanding before conversion | 1,113,042 | 60,587,936 |
| Shares converted into Class R6 (See Note 1) | 1,496,360 | 79,950,534 |
| Net increase (decrease) | 2,609,402 | $ 140,538,470 |
| (a) | The inception of the class was April 26, 2021. |
Note 10–Other Matters
As of the date of this report, interest rates in the United States and many parts of the world, including certain European countries, are ascending from historically low levels. Thus, the Fund currently faces a heightened level of risk associated with rising interest rates. This could be driven by a variety of factors, including but not limited to central bank monetary policies, changing inflation or real growth rates, general economic conditions, increasing bond issuances or reduced market demand for low yielding investments.
An outbreak of COVID-19, first detected in December 2019, has developed into a global pandemic and has resulted in travel restrictions, closure of international borders, certain businesses and securities markets, restrictions on securities trading activities, prolonged quarantines, supply chain disruptions, and lower consumer demand, as well as general concern and uncertainty. In 2022, many countries lifted some or all restrictions related to COVID-19. However, the continued impact of COVID-19 and related variants is uncertain and could further adversely affect the global economy, national economies, individual issuers and capital markets in unforeseeable ways and result in a substantial and extended economic downturn. Developments that disrupt
| 28 | MainStay WMC Growth Fund |
global economies and financial markets, such as COVID-19, may magnify factors that affect the Fund's performance.
Note 11–Subsequent Events
In connection with the preparation of the financial statements of the Fund as of and for the year ended October 31, 2022, events and transactions subsequent to October 31, 2022, through the date the financial statements were issued have been evaluated by the Manager for possible adjustment and/or disclosure. No subsequent events requiring financial statement adjustment or disclosure have been identified.
Report of Independent Registered Public Accounting Firm
To the Shareholders of the Fund and Board of Trustees
MainStay Funds Trust:
Opinion on the Financial Statements
We have audited the accompanying statement of assets and liabilities of MainStay WMC Growth Fund (the Fund), one of the funds constituting MainStay Funds Trust, including the portfolio of investments, as of October 31, 2022, the related statement of operations for the year then ended, the statements of changes in net assets for each of the years in the two-year period then ended, and the related notes (collectively, the financial statements) and the financial highlights for each of the years or periods in the five-year period then ended. In our opinion, the financial statements and financial highlights present fairly, in all material respects, the financial position of the Fund as of October 31, 2022, the results of its operations for the year then ended, the changes in its net assets for each of the years in the two-year period then ended, and the financial highlights for each of the years or periods in the five-year period then ended, in conformity with U.S. generally accepted accounting principles.
Basis for Opinion
These financial statements and financial highlights are the responsibility of the Fund's management. Our responsibility is to express an opinion on these financial statements and financial highlights based on our audits. We are a public accounting firm registered with the Public Company Accounting Oversight Board (United States) (PCAOB) and are required to be independent with respect to the Fund in accordance with the U.S. federal securities laws and the applicable rules and regulations of the Securities and Exchange Commission and the PCAOB.
We conducted our audits in accordance with the standards of the PCAOB. Those standards require that we plan and perform the audit to obtain reasonable assurance about whether the financial statements and financial highlights are free of material misstatement, whether due to error or fraud. Our audits included performing procedures to assess the risks of material misstatement of the financial statements and financial highlights, whether due to error or fraud, and performing procedures that respond to those risks. Such procedures included examining, on a test basis, evidence regarding the amounts and disclosures in the financial statements and financial highlights. Such procedures also included confirmation of securities owned as of October 31, 2022, by correspondence with the custodian, the transfer agent and brokers; when replies were not received from brokers, we performed other auditing procedures. Our audits also included evaluating the accounting principles used and significant estimates made by management, as well as evaluating the overall presentation of the financial statements and financial highlights. We believe that our audits provide a reasonable basis for our opinion.

We have served as the auditor of one or more New York Life Investment Management investment companies since 2003.
Philadelphia, Pennsylvania
December 23, 2022
| 30 | MainStay WMC Growth Fund |
Federal Income Tax Information
(Unaudited)
The Fund is required under the Internal Revenue Code to advise shareholders in a written statement as to the federal tax status of dividends paid by the Fund during such fiscal years. Accordingly, the Fund paid $130,944,928 as long term capital gain distributions.
For the fiscal year ended October 31, 2022, the Fund designated approximately $4,403,760 under the Internal Revenue Code as qualified dividend income eligible for reduced tax rates.
The dividends paid by the Fund during the fiscal year ended October 31, 2022 should be multiplied by 5.83% to arrive at the amount eligible for the corporate dividend-received deduction.
In February 2023, shareholders will receive an IRS Form 1099-DIV or substitute Form 1099, which will show the federal tax status of the distributions received by shareholders in calendar year 2022. The amounts that will be reported on such 1099-DIV or substitute Form 1099 will be the amounts you are to use on your federal income tax return and will differ from the amounts which we must report for the Fund's fiscal year ended October 31, 2022.
Proxy Voting Policies and Procedures and Proxy Voting Record
The Fund is required to file with the SEC its proxy voting record for the 12-month period ending June 30 on Form N-PX. A description of the policies and procedures that are used to vote proxies relating to portfolio securities of the Fund is available free of charge upon request by calling 800-624-6782 or visiting the SEC’s website at www.sec.gov. The most recent Form N-PX or proxy voting record is available free of charge upon request by calling 800-624-6782; visiting newyorklifeinvestments.com; or visiting the SEC’s website at www.sec.gov.
Shareholder Reports and Quarterly Portfolio Disclosure
The Fund is required to file its complete schedule of portfolio holdings with the SEC 60 days after its first and third fiscal quarter on Form N-PORT. The Fund's holdings report is available free of charge upon request by calling New York Life Investments at 800-624-6782.
Board of Trustees and Officers (Unaudited)
The Trustees and officers of the Fund are listed below. The Board oversees the MainStay Group of Funds (which consists of MainStay Funds and MainStay Funds Trust), MainStay VP Funds Trust, MainStay MacKay DefinedTerm Municipal Opportunities Fund, MainStay CBRE Global Infrastructure Megatrends Fund, the Manager and the Subadvisors, and elects the officers of the Funds who are responsible for the day-to-day operations of the Fund. Information pertaining to the Trustees and officers is set forth below. Each Trustee serves until his or her successor is
elected and qualified or until his or her resignation, death or removal. Under the Board’s retirement policy, unless an exception is made, a Trustee must tender his or her resignation by the end of the calendar year during which he or she reaches the age of 75. The business address of each Trustee and officer listed below is 51 Madison Avenue, New York, New York 10010. None of the Trustees are “interested persons” (as defined by the 1940 Act and rules adopted by the SEC thereunder) of the Fund (“Independent Trustees”).
| | Name and
Year of Birth | Term of Office,
Position(s) Held and
Length of Service | Principal Occupation(s)
During Past Five Years | Number of
Portfolios in
Fund Complex
Overseen by
Trustee | Other Directorships
Held by Trustee |
| | | | | | |
| | David H. Chow
1957 | MainStay Funds: Trustee since 2016, Advisory Board Member (June 2015 to December 2015);MainStay Funds Trust:
Trustee since January 2016, Advisory Board Member (June 2015 to December 2015) | Founder and CEO, DanCourt Management, LLC since 1999 | 78 | MainStay VP Funds Trust: Trustee since January 2016, Advisory Board Member (June 2015 to December 2015) (31 portfolios);
MainStay MacKay DefinedTerm Municipal Opportunities Fund: Trustee since January 2016, Advisory Board Member (June 2015 to December 2015);
MainStay CBRE Global Infrastructure Megatrends Fund: Trustee since June 2021; VanEck Vectors Group of Exchange-Traded Funds: Independent Chairman of the Board of Trustees since 2008 and Trustee since 2006 (56 portfolios); and Berea College of Kentucky: Trustee since 2009, Chair of the Investment Committee since 2018 |
| | Susan B. Kerley
1951 | MainStay Funds: Chairman since 2017 and Trustee since 2007;MainStay Funds Trust:
Chairman since 2017 and Trustee since 1990** | President, Strategic Management Advisors LLC since 1990 | 78 | MainStay VP Funds Trust: Chairman since January 2017 and Trustee since 2007 (31 portfolios)**;
MainStay MacKay DefinedTerm Municipal Opportunities Fund: Chairman since 2017 and Trustee since 2011;
MainStay CBRE Global Infrastructure Megatrends Fund: Trustee since June 2021; and Legg Mason Partners Funds: Trustee since 1991 (45 portfolios) |
| | Alan R. Latshaw
1951 | MainStay Funds: Trustee since 2006;MainStay Funds Trust:
Trustee since 2007*** | Retired; Partner, Ernst & Young LLP (2002 to 2003); Partner, Arthur Andersen LLP (1989 to 2002); Consultant to the MainStay Funds Audit and Compliance Committee (2004 to 2006) | 78 | MainStay VP Funds Trust: Trustee since 2007 (31 portfolios)**;
MainStay MacKay DefinedTerm Municipal Opportunities Fund: Trustee since 2011; and
MainStay CBRE Global Infrastructure Megatrends Fund: Trustee since June 2021 |
| 32 | MainStay WMC Growth Fund |
| | Name and
Year of Birth | Term of Office,
Position(s) Held and
Length of Service | Principal Occupation(s)
During Past Five Years | Number of
Portfolios in
Fund Complex
Overseen by
Trustee | Other Directorships
Held by Trustee |
| | | | | | |
| | Karen Hammond
1956 | MainStay Funds: Trustee since December 2021, Advisory Board Member (June 2021 to December 2021);MainStay Funds Trust:
Trustee since December 2021, Advisory Board Member (June 2021 to December 2021)
| Retired, Managing Director, Devonshire Investors (2007 to 2013); Senior Vice President, Fidelity Management & Research Co. (2005 to 2007); Senior Vice President and Corporate Treasurer, FMR Corp. (2003 to 2005); Chief Operating Officer, Fidelity Investments Japan (2001 to 2003) | 78 | MainStay VP Funds Trust: Trustee since December 2021, Advisory Board Member (June 2021 to December 2021) (31 Portfolios);
MainStay MacKay DefinedTerm Municipal Opportunities Fund: Trustee since December 2021, Advisory Board Member (June 2021 to December 2021);
MainStay CBRE Global Infrastructure Megatrends Fund: Trustee since December 2021, Advisory Board Member (June 2021 to December 2021);
Two Harbors Investment Corp.: Director since 2018;
Rhode Island State Investment Commission: Member since 2017; and
Blue Cross Blue Shield of Rhode Island: Director since 2019 |
| | Jacques P. Perold
1958 | MainStay Funds: Trustee since 2016, Advisory Board Member (June 2015 toDecember 2015);MainStay Funds Trust:
Trustee since January 2016, Advisory Board Member (June 2015 to December 2015) | Founder and Chief Executive Officer, CapShift Advisors LLC (since 2018); President, Fidelity Management & Research Company (2009 to 2014); President and Chief Investment Officer, Geode Capital Management, LLC (2001 to 2009) | 78 | MainStay VP Funds Trust: Trustee since January 2016, Advisory Board Member (June 2015 to December 2015) (31 portfolios);
MainStay MacKay DefinedTerm Municipal Opportunities Fund: Trustee since January 2016, Advisory Board Member (June 2015 to December 2015);
MainStay CBRE Global Infrastructure Megatrends Fund: Trustee since June 2021; Partners in Health: Trustee since 2019; Allstate Corporation: Director since 2015; and MSCI Inc.: Director since 2017 |
| | Richard S. Trutanic
1952 | MainStay Funds: Trustee since 1994;MainStay Funds Trust:
Trustee since 2007*** | Chairman and Chief Executive Officer, Somerset & Company (financial advisory firm) since 2004; Managing Director, The Carlyle Group (private investment firm) (2002 to 2004); Senior Managing Director, Partner and Board Member, Groupe Arnault S.A. (private investment firm) (1999 to 2002) | 78 | MainStay VP Funds Trust: Trustee since 2007 (31 portfolios)**;
MainStay MacKay DefinedTerm Municipal Opportunities Fund: Trustee since 2011; and MainStay CBRE Global Infrastructure Megatrends Fund: Trustee since June 2021 |
| ** | Includes prior service as a Director of MainStay VP Series Fund, Inc., the predecessor to MainStay VP Funds Trust. |
| *** | Includes prior service as a Director/Trustee of certain predecessor entities to MainStay Funds Trust. |
Board of Trustees and Officers (Unaudited) (continued)
| | Name and
Year of Birth | Position(s) Held and
Length of Service | Principal Occupation(s)
During Past Five Years | |
| | | | | |
| | Kirk C. Lehneis
1974 | President, MainStay Funds, MainStay Funds Trust since 2017 | Chief Operating Officer and Senior Managing Director (since 2016), New York Life Investment Management LLC and New York Life Investment Management Holdings LLC; Member of the Board of Managers (since 2017) and Senior Managing Director (since 2018), NYLIFE Distributors LLC; Chairman of the Board and Senior Managing Director, NYLIM Service Company LLC (since 2017); Trustee, President and Principal Executive Officer of IndexIQ Trust, IndexIQ ETF Trust and IndexIQ Active ETF Trust (since January 2018); President, MainStay CBRE Global Infrastructure Megatrends Fund (since 2021), MainStay MacKay DefinedTerm Municipal Opportunities Fund and MainStay VP Funds Trust (since 2017); Senior Managing Director, Global Product Development (From 2015-2016); Managing Director, Product Development (2010 to 2015), New York Life Investment Management LLC | |
| | Jack R. Benintende
1964 | Treasurer and Principal Financial and Accounting Officer, MainStay Funds (since 2007), MainStay Funds Trust (since 2009) | Managing Director, New York Life Investment Management LLC (since 2007); Treasurer and Principal Financial and Accounting Officer, MainStay CBRE Global Infrastructure Megatrends Fund (since 2021), MainStay MacKay DefinedTerm Municipal Opportunities Fund (since 2011) and MainStay VP Funds Trust (since 2007)** and Assistant Treasurer, New York Life Investment Management Holdings LLC (2008 to 2012) | |
| | J. Kevin Gao
1967 | Secretary and Chief Legal Officer, MainStay Funds and MainStay Funds Trust (since 2010) | Managing Director and Associate General Counsel, New York Life Investment Management LLC (since 2010); Secretary and Chief Legal Officer and MainStay CBRE Global Infrastructure Megatrends Fund (since 2021), MainStay MacKay DefinedTerm Municipal Opportunities Fund (since 2011) and MainStay VP Funds Trust (since 2010)** | |
| | Scott T. Harrington
1959 | Vice President— Administration, MainStay Funds (since 2009), MainStay Funds Trust (since 2009) | Managing Director, New York Life Investment Management LLC (including predecessor advisory organizations) (since 2000); Member of the Board of Directors, New York Life Trust Company (since 2009); Vice President—Administration, MainStay CBRE Global Infrastructure Megatrends Fund (since 2021), MainStay MacKay DefinedTerm Municipal Opportunities Fund (since 2011) and MainStay VP Funds Trust (since 2005)** | |
| | Kevin M. Gleason
1967 | Vice President and Chief Compliance Officer, MainStay Funds and MainStay Funds Trust (since June 2022) | Vice President and Chief Compliance Officer, IndexIQ, IndexIQ ETF Trust and Index IQ Active ETF Trust (since June 2022); Vice President and Chief Compliance Officer, MainStay CBRE Global Infrastructure Megatrends Fund, MainStay VP Funds Trust and MainStay MacKay DefinedTerm Municipal Opportunities Fund (since June 2022); Senior Vice President, Voya Investment Management and Chief Compliance Officer, Voya Family of Funds (2012-2022) | |
| * | The officers listed above are considered to be “interested persons” of the MainStay Group of Funds, MainStay VP Funds Trust, MainStay CBRE Global Infrastructure Megatrends Fund and MainStay MacKay DefinedTerm Municipal Opportunities Fund within the meaning of the 1940 Act because of their affiliation with the MainStay Group of Funds, New York Life Insurance Company and/or its affiliates, including New York Life Investment Management LLC, NYLIM Service Company LLC, NYLIFE Securities LLC and/or NYLIFE Distributors LLC, as described in detail in the column captioned “Principal Occupation(s) During Past Five Years.” Officers are elected annually by the Board. |
| ** | Includes prior service as an Officer of MainStay VP Series Fund, Inc., the predecessor to MainStay VP Funds Trust. |
Officers of the Trust (Who are not Trustees)*
| 34 | MainStay WMC Growth Fund |
Equity
U.S. Equity
MainStay Epoch U.S. Equity Yield Fund
MainStay S&P 500 Index Fund1
MainStay Winslow Large Cap Growth Fund
MainStay WMC Enduring Capital Fund
MainStay WMC Growth Fund
MainStay WMC Small Companies Fund
MainStay WMC Value Fund
International Equity
MainStay Epoch International Choice Fund
MainStay MacKay International Equity Fund
MainStay WMC International Research Equity Fund
Emerging Markets Equity
MainStay Candriam Emerging Markets Equity Fund
Global Equity
MainStay Epoch Capital Growth Fund
MainStay Epoch Global Equity Yield Fund
Fixed Income
Taxable Income
MainStay Candriam Emerging Markets Debt Fund
MainStay Floating Rate Fund
MainStay MacKay High Yield Corporate Bond Fund
MainStay MacKay Short Duration High Yield Fund
MainStay MacKay Strategic Bond Fund
MainStay MacKay Total Return Bond Fund
MainStay MacKay U.S. Infrastructure Bond Fund
MainStay Short Term Bond Fund
Tax-Exempt Income
MainStay MacKay California Tax Free Opportunities Fund2
MainStay MacKay High Yield Municipal Bond Fund
MainStay MacKay New York Tax Free Opportunities Fund3
MainStay MacKay Short Term Municipal Fund
MainStay MacKay Strategic Municipal Allocation Fund
MainStay MacKay Tax Free Bond Fund
Money Market
MainStay Money Market Fund
Mixed Asset
MainStay Balanced Fund
MainStay Income Builder Fund
MainStay MacKay Convertible Fund
Speciality
MainStay CBRE Global Infrastructure Fund
MainStay CBRE Real Estate Fund
MainStay Cushing MLP Premier Fund
Asset Allocation
MainStay Conservative Allocation Fund
MainStay Conservative ETF Allocation Fund
MainStay Defensive ETF Allocation Fund
MainStay Equity Allocation Fund
MainStay Equity ETF Allocation Fund
MainStay ESG Multi-Asset Allocation Fund
MainStay Growth Allocation Fund
MainStay Growth ETF Allocation Fund
MainStay Moderate Allocation Fund
MainStay Moderate ETF Allocation Fund
Manager
New York Life Investment Management LLC
New York, New York
Subadvisors
Candriam4
Strassen, Luxembourg
CBRE Investment Management Listed Real Assets LLC
Radnor, Pennsylvania
Cushing Asset Management, LP
Dallas, Texas
Epoch Investment Partners, Inc.
New York, New York
MacKay Shields LLC4
New York, New York
NYL Investors LLC4
New York, New York
Wellington Management Company LLP
Boston, Massachusetts
Winslow Capital Management, LLC
Minneapolis, Minnesota
Legal Counsel
Dechert LLP
Washington, District of Columbia
Independent Registered Public Accounting Firm
KPMG LLP
Philadelphia, Pennsylvania
Distributor
NYLIFE Distributors LLC4
Jersey City, New Jersey
Custodian
JPMorgan Chase Bank, N.A.
New York, New York
1.
Prior to February 28, 2022, the Fund's name was MainStay MacKay S&P 500 Index Fund.
| 2. | This Fund is registered for sale in AZ, CA, NV, OR, TX, UT, WA and MI (Class A and Class I shares only), and CO, FL, GA, HI, ID, MA, MD, NH, NJ and NY (Class I shares only). |
| 3. | This Fund is registered for sale in CA, CT, DE, FL, MA, NJ, NY and VT. |
| 4. | An affiliate of New York Life Investment Management LLC. |
Not part of the Annual Report
For more information
800-624-6782
newyorklifeinvestments.com
“New York Life Investments” is both a service mark, and the common trade name, of certain investment advisors affiliated with New York Life Insurance Company. The MainStay Funds® are managed by New York Life Investment Management LLC and distributed by NYLIFE Distributors LLC, 30 Hudson Street, Jersey City, NJ 07302, a wholly owned subsidiary of New York Life Insurance Company. NYLIFE Distributors LLC is a Member FINRA/SIPC.
©2022 NYLIFE Distributors LLC. All rights reserved.
| 5013886.2MS229-22 | MSWG11-12/22 |
(NYLIM) NL529
MainStay WMC International Research Equity Fund
Message from the President and Annual Report
October 31, 2022
Sign up for e-delivery of your shareholder reports. For full details on e-delivery, including who can participate and what you can receive via e-delivery,
please log in to newyorklifeinvestments.com/accounts.
| Not FDIC/NCUA Insured | Not a Deposit | May Lose Value | No Bank Guarantee | Not Insured by Any Government Agency |
This page intentionally left blank
Message from the President
A series of economic and geopolitical challenges undermined equity and fixed-income markets during the 12-month reporting period ended October 31, 2022. Stocks and bonds alike trended lower in the face of sharply rising interest rates, increasing inflationary pressures, slowing economic growth and Russia’s invasion of Ukraine.
The reporting period began on a mixed note, with concerns about the spreading Omicron variant of the COVID-19 virus and increasingly hawkish statements from the U.S. Federal Reserve (the “Fed”) regarding mounting inflation, countered by bullish sentiment stemming from U.S. economic growth and strong corporate earnings. In January 2022, markets turned decisively negative as comments from the Fed raised the likelihood of rate hikes as early as March, and Russia issued increasingly aggressive threats toward Ukraine. The onset of Russia’s invasion in February exacerbated global inflationary pressures while increasing investor uncertainty. Domestic supply shortages, international trade imbalances and rising inflation caused GDP (gross domestic product) to contract in the first and second quarters of the year, although employment and consumer spending proved resilient. Prices for petroleum surged to multi-year highs, while many key agricultural chemicals and industrial metals climbed as well. Accelerating inflationary forces prompted the Fed to implement its most aggressive interest rate increases since the 1980s with a series of five sharp rate hikes, raising the federal funds rate from a range of 0.00% to 0.25% in March to 3.00% to 3.25% in September, with additional rate hikes expected before the end of the year. International central banks generally followed suit, raising rates by varying degrees in efforts to curb local inflation, although most increases remained significantly more modest than those in the United States. Relatively high U.S. interest rates and risk-averse international sentiment pushed U.S. dollar values higher compared to most other currencies, with the ensuing negative impact on global prices for food, fuel and other key, U.S.-dollar-denominated products.
The effects of these interrelated challenges were felt throughout U.S. and international financial markets. The S&P 500® Index, a widely regarded benchmark of U.S. market performance, declined by more than 14% during the reporting period. Although the energy sector generated strong gains, bolstered by elevated oil and gas prices, most other industry areas recorded losses. The more cyclical and growth-oriented sectors of consumer discretionary, real estate and information technology delivered the
weakest returns, while the traditionally defensive and value-oriented consumer staples, utilities and health care sectors outperformed. International stocks lagged compared to their U.S. counterparts, with some emerging markets, such as China, suffering particularly steep losses. A few markets, however, including Brazil, Mexico and the United Arab Emirates, ended the reporting period with little change. Fixed-income markets saw bond prices broadly decline as yields rose along with interest rates. Short-term yields rose faster than long-term yields, producing a yield curve inversion from July through the end of the reporting period, with long-term rates remaining below short-term rates. While floating-rate instruments, which feature variable interest rates that allow investors to benefit from a rising rate environment, provided a degree of insulation from inflation-driven trends, they were not immune to the market’s widespread declines.
While the Fed acknowledges the costs of rising rates in terms of weaker GDP growth and unsettled financial markets over the short term, its primary focus continues to be the longer-term economic impact of inflation. With the latest figures as of the date of this report showing that inflation remains above 8%, versus a target rate of just 2%, the Fed clearly has a distance yet to go, making further rate increases and market volatility more likely in the coming months. The question remains as to whether the Fed and other central banks will manage a so-called “soft landing,” curbing inflation while avoiding a persistent economic slowdown. If they prove successful, we expect that favorable inflation trends and increasingly attractive valuations in both equity and bond markets should eventually translate into sustainable improvements in the investment environment.
Whatever actions the Fed takes and however financial markets react, as a MainStay investor, you can depend on us to continue providing the insight, expertise and service that have long defined New York Life Investments. Thank you for trusting us to help you meet your investment needs.
Sincerely,
Kirk C. Lehneis
President
The opinions expressed are as of the date of this report and are subject to change. There is no guarantee that any forecast made will come to pass. This material does not constitute investment advice and is not intended as an endorsement of any specific investment. Past performance is no guarantee of future results.
Not part of the Annual Report
Investors should refer to the Fund’s Summary Prospectus and/or Prospectus and consider the Fund’s investment objectives, strategies, risks, charges and expenses carefully before investing. The Summary Prospectus and/or Prospectus contain this and other information about the Fund. You may obtain copies of the Fund’s Summary Prospectus, Prospectus and Statement of Additional Information, which includes information about the MainStay Funds Trust's Trustees, free of charge, upon request, by calling toll-free 800-624-6782, by writing to NYLIFE Distributors LLC, Attn: MainStay Marketing Department, 30 Hudson Street, Jersey City, NJ 07302 or by sending an e-mail to MainStayShareholderServices@nylim.com. These documents are also available via the MainStay Funds’ website at newyorklifeinvestments.com. Please read the Fund’s Summary Prospectus and/or Prospectus carefully before investing.
Investment and Performance Comparison (Unaudited)
Performance data quoted represents past performance. Past performance is no guarantee of future results. Because of market volatility and other factors, current performance may be lower or higher than the figures shown. Investment return and principal value will fluctuate, and as a result, when shares are redeemed, they may be worth more or less than their original cost. The graph below depicts the historical performance of Class I shares of the Fund. Performance will vary from class to class based on differences in class-specific expenses and sales charges. For performance information current to the most recent month-end, please call 800-624-6782 or visit newyorklifeinvestments.com.
The performance table and graph do not reflect the deduction of taxes that a shareholder would pay on distributions or Fund share redemptions. Total returns reflect maximum applicable sales charges as indicated in the table below, if any, changes in share price, and reinvestment of dividend and capital gain distributions. The graph assumes the initial investment amount shown below and reflects the deduction of all sales charges that would have applied for the period of investment. Performance figures may reflect certain fee waivers and/or expense limitations, without which total returns may have been lower. For more information on share classes and current fee waivers and/or expense limitations (if any), please refer to the Notes to Financial Statements.
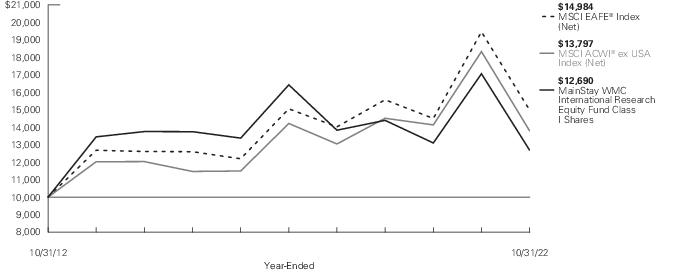
| Average Annual Total Returns for the Year-Ended October 31, 2022 |
| Class | Sales Charge | | Inception
Date1 | One
Year | Five
Years | Ten
Years | Gross
Expense
Ratio2 |
| Class A Shares | Maximum 5.5% Initial Sales Charge | With sales charges | 9/28/2007 | -29.96% | -6.35% | 1.56% | 1.20% |
| | | Excluding sales charges | | -25.89 | -5.28 | 2.14 | 1.20 |
| Investor Class Shares3 | Maximum 5% Initial Sales Charge | With sales charges | 2/28/2008 | -29.77 | -6.55 | 1.39 | 1.49 |
| | | Excluding sales charges | | -26.07 | -5.49 | 1.96 | 1.49 |
| Class C Shares | Maximum 1% CDSC | With sales charges | 9/28/2007 | -27.37 | -6.18 | 1.20 | 2.24 |
| | If Redeemed Within One Year of Purchase | Excluding sales charges | | -26.65 | -6.18 | 1.20 | 2.24 |
| Class I Shares | No Sales Charge | | 9/28/2007 | -25.61 | -5.03 | 2.41 | 0.95 |
| 1. | Effective March 5, 2021, the Fund replaced its subadvisor and modified its principal investment strategies. The past performance in the graph and table prior to that date reflects the Fund's prior subadvisor and principal investment strategies. |
| 2. | The gross expense ratios presented reflect the Fund’s “Total Annual Fund Operating Expenses” from the most recent Prospectus, as supplemented, and may differ from other expense ratios disclosed in this report. |
| 3. | Prior to June 30, 2020, the maximum initial sales charge was 5.5%, which is reflected in the applicable average annual total return figures shown. |
The footnotes on the next page are an integral part of the table and graph and should be carefully read in conjunction with them.
| Benchmark Performance* | One
Year | Five
Years | Ten
Years |
| MSCI ACWI® ex USA Index (Net)1 | -24.73% | -0.60% | 3.27% |
| MSCI EAFE® Index (Net)2 | -23.00 | -0.09 | 4.13 |
| Morningstar Foreign Large Blend Category Average3 | -24.05 | -0.71 | 3.44 |
| * | Returns for indices reflect no deductions for fees, expenses or taxes, except for foreign withholding taxes where applicable. Results assume reinvestment of all dividends and capital gains. An investment cannot be made directly in an index. |
| 1. | The Fund has selected the MSCI ACWI® (All Country World Index) ex USA Index (Net) as its primary benchmark. The MSCI ACWI® ex USA Index (Net) is a free float-adjusted market capitalization weighted index that is designed to measure the equity market performance of developed and emerging markets, excluding the U.S. |
| 2. | The MSCI EAFE® Index (Net) is the Fund's secondary benchmark. The MSCI EAFE® Index (Net) consists of international stocks representing the developed world outside of North America. |
| 3. | The Morningstar Foreign Large Blend Category Average is representative of funds that invest in a variety of big international stocks. Most of these portfolios divide their assets among a dozen or more developed markets, including Japan, Britain, France, and Germany. These portfolios primarily invest in stocks that have market caps in the top 70% of each economically integrated market (such as Europe or Asia ex-Japan). The blend style is assigned to portfolios where neither growth nor value characteristics predominate. These portfolios typically will have less than 20% of assets invested in U.S. stocks. Results are based on average total returns of similar funds with all dividends and capital gain distributions reinvested. |
The footnotes on the preceding page are an integral part of the table and graph and should be carefully read in conjunction with them.
| 6 | MainStay WMC International Research Equity Fund |
Cost in Dollars of a $1,000 Investment in MainStay WMC International Research Equity Fund (Unaudited)
The example below is intended to describe the fees and expenses borne by shareholders during the six-month period from May 1, 2022 to October 31, 2022, and the impact of those costs on your investment.
Example
As a shareholder of the Fund you incur two types of costs: (1) transaction costs, including exchange fees and sales charges (loads) on purchases (as applicable), and (2) ongoing costs, including management fees, distribution and/or service (12b-1) fees and other Fund expenses (as applicable). This example is intended to help you understand your ongoing costs (in dollars) of investing in the Fund and to compare these costs with the ongoing costs of investing in other mutual funds. The example is based on an investment of $1,000 made at the beginning of the six-month period and held for the entire period from May 1, 2022 to October 31, 2022.
This example illustrates your Fund’s ongoing costs in two ways:
Actual Expenses
The second and third data columns in the table below provide information about actual account values and actual expenses. You may use the information in these columns, together with the amount you invested, to estimate the expenses that you paid during the six months ended October 31, 2022. Simply divide your account value by $1,000 (for example, an
$8,600 account value divided by $1,000 = 8.6), then multiply the result by the number under the heading entitled “Expenses Paid During Period” to estimate the expenses you paid on your account during this period.
Hypothetical Example for Comparison Purposes
The fourth and fifth data columns in the table below provide information about hypothetical account values and hypothetical expenses based on the Fund’s actual expense ratio and an assumed rate of return of 5% per year before expenses, which is not the Fund’s actual return. The hypothetical account values and expenses may not be used to estimate the actual ending account balances or expenses you paid for the six-month period shown. You may use this information to compare the ongoing costs of investing in the Fund with the ongoing costs of investing in other mutual funds. To do so, compare this 5% hypothetical example with the 5% hypothetical examples that appear in the shareholder reports of the other mutual funds.
Please note that the expenses shown in the table are meant to highlight your ongoing costs only and do not reflect any transactional costs, such as exchange fees or sales charges (loads). Therefore, the fourth and fifth data columns of the table are useful in comparing ongoing costs only and will not help you determine the relative total costs of owning different funds. In addition, if these transactional costs were included, your costs would have been higher.
| Share Class | Beginning
Account
Value
5/1/22 | Ending Account
Value (Based
on Actual
Returns and
Expenses)
10/31/22 | Expenses
Paid
During
Period1 | Ending Account
Value (Based
on Hypothetical
5% Annualized
Return and
Actual Expenses)
10/31/22 | Expenses
Paid
During
Period1 | Net Expense
Ratio
During
Period2, 3 |
| Class A Shares | $1,000.00 | $875.40 | $ 5.48 | $1,019.36 | $ 5.90 | 1.16% |
| Investor Class Shares | $1,000.00 | $874.80 | $ 6.99 | $1,017.74 | $ 7.53 | 1.48% |
| Class C Shares | $1,000.00 | $871.60 | $10.52 | $1,013.96 | $11.32 | 2.23% |
| Class I Shares | $1,000.00 | $877.60 | $ 4.12 | $1,020.82 | $ 4.43 | 0.87% |
| 1. | Expenses are equal to the Fund’s annualized expense ratio of each class multiplied by the average account value over the period, divided by 365 and multiplied by 184 (to reflect the six-month period). The table above represents the actual expenses incurred during the six-month period. In addition to the fees and expenses which the Fund bears directly, it also indirectly bears a pro rata share of the fees and expenses of the underlying funds in which it invests. Such indirect expenses are not included in the above-reported expense figures. |
| 2. | Expenses are equal to the Fund's annualized expense ratio to reflect the six-month period. |
| 3. | Expenses are inclusive of dividends and interest on investments sold short. |
Country Composition as of October 31, 2022 (Unaudited)
| United Kingdom | 18.1% |
| Japan | 14.6 |
| France | 9.8 |
| Netherlands | 7.3 |
| Canada | 5.7 |
| United States | 4.7 |
| Australia | 4.1 |
| China | 3.6 |
| Switzerland | 3.6 |
| Taiwan | 3.3 |
| Hong Kong | 2.6 |
| Italy | 2.6 |
| Germany | 2.4 |
| Republic of Korea | 2.2 |
| Brazil | 2.2 |
| India | 1.9 |
| Ireland | 1.6 |
| Spain | 1.4 |
| Sweden | 1.3 |
| Singapore | 1.3 |
| Denmark | 0.8% |
| Thailand | 0.7 |
| South Africa | 0.7 |
| Austria | 0.7 |
| Indonesia | 0.7 |
| Philippines | 0.5 |
| Belgium | 0.5 |
| United Arab Emirates | 0.4 |
| Finland | 0.3 |
| Portugal | 0.2 |
| Macao | 0.2 |
| Luxembourg | 0.2 |
| Norway | 0.1 |
| Israel | 0.0‡ |
| Russia | 0.0‡ |
| Other Assets, Less Liabilities | –0.3 |
| Investments Sold Short | –0.0‡ |
| | 100.0% |
| ‡ | Less than one–tenth of a percent. |
See Portfolio of Investments beginning on page 11 for specific holdings within these categories. The Fund's holdings are subject to change.
Top Ten Holdings and/or Issuers Held as of October 31, 2022 (excluding short-term investments) (Unaudited)
| 1. | Shell plc |
| 2. | Unilever plc |
| 3. | BP plc |
| 4. | British American Tobacco plc |
| 5. | Diageo plc |
| 6. | Taiwan Semiconductor Manufacturing Co. Ltd., Sponsored ADR |
| 7. | Royal Bank of Canada |
| 8. | Pernod Ricard SA |
| 9. | ASML Holding NV |
| 10. | AstraZeneca plc |
| 8 | MainStay WMC International Research Equity Fund |
Portfolio Management Discussion and Analysis (Unaudited)
Questions answered by portfolio managers Jonathan G. White, CFA, and Mary L. Pryshlak, CFA, of Wellington Management Company LLP, the Fund’s Subadvisor.
How did MainStay WMC International Research Equity Fund perform relative to its benchmarks and peer group during the 12 months ended October 31, 2022?
For the 12 months ended October 31, 2022, Class I shares of MainStay WMC International Research Equity Fund returned −25.61%, underperforming the −24.73% return of the Fund’s primary benchmark, the MSCI ACWI® (All Country World Index) ex USA Index (Net) (the "Index"), and the −23.00% return of the Fund’s secondary benchmark, the MSCI EAFE® Index (Net). Over the same period, Class I shares also underperformed the −24.05% return of the Morningstar Foreign Large Blend Category Average.1
What factors affected the Fund’s relative performance during the reporting period?
The Fund underperformed the MSCI ACWI® ex USA Index (Net) during the reporting period primarily due to security selection. Weak selection in information technology, health care and consumer staples was partially offset by stronger selection in financials, energy and materials. Sector allocation, a result of our bottom-up stock selection process, modestly enhanced relative returns. Positive allocation effect was driven by the Fund’s underweight exposure to the consumer discretionary and communication services sectors, as well as overweight exposure to health care, although this was partially offset by the negative impact of overweight exposure to information technology and underweight exposure to materials and energy.
During the reporting period, which sectors were the strongest positive contributors to the Fund’s relative performance and which sectors were particularly weak?
During the reporting period, the financials, communication services and energy sectors provided the strongest positive contributions to the Fund’s performance relative to the MSCI ACWI® ex USA Index (Net). (Contributions take weightings and total returns into account.) Over the same period, the information technology, health care and consumer staples sectors detracted most from the Fund’s relative performance.
During the reporting period, which individual stocks made the strongest positive contributions to the Fund’s absolute performance and which stocks detracted the most?
The individual stocks that contributed most to the Fund’s absolute performance included Shell and Sabesp. Shares of Shell, an oil and gas conglomerate, benefited from the company’s strong earnings, as sanctions against Russia and supply cuts implemented by The Organization of the Petroleum Exporting Countries (OPEC) pushed up the price of oil. Shares of Sabesp, a
Brazilian water utility, traded higher early in 2022 after the company reported financial results for fiscal year 2021 that showed net operating revenue and earnings rising year-over-year. The company’s sanitation services segment benefited from tariff adjustments and higher total volumes. Toward the end of the reporting period shares gained, along with other Brazilian equities, after the country held the first round of its 2022 presidential election, with former President Luiz Inacio Lula da Silva ahead in the polling.
The holdings that detracted most significantly from absolute performance were Taiwan Semiconductor Manufacturing Company (TSMC) and ASML. Shares of TSMC declined as the fear of a global recession and rising geopolitical tensions with China dragged down Taiwan technology company equities. News that the chipmaker may cut their revenue outlook due to reduced orders added to the stock’s headwinds. Additionally, reports suggested that Apple would back off of increasing production of its new iPhones, which use TSMC's chips, and also rejected TSMC's planned chip price hikes. Shares of semiconductor equipment maker ASML declined amid uncertain demand for semiconductor equipment, supply chain issues, inflation and rising interest rates. Semiconductor equipment makers faced further pressure when the U.S. Department of Commerce considered broader restrictions on the sale of semiconductor manufacturing equipment to Chinese companies.
What were some of the Fund’s largest purchases and sales during the reporting period?
During the reporting period, the Fund initiated positions in Netherlands-based global consumer products company Unilever and Canada-based diversified financial services company Royal Bank of Canada (RBC). We believe the organizational changes Unilever is undergoing are positive and we expect the involvement of activist investor Trian Fund Management to optimize value creation for shareholders over the medium to long term. Unilever’s ability to deliver consistent and balanced (volume, mix and price) organic sales growth is likely to narrow the stock’s valuation gap relative to its peer group. In the case of RBC, we see the company benefiting from broad-based and diversified revenue drivers. Margins are likely to expand as we move forward in a higher interest rate environment, and we believe RBC has a strong culture of cost management relative to Canadian peers.
During the same period, the Fund eliminated its positions in Alibaba, a China-based leader in e-commerce, and Coca-Cola Europacific Partners (CCEP), a Netherlands-based bottling company. We eliminated the Fund’s Alibaba position as we became increasingly concerned about Chinese e-commerce names due to increased competition and market fragmentation, combined with the political risk in the name. Regarding CCEP,
| 1. | See page 5 for other share class returns, which may be higher or lower than Class I share returns. See page 6 for more information on benchmark and peer group returns. |
despite the company’s solid fundamental momentum as it continues to benefit from a recovery in core European markets and synergies from newly acquired Amatil, we decided to eliminate the position as part of a broader shift away from cyclical names and toward more defensive companies in the consumer staples sector.
How did the Fund’s sector and/or country weightings change during the reporting period?
The Fund’s largest increases in sector exposures relative to the MSCI ACWI® ex USA Index (Net) were to industrials, materials and consumer staples, while the most significant reductions were to information technology and consumer discretionary.
How was the Fund positioned at the end of the reporting period?
As of October 31, 2022, the Fund held its largest overweight exposures relative to the MSCI ACWI® ex USA Index (Net) in the health care and information technology sectors. As of the same date, the Fund’s most significantly underweight exposures were to consumer discretionary and materials.
The opinions expressed are those of the portfolio managers as of the date of this report and are subject to change. There is no guarantee that any forecasts will come to pass. This material does not constitute investment advice and is not intended as an endorsement of any specific investment.
| 10 | MainStay WMC International Research Equity Fund |
Portfolio of Investments October 31, 2022†
| | Shares | Value |
| Common Stocks 95.9% |
| Australia 4.1% |
| Australia & New Zealand Banking Group Ltd. (Banks) | 106,168 | $ 1,735,789 |
| BHP Group Ltd. (Metals & Mining) | 66,258 | 1,577,822 |
| Brambles Ltd. (Commercial Services & Supplies) | 30,570 | 228,392 |
| Glencore plc (Metals & Mining) | 202,066 | 1,157,488 |
| Goodman Group (Equity Real Estate Investment Trusts) | 52,857 | 574,769 |
| Newcrest Mining Ltd. (Metals & Mining) | 26,181 | 290,555 |
| Orora Ltd. (Containers & Packaging) | 79,591 | 154,258 |
| Rio Tinto plc (Metals & Mining) | 16,581 | 862,715 |
| | | 6,581,788 |
| Austria 0.7% |
| BAWAG Group AG (Banks) (a)(b) | 15,177 | 733,735 |
| Erste Group Bank AG (Banks) | 14,065 | 346,937 |
| | | 1,080,672 |
| Belgium 0.5% |
| KBC Group NV (Banks) | 4,728 | 236,893 |
| UCB SA (Pharmaceuticals) | 7,773 | 586,265 |
| | | 823,158 |
| Brazil 1.5% |
| Cia de Saneamento Basico do Estado de Sao Paulo (Water Utilities) (b) | 60,000 | 698,093 |
| Petroleo Brasileiro SA (Oil, Gas & Consumable Fuels) | 59,800 | 385,045 |
| Rumo SA (Road & Rail) | 135,300 | 579,913 |
| Vale SA (Metals & Mining) | 63,200 | 821,337 |
| | | 2,484,388 |
| Canada 5.7% |
| Agnico Eagle Mines Ltd. (Metals & Mining) | 7,207 | 317,037 |
| Barrick Gold Corp. (Metals & Mining) | 32,376 | 486,941 |
| Boat Rocker Media, Inc. (Entertainment) (b) | 42,890 | 87,521 |
| Canadian Natural Resources Ltd. (Oil, Gas & Consumable Fuels) | 20,607 | 1,235,951 |
| Canadian Pacific Railway Ltd. (Road & Rail) | 4,858 | 362,152 |
| Constellation Software, Inc. (Software) | 512 | 740,326 |
| Hydro One Ltd. (Electric Utilities) (a) | 14,492 | 363,377 |
| Intact Financial Corp. (Insurance) | 7,324 | 1,112,887 |
| Lightspeed Commerce, Inc. (Software) (b)(c) | 28,805 | 552,046 |
| Methanex Corp. (Chemicals) | 13,305 | 464,383 |
| Nuvei Corp. (IT Services) (b) | 7,709 | 231,810 |
| Royal Bank of Canada (Banks) (c) | 30,319 | 2,805,234 |
| | Shares | Value |
| |
| Canada (continued) |
| Shopify, Inc., Class A (IT Services) (b) | 12,020 | $ 412,122 |
| | | 9,171,787 |
| China 3.6% |
| Airtac International Group (Machinery) | 25,157 | 577,739 |
| Anhui Conch Cement Co. Ltd., Class H (Construction Materials) | 72,500 | 186,569 |
| China Longyuan Power Group Corp. Ltd., Class H (Independent Power and Renewable Electricity Producers) | 654,877 | 748,345 |
| China Merchants Bank Co. Ltd., Class H (Banks) | 123,000 | 404,273 |
| China Pacific Insurance Group Co. Ltd., Class H (Insurance) | 160,559 | 258,951 |
| ENN Energy Holdings Ltd. (Gas Utilities) | 42,300 | 420,594 |
| KE Holdings, Inc., ADR (Real Estate Management & Development) (b) | 41,320 | 420,638 |
| Kingdee International Software Group Co. Ltd. (Software) (b) | 78,000 | 127,588 |
| Meituan (Internet & Direct Marketing Retail) (a)(b) | 20,500 | 325,925 |
| Minth Group Ltd. (Auto Components) | 164,000 | 323,836 |
| Niu Technologies, Sponsored ADR (Automobiles) (b) | 32,015 | 83,879 |
| Ping An Insurance Group Co. of China Ltd., Class H (Insurance) | 93,390 | 373,577 |
| Tencent Holdings Ltd. (Interactive Media & Services) | 50,400 | 1,320,089 |
| Trip.com Group Ltd. (Hotels, Restaurants & Leisure) (b) | 14,300 | 315,525 |
| | | 5,887,528 |
| Denmark 0.8% |
| Ascendis Pharma A/S, ADR (Biotechnology) (b)(c) | 3,152 | 362,480 |
| DSV A/S (Air Freight & Logistics) | 702 | 95,037 |
| Genmab A/S (Biotechnology) (b) | 1,985 | 765,093 |
| | | 1,222,610 |
| Finland 0.3% |
| Nordea Bank Abp (Banks) | 51,943 | 496,695 |
| France 9.8% |
| Airbus SE (Aerospace & Defense) | 11,747 | 1,272,111 |
| ALD SA (Road & Rail) (a) | 33,689 | 359,566 |
| Arkema SA (Chemicals) | 4,985 | 394,705 |
| AXA SA (Insurance) | 69,297 | 1,712,069 |
| Bureau Veritas SA (Professional Services) | 31,228 | 773,687 |
| Capgemini SE (IT Services) | 3,608 | 592,782 |
The notes to the financial statements are an integral part of, and should be read in conjunction with, the financial statements.
11
Portfolio of Investments October 31, 2022† (continued)
| | Shares | Value |
| Common Stocks (continued) |
| France (continued) |
| Dassault Aviation SA (Aerospace & Defense) | 1,426 | $ 211,950 |
| Edenred (IT Services) | 9,047 | 464,559 |
| Engie SA (Multi-Utilities) | 48,004 | 624,025 |
| JCDecaux SE (Media) (b) | 42,942 | 541,926 |
| Klepierre SA (Equity Real Estate Investment Trusts) (b) | 15,540 | 312,523 |
| LVMH Moet Hennessy Louis Vuitton SE (Textiles, Apparel & Luxury Goods) | 2,832 | 1,788,385 |
| Pernod Ricard SA (Beverages) | 15,737 | 2,763,606 |
| Renault SA (Automobiles) (b) | 19,632 | 604,739 |
| Rothschild & Co. (Capital Markets) | 8,740 | 310,079 |
| Safran SA (Aerospace & Defense) | 6,134 | 683,300 |
| SOITEC (Semiconductors & Semiconductor Equipment) (b) | 5,199 | 667,672 |
| TotalEnergies SE (Oil, Gas & Consumable Fuels) | 14,295 | 778,400 |
| Vinci SA (Construction & Engineering) | 7,771 | 715,594 |
| Worldline SA (IT Services) (a)(b) | 5,088 | 222,851 |
| | | 15,794,529 |
| Germany 2.1% |
| Brenntag SE (Trading Companies & Distributors) | 10,795 | 655,452 |
| Commerzbank AG (Banks) (b) | 36,105 | 288,872 |
| Daimler Truck Holding AG (Machinery) (b) | 2,356 | 62,865 |
| RWE AG (Independent Power and Renewable Electricity Producers) | 14,762 | 568,807 |
| Siemens AG (Registered) (Industrial Conglomerates) | 9,828 | 1,074,593 |
| Siemens Healthineers AG (Health Care Equipment & Supplies) (a) | 6,324 | 291,111 |
| Talanx AG (Insurance) | 11,320 | 425,329 |
| | | 3,367,029 |
| Hong Kong 2.6% |
| AIA Group Ltd. (Insurance) | 235,708 | 1,785,155 |
| CK Asset Holdings Ltd. (Real Estate Management & Development) | 244,500 | 1,351,818 |
| Hong Kong Exchanges & Clearing Ltd. (Capital Markets) | 5,807 | 154,614 |
| Prudential plc (Insurance) | 47,739 | 443,889 |
| Techtronic Industries Co. Ltd. (Machinery) | 56,000 | 530,419 |
| | | 4,265,895 |
| India 1.9% |
| Axis Bank Ltd. (Banks) | 113,633 | 1,243,713 |
| | Shares | Value |
| |
| India (continued) |
| Bharti Airtel Ltd. (Wireless Telecommunication Services) | 101,178 | $ 994,762 |
| Kotak Mahindra Bank Ltd. (Banks) | 37,748 | 867,323 |
| | | 3,105,798 |
| Indonesia 0.7% |
| Bank Rakyat Indonesia Persero Tbk. PT (Banks) | 3,622,200 | 1,079,867 |
| Ireland 1.6% |
| AerCap Holdings NV (Trading Companies & Distributors) (b) | 13,581 | 725,361 |
| AIB Group plc (Banks) | 278,752 | 807,147 |
| Ryanair Holdings plc, Sponsored ADR (Airlines) (b) | 6,897 | 475,134 |
| Smurfit Kappa Group plc (Containers & Packaging) | 15,234 | 504,794 |
| | | 2,512,436 |
| Israel 0.0% ‡ |
| Mobileye Global, Inc., Class A (Electronic Equipment, Instruments & Components) (b) | 2,100 | 55,398 |
| Italy 2.6% |
| Amplifon SpA (Health Care Providers & Services) | 10,183 | 252,993 |
| DiaSorin SpA (Health Care Equipment & Supplies) | 3,153 | 412,240 |
| Enel SpA (Electric Utilities) | 93,304 | 416,687 |
| Ferrari NV (Automobiles) | 3,787 | 746,629 |
| FinecoBank Banca Fineco SpA (Banks) | 102,606 | 1,383,101 |
| Stevanato Group SpA (Life Sciences Tools & Services) | 26,561 | 447,287 |
| UniCredit SpA (Banks) | 46,974 | 582,504 |
| | | 4,241,441 |
| Japan 14.6% |
| Asahi Intecc Co. Ltd. (Health Care Equipment & Supplies) | 17,900 | 305,045 |
| Astellas Pharma, Inc. (Pharmaceuticals) | 59,400 | 817,526 |
| Chugai Pharmaceutical Co. Ltd. (Pharmaceuticals) | 28,200 | 654,292 |
| Daiichi Sankyo Co. Ltd. (Pharmaceuticals) | 36,300 | 1,163,738 |
| Daikin Industries Ltd. (Building Products) | 5,900 | 888,204 |
| GMO Payment Gateway, Inc. (IT Services) | 2,650 | 191,227 |
| Hoya Corp. (Health Care Equipment & Supplies) | 8,350 | 779,154 |
The notes to the financial statements are an integral part of, and should be read in conjunction with, the financial statements.
| 12 | MainStay WMC International Research Equity Fund |
| | Shares | Value |
| Common Stocks (continued) |
| Japan (continued) |
| Ibiden Co. Ltd. (Electronic Equipment, Instruments & Components) | 17,900 | $ 605,515 |
| Isuzu Motors Ltd. (Automobiles) | 69,270 | 812,447 |
| ITOCHU Corp. (Trading Companies & Distributors) | 17,500 | 452,991 |
| KDDI Corp. (Wireless Telecommunication Services) | 31,086 | 918,813 |
| Keyence Corp. (Electronic Equipment, Instruments & Components) | 2,825 | 1,070,002 |
| Koito Manufacturing Co. Ltd. (Auto Components) | 2,800 | 39,808 |
| Lasertec Corp. (Semiconductors & Semiconductor Equipment) | 4,870 | 697,282 |
| Makita Corp. (Machinery) | 18,100 | 331,094 |
| Mitsubishi Corp. (Trading Companies & Distributors) | 18,900 | 512,364 |
| Mitsubishi Electric Corp. (Electrical Equipment) | 33,800 | 297,777 |
| Mitsubishi UFJ Financial Group, Inc. (Banks) | 114,800 | 540,049 |
| Mitsui & Co. Ltd. (Trading Companies & Distributors) | 22,300 | 493,856 |
| Musashi Seimitsu Industry Co. Ltd. (Auto Components) | 21,800 | 251,727 |
| NET One Systems Co. Ltd. (IT Services) | 6,600 | 135,822 |
| Nikon Corp. (Household Durables) | 73,500 | 711,298 |
| Nippon Telegraph & Telephone Corp. (Diversified Telecommunication Services) | 41,220 | 1,134,905 |
| Nomura Real Estate Holdings, Inc. (Real Estate Management & Development) | 40,420 | 914,713 |
| Ono Pharmaceutical Co. Ltd. (Pharmaceuticals) | 22,800 | 536,056 |
| Oriental Land Co. Ltd. (Hotels, Restaurants & Leisure) | 4,300 | 576,919 |
| Orix JREIT, Inc. (Equity Real Estate Investment Trusts) | 504 | 676,203 |
| Resona Holdings, Inc. (Banks) | 196,120 | 738,212 |
| Seino Holdings Co. Ltd. (Road & Rail) | 7,300 | 56,163 |
| Shinko Electric Industries Co. Ltd. (Semiconductors & Semiconductor Equipment) | 17,900 | 431,565 |
| Sony Group Corp. (Household Durables) | 16,727 | 1,123,570 |
| Square Enix Holdings Co. Ltd. (Entertainment) | 2,500 | 111,638 |
| Subaru Corp. (Automobiles) | 46,090 | 717,720 |
| T&D Holdings, Inc. (Insurance) | 57,300 | 565,312 |
| | Shares | Value |
| |
| Japan (continued) |
| Tokio Marine Holdings, Inc. (Insurance) | 44,850 | $ 811,671 |
| Tokyo Electron Ltd. (Semiconductors & Semiconductor Equipment) | 4,660 | 1,237,590 |
| Yamaha Motor Co. Ltd. (Automobiles) | 38,530 | 795,502 |
| Yamato Holdings Co. Ltd. (Air Freight & Logistics) | 33,600 | 498,029 |
| | | 23,595,799 |
| Luxembourg 0.2% |
| ArcelorMittal SA (Metals & Mining) | 10,537 | 235,911 |
| Arrival SA (Automobiles) (b)(c) | 120,747 | 93,410 |
| | | 329,321 |
| Macao 0.2% |
| Sands China Ltd. (Hotels, Restaurants & Leisure) (b) | 194,000 | 338,588 |
| Netherlands 7.3% |
| Adyen NV (IT Services) (a)(b) | 263 | 377,545 |
| Akzo Nobel NV (Chemicals) | 5,316 | 328,031 |
| Argenx SE (Biotechnology) (b) | 1,320 | 515,013 |
| ASML Holding NV (Semiconductors & Semiconductor Equipment) | 5,056 | 2,388,371 |
| ASR Nederland NV (Insurance) | 8,737 | 385,005 |
| IMCD NV (Trading Companies & Distributors) | 2,765 | 358,779 |
| Koninklijke Ahold Delhaize NV (Food & Staples Retailing) | 44,686 | 1,247,546 |
| Koninklijke DSM NV (Chemicals) | 1,346 | 158,691 |
| Koninklijke KPN NV (Diversified Telecommunication Services) | 333,766 | 933,789 |
| Koninklijke Philips NV (Health Care Equipment & Supplies) | 22,602 | 286,308 |
| Shell plc (Oil, Gas & Consumable Fuels) | 153,327 | 4,227,083 |
| Wolters Kluwer NV (Professional Services) | 6,272 | 666,628 |
| | | 11,872,789 |
| Norway 0.1% |
| Norsk Hydro ASA (Metals & Mining) | 17,786 | 112,880 |
| Philippines 0.5% |
| BDO Unibank, Inc. (Banks) | 394,400 | 871,707 |
| Portugal 0.2% |
| EDP - Energias de Portugal SA (Electric Utilities) | 85,223 | 372,681 |
The notes to the financial statements are an integral part of, and should be read in conjunction with, the financial statements.
13
Portfolio of Investments October 31, 2022† (continued)
| | Shares | Value |
| Common Stocks (continued) |
| Republic of Korea 1.1% |
| LG Chem Ltd. (Chemicals) | 1,006 | $ 442,105 |
| NCSoft Corp. (Entertainment) | 1,579 | 432,314 |
| Samsung SDI Co. Ltd. (Electronic Equipment, Instruments & Components) | 1,173 | 606,901 |
| SK Telecom Co. Ltd. (Wireless Telecommunication Services) | 10,508 | 369,582 |
| | | 1,850,902 |
| Russia 0.0% ‡ |
| LUKOIL PJSC, Sponsored ADR (Oil, Gas & Consumable Fuels) (d)(e) | 11,171 | 27,760 |
| Mobile TeleSystems PJSC (Wireless Telecommunication Services) (d)(e) | 80,528 | — |
| | | 27,760 |
| Singapore 1.3% |
| Best World International Ltd. (Personal Products) (b)(c)(d)(e) | 151,379 | 145,433 |
| Capitaland Investment Ltd. (Real Estate Management & Development) | 292,500 | 621,945 |
| SATS Ltd. (Transportation Infrastructure) (b) | 39,100 | 75,405 |
| Singapore Telecommunications Ltd. (Diversified Telecommunication Services) | 319,100 | 563,542 |
| United Overseas Bank Ltd. (Banks) | 36,500 | 715,767 |
| | | 2,122,092 |
| South Africa 0.7% |
| Anglo American plc (Metals & Mining) | 25,472 | 761,977 |
| Discovery Ltd. (Insurance) (b) | 38,995 | 255,215 |
| Old Mutual Ltd. (Insurance) | 321,661 | 182,818 |
| | | 1,200,010 |
| Spain 1.4% |
| Banco Santander SA (Banks) (c) | 202,265 | 524,108 |
| Cellnex Telecom SA (Diversified Telecommunication Services) | 23,581 | 771,360 |
| Grifols SA (Biotechnology) (b) | 28,142 | 239,344 |
| Iberdrola SA (Electric Utilities) | 67,565 | 686,073 |
| | | 2,220,885 |
| Sweden 1.3% |
| Alfa Laval AB (Machinery) | 15,029 | 370,375 |
| Assa Abloy AB, Class B (Building Products) | 27,941 | 564,327 |
| Volvo AB, Class B (Machinery) | 73,901 | 1,210,131 |
| | | 2,144,833 |
| | Shares | Value |
| |
| Switzerland 3.6% |
| Alcon, Inc. (Health Care Equipment & Supplies) | 12,908 | $ 785,553 |
| Cie Financiere Richemont SA (Registered) (Textiles, Apparel & Luxury Goods) | 10,369 | 1,014,171 |
| Lonza Group AG (Registered) (Life Sciences Tools & Services) | 1,234 | 635,146 |
| Novartis AG (Registered) (Pharmaceuticals) | 28,040 | 2,265,378 |
| PSP Swiss Property AG (Registered) (Real Estate Management & Development) | 2,956 | 315,865 |
| Tecan Group AG (Registered) (Life Sciences Tools & Services) | 1,719 | 630,709 |
| Wizz Air Holdings plc (Airlines) (a)(b) | 9,083 | 178,641 |
| | | 5,825,463 |
| Taiwan 3.3% |
| ASPEED Technology, Inc. (Semiconductors & Semiconductor Equipment) | 14,020 | 730,968 |
| Chroma ATE, Inc. (Electronic Equipment, Instruments & Components) | 136,000 | 744,945 |
| E Ink Holdings, Inc. (Electronic Equipment, Instruments & Components) | 75,700 | 482,779 |
| MediaTek, Inc. (Semiconductors & Semiconductor Equipment) | 21,000 | 384,514 |
| Taiwan Semiconductor Manufacturing Co. Ltd., Sponsored ADR (Semiconductors & Semiconductor Equipment) | 48,628 | 2,993,053 |
| | | 5,336,259 |
| Thailand 0.7% |
| Kasikornbank PCL | | |
| (Banks) | 37,900 | 145,884 |
| NVDR (Banks) (c) | 261,620 | 1,003,587 |
| |
| PTT Global Chemical PCL (Chemicals) | 45,700 | 52,232 |
| | | 1,201,703 |
| United Arab Emirates 0.4% |
| Network International Holdings plc (IT Services) (a)(b) | 166,010 | 618,736 |
| United Kingdom 18.1% |
| Abcam plc (Biotechnology) (b) | 31,633 | 487,559 |
| Allfunds Group plc (Capital Markets) | 59,787 | 377,255 |
| AstraZeneca plc (Pharmaceuticals) | 20,249 | 2,381,138 |
| BAE Systems plc (Aerospace & Defense) | 66,735 | 623,274 |
| Beazley plc (Insurance) | 137,472 | 984,542 |
| BP plc (Oil, Gas & Consumable Fuels) | 627,432 | 3,452,348 |
| British American Tobacco plc (Tobacco) | 85,174 | 3,353,758 |
| BT Group plc (Diversified Telecommunication Services) | 582,688 | 867,358 |
The notes to the financial statements are an integral part of, and should be read in conjunction with, the financial statements.
| 14 | MainStay WMC International Research Equity Fund |
| | Shares | Value |
| Common Stocks (continued) |
| United Kingdom (continued) |
| CNH Industrial NV (Machinery) | 23,300 | $ 301,759 |
| Compass Group plc (Hotels, Restaurants & Leisure) | 49,854 | 1,049,974 |
| ConvaTec Group plc (Health Care Equipment & Supplies) (a) | 181,382 | 453,459 |
| Croda International plc (Chemicals) | 6,607 | 512,199 |
| Diageo plc (Beverages) | 79,490 | 3,279,906 |
| Experian plc (Professional Services) | 12,324 | 392,054 |
| Genus plc (Biotechnology) | 5,529 | 161,940 |
| HSBC Holdings plc (Banks) | 142,462 | 730,778 |
| Hyve Group plc (Media) (b) | 102,687 | 63,002 |
| Intermediate Capital Group plc (Capital Markets) | 6,235 | 75,936 |
| London Stock Exchange Group plc (Capital Markets) | 13,283 | 1,152,525 |
| National Express Group plc (Road & Rail) (b) | 29,908 | 58,033 |
| National Grid plc (Multi-Utilities) | 41,814 | 454,780 |
| Reckitt Benckiser Group plc (Household Products) | 30,631 | 2,030,377 |
| Rotork plc (Machinery) | 87,474 | 257,008 |
| Smith & Nephew plc (Health Care Equipment & Supplies) | 32,669 | 385,888 |
| Standard Chartered plc (Banks) | 192,258 | 1,146,945 |
| Unilever plc (Personal Products) | 81,031 | 3,693,358 |
| WPP plc (Media) | 75,583 | 663,958 |
| | | 29,391,111 |
| United States 2.4% |
| Atlassian Corp., Class A (Software) (b) | 2,279 | 462,022 |
| GSK plc (Pharmaceuticals) | 61,753 | 1,011,852 |
| QIAGEN NV (Life Sciences Tools & Services) (b) | 8,622 | 372,354 |
| Roche Holding AG (Pharmaceuticals) | 2,347 | 779,443 |
| Schneider Electric SE (Electrical Equipment) | 9,233 | 1,170,310 |
| | | 3,795,981 |
Total Common Stocks
(Cost $185,721,946) | | 155,400,519 |
| Preferred Stocks 2.1% |
| Brazil 0.7% |
| Banco Bradesco SA (Banks) | 288,500 | 1,109,207 |
| | Shares | Value |
| |
| Germany 0.3% |
| Volkswagen AG (Automobiles) 2.91% | 3,902 | $ 498,755 |
| Republic of Korea 1.1% |
| Samsung Electronics Co. Ltd. (Technology Hardware, Storage & Peripherals) 1.88% | 48,696 | 1,822,104 |
Total Preferred Stocks
(Cost $5,027,358) | | 3,430,066 |
| Exchange-Traded Fund 0.4% |
| United States 0.4% |
| iShares MSCI ACWI ex U.S. ETF (c) | 15,944 | 660,400 |
Total Exchange-Traded Fund
(Cost $877,397) | | 660,400 |
| |
| Short-Term Investments 1.9% |
| Affiliated Investment Company 0.3% |
| United States 0.3% |
| MainStay U.S. Government Liquidity Fund, 2.905% (f) | 556,987 | 556,987 |
| Unaffiliated Investment Company 1.6% |
| United States 1.6% |
| Invesco Government & Agency Portfolio, 3.163% (f)(g) | 2,526,546 | 2,526,546 |
Total Short-Term Investments
(Cost $3,083,533) | | 3,083,533 |
Total Investments, Before Investments Sold Short
(Cost $194,710,234) | 100.3% | 162,574,518 |
| Investments Sold Short (0.0)% ‡ |
| Common Stock Sold Short (0.0)% ‡ |
| Australia (0.0)% ‡ |
| Virgin Australia Airlines Holdings Pty. Ltd. (Airlines) (b)(d)(e) | (444,108) | (28) |
Total Common Stock Sold Short
(Proceeds $0) | | (28) |
| |
The notes to the financial statements are an integral part of, and should be read in conjunction with, the financial statements.
15
Portfolio of Investments October 31, 2022† (continued)
| | Number of
Rights | | Value |
| Right Sold Short (0.0)% ‡ |
| United States (0.0)% ‡ |
Intercell (Biotechnology)
Expires 12/31/49 (b)(d)(e) | (19,159) | | $ (2) |
Total Right Sold Short
(Proceeds $0) | | | (2) |
| |
| | Number of
Warrants | | |
| Warrants Sold Short (0.0)% ‡ |
| Singapore (0.0)% ‡ |
| Ezion Holdings Ltd. (Energy Equipment & Services) | | | |
| Expires 4/16/23 (b)(d)(e) | (2,005,620) | | — |
Total Warrants Sold Short
(Proceeds $0) | | | — |
Total Investments Sold Short
(Proceeds $0) | | | (30) |
Total Investments, Net of Investments Sold Short
(Cost $194,710,234) | 100.3% | | 162,574,488 |
| Other Assets, Less Liabilities | (0.3) | | (562,109) |
| Net Assets | 100.0% | | $ 162,012,379 |
| † | Percentages indicated are based on Fund net assets. |
| ‡ | Less than one-tenth of a percent. |
| (a) | May be sold to institutional investors only under Rule 144A or securities offered pursuant to Section 4(a)(2) of the Securities Act of 1933, as amended. |
| (b) | Non-income producing security. |
| (c) | All or a portion of this security was held on loan. As of October 31, 2022, the aggregate market value of securities on loan was $5,743,904; the total market value of collateral held by the Fund was $5,898,397. The market value of the collateral held included non-cash collateral in the form of U.S. Treasury securities with a value of $3,371,851. The Fund received cash collateral with a value of $2,526,546. (See Note 2(J)) |
| (d) | Illiquid security—As of October 31, 2022, the total market value deemed illiquid under procedures approved by the Board of Trustees was $173,163, which represented 0.1% of the Fund’s net assets.(Unaudited) |
| (e) | Security in which significant unobservable inputs (Level 3) were used in determining fair value. |
| (f) | Current yield as of October 31, 2022. |
| (g) | Represents a security purchased with cash collateral received for securities on loan. |
The notes to the financial statements are an integral part of, and should be read in conjunction with, the financial statements.
| 16 | MainStay WMC International Research Equity Fund |
Investments in Affiliates (in 000's)
Investments in issuers considered to be affiliate(s) of the Fund during the year ended October 31, 2022 for purposes of Section 2(a)(3) of the Investment Company Act of 1940, as amended, were as follows:
| Affiliated Investment Companies | Value,
Beginning
of Year | Purchases
at Cost | Proceeds
from
Sales | Net
Realized
Gain/(Loss)
on Sales | Change in
Unrealized
Appreciation/
(Depreciation) | Value,
End of
Year | Dividend
Income | Other
Distributions | Shares
End of
Year |
| MainStay U.S. Government Liquidity Fund | $ 2,105 | $ 37,304 | $ (38,852) | $ — | $ — | $ 557 | $ 6 | $ — | 557 |
| Abbreviation(s): |
| ADR—American Depositary Receipt |
| ETF—Exchange-Traded Fund |
| MSCI—Morgan Stanley Capital International |
| NVDR—Non-Voting Depositary Receipt |
| PCL—Provision for Credit Losses |
The following is a summary of the fair valuations according to the inputs used as of October 31, 2022, for valuing the Fund’s assets and liabilities:
| Description | Quoted
Prices in
Active
Markets for
Identical
Assets
(Level 1) | | Significant
Other
Observable
Inputs
(Level 2) | | Significant
Unobservable
Inputs
(Level 3) | | Total |
| Asset Valuation Inputs | | | | | | | |
| Investments in Securities (a) | | | | | | | |
| Common Stocks | | | | | | | |
| Philippines | $ — | | $ 871,707 | | $ — | | $ 871,707 |
| All Other Countries | 154,355,619 | | — | | 173,193 | | 154,528,812 |
| Total Common Stocks | 154,355,619 | | 871,707 | | 173,193 | | 155,400,519 |
| Preferred Stocks | 3,430,066 | | — | | — | | 3,430,066 |
| Exchange-Traded Fund | 660,400 | | — | | — | | 660,400 |
| Short-Term Investments | | | | | | | |
| Affiliated Investment Company | 556,987 | | — | | — | | 556,987 |
| Unaffiliated Investment Company | 2,526,546 | | — | | — | | 2,526,546 |
| Total Short-Term Investments | 3,083,533 | | — | | — | | 3,083,533 |
| Total Investments in Securities | $ 161,529,618 | | $ 871,707 | | $ 173,193 | | $ 162,574,518 |
| Liability Valuation Inputs | | | | | | | |
| Common Stock Sold Short | $ — | | $ — | | $ (28) | | $ (28) |
| Right Sold Short | — | | — | | (2) | | (2) |
| Warrants Sold Short | — | | — | | — | | — |
| Total Investments in Securities Sold Short | $ — | | $ — | | $ (30) | | $ (30) |
| (a) | For a complete listing of investments and their industries, see the Portfolio of Investments. |
The notes to the financial statements are an integral part of, and should be read in conjunction with, the financial statements.
17
Portfolio of Investments October 31, 2022† (continued)
The table below sets forth the diversification of the Fund’s investments by industry.
Industry Diversification
| | Value | Percent |
| Aerospace & Defense | $ 2,790,635 | 1.7% |
| Air Freight & Logistics | 593,066 | 0.4 |
| Airlines | 653,775 | 0.4 |
| Auto Components | 615,371 | 0.4 |
| Automobiles | 4,353,081 | 2.7 |
| Banks | 20,538,327 | 12.6 |
| Beverages | 6,043,512 | 3.7 |
| Biotechnology | 2,531,429 | 1.6 |
| Building Products | 1,452,531 | 0.9 |
| Capital Markets | 2,070,409 | 1.2 |
| Chemicals | 2,352,346 | 1.5 |
| Commercial Services & Supplies | 228,392 | 0.1 |
| Construction & Engineering | 715,594 | 0.4 |
| Construction Materials | 186,569 | 0.1 |
| Containers & Packaging | 659,052 | 0.4 |
| Diversified Telecommunication Services | 4,270,954 | 2.7 |
| Electric Utilities | 1,838,818 | 1.1 |
| Electrical Equipment | 1,468,087 | 0.9 |
| Electronic Equipment, Instruments & Components | 3,565,540 | 2.3 |
| Entertainment | 631,473 | 0.4 |
| Equity Real Estate Investment Trusts | 1,563,495 | 1.0 |
| Exchange-Traded Fund | 660,400 | 0.4 |
| Food & Staples Retailing | 1,247,546 | 0.8 |
| Gas Utilities | 420,594 | 0.3 |
| Health Care Equipment & Supplies | 3,698,758 | 2.3 |
| Health Care Providers & Services | 252,993 | 0.1 |
| Hotels, Restaurants & Leisure | 2,281,006 | 1.5 |
| Household Durables | 1,834,868 | 1.1 |
| Household Products | 2,030,377 | 1.3 |
| Independent Power and Renewable Electricity Producers | 1,317,152 | 0.8 |
| Industrial Conglomerates | 1,074,593 | 0.7 |
| Insurance | 9,296,420 | 5.7 |
| Interactive Media & Services | 1,320,089 | 0.8 |
| Internet & Direct Marketing Retail | 325,925 | 0.2 |
| IT Services | 3,247,454 | 2.0 |
| Life Sciences Tools & Services | 2,085,496 | 1.4 |
| Machinery | 3,641,390 | 2.1 |
| Media | 1,268,886 | 0.7 |
| Metals & Mining | 6,624,663 | 4.1 |
| Multi-Utilities | 1,078,805 | 0.7 |
| Oil, Gas & Consumable Fuels | 10,106,587 | 6.2 |
| Personal Products | 3,838,791 | 2.4 |
| Pharmaceuticals | 10,195,688 | 6.3 |
| | Value | | Percent |
| Professional Services | $ 1,832,369 | | 1.1% |
| Real Estate Management & Development | 3,624,979 | | 2.3 |
| Road & Rail | 1,415,827 | | 0.8 |
| Semiconductors & Semiconductor Equipment | 9,531,015 | | 5.9 |
| Software | 1,881,982 | | 1.2 |
| Technology Hardware, Storage & Peripherals | 1,822,104 | | 1.1 |
| Textiles, Apparel & Luxury Goods | 2,802,556 | | 1.7 |
| Tobacco | 3,353,758 | | 2.1 |
| Trading Companies & Distributors | 3,198,803 | | 2.0 |
| Transportation Infrastructure | 75,405 | | 0.0‡ |
| Water Utilities | 698,093 | | 0.4 |
| Wireless Telecommunication Services | 2,283,157 | | 1.4 |
| | 159,490,985 | | 98.4 |
| Short-Term Investments | 3,083,533 | | 1.9 |
| Other Assets, Less Liabilities* | (562,139) | | (0.3) |
| Net Assets | $162,012,379 | | 100.0% |
| * | Includes Investments sold short (details are shown below). |
The table below sets forth the diversification of MainStay WMC International Research Equity Fund investments sold short by industry.
| | Value | | Percent |
| Airlines | $(28) | | (0.0)%‡ |
| Biotechnology | (2) | | (0.0)‡ |
| Energy Equipment & Services | — | | (0.0)‡ |
| | $(30) | | (0.0)%‡ |
| † | Percentages indicated are based on Fund net assets. |
| ‡ | Less than one-tenth of a percent. |
The notes to the financial statements are an integral part of, and should be read in conjunction with, the financial statements.
| 18 | MainStay WMC International Research Equity Fund |
Statement of Assets and Liabilities as of October 31, 2022
| Assets |
Investment in unaffiliated securities before investments sold short, at value
(identified cost $194,153,247) including securities on loan of $5,743,904 | $ 162,017,531 |
Investment in affiliated investment companies, at value
(identified cost $556,987) | 556,987 |
| Cash | 18,239 |
| Cash collateral on deposit for short positions | 178,983 |
| Due from custodian | 56,705 |
| Receivables: | |
| Investment securities sold | 5,096,664 |
| Dividends | 1,236,447 |
| Fund shares sold | 43,788 |
| Securities lending | 4,915 |
| Other assets | 21,762 |
| Total assets | 169,232,021 |
| Liabilities |
| Investments sold short (proceeds $0) | 30 |
| Cash collateral received for securities on loan | 2,526,546 |
| Foreign currency due to custodian, at value | 8,741 |
| Payables: | |
| Investment securities purchased | 4,391,133 |
| Fund shares redeemed | 128,977 |
| Manager (See Note 3) | 79,415 |
| Custodian | 22,334 |
| Shareholder communication | 20,635 |
| Transfer agent (See Note 3) | 15,632 |
| Professional fees | 10,321 |
| NYLIFE Distributors (See Note 3) | 4,650 |
| Trustees | 43 |
| Accrued expenses | 11,185 |
| Total liabilities | 7,219,642 |
| Net assets | $ 162,012,379 |
| Composition of Net Assets |
| Shares of beneficial interest outstanding (par value of $.001 per share) unlimited number of shares authorized | $ 27,264 |
| Additional paid-in-capital | 294,995,043 |
| | 295,022,307 |
| Total distributable earnings (loss) | (133,009,928) |
| Net assets | $ 162,012,379 |
| Class A | |
| Net assets applicable to outstanding shares | $ 10,371,094 |
| Shares of beneficial interest outstanding | 1,757,054 |
| Net asset value per share outstanding | $ 5.90 |
| Maximum sales charge (5.50% of offering price) | 0.34 |
| Maximum offering price per share outstanding | $ 6.24 |
| Investor Class | |
| Net assets applicable to outstanding shares | $ 1,623,824 |
| Shares of beneficial interest outstanding | 276,770 |
| Net asset value per share outstanding | $ 5.87 |
| Maximum sales charge (5.00% of offering price) | 0.31 |
| Maximum offering price per share outstanding | $ 6.18 |
| Class C | |
| Net assets applicable to outstanding shares | $ 2,458,291 |
| Shares of beneficial interest outstanding | 431,263 |
| Net asset value and offering price per share outstanding | $ 5.70 |
| Class I | |
| Net assets applicable to outstanding shares | $147,559,170 |
| Shares of beneficial interest outstanding | 24,799,105 |
| Net asset value and offering price per share outstanding | $ 5.95 |
The notes to the financial statements are an integral part of, and should be read in conjunction with, the financial statements.
19
Statement of Operations for the year ended October 31, 2022
| Investment Income (Loss) |
| Income | |
| Dividends-unaffiliated (net of foreign tax withholding of $519,915) | $ 5,387,016 |
| Securities lending, net | 63,054 |
| Dividends-affiliated | 5,913 |
| Total income | 5,455,983 |
| Expenses | |
| Manager (See Note 3) | 1,455,087 |
| Professional fees | 97,096 |
| Custodian | 90,678 |
| Transfer agent (See Note 3) | 87,772 |
| Distribution/Service—Class A (See Note 3) | 32,394 |
| Distribution/Service—Investor Class (See Note 3) | 5,090 |
| Distribution/Service—Class C (See Note 3) | 38,654 |
| Registration | 62,203 |
| Shareholder communication | 9,194 |
| Broker fees and charges on short sales | 6,474 |
| Trustees | 3,566 |
| Miscellaneous | 21,630 |
| Total expenses before waiver/reimbursement | 1,909,838 |
| Expense waiver/reimbursement from Manager (See Note 3) | (133,655) |
| Net expenses | 1,776,183 |
| Net investment income (loss) | 3,679,800 |
| Realized and Unrealized Gain (Loss) |
| Net realized gain (loss) on: | |
| Unaffiliated investment transactions | (12,266,688) |
| Foreign currency transactions | (159,005) |
| Net realized gain (loss) | (12,425,693) |
| Net change in unrealized appreciation (depreciation) on: | |
| Unaffiliated investments | (47,772,478) |
| Investments sold short | 6 |
| Translation of other assets and liabilities in foreign currencies | (129,308) |
| Net change in unrealized appreciation (depreciation) | (47,901,780) |
| Net realized and unrealized gain (loss) | (60,327,473) |
| Net increase (decrease) in net assets resulting from operations | $(56,647,673) |
The notes to the financial statements are an integral part of, and should be read in conjunction with, the financial statements.
| 20 | MainStay WMC International Research Equity Fund |
Statements of Changes in Net Assets
for the years ended October 31, 2022 and October 31, 2021
| | 2022 | 2021 |
| Increase (Decrease) in Net Assets |
| Operations: | | |
| Net investment income (loss) | $ 3,679,800 | $ 2,955,405 |
| Net realized gain (loss) | (12,425,693) | 53,813,718 |
| Net change in unrealized appreciation (depreciation) | (47,901,780) | 11,255,870 |
| Net increase (decrease) in net assets resulting from operations | (56,647,673) | 68,024,993 |
| Distributions to shareholders: | | |
| Class A | (367,003) | (251,503) |
| Investor Class | (50,882) | (51,029) |
| Class C | (64,267) | (47,871) |
| Class I | (5,440,803) | (5,460,954) |
| Total distributions to shareholders | (5,922,955) | (5,811,357) |
| Capital share transactions: | | |
| Net proceeds from sales of shares | 16,096,804 | 13,488,394 |
| Net asset value of shares issued to shareholders in reinvestment of distributions | 5,906,186 | 5,762,226 |
| Cost of shares redeemed | (28,091,409) | (102,225,447) |
| Increase (decrease) in net assets derived from capital share transactions | (6,088,419) | (82,974,827) |
| Net increase (decrease) in net assets | (68,659,047) | (20,761,191) |
| Net Assets |
| Beginning of year | 230,671,426 | 251,432,617 |
| End of year | $162,012,379 | $ 230,671,426 |
The notes to the financial statements are an integral part of, and should be read in conjunction with, the financial statements.
21
Financial Highlights selected per share data and ratios
| | Year Ended October 31, |
| Class A | 2022 | | 2021 | | 2020 | | 2019 | | 2018 |
| Net asset value at beginning of year | $ 8.16 | | $ 6.40 | | $ 7.77 | | $ 7.93 | | $ 9.58 |
| Net investment income (loss) | 0.12(a) | | 0.09(a) | | 0.06(a) | | 0.15(a) | | 0.13 |
| Net realized and unrealized gain (loss) | (2.18) | | 1.81 | | (0.70) | | 0.10 | | (1.63) |
| Total from investment operations | (2.06) | | 1.90 | | (0.64) | | 0.25 | | (1.50) |
| Less distributions: | | | | | | | | | |
| From net investment income | (0.20) | | (0.14) | | (0.73) | | (0.41) | | (0.15) |
| Net asset value at end of year | $ 5.90 | | $ 8.16 | | $ 6.40 | | $ 7.77 | | $ 7.93 |
| Total investment return (b) | (25.89)% | | 29.93% | | (9.21)% | | 3.83% | | (15.94)%(c) |
| Ratios (to average net assets)/Supplemental Data: | | | | | | | | | |
| Net investment income (loss) | 1.67% | | 1.09% | | 0.89% | | 2.04% | | 1.37% |
| Net expenses (d)(e) | 1.15% | | 1.31% | | 1.63% | | 1.75% | | 1.78% |
| Expenses (before waiver/reimbursement) (d)(e) | 1.19% | | 1.31% | | 1.63% | | 1.75% | | 1.78% |
| Portfolio turnover rate | 65% | | 117% | | 136% | | 182% | | 223% |
| Net assets at end of year (in 000’s) | $ 10,371 | | $ 15,492 | | $ 12,373 | | $ 19,557 | | $ 31,870 |
| (a) | Per share data based on average shares outstanding during the year. |
| (b) | Total investment return is calculated exclusive of sales charges and assumes the reinvestment of dividends and distributions. For periods of less than one year, total return is not annualized. |
| (c) | Total investment return may reflect adjustments to conform to generally accepted accounting principles. |
| (d) | In addition to the fees and expenses which the Fund bears directly, it also indirectly bears a pro-rata share of the fees and expenses of the underlying funds in which it invests. Such indirect expenses are not included in the above expense ratios. |
| (e) | The expense ratios presented below show the impact of short sales expense: |
| Year Ended | | Net Expenses
(excluding short
sale expenses) | | Short Sales
Expenses |
| October 31, 2022 | | 1.15% | | 0.00%(f) |
| October 31, 2021 | | 1.30% | | 0.01% |
| October 31, 2020 | | 1.60% | | 0.03% |
| October 31, 2019 | | 1.64% | | 0.11% |
| October 31, 2018 | | 1.65% | | 0.13% |
The notes to the financial statements are an integral part of, and should be read in conjunction with, the financial statements.
| 22 | MainStay WMC International Research Equity Fund |
Financial Highlights selected per share data and ratios
| | Year Ended October 31, |
| Investor Class | 2022 | | 2021 | | 2020 | | 2019 | | 2018 |
| Net asset value at beginning of year | $ 8.11 | | $ 6.36 | | $ 7.73 | | $ 7.90 | | $ 9.54 |
| Net investment income (loss) | 0.09(a) | | 0.05(a) | | 0.04(a) | | 0.15(a) | | 0.12 |
| Net realized and unrealized gain (loss) | (2.16) | | 1.82 | | (0.70) | | 0.08 | | (1.62) |
| Total from investment operations | (2.07) | | 1.87 | | (0.66) | | 0.23 | | (1.50) |
| Less distributions: | | | | | | | | | |
| From net investment income | (0.17) | | (0.12) | | (0.71) | | (0.40) | | (0.14) |
| Net asset value at end of year | $ 5.87 | | $ 8.11 | | $ 6.36 | | $ 7.73 | | $ 7.90 |
| Total investment return (b) | (26.07)% | | 29.66% | | (9.47)% | | 3.54% | | (15.97)%(c) |
| Ratios (to average net assets)/Supplemental Data: | | | | | | | | | |
| Net investment income (loss) | 1.35% | | 0.64% | | 0.66% | | 2.00% | | 1.29% |
| Net expenses (d)(e) | 1.46% | | 1.63% | | 1.89% | | 1.93% | | 1.88% |
| Expenses (before waiver/reimbursement) (d)(e) | 1.50% | | 1.63% | | 1.89% | | 1.93% | | 1.88% |
| Portfolio turnover rate | 65% | | 117% | | 136% | | 182% | | 223% |
| Net assets at end of year (in 000's) | $ 1,624 | | $ 2,487 | | $ 2,731 | | $ 3,690 | | $ 3,407 |
| (a) | Per share data based on average shares outstanding during the year. |
| (b) | Total investment return is calculated exclusive of sales charges and assumes the reinvestment of dividends and distributions. For periods of less than one year, total return is not annualized. |
| (c) | Total investment return may reflect adjustments to conform to generally accepted accounting principles. |
| (d) | In addition to the fees and expenses which the Fund bears directly, it also indirectly bears a pro-rata share of the fees and expenses of the underlying funds in which it invests. Such indirect expenses are not included in the above expense ratios. |
| (e) | The expense ratios presented below show the impact of short sales expense: |
| Year Ended | | Net Expenses
(excluding short
sale expenses) | | Short Sales
Expenses |
| October 31, 2022 | | 1.46% | | 0.00%(f) |
| October 31, 2021 | | 1.62% | | 0.01% |
| October 31, 2020 | | 1.86% | | 0.03% |
| October 31, 2019 | | 1.81% | | 0.12% |
| October 31, 2018 | | 1.75% | | 0.13% |
The notes to the financial statements are an integral part of, and should be read in conjunction with, the financial statements.
23
Financial Highlights selected per share data and ratios
| | Year Ended October 31, |
| Class C | 2022 | | 2021 | | 2020 | | 2019 | | 2018 |
| Net asset value at beginning of year | $ 7.87 | | $ 6.16 | | $ 7.49 | | $ 7.63 | | $ 9.23 |
| Net investment income (loss) | 0.04(a) | | 0.00‡(a) | | (0.01)(a) | | 0.08(a) | | 0.05 |
| Net realized and unrealized gain (loss) | (2.11) | | 1.76 | | (0.68) | | 0.10 | | (1.57) |
| Total from investment operations | (2.07) | | 1.76 | | (0.69) | | 0.18 | | (1.52) |
| Less distributions: | | | | | | | | | |
| From net investment income | (0.10) | | (0.05) | | (0.64) | | (0.32) | | (0.08) |
| Net asset value at end of year | $ 5.70 | | $ 7.87 | | $ 6.16 | | $ 7.49 | | $ 7.63 |
| Total investment return (b) | (26.65)% | | 28.66% | | (10.16)% | | 2.81% | | (16.61)% |
| Ratios (to average net assets)/Supplemental Data: | | | | | | | | | |
| Net investment income (loss) | 0.56% | | 0.01% | | (0.22)% | | 1.14% | | 0.52% |
| Net expenses (c)(d) | 2.21% | | 2.38% | | 2.64% | | 2.66% | | 2.62% |
| Expenses (before waiver/reimbursement) (c)(d) | 2.25% | | 2.38% | | 2.64% | | 2.66% | | 2.62% |
| Portfolio turnover rate | 65% | | 117% | | 136% | | 182% | | 223% |
| Net assets at end of year (in 000’s) | $ 2,458 | | $ 5,340 | | $ 6,229 | | $ 14,203 | | $ 27,699 |
| ‡ | Less than one cent per share. |
| (a) | Per share data based on average shares outstanding during the year. |
| (b) | Total investment return is calculated exclusive of sales charges and assumes the reinvestment of dividends and distributions. For periods of less than one year, total return is not annualized. |
| (c) | In addition to the fees and expenses which the Fund bears directly, it also indirectly bears a pro-rata share of the fees and expenses of the underlying funds in which it invests. Such indirect expenses are not included in the above expense ratios. |
| (d) | The expense ratios presented below show the impact of short sales expense: |
| Year Ended | | Net Expenses
(excluding short
sale expenses) | | Short Sales
Expenses |
| October 31, 2022 | | 2.21% | | 0.00%(e) |
| October 31, 2021 | | 2.37% | | 0.01% |
| October 31, 2020 | | 2.61% | | 0.03% |
| October 31, 2019 | | 2.55% | | 0.11% |
| October 31, 2018 | | 2.49% | | 0.13% |
The notes to the financial statements are an integral part of, and should be read in conjunction with, the financial statements.
| 24 | MainStay WMC International Research Equity Fund |
Financial Highlights selected per share data and ratios
| | Year Ended October 31, |
| Class I | 2022 | | 2021 | | 2020 | | 2019 | | 2018 |
| Net asset value at beginning of year | $ 8.22 | | $ 6.45 | | $ 7.83 | | $ 8.00 | | $ 9.66 |
| Net investment income (loss) | 0.14(a) | | 0.10(a) | | 0.08(a) | | 0.17(a) | | 0.15 |
| Net realized and unrealized gain (loss) | (2.19) | | 1.83 | | (0.71) | | 0.10 | | (1.64) |
| Total from investment operations | (2.05) | | 1.93 | | (0.63) | | 0.27 | | (1.49) |
| Less distributions: | | | | | | | | | |
| From net investment income | (0.22) | | (0.16) | | (0.75) | | (0.44) | | (0.17) |
| Net asset value at end of year | $ 5.95 | | $ 8.22 | | $ 6.45 | | $ 7.83 | | $ 8.00 |
| Total investment return (b) | (25.61)% | | 30.21% | | (8.98)% | | 4.08% | | (15.72)%(c) |
| Ratios (to average net assets)/Supplemental Data: | | | | | | | | | |
| Net investment income (loss) | 1.95% | | 1.26% | | 1.19% | | 2.20% | | 1.63% |
| Net expenses (d)(e) | 0.86% | | 1.06% | | 1.38% | | 1.50% | | 1.53% |
| Expenses (before waiver/reimbursement) (d)(e) | 0.94% | | 1.08% | | 1.38% | | 1.50% | | 1.53% |
| Portfolio turnover rate | 65% | | 117% | | 136% | | 182% | | 223% |
| Net assets at end of year (in 000’s) | $ 147,559 | | $ 207,352 | | $ 230,100 | | $ 281,279 | | $ 521,050 |
| (a) | Per share data based on average shares outstanding during the year. |
| (b) | Total investment return is calculated exclusive of sales charges and assumes the reinvestment of dividends and distributions. Class I shares are not subject to sales charges. For periods of less than one year, total return is not annualized. |
| (c) | Total investment return may reflect adjustments to conform to generally accepted accounting principles. |
| (d) | In addition to the fees and expenses which the Fund bears directly, it also indirectly bears a pro-rata share of the fees and expenses of the underlying funds in which it invests. Such indirect expenses are not included in the above expense ratios. |
| (e) | The expense ratios presented below show the impact of short sales expense: |
| Year Ended | | Net Expenses
(excluding short
sale expenses) | | Short Sales
Expenses |
| October 31, 2022 | | 0.86% | | 0.00%(f) |
| October 31, 2021 | | 1.05% | | 0.01% |
| October 31, 2020 | | 1.35% | | 0.03% |
| October 31, 2019 | | 1.40% | | 0.10% |
| October 31, 2018 | | 1.40% | | 0.13% |
The notes to the financial statements are an integral part of, and should be read in conjunction with, the financial statements.
25
Notes to Financial Statements
Note 1-Organization and Business
MainStay Funds Trust (the “Trust”) was organized as a Delaware statutory trust on April 28, 2009. The Trust is registered under the Investment Company Act of 1940, as amended (the “1940 Act”), as an open-end management investment company, and is comprised of thirty-three funds (collectively referred to as the “Funds”). These financial statements and notes relate to the MainStay WMC International Research Equity Fund (the "Fund"), a “diversified” fund, as that term is defined in the 1940 Act, as interpreted or modified by regulatory authorities having jurisdiction, from time to time.
The following table lists the Fund's share classes that have been registered and commenced operations:
| Class | Commenced Operations |
| Class A | September 28, 2007 |
| Investor Class | February 28, 2008 |
| Class C | September 28, 2007 |
| Class I | September 28, 2007 |
| Class R6 | N/A* |
| SIMPLE Class | N/A* |
| * | Class R6 shares were registered for sale effective as of February 28, 2017 and SIMPLE Class shares were registered for sale effective as of August 31, 2020 but have not yet commenced operations. |
Class A and Investor Class shares are offered at net asset value (“NAV”) per share plus an initial sales charge. No initial sales charge applies to investments of $1 million or more (and certain other qualified purchases) in Class A and Investor Class shares. However, a contingent deferred sales charge (“CDSC”) of 1.00% may be imposed on certain redemptions made within 18 months of the date of purchase on shares that were purchased without an initial sales charge. Class C shares are offered at NAV without an initial sales charge, although a 1.00% CDSC may be imposed on certain redemptions of such shares made within one year of the date of purchase of Class C shares. Class I shares are offered at NAV without a sales charge. Class R6 and SIMPLE Class shares are expected to be offered at NAV without a sales charge if such shares are offered in the future. Depending upon eligibility, Class C shares convert to either Class A or Investor Class shares at the end of the calendar quarter eight years after the date they were purchased. Additionally, Investor Class shares may convert automatically to Class A shares. Under certain circumstances and as may be permitted by the Trust’s multiple class plan pursuant to Rule 18f-3 under the 1940 Act, specified share classes of the Fund may be converted to one or more other share classes of the Fund as disclosed in the capital share transactions within these Notes. The classes of shares have the same voting (except for issues that relate solely to one class), dividend, liquidation and other rights, and the same terms and conditions, except that under distribution plans pursuant to Rule 12b-1 under the 1940 Act, Class C shares are subject to higher distribution and/or service fees than Class A, Investor Class and SIMPLE Class shares. Class I and Class R6 shares are not subject to a distribution and/or service fee.
The Fund's investment objective is to seek long-term growth of capital.
Note 2–Significant Accounting Policies
The Fund is an investment company and accordingly follows the investment company accounting and reporting guidance of the Financial Accounting Standards Board (“FASB”) Accounting Standards Codification Topic 946 Financial Services—Investment Companies. The Fund prepares its financial statements in accordance with generally accepted accounting principles (“GAAP”) in the United States of America and follows the significant accounting policies described below.
(A) Securities Valuation. Investments are usually valued as of the close of regular trading on the New York Stock Exchange (the "Exchange") (usually 4:00 p.m. Eastern time) on each day the Fund is open for business ("valuation date").
Effective September 8, 2022, and pursuant to Rule 2a-5 under the 1940 Act, the Board of Trustees of the Trust (the "Board") designated New York Life Investment Management LLC (“New York Life Investments” or the "Manager") as its Valuation Designee (the "Valuation Designee"). The Valuation Designee is responsible for performing fair valuations relating to all investments in the Fund’s portfolio for which market quotations are not readily available; periodically assessing and managing material valuation risks; establishing and applying fair value methodologies; testing fair valuation methodologies; evaluating and overseeing pricing services; segregation of valuation and portfolio management functions; providing quarterly, annual and prompt reporting to the Board, as appropriate; identifying potential conflicts of interest; and maintaining appropriate records. The Valuation Designee has established a valuation committee ("Valuation Committee") to assist in carrying out the Valuation Designee’s responsibilities and establish prices of securities for which market quotations are not readily available. The Fund’s and the Valuation Designee's policies and procedures ("Valuation Procedures") govern the Valuation Designee’s selection and application of methodologies for determining and calculating the fair value of Fund investments. The Valuation Designee may value Fund portfolio securities for which market quotations are not readily available and other Fund assets utilizing inputs from pricing services and other third-party sources (together, “Pricing Sources”). The Valuation Committee meets (in person, via electronic mail or via teleconference) on an ad-hoc basis to determine fair valuations and on a quarterly basis to review fair value events (excluding fair valuations from pricing services), including valuation risks and back-testing results, and preview reports to the Board.
The Valuation Committee establishes prices of securities for which market quotations are not readily available based on such methodologies and measurements on a regular basis after considering information that is reasonably available and deemed relevant by the Valuation Committee. The Board shall oversee the Valuation Designee and review fair valuation materials on a prompt, quarterly and annual basis and approve proposed revisions to the Valuation Procedures.
| 26 | MainStay WMC International Research Equity Fund |
Investments for which market quotations are not readily available are valued at fair value as determined in good faith pursuant to the Valuation Procedures. A market quotation is readily available only when that quotation is a quoted price (unadjusted) in active markets for identical investments that the Fund can access at the measurement date, provided that a quotation will not be readily available if it is not reliable. Fair value measurements are determined within a framework that establishes a three-tier hierarchy that maximizes the use of observable market data and minimizes the use of unobservable inputs to establish a classification of fair value measurements for disclosure purposes. "Inputs" refer broadly to the assumptions that market participants would use in pricing the asset or liability, including assumptions about risk, such as the risk inherent in a particular valuation technique used to measure fair value using a pricing model and/or the risk inherent in the inputs for the valuation technique. Inputs may be observable or unobservable. Observable inputs reflect the assumptions market participants would use in pricing the asset or liability based on market data obtained from sources independent of the Fund. Unobservable inputs reflect the Fund’s own assumptions about the assumptions market participants would use in pricing the asset or liability based on the information available. The inputs or methodology used for valuing assets or liabilities may not be an indication of the risks associated with investing in those assets or liabilities. The three-tier hierarchy of inputs is summarized below.
| • | Level 1—quoted prices (unadjusted) in active markets for an identical asset or liability |
| • | Level 2—other significant observable inputs (including quoted prices for a similar asset or liability in active markets, interest rates and yield curves, prepayment speeds, credit risk, etc.) |
| • | Level 3—significant unobservable inputs (including the Fund's own assumptions about the assumptions that market participants would use in measuring fair value of an asset or liability) |
The level of an asset or liability within the fair value hierarchy is based on the lowest level of an input, both individually and in the aggregate, that is significant to the fair value measurement. The aggregate value by input level of the Fund’s assets and liabilities as of October 31, 2022, is included at the end of the Portfolio of Investments.
The Fund may use third-party vendor evaluations, whose prices may be derived from one or more of the following standard inputs, among others:
| • Broker/dealer quotes | • Benchmark securities |
| • Two-sided markets | • Reference data (corporate actions or material event notices) |
| • Bids/offers | • Monthly payment information |
| • Industry and economic events | • Reported trades |
An asset or liability for which a market quotation is not readily available is valued by methods deemed reasonable in good faith by the Valuation Committee, following the Valuation Procedures to represent fair value. Under these procedures, the Valuation Designee generally uses a market-based approach which may use related or comparable assets or
liabilities, recent transactions, market multiples, book values and other relevant information. The Valuation Designee may also use an income-based valuation approach in which the anticipated future cash flows of the asset or liability are discounted to calculate fair value. Discounts may also be applied due to the nature and/or duration of any restrictions on the disposition of the asset or liability. Fair value represents a good faith approximation of the value of a security. Fair value determinations involve the consideration of a number of subjective factors, an analysis of applicable facts and circumstances and the exercise of judgment. As a result, it is possible that the fair value for a security determined in good faith in accordance with the Valuation Procedures may differ from valuations for the same security determined for other funds using their own valuation procedures. Although the Valuation Procedures are designed to value a security at the price the Fund may reasonably expect to receive upon the security's sale in an orderly transaction, there can be no assurance that any fair value determination thereunder would, in fact, approximate the amount that the Fund would actually realize upon the sale of the security or the price at which the security would trade if a reliable market price were readily available. During the year ended October 31, 2022, there were no material changes to the fair value methodologies.
Securities which may be valued in this manner include, but are not limited to: (i) a security for which trading has been halted or suspended or otherwise does not have a readily available market quotation on a given day; (ii) a debt security that has recently gone into default and for which there is not a current market quotation; (iii) a security of an issuer that has entered into a restructuring; (iv) a security that has been delisted from a national exchange; (v) a security subject to trading collars for which no or limited trading takes place; and (vi) a security whose principal market has been temporarily closed at a time when, under normal conditions, it would be open. Securities valued in this manner are generally categorized as Level 2 or 3 in the hierarchy.
Certain securities held by the Fund may principally trade in foreign markets. Events may occur between the time the foreign markets close and the time at which the Fund's NAVs are calculated. These events may include, but are not limited to, situations relating to a single issuer in a market sector, significant fluctuations in U.S. or foreign markets, natural disasters, armed conflicts, governmental actions or other developments not tied directly to the securities markets. Should the Valuation Designee conclude that such events may have affected the accuracy of the last price of such securities reported on the local foreign market, the Valuation Designee may, pursuant to the Valuation Procedures, adjust the value of the local price to reflect the estimated impact on the price of such securities as a result of such events. In this instance, securities are generally categorized as Level 3 in the hierarchy. Additionally, certain foreign equity securities are also fair valued whenever the movement of a particular index exceeds certain thresholds. In such cases, the securities are fair valued by applying factors provided by a third-party vendor in accordance with the Valuation Procedures and are generally categorized as Level 2 in the hierarchy. Securities that were fair valued in such a
Notes to Financial Statements (continued)
manner as of October 31, 2022, are shown in the Portfolio of Investments.
If the principal market of certain foreign equity securities is closed in observance of a local foreign holiday, these securities are valued using the last closing price of regular trading on the relevant exchange and fair valued by applying factors provided by a third-party vendor in accordance with the Valuation Procedures. These securities are generally categorized as Level 2 in the hierarchy. Securities that were fair valued in such a manner as of October 31, 2022, are shown in the Portfolio of Investments.
Equity securities, including rights and warrants and exchange-traded funds ("ETFs"), are valued at the last quoted sales prices as of the close of regular trading on the relevant exchange on each valuation date. Securities that are not traded on the valuation date are valued at the mean of the last quoted bid and ask prices. Prices are normally taken from the principal market in which each security trades. These securities are generally categorized as Level 1 in the hierarchy.
Investments in mutual funds, including money market funds, are valued at their respective NAVs at the close of business each day on the valuation date. These securities are generally categorized as Level 1 in the hierarchy.
Temporary cash investments acquired in excess of 60 days to maturity at the time of purchase are valued using the latest bid prices or using valuations based on a matrix system (which considers such factors as security prices, yields, maturities and ratings), both as furnished by independent pricing services. Temporary cash investments that mature in 60 days or less at the time of purchase ("Short-Term Investments") are valued using the amortized cost method of valuation, unless the use of such method would be inappropriate. The amortized cost method involves valuing a security at its cost on the date of purchase and thereafter assuming a constant amortization to maturity of the difference between such cost and the value on maturity date. Amortized cost approximates the current fair value of a security. Securities valued using the amortized cost method are not valued using quoted prices in an active market and are generally categorized as Level 2 in the hierarchy.
The information above is not intended to reflect an exhaustive list of the methodologies that may be used to value portfolio investments. The Valuation Procedures permit the use of a variety of valuation methodologies in connection with valuing portfolio investments. The methodology used for a specific type of investment may vary based on the market data available or other considerations. The methodologies summarized above may not represent the specific means by which portfolio investments are valued on any particular business day.
A portfolio investment may be classified as an illiquid investment under the Trust's written liquidity risk management program and related procedures (“Liquidity Program”). Illiquidity of an investment might prevent the sale of such investment at a time when the Manager or the Subadvisor might wish to sell, and these investments could have the effect of decreasing the overall level of the Fund's liquidity. Further, the
lack of an established secondary market may make it more difficult to value illiquid investments, requiring the Fund to rely on judgments that may be somewhat subjective in measuring value, which could vary materially from the amount that the Fund could realize upon disposition. Difficulty in selling illiquid investments may result in a loss or may be costly to the Fund. An illiquid investment is any investment that the Manager or Subadvisor reasonably expects cannot be sold or disposed of in current market conditions in seven calendar days or less without the sale or disposition significantly changing the market value of the investment. The liquidity classification of each investment will be made using information obtained after reasonable inquiry and taking into account, among other things, relevant market, trading and investment-specific considerations in accordance with the Liquidity Program. Illiquid investments are often fair valued in accordance with the Fund's procedures described above. The liquidity of the Fund's investments was determined as of October 31, 2022, and can change at any time. Illiquid investments as of October 31, 2022, are shown in the Portfolio of Investments.
(B) Income Taxes. The Fund's policy is to comply with the requirements of the Internal Revenue Code of 1986, as amended (the “Internal Revenue Code”), applicable to regulated investment companies and to distribute all of its taxable income to the shareholders of the Fund within the allowable time limits.
The Manager evaluates the Fund’s tax positions to determine if the tax positions taken meet the minimum recognition threshold in connection with accounting for uncertainties in income tax positions taken or expected to be taken for the purposes of measuring and recognizing tax liabilities in the financial statements. Recognition of tax benefits of an uncertain tax position is permitted only to the extent the position is “more likely than not” to be sustained assuming examination by taxing authorities. The Manager analyzed the Fund's tax positions taken on federal, state and local income tax returns for all open tax years (for up to three tax years) and has concluded that no provisions for federal, state and local income tax are required in the Fund's financial statements. The Fund's federal, state and local income tax and federal excise tax returns for tax years for which the applicable statutes of limitations have not expired are subject to examination by the Internal Revenue Service and state and local departments of revenue.
(C) Foreign Taxes. The Fund may be subject to foreign taxes on income and other transaction-based taxes imposed by certain countries in which it invests. A portion of the taxes on gains on investments or currency purchases/repatriation may be reclaimable. The Fund will accrue such taxes and reclaims as applicable, based upon its current interpretation of tax rules and regulations that exist in the markets in which it invests.
The Fund may be subject to taxation on realized capital gains, repatriation proceeds and other transaction-based taxes imposed by certain countries in which it invests. The Fund will accrue such taxes as applicable based upon its current interpretation of tax rules and regulations that exist in the market in which it invests. Capital gains taxes relating to positions still
| 28 | MainStay WMC International Research Equity Fund |
held are reflected as a liability in the Statement of Assets and Liabilities, as well as an adjustment to the Fund's net unrealized appreciation (depreciation). Taxes related to capital gains realized, if any, are reflected as part of net realized gain (loss) in the Statement of Operations. Changes in tax liabilities related to capital gains taxes on unrealized investment gains, if any, are reflected as part of the change in net unrealized appreciation (depreciation) on investments in the Statement of Operations. Transaction-based charges are generally assessed as a percentage of the transaction amount.
(D) Dividends and Distributions to Shareholders. Dividends and distributions are recorded on the ex-dividend date. The Fund intends to declare and pay dividends from net investment income and distributions from net realized capital and currency gains, if any, at least annually. Unless a shareholder elects otherwise, all dividends and distributions are reinvested at NAV in the same class of shares of the Fund. Dividends and distributions to shareholders are determined in accordance with federal income tax regulations and may differ from determinations using GAAP.
(E) Security Transactions and Investment Income. The Fund records security transactions on the trade date. Realized gains and losses on security transactions are determined using the identified cost method. Dividend income is recognized on the ex-dividend date, net of any foreign tax withheld at the source, and interest income is accrued as earned using the effective interest rate method. Distributions received from real estate investment trusts may be classified as dividends, capital gains and/or return of capital.
Investment income and realized and unrealized gains and losses on investments of the Fund are allocated pro rata to the separate classes of shares based upon their relative net assets on the date the income is earned or realized and unrealized gains and losses are incurred.
(F) Expenses. Expenses of the Trust are allocated to the individual Funds in proportion to the net assets of the respective Funds when the expenses are incurred, except where direct allocations of expenses can be made. Expenses (other than transfer agent expenses and fees incurred under the shareholder services plans and/or the distribution plans further discussed in Note 3(B)) are allocated to separate classes of shares pro rata based upon their relative net assets on the date the expenses are incurred. The expenses borne by the Fund, including those of related parties to the Fund, are shown in the Statement of Operations.
Additionally, the Fund may invest in ETFs and mutual funds, which are subject to management fees and other fees that may cause the costs of investing in ETFs and mutual funds to be greater than the costs of owning the underlying securities directly. These indirect expenses of ETFs and mutual funds are not included in the amounts shown as expenses in the Statement of Operations or in the expense ratios included in the Financial Highlights.
(G) Use of Estimates. In preparing financial statements in conformity with GAAP, the Manager makes estimates and assumptions that affect the reported amounts and disclosures in the financial statements. Actual results could differ from those estimates and assumptions.
(H) Foreign Currency Transactions. The Fund's books and records are maintained in U.S. dollars. Prices of securities denominated in foreign currency amounts are translated into U.S. dollars at the mean between the buying and selling rates last quoted by any major U.S. bank at the following dates:
(i) market value of investment securities, other assets and liabilities— at the valuation date; and
(ii) purchases and sales of investment securities, income and expenses—at the date of such transactions.
The assets and liabilities that are denominated in foreign currency amounts are presented at the exchange rates and market values at the close of the period. The realized and unrealized changes in net assets arising from fluctuations in exchange rates and market prices of securities are not separately presented.
Net realized gain (loss) on foreign currency transactions represents net currency gains or losses realized as a result of differences between the amounts of securities sale proceeds or purchase cost, dividends, interest and withholding taxes as recorded on the Fund's books, and the U.S. dollar equivalent amount actually received or paid. Net currency gains or losses from valuing such foreign currency denominated assets and liabilities, other than investments at valuation date exchange rates, are reflected in unrealized foreign exchange gains or losses.
(I) Securities Sold Short. During the period a short position is open, depending on the nature and type of security, a short position is reflected as a liability and is marked to market in accordance with the valuation methodologies previously detailed (See Note 2(A)). Liabilities for securities sold short are closed out by purchasing the applicable securities for delivery to the counterparty broker. A gain, limited to the price at which the Fund sold the security short, or a loss, unlimited as to dollar amount, will be recognized upon termination of a short sale if the market price on the date the short position is closed out is less or greater, respectively, than the proceeds originally received. Any such gain or loss may be offset, completely or in part, by the change in the value of the hedged investments. Interest on short positions held is accrued daily, while dividends declared on short positions existing on the record date are recorded on the ex-dividend date as a dividend expense in the Statement of Operations. Broker fees and other expenses related to securities sold short are disclosed in the Statement of Operations. Short sales involve risk of loss in excess of the related amounts reflected in the Statement of Assets and Liabilities. As of October 31, 2022, the securities sold short are shown in the Portfolio of Investments.
(J) Securities Lending. In order to realize additional income, the Fund may engage in securities lending, subject to the limitations set forth in the 1940 Act and relevant guidance by the staff of the Securities and Exchange Commission (“SEC”). If the Fund engages in securities lending, the Fund will lend through its custodian, JPMorgan Chase Bank, N.A., ("JPMorgan"), acting as securities lending agent on behalf of the Fund. Under the current arrangement, JPMorgan will manage the Fund's collateral in accordance with the securities lending agency agreement
Notes to Financial Statements (continued)
between the Fund and JPMorgan, and indemnify the Fund against counterparty risk. The loans will be collateralized by cash (which may be invested in a money market fund) and/or non-cash collateral (which may include U.S. Treasury securities and/or U.S. government agency securities issued or guaranteed by the United States government or its agencies or instrumentalities) at least equal at all times to the market value of the securities loaned. Non-cash collateral held at year end is segregated and cannot be transferred by the Fund. The Fund bears the risk of delay in recovery of, or loss of rights in, the securities loaned. The Fund may also record a realized gain or loss on securities deemed sold due to a borrower’s inability to return securities on loan. The Fund bears the risk of any loss on investment of cash collateral. The Fund will receive compensation for lending its securities in the form of fees or it will retain a portion of interest earned on the investment of any cash collateral. The Fund will also continue to receive interest and dividends on the securities loaned and any gain or loss in the market price of the securities loaned that may occur during the term of the loan will be for the account of the Fund. Income earned from securities lending activities, if any, is reflected in the Statement of Operations. Securities on loan as of October 31, 2022, are shown in the Portfolio of Investments.
(K) Rights and Warrants. Rights are certificates that permit the holder to purchase a certain number of shares, or a fractional share, of a new stock from the issuer at a specific price. Warrants are instruments that entitle the holder to buy an equity security at a specific price for a specific period of time. These investments can provide a greater potential for profit or loss than an equivalent investment in the underlying security. Prices of these investments do not necessarily move in tandem with the prices of the underlying securities.
There is risk involved in the purchase of rights and warrants in that these investments are speculative investments. The Fund could also lose the entire value of its investment in warrants if such warrants are not exercised by the date of its expiration. The Fund is exposed to risk until the sale or exercise of each right or warrant is completed. Rights and Warrants as of October 31, 2022 are shown in the Portfolio of Investments.
(L) Foreign Securities Risk. The Fund invests in foreign securities, which carry certain risks that are in addition to the usual risks inherent in domestic securities. These risks include those resulting from currency fluctuations, future adverse political or economic developments and possible imposition of currency exchange blockages or other foreign governmental laws or restrictions. These risks are likely to be greater in emerging markets than in developed markets. The ability of issuers of debt securities held by the Fund to meet their obligations may be affected by, among other things, economic or political developments in a specific country, industry or region.
(M) Indemnifications. Under the Trust’s organizational documents, its officers and trustees are indemnified against certain liabilities that may arise out of performance of their duties to the Trust. Additionally, in the normal course of business, the Fund enters into contracts with third-party service providers that contain a variety of representations and warranties
and that may provide general indemnifications. The Fund's maximum exposure under these arrangements is unknown, as this would involve future claims that may be made against the Fund that have not yet occurred. The Manager believes that the risk of loss in connection with these potential indemnification obligations is remote. However, there can be no assurance that material liabilities related to such obligations will not arise in the future, which could adversely impact the Fund.
Note 3–Fees and Related Party Transactions
(A) Manager and Subadvisor. New York Life Investments, a registered investment adviser and an indirect, wholly-owned subsidiary of New York Life Insurance Company ("New York Life"), serves as the Fund's Manager, pursuant to an Amended and Restated Management Agreement ("Management Agreement"). The Manager provides offices, conducts clerical, recordkeeping and bookkeeping services and keeps most of the financial and accounting records required to be maintained by the Fund. Except for the portion of salaries and expenses that are the responsibility of the Fund, the Manager pays the salaries and expenses of all personnel affiliated with the Fund and certain operational expenses of the Fund. During a portion of the year ended October 31, 2022, the Fund reimbursed New York Life Investments in an amount equal to the portion of the compensation of the Chief Compliance Officer attributable to the Fund. Wellington Management Company LLP ("Wellington" or the "Subadvisor"), a registered investment adviser, serves as the Subadvisor to the Fund and is responsible for the day-to-day portfolio management of the Fund. Pursuant to the terms of a Subadvisory Agreement ("Subadvisory Agreement") between New York Life Investments and Wellington, New York Life Investments pays for the services of the Subadvisor.
Pursuant to the Management Agreement, the Fund pays the Manager a monthly fee for the services performed and the facilities furnished at an annual rate of of average daily net assets of the Fund. During the year ended October 31, 2022, the effective management fee rate was 0.75%.
Effective March 21, 2022, New York Life Investments has contractually agreed to waive fees and/or reimburse expenses so that Total Annual Fund Operating Expenses (excluding taxes, interest, litigation, extraordinary expenses, brokerage and other transaction expenses relating to the purchase or sale of portfolio investments, and acquired (underlying) fund fees and expenses) for Class A shares do not exceed 1.18% of the Fund’s average daily net assets. This agreement will remain in effect until March 21, 2023, and shall renew automatically for one-year terms unless New York Life Investments provides written notice of termination prior to the start of the next term or upon approval of the Board.
For the period February 28, 2021 through February 28, 2022, New York Life Investments had contractually agreed to waive fees and/or reimburse expenses so that Total Annual Fund Operating Expenses (excluding taxes, interest, litigation, extraordinary expenses, brokerage and other transaction expenses relating to the purchase or sale of portfolio investments, and acquired (underlying) fund fees and expenses) for
| 30 | MainStay WMC International Research Equity Fund |
Class A shares do not exceed 1.85% of the Fund’s average daily net assets. New York Life Investments applied an equivalent waiver or reimbursement, in an equal number of basis points, to the other share classes of the Fund, except for Class I shares.
New York Life Investments has contractually agreed to waive fees and/or reimburse expenses so that Total Annual Fund Operating Expenses (excluding taxes, interest, litigation, extraordinary expenses, brokerage and other transaction expenses relating to the purchase or sale of portfolio investments, and acquired (underlying) fund fees and expenses) for Class I shares do not exceed 0.86% of the Fund’s average daily net assets. This agreement will remain in effect until February 28, 2023, and shall renew automatically for one-year terms unless New York Life Investments provides written notice of termination prior to the start of the next term or upon approval of the Board.
New York Life Investments has agreed to voluntarily waive fees and/or reimburse expenses of the appropriate class of the Fund so that Total Annual Fund Operating Expenses (excluding taxes, interest, litigation, extraordinary expenses, brokerage and other transaction expenses relating to the purchase and sale of portfolio investments, and acquired (underlying) fund fees and expenses) of a class do not exceed the following percentages of average daily net assets: 1.95% for Investor Class shares and 2.70% for Class C shares. These voluntary waivers or reimbursements may be discontinued at any time without notice.
During the year ended October 31, 2022, New York Life Investments earned fees from the Fund in the amount of $1,455,087 and waived fees and/or reimbursed expenses, including the waiver/reimbursement of certain class specific expenses in the amount of $133,655 and paid the Subadvisor fees in the amount of $589,794.
JPMorgan provides sub-administration and sub-accounting services to the Fund pursuant to an agreement with New York Life Investments. These services include calculating the daily NAVs of the Fund, maintaining the general ledger and sub-ledger accounts for the calculation of the Fund's NAVs, and assisting New York Life Investments in conducting various aspects of the Fund's administrative operations. For providing these services to the Fund, JPMorgan is compensated by New York Life Investments.
Pursuant to an agreement between the Trust and New York Life Investments, New York Life Investments is responsible for providing or procuring certain regulatory reporting services for the Fund. The Fund will reimburse New York Life Investments for the actual costs incurred by New York Life Investments in connection with providing or procuring these services for the Fund.
(B) Distribution and Service Fees. The Trust, on behalf of the Fund, has entered into a distribution agreement with NYLIFE Distributors LLC (the “Distributor”), an affiliate of New York Life Investments. The Fund has adopted distribution plans (the “Plans”) in accordance with the provisions of Rule 12b-1 under the 1940 Act.
Pursuant to the Class A and Investor Class Plans, the Distributor receives a monthly fee from the Class A and Investor Class shares at an annual rate of 0.25% of the average daily net assets of the Class A and Investor Class shares for distribution and/or service activities as designated by the Distributor. Pursuant to the Class C Plan, Class C shares pay the Distributor a monthly distribution fee at an annual rate of 0.75% of the average daily net assets of the Class C shares, along with a service fee at an annual rate of 0.25% of the average daily net assets of the Class C shares, for a total 12b-1 fee of 1.00%. Class I shares are not subject to a distribution and/or service fee.
The Plans provide that the distribution and service fees are payable to the Distributor regardless of the amounts actually expended by the Distributor for distribution of the Fund's shares and service activities.
(C) Sales Charges. The Fund was advised by the Distributor that the amount of initial sales charges retained on sales of Class A and Investor Class shares during the year ended October 31, 2022, were $1,567 and $275, respectively.
The Fund was also advised that the Distributor retained CDSCs on redemptions of Investor Class and Class C shares during the year ended October 31, 2022, of $71 and $23, respectively.
(D) Transfer, Dividend Disbursing and Shareholder Servicing Agent. NYLIM Service Company LLC, an affiliate of New York Life Investments, is the Fund's transfer, dividend disbursing and shareholder servicing agent pursuant to an agreement between NYLIM Service Company LLC and the Trust. NYLIM Service Company LLC has entered into an agreement with DST Asset Manager Solutions, Inc. ("DST"), pursuant to which DST performs certain transfer agent services on behalf of NYLIM Service Company LLC. New York Life Investments has contractually agreed to limit the transfer agency expenses charged to the Fund’s share classes to a maximum of 0.35% of that share class’s average daily net assets on an annual basis after deducting any applicable Fund or class-level expense reimbursement or small account fees. This agreement will remain in effect until February 28, 2023, and shall renew automatically for one-year terms unless New York Life Investments provides written notice of termination prior to the start of the next term or upon approval of the Board. During the year ended October 31, 2022, transfer agent expenses incurred by the Fund and any reimbursements, pursuant to the aforementioned Transfer Agency expense limitation agreement, were as follows:
| Class | Expense | Waived |
| Class A | $ 4,638 | $— |
| Investor Class | 7,055 | — |
| Class C | 13,357 | — |
| Class I | 62,722 | — |
(E) Small Account Fee. Shareholders with small accounts adversely impact the cost of providing transfer agency services. In an effort to reduce total transfer agency expenses, the Fund has implemented a small account fee on certain types of accounts. As described in the Fund's
Notes to Financial Statements (continued)
prospectus, certain shareholders with an account balance of less than $1,000 ($5,000 for Class A share accounts) are charged an annual per account fee of $20 (assessed semi-annually), the proceeds from which offset transfer agent fees as reflected in the Statement of Operations. This small account fee will not apply to certain types of accounts as described further in the Fund’s prospectus.
Note 4-Federal Income Tax
As of October 31, 2022, the cost and unrealized appreciation (depreciation) of the Fund’s investment portfolio, including applicable derivative contracts and other financial instruments, as determined on a federal income tax basis, were as follows:
| | Federal Tax
Cost | Gross
Unrealized
Appreciation | Gross
Unrealized
(Depreciation) | Net
Unrealized
Appreciation/
(Depreciation) |
| Investments in Securities | $195,394,697 | $5,701,582 | $(38,521,791) | $(32,820,209) |
As of October 31, 2022, the components of accumulated gain (loss) on a tax basis were as follows:
Ordinary
income | Accumulated
Capital
and Other
Gain (Loss) | Other
Temporary
Differences | Unrealized
Appreciation
(Depreciation) | Total
Accumulated
Gain (Loss) |
| $2,882,652 | $(102,971,094) | $— | $(32,921,486) | $(133,009,928) |
The difference between book-basis and tax-basis unrealized appreciation (depreciation) is primarily due to wash sale adjustments.
As of October 31, 2022, for federal income tax purposes, capital loss carryforwards of $102,971,094, as shown in the table below, were available to the extent provided by the regulations to offset future realized gains of the Fund. Accordingly, no capital gains distributions are expected to be paid to shareholders until net gains have been realized in excess of such amounts.
Capital Loss
Available Through | Short-Term
Capital Loss
Amounts (000’s) | Long-Term
Capital Loss
Amounts (000’s) |
| Unlimited | $98,745 | $4,226 |
During the years ended October 31, 2022 and October 31, 2021, the tax character of distributions paid as reflected in the Statements of Changes in Net Assets was as follows:
| | 2022 | 2021 |
| Distributions paid from: | | |
| Ordinary Income | $5,922,955 | $5,811,357 |
Note 5–Custodian
JPMorgan is the custodian of cash and securities held by the Fund. Custodial fees are charged to the Fund based on the Fund's net assets and/or the market value of securities held by the Fund and the number of certain transactions incurred by the Fund.
Note 6–Line of Credit
The Fund and certain other funds managed by New York Life Investments maintain a line of credit with a syndicate of banks in order to secure a source of funds for temporary purposes to meet unanticipated or excessive redemption requests.
Effective July 26, 2022, under the credit agreement (the “Credit Agreement”), the aggregate commitment amount is $600,000,000 with an additional uncommitted amount of $100,000,000. The commitment fee is an annual rate of 0.15% of the average commitment amount payable quarterly, regardless of usage, to JPMorgan, who serves as the agent to the syndicate. The commitment fee is allocated among the Fund and certain other funds managed by New York Life Investments based upon their respective net assets and other factors. Interest on any revolving credit loan is charged based upon the Federal Funds Rate, Daily Simple Secured Overnight Financing Rate ("SOFR") + 0.10%, or the Overnight Bank Funding Rate, whichever is higher. The Credit Agreement expires on July 25, 2023, although the Fund, certain other funds managed by New York Life Investments and the syndicate of banks may renew the Credit Agreement for an additional year on the same or different terms or enter into a credit agreement with a different syndicate of banks. Prior to July 26, 2022, the aggregate commitment amount and the commitment fee were the same as those under the current Credit Agreement. During the year ended October 31, 2022, there were no borrowings made or outstanding with respect to the Fund under the Credit Agreement.
Note 7–Interfund Lending Program
Pursuant to an exemptive order issued by the SEC, the Fund, along with certain other funds managed by New York Life Investments, may participate in an interfund lending program. The interfund lending program provides an alternative credit facility that permits the Fund and certain other funds managed by New York Life Investments to lend or borrow money for temporary purposes directly to or from one another, subject to the conditions of the exemptive order. During the year ended October 31, 2022, there were no interfund loans made or outstanding with respect to the Fund.
Note 8–Purchases and Sales of Securities (in 000’s)
During the year ended October 31, 2022, purchases and sales of securities, other than short-term securities, were $124,639 and $132,222, respectively.
| 32 | MainStay WMC International Research Equity Fund |
Note 9–Capital Share Transactions
Transactions in capital shares for the years ended October 31, 2022 and October 31, 2021, were as follows:
| Class A | Shares | Amount |
| Period ended October 31, 2022: | | |
| Shares sold | 381,741 | $ 2,732,536 |
| Shares issued to shareholders in reinvestment of distributions | 45,770 | 357,008 |
| Shares redeemed | (579,197) | (3,997,262) |
| Net increase (decrease) in shares outstanding before conversion | (151,686) | (907,718) |
| Shares converted into Class A (See Note 1) | 9,711 | 68,614 |
| Net increase (decrease) | (141,975) | $ (839,104) |
| Year ended October 31, 2021: | | |
| Shares sold | 406,996 | $ 3,199,938 |
| Shares issued to shareholders in reinvestment of distributions | 33,548 | 240,873 |
| Shares redeemed | (534,661) | (4,069,351) |
| Net increase (decrease) in shares outstanding before conversion | (94,117) | (628,540) |
| Shares converted into Class A (See Note 1) | 59,430 | 466,438 |
| Net increase (decrease) | (34,687) | $ (162,102) |
| |
| Investor Class | Shares | Amount |
| Period ended October 31, 2022: | | |
| Shares sold | 8,861 | $ 61,330 |
| Shares issued to shareholders in reinvestment of distributions | 6,470 | 50,334 |
| Shares redeemed | (39,740) | (266,279) |
| Net increase (decrease) in shares outstanding before conversion | (24,409) | (154,615) |
| Shares converted into Investor Class (See Note 1) | 2,258 | 15,133 |
| Shares converted from Investor Class (See Note 1) | (7,927) | (56,148) |
| Net increase (decrease) | (30,078) | $ (195,630) |
| Year ended October 31, 2021: | | |
| Shares sold | 31,303 | $ 242,991 |
| Shares issued to shareholders in reinvestment of distributions | 7,076 | 50,598 |
| Shares redeemed | (106,038) | (809,982) |
| Net increase (decrease) in shares outstanding before conversion | (67,659) | (516,393) |
| Shares converted into Investor Class (See Note 1) | 3,025 | 23,291 |
| Shares converted from Investor Class (See Note 1) | (57,649) | (450,154) |
| Net increase (decrease) | (122,283) | $ (943,256) |
| |
| Class C | Shares | Amount |
| Period ended October 31, 2022: | | |
| Shares sold | 11,524 | $ 79,421 |
| Shares issued to shareholders in reinvestment of distributions | 8,412 | 64,017 |
| Shares redeemed | (263,222) | (1,734,461) |
| Net increase (decrease) in shares outstanding before conversion | (243,286) | (1,591,023) |
| Shares converted from Class C (See Note 1) | (4,187) | (27,599) |
| Net increase (decrease) | (247,473) | $ (1,618,622) |
| Year ended October 31, 2021: | | |
| Shares sold | 6,639 | $ 49,558 |
| Shares issued to shareholders in reinvestment of distributions | 6,756 | 47,223 |
| Shares redeemed | (340,250) | (2,543,000) |
| Net increase (decrease) in shares outstanding before conversion | (326,855) | (2,446,219) |
| Shares converted from Class C (See Note 1) | (5,247) | (39,575) |
| Net increase (decrease) | (332,102) | $ (2,485,794) |
| |
| Class I | Shares | Amount |
| Period ended October 31, 2022: | | |
| Shares sold | 2,007,742 | $ 13,223,517 |
| Shares issued to shareholders in reinvestment of distributions | 693,218 | 5,434,827 |
| Shares redeemed | (3,122,136) | (22,093,407) |
| Net increase (decrease) | (421,176) | $ (3,435,063) |
| Year ended October 31, 2021: | | |
| Shares sold | 1,286,350 | $ 9,995,907 |
| Shares issued to shareholders in reinvestment of distributions | 751,182 | 5,423,532 |
| Shares redeemed | (12,502,063) | (94,803,114) |
| Net increase (decrease) | (10,464,531) | $(79,383,675) |
Note 10–Other Matters
As of the date of this report, interest rates in the United States and many parts of the world, including certain European countries, are ascending from historically low levels. Thus, the Fund currently faces a heightened level of risk associated with rising interest rates. This could be driven by a variety of factors, including but not limited to central bank monetary policies, changing inflation or real growth rates, general economic conditions, increasing bond issuances or reduced market demand for low yielding investments.
An outbreak of COVID-19, first detected in December 2019, has developed into a global pandemic and has resulted in travel restrictions, closure of international borders, certain businesses and securities markets, restrictions on securities trading activities, prolonged quarantines, supply chain disruptions, and lower consumer demand, as well as general concern and uncertainty. In 2022, many countries lifted some or all restrictions related to COVID-19. However, the continued impact of COVID-19 and related variants is uncertain and could further adversely affect the global economy, national economies, individual
Notes to Financial Statements (continued)
issuers and capital markets in unforeseeable ways and result in a substantial and extended economic downturn. Developments that disrupt global economies and financial markets, such as COVID-19, may magnify factors that affect the Fund's performance.
Note 11–Subsequent Events
In connection with the preparation of the financial statements of the Fund as of and for the year ended October 31, 2022, events and transactions subsequent to October 31, 2022, through the date the financial statements were issued have been evaluated by the Manager for possible adjustment and/or disclosure. No subsequent events requiring financial statement adjustment or disclosure have been identified.
| 34 | MainStay WMC International Research Equity Fund |
Report of Independent Registered Public Accounting Firm
To the Shareholders of the Fund and Board of Trustees
MainStay Funds Trust:
Opinion on the Financial Statements
We have audited the accompanying statement of assets and liabilities of MainStay WMC International Research Equity Fund (the Fund), one of the funds constituting MainStay Funds Trust, including the portfolio of investments, as of October 31, 2022, the related statement of operations for the year then ended, the statements of changes in net assets for each of the years in the two-year period then ended, and the related notes (collectively, the financial statements) and the financial highlights for each of the years in the five-year period then ended. In our opinion, the financial statements and financial highlights present fairly, in all material respects, the financial position of the Fund as of October 31, 2022, the results of its operations for the year then ended, the changes in its net assets for each of the years in the two-year period then ended, and the financial highlights for each of the years in the five-year period then ended, in conformity with U.S. generally accepted accounting principles.
Basis for Opinion
These financial statements and financial highlights are the responsibility of the Fund's management. Our responsibility is to express an opinion on these financial statements and financial highlights based on our audits. We are a public accounting firm registered with the Public Company Accounting Oversight Board (United States) (PCAOB) and are required to be independent with respect to the Fund in accordance with the U.S. federal securities laws and the applicable rules and regulations of the Securities and Exchange Commission and the PCAOB.
We conducted our audits in accordance with the standards of the PCAOB. Those standards require that we plan and perform the audit to obtain reasonable assurance about whether the financial statements and financial highlights are free of material misstatement, whether due to error or fraud. Our audits included performing procedures to assess the risks of material misstatement of the financial statements and financial highlights, whether due to error or fraud, and performing procedures that respond to those risks. Such procedures included examining, on a test basis, evidence regarding the amounts and disclosures in the financial statements and financial highlights. Such procedures also included confirmation of securities owned as of October 31, 2022, by correspondence with custodians, the transfer agent and brokers; when replies were not received from brokers, we performed other auditing procedures. Our audits also included evaluating the accounting principles used and significant estimates made by management, as well as evaluating the overall presentation of the financial statements and financial highlights. We believe that our audits provide a reasonable basis for our opinion.

We have served as the auditor of one or more New York Life Investment Management investment companies since 2003.
Philadelphia, Pennsylvania
December 23, 2022
Federal Income Tax Information
(Unaudited)
The Fund is required under the Internal Revenue Code to advise shareholders in a written statement as to the federal tax status of dividends paid by the Fund during such fiscal years.
For the fiscal year ended October 31, 2022, the Fund designated approximately $5,081,093 under the Internal Revenue Code as qualified dividend income eligible for reduced tax rates.
The dividends paid by the Fund during the fiscal year ended October 31, 2022 should be multiplied by 0.53% to arrive at the amount eligible for the corporate dividend-received deduction.
In accordance with federal tax law, the Fund elected to provide each shareholder with their portion of the Fund’s foreign taxes paid and the income sourced from foreign countries. Accordingly, the Fund made the following designations regarding its fiscal year ended October 31, 2022:
• the total amount of taxes credited to foreign countries was $480,686.
• the total amount of income sourced from foreign countries was $3,851,951.
In February 2023, shareholders will receive an IRS Form 1099-DIV or substitute Form 1099, which will show the federal tax status of the distributions received by shareholders in calendar year 2022. The amounts that will be reported on such 1099-DIV or substitute Form 1099 will be the amounts you are to use on your federal income tax return and will differ from the amounts which we must report for the Fund's fiscal year ended October 31, 2022.
Proxy Voting Policies and Procedures and Proxy Voting Record
The Fund is required to file with the SEC its proxy voting record for the 12-month period ending June 30 on Form N-PX. A description of the policies and procedures that are used to vote proxies relating to portfolio securities of the Fund is available free of charge upon request by calling 800-624-6782 or visiting the SEC’s website at www.sec.gov. The most recent Form N-PX or proxy voting record is available free of charge upon request by calling 800-624-6782; visiting newyorklifeinvestments.com; or visiting the SEC’s website at www.sec.gov.
Shareholder Reports and Quarterly Portfolio Disclosure
The Fund is required to file its complete schedule of portfolio holdings with the SEC 60 days after its first and third fiscal quarter on Form N-PORT. The Fund's holdings report is available free of charge upon request by calling New York Life Investments at 800-624-6782.
| 36 | MainStay WMC International Research Equity Fund |
Board of Trustees and Officers (Unaudited)
The Trustees and officers of the Fund are listed below. The Board oversees the MainStay Group of Funds (which consists of MainStay Funds and MainStay Funds Trust), MainStay VP Funds Trust, MainStay MacKay DefinedTerm Municipal Opportunities Fund, MainStay CBRE Global Infrastructure Megatrends Fund, the Manager and the Subadvisors, and elects the officers of the Funds who are responsible for the day-to-day operations of the Fund. Information pertaining to the Trustees and officers is set forth below. Each Trustee serves until his or her successor is
elected and qualified or until his or her resignation, death or removal. Under the Board’s retirement policy, unless an exception is made, a Trustee must tender his or her resignation by the end of the calendar year during which he or she reaches the age of 75. The business address of each Trustee and officer listed below is 51 Madison Avenue, New York, New York 10010. None of the Trustees are “interested persons” (as defined by the 1940 Act and rules adopted by the SEC thereunder) of the Fund (“Independent Trustees”).
| | Name and
Year of Birth | Term of Office,
Position(s) Held and
Length of Service | Principal Occupation(s)
During Past Five Years | Number of
Portfolios in
Fund Complex
Overseen by
Trustee | Other Directorships
Held by Trustee |
| | | | | | |
| | David H. Chow
1957 | MainStay Funds: Trustee since 2016, Advisory Board Member (June 2015 to December 2015);MainStay Funds Trust:
Trustee since January 2016, Advisory Board Member (June 2015 to December 2015) | Founder and CEO, DanCourt Management, LLC since 1999 | 78 | MainStay VP Funds Trust: Trustee since January 2016, Advisory Board Member (June 2015 to December 2015) (31 portfolios);
MainStay MacKay DefinedTerm Municipal Opportunities Fund: Trustee since January 2016, Advisory Board Member (June 2015 to December 2015);
MainStay CBRE Global Infrastructure Megatrends Fund: Trustee since June 2021; VanEck Vectors Group of Exchange-Traded Funds: Independent Chairman of the Board of Trustees since 2008 and Trustee since 2006 (56 portfolios); and Berea College of Kentucky: Trustee since 2009, Chair of the Investment Committee since 2018 |
| | Susan B. Kerley
1951 | MainStay Funds: Chairman since 2017 and Trustee since 2007;MainStay Funds Trust:
Chairman since 2017 and Trustee since 1990** | President, Strategic Management Advisors LLC since 1990 | 78 | MainStay VP Funds Trust: Chairman since January 2017 and Trustee since 2007 (31 portfolios)**;
MainStay MacKay DefinedTerm Municipal Opportunities Fund: Chairman since 2017 and Trustee since 2011;
MainStay CBRE Global Infrastructure Megatrends Fund: Trustee since June 2021; and Legg Mason Partners Funds: Trustee since 1991 (45 portfolios) |
| | Alan R. Latshaw
1951 | MainStay Funds: Trustee since 2006;MainStay Funds Trust:
Trustee since 2007*** | Retired; Partner, Ernst & Young LLP (2002 to 2003); Partner, Arthur Andersen LLP (1989 to 2002); Consultant to the MainStay Funds Audit and Compliance Committee (2004 to 2006) | 78 | MainStay VP Funds Trust: Trustee since 2007 (31 portfolios)**;
MainStay MacKay DefinedTerm Municipal Opportunities Fund: Trustee since 2011; and
MainStay CBRE Global Infrastructure Megatrends Fund: Trustee since June 2021 |
Board of Trustees and Officers (Unaudited) (continued)
| | Name and
Year of Birth | Term of Office,
Position(s) Held and
Length of Service | Principal Occupation(s)
During Past Five Years | Number of
Portfolios in
Fund Complex
Overseen by
Trustee | Other Directorships
Held by Trustee |
| | | | | | |
| | Karen Hammond
1956 | MainStay Funds: Trustee since December 2021, Advisory Board Member (June 2021 to December 2021);MainStay Funds Trust:
Trustee since December 2021, Advisory Board Member (June 2021 to December 2021)
| Retired, Managing Director, Devonshire Investors (2007 to 2013); Senior Vice President, Fidelity Management & Research Co. (2005 to 2007); Senior Vice President and Corporate Treasurer, FMR Corp. (2003 to 2005); Chief Operating Officer, Fidelity Investments Japan (2001 to 2003) | 78 | MainStay VP Funds Trust: Trustee since December 2021, Advisory Board Member (June 2021 to December 2021) (31 Portfolios);
MainStay MacKay DefinedTerm Municipal Opportunities Fund: Trustee since December 2021, Advisory Board Member (June 2021 to December 2021);
MainStay CBRE Global Infrastructure Megatrends Fund: Trustee since December 2021, Advisory Board Member (June 2021 to December 2021);
Two Harbors Investment Corp.: Director since 2018;
Rhode Island State Investment Commission: Member since 2017; and
Blue Cross Blue Shield of Rhode Island: Director since 2019 |
| | Jacques P. Perold
1958 | MainStay Funds: Trustee since 2016, Advisory Board Member (June 2015 toDecember 2015);MainStay Funds Trust:
Trustee since January 2016, Advisory Board Member (June 2015 to December 2015) | Founder and Chief Executive Officer, CapShift Advisors LLC (since 2018); President, Fidelity Management & Research Company (2009 to 2014); President and Chief Investment Officer, Geode Capital Management, LLC (2001 to 2009) | 78 | MainStay VP Funds Trust: Trustee since January 2016, Advisory Board Member (June 2015 to December 2015) (31 portfolios);
MainStay MacKay DefinedTerm Municipal Opportunities Fund: Trustee since January 2016, Advisory Board Member (June 2015 to December 2015);
MainStay CBRE Global Infrastructure Megatrends Fund: Trustee since June 2021; Partners in Health: Trustee since 2019; Allstate Corporation: Director since 2015; and MSCI Inc.: Director since 2017 |
| | Richard S. Trutanic
1952 | MainStay Funds: Trustee since 1994;MainStay Funds Trust:
Trustee since 2007*** | Chairman and Chief Executive Officer, Somerset & Company (financial advisory firm) since 2004; Managing Director, The Carlyle Group (private investment firm) (2002 to 2004); Senior Managing Director, Partner and Board Member, Groupe Arnault S.A. (private investment firm) (1999 to 2002) | 78 | MainStay VP Funds Trust: Trustee since 2007 (31 portfolios)**;
MainStay MacKay DefinedTerm Municipal Opportunities Fund: Trustee since 2011; and MainStay CBRE Global Infrastructure Megatrends Fund: Trustee since June 2021 |
| ** | Includes prior service as a Director of MainStay VP Series Fund, Inc., the predecessor to MainStay VP Funds Trust. |
| *** | Includes prior service as a Director/Trustee of certain predecessor entities to MainStay Funds Trust. |
| 38 | MainStay WMC International Research Equity Fund |
| | Name and
Year of Birth | Position(s) Held and
Length of Service | Principal Occupation(s)
During Past Five Years | |
| | | | | |
| | Kirk C. Lehneis
1974 | President, MainStay Funds, MainStay Funds Trust since 2017 | Chief Operating Officer and Senior Managing Director (since 2016), New York Life Investment Management LLC and New York Life Investment Management Holdings LLC; Member of the Board of Managers (since 2017) and Senior Managing Director (since 2018), NYLIFE Distributors LLC; Chairman of the Board and Senior Managing Director, NYLIM Service Company LLC (since 2017); Trustee, President and Principal Executive Officer of IndexIQ Trust, IndexIQ ETF Trust and IndexIQ Active ETF Trust (since January 2018); President, MainStay CBRE Global Infrastructure Megatrends Fund (since 2021), MainStay MacKay DefinedTerm Municipal Opportunities Fund and MainStay VP Funds Trust (since 2017); Senior Managing Director, Global Product Development (From 2015-2016); Managing Director, Product Development (2010 to 2015), New York Life Investment Management LLC | |
| | Jack R. Benintende
1964 | Treasurer and Principal Financial and Accounting Officer, MainStay Funds (since 2007), MainStay Funds Trust (since 2009) | Managing Director, New York Life Investment Management LLC (since 2007); Treasurer and Principal Financial and Accounting Officer, MainStay CBRE Global Infrastructure Megatrends Fund (since 2021), MainStay MacKay DefinedTerm Municipal Opportunities Fund (since 2011) and MainStay VP Funds Trust (since 2007)** and Assistant Treasurer, New York Life Investment Management Holdings LLC (2008 to 2012) | |
| | J. Kevin Gao
1967 | Secretary and Chief Legal Officer, MainStay Funds and MainStay Funds Trust (since 2010) | Managing Director and Associate General Counsel, New York Life Investment Management LLC (since 2010); Secretary and Chief Legal Officer and MainStay CBRE Global Infrastructure Megatrends Fund (since 2021), MainStay MacKay DefinedTerm Municipal Opportunities Fund (since 2011) and MainStay VP Funds Trust (since 2010)** | |
| | Scott T. Harrington
1959 | Vice President— Administration, MainStay Funds (since 2009), MainStay Funds Trust (since 2009) | Managing Director, New York Life Investment Management LLC (including predecessor advisory organizations) (since 2000); Member of the Board of Directors, New York Life Trust Company (since 2009); Vice President—Administration, MainStay CBRE Global Infrastructure Megatrends Fund (since 2021), MainStay MacKay DefinedTerm Municipal Opportunities Fund (since 2011) and MainStay VP Funds Trust (since 2005)** | |
| | Kevin M. Gleason
1967 | Vice President and Chief Compliance Officer, MainStay Funds and MainStay Funds Trust (since June 2022) | Vice President and Chief Compliance Officer, IndexIQ, IndexIQ ETF Trust and Index IQ Active ETF Trust (since June 2022); Vice President and Chief Compliance Officer, MainStay CBRE Global Infrastructure Megatrends Fund, MainStay VP Funds Trust and MainStay MacKay DefinedTerm Municipal Opportunities Fund (since June 2022); Senior Vice President, Voya Investment Management and Chief Compliance Officer, Voya Family of Funds (2012-2022) | |
| * | The officers listed above are considered to be “interested persons” of the MainStay Group of Funds, MainStay VP Funds Trust, MainStay CBRE Global Infrastructure Megatrends Fund and MainStay MacKay DefinedTerm Municipal Opportunities Fund within the meaning of the 1940 Act because of their affiliation with the MainStay Group of Funds, New York Life Insurance Company and/or its affiliates, including New York Life Investment Management LLC, NYLIM Service Company LLC, NYLIFE Securities LLC and/or NYLIFE Distributors LLC, as described in detail in the column captioned “Principal Occupation(s) During Past Five Years.” Officers are elected annually by the Board. |
| ** | Includes prior service as an Officer of MainStay VP Series Fund, Inc., the predecessor to MainStay VP Funds Trust. |
Officers of the Trust (Who are not Trustees)*
This page intentionally left blank.
This page intentionally left blank.
This page intentionally left blank.
Equity
U.S. Equity
MainStay Epoch U.S. Equity Yield Fund
MainStay S&P 500 Index Fund1
MainStay Winslow Large Cap Growth Fund
MainStay WMC Enduring Capital Fund
MainStay WMC Growth Fund
MainStay WMC Small Companies Fund
MainStay WMC Value Fund
International Equity
MainStay Epoch International Choice Fund
MainStay MacKay International Equity Fund
MainStay WMC International Research Equity Fund
Emerging Markets Equity
MainStay Candriam Emerging Markets Equity Fund
Global Equity
MainStay Epoch Capital Growth Fund
MainStay Epoch Global Equity Yield Fund
Fixed Income
Taxable Income
MainStay Candriam Emerging Markets Debt Fund
MainStay Floating Rate Fund
MainStay MacKay High Yield Corporate Bond Fund
MainStay MacKay Short Duration High Yield Fund
MainStay MacKay Strategic Bond Fund
MainStay MacKay Total Return Bond Fund
MainStay MacKay U.S. Infrastructure Bond Fund
MainStay Short Term Bond Fund
Tax-Exempt Income
MainStay MacKay California Tax Free Opportunities Fund2
MainStay MacKay High Yield Municipal Bond Fund
MainStay MacKay New York Tax Free Opportunities Fund3
MainStay MacKay Short Term Municipal Fund
MainStay MacKay Strategic Municipal Allocation Fund
MainStay MacKay Tax Free Bond Fund
Money Market
MainStay Money Market Fund
Mixed Asset
MainStay Balanced Fund
MainStay Income Builder Fund
MainStay MacKay Convertible Fund
Speciality
MainStay CBRE Global Infrastructure Fund
MainStay CBRE Real Estate Fund
MainStay Cushing MLP Premier Fund
Asset Allocation
MainStay Conservative Allocation Fund
MainStay Conservative ETF Allocation Fund
MainStay Defensive ETF Allocation Fund
MainStay Equity Allocation Fund
MainStay Equity ETF Allocation Fund
MainStay ESG Multi-Asset Allocation Fund
MainStay Growth Allocation Fund
MainStay Growth ETF Allocation Fund
MainStay Moderate Allocation Fund
MainStay Moderate ETF Allocation Fund
Manager
New York Life Investment Management LLC
New York, New York
Subadvisors
Candriam4
Strassen, Luxembourg
CBRE Investment Management Listed Real Assets LLC
Radnor, Pennsylvania
Cushing Asset Management, LP
Dallas, Texas
Epoch Investment Partners, Inc.
New York, New York
MacKay Shields LLC4
New York, New York
NYL Investors LLC4
New York, New York
Wellington Management Company LLP
Boston, Massachusetts
Winslow Capital Management, LLC
Minneapolis, Minnesota
Legal Counsel
Dechert LLP
Washington, District of Columbia
Independent Registered Public Accounting Firm
KPMG LLP
Philadelphia, Pennsylvania
Distributor
NYLIFE Distributors LLC4
Jersey City, New Jersey
Custodian
JPMorgan Chase Bank, N.A.
New York, New York
1.
Prior to February 28, 2022, the Fund's name was MainStay MacKay S&P 500 Index Fund.
| 2. | This Fund is registered for sale in AZ, CA, NV, OR, TX, UT, WA and MI (Class A and Class I shares only), and CO, FL, GA, HI, ID, MA, MD, NH, NJ and NY (Class I shares only). |
| 3. | This Fund is registered for sale in CA, CT, DE, FL, MA, NJ, NY and VT. |
| 4. | An affiliate of New York Life Investment Management LLC. |
Not part of the Annual Report
For more information
800-624-6782
newyorklifeinvestments.com
“New York Life Investments” is both a service mark, and the common trade name, of certain investment advisors affiliated with New York Life Insurance Company. The MainStay Funds® are managed by New York Life Investment Management LLC and distributed by NYLIFE Distributors LLC, 30 Hudson Street, Jersey City, NJ 07302, a wholly owned subsidiary of New York Life Insurance Company. NYLIFE Distributors LLC is a Member FINRA/SIPC.
©2022 NYLIFE Distributors LLC. All rights reserved.
| 5013744.2MS229-22 | MSWIRE11-12/22 |
(NYLIM) NL530
MainStay WMC Small Companies Fund
Message from the President and Annual Report
October 31, 2022
Sign up for e-delivery of your shareholder reports. For full details on e-delivery, including who can participate and what you can receive via e-delivery,
please log in to newyorklifeinvestments.com/accounts.
| Not FDIC/NCUA Insured | Not a Deposit | May Lose Value | No Bank Guarantee | Not Insured by Any Government Agency |
This page intentionally left blank
Message from the President
A series of economic and geopolitical challenges undermined equity and fixed-income markets during the 12-month reporting period ended October 31, 2022. Stocks and bonds alike trended lower in the face of sharply rising interest rates, increasing inflationary pressures, slowing economic growth and Russia’s invasion of Ukraine.
The reporting period began on a mixed note, with concerns about the spreading Omicron variant of the COVID-19 virus and increasingly hawkish statements from the U.S. Federal Reserve (the “Fed”) regarding mounting inflation, countered by bullish sentiment stemming from U.S. economic growth and strong corporate earnings. In January 2022, markets turned decisively negative as comments from the Fed raised the likelihood of rate hikes as early as March, and Russia issued increasingly aggressive threats toward Ukraine. The onset of Russia’s invasion in February exacerbated global inflationary pressures while increasing investor uncertainty. Domestic supply shortages, international trade imbalances and rising inflation caused GDP (gross domestic product) to contract in the first and second quarters of the year, although employment and consumer spending proved resilient. Prices for petroleum surged to multi-year highs, while many key agricultural chemicals and industrial metals climbed as well. Accelerating inflationary forces prompted the Fed to implement its most aggressive interest rate increases since the 1980s with a series of five sharp rate hikes, raising the federal funds rate from a range of 0.00% to 0.25% in March to 3.00% to 3.25% in September, with additional rate hikes expected before the end of the year. International central banks generally followed suit, raising rates by varying degrees in efforts to curb local inflation, although most increases remained significantly more modest than those in the United States. Relatively high U.S. interest rates and risk-averse international sentiment pushed U.S. dollar values higher compared to most other currencies, with the ensuing negative impact on global prices for food, fuel and other key, U.S.-dollar-denominated products.
The effects of these interrelated challenges were felt throughout U.S. and international financial markets. The S&P 500® Index, a widely regarded benchmark of U.S. market performance, declined by more than 14% during the reporting period. Although the energy sector generated strong gains, bolstered by elevated oil and gas prices, most other industry areas recorded losses. The more cyclical and growth-oriented sectors of consumer discretionary, real estate and information technology delivered the
weakest returns, while the traditionally defensive and value-oriented consumer staples, utilities and health care sectors outperformed. International stocks lagged compared to their U.S. counterparts, with some emerging markets, such as China, suffering particularly steep losses. A few markets, however, including Brazil, Mexico and the United Arab Emirates, ended the reporting period with little change. Fixed-income markets saw bond prices broadly decline as yields rose along with interest rates. Short-term yields rose faster than long-term yields, producing a yield curve inversion from July through the end of the reporting period, with long-term rates remaining below short-term rates. While floating-rate instruments, which feature variable interest rates that allow investors to benefit from a rising rate environment, provided a degree of insulation from inflation-driven trends, they were not immune to the market’s widespread declines.
While the Fed acknowledges the costs of rising rates in terms of weaker GDP growth and unsettled financial markets over the short term, its primary focus continues to be the longer-term economic impact of inflation. With the latest figures as of the date of this report showing that inflation remains above 8%, versus a target rate of just 2%, the Fed clearly has a distance yet to go, making further rate increases and market volatility more likely in the coming months. The question remains as to whether the Fed and other central banks will manage a so-called “soft landing,” curbing inflation while avoiding a persistent economic slowdown. If they prove successful, we expect that favorable inflation trends and increasingly attractive valuations in both equity and bond markets should eventually translate into sustainable improvements in the investment environment.
Whatever actions the Fed takes and however financial markets react, as a MainStay investor, you can depend on us to continue providing the insight, expertise and service that have long defined New York Life Investments. Thank you for trusting us to help you meet your investment needs.
Sincerely,
Kirk C. Lehneis
President
The opinions expressed are as of the date of this report and are subject to change. There is no guarantee that any forecast made will come to pass. This material does not constitute investment advice and is not intended as an endorsement of any specific investment. Past performance is no guarantee of future results.
Not part of the Annual Report
Investors should refer to the Fund’s Summary Prospectus and/or Prospectus and consider the Fund’s investment objectives, strategies, risks, charges and expenses carefully before investing. The Summary Prospectus and/or Prospectus contain this and other information about the Fund. You may obtain copies of the Fund’s Summary Prospectus, Prospectus and Statement of Additional Information, which includes information about the MainStay Funds Trust's Trustees, free of charge, upon request, by calling toll-free 800-624-6782, by writing to NYLIFE Distributors LLC, Attn: MainStay Marketing Department, 30 Hudson Street, Jersey City, NJ 07302 or by sending an e-mail to MainStayShareholderServices@nylim.com. These documents are also available via the MainStay Funds’ website at newyorklifeinvestments.com. Please read the Fund’s Summary Prospectus and/or Prospectus carefully before investing.
Investment and Performance Comparison (Unaudited)
Performance data quoted represents past performance. Past performance is no guarantee of future results. Because of market volatility and other factors, current performance may be lower or higher than the figures shown. Investment return and principal value will fluctuate, and as a result, when shares are redeemed, they may be worth more or less than their original cost. The graph below depicts the historical performance of Class I shares of the Fund. Performance will vary from class to class based on differences in class-specific expenses and sales charges. For performance information current to the most recent month-end, please call 800-624-6782 or visit newyorklifeinvestments.com.
The performance table and graph do not reflect the deduction of taxes that a shareholder would pay on distributions or Fund share redemptions. Total returns reflect maximum applicable sales charges as indicated in the table below, if any, changes in share price, and reinvestment of dividend and capital gain distributions. The graph assumes the initial investment amount shown below and reflects the deduction of all sales charges that would have applied for the period of investment. Performance figures may reflect certain fee waivers and/or expense limitations, without which total returns may have been lower. For more information on share classes and current fee waivers and/or expense limitations (if any), please refer to the Notes to Financial Statements.

| Average Annual Total Returns for the Year-Ended October 31, 2022 |
| Class | Sales Charge | | Inception
Date1 | One
Year | Five
Years | Ten Years
or Since
Inception | Gross
Expense
Ratio2 |
| Class A Shares | Maximum 5.5% Initial Sales Charge | With sales charges | 1/2/2004 | -18.64% | 1.17% | 6.97% | 1.22% |
| | | Excluding sales charges | | -13.90 | 2.32 | 7.57 | 1.22 |
| Investor Class Shares3 | Maximum 5% Initial Sales Charge | With sales charges | 2/28/2008 | -18.43 | 0.89 | 6.67 | 1.66 |
| | | Excluding sales charges | | -14.13 | 2.04 | 7.28 | 1.66 |
| Class B Shares4 | Maximum 5% CDSC | With sales charges | 1/2/2004 | -17.84 | 1.05 | 6.47 | 2.41 |
| | if Redeemed Within the First Six Years of Purchase | Excluding sales charges | | -14.81 | 1.27 | 6.47 | 2.41 |
| Class C Shares | Maximum 1% CDSC | With sales charges | 12/30/2002 | -15.34 | 1.29 | 6.48 | 2.41 |
| | if Redeemed Within One Year of Purchase | Excluding sales charges | | -14.74 | 1.29 | 6.48 | 2.41 |
| Class I Shares | No Sales Charge | | 1/12/1987 | -13.71 | 2.57 | 7.84 | 0.97 |
| Class R1 Shares | No Sales Charge | | 7/31/2012 | -13.80 | 2.46 | 7.73 | 1.07 |
| Class R2 Shares | No Sales Charge | | 7/31/2012 | -14.01 | 2.21 | 7.47 | 1.32 |
| Class R3 Shares | No Sales Charge | | 2/29/2016 | -14.22 | 1.95 | 5.93 | 1.57 |
| 1. | Effective March 5, 2021, the Fund replaced its subadvisor and modified its principal investment strategies. The performance information in the graph and table from April 1, 2019 through March 5, 2021 reflects that of the Fund's prior subadvisor and principal investment strategies. Performance information shown in this report prior to April 1, 2019 reflects that of a different previous subadvisor to the fund, investment objective and principal investment strategies. |
| 2. | The gross expense ratios presented reflect the Fund’s “Total Annual Fund Operating Expenses” from the most recent Prospectus, as supplemented, and may differ from other expense ratios disclosed in this report. |
| 3. | Prior to June 30, 2020, the maximum initial sales charge was 5.5%, which is reflected in the applicable average annual total return figures shown. |
| 4. | Class B shares are closed to all new purchases as well as additional investments by existing Class B shareholders. |
The footnotes on the next page are an integral part of the table and graph and should be carefully read in conjunction with them.
| Benchmark Performance* | One
Year | Five
Years | Ten
Years |
| Russell 2000® Index1 | -18.54% | 5.56% | 9.93% |
| Morningstar Small Blend Category Average2 | -13.81 | 5.22 | 9.16 |
| * | Returns for indices reflect no deductions for fees, expenses or taxes, except for foreign withholding taxes where applicable. Results assume reinvestment of all dividends and capital gains. An investment cannot be made directly in an index. |
| 1. | The Fund has selected the Russell 2000® Index as its primary benchmark. The Russell 2000® Index measures the performance of the small-cap segment of the U.S. equity universe. It is a subset of the Russell 3000® Index and includes approximately 2,000 of the smallest securities based on a combination of their market cap and current index membership. |
| 2. | The Morningstar Small Blend Category Average is representative of funds that favor U.S. firms at the smaller end of the market-capitalization range. Some aim to own an array of value and growth stocks while others employ a discipline that leads to holdings with valuations and growth rates close to the small-cap averages. Stocks in the bottom 10% of the capitalization of the U.S. equity market are defined as small cap. The blend style is assigned to portfolios where neither growth nor value characteristics predominate. Results are based on average total returns of similar funds with all dividends and capital gain distributions reinvested. |
The footnotes on the preceding page are an integral part of the table and graph and should be carefully read in conjunction with them.
| 6 | MainStay WMC Small Companies Fund |
Cost in Dollars of a $1,000 Investment in MainStay WMC Small Companies Fund (Unaudited)
The example below is intended to describe the fees and expenses borne by shareholders during the six-month period from May 1, 2022 to October 31, 2022, and the impact of those costs on your investment.
Example
As a shareholder of the Fund you incur two types of costs: (1) transaction costs, including exchange fees and sales charges (loads) on purchases (as applicable), and (2) ongoing costs, including management fees, distribution and/or service (12b-1) fees and other Fund expenses (as applicable). This example is intended to help you understand your ongoing costs (in dollars) of investing in the Fund and to compare these costs with the ongoing costs of investing in other mutual funds. The example is based on an investment of $1,000 made at the beginning of the six-month period and held for the entire period from May 1, 2022 to October 31, 2022.
This example illustrates your Fund’s ongoing costs in two ways:
Actual Expenses
The second and third data columns in the table below provide information about actual account values and actual expenses. You may use the information in these columns, together with the amount you invested, to estimate the expenses that you paid during the six months ended October 31, 2022. Simply divide your account value by $1,000 (for example, an
$8,600 account value divided by $1,000 = 8.6), then multiply the result by the number under the heading entitled “Expenses Paid During Period” to estimate the expenses you paid on your account during this period.
Hypothetical Example for Comparison Purposes
The fourth and fifth data columns in the table below provide information about hypothetical account values and hypothetical expenses based on the Fund’s actual expense ratio and an assumed rate of return of 5% per year before expenses, which is not the Fund’s actual return. The hypothetical account values and expenses may not be used to estimate the actual ending account balances or expenses you paid for the six-month period shown. You may use this information to compare the ongoing costs of investing in the Fund with the ongoing costs of investing in other mutual funds. To do so, compare this 5% hypothetical example with the 5% hypothetical examples that appear in the shareholder reports of the other mutual funds.
Please note that the expenses shown in the table are meant to highlight your ongoing costs only and do not reflect any transactional costs, such as exchange fees or sales charges (loads). Therefore, the fourth and fifth data columns of the table are useful in comparing ongoing costs only and will not help you determine the relative total costs of owning different funds. In addition, if these transactional costs were included, your costs would have been higher.
| Share Class | Beginning
Account
Value
5/1/22 | Ending Account
Value (Based
on Actual
Returns and
Expenses)
10/31/22 | Expenses
Paid
During
Period1 | Ending Account
Value (Based
on Hypothetical
5% Annualized
Return and
Actual Expenses)
10/31/22 | Expenses
Paid
During
Period1 | Net Expense
Ratio
During
Period2 |
| Class A Shares | $1,000.00 | $949.20 | $ 6.19 | $1,018.85 | $ 6.41 | 1.26% |
| Investor Class Shares | $1,000.00 | $948.00 | $ 7.46 | $1,017.54 | $ 7.73 | 1.52% |
| Class B Shares | $1,000.00 | $944.30 | $11.12 | $1,013.76 | $11.52 | 2.27% |
| Class C Shares | $1,000.00 | $944.30 | $11.12 | $1,013.76 | $11.52 | 2.27% |
| Class I Shares | $1,000.00 | $950.00 | $ 4.96 | $1,020.11 | $ 5.14 | 1.01% |
| Class R1 Shares | $1,000.00 | $949.60 | $ 5.45 | $1,019.61 | $ 5.65 | 1.11% |
| Class R2 Shares | $1,000.00 | $948.40 | $ 6.68 | $1,018.35 | $ 6.92 | 1.36% |
| Class R3 Shares | $1,000.00 | $947.20 | $ 7.90 | $1,017.09 | $ 8.19 | 1.61% |
| 1. | Expenses are equal to the Fund’s annualized expense ratio of each class multiplied by the average account value over the period, divided by 365 and multiplied by 184 (to reflect the six-month period). The table above represents the actual expenses incurred during the six-month period. In addition to the fees and expenses which the Fund bears directly, it also indirectly bears a pro rata share of the fees and expenses of the underlying funds in which it invests. Such indirect expenses are not included in the above-reported expense figures. |
| 2. | Expenses are equal to the Fund's annualized expense ratio to reflect the six-month period. |
Industry Composition as of October 31, 2022 (Unaudited)
| Banks | 9.3% |
| Biotechnology | 7.8 |
| Software | 6.0 |
| Energy Equipment & Services | 5.9 |
| Thrifts & Mortgage Finance | 5.3 |
| Health Care Equipment & Supplies | 4.5 |
| Chemicals | 4.3 |
| Metals & Mining | 4.2 |
| Exchange–Traded Fund | 3.8 |
| Trading Companies & Distributors | 3.6 |
| Equity Real Estate Investment Trusts | 3.5 |
| Consumer Finance | 3.4 |
| Pharmaceuticals | 2.7 |
| Real Estate Management & Development | 2.7 |
| Marine | 2.3 |
| Health Care Providers & Services | 2.2 |
| Professional Services | 2.2 |
| Building Products | 2.1 |
| Gas Utilities | 2.1 |
| Household Durables | 1.8% |
| Auto Components | 1.7 |
| Hotels, Restaurants & Leisure | 1.7 |
| Specialty Retail | 1.6 |
| Semiconductors & Semiconductor Equipment | 1.6 |
| Electronic Equipment, Instruments & Components | 1.6 |
| Food Products | 1.5 |
| Commercial Services & Supplies | 1.4 |
| Construction & Engineering | 1.4 |
| IT Services | 1.4 |
| Media | 1.3 |
| Capital Markets | 1.1 |
| Technology Hardware, Storage & Peripherals | 1.0 |
| Airlines | 0.9 |
| Life Sciences Tools & Services | 0.7 |
| Short–Term Investments | 5.1 |
| Other Assets, Less Liabilities | –3.7 |
| | 100.0% |
See Portfolio of Investments beginning on page 10 for specific holdings within these categories. The Fund's holdings are subject to change.
Top Ten Holdings and/or Issuers Held as of October 31, 2022 (excluding short-term investments) (Unaudited)
| 1. | iShares Russell 2000 ETF |
| 2. | Nabors Industries Ltd. |
| 3. | Kirby Corp. |
| 4. | AMN Healthcare Services, Inc. |
| 5. | Insperity, Inc. |
| 6. | New Jersey Resources Corp. |
| 7. | Liberty Energy, Inc., Class A |
| 8. | Enova International, Inc. |
| 9. | Livent Corp. |
| 10. | Lantheus Holdings, Inc. |
| 8 | MainStay WMC Small Companies Fund |
Portfolio Management Discussion and Analysis (Unaudited)
Questions answered by portfolio manager Peter W. Carpi, CFA, of Wellington Management Company LLP, the Fund’s Subadvisor.
How did MainStay WMC Small Companies Fund perform relative to its benchmark and peer group during the 12 months ended October 31, 2022?
For the 12 months ended October 31, 2022, Class I shares of MainStay WMC Small Companies Fund returned −13.71%, outperforming the −18.54% return of the Fund’s benchmark, the Russell 2000® Index (the “Index”). Over the same period, Class I shares also outperformed the −13.81% return of the Morningstar Small Blend Category Average.1
What factors affected the Fund’s relative performance during the reporting period?
The Fund outperformed the Index due primarily to positive security selection. Sector allocation, a result of our bottom-up stock selection process, did not have a meaningful impact on relative returns. The Fund’s underweight exposure to communication services aided returns, but this was partially offset by an underweight to energy.
During the reporting period, which sectors were the strongest positive contributors to the Fund’s relative performance and which sectors were particularly weak?
During the reporting period, the strongest contributions to the Fund’s performance relative to the Index came from stock selection in the health care, industrials and materials sectors. (Contributions take weightings and total returns into account.) Conversely, the energy, real estate and consumer staples sectors detracted most significantly from relative returns.
During the reporting period, which individual stocks made the strongest positive contributions to the Fund’s absolute performance and which stocks detracted the most?
The stocks making the strongest contributions to the Fund’s absolute performance included Lantheus Holdings and Myovant Sciences. Shares of Lantheus, a producer of diagnostic and therapeutic products enhanced by artificial intelligence, rose after the company reported impressive first quarter 2022 results. Strong revenue growth was led by sales of prostate cancer imaging agent Plyarify and its U.S. Food and Drug Administration (FDA)-approved artificial intelligence software, Plyarify AI. Management also raised 2022 revenue guidance. Shares of biotechnology company Myovant Sciences traded higher after the company reported solid fiscal first quarter 2022 results, driven by key drugs Orgovyx and Myfembree. In August, the FDA granted Myovant Sciences, and its partner Pfizer, approval for Myfembree, a once-daily treatment to manage moderate-to-severe pain linked
with endometriosis in premenopausal women. Both positions were still held in the Fund at the end of the reporting period.
The most significant detractors from absolute performance were Codexis and FARO Technologies. Shares in Codexis, a California based protein engineering company that develops enzymes for pharmaceutical, food and medical applications, declined after the company announced underwhelming financial results and management lowered full-year 2022 revenue guidance. The guidance revision was prompted by lower-than-expected product revenues from Pfizer and lower-than-anticipated research & development revenue from new partnerships. Shares in FARO, a global leader in 3D measurement and imaging solutions, fell when first quarter 2022 revenues came in below market expectations due to logistic headwinds in China. Management also provided lower guidance, citing ongoing supply-chain shortages. Both positions were still held in the Fund at the end of the reporting period.
What were some of the Fund’s largest purchases and sales during the reporting period?
During the reporting period, the Fund initiated positions in LL Flooring, a hardwood floor and exotic wood products retailer, and Century Communities, a home building and construction company. During the same period, the Fund eliminated its positions in Veritone, an artificial intelligence technology and services provider, and Gentherm, a thermal management technology company.
How did the Fund’s sector weightings change during the reporting period?
The Fund seeks to keep sector and industry exposures close to those of the Index so that stock selection drives returns. Accordingly, changes in sector and industry exposures tend to be modest. The largest increases in active weight during the reporting period were in the health care, materials and energy sectors, while the largest decrease was in the industrials sector.
How was the Fund positioned at the end of the reporting period?
As of October 31, 2022, the Fund’s largest overweight exposures relative to the Index were in the materials and financials sectors. As of the same date, the Fund’s most significantly underweight exposures were in the consumer discretionary and consumer staples sectors.
| 1. | See page 5 for other share class returns, which may be higher or lower than Class I share returns. See page 6 for more information on benchmark and peer group returns. |
The opinions expressed are those of the portfolio manager as of the date of this report and are subject to change. There is no guarantee that any forecasts will come to pass. This material does not constitute investment advice and is not intended as an endorsement of any specific investment.
Portfolio of Investments October 31, 2022†
| | Shares | Value |
| Common Stocks 94.6% |
| Airlines 0.9% |
| Sun Country Airlines Holdings, Inc. (a) | 187,625 | $ 3,054,535 |
| Auto Components 1.7% |
| Dana, Inc. | 353,191 | 5,636,928 |
| Banks 9.3% |
| Banner Corp. | 52,953 | 3,958,237 |
| First Foundation, Inc. | 129,858 | 2,072,534 |
| OFG Bancorp | 150,063 | 4,183,756 |
| Old National Bancorp | 291,553 | 5,702,777 |
| Stellar Bancorp, Inc. | 152,939 | 5,022,517 |
| United Community Banks, Inc. | 135,999 | 5,235,961 |
| Veritex Holdings, Inc. | 140,071 | 4,423,442 |
| | | 30,599,224 |
| Biotechnology 7.8% |
| ACADIA Pharmaceuticals, Inc. (a) | 221,830 | 3,555,935 |
| Celldex Therapeutics, Inc. (a) | 129,143 | 4,536,793 |
| Cytokinetics, Inc. (a) | 67,655 | 2,953,817 |
| Iovance Biotherapeutics, Inc. (a) | 230,286 | 2,150,871 |
| Kymera Therapeutics, Inc. (a) | 138,276 | 4,195,294 |
| Myovant Sciences Ltd. (a) | 182,301 | 4,874,729 |
| Sage Therapeutics, Inc. (a) | 87,210 | 3,284,329 |
| | | 25,551,768 |
| Building Products 2.1% |
| Apogee Enterprises, Inc. | 96,473 | 4,426,181 |
| Insteel Industries, Inc. | 97,982 | 2,581,826 |
| | | 7,008,007 |
| Capital Markets 1.1% |
| Hamilton Lane, Inc., Class A | 58,144 | 3,478,174 |
| Chemicals 4.3% |
| Livent Corp. (a) | 199,725 | 6,305,318 |
| Minerals Technologies, Inc. | 53,564 | 2,946,556 |
| Quaker Chemical Corp. | 29,144 | 4,739,980 |
| | | 13,991,854 |
| Commercial Services & Supplies 1.4% |
| Interface, Inc. | 412,577 | 4,666,246 |
| Construction & Engineering 1.4% |
| Badger Infrastructure Solutions Ltd. | 220,555 | 4,659,282 |
| | Shares | Value |
| |
| Consumer Finance 3.4% |
| Enova International, Inc. (a) | 178,036 | $ 6,674,570 |
| PRA Group, Inc. (a) | 134,308 | 4,499,318 |
| | | 11,173,888 |
| Electronic Equipment, Instruments & Components 1.6% |
| FARO Technologies, Inc. (a) | 173,456 | 5,066,650 |
| Energy Equipment & Services 5.7% |
| Liberty Energy, Inc., Class A (a) | 408,570 | 6,908,919 |
| Nabors Industries Ltd. (a) | 40,632 | 7,071,187 |
| Patterson-UTI Energy, Inc. | 270,229 | 4,769,542 |
| | | 18,749,648 |
| Equity Real Estate Investment Trusts 3.5% |
| Piedmont Office Realty Trust, Inc., Class A | 321,646 | 3,361,201 |
| Uniti Group, Inc. | 635,485 | 4,931,363 |
| Veris Residential, Inc. (a) | 205,894 | 3,259,302 |
| | | 11,551,866 |
| Food Products 1.5% |
| Calavo Growers, Inc. | 145,783 | 5,042,634 |
| Gas Utilities 2.1% |
| New Jersey Resources Corp. | 156,647 | 6,992,722 |
| Health Care Equipment & Supplies 4.5% |
| Artivion, Inc. (a) | 301,883 | 3,369,014 |
| Lantheus Holdings, Inc. (a) | 84,855 | 6,278,422 |
| SI-BONE, Inc. (a) | 264,712 | 5,146,001 |
| | | 14,793,437 |
| Health Care Providers & Services 2.2% |
| AMN Healthcare Services, Inc. (a) | 57,904 | 7,266,952 |
| Hotels, Restaurants & Leisure 1.7% |
| Hilton Grand Vacations, Inc. (a) | 141,464 | 5,551,047 |
| Household Durables 1.8% |
| Skyline Champion Corp. (a) | 100,962 | 5,876,998 |
| IT Services 1.4% |
| I3 Verticals, Inc., Class A (a) | 212,215 | 4,617,798 |
| Life Sciences Tools & Services 0.7% |
| Codexis, Inc. (a) | 426,876 | 2,399,043 |
The notes to the financial statements are an integral part of, and should be read in conjunction with, the financial statements.
| 10 | MainStay WMC Small Companies Fund |
| | Shares | Value |
| Common Stocks (continued) |
| Marine 2.3% |
| Kirby Corp. (a) | 105,828 | $ 7,381,503 |
| Media 1.3% |
| Magnite, Inc. (a) | 569,991 | 4,155,234 |
| Metals & Mining 4.2% |
| Carpenter Technology Corp. | 133,319 | 4,986,130 |
| Materion Corp. | 55,425 | 4,750,477 |
| MP Materials Corp. (a) | 134,516 | 4,040,861 |
| | | 13,777,468 |
| Pharmaceuticals 2.7% |
| Aclaris Therapeutics, Inc. (a) | 188,700 | 2,945,607 |
| Arvinas, Inc. (a) | 60,330 | 2,999,004 |
| Pacira BioSciences, Inc. (a) | 58,560 | 3,031,066 |
| | | 8,975,677 |
| Professional Services 2.2% |
| Insperity, Inc. | 59,406 | 7,011,096 |
| Real Estate Management & Development 2.7% |
| Marcus & Millichap, Inc. | 134,048 | 4,938,328 |
| Tricon Residential, Inc. | 450,685 | 3,799,275 |
| | | 8,737,603 |
| Semiconductors & Semiconductor Equipment 1.6% |
| Tower Semiconductor Ltd. (a) | 122,325 | 5,230,617 |
| Software 6.0% |
| Agilysys, Inc. (a) | 92,960 | 5,965,243 |
| Box, Inc., Class A (a) | 164,622 | 4,782,269 |
| Cerence, Inc. (a) | 181,367 | 3,119,513 |
| Consensus Cloud Solutions, Inc. (a) | 99,921 | 5,609,565 |
| | | 19,476,590 |
| Specialty Retail 1.6% |
| Monro, Inc. | 111,370 | 5,317,918 |
| Technology Hardware, Storage & Peripherals 1.0% |
| Stratasys Ltd. (a) | 229,037 | 3,314,165 |
| Thrifts & Mortgage Finance 5.3% |
| Federal Agricultural Mortgage Corp., Class C | 38,589 | 4,445,453 |
| MGIC Investment Corp. | 330,871 | 4,516,389 |
| NMI Holdings, Inc., Class A (a) | 222,246 | 4,873,855 |
| | Shares | | Value |
| |
| Thrifts & Mortgage Finance (continued) |
| WSFS Financial Corp. | 75,357 | | $ 3,508,622 |
| | | | 17,344,319 |
| Trading Companies & Distributors 3.6% |
| Boise Cascade Co. | 87,717 | | 5,856,864 |
| MRC Global, Inc. (a) | 582,781 | | 5,845,294 |
| | | | 11,702,158 |
Total Common Stocks
(Cost $331,545,206) | | | 310,153,049 |
| Exchange-Traded Fund 3.8% |
| iShares Russell 2000 ETF (b) | 68,774 | | 12,608,337 |
Total Exchange-Traded Fund
(Cost $12,263,300) | | | 12,608,337 |
| |
| | Number of
Warrants | | |
| Warrants 0.2% |
| Energy Equipment & Services 0.2% |
| Nabors Industries Ltd. | | | |
| Expires 6/11/26 (a) | 20,384 | | 551,795 |
Total Warrants
(Cost $5,002) | | | 551,795 |
| |
| | Shares | | |
| Short-Term Investments 5.1% |
| Affiliated Investment Company 1.2% |
| MainStay U.S. Government Liquidity Fund, 2.905% (c) | 4,059,082 | | 4,059,082 |
| Unaffiliated Investment Companies 3.9% |
| Invesco Government & Agency Portfolio, 3.163% (c)(d) | 10,860,619 | | 10,860,619 |
| State Street Institutional U.S. Government Money Market Fund, 3.064% (c)(d) | 2,000,000 | | 2,000,000 |
Total Unaffiliated Investment Companies
(Cost $12,860,619) | | | 12,860,619 |
Total Short-Term Investments
(Cost $16,919,701) | | | 16,919,701 |
Total Investments
(Cost $360,733,209) | 103.7% | | 340,232,882 |
| Other Assets, Less Liabilities | (3.7) | | (12,233,055) |
| Net Assets | 100.0% | | $ 327,999,827 |
The notes to the financial statements are an integral part of, and should be read in conjunction with, the financial statements.
11
Portfolio of Investments October 31, 2022† (continued)
| † | Percentages indicated are based on Fund net assets. |
| (a) | Non-income producing security. |
| (b) | All or a portion of this security was held on loan. As of October 31, 2022, the aggregate market value of securities on loan was $12,608,154. The Fund received cash collateral with a value of $12,860,619. (See Note 2(G)) |
| (c) | Current yield as of October 31, 2022. |
| (d) | Represents a security purchased with cash collateral received for securities on loan. |
Investments in Affiliates (in 000's)
Investments in issuers considered to be affiliate(s) of the Fund during the year ended October 31, 2022 for purposes of Section 2(a)(3) of the Investment Company Act of 1940, as amended, were as follows:
| Affiliated Investment Companies | Value,
Beginning
of Year | Purchases
at Cost | Proceeds
from
Sales | Net
Realized
Gain/(Loss)
on Sales | Change in
Unrealized
Appreciation/
(Depreciation) | Value,
End of
Year | Dividend
Income | Other
Distributions | Shares
End of
Year |
| MainStay U.S. Government Liquidity Fund | $ 15,834 | $ 97,019 | $ (108,794) | $ — | $ — | $ 4,059 | $ 19 | $ — | 4,059 |
| Abbreviation(s): |
| ETF—Exchange-Traded Fund |
The following is a summary of the fair valuations according to the inputs used as of October 31, 2022, for valuing the Fund’s assets:
| Description | Quoted
Prices in
Active
Markets for
Identical
Assets
(Level 1) | | Significant
Other
Observable
Inputs
(Level 2) | | Significant
Unobservable
Inputs
(Level 3) | | Total |
| Asset Valuation Inputs | | | | | | | |
| Investments in Securities (a) | | | | | | | |
| Common Stocks | $ 310,153,049 | | $ — | | $ — | | $ 310,153,049 |
| Exchange-Traded Fund | 12,608,337 | | — | | — | | 12,608,337 |
| Warrants | 551,795 | | — | | — | | 551,795 |
| Short-Term Investments | | | | | | | |
| Affiliated Investment Company | 4,059,082 | | — | | — | | 4,059,082 |
| Unaffiliated Investment Companies | 12,860,619 | | — | | — | | 12,860,619 |
| Total Short-Term Investments | 16,919,701 | | — | | — | | 16,919,701 |
| Total Investments in Securities | $ 340,232,882 | | $ — | | $ — | | $ 340,232,882 |
| (a) | For a complete listing of investments and their industries, see the Portfolio of Investments. |
The notes to the financial statements are an integral part of, and should be read in conjunction with, the financial statements.
| 12 | MainStay WMC Small Companies Fund |
Statement of Assets and Liabilities as of October 31, 2022
| Assets |
Investment in unaffiliated securities, at value
(identified cost $356,674,127) including securities on loan of $12,608,154 | $336,173,800 |
Investment in affiliated investment companies, at value
(identified cost $4,059,082) | 4,059,082 |
| Cash | 32,436 |
| Receivables: | |
| Investment securities sold | 2,145,735 |
| Dividends | 78,935 |
| Fund shares sold | 76,164 |
| Securities lending | 3,466 |
| Other assets | 36,755 |
| Total assets | 342,606,373 |
| Liabilities |
| Cash collateral received for securities on loan | 12,860,619 |
| Payables: | |
| Investment securities purchased | 1,288,187 |
| Manager (See Note 3) | 205,339 |
| Transfer agent (See Note 3) | 80,262 |
| Fund shares redeemed | 57,347 |
| Shareholder communication | 55,664 |
| NYLIFE Distributors (See Note 3) | 37,823 |
| Professional fees | 10,696 |
| Custodian | 9,375 |
| Accrued expenses | 1,234 |
| Total liabilities | 14,606,546 |
| Net assets | $327,999,827 |
| Composition of Net Assets |
| Shares of beneficial interest outstanding (par value of $.001 per share) unlimited number of shares authorized | $ 15,157 |
| Additional paid-in-capital | 369,392,792 |
| | 369,407,949 |
| Total distributable earnings (loss) | (41,408,122) |
| Net assets | $327,999,827 |
| Class A | |
| Net assets applicable to outstanding shares | $135,890,384 |
| Shares of beneficial interest outstanding | 6,373,947 |
| Net asset value per share outstanding | $ 21.32 |
| Maximum sales charge (5.50% of offering price) | 1.24 |
| Maximum offering price per share outstanding | $ 22.56 |
| Investor Class | |
| Net assets applicable to outstanding shares | $ 35,984,823 |
| Shares of beneficial interest outstanding | 1,747,135 |
| Net asset value per share outstanding | $ 20.60 |
| Maximum sales charge (5.00% of offering price) | 1.08 |
| Maximum offering price per share outstanding | $ 21.68 |
| Class B | |
| Net assets applicable to outstanding shares | $ 2,036,214 |
| Shares of beneficial interest outstanding | 123,671 |
| Net asset value and offering price per share outstanding | $ 16.46 |
| Class C | |
| Net assets applicable to outstanding shares | $ 2,415,209 |
| Shares of beneficial interest outstanding | 146,764 |
| Net asset value and offering price per share outstanding | $ 16.46 |
| Class I | |
| Net assets applicable to outstanding shares | $151,034,543 |
| Shares of beneficial interest outstanding | 6,735,062 |
| Net asset value and offering price per share outstanding | $ 22.43 |
| Class R1 | |
| Net assets applicable to outstanding shares | $ 54,864 |
| Shares of beneficial interest outstanding | 2,465 |
| Net asset value and offering price per share outstanding | $ 22.26 |
| Class R2 | |
| Net assets applicable to outstanding shares | $ 107,818 |
| Shares of beneficial interest outstanding | 5,104 |
| Net asset value and offering price per share outstanding | $ 21.12 |
| Class R3 | |
| Net assets applicable to outstanding shares | $ 475,972 |
| Shares of beneficial interest outstanding | 22,857 |
| Net asset value and offering price per share outstanding | $ 20.82 |
The notes to the financial statements are an integral part of, and should be read in conjunction with, the financial statements.
13
Statement of Operations for the year ended October 31, 2022
| Investment Income (Loss) |
| Income | |
| Dividends-unaffiliated (net of foreign tax withholding of $443,203) | $ 9,911,677 |
| Securities lending, net | 93,293 |
| Dividends-affiliated | 18,704 |
| Total income | 10,023,674 |
| Expenses | |
| Manager (See Note 3) | 2,780,978 |
| Distribution/Service—Class A (See Note 3) | 384,215 |
| Distribution/Service—Investor Class (See Note 3) | 99,024 |
| Distribution/Service—Class B (See Note 3) | 28,703 |
| Distribution/Service—Class C (See Note 3) | 31,753 |
| Distribution/Service—Class R2 (See Note 3) | 290 |
| Distribution/Service—Class R3 (See Note 3) | 2,358 |
| Transfer agent (See Note 3) | 450,652 |
| Registration | 105,627 |
| Professional fees | 83,312 |
| Shareholder communication | 10,233 |
| Custodian | 9,507 |
| Trustees | 7,141 |
| Shareholder service (See Note 3) | 646 |
| Miscellaneous | 112,372 |
| Total expenses before waiver/reimbursement | 4,106,811 |
| Expense waiver/reimbursement from Manager (See Note 3) | (38,106) |
| Net expenses | 4,068,705 |
| Net investment income (loss) | 5,954,969 |
| Realized and Unrealized Gain (Loss) |
| Net realized gain (loss) on: | |
| Unaffiliated investment transactions | (26,177,340) |
| Foreign currency transactions | 6,716 |
| Net realized gain (loss) | (26,170,624) |
| Net change in unrealized appreciation (depreciation) on: | |
| Unaffiliated investments | (31,631,370) |
| Translation of other assets and liabilities in foreign currencies | (81) |
| Net change in unrealized appreciation (depreciation) | (31,631,451) |
| Net realized and unrealized gain (loss) | (57,802,075) |
| Net increase (decrease) in net assets resulting from operations | $(51,847,106) |
The notes to the financial statements are an integral part of, and should be read in conjunction with, the financial statements.
| 14 | MainStay WMC Small Companies Fund |
Statements of Changes in Net Assets
for the years ended October 31, 2022 and October 31, 2021
| | 2022 | 2021 |
| Increase (Decrease) in Net Assets |
| Operations: | | |
| Net investment income (loss) | $ 5,954,969 | $ (1,007,002) |
| Net realized gain (loss) | (26,170,624) | 134,212,588 |
| Net change in unrealized appreciation (depreciation) | (31,631,451) | (7,251,538) |
| Net increase (decrease) in net assets resulting from operations | (51,847,106) | 125,954,048 |
| Distributions to shareholders: | | |
| Class A | (42,316,711) | — |
| Investor Class | (11,028,249) | — |
| Class B | (1,147,348) | — |
| Class C | (1,158,831) | — |
| Class I | (37,368,289) | — |
| Class R1 | (14,689) | — |
| Class R2 | (30,236) | — |
| Class R3 | (118,773) | — |
| Total distributions to shareholders | (93,183,126) | — |
| Capital share transactions: | | |
| Net proceeds from sales of shares | 51,298,006 | 67,294,645 |
| Net asset value of shares issued to shareholders in reinvestment of distributions | 91,619,894 | — |
| Cost of shares redeemed | (71,828,689) | (83,496,240) |
| Increase (decrease) in net assets derived from capital share transactions | 71,089,211 | (16,201,595) |
| Net increase (decrease) in net assets | (73,941,021) | 109,752,453 |
| Net Assets |
| Beginning of year | 401,940,848 | 292,188,395 |
| End of year | $327,999,827 | $401,940,848 |
The notes to the financial statements are an integral part of, and should be read in conjunction with, the financial statements.
15
Financial Highlights selected per share data and ratios
| | Year Ended October 31, |
| Class A | 2022 | | 2021 | | 2020 | | 2019 | | 2018 |
| Net asset value at beginning of year | $ 32.63 | | $ 22.62 | | $ 24.59 | | $ 28.34 | | $ 31.91 |
| Net investment income (loss) (a) | 0.39 | | (0.10) | | (0.07) | | 0.07 | | 0.06 |
| Net realized and unrealized gain (loss) | (3.93) | | 10.11 | | (1.83) | | 0.24 | | (0.98) |
| Total from investment operations | (3.54) | | 10.01 | | (1.90) | | 0.31 | | (0.92) |
| Less distributions: | | | | | | | | | |
| From net investment income | — | | — | | (0.05) | | (0.05) | | — |
| From net realized gain on investments | (7.77) | | — | | — | | (4.01) | | (2.65) |
| Return of capital | — | | — | | (0.02) | | — | | — |
| Total distributions | (7.77) | | — | | (0.07) | | (4.06) | | (2.65) |
| Net asset value at end of year | $ 21.32 | | $ 32.63 | | $ 22.62 | | $ 24.59 | | $ 28.34 |
| Total investment return (b) | (13.90)% | | 44.25% | | (7.76)% | | 1.41% | | (3.48)% |
| Ratios (to average net assets)/Supplemental Data: | | | | | | | | | |
| Net investment income (loss) | 1.69% | | (0.32)% | | (0.30)% | | 0.27% | | 0.19% |
| Net expenses (c) | 1.23% | | 1.21% | | 1.25% | | 1.25% | | 1.23% |
| Expenses (before waiver/reimbursement) | 1.23%(c) | | 1.22%(c) | | 1.25% | | 1.25% | | 1.23% |
| Portfolio turnover rate | 75% | | 108% | | 208% | | 205% | | 92% |
| Net assets at end of year (in 000’s) | $ 135,890 | | $ 178,454 | | $ 115,403 | | $ 141,548 | | $ 155,636 |
| (a) | Per share data based on average shares outstanding during the year. |
| (b) | Total investment return is calculated exclusive of sales charges and assumes the reinvestment of dividends and distributions. For periods of less than one year, total return is not annualized. |
| (c) | In addition to the fees and expenses which the Fund bears directly, it also indirectly bears a pro-rata share of the fees and expenses of the underlying funds in which it invests. Such indirect expenses are not included in the above expense ratios. |
| | Year Ended October 31, |
| Investor Class | 2022 | | 2021 | | 2020 | | 2019 | | 2018 |
| Net asset value at beginning of year | $ 31.86 | | $ 22.14 | | $ 24.07 | | $ 27.85 | | $ 31.48 |
| Net investment income (loss) (a) | 0.32 | | (0.17) | | (0.13) | | (0.01) | | (0.02) |
| Net realized and unrealized gain (loss) | (3.81) | | 9.89 | | (1.80) | | 0.24 | | (0.96) |
| Total from investment operations | (3.49) | | 9.72 | | (1.93) | | 0.23 | | (0.98) |
| Less distributions: | | | | | | | | | |
| From net investment income | — | | — | | (0.00)‡ | | — | | — |
| From net realized gain on investments | (7.77) | | — | | — | | (4.01) | | (2.65) |
| Return of capital | — | | — | | (0.00)‡ | | — | | — |
| Total distributions | (7.77) | | — | | (0.00)‡ | | (4.01) | | (2.65) |
| Net asset value at end of year | $ 20.60 | | $ 31.86 | | $ 22.14 | | $ 24.07 | | $ 27.85 |
| Total investment return (b) | (14.13)% | | 43.90% | | (8.02)% | | 1.09% | | (3.74)% |
| Ratios (to average net assets)/Supplemental Data: | | | | | | | | | |
| Net investment income (loss) | 1.43% | | (0.57)% | | (0.57)% | | (0.05)% | | (0.06)% |
| Net expenses (c) | 1.50% | | 1.49% | | 1.52% | | 1.55% | | 1.49% |
| Expenses (before waiver/reimbursement) (c) | 1.58% | | 1.66% | | 1.70% | | 1.64% | | 1.56% |
| Portfolio turnover rate | 75% | | 108% | | 208% | | 205% | | 92% |
| Net assets at end of year (in 000's) | $ 35,985 | | $ 45,382 | | $ 41,547 | | $ 49,342 | | $ 48,569 |
| ‡ | Less than one cent per share. |
| (a) | Per share data based on average shares outstanding during the year. |
| (b) | Total investment return is calculated exclusive of sales charges and assumes the reinvestment of dividends and distributions. For periods of less than one year, total return is not annualized. |
| (c) | In addition to the fees and expenses which the Fund bears directly, it also indirectly bears a pro-rata share of the fees and expenses of the underlying funds in which it invests. Such indirect expenses are not included in the above expense ratios. |
The notes to the financial statements are an integral part of, and should be read in conjunction with, the financial statements.
| 16 | MainStay WMC Small Companies Fund |
Financial Highlights selected per share data and ratios
| | Year Ended October 31, |
| Class B | 2022 | | 2021 | | 2020 | | 2019 | | 2018 |
| Net asset value at beginning of year | $ 27.20 | | $ 19.04 | | $ 20.86 | | $ 24.83 | | $ 28.54 |
| Net investment income (loss) (a) | 0.15 | | (0.34) | | (0.25) | | (0.16) | | (0.22) |
| Net realized and unrealized gain (loss) | (3.12) | | 8.50 | | (1.57) | | 0.20 | | (0.84) |
| Total from investment operations | (2.97) | | 8.16 | | (1.82) | | 0.04 | | (1.06) |
| Less distributions: | | | | | | | | | |
| From net realized gain on investments | (7.77) | | — | | — | | (4.01) | | (2.65) |
| Net asset value at end of year | $ 16.46 | | $ 27.20 | | $ 19.04 | | $ 20.86 | | $ 24.83 |
| Total investment return (b) | (14.81)% | | 42.86% | | (8.72)% | | 0.35% | | (4.46)% |
| Ratios (to average net assets)/Supplemental Data: | | | | | | | | | |
| Net investment income (loss) | 0.88% | | (1.31)% | | (1.30)% | | (0.74)% | | (0.80)% |
| Net expenses (c) | 2.24% | | 2.24% | | 2.27% | | 2.30% | | 2.24% |
| Expenses (before waiver/reimbursement) (c) | 2.33% | | 2.41% | | 2.45% | | 2.39% | | 2.31% |
| Portfolio turnover rate | 75% | | 108% | | 208% | | 205% | | 92% |
| Net assets at end of year (in 000’s) | $ 2,036 | | $ 4,021 | | $ 4,447 | | $ 7,442 | | $ 10,698 |
| (a) | Per share data based on average shares outstanding during the year. |
| (b) | Total investment return is calculated exclusive of sales charges and assumes the reinvestment of dividends and distributions. For periods of less than one year, total return is not annualized. |
| (c) | In addition to the fees and expenses which the Fund bears directly, it also indirectly bears a pro-rata share of the fees and expenses of the underlying funds in which it invests. Such indirect expenses are not included in the above expense ratios. |
| | Year Ended October 31, |
| Class C | 2022 | | 2021 | | 2020 | | 2019 | | 2018 |
| Net asset value at beginning of year | $ 27.19 | | $ 19.03 | | $ 20.84 | | $ 24.81 | | $ 28.52 |
| Net investment income (loss) (a) | 0.15 | | (0.34) | | (0.25) | | (0.13) | | (0.22) |
| Net realized and unrealized gain (loss) | (3.11) | | 8.50 | | (1.56) | | 0.17 | | (0.84) |
| Total from investment operations | (2.96) | | 8.16 | | (1.81) | | 0.04 | | (1.06) |
| Less distributions: | | | | | | | | | |
| From net realized gain on investments | (7.77) | | — | | — | | (4.01) | | (2.65) |
| Net asset value at end of year | $ 16.46 | | $ 27.19 | | $ 19.03 | | $ 20.84 | | $ 24.81 |
| Total investment return (b) | (14.74)% | | 42.88%(c) | | (8.69)% | | 0.35% | | (4.47)% |
| Ratios (to average net assets)/Supplemental Data: | | | | | | | | | |
| Net investment income (loss) | 0.83% | | (1.32)% | | (1.30)% | | (0.60)% | | (0.81)% |
| Net expenses (d) | 2.24% | | 2.24% | | 2.27% | | 2.30% | | 2.24% |
| Expenses (before waiver/reimbursement) (d) | 2.33% | | 2.41% | | 2.45% | | 2.39% | | 2.31% |
| Portfolio turnover rate | 75% | | 108% | | 208% | | 205% | | 92% |
| Net assets at end of year (in 000’s) | $ 2,415 | | $ 4,129 | | $ 3,201 | | $ 5,469 | | $ 14,156 |
| (a) | Per share data based on average shares outstanding during the year. |
| (b) | Total investment return is calculated exclusive of sales charges and assumes the reinvestment of dividends and distributions. For periods of less than one year, total return is not annualized. |
| (c) | Total investment return may reflect adjustments to conform to generally accepted accounting principles. |
| (d) | In addition to the fees and expenses which the Fund bears directly, it also indirectly bears a pro-rata share of the fees and expenses of the underlying funds in which it invests. Such indirect expenses are not included in the above expense ratios. |
The notes to the financial statements are an integral part of, and should be read in conjunction with, the financial statements.
17
Financial Highlights selected per share data and ratios
| | Year Ended October 31, |
| Class I | 2022 | | 2021 | | 2020 | | 2019 | | 2018 |
| Net asset value at beginning of year | $ 33.85 | | $ 23.40 | | $ 25.44 | | $ 29.19 | | $ 32.72 |
| Net investment income (loss) (a) | 0.45 | | (0.02) | | (0.01) | | 0.17 | | 0.14 |
| Net realized and unrealized gain (loss) | (4.10) | | 10.47 | | (1.90) | | 0.22 | | (1.02) |
| Total from investment operations | (3.65) | | 10.45 | | (1.91) | | 0.39 | | (0.88) |
| Less distributions: | | | | | | | | | |
| From net investment income | — | | — | | (0.09) | | (0.13) | | — |
| From net realized gain on investments | (7.77) | | — | | — | | (4.01) | | (2.65) |
| Return of capital | — | | — | | (0.04) | | — | | — |
| Total distributions | (7.77) | | — | | (0.13) | | (4.14) | | (2.65) |
| Net asset value at end of year | $ 22.43 | | $ 33.85 | | $ 23.40 | | $ 25.44 | | $ 29.19 |
| Total investment return (b) | (13.71)% | | 44.66% | | (7.55)% | | 1.67% | | (3.26)% |
| Ratios (to average net assets)/Supplemental Data: | | | | | | | | | |
| Net investment income (loss) | 1.85% | | (0.05)% | | (0.06)% | | 0.66% | | 0.45% |
| Net expenses (c) | 0.98% | | 0.96% | | 1.00% | | 1.00% | | 0.98% |
| Expenses (before waiver/reimbursement) | 0.98%(c) | | 0.97%(c) | | 1.00% | | 1.00% | | 0.98% |
| Portfolio turnover rate | 75% | | 108% | | 208% | | 205% | | 92% |
| Net assets at end of year (in 000’s) | $ 151,035 | | $ 169,281 | | $ 127,115 | | $ 146,525 | | $ 306,746 |
| (a) | Per share data based on average shares outstanding during the year. |
| (b) | Total investment return is calculated exclusive of sales charges and assumes the reinvestment of dividends and distributions. Class I shares are not subject to sales charges. For periods of less than one year, total return is not annualized. |
| (c) | In addition to the fees and expenses which the Fund bears directly, it also indirectly bears a pro-rata share of the fees and expenses of the underlying funds in which it invests. Such indirect expenses are not included in the above expense ratios. |
| | Year Ended October 31, |
| Class R1 | 2022 | | 2021 | | 2020 | | 2019 | | 2018 |
| Net asset value at beginning of year | $ 33.69 | | $ 23.31 | | $ 25.34 | | $ 29.09 | | $ 32.65 |
| Net investment income (loss) (a) | 0.43 | | (0.05) | | (0.04) | | 0.10 | | 0.12 |
| Net realized and unrealized gain (loss) | (4.09) | | 10.43 | | (1.88) | | 0.26 | | (1.03) |
| Total from investment operations | (3.66) | | 10.38 | | (1.92) | | 0.36 | | (0.91) |
| Less distributions: | | | | | | | | | |
| From net investment income | — | | — | | (0.08) | | (0.10) | | — |
| From net realized gain on investments | (7.77) | | — | | — | | (4.01) | | (2.65) |
| Return of capital | — | | — | | (0.03) | | — | | — |
| Total distributions | (7.77) | | — | | (0.11) | | (4.11) | | (2.65) |
| Net asset value at end of year | $ 22.26 | | $ 33.69 | | $ 23.31 | | $ 25.34 | | $ 29.09 |
| Total investment return (b) | (13.80)% | | 44.53%(c) | | (7.62)% | | 1.57% | | (3.36)% |
| Ratios (to average net assets)/Supplemental Data: | | | | | | | | | |
| Net investment income (loss) | 1.77% | | (0.16)% | | (0.18)% | | 0.41% | | 0.38% |
| Net expenses (d) | 1.08% | | 1.06% | | 1.10% | | 1.10% | | 1.08% |
| Expenses (before waiver/reimbursement) | 1.08%(d) | | 1.07%(d) | | 1.10% | | 1.10% | | 1.08% |
| Portfolio turnover rate | 75% | | 108% | | 208% | | 205% | | 92% |
| Net assets at end of year (in 000’s) | $ 55 | | $ 64 | | $ 44 | | $ 65 | | $ 63 |
| (a) | Per share data based on average shares outstanding during the year. |
| (b) | Total investment return is calculated exclusive of sales charges and assumes the reinvestment of dividends and distributions. Class R1 shares are not subject to sales charges. For periods of less than one year, total return is not annualized. |
| (c) | Total investment return may reflect adjustments to conform to generally accepted accounting principles. |
| (d) | In addition to the fees and expenses which the Fund bears directly, it also indirectly bears a pro-rata share of the fees and expenses of the underlying funds in which it invests. Such indirect expenses are not included in the above expense ratios. |
The notes to the financial statements are an integral part of, and should be read in conjunction with, the financial statements.
| 18 | MainStay WMC Small Companies Fund |
Financial Highlights selected per share data and ratios
| | Year Ended October 31, |
| Class R2 | 2022 | | 2021 | | 2020 | | 2019 | | 2018 |
| Net asset value at beginning of year | $ 32.43 | | $ 22.50 | | $ 24.47 | | $ 28.21 | | $ 31.81 |
| Net investment income (loss) (a) | 0.35 | | (0.13) | | (0.09) | | 0.04 | | 0.03 |
| Net realized and unrealized gain (loss) | (3.89) | | 10.06 | | (1.83) | | 0.25 | | (0.98) |
| Total from investment operations | (3.54) | | 9.93 | | (1.92) | | 0.29 | | (0.95) |
| Less distributions: | | | | | | | | | |
| From net investment income | — | | — | | (0.04) | | (0.02) | | — |
| From net realized gain on investments | (7.77) | | — | | — | | (4.01) | | (2.65) |
| Return of capital | — | | — | | (0.01) | | — | | — |
| Total distributions | (7.77) | | — | | (0.05) | | (4.03) | | (2.65) |
| Net asset value at end of year | $ 21.12 | | $ 32.43 | | $ 22.50 | | $ 24.47 | | $ 28.21 |
| Total investment return (b) | (14.01)% | | 44.13% | | (7.84)% | | 1.30% | | (3.59)% |
| Ratios (to average net assets)/Supplemental Data: | | | | | | | | | |
| Net investment income (loss) | 1.51% | | (0.41)% | | (0.40)% | | 0.18% | | 0.09% |
| Net expenses (c) | 1.33% | | 1.31% | | 1.35% | | 1.35% | | 1.33% |
| Expenses (before waiver/reimbursement) | 1.33%(c) | | 1.32%(c) | | 1.35% | | 1.35% | | 1.33% |
| Portfolio turnover rate | 75% | | 108% | | 208% | | 205% | | 92% |
| Net assets at end of year (in 000’s) | $ 108 | | $ 126 | | $ 88 | | $ 111 | | $ 137 |
| (a) | Per share data based on average shares outstanding during the year. |
| (b) | Total investment return is calculated exclusive of sales charges and assumes the reinvestment of dividends and distributions. Class R2 shares are not subject to sales charges. For periods of less than one year, total return is not annualized. |
| (c) | In addition to the fees and expenses which the Fund bears directly, it also indirectly bears a pro-rata share of the fees and expenses of the underlying funds in which it invests. Such indirect expenses are not included in the above expense ratios. |
| | Year Ended October 31, |
| Class R3 | 2022 | | 2021 | | 2020 | | 2019 | | 2018 |
| Net asset value at beginning of year | $ 32.14 | | $ 22.35 | | $ 24.32 | | $ 28.11 | | $ 31.78 |
| Net investment income (loss) (a) | 0.27 | | (0.20) | | (0.15) | | (0.04) | | (0.05) |
| Net realized and unrealized gain (loss) | (3.82) | | 9.99 | | (1.82) | | 0.26 | | (0.97) |
| Total from investment operations | (3.55) | | 9.79 | | (1.97) | | 0.22 | | (1.02) |
| Less distributions: | | | | | | | | | |
| From net realized gain on investments | (7.77) | | — | | — | | (4.01) | | (2.65) |
| Net asset value at end of year | $ 20.82 | | $ 32.14 | | $ 22.35 | | $ 24.32 | | $ 28.11 |
| Total investment return (b) | (14.22)% | | 43.80% | | (8.10)% | | 1.04% | | (3.83)% |
| Ratios (to average net assets)/Supplemental Data: | | | | | | | | | |
| Net investment income (loss) | 1.19% | | (0.66)% | | (0.67)% | | (0.15)% | | (0.15)% |
| Net expenses (c) | 1.58% | | 1.56% | | 1.60% | | 1.60% | | 1.58% |
| Expenses (before waiver/reimbursement) | 1.58%(c) | | 1.57%(c) | | 1.60% | | 1.60% | | 1.58% |
| Portfolio turnover rate | 75% | | 108% | | 208% | | 205% | | 92% |
| Net assets at end of year (in 000’s) | $ 476 | | $ 484 | | $ 343 | | $ 342 | | $ 204 |
| (a) | Per share data based on average shares outstanding during the year. |
| (b) | Total investment return is calculated exclusive of sales charges and assumes the reinvestment of dividends and distributions. Class R3 shares are not subject to sales charges. For periods of less than one year, total return is not annualized. |
| (c) | In addition to the fees and expenses which the Fund bears directly, it also indirectly bears a pro-rata share of the fees and expenses of the underlying funds in which it invests. Such indirect expenses are not included in the above expense ratios. |
The notes to the financial statements are an integral part of, and should be read in conjunction with, the financial statements.
19
Notes to Financial Statements
Note 1-Organization and Business
MainStay Funds Trust (the “Trust”) was organized as a Delaware statutory trust on April 28, 2009. The Trust is registered under the Investment Company Act of 1940, as amended (the “1940 Act”), as an open-end management investment company, and is comprised of thirty-three funds (collectively referred to as the “Funds”). These financial statements and notes relate to the MainStay WMC Small Companies Fund (the "Fund"), a “diversified” fund, as that term is defined in the 1940 Act, as interpreted or modified by regulatory authorities having jurisdiction, from time to time.
The following table lists the Fund's share classes that have been registered and commenced operations:
| Class | Commenced Operations |
| Class A | January 2, 2004 |
| Investor Class | February 28, 2008 |
| Class B | January 2, 2004 |
| Class C | December 30, 2002 |
| Class I | January 12, 1987 |
| Class R1 | July 31, 2012 |
| Class R2 | July 31, 2012 |
| Class R3 | February 29, 2016 |
| Class R6 | N/A* |
| SIMPLE Class | N/A* |
| * | Class R6 shares were registered for sale effective as of February 28, 2017 and SIMPLE Class shares were registered for sale effective as of August 31, 2020 but have not yet commenced operations. |
Class B shares of the MainStay Group of Funds are closed to all new purchases as well as additional investments by existing Class B shareholders. Existing Class B shareholders may continue to reinvest dividends and capital gains distributions, as well as exchange their Class B shares for Class B shares of other funds in the MainStay Group of Funds as permitted by the current exchange privileges. Class B shareholders continue to be subject to any applicable contingent deferred sales charge ("CDSC") at the time of redemption. All other features of the Class B shares, including but not limited to the fees and expenses applicable to Class B shares, remain unchanged. Unless redeemed, Class B shareholders will remain in Class B shares of their respective fund until the Class B shares are converted to Class A or Investor Class shares pursuant to the applicable conversion schedule.
Class A and Investor Class shares are offered at net asset value (“NAV”) per share plus an initial sales charge. No initial sales charge applies to investments of $1 million or more (and certain other qualified purchases) in Class A and Investor Class shares. However, a CDSC of 1.00% may be imposed on certain redemptions made within 18 months of the date of purchase on shares that were purchased without an initial sales charge. Class C shares are offered at NAV without an initial sales charge, although a 1.00% CDSC may be imposed on certain redemptions of such shares made within one year of the date of purchase of Class C shares. When Class B shares were offered, they were offered at NAV without an initial sales charge, although a CDSC that declines depending on the
number of years a shareholder held its Class B shares may be imposed on certain redemptions of such shares made within six years of the date of purchase of such shares. Class I, Class R1, Class R2 and Class R3 shares are offered at NAV without a sales charge. Class R6 and SIMPLE Class shares are expected to be offered at NAV without a sales charge if such shares are offered in the future. Depending upon eligibility, Class B shares convert to either Class A or Investor Class shares at the end of the calendar quarter eight years after the date they were purchased. In addition, depending upon eligibility, Class C shares convert to either Class A or Investor Class shares at the end of the calendar quarter eight years after the date they were purchased. Additionally, Investor Class shares may convert automatically to Class A shares. Under certain circumstances and as may be permitted by the Trust’s multiple class plan pursuant to Rule 18f-3 under the 1940 Act, specified share classes of the Fund may be converted to one or more other share classes of the Fund as disclosed in the capital share transactions within these Notes. The classes of shares have the same voting (except for issues that relate solely to one class), dividend, liquidation and other rights, and the same terms and conditions, except that under distribution plans pursuant to Rule 12b-1 under the 1940 Act, Class B and Class C shares are subject to higher distribution and/or service fees than Class A, Investor Class, Class R2, Class R3 and SIMPLE Class shares. Class I, Class R1 and Class R6 shares are not subject to a distribution and/or service fee. Class R1, Class R2 and Class R3 shares are subject to a shareholder service fee, which is in addition to fees paid under the distribution plans for Class R2 and Class R3 shares.
The Fund's investment objective is to seek long-term growth of capital.
Note 2–Significant Accounting Policies
The Fund is an investment company and accordingly follows the investment company accounting and reporting guidance of the Financial Accounting Standards Board (“FASB”) Accounting Standards Codification Topic 946 Financial Services—Investment Companies. The Fund prepares its financial statements in accordance with generally accepted accounting principles (“GAAP”) in the United States of America and follows the significant accounting policies described below.
(A) Securities Valuation. Investments are usually valued as of the close of regular trading on the New York Stock Exchange (the "Exchange") (usually 4:00 p.m. Eastern time) on each day the Fund is open for business ("valuation date").
Effective September 8, 2022, and pursuant to Rule 2a-5 under the 1940 Act, the Board of Trustees of the Trust (the "Board") designated New York Life Investment Management LLC (“New York Life Investments” or the "Manager") as its Valuation Designee (the "Valuation Designee"). The Valuation Designee is responsible for performing fair valuations relating to all investments in the Fund’s portfolio for which market quotations are not readily available; periodically assessing and managing material valuation risks; establishing and applying fair value methodologies; testing fair valuation methodologies; evaluating and overseeing pricing services; segregation of valuation and portfolio management functions; providing
| 20 | MainStay WMC Small Companies Fund |
quarterly, annual and prompt reporting to the Board, as appropriate; identifying potential conflicts of interest; and maintaining appropriate records. The Valuation Designee has established a valuation committee ("Valuation Committee") to assist in carrying out the Valuation Designee’s responsibilities and establish prices of securities for which market quotations are not readily available. The Fund’s and the Valuation Designee's policies and procedures ("Valuation Procedures") govern the Valuation Designee’s selection and application of methodologies for determining and calculating the fair value of Fund investments. The Valuation Designee may value Fund portfolio securities for which market quotations are not readily available and other Fund assets utilizing inputs from pricing services and other third-party sources (together, “Pricing Sources”). The Valuation Committee meets (in person, via electronic mail or via teleconference) on an ad-hoc basis to determine fair valuations and on a quarterly basis to review fair value events (excluding fair valuations from pricing services), including valuation risks and back-testing results, and preview reports to the Board.
The Valuation Committee establishes prices of securities for which market quotations are not readily available based on such methodologies and measurements on a regular basis after considering information that is reasonably available and deemed relevant by the Valuation Committee. The Board shall oversee the Valuation Designee and review fair valuation materials on a prompt, quarterly and annual basis and approve proposed revisions to the Valuation Procedures.
Investments for which market quotations are not readily available are valued at fair value as determined in good faith pursuant to the Valuation Procedures. A market quotation is readily available only when that quotation is a quoted price (unadjusted) in active markets for identical investments that the Fund can access at the measurement date, provided that a quotation will not be readily available if it is not reliable. Fair value measurements are determined within a framework that establishes a three-tier hierarchy that maximizes the use of observable market data and minimizes the use of unobservable inputs to establish a classification of fair value measurements for disclosure purposes. "Inputs" refer broadly to the assumptions that market participants would use in pricing the asset or liability, including assumptions about risk, such as the risk inherent in a particular valuation technique used to measure fair value using a pricing model and/or the risk inherent in the inputs for the valuation technique. Inputs may be observable or unobservable. Observable inputs reflect the assumptions market participants would use in pricing the asset or liability based on market data obtained from sources independent of the Fund. Unobservable inputs reflect the Fund’s own assumptions about the assumptions market participants would use in pricing the asset or liability based on the information available. The inputs or methodology used for valuing assets or liabilities may not be an indication of the risks associated with investing in those assets or liabilities. The three-tier hierarchy of inputs is summarized below.
| • | Level 1—quoted prices (unadjusted) in active markets for an identical asset or liability |
| • | Level 2—other significant observable inputs (including quoted prices for a similar asset or liability in active markets, interest rates and yield curves, prepayment speeds, credit risk, etc.) |
| • | Level 3—significant unobservable inputs (including the Fund's own assumptions about the assumptions that market participants would use in measuring fair value of an asset or liability) |
The level of an asset or liability within the fair value hierarchy is based on the lowest level of an input, both individually and in the aggregate, that is significant to the fair value measurement. The aggregate value by input level of the Fund’s assets and liabilities as of October 31, 2022, is included at the end of the Portfolio of Investments.
The Fund may use third-party vendor evaluations, whose prices may be derived from one or more of the following standard inputs, among others:
| • Broker/dealer quotes | • Benchmark securities |
| • Two-sided markets | • Reference data (corporate actions or material event notices) |
| • Bids/offers | • Monthly payment information |
| • Industry and economic events | • Reported trades |
An asset or liability for which a market quotation is not readily available is valued by methods deemed reasonable in good faith by the Valuation Committee, following the Valuation Procedures to represent fair value. Under these procedures, the Valuation Designee generally uses a market-based approach which may use related or comparable assets or liabilities, recent transactions, market multiples, book values and other relevant information. The Valuation Designee may also use an income-based valuation approach in which the anticipated future cash flows of the asset or liability are discounted to calculate fair value. Discounts may also be applied due to the nature and/or duration of any restrictions on the disposition of the asset or liability. Fair value represents a good faith approximation of the value of a security. Fair value determinations involve the consideration of a number of subjective factors, an analysis of applicable facts and circumstances and the exercise of judgment. As a result, it is possible that the fair value for a security determined in good faith in accordance with the Valuation Procedures may differ from valuations for the same security determined for other funds using their own valuation procedures. Although the Valuation Procedures are designed to value a security at the price the Fund may reasonably expect to receive upon the security's sale in an orderly transaction, there can be no assurance that any fair value determination thereunder would, in fact, approximate the amount that the Fund would actually realize upon the sale of the security or the price at which the security would trade if a reliable market price were readily available. During the year ended October 31, 2022, there were no material changes to the fair value methodologies.
Securities which may be valued in this manner include, but are not limited to: (i) a security for which trading has been halted or suspended or otherwise does not have a readily available market quotation on a given day; (ii) a debt security that has recently gone into default and for which there is not a current market quotation; (iii) a security of an issuer that
Notes to Financial Statements (continued)
has entered into a restructuring; (iv) a security that has been delisted from a national exchange; (v) a security subject to trading collars for which no or limited trading takes place; and (vi) a security whose principal market has been temporarily closed at a time when, under normal conditions, it would be open. Securities valued in this manner are generally categorized as Level 2 or 3 in the hierarchy.
Equity securities, including exchange-traded funds ("ETFs"), are valued at the last quoted sales prices as of the close of regular trading on the relevant exchange on each valuation date. Securities that are not traded on the valuation date are valued at the mean of the last quoted bid and ask prices. Prices are normally taken from the principal market in which each security trades. These securities are generally categorized as Level 1 in the hierarchy.
Investments in mutual funds, including money market funds, are valued at their respective NAVs at the close of business each day on the valuation date. These securities are generally categorized as Level 1 in the hierarchy.
Temporary cash investments acquired in excess of 60 days to maturity at the time of purchase are valued using the latest bid prices or using valuations based on a matrix system (which considers such factors as security prices, yields, maturities and ratings), both as furnished by independent pricing services. Temporary cash investments that mature in 60 days or less at the time of purchase ("Short-Term Investments") are valued using the amortized cost method of valuation, unless the use of such method would be inappropriate. The amortized cost method involves valuing a security at its cost on the date of purchase and thereafter assuming a constant amortization to maturity of the difference between such cost and the value on maturity date. Amortized cost approximates the current fair value of a security. Securities valued using the amortized cost method are not valued using quoted prices in an active market and are generally categorized as Level 2 in the hierarchy.
The information above is not intended to reflect an exhaustive list of the methodologies that may be used to value portfolio investments. The Valuation Procedures permit the use of a variety of valuation methodologies in connection with valuing portfolio investments. The methodology used for a specific type of investment may vary based on the market data available or other considerations. The methodologies summarized above may not represent the specific means by which portfolio investments are valued on any particular business day.
(B) Income Taxes. The Fund's policy is to comply with the requirements of the Internal Revenue Code of 1986, as amended (the “Internal Revenue Code”), applicable to regulated investment companies and to distribute all of its taxable income to the shareholders of the Fund within the allowable time limits.
The Manager evaluates the Fund’s tax positions to determine if the tax positions taken meet the minimum recognition threshold in connection with accounting for uncertainties in income tax positions taken or expected to be taken for the purposes of measuring and recognizing tax liabilities in the financial statements. Recognition of tax benefits of an
uncertain tax position is permitted only to the extent the position is “more likely than not” to be sustained assuming examination by taxing authorities. The Manager analyzed the Fund's tax positions taken on federal, state and local income tax returns for all open tax years (for up to three tax years) and has concluded that no provisions for federal, state and local income tax are required in the Fund's financial statements. The Fund's federal, state and local income tax and federal excise tax returns for tax years for which the applicable statutes of limitations have not expired are subject to examination by the Internal Revenue Service and state and local departments of revenue.
(C) Dividends and Distributions to Shareholders. Dividends and distributions are recorded on the ex-dividend date. The Fund intends to declare and pay dividends from net investment income and distributions from net realized capital and currency gains, if any, at least annually. Unless a shareholder elects otherwise, all dividends and distributions are reinvested at NAV in the same class of shares of the Fund. Dividends and distributions to shareholders are determined in accordance with federal income tax regulations and may differ from determinations using GAAP.
(D) Security Transactions and Investment Income. The Fund records security transactions on the trade date. Realized gains and losses on security transactions are determined using the identified cost method. Dividend income is recognized on the ex-dividend date, net of any foreign tax withheld at the source, and interest income is accrued as earned using the effective interest rate method. Distributions received from real estate investment trusts may be classified as dividends, capital gains and/or return of capital.
Investment income and realized and unrealized gains and losses on investments of the Fund are allocated pro rata to the separate classes of shares based upon their relative net assets on the date the income is earned or realized and unrealized gains and losses are incurred.
(E) Expenses. Expenses of the Trust are allocated to the individual Funds in proportion to the net assets of the respective Funds when the expenses are incurred, except where direct allocations of expenses can be made. Expenses (other than transfer agent expenses and fees incurred under the shareholder services plans and/or the distribution plans further discussed in Note 3(B)) are allocated to separate classes of shares pro rata based upon their relative net assets on the date the expenses are incurred. The expenses borne by the Fund, including those of related parties to the Fund, are shown in the Statement of Operations.
Additionally, the Fund may invest in ETFs and mutual funds, which are subject to management fees and other fees that may cause the costs of investing in ETFs and mutual funds to be greater than the costs of owning the underlying securities directly. These indirect expenses of ETFs and mutual funds are not included in the amounts shown as expenses in the Statement of Operations or in the expense ratios included in the Financial Highlights.
| 22 | MainStay WMC Small Companies Fund |
(F) Use of Estimates. In preparing financial statements in conformity with GAAP, the Manager makes estimates and assumptions that affect the reported amounts and disclosures in the financial statements. Actual results could differ from those estimates and assumptions.
(G) Securities Lending. In order to realize additional income, the Fund may engage in securities lending, subject to the limitations set forth in the 1940 Act and relevant guidance by the staff of the Securities and Exchange Commission (“SEC”). If the Fund engages in securities lending, the Fund will lend through its custodian, JPMorgan Chase Bank, N.A., ("JPMorgan"), acting as securities lending agent on behalf of the Fund. Under the current arrangement, JPMorgan will manage the Fund's collateral in accordance with the securities lending agency agreement between the Fund and JPMorgan, and indemnify the Fund against counterparty risk. The loans will be collateralized by cash (which may be invested in a money market fund) and/or non-cash collateral (which may include U.S. Treasury securities and/or U.S. government agency securities issued or guaranteed by the United States government or its agencies or instrumentalities) at least equal at all times to the market value of the securities loaned. Non-cash collateral held at year end is segregated and cannot be transferred by the Fund. The Fund bears the risk of delay in recovery of, or loss of rights in, the securities loaned. The Fund may also record a realized gain or loss on securities deemed sold due to a borrower’s inability to return securities on loan. The Fund bears the risk of any loss on investment of cash collateral. The Fund will receive compensation for lending its securities in the form of fees or it will retain a portion of interest earned on the investment of any cash collateral. The Fund will also continue to receive interest and dividends on the securities loaned and any gain or loss in the market price of the securities loaned that may occur during the term of the loan will be for the account of the Fund. Income earned from securities lending activities, if any, is reflected in the Statement of Operations. Securities on loan as of October 31, 2022, are shown in the Portfolio of Investments.
(H) Rights and Warrants. Rights are certificates that permit the holder to purchase a certain number of shares, or a fractional share, of a new stock from the issuer at a specific price. Warrants are instruments that entitle the holder to buy an equity security at a specific price for a specific period of time. These investments can provide a greater potential for profit or loss than an equivalent investment in the underlying security. Prices of these investments do not necessarily move in tandem with the prices of the underlying securities.
There is risk involved in the purchase of rights and warrants in that these investments are speculative investments. The Fund could also lose the entire value of its investment in warrants if such warrants are not exercised by the date of its expiration. The Fund is exposed to risk until the sale or exercise of each right or warrant is completed. Rights and Warrants as of October 31, 2022 are shown in the Portfolio of Investments.
(I) Large Transaction Risks. From time to time, the Fund may receive large purchase or redemption orders from affiliated or unaffiliated mutual funds or other investors. Such large transactions could have
adverse effects on the Fund’s performance if the Fund were required to sell securities or invest cash at times when it otherwise would not do so. This activity could also accelerate the realization of capital gains and increase the Fund’s transaction costs. The Fund has adopted procedures designed to mitigate the negative impacts of such large transactions, but there can be no assurance that these procedures will be effective.
(J) Indemnifications. Under the Trust’s organizational documents, its officers and trustees are indemnified against certain liabilities that may arise out of performance of their duties to the Trust. Additionally, in the normal course of business, the Fund enters into contracts with third-party service providers that contain a variety of representations and warranties and that may provide general indemnifications. The Fund's maximum exposure under these arrangements is unknown, as this would involve future claims that may be made against the Fund that have not yet occurred. The Manager believes that the risk of loss in connection with these potential indemnification obligations is remote. However, there can be no assurance that material liabilities related to such obligations will not arise in the future, which could adversely impact the Fund.
Note 3–Fees and Related Party Transactions
(A) Manager and Subadvisor. New York Life Investments, a registered investment adviser and an indirect, wholly-owned subsidiary of New York Life Insurance Company ("New York Life"), serves as the Fund's Manager, pursuant to an Amended and Restated Management Agreement ("Management Agreement"). The Manager provides offices, conducts clerical, recordkeeping and bookkeeping services and keeps most of the financial and accounting records required to be maintained by the Fund. Except for the portion of salaries and expenses that are the responsibility of the Fund, the Manager pays the salaries and expenses of all personnel affiliated with the Fund and certain operational expenses of the Fund. During a portion of the year ended October 31, 2022, the Fund reimbursed New York Life Investments in an amount equal to the portion of the compensation of the Chief Compliance Officer attributable to the Fund. Wellington Management Company LLP ("Wellington" or the "Subadvisor"), a registered investment adviser, serves as the Subadvisor to the Fund and is responsible for the day-to-day portfolio management of the Fund. Pursuant to the terms of a Subadvisory Agreement ("Subadvisory Agreement") between New York Life Investments and Wellington, New York Life Investments pays for the services of the Subadvisor.
Pursuant to the Management Agreement, the Fund pays the Manager a monthly fee for the services performed and the facilities furnished at an annual rate of the Fund’s average daily net assets as follows: 0.80% up to $1 billion, 0.775% from $1 billion to $2 billion and 0.75% in excess of $2 billion. During the year ended October 31, 2022, the effective management fee rate was 0.80% of the Fund’s average daily net assets, exclusive of any applicable waivers/reimbursements.
During the year ended October 31, 2022, New York Life Investments earned fees from the Fund in the amount of $2,780,978 and waived fees
Notes to Financial Statements (continued)
and/or reimbursed expenses in the amount of $38,106 and paid the Subadvisor fees in the amount of $1,303,634.
JPMorgan provides sub-administration and sub-accounting services to the Fund pursuant to an agreement with New York Life Investments. These services include calculating the daily NAVs of the Fund, maintaining the general ledger and sub-ledger accounts for the calculation of the Fund's NAVs, and assisting New York Life Investments in conducting various aspects of the Fund's administrative operations. For providing these services to the Fund, JPMorgan is compensated by New York Life Investments.
Pursuant to an agreement between the Trust and New York Life Investments, New York Life Investments is responsible for providing or procuring certain regulatory reporting services for the Fund. The Fund will reimburse New York Life Investments for the actual costs incurred by New York Life Investments in connection with providing or procuring these services for the Fund.
(B) Distribution and Service Fees. The Trust, on behalf of the Fund, has entered into a distribution agreement with NYLIFE Distributors LLC (the “Distributor”), an affiliate of New York Life Investments. The Fund has adopted distribution plans (the “Plans”) in accordance with the provisions of Rule 12b-1 under the 1940 Act.
Pursuant to the Class A, Investor Class and Class R2 Plans, the Distributor receives a monthly fee from the Class A, Investor Class and Class R2 shares at an annual rate of 0.25% of the average daily net assets of the Class A, Investor Class and Class R2 shares for distribution and/or service activities as designated by the Distributor. Pursuant to the Class B and Class C Plans, Class B and Class C shares pay the Distributor a monthly distribution fee at an annual rate of 0.75% of the average daily net assets of the Class B and Class C shares, along with a service fee at an annual rate of 0.25% of the average daily net assets of the Class B and Class C shares, for a total 12b-1 fee of 1.00%. Pursuant to the Class R3 Plan, Class R3 shares pay the Distributor a monthly distribution fee at an annual rate of 0.25% of the average daily net assets of the Class R3 shares, along with a service fee at an annual rate of 0.25% of the average daily net assets of the Class R3 shares, for a total 12b-1 fee of 0.50%. Class I and Class R1 shares are not subject to a distribution and/or service fee.
The Plans provide that the distribution and service fees are payable to the Distributor regardless of the amounts actually expended by the Distributor for distribution of the Fund's shares and service activities.
In accordance with the Shareholder Services Plans for the Class R1, Class R2 and Class R3 shares, the Manager has agreed to provide, through its affiliates or independent third parties, various shareholder and administrative support services to shareholders of the Class R1, Class R2 and Class R3 shares. For its services, the Manager, its affiliates or independent third-party service providers are entitled to a shareholder service fee accrued daily and paid monthly at an annual rate of 0.10% of the average daily net assets of the Class R1, Class R2 and Class R3
shares. This is in addition to any fees paid under the Class R2 and Class R3 Plans.
During the year ended October 31, 2022, shareholder service fees incurred by the Fund were as follows:
| |
| Class R1 | $ 58 |
| Class R2 | 116 |
| Class R3 | 472 |
(C) Sales Charges. The Fund was advised by the Distributor that the amount of initial sales charges retained on sales of Class A and Investor Class shares during the year ended October 31, 2022, were $12,698 and $5,175, respectively.
The Fund was also advised that the Distributor retained CDSCs on redemptions of Class B and Class C shares during the year ended October 31, 2022, of $421 and $547, respectively.
(D) Transfer, Dividend Disbursing and Shareholder Servicing Agent. NYLIM Service Company LLC, an affiliate of New York Life Investments, is the Fund's transfer, dividend disbursing and shareholder servicing agent pursuant to an agreement between NYLIM Service Company LLC and the Trust. NYLIM Service Company LLC has entered into an agreement with DST Asset Manager Solutions, Inc. ("DST"), pursuant to which DST performs certain transfer agent services on behalf of NYLIM Service Company LLC. New York Life Investments has contractually agreed to limit the transfer agency expenses charged to the Fund’s share classes to a maximum of 0.35% of that share class’s average daily net assets on an annual basis after deducting any applicable Fund or class-level expense reimbursement or small account fees. This agreement will remain in effect until February 28, 2023, and shall renew automatically for one-year terms unless New York Life Investments provides written notice of termination prior to the start of the next term or upon approval of the Board. During the year ended October 31, 2022, transfer agent expenses incurred by the Fund and any reimbursements, pursuant to the aforementioned Transfer Agency expense limitation agreement, were as follows:
| Class | Expense | Waived |
| Class A | $128,373 | $ — |
| Investor Class | 171,317 | (32,808) |
| Class B | 12,594 | (2,536) |
| Class C | 13,848 | (2,762) |
| Class I | 123,977 | — |
| Class R1 | 49 | — |
| Class R2 | 97 | — |
| Class R3 | 397 | — |
(E) Small Account Fee. Shareholders with small accounts adversely impact the cost of providing transfer agency services. In an effort to reduce total transfer agency expenses, the Fund has implemented a small account fee on certain types of accounts. As described in the Fund's
| 24 | MainStay WMC Small Companies Fund |
prospectus, certain shareholders with an account balance of less than $1,000 ($5,000 for Class A share accounts) are charged an annual per account fee of $20 (assessed semi-annually), the proceeds from which offset transfer agent fees as reflected in the Statement of Operations. This small account fee will not apply to certain types of accounts as described further in the Fund’s prospectus.
(F) Capital. As of October 31, 2022, New York Life and its affiliates beneficially held shares of the Fund with the values and percentages of net assets as follows:
| Class R1 | $54,864 | 100.0% |
| Class R2 | 53,458 | 49.6 |
| Class R3 | 36,725 | 7.7 |
Note 4-Federal Income Tax
As of October 31, 2022, the cost and unrealized appreciation (depreciation) of the Fund’s investment portfolio, including applicable derivative contracts and other financial instruments, as determined on a federal income tax basis, were as follows:
| | Federal Tax
Cost | Gross
Unrealized
Appreciation | Gross
Unrealized
(Depreciation) | Net
Unrealized
Appreciation/
(Depreciation) |
| Investments in Securities | $363,207,740 | $34,645,457 | $(57,620,315) | $(22,974,858) |
As of October 31, 2022, the components of accumulated gain (loss) on a tax basis were as follows:
Ordinary
income | Accumulated
Capital
and Other
Gain (Loss) | Other
Temporary
Differences | Unrealized
Appreciation
(Depreciation) | Total
Accumulated
Gain (Loss) |
| $6,211,129 | $(24,644,319) | $— | $(22,974,932) | $(41,408,122) |
The difference between book-basis and tax-basis unrealized appreciation (depreciation) is primarily due to wash sale adjustments.
The following table discloses the current year reclassifications between total distributable earnings (loss) and additional paid-in capital arising from permanent differences; net assets as of October 31, 2022 were not affected.
| | Total
Distributable
Earnings (Loss) | Additional
Paid-In
Capital |
| | $94,258 | $(94,258) |
The reclassifications for the Fund are primarily due to excise taxes paid.
As of October 31, 2022, for federal income tax purposes, capital loss carryforwards of $24,644,319, as shown in the table below, were available to the extent provided by the regulations to offset future realized gains of the Fund. Accordingly, no capital gains distributions are expected
to be paid to shareholders until net gains have been realized in excess of such amounts.
Capital Loss
Available Through | Short-Term
Capital Loss
Amounts (000’s) | Long-Term
Capital Loss
Amounts (000’s) |
| Unlimited | $19,057 | $5,587 |
During the years ended October 31, 2022 and October 31, 2021, the tax character of distributions paid as reflected in the Statements of Changes in Net Assets was as follows:
| | 2022 | 2021 |
| Distributions paid from: | | |
| Ordinary Income | $66,488,654 | $— |
| Long-Term Capital Gains | 26,694,472 | — |
| Total | $93,183,126 | $— |
Note 5–Custodian
JPMorgan is the custodian of cash and securities held by the Fund. Custodial fees are charged to the Fund based on the Fund's net assets and/or the market value of securities held by the Fund and the number of certain transactions incurred by the Fund.
Note 6–Line of Credit
The Fund and certain other funds managed by New York Life Investments maintain a line of credit with a syndicate of banks in order to secure a source of funds for temporary purposes to meet unanticipated or excessive redemption requests.
Effective July 26, 2022, under the credit agreement (the “Credit Agreement”), the aggregate commitment amount is $600,000,000 with an additional uncommitted amount of $100,000,000. The commitment fee is an annual rate of 0.15% of the average commitment amount payable quarterly, regardless of usage, to JPMorgan, who serves as the agent to the syndicate. The commitment fee is allocated among the Fund and certain other funds managed by New York Life Investments based upon their respective net assets and other factors. Interest on any revolving credit loan is charged based upon the Federal Funds Rate, Daily Simple Secured Overnight Financing Rate ("SOFR") + 0.10%, or the Overnight Bank Funding Rate, whichever is higher. The Credit Agreement expires on July 25, 2023, although the Fund, certain other funds managed by New York Life Investments and the syndicate of banks may renew the Credit Agreement for an additional year on the same or different terms or enter into a credit agreement with a different syndicate of banks. Prior to July 26, 2022, the aggregate commitment amount and the commitment fee were the same as those under the current Credit Agreement. During the year ended October 31, 2022, there were no borrowings made or outstanding with respect to the Fund under the Credit Agreement.
Notes to Financial Statements (continued)
Note 7–Interfund Lending Program
Pursuant to an exemptive order issued by the SEC, the Fund, along with certain other funds managed by New York Life Investments, may participate in an interfund lending program. The interfund lending program provides an alternative credit facility that permits the Fund and certain other funds managed by New York Life Investments to lend or borrow money for temporary purposes directly to or from one another, subject to the conditions of the exemptive order. During the year ended October 31, 2022, there were no interfund loans made or outstanding with respect to the Fund.
Note 8–Purchases and Sales of Securities (in 000’s)
During the year ended October 31, 2022, purchases and sales of securities, other than short-term securities, were $258,894 and $266,145, respectively.
The Fund may purchase securities from or sell securities to other portfolios managed by the Subadvisor. These interportfolio transactions are primarily used for cash management purposes and are made pursuant to Rule 17a-7 under the 1940 Act. The Rule 17a-7 transactions during the year ended October 31, 2022, were as follows:
Sales
(000's) | Realized
Gain / (Loss)
(000's) |
| $2,538 | $282 |
Note 9–Capital Share Transactions
Transactions in capital shares for the years ended October 31, 2022 and October 31, 2021, were as follows:
| Class A | Shares | Amount |
| Year ended October 31, 2022: | | |
| Shares sold | 329,365 | $ 7,991,655 |
| Shares issued to shareholders in reinvestment of distributions | 1,699,563 | 41,588,303 |
| Shares redeemed | (1,217,496) | (28,241,658) |
| Net increase (decrease) in shares outstanding before conversion | 811,432 | 21,338,300 |
| Shares converted into Class A (See Note 1) | 94,728 | 2,285,527 |
| Shares converted from Class A (See Note 1) | (458) | (11,247) |
| Net increase (decrease) | 905,702 | $ 23,612,580 |
| Year ended October 31, 2021: | | |
| Shares sold | 730,189 | $ 23,097,708 |
| Shares redeemed | (813,539) | (25,189,750) |
| Net increase (decrease) in shares outstanding before conversion | (83,350) | (2,092,042) |
| Shares converted into Class A (See Note 1) | 448,765 | 13,503,930 |
| Net increase (decrease) | 365,415 | $ 11,411,888 |
| |
| Investor Class | Shares | Amount |
| Year ended October 31, 2022: | | |
| Shares sold | 45,425 | $ 1,037,118 |
| Shares issued to shareholders in reinvestment of distributions | 464,342 | 11,004,918 |
| Shares redeemed | (145,837) | (3,241,545) |
| Net increase (decrease) in shares outstanding before conversion | 363,930 | 8,800,491 |
| Shares converted into Investor Class (See Note 1) | 26,892 | 591,576 |
| Shares converted from Investor Class (See Note 1) | (68,134) | (1,626,377) |
| Net increase (decrease) | 322,688 | $ 7,765,690 |
| Year ended October 31, 2021: | | |
| Shares sold | 84,193 | $ 2,560,266 |
| Shares redeemed | (138,670) | (4,154,362) |
| Net increase (decrease) in shares outstanding before conversion | (54,477) | (1,594,096) |
| Shares converted into Investor Class (See Note 1) | 24,690 | 770,932 |
| Shares converted from Investor Class (See Note 1) | (422,445) | (12,397,422) |
| Net increase (decrease) | (452,232) | $(13,220,586) |
| |
| Class B | Shares | Amount |
| Year ended October 31, 2022: | | |
| Shares sold | 3,500 | $ 70,421 |
| Shares issued to shareholders in reinvestment of distributions | 58,503 | 1,115,648 |
| Shares redeemed | (28,537) | (518,983) |
| Net increase (decrease) in shares outstanding before conversion | 33,466 | 667,086 |
| Shares converted from Class B (See Note 1) | (57,645) | (1,020,393) |
| Net increase (decrease) | (24,179) | $ (353,307) |
| Year ended October 31, 2021: | | |
| Shares sold | 2,966 | $ 78,338 |
| Shares redeemed | (38,233) | (988,697) |
| Net increase (decrease) in shares outstanding before conversion | (35,267) | (910,359) |
| Shares converted from Class B (See Note 1) | (50,437) | (1,310,156) |
| Net increase (decrease) | (85,704) | $ (2,220,515) |
| |
| 26 | MainStay WMC Small Companies Fund |
| Class C | Shares | Amount |
| Year ended October 31, 2022: | | |
| Shares sold | 8,614 | $ 157,446 |
| Shares issued to shareholders in reinvestment of distributions | 60,799 | 1,158,831 |
| Shares redeemed | (61,647) | (1,096,860) |
| Net increase (decrease) in shares outstanding before conversion | 7,766 | 219,417 |
| Shares converted from Class C (See Note 1) | (12,898) | (230,333) |
| Net increase (decrease) | (5,132) | $ (10,916) |
| Year ended October 31, 2021: | | |
| Shares sold | 56,965 | $ 1,519,582 |
| Shares redeemed | (52,522) | (1,363,627) |
| Net increase (decrease) in shares outstanding before conversion | 4,443 | 155,955 |
| Shares converted from Class C (See Note 1) | (20,761) | (567,284) |
| Net increase (decrease) | (16,318) | $ (411,329) |
| |
| Class I | Shares | Amount |
| Year ended October 31, 2022: | | |
| Shares sold | 1,799,769 | $ 41,934,850 |
| Shares issued to shareholders in reinvestment of distributions | 1,424,883 | 36,590,999 |
| Shares redeemed | (1,490,542) | (38,692,716) |
| Net increase (decrease) in shares outstanding before conversion | 1,734,110 | 39,833,133 |
| Shares converted into Class I (See Note 1) | 436 | 11,247 |
| Net increase (decrease) | 1,734,546 | $ 39,844,380 |
| Year ended October 31, 2021: | | |
| Shares sold | 1,202,922 | $ 39,955,155 |
| Shares redeemed | (1,634,487) | (51,701,876) |
| Net increase (decrease) | (431,565) | $(11,746,721) |
| |
| Class R1(a) | Shares | Amount |
| Year ended October 31, 2022: | | |
| Shares issued to shareholders in reinvestment of distributions | 576 | $ 14,689 |
| Net increase (decrease) | 576 | $ 14,689 |
| |
| Class R2 | Shares | Amount |
| Year ended October 31, 2022: | | |
| Shares sold | 135 | $ 3,044 |
| Shares issued to shareholders in reinvestment of distributions | 1,246 | 30,236 |
| Shares redeemed | (160) | (3,306) |
| Net increase (decrease) | 1,221 | $ 29,974 |
| Year ended October 31, 2021: | | |
| Shares sold | 91 | $ 2,791 |
| Shares redeemed | (98) | (3,048) |
| Net increase (decrease) | (7) | $ (257) |
| |
| Class R3 | Shares | Amount |
| Year ended October 31, 2022: | | |
| Shares sold | 4,588 | $ 103,472 |
| Shares issued to shareholders in reinvestment of distributions | 4,849 | 116,270 |
| Shares redeemed | (1,630) | (33,621) |
| Net increase (decrease) | 7,807 | $ 186,121 |
| Year ended October 31, 2021: | �� | |
| Shares sold | 2,677 | $ 80,805 |
| Shares redeemed | (2,977) | (94,880) |
| Net increase (decrease) | (300) | $ (14,075) |
| (a) | No activity during the period ended October 31, 2021. |
Note 10–Other Matters
As of the date of this report, interest rates in the United States and many parts of the world, including certain European countries, are ascending from historically low levels. Thus, the Fund currently faces a heightened level of risk associated with rising interest rates. This could be driven by a variety of factors, including but not limited to central bank monetary policies, changing inflation or real growth rates, general economic conditions, increasing bond issuances or reduced market demand for low yielding investments.
An outbreak of COVID-19, first detected in December 2019, has developed into a global pandemic and has resulted in travel restrictions, closure of international borders, certain businesses and securities markets, restrictions on securities trading activities, prolonged quarantines, supply chain disruptions, and lower consumer demand, as well as general concern and uncertainty. In 2022, many countries lifted some or all restrictions related to COVID-19. However, the continued impact of COVID-19 and related variants is uncertain and could further adversely affect the global economy, national economies, individual issuers and capital markets in unforeseeable ways and result in a substantial and extended economic downturn. Developments that disrupt global economies and financial markets, such as COVID-19, may magnify factors that affect the Fund's performance.
Note 11–Subsequent Events
In connection with the preparation of the financial statements of the Fund as of and for the year ended October 31, 2022, events and transactions subsequent to October 31, 2022, through the date the financial statements were issued have been evaluated by the Manager for possible adjustment and/or disclosure. No subsequent events requiring financial statement adjustment or disclosure have been identified.
Report of Independent Registered Public Accounting Firm
To the Shareholders of the Fund and Board of Trustees
MainStay Funds Trust:
Opinion on the Financial Statements
We have audited the accompanying statement of assets and liabilities of MainStay WMC Small Companies Fund (the Fund), one of the funds constituting MainStay Funds Trust, including the portfolio of investments, as of October 31, 2022, the related statement of operations for the year then ended, the statements of changes in net assets for each of the years in the two-year period then ended, and the related notes (collectively, the financial statements) and the financial highlights for each of the years in the five-year period then ended. In our opinion, the financial statements and financial highlights present fairly, in all material respects, the financial position of the Fund as of October 31, 2022, the results of its operations for the year then ended, the changes in its net assets for each of the years in the two-year period then ended, and the financial highlights for each of the years in the five-year period then ended, in conformity with U.S. generally accepted accounting principles.
Basis for Opinion
These financial statements and financial highlights are the responsibility of the Fund's management. Our responsibility is to express an opinion on these financial statements and financial highlights based on our audits. We are a public accounting firm registered with the Public Company Accounting Oversight Board (United States) (PCAOB) and are required to be independent with respect to the Fund in accordance with the U.S. federal securities laws and the applicable rules and regulations of the Securities and Exchange Commission and the PCAOB.
We conducted our audits in accordance with the standards of the PCAOB. Those standards require that we plan and perform the audit to obtain reasonable assurance about whether the financial statements and financial highlights are free of material misstatement, whether due to error or fraud. Our audits included performing procedures to assess the risks of material misstatement of the financial statements and financial highlights, whether due to error or fraud, and performing procedures that respond to those risks. Such procedures included examining, on a test basis, evidence regarding the amounts and disclosures in the financial statements and financial highlights. Such procedures also included confirmation of securities owned as of October 31, 2022, by correspondence with custodians, the transfer agent and brokers; when replies were not received from brokers, we performed other auditing procedures. Our audits also included evaluating the accounting principles used and significant estimates made by management, as well as evaluating the overall presentation of the financial statements and financial highlights. We believe that our audits provide a reasonable basis for our opinion.

We have served as the auditor of one or more New York Life Investment Management investment companies since 2003.
Philadelphia, Pennsylvania
December 23, 2022
| 28 | MainStay WMC Small Companies Fund |
Federal Income Tax Information
(Unaudited)
The Fund is required under the Internal Revenue Code to advise shareholders in a written statement as to the federal tax status of dividends paid by the Fund during such fiscal years. Accordingly, the Fund paid $26,704,474 as long term capital gain distributions.
For the fiscal year ended October 31, 2022, the Fund designated approximately $2,168,696 under the Internal Revenue Code as qualified dividend income eligible for reduced tax rates.
The dividends paid by the Fund during the fiscal year ended October 31, 2022 should be multiplied by 3.29% to arrive at the amount eligible for the corporate dividend-received deduction.
In February 2023, shareholders will receive an IRS Form 1099-DIV or substitute Form 1099, which will show the federal tax status of the distributions received by shareholders in calendar year 2022. The amounts that will be reported on such 1099-DIV or substitute Form 1099 will be the amounts you are to use on your federal income tax return and will differ from the amounts which we must report for the Fund's fiscal year ended October 31, 2022.
Proxy Voting Policies and Procedures and Proxy Voting Record
The Fund is required to file with the SEC its proxy voting record for the 12-month period ending June 30 on Form N-PX. A description of the policies and procedures that are used to vote proxies relating to portfolio securities of the Fund is available free of charge upon request by calling 800-624-6782 or visiting the SEC’s website at www.sec.gov. The most recent Form N-PX or proxy voting record is available free of charge upon request by calling 800-624-6782; visiting newyorklifeinvestments.com; or visiting the SEC’s website at www.sec.gov.
Shareholder Reports and Quarterly Portfolio Disclosure
The Fund is required to file its complete schedule of portfolio holdings with the SEC 60 days after its first and third fiscal quarter on Form N-PORT. The Fund's holdings report is available free of charge upon request by calling New York Life Investments at 800-624-6782.
Board of Trustees and Officers (Unaudited)
The Trustees and officers of the Fund are listed below. The Board oversees the MainStay Group of Funds (which consists of MainStay Funds and MainStay Funds Trust), MainStay VP Funds Trust, MainStay MacKay DefinedTerm Municipal Opportunities Fund, MainStay CBRE Global Infrastructure Megatrends Fund, the Manager and the Subadvisors, and elects the officers of the Funds who are responsible for the day-to-day operations of the Fund. Information pertaining to the Trustees and officers is set forth below. Each Trustee serves until his or her successor is
elected and qualified or until his or her resignation, death or removal. Under the Board’s retirement policy, unless an exception is made, a Trustee must tender his or her resignation by the end of the calendar year during which he or she reaches the age of 75. The business address of each Trustee and officer listed below is 51 Madison Avenue, New York, New York 10010. None of the Trustees are “interested persons” (as defined by the 1940 Act and rules adopted by the SEC thereunder) of the Fund (“Independent Trustees”).
| | Name and
Year of Birth | Term of Office,
Position(s) Held and
Length of Service | Principal Occupation(s)
During Past Five Years | Number of
Portfolios in
Fund Complex
Overseen by
Trustee | Other Directorships
Held by Trustee |
| | | | | | |
| | David H. Chow
1957 | MainStay Funds: Trustee since 2016, Advisory Board Member (June 2015 to December 2015);MainStay Funds Trust:
Trustee since January 2016, Advisory Board Member (June 2015 to December 2015) | Founder and CEO, DanCourt Management, LLC since 1999 | 78 | MainStay VP Funds Trust: Trustee since January 2016, Advisory Board Member (June 2015 to December 2015) (31 portfolios);
MainStay MacKay DefinedTerm Municipal Opportunities Fund: Trustee since January 2016, Advisory Board Member (June 2015 to December 2015);
MainStay CBRE Global Infrastructure Megatrends Fund: Trustee since June 2021; VanEck Vectors Group of Exchange-Traded Funds: Independent Chairman of the Board of Trustees since 2008 and Trustee since 2006 (56 portfolios); and Berea College of Kentucky: Trustee since 2009, Chair of the Investment Committee since 2018 |
| | Susan B. Kerley
1951 | MainStay Funds: Chairman since 2017 and Trustee since 2007;MainStay Funds Trust:
Chairman since 2017 and Trustee since 1990** | President, Strategic Management Advisors LLC since 1990 | 78 | MainStay VP Funds Trust: Chairman since January 2017 and Trustee since 2007 (31 portfolios)**;
MainStay MacKay DefinedTerm Municipal Opportunities Fund: Chairman since 2017 and Trustee since 2011;
MainStay CBRE Global Infrastructure Megatrends Fund: Trustee since June 2021; and Legg Mason Partners Funds: Trustee since 1991 (45 portfolios) |
| | Alan R. Latshaw
1951 | MainStay Funds: Trustee since 2006;MainStay Funds Trust:
Trustee since 2007*** | Retired; Partner, Ernst & Young LLP (2002 to 2003); Partner, Arthur Andersen LLP (1989 to 2002); Consultant to the MainStay Funds Audit and Compliance Committee (2004 to 2006) | 78 | MainStay VP Funds Trust: Trustee since 2007 (31 portfolios)**;
MainStay MacKay DefinedTerm Municipal Opportunities Fund: Trustee since 2011; and
MainStay CBRE Global Infrastructure Megatrends Fund: Trustee since June 2021 |
| 30 | MainStay WMC Small Companies Fund |
| | Name and
Year of Birth | Term of Office,
Position(s) Held and
Length of Service | Principal Occupation(s)
During Past Five Years | Number of
Portfolios in
Fund Complex
Overseen by
Trustee | Other Directorships
Held by Trustee |
| | | | | | |
| | Karen Hammond
1956 | MainStay Funds: Trustee since December 2021, Advisory Board Member (June 2021 to December 2021);MainStay Funds Trust:
Trustee since December 2021, Advisory Board Member (June 2021 to December 2021)
| Retired, Managing Director, Devonshire Investors (2007 to 2013); Senior Vice President, Fidelity Management & Research Co. (2005 to 2007); Senior Vice President and Corporate Treasurer, FMR Corp. (2003 to 2005); Chief Operating Officer, Fidelity Investments Japan (2001 to 2003) | 78 | MainStay VP Funds Trust: Trustee since December 2021, Advisory Board Member (June 2021 to December 2021) (31 Portfolios);
MainStay MacKay DefinedTerm Municipal Opportunities Fund: Trustee since December 2021, Advisory Board Member (June 2021 to December 2021);
MainStay CBRE Global Infrastructure Megatrends Fund: Trustee since December 2021, Advisory Board Member (June 2021 to December 2021);
Two Harbors Investment Corp.: Director since 2018;
Rhode Island State Investment Commission: Member since 2017; and
Blue Cross Blue Shield of Rhode Island: Director since 2019 |
| | Jacques P. Perold
1958 | MainStay Funds: Trustee since 2016, Advisory Board Member (June 2015 toDecember 2015);MainStay Funds Trust:
Trustee since January 2016, Advisory Board Member (June 2015 to December 2015) | Founder and Chief Executive Officer, CapShift Advisors LLC (since 2018); President, Fidelity Management & Research Company (2009 to 2014); President and Chief Investment Officer, Geode Capital Management, LLC (2001 to 2009) | 78 | MainStay VP Funds Trust: Trustee since January 2016, Advisory Board Member (June 2015 to December 2015) (31 portfolios);
MainStay MacKay DefinedTerm Municipal Opportunities Fund: Trustee since January 2016, Advisory Board Member (June 2015 to December 2015);
MainStay CBRE Global Infrastructure Megatrends Fund: Trustee since June 2021; Partners in Health: Trustee since 2019; Allstate Corporation: Director since 2015; and MSCI Inc.: Director since 2017 |
| | Richard S. Trutanic
1952 | MainStay Funds: Trustee since 1994;MainStay Funds Trust:
Trustee since 2007*** | Chairman and Chief Executive Officer, Somerset & Company (financial advisory firm) since 2004; Managing Director, The Carlyle Group (private investment firm) (2002 to 2004); Senior Managing Director, Partner and Board Member, Groupe Arnault S.A. (private investment firm) (1999 to 2002) | 78 | MainStay VP Funds Trust: Trustee since 2007 (31 portfolios)**;
MainStay MacKay DefinedTerm Municipal Opportunities Fund: Trustee since 2011; and MainStay CBRE Global Infrastructure Megatrends Fund: Trustee since June 2021 |
| ** | Includes prior service as a Director of MainStay VP Series Fund, Inc., the predecessor to MainStay VP Funds Trust. |
| *** | Includes prior service as a Director/Trustee of certain predecessor entities to MainStay Funds Trust. |
Board of Trustees and Officers (Unaudited) (continued)
| | Name and
Year of Birth | Position(s) Held and
Length of Service | Principal Occupation(s)
During Past Five Years | |
| | | | | |
| | Kirk C. Lehneis
1974 | President, MainStay Funds, MainStay Funds Trust since 2017 | Chief Operating Officer and Senior Managing Director (since 2016), New York Life Investment Management LLC and New York Life Investment Management Holdings LLC; Member of the Board of Managers (since 2017) and Senior Managing Director (since 2018), NYLIFE Distributors LLC; Chairman of the Board and Senior Managing Director, NYLIM Service Company LLC (since 2017); Trustee, President and Principal Executive Officer of IndexIQ Trust, IndexIQ ETF Trust and IndexIQ Active ETF Trust (since January 2018); President, MainStay CBRE Global Infrastructure Megatrends Fund (since 2021), MainStay MacKay DefinedTerm Municipal Opportunities Fund and MainStay VP Funds Trust (since 2017); Senior Managing Director, Global Product Development (From 2015-2016); Managing Director, Product Development (2010 to 2015), New York Life Investment Management LLC | |
| | Jack R. Benintende
1964 | Treasurer and Principal Financial and Accounting Officer, MainStay Funds (since 2007), MainStay Funds Trust (since 2009) | Managing Director, New York Life Investment Management LLC (since 2007); Treasurer and Principal Financial and Accounting Officer, MainStay CBRE Global Infrastructure Megatrends Fund (since 2021), MainStay MacKay DefinedTerm Municipal Opportunities Fund (since 2011) and MainStay VP Funds Trust (since 2007)** and Assistant Treasurer, New York Life Investment Management Holdings LLC (2008 to 2012) | |
| | J. Kevin Gao
1967 | Secretary and Chief Legal Officer, MainStay Funds and MainStay Funds Trust (since 2010) | Managing Director and Associate General Counsel, New York Life Investment Management LLC (since 2010); Secretary and Chief Legal Officer and MainStay CBRE Global Infrastructure Megatrends Fund (since 2021), MainStay MacKay DefinedTerm Municipal Opportunities Fund (since 2011) and MainStay VP Funds Trust (since 2010)** | |
| | Scott T. Harrington
1959 | Vice President— Administration, MainStay Funds (since 2009), MainStay Funds Trust (since 2009) | Managing Director, New York Life Investment Management LLC (including predecessor advisory organizations) (since 2000); Member of the Board of Directors, New York Life Trust Company (since 2009); Vice President—Administration, MainStay CBRE Global Infrastructure Megatrends Fund (since 2021), MainStay MacKay DefinedTerm Municipal Opportunities Fund (since 2011) and MainStay VP Funds Trust (since 2005)** | |
| | Kevin M. Gleason
1967 | Vice President and Chief Compliance Officer, MainStay Funds and MainStay Funds Trust (since June 2022) | Vice President and Chief Compliance Officer, IndexIQ, IndexIQ ETF Trust and Index IQ Active ETF Trust (since June 2022); Vice President and Chief Compliance Officer, MainStay CBRE Global Infrastructure Megatrends Fund, MainStay VP Funds Trust and MainStay MacKay DefinedTerm Municipal Opportunities Fund (since June 2022); Senior Vice President, Voya Investment Management and Chief Compliance Officer, Voya Family of Funds (2012-2022) | |
| * | The officers listed above are considered to be “interested persons” of the MainStay Group of Funds, MainStay VP Funds Trust, MainStay CBRE Global Infrastructure Megatrends Fund and MainStay MacKay DefinedTerm Municipal Opportunities Fund within the meaning of the 1940 Act because of their affiliation with the MainStay Group of Funds, New York Life Insurance Company and/or its affiliates, including New York Life Investment Management LLC, NYLIM Service Company LLC, NYLIFE Securities LLC and/or NYLIFE Distributors LLC, as described in detail in the column captioned “Principal Occupation(s) During Past Five Years.” Officers are elected annually by the Board. |
| ** | Includes prior service as an Officer of MainStay VP Series Fund, Inc., the predecessor to MainStay VP Funds Trust. |
Officers of the Trust (Who are not Trustees)*
| 32 | MainStay WMC Small Companies Fund |
This page intentionally left blank.
This page intentionally left blank.
Equity
U.S. Equity
MainStay Epoch U.S. Equity Yield Fund
MainStay S&P 500 Index Fund1
MainStay Winslow Large Cap Growth Fund
MainStay WMC Enduring Capital Fund
MainStay WMC Growth Fund
MainStay WMC Small Companies Fund
MainStay WMC Value Fund
International Equity
MainStay Epoch International Choice Fund
MainStay MacKay International Equity Fund
MainStay WMC International Research Equity Fund
Emerging Markets Equity
MainStay Candriam Emerging Markets Equity Fund
Global Equity
MainStay Epoch Capital Growth Fund
MainStay Epoch Global Equity Yield Fund
Fixed Income
Taxable Income
MainStay Candriam Emerging Markets Debt Fund
MainStay Floating Rate Fund
MainStay MacKay High Yield Corporate Bond Fund
MainStay MacKay Short Duration High Yield Fund
MainStay MacKay Strategic Bond Fund
MainStay MacKay Total Return Bond Fund
MainStay MacKay U.S. Infrastructure Bond Fund
MainStay Short Term Bond Fund
Tax-Exempt Income
MainStay MacKay California Tax Free Opportunities Fund2
MainStay MacKay High Yield Municipal Bond Fund
MainStay MacKay New York Tax Free Opportunities Fund3
MainStay MacKay Short Term Municipal Fund
MainStay MacKay Strategic Municipal Allocation Fund
MainStay MacKay Tax Free Bond Fund
Money Market
MainStay Money Market Fund
Mixed Asset
MainStay Balanced Fund
MainStay Income Builder Fund
MainStay MacKay Convertible Fund
Speciality
MainStay CBRE Global Infrastructure Fund
MainStay CBRE Real Estate Fund
MainStay Cushing MLP Premier Fund
Asset Allocation
MainStay Conservative Allocation Fund
MainStay Conservative ETF Allocation Fund
MainStay Defensive ETF Allocation Fund
MainStay Equity Allocation Fund
MainStay Equity ETF Allocation Fund
MainStay ESG Multi-Asset Allocation Fund
MainStay Growth Allocation Fund
MainStay Growth ETF Allocation Fund
MainStay Moderate Allocation Fund
MainStay Moderate ETF Allocation Fund
Manager
New York Life Investment Management LLC
New York, New York
Subadvisors
Candriam4
Strassen, Luxembourg
CBRE Investment Management Listed Real Assets LLC
Radnor, Pennsylvania
Cushing Asset Management, LP
Dallas, Texas
Epoch Investment Partners, Inc.
New York, New York
MacKay Shields LLC4
New York, New York
NYL Investors LLC4
New York, New York
Wellington Management Company LLP
Boston, Massachusetts
Winslow Capital Management, LLC
Minneapolis, Minnesota
Legal Counsel
Dechert LLP
Washington, District of Columbia
Independent Registered Public Accounting Firm
KPMG LLP
Philadelphia, Pennsylvania
Distributor
NYLIFE Distributors LLC4
Jersey City, New Jersey
Custodian
JPMorgan Chase Bank, N.A.
New York, New York
1.
Prior to February 28, 2022, the Fund's name was MainStay MacKay S&P 500 Index Fund.
| 2. | This Fund is registered for sale in AZ, CA, NV, OR, TX, UT, WA and MI (Class A and Class I shares only), and CO, FL, GA, HI, ID, MA, MD, NH, NJ and NY (Class I shares only). |
| 3. | This Fund is registered for sale in CA, CT, DE, FL, MA, NJ, NY and VT. |
| 4. | An affiliate of New York Life Investment Management LLC. |
Not part of the Annual Report
For more information
800-624-6782
newyorklifeinvestments.com
“New York Life Investments” is both a service mark, and the common trade name, of certain investment advisors affiliated with New York Life Insurance Company. The MainStay Funds® are managed by New York Life Investment Management LLC and distributed by NYLIFE Distributors LLC, 30 Hudson Street, Jersey City, NJ 07302, a wholly owned subsidiary of New York Life Insurance Company. NYLIFE Distributors LLC is a Member FINRA/SIPC.
©2022 NYLIFE Distributors LLC. All rights reserved.
| 5013935.2MS229-22 | MSWSC11-12/22 |
(NYLIM) NL531
As of the end of the period covered by this report, the Registrant has adopted a code of ethics (the “Code”) that applies to the Registrant’s principal executive officer (“PEO”) and principal financial officer (“PFO”). During the period covered by this report, no amendments were made to the provisions of the Code. The Registrant did not grant any waivers, including implicit waivers, from any provisions of the Code to the PEO or PFO during the period covered by this report. A copy of the Code is filed herewith.
| Item 3. | Audit Committee Financial Expert. |
The Board of Trustees has determined that the Registrant has three “audit committee financial experts” serving on its Audit Committee. The Audit Committee financial experts are Alan R. Latshaw, Karen Hammond and Susan B. Kerley. Mr. Latshaw, Ms. Hammond and Ms. Kerley are “independent” as defined by Item 3 of Form N-CSR.
| Item 4. | Principal Accountant Fees and Services. |
(a) Audit Fees
The aggregate fees billed for the fiscal year ended October 31, 2022 for professional services rendered by KPMG LLP (“KPMG”) for the audit of the Registrant’s annual financial statements or services that are normally provided by KPMG in connection with statutory and regulatory filings or engagements for that fiscal year were $1,286,050.
The aggregate fees billed for the fiscal year ended October 31, 2021 for professional services rendered by KPMG for the audit of the Registrant’s annual financial statements or services that are normally provided by KPMG in connection with statutory and regulatory filings or engagements for that fiscal year were $1,290,400.
(b) Audit-Related Fees
The aggregate fees billed for assurance and related services by KPMG that are reasonably related to the performance of the audit of the Registrant’s financial statements and are not reported under paragraph (a) of this Item were: (i) $0 for the fiscal year ended October 31, 2022, and (ii) $0 for the fiscal year ended October 31, 2021.
(c) Tax Fees
The aggregate fees billed for professional services rendered by KPMG for tax compliance, tax advice, and tax planning were: (i) $0 during the fiscal year ended October 31, 2022, and (ii) $0 during the fiscal year ended October 31, 2021.These services primarily included preparation of federal, state and local income tax returns and excise tax returns, as well as services relating to excise tax distribution requirements.
(d) All Other Fees
The aggregate fees billed for products and services provided by KPMG, other than the services reported in paragraphs (a) through (c) of this Item were: (i) $0 during the fiscal year ended October 31, 2022, and (ii) $0 during the fiscal year ended
October 31, 2021.
(e) Pre-Approval Policies and Procedures
| | (1) | The Registrant’s Audit Committee has adopted pre-approval policies and procedures (the “Procedures”) to govern the Committee’s pre-approval of (i) all audit services and permissible non-audit services to be provided to the Registrant by its independent accountant, and (ii) all permissible non-audit services to be provided by such independent accountant to the Registrant’s investment adviser and to any entity controlling, controlled by or under common control with the investment adviser that provides ongoing services to the Registrant (collectively, the “Service Affiliates”) if the services directly relate to the Registrant’s operations and financial reporting. In accordance with the Procedures, the Audit Committee is responsible for the engagement of the independent accountant to certify the Registrant’s financial statements for each fiscal year. With respect to the pre-approval of non-audit services provided to the Registrant and its Service Affiliates, the Procedures provide that the Audit Committee may annually pre-approve a list of the types of services that may be provided to the Registrant or its Service Affiliates, or the Audit Committee may pre-approve such services on a project-by-project basis as they arise. Unless a type of service has received general pre-approval, it will require specific pre-approval by the Audit Committee if it is to be provided by the independent accountant. The Procedures also permit the Audit Committee to delegate authority to one or more of its members to pre-approve any proposed non-audit services that have not been previously pre-approved by the Audit Committee, subject to the ratification by the full Audit Committee no later than its next scheduled meeting. To date, the Audit Committee has not delegated such authority. |
| | (2) | With respect to the services described in paragraphs (b) through (d) of this Item 4, no amount was approved by the Audit Committee pursuant to paragraph (c)(7)(i)(C) of Rule 2-01 of Regulation S-X. |
(f) There were no hours expended on KPMG’s engagement to audit the Registrant’s financial statements for the most recent fiscal year was attributable to work performed by persons other than KPMG’s full-time, permanent employees.
(g) All non-audit fees billed by KPMG for services rendered to the Registrant for the fiscal years ended October 31, 2022 and October 31, 2021 are disclosed in 4(b)-(d) above.
The aggregate non-audit fees billed by KPMG for services rendered to the Registrant’s investment adviser (not including any sub-adviser whose role is primarily portfolio management and is subcontracted with or overseen by another investment adviser), and any entity controlling, controlled by, or under common control with the adviser that provides ongoing services to the Registrant were approximately: (i) $193,405 for the fiscal year ended October 31, 2022; and (ii) $78,500 for the fiscal year ended October 31, 2021.
(h) The Registrant’s Audit Committee has determined that the non-audit services rendered by KPMG for the fiscal year ended October 31, 2022 to the Registrant’s investment adviser and any entity controlling, controlled by, or under common control with the Registrant’s investment adviser that provides ongoing services to the Registrant that were not required to be pre-approved by the Audit Committee because they
did not relate directly to the operations and financial reporting of the registrant were compatible with maintaining the respective independence of KPMG during the relevant time period.
| Item 5. | Audit Committee of Listed Registrants. |
Not applicable.
The Schedule of Investments is included as part of Item 1 of this report.
| Item 7. | Disclosure of Proxy Voting Policies and Procedures for Closed-End Management Investment Companies. |
Not applicable.
| Item 8. | Portfolio Managers of Closed-End Management Investment Companies. |
Not applicable.
| Item 9. | Purchases of Equity Securities by Closed-End Management Investment Company and Affiliated Purchasers. |
Not applicable.
| Item 10. | Submission of Matters to a Vote of Security Holders. |
Since the Registrant’s last response to this Item, there have been no material changes to the procedures by which shareholders may recommend nominees to the Registrant’s Board of Trustees.
| Item 11. | Controls and Procedures. |
(a) Based on an evaluation of the Registrant’s Disclosure Controls and Procedures (as defined in Rule 30a-3(c) under the Investment Company Act of 1940) (the “Disclosure Controls”), as of a date within 90 days prior to the filing date (the “Filing Date”) of this Form N-CSR (the “Report”), the Registrant’s principal executive officer and principal financial officer have concluded that the Disclosure Controls are reasonably designed to ensure that information required to be disclosed by the Registrant in the Report is recorded, processed, summarized and reported by the Filing Date, including ensuring that information required to be disclosed in the Report is accumulated and communicated to the Registrant’s management, including the Registrant’s principal executive officer and principal financial officer, as appropriate to allow timely decisions regarding required disclosure.
(b) There were no changes in the Registrant’s internal control over financial reporting (as defined in Rule 30a-3(d)) under the Investment Company Act of 1940 that occurred during the period covered by this report that has materially affected, or is reasonably likely to materially affect, the Registrant’s internal control over financial reporting.
| Item 12. | Disclosure of Securities Lending Activities for Closed-End Management Investment Companies. |
Not applicable.
SIGNATURES
Pursuant to the requirements of the Securities Exchange Act of 1934 and the Investment Company Act of 1940, the Registrant has duly caused this Report to be signed on its behalf by the undersigned, thereunto duly authorized.
MAINSTAY FUNDS TRUST
| | |
| |
| By: | | /s/ Kirk C. Lehneis |
| | Kirk C. Lehneis |
| | President and Principal Executive Officer |
|
Date: January 6, 2023 |
Pursuant to the requirements of the Securities Exchange Act of 1934 and the Investment Company Act of 1940, this Report has been signed below by the following persons on behalf of the Registrant and in the capacities and on the dates indicated.
| | |
| |
| By: | | /s/ Kirk C. Lehneis |
| | Kirk C. Lehneis |
| | President and Principal Executive Officer |
|
Date: January 6, 2023 |
| |
| By: | | /s/ Jack R. Benintende |
| | Jack R. Benintende |
| | Treasurer and Principal Financial and Accounting Officer |
|
Date: January 6, 2023 |