UNITED STATES
SECURITIES AND EXCHANGE COMMISSION
Washington, D.C. 20549
FORM N-CSR
CERTIFIED SHAREHOLDER REPORT OF REGISTERED
MANAGEMENT INVESTMENT COMPANIES
| | |
| Investment Company Act file number | | 811-22329 |
Nuveen Mortgage and Income Fund
(Exact name of registrant as specified in charter)
Nuveen Investments
333 West Wacker Drive, Chicago, IL 60606
(Address of principal executive offices) (Zip code)
Gifford R. Zimmerman
Nuveen Investments
333 West Wacker Drive, Chicago, IL 60606
(Name and address of agent for service)
| | |
| Registrant’s telephone number, including area code: | | (312) 917-7700 |
| | |
| Date of fiscal year end: | | December 31 |
| | |
| Date of reporting period: | | June 30, 2020 |
Form N-CSR is to be used by management investment companies to file reports with the Commission not later than 10 days after the transmission to stockholders of any report that is required to be transmitted to stockholders under Rule 30e-1 under the Investment Company Act of 1940 (17 CFR 270.30e-1). The Commission may use the information provided on Form N-CSR in its regulatory, disclosure review, inspection, and policy making roles.
A registrant is required to disclose the information specified by Form N-CSR, and the Commission will make this information public. A registrant is not required to respond to the collection of information contained in Form N-CSR unless the Form displays a currently valid Office of Management and Budget (“OMB”) control number. Please direct comments concerning the accuracy of the information collection burden estimate and any suggestions for reducing the burden to Secretary, Securities and Exchange Commission, 450 Fifth Street, NW, Washington, DC 20549-0609. The OMB has reviewed this collection of information under the clearance requirements of 44 U.S.C. ss.3507.
| ITEM 1. | REPORTS TO STOCKHOLDERS. |

Closed-End Funds
30 June 2020
Nuveen Closed-End Funds
| | |
| JLS | | Nuveen Mortgage and Income Fund |
Beginning on January 1, 2021, as permitted by regulations adopted by the Securities and Exchange Commission, paper copies of the Funds’ annual and semi-annual shareholder reports will no longer be sent by mail, unless you specifically request paper copies of the reports. Instead, the reports will be made available on the Funds’ website (www.nuveen.com), and you will be notified by mail each time a report is posted and provided with a website link to access the report.
If you have already elected to receive shareholder reports electronically, you will not be affected by this change and you need not take any action. You may elect to receive shareholder reports and other communications from the Funds electronically anytime by contacting the financial intermediary (such as a broker-dealer or bank) through which you hold your Fund shares or, if you are a direct investor, by enrolling at www.nuveen.com/e-reports.
You may elect to receive all future shareholder reports in paper free of charge at any time by contacting your financial intermediary or, if you are a direct investor, (i) by calling 800-257-8787 and selecting option #2 or (ii) by logging into your Investor Center account at www.computershare.com/investor and clicking on “Communication Preferences.” Your election to receive reports in paper will apply to all funds held in your account with your financial intermediary or, if you are a direct investor, to all your directly held Nuveen Funds and any other directly held funds within the same group of related investment companies.
Semiannual Report
Life is Complex.
Nuveen makes things e-simple.
It only takes a minute to sign up for e-Reports. Once enrolled, you’ll receive an e-mail as soon as your Nuveen Fund information is ready. No more waiting for delivery by regular mail. Just click on the link within the e-mail to see the report and save it on your computer if you wish.
Free e-Reports right to your email!
www.investordelivery.com
If you receive your Nuveen Fund distributions and statements from your financial professional or brokerage account.
or
www.nuveen.com/client-access
If you receive your Nuveen Fund distributions and statements directly from Nuveen.
NOT FDIC INSURED MAY LOSE VALUE NO BANK GUARANTEE
Table of Contents
3
Chair’s Letter to Shareholders

Dear Shareholders,
The COVID-19 crisis is taking an unprecedented toll on our health, societies, economies and financial markets. Our thoughts are with you during this time of significant disruption caused by the disease and its economic fallout. With many regions of the world suppressing the initial spread of the virus, governments and public health officials face the extraordinary challenge of balancing the resumption of economic activity with public safety. New clusters of infection emerged in the U.S. and other countries following their reopening this summer and a new school year and Northern Hemisphere flu season add new variables. Markets have turned their focus to the potential for an economic recovery, although the timing and magnitude are highly uncertain. Elevated market volatility is likely to continue, with economic data, coronavirus infection rates and the upcoming U.S. presidential election under scrutiny.
While we do not want to understate the dampening effect on the global economy, it is important to differentiate short-term interruptions from the longer-lasting implications to the economy. Prior to the COVID-19 crisis, some areas of the global economy were showing signs of improvement after trade tensions had weighed on economic activity for much of 2019. More recently, countries that have reopened have seen marked improvement in some near-term economic indicators. Central banks and governments around the world have announced economic stimulus measures and pledged to continue doing what it takes to support their economies. In the U.S., the Federal Reserve has cut its benchmark interest rate to near zero and introduced similar programs that helped revive the U.S. economy after the 2008 financial crisis. The U.S. Government has approved three relief packages, including a $2 trillion-dollar package directly supporting businesses and individuals. The Coronavirus Aid, Relief and Economic Security Act, called the CARES Act, provides direct payments and expanded unemployment benefits to individuals, loans and grants to small businesses, loans and other money to large corporations and funding for hospitals, public health, education and state and local governments. In the European Union, the European Central Bank recently increased the size of its Pandemic Emergency Purchase Program, known as PEPP, to €1.35 trillion from €750 billion and extended its duration to June 2021.
In the meantime, patience and a long-term perspective are key for investors. When market fluctuations are the leading headlines day after day, it’s tempting to “do something.” However, your long-term goals can’t be met with short-term thinking. We encourage you to talk to your financial professional, who can review your time horizon, risk tolerance and investment goals. On behalf of the other members of the Nuveen Fund Board, we look forward to continuing to earn your trust in the months and years ahead.
Sincerely,

Terence J. Toth
Chair of the Board
August 24, 2020
4
Portfolio Manager’s Comments
Nuveen Mortgage and Income Fund (JLS)
(formerly Nuveen Mortgage Opportunity Term Fund)
The Fund features portfolio management by Teachers Advisors, LLC (TAL), an affiliate of Nuveen Fund Advisors, LLC, the Fund’s investment adviser. Aashh Parekh, CFA, Nick Travaglino, and Stephen Virgilio serve as portfolio managers for the restructured Fund.
Here the portfolio management team reviews the management strategies and the performance of the Fund for the six-month period ended June 30, 2020.
An Update on COVID-19 Coronavirus and its Impact on the Securities Markets
Slowing COVID-19 coronavirus infection rates around the world encouraged authorities to loosen restrictions on business and social activity in recent months. While economic indicators have improved considerably from the depths of the shutdown, some regions, including the U.S., have seen an uptick in infection rates after reopening. This may slow the recovery process and contribute to short-term market volatility in the meantime.
Although the detection of the virus in China was made public in December 2019, markets did not start to fully acknowledge the risks and potential economic impact until the latter portion of February 2020, when outbreaks outside of China were first reported. Global stock markets sold off severely, with the S&P 500® index reaching a bear market (a 20% drop from the previous high) within three weeks, the fastest bear market decline in history. Even certain parts of the bond market suffered; below investment grade municipal and corporate bonds generally dropped the furthest, mostly out of concerns for the continued financial stability of lower quality issuers. Demand for safe-haven assets, along with mounting recession fears, drove the yield on the 10-year U.S. Treasury note to 0.5% in March 2020, an all-time low. Additionally, oil prices collapsed to an 18-year low on supply glut concerns, as shutdowns across the global economy sharply reduced oil demand, although oil prices have recovered to well above those lows.
Central banks and governments have responded with liquidity injections to ease the strain on financial systems and stimulus measures to buffer the shock to businesses and consumers. These measures have helped stabilize the markets over the short term, and most markets have recovered most of their losses. But volatility will likely remain elevated until the health crisis itself is under control (via fewer new cases, lower infection rates and/or verified treatments or vaccines). There are still many unknowns and new information is incoming daily, compounding the difficulty of modeling outcomes for epidemiologists and economists alike.
This material is not intended to be a recommendation or investment advice, does not constitute a solicitation to buy, sell or hold a security or an investment strategy and is not provided in a fiduciary capacity. The information provided does not take into account the specific objectives or circumstances of any particular investor, or suggest any specific course of action. Investment decisions should be made based on an investor’s objectives and circumstances and in consultation with his or her advisors.
Certain statements in this report are forward-looking statements. Discussions of specific investments are for illustration only and are not intended as recommendations of individual investments. The forward-looking statements and other views expressed herein are those of the portfolio manager as of the date of this report. Actual future results or occurrences may differ significantly from those anticipated in any forward-looking statements and the views expressed herein are subject to change at any time, due to numerous market and other factors. The Funds disclaim any obligation to update publicly or revise any forward-looking statements or views expressed herein.
For financial recording purposes, the ratings disclosed are the highest rating given by one of the following national rating agencies: Standard & Poor’s (S&P), Moody’s Investors Service, Inc. (Moody’s) or Fitch, Inc. (Fitch). This treatment of split-rated securities may differ from that used for other purposes as for Fund investment policies. Credit ratings are subject to change. AAA, AA, A and BBB are investment grade ratings; BB, B, CCC, CC, C and D are below investment grade ratings. Holdings designated N/R are not rated by these national rating agencies.
Refer to the Glossary of Terms Used in this Report for further definition of the terms used within this section.
5
Portfolio Managers’ Comments (continued)
Nuveen, LLC and our portfolio management teams are monitoring the situation carefully and continuously refining our views and approaches to managing the Funds to best pursue investment objectives while mitigating risks through all market environments.
What key strategies were used to manage the Fund during this six-month reporting period ended June 30, 2020?
The Fund invests at least 65% of its managed assets in mortgage-backed securities (MBS), including residential MBS and commercial MBS, and up to 35% in non-mortgage related asset-backed securities (ABS) including but not limited to any asset that generates reliable cash flows including collateralized loan obligations as well as pools of consumer auto loans, credit card receivables, aircraft leases and maintenance agreements, timeshare agreements, and solar photovoltaics (the conversion of light into electricity). A maximum of 5% can be invested in catastrophe bonds, which are backed by a secured collateral account and considered by the Fund to be ABS. The Fund uses leverage.
During the reporting period, the Fund reinvested money received from mortgage paydowns into high quality assets across the securitized markets that were trading at discounted prices. As the securitized market rebounded and the opportunity set narrowed, we were able to use our research and trading platforms to identify attractive opportunities. At the end of the reporting period, the Fund’s allocations were approximately 47% to MBS, 26% to CMBS, 25% to ABS and 2% in cash.
How did the Fund perform during this six-month reporting period ended June 30, 2020?
The tables in the Performance Overview and Holding Summaries section of this report provide total returns for the six-month, one-year, five-year and ten-year periods ended June 30, 2020. The Fund’s total returns at net asset value (NAV) are compared with the performance of a corresponding market index.
For the six-month reporting period, JLS underperformed the Linked Index, which is represented by Barclays U.S. Aggregate Bond Index since the Fund’s inception to 10/13/19 and beginning 10/14/19 the ICE BofA U.S. ABS and CMBS Index.
For the reporting period, concerns over the COVID-19 crisis deeply impacted the U.S. markets and economy. Beginning in February 2020, the sell-off in the securitized markets was fairly orderly. However, in mid-March 2020 shareholder redemptions in large mutual funds and real estate investment trusts (REITs) led to forced liquidation and some of the widest spreads of the reporting period. There was significant repricing across all sectors, with lower quality and less liquid sectors suffering the most damage. Across the securitized markets, the RMBS market experienced the most selling pressure, followed by the ABS and CMBS markets.
During the second half of the reporting period, massive monetary and fiscal policy by both the U.S. government and the U.S. Federal Reserve (Fed) contributed to the securitized market’s rebound. The Fed established the Term Asset-Backed Securities Loan Facility (TALF) that enabled the issuance of ABS backed by student loans, auto loans, credit card loans, loans guaranteed by the Small Business Administration and certain other assets. Across the securitized markets, the RMBS market experienced rebounded the fastest from the first half of the reporting period lows, followed by the ABS and CMBS markets.
During the first half of the reporting period, the Fed quickly acted to cut rates during the sell-off which benefited the Fund’s allocation to CMBS due to their longer dated and fixed-rate characteristics. Other contributors included holdings in high quality ABS at the front end of the yield curve (typically those with one- to three-year maturities). Credit risk transfer securities tranche 1 (CRT M1) also contributed to performance. These are general obligations of Fannie Mae and Freddie Mac and are mandated to expand the secondary market for residential mortgage loans through securitization in the RMBS space. In addition, the Fund’s nearly 50% allocation to RMBS securities contributed to its outperformance especially during the second half of the reporting period. RMBS securities experienced the strongest
6
rebound. Security selection also contributed to relative performance. The Fund received money from mortgage paydowns and reinvested it in high quality issues with wider spreads early in the reporting period. When the new issue market opened up again later in the reporting period, spreads tightened which benefited the Fund’s performance
Several positions detracted from performance. The Fund’s holdings in aircraft ABS detracted from relative performance as the aviation industry was particularly hard hit by the impact of the COVID-19 crisis. In addition, CMBS securities with higher exposure to COVID-19 risks also dampened performance as concerns spread about widespread defaults and liquidity dislocation spread. Lastly, a long position in CRT M2, which are in a lower tranche of the capital structure. Although the Fed intervened and began buying mortgage debt backed by government agencies, CRT M2s sold off on fears that there could be liquidity strains as a wave of missed mortgage payments.
The Fund utilized U.S. Treasury futures for duration and yield curve management purposes. The futures contracts impact on performance was negative during the reporting period.
7
Fund Leverage
IMPACT OF THE FUND’S LEVERAGE STRATEGY ON PERFORMANCE
One important factor impacting the returns of the Fund’s common shares relative to its comparative benchmarks was the Fund’s use of leverage through reverse repurchase agreements. The Fund uses leverage because our research has shown that, over time, leveraging provides opportunities for additional income. The opportunity arises when short-term rates that the Fund pays on its leveraging instruments are lower than the interest the Fund earns on its portfolio securities that it has bought with the proceeds of that leverage. This has been particularly true in the recent market environment where short-term rates have been low by historical standards.
However, use of leverage can expose Fund common shares to additional price volatility. When the Fund uses leverage, the Fund’s common shares will experience a greater increase in their net asset value if the securities acquired through the use of leverage increase in value, but will also experience a correspondingly larger decline in their net asset value if the securities acquired through leverage decline in value. All this will make the shares’ total return performance more variable over time.
In addition, common share income in levered funds will typically decrease in comparison to unlevered funds when short-term interest rates increase and increase when short-term interest rates decrease. In recent quarters, fund leverage expenses have generally tracked the overall movement of short-term interest rates. While fund leverage expenses are somewhat higher than their recent lows, leverage nevertheless continues to provide the opportunity for incremental common share income, particularly over longer-term periods.
The Fund’s use of leverage had a negative impact on total return performance during this reporting period. The negative impact of leverage during the brief but severe COVID-19 induced market downturn in March was greater than the positive impact of leverage during the remainder of the reporting period. More specifically, this net negative contribution of leverage was amplified during the market downturn in part because the Fund used proceeds from portfolio sales to pay down borrowings and reduce its elevated leverage ratio, which rose as prices of portfolio securities, including those sold for de-levering purposes, declined. Management believes, however, that the potential benefits from leverage continue to outweigh the associated increase in risk and total return variability previously described.
As of June 30, 2020, the Fund’s percentages of leverage are as shown in the accompanying table.
| | | | |
| | | JLS | |
Effective Leverage* | | | 20.95 | % |
Regulatory Leverage* | | | 0.00 | % |
| * | Effective leverage is the Fund’s effective economic leverage, and includes both regulatory leverage and the leverage effects of certain derivative and other investments in a Fund’s portfolio that increase the Fund’s investment exposure. Regulatory leverage consists of preferred shares issued or borrowings of the Fund. Both of these are part of the Fund’s capital structure. The Fund, however, may from time to time borrow on a typically transient basis in connection with its day-to-day operations, primarily in connection with the need to settle portfolio trades. Such incidental borrowings are excluded from the calculation of the Fund’s effective leverage ratio. Regulatory leverage is subject to asset coverage limits set forth in the Investment Company Act of 1940. |
THE FUND’S LEVERAGE
Reverse Repurchase Agreements
As noted above, the Fund utilized reverse repurchase agreements, in which the Fund sells to a counterparty a security that it holds with a contemporaneous agreement to repurchase the same security at an agreed-upon price and date. The Fund’s transactions in reverse repurchase agreements are as shown in the accompanying table.
8
| | | | | | | | | | | | | | | | | | | | | | | | | | | | | | | | | | |
| Current Reporting Period | | | | | | Subsequent to the Close of
the Reporting Period | |
Outstanding
Balance as of
January 1, 2020 | | | Sales | | | Purchases | | | Outstanding
Balance as of
June 30, 2020 | | | Average Balance
Outstanding | | | | | | Sales | | | Purchases | | | Outstanding
Balance as of
August 27, 2020 | |
| | $52,050,000 | | | | $102,639,199 | | | | $(124,556,500) | | | | $30,132,699 | | | | $41,066,188 | | | | | | | | $ — | | | | $ — | | | | $30,132,699 | |
Refer to Notes to Financial Statements, Note 8 – Fund Leverage for further details.
9
Common Share Information
DISTRIBUTION INFORMATION
The following information regarding the Fund’s distributions is current as of June 30, 2020.
The Fund has a cash flow-based distribution program. Under this program, the Fund seeks to maintain an attractive and stable regular distribution based on the Fund’s net cash flow received from its portfolio investments. Fund distributions are not intended to include expected portfolio appreciation; however, the Fund invests in securities that make payments which ultimately may be fully or partially treated as gains or return of capital for tax purposes. This tax treatment will generally “flow through” to the Fund’s distributions, but the specific tax treatment is often not known with certainty until after the end of the Fund’s tax year. As a result, regular distributions throughout the year are likely to be re-characterized for tax purposes as either long-term gains (both realized and unrealized), or as a non-taxable return of capital.
The figures in the table below provide an estimate as of June 30, 2020 of the sources (for tax purposes) of the Fund’s distributions. These sources estimates include amounts currently estimated to be attributable to realized gains and/or returns of capital. The Fund attributes these non-income sources equally to each regular distribution throughout the fiscal year. The estimated information shown below is for the distributions paid on common shares for all prior months in the current fiscal year. These amounts should not be used for tax reporting purposes, and the distribution sources may differ for financial reporting than for tax reporting. The final determination of the tax characteristics of all distributions paid in 2020 will be made in early 2021 and reported to you on Form 1099-DIV. More details about the tax characteristics of the Fund’s distributions are available on www.nuveen.com/CEFdistributions.
Data as of June 30, 2020
| | | | | | | | | | | | | | | | | | | | | | | | | | | | | | | | | | |
| Current Month | | | | | | Fiscal YTD | |
| | | | Estimated Percentage of Distribution | | | | | | Estimated Per Share Amounts | |
Latest
Declared
Distribution | | | Net
Investment
Income | | | Realized
Gains | | | Return of
Capital | | | | | | Distributions | | | Net
Investment
Income | | | Realized
Gains | | | Return of
Capital | |
| | $0.0680 | | | | 80.0% | | | | 0.0% | | | | 20.0% | | | | | | | | $0.5680 | | | | $0.4544 | | | | $ — | | | | $0.1136 | |
The following table provides information regarding Fund distributions and total return performance over various time periods. This information is intended to help you better understand whether Fund returns for the specified time periods were sufficient to meet Fund distributions.
Data as of June 30, 2020
| | | | | | | | | | | | | | | | | | | | | | | | | | | | |
| | | | | | | | Annualized | | | | | Cumulative | |
Inception
Date | | Latest
Declared
Distribution | | | | | Current
Distribution on
NAV | | | 1-Year
Return on
NAV | | | 5-Year
Return on
NAV | | | | | Fiscal YTD
Distributions on
NAV | | | Fiscal YTD Return
on NAV | |
| 11/25/2009 | | | $0.0680 | | | | | | 3.94% | | | | (5.81)% | | | | 3.59% | | | | | | 2.74% | | | | (6.74)% | |
10
NUVEEN CLOSED-END FUND DISTRIBUTION AMOUNTS
The Nuveen Closed-End Funds’ monthly and quarterly periodic distributions to shareholders are posted on www.nuveen.com and can be found on Nuveen’s enhanced closed-end fund resource page, which is at https://www.nuveen.com/resource-center-closed-endfunds, along with other Nuveen closed-end fund product updates. To ensure timely access to the latest information, shareholders may use a subscribe function, which can be activated at this web page (https://www.nuveen.com/subscriptions).
COMMON SHARE REPURCHASES
During August 2020 (subsequent to the close of the reporting period), the Fund’s Board of Trustees reauthorized an open-market share repurchase program, allowing each Fund to repurchase an aggregate of up to approximately 10% of its outstanding shares.
As of June 30, 2020, and since the inception of the Funds’ repurchase programs, the Funds have cumulatively repurchased and retired their outstanding common shares as shown in the accompanying table.
| | | | |
| | | JLS | |
Common shares cumulatively repurchased and retired | | | 0 | |
Common shares authorized for repurchase | | | 545,000 | |
During the current reporting period, the Fund did not repurchase any of their outstanding common shares.
OTHER COMMON SHARE INFORMATION
As of June 30, 2020, and during the current reporting period, the Fund’s common share prices were trading at a premium/(discount) to its common share NAV as shown in the accompanying table.
| | | | |
| | | JLS | |
Common share NAV | | $ | 20.72 | |
Common share price | | $ | 19.55 | |
Premium/(Discount) to NAV | | | (5.65 | )% |
6-month average premium/(discount) to NAV | | | (5.78 | )% |
11
Risk Considerations
Risk Considerations
Fund shares are not guaranteed or endorsed by any bank or other insured depository institution, and are not federally insured by the Federal Deposit Insurance Corporation.
Nuveen Mortgage and Income Fund (JLS)
Investing in closed-end funds involves risk; principal loss is possible. There is no guarantee the Fund’s investment objectives will be achieved. Closed-end fund shares may frequently trade at a discount or premium to their net asset value. Investing in mortgage-backed securities entails credit risk, the risk that the servicer fails to perform its duties, liquidity risks, interest rate risks, structure risks, prepayment risk, and geographical concentration risks. Investing in asset-backed securities entails credit risks inherent in the underlying collateral, the risk that the servicer fails to perform its duties, interest rate risk, liquidity risks and prepayment risk. Leverage increases return volatility and magnifies the Fund’s potential return and its risks; there is no guarantee a fund’s leverage strategy will be successful. These and other risk considerations are described in more detail on the Fund’s web page at www.nuveen.com/JLS.
12
THIS PAGE INTENTIONALLY LEFT BLANK
13
| | |
| JLS | | Nuveen Mortgage and Income Fund Performance Overview and Holding Summaries as of June 30, 2020 |
Refer to Glossary of Terms Used in this Report for further definition of terms used in this section.
Average Annual Total Returns as of June 30, 2020
| | | | | | | | | | | | | | | | |
| | | Cumulative | | | Average Annual | |
| | | 6-Month | | | 1-Year | | | 5-Year | | | 10-Year | |
| JLS at Common Share NAV | | | (6.74)% | | | | (5.81)% | | | | 3.59% | | | | 6.62% | |
| JLS at Common Share Price | | | (8.37)% | | | | (10.70)% | | | | 5.42% | | | | 6.66% | |
| Bloomberg Barclays U.S. Aggregate Bond Index | | | 6.14% | | | | 8.74% | | | | 4.30% | | | | 3.82% | |
| JLS Linked Benchmark1 | | | 2.37% | | | | 4.56% | | | | 3.49% | | | | 3.42% | |
Performance prior to October 14, 2019, reflects the Fund’s performance under the management of a sub-adviser using investment strategies that differed from those currently in place. Past performance is not predictive of future results. Current performance may be higher or lower than the data shown. Returns do not reflect the deduction of taxes that shareholders may have to pay on Fund distributions or upon the sale of Fund shares. Returns at NAV are net of Fund expenses, and assume reinvestment of distributions. Comparative index return information is provided for the Fund’s shares at NAV only. Indexes are not available for direct investment.
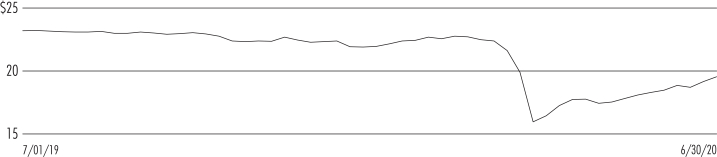
Common Share Price Performance — Weekly Closing Price
| 1 | The JLS Linked Benchmark is comprised of the Barclays U.S. Aggregate Bond Index from inception to 10/13/19 and the ICE BofA U.S. ABS & CMBS Index after 10/13/19. |
14
This data relates to the securities held in the Fund’s portfolio of investments as of the end of the reporting period. It should not be construed as a measure of performance for the Fund itself. Holdings are subject to change.
For financial reporting purposes, the ratings disclosed are the highest rating given by one of the following national rating agencies: Standard & Poor’s Group, Moody’s Investors Service, Inc. or Fitch, Inc. This treatment of split-rated securities may differ from that used for other purposes, such as for Fund investment policies. Credit ratings are subject to change. AAA, AA, A and BBB are investment grade ratings; BB, B, CCC, CC, C and D are below-investment grade ratings. Holdings designated N/R are not rated by these national rating agencies.
Fund Allocation
(% of net assets)
| | | | |
| Mortgage-Backed Securities | | | 95.8% | |
| Asset-Backed Securities | | | 32.2% | |
| U.S. Government and Agency Obligations | | | 0.1% | |
| Other Assets Less Liabilities | | | (1.6)% | |
Net Assets Plus Reverse Repurchase Agreements | | | 126.5% | |
| Reverse Repurchase Agreements | | | (26.5)% | |
Net Assets | | | 100% | |
Credit Quality
(% of total investments)
| | | | |
| U.S. Treasury/Agency | | | 3.7% | |
| AAA | | | 15.8% | |
| AA | | | 2.0% | |
| A | | | 10.8% | |
| BBB | | | 22.5% | |
| BB or Lower | | | 24.2% | |
| N/R (not rated) | | | 21.0% | |
Total | | | 100% | |
15
Shareholder Meeting Report
The annual meeting of shareholders, originally scheduled to be held on April 8, 2020 in person, was postponed to April 22, 2020 for JLS. The meeting was held virtually due to public health concerns regarding the ongoing COVID-19 pandemic; at this meeting the shareholders were asked to elect Board members.
| | | | |
| | | JLS | |
| | | Common
Shares | |
Approval of the Board Members was reached as follows: | | | | |
John K. Nelson | | | | |
For | | | 4,586,019 | |
Withhold | | | 228,771 | |
Total | | | 4,814,790 | |
Terence J. Toth | | | | |
For | | | 4,584,874 | |
Withhold | | | 229,916 | |
Total | | | 4,814,790 | |
Robert L. Young | | | | |
For | | | 4,588,277 | |
Withhold | | | 226,513 | |
Total | | | 4,814,790 | |
16
| | |
| JLS | | Nuveen Mortgage and Income Fund Portfolio of Investments June 30, 2020 |
| | | (Unaudited) |
| | | | | | | | | | | | | | | | | | | | |
Principal
Amount (000) | | | Description (1) | | Coupon | | | Maturity | | | Ratings (2) | | | Value | |
| | | |
| | | | LONG-TERM INVESTMENTS – 128.0% (99.9% of Total Investments) | | | | | | | | | |
| | | | |
| | | | MORTGAGE-BACKED SECURITIES – 95.8% (74.8% of Total Investments) | | | | | | | | | | |
| | | | | |
| $ | 5,000 | | | Angel Oak Mortgage Trust I LLC 2018-1, 144A, (3) | | | 4.100% | | | | 4/27/48 | | | | A | | | $ | 4,984,500 | |
| | 800 | | | BANK 2020-BNK25, 144A, (3) | | | 2.500% | | | | 1/15/63 | | | | BBB | | | | 606,433 | |
| | 1,000 | | | BBCMS Mortgage Trust 2020-C6, 144A | | | 3.688% | | | | 2/15/53 | | | | N/R | | | | 994,488 | |
| | 3,847 | | | BCAP LLC Trust 2007-AA1, (1-Month LIBOR reference rate + 0.180% spread), (3), (4) | | | 0.365% | | | | 3/25/37 | | | | Caa3 | | | | 3,429,594 | |
| | 1,000 | | | Benchmark 2020-B16 Mortgage Trust, 144A, (3) | | | 2.500% | | | | 2/15/53 | | | | BBB | | | | 685,844 | |
| | 1,500 | | | BX Commercial Mortgage Trust 2020-BXLP, 144A, (1-Month LIBOR reference rate + 1.600% spread), (3), (4) | | | 1.785% | | | | 12/15/36 | | | | N/R | | | | 1,436,169 | |
| | 845 | | | CD 2016-CD1 Mortgage Trust, (3) | | | 3.631% | | | | 8/10/49 | | | | A– | | | | 740,239 | |
| | 1,500 | | | CD 2016-CD2 Mortgage Trust, (3) | | | 4.159% | | | | 11/10/49 | | | | A– | | | | 1,355,013 | |
| | 878 | | | CD 2017-CD3 Mortgage Trust, (3) | | | 4.712% | | | | 2/10/50 | | | | A– | | | | 820,369 | |
| | 25 | | | CF 2020-P1 Mortgage Trust, 144A | | | 2.840% | | | | 4/15/52 | | | | N/R | | | | 26,511 | |
| | 750 | | | CF 2020-P1 Mortgage Trust, 144A | | | 10.010% | | | | 4/15/52 | | | | N/R | | | | 750,621 | |
| | 2,217 | | | ChaseFlex Trust Series 2007-2, (1-Month LIBOR reference rate + 0.280% spread), (3), (4) | | | 0.465% | | | | 5/25/37 | | | | B3 | | | | 2,044,730 | |
| | 819 | | | CHL Mortgage Pass-Through Trust 2006-HYB1 | | | 3.418% | | | | 3/20/36 | | | | Caa3 | | | | 762,051 | |
| | 1000 | | | Citigroup Commercial Mortgage Trust 2015-GC29 | | | 4.296% | | | | 4/10/48 | | | | A– | | | | 963,021 | |
| | 1,200 | | | COMM 2013-CCRE11 Mortgage Trust, (3) | | | 5.278% | | | | 8/10/50 | | | | Aa3 | | | | 1,243,251 | |
| | 500 | | | COMM 2013-CCRE9 Mortgage Trust, 144A | | | 4.386% | | | | 7/10/45 | | | | AA– | | | | 501,247 | |
| | 1,500 | | | COMM 2013-LC13 Mortgage Trust, 144A, (3) | | | 5.463% | | | | 8/10/46 | | | | BBB– | | | | 1,305,733 | |
| | 325 | | | COMM 2014-CCRE19 Mortgage Trust | | | 4.703% | | | | 8/10/47 | | | | AA– | | | | 336,473 | |
| | 1,000 | | | COMM 2014-CCRE19 Mortgage Trust, 144A, (3) | | | 4.888% | | | | 8/10/47 | | | | BBB– | | | | 625,588 | |
| | 1,000 | | | COMM 2015-CCRE22 Mortgage Trust, 144A | | | 3.000% | | | | 3/10/48 | | | | BB– | | | | 610,707 | |
| | 500 | | | COMM 2015-CCRE23 Mortgage Trust | | | 4.435% | | | | 5/10/48 | | | | N/R | | | | 494,189 | |
| | 1,500 | | | COMM 2015-CCRE24 Mortgage Trust, (3) | | | 3.463% | | | | 8/10/48 | | | | BBB– | | | | 1,124,604 | |
| | 500 | | | COMM 2015-CCRE25 Mortgage Trust | | | 4.690% | | | | 8/10/48 | | | | A– | | | | 463,320 | |
| | 750 | | | COMM 2015-CCRE26 Mortgage Trust | | | 4.630% | | | | 10/10/48 | | | | A– | | | | 737,331 | |
| | 800 | | | COMM 2015-LC21 Mortgage Trust, (3) | | | 4.484% | | | | 7/10/48 | | | | N/R | | | | 828,304 | |
| | 227 | | | COMM 2016-GCT Mortgage Trust, 144A | | | 3.577% | | | | 8/10/29 | | | | B– | | | | 207,338 | |
| | 1,885 | | | COMM Mortgage Trust, (3) | | | 4.713% | | | | 5/10/51 | | | | A– | | | | 1,818,195 | |
| | 1,500 | | | Connecticut Avenue Securities Trust 2020-R02, 144A, (1-Month LIBOR reference rate + 2.000% spread), (4) | | | 2.185% | | | | 1/25/40 | | | | B+ | | | | 1,420,053 | |
| | 243 | | | Countrywide Asset-Backed Certificates, (1-Month LIBOR reference rate + 1.350% spread), (4) | | | 1.535% | | | | 4/25/34 | | | | Ba3 | | | | 242,748 | |
| | 800 | | | CPT Mortgage Trust, 144A | | | 3.097% | | | | 11/13/39 | | | | N/R | | | | 720,686 | |
| | 1,000 | | | Ellington Financial Mortgage Trust 2019-1, 144A | | | 3.587% | | | | 6/25/59 | | | | BBB | | | | 946,407 | |
| | 1,995 | | | Fannie Mae Connecticut Avenue Securities, (1-Month LIBOR reference rate + 0.450% spread), (4) | | | 0.635% | | | | 7/25/30 | | | | BBB | | | | 1,905,789 | |
| | 4,133 | | | Fannie Mae Connecticut Avenue Securities, (1-Month LIBOR reference rate + 2.100% spread), (4) | | | 2.285% | | | | 3/25/31 | | | | Aaa | | | | 4,036,585 | |
| | 1,410 | | | Fannie Mae Connecticut Avenue Securities, (1-Month LIBOR reference rate + 2.150% spread), (4) | | | 2.335% | | | | 10/25/30 | | | | BB | | | | 1,385,870 | |
| | 1,168 | | | Fannie Mae Connecticut Avenue Securities, (1-Month LIBOR reference rate + 2.200% spread), (4) | | | 0.000% | | | | 8/25/30 | | | | Aaa | | | | 1,141,887 | |
| | 1,880 | | | Fannie Mae Connecticut Avenue Securities, (1-Month LIBOR reference rate + 3.000% spread), (3), (4) | | | 3.185% | | | | 7/25/24 | | | | Aaa | | | | 1,646,172 | |
| | 912 | | | Fannie Mae Connecticut Avenue Securities, (1-Month LIBOR reference rate + 5.900% spread), (4) | | | 6.085% | | | | 10/25/28 | | | | BBB | | | | 947,920 | |
| | 793 | | | Fannie Mae Pool | | | 3.000% | | | | 5/01/50 | | | | N/R | | | | 835,850 | |
| | 3,991 | | | Fannie Mae Pool | | | 2.500% | | | | 6/01/50 | | | | N/R | | | | 4,158,160 | |
| | 1,031 | | | First Horizon Alternative Mortgage Securities Trust 2005-AA7 | | | 3.550% | | | | 9/25/35 | | | | N/R | | | | 957,061 | |
| | 1,745 | | | First Horizon Alternative Mortgage Securities Trust 2006-FA3 | | | 6.000% | | | | 7/25/36 | | | | N/R | | | | 1,249,896 | |
| | 94 | | | Flagstar Mortgage Trust 2017-2, 144A | | | 4.111% | | | | 10/25/47 | | | | A3 | | | | 94,575 | |
| | 3,000 | | | Freddie Mac Stacr Remic Trust 2019-Hqa4, 144A, (1-Month LIBOR reference rate + 2.050% spread), (3), (4) | | | 2.235% | | | | 11/25/49 | | | | B+ | | | | 2,909,834 | |
17
| | |
| |
| JLS | | Nuveen Mortgage and Income Fund (continued) |
| |
| | Portfolio of Investments June 30, 2020 |
| | (Unaudited) |
| | | | | | | | | | | | | | | | | | | | |
Principal
Amount (000) | | | Description (1) | | Coupon | | | Maturity | | | Ratings (2) | | | Value | |
| | | | |
| | | | MORTGAGE-BACKED SECURITIES (continued) | | | | | | | | | | |
| | | | | |
| $ | 1,500 | | | Freddie Mac STACR Remic Trust 2020-DNA2, 144A, (1-Month LIBOR reference rate + 1.850% spread), (4) | | | 2.035% | | | | 2/25/50 | | | | BB | | | $ | 1,422,156 | |
| | 72 | | | Freddie Mac Stacr Remic Trust 2020-HQA2, 144A, (1-Month LIBOR reference rate + 3.100% spread), (4) | | | 3.285% | | | | 3/25/50 | | | | Ba2 | | | | 68,935 | |
| | 1,500 | | | Freddie Mac Stacr Trust 2018-HQA2, 144A, (1-Month LIBOR reference rate + 2.300% spread), (4) | | | 2.485% | | | | 10/25/48 | | | | B+ | | | | 1,444,468 | |
| | 2,220 | | | Freddie Mac STACR Trust 2019-HRP1, 144A, (1-Month LIBOR reference rate + 1.400% spread), (3), (4) | | | 1.585% | | | | 2/25/49 | | | | BBB+ | | | | 2,114,494 | |
| | 312 | | | Freddie Mac Strips, (I/O), (1-Month LIBOR reference rate + 5.920% spread), (4) | | | 5.735% | | | | 3/15/44 | | | | N/R | | | | 64,882 | |
| | 1,500 | | | Freddie Mac Structured Agency Credit Risk Debt Notes, (1-Month LIBOR reference rate + 2.350% spread), (3), (4) | | | 2.535% | | | | 4/25/30 | | | | Ba2 | | | | 1,441,461 | |
| | 2,500 | | | Freddie Mac Structured Agency Credit Risk Debt Notes, (1-Month LIBOR reference rate + 3.250% spread), (3), (4) | | | 3.435% | | | | 7/25/29 | | | | Aaa | | | | 2,521,835 | |
| | 5,000 | | | Freddie Mac Structured Agency Credit Risk Debt Notes, (1-Month LIBOR reference rate + 3.450% spread), (3), (4) | | | 3.635% | | | | 10/25/29 | | | | BBB | | | | 5,067,299 | |
| | 1,033 | | | Freddie Mac Structured Agency Credit Risk Debt Notes, (1-Month LIBOR reference rate + 4.150% spread), (3), (4) | | | 0.046% | | | | 1/25/25 | | | | Aaa | | | | 1,048,724 | |
| | 924 | | | Freddie Mac Structured Agency Credit Risk Debt Notes, 144A | | | 4.466% | | | | 11/25/48 | | | | Aaa | | | | 912,086 | |
| | 1,609 | | | GMACM Mortgage Loan Trust 2005-AF2 | | | 6.000% | | | | 12/25/35 | | | | N/R | | | | 1,502,862 | |
| | 1,000 | | | GS Mortgage Securities Trust 2015-GC30, (3) | | | 4.169% | | | | 5/10/50 | | | | N/R | | | | 1,016,547 | |
| | 14,587 | | | GS Mortgage Securities Trust 2019-GC38, (I/O) | | | 1.124% | | | | 2/10/52 | | | | AAA | | | | 939,268 | |
| | 500 | | | GS Mortgage Securities Trust 2019-GC40, 144A | | | 3.668% | | | | 7/10/52 | | | | BBB– | | | | 479,344 | |
| | 1,873 | | | GSAA Home Equity Trust 2007-8, (1-Month LIBOR reference rate + 0.450% spread), (3), (4) | | | 0.635% | | | | 8/25/37 | | | | B1 | | | | 1,835,819 | |
| | 546 | | | Hudson Yards, 144A | | | 3.041% | | | | 12/10/41 | | | | Baa3 | | | | 523,751 | |
| | 1,000 | | | Hudson Yards, 144A | | | 3.041% | | | | 12/10/41 | | | | N/R | | | | 875,474 | |
| | 2,048 | | | IndyMac INDX Mortgage Loan Trust 2005-AR11, (3) | | | 3.512% | | | | 8/25/35 | | | | Caa3 | | | | 1,761,269 | |
| | 1,170 | | | JP Morgan Mortgage Trust 2006-A6 | | | 3.955% | | | | 10/25/36 | | | | N/R | | | | 1,025,038 | |
| | 1,000 | | | JPMBB Commercial Mortgage Securities Trust 2015-C27, (3) | | | 3.898% | | | | 2/15/48 | | | | N/R | | | | 1,008,804 | |
| | 400 | | | JPMBB Commercial Mortgage Securities Trust 2015-C29 | | | 4.352% | | | | 5/15/48 | | | | A– | | | | 359,488 | |
| | 760 | | | JPMBB Commercial Mortgage Securities Trust 2015-C29, (3) | | | 4.118% | | | | 5/15/48 | | | | AA– | | | | 764,265 | |
| | 600 | | | Morgan Stanley Bank of America Merrill Lynch Trust 2014 C19 | | | 4.000% | | | | 12/15/47 | | | | N/R | | | | 541,890 | |
| | 590 | | | Morgan Stanley Capital I Trust 2011-C1, 144A | | | 0.056% | | | | 9/15/47 | | | | AAA | | | | 585,710 | |
| | 226 | | | Morgan Stanley Capital I Trust 2015-MS1 | | | 4.166% | | | | 5/15/48 | | | | N/R | | | | 230,276 | |
| | 274 | | | Morgan Stanley Mortgage Loan Trust 2007-15AR | | | 3.347% | | | | 11/25/37 | | | | CCC | | | | 225,447 | |
| | 1,000 | | | Natixis Commercial Mortgage Securities Trust 2019-1776, 144A | | | 3.902% | | | | 10/15/36 | | | | Ba3 | | | | 951,663 | |
| | 2,000 | | | Natixis Commercial Mortgage Securities Trust 2019-MILE, 144A, (1-Month LIBOR reference rate + 1.500% spread), (3), (4) | | | 1.685% | | | | 7/15/36 | | | | N/R | | | | 1,959,972 | |
| | 1,000 | | | Natixis Commercial Mortgage Securities Trust 2019-MILE, 144A, (1-Month LIBOR reference rate + 2.750% spread), (3), (4) | | | 2.935% | | | | 7/15/36 | | | | N/R | | | | 946,577 | |
| | 1,050 | | | Natixis Commercial Mortgage Securities Trust 2019-MILE, 144A, (1-Month LIBOR reference rate + 4.250% spread), (4) | | | 4.435% | | | | 7/15/36 | | | | N/R | | | | 946,247 | |
| | 2,148 | | | RALI Series 2007-QS2 Trust, (3) | | | 6.250% | | | | 1/25/37 | | | | Caa3 | | | | 1,875,540 | |
| | 4,637 | | | RAMP Series 2006-NC2 Trust, (1-Month LIBOR reference rate + 0.290% spread), (3), (4) | | | 0.475% | | | | 2/25/36 | | | | Aaa | | | | 4,551,481 | |
| | 2,275 | | | STACR Trust 2018-HRP1, 144A, (1-Month LIBOR reference rate + 1.650% spread), (3), (4) | | | 1.835% | | | | 4/25/43 | | | | BB– | | | | 2,247,947 | |
| | 1,500 | | | Tricon American Homes 2016-SFR1 Trust, 144A | | | 4.878% | | | | 11/17/33 | | | | N/R | | | | 1,498,388 | |
| | 605 | | | UBS-Barclays Commercial Mortgage Trust 2013-C5, 144A, (3) | | | 4.235% | | | | 3/10/46 | | | | A3 | | | | 556,896 | |
| | 1,512 | | | Vericrest Opportunity Loan Trust 2019-NPL2, 144A | | | 3.967% | | | | 2/25/49 | | | | N/R | | | | 1,519,046 | |
| | 1,500 | | | VOLT LXXXIV LLC, 144A | | | 3.967% | | | | 12/27/49 | | | | N/R | | | | 1,450,618 | |
| | 1,241 | | | WaMu Mortgage Pass-Through Certificates Series 2006-AR7 Trust, (12MTA reference rate + 0.980% spread), (4) | | | 2.484% | | | | 7/25/46 | | | | Caa3 | | | | 1,101,502 | |
| | 1,190 | | | Wells Fargo Commercial Mortgage Trust 2012-LC5, 144A, (3) | | | 4.918% | | | | 10/15/45 | | | | Baa3 | | | | 1,162,499 | |
| | 1,300 | | | Wells Fargo Commercial Mortgage Trust 2015-NXS1, (3) | | | 4.296% | | | | 5/15/48 | | | | BBB– | | | | 1,010,716 | |
| | 435 | | | Wells Fargo Commercial Mortgage Trust 2015-NXS3 | | | 4.694% | | | | 9/15/57 | | | | N/R | | | | 396,711 | |
| | 564 | | | Wells Fargo Commercial Mortgage Trust 2015-NXS3 | | | 4.694% | | | | 9/15/57 | | | | N/R | | | | 551,297 | |
| | 1,000 | | | Wells Fargo Commercial Mortgage Trust 2016-C32, (3) | | | 4.884% | | | | 1/15/59 | | | | N/R | | | | 1,051,996 | |
| | 1,000 | | | WFRBS Commercial Mortgage Trust 2013-C18 | | | 4.845% | | | | 12/15/46 | | | | A3 | | | | 906,351 | |
| $ | 129,264 | | | Total Mortgage-Backed Securities (cost $113,598,213) | | | | | | | | | | | | | | | 108,962,395 | |
18
| | | | | | | | | | | | | | | | | | | | |
Principal
Amount (000) | | | Description (1) | | Coupon | | | Maturity | | | Ratings (2) | | | Value | |
| | | |
| | | | ASSET-BACKED SECURITIES – 32.2% (25.1% of Total Investments) | | | | | | | |
| | | | | |
| $ | 961 | | | AASET 2020-1 Trust, 144A | | | 6.413% | | | | 1/16/40 | | | | BB | | | $ | 357,212 | |
| | 971 | | | Adams Outdoor Advertising LP, 144A | | | 4.810% | | | | 11/15/48 | | | | A | | | | 987,163 | |
| | 1,500 | | | Adams Outdoor Advertising LP, 144A | | | 7.356% | | | | 11/15/48 | | | | BB | | | | 1,459,385 | |
| | 605 | | | Applebee’s Funding LLC / IHOP Funding LLC, 144A | | | 4.194% | | | | 6/07/49 | | | | BBB | | | | 536,230 | |
| | 500 | | | Avis Budget Rental Car Funding AESOP LLC, 144A | | | 3.450% | | | | 3/20/23 | | | | AAA | | | | 501,613 | |
| | 1,275 | | | Avis Budget Rental Car Funding AESOP LLC, 144A | | | 4.530% | | | | 3/20/23 | | | | BBB | | | | 1,197,444 | |
| | 775 | | | CARS-DB4 LP, 144A | | | 4.520% | | | | 2/15/50 | | | | BBB | | | | 703,474 | |
| | 1,200 | | | Cayuga Park CLO, Ltd, 144A, (3-Month LIBOR reference rate + 4.000% spread), (4), (WI/DD) | | | 0.000% | | | | 7/17/31 | | | | N/R | | | | 1,200,000 | |
| | 300 | | | Cayuga Park CLO, Ltd, 144A, (3-Month LIBOR reference rate + 7.500% spread), (4), (WI/DD) | | | 0.000% | | | | 7/17/31 | | | | N/R | | | | 297,000 | |
| | 500 | | | CIFC Funding 2015-IV Ltd, 144A, (3-Month LIBOR reference rate + 4.000% spread), (4) | | | 0.000% | | | | 10/20/27 | | | | Baa3 | | | | 494,730 | |
| | 417 | | | DB Master Finance LLC, 144A | | | 4.021% | | | | 5/20/49 | | | | BBB | | | | 438,639 | |
| | 232 | | | Domino’s Pizza Master Issuer LLC, 144A | | | 3.082% | | | | 7/25/47 | | | | BBB+ | | | | 237,011 | |
| | 49 | | | Domino’s Pizza Master Issuer LLC, 144A | | | 4.118% | | | | 7/25/47 | | | | BBB+ | | | | 52,577 | |
| | 1,000 | | | Drive Auto Receivables Trust 2020-2 | | | 3.050% | | | | 5/15/28 | | | | BBB | | | | 1,014,182 | |
| | 980 | | | Driven Brands Funding LLC, 144A | | | 4.739% | | | | 4/20/48 | | | | BBB– | | | | 1,037,144 | |
| | 500 | | | DT Auto Owner Trust 2020-2, 144A | | | 3.280% | | | | 3/16/26 | | | | A | | | | 516,076 | |
| | 1,500 | | | Four Seas LP, 144A | | | 4.950% | | | | 8/28/27 | | | | N/R | | | | 1,481,641 | |
| | 1000 | | | Caelus Re VI Ltd, 144A, (3-Month U.S. Treasury Bill reference rate + 5.500% spread), (4) | | | 5.629% | | | | 6/07/23 | | | | N/R | | | | 964,400 | |
| | 500 | | | Galaxy XXIX CLO Ltd, 144A, (3-Month LIBOR reference rate + 2.400% spread), (4) | | | 2.792% | | | | 11/15/26 | | | | Baa3 | | | | 463,663 | |
| | 487 | | | Hilton Grand Vacations Trust 2020-A, 144A | | | 4.220% | | | | 2/25/39 | | | | A | | | | 489,112 | |
| | 974 | | | Hilton Grand Vacations Trust 2020-A, 144A | | | 6.420% | | | | 2/25/39 | | | | BBB | | | | 984,583 | |
| | 1,433 | | | Horizon Aircraft Finance II Ltd, 144A | | | 4.703% | | | | 7/15/39 | | | | BBB | | | | 790,953 | |
| | 732 | | | Horizon Aircraft Finance III Ltd, 144A | | | 4.458% | | | | 11/15/39 | | | | BBB | | | | 405,327 | |
| | 530 | | | Jack in the Box Funding LLC, 144A | | | 3.982% | | | | 8/25/49 | | | | BBB | | | | 546,494 | |
| | 653 | | | Jack in the Box Funding LLC, 144A | | | 4.476% | | | | 8/25/49 | | | | BBB | | | | 679,188 | |
| | 608 | | | LUNAR AIRCRAFT 2020-1 LTD, 144A | | | 4.335% | | | | 2/15/45 | | | | BBB | | | | 331,044 | |
| | 561 | | | LUNAR AIRCRAFT 2020-1 LTD, 144A | | | 6.413% | | | | 2/15/45 | | | | BB | | | | 206,508 | |
| | 1,375 | | | Magnetite XXIII Ltd, 144A, (3-Month LIBOR reference rate + 6.750% spread), (4) | | | 7.741% | | | | 10/25/32 | | | | BB– | | | | 1,299,796 | |
| | 283 | | | Morgan Stanley ABS Capital I Inc Trust 2004-HE6, (1-Month LIBOR reference rate + 0.825% spread), (4) | | | 1.010% | | | | 8/25/34 | | | | BBB+ | | | | 279,035 | |
| | 800 | | | Mosaic Solar Loan Trust 2020-1, 144A | | | 4.470% | | | | 4/20/46 | | | | N/R | | | | 808,000 | |
| | 540 | | | Mosaic Solar Loan Trust 2020-1, 144A | | | 6.910% | | | | 4/20/46 | | | | N/R | | | | 545,400 | |
| | 1,596 | | | MVW 2019-2 LLC, 144A | | | 2.220% | | | | 10/20/38 | | | | AAA | | | | 1,595,603 | |
| | 479 | | | MVW Owner Trust 2017-1, 144A | | | 0.024% | | | | 12/20/34 | | | | AAA | | | | 476,711 | |
| | 860 | | | MVW Owner Trust 2018-1, 144A | | | 3.450% | | | | 1/21/36 | | | | AAA | | | | 878,941 | |
| | 993 | | | MVW Owner Trust 2019-1, 144A | | | 2.890% | | | | 11/20/36 | | | | AAA | | | | 1,009,614 | |
| | 1,250 | | | Neuberger Berman Loan Advisers CLO 37 Ltd, 144A, (3-Month LIBOR reference rate + 7.050% spread), (4) | | | 7.219% | | | | 7/20/31 | | | | BB– | | | | 1,237,500 | |
| | 1,318 | | | SERVPRO Master Issuer LLC, 144A | | | 3.882% | | | | 10/25/49 | | | | BBB– | | | | 1,325,410 | |
| | 591 | | | Sesac Finance LLC, 144A | | | 5.216% | | | | 7/25/49 | | | | N/R | | | | 606,476 | |
| | 250 | | | Sierra Ltd, 144A, (3-Month U.S. Treasury Bill reference rate + 3.250% spread), (4) | | | 3.379% | | | | 12/28/22 | | | | N/R | | | | 248,625 | |
| | 735 | | | Sierra Timeshare 2018-2 Receivables Funding LLC, 144A | | | 3.500% | | | | 6/20/35 | | | | AAA | | | | 746,728 | |
| | 422 | | | Sierra Timeshare 2019-3 Receivables Funding LLC, 144A | | | 4.180% | | | | 8/20/36 | | | | BB | | | | 382,291 | |
| | 767 | | | Sonic Capital LLC, 144A | | | 3.845% | | | | 1/20/50 | | | | BBB | | | | 804,355 | |
| | 660 | | | START Ireland, 144A | | | 5.095% | | | | 3/15/44 | | | | BB | | | | 330,767 | |
| | 500 | | | Sutter Re Ltd, 144A, (3-Month U.S. Treasury Bill reference rate + 5.000% spread), (4) | | | 5.129% | | | | 6/06/22 | | | | N/R | | | | 502,650 | |
| | 509 | | | Taco Bell Funding LLC, 144A | | | 4.970% | | | | 5/25/46 | | | | BBB | | | | 538,873 | |
| | 246 | | | Taco Bell Funding LLC, 144A | | | 4.318% | | | | 11/25/48 | | | | BBB | | | | 251,490 | |
| | 1,000 | | | Tesla Auto Lease Trust 2018-B, 144A | | | 7.870% | | | | 6/20/22 | | | | Ba3 | | | | 1,037,472 | |
| | 710 | | | Tesla Auto Lease Trust 2019-A, 144A | | | 5.480% | | | | 5/22/23 | | | | Ba3 | | | | 726,263 | |
| | 1,000 | | | Voya CLO 2020-1 Ltd, 144A, (3-Month LIBOR reference rate + 4.250% spread), (4) | | | 4.553% | | | | 7/16/31 | | | | BBB– | | | | 1,000,000 | |
| | 1,000 | | | Voya CLO 2020-1 Ltd, 144A, (3-Month LIBOR reference rate + 7.550% spread), (4) | | | 7.853% | | | | 7/16/31 | | | | BB– | | | | 980,000 | |
| | 481 | | | VSE 2018-A VOI Mortgage LLC, 144A | | | 3.560% | | | | 2/20/36 | | | | AAA | | | | 490,937 | |
| | 113 | | | Wendy’s Funding LLC, 144A | | | 3.783% | | | | 6/15/49 | | | | BBB | | | | 118,967 | |
| $ | 39,221 | | | Total Asset-Backed Securities (cost $38,582,260) | | | | | | | | | | | | | | | 36,594,697 | |
| | | | Total Long-Term Investments (cost $152,180,473) | | | | | | | | | | | | | | | 145,557,092 | |
19
| | |
| |
| JLS | | Nuveen Mortgage and Income Fund (continued) |
| |
| | Portfolio of Investments June 30, 2020 |
| | (Unaudited) |
| | | | | | | | | | | | | | | | | | | | |
Principal
Amount (000) | | | Description (1) | | Coupon | | | Maturity | | | Ratings (2) | | | Value | |
| | | |
| | | | SHORT-TERM INVESTMENTS – 0.1% (0.1% of Total Investments) | | | | | | | | | |
| | | |
| | | | U.S. GOVERNMENT AND AGENCY OBLIGATIONS – 0.1% (0.1% of Total Investments) | | | | | | | |
| | | | | |
| $ | 130 | | | Federal Agricultural Mortgage Corp Discount Notes | | | 0.000% | | | | 7/01/20 | | | | N/R | | | $ | 130,000 | |
| | | | Total Short-Term Investments (cost $130,000) | | | | | | | | | | | | | | | 130,000 | |
| | | | Total Investments (cost $152,310,473) – 128.1% | | | | | | | | | | | | | | | 145,687,092 | |
| | | | Reverse Repurchase Agreements – (26.5)% (5) | | | | | | | | | | | | | | | (30,132,699 | ) |
| | | | Other Assets Less Liabilities – (1.6)% | | | | | | | | | | | | | | | (1,853,281 | ) |
| | | | Net Assets Applicable to Common Shares – 100% | | | | | | | | | | | | | | $ | 113,701,112 | |
For Fund portfolio compliance purposes, the Fund’s industry classifications refer to any one or more of the industry sub-classifications used by one or more widely recognized market indexes or ratings group indexes, and/or as defined by Fund management. This definition may not apply for purposes of this report, which may combine industry sub-classifications into sectors for reporting ease.
| (1) | All percentages shown in the Portfolio of Investments are based on net assets applicable to common shares unless otherwise noted. |
| (2) | For financial reporting purposes, the ratings disclosed are the highest of Standard & Poor’s Group (“Standard & Poor’s”), Moody’s Investors Service, Inc. (“Moody’s”) or Fitch, Inc. (“Fitch”) rating. This treatment of split-rated securities may differ from that used for other purposes, such as for Fund investment policies. Ratings below BBB by Standard & Poor’s, Baa by Moody’s or BBB by Fitch are considered to be below investment grade. Holdings designated N/R are not rated by any of these national rating agencies. |
| (3) | Investment, or portion of investment, has been pledged to collateralize the net payment obligations for investments in reverse repurchase agreements. As of the end of the reporting period, investments with a value of $56,112,168 have been pledged as collateral for reverse repurchase agreements. |
| (4) | Variable rate security. The rate shown is the coupon as of the end of the reporting period. |
| (5) | Reverse Repurchase Agreements as a percentage of Total Investments is 20.7%. |
| 12MTA | Federal Reserve U.S. 12-Month Cumulative Treasury Average 1-Year CMT. |
| 144A | Investment is exempt from registration under Rule 144A of the Securities Act of 1933, as amended. These investments may only be resold in transactions exempt from registration, which are normally those transactions with qualified institutional buyers. |
| I/O | Interest only security. |
| LIBOR | London Inter-Bank Offered Rate |
| WI/DD | Purchased on a when-issued or delayed delivery basis. |
See accompanying notes to financial statements.
20
Statement of Assets and Liabilities
June 30, 2020
(Unaudited)
| | | | |
Assets | | | | |
Long-term investments, at value (cost $152,180,473) | | $ | 145,557,092 | |
Short-term investments, at value (cost approximates value) | | | 130,000 | |
Cash | | | 25,146 | |
Receivable for Interest | | | 389,183 | |
Other assets | | | 53,452 | |
Total assets | | | 146,154,873 | |
Liabilities | | | | |
Reverse repurchase agreements | | | 30,132,699 | |
Payable for: | | | | |
Dividends | | | 370,664 | |
Investments purchased – when-issued/delayed-delivery settlement | | | 1,497,000 | |
Accrued expenses: | | | | |
Interest | | | 248,723 | |
Management fees | | | 24,084 | |
Trustees fees | | | 49,911 | |
Other | | | 130,680 | |
Total liabilities | | | 32,453,761 | |
Net assets applicable to common shares | | $ | 113,701,112 | |
Common shares outstanding | | | 5,487,440 | |
Net asset value (“NAV”) per common share outstanding | | $ | 20.72 | |
Net assets applicable to common shares consist of: | | | | |
Common shares, $0.01 par value per share | | $ | 54,874 | |
Paid-in surplus | | | 124,995,304 | |
Total distributable earnings | | | (11,349,066 | ) |
Net assets applicable to common shares | | $ | 113,701,112 | |
Authorized common shares | | | Unlimited | |
See accompanying notes to financial statements.
21
Statement of Operations
Six Months Ended June 30, 2020
(Unaudited)
| | | | |
Investment Income | | $ | 3,324,614 | |
Expenses | | | | |
Management fees | | | 738,811 | |
Interest expense | | | 625,495 | |
Custodian fees | | | 19,071 | |
Trustees fees | | | 825 | |
Professional fees | | | 102,148 | |
Shareholder reporting expenses | | | 6,530 | |
Shareholder servicing agent fees | | | 62 | |
Stock exchange listing fees | | | 5,798 | |
Investor relations expenses | | | 30,993 | |
Other | | | 13,932 | |
Total expenses before fee waiver/expense reimbursement | | | 1,543,665 | |
Fee waiver/expense reimbursement | | | (938,941 | ) |
Net expenses | | | 604,724 | |
Net investment income (loss) | | | 2,719,890 | |
Realized and Unrealized Gain (Loss) | | | | |
Net realized gain (loss) from investments | | | (2,471,467 | ) |
Change in net unrealized appreciation (depreciation) of investments | | | (8,683,107 | ) |
Net realized and unrealized gain (loss) | | | (11,154,574 | ) |
Net increase (decrease) in net assets applicable to common shares from operations | | $ | (8,434,684 | ) |
See accompanying notes to financial statements.
22
Statement of Changes in Net Assets
(Unaudited)
| | | | | | | | |
| | | Six Months
Ended
6/30/20 | | | Year
Ended
12/31/19 | |
Operations | | | | | | | | |
Net investment income (loss) | | $ | 2,719,890 | | | $ | 10,327,349 | |
Net realized gain (loss) from: | | | | | | | | |
Investments | | | (2,471,467 | ) | | | (3,745,116 | ) |
Futures contracts | | | — | | | | (2,436,470 | ) |
Change in net unrealized appreciation (depreciation) of: | | | | | | | | |
Investments | | | (8,683,107 | ) | | | 13,359,106 | |
Futures contracts | | | — | | | | 314,651 | |
Net increase (decrease) in net assets applicable to common shares from operations | | | (8,434,684 | ) | | | 17,819,520 | |
Distributions to Common Shareholders | | | | | | | | |
Dividends | | | (3,116,866 | ) | | | (12,059,972 | ) |
Return of capital | | | — | | | | (6,039,324 | ) |
Decrease in net assets applicable to common shares from distributions to common shareholders | | | (3,116,866 | ) | | | (18,099,296 | ) |
Capital Share Transactions | | | | | | | | |
Common shares: | | | | | | | | |
Net proceeds from shares issued to shareholders due to reinvestment of distributions | | | — | | | | 14,734 | |
Cost of shares repurchased and retired through tender offer | | | — | | | | (240,292,577 | ) |
Net increase (decrease) in net assets applicable to common shares from capital share transactions | | | — | | | | (240,277,843 | ) |
Net increase (decrease) in net assets applicable to common shares | | | (11,551,550 | ) | | | (240,557,619 | ) |
Net assets applicable to common shares at the beginning of period | | | 125,252,662 | | | | 365,810,281 | |
Net assets applicable to common shares at the end of period | | $ | 113,701,112 | | | $ | 125,252,662 | |
See accompanying notes to financial statements.
23
Statement of Cash Flows
Six Months Ended June 30, 2020
| | | | |
Cash Flows from Operating Activities: | | | | |
Net Increase (Decrease) in Net Assets Applicable to Common Shares from Operations | | $ | (8,434,684 | ) |
Adjustments to reconcile the net increase (decrease) in net assets applicable to common shares from operations to net cash provided by (used in) operating activities: | | | | |
Purchases of investments | | | (100,599,806 | ) |
Proceeds from sales and maturities of investments | | | 114,147,643 | |
Proceeds from (Purchase of) short-term investments, net | | | 7,449,769 | |
Amortization (Accretion) of premiums and discounts, net | | | (70,099 | ) |
(Increase) Decrease in: | | | | |
Receivable for interest | | | 8,358 | |
Receivable for investments sold | | | 1,168,463 | |
Receivable from Adviser | | | 82,348 | |
Other assets | | | (2,275 | ) |
Increase (Decrease) in: | | | | |
Investments purchased – regular settlement | | | (1,184,469 | ) |
Investments purchased – when-issued/delayed-delivery settlement | | | 1,247,000 | |
Accrued management fees | | | 24,084 | |
Accrued interest on borrowings | | | (3,611 | ) |
Accrued trustees fees | | | (4,977 | ) |
Accrued other expenses | | | (87,226 | ) |
Net realized (gain) loss from: | | | | |
Investments | | | 2,471,467 | |
Paydowns | | | (225,619 | ) |
Change in net unrealized (appreciation) depreciation of investments | | | 8,683,107 | |
Net cash provided by (used in) operating activities | | | 24,669,473 | |
Cash Flow from Financing Activities: | | | | |
Proceeds from reverse repurchase agreements | | | 102,639,199 | |
Purchase of reverse repurchase agreements | | | (124,556,500 | ) |
Cash distributions paid to common shareholders | | | (2,746,202 | ) |
Net cash provided by (used in) financing activities | | | (24,663,503 | ) |
Net Increase (Decrease) in Cash | | | 5,970 | |
Cash at the beginning of period | | | 19,176 | |
Cash at the end of period | | | 25,146 | |
| |
| Supplemental Disclosure of Cash Flow Information | | | |
Cash paid for interest (excluding costs) | | $ | 629,106 | |
See accompanying notes to financial statements.
24
THIS PAGE INTENTIONALLY LEFT BLANK
25
Financial Highlights
(Unaudited)
Selected data for a share outstanding throughout each period:
| | | | | | | | | | | | | | | | | | | | | | | | | | | | | | | | | | | | | | | | |
| | | | |
| | | | | | Investment Operations | | | Less Distributions to
Common Shareholders | | | Common Share | |
| | | | | | | | | | |
| | | Beginning
Common
Share
NAV | | | Net
Investment
Income
(Loss)(a) | | | Net
Realized/
Unrealized
Gain (Loss) | | | Total | | | From
Net
Investment
Income | | | From
Accumulated
Net
Realized
Gains | | | Return
of
Capital | | | Total | | | Ending
NAV | | | Ending
Share
Price | |
Year Ended 12/31: | | | | | | | | | | | | | | | | | | | | | | | | | | | | | | | | | |
2020(f) | | $ | 22.83 | | | $ | 0.50 | | | $ | (2.04 | ) | | $ | (1.54 | ) | | $ | (0.57 | ) | | $ | — | | | $ | — | | | $ | (0.57 | ) | | $ | 20.72 | | | $ | 19.55 | |
2019 | | | 23.02 | | | | 0.76 | | | | 0.41 | | | | 1.17 | | | | (0.92 | ) | | | — | | | | (0.44 | ) | | | (1.36 | ) | | | 22.83 | | | | 21.96 | |
2018 | | | 24.70 | | | | 1.16 | | | | (0.76 | ) | | | 0.40 | | | | (1.52 | ) | | | (0.49 | ) | | | (0.07 | ) | | | (2.08 | ) | | | 23.02 | | | | 22.35 | |
2017 | | | 25.02 | | | | 1.34 | | | | 1.65 | | | | 2.99 | | | | (1.94 | ) | | | (1.37 | ) | | | — | | | | (3.31 | ) | | | 24.70 | | | | 24.69 | |
2016 | | | 25.09 | | | | 1.56 | | | | 0.08 | | | | 1.64 | | | | (1.43 | ) | | | (0.28 | ) | | | — | | | | (1.71 | ) | | | 25.02 | | | | 24.07 | |
2015 | | | 26.16 | | | | 1.28 | | | | (0.83 | ) | | | 0.45 | | | | (1.13 | ) | | | (0.25 | ) | | | (0.14 | ) | | | (1.52 | ) | | | 25.09 | | | | 22.71 | |
| | | | | | | | |
| | | Borrowings at the End of Period | |
| | | Aggregate
Amount
Outstanding
(000) | | | Asset
Coverage
Per $1,000 | |
Year Ended 12/31: | |
2020(e) | | $ | — | | | $ | — | |
2019 | | | — | | | | — | |
2018 | | | 147,200 | | | | 3,485 | |
2017 | | | 147,200 | | | | 3,666 | |
2016 | | | 147,200 | | | | 3,701 | |
2015 | | | 147,200 | | | | 3,708 | |
26
| | | | | | | | | | | | | | | | | | | | | | | | | | | | | | |
| | | | | | | Ratios/Supplemental Data
Applicable to Common Shares | |
Common Share
Total Returns | | | | | | Ratios to Average Net Assets
Before Reimbursement(c) | | | Ratios to Average Net Assets
After Reimbursement(c)(d) | | | | |
| | | | | | | |
Based
on
NAV(b) | | | Based
on
Share
Price(b) | | | Ending
Net
Assets
(000) | | | Expenses | | | Net
Investment
Income (Loss) | | | Expenses | | | Net
Investment
Income (Loss) | | | Portfolio
Turnover
Rate(e) | |
| | | | | | | | | | | | | | | | | | | | | | | | | | | | | | |
| | (6.74 | )% | | | (8.37 | )% | | $ | 113,701 | | | | 2.70 | %* | | | 3.11 | %* | | | 1.06 | %* | | | 4.75 | %* | | | 65 | % |
| | 5.16 | | | | 4.27 | | | | 125,253 | | | | 2.72 | | | | 3.08 | | | | 2.53 | | | | 3.26 | | | | 100 | |
| | 1.63 | | | | (1.06 | ) | | | 365,810 | | | | 2.89 | | | | 4.77 | | | | N/A | | | | N/A | | | | 44 | |
| | 12.21 | | | | 16.79 | | | | 392,453 | | | | 2.51 | | | | 5.12 | | | | N/A | | | | N/A | | | | 85 | |
| | 6.79 | | | | 13.97 | | | | 397,604 | | | | 2.42 | | | | 6.29 | | | | N/A | | | | N/A | | | | 73 | |
| | 1.71 | | | | 4.82 | | | | 398,601 | | | | 2.24 | | | | 4.96 | | | | N/A | | | | N/A | | | | 24 | |
| (a) | Per share Net Investment Income (Loss) is calculated using the average daily shares method. |
| (b) | Total Return Based on Common Share NAV is the combination of changes in common share NAV, reinvested dividend income at NAV and reinvested capital gains distributions at NAV, if any. The last dividend declared in the period, which is typically paid on the first business day of the following month, is assumed to be reinvested at the ending NAV. The actual reinvest price for the last dividend declared in the period may often be based on the Fund’s market price (and not its NAV), and therefore may be different from the price used in the calculation. Total returns are not annualized. |
Total Return Based on Common Share Price is the combination of changes in the market price per share and the effect of reinvested dividend income and reinvested capital gains distributions, if any, at the average price paid per common share at the time of reinvestment. The last dividend declared in the period, which is typically paid on the first business day of the following month, is assumed to be reinvested at the ending market price. The actual reinvestment for the last dividend declared in the period may take place over several days, and in some instances may not be based on the market price, so the actual reinvestment price may be different from the price used in the calculation. Total returns are not annualized.
| | | | |
| (c) | | • | | Net Investment Income (Loss) ratios reflect income earned and expenses incurred on assets attributable to reverse repurchase agreements (where applicable) and/or borrowings (as described in Note 8 – Fund Leverage). |
| | • | | Each ratio includes the effect of all interest expense paid and other costs related to reverse repurchase agreements and/or to borrowings, where applicable, as follows: |
| | | | |
Ratios of Interest Expense to Average Net Assets Applicable to Common Shares | |
Year Ended 12/31: | |
2020(e) | | | 1.10 | %* |
2019 | | | 1.15 | |
2018 | | | 1.26 | |
2017 | | | 0.93 | |
2016 | | | 0.79 | |
2015 | | | 0.63 | |
| (d) | During the fiscal year ended December 31, 2019, the Adviser voluntarily reimbursed the Fund for certain expenses incurred in connection with its restructuring. See Notes to Financial Statements, Note 7 – Management Fees. |
| (e) | Portfolio Turnover Rate is calculated based on the lesser of long-term purchases or sales (as disclosed in Note 4 – Portfolio Securities and Investments in Derivatives) divided by the average long-term market value during the period. |
| (f) | For the six months ended June 30, 2020. |
| N/A | Fund did not have a contractual reimbursement with the Adviser. |
See accompanying notes to financial statements.
27
Notes to Financial Statements
(Unaudited)
1. General Information
Fund Information
Nuveen Mortgage and Income Fund (the “Fund”) is registered under the Investment Company Act of 1940 (the “1940 Act”), as amended, as a diversified, closed-end management investment company. The Fund’s common shares are listed on the New York Stock Exchange (“NYSE”) and trade under the ticker symbol “JLS.” The Fund was organized as a Massachusetts business trust on September 10, 2009.
The end of the reporting period for the Fund is June 30, 2020, and the period covered by these Notes to Financial Statements is for the six months ended June 30, 2020 (the “current fiscal period”).
Investment Adviser and Sub-Adviser
The Fund’s investment adviser is Nuveen Fund Advisors, LLC (the “Adviser”), a subsidiary of Nuveen, LLC (“Nuveen”). Nuveen is the investment management arm of Teachers Insurance and Annuity Association of America (TIAA). The Adviser has overall responsibility for management of the Fund, oversees the management of the Fund’s portfolios, manages the Fund’s business affairs and provides certain clerical, bookkeeping and other administrative services, and, if necessary, asset allocation decisions. The Adviser has entered into a sub-advisory agreement with Teachers Advisors, LLC (the “Sub-Adviser”), an affiliate of the Adviser, under which the Sub-Adviser manages the Fund’s investment portfolio.
Other Matters
The outbreak of the novel coronavirus (“COVID-19”) and subsequent global pandemic began significantly impacting the U.S. and global financial markets and economies during the calendar quarter ended March 31, 2020. The worldwide spread of COVID-19 has created significant uncertainty in the global economy. The duration and extent of COVID-19 over the long-term cannot be reasonably estimated at this time. The ultimate impact of COVID-19 and the extent to which COVID-19 impacts the Funds’ normal course of business, results of operations, investments, and cash flows will depend on future developments, which are highly uncertain and difficult to predict. Management continues to monitor and evaluate this situation.
2. Significant Accounting Policies
The accompanying financial statements were prepared in accordance with accounting principles generally accepted in the United States of America (“U.S. GAAP”), which may require the use of estimates made by management and the evaluation of subsequent events. Actual results may differ from those estimates. The Fund is an investment company and follows the accounting guidance in the Financial Accounting Standards Board (“FASB”) Accounting Standards Codification 946, Financial Services – Investment Companies. The net asset value (“NAV”) for financial reporting purposes may differ from the NAV for processing security and common share transactions. The NAV for financial reporting purposes includes security and common share transactions through the date of the report. Total return is computed based on the NAV used for processing security and common share transactions. The following is a summary of the significant accounting policies consistently followed by the Fund.
Compensation
The Fund pays no compensation directly to those of its trustees who are affiliated with the Adviser or to its officers, all of whom receive remuneration for their services to the Fund from the Adviser or its affiliates. The Board has adopted a deferred compensation plan for independent trustees that enables trustees to elect to defer receipt of all or a portion of the annual compensation they are entitled to receive from certain Nuveen-advised funds. Under the plan, deferred amounts are treated as though equal dollar amounts had been invested in shares of select Nuveen-advised funds.
Dividends and Distributions to Common Shareholders
Distributions to common shareholders are recorded on the ex-dividend date. The amount and timing of distributions are determined in accordance with federal income tax regulations, which may differ from U.S. GAAP.
The Fund makes monthly cash distributions to common shareholders of a stated dollar amount per share. Subject to approval and oversight by the Board, the Fund seeks to establish a distribution rate that roughly corresponds to the cash flows from its investment strategies through regular distributions (a “Cash Flow-Based Distribution Program”). The Fund seeks to establish a relatively stable common share distribution rate that roughly corresponds to the Fund’s net cash flows after expense from its investments over an extended period of time. Actual net cash flows the Fund receives may differ from the Fund’s distribution rate over shorter time periods over a specific timeframe. The portion of distributions paid attributed to net unrealized gains, if any, is distributed from the Fund’s assets and is treated by common shareholders as a non-taxable distribution (“Return of Capital”) for tax purposes. In the event that total distributions during a calendar year exceed the Fund’s total return on NAV, the difference will reduce NAV per common share. If the Fund’s total return on common share NAV exceeds total distributions during a calendar year, the excess will be reflected as an increase in NAV per common share. The final determination of the source and character of all distributions for the fiscal year is made after the end of the fiscal year and is reflected in the financial statements contained in the annual report as of December 31 each year.
28
Indemnifications
Under the Fund’s organizational documents, their officers and trustees are indemnified against certain liabilities arising out of the performance of their duties to the Fund. In addition, in the normal course of business, the Fund enter into contracts that provide general indemnifications to other parties. The Fund’s maximum exposure under these arrangements is unknown as this would involve future claims that may be made against the Fund that have not yet occurred. However, the Fund has not had prior claims or losses pursuant to these contracts and expect the risk of loss to be remote.
Investments and Investment Income
Securities transactions are accounted for as of the trade date for financial reporting purposes. Investment income is comprised of interest income, which reflects the amortization of premiums and accretion of discounts for financial reporting purposes, and is recorded on an accrual basis. Investment income also reflects payment-in-kind (“PIK”) interest and paydown gains and losses, if any. PIK interest represents income received in the form of securities in lieu of cash.
Netting Agreements
In the ordinary course of business, the Fund may enter into transactions subject to enforceable master repurchase agreements, International Swaps and Derivatives Association, Inc. (ISDA) master agreements or other similar arrangements (“netting agreements”). Generally, the right to offset in netting agreements allows the Fund to offset certain securities and derivatives with a specific counterparty, when applicable, as well as any collateral received or delivered to that counterparty based on the terms of the agreements. Generally, the Fund manages its cash collateral and securities collateral on a counterparty basis.
The Fund’s investments subject to netting agreements as of the end of the reporting period, if any, are further described in Note 4 – Portfolio Securities and Investments in Derivatives.
New Accounting Pronouncements and Rule Issuances
Fair Value Measurement: Disclosure Framework
During August 2018, the FASB issued ASU 2018-13 (“ASU 2018-13”), Fair Value Measurement: Disclosure Framework – Changes to the Disclosure Requirements for Fair Value Measurements. ASU 2018-13 modifies the disclosures required by Topic 820, Fair Value Measurements. The amendments in ASU 2018-13 are effective for all entities for fiscal years, and interim periods within those fiscal years, beginning after December 15, 2019. Management has early implemented this guidance and it did not have a material impact on the Fund’s financial statements.
Reference Rate Reform
In March 2020, FASB issued ASU 2020-04, Reference Rate Reform: Facilitation of the Effects of Reference Rate Reform on Financial Reporting. The main objective of the new guidance is to provide relief to companies that will be impacted by the expected change in benchmark interest rates at the end of 2021, when participating banks will no longer be required to submit London Interbank Offered Rate (LIBOR) quotes by the UK Financial Conduct Authority (FCA). The new guidance allows companies to, provided the only changes to existing contracts are a change to an approved benchmark interest rate, account for modifications as a continuance of the existing contract without additional analysis. For new and existing contracts, the Funds may elect to apply the optional expedients as of March 12, 2020 through December 31, 2022. Management has not yet elected to apply the optional expedients, but is currently assessing the impact of the ASU’s adoption to the Funds’ financial statements and various filings.
3. Investment Valuation and Fair Value Measurements
The fair valuation input levels as described below are for fair value measurement purposes.
The Fund’s investment in securities are recorded at their estimated fair value. Fair value is defined as the price that would be received upon selling an investment or transferring a liability in an orderly transaction to an independent buyer in the principal or most advantageous market for the investment. A three-tier hierarchy is used to maximize the use of observable market data and minimize the use of unobservable inputs and to establish classification of fair value measurements for disclosure purposes. Observable inputs reflect the assumptions market participants would use in pricing the asset or liability. Observable inputs are based on market data obtained from sources independent of the reporting entity. Unobservable inputs reflect the reporting entity’s own assumptions about the assumptions market participants would use in pricing the asset or liability. Unobservable inputs are based on the best information available in the circumstances. The following is a summary of the three-tiered hierarchy of valuation input levels.
| | |
| Level 1 – | | Inputs are unadjusted and prices are determined using quoted prices in active markets for identical securities. |
| Level 2 – | | Prices are determined using other significant observable inputs (including quoted prices for similar securities, interest rates, credit spreads, etc.). |
| Level 3 – | | Prices are determined using significant unobservable inputs (including management’s assumptions in determining the fair value of investments). |
29
Notes to Financial Statements (continued)
(Unaudited)
Prices of fixed-income securities are provided by an independent pricing service (“pricing service”) approved by the Board. The pricing service establishes a security’s fair value using methods that may include consideration of the following: yields or prices of investments of comparable quality, type of issue, coupon, maturity and rating, market quotes or indications of value from security dealers, evaluations of anticipated cash flows or collateral, general market conditions and other information and analysis, including the obligor’s credit characteristics considered relevant. These securities are generally classified as Level 2. In pricing certain securities, particularly less liquid and lower quality securities, the pricing service may consider information about a security, its issuer or market activity provided by the Adviser. These securities are generally classified as Level 2 or Level 3 depending on the observability of the significant inputs.
Certain securities may not be able to be priced by the pre-established pricing methods as described above. Such securities may be valued by the Board and/or its appointee at fair value. These securities generally include, but are not limited to, restricted securities (securities which may not be publicly sold without registration under the Securities Act of 1933, as amended) for which a pricing service is unable to provide a market price; securities whose trading has been formally suspended; debt securities that have gone into default and for which there is no current market quotation; a security whose market price is not available from a pre-established pricing source; a security with respect to which an event has occurred that is likely to materially affect the value of the security after the market has closed but before the calculation of a Fund’s common share NAV (as may be the case in non-U.S. markets on which the security is primarily traded) or make it difficult or impossible to obtain a reliable market quotation; and a security whose price, as provided by the pricing service, is not deemed to reflect the security’s fair value. As a general principle, the fair value of a security would appear to be the amount that the owner might reasonably expect to receive for it in a current sale. A variety of factors may be considered in determining the fair value of such securities, which may include consideration of the following: yields or prices of investments of comparable quality, type of issue, coupon, maturity and rating, market quotes or indications of value from security dealers, evaluations of anticipated cash flows or collateral, general market conditions and other information and analysis, including the obligor’s credit characteristics considered relevant. These securities are generally classified as Level 2 or Level 3 depending on the observability of the significant inputs. Regardless of the method employed to value a particular security, all valuations are subject to review by the Board and/or its appointee.
The inputs or methodologies used for valuing securities are not an indication of the risks associated with investing in those securities. The following is a summary of Fund’s fair value measurements as of the end of the reporting period:
| | | | | | | | | | | | | | | | |
| | | Level 1 | | | Level 2 | | | Level 3 | | | Total | |
Long-Term Investments*: | | | | | | | | | | | | | | | | |
Mortgage-Backed Securities | | $ | — | | | $ | 108,962,395 | | | $ | — | | | $ | 108,962,395 | |
Asset-Backed Securities | | | — | | | | 36,594,697 | | | | — | | | | 36,594,697 | |
| | | | |
Short-Term Investments: | | | | | | | | | | | | | | | | |
U.S. Government And Agency Obligations | | | — | | | | 130,000 | | | | — | | | | 130,000 | |
Total | | $ | — | | | $ | 145,687,092 | | | $ | — | | | $ | 145,687,092 | |
| * | Refer to the Fund’s Portfolio of Investments for industry classifications. |
4. Portfolio Securities and Investments in Derivatives
Portfolio Securities
Investment Transactions
Long-term purchases and sales (including maturities but excluding derivative transactions) during the current fiscal period aggregated $100,599,806 and $114,147,643, respectively.
The Fund may purchase securities on a when-issued or delayed-delivery basis. Securities purchased on a when-issued or delayed-delivery basis may have extended settlement periods; interest income is not accrued until settlement date. Any securities so purchased are subject to market fluctuation during this period. The Fund have earmarked securities in their portfolios with a current value at least equal to the amount of the when-issued/delayed-delivery purchase commitments. If a Fund has outstanding when-issued/delayed-delivery purchases commitments as of the end of the reporting period, such amounts are recognized on the Statement of Assets and Liabilities.
Investments in Derivatives
The Fund is authorized to invest in certain derivative instruments such as futures, options and swap contracts. The Fund limits its investments in futures, options on futures and swap contracts to the extent necessary for the Adviser to claim the exclusion from registration by the Commodity Futures Trading Commission as a commodity pool operator with respect to the Fund. The Fund records derivative instruments at fair value with changes in fair value recognized on the Statement of Operations, when applicable. Even though the Fund’s investments in derivatives may represent economic hedges, they are not considered to be hedge transactions for financial reporting purposes.
30
Although the Fund is authorized to invest in derivative instruments, and may do so in the future, it did not make any such investments during the current fiscal period.
Market and Counterparty Credit Risk
In the normal course of business the Fund may invest in financial instruments and enter into financial transactions where risk of potential loss exists due to changes in the market (market risk) or failure of the other party to the transaction to perform (counterparty credit risk). The potential loss could exceed the value of the financial assets recorded on the financial statements. Financial assets, which potentially expose the Fund to counterparty credit risk, consist principally of cash due from counterparties on forward, option and swap transactions, when applicable. The extent of the Fund’s exposure to counterparty credit risk in respect to these financial assets approximates their carrying value as recorded on the Statement of Assets and Liabilities.
The Fund helps manage counterparty credit risk by entering into agreements only with counterparties the Adviser believes have the financial resources to honor their obligations and by having the Adviser monitor the financial stability of the counterparties. Additionally, counterparties may be required to pledge collateral daily (based on the daily valuation of the financial asset) on behalf of the Fund with a value approximately equal to the amount of any unrealized gain above a pre-determined threshold. Reciprocally, when the Fund has an unrealized loss, the Fund has instructed the custodian to pledge assets of the Fund as collateral with a value approximately equal to the amount of the unrealized loss above a pre-determined threshold. Collateral pledges are monitored and subsequently adjusted if and when the valuations fluctuate, either up or down, by at least the pre-determined threshold amount.
5. Fund Shares
Common Share Transactions
Transactions in common shares during the Fund’s current and prior fiscal period were as follows:
| | | | | | | | |
| | | Six Months
Ended 6/30/20 | | | Year Ended
12/31/19 | |
Common Shares: | | | | | | | | |
Issued to shareholders due to reinvestment of distributions | | | — | | | | 632 | |
Repurchased and retired through tender offer | | | — | | | | (10,402,186 | ) |
| | |
Tender offer: | | | | | | | | |
Price per common share | | | — | | | | $23.10 | |
Discount per common share | | | — | | | | 0.00 | % |
6. Income Tax Information
The Fund is a separate taxpayer for federal income tax purposes. The Fund intends to distribute substantially all of its net investment company taxable income to common shareholders and to otherwise comply with the requirements of Subchapter M of the Internal Revenue Code applicable to regulated investment companies. Therefore, no federal income tax provision is required.
For all open tax years and all major taxing jurisdictions, management of the Fund has concluded that there are no significant uncertain tax positions that would require recognition in the financial statements. Open tax years are those that are open for examination by taxing authorities (i.e., generally the last four tax year ends and the interim tax period since then). Furthermore, management of the Fund is also not aware of any tax positions for which it is reasonably possible that the total amounts of unrecognized tax benefits will significantly change in the next twelve months.
The following information is presented on an income tax basis. Differences between amounts for financial statement and federal income tax purposes are primarily due to recognition of market discount accretion on investments and timing differences in recognizing certain gains and losses on investment transactions. To the extent that differences arise that are permanent in nature, such amounts are reclassified within the capital accounts as detailed below. Temporary differences do not require reclassification. Temporary and permanent differences do not impact the common share NAV of the Fund.
The table below presents the cost and unrealized appreciation (depreciation) of the Fund’s investment portfolio, as determined on a federal income tax basis, as of June 30, 2020.
| | | | |
Tax cost of investments | | $ | 153,970,538 | |
Gross unrealized: | | | | |
Appreciation | | | 2,247,080 | |
Depreciation | | | (10,530,526 | ) |
Net unrealized appreciation (depreciation) of investments | | $ | (8,283,446 | ) |
31
Notes to Financial Statements (continued)
(Unaudited)
Permanent differences, primarily due to investments in MBS and treatment of notional principal contracts, resulted in reclassifications among the Fund’s components of net assets as of December 31, 2019, the Fund’s last tax year end.
The tax components of undistributed net ordinary income and net long-term capital gains as of December 31, 2019, the Fund’s last tax year end, were as follows:
| | | | |
Undistributed net ordinary income | | $ | — | |
Undistributed net long-term capital gains | | | — | |
The tax character of distributions paid during the Fund’s last tax year ended December 31, 2019 was designated for purposes of the dividends paid deduction as follows: | |
Distributions from net ordinary income1 | | $ | 12,059,972 | |
Distributions from net long-term capital gains | | | — | |
Return of capital | | | 6,039,324 | |
1 Net ordinary income consists of net taxable income derived from dividends, interest, and net short-term capital gains, if any. | |
| |
As of December 31, 2019, the Fund’s last tax year end, the Fund had unused capital losses carrying forward available for federal income tax purposes to be applied against future capital gains, if any. The capital losses are not subject to expiration.
| | | | |
Not subject to expiration: | | | | |
Short-term | | $ | 238,822 | |
Long-term | | | — | |
Total | | $ | 238,822 | |
7. Management Fees
The Fund’s management fee compensates the Adviser for overall investment advisory and administrative services and general office facilities. The Sub-Adviser is compensated for its services to the Fund from the management fees paid to the Adviser.
The Fund’s management fee consists of two components – a fund-level fee, based only on the amount of assets within each individual Fund, and a complex-level fee, based on the aggregate amount of all eligible fund assets managed by the Adviser. This pricing structure enables Fund common shareholders to benefit from growth in the assets within their respective Fund as well as from growth in the amount of complex-wide assets managed by the Adviser.
The annual fund-level fee, payable monthly, for each Fund is calculated according to the following schedule:
| | | | |
| Average Daily Managed Assets1 | | Fund-Level Fee Rate | |
For the first $125 million | | | 0.8000 | % |
For the next $125 million | | | 0.7875 | |
For the next $150 million | | | 0.7750 | |
For the next $600 million | | | 0.7625 | |
For managed assets over $1 billion | | | 0.7500 | |
32
The annual complex-level fee, payable monthly, for the Fund is calculated by multiplying the current complex-wide fee rate, determined according to the following schedule by the Fund’s daily managed assets:
| | | | |
| Complex-Level Eligible Asset Breakpoint Level2 | | Effective Complex-Level Fee
Rate at Breakpoint Level | |
$55 billion | | | 0.2000 | % |
$56 billion | | | 0.1996 | |
$57 billion | | | 0.1989 | |
$60 billion | | | 0.1961 | |
$63 billion | | | 0.1931 | |
$66 billion | | | 0.1900 | |
$71 billion | | | 0.1851 | |
$76 billion | | | 0.1806 | |
$80 billion | | | 0.1773 | |
$91 billion | | | 0.1691 | |
$125 billion | | | 0.1599 | |
$200 billion | | | 0.1505 | |
$250 billion | | | 0.1469 | |
$300 billion | | | 0.1445 | |
| 1 | “Managed assets” means the total assets of the Fund, minus the sum of its accrued liabilities (other than the Fund liabilities incurred for the express purpose of creating effective leverage). Total assets for this purpose shall include assets attributable to the Fund’s use of effective leverage (whether or not those assets are reflected in the Fund’s financial statements for the purposes of U.S. GAAP). |
| 2 | The complex-level fee is based on the aggregate daily managed assets (as “managed assets” is defined in each Nuveen fund’s investment management agreement with the Adviser, which generally includes assets attributable to any preferred shares that may be outstanding and any borrowings (including the issuance of commercial paper or notes)) of the Nuveen open-end and closed-end Funds that constitute “eligible assets.” Eligible assets do not include assets attributable to investments in other Nuveen funds or assets in excess of a determined amount (originally $2 billion) added to the Nuveen fund complex in connection with the Adviser’s assumption of the management of the former First American Funds effective January 1, 2011, but do not include certain assets of certain Nuveen funds that were reorganized into funds advised by an affiliate of the Adviser during the 2019 calendar year. As of June 30, 2020, the complex-level fee for the Fund was 0.1582%. |
Effective October 14, 2019, the Adviser entered into an agreement to waive management fees or reimburse expenses in an amount equal to 1.5% of the Fund’s managed assets for the first six months, 0.75% for the next three months and 0.25% for the next three months.
8. Fund Leverage
Reverse Repurchase Agreements
During the current fiscal period, the Fund entered into a reverse repurchase agreement as a means of leverage.
In a reverse repurchase agreement, the Fund sells to the counterparty a security that it holds with a contemporaneous agreement to repurchase the same security at an agreed-upon price and date, with the Fund retaining the risk of loss that is associated with that security. The Fund will segregate assets determined to be liquid by the Adviser to cover its obligations under reverse repurchase agreements. Securities sold under reverse repurchase agreements are recorded as a liability and recognized as “Reverse repurchase agreements” on the Statement of Assets and Liabilities.
Interest payments made on reverse repurchase agreements are recognized as a component of “Interest expense” on the Statement of Operations.
As of the end of the reporting period, the Fund’s outstanding balances on its reverse repurchase agreement were as follows:
| | | | | | | | | | | | | | | | | | | | |
| Counterparty | | Coupon | | | Principal
Amount | | | Maturity | | | Value | | | Value and
Accrued Interest | |
Morgan Stanley | | | 3.752 | % | | $ | (14,303,816 | ) | | | 10/06/20 | | | $ | (14,303,816 | ) | | $ | (14,417,734 | ) |
Morgan Stanley LLC | | | 3.750 | % | | $ | (924,883 | ) | | | 10/06/20 | | | $ | (924,883 | ) | | | (932,109 | ) |
Royal Bank of Canada | | | 3.745 | % | | | (4,345,000 | ) | | | 7/15/20 | | | | (4,345,000 | ) | | | (4,376,526 | ) |
Societe Generale | | | 4.060 | % | | | (10,559,000 | ) | | | 7/09/20 | | | | (10,559,000 | ) | | | (10,655,053 | ) |
| | | | | | | $ | (30,132,699 | ) | | | | | | $ | (30,132,699 | ) | | $ | (30,381,422 | ) |
During the current fiscal period, the average daily balance outstanding and average interest rate on the Fund’s reverse repurchase agreement were as follows:
| | | | |
Utilization period (days outstanding) | | | 182 | |
Average daily balance outstanding | | $ | 41,006,188 | |
Weighted average interest rate | | | 3.53 | % |
33
Notes to Financial Statements (continued)
(Unaudited)
The following table presents the reverse repurchase agreements subject to netting agreements and the collateral delivered related to those reverse repurchase agreements.
| | | | | | | | | | | | |
| Counterparty | | Reverse Repurchase
Agreements* | | | Collateral
Pledged to
Counterparty** | | | Net
Exposure | |
Morgan Stanley | | $ | (14,417,734 | ) | | $ | (14,417,734 | ) | | $ | — | |
Morgan Stanley LLC | | | (932,109 | ) | | | (932,109 | ) | | | — | |
Royal Bank of Canada | | | (4,376,526 | ) | | | (4,376,526 | ) | | | — | |
Societe Generale | | | (10,655,053 | ) | | | (10,655,053 | ) | | | — | |
| | | $ | (30,381,422 | ) | | $ | (30,381,422 | ) | | $ | — | |
| * | Represents gross value and accrued interest for the counterparty as reported in the preceding table. |
| ** | As of the end of the reporting period, the value of the collateral pledged to the counterparty exceeded the value of the reverse repurchase agreements. |
9. Inter-Fund Lending
Inter-Fund Borrowing and Lending
The Securities and Exchange Commission (“SEC”) has granted an exemptive order permitting registered open-end and closed-end Nuveen funds to participate in an inter-fund lending facility whereby the Nuveen funds may directly lend to and borrow money from each other for temporary purposes (e.g., to satisfy redemption requests or when a sale of securities “fails,” resulting in an unanticipated cash shortfall) (the “Inter-Fund Program”). The closed-end Nuveen funds, including the Funds covered by this shareholder report, will participate only as lenders, and not as borrowers, in the Inter-Fund Program because such closed-end funds rarely, if ever, need to borrow cash to meet redemptions. The Inter-Fund Program is subject to a number of conditions, including, among other things, the requirements that (1) no fund may borrow or lend money through the Inter-Fund Program unless it receives a more favorable interest rate than is typically available from a bank or other financial institution for a comparable transaction; (2) no fund may borrow on an unsecured basis through the Inter-Fund Program unless the fund’s outstanding borrowings from all sources immediately after the inter-fund borrowing total 10% or less of its total assets; provided that if the borrowing fund has a secured borrowing outstanding from any other lender, including but not limited to another fund, the inter-fund loan must be secured on at least an equal priority basis with at least an equivalent percentage of collateral to loan value; (3) if a fund’s total outstanding borrowings immediately after an inter-fund borrowing would be greater than 10% of its total assets, the fund may borrow through the inter-fund loan on a secured basis only; (4) no fund may lend money if the loan would cause its aggregate outstanding loans through the Inter-Fund Program to exceed 15% of its net assets at the time of the loan; (5) a fund’s inter-fund loans to any one fund shall not exceed 5% of the lending fund’s net assets; (6) the duration of inter-fund loans will be limited to the time required to receive payment for securities sold, but in no event more than seven days; and (7) each inter-fund loan may be called on one business day’s notice by a lending fund and may be repaid on any day by a borrowing fund. In addition, a Nuveen fund may participate in the Inter-Fund Program only if and to the extent that such participation is consistent with the fund’s investment objective and investment policies. The Board is responsible for overseeing the Inter-Fund Program.
The limitations detailed above and the other conditions of the SEC exemptive order permitting the Inter-Fund Program are designed to minimize the risks associated with Inter-Fund Program for both the lending fund and the borrowing fund. However, no borrowing or lending activity is without risk. When a fund borrows money from another fund, there is a risk that the loan could be called on one day’s notice or not renewed, in which case the fund may have to borrow from a bank at a higher rate or take other actions to payoff such loan if an inter-fund loan is not available from another fund. Any delay in repayment to a lending fund could result in a lost investment opportunity or additional borrowing costs.
During the current reporting period, the Fund did not utilize this facility.
10. Subsequent Events
Borrowings
During August 2020, the Fund entered into a $22,500,000 (maximum commitment amount) borrowing arrangement as an additional means of leverage.
34
Additional Fund Information
| | | | | | | | |
| Board of Trustees* | | | | | | | | |
| Jack B. Evans | | William C. Hunter | | Albin F. Moschner | | John K. Nelson | | Judith M. Stockdale |
| Carole E. Stone | | Terence J. Toth | | Margaret L. Wolff | | Robert L. Young | | |
| * | Matthew Thornton III has been appointed to the Board of Trustees effective November 16, 2020. |
| | | | | | | | |
| | | | | |
Investment Adviser Nuveen Fund Advisors, LLC 333 West Wacker Drive Chicago, IL 60606 | | Custodian State Street Bank & Trust Company One Lincoln Street Boston, MA 02111 | | Legal Counsel Chapman and Cutler LLP Chicago, IL 60603 | | Independent Registered
Public Accounting Firm PricewaterhouseCoopers LLP
One North Wacker Drive Chicago, IL 60606 | | Transfer Agent and
Shareholder Services Computershare Trust
Company, N.A. 150 Royall Street Canton, MA 02021 (800) 257-8787 |
Portfolio of Investments Information
The Fund is required to file its complete schedule of portfolio holdings with the Securities and Exchange Commission (SEC) for the first and third quarters of each fiscal year as an exhibit to its report on Form N-PORT. You may obtain this information on the SEC’s website at http://www.sec.gov.
Nuveen Funds’ Proxy Voting Information
You may obtain (i) information regarding how each fund voted proxies relating to portfolio securities held during the most recent twelve-month period ended June 30, without charge, upon request, by calling Nuveen toll-free at (800) 257-8787 or on Nuveen’s website at www.nuveen.com and (ii) a description of the policies and procedures that each fund used to determine how to vote proxies relating to portfolio securities without charge, upon request, by calling Nuveen toll free at (800) 257-8787. You may also obtain this information directly from the SEC. Visit the SEC on-line at http://www.sec.gov.
CEO Certification Disclosure
Each Fund’s Chief Executive Officer (CEO) has submitted to the New York Stock Exchange (NYSE) the annual CEO certification as required by Section 303A.12(a) of the NYSE Listed Company Manual. Each Fund has filed with the SEC the certification of its CEO and Chief Financial Officer required by Section 302 of the Sarbanes-Oxley Act.
Common Share Repurchases
The Fund intends to repurchase, through its open-market share repurchase program, shares of its own common stock at such times and in such amounts as is deemed advisable. During the period covered by this report, the Fund repurchased shares of its common stock, as shown in the accompanying table. Any future repurchases will be reported to shareholders in the next annual or semi-annual report.
| | | | |
| | | JLS | |
Common shares repurchased | | | — | |
FINRA BrokerCheck
The Financial Industry Regulatory Authority (FINRA) provides information regarding the disciplinary history of FINRA member firms and associated investment professionals. This information as well as an investor brochure describing FINRA BrokerCheck is available to the public by calling the FINRA BrokerCheck Hotline number at (800) 289-9999 or by visiting www.FINRA.org.
35
Glossary of Terms Used in this Report
| ∎ | | Average Annual Total Return: This is a commonly used method to express an investment’s performance over a particular, usually multi-year time period. It expresses the return that would have been necessary each year to equal the investment’s actual cumulative performance (including change in NAV or market price and reinvested dividends and capital gains distributions, if any) over the time period being considered. |
| ∎ | | Bloomberg Barclays U.S. Aggregate Bond Index: An unmanaged index that includes all investment-grade, publicly issued, fixed-rate, dollar denominated, non-convertible debt issues and commercial mortgage backed securities with maturities of at least one year and outstanding par values of $150 million or more. Index returns assume reinvestment of distributions, but do not include the effects of any applicable sales charges or management fees. |
| ∎ | | Bloomberg Barclays Commercial Mortgage-Backed Securities (CMBS) Aggregate Index: An index that measures the performance of the commercial mortgage-backed securities market. Benchmark returns assume reinvestment of distributions, but do not reflect any applicable sales charges or management fees. |
| ∎ | | Commercial Mortgage-Backed Securities (CMBS): Commercial mortgage-backed securities are backed by cash flows of a mortgage or pool of mortgages on commercial real estate. CMBS generally are structured to provide protection to the senior class investors against potential losses on the underlying mortgage loans. CMBS are typically characterized by the following: i) loans on multi-family housing, non-residential property, ii) payments based on the amortization schedule of 25-30 years with a balloon payment due usually after 10 years, and iii) restrictions on prepayments. |
| ∎ | | Duration: Duration is a measure of the expected period over which a bond’s principal and interest will be paid, and consequently is a measure of the sensitivity of a bond’s or bond Fund’s value to changes when market interest rates change. Generally, the longer a bond’s or Fund’s duration, the more the price of the bond or Fund will change as interest rates change. |
| ∎ | | Effective Leverage: Effective leverage is a fund’s effective economic leverage, and includes both regulatory leverage (see below) and the leverage effects of certain derivative investments in the fund’s portfolio that increase the fund’s investment exposure. |
| ∎ | | ICE BofA U.S. ABS & CMBS Index: An index that tracks the performance of U.S. dollar denominated investment grade fixed and floating rate asset backed securities (ABS) and fixed rate commercial mortgage backed securities (CMBS) publicly issued in the U.S. domestic market. Index returns assume reinvestment of distributions, but do not reflect of any applicable sales charges or management fees. |
| ∎ | | JLS Linked Benchmark: The JLS Linked Benchmark is comprised of the Barclays U.S. Aggregate Bond Index from inception to 10/13/19 and the ICE BofA U.S. ABS & CMBS Index after 10/13/19. The Barclays U.S. Aggregate Bond Index is an unmanaged index that includes all investment-grade, publicly issued, fixed-rate, dollar denominated, nonconvertible debt issues and commercial mortgage-backed securities with maturities of at least one year and outstanding par values of $150 million or more. The ICE BofA U.S. ABS & CMBS Index is an index that tracks the performance of U.S. dollar denominated investment grade fixed and floating rate asset backed securities (ABS) and fixed rate commercial mortgage backed securities (CMBS) publicly issued in the U.S. domestic market. Index returns assume reinvestment of distributions, but do not reflect of any applicable sales charges or management fees. |
| ∎ | | Leverage: Leverage is created whenever a fund has investment exposure (both reward and/or risk) equivalent to more than 100% of the investment capital. |
| ∎ | | Mortgage-Backed Securities (MBS): Mortgage-backed securities (MBS) are bonds backed by pools of mortgages, usually with similar characteristics, and which return principal and interest in each payment. MBS are composed of residential mortgages (RMBS) or commercial mortgages (CMBS). RMBS are further divided into agency RMBS and non-agency RMBS, depending on the issuer. |
36
| ∎ | | Net Asset Value (NAV) Per Share: A fund’s Net Assets is equal to its total assets (securities, cash, accrued earnings and receivables) less its total liabilities. NAV per share is equal to the fund’s Net Assets divided by its number of shares outstanding. |
| ∎ | | Regulatory Leverage: Regulatory leverage consists of preferred shares issued by or borrowings of a fund. Both of these are part of a fund’s capital structure. Regulatory leverage is subject to asset coverage limits set in the Investment Company Act of 1940. |
| ∎ | | Residential Mortgage-Backed Securities (RMBS): Residential mortgage-backed securities are securities the payments on which depend primarily on the cash flow from residential mortgage loans made to borrowers that are secured by residential real estate. RMBS consist of agency and non-agency RMBS. Agency RMBS have agency guarantees that assure investors that they will receive timely payment of interest and principal, regardless of delinquency or default rates on the underlying loans. Agency RMBS include securities issued by the Government National Mortgage Association, the Federal National Mortgage Association and the Federal Home Loan Mortgage Corporation, and other federal agencies, or issues guaranteed by them. Non-agency RMBS do not have agency guarantees. Non-agency RMBS have credit enhancement built into the structure to shield investors from borrower delinquencies. The spectrum of non-agency residential mortgage loans includes traditional jumbo loans (prime), alternative-A loans (Alt-A), and home equity loans (subprime). |
37
Reinvest Automatically, Easily and Conveniently
Nuveen makes reinvesting easy. A phone call is all it takes to set up your reinvestment account.
Nuveen Closed-End Funds Automatic Reinvestment Plan
Your Nuveen Closed-End Fund allows you to conveniently reinvest distributions in additional Fund shares.
By choosing to reinvest, you’ll be able to invest money regularly and automatically, and watch your investment grow through the power of compounding. Just like distributions in cash, there may be times when income or capital gains taxes may be payable on distributions that are reinvested.
It is important to note that an automatic reinvestment plan does not ensure a profit, nor does it protect you against loss in a declining market.
Easy and convenient
To make recordkeeping easy and convenient, each quarter you’ll receive a statement showing your total distributions, the date of investment, the shares acquired and the price per share, and the total number of shares you own.
How shares are purchased
The shares you acquire by reinvesting will either be purchased on the open market or newly issued by the Fund. If the shares are trading at or above net asset value at the time of valuation, the Fund will issue new shares at the greater of the net asset value or 95% of the then-current market price. If the shares are trading at less than net asset value, shares for your account will be purchased on the open market. If the Plan Agent begins purchasing Fund shares on the open market while shares are trading below net asset value, but the Fund’s shares subsequently trade at or above their net asset value before the Plan Agent is able to complete its purchases, the Plan Agent may cease open-market purchases and may invest the uninvested portion of the distribution in newly-issued Fund shares at a price equal to the greater of the shares’ net asset value or 95% of the shares’ market value on the last business day immediately prior to the purchase date. Distributions received to purchase shares in the open market will normally be invested shortly after the distribution payment date. No interest will be paid on distributions awaiting reinvestment. Because the market price of the shares may increase before purchases are completed, the average purchase price per share may exceed the market price at the time of valuation, resulting in the acquisition of fewer shares than if the distribution had been paid in shares issued by the Fund. A pro rata portion of any applicable brokerage commissions on open market purchases will be paid by Plan participants. These commissions usually will be lower than those charged on individual transactions.
Flexible
You may change your distribution option or withdraw from the Plan at any time,
should your needs or situation change.
You can reinvest whether your shares are registered in your name, or in the name of a brokerage firm, bank, or other nominee. Ask your investment advisor if his or her firm will participate on your behalf. Participants whose shares are registered in the name of one firm may not be able to transfer the shares to another firm and continue to participate in the Plan.
The Fund reserves the right to amend or terminate the Plan at any time. Although the Fund reserves the right to amend the Plan to include a service charge payable by the participants, there is no direct service charge to participants in the Plan at this time.
Call today to start reinvesting distributions
For more information on the Nuveen Automatic Reinvestment Plan or to enroll in or withdraw from the Plan, speak with your financial professional or call us at (8oo) 257-8787.
38
Annual Investment Management Agreement Approval Process
(Unaudited)
At a meeting held on May 19-21, 2020 (the “May Meeting”), the Board of Trustees (the “Board” and each Trustee, a “Board Member”) of the Fund, which is comprised entirely of Board Members who are not “interested persons” (as defined under the Investment Company Act of 1940 (the “1940 Act”)) (the “Independent Board Members”), approved the renewal of the management agreement (the “Investment Management Agreement”) with Nuveen Fund Advisors, LLC (the “Adviser”) pursuant to which the Adviser serves as investment adviser to the Fund and the sub-advisory agreement (the “Sub-Advisory Agreement”) with Teachers Advisors, LLC (the “Sub-Adviser”) pursuant to which the Sub-Adviser serves as the investment sub-adviser to the Fund. Although the 1940 Act requires that continuances of the Advisory Agreements (as defined below) be approved by the in-person vote of a majority of the Independent Board Members, the May Meeting was held virtually through the internet in view of the health risks associated with holding an in-person meeting during the COVID-19 pandemic and governmental restrictions on gatherings. The May Meeting was held in reliance on an order issued by the Securities and Exchange Commission on March 13, 2020, as extended on March 25, 2020, which provided registered investment companies temporary relief from the in-person voting requirements of the 1940 Act with respect to the approval of a fund’s advisory agreement in response to the challenges arising in connection with the COVID-19 pandemic.
Following up to an initial two-year period, the Board considers the renewal of the Investment Management Agreement and Sub-Advisory Agreement on an annual basis. The Investment Management Agreement and Sub-Advisory Agreement are collectively referred to as the “Advisory Agreements” and the Adviser and the Sub-Adviser are collectively, the “Fund Advisers” and each, a “Fund Adviser.” Throughout the year, the Board and its committees meet regularly and, at these meetings, review an extensive array of topics and information that are relevant to its annual consideration of the renewal of the advisory agreements for the Nuveen funds. Such information may address, among other things, fund performance; the Adviser’s strategic plans; the review of the funds and investment teams; compliance, regulatory and risk management matters; the trading practices of the various sub-advisers to the funds; valuation of securities; fund expenses; overall market and regulatory developments; the management of leverage financing; and the secondary market trading of the closed-end funds and any actions to address discounts.
In addition to the information and materials received during the year, the Board, in response to a request made on its behalf by independent legal counsel, received extensive materials and information prepared specifically for its annual consideration of the renewal of the advisory agreements for the Nuveen funds by the Adviser and by Broadridge Financial Solutions, Inc. (“Broadridge”), an independent provider of investment company data. The materials cover a wide range of topics including, but not limited to, a description of the nature, extent and quality of services provided by the Fund Advisers; a review of each sub-adviser to the Nuveen funds and the applicable investment teams; an analysis of fund performance in absolute terms and as compared to the performance of certain peer funds and benchmarks with a focus on any performance outliers; an analysis of the fees and expense ratios of the Nuveen funds in absolute terms and as compared to those of certain peer funds with a focus on any expense outliers; a description of portfolio manager compensation; a review of the secondary market trading of shares of the Nuveen closed-end funds (including, among other things, an analysis of performance, distribution and valuation and capital raising trends in the broader closed-end fund market and in particular with respect to Nuveen closed-end funds; a review of the leverage management actions taken on behalf of the Nuveen closed-end funds and their resulting impact on performance; and a description of the distribution management process and any capital management activities); a review of the performance of various service providers; a description of various initiatives Nuveen had undertaken or continued during the year for the benefit of particular fund(s) and/or the complex; a description of the profitability or financial data of Nuveen and the sub-advisers to the Nuveen funds; and a description of indirect benefits received by the Adviser and the sub-advisers as a result of their relationships with the Nuveen funds.
In continuing its practice, the Board met prior to the May Meeting to begin its considerations of the renewal of the Advisory Agreements. Accordingly, on April 27-28, 2020 (the “April Meeting”), the Board met to review and discuss, in part, the performance of the Nuveen funds and the Adviser’s evaluation of each sub-adviser to the Nuveen funds. In its review, the Board recognized the volatile market conditions occurring during the first half of 2020 arising, in part, from the public health crisis
39
Annual Investment Management Agreement Approval Process (continued)
(Unaudited)
caused by the novel coronavirus known as COVID-19 and the resulting impact on fund performance. Accordingly, the Board reviewed, among other things, fund performance reflecting the more volatile periods, including for various time periods ended the first quarter of 2020 and for various time periods ended April 17, 2020. At the April Meeting, the Board Members asked questions and requested additional information that was provided for the May Meeting. In continuing its review of the Nuveen funds in light of the extraordinary market conditions experienced in early 2020, the Board received updated fund performance data reflecting various time periods ended May 8, 2020 for its May Meeting. The Board also continued its practice of seeking to meet periodically with the various sub-advisers to the Nuveen funds and their investment teams, when feasible.
The Independent Board Members considered the review of the advisory agreements for the Nuveen funds to be an ongoing process and employed the accumulated information, knowledge, and experience the Board Members had gained during their tenure on the boards governing the Nuveen funds and working with the Adviser and sub-advisers in their review of the advisory agreements. The contractual arrangements are a result of multiple years of review, negotiation and information provided in connection with the boards’ annual review of the Nuveen funds’ advisory arrangements and oversight of the Nuveen funds.
The Independent Board Members were advised by independent legal counsel during the annual review process as well as throughout the year, including meeting in executive sessions with such counsel at which no representatives from the Adviser or the Sub-Adviser were present. In connection with their annual review, the Independent Board Members also received a memorandum from independent legal counsel outlining their fiduciary duties and legal standards in reviewing the Advisory Agreements.
The Board’s decision to renew the Advisory Agreements was not based on a single identified factor, but rather the decision reflected the comprehensive consideration of all the information provided throughout the year and at the April and May Meetings, and each Board Member may have attributed different levels of importance to the various factors and information considered in connection with the approval process. The following summarizes the principal factors and information, but not all the factors, the Board considered in deciding to renew the Advisory Agreements and its conclusions.
| A. | | Nature, Extent and Quality of Services |
In evaluating the renewal of the Advisory Agreements, the Independent Board Members received and considered information regarding the nature, extent and quality of the applicable Fund Adviser’s services provided to the Fund with particular focus on the services and enhancements to such services provided during the last year. The Independent Board Members considered the Investment Management Agreement and the Sub-Advisory Agreement separately in the course of their review. With this approach, they considered the respective roles of the Adviser and the Sub-Adviser in providing services to the Fund.
With respect to the Adviser, the Board recognized that the Adviser has provided a vast array of services the scope of which has expanded over the years in light of regulatory, market and other developments, such as the development of expanded compliance programs for the Nuveen funds. The Board also noted the extensive resources, tools and capabilities the Adviser and its affiliates devoted to the various operations of the Nuveen funds. These services include, but are not limited to: investment oversight, risk management and securities valuation services (such as analyzing investment performance and risk data; overseeing and reviewing the various sub-advisers to the Nuveen funds and their investment teams; overseeing trade execution, soft dollar practices and securities lending activities; providing daily valuation services and developing related valuation policies, procedures and methodologies; overseeing risk disclosure; periodic testing of investment and liquidity risks; participating in financial statement and marketing disclosures; participating in product development; and participating in leverage management and liquidity monitoring); product management (such as analyzing a fund’s position in the marketplace, setting dividends, preparing shareholder and intermediary communications and other due diligence support); fund administration (such as preparing fund tax returns and other tax compliance services, overseeing the funds’ independent public accountants and other service providers; managing fund budgets and expenses; and helping to fulfill the funds’ regulatory filing requirements); oversight of shareholder services and transfer agency functions (such as overseeing transfer agent service providers which include registered shareholder customer service and transaction processing; and overseeing proxy solicitation and tabulation services); Board relations services (such as organizing and administering Board and committee meetings, preparing various reports to the Board and committees and providing other support services); compliance and regulatory oversight services (such as devising compliance programs; managing compliance policies;
40
monitoring compliance with applicable fund policies and laws and regulations; and evaluating the compliance programs of the various sub-advisers to the Nuveen funds and certain other service providers); legal support and oversight of outside law firms (such as helping to prepare and file registration statements and proxy statements; overseeing fund activities and providing legal interpretations regarding such activities; and negotiating agreements with other fund service providers); and providing leverage, capital and distribution management services.
The Board also recognized that the Adviser and its affiliates have undertaken a number of initiatives over the previous year that benefited the complex and/or particular Nuveen funds including, but not limited to:
| | • | | Fund Improvements and Product Management Initiatives – continuing to proactively manage the Nuveen fund complex as a whole and at the individual fund level with an aim to enhance the shareholder outcomes through, among other things, rationalizing the product line and gaining efficiencies through mergers, repositionings and liquidations; reviewing and updating investment policies and benchmarks; and integrating certain investment teams and changing the portfolio managers serving various funds; |
| | • | | Capital Initiatives – continuing to invest capital to support new Nuveen funds with initial capital as well as to facilitate modifications to the strategies or structure of existing funds; |
| | • | | Compliance Program Initiatives – continuing efforts to mitigate compliance risk, increase operating efficiencies, strengthen key compliance program elements and support international business growth and other objectives through, among other things, integrating various investment teams across affiliates, consolidating marketing review functions, enhancing compliance related technologies and establishing and maintaining shared broad-based compliance policies throughout the organization and its affiliates; |
| | • | | Risk Management and Valuation Services – continuing efforts to provide Nuveen with a more disciplined and consistent approach to identifying and mitigating the firm’s operational risks through, among other things, enhancing the interaction and reporting between the investment risk management team and various affiliates and adopting a risk operational framework across the complex; |
| | • | | Regulatory Matters – continuing efforts to monitor regulatory trends and advocate on behalf of the Nuveen funds, to implement and comply with new or revised rules and mandates and to respond to regulatory inquiries and exams; |
| | • | | Government Relations – continuing efforts of various Nuveen teams and affiliates to develop policy positions on a broad range of issues that may impact the Nuveen funds, advocate and communicate these positions to lawmakers and other regulatory authorities and work with trade associations to ensure these positions are represented; |
| | • | | Business Continuity, Disaster Recovery and Information Services – continuing to periodically test business continuity and disaster recovery plans, maintain an information security program designed to identify and manage information security risks, and provide reports to the Board, at least annually, addressing, among other things, management’s security risk assessment, cyber risk profile, potential impact of new or revised laws and regulations, incident tracking and other relevant information technology risk-related reports; |
| | • | | Expanded Dividend Management Services – continuing to manage the dividends among the varying types of Nuveen funds within the Nuveen complex to be consistent with the respective fund’s product design and investing resources to develop systems to assist in the process for newer products such as target term funds; and |
| | • | | with respect specifically to closed-end funds, such initiatives also included: |
| | • | | Leverage Management Services – continuing to actively manage leverage including developing new leverage instruments, managing leverage exposure and costs through various providers, and managing and adapting tender option bond structures to comply with regulations and developing further relationships with leverage providers; |
| | • | | Capital Management, Market Intelligence and Secondary Market Services – ongoing capital management efforts through shelf offerings, share repurchases as appropriate to address discounts, tender offers and capital return programs as well as providing market data analysis to help understand closed-end fund ownership cycles and their impact on secondary market trading as well as to improve proxy solicitation efforts; and |
41
Annual Investment Management Agreement Approval Process (continued)
(Unaudited)
| | • | | Closed-end Fund Investor Relations Program – maintaining the closed-end fund investor relations program which, among other things, raises awareness, provides educational materials and cultivates advocacy for closed-end funds and the Nuveen closed-end fund product line. |
The Board also noted the benefits to shareholders of investing in a Nuveen fund, as each Nuveen fund is a part of a large fund complex with a variety of investment disciplines, capabilities, expertise and resources available to navigate and support the funds including during stressed times as occurred in the market in the first half of 2020. In addition to the services provided by the Adviser, the Board also considered the risks borne by the Adviser and its affiliates in managing the Nuveen funds, including entrepreneurial, operational, reputational, regulatory and litigation risks.
The Board further considered the division of responsibilities between the Adviser and the Sub-Adviser and recognized that the Sub-Adviser and its investment personnel generally are responsible for the management of the Fund’s portfolio under the oversight of the Adviser and the Board. The Board considered an analysis of the Sub-Adviser provided by the Adviser which included, among other things, the Sub-Adviser’s assets under management and changes thereto, a summary of the applicable investment team and changes thereto, the investment approach of the team and the performance of the funds sub-advised by the Sub-Adviser over various periods. The Board further considered at the May Meeting or prior meetings evaluations of the Sub-Adviser’s compliance program and trade execution. The Board also considered the structure of investment personnel compensation programs and whether this structure provides appropriate incentives to act in the best interests of the respective Nuveen funds. The Board noted that the Adviser recommended the renewal of the Sub-Advisory Agreement.
Based on its review, the Board determined, in the exercise of its reasonable business judgment, that it was satisfied with the nature, extent and quality of services provided to the Fund under each applicable Advisory Agreement.
| B. | | The Investment Performance of the Fund and Fund Advisers |
In evaluating the quality of the services provided by the Fund Advisers, the Board also received and considered a variety of investment performance data of the Nuveen funds they advise. In this regard, the Board reviewed, among other things, Fund performance over the quarter, one-, three- and five-year periods ending December 31, 2019. Unless otherwise indicated, the performance data referenced below reflects the periods ended December 31, 2019. In general, the year 2019 was a period of strong market performance. However, as noted above, the Board recognized the unprecedented market volatility and decline that occurred in early 2020 and the significant impact it would have on fund performance. As a result, the Board reviewed performance data capturing more recent time periods, including performance data reflecting the first quarter of 2020 as well as performance data for various periods ended April 17, 2020 for its April Meeting and May 8, 2020 for its May Meeting.
The Board reviewed both absolute and relative fund performance during the annual review over the various time periods. With respect to the latter, the Board considered fund performance in comparison to the performance of peer funds (the “Performance Peer Group”) and recognized and/or customized benchmarks (i.e., generally benchmarks derived from multiple recognized benchmarks). For funds that had changes in portfolio managers, the Board considered performance data of such funds before and after such changes. In considering performance data, the Board is aware of certain inherent limitations with such data, including that differences between the objective(s), strategies and other characteristics of the Nuveen funds compared to the respective Performance Peer Group and/or benchmark(s) (such as differences in the use of leverage) as well as differences in the composition of the Performance Peer Group over time will necessarily contribute to differences in performance results and limit the value of the comparative information. To assist the Board in its review of the comparability of the relative performance, the Adviser has ranked the relevancy of the peer group to the funds as low, medium or high.
As noted above, the Board reviewed fund performance over various periods ended December 31, 2019 as well as the first quarter of 2020 and various time periods ended April 17, 2020 and May 8, 2020. In light of the significant market decline in the early part of 2020, the Board noted that a shorter period of underperformance may significantly impact longer term performance. Further, the Board recognized that performance data may differ significantly depending on the ending date selected and accordingly, performance results for periods ended at the year-end of 2019 may vary significantly from
42
performance results for periods ended in the first quarter of 2020, particularly given the extraordinary market conditions at that time as the impact of COVID-19 and other market developments unfolded. The Board considered a fund’s performance in light of the overall financial market conditions. In addition, the Board recognized that shareholders may evaluate performance based on their own holding periods which may differ from the periods reviewed by the Board and lead to differing results.
The secondary market trading of shares of the Nuveen closed-end funds continues to be a priority for the Board given its importance to shareholders, and therefore data reflecting the premiums and discounts at which the shares of the closed-end funds trade is reviewed by the Board during its annual review and by the Board and/or its Closed-end Fund committee during its respective quarterly meetings throughout the year.
In addition to the performance data prepared in connection with the annual review of the advisory agreements of the Nuveen funds, the Board reviewed fund performance throughout the year at its quarterly meetings representing differing time periods and took into account the discussions that occurred at these Board meetings in evaluating a fund’s overall performance. The Board also considered, among other things, the Adviser’s analysis of each Nuveen fund’s performance, with particular focus on funds that were considered performance outliers (both overperformance and underperformance), the factors contributing to the performance and any steps taken to address any performance concerns. Given the volatile market conditions of early 2020, the Board considered the Adviser’s analysis of the impact of such conditions on the Nuveen funds’ performance.
The Board evaluated performance in light of various factors, including general market conditions, issuer-specific information, asset class information, fund cash flows and other factors. Accordingly, depending on the facts and circumstances, the Board may be satisfied with a fund’s performance notwithstanding that its performance may be below its benchmark or peer group for certain periods. However, with respect to any Nuveen funds for which the Board had identified performance issues, the Board monitors such funds closely until performance improves, discusses with the Adviser the reasons for such results, considers whether any steps are necessary or appropriate to address such issues, and reviews the results of any efforts undertaken.
The Board noted that although the Fund’s performance was below the performance of its benchmark for the one-year period ended December 31, 2019, the Fund outperformed its benchmark for the three- and five-year periods ended December 31, 2019. Further, although the Fund ranked in the fourth quartile of its Performance Peer Group for the one-year period ended December 31, 2019, the Fund ranked in the second quartile of its Performance Peer Group for the three- and five-year periods ended December 31, 2019. With the market decline in the first quarter of 2020, the Fund’s performance was below the performance of its benchmark and the Fund ranked in the third quartile of its Performance Peer Group for the one-, three- and five-year periods ended March 31, 2020. In its review, the Board noted the Fund’s Performance Peer Group was classified as low for relevancy. The Board also recognized that with shareholder approval, the Fund was recently restructured to become a perpetual closed-end fund with a new investment objective, new sub-adviser and revised investment mandate. The transition to the revised investment mandate was effective in October 2019 and performance prior to such restructuring would not reflect these changes. The Board noted that the Fund’s performance in the fourth quarter of 2019 could be attributed to, among other things, the efforts to raise cash for a tender offer, change investment managers and transition to the new investment mandate. Further, the Board noted the performance history of the Fund under its revised mandate and new sub-adviser was too new to make a meaningful assessment of performance.
| C. | | Fees, Expenses and Profitability |
As part of its annual review, the Board considered the contractual management fee and net management fee (the management fee after taking into consideration fee waivers and/or expense reimbursements, if any) paid by a Nuveen fund to the Adviser in light of the nature, extent and quality of the services provided. The Board also considered the total operating expense ratio of each Nuveen fund before and after any fee waivers and/or expense reimbursements. More specifically, the Independent Board Members reviewed, among other things, each fund’s gross and net management fee rates (i.e., before and after expense reimbursements and/or fee waivers, if any) and net total expense ratio in relation to those of a comparable
43
Annual Investment Management Agreement Approval Process (continued)
(Unaudited)
universe of funds (the “Peer Universe”) established by Broadridge. The Independent Board Members reviewed the methodology Broadridge employed to establish its Peer Universe and recognized that differences between the applicable fund and its respective Peer Universe as well as changes to the composition of the Peer Universe from year to year may limit some of the value of the comparative data. The Independent Board Members also considered a fund’s operating expense ratio as it more directly reflected the shareholder’s costs in investing in the respective fund.
In their review, the Independent Board Members considered, in particular, each Nuveen fund with a net expense ratio (excluding investment-related costs of leverage) of six basis points or higher compared to that of its peer average (each, an “Expense Outlier Fund”) and an analysis as to the factors contributing to each such fund’s higher relative net expense ratio. In addition, although the Board reviewed a fund’s total net expenses both including and excluding investment-related expenses (i.e., leverage costs) and taxes for certain of the closed-end funds, the Board recognized that leverage expenses will vary across the Nuveen funds and in comparison to peers because of differences in the forms and terms of leverage employed by the respective fund. Accordingly, in reviewing the comparative data between a fund and its peers, the Board generally considered the fund’s net expense ratio and fees (excluding leverage costs and leveraged assets) to be higher if they were over 10 basis points higher, slightly higher if they were 6 to 10 basis points higher, in line if they were within approximately 5 basis points higher than the peer average and below if they were below the peer average of the Peer Universe. The Independent Board Members also considered, in relevant part, a fund’s net management fee and net total expense ratio in light of its performance history.
In their review of the fee arrangements for the Nuveen funds, the Independent Board Members considered the management fee schedules, including the complex-wide and fund-level breakpoint schedules, as applicable. The Board noted that across the Nuveen fund complex, the complex-wide fee breakpoints reduced fees by $56.6 million and fund-level breakpoints reduced fees by $66.8 million in 2019.
With respect to the Sub-Adviser, the Board also considered the sub-advisory fee schedule paid to the Sub-Adviser in light of the sub-advisory services provided to the Fund, the breakpoint schedule and comparative data of the fees the Sub-Adviser charges to other clients, if any. In its review, the Board recognized that the compensation paid to the Sub-Adviser is the responsibility of the Adviser, not the Fund.
The Independent Board Members noted that the Fund had a net management fee that was higher than the peer average, but a net expense ratio that was in line with the peer average.
Based on its review of the information provided, the Board determined that the Fund’s management fees (as applicable) to a Fund Adviser were reasonable in light of the nature, extent and quality of services provided to the Fund.
| | 2. | | Comparisons with the Fees of Other Clients |
In determining the appropriateness of fees, the Board also considered information regarding the fee rates the respective Fund Advisers charged to certain other types of clients and the type of services provided to these other clients. With respect to the Adviser and/or the Sub-Adviser, such other clients may include foreign investment companies offered by Nuveen and sub-advised by the Sub-Adviser; and certain funds advised by the Sub-Adviser. The Board further noted that the Adviser also advised and the Sub-Adviser sub-advised certain exchange-traded funds (“ETFs”) sponsored by Nuveen.
The Board recognized that the Fund had an affiliated sub-adviser and, with respect to affiliated sub-advisers, reviewed, among other things, the range of fees assessed for foreign investment companies and ETFs offered by Nuveen. The Board also reviewed the management fees and expense ratios of certain funds advised by the Sub-Adviser in the TIAA-CREF family of funds.
In considering the fee data of other clients, the Board considered, among other things, the differences in the amount, type and level of services provided to the Nuveen funds relative to other clients as well as the differences in portfolio investment policies, investor profiles, account sizes and regulatory requirements, all of which contribute to the variations in the fee schedules. The Board recognized the complexity and myriad of services the Adviser had provided to the Nuveen funds compared to the other types of clients as the Adviser is principally responsible for all aspects of operating the funds, including complying with the increased regulatory requirements required when managing the funds as well as the increased
44
entrepreneurial, legal and regulatory risks that the Adviser incurs in sponsoring and managing the funds. Further, with respect to ETFs, the Board considered that Nuveen ETFs are passively managed compared to the active management of the other Nuveen funds which contributed to the differences in fee levels between the Nuveen ETFs and other Nuveen funds. In general, higher fee levels reflect higher levels of service provided by the Adviser, increased investment management complexity, greater product management requirements, and higher levels of business risk or some combination of these factors. The Board further considered that the Sub-Adviser’s fee is essentially for portfolio management services. The Board concluded the varying levels of fees were justified given, among other things, the inherent differences in the products and the level of services provided to the Nuveen funds versus other clients, the differing regulatory requirements and legal liabilities and the entrepreneurial, legal and regulatory risks incurred in sponsoring and advising a registered investment company.
| | 3. | | Profitability of Fund Advisers |
In their review, the Independent Board Members considered information regarding Nuveen’s level of profitability for its advisory services to the Nuveen funds for the calendar years 2019 and 2018. The Board reviewed, among other things, Nuveen’s net margins (pre-tax) (both including and excluding distribution expenses); gross and net revenue margins (pre- and post-tax); revenues, expenses, and net income (pre-tax and after-tax and before distribution) of Nuveen for fund advisory services; and comparative profitability data comparing the margins of Nuveen compared to the adjusted margins of certain peers with publicly available data and with the most comparable assets under management (based on asset size and asset composition) for each of the last two calendar years. The Board also reviewed the revenues and expenses the Adviser derived from its ETF product line for the 2018 and 2019 calendar years.
In reviewing the profitability data, the Independent Board Members recognized the subjective nature of calculating profitability as the information is not audited and is dependent on cost allocation methodologies to allocate expenses of Nuveen and its affiliates between the fund and non-fund businesses. The expenses to be allocated include direct expenses in servicing the Nuveen funds as well as indirect and/or shared costs (such as overhead, legal and compliance) some of which are attributed to the Nuveen funds pursuant to the cost allocation methodologies. The Independent Board Members reviewed a description of the cost allocation methodologies employed to develop the financial information and a summary of the history of changes to the methodology over the eleven-year period from 2008 to 2019. The Board had also appointed three Independent Board Members, along with the assistance of independent counsel, to serve as the Board’s liaisons to review the development of the profitability data and any proposed changes to the cost allocation methodology prior to incorporating any such changes and to report to the full Board. The Board recognized that other reasonable and valid allocation methodologies could be employed and could lead to significantly different results. Based on the data, the Independent Board Members noted that Nuveen’s net margins were higher in 2019 than the previous year and considered the key drivers behind the revenue and expense changes that impacted Nuveen’s net margins between the years. The Board also noted the reinvestments of some of the profits into the business through, among other things, the investment of seed capital in certain funds and continued investments in enhancements to information technology, internal infrastructure and data management improvements and global investment and innovation projects.
As noted above, the Independent Board Members also considered Nuveen’s margins from its relationship to the Nuveen funds compared to the adjusted margins of certain peers with publicly available data and with the most comparable assets under management (based on asset size and asset composition) to Nuveen for the calendar years 2019 and 2018. The Independent Board Members noted that Nuveen’s margins from its relationships with the Nuveen funds were on the low range compared to the adjusted margins of the peers. The Independent Board Members, however, recognized that it is difficult to make comparisons of profitability with other investment adviser peers given that comparative data is not generally public and the calculation of profitability is subjective and affected by numerous factors (such as types of funds a peer manages, its business mix, its cost of capital, the numerous assumptions underlying the methodology used to allocate expenses and other factors) which can have a significant impact on the results.
Aside from Nuveen’s profitability, the Board recognized that the Adviser is a subsidiary of Nuveen, LLC, the investment management arm of Teachers Insurance and Annuity Association of America (“TIAA”). As such, the Board also reviewed a balance sheet for TIAA reflecting its assets, liabilities and capital and contingency reserves for the 2019 and 2018 calendar years to consider the financial strength of TIAA. The Board recognized the benefit of having an investment adviser and its parent with significant resources, particularly during periods of market stress.
45
Annual Investment Management Agreement Approval Process (continued)
(Unaudited)
In addition to Nuveen, the Independent Board Members also considered the profitability of the Sub-Adviser from its relationships with the Nuveen funds. In this regard, the Independent Board Members reviewed, among other things, the Sub-Adviser’s revenues, expenses and net operating income for its advisory services to the Nuveen ETFs and closed-end funds for 2019.
In evaluating the reasonableness of the compensation, the Independent Board Members also considered any other ancillary benefits derived by the respective Fund Adviser from its relationship with the Nuveen funds as discussed in further detail below.
Based on a consideration of all the information provided, the Board noted that Nuveen’s and the Sub-Adviser’s level of profitability was acceptable and not unreasonable in light of the services provided.
| D. | | Economies of Scale and Whether Fee Levels Reflect These Economies of Scale |
The Board considered whether there have been economies of scale with respect to the management of the Nuveen funds and whether these economies of scale have been appropriately shared with the funds. The Board recognized that although economies of scale are difficult to measure, there are several methods to help share the benefits of economies of scale, including breakpoints in the management fee schedule, fee waivers and/or expense limitations, the pricing of Nuveen funds at scale at inception and investments in Nuveen’s business which can enhance the services provided to the funds for the fees paid. The Board noted that Nuveen generally has employed these various methods. In this regard, the Board noted that the management fee of the Adviser is generally comprised of a fund-level component and a complex-level component each with its own breakpoint schedule, subject to certain exceptions. The Board reviewed the fund-level and complex-level fee schedules. The Board considered that the fund-level breakpoint schedules are designed to share economies of scale with shareholders if the particular fund grows, and the complex-level breakpoint schedule is designed to deliver the benefits of economies of scale to shareholders when the eligible assets in the complex pass certain thresholds even if the assets of a particular fund are unchanged or have declined. With respect to the Nuveen closed-end funds, the Board noted that, although such funds may from time-to-time make additional share offerings, the growth of their assets would occur primarily through the appreciation of such funds’ investment portfolios. Further, in the calculation of the complex-level component, the Board noted that it had approved the acquisition of several Nuveen funds by similar TIAA-CREF funds in 2019. However, to mitigate the loss of the assets of these Nuveen funds deemed eligible to be included in the calculation of the complex-wide fee when these Nuveen funds left the complex upon acquisition, Nuveen agreed to credit approximately $460 million to assets under management to the Nuveen complex in calculating the complex-wide component.
The Independent Board Members also recognized the Adviser’s continued reinvestment in its business through, among other things, investments in its business infrastructure and information technology, portfolio accounting system and other systems and platforms that will, among other things, support growth, simplify and enhance information sharing, and enhance the investment process to the benefit of all of the Nuveen funds.
Based on its review, the Board concluded that the current fee arrangements together with the Adviser’s reinvestment in its business appropriately shared any economies of scale with shareholders.
The Independent Board Members received and considered information regarding other benefits the respective Fund Adviser or its affiliates may receive as a result of their relationship with the Nuveen funds. The Board considered the compensation that an affiliate of the Adviser received for serving as co-manager in the initial public offerings of new closed-end funds and for serving as an underwriter on shelf offerings of existing closed-end funds. In addition, the Independent Board Members also noted that various sub-advisers may engage in soft dollar transactions pursuant to which they may receive the benefit of research products and other services provided by broker-dealers executing portfolio transactions on behalf of the applicable Nuveen funds, although the Board recognized that certain sub-advisers may be phasing out the use of soft dollars over time. The Board noted that the Sub-Adviser does not participate in soft dollar arrangements with respect to Fund portfolio transactions.
46
Based on its review, the Board concluded that any indirect benefits received by a Fund Adviser as a result of its relationship with the Fund were reasonable and within acceptable parameters.
The Board Members did not identify any single factor discussed previously as all-important or controlling. The Board Members, including the Independent Board Members, concluded that the terms of each Advisory Agreement were fair and reasonable, that the respective Fund Adviser’s fees were reasonable in light of the services provided to the Fund and that the Advisory Agreements be renewed.
47
Nuveen:
Serving Investors for Generations
Since 1898, financial professionals and their clients have relied on Nuveen to provide
dependable investment solutions through continued adherence to proven, long-term investing
principles. Today, we offer a range of high quality solutions designed to
be integral components of a well-diversified core portfolio.
Focused on meeting investor needs.
Nuveen is the investment manager of TIAA. We have grown into one of the world’s premier global asset managers, with specialist knowledge across all major asset classes and particular strength in solutions that provide income for investors and that draw on our expertise in alternatives and responsible investing. Nuveen is driven not only by the independent investment processes across the firm, but also the insights, risk management, analytics and other tools and resources that a truly world-class platform provides. As a global asset manager, our mission is to work in partnership with our clients to create solutions which help them secure their financial future.
Find out how we can help you.
To learn more about how the products and services of Nuveen may be able to help you meet your financial goals, talk to your financial professional, or call us at (800) 257-8787. Please read the information provided carefully before you invest. Investors should consider the investment objective and policies, risk considerations, charges and expenses of any investment carefully. Where applicable, be sure to obtain a prospectus, which contains this and other relevant information. To obtain a prospectus, please contact your securities representative or Nuveen, 333 W. Wacker Dr., Chicago, IL 60606. Please read the prospectus carefully before you invest or send money.
Learn more about Nuveen Funds at: www.nuveen.com/closed-end-funds
| | | | |
| Nuveen Securities, LLC, member FINRA and SIPC | 333 West Wacker Drive Chicago, IL 60606 | www.nuveen.com | | | |
ESA-H-0620D 1300438-INV-B-08/21 |
Not applicable to this filing.
| ITEM 3. | AUDIT COMMITTEE FINANCIAL EXPERT. |
Not applicable to this filing.
| ITEM 4. | PRINCIPAL ACCOUNTANT FEES AND SERVICES. |
Not applicable to this filing.
| ITEM 5. | AUDIT COMMITTEE OF LISTED REGISTRANTS. |
Not applicable to this filing.
| ITEM 6. | SCHEDULE OF INVESTMENTS. |
| (a) | | See Portfolio of Investments in Item 1. |
| ITEM 7. | DISCLOSURE OF PROXY VOTING POLICIES AND PROCEDURES FOR CLOSED-END MANAGEMENT INVESTMENT COMPANIES. |
Not applicable to this filing.
| ITEM 8. | PORTFOLIO MANAGERS OF CLOSED-END MANAGEMENT INVESTMENT COMPANIES. |
Not applicable to this filing.
| ITEM 9. | PURCHASES OF EQUITY SECURITIES BY CLOSED-END MANAGEMENT INVESTMENT COMPANY AND AFFILIATED PURCHASERS. |
Not applicable.
| ITEM 10. | SUBMISSION OF MATTERS TO A VOTE OF SECURITY HOLDERS. |
There have been no material changes to the procedures by which shareholders may recommend nominees to the registrant’s Board implemented after the registrant last provided disclosure in response to this item.
| ITEM 11. | CONTROLS AND PROCEDURES. |
| (a) | | The registrant’s principal executive and principal financial officers, or persons performing similar functions, have concluded that the registrant’s disclosure controls and procedures (as defined in Rule 30a-3(c) under the Investment Company Act of 1940, as amended (the “1940 Act”) (17 CFR 270.30a-3(c))) are effective, as of a date within 90 days of the filing date of this report that includes the disclosure required by this paragraph, based on their evaluation of the controls and procedures required by Rule 30a-3(b) under the 1940 Act (17 CFR 270.30a-3(b)) and Rules 13a-15(b) or 15d-15(b) under the Securities Exchange Act of 1934, as amended (the “Exchange Act”) (17 CFR 240.13a-15(b) or 240.15d-15(b)). |
| (b) | | There were no changes in the registrant’s internal control over financial reporting (as defined in Rule 30a-3(d) under the 1940 Act (17 CFR 270.30a-3(d)) that occurred during the period covered by this report that has materially affected, or is reasonably likely to materially affect, the registrant’s internal control over financial reporting. |
| ITEM 12. | DISCLOSURE OF SECURITIES LENDING ACTIVITIES FOR CLOSED-END MANAGEMENT INVESTMENT COMPANIES. |
Not applicable.
File the exhibits listed below as part of this Form.
(a)(1) Any code of ethics, or amendment thereto, that is the subject of the disclosure required by Item 2, to the extent that the registrant intends to satisfy the Item 2 requirements through filing of an exhibit: Not applicable to this filing.
(a)(2) A separate certification for each principal executive officer and principal financial officer of the registrant as required by Rule 30a-2(a) under the 1940 Act (17 CFR 270.30a-2(a)) in the exact form set forth below: See EX-99.CERT attached hereto.
(a)(3) Any written solicitation to purchase securities under Rule 23c-1 under the 1940 Act (17 CFR 270.23c-1) sent or given during the period covered by the report by or on behalf of the registrant to 10 or more persons: Not applicable.
(a)(4) Change in the registrant’s independent public accountant. Not applicable.
(b) If the report is filed under Section 13(a) or 15(d) of the Exchange Act, provide the certifications required by Rule 30a-2 (b) under the 1940 Act (17 CFR 270.30a-2(b)), Rule 13a-14(b) or Rule 15d-14(b) under the Exchange Act (17 CFR 240.13a-14(b) or 240.15d-14(b)), and Section 1350 of Chapter 63 of Title 18 of the United States Code (18 U.S.C. 1350) as an Exhibit. A certification furnished pursuant to this paragraph will not be deemed “filed” for purposes of Section 18 of the Exchange Act (15 U.S.C. 78r), or otherwise subject to the liability of that section. Such certification will not be deemed to be incorporated by reference into any filing under the Securities Act of 1933 or the Exchange Act, except to the extent that the registration specifically incorporates it by reference: See EX-99.906 CERT attached hereto.
September 4, 2020
|
Nuveen Investments, Inc. 333 West Wacker Drive Chicago, IL 60606 |
Securities and Exchange Commission
100 F Street, N.E.
Washington, D.C. 20549
RE: Nuveen Mortgage and Income Fund’s June 30, 2020 semi-annual report
Ladies and Gentlemen:
We are highlighting a correction that was made to the June 30, 2020 semi-annual shareholder report (the “Report”) for Nuveen Mortgage and Income Fund (JLS) (the “Fund”) subsequent to releasing the Report to shareholders and in advance of filing this Form N-CSR.
Explanation: Within the Fund’s Notes to Financial Statements, Note 10. Subsequent Events, Reverse Repurchase Agreements the Report incorrectly disclosed that the Fund decreased its reverse repurchase agreements to $50,160,000. The Fund did not have any subsequent event activity to disclose and therefore the following footnote has been removed entirely from Note 10:
Reverse Repurchase Agreements
Subsequent to the reporting period, the Fund decreased the balance on its reverse repurchase agreement to $50,160,000.
This correction has also been reflected in the Report posted to the Fund’s website at http://connect.rightprospectus.com/Nuveen/TADF/670735109/SAR?site=CEF
|
|
| Sincerely, |
|
| Nuveen Investments, Inc. |
|
| /s/ Gina Spunder |
|
| Gina Spunder |
| Assistant Vice President and Assistant Secretary 312-917-8176 |
SIGNATURES
Pursuant to the requirements of the Securities Exchange Act of 1934 and the Investment Company Act of 1940, the registrant has duly caused this report to be signed on its behalf by the undersigned, thereunto duly authorized.
(Registrant) Nuveen Mortgage and Income Fund
| | |
| By (Signature and Title) | | /s/ Gifford R. Zimmerman |
| | Gifford R. Zimmerman |
| | Vice President and Secretary |
Date: September 4, 2020
Pursuant to the requirements of the Securities Exchange Act of 1934 and the Investment Company Act of 1940, this report has been signed below by the following persons on behalf of the registrant and in the capacities and on the dates indicated.
| | |
| By (Signature and Title) | | /s/ David J. Lamb |
| | David J. Lamb |
| | Chief Administrative Officer |
| | (principal executive officer) |
Date: September 4, 2020
| | |
| By (Signature and Title) | | /s/ E. Scott Wickerham |
| | E. Scott Wickerham |
| | Vice President and Controller |
| | (principal financial officer) |
Date: September 4, 2020