UNITED STATES
SECURITIES AND EXCHANGE COMMISSION
Washington, D.C. 20549
FORM N-CSR
CERTIFIED SHAREHOLDER REPORT OF REGISTERED
MANAGEMENT INVESTMENT COMPANIES
| | |
| Investment Company Act file number | | 811-22329 |
Nuveen Mortgage and Income Fund
(Exact name of registrant as specified in charter)
Nuveen Investments
333 West Wacker Drive, Chicago, IL 60606
(Address of principal executive offices) (Zip code)
Mark L. Winget
Nuveen Investments
333 West Wacker Drive, Chicago, IL 60606
(Name and address of agent for service)
| | |
| Registrant’s telephone number, including area code: | | (312) 917-7700 |
| | |
| Date of fiscal year end: | | December 31 |
| | |
| Date of reporting period: | | June 30, 2021 |
Form N-CSR is to be used by management investment companies to file reports with the Commission not later than 10 days after the transmission to stockholders of any report that is required to be transmitted to stockholders under Rule 30e-1 under the Investment Company Act of 1940 (17 CFR 270.30e-1). The Commission may use the information provided on Form N-CSR in its regulatory, disclosure review, inspection, and policy making roles.
A registrant is required to disclose the information specified by Form N-CSR, and the Commission will make this information public. A registrant is not required to respond to the collection of information contained in Form N-CSR unless the Form displays a currently valid Office of Management and Budget (“OMB”) control number. Please direct comments concerning the accuracy of the information collection burden estimate and any suggestions for reducing the burden to Secretary, Securities and Exchange Commission, 450 Fifth Street, NW, Washington, DC 20549-0609. The OMB has reviewed this collection of information under the clearance requirements of 44 U.S.C. ss.3507.
| ITEM 1. | REPORTS TO STOCKHOLDERS. |

Closed-End Funds
30 June
2021
Nuveen Closed-End Funds
| | |
| JGH | | Nuveen Global High Income Fund |
| NPCT | | Nuveen Core Plus Impact Fund |
| JLS | | Nuveen Mortgage and Income Fund |
As permitted by regulations adopted by the Securities and Exchange Commission, paper copies of the Fund’s annual and semi-annual shareholder reports will not be sent to you by mail unless you specifically request paper copies of the reports. Instead, the reports will be made available on the Fund’s website (www.nuveen.com), and you will be notified by mail each time a report is posted and provided with a website link to access the report.
You may elect to receive shareholder reports and other communications from the Fund electronically at any time by contacting the financial intermediary (such as a broker-dealer or bank) through which you hold your Fund shares or, if you are a direct investor, by enrolling at www.nuveen.com/e-reports.
You may elect to receive all future shareholder reports in paper free of charge at any time by contacting your financial intermediary or, if you are a direct investor, by calling 800-257-8787 and selecting option #2 or (ii) by logging into your Investor Center account at www.computershare.com/investor and clicking on “Communication Preferences”. Your election to receive reports in paper will apply to all funds held in your account with your financial intermediary or, if you are a direct investor, to all your directly held Nuveen Funds and any other directly held funds within the same group of related investment companies.
Semiannual Report
Life is Complex.
Nuveen makes things e-simple.
It only takes a minute to sign up for e-Reports. Once enrolled, you’ll receive an e-mail as soon as your Nuveen Fund information is ready—no more waiting for delivery by regular mail. Just click on the link within the e-mail to see the report and save it on your computer if you wish.
Free e-Reports right to your e-mail!
www.investordelivery.com
If you receive your Nuveen Fund distributions and statements from your financial professional or brokerage account.
or
www.nuveen.com/client-access
If you receive your Nuveen Fund dividends and statements directly from Nuveen.
NOT FDIC INSURED MAY LOSE VALUE NO BANK GUARANTEE
Table of Contents
3
Chair’s Letter to Shareholders

Dear Shareholders,
More than a year has passed since the World Health Organization declared COVID-19 a global pandemic in March 2020, resulting in a year marked by a global economic downturn, financial market turbulence and some immeasurable losses of life. Although the health crisis persists, with the widespread distribution of vaccines in the U.S. and extraordinary economic interventions by governments and central banks around the world, we collectively look forward to what our “new normal” might be.
Global economic activity has continued to rebound, driving both gross domestic product growth and inflation higher, especially in the U.S. Vaccinations have enabled a further reopening of economies while governments and central banks have taken extraordinary measures to support the recoveries. To extend relief programs enacted earlier in the crisis, the U.S. government passed $900 billion in aid to individuals and businesses in late December 2020. Another $1.9 trillion relief package was signed into law in March 2021, providing extended unemployment benefits, direct payments to individuals and families, assistance to state and local municipalities, grants to education and public health, and other support. Currently, Congress is working on an infrastructure spending plan, although its final shape and whether it passes remains to be seen. The U.S. Federal Reserve (Fed) and other central banks around the world have upgraded their economic forecasts but remain committed to sustaining the recovery by maintaining accommodative monetary conditions. However, as economies have reopened, the surge in consumer demand has outpaced supply chain capacity, resulting in a jump in inflation indicators in recent months. Whether inflation persists is a subject of debate by economists and some market observers, while the Fed and other central banks believe it to be more transitory.
While the markets’ longer-term outlook has brightened, we expect intermittent bouts of volatility to continue. Markets are closely monitoring central bank signals, particularly if inflation remains elevated, as a sooner-than-expected shift to monetary tightening could slow the economic recovery. Additionally, COVID-19 cases are rising again, as more virulent strains such as the delta variant have spread, both case counts and hospitalizations are rising, and vaccination rollouts have been uneven around the country and around the world. The recovery hinges on controlling the virus, and estimates vary considerably on when economic activity might be fully restored and what level of public inoculation would be sufficient to contain the spread of the virus, particularly in light of new variants. On the political front, the Biden administration’s full policy agenda and the potential for Congressional gridlock remain to be seen, either of which could cause investment outlooks to shift. Short-term market fluctuations can provide your Fund opportunities to invest in new ideas as well as upgrade existing positioning while providing long-term value for shareholders. For more than 120 years, the careful consideration of risk and reward has guided Nuveen’s focus on delivering long-term results to our shareholders.
If you have concerns about what’s coming next, it may be an opportune time to assess your portfolio. We encourage you to review your time horizon, risk tolerance and investment goals with your financial professional.
On behalf of the other members of the Nuveen Fund Board, we look forward to continuing to earn your trust in the months and years ahead.
Sincerely,

Terence J. Toth
Chair of the Board
August 23, 2021
4
Important Semiannual Shareholder Report Notice
For Shareholders of
Nuveen Global High Income Fund (JGH)
Nuveen Core Plus Impact Fund (NPCT)
Nuveen Mortgage and Income Fund (JLS)
Semiannual Shareholder Report for the period ending June 30, 2021
Beginning with this semiannual shareholder report, the Funds will only include portfolio manager commentaries in their annual shareholder reports. For the Funds’ most recent annual portfolio manager discussion, please refer to the Portfolio Managers’ Comments section of each Fund’s December 31, 2020 annual shareholder report.
For current information on your Fund’s investment objectives, portfolio management team and average annual total returns please refer to the Fund’s website at www.nuveen.com.
For changes that occurred to your Fund both during and subsequent to this reporting period, please refer to the Notes to Financial Statements section of this report.
For average annual total returns as of the end of this reporting period, please refer to the Performance Overview and Holding Summaries section within this report.
5
Fund Leverage
IMPACT OF THE FUND’S LEVERAGE STRATEGY ON PERFORMANCE
One important factor impacting the common share returns of the Funds relative to their comparative benchmarks was the use of leverage through bank borrowings (for JGH and JLS) and reverse repurchase agreements (for JLS). The Funds use leverage because our research has shown that, over time, leveraging provides opportunities for additional income. The opportunity arises when short-term rates that the Fund pays on its leveraging instruments are lower than the interest the Fund earns on its portfolio securities that it has bought with the proceeds of that leverage. This has been particularly true in the recent market environment where short-term rates have been low by historical standards. Subsequent to the end of the reporting period, NPCT entered into reverse repurchase agreements as a use of leverage.
However, use of leverage can expose Fund common shares to additional price volatility. When a Fund uses leverage, the Fund’s common shares will experience a greater increase in their net asset value if the securities acquired through the use of leverage increase in value, but will also experience a correspondingly larger decline in their net asset value if the securities acquired through leverage decline in value. All this will make the shares’ total return performance more variable over time.
In addition, common share income in levered funds will typically decrease in comparison to unlevered funds when short-term interest rates increase and increase when short-term interest rates decrease. In recent quarters, fund leverage expenses have generally tracked the overall movement of short-term interest rates. While fund leverage expenses are somewhat higher than their recent lows, leverage nevertheless continues to provide the opportunity for incremental common share income, particularly over longer-term periods.
For JGH and JLS, the use of leverage had a positive impact on total return performance during this reporting period.
JGH also continued to use interest rate swap contracts to partially hedge its future interest cost of leverage. The impact of the swap contracts on total return performance was positive during this reporting period largely due to the improvement in mark-to-market values driven by the increase in long-term rates.
6
As of June 30, 2021, the Funds’ percentages of leverage are shown in the accompanying table.
| | | | | | | | |
| | | JGH | | | JLS | |
Effective Leverage* | | | 28.58 | % | | | 23.81 | % |
Regulatory Leverage* | | | 28.58 | % | | | 9.07 | % |
| * | Effective leverage is a Fund’s effective economic leverage, and includes both regulatory leverage and the leverage effects of certain derivative and other investments in a Fund’s portfolio that increase the Fund’s investment exposure. Regulatory leverage consists of preferred shares issued or borrowings of the Fund. Both of these are part of a Fund’s capital structure. A Fund, however, may from time to time borrow on a typically transient basis in connection with its day-to-day operations, primarily in connection with the need to settle portfolio trades. Such incidental borrowings are excluded from the calculation of a Fund’s effective leverage ratio. Regulatory leverage is subject to asset coverage limits set forth in the Investment Company Act of 1940. |
THE FUND’S LEVERAGE
Bank Borrowings
As noted previously, the Funds employ leverage through the use of bank borrowings. The Funds’ bank borrowing activities are as shown in the accompanying table.
| | | | | | | | | | | | | | | | | | | | | | | | | | | | | | | | | | | | |
| | | Current Reporting Period | | | | | | Subsequent to the Close of
the Reporting Period | |
| Fund | | Outstanding
Balance as of
January 1, 2021 | | | Draws | | | Paydowns | | | Outstanding
Balance as of
June 30, 2021 | | | Average Balance
Outstanding | | | | | | Draws | | | Paydowns | | | Outstanding
Balance as of
August 26, 2021 | |
JGH | | $ | 149,200,000 | | | $ | 9,800,000 | | | $ | — | | | $ | 159,000,000 | | | $ | 155,013,260 | | | | | | | $ | — | | | $ | — | | | $ | 159,000,000 | |
JLS | | $ | 15,505,000 | | | $ | 750,000 | | | $ | (3,900,000 | ) | | $ | 12,355,000 | | | $ | 13,464,392 | | | | | | | $ | — | | | $ | — | | | $ | 12,355,000 | |
Refer to Notes to Financial Statements, Note 8 – Borrowing Arrangements for further details.
Reverse Repurchase Agreements
As noted previously, JLS and NPCT (subsequent to the reporting period) use reverse repurchase agreements, in which the Fund sells to a counterparty a security that it holds with a contemporaneous agreement to repurchase the same security at an agreed-upon price and date. The Funds’ transactions in reverse repurchase agreements are as shown in the accompanying table.
| | | | | | | | | | | | | | | | | | | | | | | | | | | | | | | | | | | | |
| | | Current Reporting Period | | | | | | Subsequent to the Close of
the Reporting Period | |
| Fund | | Outstanding
Balance as of
January 1, 2021 | | | Sales | | | Purchases | | | Outstanding
Balance as of
June 30, 2021 | | | Average Balance
Outstanding | | | | | | Sales | | | Purchases | | | Outstanding
Balance as of
August 26, 2021 | |
JLS | | $ | 25,198,132 | | | $ | 65,380,879 | | | $ | (64,281,011 | ) | | $ | 26,298,000 | | | $ | 25,443,005 | | | | | | | $ | 21,739,000 | | | $ | (18,913,000 | ) | | $ | 29,124,000 | |
NPCT | | $ | — | | | $ | — | | | $ | — | | | $ | — | | | $ | — | | | | | | | $ | 48,000,000 | | | $ | (7,500,000 | ) | | $ | 40,500,000 | |
Refer to Notes to Financial Statements, Note 8 – Borrowing Arrangements for further details.
7
Common Share
Information
COMMON SHARE DISTRIBUTION INFORMATION FOR JGH AND JLS
The following information regarding the distributions for JGH and JLS are current as of June 30, 2021.
Effective with each Fund’s March 2021 distribution, the Funds implemented a level distribution program. The goal of the level distribution program is to provide shareholders with stable, but not guaranteed, cash flow, independent of the amount or timing of income earned or capital gains realized by the Funds. The Funds intend to distribute all or substantially all of their net investment income through their regular monthly distribution and to distribute realized capital gains at least annually. In any monthly period, in order to maintain its level distribution amount, each Fund may pay out more or less than its net investment income during the period. As a result, regular distributions throughout the year are expected to include net investment income and potentially a return of capital or capital gains for tax purposes. You should not draw any conclusions about the Fund’s investment performance from the amount of the distribution or from the terms of the level distribution program. A return of capital is a non-taxable distribution of a portion of a Fund’s capital. A return of capital distribution does not necessarily reflect a Fund’s investment performance and should not be confused with “yield” or “income.”
Actual amounts and sources for tax reporting purposes will be determined as of each Fund’s fiscal year-end and reported to shareholders on Form 1099-DIV. Because distribution source estimates are updated throughout the current fiscal year based on a Fund’s performance, these estimates may differ from both the tax information reported to you in your Fund’s 1099 statement, as well as the ultimate economic sources of distributions over the life of your investment. The figures in the table below provide an estimate of the sources of distributions and may include amounts attributed to realized gains and/or returns of capital. The Funds attribute these estimates equally to each regular distribution throughout the year. Consequently, the estimated information shown below is for the current distribution, and also represents an updated estimate for all prior months in the fiscal year. These estimates should not be used for tax reporting purposes. The final determination for all distributions paid in 2021 will be made in early 2022 and reported to you on Form 1099-DIV. More details about each Fund’s distributions and the basis for these estimates are available on www.nuveen.com/en-us/closed-end-funds.
Data as of June 30, 2021
| | | | | | | | | | | | | | | | | | | | | | | | | | | | | | | | |
| | | Current Month Estimated
Percentage of the Distributions | | | | | | Calendar YTD
Estimated Per Share Amounts | |
| Fund | | Net
Investment
Income | | | Realized
Gains | | | Return of
Capital | | | | | | Total
Distributions | | | Net
Investment
Income | | | Realized
Gains | | | Return of
Capital | |
JGH | | | 81.37 | % | | | 0.00 | % | | | 18.63 | % | | | | | | $ | 0.6230 | | | $ | 0.5070 | | | $ | 0.0000 | | | $ | 0.1160 | |
JLS | | | 80.03 | % | | | 12.54 | % | | | 7.44 | % | | | | | | $ | 0.4680 | | | $ | 0.3745 | | | $ | 0.0587 | | | $ | 0.0348 | |
8
The following table provides information regarding Fund distributions and total return performance over various time periods. This information is intended to help you better understand whether Fund returns for the specified time periods were sufficient to meet Fund distributions.
Data as of June 30, 2021
| | | | | | | | | | | | | | | | | | | | | | | | | | | | | | | | | | | | |
| | | | | | | | | | | | Annualized | | | | | | Cumulative | |
| Fund | | Inception
Date | | | Latest
Monthly
Per Share
Distribution | | | | | | Current
Distribution
on NAV | | | 1-Year
Return on
NAV | | | 5-Year
Return on
NAV | | | | | | Calendar
YTD Distributions
on NAV | | | Calendar
YTD Return
on NAV | |
JGH | | | 11/24/2014 | | | | $0.1130 | | | | | | | | 7.91% | | | | 21.11% | | | | 8.57% | | | | | | | | 3.63% | | | | 4.76% | |
JLS | | | 11/25/2009 | | | | $0.0830 | | | | | | | | 4.41% | | | | 13.33% | | | | 5.96% | | | | | | | | 2.07% | | | | 3.94% | |
COMMON SHARE DISTRIBUTION INFORMATION FOR NPCT
The following information regarding NPCT’s distributions is current as of June 30, 2021, the date of the distribution data included within the Fund’s most recent distribution notice of the time this report was prepared. The Fund’s distribution levels may vary over time based on the Fund’s investment activities and portfolio investment value changes.
The Fund has adopted a managed distribution program. The goal of the Fund’s managed distribution program is to provide shareholders relatively consistent and predictable cash flow by systematically converting its expected long-term return potential into regular distributions. As a result, regular distributions throughout the year will likely include a portion of expected long-term and/or short-term gains (both realized and unrealized), along with net investment income.
Important points to understand about Nuveen fund managed distributions are:
| • | | The Fund seeks to establish a relatively stable common share distribution rate that roughly corresponds to the projected total return from its investment strategy over an extended period of time. However, you should not draw any conclusions about the Fund’s past or future investment performance from its current distribution rate. |
| • | | Actual common share returns will differ from projected long-term returns (and therefore the Fund’s distribution rate), at least over shorter time periods. Over a specific timeframe, the difference between actual returns and total distributions will be reflected in an increasing (returns exceed distributions) or a decreasing (distributions exceed returns) Fund net asset value. |
| • | | Each period’s distributions are expected to be paid from some or all of the following sources: |
| | • | | net investment income consisting of regular interest and dividends, |
| | • | | net realized gains from portfolio investments, and |
| | • | | unrealized gains, or, in certain cases, a return of principal (non-taxable distributions). |
| • | | A non-taxable distribution is a payment of a portion of the Fund’s capital. When the Fund’s returns exceed distributions, it may represent portfolio gains generated, but not realized as a taxable capital gain. In periods when the Fund’s returns fall short of distributions, it will represent a portion of your original principal unless the shortfall is offset during other time periods over the life of your investment (previous or subsequent) when the Fund’s total return exceeds distributions. |
| • | | Because distribution source estimates are updated throughout the current fiscal year based on the Fund’s performance, these estimates may differ from both the tax information reported to you in the Fund’s 1099 statement, as well as the ultimate economic sources of distributions over the life of your investment. |
9
Common Share Information (continued)
The following table provides information regarding the Fund’s distributions and total return performance over various time periods. This information is intended to help you better understand whether the Fund’s returns for the specified time periods were sufficient to meet its distributions.
Data as of June 30, 2021
| | | | | | | | | | | | | | | | | | | | | | | | | | | | | | |
| | | | | | | | | | | Annualized | | | Cumulative | |
| Fund | | Inception Date | | Latest
Monthly
Per Share
Distribution | | | | | | Current
Distribution
on NAV | | | 1-Year
Return on
NAV | | | 5-Year
Return on
NAV | | | Fiscal YTD
Distributions
on NAV | | | Fiscal
YTD Return
on NAV | |
NPCT | | 4/27/2021 | | $ | 0.1030 | | | | | | | | 6.14 | % | | | N/A | | | | N/A | | | | 1.02 | % | | | 1.17 | % |
The following table provides estimates of the Fund’s distribution sources, reflecting year-to-date cumulative experience through the latest month-end. These estimates are for informational purposes only. The Fund attributes these estimates equally to each regular distribution throughout the year. Consequently, the estimated information shown below is for the current distribution, and also represents an updated estimate for all prior months in the year.
The amounts and sources of distributions reported in this notice are only estimates and are not being provided for tax reporting purposes. The actual amounts and character of the distributions for tax reporting purposes will be reported to shareholders on Form 1099-DIV which will be sent to shareholders shortly after calendar year-end. More details about the Fund’s distributions and the basis for these estimates are available on www.nuveen.com/cef.
Data as of June 30, 2021
| | | | | | | | | | | | | | | | | | | | | | | | | | | | | | | | | | |
| | | | | Current Month Estimated
Percentage of the Distribution | | | | | | Fiscal YTD
Estimated Per Share Amounts | |
| Fund | | Distribution | | Net
Investment
Income | | | Realized
Gains | | | Return of
Capital | | | | | | Total
Distributions | | | Net
Investment
Income | | | Realized
Gains | | | Return of
Capital | |
NPCT | | $0.1030 | | | 3.42% | | | | 7.12% | | | | 89.46% | | | | | | | | $0.1030 | | | | $0.0035 | | | | $0.0073 | | | | $0.0921 | |
NUVEEN CLOSED-END FUND DISTRIBUTION AMOUNTS
The Nuveen Closed-End Funds’ monthly and quarterly periodic distributions to shareholders are posted on www.nuveen.com and can be found on Nuveen’s enhanced closed-end fund resource page, which is at https://www.nuveen.com/resource-center-closed-end-funds, along with other Nuveen closed-end fund product updates. To ensure timely access to the latest information, shareholders may use a subscribe function, which can be activated at this web page (https://www.nuveen.com/subscriptions).
COMMON SHARE REPURCHASES
During August 2021 (subsequent to the close of the reporting period), the Funds’ Board of Trustees reauthorized JGH and JLS and authorized NPCT to participate in an open-market common share repurchase program, allowing each Fund to repurchase an aggregate of up to approximately 10% of its outstanding common shares.
As of June 30, 2021, and since the inception of the Funds’ repurchase program, the Funds have cumulatively repurchased and retired its outstanding common shares as shown in the accompanying table.
| | | | | | | | | | | | |
| | | JGH | | | NPCT | | | JLS | |
Common shares cumulatively repurchased and retired | | | 900,000 | | | | — | | | | — | |
Common shares authorized for repurchase | | | 2,315,000 | | | | 2,875,000 | | | | 545,000 | |
During the current reporting period, the Funds did not repurchase any of their outstanding common shares.
10
OTHER COMMON SHARE INFORMATION
As of June 30, 2021, and during the current reporting period, the Funds’ common share price was trading at a premium/(discount) to its common share NAV as shown in the accompanying table.
| | | | | | | | | | | | |
| | | JGH | | | NPCT | | | JLS | |
Common share NAV | | $ | 17.14 | | | $ | 20.13 | | | $ | 22.57 | |
Common share price | | $ | 16.21 | | | $ | 19.40 | | | $ | 20.89 | |
Premium/(Discount) to NAV | | | (5.43 | )% | | | (3.63 | )% | | | (7.44 | )% |
6-month average premium/(discount) to NAV | | | (8.03 | )% | | | 2.73 | % | | | (8.49 | )% |
11
| | |
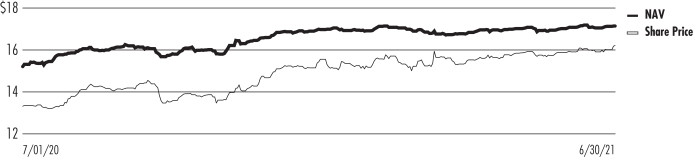
| JGH | | Nuveen Global High Income Fund Performance Overview and Holding Summaries as of June 30, 2021 |
Refer to the Glossary of Terms Used in this Report for further definition of the terms used within this section.
Average Annual Total Returns as of June 30, 2021
| | | | | | | | | | | | | | | | |
| | | Cumulative | | | Average Annual | |
| | | 6-Month | | | 1-Year | | | 5-Year | | | Since
Inception | |
| JGH at Common Share NAV | | | 4.76% | | | | 21.11% | | | | 8.57% | | | | 5.50% | |
| JGH at Common Share Price | | | 8.46% | | | | 31.96% | | | | 11.36% | | | | 7.12% | |
| Bloomberg Barclays Global High Yield (USD Hedged) Index | | | 2.71% | | | | 13.62% | | | | 6.65% | | | | 5.94% | |
Since inception returns are from 11/24/14. Past performance is not predictive of future results. Current performance may be higher or lower than the data shown. Returns do not reflect the deduction of taxes that shareholders may have to pay on Fund distributions or upon the sale of Fund shares. Returns at NAV are net of Fund expenses, and assume reinvestment of distributions. Comparative index return information is provided for the Fund’s shares at NAV only. Indexes are not available for direct investment.
Daily Common Share NAV and Share Price
12
This data relates to the securities held in the Fund’s portfolio of investments as of the end of the reporting period. It should not be construed as a measure of performance for the Fund itself. Holdings are subject to change.
The Fund uses credit quality ratings for its portfolio securities provided by Standard & Poor’s Group, Moody’s Investors Service, Inc. and Fitch, Inc. If all three provide a rating for a security, the middle is used; if two of the three agencies rate a security, the lower rating is used; and if only one rating agency rates a security, that rating is used. This treatment of split-rated securities may differ from that used for other purposes, such as for Fund investment policies. Credit ratings are subject to change. AAA, AA, A and BBB are investment grade ratings; BB, B, CCC, CC, C and D are below-investment grade ratings. Holdings designated N/R are not rated by these national rating agencies.
Fund Allocation
(% of net assets)
| | | | |
| Corporate Bonds | | | 86.6% | |
| Sovereign Debt | | | 15.6% | |
| Variable Rate Senior Loan Interests | | | 14.0% | |
| 1,000 Par (or similar) Institutional Preferred | | | 9.0% | |
| Contingent Capital Securities | | | 8.3% | |
| 25 Par (or similar) Retail Preferred | | | 1.5% | |
| Repurchase Agreements | | | 6.0% | |
| Other Assets Less Liabilities | | | (1.0)% | |
Net Assets Plus Borrowings | | | 140.0% | |
| Borrowings | | | (40.0)% | |
Net Assets | | | 100% | |
Top Five Issuers
(% of total investments)
| | | | |
| Turkey Government International Bond | | | 1.3% | |
| Dominican Republic International Bond | | | 1.1% | |
| Tenet Healthcare Corp | | | 1.0% | |
| Altice France SA/France | | | 1.0% | |
| Petroleos Mexicanos | | | 0.9% | |
Portfolio Composition
(% of total investments)
| | | | |
| Oil, Gas & Consumable Fuels | | | 12.1% | |
| Sovereign Debt | | | 11.1% | |
| Banks | | | 6.9% | |
| Hotels, Restaurants & Leisure | | | 5.0% | |
| Health Care Providers & Services | | | 4.2% | |
| Media | | | 3.9% | |
| Chemicals | | | 3.1% | |
| Specialty Retail | | | 2.8% | |
| Auto Components | | | 2.6% | |
| Commercial Services & Supplies | | | 2.6% | |
| Insurance | | | 2.5% | |
| Capital Markets | | | 2.5% | |
| Metals & Mining | | | 2.4% | |
| Diversified Telecommunication Services | | | 2.2% | |
| Pharmaceuticals | | | 2.0% | |
| Independent Power & Renewable Electricity Producers | | | 1.9% | |
| Wireless Telecommunication Services | | | 1.7% | |
| Consumer Finance | | | 1.6% | |
| IT Services | | | 1.6% | |
| Automobiles | | | 1.5% | |
| Software | | | 1.4% | |
| Equity Real Estate Investment Trust | | | 1.4% | |
| Other1 | | | 18.8% | |
| Repurchase Agreements | | | 4.2% | |
Total | | | 100% | |
Portfolio Credit Quality
(% of total long-term investments)
| | | | |
| BBB | | | 4.6% | |
| BB or Lower | | | 94.2% | |
| N/R (not rated) | | | 1.2% | |
Total | | | 100% | |
Country Allocation2
(% of total investments)
| | | | |
| United States | | | 58.6% | |
| Canada | | | 3.5% | |
| Brazil | | | 3.2% | |
| United Kingdom | | | 3.1% | |
| Mexico | | | 2.1% | |
| Turkey | | | 1.7% | |
| Netherlands | | | 1.6% | |
| France | | | 1.5% | |
| Spain | | | 1.5% | |
| Dominican Republic | | | 1.4% | |
| Germany | | | 1.3% | |
| Israel | | | 1.1% | |
| Oman | | | 1.1% | |
| Colombia | | | 1.0% | |
| Other3 | | | 17.3% | |
Total | | | 100% | |
| 1 | See Portfolio of Investments for details on “other” Portfolio Composition. |
| 2 | Includes 24.4% (as a percentage of total investments) in emerging market countries. |
| 3 | “Other” countries include thirty-nine countries that individually constitute less than 1% as a percentage of total investments. |
13
| | |
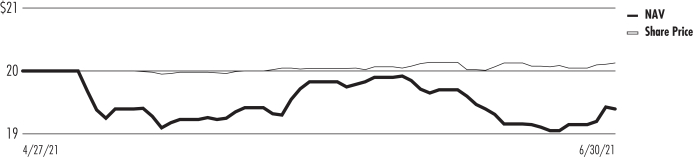
| NPCT | | Nuveen Core Plus Impact Fund Performance Overview and Holding Summaries as of June 30, 2021 |
Refer to Glossary of Terms Used in this Report for further definition of terms used in this section.
Cumulative Total Returns as of June 30, 2021
| | | | |
| | | Since
Inception | |
| NPCT at Common Share NAV | | | 1.17% | |
| NPCT at Common Share Price | | | (2.49)% | |
| NPCT Custom Blended Fund Performance Benchmark1 | | | 1.48% | |
| Bloomberg Barclays U.S. Aggregate Bond Index | | | 1.13% | |
Since inception returns are from 4/27/21. Past performance is not predictive of future results. Current performance may be higher or lower than the data shown. Returns do not reflect the deduction of taxes that shareholders may have to pay on Fund distributions or upon the sale of Fund shares. Returns at NAV are net of Fund expenses, and assume reinvestment of distributions. Comparative index return information is provided for the Fund’s shares at NAV only. Indexes are not available for direct investment.
Daily Common Share NAV and Share Price
| 1 | The NPCT Custom Blended Fund Performance Benchmark is comprised of: 60% of the return of the Bloomberg Barclays Morgan Stanley Capital International (MSCI) US Green Bond Index and 40% of the return of the Bloomberg Barclays U.S. High Yield Bond Index. |
14
This data relates to the securities held in the Fund’s portfolio of investments as of the end of the reporting period. It should not be construed as a measure of performance for the Fund itself. Holdings are subject to change.
The Fund uses credit quality ratings for its portfolio securities provided by Standard & Poor’s Group, Moody’s Investors Service, Inc. and Fitch, Inc. If all three provide a rating for a security, the middle is used; if two of the three agencies rate a security, the lower rating is used; and if only one rating agency rates a security, that rating is used. This treatment of split-rated securities may differ from that used for other purposes, such as for Fund investment policies. Credit ratings are subject to change. AAA, AA, A and BBB are investment grade ratings; BB, B, CCC, CC, C and D are below-investment grade ratings. Holdings designated N/R are not rated by these national rating agencies.
Fund Allocation
(% of net assets)
| | | | |
| Corporate Bonds | | | 43.9% | |
| Mortgage-Backed Securities | | | 6.8% | |
| $1,000 Par (or similar) Institutional Preferred | | | 5.4% | |
| $25 Par (or similar) Retail Preferred | | | 2.6% | |
| Variable Rate Senior Loan Interests | | | 2.1% | |
| Sovereign Debt | | | 1.3% | |
| Asset-Backed Securities | | | 1.3% | |
| Municipal Bonds | | | 0.9% | |
| Repurchase Agreements | | | 38.6% | |
| Other Assets Less Liabilities | | | (2.9)% | |
Net Assets | | | 100% | |
Portfolio Composition
(% of total investments)
| | | | |
| Banks | | | 8.0% | |
| Electric Utilities | | | 7.9% | |
| Mortgage-Backed Securities | | | 6.6% | |
| Independent Power & Renewable Electricity Producers | | | 5.7% | |
| Equity Real Estate Investment Trust | | | 3.8% | |
| Communications Equipment | | | 2.5% | |
| Multi-Utilities | | | 2.2% | |
| Road & Rail | | | 1.9% | |
| Automobiles | | | 1.8% | |
| Chemicals | | | 1.8% | |
| Health Care Providers & Services | | | 1.7% | |
| Sovereign Debt | | | 1.3% | |
| Asset-Backed Securities | | | 1.3% | |
| Other1 | | | 15.9% | |
| Repurchase Agreements | | | 37.6% | |
Total | | | 100% | |
Portfolio Credit Quality
(% of total long-term investments)
| | | | |
| AA | | | 1.2% | |
| A | | | 1.6% | |
| BBB | | | 47.6% | |
| BB or Lower | | | 40.6% | |
| N/R (not rated) | | | 9.0% | |
Total | | | 100% | |
Country Allocation2
(% of total investments)
| | | | |
| United States | | | 77.8% | |
| United Kingdom | | | 4.8% | |
| Canada | | | 4.4% | |
| Italy | | | 2.6% | |
| Indonesia | | | 1.8% | |
| Australia | | | 1.8% | |
| Spain | | | 1.1% | |
| Bermuda | | | 1.0% | |
| Turkey | | | 1.0% | |
| Japan | | | 0.9% | |
| South Korea | | | 0.8% | |
| Other3 | | | 2.0% | |
Total | | | 100% | |
| 1 | See Portfolio of Investments for details on “other” Portfolio Composition. |
| 2 | Includes 6.3% (as a percentage of total investments) in emerging market countries. |
| 3 | “Other” countries include five countries that individually constitute less than 0.8% as a percentage of total investments. |
15
| | |
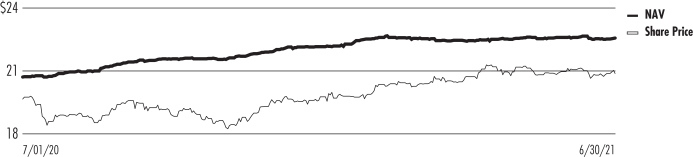
| JLS | | Nuveen Mortgage and Income Fund Performance Overview and Holding Summaries as of June 30, 2021 |
Refer to Glossary of Terms Used in this Report for further definition of terms used in this section.
Average Annual Total Returns as of June 30, 2021
| | | | | | | | | | | | | | | | |
| | | Cumulative | | | Average Annual | |
| | | 6-Month | | | 1-Year | | | 5-Year | | | 10-Year | |
| JLS at Common Share NAV | | | 3.94% | | | | 13.33% | | | | 5.96% | | | | 7.04% | |
| JLS at Common Share Price | | | 8.08% | | | | 11.64% | | | | 5.97% | | | | 6.64% | |
| ICE BofA U.S. ABS & CMBS Index1 | | | 0.46% | | | | 3.24% | | | | 2.94% | | | | 3.35% | |
| Bloomberg Barclays U.S. Aggregate Bond Index | | | (1.60)% | | | | (0.33)% | | | | 3.03% | | | | 3.39% | |
Performance prior to October 14, 2019, reflects the Fund’s performance under the management of a sub-adviser using investment strategies that differed from those currently in place. Past performance is not predictive of future results. Current performance may be higher or lower than the data shown. Returns do not reflect the deduction of taxes that shareholders may have to pay on Fund distributions or upon the sale of Fund shares. Returns at NAV are net of Fund expenses, and assume reinvestment of distributions. Comparative index return information is provided for the Fund’s shares at NAV only. Indexes are not available for direct investment.
Daily Common Share NAV and Share Price
| 1 | From fund inception to 10/14/19, the Fund’s benchmark was the Bloomberg Barclays U.S. Aggregate Index. |
16
This data relates to the securities held in the Fund’s portfolio of investments as of the end of the reporting period. It should not be construed as a measure of performance for the Fund itself. Holdings are subject to change.
For financial reporting purposes, the ratings disclosed are the highest rating given by one of the following national rating agencies: Standard & Poor’s Group, Moody’s Investors Service, Inc. or Fitch, Inc. This treatment of split-rated securities may differ from that used for other purposes, such as for Fund investment policies. Credit ratings are subject to change. AAA, AA, A and BBB are investment grade ratings; BB, B, CCC, CC, C and D are below-investment grade ratings. Holdings designated N/R are not rated by these national rating agencies.
Fund Allocation
(% of net assets)
| | | | |
| Mortgage-Backed Securities | | | 86.3% | |
| Asset-Backed Securities | | | 44.4% | |
| U.S. Government and Agency Obligations | | | 1.3% | |
| Other Assets Less Liabilities | | | (0.8)% | |
Net Assets Plus Borrowings and Reverse Repurchase Agreements | | | 131.2% | |
| Borrowings | | | (10.0)% | |
| Reverse Repurchase Agreements | | | (21.2)% | |
Net Assets | | | 100% | |
Credit Quality
(% of total investments)
| | | | |
| U.S. Treasury/Agency | | | 1.1% | |
| AAA | | | 4.6% | |
| AA | | | 1.6% | |
| A | | | 10.2% | |
| BBB | | | 25.8% | |
| BB or Lower | | | 36.3% | |
| N/R (not rated) | | | 20.4% | |
Total | | | 100% | |
17
Shareholder Meeting Report
The annual meeting of shareholders for JGH was held on April 6, 2021 for shareholders of record on January 29, 2021. The meeting was held virtually due to public health concerns regarding the ongoing COVID-19 pandemic; at this meeting the shareholders were asked to elect three Class III Trustees, including a choice between three nominees nominated by the existing Board of Trustees, and a slate of two nominees nominated by an activist shareholder.
The annual meeting of shareholders was held on April 6, 2021 for JLS. The meeting was held virtually due to public health concerns regarding the ongoing COVID-19 pandemic; at this meeting the shareholders were asked to elect three Class III Trustees.
| | | | | | | | |
| | | JGH | | | JLS | |
| | | Common
Shares | | | Common
Shares | |
The vote results in the Election of Class III Trustees were as follows: | | | | | | | | |
Jack B. Evans* | | | | | | | | |
For | | | 8,124,602 | | | | 2,756,904 | |
Withhold | | | 1,957,045 | | | | 976,277 | |
Total | | | 10,081,647 | | | | 3,733,181 | |
Albin F. Moschner* | | | | | | | | |
For | | | 8,117,901 | | | | 2,741,390 | |
Withhold | | | 1,963,746 | | | | 991,791 | |
Total | | | 10,081,647 | | | | 3,733,181 | |
Matthew Thornton III* | | | | | | | | |
For | | | 9,791,096 | | | | 3,652,455 | |
Withhold | | | 290,551 | | | | 80,726 | |
Total | | | 10,081,647 | | | | 3,733,181 | |
Thomas H. McGlade | | | | | | | | |
For | | | 5,051,998 | | | | | |
Withhold | | | 141,402 | | | | | |
Total | | | 5,193,400 | | | | | |
Abul Rahman | | | | | | | | |
For | | | 5,035,054 | | | | | |
Withhold | | | 158,346 | | | | | |
Total | | | 5,193,400 | | | | | |
| * | Mr. Evans, Moschner and Thornton III, incumbent Class III Trustees, will continue to serve as Class III Trustees until their successors are duly elected and qualify. |
18
| | |
| JGH | | Nuveen Global High Income Fund Portfolio of Investments June 30, 2021 |
| | | (Unaudited) |
| | | | | | | | | | | | | | | | | | | | | | | | | | | | |
Principal
Amount (000) | | | Description (1) | | | | | | | | Coupon | | | Maturity | | | Ratings (2) | | | Value | |
| | | | |
| | | | LONG-TERM INVESTMENTS – 135.0% (95.8% of Total Investments) | | | | | | | | | | | | | |
| | | | | |
| | | | CORPORATE BONDS – 86.6% (61.4% of Total Investments) | | | | | | | | | | | | | |
| | | | | |
| | | | Aerospace & Defense – 0.9% | | | | | | | | | | | | | |
| | | | | | | |
| $ | 475 | | | Embraer Netherlands Finance BV, 144A | | | | | | | | | | | 6.950% | | | | 1/17/28 | | | | BB+ | | | $ | 543,281 | |
| | 2,675 | | | Rolls-Royce PLC, 144A | | | | 5.750% | | | | 10/15/27 | | | | BB– | | | | 2,946,486 | |
| | 3,150 | | | Total Aerospace & Defense | | | | | | | | | | | | | | | | 3,489,767 | |
| | | | | |
| | | | Air Freight & Logistics – 0.1% | | | | | | | | | | | | | |
| | | | | | | |
| | 500 | | | Cargo Aircraft Management Inc, 144A | | | | | | | | | | | 4.750% | | | | 2/01/28 | | | | BB | | | | 509,915 | |
| | | | | |
| | | | Airlines – 0.4% | | | | | | | | | | | | | |
| | | | | |
| | 1,000 | | | Aerovias de Mexico SA de CV, 144A, (3) | | | | 7.000% | | | | 2/05/25 | | | | D | | | | 792,500 | |
| | 675 | | | American Airlines Inc/AAdvantage Loyalty IP Ltd, 144A | | | | 5.500% | | | | 4/20/26 | | | | Ba2 | | | | 714,656 | |
| | 3,000 | | | Virgin Australia Holdings Pty Ltd, 144A | | | | 7.875% | | | | 10/15/21 | | | | N/R | | | | 273,750 | |
| | 4,675 | | | Total Airlines | | | | | | | | | | | | | | | | 1,780,906 | |
| | | | | |
| | | | Auto Components – 3.3% | | | | | | | | | | | | | |
| | | | | | | |
| | 2,000 | | | Adient Global Holdings Ltd, 144A | | | | | | | | | | | 4.875% | | | | 8/15/26 | | | | B | | | | 2,058,460 | |
| | 400 | | | Alta Equipment Group Inc, 144A | | | | | | | | | | | 5.625% | | | | 4/15/26 | | | | B– | | | | 410,468 | |
| | 225 | | | Dana Inc | | | | | | | | | | | 5.375% | | | | 11/15/27 | | | | BB | | | | 239,625 | |
| | 650 | | | Dana Inc | | | | | | | | | | | 4.250% | | | | 9/01/30 | | | | BB | | | | 668,687 | |
| | 1,025 | | | Goodyear Tire & Rubber Co, 144A | | | | 5.000% | | | | 7/15/29 | | | | BB– | | | | 1,073,175 | |
| | 3,000 | | | Goodyear Tire & Rubber Co | | | | 5.250% | | | | 4/30/31 | | | | BB– | | | | 3,131,250 | |
| | 940 | | | Goodyear Tire & Rubber Co, 144A | | | | 5.250% | | | | 7/15/31 | | | | BB– | | | | 982,300 | |
| | 1,275 | | | IHO Verwaltungs GmbH, 144A, (cash 4.750%, PIK 5.500%) | | | | 4.750% | | | | 9/15/26 | | | | BB | | | | 1,303,420 | |
| | 3,000 | | | IHO Verwaltungs GmbH, 144A, (cash 6.375%, PIK 7.125%) | | | | 6.375% | | | | 5/15/29 | | | | BB | | | | 3,270,000 | |
| | 12,515 | | | Total Auto Components | | | | | | | | | | | | | | | | 13,137,385 | |
| | | | | |
| | | | Automobiles – 1.5% | | | | | | | | | | | | | |
| | | | | | | |
| | 525 | | | Ford Motor Co | | | | | | | | | | | 9.000% | | | | 4/22/25 | | | | BB+ | | | | 647,257 | |
| | 300 | | | Ford Motor Co | | | | | | | | | | | 9.625% | | | | 4/22/30 | | | | BB+ | | | | 430,500 | |
| | 2,000 | | | Ford Motor Credit Co LLC | | | | | | | | | | | 5.113% | | | | 5/03/29 | | | | BB+ | | | | 2,238,960 | |
| | 1,975 | | | Ford Motor Credit Co LLC | | | | | | | | | | | 3.625% | | | | 6/17/31 | | | | BB+ | | | | 2,013,275 | |
| | 580 | | | PM General Purchaser LLC, 144A | | | | | | | | | | | 9.500% | | | | 10/01/28 | | | | B+ | | | | 610,984 | |
| | 5,380 | | | Total Automobiles | | | | | | | | | | | | | | | | 5,940,976 | |
| | | | | |
| | | | Banks – 1.0% | | | | | | | | | | | | | |
| | | | | | | |
| | 1,000 | | | Akbank TAS, 144A | | | | | | | | | | | 6.800% | | | | 2/06/26 | | | | B1 | | | | 1,053,980 | |
| | 500 | | | Banco Industrial SA/Guatemala, 144A | | | | | | | | | | | 4.875% | | | | 1/29/31 | | | | B1 | | | | 521,250 | |
| | 1,000 | | | Banistmo SA, 144A | | | | | | | | | | | 4.250% | | | | 7/31/27 | | | | Baa3 | | | | 1,053,750 | |
| | 1,250 | | | Grupo Aval Ltd, 144A | | | | | | | | | | | 4.375% | | | | 2/04/30 | | | | Baa3 | | | | 1,235,562 | |
| | 3,750 | | | Total Banks | | | | | | | | | | | | | | | | 3,864,542 | |
| | | | | |
| | | | Beverages – 0.9% | | | | | | | | | | | | | |
| | | | | | | |
| | 2,500 | | | Primo Water Holdings Inc, 144A | | | | | | | | | | | 4.375% | | | | 4/30/29 | | | | B+ | | | | 2,500,000 | |
| | 925 | | | Triton Water Holdings Inc, 144A | | | | | | | | | | | 6.250% | | | | 4/01/29 | | | | CCC+ | | | | 927,312 | |
| | 3,425 | | | Total Beverages | | | | | | | | | | | | | | | | 3,427,312 | |
| | | | | |
| | | | Building Products – 0.3% | | | | | | | | | | | | | |
| | | | | | | |
| | 625 | | | Cemex SAB de CV, 144A | | | | | | | | | | | 5.125% | | | | 9/08/69 | | | | B | | | | 645,125 | |
| | 570 | | | SRS Distribution Inc, 144A | | | | 4.625% | | | | 7/01/28 | | | | B– | | | | 582,825 | |
| | 1,195 | | | Total Building Products | | | | | | | | | | | | | | | | 1,227,950 | |
| | | | | |
| | | | Capital Markets – 1.3% | | | | | | | | | | | | | |
| | | | | |
| | 1,500 | | | Banco BTG Pactual SA/Cayman Islands, 144A | | | | 2.750% | | | | 1/11/26 | | | | Ba2 | | | | 1,461,750 | |
| | 600 | | | Compass Group Diversified Holdings LLC, 144A | | | | 5.250% | | | | 4/15/29 | | | | B+ | | | | 624,000 | |
| | 1,275 | | | Icahn Enterprises LP / Icahn Enterprises Finance Corp, 144A | | | | 5.250% | | | | 5/15/27 | | | | BB | | | | 1,316,437 | |
| | 1,900 | | | LPL Holdings Inc, 144A | | | | | | | | | | | 4.375% | | | | 5/15/31 | | | | BB | | | | 1,921,375 | |
| | 5,275 | | | Total Capital Markets | | | | | | | | | | | | | | | | | | | | | | | 5,323,562 | |
19
| | |
| |
| JGH | | Nuveen Global High Income Fund (continued) |
| | Portfolio of Investments June 30, 2021 |
| | (Unaudited) |
| | | | | | | | | | | | | | | | | | | | | | | | | | | | |
Principal
Amount (000) | | | Description (1) | | | | | | | | Coupon | | | Maturity | | | Ratings (2) | | | Value | |
| | | | | |
| | | | Chemicals – 4.4% | | | | | | | | | | | | | |
| | | | | |
| $ | 1,000 | | | Calumet Specialty Products Partners LP / Calumet Finance Corp, 144A | | | | 11.000% | | | | 4/15/25 | | | | B– | | | $ | 1,087,500 | |
| | 2,500 | | | NOVA Chemicals Corp, 144A | | | | | | | | | | | 5.000% | | | | 5/01/25 | | | | BB– | | | | 2,675,000 | |
| | 1,000 | | | NOVA Chemicals Corp, 144A | | | | | | | | | | | 5.250% | | | | 6/01/27 | | | | BB– | | | | 1,077,800 | |
| | 2,744 | | | OCI NV, 144A | | | | | | | | | | | 5.250% | | | | 11/01/24 | | | | BB | | | | 2,828,241 | |
| | 2,137 | | | OCI NV, 144A | | | | | | | | | | | 4.625% | | | | 10/15/25 | | | | BB | | | | 2,228,496 | |
| | 850 | | | OCP SA, 144A | | | | | | | | | | | 5.125% | | | | 6/23/51 | | | | BB+ | | | | 857,735 | |
| | 1,275 | | | Rayonier AM Products Inc, 144A | | | | | | | | | | | 7.625% | | | | 1/15/26 | | | | B+ | | | | 1,329,187 | |
| | 1,500 | | | Sasol Financing USA LLC | | | | | | | | | | | 5.500% | | | | 3/18/31 | | | | BB | | | | 1,580,250 | |
| | 1,425 | | | Tronox Inc, 144A | | | | | | | | | | | 6.500% | | | | 5/01/25 | | | | BB– | | | | 1,508,063 | |
| | 2,025 | | | Tronox Inc, 144A | | | | | | | | | | | 4.625% | | | | 3/15/29 | | | | B | | | | 2,045,209 | |
| | 350 | | | Univar Solutions USA Inc/Washington, 144A | | | | 5.125% | | | | 12/01/27 | | | | BB | | | | 367,938 | |
| | 16,806 | | | Total Chemicals | | | | | | | | | | | | | | | | | | | | | | | 17,585,419 | |
| | | | | |
| | | | Commercial Services & Supplies – 2.7% | | | | | | | | | | | | | |
| | | | | | | |
| | 2,425 | | | ADT Security Corp, 144A | | | | | | | | | | | 4.875% | | | | 7/15/32 | | | | BB– | | | | 2,555,319 | |
| | 100 | | | GFL Environmental Inc, 144A | | | | | | | | | | | 5.125% | | | | 12/15/26 | | | | BB– | | | | 105,792 | |
| | 2,170 | | | GFL Environmental Inc, 144A | | | | | | | | | | | 4.750% | | | | 6/15/29 | | | | B– | | | | 2,253,111 | |
| | 755 | | | Madison IAQ LLC, 144A | | | | | | | | | | | 4.125% | | | | 6/30/28 | | | | B1 | | | | 762,550 | |
| | 85 | | | Madison IAQ LLC, 144A | | | | | | | | | | | 5.875% | | | | 6/30/29 | | | | Caa1 | | | | 86,488 | |
| | 2,000 | | | Pitney Bowes Inc, 144A | | | | | | | | | | | 6.875% | | | | 3/15/27 | | | | N/R | | | | 2,112,500 | |
| | 1,500 | | | Pitney Bowes Inc, 144A | | | | | | | | | | | 7.250% | | | | 3/15/29 | | | | BB | | | | 1,593,750 | |
| | 1,100 | | | Prime Security Services Borrower LLC / Prime Finance Inc, 144A | | | | 6.250% | | | | 1/15/28 | | | | B– | | | | 1,170,125 | |
| | 10,135 | | | Total Commercial Services & Supplies | | | | | | | | | | | | | | | | 10,639,635 | |
| | | | | |
| | | | Communications Equipment – 0.8% | | | | | | | | | | | | | |
| | | | | | | |
| | 1,325 | | | Gray Television Inc, 144A | | | | | | | | | | | 4.750% | | | | 10/15/30 | | | | B+ | | | | 1,320,402 | |
| | 425 | | | Liquid Telecommunications Financing Plc, 144A | | | | 5.500% | | | | 9/04/26 | | | | B1 | | | | 435,179 | |
| | 1,000 | | | Network i2i Ltd, 144A | | | | | | | | | | | 3.975% | | | | 6/03/70 | | | | BB | | | | 1,000,500 | |
| | 425 | | | Viasat Inc, 144A | | | | | | | | | | | 5.625% | | | | 4/15/27 | | | | BB+ | | | | 443,628 | |
| | 3,175 | | | Total Communications Equipment | | | | | | | | | | | | | | | | 3,199,709 | |
| | | | | |
| | | | Construction & Engineering – 0.4% | | | | | | | | | | | | | |
| | | | | |
| | 550 | | | ATP Tower Holdings LLC / Andean Tower Partners Colombia SAS / Andean Telecom Par, 144A | | | | 4.050% | | | | 4/27/26 | | | | BB– | | | | 565,400 | |
| | 1,000 | | | IHS Netherlands Holdco BV, 144A | | | | | | | | | | | 7.125% | | | | 3/18/25 | | | | B | | | | 1,042,500 | |
| | 1,550 | | | Total Construction & Engineering | | | | | | | | | | | | | | | | 1,607,900 | |
| | | | | |
| | | | Construction Materials – 0.6% | | | | | | | | | | | | | |
| | | | | | | |
| | 900 | | | Cemex SAB de CV, 144A | | | | | | | | | | | 7.375% | | | | 6/05/27 | | | | BB | | | | 1,015,920 | |
| | 975 | | | Cemex SAB de CV, 144A | | | | | | | | | | | 3.875% | | | | 7/11/31 | | | | BB | | | | 991,088 | |
| | 450 | | | Volcan Cia Minera SAA, 144A | | | | | | | | | | | 4.375% | | | | 2/11/26 | | | | Ba2 | | | | 445,500 | |
| | 2,325 | | | Total Construction Materials | | | | | | | | | | | | | | | | 2,452,508 | |
| | | | | |
| | | | Consumer Finance – 1.4% | | | | | | | | | | | | | |
| | | | | | | |
| | 2,010 | | | Capital One Financial Corp | | | | | | | | | | | 3.950% | | | | 9/01/69 | | | | BB+ | | | | 2,052,712 | |
| | 3,000 | | | Curo Group Holdings Corp, 144A | | | | | | | | | | | 8.250% | | | | 9/01/25 | | | | B– | | | | 3,105,000 | |
| | 550 | | | OneMain Finance Corp | | | | | | | | | | | 8.875% | | | | 6/01/25 | | | | BB– | | | | 609,780 | |
| | 5,560 | | | Total Consumer Finance | | | | | | | | | | | | | | | | 5,767,492 | |
| | | | | |
| | | | Containers & Packaging – 0.2% | | | | | | | | | | | | | |
| | | | | |
| | 900 | | | Ardagh Metal Packaging Finance USA LLC / Ardagh Metal Packaging Finance PLC, 144A | | | | 4.000% | | | | 9/01/29 | | | | B+ | | | | 892,418 | |
| | | | | |
| | | | Diversified Financial Services – 1.5% | | | | | | | | | | | | | |
| | | | | |
| | 1,125 | | | Genesis Energy LP / Genesis Energy Finance Corp | | | | 7.750% | | | | 2/01/28 | | | | B+ | | | | 1,162,620 | |
| | 815 | | | Mexico Remittances Funding Fiduciary Estate Management Sarl, 144A | | | | 4.875% | | | | 1/15/28 | | | | Ba1 | | | | 802,196 | |
| | 1,345 | | | OneMain Finance Corp | | | | | | | | | | | 3.500% | | | | 1/15/27 | | | | BB– | | | | 1,355,088 | |
| | 2,355 | | | Quicken Loans LLC, 144A | | | | | | | | | | | 5.250% | | | | 1/15/28 | | | | BB+ | | | | 2,472,750 | |
| | 5,640 | | | Total Diversified Financial Services | | | | | | | | | | | | | | | | 5,792,654 | |
20
| | | | | | | | | | | | | | | | | | | | | | | | | | | | |
Principal
Amount (000) | | | Description (1) | | | | | | | | Coupon | | | Maturity | | | Ratings (2) | | | Value | |
| | | | | |
| | | | Diversified Telecommunication Services – 3.1% | | | | | | | | | | | | | |
| | | | | | | |
| $ | 3,825 | | | Altice France SA/France, 144A | | | | | | | | | | | 5.125% | | | | 7/15/29 | | | | B | | | $ | 3,843,742 | |
| | 1,125 | | | Avaya Inc, 144A | | | | | | | | | | | 6.125% | | | | 9/15/28 | | | | B+ | | | | 1,204,088 | |
| | 2,000 | | | Embarq Corp | | | | | | | | | | | 7.995% | | | | 6/01/36 | | | | BB | | | | 2,267,300 | |
| | 2,000 | | | Telecom Italia Capital SA | | | | | | | | | | | 7.200% | | | | 7/18/36 | | | | BB+ | | | | 2,580,000 | |
| | 1,610 | | | Vmed O2 UK Financing I PLC, 144A, (WI/DD) | | | | 4.750% | | | | 7/15/31 | | | | BB– | | | | 1,634,150 | |
| | 1,000 | | | Zayo Group Holdings Inc, 144A | | | | | | | | | | | 4.000% | | | | 3/01/27 | | | | B+ | | | | 993,120 | |
| | 11,560 | | | Total Diversified Telecommunication Services | | | | | | | | | | | | | | | | 12,522,400 | |
| | | | | |
| | | | Electric Utilities – 0.3% | | | | | | | | | | | | | |
| | | | | |
| | 1,000 | | | AES Andres BV, 144A | | | | 5.700% | | | | 5/04/28 | | | | BB– | | | | 1,034,215 | |
| | | | | |
| | | | Electronic Equipment, Instruments & Components – 1.1% | | | | | | | | | | | | | |
| | | | | |
| | 4,125 | | | Imola Merger Corp, 144A | | | | 4.750% | | | | 5/15/29 | | | | BB– | | | | 4,243,594 | |
| | | | | |
| | | | Energy Equipment & Services – 0.7% | | | | | | | | | | | | | |
| | | | | |
| | 1,200 | | | Archrock Partners LP / Archrock Partners Finance Corp, 144A | | | | 6.875% | | | | 4/01/27 | | | | B+ | | | | 1,273,500 | |
| | 1,625 | | | Archrock Partners LP / Archrock Partners Finance Corp, 144A | | | | 6.250% | | | | 4/01/28 | | | | B+ | | | | 1,696,354 | |
| | 2,825 | | | Total Energy Equipment & Services | | | | | | | | | | | | | | | | 2,969,854 | |
| | | | | |
| | | | Entertainment – 0.7% | | | | | | | | | | | | | |
| | | | | | | |
| | 1,500 | | | Cinemark USA Inc, 144A | | | | | | | | | | | 8.750% | | | | 5/01/25 | | | | BB– | | | | 1,642,500 | |
| | 900 | | | Live Nation Entertainment Inc, 144A | | | | | | | | | | | 6.500% | | | | 5/15/27 | | | | B+ | | | | 998,820 | |
| | 2,400 | | | Total Entertainment | | | | | | | | | | | | | | | | 2,641,320 | |
| | | | | |
| | | | Equity Real Estate Investment Trust – 1.9% | | | | | | | | | | | | | |
| | | | | |
| | 565 | | | CTR Partnership LP / CareTrust Capital Corp, 144A | | | | 3.875% | | | | 6/30/28 | | | | BB+ | | | | 576,933 | |
| | 2,250 | | | Iron Mountain Inc, 144A | | | | | | | | | | | 5.250% | | | | 3/15/28 | | | | BB– | | | | 2,354,737 | |
| | 2,225 | | | MPH Acquisition Holdings LLC, 144A | | | | | | | | | | | 5.750% | | | | 11/01/28 | | | | B– | | | | 2,235,925 | |
| | 450 | | | RLJ Lodging Trust LP, 144A | | | | | | | | | | | 3.750% | | | | 7/01/26 | | | | BB– | | | | 454,500 | |
| | 1,150 | | | Uniti Group LP / Uniti Group Finance Inc / CSL Capital LLC, 144A | | | | 4.750% | | | | 4/15/28 | | | | B | | | | 1,147,125 | |
| | 880 | | | XHR LP, 144A | | | | | | | | | | | 4.875% | | | | 6/01/29 | | | | B | | | | 908,600 | |
| | 7,520 | | | Total Equity Real Estate Investment Trust | | | | | | | | | | | | | | | | 7,677,820 | |
| | | | | |
| | | | Food & Staples Retailing – 0.2% | | | | | | | | | | | | | |
| | | | | |
| | 750 | | | BRF SA, 144A | | | | 5.750% | | | | 9/21/50 | | | | Ba2 | | | | 769,125 | |
| | | | | |
| | | | Food Products – 0.8% | | | | | | | | | | | | | |
| | | | | |
| | 1,225 | | | Amaggi Luxembourg International Sarl, 144A | | | | 5.250% | | | | 1/28/28 | | | | Ba2 | | | | 1,284,425 | |
| | 1,000 | | | Kernel Holding SA, 144A | | | | | | | | | | | 6.500% | | | | 10/17/24 | | | | BB– | | | | 1,069,300 | |
| | 1,000 | | | MARB BondCo PLC, 144A | | | | | | | | | | | 3.950% | | | | 1/29/31 | | | | BB | | | | 964,200 | |
| | 3,225 | | | Total Food Products | | | | | | | | | | | | | | | | 3,317,925 | |
| | | | | |
| | | | Gas Utilities – 0.1% | | | | | | | | | | | | | |
| | | | | |
| | 250 | | | Suburban Propane Partners LP/Suburban Energy Finance Corp, 144A | | | | 5.000% | | | | 6/01/31 | | | | BB– | | | | 255,938 | |
| | | | | |
| | | | Health Care Providers & Services – 4.0% | | | | | | | | | | | | | |
| | | | | | | |
| | 1,110 | | | AHP Health Partners Inc, 144A | | | | | | | | | | | 5.750% | | | | 7/15/29 | | | | CCC+ | | | | 1,125,262 | |
| | 575 | | | CHS/Community Health Systems Inc, 144A | | | | 6.625% | | | | 2/15/25 | | | | B | | | | 608,057 | |
| | 450 | | | CHS/Community Health Systems Inc, 144A | | | | 5.625% | | | | 3/15/27 | | | | B | | | | 480,375 | |
| | 385 | | | CHS/Community Health Systems Inc, 144A | | | | 8.000% | | | | 12/15/27 | | | | B | | | | 428,332 | |
| | 125 | | | CHS/Community Health Systems Inc, 144A | | | | 6.000% | | | | 1/15/29 | | | | B | | | | 133,750 | |
| | 1,800 | | | CHS/Community Health Systems Inc, 144A | | | | 6.875% | | | | 4/15/29 | | | | CCC | | | | 1,883,646 | |
| | 475 | | | CHS/Community Health Systems Inc, 144A | | | | 4.750% | | | | 2/15/31 | | | | B | | | | 476,781 | |
| | 750 | | | Cushman & Wakefield US Borrower LLC, 144A | | | | 6.750% | | | | 5/15/28 | | | | BB– | | | | 808,845 | |
| | 575 | | | LifePoint Health Inc, 144A | | | | | | | | | | | 5.375% | | | | 1/15/29 | | | | CCC+ | | | | 560,625 | |
| | 1,000 | | | RegionalCare Hospital Partners Holdings Inc / LifePoint Health Inc, 144A | | | | 9.750% | | | | 12/01/26 | | | | CCC+ | | | | 1,076,250 | |
| | 3,000 | | | Team Health Holdings Inc, 144A | | | | | | | | | | | 6.375% | | | | 2/01/25 | | | | CCC | | | | 2,853,180 | |
| | 200 | | | Tenet Healthcare Corp, 144A | | | | | | | | | | | 7.500% | | | | 4/01/25 | | | | B+ | | | | 216,026 | |
| | 5,000 | | | Tenet Healthcare Corp, 144A | | | | | | | | | | | 6.125% | | | | 10/01/28 | | | | CCC+ | | | | 5,328,200 | |
| | 15,445 | | | Total Health Care Providers & Services | | | | | | | | | | | | | | | | 15,979,329 | |
21
| | |
| |
| JGH | | Nuveen Global High Income Fund (continued) |
| | Portfolio of Investments June 30, 2021 |
| | (Unaudited) |
| | | | | | | | | | | | | | | | | | | | | | | | | | | | |
Principal
Amount (000) | | | Description (1) | | | | | | | | Coupon | | | Maturity | | | Ratings (2) | | | Value | |
| | | | | |
| | | | Hotels, Restaurants & Leisure – 6.5% | | | | | | | | | | | | | |
| | | | | | | |
| $ | 375 | | | Arcos Dorados Holdings Inc, 144A | | | | | | | | | | | 5.875% | | | | 4/04/27 | | | | Ba2 | | | $ | 394,485 | |
| | 900 | | | Carnival Corp, 144A | | | | | | | | | | | 7.625% | | | | 3/01/26 | | | | B+ | | | | 977,625 | |
| | 1,900 | | | Carnival Corp, 144A | | | | | | | | | | | 5.750% | | | | 3/01/27 | | | | B+ | | | | 1,990,250 | |
| | 1,100 | | | Cedar Fair LP / Canada’s Wonderland Co / Magnum Management Corp / Millennium Op, 144A | | | | 5.500% | | | | 5/01/25 | | | | BB | | | | 1,148,125 | |
| | 1,375 | | | Churchill Downs Inc, 144A | | | | | | | | | | | 4.750% | | | | 1/15/28 | | | | B+ | | | | 1,422,726 | |
| | 1,480 | | | Cinemark USA Inc, 144A | | | | | | | | | | | 5.250% | | | | 7/15/28 | | | | B | | | | 1,517,000 | |
| | 1,495 | | | Constellation Merger Sub Inc, 144A | | | | | | | | | | | 8.500% | | | | 9/15/25 | | | | Caa3 | | | | 1,471,244 | |
| | 100 | | | Hilton Domestic Operating Co Inc, 144A | | | | 5.750% | | | | 5/01/28 | | | | BB | | | | 108,207 | |
| | 830 | | | Hilton Grand Vacations Borrower Escrow LLC / Hilton Grand Vacations Borrower Esc, 144A | | | | 5.000% | | | | 6/01/29 | | | | B | | | | 848,675 | |
| | 200 | | | International Game Technology PLC, 144A | | | | 4.125% | | | | 4/15/26 | | | | BB | | | | 208,250 | |
| | 2,000 | | | International Game Technology PLC, 144A | | | | 6.250% | | | | 1/15/27 | | | | BB | | | | 2,280,000 | |
| | 400 | | | International Game Technology PLC, 144A | | | | 5.250% | | | | 1/15/29 | | | | BB | | | | 429,000 | |
| | 1,700 | | | Life Time Inc, 144A | | | | 5.750% | | | | 1/15/26 | | | | B– | | | | 1,761,625 | |
| | 425 | | | Marriott Ownership Resorts Inc, 144A | | | | 4.500% | | | | 6/15/29 | | | | B+ | | | | 430,844 | |
| | 1,175 | | | MGM China Holdings Ltd, 144A | | | | 5.875% | | | | 5/15/26 | | | | BB– | | | | 1,233,750 | |
| | 2,160 | | | MGM Growth Properties Operating Partnership LP / MGP Finance Co-Issuer Inc | | | | 4.500% | | | | 1/15/28 | | | | BB– | | | | 2,284,200 | |
| | 550 | | | NCL Corp Ltd, 144A | | | | 5.875% | | | | 3/15/26 | | | | B– | | | | 576,125 | |
| | 500 | | | NCL Finance Ltd, 144A | | | | 6.125% | | | | 3/15/28 | | | | B– | | | | 523,975 | |
| | 600 | | | Playtika Holding Corp, 144A | | | | 4.250% | | | | 3/15/29 | | | | B | | | | 599,586 | |
| | 2,000 | | | Scientific Games International Inc, 144A | | | | 5.000% | | | | 10/15/25 | | | | B+ | | | | 2,065,000 | |
| | 1,500 | | | Wynn Las Vegas LLC / Wynn Las Vegas Capital Corp, 144A | | | | 5.250% | | | | 5/15/27 | | | | BB– | | | | 1,611,150 | |
| | 2,000 | | | Wynn Macau Ltd, 144A | | | | | | | | | | | 5.500% | | | | 10/01/27 | | | | BB– | | | | 2,080,000 | |
| | 24,765 | | | Total Hotels, Restaurants & Leisure | | | | | | | | | | | | | | | | | | | | | | | 25,961,842 | |
| | | | | |
| | | | Household Durables – 1.8% | | | | | | | | | | | | | |
| | | | | |
| | 1,175 | | | Kronos Acquisition Holdings Inc / KIK Custom Products Inc, 144A | | | | 5.000% | | | | 12/31/26 | | | | B | | | | 1,192,625 | |
| | 1,325 | | | Kronos Acquisition Holdings Inc / KIK Custom Products Inc, 144A | | | | 7.000% | | | | 12/31/27 | | | | CCC | | | | 1,327,995 | |
| | 750 | | | M/I Homes Inc | | | | | | | | | | | 5.625% | | | | 8/01/25 | | | | BB– | | | | 772,500 | |
| | 3,625 | | | WASH Multifamily Acquisition Inc, 144A | | | | | | | | | | | 5.750% | | | | 4/15/26 | | | | B– | | | | 3,784,862 | |
| | 6,875 | | | Total Household Durables | | | | | | | | | | | | | | | | 7,077,982 | |
| | | | | |
| | | | Independent Power & Renewable Electricity Producers – 2.4% | | | | | | | | | | | | | |
| | | | | |
| | 2,815 | | | Atlantica Sustainable Infrastructure PLC, 144A | | | | 4.125% | | | | 6/15/28 | | | | BB+ | | | | 2,867,922 | |
| | 600 | | | Azure Power Solar Energy Pvt Ltd, 144A | | | | | | | | | | | 5.650% | | | | 12/24/24 | | | | Ba1 | | | | 636,000 | |
| | 1,000 | | | EnfraGen Energia Sur SA / EnfraGen Spain SA / Prime Energia SpA, 144A | | | | | | | | | | | 5.375% | | | | 12/30/30 | | | | BBB– | | | | 995,000 | |
| | 825 | | | Investment Energy Resources Ltd, 144A | | | | | | | | | | | 6.250% | | | | 4/26/29 | | | | BB– | | | | 892,031 | |
| | 1,000 | | | Talen Energy Supply LLC, 144A | | | | | | | | | | | 7.625% | | | | 6/01/28 | | | | BB– | | | | 935,710 | |
| | 2,500 | | | TerraForm Power Operating LLC, 144A | | | | | | | | | | | 5.000% | | | | 1/31/28 | | | | BB– | | | | 2,646,875 | |
| | 670 | | | UEP Penonome II SA, 144A | | | | | | | | | | | 6.500% | | | | 10/01/38 | | | | BB | | | | 683,876 | |
| | 9,410 | | | Total Independent Power & Renewable Electricity Producers | | | | | | | | | | | | | | | | 9,657,414 | |
| | | | | |
| | | | Industrial Conglomerates – 0.4% | | | | | | | | | | | | | |
| | | | | |
| | 1,550 | | | Icahn Enterprises LP / Icahn Enterprises Finance Corp, 144A | | | | 4.375% | | | | 2/01/29 | | | | BB | | | | 1,542,250 | |
| | | | | |
| | | | Insurance – 1.6% | | | | | | | | | | | | | |
| | | | | |
| | 1,125 | | | Acrisure LLC / Acrisure Finance Inc, 144A | | | | 10.125% | | | | 8/01/26 | | | | CCC+ | | | | 1,268,438 | |
| | 2,475 | | | Acrisure LLC / Acrisure Finance Inc, 144A | | | | 4.250% | | | | 2/15/29 | | | | B | | | | 2,444,062 | |
| | 100 | | | Alliant Holdings Intermediate LLC / Alliant Holdings Co-Issuer, 144A | | | | 4.250% | | | | 10/15/27 | | | | B | | | | 101,499 | |
| | 725 | | | Antero Resources Corp, 144A | | | | | | | | | | | 5.375% | | | | 3/01/30 | | | | BB– | | | | 739,957 | |
| | 1,000 | | | Fidelis Insurance Holdings Ltd, 144A | | | | | | | | | | | 6.625% | | | | 4/01/41 | | | | BB+ | | | | 1,017,722 | |
| | 1,000 | | | SBL Holdings Inc, 144A | | | | | | | | | | | 6.500% | | | | 12/30/49 | | | | BB | | | | 993,750 | |
| | 6,425 | | | Total Insurance | | | | | | | | | | | | | | | | 6,565,428 | |
| | | | | |
| | | | Interactive Media & Services – 0.4% | | | | | | | | | | | | | |
| | | | | | | |
| | 250 | | | Arches Buyer Inc, 144A | | | | | | | | | | | 6.125% | | | | 12/01/28 | | | | CCC+ | | | | 257,500 | |
| | 1,225 | | | Rackspace Technology Global Inc, 144A | | | | 3.500% | | | | 2/15/28 | | | | B+ | | | | 1,185,188 | |
| | 1,475 | | | Total Interactive Media & Services | | | | | | | | | | | | | | | | | | | | | | | 1,442,688 | |
22
| | | | | | | | | | | | | | | | | | | | | | | | | | | | |
Principal
Amount (000) | | | Description (1) | | | | | | | | Coupon | | | Maturity | | | Ratings (2) | | | Value | |
| | | | | |
| | | | Internet & Direct Marketing Retail – 0.2% | | | | | | | | | | | | | |
| | | | | | | |
| $ | 650 | | | B2W Digital Lux Sarl, 144A | | | | | | | | | | | 4.375% | | | | 12/20/30 | | | | BB | | | $ | 651,300 | |
| | | | | |
| | | | IT Services – 0.8% | | | | | | | | | | | | | |
| | | | | | | |
| | 2,700 | | | Ahead DB Holdings LLC, 144A | | | | | | | | | | | 6.625% | | | | 5/01/28 | | | | CCC+ | | | | 2,793,258 | |
| | 250 | | | Science Applications International Corp, 144A | | | | 4.875% | | | | 4/01/28 | | | | BB– | | | | 262,188 | |
| | 2,950 | | | Total IT Services | | | | | | | | | | | | | | | | | | | | | | | 3,055,446 | |
| | | | | |
| | | | Leisure Products – 0.6% | | | | | | | | | | | | | |
| | | | | | | |
| | 2,350 | | | Academy Ltd, 144A | | | | | | | | | | | 6.000% | | | | 11/15/27 | | | | B+ | | | | 2,511,563 | |
| | | | | |
| | | | Life Sciences Tools & Services – 0.2% | | | | | | | | | | | | | |
| | | | | | | |
| | 900 | | | Avantor Funding Inc, 144A | | | | | | | | | | | 4.625% | | | | 7/15/28 | | | | BB– | | | | 950,193 | |
| | | | | |
| | | | Machinery – 0.3% | | | | | | | | | | | | | |
| | | | | |
| | 1,000 | | | Titan Acquisition Ltd / Titan Co-Borrower LLC, 144A | | | | 7.750% | | | | 4/15/26 | | | | CCC | | | | 1,036,250 | |
| | | | | |
| | | | Marine – 0.2% | | | | | | | | | | | | | |
| | | | | |
| | 650 | | | Hidrovias International Finance SARL, 144A | | | | 4.950% | | | | 2/08/31 | | | | Ba2 | | | | 660,481 | |
| | | | | |
| | | | Media – 5.5% | | | | | | | | | | | | | |
| | | | | | | |
| | 1,429 | | | Altice France SA/France, 144A | | | | | | | | | | | 7.375% | | | | 5/01/26 | | | | B | | | | 1,486,060 | |
| | 100 | | | CCO Holdings LLC / CCO Holdings Capital Corp, 144A | | | | 4.500% | | | | 8/15/30 | | | | BB | | | | 104,121 | |
| | 1,050 | | | Clear Channel Outdoor Holdings Inc, 144A | | | | 7.750% | | | | 4/15/28 | | | | CCC | | | | 1,099,896 | |
| | 1,665 | | | Clear Channel Outdoor Holdings Inc, 144A | | | | 7.500% | | | | 6/01/29 | | | | CCC | | | | 1,723,835 | |
| | 1,250 | | | CSC Holdings LLC, 144A | | | | | | | | | | | 5.375% | | | | 2/01/28 | | | | BB | | | | 1,322,438 | |
| | 1,250 | | | DISH DBS Corp | | | | | | | | | | | 5.875% | | | | 11/15/24 | | | | B | | | | 1,342,188 | |
| | 2,550 | | | DISH DBS Corp, 144A | | | | | | | | | | | 5.125% | | | | 6/01/29 | | | | B | | | | 2,517,946 | |
| | 2,000 | | | Getty Images Inc, 144A | | | | | | | | | | | 9.750% | | | | 3/01/27 | | | | CCC+ | | | | 2,145,000 | |
| | 900 | | | Lamar Media Corp | | | | | | | | | | | 4.875% | | | | 1/15/29 | | | | BB– | | | | 949,500 | |
| | 1,275 | | | LCPR Senior Secured Financing DAC, 144A | | | | 5.125% | | | | 7/15/29 | | | | B+ | | | | 1,318,031 | |
| | 1,090 | | | Sirius XM Radio Inc, 144A | | | | | | | | | | | 4.000% | | | | 7/15/28 | | | | BB | | | | 1,122,700 | |
| | 1,525 | | | Univision Communications Inc, 144A | | | | | | | | | | | 4.500% | | | | 5/01/29 | | | | B1 | | | | 1,536,438 | |
| | 1,500 | | | UPC Broadband Finco BV, 144A | | | | | | | | | | | 4.875% | | | | 7/15/31 | | | | BB– | | | | 1,503,450 | |
| | 2,500 | | | UPC Holding BV, 144A | | | | | | | | | | | 5.500% | | | | 1/15/28 | | | | B | | | | 2,618,750 | |
| | 925 | | | Virgin Media Secured Finance PLC, 144A | | | | 5.500% | | | | 5/15/29 | | | | BB– | | | | 994,375 | |
| | 21,009 | | | Total Media | | | | | | | | | | | | | | | | | | | | | | | 21,784,728 | |
| | | | | |
| | | | Metals & Mining – 3.4% | | | | | | | | | | | | | |
| | | | | | | |
| | 775 | | | AngloGold Ashanti Holdings PLC | | | | | | | | | | | 3.750% | | | | 10/01/30 | | | | BBB– | | | | 798,855 | |
| | 3,000 | | | AngloGold Ashanti Holdings PLC | | | | | | | | | | | 6.500% | | | | 4/15/40 | | | | BBB– | | | | 3,720,000 | |
| | 875 | | | Constellium SE, 144A | | | | | | | | | | | 3.750% | | | | 4/15/29 | | | | B | | | | 866,250 | |
| | 2,000 | | | First Quantum Minerals Ltd, 144A | | | | | | | | | | | 6.875% | | | | 3/01/26 | | | | B | | | | 2,092,220 | |
| | 1,500 | | | Gold Fields Orogen Holdings BVI Ltd, 144A | | | | 6.125% | | | | 5/15/29 | | | | BBB– | | | | 1,775,700 | |
| | 950 | | | Nexa Resources SA, 144A | | | | | | | | | | | 6.500% | | | | 1/18/28 | | | | BB+ | | | | 1,071,609 | |
| | 500 | | | Vale Overseas Ltd | | | | | | | | | | | 6.875% | | | | 11/10/39 | | | | BBB– | | | | 699,385 | |
| | 2,500 | | | Warrior Met Coal Inc, 144A | | | | | | | | | | | 8.000% | | | | 11/01/24 | | | | BB | | | | 2,537,500 | |
| | 12,100 | | | Total Metals & Mining | | | | | | | | | | | | | | | | | | | | | | | 13,561,519 | |
| | | | | |
| | | | Mortgage Real Estate Investment Trust – 0.2% | | | | | | | | | | | | | |
| | | | | |
| | 675 | | | HAT Holdings I LLC / HAT Holdings II LLC, 144A | | | | 6.000% | | | | 4/15/25 | | | | BB+ | | | | 711,524 | |
| | | | | |
| | | | Oil, Gas & Consumable Fuels – 16.3% | | | | | | | | | | | | | |
| | | | | |
| | 1,800 | | | Antero Midstream Partners LP / Antero Midstream Finance Corp, 144A | | | | 7.875% | | | | 5/15/26 | | | | BB– | | | | 2,011,698 | |
| | 1,335 | | | Antero Midstream Partners LP / Antero Midstream Finance Corp, 144A | | | | 5.375% | | | | 6/15/29 | | | | BB– | | | | 1,391,737 | |
| | 244 | | | Antero Resources Corp, 144A | | | | | | | | | | | 8.375% | | | | 7/15/26 | | | | BB– | | | | 277,550 | |
| | 1,500 | | | Calumet Specialty Products Partners LP / Calumet Finance Corp | | | | 7.750% | | | | 4/15/23 | | | | B– | | | | 1,492,500 | |
| | 1,875 | | | Cosan SA, 144A | | | | | | | | | | | 5.500% | | | | 9/20/29 | | | | BB | | | | 2,019,769 | |
| | 1,900 | | | Crestwood Midstream Partners LP / Crestwood Midstream Finance Corp, 144A | | | | | | | | | | | 5.625% | | | | 5/01/27 | | | | BB– | | | | 1,949,875 | |
| | 715 | | | DT Midstream Inc, 144A | | | | | | | | | | | 4.125% | | | | 6/15/29 | | | | BB+ | | | | 725,961 | |
| | 895 | | | DT Midstream Inc, 144A | | | | | | | | | | | 4.375% | | | | 6/15/31 | | | | BB+ | | | | 914,502 | |
23
| | |
| |
| JGH | | Nuveen Global High Income Fund (continued) |
| | Portfolio of Investments June 30, 2021 |
| | (Unaudited) |
| | | | | | | | | | | | | | | | | | | | | | | | | | | | |
Principal
Amount (000) | | | Description (1) | | | | | | | | Coupon | | | Maturity | | | Ratings (2) | | | Value | |
| | | | | |
| | | | Oil, Gas & Consumable Fuels (continued) | | | | | | | | | | | | | |
| | | | | | | |
| $ | 625 | | | Ecopetrol SA | | | | | | | | | | | 6.875% | | | | 4/29/30 | | | | BBB– | | | $ | 754,381 | |
| | 2,351 | | | Energean Israel Finance Ltd | | | | | | | | | | | 5.875% | | | | 3/30/31 | | | | BB– | | | | 2,411,753 | |
| | 200 | | | EnLink Midstream LLC, 144A | | | | | | | | | | | 5.625% | | | | 1/15/28 | | | | BB+ | | | | 211,278 | |
| | 425 | | | EQM Midstream Partners LP, 144A | | | | | | | | | | | 4.500% | | | | 1/15/29 | | | | BB– | | | | 432,386 | |
| | 525 | | | EQM Midstream Partners LP, 144A | | | | | | | | | | | 4.750% | | | | 1/15/31 | | | | BB– | | | | 540,981 | |
| | 500 | | | Genesis Energy LP / Genesis Energy Finance Corp | | | | 6.500% | | | | 10/01/25 | | | | B+ | | | | 505,000 | |
| | 1,500 | | | Leviathan Bond Ltd , Reg S, 144A | | | | | | | | | | | 6.500% | | | | 6/30/27 | | | | BB– | | | | 1,664,028 | |
| | 1,750 | | | Medco Oak Tree Pte Ltd, 144A | | | | | | | | | | | 7.375% | | | | 5/14/26 | | | | B+ | | | | 1,911,875 | |
| | 4,000 | | | MEG Energy Corp, 144A | | | | | | | | | | | 5.875% | | | | 2/01/29 | | | | BB– | | | | 4,170,000 | |
| | 2,500 | | | Moss Creek Resources Holdings Inc, 144A | | | | 10.500% | | | | 5/15/27 | | | | B | | | | 2,472,500 | |
| | 1,600 | | | Murphy Oil Corp | | | | | | | | | | | 5.875% | | | | 12/01/27 | | | | BB | | | | 1,669,920 | |
| | 2,100 | | | New Fortress Energy Inc, 144A | | | | | | | | | | | 6.500% | | | | 9/30/26 | | | | Ba3 | | | | 2,145,780 | |
| | 700 | | | NGL Energy Operating LLC / NGL Energy Finance Corp, 144A | | | | 7.500% | | | | 2/01/26 | | | | BB– | | | | 735,000 | |
| | 475 | | | Occidental Petroleum Corp | | | | | | | | | | | 5.500% | | | | 12/01/25 | | | | BB | | | | 524,885 | |
| | 400 | | | Occidental Petroleum Corp | | | | | | | | | | | 6.125% | | | | 1/01/31 | | | | BB | | | | 470,612 | |
| | 500 | | | OQ SAOC, 144A | | | | | | | | | | | 5.125% | | | | 5/06/28 | | | | Ba3 | | | | 502,532 | |
| | 1,000 | | | Parkland Corp/Canada, 144A | | | | | | | | | | | 5.875% | | | | 7/15/27 | | | | BB | | | | 1,065,870 | |
| | 1,325 | | | Parkland Corp/Canada, 144A | | | | | | | | | | | 4.500% | | | | 10/01/29 | | | | BB | | | | 1,346,452 | |
| | 335 | | | PBF Holding Co LLC / PBF Finance Corp, 144A | | | | 9.250% | | | | 5/15/25 | | | | BB | | | | 337,476 | |
| | 2,095 | | | PBF Holding Co LLC / PBF Finance Corp | | | | 7.250% | | | | 6/15/25 | | | | B+ | | | | 1,592,200 | |
| | 1,500 | | | Petrobras Global Finance BV | | | | | | | | | | | 5.093% | | | | 1/15/30 | | | | BB– | | | | 1,637,265 | |
| | 1,500 | | | Petrobras Global Finance BV | | | | | | | | | | | 5.600% | | | | 1/03/31 | | | | BB– | | | | 1,680,000 | |
| | 980 | | | Petrobras Global Finance BV | | | | | | | | | | | 6.900% | | | | 3/19/49 | | | | BB– | | | | 1,168,405 | |
| | 550 | | | Petrobras Global Finance BV | | | | | | | | | | | 5.500% | | | | 6/10/51 | | | | BB– | | | | 550,192 | |
| | 3,146 | | | Petroleos Mexicanos | | | | | | | | | | | 8.000% | | | | 1/23/27 | | | | BB | | | | 3,322,962 | |
| | 2,000 | | | Petroleos Mexicanos | | | | | | | | | | | 5.350% | | | | 2/12/28 | | | | BB | | | | 1,966,900 | |
| | 1,230 | | | Range Resources Corp | | | | | | | | | | | 9.250% | | | | 2/01/26 | | | | B+ | | | | 1,356,075 | |
| | 1,335 | | | Saka Energi Indonesia PT, 144A | | | | | | | | | | | 4.450% | | | | 5/05/24 | | | | B1 | | | | 1,264,912 | |
| | 1,500 | | | SierraCol Energy Andina LLC, 144A | | | | | | | | | | | 6.000% | | | | 6/15/28 | | | | B1 | | | | 1,518,300 | |
| | 2,000 | | | SM Energy Co | | | | | | | | | | | 5.625% | | | | 6/01/25 | | | | B | | | | 1,980,000 | |
| | 1,000 | | | SM Energy Co | | | | | | | | | | | 6.750% | | | | 9/15/26 | | | | B | | | | 1,017,500 | |
| | 1,520 | | | SunCoke Energy Inc, 144A | | | | | | | | | | | 4.875% | | | | 6/30/29 | | | | BB | | | | 1,518,100 | |
| | 1,000 | | | Sunoco LP / Sunoco Finance Corp | | | | | | | | | | | 6.000% | | | | 4/15/27 | | | | BB– | | | | 1,045,750 | |
| | 475 | | | Sunoco LP / Sunoco Finance Corp, 144A | | | | 4.500% | | | | 5/15/29 | | | | BB– | | | | 483,313 | |
| | 1,800 | | | Targa Resources Partners LP / Targa Resources Partners Finance Corp | | | | 5.875% | | | | 4/15/26 | | | | BB | | | | 1,890,558 | |
| | 1,000 | | | TransMontaigne Partners LP / TLP Finance Corp | | | | 6.125% | | | | 2/15/26 | | | | B+ | | | | 1,022,500 | |
| | 1,825 | | | Tullow Oil PLC, 144A | | | | | | | | | | | 10.250% | | | | 5/15/26 | | | | B– | | | | 1,914,972 | |
| | 3,000 | | | USA Compression Partners LP / USA Compression Finance Corp | | | | 6.875% | | | | 9/01/27 | | | | B+ | | | | 3,204,840 | |
| | 62,531 | | | Total Oil, Gas & Consumable Fuels | | | | | | | | | | | | | | | | | | | | | | | 64,791,045 | |
| | | | | | | |
| | | | Personal Products – 0.5% | | | | | | | | | | | | | | | | | | |
| | | | | | | |
| | 2,000 | | | Coty Inc, 144A | | | | | | | | | | | 5.000% | | | | 4/15/26 | | | | B | | | | 2,027,960 | |
| | | | | | | |
| | | | Pharmaceuticals – 2.2% | | | | | | | | | | | | | | | | | | |
| | | | | | | |
| | 1,740 | | | Bausch Health Cos Inc, 144A | | | | | | | | | | | 4.875% | | | | 6/01/28 | | | | BB | | | | 1,780,890 | |
| | 200 | | | Horizon Therapeutics USA Inc, 144A | | | | | | | | | | | 5.500% | | | | 8/01/27 | | | | BB– | | | | 212,250 | |
| | 725 | | | Jazz Securities DAC, 144A | | | | | | | | | | | 4.375% | | | | 1/15/29 | | | | BB | | | | 751,680 | |
| | 2,150 | | | ORGANON & CO/ORG, 144A | | | | | | | | | | | 5.125% | | | | 4/30/31 | | | | BB– | | | | 2,214,930 | |
| | 1,500 | | | Par Pharmaceutical Inc, 144A | | | | | | | | | | | 7.500% | | | | 4/01/27 | | | | B | | | | 1,533,495 | |
| | 2,000 | | | Teva Pharmaceutical Finance Netherlands III BV | | | | 6.750% | | | | 3/01/28 | | | | BB | | | | 2,190,000 | |
| | 8,315 | | | Total Pharmaceuticals | | | | | | | | | | | | | | | | | | | | | | | 8,683,245 | |
| | | | | |
| | | | Real Estate Management & Development – 1.7% | | | | | | | | | | | | | |
| | | | | | | |
| | 975 | | | Howard Hughes Corp, 144A | | | | | | | | | | | 4.125% | | | | 2/01/29 | | | | BB– | | | | 975,020 | |
| | 1,050 | | | Howard Hughes Corp, 144A | | | | | | | | | | | 4.375% | | | | 2/01/31 | | | | BB– | | | | 1,046,199 | |
| | 1,125 | | | Kennedy-Wilson Inc | | | | | | | | | | | 4.750% | | | | 3/01/29 | | | | BB | | | | 1,158,750 | |
| | 1,175 | | | Kennedy-Wilson Inc | | | | | | | | | | | 5.000% | | | | 3/01/31 | | | | BB | | | | 1,208,781 | |
| | 2,000 | | | Realogy Group LLC / Realogy Co-Issuer Corp, 144A | | | | 9.375% | | | | 4/01/27 | | | | B– | | | | 2,222,280 | |
| | 6,325 | | | Total Real Estate Management & Development | | | | | | | | | | | | | | | | 6,611,030 | |
| | | | | |
| | | | Road & Rail – 0.3% | | | | | | | | | | | | | |
| | | | | | | |
| | 1,000 | | | Rumo Luxembourg Sarl, 144A | | | | | | | | | | | 5.250% | | | | 1/10/28 | | | | BB | | | | 1,070,400 | |
24
| | | | | | | | | | | | | | | | | | | | | | | | | | | | |
Principal
Amount (000) | | | Description (1) | | | | | | | | Coupon | | | Maturity | | | Ratings (2) | | | Value | |
| | | | | |
| | | | Software – 0.3% | | | | | | | | | | | | | |
| | | | | |
| $ | 1,175 | | | Clarivate Science Holdings Corp, 144A | | | | 3.875% | | | | 6/30/28 | | | | B+ | | | $ | 1,185,704 | |
| | | | | |
| | | | Specialty Retail – 2.7% | | | | | | | | | | | | | |
| | | | | |
| | 4,425 | | | Ferrellgas LP / Ferrellgas Finance Corp, 144A | | | | 5.875% | | | | 4/01/29 | | | | B– | | | | 4,369,687 | |
| | 925 | | | L Brands Inc, 144A | | | | | | | | | | | 6.625% | | | | 10/01/30 | | | | BB– | | | | 1,070,688 | |
| | 800 | | | LCM Investments Holdings II LLC, 144A | | | | 4.875% | | | | 5/01/29 | | | | BB– | | | | 820,000 | |
| | 750 | | | Magic Mergeco Inc, 144A | | | | | | | | | | | 5.250% | | | | 5/01/28 | | | | BB– | | | | 769,448 | |
| | 1,400 | | | Magic Mergeco Inc, 144A | | | | | | | | | | | 7.875% | | | | 5/01/29 | | | | B– | | | | 1,443,750 | |
| | 1,500 | | | Staples Inc, 144A | | | | | | | | | | | 7.500% | | | | 4/15/26 | | | | B | | | | 1,553,602 | |
| | 850 | | | Superior Plus LP / Superior General Partner Inc, 144A | | | | 4.500% | | | | 3/15/29 | | | | BB– | | | | 875,517 | |
| | 10,650 | | | Total Specialty Retail | | | | | | | | | | | | | | | | | | | | | | | 10,902,692 | |
| | | | | |
| | | | Technology Hardware, Storage & Peripherals – 0.8% | | | | | | | | | | | | | |
| | | | | | | |
| | 3,000 | | | Diebold Nixdorf Inc | | | | | | | | | | | 8.500% | | | | 4/15/24 | | | | CCC | | | | 3,071,250 | |
| | | | | |
| | | | Thrifts & Mortgage Finance – 0.4% | | | | | | | | | | | | | |
| | | | | |
| | 1,750 | | | Ladder Capital Finance Holdings LLLP / Ladder Capital Finance Corp, 144A | | | | 5.250% | | | | 10/01/25 | | | | BB | | | | 1,780,625 | |
| | | | | |
| | | | Trading Companies & Distributors – 0.2% | | | | | | | | | | | | | |
| | | | | | | |
| | 600 | | | WESCO Distribution Inc, 144A | | | | | | | | | | | 7.250% | | | | 6/15/28 | | | | BB– | | | | 668,310 | |
| | | | | |
| | | | Transportation Infrastructure – 0.3% | | | | | | | | | | | | | |
| | | | | |
| | 1,000 | | | Aeropuertos Dominicanos Siglo XXI SA, 144A | | | | 6.750% | | | | 3/30/29 | | | | B+ | | | | 1,046,250 | |
| | | | | |
| | | | Wireless Telecommunication Services – 1.8% | | | | | | | | | | | | | |
| | | | | | | |
| | 1,550 | | | C&W Senior Financing DAC, 144A | | | | | | | | | | | 6.875% | | | | 9/15/27 | | | | B+ | | | | 1,654,082 | |
| | 2,750 | | | Hughes Satellite Systems Corp | | | | | | | | | | | 6.625% | | | | 8/01/26 | | | | BB | | | | 3,083,437 | |
| | 900 | | | Millicom International Cellular SA, 144A | | | | 5.125% | | | | 1/15/28 | | | | Ba1 | | | | 936,000 | |
| | 250 | | | Millicom International Cellular SA, 144A | | | | 4.500% | | | | 4/27/31 | | | | Ba1 | | | | 258,750 | |
| | 1,050 | | | Oztel Holdings SPC Ltd, 144A | | | | | | | | | | | 6.625% | | | | 4/24/28 | | | | Ba3 | | | | 1,163,768 | |
| | 6,500 | | | Total Wireless Telecommunication Services | | | | | | | | | | | | | | | | 7,096,037 | |
| $ | 332,686 | | | Total Corporate Bonds (cost $332,363,270) | | | | | | | | | | | | | | | | 344,156,726 | |
| | | | | | | |
Principal
Amount (000) | | | Description (1) | | | | | | | | Coupon | | | Maturity | | | Ratings (2) | | | Value | |
| | | | | | |
| | | | SOVEREIGN DEBT – 15.6% (11.1% of Total Investments) | | | | | | | | | | | | | | | | | | | | | |
| | | | | | | |
| | | | Angola – 0.6% | | | | | | | | | | | | | | | | | | |
| | | | | | | |
| $ | 1,500 | | | Angolan Government International Bond, 144A | | | | | | | | | | | 8.250% | | | | 5/09/28 | | | | Caa1 | | | $ | 1,564,230 | |
| | 900 | | | Angolan Government International Bond, 144A | | | | | | | | | | | 8.000% | | | | 11/26/29 | | | | CCC+ | | | | 922,392 | |
| | 2,400 | | | Total Angola | | | | | | | | | | | | | | | | | | | | | | | 2,486,622 | |
| | | | | | | |
| | | | Argentina – 0.2% | | | | | | | | | | | | | | | | | | |
| | | | | | | |
| | 169 | | | Argentine Republic Government International Bond | | | | | | | | | | | 1.000% | | | | 7/09/29 | | | | CCC+ | | | | 63,929 | |
| | 548 | | | Argentine Republic Government International Bond | | | | | | | | | | | 0.125% | | | | 7/09/30 | | | | CCC+ | | | | 196,279 | |
| | 1,474 | | | Argentine Republic Government International Bond | | | | | | | | | | | 0.125% | | | | 7/09/35 | | | | CCC+ | | | | 466,730 | |
| | 544 | | | Argentine Republic Government International Bond | | | | | | | | | | | 0.125% | | | | 7/09/41 | | | | CCC+ | | | | 193,936 | |
| | 2,735 | | | Total Argentina | | | | | | | | | | | | | | | | | | | | | | | 920,874 | |
| | | | | | | |
| | | | Bahrain – 0.5% | | | | | | | | | | | | | | | | | | |
| | | | | | | |
| | 1,000 | | | Bahrain Government International Bond, 144A | | | | | | | | | | | 4.250% | | | | 1/25/28 | | | | B+ | | | | 1,000,000 | |
| | 1,000 | | | Bahrain Government International Bond, 144A | | | | | | | | | | | 7.000% | | | | 10/12/28 | | | | B+ | | | | 1,121,122 | |
| | 2,000 | | | Total Bahrain | | | | | | | | | | | | | | | | | | | | | | | 2,121,122 | |
| | | | | | | |
| | | | Brazil – 0.6% | | | | | | | | | | | | | | | | | | |
| | | | | | | |
| | 1,250 | | | Brazilian Government International Bond | | | | | | | | | | | 3.875% | | | | 6/12/30 | | | | BB– | | | | 1,260,500 | |
| | 1,200 | | | Brazilian Government International Bond | | | | | | | | | | | 5.000% | | | | 1/27/45 | | | | BB– | | | | 1,212,576 | |
| | 2,450 | | | Total Brazil | | | | | | | | | | | | | | | | | | | | | | | 2,473,076 | |
25
| | |
| |
| JGH | | Nuveen Global High Income Fund (continued) |
| | Portfolio of Investments June 30, 2021 |
| | (Unaudited) |
| | | | | | | | | | | | | | | | | | | | | | | | | | | | |
Principal
Amount (000) | | | Description (1) | | | | | | | | Coupon | | | Maturity | | | Ratings (2) | | | Value | |
| | | | | | | |
| | | | Costa Rica – 0.5% | | | | | | | | | | | | | | | | | | |
| | | | | | | |
| $ | 2,050 | | | Costa Rica Government International Bond, 144A | | | | | | | | | | | 6.125% | | | | 2/19/31 | | | | B | | | $ | 2,173,020 | |
| | | | | | | |
| | | | Dominican Republic – 1.5% | | | | | | | | | | | | | | | | | | |
| | | | | | | |
| | 3,000 | | | Dominican Republic International Bond, 144A | | | | | | | | | | | 5.500% | | | | 1/27/25 | | | | BB– | | | | 3,293,700 | |
| | 1,500 | | | Dominican Republic International Bond, 144A | | | | | | | | | | | 4.875% | | | | 9/23/32 | | | | BB– | | | | 1,545,000 | |
| | 1,175 | | | Dominican Republic International Bond, 144A | | | | | | | | | | | 5.300% | | | | 1/21/41 | | | | BB– | | | | 1,172,074 | |
| | 5,675 | | | Total Dominican Republic | | | | | | | | | | | | | | | | | | | | | | | 6,010,774 | |
| | | | | | | |
| | | | Ecuador – 0.5% | | | | | | | | | | | | | | | | | | |
| | | | | | | |
| | 1,768 | | | Ecuador Government International Bond, 144A | | | | | | | | | | | 0.500% | | | | 7/31/30 | | | | B– | | | | 1,506,812 | |
| | 80 | | | Ecuador Government International Bond, 144A | | | | | | | | | | | 0.000% | | | | 7/31/30 | | | | B– | | | | 44,238 | |
| | 371 | | | Ecuador Government International Bond, 144A | | | | | | | | | | | 0.500% | | | | 7/31/35 | | | | B– | | | | 254,460 | |
| | 2,219 | | | Total Ecuador | | | | | | | | | | | | | | | | | | | | | | | 1,805,510 | |
| | | | | | | |
| | | | Egypt – 0.9% | | | | | | | | | | | | | | | | | | |
| | | | | | | |
| | 1,300 | | | Egypt Government International Bond, 144A | | | | | | | | | | | 5.875% | | | | 6/11/25 | | | | B | | | | 1,386,346 | |
| | 2,300 | | | Egypt Government International Bond, 144A | | | | | | | | | | | 7.053% | | | | 1/15/32 | | | | B+ | | | | 2,356,350 | |
| | 3,600 | | | Total Egypt | | | | | | | | | | | | | | | | | | | | | | | 3,742,696 | |
| | | | | | | |
| | | | El Salvador – 0.2% | | | | | | | | | | | | | | | | | | |
| | | | | | | |
| | 725 | | | El Salvador Government International Bond, 144A | | | | | | | | | | | 7.650% | | | | 6/15/35 | | | | B– | | | | 661,635 | |
| | | | | | | |
| | | | Ghana – 0.8% | | | | | | | | | | | | | | | | | | |
| | | | | | | |
| | 3,325 | | | Ghana Government International Bond, 144A | | | | | | | | | | | 8.125% | | | | 3/26/32 | | | | B– | | | | 3,368,604 | |
| | | | | | | |
| | | | Guatemala – 0.6% | | | | | | | | | | | | | | | | | | |
| | | | | | | |
| | 1,980 | | | Guatemala Government Bond, 144A | | | | | | | | | | | 6.125% | | | | 6/01/50 | | | | BB– | | | | 2,420,550 | |
| | | | | | | |
| | | | Honduras – 0.2% | | | | | | | | | | | | | | | | | | |
| | | | | | | |
| | 725 | | | Honduras Government International Bond, 144A | | | | | | | | | | | 6.250% | | | | 1/19/27 | | | | BB– | | | | 791,338 | |
| | | | | | | |
| | | | Iraq – 0.7% | | | | | | | | | | | | | | | | | | |
| | | | | | | |
| | 2,713 | | | Iraq International Bond, 144A | | | | | | | | | | | 5.800% | | | | 1/15/28 | | | | N/R | | | | 2,623,774 | |
| | | | | | | |
| | | | Jamaica – 0.6% | | | | | | | | | | | | | | | | | | |
| | | | | | | |
| | 1,700 | | | Jamaica Government International Bond | | | | | | | | | | | 7.875% | | | | 7/28/45 | | | | B | | | | 2,371,500 | |
| | | | | | | |
| | | | Jordan – 0.5% | | | | | | | | | | | | | | | | | | |
| | | | | | | |
| | 1,000 | | | Jordan Government International Bond, 144A | | | | | | | | | | | 4.950% | | | | 7/07/25 | | | | B+ | | | | 1,037,700 | |
| | 800 | | | Jordan Government International Bond, 144A | | | | | | | | | | | 5.750% | | | | 1/31/27 | | | | B+ | | | | 858,704 | |
| | 1,800 | | | Total Jordan | | | | | | | | | | | | | | | | | | | | | | | 1,896,404 | |
| | | | | | | |
| | | | Kenya – 0.8% | | | | | | | | | | | | | | | | | | |
| | | | | | | |
| | 2,000 | | | Kenya Government International Bond, 144A | | | | | | | | | | | 7.000% | | | | 5/22/27 | | | | B+ | | | | 2,194,440 | |
| | 825 | | | Kenya Government International Bond, 144A | | | | | | | | | | | 6.300% | | | | 1/23/34 | | | | B+ | | | | 822,937 | |
| | 2,825 | | | Total Kenya | | | | | | | | | | | | | | | | | | | | | | | 3,017,377 | |
| | | | | | | |
| | | | Mongolia – 0.2% | | | | | | | | | | | | | | | | | | |
| | | | | | | |
| | 675 | | | Mongolia Government International Bond, 144A, (WI/DD) | | | | | | | | | | | 4.450% | | | | 7/07/31 | | | | B | | | | 662,119 | |
| | | | | | | |
| | | | Morocco – 0.2% | | | | | | | | | | | | | | | | | | |
| | | | | | | |
| | 775 | | | Morocco Government International Bond, 144A | | | | | | | | | | | 3.000% | | | | 12/15/32 | | | | BB+ | | | | 747,441 | |
| | | | | | | |
| | | | Nigeria – 0.4% | | | | | | | | | | | | | | | | | | |
| | | | | | | |
| | 1,425 | | | Nigeria Government International Bond, 144A | | | | | | | | | | | 7.875% | | | | 2/16/32 | | | | B | | | | 1,534,013 | |
| | | | | | | |
| | | | Oman – 1.1% | | | | | | | | | | | | | | | | | | |
| | | | | | | |
| | 1,000 | | | Oman Government International Bond, 144A | | | | | | | | | | | 4.750% | | | | 6/15/26 | | | | BB– | | | | 1,036,450 | |
| | 800 | | | Oman Government International Bond, 144A | | | | | | | | | | | 6.750% | | | | 10/28/27 | | | | Ba3 | | | | 896,000 | |
26
| | | | | | | | | | | | | | | | | | | | | | | | | | | | |
Principal
Amount (000) | | | Description (1) | | | | | | | | Coupon | | | Maturity | | | Ratings (2) | | | Value | |
| | | | | | | |
| | | | Oman (continued) | | | | | | | | | | | | | | | | | | |
| | | | | |
| $ | 1,500 | | | Oman Government International Bond, 144A | | | | 6.000% | | | | 8/01/29 | | | | Ba3 | | | $ | 1,593,639 | |
| | 800 | | | Oman Sovereign Sukuk Co, 144A | | | | | | | | 4.875% | | | | 6/15/30 | | | | Ba3 | | | | 820,768 | |
| | 4,100 | | | Total Oman | | | | | | | | | | | | | | | | | | | | | | | 4,346,857 | |
| | | | | | | |
| | | | Pakistan – 0.4% | | | | | | | | | | | | | | | | | | |
| | | | | |
| | 1,450 | | | Pakistan Government International Bond, 144A | | | | 6.875% | | | | 12/05/27 | | | | B– | | | | 1,504,871 | |
| | | | | | | |
| | | | Senegal – 0.4% | | | | | | | | | | | | | | | | | | |
| | | | | |
| | 1,500 | | | Senegal Government International Bond, 144A | | | | 6.250% | | | | 5/23/33 | | | | BB– | | | | 1,580,670 | |
| | | | | | | |
| | | | Sri Lanka – 0.2% | | | | | | | | | | | | | | | | | | |
| | | | | |
| | 1,500 | | | Sri Lanka Government International Bond, 144A | | | | 6.125% | | | | 6/03/25 | | | | CCC+ | | | | 1,005,000 | |
| | | | | | | |
| | | | Turkey – 2.1% | | | | | | | | | | | | | | | | | | |
| | | | | |
| | 1,800 | | | Turkey Government International Bond | | | | 5.750% | | | | 3/22/24 | | | | Ba3 | | | | 1,866,010 | |
| | 1,500 | | | Turkey Government International Bond | | | | 5.125% | | | | 2/17/28 | | | | Ba3 | | | | 1,456,200 | |
| | 1,500 | | | Turkey Government International Bond | | | | 5.950% | | | | 1/15/31 | | | | Ba3 | | | | 1,468,536 | |
| | 1,250 | | | Turkey Government International Bond | | | | 5.875% | | | | 6/26/31 | | | | Ba3 | | | | 1,213,125 | |
| | 1,250 | | | Turkey Government International Bond | | | | 6.625% | | | | 2/17/45 | | | | Ba3 | | | | 1,186,015 | |
| | 1,000 | | | Turkiye Ihracat Kredi Bankasi AS, 144A | | | | 5.750% | | | | 7/06/26 | | | | B1 | | | | 990,937 | |
| | 8,300 | | | Total Turkey | | | | | | | | | | | | | | | | | | | | | | | 8,180,823 | |
| | | | | | | |
| | | | Ukraine – 0.8% | | | | | | | | | | | | | | | | | | |
| | | | | |
| | 1,425 | | | Ukraine Government International Bond, 144A | | | | 7.750% | | | | 9/01/25 | | | | B | | | | 1,559,634 | |
| | 1,500 | | | Ukraine Government International Bond, 144A | | | | 7.253% | | | | 3/15/33 | | | | B | | | | 1,561,803 | |
| | 2,925 | | | Total Ukraine | | | | | | | | | | | | | | | | | | | | | | | 3,121,437 | |
| | | | | | | |
| | | | Uzbekistan – 0.1% | | | | | | | | | | | | | | | | | | |
| | | | | | |
| | 450 | | | Republic of Uzbekistan Bond, 144A | | | | | | | | 3.700% | | | | 11/25/30 | | | | BB– | | | | 447,579 | |
| $ | 62,022 | | | Total Sovereign Debt (cost $61,027,221) | | | | | | | | | | | | | | | | 62,015,686 | |
| | | | | | | |
Principal
Amount (000) | | | Description (1) | | Coupon (4) | | | Reference Rate (4) | | | Spread (4) | | | Maturity (5) | | | Ratings (2) | | | Value | |
| | | | |
| | | | VARIABLE RATE SENIOR LOAN INTERESTS – 14.0% (9.9% of Total Investments) (4) | | | | | | | | | | | | | |
| | | | | | | |
| | | | Airlines – 0.3% | | | | | | | | | | | | | | | | | | |
| | | | | | | |
| $ | 750 | | | AAdvantage Loyalty IP Ltd., Term Loan | | | 5.500% | | | | 3-Month LIBOR | | | | 4.750% | | | | 4/20/28 | | | | Ba2 | | | $ | 782,861 | |
| | 275 | | | SkyMiles IP Ltd., Term Loan B | | | 4.750% | | | | 3-Month LIBOR | | | | 3.750% | | | | 10/20/27 | | | | Baa1 | | | | 290,831 | |
| | 1,025 | | | Total Airlines | | | | | | | | | | | | | | | | | | | | | | | 1,073,692 | |
| | | | | | | |
| | | | Auto Components – 0.4% | | | | | | | | | | | | | | | | | | |
| | | | | | | |
| | 1,097 | | | Autokiniton US Holdings, Inc., Term Loan B | | | 5.000% | | | | 3-Month LIBOR | | | | 4.500% | | | | 4/06/28 | | | | B | | | | 1,107,196 | |
| | 373 | | | Truck Hero, Inc., Term Loan B, (DD1) | | | 4.500% | | | | 1-Month LIBOR | | | | 3.750% | | | | 2/24/28 | | | | B | | | | 373,468 | |
| | 1,470 | | | Total Auto Components | | | | | | | | | | | | | | | | | | | | | | | 1,480,664 | |
| | | | | | | |
| | | | Beverages – 0.5% | | | | | | | | | | | | | | | | | | |
| | | | | | | |
| | 2,000 | | | Triton Water Holdings, Inc, Term Loan | | | 4.500% | | | | 3-Month LIBOR | | | | 3.500% | | | | 3/31/28 | | | | B+ | | | | 2,000,280 | |
| | | | | |
| | | | Commercial Services & Supplies – 0.9% | | | | | | | | | | | | | |
| | | | | | | |
| | 673 | | | PAE Holding Corporation, Term Loan B | | | 5.250% | | | | 1-Month LIBOR | | | | 4.500% | | | | 10/19/27 | | | | B | | | | 676,258 | |
| | 3,075 | | | Spin Holdco Inc., Term Loan | | | 4.750% | | | | 3-Month LIBOR | | | | 4.000% | | | | 3/04/28 | | | | B– | | | | 3,083,656 | |
| | 3,748 | | | Total Commercial Services & Supplies | | | | | | | | | | | | | | | | 3,759,914 | |
27
| | |
| |
| JGH | | Nuveen Global High Income Fund (continued) |
| | Portfolio of Investments June 30, 2021 |
| | (Unaudited) |
| | | | | | | | | | | | | | | | | | | | | | | | | | | | |
Principal
Amount (000) | | | Description (1) | | Coupon (4) | | | Reference Rate (4) | | | Spread (4) | | | Maturity (5) | | | Ratings (2) | | | Value | |
| | | | | | | |
| | | | Containers & Packaging – 0.9% | | | | | | | | | | | | | | | | | | |
| | | | | | | |
| $ | 1,699 | | | Plaze, Inc., Term Loan B | | | 3.604% | | | | 1-Month LIBOR | | | | 3.500% | | | | 8/03/26 | | | | B | | | $ | 1,677,886 | |
| | 1,798 | | | Pregis TopCo Corporation, Term Loan, First Lien | | | 4.104% | | | | 1-Month LIBOR | | | | 4.000% | | | | 8/01/26 | | | | B | | | | 1,799,423 | |
| | 3,497 | | | Total Containers & Packaging | | | | | | | | | | | | | | | | | | | | | | | 3,477,309 | |
| | | | | |
| | | | Food & Staples Retailing – 0.8% | | | | | | | | | | | | | |
| | | | | | | |
| | 2,279 | | | H Food Holdings LLC, Incremental Term Loan B3 | | | 6.000% | | | | 1-Month LIBOR | | | | 5.000% | | | | 5/31/25 | | | | B | | | | 2,285,309 | |
| | 893 | | | Shearer’s Foods, Inc., Term Loan | | | 4.250% | | | | 3-Month LIBOR | | | | 3.500% | | | | 8/01/27 | | | | B | | | | 895,119 | |
| | 3,172 | | | Total Food & Staples Retailing | | | | | | | | | | | | | | | | | | | | | | | 3,180,428 | |
| | | | | |
| | | | Health Care Equipment & Supplies – 1.0% | | | | | | | | | | | | | |
| | | | | | | |
| | 1,955 | | | Auris Luxembourg III Sarl, Term Loan B2 | | | 3.854% | | | | 1-Month LIBOR | | | | 3.750% | | | | 2/21/26 | | | | B– | | | | 1,937,118 | |
| | 1,995 | | | Viant Medical Holdings, Inc., Term Loan, First Lien, (WI/DD) | | | TBD | | | | TBD | | | | TBD | | | | TBD | | | | B– | | | | 1,941,050 | |
| | 3,950 | | | Total Health Care Equipment & Supplies | | | | | | | | | | | | | | | | 3,878,168 | |
| | | | | |
| | | | Health Care Providers & Services – 2.0% | | | | | | | | | | | | | |
| | | | | | | |
| | 998 | | | ADMI Corp., Term Loan B2 | | | 3.250% | | | | 1-Month LIBOR | | | | 2.750% | | | | 12/23/27 | | | | B | | | | 987,734 | |
| | 1,632 | | | Gentiva Health Services, Inc., Term Loan | | | 2.875% | | | | 1-Month LIBOR | | | | 2.750% | | | | 7/02/25 | | | | B+ | | | | 1,630,144 | |
| | 2,875 | | | Onex TSG Intermediate Corp., Term Loan B | | | 5.500% | | | | 3-Month LIBOR | | | | 4.750% | | | | 2/26/28 | | | | B | | | | 2,899,711 | |
| | 1,518 | | | RegionalCare Hospital Partners Holdings, Inc., Term Loan B | | | 3.854% | | | | 1-Month LIBOR | | | | 3.750% | | | | 11/16/25 | | | | B+ | | | | 1,516,713 | |
| | 746 | | | US Radiology Specialists, Inc., Term Loan | | | 5.647% | | | | 3-Month LIBOR | | | | 5.500% | | | | 12/15/27 | | | | B– | | | | 751,847 | |
| | 7,769 | | | Total Health Care Providers & Services | | | | | | | | | | | | | | | | 7,786,149 | |
| | | | | |
| | | | Hotels, Restaurants & Leisure – 0.5% | | | | | | | | | | | | | |
| | | | | | | |
| | 1,995 | | | Life Time Fitness Inc , Term Loan B | | | 5.750% | | | | 3-Month LIBOR | | | | 4.750% | | | | 12/15/24 | | | | B– | | | | 2,007,469 | |
| | | | | |
| | | | Industrial Conglomerates – 0.7% | | | | | | | | | | | | | |
| | | | | | | |
| | 2,604 | | | U.S. Renal Care, Inc., Term Loan B | | | 5.104% | | | | 1-Month LIBOR | | | | 5.000% | | | | 7/26/26 | | | | B | | | | 2,617,190 | |
| | | | | | | |
| | | | Insurance – 0.2% | | | | | | | | | | | | | | | | | | |
| | | | | | | |
| | 666 | | | Hub International Limited, Term Loan B | | | 4.000% | | | | 3-Month LIBOR | | | | 3.250% | | | | 4/25/25 | | | | B | | | | 667,466 | |
| | | | | | | |
| | | | IT Services – 1.4% | | | | | | | | | | | | | | | | | | |
| | | | | | | |
| | 992 | | | Ahead Data Blue, LLC, Term Loan B | | | 4.500% | | | | 2-Month LIBOR | | | | 3.750% | | | | 10/16/27 | | | | B+ | | | | 995,140 | |
| | 1,000 | | | McAfee, LLC, Term Loan B, (WI/DD) | | | TBD | | | | TBD | | | | TBD | | | | TBD | | | | B | | | | 1,000,875 | |
| | 1,770 | | | NeuStar, Inc., Term Loan B5 | | | 5.500% | | | | 3-Month LIBOR | | | | 4.500% | | | | 8/08/24 | | | | B+ | | | | 1,736,582 | |
| | 1,995 | | | Syniverse Holdings, Inc., Term Loan, First Lien | | | 6.000% | | | | 3-Month LIBOR | | | | 5.000% | | | | 3/09/23 | | | | CCC+ | | | | 1,979,159 | |
| | 5,757 | | | Total IT Services | | | | | | | | | | | | | | | | | | | | | | | 5,711,756 | |
| | | | | |
| | | | Life Sciences Tools & Services – 0.2% | | | | | | | | | | | | | |
| | | | | | | |
| | 995 | | | DiversiTech Holdings, Inc., Term Loan | | | 4.250% | | | | 3-Month LIBOR | | | | 3.250% | | | | 12/17/24 | | | | B2 | | | | 997,036 | |
| | | | | | | |
| | | | Personal Products – 0.2% | | | | | | | | | | | | | | | | | | |
| | | | | | | |
| | 800 | | | Journey Personal Care Corp., Term Loan B | | | 5.000% | | | | 3-Month LIBOR | | | | 4.250% | | | | 3/01/28 | | | | B | | | | 803,004 | |
28
| | | | | | | | | | | | | | | | | | | | | | | | | | | | |
Principal
Amount (000) | | | Description (1) | | Coupon (4) | | | Reference Rate (4) | | | Spread (4) | | | Maturity (5) | | | Ratings (2) | | | Value | |
| | | | | | | |
| | | | Pharmaceuticals – 0.6% | | | | | | | | | | | | | | | | | | |
| | | | | | | |
| $ | 899 | | | Endo Luxembourg Finance Company I S.a r.l., Term Loan | | | 5.750% | | | | 3-Month LIBOR | | | | 5.000% | | | | 3/25/28 | | | | B | | | $ | 869,824 | |
| | 1,500 | | | Jazz Financing Lux S.a.r.l., Term Loan | | | 4.000% | | | | 1-Month LIBOR | | | | 3.500% | | | | 4/22/28 | | | | BB | | | | 1,506,442 | |
| | 2,399 | | | Total Pharmaceuticals | | | | | | | | | | | | | | | | | | | | | | | 2,376,266 | |
| | | | | | | |
| | | | Professional Services – 0.1% | | | | | | | | | | | | | | | | | | |
| | | | | | | |
| | 448 | | | Da Vinci Purchaser Corp., Term Loan | | | 5.000% | | | | 3-Month LIBOR | | | | 4.000% | | | | 11/26/26 | | | | B | | | | 449,773 | |
| | | | | | | |
| | | | Road & Rail – 0.1% | | | | | | | | | | | | | | | | | | |
| | | | | | | |
| | 578 | | | Hertz Corp | | | 3.500% | | | | 1-Month LIBOR | | | | 2.750% | | | | 6/30/23 | | | | N/R | | | | 578,632 | |
| | | | |
| | | | Semiconductors & Semiconductor Equipment – 0.1% | | | | | | | | | | |
| | | | | | | |
| | 411 | | | Ultra Clean Holdings, Inc, Term Loan B | | | 3.854% | | | | 1-Month LIBOR | | | | 3.750% | | | | 8/27/25 | | | | B1 | | | | 412,781 | |
| | | | | | | |
| | | | Software – 1.7% | | | | | | | | | | | | | | | | | | |
| | | | | | | |
| | 2,000 | | | Apttus Corporation, Term Loan, (WI/DD) | | | TBD | | | | TBD | | | | TBD | | | | TBD | | | | B– | | | | 2,014,500 | |
| | 2,500 | | | Finastra USA, Inc., Term Loan, First Lien, (WI/DD) | | | TBD | | | | TBD | | | | TBD | | | | TBD | | | | B | | | | 2,464,775 | |
| | 475 | | | RealPage, Inc, Term Loan, First Lien | | | 3.750% | | | | 1-Month LIBOR | | | | 3.250% | | | | 4/22/28 | | | | B | | | | 474,140 | |
| | 1,965 | | | Sirius Computer Solutions, Inc., Term Loan | | | 3.604% | | | | 1-Month LIBOR | | | | 3.500% | | | | 7/01/26 | | | | BB– | | | | 1,964,542 | |
| | 6,940 | | | Total Software | | | | | | | | | | | | | | | | | | | | | | | 6,917,957 | |
| | | | | | | |
| | | | Specialty Retail – 1.2% | | | | | | | | | | | | | | | | | | |
| | | | | | | |
| | 1,496 | | | Great Outdoors Group, LLC, Term Loan B | | | 5.000% | | | | 6-Month LIBOR | | | | 4.250% | | | | 3/05/28 | | | | B+ | | | | 1,503,499 | |
| | 935 | | | Jo-Ann Stores, Inc., Term Loan | | | 6.000% | | | | 1-Month LIBOR | | | | 5.000% | | | | 10/16/23 | | | | B | | | | 934,850 | |
| | 2,000 | | | PetSmart, Inc., Term Loan B | | | 4.500% | | | | 3-Month LIBOR | | | | 3.750% | | | | 2/12/28 | | | | BB– | | | | 2,004,000 | |
| | 225 | | | WOOF Holdings, Inc, Term Loan, First Lien | | | 4.500% | | | | 3-Month LIBOR | | | | 3.750% | | | | 12/21/27 | | | | B | | | | 225,376 | |
| | 4,656 | | | Total Specialty Retail | | | | | | | | | | | | | | | | | | | | | | | 4,667,725 | |
| | | | |
| | | | Wireless Telecommunication Services – 0.2% | | | | | | | | | | |
| | | | | | | |
| | 750 | | | GOGO Intermediate Holdings LLC, Term Loan B | | | 4.500% | | | | 3-Month LIBOR | | | | 3.750% | | | | 4/30/28 | | | | B– | | | | 749,812 | |
| $ | 55,630 | | | Total Variable Rate Senior Loan Interests (cost $55,190,136) | | | | | | | | | | | | 55,593,471 | |
| | | | | | | |
Principal
Amount (000) | | | Description (1) | | | | | | | | Coupon | | | Maturity | | | Ratings (2) | | | Value | |
| | | |
| | | | $1,000 PAR (OR SIMILAR) INSTITUTIONAL PREFERRED – 9.0% (6.4% of Total Investments) | | | | | | | | | |
| | | | | | | |
| | | | Automobiles – 0.6% | | | | | | | | | | | | | | | | | | |
| | | | | | | |
| $ | 905 | | | General Motors Financial Co Inc | | | | | | | | | | | 5.700% | | | | N/A (6) | | | | BB | | | $ | 1,013,600 | |
| | 1,473 | | | General Motors Financial Co Inc | | | | | | | | | | | 5.750% | | | | N/A (6) | | | | BB | | | | 1,603,198 | |
| | 2,378 | | | Total Automobiles | | | | | | | | | | | | | | | | | | | | | | | 2,616,798 | |
| | | | | | | |
| | | | Banks – 1.7% | | | | | | | | | | | | | | | | | | |
| | | | | | | |
| | 2,500 | | | Citigroup Inc | | | | | | | | | | | 5.000% | | | | N/A (6) | | | | BB+ | | | | 2,616,500 | |
| | 2,000 | | | Huntington Bancshares Inc/OH | | | | | | | | | | | 5.625% | | | | N/A (6) | | | | BB+ | | | | 2,322,500 | |
| | 1,000 | | | NBK Tier 1 Financing Ltd, 144A | | | | | | | | | | | 3.625% | | | | N/A (6) | | | | Baa3 | | | | 1,003,410 | |
| | 770 | | | SVB Financial Group | | | | | | | | | | | 4.100% | | | | N/A (6) | | | | BBB | | | | 781,065 | |
| | 6,270 | | | Total Banks | | | | | | | | | | | | | | | | | | | | | | | 6,723,475 | |
| | | | | | | |
| | | | Capital Markets – 0.5% | | | | | | | | | | | | | | | | | | |
| | | | | | | |
| | 1,500 | | | Dresdner Funding Trust I, 144A | | | | | | | | | | | 8.151% | | | | 6/30/31 | | | | BB+ | | | | 2,145,000 | |
29
| | |
| |
| JGH | | Nuveen Global High Income Fund (continued) |
| | Portfolio of Investments June 30, 2021 |
| | (Unaudited) |
| | | | | | | | | | | | | | | | | | | | | | | | | | | | |
Principal
Amount (000) | | | Description (1) | | | | | | | | Coupon | | | Maturity | | | Ratings (2) | | | Value | |
| | | | | | | |
| | | | Communications Equipment – 0.9% | | | | | | | | | | | | | | | | | | |
| | | | | | | |
| $ | 3,500 | | | Vodafone Group PLC | | | | | | | | | | | 4.125% | | | | 6/04/81 | | | | BB+ | | | $ | 3,494,750 | |
| | | | | | | |
| | | | Consumer Finance – 0.8% | | | | | | | | | | | | | | | | | | |
| | | | | | | |
| | 2,000 | | | Ally Financial Inc | | | | | | | | | | | 4.700% | | | | N/A (6) | | | | BB– | | | | 2,071,400 | |
| | 1,000 | | | Discover Financial Services | | | | | | | | | | | 6.125% | | | | N/A (6) | | | | BB | | | | 1,122,200 | |
| | 3,000 | | | Total Consumer Finance | | | | | | | | | | | | | | | | | | | | | | | 3,193,600 | |
| | | | | | | |
| | | | Electric Utilities – 0.5% | | | | | | | | | | | | | | | | | | |
| | | | | | | |
| | 2,000 | | | Edison International | | | | | | | | | | | 5.375% | | | | N/A (6) | | | | BB | | | | 2,014,600 | |
| | | | | | | |
| | | | Food Products – 0.7% | | | | | | | | | | | | | | | | | | |
| | | | | | | |
| | 1,500 | | | Land O’ Lakes Inc, 144A | | | | | | | | | | | 8.000% | | | | N/A (6) | | | | BB | | | | 1,610,625 | |
| | 1,000 | | | Land O’ Lakes Inc, 144A | | | | | | | | | | | 7.000% | | | | N/A (6) | | �� | | BB | | | | 1,035,000 | |
| | 2,500 | | | Total Food Products | | | | | | | | | | | | | | | | | | | | | | | 2,645,625 | |
| | | | | | |
| | | | Independent Power & Renewable Electricity Producers – 0.3% | | | | | | | | | | | | | | | | |
| | | | | | | |
| | 1,000 | | | AES Gener SA, 144A | | | | | | | | | | | 7.125% | | | | 3/26/79 | | | | BB | | | | 1,070,510 | |
| | | | | | | |
| | | | Insurance – 1.3% | | | | | | | | | | | | | | | | | | |
| | | | | | | |
| | 1,750 | | | Assurant Inc | | | | | | | | | | | 7.000% | | | | 3/27/48 | | | | BB+ | | | | 2,021,022 | |
| | 1,250 | | | Enstar Finance LLC | | | | | | | | | | | 5.750% | | | | 9/01/40 | | | | BB+ | | | | 1,326,563 | |
| | 1,000 | | | QBE Insurance Group Ltd | | | | | | | | | | | 6.750% | | | | 12/02/44 | | | | BBB | | | | 1,138,750 | |
| | 500 | | | QBE Insurance Group Ltd, 144A | | | | | | | | | | | 5.875% | | | | N/A (6) | | | | BBB | | | | 545,750 | |
| | 4,500 | | | Total Insurance | | | | | | | | | | | | | | | | | | | | | | | 5,032,085 | |
| | | | | | | |
| | | | Oil, Gas & Consumable Fuels – 0.4% | | | | | | | | | | | | | | | | | | |
| | | | | | | |
| | 1,400 | | | Energy Transfer LP | | | | | | | | | | | 6.500% | | | | N/A (6) | | | | BB | | | | 1,427,300 | |
| | | | | | | |
| | | | Trading Companies & Distributors – 1.0% | | | | | | | | | | | | | | | | | | |
| | | | | | | |
| | 1,000 | | | AerCap Global Aviation Trust, 144A | | | | | | | | | | | 6.500% | | | | 6/15/45 | | | | BB+ | | | | 1,067,500 | |
| | 1,750 | | | AerCap Holdings NV | | | | | | | | | | | 5.875% | | | | 10/10/79 | | | | BB | | | | 1,822,450 | |
| | 1,000 | | | Air Lease Corp | | | | | | | | | | | 4.650% | | | | N/A (6) | | | | BB+ | | | | 1,036,250 | |
| | 3,750 | | | Total Trading Companies & Distributors | | | | | | | | | | | | | | | | | | | | | | | 3,926,200 | |
| | | | | | | |
| | | | Wireless Telecommunication Services – 0.3% | | | | | | | | | | | | | | | | | | |
| | | | | | | |
| | 1,300 | | | Network i2i Ltd, 144A | | | | | | | | | | | 5.650% | | | | N/A (6) | | | | BB | | | | 1,392,625 | |
| $ | 33,098 | | | Total $1,000 Par (or similar) Institutional Preferred (cost $33,216,029) | | | | | | | | | | | | | | | | | | | | 35,682,568 | |
| | | | | | | |
Principal
Amount (000) | | | Description (1), (7) | | | | | | | | Coupon | | | Maturity | | | Ratings (2) | | | Value | |
| | | | |
| | | | CONTINGENT CAPITAL SECURITIES – 8.3% (5.9% of Total Investments) | | | | | | | | | | | | | |
| | | | | | | |
| | | | Banks – 6.6% | | | | | | | | | | | | | | | | | | |
| | | | | | | |
| $ | 1,900 | | | Banco Bilbao Vizcaya Argentaria SA | | | | | | | | | | | 6.500% | | | | N/A (6) | | | | Ba2 | | | $ | 2,068,625 | |
| | 1,980 | | | Banco Mercantil del Norte SA/Grand Cayman, 144A | | | | | | | | | | | 6.750% | | | | N/A (6) | | | | BB | | | | 2,128,500 | |
| | 1,500 | | | Banco Santander SA | | | | | | | | | | | 4.750% | | | | N/A (6) | | | | Ba1 | | | | 1,518,000 | |
| | 1,000 | | | Banco Santander SA | | | | | | | | | | | 7.500% | | | | N/A (6) | | | | Ba1 | | | | 1,101,280 | |
| | 1,000 | | | Bancolombia SA | | | | | | | | | | | 4.625% | | | | 12/18/29 | | | | Ba2 | | | | 1,016,260 | |
| | 1,000 | | | Bangkok Bank PCL/Hong Kong, 144A | | | | | | | | | | | 5.000% | | | | N/A (6) | | | | Ba1 | | | | 1,053,000 | |
| | 1,000 | | | Barclays PLC | | | | | | | | | | | 7.750% | | | | N/A (6) | | | | BB | | | | 1,098,750 | |
| | 2,225 | | | Barclays PLC | | | | | | | | | | | 6.125% | | | | N/A (6) | | | | BB | | | | 2,465,567 | |
| | 1,000 | | | BNP Paribas SA, 144A | | | | | | | | | | | 6.625% | | | | N/A (6) | | | | BBB– | | | | 1,095,470 | |
| | 1,000 | | | Credit Agricole SA, 144A | | | | | | | | | | | 8.125% | | | | N/A (6) | | | | BBB | | | | 1,215,000 | |
| | 1,500 | | | Danske Bank A/S, Reg S | | | | | | | | | | | 4.375% | | | | N/A (6) | | | | BBB– | | | | 1,515,000 | |
| | 1,425 | | | Intesa Sanpaolo SpA, 144A | | | | | | | | | | | 7.700% | | | | N/A (6) | | | | BB– | | | | 1,632,508 | |
| | 2,200 | | | Lloyds Banking Group PLC | | | | | | | | | | | 7.500% | | | | N/A (6) | | | | BBB– | | | | 2,502,500 | |
| | 2,000 | | | Macquarie Bank Ltd/London, 144A | | | | | | | | | | | 6.125% | | | | N/A (6) | | | | BB+ | | | | 2,187,500 | |
| | 2,000 | | | Natwest Group PLC | | | | | | | | | | | 8.000% | | | | N/A (6) | | | | BBB– | | | | 2,365,140 | |
| | 900 | | | Societe Generale SA, 144A | | | | | | | | | | | 4.750% | | | | N/A (6) | | | | BB | | | | 932,625 | |
| | 485 | | | UniCredit SpA | | | | | | | | | | | 8.000% | | | | N/A (6) | | | | B1 | | | | 539,563 | |
| | 24,115 | | | Total Banks | | | | | | | | | | | | | | | | | | | | | | | 26,435,288 | |
30
| | | | | | | | | | | | | | | | | | | | | | | | | | | | |
Principal
Amount (000) | | | Description (1), (7) | | | | | | | | Coupon | | | Maturity | | | Ratings (2) | | | Value | |
| | | | | | | |
| | | | Capital Markets – 1.7% | | | | | | | | | | | | | | | | | | |
| | | | | | | |
| $ | 1,500 | | | Credit Suisse Group AG, 144A | | | | | | | | | | | 7.500% | | | | N/A (6) | | | | BB+ | | | $ | 1,631,250 | |
| | 750 | | | Credit Suisse Group AG, 144A | | | | | | | | | | | 6.375% | | | | N/A (6) | | | | BB | | | | 835,973 | |
| | 2,650 | | | Deutsche Bank AG | | | | | | | | | | | 6.000% | | | | N/A (6) | | | | BB– | | | | 2,799,062 | |
| | 1,200 | | | UBS Group AG, 144A | | | | | | | | | | | 7.000% | | | | N/A (6) | | | | BBB | | | | 1,321,500 | |
| | 6,100 | | | Total Capital Markets | | | | | | | | | | | | | | | | | | | | | | | 6,587,785 | |
| $ | 30,215 | | | Total Contingent Capital Securities (cost $30,424,137) | | | | | | | | | | | | | | | | | | | | 33,023,073 | |
| | | | | | | |
| Shares | | | Description (1) | | | | | | | | Coupon | | | | | | Ratings (2) | | | Value | |
| | | | |
| | | | $25 PAR (OR SIMILAR) RETAIL PREFERRED – 1.5% (1.1% of Total Investments) | | | | | | | | | | | | | |
| | | | | | | |
| | | | Banks – 0.4% | | | | | | | | | | | | | | | | | | |
| | | | | | | |
| | 55,000 | | | Wintrust Financial Corp | | | | | | | | | | | 6.875% | | | | | | | | Ba2 | | | $ | 1,554,300 | |
| | | | | | | |
| | | | Food Products – 0.2% | | | | | | | | | | | | | | | | | | |
| | | | | | | |
| | 35,000 | | | CHS Inc | | | | | | | | | | | 7.100% | | | | | | | | N/R | | | | 997,850 | |
| | | | | | | |
| | | | Insurance – 0.5% | | | | | | | | | | | | | | | | | | |
| | | | | | | |
| | 39,000 | | | Assurant Inc | | | | | | | | | | | 5.250% | | | | | | | | BB+ | | | | 1,054,560 | |
| | 30,000 | | | Enstar Group Ltd | | | | | | | | | | | 7.000% | | | | | | | | BB+ | | | | 887,400 | |
| | | | Total Insurance | | | | | | | | | | | | | | | | | | | | | | | 1,941,960 | |
| | | | | | | |
| | | | Oil, Gas & Consumable Fuels – 0.4% | | | | | | | | | | | | | | | | | | |
| | | | | | | |
| | 60,000 | | | NuStar Energy LP | | | | | | | | | | | 8.500% | | | | | | | | B | | | | 1,455,000 | |
| | | | Total $25 Par (or similar) Retail Preferred (cost $5,622,408) | | | | | | | | | | | | | | | | | | | | | | | 5,949,110 | |
| | | | Total Long-Term Investments (cost $517,843,201) | | | | | | | | | | | | | | | | | | | | 536,420,634 | |
| | | | | | | |
Principal
Amount (000) | | | Description (1) | | | | | | | | Coupon | | | Maturity | | | | | | Value | |
| | | | | |
| | | | SHORT-TERM INVESTMENTS – 6.0% (4.2% of Total Investments) | | | | | | | | | | | | | | | | | |
| | | | | |
| | | | REPURCHASE AGREEMENTS – 6.0% (4.2% of Total Investments) | | | | | | | | | | | | | |
| | | | | | | |
| $ | 23,650 | | | Repurchase Agreement with Fixed Income Clearing Corporation, dated 6/30/21, repurchase price $23,650,031, collateralized by $21,424,100, U.S. Treasury Inflation Indexed Bonds, 0.125%, due 4/15/22, value $24,123,084 | | | | | | | | | | | 0.000% | | | | 7/01/21 | | | | | | | $ | 23,650,031 | |
| | | | Total Short-Term Investments (cost $23,650,031) | | | | | | | | | | | | | | | | | | | | | | | 23,650,031 | |
| | | | Total Investments (cost $541,493,232) – 141.0% | | | | | | | | | | | | | | | | | | | | | | | 560,070,665 | |
| | | | Borrowings – (40.0)% (8), (9) | | | | | | | | | | | | | | | | | | | | | | | (159,000,000 | ) |
| | | | Other Assets Less Liabilities – (1.0)% (10) | | | | | | | | | | | | | | | | | | | | | | | (3,833,389 | ) |
| | | | Net Assets Applicable to Common Shares – 100% | | | | | | | | | | | | | | | | | | | $ | 397,237,276 | |
Investments in Derivatives
Interest Rate Swaps – OTC Uncleared
| | | | | | | | | | | | | | | | | | | | | | | | | | | | | | | | | | | | | | | | |
| Counterparty | | Notional
Amount | | | Fund
Pay/Receive
Floating Rate | | | Floating Rate Index | | | Fixed Rate
(Annualized) | | | Fixed Rate
Payment
Frequency | | | Effective
Date (11) | | | Optional
Termination
Date | | | Maturity
Date | | | Value | | | Unrealized
Appreciation
(Depreciation) | |
Morgan Stanley Capital Services LLC | | $ | 87,400,000 | | | | Receive | | | | 1-Month LIBOR | | | | 1.994 | % | | | Monthly | | | | 6/01/18 | | | | 7/01/25 | | | | 7/01/27 | | | $ | (6,059,470 | ) | | $ | (6,059,470 | ) |
31
| | |
| |
| JGH | | Nuveen Global High Income Fund (continued) |
| | Portfolio of Investments June 30, 2021 |
| | (Unaudited) |
For Fund portfolio compliance purposes, the Fund’s industry classifications refer to any one or more of the industry sub-classifications used by one or more widely recognized market indexes or ratings group indexes, and/or as defined by Fund management. This definition may not apply for purposes of this report, which may combine industry sub-classifications into sectors for reporting ease.
| (1) | All percentages shown in the Portfolio of Investments are based on net assets applicable to common shares unless otherwise noted. |
| (2) | The Fund uses credit quality ratings for its portfolio securities provided by Standard & Poor’s Group (“Standard & Poor’s”), Moody’s Investors Service, Inc. (“Moody’s”) and Fitch, Inc. (“Fitch”). If all three provide a rating for a security, the middle is used; if two of the three agencies rate a security, the lower rating is used; and if only one rating agency rates a security, that rating is used. This treatment of split-rated securities may differ from that used for other purposes, such as for Fund investment policies. Ratings below BBB by Standard & Poor’s, Baa by Moody’s or BBB by Fitch are considered to be below investment grade. Holdings designated N/R are not rated by any of these national rating agencies. |
| (3) | Defaulted security. A security whose issuer has failed to fully pay principal and/or interest when due, or is under the protection of bankruptcy. |
| (4) | Senior loans generally pay interest at rates which are periodically adjusted by reference to a base short-term, floating lending rate (Reference Rate) plus an assigned fixed rate (Spread). These floating lending rates are generally (i) the lending rate referenced by the London Inter-Bank Offered Rate (“LIBOR”), or (ii) the prime rate offered by one or more major United States banks. Senior loans may be considered restricted in that the Fund ordinarily is contractually obligated to receive approval from the agent bank and/or borrower prior to the disposition of a senior loan. The rate shown is the coupon as of the end of the reporting period. |
| (5) | Senior Loans generally are subject to mandatory and/or optional prepayment. Because of these mandatory prepayment conditions and because there may be significant economic incentives for a borrower to prepay, prepayments of senior loans may occur. As a result, the actual remaining maturity of senior loans held may be substantially less than the stated maturities shown. |
| (6) | Perpetual security. Maturity date is not applicable. |
| (7) | Contingent Capital Securities (“CoCos”) are hybrid securities with loss absorption characteristics built into the terms of the security for the benefit of the issuer. For example, the terms may specify an automatic write-down of principal or a mandatory conversion into the issuer’s common stock under certain adverse circumstances, such as the issuer’s capital ratio falling below a specified level. |
| (8) | Borrowings as a percentage of Total Investments is 28.4%. |
| (9) | The Fund may pledge up to 100% of its eligible investments (excluding any investments separately pledged as collateral for specific investments in derivatives, when applicable) in the Portfolio of Investments as collateral for borrowings. |
| (10) | Other assets less liabilities includes the unrealized appreciation (depreciation) of certain over-the-counter (“OTC”) derivatives as well as the OTC cleared and exchange-traded derivatives, when applicable. The unrealized appreciation (depreciation) of OTC cleared and exchange-traded derivatives is recognized as part of the cash collateral at brokers and/or the receivable or payable for variation margin as presented on the Statement of Assets and Liabilities, when applicable. |
| (11) | Effective date represents the date on which both the Fund and counterparty commence interest payment accruals on each contract. |
| 144A | Investment is exempt from registration under Rule 144A of the Securities Act of 1933, as amended. These investments may only be resold in transactions exempt from registration, which are normally those transactions with qualified institutional buyers. |
| DD1 | Portion of investment purchased on a delayed delivery basis. |
| LIBOR | London Inter-Bank Offered Rate |
| PIK | Payment-in-kind (“PIK”) security. Depending on the terms of the security, income may be received in the form of cash, securities, or a combination of both. The PIK rate shown, where applicable, represents the annualized rate of the last PIK payment made by the issuer as of the end of the reporting period. |
| Reg S | Regulation S allows U.S. companies to sell securities to persons or entities located outside of the United States without registering those securities with the Securities and Exchange Commission. Specifically, Regulation S provides a safe harbor from the registration requirements of the Securities Act for the offers and sales of securities by both foreign and domestic issuers that are made outside the United States. |
| TBD | Senior loan purchased on a when-issued or delayed-delivery basis. Certain details associated with this purchase are not known prior to the settlement date of the transaction. In addition, senior loans typically trade without accrued interest and therefore a coupon rate is not available prior to settlement. At settlement, if still unknown, the borrower or counterparty will provide the Fund with the final coupon rate and maturity date. |
| WI/DD | Purchased on a when-issued or delayed delivery basis. |
See accompanying notes to financial statements.
32
| | |
| NPCT | | Nuveen Core Plus Impact Fund Portfolio of Investments June 30, 2021 |
| | | (Unaudited) |
| | | | | | | | | | | | | | | | | | | | | | | | | | | | |
| | | | | | | |
Principal
Amount (000) | | | Description (1) | | | | | | | | Coupon | | | Maturity | | | Ratings (2) | | | Value | |
| | |
| | | | LONG-TERM INVESTMENTS – 64.3% (66.9% of Total Investments) | | | | | |
| | |
| | | | CORPORATE BONDS – 43.9% (42.6% of Total Investments) | | | | | |
| | | | | | | |
| | | | Airlines – 0.3% | | | | | | | | | | | | | | | | | | |
| | | | | | | |
| $ | 2,000 | | | Delta Air Lines Inc | | | | | | | | | | | 3.750% | | | | 10/28/29 | | | | BB+ | | | $ | 1,996,782 | |
| | | | | | | |
| | | | Auto Components – 0.9% | | | | | | | | | | | | | | | | | | |
| | | | | | | |
| | 5,000 | | | Dana Inc | | | | | | | | | | | 4.250% | | | | 9/01/30 | | | | BB | | | | 5,143,750 | |
| | | | | | | |
| | | | Automobiles – 1.9% | | | | | | | | | | | | | | | | | | |
| | | | | | | |
| | 10,010 | | | Harley-Davidson Inc | | | | | | | | | | | 4.625% | | | | 7/28/45 | | | | BBB– | | | | 10,970,396 | |
| | | | |
| | | | Banks – 6.0% | | | | | | | | | | |
| | | | | | | |
| | 5,000 | | | Alimentation Couche-Tard Inc, 144A | | | | | | | | | | | 3.625% | | | | 5/13/51 | | | | BBB | | | | 5,224,806 | |
| | 5,000 | | | Barclays PLC | | | | | | | | | | | 3.811% | | | | 3/10/42 | | | | BBB– | | | | 5,274,920 | |
| | 5,000 | | | Intesa Sanpaolo SpA, 144A | | | | | | | | | | | 4.198% | | | | 6/01/32 | | | | BB+ | | | | 5,123,801 | |
| | 5,000 | | | Intesa Sanpaolo SpA, 144A | | | | | | | | | | | 4.950% | | | | 6/01/42 | | | | BB+ | | | | 5,177,621 | |
| | 6,450 | | | Standard Chartered PLC, 144A | | | | | | | | | | | 5.700% | | | | 3/26/44 | | | | BBB | | | | 8,275,730 | |
| | 5,000 | | | UniCredit SpA, 144A | | | | | | | | | | | 5.459% | | | | 6/30/35 | | | | BB+ | | | | 5,451,708 | |
| | 31,450 | | | Total Banks | | | | | | | | | | | | | | | | | | | | | | | 34,528,586 | |
| | | | | | | |
| | | | Building Products – 0.9% | | | | | | | | | | | | | | | | | | |
| | | | | | | |
| | 5,000 | | | Carrier Global Corp | | | | | | | | | | | 3.577% | | | | 4/05/50 | | | | BBB– | | | | 5,302,331 | |
| | | | | |
| | | | Chemicals – 1.8% | | | | | | | | | | | | | |
| | | | | | | |
| | 5,000 | | | International Flavors & Fragrances Inc, 144A | | | | | | | | | | | 3.468% | | | | 12/01/50 | | | | BBB | | | | 5,197,301 | |
| | 5,000 | | | LYB International Finance III LLC | | | | | | | | | | | 3.800% | | | | 10/01/60 | | | | BBB | | | | 5,286,513 | |
| | 10,000 | | | Total Chemicals | | | | | | | | | | | | | | | | 10,483,814 | |
| | | | | | | |
| | | | Communications Equipment – 1.7% | | | | | | | | | | | | | | | | | | |
| | | | | | | |
| | 10,000 | | | Vodafone Group PLC | | | | | | | | | | | 5.125% | | | | 6/04/81 | | | | BB+ | | | | 10,100,000 | |
| | | | | | | |
| | | | Diversified Financial Services – 0.4% | | | | | | | | | | | | | | | | | | |
| | | | | | | |
| | 2,400 | | | Community Preservation Corp | | | | | | | | | | | 2.867% | | | | 2/01/30 | | | | AA– | | | | 2,506,933 | |
| | | | | | | |
| | | | Diversified Telecommunication Services – 0.9% | | | | | | | | | | | | | | | | | | |
| | | | | | | |
| | 5,000 | | | Verizon Communications Inc | | | | | | | | | | | 3.700% | | | | 3/22/61 | | | | BBB+ | | | | 5,355,293 | |
| | | | |
| | | | Electric Utilities – 6.5% | | | | | | | | | | |
| | | | | | | |
| | 2,765 | | | Consolidated Edison Co of New York Inc | | | | | | | | | | | 4.500% | | | | 5/15/58 | | | | A– | | | | 3,338,404 | |
| | 2,000 | | | Leeward Renewable Energy Operations LLC, 144A, (WI/DD) | | | | | | | | | | | 4.250% | | | | 7/01/29 | | | | Ba3 | | | | 2,025,000 | |
| | 7,330 | | | Liberty Utilities Finance GP 1, 144A | | | | | | | | | | | 2.050% | | | | 9/15/30 | | | | BBB+ | | | | 7,067,358 | |
| | 7,000 | | | Pattern Energy Operations LP / Pattern Energy Operations Inc, 144A | | | | | | | | | | | 4.500% | | | | 8/15/28 | | | | BB– | | | | 7,246,400 | |
| | 5,000 | | | Star Energy Geothermal Darajat II / Star Energy Geothermal Salak, 144A | | | | | | | | | | | 4.850% | | | | 10/14/38 | | | | Baa3 | | | | 5,490,000 | |
| | 4,750 | | | Topaz Solar Farms LLC, 144A | | | | | | | | | | | 5.750% | | | | 9/30/39 | | | | BB | | | | 5,496,810 | |
| | 6,125 | | | Topaz Solar Farms LLC, 144A | | | | | | | | | | | 4.875% | | | | 9/30/39 | | | | BB | | | | 6,644,210 | |
| | 34,970 | | | Total Electric Utilities | | | | | | | | | | | | | | | | | | | | | | | 37,308,182 | |
| | | | |
| | | | Electronic Equipment, Instruments & Components – 0.9% | | | | | | | | | | |
| | | | | | | |
| | 5,000 | | | SK Battery America Inc, Reg S | | | | | | | | | | | 2.125% | | | | 1/26/26 | | | | Baa3 | | | | 4,957,869 | |
| | | | |
| | | | Equity Real Estate Investment Trust – 3.9% | | | | | | | | | | |
| | | | | | | |
| | 9,915 | | | HAT Holdings I LLC / HAT Holdings II LLC, 144A | | | | | | | | | | | 3.375% | | | | 6/15/26 | | | | BB+ | | | | 9,989,363 | |
| | 2,000 | | | HAT Holdings I LLC / HAT Holdings II LLC, 144A | | | | | | | | | | | 3.750% | | | | 9/15/30 | | | | BB+ | | | | 1,952,500 | |
| | 5,000 | | | Scentre Group Trust 2, 144A | | | | | | | | | | | 5.125% | | | | 9/24/80 | | | | BBB+ | | | | 5,331,250 | |
| | 2,000 | | | Starwood Property Trust Inc, 144A | | | | | | | | | | | 5.500% | | | | 11/01/23 | | | | BB– | | | | 2,095,000 | |
| | 3,075 | | | Vornado Realty LP | | | | | | | | | | | 3.400% | | | | 6/01/31 | | | | BBB | | | | 3,179,346 | |
| | 21,990 | | | Total Equity Real Estate Investment Trust | | | | | | | | | | | | | | | | | | | | | | | 22,547,459 | |
33
| | |
| |
| NPCT | | Nuveen Core Plus Impact Fund (continued) |
| | Portfolio of Investments June 30, 2021 |
| | (Unaudited) |
| | | | | | | | | | | | | | | | | | | | | | | | | | | | |
| | | | | | | |
Principal
Amount (000) | | | Description (1) | | | | | | | | Coupon | | | Maturity | | | Ratings (2) | | | Value | |
| | | | | |
| | | | Gas Utilities – 1.2% | | | | | | | | | | | | | |
| | | | | | | |
| $ | 6,937 | | | National Fuel Gas Co | | | | | | | | | | | 2.950% | | | | 3/01/31 | | | | BBB– | | | $ | 6,977,242 | |
| | | | | |
| | | | Health Care Providers & Services – 1.7% | | | | | | | | | | | | | |
| | | | | | | |
| | 10,000 | | | HCA Inc | | | | | | | | | | | 3.500% | | | | 7/15/51 | | | | BBB– | | | | 9,995,444 | |
| | | | | |
| | | | Household Durables – 1.0% | | | | | | | | | | | | | |
| | | | | | | |
| | 5,000 | | | Arcelik AS, (3) | | | | | | | | | | | 3.000% | | | | 8/03/21 | | | | BB+ | | | | 5,995,566 | |
| | | | |
| | | | Independent Power & Renewable Electricity Producers – 4.6% | | | | | | | | | | |
| | | | | | | |
| | 5,000 | | | AES Corp, 144A | | | | | | | | | | | 2.450% | | | | 1/15/31 | | | | BBB– | | | | 4,947,054 | |
| | 6,270 | | | Atlantica Sustainable Infrastructure PLC, 144A | | | | | | | | | | | 4.125% | | | | 6/15/28 | | | | BB+ | | | | 6,387,876 | |
| | 2,400 | | | Clearway Energy Operating LLC, 144A | | | | | | | | | | | 4.750% | | | | 3/15/28 | | | | BB | | | | 2,517,000 | |
| | 2,000 | | | Continuum Energy Levanter Pte Ltd, 144A | | | | | | | | | | | 4.500% | | | | 2/09/27 | | | | Ba1 | | | | 2,048,000 | |
| | 2,000 | | | NextEra Energy Operating Partners LP, 144A | | | | | | | | | | | 4.500% | | | | 9/15/27 | | | | BB+ | | | | 2,164,300 | |
| | 5,375 | | | Renewable Energy Group Inc, 144A | | | | | | | | | | | 5.875% | | | | 6/01/28 | | | | BB | | | | 5,637,031 | |
| | 2,958 | | | UEP Penonome II SA, 144A | | | | | | | | | | | 6.500% | | | | 10/01/38 | | | | BB | | | | 3,017,100 | |
| | 26,003 | | | Total Independent Power & Renewable Electricity Producers | | | | | | | | | | | | | | | | | | | | | | | 26,718,361 | |
| | | | | |
| | | | Machinery – 0.9% | | | | | | | | | | | | | |
| | | | | | | |
| | 5,000 | | | Mueller Water Products Inc, 144A | | | | | | | | | | | 4.000% | | | | 6/15/29 | | | | BB+ | | | | 5,138,100 | |
| | | | | |
| | | | Media – 0.9% | | | | | | | | | | | | | |
| | | | | | | |
| | 5,000 | | | Discovery Communications LLC | | | | | | | | | | | 4.000% | | | | 9/15/55 | | | | BBB– | | | | 5,292,032 | |
| | | | | |
| | | | Metals & Mining – 1.0% | | | | | | | | | | | | | |
| | | | | | | |
| | 5,000 | | | Teck Resources Ltd | | | | | | | | | | | 5.200% | | | | 3/01/42 | | | | BBB– | | | | 5,882,556 | |
| | | | | |
| | | | Mortgage Real Estate Investment Trust – 0.7% | | | | | | | | | | | | | |
| | | | | | | |
| | 3,745 | | | Starwood Property Trust Inc, 144A, (WI/DD) | | | | | | | | | | | 3.625% | | | | 7/15/26 | | | | BB– | | | | 3,773,088 | |
| | | | | |
| | | | Multi-Utilities – 0.5% | | | | | | | | | | | | | |
| | | | | | | |
| | 2,244 | | | Consolidated Edison Co of New York Inc | | | | | | | | | | | 4.300% | | | | 12/01/56 | | | | A– | | | | 2,641,346 | |
| | | | | |
| | | | Oil, Gas & Consumable Fuels – 0.9% | | | | | | | | | | | | | |
| | | | | | | |
| | 5,000 | | | Santos Finance Ltd, 144A | | | | | | | | | | | 3.649% | | | | 4/29/31 | | | | BBB | | | | 5,117,719 | |
| | | | | |
| | | | Pharmaceuticals – 0.9% | | | | | | | | | | | | | |
| | | | | | | |
| | 5,000 | | | Takeda Pharmaceutical Co Ltd | | | | | | | | | | | 3.375% | | | | 7/09/60 | | | | BBB+ | | | | 5,131,474 | |
| | | | | |
| | | | Real Estate Management & Development – 0.5% | | | | | | | | | | | | | |
| | | | | | | |
| | 2,250 | | | GTC Aurora Luxembourg SA, (3) | | | | | | | | | | | 2.250% | | | | 8/03/21 | | | | Baa3 | | | | 2,678,519 | |
| | | | | |
| | | | Road & Rail – 2.0% | | | | | | | | | | | | | |
| | | | | | | |
| | 5,000 | | | Kansas City Southern | | | | | | | | | | | 4.200% | | | | 11/15/69 | | | | BBB | | | | 5,780,899 | |
| | 5,000 | | | Norfolk Southern Corp | | | | | | | | | | | 4.100% | | | | 5/15/21 | | | | BBB+ | | | | 5,479,784 | |
| | 10,000 | | | Total Road & Rail | | | | | | | | | | | | | | | | 11,260,683 | |
| | | | | | | |
| | | | Trading Companies & Distributors – 1.0% | | | | | | | | | | | | | | | | | | |
| | | | | | | |
| | 6,000 | | | Triton Container International Ltd, 144A | | | | | | | | | | | 3.150% | | | | 6/15/31 | | | | BBB– | | | | 6,035,231 | |
| $ | 239,999 | | | Total Corporate Bonds (cost $248,215,287) | | | | | | | | | | | | 253,838,756 | |
| | | | | | | |
Principal
Amount (000) | | | Description (1) | | | | | | | | Coupon | | | Maturity | | | Ratings (2) | | | Value | |
| | | | | |
| | | | MORTGAGE-BACKED SECURITIES – 6.8% | | | | | | | | | | | | | |
| | | | | | | |
| $ | 3,840 | | | Benchmark 2019-B10 Mortgage Trust, 144A | | | | | | | | | | | 4.029% | | | | 3/15/62 | | | | N/R | | | $ | 3,764,082 | |
| | 7,887 | | | COMM 2020-CX Mortgage Trust, 144A | | | | | | | | | | | 2.773% | | | | 11/10/46 | | | | N/R | | | | 7,473,824 | |
| | 28,995 | | | Freddie Mac Multifamily ML Certificates | | | | | | | | | | | 2.055% | | | | 1/25/38 | | | | N/R | | | | 6,216,354 | |
34
| | | | | | | | | | | | | | | | | | | | | | | | | | | | |
Principal
Amount (000) | | | Description (1) | | | | | | | | Coupon | | | Maturity | | | Ratings (2) | | | Value | |
| | | | | |
| | | | MORTGAGE-BACKED SECURITIES (continued) | | | | | | | | | | | | | |
| | | | | |
| $ | 5,000 | | | JP Morgan Chase Commercial Mortgage Securities Trust, Series 2018-AON, 144A | | | | 4.767% | | | | 7/05/31 | | | | B | | | $ | 5,020,331 | |
| | 80,369 | | | SLG Office Trust 2021-OVA, 144A | | | | | | | | | | | 0.258% | | | | 7/15/41 | | | | Aa3 | | | | 1,725,916 | |
| | 3,860 | | | SLG Office Trust 2021-OVA, 144A | | | | | | | | | | | 2.851% | | | | 7/15/41 | | | | N/R | | | | 3,778,288 | |
| | 5,000 | | | SLG Office Trust 2021-OVA, 144A | | | | | | | | | | | 2.851% | | | | 7/15/41 | | | | N/R | | | | 4,656,800 | |
| | 7,000 | | | VNDO Mortgage Trust, Series 2016-350P, 144A | | | | | | | | 4.033% | | | | 1/10/35 | | | | BB– | | | | 6,825,637 | |
| $ | 141,951 | | | Total Mortgage-Backed Securities (cost $39,322,108) | | | | | | | | | | | | | | | | 39,461,232 | |
| | | | | | | |
Principal
Amount (000) | | | Description (1) | | | | | | | | Coupon | | | Maturity | | | Ratings (2) | | | Value | |
| | | |
| | | | $1,000 PAR (OR SIMILAR) INSTITUTIONAL PREFERRED – 5.4% (5.2% of Total Investments) | | | | | | | | | |
| | | | | |
| | | | Banks – 2.3% | | | | | | | | | | | | | |
| | | | | |
| $ | 6,250 | | | JPMorgan Chase & Co | | | | 3.650% | | | | N/A (4) | | | | BBB | | | $ | 6,258,750 | |
| | 6,820 | | | SVB Financial Group | | | | | | | | | | | 4.000% | | | | N/A (4) | | | | BBB | | | | 6,941,396 | |
| | 13,070 | | | Total Banks | | | | | | | | | | | | | | | | | | | | | | | 13,200,146 | |
| | | | | | | |
| | | | Communications Equipment – 0.8% | | | | | | | | | | | | | | | | | | |
| | | | | | | |
| | 5,000 | | | Vodafone Group PLC | | | | | | | | | | | 4.125% | | | | 6/04/81 | | | | BB+ | | | | 4,992,500 | |
| | | | | | | |
| | | | Consumer Finance – 0.5% | | | | | | | | | | | | | | | | | | |
| | | | | | | |
| | 3,000 | | | Ally Financial Inc | | | | | | | | | | | 4.700% | | | | N/A (4) | | | | BB– | | | | 3,107,100 | |
| | | | | | | |
| | | | Electric Utilities – 0.9% | | | | | | | | | | | | | | | | | | |
| | | | | | | |
| | 5,000 | | | Southern Co | | | | | | | | | | | 3.750% | | | | 9/15/51 | | | | BBB– | | | | 5,032,000 | |
| | | | | |
| | | | Independent Power & Renewable Electricity Producers – 0.4% | | | | | | | | | | | | | |
| | | | | | | |
| | 2,000 | | | AES Gener SA, 144A | | | | | | | | | | | 6.350% | | | | 10/07/79 | | | | BB | | | | 2,133,000 | |
| | | | | |
| | | | Multi-Utilities – 0.5% | | | | | | | | | | | | | |
| | | | | | | |
| | 2,500 | | | CMS Energy Corp | | | | | | | | | | | 4.750% | | | | 6/01/50 | | | | BBB– | | | | 2,785,937 | |
| $ | 30,570 | | | Total $1,000 Par (or similar) Institutional Preferred (cost $31,033,083) | | | | | | | | | | | | 31,250,683 | |
| | | | | | | |
| Shares | | | Description (1) | | | | | | | | Coupon | | | | | | Ratings (2) | | | Value | |
| | | | |
| | | | $25 PAR (OR SIMILAR) RETAIL PREFERRED – 2.6% (2.5% of Total Investments) | | | | | | | | | | | | | |
| | | | | |
| | | | Independent Power & Renewable Electricity Producers – 0.9% | | | | | | | | | | | | | |
| | | | | | | |
| | 200,000 | | | Brookfield Renewable Partners LP | | | | | | | | | | | 5.250% | | | | | | | | BBB– | | | $ | 5,240,000 | |
| | | | | | | |
| | | | Multi-Utilities – 1.3% | | | | | | | | | | | | | | | | | | |
| | | | | |
| | 100,426 | | | Brookfield Infrastructure Partners LP | | | | 5.125% | | | | | | | | BBB– | | | | 2,627,144 | |
| | 200,000 | | | CMS Energy Corp, (5), (6) | | | | | | | | | | | 4.200% | | | | | | | | BB+ | | | | 5,054,000 | |
| | | | Total Multi-Utilities | | | | | | | | | | | | | | | | | | | | | | | 7,681,144 | |
| | | |
| | | | Real Estate Management & Development – 0.4% | | | | | | | |
| | | | | | | |
| | 77,904 | | | Brookfield Property Partners LP | | | | | | | | | | | 5.750% | | | | | | | | BB+ | | | | 1,945,263 | |
| | | | Total $25 Par (or similar) Retail Preferred (cost $14,723,056) | | | | | | | | | | | | | | | | 14,866,407 | |
| | | | | | | |
Principal
Amount (000) | | | Description (1) | | Coupon (7) | | | Reference
Rate (7) | | | Spread (7) | | | Maturity (8) | | | Ratings (2) | | | Value | |
| | |
| | | | VARIABLE RATE SENIOR LOAN INTERESTS – 2.1% (2.0% of Total Investments) (6) | | | | | |
| | | | | | | |
| | | | Airlines – 0.5% | | | | | | | | | | | | | | | | | | |
| | | | | | | |
| $ | 2,500 | | | SkyMiles IP Ltd., Term Loan B, (WI/DD) | | | TBD | | | | TBD | | | | TBD | | | | TBD | | | | Baa1 | | | $ | 2,643,913 | |
| | | | | |
| | | | Commercial Services & Supplies – 0.8% | | | | | | | | | | | | | |
| | | | | | | |
| | 4,500 | | | Liberty Tire Recycling Holdco, LLC, Term Loan | | | 5.500% | | | | 3-Month LIBOR | | | | 4.500% | | | | 5/07/28 | | | | B– | | | | 4,477,500 | |
35
| | |
| |
| NPCT | | Nuveen Core Plus Impact Fund (continued) |
| | Portfolio of Investments June 30, 2021 |
| | (Unaudited) |
| | | | | | | | | | | | | | | | | | | | | | | | | | | | |
Principal
Amount (000) | | | Description (1) | | Coupon (7) | | | Reference
Rate (7) | | | Spread (7) | | | Maturity (8) | | | Ratings (2) | | | Value | |
| | | | | | | |
| | | | Electric Utilities – 0.8% | | | | | | | | | | | | | | | | | | |
| | | | | | | |
| $ | 4,742 | | | ExGen Renewables IV, LLC, Term Loan, (DD1) | | | 3.500% | | | | 3-Month LIBOR | | | | 2.500% | | | | 12/15/27 | | | | BB– | | | $ | 4,749,405 | |
| $ | 11,742 | | | Total Variable Rate Senior Loan Interests (cost $11,873,400) | | | | | | | | | | | | 11,870,818 | |
| | | | | | | |
Principal
Amount (000) | | | Description (1) | | | | | | | | Coupon | | | Maturity | | | Ratings (2) | | | Value | |
| | | | | | |
| | | | SOVEREIGN DEBT – 1.3% (1.3% of Total Investments) | | | | | | | | | | | | | | | | | | | | | |
| | | | |
| | | | Egypt – 0.4% | | | | | | | | | | |
| | | | | |
| $ | 2,500 | | | Egypt Government International Bond, 144A | | | | 5.250% | | | | 10/06/25 | | | | B+ | | | $ | 2,634,500 | |
| | | | |
| | | | Indonesia – 0.9% | | | | | | | | | | | | | |
| | | | | | |
| | 5,000 | | | Perusahaan Penerbit SBSN Indonesia III, 144A | | | | | | | | 3.550% | | | | 6/09/51 | | | | BBB | | | | 5,092,500 | |
| $ | 7,500 | | | Total Sovereign Debt (cost $7,705,601) | | | | | | | | | | | | | | | | 7,727,000 | |
| | | | | | | |
Principal
Amount (000) | | | Description (1) | | | | | | | | Coupon | | | Maturity | | | Ratings (2) | | | Value | |
| | | | |
| | | | ASSET-BACKED SECURITIES – 1.3% ( 1.3% of Total Investments) | | | | | | | | | | | | | |
| | | | | |
| $ | 2,273 | | | GoodLeap Sustainable Home Improvement Loan Trust 2021-3, 144A | | | | 3.500% | | | | 5/20/48 | | | | N/R | | | $ | 2,151,270 | |
| | 6,450 | | | Mosaic Solar Loan Trust 2020-1, 144A | | | | 0.000% | | | | 4/20/46 | | | | N/R | | | | 5,482,500 | |
| $ | 8,723 | | | Total Asset-Backed Securities (cost $7,636,895) | | | | | | | | | | | | | | | | 7,633,770 | |
| | | | | | | |
Principal
Amount (000) | | | Description (1) | | | | | | | | | | | Optional Call
Provisions (9) | | | Ratings (2) | | | Value | |
| | | | | |
| | | | MUNICIPAL BONDS – 0.9% (0.9% of Total Investments) | | | | | | | | | | | | | | | | | |
| | | | | | | |
| | | | District of Columbia – 0.1% | | | | | | | | | | | | | | | | | | |
| | | | | |
| $ | 220 | | | District of Columbia Water and Sewer Authority, Public Utility Revenue Bonds, Taxable Senior Lien Green Series 2014A, 4.814%, 10/01/14 | | | | | | | | No Opt. Call | | | | AA+ | | | $ | 312,690 | |
| | | | | | | |
| | | | Michigan – 0.8% | | | | | | | | | | | | | | | | | | |
| | | | | | | |
| | | | City of Detroit MI: | | | | | | | | | | | | | | | | | | | | | | | | |
| | 1,000 | | | 2.960%, 4/01/27 | | | | | | | | | | | | | | | No Opt. Call | | | | BB– | | | | 1,010,227 | |
| | 500 | | | 3.110%, 4/01/28 | | | | | | | | | | | | | | | No Opt. Call | | | | BB– | | | | 503,860 | |
| | 1,745 | | | 3.244%, 4/01/29 | | | | | | | | | | | | | | | No Opt. Call | | | | BB– | | | | 1,763,312 | |
| | 1,575 | | | Detroit, Wayne County, Michigan, General Obligation Bonds, Taxable Series 2021B, 3.644%, 4/01/34 | | | | | | | | 4/31 at 100.00 | | | | BB– | | | | 1,613,516 | |
| | 4,820 | | | Total Michigan | | | | | | | | | | | | | | | | | | | | | | | 4,890,915 | |
| $ | 5,040 | | | Total Municipal Bonds (cost $5,117,888) | | | | | | | | | | | | | | | | 5,203,605 | |
| | | | Total Long-Term Investments (cost $365,627,318) | | | | | | | | | | | | | | | | 371,852,271 | |
| | | | | | | |
Principal
Amount (000) | | | Description (1) | | | | | | | | Coupon | | | Maturity | | | | | | Value | |
| | | | | |
| | | | REPURCHASE AGREEMENTS – 38.6% (37.6% of Total Investments) | | | | | | | | | | | | | |
| | | | | |
| $ | 223,642 | | | Repurchase Agreement with Fixed Income Clearing Corporation, dated 6/30/21, repurchase price $223,642,294, collateralized by $265,064,800, U.S. Treasury Bonds, 1.125%, due 8/15/40, value $228,115,149 | | | | 0.000% | | | | 7/01/21 | | | | | | | $ | 223,642,294 | |
| | | | Total Short-Term Investments (cost $223,642,294) | | | | | | | | | | | | | | | | 223,642,294 | |
| | | | Total Investments (cost $589,269,612) – 102.9% | | | | | | | | | | | | | | | | 595,494,565 | |
| | | | Other Assets Less Liabilities – (2.9)% (10) | | | | | | | | | | | | | | | | (16,665,377 | ) |
| | | | Net Assets – 100% | | | | | | | | | | | | | | | $ | 578,829,188 | |
36
Investments in Derivatives
Cross Currency Swaps – OTC Uncleared
| | | | | | | | | | | | | | | | | | | | | | | | | | |
| Counterparty | | Terms of
payments to be
paid | | Terms of
payments to be
received | | Currency | | Maturity
Date | | | Notional
Amount
(Local Currency) | | | Value | | | Upfront
Premiums
Paid
(Received) | | | Unrealized
Appreciation
(Depreciation) | |
Citibank N.A. | | | | Fixed semi-annual 3.562% | | USD | | | 6/23/26 | | | | 2,725,875 | | | $ | 54,848 | | | $ | 24,565 | | | $ | 30,283 | |
| | | Fixed semi-annual 2.250% | | | | EUR | | | | | | | 2,250,000 | | | | | | | | | | | | | |
Morgan Stanley Capital Services LLC | | | | Fixed semi-annual 4.330% | | USD | | | 5/27/26 | | | | 6,088,500 | | | | 166,955 | | | | 4,250 | | | | 162,705 | |
| | | Fixed annual 3.000% | | | | EUR | | | | | | | 5,000,000 | | | | | | | | | | | | | |
Total unrealized appreciation on swaps | | | | | | | | | | | | | | | | | | $ | 192,988 | |
For Fund portfolio compliance purposes, the Fund’s industry classifications refer to any one or more of the industry sub-classifications used by one or more widely recognized market indexes or ratings group indexes, and/or as defined by Fund management. This definition may not apply for purposes of this report, which may combine industry sub-classifications into sectors for reporting ease.
| (1) | All percentages shown in the Portfolio of Investments are based on net assets applicable to common shares unless otherwise noted. |
| (2) | The Fund uses credit quality ratings for its portfolio securities provided by Standard & Poor’s Group (“Standard & Poor’s”), Moody’s Investors Service, Inc. (“Moody’s”) and Fitch, Inc. (“Fitch”). If all three provide a rating for a security, the middle is used; if two of the three agencies rate a security, the lower rating is used; and if only one rating agency rates a security, that rating is used. AAA, AA, A, and BBB are investment grade ratings; BB, B, CCC/CC/C and D are below-investment grade ratings. Credit ratings are subject to change. Holdings designated N/R are not rated by Moody’s, S&P or Fitch. |
| (3) | All or a portion of this security is owned by Nuveen Core Plus Impact Fund Offshore Limited which is a 100% owned subsidiary of the Fund. |
| (4) | Perpetual security. Maturity date is not applicable. |
| (5) | For fair value measurement disclosure purposes, investment classified as Level 2. See Notes to Financial Statements, Note 3 – Investment Valuation and Fair Value Measurements for more information. |
| (6) | Non-income producing; issuer has not declared an ex-dividend date within the past twelve months. |
| (7) | Senior loans generally pay interest at rates which are periodically adjusted by reference to a base short-term, floating lending rate (Reference Rate) plus an assigned fixed rate (Spread). These floating lending rates are generally (i) the lending rate referenced by the London Inter-Bank Offered Rate (“LIBOR”), or (ii) the prime rate offered by one or more major United States banks. Senior loans may be considered restricted in that the Fund ordinarily is contractually obligated to receive approval from the agent bank and/or borrower prior to the disposition of a senior loan. The rate shown is the coupon as of the end of the reporting period. |
| (8) | Senior Loans generally are subject to mandatory and/or optional prepayment. Because of these mandatory prepayment conditions and because there may be significant economic incentives for a borrower to prepay, prepayments of senior loans may occur. As a result, the actual remaining maturity of senior loans held may be substantially less than the stated maturities shown. |
| (9) | Optional Call Provisions: Dates (month and year) and prices of the earliest optional call or redemption. There may be other call provisions at varying prices at later dates. Certain mortgage-backed securities may be subject to periodic principal paydowns. |
| (10) | Other assets less liabilities includes the unrealized appreciation (depreciation) of certain over-the-counter (“OTC”) derivatives as well as the OTC cleared and exchange-traded derivatives, when applicable. The unrealized appreciation (depreciation) of OTC cleared and exchange-traded derivatives is recognized as part of the cash collateral at brokers and/or the receivable or payable for variation margin as presented on the Statement of Assets and Liabilities, when applicable. |
| 144A | Investment is exempt from registration under Rule 144A of the Securities Act of 1933, as amended. These investments may only be resold in transactions exempt from registration, which are normally those transactions with qualified institutional buyers. |
| DD1 | Portion of investment purchased on a delayed delivery basis. |
| LIBOR | London Inter-Bank Offered Rate |
| Reg S | Regulation S allows U.S. companies to sell securities to persons or entities located outside of the United States without registering those securities with the Securities and Exchange Commission. Specifically, Regulation S provides a safe harbor from the registration requirements of the Securities Act for the offers and sales of securities by both foreign and domestic issuers that are made outside the United States. |
| TBD | Senior loan purchased on a when-issued or delayed-delivery basis. Certain details associated with this purchase are not known prior to the settlement date of the transaction. In addition, senior loans typically trade without accrued interest and therefore a coupon rate is not available prior to settlement. At settlement, if still unknown, the borrower or counterparty will provide the Fund with the final coupon rate and maturity date. |
| WI/DD | Purchased on a when-issued or delayed delivery basis. |
See accompanying notes to financial statements.
37
| | |
| JLS | | Nuveen Mortgage and Income Fund Portfolio of Investments June 30, 2021 |
| | | (Unaudited) |
| | | | | | | | | | | | | | | | | | | | |
Principal
Amount (000) | | | Description (1) | | Coupon | | | Maturity | | | Ratings (2) | | | Value | |
| | | |
| | | | LONG-TERM INVESTMENTS – 130.7% (99.0% of Total Investments) | | | | | | | | | |
| | | | |
| | | | MORTGAGE-BACKED SECURITIES – 86.3% (65.4% of Total Investments) | | | | | | | | | | |
| | | | | |
| $ | 1,500 | | | ACRE Commercial Mortgage Series 2021-FL4 Ltd, 144A, (1-Month LIBOR reference rate + 2.600% spread), (3) | | | 2.683% | | | | 12/18/37 | | | | N/R | | | $ | 1,488,782 | |
| | 1,500 | | | Alen 2021-ACEN Mortgage Trust, 144A, (1-Month LIBOR reference rate + 4.000% spread), (3) | | | 4.073% | | | | 4/15/34 | | | | BB– | | | | 1,512,432 | |
| | 1,000 | | | Angel Oak Mortgage Trust 2019-5, 144A | | | 3.957% | | | | 10/25/49 | | | | BB | | | | 1,003,117 | |
| | 1,000 | | | BANK 2017-BNK6 | | | 3.851% | | | | 7/15/60 | | | | A | | | | 1,057,679 | |
| | 1,000 | | | BANK 2019-BNK21, 144A | | | 2.500% | | | | 10/17/52 | | | | BBB | | | | 908,785 | |
| | 1,000 | | | BBCMS Mortgage Trust 2020-C6, 144A | | | 3.811% | | | | 2/15/53 | | | | N/R | | | | 1,056,982 | |
| | 3,156 | | | BCAP LLC Trust 2007-AA1, (1-Month LIBOR reference rate + 0.180% spread), (3) | | | 0.272% | | | | 3/25/37 | | | | Caa3 | | | | 3,094,576 | |
| | 1,500 | | | Benchmark 2020-B18 Mortgage Trust, 144A | | | 4.139% | | | | 7/15/53 | | | | B– | | | | 1,521,479 | |
| | 485 | | | BX Commercial Mortgage Trust 2020-BXLP, 144A, (1-Month LIBOR reference rate + 1.600% spread), (3) | | | 1.673% | | | | 12/15/36 | | | | N/R | | | | 485,244 | |
| | 845 | | | CD 2016-CD1 Mortgage Trust, (4) | | | 3.631% | | | | 8/10/49 | | | | A– | | | | 842,843 | |
| | 1,500 | | | CD 2016-CD2 Mortgage Trust | | | 4.156% | | | | 11/10/49 | | | | A– | | | | 1,553,562 | |
| | 1,028 | | | CD 2017-CD3 Mortgage Trust, (4) | | | 4.710% | | | | 2/10/50 | | | | A– | | | | 1,073,834 | |
| | 25 | | | CF 2020-P1 Mortgage Trust, 144A | | | 2.840% | | | | 4/15/25 | | | | N/R | | | | 26,114 | |
| | 750 | | | CF 2020-P1 Mortgage Trust, 144A | | | 10.010% | | | | 4/15/52 | | | | N/R | | | | 800,428 | |
| | 651 | | | CHL Mortgage Pass-Through Trust 2006-HYB1 | | | 2.609% | | | | 3/20/36 | | | | Caa3 | | | | 650,100 | |
| | 1,000 | | | Citigroup Commercial Mortgage Trust 2015-GC29, (4) | | | 4.288% | | | | 4/10/48 | | | | A– | | | | 1,069,727 | |
| | 1,500 | | | COMM 2013-LC13 Mortgage Trust, 144A | | | 5.437% | | | | 8/10/46 | | | | BB– | | | | 1,383,859 | |
| | 700 | | | COMM 2014-CCRE15 Mortgage Trust, 144A | | | 4.865% | | | | 2/10/47 | | | | Baa3 | | | | 729,723 | |
| | 1,469 | | | COMM 2014-CCRE19 Mortgage Trust, 144A, (4) | | | 4.865% | | | | 8/10/47 | | | | BBB– | | | | 1,453,811 | |
| | 1,500 | | | COMM 2014-UBS3 Mortgage Trust, 144A | | | 4.927% | | | | 6/10/47 | | | | N/R | | | | 1,515,710 | |
| | 1,000 | | | COMM 2015-CCRE22 Mortgage Trust, 144A | | | 3.000% | | | | 3/10/48 | | | | BB– | | | | 842,934 | |
| | 1,500 | | | COMM 2015-CCRE24 Mortgage Trust, (4) | | | 3.463% | | | | 8/10/48 | | | | BBB– | | | | 1,379,038 | |
| | 800 | | | COMM 2015-CCRE25 Mortgage Trust | | | 4.682% | | | | 8/10/48 | | | | A– | | | | 859,724 | |
| | 1,245 | | | COMM 2015-CCRE25 Mortgage Trust | | | 3.932% | | | | 8/10/48 | | | | BB | | | | 1,172,527 | |
| | 800 | | | COMM 2015-LC21 Mortgage Trust, (4) | | | 4.479% | | | | 7/10/48 | | | | N/R | | | | 875,414 | |
| | 1,568 | | | Connecticut Avenue Securities Trust 2020-R01, 144A, (1-Month LIBOR reference rate + 2.050% spread), (3), (4) | | | 2.142% | | | | 1/25/40 | | | | B | | | | 1,574,563 | |
| | 2,182 | | | Connecticut Avenue Securities Trust 2020-R02, 144A, (1-Month LIBOR reference rate + 2.000% spread), (3), (5) | | | 2.092% | | | | 1/25/40 | | | | B | | | | 2,191,149 | |
| | 800 | | | CPT MORTGAGE TRUST, 144A | | | 3.097% | | | | 11/13/39 | | | | N/R | | | | 792,616 | |
| | 33,000 | | | DOLP Trust 2021-NYC, 144A | | | 0.665% | | | | 5/10/41 | | | | A– | | | | 1,638,344 | |
| | 1,177 | | | Fannie Mae Connecticut Avenue Securities, (1-Month LIBOR reference rate + 3.000% spread), (3), (5) | | | 3.092% | | | | 7/25/24 | | | | Aaa | | | | 1,186,066 | |
| | 1,826 | | | Fannie Mae Connecticut Avenue Securities, (1-Month LIBOR reference rate + 2.650% spread), (3), (4) | | | 2.742% | | | | 2/25/30 | | | | Aaa | | | | 1,855,390 | |
| | 964 | | | Fannie Mae Connecticut Avenue Securities, (1-Month LIBOR reference rate + 2.200% spread), (3) | | | 2.292% | | | | 8/25/30 | | | | Aaa | | | | 974,626 | |
| | 1,090 | | | Fannie Mae Connecticut Avenue Securities, (1-Month LIBOR reference rate + 2.150% spread), (3) | | | 2.242% | | | | 10/25/30 | | | | BB | | | | 1,103,573 | |
| | 2,474 | | | Fannie Mae Connecticut Avenue Securities, (1-Month LIBOR reference rate + 2.550% spread), (3), (4) | | | 2.642% | | | | 12/25/30 | | | | B+ | | | | 2,518,082 | |
| | 3,399 | | | Fannie Mae Connecticut Avenue Securities, (1-Month LIBOR reference rate + 2.100% spread), (3), (5) | | | 2.192% | | | | 3/25/31 | | | | Aaa | | | | 3,438,563 | |
| | 1,045 | | | Fannie Mae Connecticut Avenue Securities, 144A, (1-Month LIBOR reference rate + 2.100% spread), (3) | | | 2.192% | | | | 9/25/39 | | | | B | | | | 1,049,445 | |
| | 1,546 | | | Fannie Mae Pool | | | 2.500% | | | | 6/01/51 | | | | N/R | | | | 1,600,544 | |
| | 777 | | | First Horizon Alternative Mortgage Securities Trust 2005-AA7 | | | 2.392% | | | | 9/25/35 | | | | N/R | | | | 757,903 | |
| | 1,445 | | | First Horizon Alternative Mortgage Securities Trust 2006-FA3 | | | 6.000% | | | | 7/25/36 | | | | N/R | | | | 974,015 | |
| | 92 | | | Flagstar Mortgage Trust 2017-2, 144A | | | 4.106% | | | | 10/25/47 | | | | A3 | | | | 93,580 | |
| | 1,126 | | | Freddie Mac Multifamily Structured Pass Through Certificates | | | 2.802% | | | | 10/25/55 | | | | N/R | | | | 237,234 | |
| | 1,364 | | | Freddie Mac Stacr Remic Trust 2019-Hqa4, 144A, (1-Month LIBOR reference rate + 2.050% spread), (3), (4) | | | 2.142% | | | | 11/25/49 | | | | BB | | | | 1,369,090 | |
| | 1,500 | | | Freddie Mac STACR Remic Trust 2020-DNA2, 144A, (1-Month LIBOR reference rate + 2.500% spread), (3) | | | 2.592% | | | | 2/25/50 | | | | B | | | | 1,503,698 | |
| | 1,388 | | | Freddie Mac STACR REMIC Trust 2020-HQA1, 144A, (1-Month LIBOR reference rate + 1.900% spread), (3), (4) | | | 1.992% | | | | 1/25/50 | | | | BB | | | | 1,391,885 | |
| | 2,725 | | | Freddie Mac STACR REMIC Trust 2021-DNA3, 144A, (SOFR30A reference rate + 2.100% spread), (3), (4) | | | 2.118% | | | | 10/25/33 | | | | BBB– | | | | 2,783,336 | |
38
| | | | | | | | | | | | | | | | | | | | |
Principal
Amount (000) | | | Description (1) | | Coupon | | | Maturity | | | Ratings (2) | | | Value | |
| | | | |
| | | | MORTGAGE-BACKED SECURITIES (continued) | | | | | | | | | | |
| | | | | |
| $ | 2,000 | | | Freddie Mac STACR REMIC Trust 2021-HQA1, 144A, (SOFR30A reference rate + 2.250% spread), (3), (4) | | | 2.268% | | | | 8/25/33 | | | | Ba1 | | | $ | 2,026,285 | |
| | 3,000 | | | Freddie Mac STACR REMIC Trust 2021-HQA2, 144A, (SOFR30A reference rate + 2.050% spread), (3) | | | 2.067% | | | | 12/25/33 | | | | Ba1 | | | | 3,008,816 | |
| | 1,500 | | | Freddie Mac Stacr Trust 2018-HQA2, 144A, (1-Month LIBOR reference rate + 2.300% spread), (3) | | | 2.392% | | | | 10/25/48 | | | | B+ | | | | 1,513,551 | |
| | 1,425 | | | Freddie Mac STACR Trust 2019-DNA4, 144A, (1-Month LIBOR reference rate + 2.700% spread), (3) | | | 2.792% | | | | 10/25/49 | | | | B | | | | 1,429,300 | |
| | 2,214 | | | Freddie Mac STACR Trust 2019-HRP1, 144A, (1-Month LIBOR reference rate + 1.400% spread), (3), (4) | | | 1.492% | | | | 2/25/49 | | | | BBB+ | | | | 2,228,633 | |
| | 207 | | | Freddie Mac Strips FHS 327 S8, (1-Month LIBOR *-100% reference rate + 5.920% spread), (3) | | | 5.847% | | | | 3/15/44 | | | | N/R | | | | 40,640 | |
| | 1,500 | | | Freddie Mac Structured Agency Credit Risk Debt Notes, (1-Month LIBOR reference rate + 2.350% spread), (3), (4) | | | 2.442% | | | | 4/25/30 | | | | Baa3 | | | | 1,511,507 | |
| | 893 | | | Freddie Mac Structured Agency Credit Risk Debt Notes, (1-Month LIBOR reference rate + 2.300% spread), (3) | | | 2.472% | | | | 8/25/30 | | | | BB– | | | | 905,777 | |
| | 1,500 | | | Freddie Mac Structured Agency Credit Risk Debt Notes, 144A, (SOFR30A reference rate + 2.300% spread), (3), (4) | | | 2.318% | | | | 8/25/33 | | | | BBB– | | | | 1,538,965 | |
| | 211 | | | Freddie Mac Structured Agency Credit Risk Debt Notes, 144A | | | 4.036% | | | | 9/25/47 | | | | Ba3 | | | | 211,012 | |
| | 900 | | | Freddie Mac Structured Agency Credit Risk Debt Notes, 144A, (SOFR30A reference rate + 4.000% spread), (3) | | | 4.018% | | | | 11/25/50 | | | | B2 | | | | 941,844 | |
| | 1,500 | | | GS Mortgage Securities Corp Trust 2017-SLP, 144A | | | 4.744% | | | | 10/10/32 | | | | B | | | | 1,496,258 | |
| | 1,000 | | | GS Mortgage Securities Corp Trust 2018-TWR, 144A, (1-Month LIBOR reference rate + 1.450% spread), (3), (4) | | | 1.523% | | | | 7/15/31 | | | | A– | | | | 990,129 | |
| | 1,000 | | | GS Mortgage Securities Trust 2016-GS4, (4) | | | 3.930% | | | | 11/10/49 | | | | A– | | | | 1,001,210 | |
| | 500 | | | GS Mortgage Securities Trust 2019-GC40, 144A | | | 3.668% | | | | 7/10/52 | | | | BBB– | | | | 519,164 | |
| | 546 | | | Hudson Yards, 144A | | | 3.041% | | | | 12/10/41 | | | | Baa3 | | | | 556,796 | |
| | 1,000 | | | Hudson Yards, 144A | | | 3.041% | | | | 12/10/41 | | | | N/R | | | | 957,955 | |
| | 1,791 | | | IndyMac INDX Mortgage Loan Trust 2005-AR11 | | | 2.986% | | | | 8/25/35 | | | | Caa3 | | | | 1,644,196 | |
| | 874 | | | JP Morgan Mortgage Trust 2006-A6 | | | 3.132% | | | | 10/25/36 | | | | N/R | | | | 776,737 | |
| | 927 | | | JP Morgan Mortgage Trust 2018-6, 144A | | | 3.930% | | | | 12/25/48 | | | | Ba1 | | | | 941,696 | |
| | 1,600 | | | JPMBB Commercial Mortgage Securities Trust 2014-C22, (4) | | | 4.705% | | | | 9/15/47 | | | | BBB | | | | 1,582,108 | |
| | 1,000 | | | JPMBB Commercial Mortgage Securities Trust 2015-C27, (4) | | | 3.898% | | | | 2/15/48 | | | | N/R | | | | 1,054,446 | |
| | 760 | | | JPMBB Commercial Mortgage Securities Trust 2015-C29, (4) | | | 4.118% | | | | 5/15/48 | | | | AA– | | | | 815,725 | |
| | 400 | | | JPMBB Commercial Mortgage Securities Trust 2015-C29 | | | 4.337% | | | | 5/15/48 | | | | A– | | | | 395,886 | |
| | 1,189 | | | JPMBB Commercial Mortgage Securities Trust 2016-C1, (4) | | | 4.889% | | | | 3/15/49 | | | | A– | | | | 1,301,928 | |
| | 1,500 | | | JPMCC Commercial Mortgage Securities Trust 2017-JP7, 144A | | | 4.545% | | | | 9/15/50 | | | | BBB | | | | 1,523,656 | |
| | 600 | | | Morgan Stanley Bank of America Merrill Lynch Trust 2014 C19 | | | 4.000% | | | | 12/15/47 | | | | N/R | | | | 631,329 | |
| | 226 | | | Morgan Stanley Capital I Trust 2015-MS1 | | | 4.166% | | | | 5/15/48 | | | | N/R | | | | 243,445 | |
| | 242 | | | Morgan Stanley Mortgage Loan Trust 2007-15AR | | | 2.888% | | | | 11/25/37 | | | | CCC | | | | 207,526 | |
| | 2,000 | | | MRCD Mortgage Trust, 144A | | | 2.718% | | | | 12/15/36 | | | | N/R | | | | 1,992,180 | |
| | 1,000 | | | Natixis Commercial Mortgage Securities Trust 2019-1776, 144A | | | 3.902% | | | | 10/15/36 | | | | Ba3 | | | | 1,002,118 | |
| | 1,000 | | | Natixis Commercial Mortgage Securities Trust 2019-MILE, 144A, (1-Month LIBOR reference rate + 2.750% spread), (3), (4) | | | 2.823% | | | | 7/15/36 | | | | N/R | | | | 999,699 | |
| | 1,050 | | | Natixis Commercial Mortgage Securities Trust 2019-MILE, 144A, (1-Month LIBOR reference rate + 4.250% spread), (3) | | | 4.323% | | | | 7/15/36 | | | | N/R | | | | 1,031,548 | |
| | 1,699 | | | RALI Series 2007-QS2 Trust | | | 6.250% | | | | 1/25/37 | | | | Caa3 | | | | 1,623,833 | |
| | 40,180 | | | SLG Office Trust 2021-OVA, 144A | | | 0.258% | | | | 7/15/41 | | | | AA– | | | | 862,861 | |
| | 1,000 | | | SLG Office Trust 2021-OVA, 144A | | | 2.851% | | | | 7/15/41 | | | | N/R | | | | 931,360 | |
| | 1,500 | | | Spruce Hill Mortgage Loan Trust 2020-SH1, 144A | | | 3.827% | | | | 1/28/50 | | | | BB | | | | 1,526,188 | |
| | 2,275 | | | STACR Trust 2018-HRP1, 144A, (1-Month LIBOR reference rate + 1.650% spread), (3), (4) | | | 1.742% | | | | 4/25/43 | | | | BB– | | | | 2,277,781 | |
| | 1,000 | | | UBS-Barclays Commercial Mortgage Trust 2013-C5, 144A | | | 3.649% | | | | 3/10/46 | | | | Aa3 | | | | 1,015,853 | |
| | 200 | | | Verus Securitization Trust 2019-3, 144A | | | 4.043% | | | | 7/25/59 | | | | BB | | | | 203,512 | |
| | 1,500 | | | VNDO Mortgage Trust, Series 2016-350P, 144A | | | 4.033% | | | | 1/10/35 | | | | BB– | | | | 1,462,637 | |
| | 1,190 | | | Wells Fargo Commercial Mortgage Trust 2012-LC5, 144A, (4) | | | 4.916% | | | | 10/15/45 | | | | Baa3 | | | | 1,213,036 | |
| | 1,300 | | | Wells Fargo Commercial Mortgage Trust 2015-NXS1 | | | 4.284% | | | | 5/15/48 | | | | BBB– | | | | 1,330,889 | |
| $ | 178,841 | | | Total Mortgage-Backed Securities (cost $106,095,968) | | | | | | | | | | | | | | | 106,862,141 | |
| | | | | |
Principal
Amount (000) | | | Description (1) | | Coupon | | | Maturity | | | Ratings (2) | | | Value | |
| | | | |
| | | | ASSET-BACKED SECURITIES – 44.4% (33.6% of Total Investments) | | | | | | | | | | |
| | | | | |
| $ | 997 | | | AASET 2020-1 Trust, 144A | | | 6.413% | | | | 1/16/40 | | | | B | | | $ | 452,948 | |
| | 939 | | | Adams Outdoor Advertising LP, 144A | | | 4.810% | | | | 11/15/48 | | | | A | | | | 1,006,229 | |
39
| | |
| |
| JLS | | Nuveen Mortgage and Income Fund (continued) |
| | Portfolio of Investments June 30, 2021 |
| | (Unaudited) |
| | | | | | | | | | | | | | | | | | | | |
Principal
Amount (000) | | | Description (1) | | Coupon | | | Maturity | | | Ratings (2) | | | Value | |
| | | | |
| | | | ASSET-BACKED SECURITIES (continued) | | | | | | | | | | |
| | | | | |
| $ | 1,500 | | | Adams Outdoor Advertising LP, 144A | | | 7.356% | | | | 11/15/48 | | | | BB | | | $ | 1,553,611 | |
| | 2,000 | | | AIMCO CLO 10 Ltd, 144A, (3-Month LIBOR reference rate + 3.550% spread), (3) | | | 3.734% | | | | 7/22/32 | | | | BBB– | | | | 2,001,782 | |
| | 1,171 | | | Air Canada 2020-2 Class A Pass Through Trust, 144A | | | 5.250% | | | | 4/01/29 | | | | A | | | | 1,270,293 | |
| | 1,139 | | | Air Canada 2020-2 Class B Pass Through Trust, 144A | | | 9.000% | | | | 10/01/25 | | | | BBB- | | | | 1,263,896 | |
| | 77 | | | ARTS Ltd, Reg S | | | 1.899% | | | | 9/15/21 | | | | BB+ | | | | 76,754 | |
| | 1,275 | | | Avis Budget Rental Car Funding AESOP LLC, 144A | | | 4.530% | | | | 3/20/23 | | | | BBB | | | | 1,295,250 | |
| | 225 | | | Avis Budget Rental Car Funding AESOP LLC, 144A | | | 4.950% | | | | 3/20/25 | | | | Baa2 | | | | 242,892 | |
| | 1,000 | | | Bojangles Issuer LLC, 144A | | | 3.832% | | | | 10/20/50 | | | | N/R | | | | 1,042,680 | |
| | 500 | | | Bonanza RE Ltd, 144A, (3-Month U.S. Treasury Bill reference rate + 4.750% spread), (3) | | | 4.791% | | | | 12/23/24 | | | | N/R | | | | 502,600 | |
| | 593 | | | British Airways 2020-1 Class A Pass Through Trust, 144A | | | 4.250% | | | | 11/15/32 | | | | A+ | | | | 637,824 | |
| | 575 | | | British Airways 2020-1 Class B Pass Through Trust, 144A, (4) | | | 8.375% | | | | 11/15/28 | | | | BBB | | | | 665,289 | |
| | 750 | | | Caelus Re VI Ltd, 144A, (3-Month U.S. Treasury Bill reference rate + 5.500% spread), (3) | | | 5.541% | | | | 6/07/23 | | | | N/R | | | | 767,550 | |
| | 2,000 | | | Cars Net Lease Mortgage Notes Series 2020-1, 144A | | | 4.690% | | | | 12/15/50 | | | | BBB | | | | 2,174,037 | |
| | 775 | | | CARS-DB4 LP, 144A | | | 4.520% | | | | 2/15/50 | | | | BBB | | | | 798,789 | |
| | 3 | | | Carvana Auto Receivables Trust, 144A | | | 1.000% | | | | 5/10/28 | | | | N/R | | | | 1,229,100 | |
| | 250 | | | Cayuga Park CLO Ltd, 144A, (3-Month LIBOR reference rate + 6.000% spread), (3), (WI/DD) | | | 1.000% | | | | 7/17/34 | | | | N/R | | | | 250,000 | |
| | 500 | | | Cayuga Park CLO Ltd, 144A, (3-Month LIBOR reference rate + 3.100% spread), (3), (WI/DD) | | | 1.000% | | | | 7/17/34 | | | | N/R | | | | 500,000 | |
| | 300 | | | Cayuga Park CLO, Ltd, 144A, (3-Month LIBOR reference rate + 7.330% spread), (3) | | | 7.520% | | | | 7/17/31 | | | | BB– | | | | 300,000 | |
| | 1,200 | | | Cayuga Park CLO, Ltd, 144A, (3-Month LIBOR reference rate + 4.000% spread), (3) | | | 4.190% | | | | 7/17/31 | | | | BBB– | | | | 1,200,000 | |
| | 1,375 | | | CIFC Funding 2020-II Ltd, 144A, (3-Month LIBOR reference rate + 4.250% spread), (3) | | | 4.438% | | | | 8/24/32 | | | | BBB– | | | | 1,380,239 | |
| | 413 | | | DB Master Finance LLC, 144A | | | 4.021% | | | | 5/20/49 | | | | BBB | | | | 435,482 | |
| | 48 | | | Domino’s Pizza Master Issuer LLC, 144A | | | 4.118% | | | | 7/25/47 | | | | BBB+ | | | | 52,199 | |
| | 970 | | | Driven Brands Funding LLC, 144A, (5) | | | 4.739% | | | | 4/20/48 | | | | BBB– | | | | 1,031,382 | |
| | 167 | | | Garanti Diversified Payment Rights Finance Co, Reg S | | | 3.366% | | | | 10/09/21 | | | | BB+ | | | | 166,375 | |
| | 1,990 | | | Hardee’s Funding LLC, 144A | | | 3.981% | | | | 12/20/50 | | | | BBB | | | | 2,105,858 | |
| | 359 | | | Hilton Grand Vacations Trust 2020-A, 144A | | | 4.220% | | | | 2/25/39 | | | | A | | | | 381,481 | |
| | 718 | | | Hilton Grand Vacations Trust 2020-A, 144A | | | 6.420% | | | | 2/25/39 | | | | BBB | | | | 785,329 | |
| | 555 | | | HIN Timeshare Trust 2020-A, 144A | | | 5.500% | | | | 10/09/39 | | | | BB | | | | 577,374 | |
| | 396 | | | HIN Timeshare Trust 2020-A, 144A | | | 6.500% | | | | 10/09/39 | | | | B | | | | 406,716 | |
| | 1,433 | | | Horizon Aircraft Finance II Ltd, 144A | | | 4.703% | | | | 7/15/39 | | | | BBB | | | | 1,347,257 | |
| | 244 | | | Horizon Aircraft Finance III Ltd, 144A | | | 4.458% | | | | 11/15/39 | | | | BBB | | | | 236,661 | |
| | 529 | | | Jack in the Box Funding LLC, 144A | | | 3.982% | | | | 8/25/49 | | | | BBB | | | | 541,275 | |
| | 651 | | | Jack in the Box Funding LLC, 144A | | | 4.476% | | | | 8/25/49 | | | | BBB | | | | 686,590 | |
| | 308 | | | Lunar Aircraft 2020-1 LTD, 144A | | | 4.335% | | | | 2/15/45 | | | | BB | | | | 286,650 | |
| | 1,375 | | | Magnetite XXIII Ltd, 144A, (3-Month LIBOR reference rate + 6.750% spread), (3) | | | 6.926% | | | | 10/25/32 | | | | BB– | | | | 1,376,940 | |
| | 1,630 | | | Mexico Remittances Funding Fiduciary Estate Management Sarl, 144A | | | 4.875% | | | | 1/15/28 | | | | BB+ | | | | 1,604,393 | |
| | 800 | | | Mosaic Solar Loan Trust 2020-1, 144A | | | 4.470% | | | | 4/20/46 | | | | N/R | | | | 815,198 | |
| | 540 | | | Mosaic Solar Loan Trust 2020-1, 144A | | | 6.910% | | | | 4/20/46 | | | | N/R | | | | 558,170 | |
| | 1,000 | | | Mosaic Solar Loan Trust 2020-1, 144A | | | 0.000% | | | | 4/20/46 | | | | N/R | | | | 850,000 | |
| | 1,520 | | | Mosaic Solar Loan Trust 2020-2, 144A | | | 5.420% | | | | 8/20/46 | | | | N/R | | | | 1,562,759 | |
| | 902 | | | MVW 2020-1 LLC, 144A | | | 4.210% | | | | 10/20/37 | | | | BBB | | | | 955,237 | |
| | 576 | | | MVW 2020-1 LLC, 144A | | | 7.140% | | | | 10/20/37 | | | | BB | | | | 631,170 | |
| | 250 | | | Oportun Funding XIV LLC, 144A | | | 3.440% | | | | 3/08/28 | | | | N/R | | | | 249,611 | |
| | 500 | | | Oportun Funding XIV LLC, 144A | | | 5.400% | | | | 3/08/28 | | | | N/R | | | | 499,998 | |
| | 250 | | | Purchasing Power Funding 2021-A LLC, 144A | | | 4.370% | | | | 10/15/25 | | | | N/R | | | | 249,795 | |
| | 250 | | | Putnam RE PTE Ltd, 144A, (1-Month U.S. Treasury Bill reference rate + 5.500% spread), (3) | | | 5.541% | | | | 6/07/24 | | | | N/R | | | | 249,525 | |
| | 400 | | | Residential Reinsurance 2020 Ltd, 144A, (3-Month U.S. Treasury Bill reference rate + 6.510% spread), (3) | | | 6.551% | | | | 12/06/24 | | | | N/R | | | | 405,200 | |
| | 250 | | | Sanders Re Ltd, 144A, (3-Month U.S. Treasury Bill reference rate + 5.500% spread), (3) | | | 5.541% | | | | 4/07/22 | | | | N/R | | | | 218,750 | |
| | 1,305 | | | SERVPRO Master Issuer LLC, 144A | | | 3.882% | | | | 10/25/49 | | | | BBB– | | | | 1,373,096 | |
| | 585 | | | Sesac Finance LLC, 144A | | | 5.216% | | | | 7/25/49 | | | | N/R | | | | 623,743 | |
| | 271 | | | Sierra Timeshare 2019-3 Receivables Funding LLC, 144A | | | 4.180% | | | | 8/20/36 | | | | BB | | | | 275,524 | |
| | 820 | | | Sierra Timeshare 2020-2 Receivables Funding LLC, 144A | | | 6.590% | | | | 7/20/37 | | | | BB | | | | 866,458 | |
40
| | | | | | | | | | | | | | | | | | | | |
Principal
Amount (000) | | | Description (1) | | Coupon | | | Maturity | | | Ratings (2) | | | Value | |
| | | | |
| | | | ASSET-BACKED SECURITIES (continued) | | | | | | | | | | |
| | | | | |
| $ | 762 | | | Sonic Capital LLC, 144A | | | 3.845% | | | | 1/20/50 | | | | BBB | | | $ | 804,227 | |
| | 647 | | | START Ireland, 144A | | | 5.095% | | | | 3/15/44 | | | | BB | | | | 608,288 | |
| | 504 | | | Taco Bell Funding LLC, 144A | | | 4.970% | | | | 5/25/46 | | | | BBB | | | | 544,229 | |
| | 500 | | | TCW CLO 2019-1 AMR Ltd, 144A, (3-Month LIBOR reference rate + 6.750% spread), (3) | | | 6.906% | | | | 2/15/29 | | | | BB– | | | | 500,007 | |
| | 1,000 | | | TES LLC, 2017-1, 144A | | | 7.740% | | | | 10/20/47 | | | | N/R | | | | 987,073 | |
| | 1,000 | | | Tesla Auto Lease Trust 2018-B, 144A | | | 7.870% | | | | 6/20/22 | | | | Ba3 | | | | 1,015,615 | |
| | 710 | | | Tesla Auto Lease Trust 2019-A, 144A | | | 5.480% | | | | 5/22/23 | | | | Ba3 | | | | 745,145 | |
| | 1,500 | | | Tesla Auto Lease Trust 2020-A, 144A | | | 4.640% | | | | 8/20/24 | | | | Ba2 | | | | 1,575,450 | |
| | 1,285 | | | United Airlines 2020-1 Class A Pass-Through Trust, (4) | | | 5.875% | | | | 10/15/27 | | | | A | | | | 1,425,510 | |
| | 250 | | | Ursa Re II Ltd, 144A, (3-Month U.S. Treasury Bill reference rate + 6.250% spread), (3) | | | 6.291% | | | | 12/07/23 | | | | N/R | | | | 257,850 | |
| | 1,730 | | | Vivint Solar Financing V LLC, 144A | | | 7.370% | | | | 4/30/48 | | | | N/R | | | | 1,836,241 | |
| | 1,000 | | | Voya CLO 2020-1 Ltd, 144A, (3-Month LIBOR reference rate + 4.250% spread), (3) | | | 4.434% | | | | 7/16/31 | | | | BBB– | | | | 1,000,420 | |
| | 681 | | | VR Funding LLC, 144A | | | 6.420% | | | | 11/15/50 | | | | N/R | | | | 686,963 | |
| $ | 52,718 | | | Total Asset-Backed Securities (cost $53,688,442) | | | | | | | | | | | | | | | 55,004,977 | |
| | | | Total Long-Term Investments (cost $159,784,410) | | | | | | | | | | | | | | | 161,867,118 | |
| | | | | |
Principal
Amount (000) | | | Description (1) | | Coupon | | | Maturity | | | Ratings (2) | | | Value | |
| | | |
| | | | SHORT-TERM INVESTMENTS – 1.4% (1.0% of Total Investments) | | | | | | | | | |
| | | |
| | | | U.S. GOVERNMENT AND AGENCY OBLIGATIONS – 1.4% (1.0% of Total Investments) | | | | | | | |
| | | | | |
| $ | 1,664 | | | Federal Agricultural Mortgage Corp Discount Notes | | | 0.000% | | | | 7/01/21 | | | | N/R | | | $ | 1,664,000 | |
| $ | 1,664 | | | Total Short-Term Investments (cost $1,664,000) | | | | | | | | | | | | | | | 1,664,000 | |
| | | | Total Investments (cost $161,448,410) – 132.1% | | | | | | | | | | | | | | | 163,531,118 | |
| | | | Borrowings – (10.0)% (6), (7) | | | | | | | | | | | | | | | (12,355,000 | ) |
| | | | Reverse Repurchase Agreements, including accrued interest – (21.3)% (8) | | | | | | | | | | | | (26,344,479 | ) |
| | | | Other Assets Less Liabilities – (0.8)% | | | | | | | | | | | | | | | (975,219 | ) |
| | | | Net Assets Applicable to Common Shares – 100% | | | | | | | | | | | | | | $ | 123,856,420 | |
For Fund portfolio compliance purposes, the Fund’s industry classifications refer to any one or more of the industry sub-classifications used by one or more widely recognized market indexes or ratings group indexes, and/or as defined by Fund management. This definition may not apply for purposes of this report, which may combine industry sub-classifications into sectors for reporting ease.
| (1) | All percentages shown in the Portfolio of Investments are based on net assets applicable to common shares unless otherwise noted. |
| (2) | For financial reporting purposes, the ratings disclosed are the highest of Standard & Poor’s Group (“Standard & Poor’s”), Moody’s Investors Service, Inc. (“Moody’s”) or Fitch, Inc. (“Fitch”) rating. This treatment of split-rated securities may differ from that used for other purposes, such as for Fund investment policies. Ratings below BBB by Standard & Poor’s, Baa by Moody’s or BBB by Fitch are considered to be below investment grade. Holdings designated N/R are not rated by any of these national rating agencies. |
| (3) | Variable rate security. The rate shown is the coupon as of the end of the reporting period. |
| (4) | Investment, or portion of investment, has been pledged to collateralize the net payment obligations for investments in reverse repurchase agreements. As of the end of the reporting period, investments with a value of $35,364,804 have been pledged as collateral for reverse repurchase agreements. |
| (5) | Investment, or portion of investment, is hypothecated. The total value of investments hypothecated as of the end of the reporting period was $7,162,522. |
| (6) | Borrowings as a percentage of Total Investments is 7.6%. |
| (7) | The Fund may pledge up to 100% of its eligible investments (excluding any investments separately pledged as collateral for specific investments in derivatives, when applicable) in the Portfolio of Investments as collateral for borrowings. As of the end of the reporting period, investments with a value of $35,591,350 have been pledged as collateral for borrowings. |
| (8) | Reverse Repurchase Agreements as a percentage of Total Investments is 16.1%. |
| 144A | Investment is exempt from registration under Rule 144A of the Securities Act of 1933, as amended. These investments may only be resold in transactions exempt from registration, which are normally those transactions with qualified institutional buyers. |
| LIBOR | London Inter-Bank Offered Rate |
| Reg S | Regulation S allows U.S. companies to sell securities to persons or entities located outside of the United States without registering those securities with the Securities and Exchange Commission. Specifically, Regulation S provides a safe harbor from the registration requirements of the Securities Act for the offers and sales of securities by both foreign and domestic issuers that are made outside the United States. |
| SOFR30A | 30 Day Average Secured Overnight Financing Rate |
| WI/DD | Purchased on a when-issued or delayed delivery basis. |
See accompanying notes to financial statements.
41
Statement of Assets and Liabilities
June 30, 2021
(Unaudited)
| | | | | | | | | | | | |
| | | JGH | | | NPCT(1) | | | JLS | |
Assets | | | | | | | | | | | | |
Long-term investments, at value (cost $517,843,201, $365,627,318 and $159,784,410, respectively) | | $ | 536,420,634 | | | $ | 371,852,271 | | | $ | 161,867,118 | |
Short-term investments, at value (cost approximates value) | | | 23,650,031 | | | | 223,642,294 | | | | 1,664,000 | |
Cash | | | — | | | | 36,484 | | | | 5,627 | |
Cash collateral at broker for investments in swaps(2) | | | 5,933,180 | | | | — | | | | — | |
Swaps premiums paid | | | — | | | | 28,815 | | | | — | |
Unrealized appreciation on cross currency swaps | | | — | | | | 192,988 | | | | — | |
Receivable for: | | | | | | | | | | | | |
Dividends | | | 36,430 | | | | 27,997 | | | | — | |
Interest | | | 6,553,729 | | | | 2,404,117 | | | | 571,408 | |
Investments sold | | | 5,154,616 | | | | — | | | | — | |
Reclaims | | | 4,573 | | | | 10,107 | | | | 1,232 | |
Other assets | | | 136,891 | | | | — | | | | 65,452 | |
Total assets | | | 577,890,084 | | | | 598,195,073 | | | | 164,174,837 | |
Liabilities | | | | | | | | | | | | |
Borrowings | | | 159,000,000 | | | | — | | | | 12,355,000 | |
Reverse repurchase agreements, including accrued interest | | | — | | | | — | | | | 26,344,479 | |
Unrealized depreciation on interest rate swaps | | | 6,059,470 | | | | — | | | | — | |
Payable for: | | | | | | | | | | | | |
Dividends | | | 2,566,472 | | | | 2,431,368 | | | | 452,418 | |
Investments purchased – regular settlement | | | 2,124,009 | | | | 5,000,000 | | | | — | |
Investments purchased – when-issued/delayed-delivery settlement | | | 9,978,242 | | | | 11,368,400 | | | | 750,000 | |
Accrued expenses: | | | | | | | | | | | | |
Interest on borrowings | | | 128,859 | | | | — | | | | 16,811 | |
Management fees | | | 388,482 | | | | 435,069 | | | | 127,056 | |
Trustees fees | | | 113,080 | | | | 5,091 | | | | 62,295 | |
Offering costs | | | — | | | | 16,000 | | | | — | |
Other | | | 294,194 | | | | 109,957 | | | | 210,358 | |
Total liabilities | | | 180,652,808 | | | | 19,365,885 | | | | 40,318,417 | |
Net assets applicable to common shares | | $ | 397,237,276 | | | $ | 578,829,188 | | | $ | 123,856,420 | |
Common shares outstanding | | | 23,177,393 | | | | 28,755,000 | | | | 5,487,440 | |
Net asset value (“NAV”) per common share outstanding | | $ | 17.14 | | | $ | 20.13 | | | $ | 22.57 | |
Net assets applicable to common shares consist of: | | | | | | | | | | | | |
Common shares, $0.01 par value per share | | $ | 231,774 | | | $ | 287,550 | | | $ | 54,874 | |
Paid-in surplus | | | 483,684,565 | | | | 574,812,450 | | | | 123,652,318 | |
Total distributable earnings | | | (86,679,063 | ) | | | 3,729,188 | | | | 149,228 | |
Net assets applicable to common shares | | $ | 397,237,276 | | | $ | 578,829,188 | | | $ | 123,856,420 | |
Authorized common shares | | | Unlimited | | | | Unlimited | | | | Unlimited | |
| (1) | Consolidated Statement of Assets and Liabilities (as disclosed in Note 1). |
| (2) | Cash pledged to collateralize the net payment obligations for investments in derivatives is in addition to the Fund’s securities pledged as collateral as noted in the Portfolio of Investments. |
See accompanying notes to financial statements.
42
Statement of Operations
Six Months Ended June 30, 2021
(Unaudited)
| | | | | | | | | | | | |
| | | JGH | | | NPCT(1) | | | JLS | |
| Investment Income | | | | | | | | | | | | |
Dividends | | $ | 208,524 | | | $ | 60,165 | | | $ | — | |
Interest | | | 15,409,143 | | | | 1,213,884 | | | | 3,332,998 | |
Rehypothecation income | | | — | | | | — | | | | 2,766 | |
Tax withheld | | | (1,604 | ) | | | — | | | | — | |
Total Investment Income | | | 15,616,063 | | | | 1,274,049 | | | | 3,335,764 | |
Expenses | | | | | | | | | | | | |
Management fees | | | 2,317,214 | | | | 930,543 | | | | 766,749 | |
Interest expense | | | 693,836 | | | | — | | | | 297,408 | |
Custodian fees | | | 68,324 | | | | 42,481 | | | | 22,115 | |
Trustees fees | | | 12,255 | | | | 5,167 | | | | 1,954 | |
Professional fees | | | 80,288 | | | | 4,935 | | | | 27,421 | |
Shareholder reporting expenses | | | 62,343 | | | | 39,318 | | | | 16,257 | |
Shareholder servicing agent fees | | | 1,098 | | | | 25 | | | | 932 | |
Stock exchange listing fees | | | 3,290 | | | | — | | | | 3,290 | |
Investor relations expense | | | 12,514 | | | | 6,744 | | | | 14,940 | |
Other | | | 12,497 | | | | 16,949 | | | | 11,755 | |
Total expenses | | | 3,263,659 | | | | 1,046,162 | | | | 1,162,821 | |
Net expenses | | | 3,263,659 | | | | 1,046,162 | | | | 1,162,821 | |
Net investment income (loss) | | | 12,352,404 | | | | 227,887 | | | | 2,172,943 | |
Realized and Unrealized Gain (Loss) | | | | | | | | | | | | |
Net realized gain (loss) from: | | | | | | | | | | | | |
Investments and foreign currency | | | 15,524,980 | | | | 45,408 | | | | 905,430 | |
Swaps | | | (815,092 | ) | | | 31 | | | | — | |
Change in net unrealized appreciation (depreciation) of: | | | | | | | | | | | | |
Investments and foreign currency | | | (11,417,625 | ) | | | 6,224,639 | | | | 1,703,670 | |
Swaps | | | 2,733,418 | | | | 192,988 | | | | — | |
Net realized and unrealized gain (loss) | | | 6,025,681 | | | | 6,463,066 | | | | 2,609,100 | |
Net increase (decrease) in net assets applicable to common shares from operations | | | 18,378,085 | | | | 6,690,953 | | | | 4,782,043 | |
| (1) | Consolidated Statement of Operations (as disclosed in Note 1) for the period April 27, 2021 (commencement of operations) through June 30, 2021. |
See accompanying notes to financial statements.
43
Statement of Changes in Net Assets
| | | | | | | | | | | | |
| | | JGH | | | NPCT(1) | |
| | | Six Months
Ended 6/30/21 (Unaudited) | | | Year Ended
12/31/20 | | | For the period
4/27/21
(commencement
of operations)
through 6/30/21 (Unaudited) | |
Operations | | | | | | | | | | | | |
Net investment income (loss) | | $ | 12,352,404 | | | $ | 25,562,839 | | | $ | 227,887 | |
Net realized gain (loss) from: | | | | | | | | | | | | |
Investments and foreign currency | | | 15,524,980 | | | | (31,101,930 | ) | | | 45,408 | �� |
Swaps | | | (815,092 | ) | | | (1,074,313 | ) | | | 31 | |
Change in net unrealized appreciation (depreciation) of: | | | | | | | | | | | | |
Investments and foreign currency | | | (11,417,625 | ) | | | 11,238,560 | | | | 6,224,639 | |
Swaps | | | 2,733,418 | | | | (6,114,136 | ) | | | 192,988 | |
Net increase (decrease) in net assets applicable to common shares from operations | | | 18,378,085 | | | | (1,488,980 | ) | | | 6,690,953 | |
Distributions to Common Shareholders | | | | | | | | | | | | |
Dividends | | | (14,439,516 | ) | | | (24,735,572 | ) | | | (2,961,765 | ) |
Return of capital | | | — | | | | (956,568 | ) | | | — | |
Decrease in net assets applicable to common shares from distributions to common shareholders | | | (14,439,516 | ) | | | (25,692,140 | ) | | | (2,961,765 | ) |
Capital Share Transactions | | | | | | | | | | | | |
Common shares: | | | | | | | | | | | | |
Proceeds from sale of shares, net of offering costs | | | — | | | | — | | | | 575,000,000 | |
Net increase (decrease) in net assets applicable to common shares from capital share transactions | | | — | | | | — | | | | 575,000,000 | |
Net increase (decrease) in net assets applicable to common shares | | | 3,938,569 | | | | (27,181,120 | ) | | | 578,729,188 | |
Net assets applicable to common shares at the beginning of period | | | 393,298,707 | | | | 420,479,827 | | | | 100,000 | |
Net assets applicable to common shares at the end of period | | $ | 397,237,276 | | | $ | 393,298,707 | | | $ | 578,829,188 | |
| (1) | Consolidated Statement of Changes in Net Assets (as disclosed in Note 1). |
See accompanying notes to financial statements.
44
| | | | | | | | |
| | | JLS | |
| | | Six Months Ended 6/30/21 (Unaudited) | | | Year Ended 12/31/20 | |
Operations | | | | | | | | |
Net investment income (loss) | | $ | 2,172,943 | | | $ | 4,692,908 | |
Net realized gain (loss) from: | | | | | | | | |
Investments and foreign currency | | | 905,430 | | | | (1,266,642 | ) |
Swaps | | | — | | | | — | |
Change in net unrealized appreciation (depreciation) of: | | | | | | | | |
Investments and foreign currency | | | 1,703,670 | | | | (1,680,688 | ) |
Swaps | | | — | | | | — | |
Net increase (decrease) in net assets applicable to common shares from operations | | | 4,782,043 | | | | 1,745,578 | |
Distributions to Common Shareholders | | | | | | | | |
Dividends | | | (2,568,122 | ) | | | (4,012,755 | ) |
Return of capital | | | — | | | | (1,342,986 | ) |
Decrease in net assets applicable to common shares from distributions to common shareholders | | | (2,568,122 | ) | | | (5,355,741 | ) |
Capital Share Transactions | | | | | | | | |
Common shares: | | | | | | | | |
Proceeds from sale of shares, net of offering costs | | | — | | | | — | |
Net increase (decrease) in net assets applicable to common shares from capital share transactions | | | — | | | | — | |
Net increase (decrease) in net assets applicable to common shares | | | 2,213,921 | | | | (3,610,163 | ) |
Net assets applicable to common shares at the beginning of period | | | 121,642,499 | | | | 125,252,662 | |
Net assets applicable to common shares at the end of period | | $ | 123,856,420 | | | $ | 121,642,499 | |
See accompanying notes to financial statements.
45
Statement of Cash Flows
Six Months Ended June 30, 2021
| | | | | | | | |
| | | JGH | | | JLS | |
Cash Flows from Operating Activities: | | | | | | | | |
Net Increase (Decrease) in Net Assets Applicable to Common Shares from Operations | | $ | 18,378,085 | | | $ | 4,782,043 | |
Adjustments to reconcile the net increase (decrease) in net assets applicable to common shares from operations to net cash provided by (used in) operating activities: | | | | | | | | |
Purchases of investments | | | (263,435,256 | ) | | | (53,310,223 | ) |
Proceeds from sales and maturities of investments | | | 259,439,204 | | | | 62,517,806 | |
Proceeds from (Purchase of) short-term investments, net | | | (12,745,206 | ) | | | 2,837,973 | |
Amortization (Accretion) of premiums and discounts, net | | | 2,777 | | | | (74,686 | ) |
(Increase) Decrease in: | | | | | | | | |
Receivable for interest | | | 662,707 | | | | 31,093 | |
Receivable for dividends | | | (12,780 | ) | | | — | |
Receivable for investments sold | | | (332,949 | ) | | | — | |
Receivable for reclaims | | | (4,573 | ) | | | 210 | |
Other assets | | | 17,880 | | | | 20,469 | |
Increase (Decrease) in: | | | | | | | | |
Investments purchased – regular settlement | | | 2,124,009 | | | | (953,056 | ) |
Investments purchased – when-issued/delayed-delivery settlement | | | 5,612,006 | | | | (8,637,066 | ) |
Accrued management fees | | | (1,852 | ) | | | (240 | ) |
Accrued interest on borrowings | | | 117,472 | | | | (32,456 | ) |
Accrued Trustees fees | | | 24,077 | | | | 12,112 | |
Accrued other expenses | | | 141,882 | | | | 37,629 | |
Net realized (gain) loss from: | | | | | | | | |
Investments and foreign currency | | | (15,524,980 | ) | | | (905,430 | ) |
Paydowns | | | (177,426 | ) | | | (81,215 | ) |
Change in net unrealized appreciation (depreciation) of: | | | | | | | | |
Investments and foreign currency | | | 11,417,625 | | | | (1,703,670 | ) |
Swaps | | | (2,733,418 | ) | | | — | |
Net cash provided by (used in) operating activities | | | 2,969,284 | | | | 4,541,293 | |
Cash Flow from Financing Activities: | | | | | | | | |
Proceeds from borrowings | | | 9,800,000 | | | | 750,000 | |
(Repayments of) borrowings | | | — | | | | (3,900,000 | ) |
Proceeds from reverse repurchase agreements | | | — | | | | 65,380,879 | |
(Repayments of) reverse repurchase agreements | | | — | | | | (64,281,011 | ) |
Increase (Decrease) in cash overdraft | | | — | | | | (369,830 | ) |
Cash distributions paid to common shareholders | | | (11,873,044 | ) | | | (2,115,704 | ) |
Net cash provided by (used in) financing activities | | | (2,073,044 | ) | | | (4,535,666 | ) |
Net Increase (Decrease) in Cash and Cash Collateral at Brokers | | | 896,240 | | | | 5,627 | |
Cash and cash collateral at brokers at the beginning of period | | | 5,036,940 | | | | — | |
Cash and cash collateral at brokers at the end of period | | | 5,933,180 | | | | 5,627 | |
|
| The following table provides a reconciliation of cash and cash collateral at brokers to the statement of assets and liabilities: | |
Cash | | | — | | | | 5,627 | |
Cash collateral at brokers for investments in swaps | | | 5,933,180 | | | | — | |
Total cash and cash collateral at brokers | | | 5,933,180 | | | | 5,627 | |
| | |
| Supplemental Disclosure of Cash Flow Information | | | | | | |
Cash paid for interest (excluding amortization of offering costs) | | $ | 516,949 | | | $ | 305,070 | |
See accompanying notes to financial statements.
46
THIS PAGE INTENTIONALLY LEFT BLANK
Financial Highlights
Selected data for a share outstanding throughout each period:
| | | | | | | | | | | | | | | | | | | | | | | | | | | | | | | | | | | | | | | | | | | | |
| | | | |
| | | | | | Investment Operations | | | Less Distributions to
Common Shareholders | | | Common Share | |
| | | Beginning
Common
Share
NAV | | | Net
Investment
Income
(Loss)(a) | | | Net
Realized/
Unrealized
Gain (Loss) | | | Total | | | From
Net
Investment
Income | | | From
Accumulated
Net Realized
Gains | | | Return
of
Capital | | | Total | | | Discount from
Shares
Repurchased
and Retired | | | Ending
NAV | | | Ending
Share
Price | |
|
JGH | |
Year Ended 12/31: | |
2021(f) | | $ | 16.97 | | | $ | 0.53 | | | $ | 0.26 | | | $ | 0.79 | | | $ | (0.62) | | | $ | — | | | $ | — | | | $ | (0.62 | ) | | $ | — | | | $ | 17.14 | | | $ | 16.21 | |
2020 | | | 18.14 | | | | 1.10 | | | | (1.16 | ) | | | (0.06 | ) | | | (1.07 | ) | | | — | | | | (0.04 | ) | | | (1.11 | ) | | | — | | | | 16.97 | | | | 15.55 | |
2019 | | | 16.01 | | | | 1.19 | | | | 2.17 | | | | 3.36 | | | | (1.20 | ) | | | — | | | | (0.03 | ) | | | (1.23 | ) | | | — | | | | 18.14 | | | | 16.38 | |
2018 | | | 18.51 | | | | 1.26 | | | | (2.42 | ) | | | (1.16 | ) | | | (1.27 | ) | | | — | | | | (0.08 | ) | | | (1.35 | ) | | | 0.01 | | | | 16.01 | | | | 13.65 | |
2017 | | | 17.82 | | | | 1.42 | | | | 0.71 | | | | 2.13 | | | | (1.34 | ) | | | — | | | | (0.10 | ) | | | (1.44 | ) | | | — | | | | 18.51 | | | | 16.91 | |
2016 | | | 16.05 | | | | 1.47 | | | | 1.83 | | | | 3.30 | | | | (1.51 | ) | | | — | | | | (0.03 | ) | | | (1.54 | ) | | | 0.01 | | | | 17.82 | | | | 15.99 | |
|
NPCT(e) | |
Year Ended 12/31: | |
2021(g) | | | 20.00 | | | | 0.01 | | | | 0.22 | | | | 0.23 | | | | (0.10 | ) | | | — | | | | — | | | | (0.10 | ) | | | — | | | | 20.13 | | | | 19.40 | |
| | | | | | | | |
| | | Borrowings at the End of Period | |
| | | Aggregate
Amount
Outstanding
(000) | | | Asset
Coverage
Per $1,000 | |
|
JGH | |
Year Ended 12/31: | |
2021(f) | | $ | 159,000 | | | $ | 3,498 | |
2020 | | | 149,200 | | | | 3,636 | |
2019 | | | 175,200 | | | | 3,400 | |
2018 | | | 175,200 | | | | 3,118 | |
2017 | | | 175,200 | | | | 3,455 | |
2016 | | | 164,800 | | | | 3,513 | |
48
| | | | | | | | | | | | | | | | | | | | | | |
| | | | | | |
Common Share Supplemental Data/
Ratios Applicable to Common Shares | |
| Common Share Total Returns | | | | | | Ratios to Average Net Assets(c) | | | | |
Based
on
NAV(b) | | | Based on
Share
Price(b) | | | Ending
Net Assets
(000) | | | Expenses | | | Net
Investment
Income (Loss) | | | Portfolio Turnover
Rate(d) | |
| | | | | |
| | | | | | | | | | | | | | | | | | | | | | | |
| | | | | | | | | | | | | | | | | | | | | | |
| | 4.76 | % | | | 8.46 | % | | $ | 397,237 | | | | 1.67 | %* | | | 6.34 | %* | | | 49 | % |
| | 0.39 | | | | 2.88 | | | | 393,299 | | | | 1.87 | | | | 6.94 | | | | 35 | |
| | 21.54 | | | | 29.93 | | | | 420,480 | | | | 2.64 | | | | 6.84 | | | | 43 | |
| | (6.67 | ) | | | (11.97 | ) | | | 371,082 | | | | 2.51 | | | | 7.10 | | | | 61 | |
| | 12.25 | | | | 15.14 | | | | 430,058 | | | | 2.08 | | | | 7.70 | | | | 77 | |
| | 21.85 | | | | 29.26 | | | | 414,084 | | | | 1.97 | | | | 8.91 | | | | 49 | |
| | | | | |
| | | | | | | | | | | | | | | | | | | | | | | |
| | | | | | | | | | | | | | | | | | | | | | |
| | 1.17 | | | | (2.49 | ) | | | 578,829 | | | | 1.02 | * | | | 0.22 | * | | | 23 | |
| (a) | Per share Net Investment Income (Loss) is calculated using the average daily shares method. |
| (b) | Total Return Based on Common Share NAV is the combination of changes in common share NAV, reinvested dividend income at NAV and reinvested capital gains distributions at NAV, if any. The last dividend declared in the period, which is typically paid on the first business day of the following month, is assumed to be reinvested at the ending NAV. The actual reinvest price for the last dividend declared in the period may often be based on the Fund’s market price (and not its NAV), and therefore may be different from the price used in the calculation. Total returns are not annualized. |
Total Return Based on Common Share Price is the combination of changes in the market price per common share and the effect of reinvested dividend income and reinvested capital gains distributions, if any, at the average price paid per common share at the time of reinvestment. The last dividend declared in the period, which is typically paid on the first business day of the following month, is assumed to be reinvested at the ending market price. The actual reinvestment for the last dividend declared in the period may take place over several days, and in some instances may not be based on the market price, so the actual reinvestment price may be different from the price used in the calculation. Total returns are not annualized.
| | | | |
| (c) | | • | | Net Investment Income (Loss) ratios reflect income earned and expenses incurred on assets attributable to borrowings, (as described in Note 8 – Borrowing Arrangements). |
| | • | | Each ratio includes the effect of all interest expense paid and other costs related to borrowings as follows: |
| | | | |
Ratios of Borrowings Interest Expense
to Average Net Assets Applicable
to Common Shares | |
JGH | | | | |
Year Ended 12/31: | |
2021(f) | | | 0.36 | %* |
2020 | | | 0.59 | |
2019 | | | 1.33 | |
2018 | | | 1.19 | |
2017 | | | 0.78 | |
2016 | | | 0.66 | |
| (d) | Portfolio Turnover Rate is calculated based on the lesser of long-term purchases or sales (as disclosed in Note 4 – Portfolio Securities and Investments in Derivatives) divided by the average long-term market value during the period. |
| (e) | Consolidated Financial Highlights (as disclosed in Note 1). |
| (f) | Unaudited. For the six months ended June 30, 2021. |
| (g) | Unaudited. For the period April 27, 2021 (commencement of operations) through June 30, 2021. |
See accompanying notes to financial statements.
49
Financial Highlights (continued)
| | | | | | | | | | | | | | | | | | | | | | | | | | | | | | | | | | | | | | | | |
| | | | |
| | | | | | Investment Operations | | | Less Distributions to
Common Shareholders | | | Common Share | |
| | | Beginning
Common
Share
NAV | | | Net
Investment
Income
(Loss)(a) | | | Net
Realized/
Unrealized
Gain (Loss) | | | Total | | | From
Net
Investment
Income | | | From
Accumulated
Net Realized
Gains | | | Return
of
Capital | | | Total | | | Ending
NAV | | | Ending
Share
Price | |
| | | | | | | | | |
JLS | | | | | | | | | | | | | | | | | | | | | | | | | | | | | | | | | | | | | |
Year Ended 12/31: | | | | | | | | | | | | | | | | | | | | | | | | | | | | | | | | | | | | | | | | |
2021(f) | | $ | 22.17 | | | $ | 0.40 | | | $ | 0.47 | | | $ | 0.87 | | | $ | (0.47 | ) | | $ | — | | | $ | — | | | $ | (0.47 | ) | | $ | 22.57 | | | $ | 20.89 | |
2020 | | | 22.83 | | | | 0.86 | | | | (0.55 | ) | | | 0.31 | | | | (0.73 | ) | | | — | | | | (0.24 | ) | | | (0.97 | ) | | | 22.17 | | | | 19.77 | |
2019 | | | 23.02 | | | | 0.76 | | | | 0.41 | | | | 1.17 | | | | (0.92 | ) | | | — | | | | (0.44 | ) | | | (1.36 | ) | | | 22.83 | | | | 21.96 | |
2018 | | | 24.70 | | | | 1.16 | | | | (0.76 | ) | | | 0.40 | | | | (1.52 | ) | | | (0.49 | ) | | | (0.07 | ) | | | (2.08 | ) | | | 23.02 | | | | 22.35 | |
2017 | | | 25.02 | | | | 1.34 | | | | 1.65 | | | | 2.99 | | | | (1.94 | ) | | | (1.37 | ) | | | — | | | | (3.31 | ) | | | 24.70 | | | | 24.69 | |
2016 | | | 25.09 | | | | 1.56 | | | | 0.08 | | | | 1.64 | | | | (1.43 | ) | | | (0.28 | ) | | | — | | | | (1.71 | ) | | | 25.02 | | | | 24.07 | |
| | | | | | | | |
| | | Borrowings at the End of Period | |
| | | Aggregate
Amount
Outstanding
(000) | | | Asset
Coverage
Per $1,000 | |
| | |
JLS | | | | �� | | | | |
Year Ended 12/31: | |
2021(f) | | $ | 12,355 | | | $ | 11,025 | |
2020 | | | 15,505 | | | | 8,845 | |
2019 | | | — | | | | — | |
2018 | | | 147,200 | | | | 3,485 | |
2017 | | | 147,200 | | | | 3,666 | |
2016 | | | 147,200 | | | | 3,701 | |
50
| | | | | | | | | | | | | | | | | | | | | | | | | | | | | | |
| | | | | | | Ratios/Supplemental Data
Applicable to Common Shares | |
Common Share Total
Returns | | | | | | Ratios to Average Net Assets Before
Reimbursement(c) | | | Ratios to Average Net Assets After
Reimbursement(c)(d) | | | | |
Based
on
NAV(b) | | | Based on
Share
Price(b) | | | Ending
Net Assets
(000) | | | Expenses | | | Net
Investment
Income (Loss) | | | Expenses | | | Net
Investment
Income (Loss) | | | Portfolio Turnover
Rate(e) | |
| | | | | | | |
| | | | | | | | | | | | | | | | | | | | | | | | | | | | | | | |
| | | | | | | | | | | | | | | | | | | | | | | | | | | | | | |
| | 3.94 | % | | | 8.08 | % | | $ | 123,856 | | | | 1.90 | %* | | | 3.55 | %* | | | N/A | | | | N/A | | | | 39 | % |
| | 1.69 | | | | (5.36 | ) | | | 121,642 | | | | 2.46 | | | | 3.11 | | | | 1.54 | | | | 4.04 | | | | 117 | |
| | 5.16 | | | | 4.27 | | | | 125,253 | | | | 2.72 | | | | 3.08 | | | | 2.53 | | | | 3.26 | | | | 100 | |
| | 1.63 | | | | (1.06 | ) | | | 365,810 | | | | 2.89 | | | | 4.77 | | | | N/A | | | | N/A | | | | 44 | |
| | 12.21 | | | | 16.79 | | | | 392,453 | | | | 2.51 | | | | 5.12 | | | | N/A | | | | N/A | | | | 85 | |
| | 6.79 | | | | 13.97 | | | | 397,604 | | | | 2.42 | | | | 6.29 | | | | N/A | | | | N/A | | | | 73 | |
| (a) | Per share Net Investment Income (Loss) is calculated using the average daily shares method. |
| (b) | Total Return Based on Common Share NAV is the combination of changes in common share NAV, reinvested dividend income at NAV and reinvested capital gains distributions at NAV, if any. The last dividend declared in the period, which is typically paid on the first business day of the following month, is assumed to be reinvested at the ending NAV. The actual reinvest price for the last dividend declared in the period may often be based on the Fund’s market price (and not its NAV), and therefore may be different from the price used in the calculation. Total returns are not annualized. |
Total Return Based on Common Share Price is the combination of changes in the market price per share and the effect of reinvested dividend income and reinvested capital gains distributions, if any, at the average price paid per common share at the time of reinvestment. The last dividend declared in the period, which is typically paid on the first business day of the following month, is assumed to be reinvested at the ending market price. The actual reinvestment for the last dividend declared in the period may take place over several days, and in some instances may not be based on the market price, so the actual reinvestment price may be different from the price used in the calculation. Total returns are not annualized.
| | | | |
| (c) | | • | | Net Investment Income (Loss) ratios reflect income earned and expenses incurred on assets attributable to reverse repurchase agreements (where applicable) and/or borrowings (as described in Note 8 – Fund Leverage). |
| | • | | Each ratio includes the effect of all interest expense paid and other costs related to reverse repurchase agreements and/or to borrowings, where applicable, as follows: |
| | | | |
Ratios of Interest Expense
to Average Net Assets Applicable
to Common Shares | |
JLS | | | | |
Year Ended 12/31: | |
2021(f) | | | 0.49 | %* |
2020 | | | 0.91 | |
2019 | | | 1.15 | |
2018 | | | 1.26 | |
2017 | | | 0.93 | |
2016 | | | 0.79 | |
| (d) | During the fiscal year ended December 31, 2019, the Adviser voluntarily reimbursed the Fund for certain expenses incurred in connection with its restructuring. See Notes to Financial Statements, Note 7 – Management Fees. |
| (e) | Portfolio Turnover Rate is calculated based on the lesser of long-term purchases or sales (as disclosed in Note 4 – Portfolio Securities and Investments in Derivatives) divided by the average long-term market value during the period. |
| (f) | Unaudited. For the six months ended June 30, 2021. |
| N/A | Fund did not have a contractual reimbursement with the Adviser. |
51
See accompanying notes to financial statements.
Notes to Financial Statements
(Unaudited)
1. General Information
Fund Information
The funds covered in this report and their corresponding New York Stock Exchange (“NYSE”) symbols are as follows (each a “Fund” and collectively, the “Funds”):
| | • | | Nuveen Global High Income Fund (JGH) |
| | • | | Nuveen Core Plus Impact Fund (NPCT) |
| | • | | Nuveen Mortgage and Income Fund (JLS) |
The Funds are registered under the Investment Company Act of 1940 (the “1940 Act”), as amended, as diversified closed-end management investment companies. JGH, NPCT and JLS were organized as Massachusetts business trusts on August 5, 2014, December 4, 2020 and September 10, 2009, respectively.
The end of the reporting period for the Funds is June 30, 2021. The period covered by these Notes to Financial Statements for JGH and JLS is for the six months ended June 30, 2021, and the reporting period for NPCT is the period April 27, 2021 (commencement of operations) through June 30, 2021 (collectively the “current fiscal period”).
Investment Adviser and Sub-Adviser
The Funds’ investment adviser is Nuveen Fund Advisors, LLC (the “Adviser”), a subsidiary of Nuveen, LLC (“Nuveen”). Nuveen is the investment management arm of Teachers Insurance and Annuity Association of America (TIAA). The Adviser has overall responsibility for management of the Fund, oversees the management of the Funds’ portfolio, manages the Funds’ business affairs and provides certain clerical, bookkeeping and other administrative services, and, if necessary, asset allocation decisions. The Adviser has entered into a sub-advisory agreement with Nuveen Asset Management, LLC (“NAM”), a subsidiary of the Adviser and Techers Advisors, LLC (“TAL”), an affiliate of the Adviser, (each a “Sub-Adviser” and collectively, the “Sub-Advisers). NAM manages the investment portfolios of JGH and NPCT, while TAL manages the investment portfolio of JLS.
Developments Regarding JGH’s Control Share By-Law
On January 14, 2021, JGH’s Board of Trustees (the “JGH Board”) received a shareholder demand letter (the “Demand Letter”) from Saba Capital CEF Opportunities 1, Ltd. and Saba Capital Management, L.P. (collectively, “Saba”) demanding that the JGH (i) rescind the Fund’s by-law provisions pursuant to which, in summary, a shareholder who obtains beneficial ownership of common shares in a control share acquisition shall have the same voting rights as other common shareholders only to the extent authorized by the other disinterested shareholders (the “Control Share By-Law”) and (ii) commence judicial action against the JGH Board to ensure that the Control Share By-Law is withdrawn. Following review of the Demand Letter, the JGH Board determined that it would not be in the best interests of the Fund or the Fund’s shareholders to take the actions requested in the Demand Letter. Also on January 14, 2021, Saba filed a civil complaint in the U.S. District Court for the Southern District of New York against the Fund, certain other Nuveen funds and the Trustees, seeking a declaration that the Control Share By-Law violates the 1940 Act, rescission of the Control Share By-Law and a permanent injunction against applying the Control Share By-Law. Management has determined that this complaint is unlikely to have an impact to the Fund’s financial statements.
Other Matters
The outbreak of the novel coronavirus (“COVID-19”) and subsequent global pandemic began significantly impacting the U.S. and global financial markets and economies during the calendar quarter ended March 31, 2020. The worldwide spread of COVID-19 has created significant uncertainty in the global economy. The duration and extent of COVID-19 over the long term cannot be reasonably estimated at this time. The ultimate impact of COVID-19 and the extent to which COVID-19 impacts the Funds’ normal course of business, results of operations, investments, and cash flows will depend on future developments, which are highly uncertain and difficult to predict. Management continues to monitor and evaluate this situation.
Basis for Consolidation
NPCT is presented on a consolidated basis with the Nuveen Core Plus Impact Fund Offshore Limited (the “Subsidiary”), a wholly-owned subsidiary of NPCT organized under the laws of the Cayman Islands. The Subsidiary commenced operations on April 27, 2021 and is intended to provide the Fund with exposure to Regulation S fixed-income securities. Regulation S securities are securities of U.S. and non-U.S. issuers that are issued through private placement transactions with the SEC pursuant to Regulation S under the Securities Act of 1933, as amended. The Subsidiary is advised by the Adviser and
52
has the same investment objective as NPCT, but unlike NPCT, it may invest in Regulation S securities without limitation. As of the end of the reporting period, the net assets of the Subsidiary were $8,693,456 representing 2% of the Fund’s consolidated net assets. All inter-company transactions and balances have been eliminated.
Select financial information related to the Subsidiary is as follows:
| | | | |
| | | NPCT | |
Total long-term investments at value | | $ | 8,674,085 | |
Net assets applicable to Common Shares | | | 8,693,456 | |
Net investment income (loss) | | | 50,895 | |
Net realized gain (loss) from investments and foreign currency | | | — | |
Change in net unrealized appreciation (depreciation) from investments and foreign currency | | | (125,529 | ) |
2. Significant Accounting Policies
The accompanying financial statements were prepared in accordance with accounting principles generally accepted in the United States of America (“U.S. GAAP”), which may require the use of estimates made by management and the evaluation of subsequent events. Actual results may differ from those estimates. Each Fund is an investment company and follows the accounting guidance in the Financial Accounting Standards Board (“FASB”) Accounting Standards Codification 946, Financial Services – Investment Companies. The net asset value (“NAV”) for financial reporting purposes may differ from the NAV for processing security and common share transactions. The NAV for financial reporting purposes includes security and common share transactions through the date of the report. Total return is computed based on the NAV used for processing security and common share transactions. The following is a summary of the significant accounting policies consistently followed by the Funds.
Compensation
The Funds pay no compensation directly to those of their trustees who are affiliated with the Adviser or to their officers, all of whom receive remuneration for their services to the Funds from the Adviser or its affiliates. The Funds’ Board of Trustees (the “Board”) has adopted a deferred compensation plan for independent trustees that enables trustees to elect to defer receipt of all or a portion of the annual compensation they are entitled to receive from certain Nuveen-advised funds. Under the plan, deferred amounts are treated as though equal dollar amounts had been invested in shares of select Nuveen-advised funds.
Distributions to Common Shareholders
Distributions to common shareholders are recorded on the ex-dividend date. The amount, character and timing of distributions are determined in accordance with federal income tax regulations, which may differ from U.S. GAAP.
Effective in conjunction with the declaration of the March 2021 distribution, each Fund has implemented a level distribution program to provide shareholders with stable, but not guaranteed, cash flow, independent of the amount or timing of income earned or capital gains realized by the Fund. Under this program, the Fund’s regular monthly distribution, in order to maintain its level distribution amount, may include net investment income, return of capital and potentially capital gains for tax purposes. The amounts and sources of distributions are reported for financial reporting purposes and are not being provided for tax reporting purposes. The actual amounts and character of the distributions for tax reporting purposes will be reported to shareholders on Form 1099-DIV which will be sent to shareholders shortly after calendar year-end.
NPCT makes monthly cash distributions to common shareholders of a stated dollar amount per share. Subject to approval and oversight by the Board, the Fund seeks to maintain a stable distribution level designed to deliver the long-term return potential of the Fund’s investment strategy through regular monthly distributions (a “Managed Distribution Program”). Total distributions during a calendar year generally will be made from the Fund’s net investment income, net realized capital gains and net unrealized capital gains in the Fund’s portfolio, if any. The portion of distributions paid attributed to net unrealized gains, if any, is distributed from the Fund’s assets and is treated by common shareholders as a nontaxable distribution (“return of capital”) for tax purposes. In the event that total distributions during a calendar year exceed the Fund’s total return on NAV, the difference will reduce NAV per share. If the Fund’s total return on NAV exceeds total distributions during a calendar year, the excess will be reflected as an increase in NAV per share. The amounts and sources of distributions reported for financial reporting purposes and are not being provided for tax reporting purposes. The actual amounts and character of the distributions for tax reporting purposes will be reported to shareholders on Form 1099-DIV which will be sent to shareholders shortly after calendar year-end.
Foreign Currency Transactions and Translation
To the extent that JGH and NPCT invests in securities and/or contracts that are denominated in a currency other than U.S. dollars, the Funds will be subject to currency risk, which is the risk that an increase in the U.S. dollar relative to the foreign currency will reduce returns or portfolio value. Generally, when the U.S. dollar rises in value against a foreign currency, the Funds’ investments denominated in that currency will lose value because their currency is worth fewer
53
Notes to Financial Statements (continued)
(Unaudited)
U.S. dollars; the opposite effect occurs if the U.S. dollar falls in relative value. Investments and other assets and liabilities denominated in foreign currencies are converted into U.S. dollars on a spot (i.e. cash) basis at the spot rate prevailing in the foreign currency exchange market at the time of valuation. Purchases and sales of investments and income denominated in foreign currencies are translated into U.S. dollars on the respective dates of such transactions.
The books and records of the Funds are maintained in U.S. dollars. Assets, including investments, and liabilities denominated in foreign currencies are translated into U.S. dollars at the end of each day. Purchases and sales of securities, income and expenses are translated into U.S. dollars at the prevailing exchange rate on the respective dates of the transactions.
Net realized foreign currency gains and losses resulting from changes in exchange rates associated with (i) foreign currency, (ii) investments and (iii) derivatives include foreign currency gains and losses between trade date and settlement date of the transactions, foreign currency transactions, and the difference between the amounts of interest and dividends recorded on the books of the Funds and the amounts actually received are recognized as a component of “Net realized gain (loss) from investments and foreign currency” on the Statement of Operations, when applicable.
The unrealized gains and losses resulting from changes in foreign currency exchange rates and changes in foreign exchange rates associated with (i) investments and (ii) other assets and liabilities are recognized as a component of “Change in net unrealized appreciation (depreciation) of investments and foreign currency” on the Statement of Operations, when applicable. The unrealized gains and losses resulting from changes in foreign exchange rates associated with investments in derivatives are recognized as a component of the respective derivative’s related “Change in net unrealized appreciation (depreciation)” on the Statement of Operations, when applicable.
As of the end of the reporting period, the following Funds’ investments in non-U.S. securities were as follows:
| | | | | | | | |
| JGH | | Value | | | % of Total
Investments | |
Country: | | | | | | | | |
Canada | | $ | 19,626,411 | | | | 3.5 | % |
Brazil | | | 18,027,540 | | | | 3.2 | |
United Kingdom | | | 17,501,718 | | | | 3.1 | |
Mexico | | | 11,665,191 | | | | 2.1 | |
Turkey | | | 9,234,803 | | | | 1.7 | |
Netherlands | | | 9,178,936 | | | | 1.6 | |
France | | | 8,572,897 | | | | 1.5 | |
Spain | | | 8,550,827 | | | | 1.5 | |
Dominican Republic | | | 8,091,239 | | | | 1.4 | |
Germany | | | 7,372,482 | | | | 1.3 | |
Israel | | | 6,265,781 | | | | 1.1 | |
Oman | | | 6,013,157 | | | | 1.1 | |
Colombia | | | 5,719,254 | | | | 1.0 | |
Other | | | 95,871,286 | | | | 17.3 | |
Total non-U.S. securities | | $ | 231,691,522 | | | | 41.4 | % |
| | |
| NPCT | | | | | | |
Country: | | | | | | | | |
United Kingdom | | $ | 28,643,150 | | | | 4.8 | % |
Canada | | | 26,041,865 | | | | 4.4 | |
Italy | | | 15,753,130 | | | | 2.6 | |
Indonesia | | | 10,582,500 | | | | 1.8 | |
Australia | | | 10,448,969 | | | | 1.8 | |
Spain | | | 6,387,876 | | | | 1.1 | |
Bermuda | | | 6,035,231 | | | | 1.0 | |
Turkey | | | 5,995,566 | | | | 1.0 | |
Japan | | | 5,131,474 | | | | 0.9 | |
South Korea | | | 4,957,869 | | | | 0.8 | |
Other | | | 12,511,119 | | | | 2.0 | |
Total non-U.S. securities | | $ | 132,488,749 | | | | 22.2 | % |
Indemnifications
Under the Funds’ organizational documents, their officers and trustees are indemnified against certain liabilities arising out of the performance of their duties to the Funds. In addition, in the normal course of business, the Funds enter into contracts that provide general indemnifications to other parties. The Funds’ maximum exposure under these arrangements is unknown as this would involve future claims that may be made against the Funds that have not yet occurred. However, the Funds have not had prior claims or losses pursuant to these contracts and expects the risk of loss to be remote.
54
Investments and Investment Income
Securities transactions are accounted for as of the trade date for financial reporting purposes. Trade date for senior and subordinated loans purchased in the “primary market” is considered the date on which the loan allocations are determined. Trade date for senior and subordinated loans purchased in the “secondary market” is the date on which the transaction is entered into. Realized gains and losses on securities transactions are based upon the specific identification method. Dividend income is recorded on the ex-dividend date, or for foreign securities, when information is available. Non-cash dividends received in the form of stock, if any, are recognized on the ex-dividend date and recorded at fair value. Interest income, which is recorded on an accrual basis and includes accretion of discounts and amortization of premiums for financial reporting purposes. Interest income also reflects payment-in-kind (“PIK”) interest, fee income, if any and paydown gains and losses, if any. PIK interest represents income received in the form of securities in lieu of cash. Fee income consists primarily of amendment fees. Amendment fees are earned as compensation for evaluating and accepting changes to an original senior loan agreement and are recognized when received. Rehypothecation income is comprised of fees earned in connection with the rehypothecation of pledged collateral as further described in Note 8 – Borrowing Arrangements.
Netting Agreements
In the ordinary course of business, the Funds may enter into transactions subject to enforceable master repurchase agreements, International Swaps and Derivatives Association, Inc. (ISDA) master agreements or other similar arrangements (“netting agreements”). Generally, the right to offset in netting agreements allows each Fund to offset certain securities and derivatives with a specific counterparty, when applicable, as well as any collateral received or delivered to that counterparty based on the terms of the agreements. Generally, each Fund manages its cash collateral and securities collateral on a counterparty basis.
The Funds’ investments subject to netting agreements as of the end of the reporting period, if any, are further described in Note 4 – Portfolio Securities and Investments in Derivatives.
Organizational Expenses for NPCT
Prior to the commencement of operations on April 27, 2021, NPCT had no operations other than those related to organizational matters and the Fund’s initial contribution of $100,000 by the Adviser.
New Accounting Pronouncements and Rule Issuances
Reference Rate Reform
In March 2020, FASB issued Accounting Standards Update (“ASU”) 2020-04, Reference Rate Reform: Facilitation of the Effects of Reference Rate Reform on Financial Reporting. The main objective of the new guidance is to provide relief to companies that will be impacted by the expected change in benchmark interest rates at the end of 2021, when participating banks will no longer be required to submit London Interbank Offered Rate (LIBOR) quotes by the UK Financial Conduct Authority (FCA). The new guidance allows companies to, provided the only change to existing contracts are a change to an approved benchmark interest rate, account for modifications as a continuance of the existing contract without additional analysis. For new and existing contracts, the Funds may elect to apply the amendments as of March 12, 2020 through December 31, 2022. Management has not yet elected to apply the amendments, is continuously evaluating the potential effect a discontinuation of LIBOR could have on the Funds’ investments and has currently determined that it is unlikely the ASU’s adoption will have a significant impact on the Funds’ financial statements and various filings.
Securities and Exchange Commission (“SEC”) Adopts New Rules to Modernize Fund Valuation Framework
In December 2020, the SEC voted to adopt a new rule governing fund valuation practices. New Rule 2a-5 under the 1940 Act establishes requirements for determining fair value in good faith for purposes of the 1940 Act. Rule 2a-5 will permit fund boards to designate certain parties to perform fair value determinations, subject to board oversight and certain other conditions. Rule 2a-5 also defines when market quotations are “readily available” for purposes of Section 2(a)(41) of the 1940 Act, which requires a fund to fair value a security when market quotations are not readily available. The SEC also adopted new Rule 31a-4 under the 1940 Act, which sets forth the recordkeeping requirements associated with fair value determinations. Finally, the SEC is rescinding previously issued guidance on related issues, including the role of a board in determining fair value and the accounting and auditing of fund investments. Rule 2a-5 and Rule 31a-4 became effective on March 8, 2021, with a compliance date of September 8, 2022. A fund may voluntarily comply with the rules after the effective date, and in advance of the compliance date, under certain conditions. Management is currently assessing the impact of these provisions on the Funds’ financial statements.
3. Investment Valuation and Fair Value Measurements
The Funds’ investments in securities are recorded at their estimated fair value utilizing valuation methods approved by the Board. Fair value is defined as the price that would be received upon selling an investment or transferring a liability in an orderly transaction to an independent buyer in the principal or most advantageous market for the investment. U.S. GAAP establishes the three-tier hierarchy which is used to maximize the use of observable market data and minimize the use of unobservable inputs and to establish classification of fair value measurements for disclosure purposes. Observable inputs reflect the assumptions market participants would use in pricing the asset or liability. Observable inputs are based on market data obtained from sources
55
Notes to Financial Statements (continued)
(Unaudited)
independent of the reporting entity. Unobservable inputs reflect management’s assumptions about the assumptions market participants would use in pricing the asset or liability. Unobservable inputs are based on the best information available in the circumstances. The following is a summary of the three-tiered hierarchy of valuation input levels.
| | |
| Level 1 – | | Inputs are unadjusted and prices are determined using quoted prices in active markets for identical securities. |
| Level 2 – | | Prices are determined using other significant observable inputs (including quoted prices for similar securities, interest rates, credit spreads, etc.). |
| Level 3 – | | Prices are determined using significant unobservable inputs (including management’s assumptions in determining the fair value of investments). |
A description of the valuation techniques applied to the Funds’ major classifications of assets and liabilities measured at fair value follows:
Equity securities and exchange-traded funds listed or traded on a national market or exchange are valued based on their sale price at the official close of business of such market or exchange on the valuation date. Foreign equity securities are valued at the last sale price or official closing price reported on the exchange where traded and converted to U.S. dollars at the prevailing rates of exchange on the date of valuation. To the extent these securities are actively traded and that valuation adjustments are not applied, they are generally classified as Level 1. If there is no official close of business, then the latest available sale price is utilized. If no sales are reported, then the mean of the latest available bid and ask prices is utilized and these securities are generally classified as Level 2.
Prices of fixed-income securities are generally provided by an independent pricing service (“pricing service”) approved by the Board. The pricing service establishes a security’s fair value using methods that may include consideration of the following: yields or prices of investments of comparable quality, type of issue, coupon, maturity and rating, market quotes or indications of value from security dealers, evaluations of anticipated cash flows or collateral, general market conditions and other information and analysis, including the obligor’s credit characteristics considered relevant. In pricing certain securities, particularly less liquid and lower quality securities, the pricing service may consider information about a security, its issuer or market activity provided by the Adviser. These securities are generally classified as Level 2.
Repurchase agreements are valued at contract amount plus accrued interest, which approximates market value. These securities are generally classified as Level 2.
Swap contracts are marked-to-market daily based upon a price supplied by a pricing service. Swaps are generally classified as Level 2.
For events affecting the value of foreign securities between the time when the exchange on which they are traded closes and the time when the Funds’ net assets are calculated, such securities will be valued at fair value in accordance with procedures adopted by the Board. These foreign securities are generally classified as Level 2.
Any portfolio security or derivative for which market quotations are not readily available or for which the above valuation procedures are deemed not to reflect fair value are valued at fair value, as determined in good faith using procedures approved by the Board. As a general principle, the fair value of a security would appear to be the amount that the owner might reasonably expect to receive for it in a current sale. A variety of factors may be considered in determining the fair value of such securities, which may include consideration of the following: yields or prices of investments of comparable quality, type of issue, coupon, maturity and rating, market quotes or indications of value from security dealers, evaluations of anticipated cash flows or collateral, general market conditions and other information and analysis, including the obligor’s credit characteristics considered relevant. To the extent the inputs are observable and timely, the values would be classified as Level 2 of the fair value hierarchy; otherwise they would be classified as Level 3.
The following table summarizes the market value of the Funds’ investments as of the end of the reporting period, based on the inputs used to value them:
| | | | | | | | | | | | | | | | |
| JGH | | Level 1 | | | Level 2 | | | Level 3 | | | Total | |
Long-Term Investments*: | | | | | | | | | | | | | | | | |
Corporate Bonds | | $ | — | | | $ | 344,156,726 | | | $ | — | | | $ | 344,156,726 | |
Sovereign Debt | | | — | | | | 62,015,686 | | | | — | | | | 62,015,686 | |
Variable Rate Senior Loan Interests | | | — | | | | 55,593,471 | | | | — | | | | 55,593,471 | |
$1,000 Par (or similar) Institutional Preferred | | | — | | | | 35,682,568 | | | | — | | | | 35,682,568 | |
Contingent Capital Securities | | | — | | | | 33,023,073 | | | | — | | | | 33,023,073 | |
$25 Par (or similar) Retail Preferred | | | 5,949,110 | | | | — | | | | — | | | | 5,949,110 | |
| | | | |
Short-Term Investments: | | | | | | | | | | | | | | | | |
Repurchase Agreements | | | — | | | | 23,650,031 | | | | — | | | | 23,650,031 | |
| | | | |
Investments in Derivatives: | | | | | | | | | | | | | | | | |
Interest Rate Swaps** | | | — | | | | (6,059,470 | ) | | | — | | | | (6,059,470 | ) |
Total | | $ | 5,949,110 | | | $ | 548,062,085 | | | $ | — | | | $ | 554,011,195 | |
56
| | | | | | | | | | | | | | | | |
| NPCT | | Level 1 | | | Level 2 | | | Level 3 | | | Total | |
Long-Term Investments*: | | | | | | | | | | | | | | | | |
Corporate Bonds | | $ | — | | | $ | 253,838,756 | | | $ | — | | | $ | 253,838,756 | |
$1,000 Par (or similar) Institutional Preferred | | | — | | | | 31,250,683 | | | | — | | | | 31,250,683 | |
Mortgage-Backed Securities | | | — | | | | 39,461,232 | | | | — | | | | 39,461,232 | |
$25 Par (or similar) Retail Preferred | | | 9,812,407 | | | | 5,054,000 | *** | | | — | | | | 14,866,407 | |
Variable Rate Senior Loan Interests | | | — | | | | 11,870,818 | | | | — | | | | 11,870,818 | |
Sovereign Debt | | | — | | | | 7,727,000 | | | | — | | | | 7,727,000 | |
Asset-Backed Securities | | | — | | | | 7,633,770 | | | | — | | | | 7,633,770 | |
Municipal Bonds | | | — | | | | 5,203,605 | | | | — | | | | 5,203,605 | |
| | | | |
Short-Term Investments: | | | | | | | | | | | | | | | | |
Repurchase Agreements | | | — | | | | 223,642,294 | | | | — | | | | 223,642,294 | |
| | | | |
Investments in Derivatives: | | | | | | | | | | | | | | | | |
Cross Currency Swaps** | | | — | | | | 192,988 | | | | — | | | | 192,988 | |
Total | | $ | 9,812,407 | | | $ | 585,875,146 | | | $ | — | | | $ | 595,687,553 | |
| | | | |
| JLS | | | | | | | | | | | | |
Long-Term Investments*: | | | | | | | | | | | | | | | | |
Mortgage-Backed Securities | | $ | — | | | $ | 106,862,141 | | | $ | — | | | $ | 106,862,141 | |
Asset-Backed Securities | | | — | | | | 55,004,977 | | | | — | | | | 55,004,977 | |
| | | | |
Short-Term Investments: | | | | | | | | | | | | | | | | |
U.S. Government And Agency Obligations | | | — | | | | 1,664,000 | | | | — | | | | 1,664,000 | |
Total | | $ | — | | | $ | 163,531,118 | | | $ | — | | | $ | 163,531,118 | |
| * | Refer to the Fund’s Portfolio of Investments for industry and country classifications, where applicable. |
| ** | Represents net unrealized appreciation (depreciation) as reported in the Fund’s Portfolio of Investments. |
| *** | Refer to the Fund’s Portfolio of Investments for securities classified as Level 2. |
4. Portfolio Securities and Investments in Derivatives
Portfolio Securities
Unfunded Commitments for JGH and NPCT
Pursuant to the terms of certain of the variable rate senior loan agreements, JGH and NPCT may have unfunded senior loan commitments. Each Fund will maintain with its custodian, cash, liquid securities and/or liquid senior loans having an aggregate value at least equal to the amount of unfunded senior loan commitments. As of the end of the reporting period, JGH and NPCT had no such outstanding unfunded senior loan commitments.
Participation Commitments for JGH and NPCT
With respect to the senior loans held in JGH’s and NPCT’s portfolio, the Funds may: 1) invest in assignments; 2) act as a participant in primary lending syndicates; or 3) invest in participations. If a Fund purchases a participation of a senior loan interest, the Fund would typically enter into a contractual agreement with the lender or other third party selling the participation, rather than directly with the borrower. As such, the Fund not only assumes the credit risk of the borrower, but also that of the selling participant or other persons interpositioned between the Fund and the borrower. As of the end of the reporting period, JGH and NPCT had no such outstanding participation commitments.
Repurchase Agreements
In connection with transactions in repurchase agreements, it is the Funds’ policy that its custodian take possession of the underlying collateral securities, the fair value of which exceeds the principal amount of the repurchase transaction, including accrued interest, at all times. If the counterparty defaults, and the fair value of the collateral declines, realization of the collateral may be delayed or limited.
The following table presents the repurchase agreements for the Funds that are subject to netting agreements as of the end of the reporting period, and the collateral delivered related to those repurchase agreements.
| | | | | | | | | | |
| Fund | | Counterparty | | Short-Term
Investments, at Value | | | Collateral
Pledged (From)
Counterparty | |
| JGH | | Fixed Income Clearing Corporation | | $ | 23,650,031 | | | $ | (24,123,084 | ) |
NPCT | | Fixed Income Clearing Corporation | | | 223,642,294 | | | | (228,115,149 | ) |
57
Notes to Financial Statements (continued)
(Unaudited)
Zero Coupon Securities
A zero coupon security does not pay a regular interest coupon to its holders during the life of the security. Income to the holder of the security comes from accretion of the difference between the original purchase price of the security at issuance and the par value of the security at maturity and is effectively paid at maturity. The market prices of zero coupon securities generally are more volatile than the market prices of securities that pay interest periodically.
Investment Transactions
Long-term purchases and sales (including maturities) during the current fiscal period were as follows:
| | | | | | | | | | | | |
| | | JGH | | | NPCT | | | JLS | |
Purchases | | $ | 263,435,256 | | | $ | 385,561,304 | | | $ | 53,310,223 | |
Sales and maturities | | | 259,439,204 | | | | 19,866,368 | | | | 62,517,806 | |
The Funds may purchase securities on a when-issued or delayed-delivery basis. Securities purchased on a when-issued or delayed-delivery basis may have extended settlement periods; interest income is not accrued until settlement date. Any securities so purchased are subject to market fluctuation during this period. The Funds have earmarked securities in their portfolio with a current value at least equal to the amount of the when-issued/delayed-delivery purchase commitments. If a Fund has outstanding when-issued/delayed-delivery purchases commitments as of the end of the reporting period, such amounts are recognized on the Statement of Assets and Liabilities.
Investments in Derivatives
Each Fund is authorized to invest in certain derivative instruments, such as futures, options and swap contracts. Each Fund limits its investments in futures, options on futures and swap contracts to the extent necessary for the Adviser to claim the exclusion from registration by the Commodity Futures Trading Commission as a commodity pool operator with respect to the Fund. The Funds record derivative instruments at fair value, with changes in fair value recognized on the Statement of Operations, when applicable. Even though the Funds’ investments in derivatives may represent economic hedges, they are not considered to be hedge transactions for financial reporting purposes.
Interest Rate Swap Contracts
Interest rate swap contracts involve a Fund’s agreement with the counterparty to pay or receive a fixed rate payment in exchange for the counterparty receiving or paying a variable rate payment. Forward interest rate swap contracts involve a Fund’s agreement with a counterparty to pay, in the future, a fixed or variable rate payment in exchange for the counterparty paying the Fund a variable or fixed rate payment, the accruals for which would begin at a specified date in the future (the “effective date”).
The amount of the payment obligation for an interest rate swap is based on the notional amount and the termination date of the contract. Interest rate swap contracts do not involve the delivery of securities or other underlying assets or principal. Accordingly, the risk of loss with respect to the swap counterparty on such transactions is limited to the net amount of interest payments that the Fund is to receive.
Interest rate swap contracts are valued daily. Upon entering into an interest rate swap contract (and beginning on the effective date for a forward interest rate swap contract), the Fund accrues the fixed rate payment expected to be paid or received and the variable rate payment expected to be received or paid on the interest rate swap contracts on a daily basis, and recognizes the daily change in the fair value of the Fund’s contractual rights and obligations under the contracts. For an over-the-counter (“OTC”) swap that is not cleared through a clearing house (“OTC Uncleared”), the amount recorded on these transactions is recognized on the Statement of Assets and Liabilities as a component of “Unrealized appreciation or depreciation on swaps.”
Upon the execution of an OTC swap cleared through a clearing house (“OTC Cleared”), the Fund is obligated to deposit cash or eligible securities, also known as “initial margin,” into an account at its clearing broker equal to a specified percentage of the contract amount. Cash deposited by the Fund to cover initial margin requirements on open swap contracts, if any, is recognized as a component of “Cash collateral at brokers for investments in swaps” on the Statement of Assets and Liabilities. Investments in OTC Cleared swaps obligate the Fund and the clearing broker to settle monies on a daily basis representing changes in the prior day’s “mark-to-market” of the swap contract. If the Fund has unrealized appreciation, the clearing broker will credit the Fund’s account with an amount equal to the appreciation. Conversely, if the Fund has unrealized depreciation, the clearing broker will debit the Fund’s account with an amount equal to the depreciation. These daily cash settlements are also known as “variation margin.” Variation margin for OTC Cleared swaps is recognized as a receivable and/or payable for “Variation margin on swap contracts” on the Statement of Assets and Liabilities. Upon the execution of an OTC Uncleared swap, neither the Fund nor the counterparty is required to deposit initial margin as the trades are recorded bilaterally between both parties to the swap contract, and the terms of the variation margin are subject to a predetermined threshold negotiated by the Fund and the counterparty. Variation margin for OTC Uncleared swaps is recognized as a component of “Unrealized appreciation or depreciation on interest rate swaps” as described in the preceding paragraph.
58
The net amount of periodic payments settled in cash are recognized as a component of “Net realized gain (loss) from swaps” on the Statement of Operations, in addition to the net realized gain or loss recorded upon the termination of the swap contract. For tax purposes, payments expected to be received or paid on the swap contracts are treated as ordinary income or expense, respectively. Changes in the value of the swap contracts during the fiscal period are recognized as a component of “Change in net unrealized appreciation (depreciation) of swaps” on the Statement of Operations. In certain instances, payments are made or received upon entering into the swap contract to compensate for differences between the stated terms of the swap agreements and prevailing market conditions (credit spreads, currency exchange rates, interest rates, and other relevant factors). Payments received or made at the beginning of the measurement period, if any, are recognized as “Interest rate swaps premiums received and/or paid” on the Statement of Assets and Liabilities.
During the current fiscal period, JGH continued to use interest rate swap contracts to partially hedge its future interest cost of leverage, which is through the use of bank borrowings.
Cross Currency Swap Contracts
NPCT uses cross currency swap contracts to gain or mitigate exposure to foreign exchange markets. A cross currency swap is an agreement between two parties to exchange two different currencies with the understanding that the exchange will be reversed at a later date at specified exchange rates.
Risks may arise upon entering into these contracts from the potential of default by counterparty and, depending on their terms, may be subject to foreign exchange risk.
Cross currency swap contracts are valued daily. Upon entering into a cross currency swap contract the exchange of currencies takes place at the current spot rate. For an OTC Uncleared swap not cleared through a clearing house, the amount recorded on these transactions is recognized on the Statement of Assets and Liabilities as a component of “Unrealized appreciation or deprecation on cross currency swaps.”
Upon the execution of an OTC Cleared swap, the Fund is obligated to deposit cash or eligible securities, also known as “initial margin,” into an account at its clearing broker equal to a specified percentage of the contract amount. Cash held by the broker to cover initial margin requirements on open swap contracts, if any, is recognized as “Cash collateral at brokers for investments in swaps” on the Statement of Assets and Liabilities. Investments in OTC Cleared swaps obligate a Fund and the clearing broker to settle monies on a daily basis representing changes in the prior day’s “mark-to-market” of the swap. If a Fund has unrealized appreciation, the clearing broker would credit the Fund’s account with an amount equal to the appreciation and conversely if a Fund has unrealized depreciation, the clearing broker will debit a Fund’s account with an amount equal to the depreciation. These daily cash settlements are also known as “variation margin.” Variation margin for OTC Cleared swaps is recognized as a receivable and/or payable for “Variation margin on swap contracts” on the Statement of Assets and Liabilities. Upon the execution of an OTC Uncleared swap, neither the Fund nor the counterparty is required to deposit initial margin as the trades are recorded bilaterally between both parties to the swap contract, and the terms of the variation margin are subject to a predetermined threshold negotiated by the Fund and the counterparty. Variation margin for OTC Uncleared swaps is recognized as a component of “Unrealized appreciation or depreciation on cross currency swaps” as described in the preceding paragraph.
Interest payments, if applicable, are made between the parties based on interest rates available in the two currencies at the inception of the contract and recognized as a component of “Realized gain (loss) from swaps” on the Statement of Operations, in addition to the net realized gain or loss recorded upon the termination of the swap contract. At maturity, the re-exchange may take place at the same exchange rate, a specified rate, or the then current spot rate. Changes in value of the swap contracts during the fiscal period are recognized as a component of “Change in unrealized appreciation (depreciation) of swaps” on the Statement of the Operations. In certain instances, payments are made or received upon entering into the swap contract to compensate for differences between the stated terms of the swap agreements and prevailing market conditions (credit spreads, currency exchange rates, interest rates, and other relevant factors). Payments received or made at the beginning of the measurement period, if any, are recognized as “Cross currency swaps premiums received and/or paid” on the Statement of Assets and Liabilities.
During the current fiscal period, NPCT utilized cross currency swaps to hedge its Euro exposure to U.S. dollars
The average notional amount of each Fund’s respective swap contracts outstanding during the current fiscal period was as follows:
| | | | | | | | |
| | | JGH | | | NPCT | |
Average notional amount of swap contracts outstanding* | | $ | 87,400,000 | | | $ | 8,814,375 | |
| * | The average notional amount is calculated based on the outstanding notional at the beginning of the current fiscal period and at the end of each fiscal quarter within the current fiscal period. |
59
Notes to Financial Statements (continued)
(Unaudited)
The following table presents the fair value of all swap contracts held by JGH and NPCT as of the end of the reporting period, the location of these instruments on the Statement of Assets and Liabilities and the primary underlying risk exposure.
| | | | | | | | | | | | | | | | | | |
| | | | | Location on the Statement of Assets and Liabilities | |
Underlying Risk Exposure | | Derivative Instrument | | Asset Derivatives | | | | | | (Liability) Derivatives | |
| | Location | | Value | | | | | | Location | | Value | |
| JGH | | | | | | | | | | | | | | | | | | |
| Interest rate | | Swaps (OTC Uncleared) | | — | | $ | — | | | | | | | Unrealized depreciation on interest rate swaps** | | $ | (6,059,470 | ) |
| NPCT | | | | | | | | | | | | | | | | | | |
| Foreign currency exchange rate | | Swaps (OTC Uncleared) | | Unrealized appreciation on cross currency swaps** | | $ | 192,988 | | | | | | | — | | $ | — | |
| ** | Some swaps contracts require a counterparty to pay or receive a premium, which is disclosed on the Statement of Assets and Liabilities, when applicable, and is not reflected in the cumulative unrealized appreciation (depreciation) presented above. |
The following table presents the swap contracts subject to netting agreements and the collateral delivered related to those swap contracts as of the end of the reporting period.
| | | | | | | | | | | | | | | | | | | | | | | | | | |
| | | | | | | | | | | | | | Gross Amount Net Offset on the
Statement of Assets and Liabilities | | | | |
| Fund | | Counterparty | | Gross
Unrealized
Appreciation
on Swaps*** | | | Gross
Unrealized
(Depreciation)
on Swaps*** | | | Net
Unrealized
Appreciation
(Depreciation)
on Swaps*** | | | Swaps
Premiums
Paid
(Received) | | | Collateral
Pledged
to (from)
Counterparty | | | Net
Exposure | |
| JGH | | Morgan Stanley Capital Services LLC | | $ | — | | | $ | (6,059,470 | ) | | $ | (6,059,470 | ) | | $ | — | | | $ | 5,933,180 | | | $ | (126,290 | ) |
| NPCT | | Citibank N.A. | | $ | 30,283 | | | $ | — | | | $ | 30,283 | | | $ | 24,565 | | | $ | — | | | $ | — | |
| NPCT | | Morgan Stanley Capital Services LLC | | | 162,705 | | | | — | | | | 162,705 | | | | 4,250 | | | | — | | | | — | |
| | | | | $ | 192,988 | | | $ | — | | | $ | 192,988 | | | $ | 28,815 | | | $ | — | | | $ | — | |
| *** | Represents gross unrealized appreciation (depreciation) for the counterparty as reported in the Fund’s Portfolio of Investments. |
The following table presents the amount of net realized gain (loss) and change in net unrealized appreciation (depreciation) recognized on swap contracts on the Statement of Operations during the current fiscal period, and the primary underlying risk exposure.
| | | | | | | | | | | | |
| Fund | | Underlying
Risk Exposure | | Derivative
Instrument | | Net Realized
Gain (Loss)
from Swaps | | | Change in Net
Unrealized
Appreciation
(Depreciation)
of Swaps | |
| JGH | | Interest rate | | Swaps | | $ | (815,092 | ) | | $ | 2,733,418 | |
| NPCT | | Foreign currency exchange rate | | Swaps | | | 31 | | | | 192,988 | |
Market and Counterparty Credit Risk
In the normal course of business each Fund may invest in financial instruments and enter into financial transactions where risk of potential loss exists due to changes in the market (market risk) or failure of the other party to the transaction to perform (counterparty credit risk). The potential loss could exceed the value of the financial assets recorded on the financial statements. Financial assets, which potentially expose each Fund to counterparty credit risk, consist principally of cash due from counterparties on forward, option and swap transactions, when applicable. The extent of each Fund’s exposure to counterparty credit risk in respect to these financial assets approximates its carrying value as recorded on the Statement of Assets and Liabilities.
Each Fund helps manage counterparty credit risk by entering into agreements only with counterparties the Adviser believes have the financial resources to honor their obligations and by having the Adviser monitor the financial stability of the counterparties. Additionally, counterparties may be required to pledge collateral daily (based on the daily valuation of the financial asset) on behalf of each Fund with a value approximately equal to the amount of any unrealized gain above a pre-determined threshold. Reciprocally, when each Fund has an unrealized loss, the Funds have instructed the custodian to pledge assets of the Funds as collateral with a value approximately equal to the amount of the unrealized loss above a pre-determined threshold. Collateral pledges are monitored and subsequently adjusted if and when the valuations fluctuate, either up or down, by at least the pre-determined threshold amount.
60
5. Fund Shares
Common Share Transactions
Transactions in common shares during the Funds’ current and prior fiscal period, where applicable, were as follows:
| | | | |
| | | NPCT* | |
| | | For the period 4/27/21
(commencement of operations)
through 6/30/21 | |
Common shares: | | | | |
Sold | | | 28,750,000 | |
| * | Prior to the commencement of operations, the Adviser purchased 5,000 shares, which are still held as of the end of the current fiscal period. |
6. Income Tax Information
Each Fund is a separate taxpayer for federal income tax purposes. Each Fund intends to distribute substantially all of its net investment company taxable income to common shareholders and to otherwise comply with the requirements of Subchapter M of the Internal Revenue Code applicable to regulated investment companies. In any year when JGH realizes net capital gains, the Fund may choose to distribute all or a portion of its net capital gains to common shareholders, or alternatively, to retain all or a portion of its net capital gains and pay federal corporate income taxes on such retained gains.
For all open tax years and all major taxing jurisdictions, management of the Funds have concluded that there are no significant uncertain tax positions that would require recognition in the financial statements. Open tax years are those that are open for examination by taxing authorities (i.e., generally the last four tax year ends and the interim tax period since then). Furthermore, management of the Funds is also not aware of any tax positions for which it is reasonably possible that the total amounts of unrecognized tax benefits will significantly change in the next twelve months.
The following information is presented on an income tax basis. Differences between amounts for financial statement and federal income tax purposes are primarily due to recognition of market discount accretion on investments, recognition of premium amortization and timing differences in recognizing certain gains and losses on investment transactions. To the extent that differences arise that are permanent in nature, such amounts are reclassified within the capital accounts as detailed below. Temporary differences do not require reclassification. Temporary and permanent differences do not impact the NAV of the Funds.
The table below presents the cost and unrealized appreciation (depreciation) of each Fund’s investment portfolio, as determined on a federal income tax basis, as of June 30, 2021.
For purposes of this disclosure, derivative tax cost is generally the sum of any upfront fees or premiums exchanged and any amounts unrealized for income statement reporting but realized in income and/or capital gains for tax reporting. If a particular derivative category does not disclose any tax unrealized appreciation or depreciation, the change in value of those derivatives have generally been fully realized for tax purposes.
| | | | | | | | | | | | |
| | | JGH | | | NPCT | | | JLS | |
Tax cost of investments | | $ | 541,759,215 | | | $ | 589,348,792 | | | $ | 161,519,267 | |
Gross unrealized: | | | | | | | | | | | | |
Appreciation | | $ | 23,505,298 | | | $ | 6,764,382 | | | | 3,603,618 | |
Depreciation | | | (11,253,318 | ) | | | (399,698 | ) | | | (1,591,767 | ) |
Net unrealized appreciation (depreciation) of investments | | $ | 12,251,980 | | | $ | 6,364,684 | | | $ | 2,011,851 | |
Permanent differences, primarily due to treatment of notional principal contracts, complex securities character adjustments, investments in MBS, paydowns, and bond premium amortization adjustments, resulted in reclassifications among the Funds’ components of net assets as of December 31, 2020, the Funds’ last tax year end. The tax components of undistributed net ordinary income and net long-term capital gains as of December 31, 2020, the Funds’ last tax year end, were as follows: | |
| | | | | | JGH | | | JLS | |
Undistributed net ordinary income | | | | | | $ | — | | | $ | — | |
Undistributed net long-term capital gains | | | | | | | — | | | | — | |
61
Notes to Financial Statements (continued)
(Unaudited)
| | | | | | | | | | | | |
| The tax character of distributions paid during the Funds’ last tax year ended December 31, 2020 was designated for purposes of the dividends paid deduction as follows: | |
| | | | | | JGH | | | JLS | |
Distributions from net ordinary income¹ | | | | | | $ | 24,735,572 | | | $ | 4,012,755 | |
Distributions from net long-term capital gains | | | | | | | — | | | | — | |
Return of capital | | | | | | | 956,568 | | | | 1,342,986 | |
|
1 Net ordinary income consists of net taxable income derived from dividends, interest, and net short-term capital gains, if any. | |
|
| As of December 31, 2020, the Funds’ last tax year end, the following Funds had unused capital losses carrying forward available for federal income tax purposes to be applied against future capital gains, if any. The capital losses are not subject to expiration. | |
| | | | | | JGH | | | JLS | |
Not subject to expiration: | | | | | | | | | | | | |
Short-term | | | | | | $ | 29,592,860 | | | $ | 2,128,740 | |
Long-term | | | | | | | 82,025,895 | | | | — | |
Total | | | | | | $ | 111,618,755 | | | $ | 2,128,740 | |
7. Management Fees and Other Transactions with Affiliates
Each Fund’s management fee compensates the Adviser for overall investment advisory and administrative services and general office facilities. The Sub-Adviser is compensated for its services to the Funds from the management fees paid to the Adviser.
Each Fund’s management fee consists of two components – a fund-level fee, based only on the amount of assets within each individual Fund, and a complex-level fee, based on the aggregate amount of all eligible fund assets managed by the Adviser. This pricing structure enables Fund shareholders to benefit from growth in the assets within their respective Fund as well as from growth in the amount of complex-wide assets managed by the Adviser.
The annual fund-level fee, payable monthly, for each Fund is calculated according to the following schedule:
| | | | | | | | |
| | | JGH | | | NPCT | |
| Average Daily Managed Assets | | Fund-Level Fee Rate | | | Fund-Level Fee Rate | |
For the first $500 million | | | 0.7000 | % | | | 0.8000 | % |
For the next $500 million | | | 0.6750 | | | | 0.7750 | |
For the next $500 million | | | 0.6500 | | | | 0.7500 | |
For the next $500 million | | | 0.6250 | | | | 0.7250 | |
For managed assets over $2 billion | | | 0.6000 | | | | 0.7000 | |
| | | | |
| | | JLS | |
| Average Daily Managed Assets1 | | Fund-Level Fee Rate | |
For the first $125 million | | | 0.8000 | % |
For the next $125 million | | | 0.7875 | |
For the next $150 million | | | 0.7750 | |
For the next $600 million | | | 0.7625 | |
For managed assets over $1 billion | | | 0.7500 | |
62
The annual complex-level fee, payable monthly, for each Fund is calculated by multiplying the current complex-wide fee rate, determined according to the following schedule by the Fund’s daily managed assets:
| | | | |
| Complex-Level Eligible Asset Breakpoint Level2 | | Effective Complex-Level Fee Rate at Breakpoint Level | |
$55 billion | | | 0.2000 | % |
$56 billion | | | 0.1996 | |
$57 billion | | | 0.1989 | |
$60 billion | | | 0.1961 | |
$63 billion | | | 0.1931 | |
$66 billion | | | 0.1900 | |
$71 billion | | | 0.1851 | |
$76 billion | | | 0.1806 | |
$80 billion | | | 0.1773 | |
$91 billion | | | 0.1691 | |
$125 billion | | | 0.1599 | |
$200 billion | | | 0.1505 | |
$250 billion | | | 0.1469 | |
$300 billion | | | 0.1445 | |
| 1 | “Managed assets” means the total assets of the Fund, minus the sum of its accrued liabilities (other than the Fund liabilities incurred for the express purpose of creating effective leverage). Total assets for this purpose shall include assets attributable to the Fund’s use of effective leverage (whether or not those assets are reflected in the Fund’s financial statements for the purposes of U.S. GAAP). |
| 2 | For the complex-level fees, managed assets include closed-end fund assets managed by the Adviser that are attributable to certain types of leverage. For these purposes, leverage includes the fund’s use of preferred stock and borrowings and certain investments in the residual interest certificates (also called inverse floating rate securities) in tender option bond (TOB) trusts, including the portion of assets held by a TOB trust that has been effectively financed by the trust’s issuance of floating rate securities, subject to an agreement by the Adviser as to certain funds to limit the amount of such assets for determining managed assets in certain circumstances. The complex-level fee is calculated based upon the aggregate daily managed assets of all Nuveen open-end and closed-end funds that constitute “eligible assets.” Eligible assets do not include assets attributable to investments in other Nuveen funds or assets in excess of a determined amount (originally $2 billion) added to the Nuveen fund complex in connection with the Adviser’s assumption of the management of the former First American Funds effective January 1, 2011, but do not include certain assets of certain Nuveen funds that were reorganized into funds advised by an affiliate of the Adviser during the 2019 calendar year. As of June 30, 2021, the complex-level fee for each Fund was 0.1539%. |
8. Borrowing Arrangements
Borrowings
JGH and JLS have entered into a borrowing arrangement (“Borrowings”) as a means of leverage.
Borrowings Information for JGH
The Fund has entered into a 364-day revolving line of credit. As of the end of the reporting period, the Fund’s maximum commitment amount under its Borrowings is as follows:
| | | | |
| | | JGH | |
Maximum commitment amount | | $ | 165,000,000 | |
As of the end of the reporting period, the Fund’s outstanding balance on its Borrowings was as follows:
| | | | |
| | | JGH | |
Outstanding balance on Borrowings | | $ | 159,000,000 | |
Interest is charged on the Borrowings drawn amount at a rate per annum equal to one-month LIBOR (London Inter-Bank Offered Rate) plus 0.70% for LIBOR loans or Federal Funds rate plus 0.80% for Base Rate Loans. The Fund also accrued a 0.15% per annum commitment fee based on the undrawn balance based on the maximum commitment amount of the Borrowings to the extent the unused portion of the Borrowings is less than 50% of the maximum commitment amount otherwise the per annum commitment fee is 0.25%.
During the Fund’s utilization period(s) during the current fiscal period, the average daily balance outstanding (which was for the entire current reporting period) and average annual interest rate on the Fund’s Borrowings were as follows:
| | | | |
| | | JGH | |
Average daily balance outstanding | | $ | 155,013,260 | |
Average annual interest rate | | | 0.82 | % |
Borrowings Information for JLS
The Fund has entered into a committed financing agreement. As of the end of the reporting period, the Fund’s maximum commitment amount under its Borrowings is as follows:
| | | | |
| | | JLS | |
Maximum commitment amount | | $ | 22,500,000 | |
63
Notes to Financial Statements (continued)
(Unaudited)
As of the end of the reporting period, the Fund’s outstanding balance on its Borrowings was as follows:
| | | | |
| | | JLS | |
Outstanding balance on Borrowings | | $ | 12,355,000 | |
Interest is charged on these Borrowings at 3-Month LIBOR (London Inter-Bank Offered Rate) plus 1.50% (2.00% prior to February 18, 2021) per annum on the amount borrowed and 0.50% per annum on the undrawn balance (which was waived for the reporting period) and a one-time upfront fee of 0.222% per annum of the maximum commitment amount.
During the Fund’s utilization period(s) during the current fiscal period, the average daily balance outstanding (which was for the entire current reporting period) and average annual interest rate on the Fund’s Borrowings were as follows:
| | | | |
| | | JLS | |
Average daily balance outstanding | | $ | 13,464,392 | |
Average annual interest rate | | | 1.87 | % |
Other Borrowings Information for the Funds
In order to maintain their Borrowings, the Funds must meet certain collateral, asset coverage and other requirements. Each Fund’s Borrowings outstanding is fully secured by eligible securities held in its portfolio of investments.
Each Fund’s Borrowings outstanding is recognized as “Borrowings” on the Statement of Assets and Liabilities. Interest expense incurred on the borrowed amount, undrawn balance and initial fees are recognized as a component of “Interest expense and amortization of offering costs” on the Statement of Operations.
Rehypothecation
JLS has entered into a Rehypothecation Side Letter (“Side Letter”) with its prime brokerage lender, allowing it to re-register the Pledged Collateral in its own name or in a name other than the Fund’s to pledge, repledge, hypothecate, rehyphothecate, sell, lend or otherwise transfer or use the Pledged Collateral (the “Hypothecated Securities”) with all rights of ownership as described in the Side Letter. Subject to certain conditions, the total value of the outstanding Hypothecated Securities shall not exceed the lesser of (i) 98% of the outstanding balance on the Borrowings to which the Pledged Collateral relates and (ii) 331/3% of the Fund’s total assets. The Fund may designate any Pledged Collateral as ineligible for rehypothecation. The Fund may also recall Hypothecated Securities on demand.
The Fund also has the right to apply and set-off an amount equal to one-hundred percent (100%) of the then-current fair market value of such Pledged Collateral against the current Borrowings under the Side Letter in the event that prime brokerage lender fails to timely return the Pledged Collateral and in certain other circumstances. In such circumstances, however, the Fund may not be able to obtain replacement financing required to purchase replacement securities and, consequently, the Fund’s income generating potential may decrease. Even if the Fund is able to obtain replacement financing, it might not be able to purchase replacement securities at favorable prices.
The Fund will receive a fee in connection with the Hypothecated Securities (“Rehypothecation Fees”) in addition to any principal, interest, dividends and other distributions paid on the Hypothecated Securities.
As of the end of the reporting period, the Fund had Hypothecated Securities totaling $7,162,522. During the current fiscal period, the Fund earned Rehypothecation Fees of $2,766, which is recognized as “Rehypothecation income” on the Statement of Operations.
Reverse Repurchase Agreements for JLS
JLS has entered into reverse repurchase agreements as a means of leverage.
The Fund may enter into a reverse repurchase agreement with brokers, dealers, banks or other financial institutions that have been determined by the Adviser to be creditworthy. In a reverse repurchase agreement, a Fund sells to the counterparty a security that it holds with a contemporaneous agreement to repurchase the same security at an agreed-upon price and date, reflecting the interest rate effective for the term of the agreement. It may also be viewed as the borrowing of money by the Fund. Cash received in exchange for securities delivered, plus accrued interest payments to be made by the Fund to a counterparty, are reflected as a liability on the Statement of Assets and Liabilities. Interest payments made by the Fund to counterparties are recognized as a component of “Interest expense and amortization of offering costs” on the Statement of Operations.
In a reverse repurchase agreement, the Fund retains the risk of loss associated with the sold security. In order to minimize risk, the Fund pledges and/or segregates securities and cash as collateral with a fair value at least equal to its purchase obligations under these agreements (including accrued interest). Reverse repurchase agreements also involve the risk that the purchaser fails to return the securities as agreed upon, files for bankruptcy or becomes insolvent. Upon a bankruptcy or insolvency of a counterparty, the Fund is considered to be an unsecured creditor with respect to excess collateral and as such the return of excess collateral may be delayed. A Fund will pledge assets determined to be liquid by the Adviser to cover its obligations under reverse repurchase agreements.
64
As of the end of the reporting period, the Fund’s outstanding balances on its reverse repurchase agreement were as follows:
| | | | | | | | | | | | | | | | | | | | |
| Counterparty | | Coupon | | | Principal
Amount | | | Maturity | | | Value | | | Value and
Accrued Interest | |
Morgan Stanley Bank, N.A. | | | 1.08% | | | $ | (9,049,000 | ) | | | 9/2/21 | | | $ | (9,049,000 | ) | | $ | (9,056,011 | ) |
Royal Bank of Canada | | | 1.08% | | | | (12,170,000 | ) | | | 7/15/21 | | | | (12,170,000 | ) | | | (12,196,610 | ) |
Societe Generale | | | 1.18% | | | | (5,079,000 | ) | | | 7/15/21 | | | | (5,079,000 | ) | | | (5,091,858 | ) |
| | | | | | | $ | (26,298,000 | ) | | | | | | $ | (26,298,000 | ) | | $ | (26,344,479 | ) |
During the current fiscal period, the average daily balance outstanding and average interest rate on the Fund’s reverse repurchase agreement were as follows:
| | | | |
| | | JLS | |
Utilization period (days outstanding) | | | 181 | |
Average daily balance outstanding | | $ | 25,443,005 | |
Weighted average interest rate | | | 1.26 | % |
The following table presents the reverse repurchase agreements subject to netting agreements and the collateral delivered related to those reverse repurchase agreements.
| | | | | | | | |
| Counterparty | | Reverse
Repurchase
Agreements* | | | Collateral
Pledged to
Counterparty | |
Morgan Stanley Bank, N.A. | | $ | (9,056,011 | ) | | $ | (12,465,714 | ) |
Royal Bank of Canada | | | (12,196,610 | ) | | | (16,047,948 | ) |
Societe Generale | | | (5,091,858 | ) | | | (6,851,142 | ) |
| * | Represents gross value and accrued interest for the counterparty as reported in the preceding table. |
Inter-Fund Borrowing and Lending
The SEC has granted an exemptive order permitting registered open-end and closed-end Nuveen funds to participate in an inter-fund lending facility whereby the Nuveen funds may directly lend to and borrow money from each other for temporary purposes (e.g., to satisfy redemption requests or when a sale of securities “fails,” resulting in an unanticipated cash shortfall) (the “Inter-Fund Program”). The closed-end Nuveen funds, including the Fund covered by this shareholder report, will participate only as lenders, and not as borrowers, in the Inter-Fund Program because such closed-end funds rarely, if ever, need to borrow cash to meet redemptions. The Inter-Fund Program is subject to a number of conditions, including, among other things, the requirements that (1) no fund may borrow or lend money through the Inter-Fund Program unless it receives a more favorable interest rate than is typically available from a bank or other financial institution for a comparable transaction; (2) no fund may borrow on an unsecured basis through the Inter-Fund Program unless the fund’s outstanding borrowings from all sources immediately after the inter-fund borrowing total 10% or less of its total assets; provided that if the borrowing fund has a secured borrowing outstanding from any other lender, including but not limited to another fund, the inter-fund loan must be secured on at least an equal priority basis with at least an equivalent percentage of collateral to loan value; (3) if a fund’s total outstanding borrowings immediately after an inter-fund borrowing would be greater than 10% of its total assets, the fund may borrow through the inter-fund loan on a secured basis only; (4) no fund may lend money if the loan would cause its aggregate outstanding loans through the Inter-Fund Program to exceed 15% of its net assets at the time of the loan; (5) a fund’s inter-fund loans to any one fund shall not exceed 5% of the lending fund’s net assets; (6) the duration of inter-fund loans will be limited to the time required to receive payment for securities sold, but in no event more than seven days; and (7) each inter-fund loan may be called on one business day’s notice by a lending fund and may be repaid on any day by a borrowing fund. In addition, a Nuveen fund may participate in the Inter-Fund Program only if and to the extent that such participation is consistent with the fund’s investment objective and investment policies. The Board is responsible for overseeing the Inter-Fund Program.
The limitations detailed above and the other conditions of the SEC exemptive order permitting the Inter-Fund Program are designed to minimize the risks associated with Inter-Fund Program for both the lending fund and the borrowing fund. However, no borrowing or lending activity is without risk. When a fund borrows money from another fund, there is a risk that the loan could be called on one day’s notice or not renewed, in which case the fund may have to borrow from a bank at a higher rate or take other actions to payoff such loan if an inter-fund loan is not available from another fund. Any delay in repayment to a lending fund could result in a lost investment opportunity or additional borrowing costs.
During the current reporting period, none of the Funds covered by this shareholder report have entered into any inter-fund loan activity.
9. Subsequent Events
Reverse Repurchase Agreements for NPCT
Subsequent to the close of the reporting period, NPCT entered into reverse repurchase agreements as a means of leverage.
65
Risk Considerations (Unaudited)
Fund shares are not guaranteed or endorsed by any bank or other insured depository institution and are not federally insured by the Federal Deposit Insurance Corporation.
Nuveen Global High Income Fund (JGH)
Investing in closed-end funds involves risk; principal loss is possible. There is no guarantee the Fund’s investment objectives will be achieved. Closed-end fund shares may frequently trade at a discount or premium to their net asset value. Debt or fixed income securities such as those held by the Fund, are subject to market risk, credit risk, interest rate risk, derivatives risk, liquidity risk, and income risk. As interest rates rise, bond prices fall. Lower credit debt securities may be more likely to fail to make timely interest or principal payments. Foreign investments involve additional risks, including currency fluctuation, political and economic instability, lack of liquidity and differing legal and accounting standards. The risks of foreign investments are magnified in emerging markets. Leverage increases return volatility and magnifies the Fund’s potential return and its risks; there is no guarantee a fund’s leverage strategy will be successful. These and other risk considerations such as call risk are described in more detail on the Fund’s web page at www.nuveen.com/JGH.
Nuveen Core Plus Impact Fund (NPCT)
Investing in closed-end funds involves risk; principal loss is possible. There is no guarantee the Fund’s investment objectives will be achieved. Closed-end fund shares may frequently trade at a discount or premium to their net asset value. Because the Impact Criteria and/or Nuveen’s Environmental Social Governance (ESG) investment criteria may exclude investments of certain issuers for non-financial reasons, the Fund may forgo some market opportunities available to funds that do not use these criteria. This may cause the Fund to underperform the market as a whole or other funds that do not use an Impact Criteria or ESG investment strategy or that use a different methodology or different factors to determine an investment’s impact and/or ESG investment criteria. Issuers of debt instruments in which the Fund may invest may default on their obligations to pay principal or interest when due. Investments of below investment grade quality are regarded as having speculative characteristics with respect to the issuer’s capacity to pay interest and repay principal, and may be subject to higher price volatility and default risk than investment grade investments of comparable terms and duration. Non-U.S. investments involve risks such as currency fluctuation, political and economic instability, lack of liquidity and differing legal and accounting standards. These risks are magnified in emerging markets. The values of municipal securities held by the Fund may be adversely affected by local political and economic conditions and developments. Leverage increases return volatility and magnifies the Fund’s potential return and its risks; there is no guarantee a fund’s leverage strategy will be successful. These and other risk considerations are described in more detail on the Fund’s web page at www.nuveen.com/NPCT.
Nuveen Mortgage and Income Fund (JLS)
Investing in closed-end funds involves risk; principal loss is possible. There is no guarantee the Fund’s investment objectives will be achieved. Closed-end fund shares may frequently trade at a discount or premium to their net asset value. Investing in mortgage-backed securities entails credit risk, the risk that the servicer fails to perform its duties, liquidity risks, interest rate risks, structure risks, prepayment risk, and geographical concentration risks. Investing in asset-backed securities entails credit risks inherent in the underlying collateral, the risk that the servicer fails to perform its duties, interest rate risk, liquidity risks and prepayment risk. Leverage increases return volatility and magnifies the Fund’s potential return and its risks; there is no guarantee a fund’s leverage strategy will be successful. These and other risk considerations are described in more detail on the Fund’s web page at www.nuveen.com/JLS.
66
Additional Fund Information (Unaudited)
| | | | | | | | | | |
| Board of Trustees | | | | | | | | | | |
| Jack B. Evans | | William C. Hunter | | Amy B. R. Lancellotta | | Joanne T. Medero | | Albin F. Moschner | | John K. Nelson |
| Judith M. Stockdale | | Carole E. Stone | | Matthew Thornton III | | Terence J. Toth | | Margaret L. Wolff | | Robert L. Young |
| | | | | | | | |
| | | | | |
Investment Adviser Nuveen Fund Advisors, LLC 333 West Wacker Drive Chicago, IL 60606 | | Custodian State Street Bank
& Trust Company
One Lincoln Street Boston, MA 02111 | | Legal Counsel Chapman and Cutler LLP Chicago, IL 60603 | | Independent Registered
Public Accounting Firm PricewaterhouseCoopers LLP
One North Wacker Drive Chicago, IL 60606 | | Transfer Agent and
Shareholder Services Computershare Trust Company, N.A. 150 Royall Street Canton, MA 02021 (800) 257-8787 |
Portfolio of Investments Information
The Fund is required to file its complete schedule of portfolio holdings with the Securities and Exchange Commission (SEC) for the first and third quarters of each fiscal year as an exhibit to its report on Form N-PORT. You may obtain this information on the SEC’s website at http://www.sec.gov.
Nuveen Funds’ Proxy Voting Information
You may obtain (i) information regarding how each fund voted proxies relating to portfolio securities held during the most recent twelve-month period ended June 30, without charge, upon request, by calling Nuveen toll-free at (800) 257-8787 or on Nuveen’s website at www.nuveen.com and (ii) a description of the policies and procedures that each fund used to determine how to vote proxies relating to portfolio securities without charge, upon request, by calling Nuveen toll free at (800) 257-8787. You may also obtain this information directly from the SEC. Visit the SEC on-line at http://www.sec.gov.
CEO Certification Disclosure
The Fund’s Chief Executive Officer (CEO) has submitted to the New York Stock Exchange (NYSE) the annual CEO certification as required by Section 303A.12(a) of the NYSE Listed Company Manual. The Fund has filed with the SEC the certification of its CEO and Chief Financial Officer required by Section 302 of the Sarbanes-Oxley Act.
Common Share Repurchases
The Fund intends to repurchase, through its open-market share repurchase program, shares of its own common stock at such times and in such amounts as is deemed advisable. During the period covered by this report, the Fund repurchased shares of its common stock, as shown in the accompanying table. Any future repurchases will be reported to shareholders in the next annual or semi-annual report.
| | | | | | | | |
| | | JGH | | | JLS | |
Common shares repurchased | | | 0 | | | | 0 | |
FINRA BrokerCheck
The Financial Industry Regulatory Authority (FINRA) provides information regarding the disciplinary history of FINRA member firms and associated investment professionals. This information as well as an investor brochure describing FINRA BrokerCheck is available to the public by calling the FINRA BrokerCheck Hotline number at (800) 289-9999 or by visiting www.FINRA.org.
67
Glossary of Terms Used in this Report
(Unaudited)
| ∎ | | Average Annual Total Return: This is a commonly used method to express an investment’s performance over a particular, usually multi-year time period. It expresses the return that would have been necessary each year to equal the investment’s actual cumulative performance (including change in NAV or market price and reinvested dividends and capital gains distributions, if any) over the time period being considered. |
| ∎ | | Bloomberg Barclays Commercial Mortgage-Backed Securities (CMBS) Aggregate Index: An index that measures the performance of the commercial mortgage-backed securities market. Benchmark returns assume reinvestment of distributions, but do not reflect any applicable sales charges or management fees. |
| ∎ | | Bloomberg Barclays Global High Yield (USD Hedged) Index: An unmanaged index considered representative of fixed-rate, non-investment grade debt of companies in the U.S., developed markets and emerging markets. Benchmark returns assume reinvestment of distributions, but do not reflect any applicable sales charges or management fees. |
| ∎ | | Bloomberg Barclays U.S. Aggregate Bond Index: An unmanaged index that includes all investment grade, publicly issued, fixed rate, dollar denominated, non-convertible debt issues and commercial mortgage backed securities with maturities of at leas.t one year and outstanding par values of $150 million or more. Index returns assume reinvestment of distributions, but do not include the effects of any applicable sales charges or management fees. |
| ∎ | | Commercial Mortgage-Backed Securities (CMBS): Commercial mortgage-backed securities are backed by cash flows of a mortgage or pool of mortgages on commercial real estate. CMBS generally are structured to provide protection to the senior class investors against potential losses on the underlying mortgage loans. CMBS are typically characterized by the following: i) loans on multifamily housing, non-residential property, ii) payments based on the amortization schedule of 25-30 years with a balloon payment due usually after 10 years, and iii) restrictions on prepayments. |
| ∎ | | Contingent Capital Securities (CoCos): CoCos are debt or capital securities of primarily non-U.S. issuers with loss absorption contingency mechanisms built into the terms of the security, for example a mandatory conversion into common stock of the issuer, or a principal write-down, which if triggered would likely cause the CoCos investment to lose value. Loss absorption mechanisms would become effective upon the occurrence of a specified contingency event, or at the discretion of a regulatory body. Specified contingency events, as identified in the CoCo’s governing documents, usually reference a decline in the issuer’s capital below a specified threshold level, and/or certain regulatory events. A loss absorption contingency event for CoCos would likely be the result of, or related to, the deterioration of the issuer’s financial condition and/or its status as a going concern. In such a case, with respect to CoCos that provide for conversion into common stock upon the occurrence of the contingency event, the market price of the issuer’s common stock received by the Acquiring Fund will have likely declined, perhaps substantially, and may continue to decline after conversion. CoCos rated below investment grade should be considered high yield securities, or “junk,” but often are issued by entities whose more senior securities are rated investment grade. CoCos are a relatively new type of security; and there is a risk that CoCo security issuers may suffer the sort of future financial distress that could materially increase the likelihood (or the market’s perception of the likelihood) that an automatic write-down or conversion event on those issuers’ CoCos will occur. Additionally, the trading behavior of a given issuer’s CoCos may be strongly impacted by the trading behavior of other issuers’ CoCos, such that negative information from an unrelated CoCo security may cause a decline in value of one or more CoCos held by the Fund. Accordingly, the trading behavior of CoCos may not follow the trading behavior of other types of debt and preferred securities. Despite these concerns, the prospective reward vs. risk characteristics of at least certain CoCos may be very attractive relative to other fixed-income alternatives. |
68
| ∎ | | Duration: Duration is a measure of the expected period over which a bond’s principal and interest will be paid, and consequently is a measure of the sensitivity of a bond’s or bond fund’s value to changes when market interest rates change. Generally, the longer a bond’s or fund’s duration, the more the price of the bond or fund will change as interest rates change. |
| ∎ | | Effective Leverage: Effective leverage is a fund’s effective economic leverage, and includes both regulatory leverage (see below) and the leverage effects of certain derivative investments in the fund’s portfolio. |
| ∎ | | ICE BofA U.S. ABS & CMBS Index: An index that tracks the performance of U.S. dollar denominated investment grade fixed and floating rate asset backed securities (ABS) and fixed rate commercial mortgage backed securities (CMBS) publicly issued in the U.S. domestic market. Index returns assume reinvestment of distributions, but do not reflect of any applicable sales charges or management fees. |
| ∎ | | Leverage: Leverage is created whenever a fund has investment exposure (both reward and/or risk) equivalent to more than 100% of the investment capital. |
| ∎ | | Mortgage-Backed Securities (MBS): Mortgage-backed securities (MBS) are bonds backed by pools of mortgages, usually with similar characteristics, and which return principal and interest in each payment. MBS are composed of residential mortgages (RMBS) or commercial mortgages (CMBS). RMBS are further divided into agency RMBS and non-agency RMBS, depending on the issuer. |
| ∎ | | Net Asset Value (NAV) Per Share: A fund’s Net Assets is equal to its total assets (securities, cash, accrued earnings and receivables) less its total liabilities. NAV per share is equal to the fund’s Net Assets divided by its number of shares outstanding. |
| ∎ | | NPCT Custom Blended Fund Performance Benchmark |
| | | (60% Bloomberg Barclays MSCI US Green Bond Index and 40% Bloomberg Barclays U.S. High Yield Bond Index): The Bloomberg Barclays MSCI U.S. Green Bond Index measures the performance of USD-denominated fixed-income securities issued to fund projects with direct environmental benefits. The Bloomberg Barclays U.S. Corporate High Yield Bond Index measures the USD-denominated, high yield, fixed-rate corporate bond market. Securities are classified as high yield if the middle rating of Moody’s, Fitch and S&P is Ba1/BB+/BB+ or below. Index returns assume reinvestment of distributions, but do not reflect of any applicable sales charges or management fees. |
| ∎ | | Regulatory Leverage: Regulatory leverage consists of preferred shares issued by or borrowings of a fund. Both of these are part of a fund’s capital structure. Regulatory leverage is subject to asset coverage limits set in the Investment Company Act of 1940. |
| ∎ | | Residential Mortgage-Backed Securities (RMBS): Residential mortgage-backed securities are securities the payments on which depend primarily on the cash flow from residential mortgage loans made to borrowers that are secured by residential real estate. RMBS consist of agency and non-agency RMBS. Agency RMBS have agency guarantees that assure investors that they will receive timely payment of interest and principal, regardless of delinquency or default rates on the underlying loans. Agency RMBS include securities issued by the Government National Mortgage Association, the Federal National Mortgage Association and the Federal Home Loan Mortgage Corporation, and other federal agencies, or issues guaranteed by them. Non-agency RMBS do not have agency guarantees. Non-agency RMBS have credit enhancement built into the structure to shield investors from borrower delinquencies. The spectrum of non-agency residential mortgage loans includes traditional jumbo loans (prime), alternative-A loans (Alt-A), and home equity loans (subprime). |
69
Annual Investment Management Agreement Approval Process
(Unaudited)
The Boards of Trustees (collectively, the “Board” and each Trustee, a “Board Member”) of the Funds, which are comprised entirely of Board Members who are not “interested persons” (as defined under the Investment Company Act of 1940 (the “1940 Act”)) (the “Independent Board Members”), are responsible for determining whether to initially approve or, after an initial term, to renew, the advisory arrangements of their respective Funds. A discussion of the Board’s most recent approval of the renewal of the advisory arrangements of Nuveen Global High Income Fund (the “Global High Income Fund”) and Nuveen Mortgage and Income Fund (the “Mortgage and Income Fund”) is set forth in Part I below. The advisory arrangements of Nuveen Core Plus Impact Fund (the “Core Plus Impact Fund”) have not yet been up for renewal. A discussion of the Board’s initial approval of the advisory arrangements of the Core Plus Impact Fund is set forth in Part II below.
PART I
Nuveen Global High Income Fund
Nuveen Mortgage and Income Fund
At a meeting held on May 25-27, 2021 (the “May Meeting”), the Board approved, for its respective Fund, the renewal of the management agreement (for purposes of this Part I, each, an “Investment Management Agreement”) with Nuveen Fund Advisors, LLC (the “Adviser”), pursuant to which the Adviser serves as the investment adviser to such Fund and the sub-advisory agreement (for purposes of this Part I, each, a “Sub-Advisory Agreement”) with (a) in the case of the Global High Income Fund, Nuveen Asset Management, LLC (“NAM”), pursuant to which NAM serves as the investment sub-adviser to such Fund; and (b) in the case of the Mortgage and Income Fund, Teachers Advisors, LLC (“TAL,” and NAM and TAL are each, a “Sub-Adviser”), pursuant to which TAL serves as the investment sub-adviser to such Fund. For purposes of this Part I, the Global High Income Fund and the Mortgage and Income Fund are the “Funds” and each, a “Fund.” Although the 1940 Act requires that continuances of the Advisory Agreements (as defined below) be approved by the in-person vote of a majority of the Independent Board Members, the May Meeting was held virtually through the internet in view of the health risks associated with holding an in-person meeting during the COVID-19 pandemic and governmental restrictions on gatherings. The May Meeting was held virtually in reliance on certain exemptive relief the Securities and Exchange Commission provided to registered investment companies providing temporary relief from the in-person voting requirements of the 1940 Act with respect to the approval of a fund’s advisory agreement in light of these challenges.
Following up to an initial two-year period, the Board considers the renewal of each Investment Management Agreement and Sub-Advisory Agreement on behalf of the applicable Fund on an annual basis. For purposes of this Part I, the Investment Management Agreements and Sub-Advisory Agreements are collectively referred to as the “Advisory Agreements” and the Adviser and each Sub-Adviser are collectively, the “Fund Advisers” and each, a “Fund Adviser.” Throughout the year, the Board and its committees meet regularly and, at these meetings, receive regular and/or special reports that cover an extensive array of topics and information that are relevant to its annual consideration of the renewal of the advisory agreements for the Nuveen funds. Such information may address, among other things, fund performance and risk information; the Adviser’s strategic plans; product initiatives for various funds; the review of the funds and investment teams; compliance, regulatory and risk management matters; the trading practices of the various sub-advisers to the funds; valuation of securities; fund expenses; securities lending; liquidity management; overall market and regulatory developments; and with respect to closed-end funds, capital management initiatives, institutional ownership, management of leverage financing and the secondary market trading of the closed-end funds and any actions to address discounts. The Board also seeks to meet periodically with the Nuveen funds’ sub-advisers and portfolio teams, when feasible.
In addition, in connection with the annual consideration of the advisory agreements for the Nuveen funds, the Board, through its independent legal counsel, requested and received extensive materials and information prepared specifically for its annual consideration of the renewal of such advisory agreements by the Adviser and by Broadridge Financial Solutions, Inc. (“Broadridge”), an independent provider of investment company data. The materials cover a wide range of topics including, but not limited to, a description of the nature, extent and quality of services provided by the Fund Advisers; a review of product actions taken during 2020
70
(such as mergers, liquidations, fund launches, changes to investment teams, and changes to investment policies); a review of each sub-adviser to the Nuveen funds and the applicable investment teams; an analysis of fund performance in absolute terms and as compared to the performance of certain peer funds and benchmarks with a focus on any performance outliers; an analysis of the fees and expense ratios of the Nuveen funds in absolute terms and as compared to those of certain peer funds with a focus on any expense outliers; a review of management fee schedules; a description of portfolio manager compensation; an overview of the secondary market trading of shares of the Nuveen closed-end funds (including, among other things, an analysis of performance, distribution and valuation and capital-raising trends in the broader closed-end fund market and with respect to Nuveen closed-end funds and a review of the leverage management actions taken on behalf of the closed-end funds particularly during the periods of market volatility generally caused by the COVID-19 pandemic); a review of the performance of various service providers; a description of various initiatives Nuveen had undertaken or continued during the year for the benefit of particular fund(s) and/or the complex; a description of the profitability or financial data of Nuveen and the sub-advisers to the Nuveen funds; and a description of indirect benefits received by the Adviser and the sub-advisers as a result of their relationships with the Nuveen funds. The information prepared specifically for the annual review supplemented the information provided to the Board and its committees and the evaluations of the Nuveen funds by the Board and its committees during the year.
In continuing its practice, the Board met prior to the May Meeting to begin its considerations of the renewal of the Advisory Agreements. Accordingly, on April 21-22, 2021 (the “April Meeting”), the Board met to review and discuss, in part, the performance of the Nuveen funds and the Adviser’s evaluation of each sub-adviser to the Nuveen funds. At the April Meeting, the Board Members asked questions and requested additional information that was provided for the May Meeting. The Board reviewed fund performance throughout the year and in its review, the Board recognized the volatile market conditions that occurred in early 2020 arising, in part, from the public health crisis caused by the novel coronavirus known as COVID-19 and the resulting impact on a fund’s performance for 2020 and thereafter. Accordingly, the Board considered performance data measured over various periods of time as summarized in more detail below.
The Independent Board Members considered the review of the advisory agreements for the Nuveen funds to be an ongoing process and employed the accumulated information, knowledge and experience the Board Members had gained during their tenure on the boards governing the Nuveen funds and working with the Adviser and sub-advisers in their review of the advisory agreements. The contractual arrangements are a result of multiple years of review, negotiation and information provided in connection with the boards’ annual review of the Nuveen funds’ advisory arrangements and oversight of the Nuveen funds.
The Independent Board Members were advised by independent legal counsel during the annual review process as well as throughout the year, including meeting in executive sessions with such counsel at which no representatives from the Adviser or the Sub-Advisers were present. In connection with their annual review, the Independent Board Members also received a memorandum from independent legal counsel outlining their fiduciary duties and legal standards in reviewing the Advisory Agreements.
The Board’s decision to renew the Advisory Agreements was not based on a single identified factor, but rather the decision reflected the comprehensive consideration of all the information provided throughout the year and at the April and May Meetings, and each Board Member may have attributed different levels of importance to the various factors and information considered in connection with the approval process. The following summarizes the principal factors and information, but not all the factors, the Board considered in deciding to renew the Advisory Agreements as well as the Board’s conclusions.
| A. | | Nature, Extent and Quality of Services |
In evaluating the renewal of the Advisory Agreements, the Independent Board Members received and considered information regarding the nature, extent and quality of the applicable Fund Adviser’s services provided to the respective Fund with particular focus on the services and enhancements to such services provided during the last year. The Independent Board Members considered the Investment Management Agreements and the Sub-Advisory Agreements separately in the course of their review. With this approach, they considered the respective roles of the Adviser and the Sub-Advisers in providing services to the applicable Fund(s).
The Board recognized that the Nuveen funds operate in a highly regulated industry and, therefore, the Adviser has provided a wide array of management, oversight and administrative services to manage and operate the funds, and the scope and
71
Annual Investment Management Agreement Approval Process (continued)
(Unaudited)
complexity of these services have expanded over time as a result of, among other things, regulatory and other developments. The Board accordingly considered the extensive resources, tools and capabilities available to the Adviser to operate and manage the Nuveen funds. With respect to the Adviser, as a general matter, some of these services it and its affiliates provide to the Nuveen funds include, but are not limited to: product management (such as setting dividends, analyzing fund expenses, providing competitive analysis, and providing due diligence support); investment oversight, risk management and securities valuation services (such as overseeing and reviewing the various sub-advisers to the Nuveen funds and their investment teams; analyzing fund performance and risk data; overseeing operational and risk management; participating in financial statement, marketing and risk disclosures; providing daily valuation services and developing related valuation policies, procedures and methodologies; periodic testing of audit and regulatory requirements; participating in product development and management processes; participating in leverage management, liquidity monitoring and counterparty credit oversight; providing due diligence and overseeing fund accounting and custody providers; overseeing third party pricing services and periodically assessing investment and liquidity risks); fund administration (such as preparing fund tax returns and other tax compliance services; preparing regulatory filings; overseeing the funds’ independent public accountants and other service providers; analyzing products and enhancements; and managing fund budgets and expenses); oversight of shareholder services and transfer agency functions (such as overseeing transfer agent service providers which include registered shareholder customer service and transaction processing; overseeing proxy solicitation and tabulation services; and overseeing the production and distribution of financial reports by service providers); Board relations services (such as organizing and administering Board and committee meetings, preparing various reports to the Board and committees and providing other support services); compliance and regulatory oversight services (such as managing compliance policies; monitoring compliance with applicable fund policies and laws and regulations; devising internal compliance programs and a framework to review and assess compliance programs; evaluating the compliance programs of the various sub-advisers to the Nuveen funds and certain other service providers; responding to regulatory requests; and preparing compliance training materials); legal support and oversight of outside law firms (such as helping to prepare and file registration statements and proxy statements; overseeing fund activities and providing legal interpretations regarding such activities; maintaining regulatory registrations and negotiating agreements with other fund service providers; and monitoring changes in regulatory requirements and commenting on rule proposals impacting investment companies); and with respect to closed-end funds, managing leverage, monitoring asset coverage and promoting an orderly secondary market.
In evaluating services, the Board reviewed various highlights of the initiatives the Adviser and its affiliates have undertaken or continued in 2020 to benefit the Nuveen complex and/or particular Nuveen funds and meet the requirements of an increasingly complex regulatory environment including, but not limited to:
| | • | | Centralization of Functions – ongoing initiatives to centralize investment leadership, market approach and shared support functions within Nuveen and its affiliates in seeking to operate more effectively the business and enhance the services to the Nuveen funds; |
| | • | | Fund Improvements and Product Management Initiatives – continuing to proactively manage the Nuveen fund complex as a whole and at the individual fund level with an aim to continually improve product platforms and investment strategies to better serve shareholders through, among other things, rationalizing the product line and gaining efficiencies through mergers, repositionings and liquidations; launching new funds; reviewing and updating investment policies and benchmarks; and modifying portfolio management teams for various funds; |
| | • | | Investment Team Integrations – continuing to integrate and adjust the members of certain investment teams, in part, to allow greater access to tools and resources within the Nuveen organization and its affiliates; |
| | • | | Capital Initiatives – continuing to invest capital to support new Nuveen funds with initial capital as well as to support existing funds and facilitate regulatory or logistical changes; |
| | • | | Compliance Program Initiatives – continuing efforts to mitigate compliance risk, increase operating efficiencies, implement enhancements to strengthen key compliance program elements and support international business growth and other corporate objectives; |
72
| | • | | Investment Oversight – preparing reports to the Board addressing, among other things, fund performance; market conditions; investment teams; new products; changes to mandates, policies and benchmarks; and other management proposals; |
| | • | | Risk Management and Valuation Services – continuing to oversee and manage risk including, among other things, conducting daily calculations and monitoring of risk measures across the Nuveen funds, instituting appropriate investment risk controls, providing risk reporting throughout the firm, participating in internal oversight committees, and continuing to implement an operational risk framework that seeks to provide greater transparency of operational risk matters across the complex as well as provide multiple other risk programs that seek to provide a more disciplined and consistent approach to identifying and mitigating Nuveen’s operational risks. Further, the securities valuation team continues, among other things, to oversee the daily valuation process of the portfolio securities of the funds, maintains the valuation policies and procedures, facilitates valuation committee meetings, manages relationships with pricing vendors, and prepares relevant valuation reports and designs methods to simplify and enhance valuation workflow within the organization; |
| | • | | Regulatory Matters – continuing efforts to monitor regulatory trends and advocate on behalf of Nuveen and/or the Nuveen funds, to implement and comply with new or revised rules and mandates and to respond to regulatory inquiries and exams; |
| | • | | Government Relations – continuing efforts of various Nuveen teams and Nuveen’s affiliates to develop policy positions on a broad range of issues that may impact the Nuveen funds, advocate and communicate these positions to lawmakers and other regulatory authorities and work with trade associations to ensure these positions are represented; |
| | • | | Business Continuity, Disaster Recovery and Information Security – continuing efforts of Nuveen to periodically test and update business continuity and disaster recovery plans and, together with its affiliates, to maintain an information security program designed to identify and manage information security risks, and provide reports to the Board, at least annually, addressing, among other things, management’s security risk assessment, cyber risk profile, potential impact of new or revised laws and regulations, incident tracking and other relevant information technology risk-related reports; |
| | • | | Dividend Management Services – continuing to manage the dividends among the varying types of Nuveen funds within the Nuveen complex to be consistent with the respective fund’s product design and positioning in striving to deliver those earnings to shareholders in a relatively consistent manner over time as well as assisting in the development of new products or the restructuring of existing funds; and |
| | • | | with respect specifically to closed-end funds, such continuing services also included: |
| | • | | Leverage Management Services – continuing to actively manage the various forms of leverage utilized across the complex, including through committing resources and focusing on sourcing/structure development and bank provider management, which was key to navigating the respective funds through the COVID-related market volatility in 2020; |
| | • | | Capital Management, Market Intelligence and Secondary Market Services – ongoing capital management efforts through shelf offerings, share repurchases, tender offers and capital return programs as well as providing market data analysis to help understand closed-end fund ownership cycles and their impact on secondary market trading as well as to improve proxy solicitation efforts; and |
| | • | | Closed-end Fund Investor Relations Program – maintaining the closed-end fund investor relations program which, among other things, raises awareness, provides educational materials and cultivates advocacy for closed-end funds and the Nuveen closed-end fund product line. |
In its review, the Board recognized that Nuveen’s risk management, compliance, technology and operations capabilities are all integral to providing its investment management services to the Nuveen funds. Further, the Board noted the benefits to shareholders of investing in a Nuveen fund, as each Nuveen fund is a part of a large fund complex with a variety of investment disciplines, capabilities, expertise and resources available to navigate and support the funds including during
73
Annual Investment Management Agreement Approval Process (continued)
(Unaudited)
stressed times as occurred in the market in the first half of 2020. The Board recognized the impact of the COVID-19 pandemic during the year and the adaptations required by service providers to continue to deliver their services to the Nuveen funds, including working remotely. In this regard, the Board noted the ability of the Adviser and the various sub-advisers to the Nuveen funds to provide continuously their services notwithstanding the significant disruptions caused by the pandemic. In addition to the services provided by the Adviser, the Board also considered the risks borne by the Adviser and its affiliates in managing the Nuveen funds, including entrepreneurial, operational, reputational, regulatory and litigation risks.
The Board further considered the division of responsibilities between the Adviser and the respective Sub-Adviser and recognized that the Sub-Advisers and their investment personnel generally are responsible for the management of each applicable Fund’s portfolio under the oversight of the Adviser and the Board. The Board considered an analysis of each Sub-Adviser provided by the Adviser which included, among other things, the assets under management of the applicable investment team and changes thereto, a summary of the applicable investment team and changes thereto, the investment process and philosophy of the applicable investment team, the performance of the Nuveen funds sub-advised by such Sub-Adviser over various periods of time and a summary of any significant policy and/or other changes to the Nuveen funds sub-advised by such Sub-Adviser. The Board further considered at the May Meeting or prior meetings evaluations of each Sub-Adviser’s compliance programs and trade execution. The Board also considered the structure of investment personnel compensation programs and whether this structure provides appropriate incentives to act in the best interests of the respective Nuveen funds. The Board noted that the Adviser recommended the renewal of the Sub-Advisory Agreements.
Based on its review, the Board determined, in the exercise of its reasonable business judgment, that it was satisfied with the nature, extent and quality of services provided to the respective Funds under each applicable Advisory Agreement.
| B. | | The Investment Performance of the Funds and Fund Advisers |
In evaluating the quality of the services provided by the Fund Advisers, the Board also received and considered a variety of investment performance data of the Nuveen funds they advise. In evaluating performance, the Board recognized that performance data may differ significantly depending on the ending date selected, particularly during periods of market volatility, and therefore considered performance over a variety of time periods that may include full market cycles. In this regard, the Board reviewed, among other things, Fund performance over the quarter, one-, three- and five-year periods ending December 31, 2020 as well as performance data periods ending nearer to the May Meeting, including the quarter, one-, three- and five-year periods ending March 31, 2021 and May 14, 2021. The performance data prepared for the annual review of the advisory agreements for the Nuveen funds supplemented the fund performance data that the Board received throughout the year at its meetings representing differing time periods. In its review, the Board took into account the discussions with representatives of the Adviser; the Adviser’s analysis regarding fund performance that occurred at these Board meetings with particular focus on funds that were considered performance outliers (both overperformance and underperformance); the factors contributing to the performance; and any recommendations or steps taken to address performance concerns. Regardless of the time period reviewed by the Board, the Board recognized that shareholders may evaluate performance based on their own holding periods which may differ from the periods reviewed by the Board and lead to differing results.
In its review, the Board reviewed both absolute and relative fund performance during the annual review over the various time periods. With respect to the latter, the Board considered fund performance in comparison to the performance of peer funds (the “Performance Peer Group”) and recognized and/or customized benchmarks (i.e., generally benchmarks derived from multiple recognized benchmarks). For Nuveen funds that had changes in portfolio managers since 2018 or significant changes, among other things, to their investment strategies or policies since 2019, the Board reviewed certain performance data comparing the performance of such funds before and after such changes. In considering performance data, the Board is aware of certain inherent limitations with such data, including that differences between the objective(s), strategies and other characteristics of the Nuveen funds compared to the respective Performance Peer Group and/or benchmark(s) (such as differences in the use of leverage) as well as differences in the composition of the Performance Peer Group over time will necessarily contribute to differences in performance results and limit the value of the comparative information. To assist the Board in its review of the comparability of the relative performance, the Adviser has ranked the relevancy of the peer group to the funds as low, medium or high.
74
The Board also evaluated performance in light of various relevant factors, including, among other things, general market conditions, issuer-specific information, asset class information, leverage and fund cash flows. In relation to general market conditions, the Board recognized the significant market decline in the early part of 2020 in connection with, among other things, the impact of the COVID-19 pandemic and that such a period of underperformance and market volatility may significantly weigh on the longer term performance results. Accordingly, depending on the facts and circumstances including any differences between the respective Nuveen fund and its benchmark and/or Performance Peer Group, the Board may be satisfied with a fund’s performance notwithstanding that its performance may be below that of its benchmark or peer group for certain periods. However, with respect to any Nuveen funds for which the Board had identified performance issues, the Board monitors such funds closely until performance improves, discusses with the Adviser the reasons for such results, considers whether any steps are necessary or appropriate to address such issues, and reviews the results of any steps undertaken.
The secondary market trading of shares of the Nuveen closed-end funds continues to be a priority for the Board given its importance to shareholders, and therefore data reflecting the premiums and discounts at which the shares of the closed-end funds trade are reviewed by the Board during its annual review and by the Board and/or its Closed-end Fund committee during its respective quarterly meetings throughout the year. The Board continuously reviews all closed-end fund discounts and the fund’s performance relative to both primary and secondary benchmarks and peers. In its review, the Board considers, among other things, changes to investment mandates and guidelines, enhanced and attractive distribution policies, leverage levels and types, fund reorganizations, share repurchases and similar capital market actions and effective communications programs to build greater awareness and deepen understanding of closed-end funds.
For the Global High Income Fund, the Board noted that although the Fund’s performance was below the performance of its benchmark for the one- and three-year periods ended December 31, 2020, the Fund outperformed its benchmark for the five-year period ended December 31, 2020. In addition, the Fund ranked in the fourth quartile of its Performance Peer Group for the one-year period, the third quartile for the three-year period and second quartile for the five-year period ended December 31, 2020. Although the Fund’s performance was below the performance of its benchmark for the three-year period ended March 31, 2021, the Fund outperformed its benchmark for the one- and five-year periods ended March 31, 2021 and ranked in the second quartile of its Performance Peer Group for the one- and five-year periods and third quartile for the three-year period ended March 31, 2021. For the periods ended May 14, 2021, the Fund’s performance was below the performance of its benchmark for the three-year period, but the Fund outperformed its benchmark for the one- and five-year periods. The Fund also ranked in the third quartile of its Performance Peer Group for the one- and three-year periods and second quartile for the five-year period ended May 14, 2021. In reviewing performance, the Board also recognized the changes to the portfolio management team in 2020. Based on its review, the Board was satisfied with the Fund’s overall performance.
For the Mortgage and Income Fund, the Board noted that although the Fund’s performance was below the performance of its benchmark for the one- and three-year periods ended December 31, 2020, the Fund outperformed its benchmark for the five-year period ended December 31, 2020. Further, the Fund ranked in the third quartile of its Performance Peer Group for the one- and three-year periods ended December 31, 2020 and in the second quartile of its Performance Peer Group for the five-year period ended December 31, 2020. The Board further noted that although the Fund’s performance was below the performance of its benchmark for the three-year period ended March 31, 2021, the Fund outperformed its benchmark for the one- and five-year periods ended March 31, 2021 and ranked in the second quartile of its Performance Peer Group for the one- and five-year periods and third quartile of its Performance Peer Group for the three-year period ended March 31, 2021. In addition, for the periods ended May 14, 2021, the Fund’s performance was below the performance of its benchmark for the three-year period, but the Fund outperformed its benchmark for the one- and five-year periods and ranked in the second quartile of its Performance Peer Group for the one-, three- and five-year periods. In its review, the Board noted the Fund’s Performance Peer Group was classified as low for relevancy. The Board also recognized that the Fund was recently restructured to become a perpetual closed-end fund with a new investment objective, new sub-adviser and revised investment mandate. The transition to the revised investment mandate was effective in October 2019 and performance prior to such restructuring would not reflect these changes. Based on its review, the Board was satisfied with the Fund’s overall performance.
75
Annual Investment Management Agreement Approval Process (continued)
(Unaudited)
| C. | | Fees, Expenses and Profitability |
As part of its annual review, the Board considered the contractual management fee and net management fee (the management fee after taking into consideration fee waivers and/or expense reimbursements, if any) paid by a Nuveen fund to the Adviser in light of the nature, extent and quality of the services provided. The Board also considered the total operating expense ratio of each fund before and after any fee waivers and/or expense reimbursements. More specifically, the Independent Board Members reviewed, among other things, each fund’s gross and net management fee rates (i.e., before and after expense reimbursements and/or fee waivers, if any) and net total expense ratio in relation to those of a comparable universe of funds (the “Peer Universe”) established by Broadridge. The Independent Board Members reviewed the methodology Broadridge employed to establish its Peer Universe and recognized that differences between the applicable fund and its respective Peer Universe as well as changes to the composition of the Peer Universe from year to year may limit some of the value of the comparative data. The Independent Board Members also considered a fund’s operating expense ratio as it more directly reflected the shareholder’s costs in investing in the respective fund.
In their review, the Independent Board Members considered, in particular, each fund with a net expense ratio (excluding investment-related costs of leverage) of six basis points or higher compared to that of its peer average (each, an “Expense Outlier Fund”) and an analysis as to the factors contributing to each such fund’s higher relative net expense ratio. In addition, although the Board reviewed a fund’s total net expenses both including and excluding investment-related expenses (i.e., leverage costs) and taxes for certain of the closed-end funds, the Board recognized that leverage expenses will vary across funds and in comparison to peers because of differences in the forms and terms of leverage employed by the respective fund. Accordingly, in reviewing the comparative data between a fund and its peers, the Board generally considered the fund’s net expense ratio and fees (excluding leverage costs and leveraged assets) to be higher if they were over 10 basis points higher, slightly higher if they were 6 to 10 basis points higher, in line if they were within approximately 5 basis points higher than the peer average and below if they were below the peer average of the Peer Universe. The Independent Board Members also considered, in relevant part, a fund’s net management fee and net total expense ratio in light of its performance history.
In their review of the fee arrangements for the Nuveen funds, the Independent Board Members considered the management fee schedules, including the complex-wide and fund-level breakpoint schedules. The Board noted that across the Nuveen fund complex, the complex-wide fee breakpoints reduced fees by approximately $58.4 million and fund-level breakpoints reduced fees by approximately $69.6 million in 2020.
With respect to the Sub-Advisers, the Board also considered the sub-advisory fee schedule paid to each Sub-Adviser in light of the sub-advisory services provided to the respective Fund, the breakpoint schedule and comparative data of the fees such Sub-Adviser charges to other clients, if any. In its review, the Board recognized that the compensation paid to the Sub-Advisers is the responsibility of the Adviser, not the Funds.
The Independent Board Members noted that (a) the Global High Income Fund had a net management fee that was higher than the peer average, but a net expense ratio that was below the peer average; and (b) the Mortgage and Income Fund had a net management fee and a net expense ratio that were below the respective peer averages.
Based on its review of the information provided, the Board determined that each Fund’s management fees (as applicable) to a Fund Adviser were reasonable in light of the nature, extent and quality of services provided to the Fund.
| | 2. | | Comparisons with the Fees of Other Clients |
In determining the appropriateness of fees, the Board also considered information regarding the fee rates the respective Fund Advisers charged to certain other types of clients and the type of services provided to these other clients. With respect to the Adviser and/or the Sub-Advisers, such other clients may include retail and institutional managed accounts advised by a Sub-Adviser (with respect to NAM); hedge funds managed by a Sub-Adviser (with respect to NAM); investment companies offered outside the Nuveen family and sub-advised by a Sub-Adviser (with respect to NAM); foreign investment companies offered by Nuveen and sub-advised by a Sub-Adviser (with respect to NAM and TAL); collective investment trusts sub-advised by a Sub-Adviser (with respect to NAM); and certain funds advised by a Sub-Adviser (with respect to TAL). The Board further noted that the Adviser also advised and TAL sub-advised certain exchange-traded funds (“ETFs”) sponsored by Nuveen.
76
The Board recognized that each Fund had an affiliated sub-adviser and, with respect to affiliated sub-advisers, reviewed, among other things, the range of fees assessed for managed accounts, hedge funds (along with their performance fee), foreign investment companies and ETFs offered by Nuveen, as applicable. The Board also reviewed the fee range and average fee rate of certain selected investment strategies offered in retail and institutional managed accounts advised by NAM, the hedge funds advised by NAM (along with their performance fee) and non-Nuveen investment companies sub-advised by certain affiliated sub-advisers. Further, the Board reviewed the management fees and expense ratios of certain funds advised by TAL in the TIAA-CREF family of funds.
In considering the fee data of other clients, the Board recognized, among other things, the differences in the amount, type and level of services provided to the Nuveen funds relative to other clients as well as the differences in portfolio investment policies, investor profiles, account sizes and regulatory requirements, all of which contribute to the variations in the fee schedules. The Board recognized the breadth of services the Adviser had provided to the Nuveen funds compared to the other types of clients as the funds operate in a highly regulated industry with increasing regulatory requirements as well as the increased entrepreneurial, legal and regulatory risks that the Adviser incurs in sponsoring and managing the funds. Further, with respect to ETFs, the Board considered that Nuveen ETFs were passively managed compared to the active management of the other Nuveen funds which contributed to the differences in fee levels between the Nuveen ETFs and other Nuveen funds. In general, higher fee levels reflect higher levels of service provided by the Adviser, increased investment management complexity, greater product management requirements, and higher levels of business risk or some combination of these factors. The Board further considered that each Sub-Adviser’s fee is essentially for portfolio management services and therefore more comparable to, as applicable, the fees it receives for retail wrap accounts and other external sub-advisory mandates. The Board concluded the varying levels of fees were justified given, among other things, the inherent differences in the products and the level of services provided to the Nuveen funds versus other clients, the differing regulatory requirements and legal liabilities and the entrepreneurial, legal and regulatory risks incurred in sponsoring and advising a registered investment company.
| | 3. | | Profitability of Fund Advisers |
In their review, the Independent Board Members considered information regarding Nuveen’s level of profitability for its advisory services to the Nuveen funds for the calendar years 2020 and 2019. The Board reviewed, among other things, Nuveen’s net margins (pre-tax) (both including and excluding distribution expenses); gross and net revenue margins (pre- and post-tax and excluding distribution) from Nuveen funds only; revenues, expenses and net income (pre- and post-tax and before distribution expenses) of Nuveen for fund advisory services; and comparative profitability data comparing the operating margins of Nuveen compared to the adjusted operating margins of certain peers that had publicly available data and with the most comparable assets under management (based on asset size and asset composition) for each of the last two calendar years. In reviewing the peer comparison data, the Independent Board Members noted that Nuveen Investments, Inc.’s operating margins were on the low range compared to the total company adjusted operating margins of the peers. The Board also reviewed the revenues and expenses the Adviser derived from its ETF product line for the 2019 and 2020 calendar years.
In reviewing the profitability data, the Independent Board Members recognized the subjective nature of calculating profitability as the information is not audited and is dependent on cost allocation methodologies to allocate corporate-wide expenses to the Nuveen complex and its affiliates and to further allocate such Nuveen complex expenses between the Nuveen fund and non-fund businesses. Generally, fund-specific expenses are allocated to the Nuveen funds and partial fund-related expenses and/or corporate overhead and shared costs (such as legal and compliance, accounting and finance, information technology and human resources and office services) are partially attributed to the funds pursuant to cost allocation methodologies. The Independent Board Members reviewed a description of the cost allocation methodologies employed to develop the financial information, a summary of the history of changes to the methodology over the years from 2010 to 2020, and the net revenue margins derived from the Nuveen funds (pre-tax and including and excluding distribution) and total company margins from Nuveen Investments, Inc. compared to the firm-wide adjusted margins of the peers for each calendar year from 2010 to 2020. The Board had also appointed three Independent Board Members to serve as the Board’s liaisons, with the assistance of independent counsel, to review the development of the profitability data and any proposed
77
Annual Investment Management Agreement Approval Process (continued)
(Unaudited)
changes to the cost allocation methodology prior to incorporating any such changes and to report to the full Board. The Board recognized that other reasonable and valid allocation methodologies could be employed and could lead to significantly different results. The Independent Board Members also considered the key drivers behind the revenue and expense changes that impacted Nuveen’s net margins between 2019 and 2020. The Board also noted the reinvestments Nuveen and/or its parent made into its business through, among other things, the investment of seed capital in certain Nuveen funds and continued investments in enhancements to information technology, portfolio accounting systems and the global trading platform.
In reviewing the comparative peer data noted above, the Board considered that the operating margins of Nuveen Investments, Inc. were in the lower half of the peer group range; however, the Independent Board Members also recognized the limitations of the comparative data given that peer data is not generally public and the calculation of profitability is subjective and affected by numerous factors (such as types of funds a peer manages, its business mix, its cost of capital, the numerous assumptions underlying the methodology used to allocate expenses and other factors) that can have a significant impact on the results.
Aside from Nuveen’s profitability, the Board recognized that the Adviser is a subsidiary of Nuveen, LLC, the investment management arm of Teachers Insurance and Annuity Association of America (“TIAA”). Accordingly, the Board also reviewed a balance sheet for TIAA reflecting its assets, liabilities and capital and contingency reserves for the 2020 and 2019 calendar years to consider the financial strength of TIAA. The Board recognized the benefit of an investment adviser and its parent with significant resources, particularly during periods of market volatility as experienced with the COVID-19 pandemic.
In addition to Nuveen, the Independent Board Members considered the profitability of the Sub-Advisers from their relationships with the respective Nuveen funds. In this regard, the Independent Board Members reviewed, among other things, NAM’s revenues, expenses and net revenue margins (pre- and post-tax) for its advisory activities for the calendar year ended December 31, 2020 as well as its pre- and post-tax net revenue margins for 2020 compared to such margins for 2019. The Independent Board Members also reviewed a profitability analysis reflecting the revenues, expenses and revenue margin (pre- and post-tax) by asset type for NAM for the calendar year ending December 31, 2020 and the pre- and post-tax revenue margins from 2020 and 2019. With respect to TAL, the Independent Board Members reviewed such Sub-Adviser’s revenues, expenses and net operating income for its advisory services to the Nuveen ETFs and Nuveen closed-end funds for 2020 and 2019.
In evaluating the reasonableness of the compensation, the Independent Board Members also considered any other ancillary benefits derived by the respective Fund Adviser from its relationship with the Nuveen funds as discussed in further detail below.
Based on a consideration of all the information provided, the Board noted that Nuveen’s and each Sub-Adviser’s level of profitability was acceptable and not unreasonable in light of the services provided.
| D. | | Economies of Scale and Whether Fee Levels Reflect These Economies of Scale |
The Board considered whether there have been economies of scale with respect to the management of the Nuveen funds and whether these economies of scale have been appropriately shared with the funds. The Board recognized that although economies of scale are difficult to measure and certain expenses may not decline with a rise in assets, there are several methods to help share the benefits of economies of scale, including breakpoints in the management fee schedule, fee waivers and/or expense limitations, the pricing of Nuveen funds at scale at inception and investments in Nuveen’s business which can enhance the services provided to the funds for the fees paid. The Board noted that Nuveen generally has employed these various methods, and the Board considered the extent to which the Nuveen funds will benefit from economies of scale as their assets grow. In this regard, the Board noted that the management fee of the Adviser is generally comprised of a fund-level component and a complex-level component each with its own breakpoint schedule, subject to certain exceptions. The Board reviewed the fund-level and complex-level fee schedules. The Board considered that the fund-level breakpoint schedules are designed to share economies of scale with shareholders if the particular fund grows, and the complex-level breakpoint schedule is designed to deliver the benefits of economies of scale to shareholders when the eligible assets in the
78
complex pass certain thresholds even if the assets of a particular fund are unchanged or have declined. With respect to the Nuveen closed-end funds, the Independent Board Members noted that, although such funds may from time to time make additional share offerings, the growth of their assets would occur primarily through the appreciation of such funds’ investment portfolios. Further, in the calculation of the complex-level component, the Board noted that it had approved the acquisition of several Nuveen funds by similar TIAA-CREF funds in 2019. However, to mitigate the loss of the assets of these Nuveen funds deemed eligible to be included in the calculation of the complex-wide fee when these Nuveen funds left the complex upon acquisition, Nuveen agreed to credit approximately $604.5 million to assets under management to the Nuveen complex in calculating the complex-wide component.
In addition to the fund-level and complex-level fee schedules, the Independent Board Members considered the temporary and/or permanent expense caps applicable to certain Nuveen funds (including the amounts of fees waived or amounts reimbursed to the respective funds in 2019 and 2020). The Board noted that with respect to the Mortgage and Income Fund, the Adviser had agreed to a temporary fee waiver or expense reimbursement at certain expense levels, which expired in October 2020.
The Independent Board Members also recognized the Adviser’s continued reinvestment in its business through various initiatives including maintaining a seed account available for investments into Nuveen funds and investing in its internal infrastructure, information technology and other systems that will, among other things, consolidate and enhance accounting systems, integrate technology platforms to support growth and efficient data processing, and further develop its global trading platform to enhance the investment process for the investment teams.
Based on its review, the Board concluded that the current fee arrangements together with the Adviser’s reinvestment in its business appropriately shared any economies of scale with shareholders.
The Independent Board Members received and considered information regarding other benefits the respective Fund Adviser or its affiliates may receive as a result of their relationship with the Nuveen funds. The Board considered the compensation that an affiliate of the Adviser received for serving as co-manager in the initial public offerings of new closed-end funds and for serving as an underwriter on shelf offerings of existing closed-end funds. In addition, the Independent Board Members also noted that various sub-advisers (including NAM) may engage in soft dollar transactions pursuant to which they may receive the benefit of research products and other services provided by broker-dealers executing portfolio transactions on behalf of the applicable Nuveen funds. However, the Board noted that any benefits for NAM when transacting in fixed-income securities may be more limited as such securities generally trade on a principal basis and therefore do not generate brokerage commissions. Further, the Board noted that TAL does not participate in soft dollar arrangements with respect to Nuveen fund portfolio transactions.
Based on its review, the Board concluded that any indirect benefits received by a Fund Adviser as a result of its relationship with the Funds were reasonable and within acceptable parameters.
The Board Members did not identify any single factor discussed previously as all-important or controlling. The Board Members, including the Independent Board Members, concluded that the terms of each Advisory Agreement were fair and reasonable, that the respective Fund Adviser’s fees were reasonable in light of the services provided to each Fund and that the Advisory Agreements be renewed.
79
Annual Investment Management Agreement Approval Process (continued)
(Unaudited)
PART II
Nuveen Core Plus Impact Fund
At a meeting held on February 23-25, 2021 (the “Meeting”), the Board Members, all of whom are Independent Board Members, considered and approved the investment management agreement (for purposes of this Part II, the “Investment Management Agreement”) pursuant to which Nuveen Fund Advisors, LLC (the “Adviser”) serves as the investment adviser to Nuveen Core Plus Impact Fund (for purposes of this Part II, the “Fund”) and the investment sub-advisory agreement (for purposes of this Part II, the “Sub-Advisory Agreement”) pursuant to which Nuveen Asset Management, LLC (the “Sub-Adviser”) serves as investment sub-adviser to the Fund. (For purposes of this Part II, (a) the Adviser and the Sub-Adviser are each hereafter a “Fund Adviser” and (b) the Investment Management Agreement and the Sub-Advisory Agreement are each hereafter an “Advisory Agreement” and collectively, the “Advisory Agreements.”) Further, the Board is aware that the Fund may gain exposure to certain investments by investing in the Fund’s wholly-owned subsidiary organized under the laws of the Cayman Islands, which is advised by the Sub-Adviser for no additional fee. The review of services to be provided to the Fund and management fees to be paid to the Fund Advisers encompasses this arrangement.
Although the 1940 Act requires that the Advisory Agreements be approved by the in-person vote of a majority of the Independent Board Members, the Meeting was held virtually through the internet in view of the health risks associated with holding an in-person meeting during the COVID-19 pandemic and governmental restrictions on gatherings. The Meeting was held in reliance on an order issued by the Securities and Exchange Commission on March 13, 2020, as extended on March 25, 2020 and June 19, 2020, which provided registered investment companies temporary relief from the in-person voting requirements of the 1940 Act with respect to the approval of a fund’s advisory agreement in response to the challenges arising in connection with the COVID-19 pandemic.
To assist the Board in its evaluation of an Advisory Agreement with a Fund Adviser at the Meeting, the Independent Board Members had received, in adequate time in advance of the Meeting or at prior meetings, materials which outlined, among other things:
| | • | | the nature, extent and quality of the services expected to be provided by the Fund Adviser; |
| | • | | the organization of the Fund Adviser, including the responsibilities of various departments and key personnel; |
| | • | | the expertise and background of the Fund Adviser with respect to the Fund’s investment strategy; |
| | • | | certain performance-related information (as described below); |
| | • | | the profitability of Nuveen and its affiliates for their advisory activities; |
| | • | | the proposed management fees of the Fund Adviser, including comparisons of such fees with the management fees of comparable funds; |
| | • | | the expected expenses of the Fund, including comparisons of the Fund’s expected expense ratio with the expense ratios of comparable funds; and |
| | • | | the soft dollar practices of the Fund Adviser, if any. |
At the Meeting and/or at prior meetings, the Adviser made presentations to and responded to questions from the Board. During the Meeting and/or at prior meetings, the Independent Board Members also met privately with their legal counsel to, among other things, review the Board’s duties under the 1940 Act, the general principles of state law in reviewing and approving advisory contracts, the standards used by courts in determining whether investment company boards of directors have fulfilled their duties, factors to be considered in voting on advisory contracts and an adviser’s fiduciary duty with respect to advisory agreements and compensation. It is with this background that the Independent Board Members considered the Advisory Agreements. As outlined in more detail below, the Independent Board Members considered various factors they believed relevant with respect to the Fund. Each Board Member may have accorded different weight to the various factors and information discussed below in reaching his or her conclusions with respect to the Fund’s Advisory Agreements. The Board
80
Members also drew on information they had received in their capacity as trustees and directors, as applicable, of other registered investment companies advised by the Fund Advisers.
| A. | | Nature, Extent and Quality of Services |
The Independent Board Members considered the nature, extent and quality of the respective Fund Adviser’s services, including portfolio management services and administrative services. Given that the Adviser and the Sub-Adviser already serve as adviser and sub-adviser, respectively, to other Nuveen funds overseen by the Board Members, the Board has a good understanding of each such Fund Adviser’s organization, operations, personnel and services. As the Independent Board Members meet regularly throughout the year to oversee the Nuveen funds, including funds currently advised by the Fund Advisers, the Independent Board Members have relied upon their knowledge from their meetings and any other interactions throughout the year with the respective Fund Adviser in evaluating the Advisory Agreements.
At the Meeting and/or at prior meetings, the Independent Board Members reviewed materials outlining, among other things, the respective Fund Adviser’s organization and business; the types of services that such Fund Adviser or its affiliates provide to the Nuveen funds (as applicable) and are expected to provide to the Fund; and the experience of the respective Fund Adviser with applicable investment strategies. Further, at the Meeting and/or at prior meetings, the Independent Board Members have evaluated the background and experience of the relevant investment personnel.
In considering the services that were expected to be provided by the Fund Advisers, at the Meeting and/or at prior meetings, the Board has recognized that the Adviser provides a vast array of services to the Nuveen funds, the scope of which has expanded over the years in light of regulatory, market and other developments, such as the development of expanded compliance programs for the Nuveen funds. The Board has also noted the extensive resources, tools and capabilities the Adviser and its affiliates devote to the various operations of the Nuveen funds. In this regard, services provided to the Nuveen funds include, but are not limited to: investment oversight, risk management and securities valuation services; product management; fund administration; oversight of shareholder services and transfer agency functions; Board relations services; compliance and regulatory oversight services; legal support and oversight of outside law firms; and providing leverage, capital and distribution management services. In addition to the services provided by the Adviser, the Board has also considered the risks borne by the Adviser and its affiliates in managing the Nuveen funds, including entrepreneurial, operational, reputational, regulatory and litigation risks.
The Board further considered the division of responsibilities between the Adviser and the Sub-Adviser and recognized that the Sub-Adviser and its investment personnel would generally be responsible for the management of the Fund’s portfolio under the oversight of the Adviser and the Board. In this regard, the Board recognized the relevant experience and expertise of the Sub-Adviser and the applicable investment personnel.
Based on its review, the Board found that, overall, the nature, extent and quality of services expected to be provided to the Fund under each Advisory Agreement were satisfactory.
| B. | | Investment Performance |
The Fund was new and, therefore, did not have its own performance history. However, based on information provided by the Adviser, it was expected that the Fund’s investment strategy would have certain similarities to that of the TIAA-CREF Core Impact Bond Fund (the “TIAA-CREF Fund”), which is managed by an affiliate of the Adviser. The Board was provided with certain performance information relating to the institutional class shares of the TIAA-CREF Fund, including average annual total returns for the quarter, one-year, three-year, five-year and since inception periods as of December 31, 2020.
| C. | | Fees, Expenses and Profitability |
In evaluating the management fees and expenses that the Fund was expected to bear, the Independent Board Members considered, among other things, the Fund’s proposed management fee structure and its expected expense ratio in absolute terms as well as compared with the fees and expense ratios of comparable funds. Accordingly, the Independent Board Members reviewed, among other things, the proposed advisory fee and estimated net total expense ratio for the Fund (based
81
Annual Investment Management Agreement Approval Process (continued)
(Unaudited)
on both common assets and total managed assets), as well as comparative fee and expense data pertaining to the Fund’s peers in the Lipper category in which the Fund is expected to be classified (“Lipper Peers”). In addition, the Adviser provided the Board with a custom peer comparison that consisted of comparative fee and expense data pertaining to a subset of the Lipper Peers that the Adviser deemed more comparable to the Fund in certain respects. Further, the Independent Board Members took into account the proposed sub-advisory fee for the Fund.
The Independent Board Members recognized that assets attributable to the Fund’s use of leverage would be included in the amount of assets upon which the advisory fee is calculated. In this regard, the Independent Board Members noted that the advisory fee is based on a percentage of average daily “Managed Assets.” “Managed Assets” generally means the total assets of the Fund, minus the sum of its accrued liabilities (other than Fund liabilities incurred for the express purpose of creating leverage). “Total assets” for this purpose includes assets attributable to the Fund’s use of leverage (whether or not those assets are reflected in the Fund’s financial statements for purposes of generally accepted accounting principles), and derivatives will be valued at their market value. The Independent Board Members recognized that the fact that a decision to employ or increase the Fund’s leverage will have the effect, all other things being equal, of increasing Managed Assets (and, in turn, increasing the Adviser’s and the Sub-Adviser’s management fees), means that the Adviser and the Sub-Adviser may have a conflict of interest in determining whether to use or increase leverage. The Independent Board Members noted, however, that the Adviser and the Sub-Adviser would seek to manage that potential conflict by recommending to the Board to leverage the Fund (or increase such leverage) when they determine that such action would be in the best interests of the Fund and its common shareholders, and by periodically reviewing with the Board the Fund’s performance and the impact of the use of leverage on that performance.
The Independent Board Members considered the proposed management fee rate before any fund-level and complex-wide breakpoints. In addition, the Independent Board Members considered the Fund’s fund-level and complex-wide breakpoint schedules (described in further detail below). Based on their review of the fee and expense information provided, the Independent Board Members determined that the Fund’s management fees (as applicable) to a Fund Adviser were reasonable in light of the nature, extent and quality of services expected to be provided to the Fund.
| | 2. | | Comparisons with the Fees of Other Clients |
At the Meeting and/or at prior meetings, the Board has reviewed information regarding the fee rates that the Fund Advisers charge for certain other types of clients and the type of services provided to these other clients. With respect to the Adviser and/or the Sub-Adviser, such other clients may include retail and institutional managed accounts advised by the Sub-Adviser; investment companies offered outside the Nuveen family and sub-advised by the Sub-Adviser; foreign investment companies offered by Nuveen and sub-advised by the Sub-Adviser; and collective investment trusts sub-advised by the Sub-Adviser. Further, the Board has noted that the Adviser also advises certain exchange-traded funds (“ETFs”) sponsored by Nuveen.
In considering the fee data of other clients, the Board has considered, among other things, the differences in the amount, type and level of services provided to the Nuveen funds relative to other clients as well as the differences in portfolio investment policies, investor profiles, account sizes and regulatory requirements, all of which contribute to the variations in the fee schedules. The Board has recognized the complexity and myriad of services the Adviser provides to the Nuveen funds compared to the other types of clients as the Adviser is principally responsible for all aspects of operating the funds, including complying with the increased regulatory requirements required when managing the funds as well as the increased entrepreneurial, legal and regulatory risks that the Adviser incurs in sponsoring and managing the funds. Further, with respect to ETFs, the Board has considered that Nuveen ETFs have been passively managed compared to the active management of the other Nuveen funds which has contributed to the differences in fee levels between the Nuveen ETFs and other Nuveen funds. In general, higher fee levels reflect higher levels of service provided by the Adviser, increased investment management complexity, greater product management requirements, and higher levels of business risk or some combination of these factors. In addition, the Board has considered that the Sub-Adviser’s fee is essentially for portfolio management services and therefore more comparable to the fees it receives for retail wrap accounts and other external sub-advisory mandates. The Board has recognized that the varying levels of fees were justified given, among other things, the inherent differences in the products and the level of services provided to the Nuveen funds versus other clients, the differing
82
regulatory requirements and legal liabilities and the entrepreneurial, legal and regulatory risks incurred in sponsoring and advising a registered investment company.
| | 3. | | Profitability of Fund Advisers |
In conjunction with their review of fees, at the Meeting and/or at prior meetings, the Independent Board Members have considered information regarding Nuveen’s level of profitability for its advisory services to the Nuveen funds for the calendar years 2019 and 2018. The Board has previously reviewed, among other things, Nuveen’s net margins (pre-tax) (both including and excluding distribution expenses); gross and net revenue margins (pre- and post-tax); revenues, expenses, and net income (pre-tax and after-tax and before distribution) of Nuveen for fund advisory services; and comparative profitability data comparing the margins of Nuveen compared to the adjusted margins of certain peers with publicly available data and with the most comparable assets under management (based on asset size and asset composition) for the 2018 and 2019 calendar years. The Board has also reviewed the revenues and expenses the Adviser derived from its ETF product line for the 2018 and 2019 calendar years.
In reviewing the profitability data, the Independent Board Members have recognized the subjective nature of calculating profitability as the information is not audited and is dependent on cost allocation methodologies to allocate expenses of Nuveen and its affiliates between the fund and non-fund businesses. The expenses to be allocated include direct expenses in servicing the Nuveen funds as well as indirect and/or shared costs (such as overhead, legal and compliance) some of which are attributed to the Nuveen funds pursuant to the cost allocation methodologies. The Independent Board Members have reviewed a description of the cost allocation methodologies employed to develop the financial information and a summary of the history of changes to the methodology over the eleven-year period from 2008 to 2019. The Board has also appointed three Independent Board Members, along with the assistance of independent counsel, to serve as the Board’s liaisons to review the development of the profitability data and any proposed changes to the cost allocation methodology prior to incorporating any such changes and to report to the full Board. The Board has recognized that other reasonable and valid allocation methodologies could be employed and could lead to significantly different results. Based on the data, the Independent Board Members have noted that Nuveen’s net margins were higher in 2019 than the previous year and considered the key drivers behind the revenue and expense changes that impacted Nuveen’s net margins between the years. The Board has also noted the reinvestments of some of the profits into the business through, among other things, the investment of seed capital in certain funds and continued investments in enhancements to information technology, internal infrastructure and data management improvements and global investment and innovation projects.
As indicated above, the Independent Board Members have also considered the operating margins of Nuveen Investments, Inc. compared to the adjusted margins of certain peers with publicly available data and with the most comparable assets under management (based on asset size and asset composition) to Nuveen for the calendar years 2019 and 2018. The Independent Board Members have noted that the operating margins of Nuveen Investments, Inc. were in the lower half of the peer group range. The Independent Board Members, however, have recognized that it is difficult to make comparisons of profitability with other investment adviser peers given that comparative data is not generally public and the calculation of profitability is subjective and affected by numerous factors (such as types of funds a peer manages, its business mix, its cost of capital, the numerous assumptions underlying the methodology used to allocate expenses and other factors) which can have a significant impact on the results.
Aside from Nuveen’s profitability, the Board has recognized that the Adviser is a subsidiary of Nuveen, LLC, the investment management arm of Teachers Insurance and Annuity Association of America (“TIAA”). As such, the Board has also reviewed a balance sheet for TIAA reflecting its assets, liabilities and capital and contingency reserves for the 2019 and 2018 calendar years to consider the financial strength of TIAA. The Board has recognized the benefit of having an investment adviser and its parent with significant resources, particularly during periods of market stress.
In addition to Nuveen, the Independent Board Members have also considered the profitability of the Sub-Adviser from its relationships with the Nuveen funds. In this regard, the Independent Board Members have reviewed, among other things, the Sub-Adviser’s revenues, expenses and net revenue margins (pre- and post-tax) for its advisory activities for the calendar year ended December 31, 2019 as well as its pre-tax and after-tax net revenue margins for 2019 compared to such margins for
83
Annual Investment Management Agreement Approval Process (continued)
(Unaudited)
2018. The Independent Board Members have also reviewed a profitability analysis reflecting the revenues, expenses and revenue margin (pre- and post-tax) by asset type for the Sub-Adviser for the calendar year ended December 31, 2019 and the pre- and post-tax revenue margins from 2019 and 2018.
In evaluating the reasonableness of the compensation, the Independent Board Members have also considered any other ancillary benefits derived by the respective Fund Adviser from its relationship with the Nuveen funds as discussed in further detail below.
Based on a consideration of all the information provided, the Board has noted that Nuveen’s and the Sub-Adviser’s level of profitability was acceptable and not unreasonable in light of the services provided.
| D. | | Economies of Scale and Whether Fee Levels Reflect These Economies of Scale |
The Board considered whether the Fund could be expected to benefit from any economies of scale. The Board has recognized that although economies of scale are difficult to measure, there are several methods to help share the benefits of economies of scale, including breakpoints in the management fee schedule, fee waivers and/or expense limitations, the pricing of Nuveen funds at scale at inception and investments in Nuveen’s business which can enhance the services provided to the funds for the fees paid. The Board has noted that Nuveen generally has employed these various methods with respect to the Nuveen funds. In this regard, the Board has noted that the management fee of the Adviser is generally comprised of a fund-level component and a complex-level component, each with its own breakpoint schedule, subject to certain exceptions. In general terms, the fund-level breakpoint schedules are designed to share economies of scale with shareholders if the particular fund grows, and the complex-level breakpoint schedule is designed to deliver the benefits of economies of scale to shareholders when the eligible assets in the complex pass certain thresholds even if the assets of a particular fund are unchanged or have declined. Accordingly, the Independent Board Members reviewed and considered the proposed management fees for the Fund, taking into account the fund-level and complex-level breakpoint schedules. In this regard, however, the Fund is a closed-end fund and the Independent Board Members have recognized that although closed-end funds may from time to time make additional share offerings, the growth of their assets would occur primarily through the appreciation of such funds’ investment portfolios.
The Independent Board Members have also recognized the Adviser’s continued reinvestment in its business through, among other things, investments in its business infrastructure and information technology, portfolio accounting system and other systems and platforms that will, among other things, support growth, simplify and enhance information sharing, and enhance the investment process to the benefit of all of the Nuveen funds.
Based on its review, the Board concluded that the proposed fee structure was acceptable and reflected economies of scale to be shared with the Fund’s shareholders when assets under management increase.
The Independent Board Members received and considered information at the Meeting and/or at prior meetings regarding other benefits the respective Fund Adviser or its affiliates may receive as a result of their relationship with the Nuveen funds. With respect to closed-end funds, the Board has considered the compensation received by an affiliate of the Adviser for serving as co-manager in the initial public offerings of new closed-end funds and for serving as an underwriter on shelf offerings of existing closed-end funds. In addition, the Independent Board Members have noted that various sub-advisers (including the Sub-Adviser) may engage in soft dollar transactions pursuant to which they may receive the benefit of research products and other services provided by broker-dealers executing portfolio transactions on behalf of the applicable Nuveen funds, although the Board has recognized that certain sub-advisers may be phasing out the use of soft dollars over time.
The Board, however, has noted that the benefits for the Sub-Adviser when transacting in fixed-income securities may be more limited as such securities generally trade on a principal basis and therefore do not generate brokerage commissions. Further, the Board has considered that although the Sub-Adviser may benefit from the receipt of research and other services that it may otherwise have to pay for out of its own resources, the research may also benefit the Nuveen funds to the extent it enhances the ability of the Sub-Adviser to manage such funds or is acquired through the commissions paid on portfolio transactions of other clients.
84
Based on its review, the Board concluded that any indirect benefits expected to be received by a Fund Adviser as a result of its relationship with the Fund were reasonable and within acceptable parameters.
The Independent Board Members did not identify any single factor discussed previously as all-important or controlling. The Board Members, including a majority of the Independent Board Members, concluded that the terms of the Investment Management Agreement and the Sub-Advisory Agreement were fair and reasonable, that the respective Fund Adviser’s fees were reasonable in light of the services expected to be provided to the Fund and that the Investment Management Agreement and Sub-Advisory Agreement should be and were approved on behalf of the Fund.
85
Notes
86
Notes
87
Nuveen:
Serving Investors for Generations
Since 1898, financial professional and their clients have relied on Nuveen to provide
dependable investment solutions through continued adherence to proven, long-term investing
principles. Today, we offer a range of high quality solutions designed to
be integral components of a well-diversified core portfolio.
Focused on meeting investor needs.
Nuveen is the investment manager of TIAA. We have grown into one of the world’s premier global asset managers, with specialist knowledge across all major asset classes and particular strength in solutions that provide income for investors and that draw on our expertise in alternatives and responsible investing. Nuveen is driven not only by the independent investment processes across the firm, but also the insights, risk management, analytics and other tools and resources that a truly world-class platform provides. As a global asset manager, our mission is to work in partnership with our clients to create solutions which help them secure their financial future.
Find out how we can help you.
To learn more about how the products and services of Nuveen may be able to help you meet your financial goals, talk to your financial professional, or call us at (800) 257-8787. Please read the information provided carefully before you invest. Investors should consider the investment objective and policies, risk considerations, charges and expenses of any investment carefully. Where applicable, be sure to obtain a prospectus, which contains this and other relevant information. To obtain a prospectus, please contact your securities representative or Nuveen, 333 W. Wacker Dr., Chicago, IL 60606. Please read the prospectus carefully before you invest or send money.
Learn more about Nuveen Funds at: www.nuveen.com/closed-end-funds
| | | | |
| Nuveen Securities, LLC, member FINRA and SIPC | 333 West Wacker Drive Chicago, IL 60606 | www.nuveen.com | | | | ESA-B-0621D 1739052-INV-B-08/22 |
Not applicable to this filing.
| ITEM 3. | AUDIT COMMITTEE FINANCIAL EXPERT. |
Not applicable to this filing.
| ITEM 4. | PRINCIPAL ACCOUNTANT FEES AND SERVICES. |
Not applicable to this filing.
| ITEM 5. | AUDIT COMMITTEE OF LISTED REGISTRANTS. |
Not applicable to this filing.
| ITEM 6. | SCHEDULE OF INVESTMENTS. |
| (a) | | See Portfolio of Investments in Item 1. |
| ITEM 7. | DISCLOSURE OF PROXY VOTING POLICIES AND PROCEDURES FOR CLOSED-END MANAGEMENT INVESTMENT COMPANIES. |
Not applicable to this filing.
| ITEM 8. | PORTFOLIO MANAGERS OF CLOSED-END MANAGEMENT INVESTMENT COMPANIES. |
Not applicable to this filing.
| ITEM 9. | PURCHASES OF EQUITY SECURITIES BY CLOSED-END MANAGEMENT INVESTMENT COMPANY AND AFFILIATED PURCHASERS. |
Not applicable.
| ITEM 10. | SUBMISSION OF MATTERS TO A VOTE OF SECURITY HOLDERS. |
There have been no material changes to the procedures by which shareholders may recommend nominees to the registrant’s Board implemented after the registrant last provided disclosure in response to this item.
| ITEM 11. | CONTROLS AND PROCEDURES. |
| (a) | | The registrant’s principal executive and principal financial officers, or persons performing similar functions, have concluded that the registrant’s disclosure controls and procedures (as defined in Rule 30a-3(c) under the Investment Company Act of 1940, as amended (the “1940 Act”) (17 CFR 270.30a-3(c))) are effective, as of a date within 90 days of the filing date of this report that includes the disclosure required by this paragraph, based on their evaluation of the controls and procedures required by Rule 30a-3(b) under the 1940 Act (17 CFR 270.30a-3(b)) and Rules 13a-15(b) or 15d-15(b) under the Securities Exchange Act of 1934, as amended (the “Exchange Act”) (17 CFR 240.13a-15(b) or 240.15d-15(b)). |
| (b) | | There were no changes in the registrant’s internal control over financial reporting (as defined in Rule 30a-3(d) under the 1940 Act (17 CFR 270.30a-3(d)) that occurred during the period covered by this report that has materially affected, or is reasonably likely to materially affect, the registrant’s internal control over financial reporting. |
| ITEM 12. | DISCLOSURE OF SECURITIES LENDING ACTIVITIES FOR CLOSED-END MANAGEMENT INVESTMENT COMPANIES. |
Not applicable.
File the exhibits listed below as part of this Form.
(a)(1) Any code of ethics, or amendment thereto, that is the subject of the disclosure required by Item 2, to the extent that the registrant intends to satisfy the Item 2 requirements through filing of an exhibit: Not applicable to this filing.
(a)(2) A separate certification for each principal executive officer and principal financial officer of the registrant as required by Rule 30a-2(a) under the 1940 Act (17 CFR 270.30a-2(a)) in the exact form set forth below: See EX-99.CERT attached hereto.
(a)(3) Any written solicitation to purchase securities under Rule 23c-1 under the 1940 Act (17 CFR 270.23c-1) sent or given during the period covered by the report by or on behalf of the registrant to 10 or more persons: Not applicable.
(a)(4) Change in the registrant’s independent public accountant. Not applicable.
(b) If the report is filed under Section 13(a) or 15(d) of the Exchange Act, provide the certifications required by Rule 30a-2 (b) under the 1940 Act (17 CFR 270.30a-2(b)), Rule 13a-14(b) or Rule 15d-14(b) under the Exchange Act (17 CFR 240.13a-14(b) or 240.15d-14(b)), and Section 1350 of Chapter 63 of Title 18 of the United States Code (18 U.S.C. 1350) as an Exhibit. A certification furnished pursuant to this paragraph will not be deemed “filed” for purposes of Section 18 of the Exchange Act (15 U.S.C. 78r), or otherwise subject to the liability of that section. Such certification will not be deemed to be incorporated by reference into any filing under the Securities Act of 1933 or the Exchange Act, except to the extent that the registration specifically incorporates it by reference: See EX-99.906 CERT attached hereto.
SIGNATURES
Pursuant to the requirements of the Securities Exchange Act of 1934 and the Investment Company Act of 1940, the registrant has duly caused this report to be signed on its behalf by the undersigned, thereunto duly authorized.
(Registrant) Nuveen Mortgage and Income Fund
| | |
| By (Signature and Title) | | /s/ Mark L. Winget |
| | Mark L. Winget |
| | Vice President and Secretary |
Date: September 2, 2021
Pursuant to the requirements of the Securities Exchange Act of 1934 and the Investment Company Act of 1940, this report has been signed below by the following persons on behalf of the registrant and in the capacities and on the dates indicated.
| | |
| By (Signature and Title) | | /s/ David J. Lamb |
| | David J. Lamb |
| | Chief Administrative Officer |
| | (principal executive officer) |
Date: September 2, 2021
| | |
| By (Signature and Title) | | /s/ E. Scott Wickerham |
| | E. Scott Wickerham |
| | Vice President and Controller |
| | (principal financial officer) |
Date: September 2, 2021