UNITED STATES
SECURITIES AND EXCHANGE COMMISSION
Washington, D.C. 20549
FORMN-CSR
CERTIFIED SHAREHOLDER REPORT OF REGISTERED
MANAGEMENT INVESTMENT COMPANIES
Investment Company Act file number811-22338
Legg Mason Global Asset Management Trust
(Exact name of registrant as specified in charter)
620 Eighth Avenue, 49th Floor, New York, NY 10018
(Address of principal executive offices) (Zip code)
Robert I. Frenkel, Esq.
Legg Mason & Co., LLC
100 First Stamford Place
Stamford, CT 06902
(Name and address of agent for service)
Registrant’s telephone number, including area code:1-877-721-1926
Date of fiscal year end: September 30
Date of reporting period: September 30, 2019
| ITEM 1. | REPORT TO STOCKHOLDERS |
TheAnnual Report to Stockholders is filed herewith.

| | |
| Annual Report | | September 30, 2019 |
QS
GLOBAL MARKET NEUTRAL FUND
Beginning in March 2021, as permitted by regulations adopted by the Securities and Exchange Commission, the Fund intends to no longer mail paper copies of the Fund’s shareholder reports like this one, unless you specifically request paper copies of the reports from the Fund or from your Service Agent or financial intermediary (such as a broker-dealer or bank). Instead, the reports will be made available on a website, and you will be notified by mail each time a report is posted and provided with a website link to access the report.
If you already elected to receive shareholder reports electronically (“e-delivery”), you will not be affected by this change and you need not take any action. If you have not already elected e-delivery, you may elect to receive shareholder reports and other communications from the Fund electronically by contacting your Service Agent or, if you are a direct shareholder with the Fund, by calling 1-877-721-1926.
You may elect to receive all future reports in paper free of charge. If you invest through a Service Agent, you can contact your Service Agent to request that you continue to receive paper copies of your shareholder reports. That election will apply to all Legg Mason Funds held in your account at that Service Agent. If you are a direct shareholder with the Fund, you can call the Fund at 1-877-721-1926, or write to the Fund by regular mail at Legg Mason Funds, P.O. Box 9699, Providence, RI 02940-9699 or by express, certified or registered mail to Legg Mason Funds, 4400 Computer Drive, Westborough, MA 01581 to let the Fund know you wish to continue receiving paper copies of your shareholder reports. That election will apply to all Legg Mason Funds held in your account held directly with the fund complex.

|
| INVESTMENT PRODUCTS: NOT FDIC INSURED • NO BANK GUARANTEE • MAY LOSE VALUE |
Fund objective
The Fund seeks long-term capital appreciation.
Letter from the president

Dear Shareholder,
We are pleased to provide the annual report of QS Global Market Neutral Fund for the twelve-month reporting period ended September 30, 2019. Please read on for a detailed look at prevailing economic and market conditions during the Fund’s reporting period and to learn how those conditions have affected Fund performance.
As always, we remain committed to providing you with excellent service and a full spectrum of investment choices. We also remain committed to supplementing the support you receive from your financial advisor. One way we accomplish this is through our website, www.leggmason.com. Here you can gain immediate access to market and investment information, including:
| • | | Fund prices and performance, |
| • | | Market insights and commentaries from our portfolio managers, and |
| • | | A host of educational resources. |
We look forward to helping you meet your financial goals.
Sincerely,

Jane Trust, CFA
President and Chief Executive Officer
October 31, 2019
| | |
| II | | QS Global Market Neutral Fund |
Fund overview
Q. What is the Fund’s investment strategy?
A.The Fund seeks to provide long-term capital appreciation. The Fund seeks positive returns unrelated to the broad global market by selecting both long and short positions in equity securities from anywhere in the world while applying measures that attempt to control for risk. We at QS Investors, LLC, the Fund’s subadviser, buy equity securities that we consider to be undervalued (“long positions”) and sell short equity securities that we consider to be overvalued (“short positions”). We use quantitative models to select long and short position sizes that we believe will achieve overall market neutrality, thereby attempting to limit the effects of global stock market movements on overall Fund performance. We view market neutrality to mean that the exposure of the long and short positions should offset one another producing a net equity exposure that is approximately +/- 1% under normal market conditions. Because of the Fund’s market neutral strategy, the Fund is intended to have returns that are generally independent of the returns and direction of the global stock market, although there can be no assurance that it will achieve that result.
Under normal market conditions, the Fund will invest primarily in common stocks, preferred stocks, convertible securities, American depositary receipts, global depository receipts, master limited partnerships (MLPs), real estate investment trusts (REITs)i, and securities of other investment companies including exchange-traded funds (ETFs). As a global fund, the Fund can seek investment opportunities anywhere in the world, and under normal market conditions, the Fund will invest in or have exposure to at least three countries, which may include the United States. The Fund may invest without limit in securities in any country, including countries with developed or emerging markets. The Fund may invest in issuers of any market capitalization.
When we deem it to be appropriate, the Fund may enter into various derivative transactions as a principal investment strategy using total return swaps, equity futures, options, warrants, and other similar investments. Derivatives may be used by the Fund as a hedging technique in an attempt to manage risk; as a substitute for buying or selling securities; to provide additional exposure to investment types or market factors; to change the characteristics of the Fund’s portfolio; in an attempt to enhance returns; and to manage cash.
Q. What were the overall market conditions during the Fund’s reporting period?
A.Global equity returns were volatile and mixed across regions and sectors for the twelve-month reporting ended September 30, 2019, with the MSCI All Country World Index (“MSCI ACWI”)ii returning 1.38% for the reporting period. The positive result was driven in the major markets by the U.S., with the resource-based Australia, New Zealand & Canada region posting the best return and Continental Europe being the only other region in positive territory, albeit modestly. Japan was the laggard, particularly in the Materials sector and banks industry.
| | |
| QS Global Market Neutral Fund 2019 Annual Report | | 1 |
Fund overview (cont’d)
The final quarter of 2018 was one of extreme market volatility, including a dip into bear market territory. The MSCI ACWI returned -12.8% in U.S. dollar terms for the fourth quarter of 2018. Global equities across the board were affected by a risk-off sentiment that had not been seen since the global financial crisis. A confluence of factors drove equity markets to one of the worst quarters of the decade. Equity markets both in the U.S. and internationally saw a rotation in October 2018 as the narrow, growth-based names that had driven most of the gains in 2018 became expensive on a number of fundamental metrics. November 2018 saw some relief with global equities posting a modest gain, but in December 2018, equity markets experienced their steepest monthly loss since February 2009, with losses pervasive across geography, sector, style and market cap. In this quarter, the trade issues between the U.S. and China seemed to be headed toward a resolution, but investors were left with uncertainty. China’s manufacturing sector ended the year in contraction; the World Trade Organization (“WTO”) indicated that global trade weakened during the fourth quarter of 2018 and also reduced its outlook for 2019. In the U.S., the Federal Reserve Board (the “Fed”)iii moved to a more dovish stance in the final calendar quarter of 2018 in light of slowing global growth forecasts. In December 2018, the Fed announced a quarter point rate hike, largely expected by the market, but reduced guidance for 2019 to two likely rate hikes rather than the three announced in September 2018. Volatility in U.S. equities was exacerbated at the end of 2018 by news of a partial shutdown of the U.S. government driven by disagreement regarding funding for a Mexican border wall.
The MSCI ACWI returned 12.2% in U.S. dollar terms during the first calendar quarter of 2019, with all regions returning over 6%. After a rally in January 2019, equities continued to generate positive returns for the rest of the quarter. Markets returned to a “risk-on” sentiment as central bank policies became increasingly accommodative, the U.S. experienced a positive earnings season and China manufacturing indicators returned to modest growth levels. Over the quarter, a rise in oil prices of 32% and a U.S. yield curveiv inversion in late March 2019 did little to stop the positive market momentum.
Global equity markets continued to advance in the second quarter of 2019 with the MSCI ACWI returning 3.80%, but with increased volatility. The quarter started with a strong rally in April 2019, only to sharply decline in May 2019, and rebound dramatically in June 2019. The risk on/risk off theme that had dominated financial markets over the past few years continued during the quarter, as most risky assets appreciated dramatically in April and June but exhibited dismal performance during May 2019. The shifts in investor sentiment were propelled by the perception of a number of risks, including an escalation in the U.S.-China trade tariff war, uncertainty around Brexit, an inversion of the yield curve in the U.S. and soft global growth. These risks overshadowed several sources of investor optimism, which included a pivot to accommodative monetary policies by major central banks, positive economic data and a post G-20vmeeting “tariff freeze” agreement between the U.S. and China.
| | |
| 2 | | QS Global Market Neutral Fund 2019 Annual Report |
In the final calendar quarter of the reporting period, the MSCI ACWI returned 0.11%, with the positive performance from U.S. equities largely offset by negative returns in all other regions within the index. Concerns regarding the softening of global economic growth, the previous inversion of the U.S. yield curve, trade related tensions between the U.S. and China, frictions in the Middle East, and uncertainty around Brexit continued to rattle investors. Against this backdrop, the Fed cut its benchmark interest rate twice over the quarter providing some relief to U.S. equity markets, which had the best year-to-date performance since 1997. The Fed was one of 16 central banks to lower interest rates during the quarter, and two dozen more are expected to slash rates in the fourth quarter. The WTO cut its global trade growth forecast for this year to the weakest level in a decade, warning that further rounds of tariffs in an environment of heightened uncertainty could spark a “destructive cycle of recrimination”.
The U.S. was the best performing major region in the MSCI ACWI for the reporting period. After a difficult fourth quarter of 2018 where most sectors had double-digit declines, U.S. equities began 2019 with their best first calendar quarter return since 1998. Investor optimism continued and most sectors had double-digit returns. The Fed suggested that mixed economic signals justified a revised approach to interest rate hikes, making them unlikely for the rest of 2019. Indeed, after the Fed meeting in June 2019, Chairman Jerome Powell’s comments were perceived as dovish, and the “dots” projections showed that seven policymakers are forecasting fifty basis pointsvi of cuts by calendar year end. At the end of the reporting period, the U.S. economy remained on a stronger footing than most other major markets, driven by robust employment and consumer spending numbers, despite contraction within the manufacturing index. However, consumer, business and investor confidence indices were at multi-year lows.
Continental Europe was the only other major region outside of the U.S. with a positive return for the reporting period, despite the fact that in the first quarter of 2019, economic indicators weakened across much of the Eurozone; the European Central Bank (“ECB”)viicut its growth forecasts, cancelled an expected rate rise in 2019, and offered cheap rates to banks to boost growth. Continental Europe outperformed in the second calendar quarter of 2019 but underperformed in the final quarter of the reporting period, and in September 2019, the ECB voted to restart its quantitative easing program, pushing interest rates into deeper negative territory and further incentivizing bank lending.
Japanese equities lagged all other markets for much of the reporting period. Japan slightly underperformed the other large markets in the final quarter of 2018 as economic indicators softened and business sentiment declined, with optimism for the 2020 Olympics overshadowed by concern over an impending sales tax increase. Japanese manufacturing experienced the largest contraction in nearly three years in March of 2019 due to both domestic and export declines, particularly in sales to China and Taiwan. Nonetheless, in the final quarter of the reporting period, only Japanese equities were in positive territory; while exports fell due to a slowing global economy and the U.S.-China trade war, private spending continued to show strength ahead of a consumption tax increase scheduled for October 1, 2019.
| | |
| QS Global Market Neutral Fund 2019 Annual Report | | 3 |
Fund overview (cont’d)
The U.K. also underperformed the MSCI ACWI overall for the reporting period, with the uncertainty and fear around a no-deal Brexit impacting business activity and equity markets. At the start of the period, the U.K. outperformed the other large developed regions, with manufacturing and services improving above expectations at the end of 2018. However, in the first quarter of 2019, the deadline for Brexit was delayed after Parliament voted a third time against Prime Minister Theresa May’s negotiated deal. While employment levels remained high, new hiring and business sentiment continued to fall amid uncertainty about trade with Europe and other markets. The resignation of Theresa May in July 2019 and the hawkish position of her successor, Boris Johnson, added to Brexit uncertainty. U.K. equity markets rallied in September 2019 as Parliament passed the Benn Act, a bill that reduces the probability of a no-deal Brexit by forcing the Prime Minister to seek a three-month extension in case no deal is reached by October 19, 2019.
After outperforming developed markets in the fourth quarter of 2018 and in January 2019, emerging markets underperformed most developed markets for the remainder of the reporting period.
Across the smaller regions, resource-based Australia, New Zealand & Canada outperformed the MSCI ACWI overall throughout the reporting period, in a period of industrial commodity strength, while Developed Asia ex-Japan underperformed.
Q. How did we respond to these changing market conditions?
A.Given that our process is designed to limit the effects of global stock market movements on overall Fund performance, changing market conditions do not necessitate a change in our process.
Performance review
For the twelve months ended September 30, 2019, Class A shares of QS Global Market Neutral Fund, excluding sales charges, returned -7.49%. The Fund’s unmanaged benchmark, the FTSE 3-Month U.S. Treasury Bill Indexviii, returned 2.36% for the same period. The Lipper Alternative Equity Market Neutral Funds Category Averageix returned -3.84% over the same time frame.
| | |
| 4 | | QS Global Market Neutral Fund 2019 Annual Report |
| | | | | | | | |
Performance Snapshotas of September 30, 2019
(unaudited) | |
| (excluding sales charges) | | 6 months | | | 12 months | |
| QS Global Market Neutral Fund: | | | | | | | | |
Class A | | | -4.96 | % | | | -7.49 | % |
Class C | | | -5.40 | % | | | -8.14 | % |
Class I | | | -4.85 | % | | | -7.25 | % |
Class IS | | | -4.84 | % | | | -7.13 | % |
| FTSE 3-Month U.S. Treasury Bill Index | | | 1.18 | % | | | 2.36 | % |
| Lipper Alternative Equity Market Neutral Funds Category Average | | | -1.87 | % | | | -3.84 | % |
The performance shown represents past performance. Past performance is no guarantee of future results and current performance may be higher or lower than the performance shown above. Principal value and investment returns will fluctuate and investors’ shares, when redeemed, may be worth more or less than their original cost. To obtain performance data current to the most recent month-end, please visit our website at www.leggmason.com/mutualfunds.
All share class returns assume the reinvestment of all distributions at net asset value and the deduction of all Fund expenses. Returns have not been adjusted to include sales charges that may apply or the deduction of taxes that a shareholder would pay on Fund distributions. If sales charges were reflected, the performance quoted would be lower. Performance figures for periods shorter than one year represent cumulative figures and are not annualized.
Fund performance figures reflect fee waivers and/or expense reimbursements, without which the performance would have been lower.
|
| Total Annual Operating Expenses (unaudited) |
As of the Fund’s current prospectus dated February 1, 2019, the gross total annual fund operating expense ratios for Class A, Class C, Class I and Class IS shares were 3.42%, 4.56%, 3.20% and 3.18%, respectively.
Actual expenses may be higher. For example, expenses may be higher than those shown if average net assets decrease. Net assets are more likely to decrease and Fund expense ratios are more likely to increase when markets are volatile.
As a result of expense limitation arrangements, the ratio of total annual fund operating expenses, other than interest, brokerage commissions and expenses, fees, costs and expenses associated with any prime brokerage arrangement (including the costs of any securities borrowing arrangement); dividend and interest expenses on securities sold short, taxes, extraordinary expenses and acquired fund fees and expenses, to average net assets will not exceed 1.55% for Class A shares, 2.30% for Class C shares, 1.20% for Class I shares and 1.10% for Class IS shares. In addition, the ratio of total annual fund operating expenses for Class IS shares will not exceed the ratio of total annual fund operating expenses for Class I shares. Total annual fund operating expenses after waiving fees and/or reimbursing expenses, as applicable, exceed the expense cap for each class as a result of acquired fund fees and expenses and dividend and interest expenses on securities sold short. These expense limitation arrangements cannot be terminated prior to December 31, 2020 without the Board of Trustees’ consent.
| | |
| QS Global Market Neutral Fund 2019 Annual Report | | 5 |
Fund overview (cont’d)
The manager is permitted to recapture amounts waived and/or reimbursed to a class within three years after the fiscal year in which the manager earned the fee or incurred the expense if the class’ total annual operating expenses have fallen to a level below the expense limitation (“expense cap”) in effect at the time the fees were earned or the expenses incurred. In no case will the manager recapture any amount that would result, on any particular business day of the Fund, in the class’ total annual operating expenses exceeding the expense cap or any other lower limit then in effect.
Q. What were the leading contributors to performance?
A.The leading contributor to performance at the region level was stock selection within the U.K. Across sectors, performance was strong in the Health Care and Energy sectors, and in the banks industry. While the global stock selection model that we employ in managing the Fund has been improving since the fourth quarter of 2018, performance was still in negative territory for the reporting period. Valuation was strong during the fourth quarter of 2018, while Sentiment was strong, especially within the Expectations dimension, during the second and third quarters of 2019.
Q. What were the leading detractors from performance?
A.Stock selection in Japan was a leading detractor from performance at the region level for the reporting period overall; weak performance across the Materials and Consumer Discretionary sectors also detracted. The fourth quarter of 2018 was the worst performing quarter in the last twelve months, with the Sentiment dimension in the model being very weak across all categories, specifically across Earnings Growth factors. Traditional valuation metrics and measures of cash flow were extremely weak in the first and second quarters of 2019.
Q. Were there any significant changes to the Fund during the period?
A. There were no significant changes to the Fund during the reporting period.
Thank you for your investment in QS Global Market Neutral Fund. As always, we appreciate that you have chosen us to manage your assets and we remain focused on achieving the Fund’s investment goals.
Sincerely,
QS Investors, LLC
October 18, 2019
RISKS: Equity securities are subject to market and price fluctuations. Small- and mid-cap stocks involve greater risks and volatility than large-cap stocks. Foreign investments are subject to special risks including currency fluctuations and social, economic and political uncertainties, which could increase volatility. These risks are magnified in emerging markets. The Fund uses short positions in combination with long positions in a market neutral strategy to try to neutralize exposure to the global stock market and capture a positive return, regardless of the direction of the market. The Fund’s market neutral strategy may result in greater losses or lower positive
| | |
| 6 | | QS Global Market Neutral Fund 2019 Annual Report |
returns than if the Fund held only long positions. Although the subadviser’s models were created to improve performance and to reduce overall portfolio risk, there is no guarantee that these models and the Fund’s market neutral strategy will be successful. The overall performance of the Fund depends on the net performance of its long and short positions, and it is possible for the Fund to experience a net loss across all positions. The Fund may employ leverage, which increases the volatility of investment returns and subjects the Fund to magnified losses if the Fund’s investments decline in value. The Fund may use derivatives, such as options and futures, which can be illiquid, may disproportionately increase losses, and have a potentially large impact on Fund performance. The Fund may employ short selling, a speculative strategy. Unlike the possible loss on a security that is purchased, there is no limit on the amount of loss on an appreciating security that is sold short. There is no assurance strategies used by the Fund will be successful. Active and frequent trading may increase a shareholder’s tax liability and transaction costs, which could detract from Fund performance. Some assets held by the Fund may be impossible or difficult to sell, particularly during times of market turmoil. These illiquid assets may also be difficult to value. If the Fund is forced to sell an illiquid asset to meet redemption requests or other cash needs, the Fund may be forced to sell at a loss. There can be no assurance that the Fund will engage in hedging transactions at any given time, even under volatile market conditions, or that any hedging transactions the Fund engages in will be successful. Hedging transactions involve costs and may reduce gains or result in losses. Additional risks may include those risks associated with REITs, MLPs and investing in securities issued by other investment companies, including ETFs. Please see the Fund’s prospectus for a more complete discussion of these and other risks and the Fund’s investment strategies.
Portfolio holdings and breakdowns are as of September 30, 2019 and are subject to change and may not be representative of the portfolio managers’ current or future investments. The Fund’s top ten holdings (as a percentage of net assets) as of September 30, 2019 were: Bellway PLC (0.7%), Lloyds Banking Group PLC (0.7%), ASML Holding NV (0.6%), Canadian Natural Resources Ltd. (0.6%), Hazama Ando Corp. (0.6%), Roche Holding AG (0.6%%), Glencore PLC (0.6%), Eastman Chemical Co. (0.6%), Ally Financial Inc. (0.6%) and Air Canada (0.6%). Please refer to pages 15 through 35 for a list and percentage breakdown of the Fund’s holdings.
The mention of sector breakdowns is for informational purposes only and should not be construed as a recommendation to purchase or sell any securities. The information provided regarding such sectors is not a sufficient basis upon which to make an investment decision. Investors seeking financial advice regarding the appropriateness of investing in any securities or investment strategies discussed should consult their financial professional. The Fund’s top five sector holdings (as a percentage of net assets) as of September 30, 2019 were: Industrials (17.5%), Consumer Discretionary (13.8%), Information Technology (11.4%), Materials (10.3%) and Financials (9.2%). The Fund’s portfolio composition is subject to change at any time.
All investments are subject to risk including the possible loss of principal. Past performance is no guarantee of future results. All index performance reflects no deduction for fees, expenses or taxes. Please note that an investor cannot invest directly in an index.
The information provided is not intended to be a forecast of future events, a guarantee of future results or investment advice. Views expressed may differ from those of the firm as a whole.
| | |
| QS Global Market Neutral Fund 2019 Annual Report | | 7 |
Fund overview (cont’d)
| i | Real estate investment trusts (“REITs”) invest in real estate or loans secured by real estate and issue shares in such investments, which can be illiquid. |
| ii | The MSCI All Country World Index (“MSCI ACWI”) a market capitalization weighted index that is designed to measure the equity market performance of developed and emerging markets. The MSCI ACWI consists of 45 country indices comprising 24 developed and 21 emerging market country indices. |
| iii | The Federal Reserve Board (the “Fed”) is responsible for the formulation of U.S. policies designed to promote economic growth, full employment, stable prices and a sustainable pattern of international trade and payments. |
| iv | The yield curve is the graphical depiction of the relationship between the yield on bonds of the same credit quality but different maturities. |
| v | The Group of Twenty (“G-20”) Finance Ministers and Central Bank Governors was established in 1999 to bring together systemically important industrialized and developing economies to discuss key issues in the global economy. |
| vi | A basis point is one-hundredth (1/100 or 0.01) of one percent. |
| vii | The European Central Bank (“ECB”) is responsible for the monetary system of the European Union and the euro currency. |
| viii | The FTSE 3-Month U.S. Treasury Bill Index is an unmanaged index generally representative of the average yield of 3-month U.S. Treasury bills. |
| ix | Lipper, Inc., a wholly-owned subsidiary of Reuters, provides independent insight on global collective investments. Returns are based on the period ended September 30, 2019, including the reinvestment of all distributions, including returns of capital, if any, calculated among the 92 funds for the six-month period and among the 92 funds for the twelve-month period in the Fund’s Lipper category, and excluding sales charges, if any. |
| | |
| 8 | | QS Global Market Neutral Fund 2019 Annual Report |
Fund at a glance(unaudited)
Investment breakdown†(%) as a percent of total investments
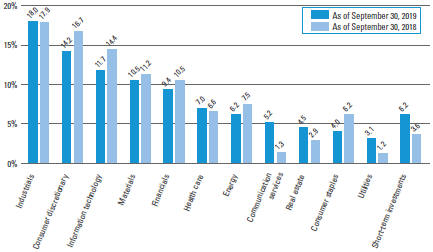
| † | The bar graph above represents the composition of the Fund’s investments as of September 30, 2019 and September 30, 2018 and does not include derivatives, such as forward foreign currency contracts. The Fund is actively managed. As a result, the composition of the Fund’s investments is subject to change at any time. |
Securities sold short breakdown*(%) as a percent of total securities sold short
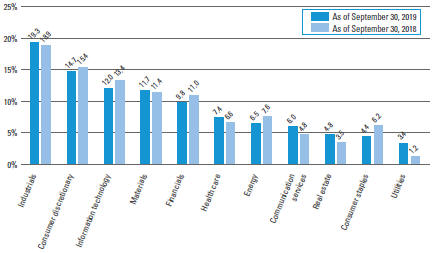
| * | The bar graph above represents the composition of the Fund’s investments sold short as of September 30, 2019 and September 30, 2018 and does not include derivatives. The Fund is actively managed. As a result, the composition of the Fund’s investments is subject to change at any time. |
| | |
| QS Global Market Neutral Fund 2019 Annual Report | | 9 |
Fund expenses(unaudited)
Example
As a shareholder of the Fund, you may incur two types of costs: (1) transaction costs, including front-end and back-end sales charges (loads) on purchase payments; and (2) ongoing costs, including management fees; service and/or distribution (12b-1) fees; and other Fund expenses. This example is intended to help you understand your ongoing costs (in dollars) of investing in the Fund and to compare these costs with the ongoing costs of investing in other mutual funds.
This example is based on an investment of $1,000 invested on April 1, 2019 and held for the six months ended September 30, 2019.
Actual expenses
The table below titled “Based on Actual Total Return” provides information about actual account values and actual expenses. You may use the information provided in this table, together with the amount you invested, to estimate the expenses that you paid over the period. To estimate the expenses you paid on your account, divide your ending account value by $1,000 (for example, an $8,600 ending account value divided by $1,000 = 8.6), then multiply the result by the number under the heading entitled “Expenses Paid During the Period”.
Hypothetical example for comparison purposes
The table below titled “Based on Hypothetical Total Return” provides information about hypothetical account values and hypothetical expenses based on the actual expense ratio and an assumed rate of return of 5.00% per year before expenses, which is not the Fund’s actual return. The hypothetical account values and expenses may not be used to estimate the actual ending account balance or expenses you paid for the period. You may use the information provided in this table to compare the ongoing costs of investing in the Fund and other funds. To do so, compare the 5.00% hypothetical example relating to the Fund with the 5.00% hypothetical examples that appear in the shareholder reports of the other funds.
Please note that the expenses shown in the table below are meant to highlight your ongoing costs only and do not reflect any transactional costs, such as front-end or back-end sales charges (loads). Therefore, the table is useful in comparing ongoing costs only, and will not help you determine the relative total costs of owning different funds. In addition, if these transaction costs were included, your costs would have been higher.
| | | | | | | | | | | | | | | | | | | | | | | | | | | | | | | | | | | | | | | | | | | | | | |
| | | |
| Based on actual total return1 | | | | | | | | | Based on hypothetical total return1 | |
| | | Actual
Total Return
Without
Sales
Charge2 | | | Beginning
Account
Value | | | Ending
Account
Value | | | Annualized
Expense
Ratio | | | Expenses
Paid
During
the
Period3 | | | | | | | | Hypothetical
Beginning
Annualized
Total Return | | | Beginning
Account
Value | | | Ending
Account
Value | | | Annualized
Expense
Ratio | | | Expenses
Paid
During
the
Period3 | |
| Class A | | | -4.96 | % | | $ | 1,000.00 | | | $ | 950.40 | | | | 3.54 | % | | $ | 17.31 | | | | | | | Class A | | | 5.00 | % | | $ | 1,000.00 | | | $ | 1,007.32 | | | | 3.54 | % | | $ | 17.81 | |
| Class C | | | -5.40 | | | | 1,000.00 | | | | 946.00 | | | | 4.20 | | | | 20.49 | | | | | | | Class C | | | 5.00 | | | | 1,000.00 | | | | 1,004.01 | | | | 4.20 | | | | 21.10 | |
| Class I | | | -4.85 | | | | 1,000.00 | | | | 951.50 | | | | 3.18 | | | | 15.56 | | | | | | | Class I | | | 5.00 | | | | 1,000.00 | | | | 1,009.12 | | | | 3.18 | | | | 16.02 | |
| Class IS | | | -4.84 | | | | 1,000.00 | | | | 951.60 | | | | 3.08 | | | | 15.07 | | | | | | | Class IS | | | 5.00 | | | | 1,000.00 | | | | 1,009.63 | | | | 3.08 | | | | 15.52 | |
| | |
| 10 | | QS Global Market Neutral Fund 2019 Annual Report |
| 1 | For the six months ended September 30, 2019. |
| 2 | Assumes the reinvestment of all distributions, including returns of capital, if any, at net asset value and does not reflect the deduction of the applicable sales charge with respect to Class A shares or the applicable contingent deferred sales charge (“CDSC”) with respect to Class C shares. Total return is not annualized, as it may not be representative of the total return for the year. Performance figures may reflect compensating balance arrangements, fee waivers and/or expense reimbursements. In the absence of compensating balance arrangements, fee waivers and/or expense reimbursements, the total return would have been lower. Past performance is no guarantee of future results. |
| 3 | Expenses (net of compensating balance arrangements, fee waivers and/or expense reimbursements) are equal to each class’ respective annualized expense ratio multiplied by the average account value over the period, multiplied by the number of days in the most recent fiscal half-year (183), then divided by 365. |
| | |
| QS Global Market Neutral Fund 2019 Annual Report | | 11 |
Fund performance(unaudited)
| | | | | | | | | | | | | | | | |
| Average annual total returns | | | | | | | | | | | | |
| Without sales charges1 | | Class A | | | Class C | | | Class I | | | Class IS | |
| Twelve Months Ended 9/30/19 | | | -7.49 | % | | | -8.14 | % | | | -7.25 | % | | | -7.13 | % |
| Inception* through 9/30/19 | | | -0.94 | | | | -5.03 | | | | -0.64 | | | | -0.58 | |
| | | | |
| With sales charges2 | | Class A | | | Class C | | | Class I | | | Class IS | |
| Twelve Months Ended 9/30/19 | | | -12.80 | % | | | -9.04 | % | | | -7.25 | % | | | -7.13 | % |
| Inception* through 9/30/19 | | | -2.45 | | | | -5.03 | | | | -0.64 | | | | -0.58 | |
| | | | |
| Cumulative total returns | |
| Without sales charges1 | | | |
| Class A (Inception date of 11/30/15 through 9/30/19) | | | -3.54 | % |
| Class C (Inception date of 7/16/18 through 9/30/19) | | | -6.04 | |
| Class I (Inception date of 11/30/15 through 9/30/19) | | | -2.44 | |
| Class IS (Inception date of 11/30/15 through 9/30/19) | | | -2.22 | |
All figures represent past performance and are not a guarantee of future results. Investment return and principal value of an investment will fluctuate so that an investor’s shares, when redeemed, may be worth more or less than their original cost. The returns shown do not reflect the deduction of taxes that a shareholder would pay on Fund distributions or the redemption of Fund shares. Performance figures may reflect compensating balance arrangements, fee waivers and/or expense reimbursements. In the absence of compensating balance arrangements, fee waivers and/or expense reimbursements, the total return would have been lower.
| 1 | Assumes the reinvestment of all distributions, including returns of capital, if any, at net asset value and does not reflect the deduction of the applicable sales charge with respect to Class A shares or the applicable contingent deferred sales charge (“CDSC”) with respect to Class C shares. |
| 2 | Assumes the reinvestment of all distributions, including returns of capital, if any, at net asset value. In addition, Class A shares reflect the deduction of the maximum initial sales charge of 5.75%. Class C shares reflect the deduction of a 1.00% CDSC, which applies if shares are redeemed within one year from purchase payment. |
| * | Inception date for Class A, I and IS shares is November 30, 2015 and for Class C is July 16, 2018. |
| | |
| 12 | | QS Global Market Neutral Fund 2019 Annual Report |
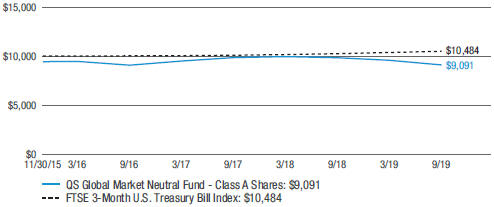
Historical performance
Value of $10,000 invested in
Class A Shares of QS Global Market Neutral Fund vs. FTSE 3-Month U.S. Treasury Bill Index† — November 30, 2015 - September 2019
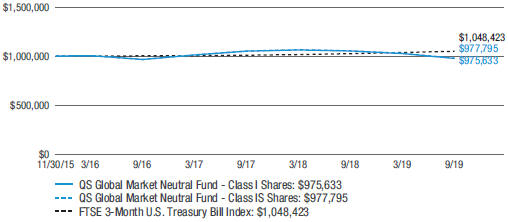
Value of $1,000,000 invested in
Class I and IS Shares of QS Global Market Neutral Fund vs. FTSE 3-Month U.S. Treasury Bill Index† — November 30, 2015 - September 2019
All figures represent past performance and are not a guarantee of future results. Investment return and principal value of an investment will fluctuate so that an investor’s shares, when redeemed, may be worth more or less than their original cost. The returns shown do not reflect the deduction of taxes that a shareholder would pay on Fund distributions or the redemption of Fund shares. Performance figures may reflect compensating balance arrangements, fee waivers and/or expense reimbursements. In the absence of compensating balance arrangements, fee waivers and/or expense reimbursements, the total return would have been lower.
| | |
| QS Global Market Neutral Fund 2019 Annual Report | | 13 |
Fund performance(unaudited) (cont’d)
| † | Hypothetical illustration of $10,000 invested in Class A shares and $1,000,000 invested in Class I and IS shares of QS Global Market Neutral Fund on November 30, 2015 (inception date), assuming the deduction of the maximum initial sales charge of 5.75% at the time of investment for Class A shares and the reinvestment of all distributions, including returns of capital, if any, at net asset value through September 30, 2019. The hypothetical illustration also assumes a $10,000 or $1,000,000 investment, as applicable, in the FTSE 3-Month U.S. Treasury Bill Index. The FTSE 3-Month U.S. Treasury Bill Index is an unmanaged market index generally representative of the average yield of 3-month U.S. Treasury bills. The Index is unmanaged and not subject to the same management and trading expenses as a mutual fund. Please note that an investor cannot invest directly in an index. The performance of the Fund’s other class may be greater or less than the Class A, I and IS shares’ performance indicated on these charts, depending on whether greater or lesser sales charges and fees were incurred by shareholders investing in the other class. |
| | |
| 14 | | QS Global Market Neutral Fund 2019 Annual Report |
Schedule of investments
September 30, 2019
QS Global Market Neutral Fund
| | | | | | | | | | | | | | | | |
| Security | | | | | | | | Shares | | | Value | |
| Common Stocks — 90.7% | | | | | | | | | | | | | | | | |
| Communication Services — 5.0% | | | | | | | | | | | | | | | | |
Entertainment — 1.2% | | | | | | | | | | | | | | | | |
Electronic Arts Inc. | | | | | | | | | | | 2,645 | | | $ | 258,734 | *(a) |
IMAX Corp. | | | | | | | | | | | 12,929 | | | | 283,792 | *(a) |
Viacom Inc., Class B Shares | | | | | | | | | | | 9,403 | | | | 225,954 | (a) |
Total Entertainment | | | | | | | | | | | | | | | 768,480 | |
Interactive Media & Services — 1.7% | | | | | | | | | | | | | | | | |
Auto Trader Group PLC | | | | | | | | | | | 59,504 | | | | 373,068 | (b) |
Dip Corp. | | | | | | | | | | | 8,200 | | | | 199,164 | (b) |
Snap Inc., Class A Shares | | | | | | | | | | | 15,427 | | | | 243,747 | *(a) |
TripAdvisor Inc. | | | | | | | | | | | 7,052 | | | | 272,771 | *(a) |
Total Interactive Media & Services | | | | | | | | | | | | | | | 1,088,750 | |
Media — 2.1% | | | | | | | | | | | | | | | | |
AMC Networks Inc., Class A Shares | | | | | | | | | | | 4,408 | | | | 216,697 | *(a) |
Corus Entertainment Inc., Class B Shares | | | | | | | | | | | 62,100 | | | | 247,959 | |
Fuji Media Holdings | | | | | | | | | | | 18,200 | | | | 235,392 | (b) |
Nexstar Broadcasting Group Inc., Class A Shares | | | | | | | | | | | 2,204 | | | | 225,491 | (a) |
Sinclair Broadcast Group Inc., Class A Shares | | | | | | | | | | | 7,199 | | | | 307,685 | (a) |
ValueCommerce Co. Ltd. | | | | | | | | | | | 7,300 | | | | 116,089 | (b) |
Total Media | | | | | | | | | | | | | | | 1,349,313 | |
Total Communication Services | | | | | | | | | | | | | | | 3,206,543 | |
| Consumer Discretionary — 13.2% | | | | | | | | | | | | | | | | |
Auto Components — 1.5% | | | | | | | | | | | | | | | | |
CIE Automotive SA | | | | | | | | | | | 11,901 | | | | 298,657 | (b) |
Magna International Inc. | | | | | | | | | | | 6,600 | | | | 351,807 | |
TS Tech Co. Ltd. | | | | | | | | | | | 10,000 | | | | 306,084 | (b) |
Total Auto Components | | | | | | | | | | | | | | | 956,548 | |
Distributors — 0.5% | | | | | | | | | | | | | | | | |
Inchcape PLC | | | | | | | | | | | 39,669 | | | | 308,005 | (b) |
Hotels, Restaurants & Leisure — 3.2% | | | | | | | | | | | | | | | | |
Aristocrat Leisure Ltd. | | | | | | | | | | | 13,223 | | | | 274,195 | (b) |
Betsson AB | | | | | | | | | | | 19,100 | | | | 92,484 | *(b) |
BJ’s Restaurants Inc. | | | | | | | | | | | 3,673 | | | | 142,659 | (a) |
EI Group PLC | | | | | | | | | | | 102,098 | | | | 353,163 | *(b) |
Evolution Gaming Group AB | | | | | | | | | | | 13,208 | | | | 260,135 | (b) |
Greggs PLC | | | | | | | | | | | 7,500 | | | | 192,791 | (b) |
Starbucks Corp. | | | | | | | | | | | 3,820 | | | | 337,764 | (a) |
Yum! Brands Inc. | | | | | | | | | | | 3,300 | | | | 374,319 | (a) |
Total Hotels, Restaurants & Leisure | | | | | | | | | | | | | | | 2,027,510 | |
See Notes to Financial Statements.
| | |
| QS Global Market Neutral Fund 2019 Annual Report | | 15 |
Schedule of investments (cont’d)
September 30, 2019
QS Global Market Neutral Fund
| | | | | | | | | | | | | | | | |
| Security | | | | | | | | Shares | | | Value | |
Household Durables — 2.6% | | | | | | | | | | | | | | | | |
Bellway PLC | | | | | | | | | | | 10,214 | | | $ | 420,204 | (b) |
Berkeley Group Holdings PLC | | | | | | | | | | | 6,353 | | | | 326,429 | (b) |
Bovis Homes Group PLC | | | | | | | | | | | 16,319 | | | | 223,522 | (b) |
Forbo Holding AG, Registered Shares | | | | | | | | | | | 206 | | | | 305,824 | (b) |
Redrow PLC | | | | | | | | | | | 48,577 | | | | 369,113 | (b) |
Total Household Durables | | | | | | | | | | | | | | | 1,645,092 | |
Internet & Direct Marketing Retail — 0.8% | | | | | | | | | | | | | | | | |
Booking Holdings Inc. | | | | | | | | | | | 147 | | | | 288,504 | *(a) |
Real Matters Inc. | | | | | | | | | | | 26,000 | | | | 216,658 | * |
Total Internet & Direct Marketing Retail | | | | | | | | | | | | | | | 505,162 | |
Multiline Retail — 0.8% | | | | | | | | | | | | | | | | |
Izumi Co. Ltd. | | | | | | | | | | | 4,100 | | | | 161,181 | (b) |
Next PLC | | | | | | | | | | | 4,763 | | | | 362,286 | (b) |
Total Multiline Retail | | | | | | | | | | | | | | | 523,467 | |
Specialty Retail — 2.2% | | | | | | | | | | | | | | | | |
Best Buy Co. Inc. | | | | | | | | | | | 3,823 | | | | 263,749 | (a) |
Dunelm Group PLC | | | | | | | | | | | 28,356 | | | | 292,265 | (b) |
Home Depot Inc. | | | | | | | | | | | 1,383 | | | | 320,884 | (a) |
JD Sports Fashion PLC | | | | | | | | | | | 33,000 | | | | 304,870 | (b) |
Tractor Supply Co. | | | | | | | | | | | 2,351 | | | | 212,624 | (a) |
Total Specialty Retail | | | | | | | | | | | | | | | 1,394,392 | |
Textiles, Apparel & Luxury Goods — 1.6% | | | | | | | | | | | | | | | | |
adidas AG | | | | | | | | | | | 1,225 | | | | 381,248 | (b) |
Deckers Outdoor Corp. | | | | | | | | | | | 2,400 | | | | 353,664 | *(a) |
Under Armour Inc., Class A Shares | | | | | | | | | | | 14,692 | | | | 292,958 | *(a) |
Total Textiles, Apparel & Luxury Goods | | | | | | | | | | | | | | | 1,027,870 | |
Total Consumer Discretionary | | | | | | | | | | | | | | | 8,388,046 | |
| Consumer Staples — 3.9% | | | | | | | | | | | | | | | | |
Beverages — 0.8% | | | | | | | | | | | | | | | | |
Monster Beverage Corp. | | | | | | | | | | | 3,820 | | | | 221,789 | *(a) |
Suntory Beverage & Food Ltd. | | | | | | | | | | | 7,200 | | | | 307,942 | (b) |
Total Beverages | | | | | | | | | | | | | | | 529,731 | |
Food & Staples Retailing — 0.9% | | | | | | | | | | | | | | | | |
Colruyt SA | | | | | | | | | | | 4,112 | | | | 225,316 | (b) |
Seven & i Holdings Co. Ltd. | | | | | | | | | | | 8,800 | | | | 337,699 | (b) |
Total Food & Staples Retailing | | | | | | | | | | | | | | | 563,015 | |
Food Products — 0.6% | | | | | | | | | | | | | | | | |
Calbee Inc. | | | | | | | | | | | 6,600 | | | | 205,797 | (b) |
Simply Good Foods Co. | | | | | | | | | | | 6,500 | | | | 188,435 | *(a) |
Total Food Products | | | | | | | | | | | | | | | 394,232 | |
See Notes to Financial Statements.
| | |
| 16 | | QS Global Market Neutral Fund 2019 Annual Report |
QS Global Market Neutral Fund
| | | | | | | | | | | | | | | | |
| Security | | | | | | | | Shares | | | Value | |
Household Products — 0.5% | | | | | | | | | | | | | | | | |
Kimberly-Clark Corp. | | | | | | | | | | | 2,057 | | | $ | 292,197 | (a) |
Personal Products — 0.6% | | | | | | | | | | | | | | | | |
Unilever PLC | | | | | | | | | | | 6,200 | | | | 372,796 | (b) |
Tobacco — 0.5% | | | | | | | | | | | | | | | | |
Swedish Match AB | | | | | | | | | | | 7,934 | | | | 328,210 | (b) |
Total Consumer Staples | | | | | | | | | | | | | | | 2,480,181 | |
| Energy — 6.1% | | | | | | | | | | | | | | | | |
Energy Equipment & Services — 0.9% | | | | | | | | | | | | | | | | |
Petrofac Ltd. | | | | | | | | | | | 41,138 | | | | 201,855 | (b) |
Precision Drilling Corp. | | | | | | | | | | | 106,200 | | | | 121,843 | * |
Tecnicas Reunidas SA | | | | | | | | | | | 8,815 | | | | 215,867 | *(b) |
Total Energy Equipment & Services | | | | | | | | | | | | | | | 539,565 | |
Oil, Gas & Consumable Fuels — 5.2% | | | | | | | | | | | | | | | | |
Canadian Natural Resources Ltd. | | | | | | | | | | | 15,350 | | | | 408,414 | |
ConocoPhillips | | | | | | | | | | | 3,967 | | | | 226,040 | (a) |
Enerplus Corp. | | | | | | | | | | | 25,000 | | | | 186,247 | |
Imperial Oil Ltd. | | | | | | | | | | | 13,760 | | | | 358,320 | |
Lundin Petroleum AB | | | | | | | | | | | 10,872 | | | | 325,233 | (b) |
Repsol SA | | | | | | | | | | | 23,959 | | | | 373,718 | (b) |
Royal Dutch Shell PLC, Class A Shares | | | | | | | | | | | 11,819 | | | | 345,461 | (b) |
Saras SpA | | | | | | | | | | | 124,885 | | | | 213,887 | (b) |
Seven Generations Energy Ltd., Class A Shares | | | | | | | | | | | 32,500 | | | | 206,552 | * |
Suncor Energy Inc. | | | | | | | | | | | 10,700 | | | | 337,512 | |
Valero Energy Corp. | | | | | | | | | | | 3,854 | | | | 328,515 | (a) |
Total Oil, Gas & Consumable Fuels | | | | | | | | | | | | | | | 3,309,899 | |
Total Energy | | | | | | | | | | | | | | | 3,849,464 | |
| Financials — 9.2% | | | | | | | | | | | | | | | | |
Banks — 2.3% | | | | | | | | | | | | | | | | |
Banco Bilbao Vizcaya Argentaria SA | | | | | | | | | | | 73,437 | | | | 383,144 | (b) |
Comerica Inc. | | | | | | | | | | | 2,900 | | | | 191,371 | (a) |
DNB ASA | | | | | | | | | | | 12,200 | | | | 215,393 | (b) |
Lloyds Banking Group PLC | | | | | | | | | | | 620,000 | | | | 413,464 | (b) |
Yamaguchi Financial Group Inc. | | | | | | | | | | | 40,100 | | | | 277,044 | (b) |
Total Banks | | | | | | | | | | | | | | | 1,480,416 | |
Capital Markets — 1.6% | | | | | | | | | | | | | | | | |
AllianceBernstein Holding LP | | | | | | | | | | | 7,346 | | | | 215,605 | (a) |
CI Financial Corp. | | | | | | | | | | | 13,200 | | | | 192,592 | |
Intermediate Capital Group PLC | | | | | | | | | | | 13,517 | | | | 241,686 | (b) |
State Street Corp. | | | | | | | | | | | 5,583 | | | | 330,458 | (a) |
Total Capital Markets | | | | | | | | | | | | | | | 980,341 | |
See Notes to Financial Statements.
| | |
| QS Global Market Neutral Fund 2019 Annual Report | | 17 |
Schedule of investments (cont’d)
September 30, 2019
QS Global Market Neutral Fund
| | | | | | | | | | | | | | | | |
| Security | | | | | | | | Shares | | | Value | |
Consumer Finance — 0.6% | | | | | | | | | | | | | | | | |
Ally Financial Inc. | | | | | | | | | | | 11,754 | | | $ | 389,763 | (a) |
Diversified Financial Services — 0.3% | | | | | | | | | | | | | | | | |
Financial Products Group Co. Ltd. | | | | | | | | | | | 17,600 | | | | 176,709 | (b) |
Insurance — 4.1% | | | | | | | | | | | | | | | | |
Aegon NV | | | | | | | | | | | 70,057 | | | | 291,343 | (b) |
Allianz SE, Registered Shares | | | | | | | | | | | 1,322 | | | | 308,285 | (b) |
ASR Nederland NV | | | | | | | | | | | 9,462 | | | | 349,643 | (b) |
Aviva PLC | | | | | | | | | | | 74,350 | | | | 364,619 | (b) |
AXA SA | | | | | | | | | | | 6,200 | | | | 158,475 | (b) |
Japan Post Insurance Co. Ltd. | | | | | | | | | | | 12,500 | | | | 189,239 | (b) |
Manulife Financial Corp. | | | | | | | | | | | 20,600 | | | | 377,839 | |
MetLife Inc. | | | | | | | | | | | 6,612 | | | | 311,822 | (a) |
T&D Holdings Inc. | | | | | | | | | | | 25,700 | | | | 274,417 | (b) |
Total Insurance | | | | | | | | | | | | | | | 2,625,682 | |
Thrifts & Mortgage Finance — 0.3% | | | | | | | | | | | | | | | | |
Deutsche Pfandbriefbank AG | | | | | | | | | | | 13,163 | | | | 160,633 | (b) |
Total Financials | | | | | | | | | | | | | | | 5,813,544 | |
| Health Care — 6.8% | | | | | | | | | | | | | | | | |
Biotechnology — 0.3% | | | | | | | | | | | | | | | | |
Regeneron Pharmaceuticals Inc. | | | | | | | | | | | 735 | | | | 203,889 | *(a) |
Health Care Equipment & Supplies — 0.5% | | | | | | | | | | | | | | | | |
Masimo Corp. | | | | | | | | | | | 1,910 | | | | 284,189 | *(a) |
Health Care Providers & Services — 1.3% | | | | | | | | | | | | | | | | |
Cardinal Health Inc. | | | | | | | | | | | 5,583 | | | | 263,462 | (a) |
Chemed Corp. | | | | | | | | | | | 735 | | | | 306,914 | (a) |
McKesson Corp. | | | | | | | | | | | 2,057 | | | | 281,109 | (a) |
Total Health Care Providers & Services | | | | | | | | | | | | | | | 851,485 | |
Health Care Technology — 0.6% | | | | | | | | | | | | | | | | |
Veeva Systems Inc., Class A Shares | | | | | | | | | | | 2,311 | | | | 352,867 | *(a) |
Life Sciences Tools & Services — 0.5% | | | | | | | | | | | | | | | | |
ICON PLC | | | | | | | | | | | 2,300 | | | | 338,882 | *(a) |
Pharmaceuticals — 3.6% | | | | | | | | | | | | | | | | |
Bausch Health Cos Inc. | | | | | | | | | | | 16,200 | | | | 353,383 | * |
Bristol-Myers Squibb Co. | | | | | | | | | | | 7,346 | | | | 372,516 | (a) |
Hikma Pharmaceuticals PLC | | | | | | | | | | | 7,400 | | | | 200,130 | (b) |
Indivior PLC | | | | | | | | | | | 249,769 | | | | 149,029 | *(b) |
Merck & Co. Inc. | | | | | | | | | | | 2,938 | | | | 247,321 | (a) |
Roche Holding AG | | | | | | | | | | | 1,375 | | | | 400,985 | (b) |
See Notes to Financial Statements.
| | |
| 18 | | QS Global Market Neutral Fund 2019 Annual Report |
QS Global Market Neutral Fund
| | | | | | | | | | | | | | | | |
| Security | | | | | | | | Shares | | | Value | |
Pharmaceuticals — continued | | | | | | | | | | | | | | | | |
Shionogi & Co. Ltd. | | | | | | | | | | | 5,100 | | | $ | 284,534 | (b) |
Taro Pharmaceutical Industries Ltd. | | | | | | | | | | | 3,400 | | | | 256,530 | (a) |
Total Pharmaceuticals | | | | | | | | | | | | | | | 2,264,428 | |
Total Health Care | | | | | | | | | | | | | | | 4,295,740 | |
| Industrials — 17.5% | | | | | | | | | | | | | | | | |
Aerospace & Defense — 0.5% | | | | | | | | | | | | | | | | |
Safran SA | | | | | | | | | | | 2,100 | | | | 331,047 | (b) |
Air Freight & Logistics — 1.2% | | | | | | | | | | | | | | | | |
Expeditors International of Washington Inc. | | | | | | | | | | | 3,820 | | | | 283,788 | (a) |
Royal Mail PLC | | | | | | | | | | | 67,000 | | | | 174,354 | (b) |
Yamato Holdings Co. Ltd. | | | | | | | | | | | 18,000 | | | | 272,191 | (b) |
Total Air Freight & Logistics | | | | | | | | | | | | | | | 730,333 | |
Airlines — 1.0% | | | | | | | | | | | | | | | | |
Air Canada | | | | | | | | | | | 11,800 | | | | 384,857 | * |
Southwest Airlines Co. | | | | | | | | | | | 5,142 | | | | 277,719 | (a) |
Total Airlines | | | | | | | | | | | | | | | 662,576 | |
Building Products — 0.6% | | | | | | | | | | | | | | | | |
CSW Industrials Inc. | | | | | | | | | | | 2,204 | | | | 152,142 | (a) |
Sanwa Holdings Corp. | | | | | | | | | | | 18,400 | | | | 207,137 | (b) |
Total Building Products | | | | | | | | | | | | | | | 359,279 | |
Commercial Services & Supplies — 0.5% | | | | | | | | | | | | | | | | |
Tetra Tech Inc. | | | | | | | | | | | 3,526 | | | | 305,916 | (a) |
Construction & Engineering — 1.8% | | | | | | | | | | | | | | | | |
Great Lakes Dredge & Dock Corp. | | | | | | | | | | | 15,721 | | | | 164,284 | *(a) |
Hazama Ando Corp. | | | | | | | | | | | 54,400 | | | | 404,839 | (b) |
Kandenko Co. Ltd. | | | | | | | | | | | 32,000 | | | | 286,092 | (b) |
Tokyu Construction Co. Ltd. | | | | | | | | | | | 38,900 | | | | 298,886 | (b) |
Total Construction & Engineering | | | | | | | | | | | | | | | 1,154,101 | |
Electrical Equipment — 1.0% | | | | | | | | | | | | | | | | |
Nippon Carbon Co. Ltd. | | | | | | | | | | | 7,300 | | | | 259,845 | (b) |
Signify NV | | | | | | | | | | | 12,600 | | | | 346,398 | (b) |
Total Electrical Equipment | | | | | | | | | | | | | | | 606,243 | |
Machinery — 3.0% | | | | | | | | | | | | | | | | |
Atlas Copco AB, Class A Shares | | | | | | | | | | | 8,815 | | | | 271,375 | (b) |
DMG Mori Co. Ltd. | | | | | | | | | | | 21,500 | | | | 307,829 | (b) |
Dover Corp. | | | | | | | | | | | 2,498 | | | | 248,701 | (a) |
IMI PLC | | | | | | | | | | | 18,365 | | | | 217,003 | (b) |
JTEKT Corp. | | | | | | | | | | | 24,500 | | | | 283,181 | (b) |
Mitsui E&S Holdings Co. Ltd. | | | | | | | | | | | 30,400 | | | | 268,498 | *(b) |
See Notes to Financial Statements.
| | |
| QS Global Market Neutral Fund 2019 Annual Report | | 19 |
Schedule of investments (cont’d)
September 30, 2019
QS Global Market Neutral Fund
| | | | | | | | | | | | | | | | |
| Security | | | | | | | | Shares | | | Value | |
Machinery — continued | | | | | | | | | | | | | | | | |
Takeuchi Manufacturing Co. Ltd. | | | | | | | | | | | 10,000 | | | $ | 156,455 | (b) |
Vesuvius PLC | | | | | | | | | | | 32,323 | | | | 180,984 | (b) |
Total Machinery | | | | | | | | | | | | | | | 1,934,026 | |
Professional Services — 3.9% | | | | | | | | | | | | | | | | |
Adecco Group AG, Registered Shares | | | | | | | | | | | 3,400 | | | | 188,064 | (b) |
Bureau Veritas SA | | | | | | | | | | | 13,693 | | | | 330,184 | (b) |
FTI Consulting Inc. | | | | | | | | | | | 2,204 | | | | 233,602 | *(a) |
Insperity Inc. | | | | | | | | | | | 3,232 | | | | 318,740 | (a) |
JAC Recruitment Co. Ltd. | | | | | | | | | | | 10,000 | | | | 192,750 | (b) |
Meitec Corp. | | | | | | | | | | | 6,500 | | | | 319,625 | (b) |
Robert Half International Inc. | | | | | | | | | | | 5,877 | | | | 327,114 | (a) |
TriNet Group Inc. | | | | | | | | | | | 4,555 | | | | 283,275 | *(a) |
Wolters Kluwer NV | | | | | | | | | | | 3,600 | | | | 262,932 | (b) |
Total Professional Services | | | | | | | | | | | | | | | 2,456,286 | |
Road & Rail — 0.8% | | | | | | | | | | | | | | | | |
Landstar System Inc. | | | | | | | | | | | 2,498 | | | | 281,225 | (a) |
TFI International Inc. | | | | | | | | | | | 7,600 | | | | 232,672 | |
Total Road & Rail | | | | | | | | | | | | | | | 513,897 | |
Trading Companies & Distributors — 2.9% | | | | | | | | | | | | | | | | |
AerCap Holdings NV | | | | | | | | | | | 3,500 | | | | 191,625 | *(a) |
Ashtead Group PLC | | | | | | | | | | | 13,504 | | | | 375,765 | (b) |
Hanwa Co. Ltd. | | | | | | | | | | | 7,100 | | | | 195,523 | (b) |
Kanamoto Co. Ltd. | | | | | | | | | | | 8,500 | | | | 212,222 | (b) |
Mitsubishi Corp. | | | | | | | | | | | 13,200 | | | | 325,045 | (b) |
Sojitz Corp. | | | | | | | | | | | 105,900 | | | | 329,647 | (b) |
WESCO International Inc. | | | | | | | | | | | 4,408 | | | | 210,570 | *(a) |
Total Trading Companies & Distributors | | | | | | | | | | | | | | | 1,840,397 | |
Transportation Infrastructure — 0.3% | | | | | | | | | | | | | | | | |
Kamigumi Co. Ltd. | | | | | | | | | | | 8,100 | | | | 183,501 | (b) |
Total Industrials | | | | | | | | | | | | | | | 11,077,602 | |
| Information Technology — 11.4% | | | | | | | | | | | | | | | | |
Communications Equipment — 1.6% | | | | | | | | | | | | | | | | |
Cisco Systems Inc. | | | | | | | | | | | 6,465 | | | | 319,436 | (a) |
F5 Networks Inc. | | | | | | | | | | | 1,478 | | | | 207,541 | *(a) |
Spirent Communications PLC | | | | | | | | | | | 73,462 | | | | 179,499 | (b) |
Telefonaktiebolaget LM Ericsson, Class B Shares | | | | | | | | | | | 41,153 | | | | 328,921 | (b) |
Total Communications Equipment | | | | | | | | | | | | | | | 1,035,397 | |
Electronic Equipment, Instruments & Components — 1.6% | | | | | | | | | | | | | | | | |
Benchmark Electronics Inc. | | | | | | | | | | | 5,877 | | | | 170,786 | (a) |
CDW Corp. | | | | | | | | | | | 2,753 | | | | 339,280 | (a) |
See Notes to Financial Statements.
| | |
| 20 | | QS Global Market Neutral Fund 2019 Annual Report |
QS Global Market Neutral Fund
| | | | | | | | | | | | | | | | |
| Security | | | | | | | | Shares | | | Value | |
Electronic Equipment, Instruments & Components — continued | | | | | | | | | | | | | | | | |
Fabrinet | | | | | | | | | | | 4,408 | | | $ | 230,538 | *(a) |
Nippon Electric Glass Co. Ltd. | | | | | | | | | | | 13,000 | | | | 291,265 | (b) |
Total Electronic Equipment, Instruments & Components | | | | | | | | | | | | | | | 1,031,869 | |
IT Services — 1.0% | | | | | | | | | | | | | | | | |
Appen Ltd. | | | | | | | | | | | 13,223 | | | | 189,238 | (b) |
Otsuka Corp. | | | | | | | | | | | 5,000 | | | | 200,359 | (b) |
Wirecard AG | | | | | | | | | | | 1,322 | | | | 211,274 | (b) |
Total IT Services | | | | | | | | | | | | | | | 600,871 | |
Semiconductors & Semiconductor Equipment — 3.2% | | | | | | | | | | | | | | | | |
ASM International NV | | | | | | | | | | | 4,156 | | | | 383,398 | (b) |
ASML Holding NV | | | | | | | | | | | 1,650 | | | | 409,533 | (b) |
Dialog Semiconductor PLC | | | | | | | | | | | 7,200 | | | | 341,108 | *(b) |
NXP Semiconductors NV | | | | | | | | | | | 3,500 | | | | 381,920 | (a) |
Optorun Co. Ltd. | | | | | | | | | | | 9,000 | | | | 257,759 | (b) |
Qorvo Inc. | | | | | | | | | | | 3,232 | | | | 239,621 | *(a) |
Total Semiconductors & Semiconductor Equipment | | | | | | | | | | | | | | | 2,013,339 | |
Software — 3.4% | | | | | | | | | | | | | | | | |
Check Point Software Technologies Ltd. | | | | | | | | | | | 3,129 | | | | 342,625 | *(a) |
Citrix Systems Inc. | | | | | | | | | | | 3,379 | | | | 326,141 | (a) |
CyberArk Software Ltd. | | | | | | | | | | | 2,800 | | | | 279,496 | *(a) |
Dropbox Inc., Class A Shares | | | | | | | | | | | 9,550 | | | | 192,624 | *(a) |
Fortinet Inc. | | | | | | | | | | | 4,408 | | | | 338,358 | *(a) |
Manhattan Associates Inc. | | | | | | | | | | | 3,379 | | | | 272,584 | *(a) |
Proofpoint Inc. | | | | | | | | | | | 1,910 | | | | 246,486 | *(a) |
SimCorp A/S | | | | | | | | | | | 1,910 | | | | 167,825 | (b) |
Total Software | | | | | | | | | | | | | | | 2,166,139 | |
Technology Hardware, Storage & Peripherals — 0.6% | | | | | | | | | | | | | | | | |
Brother Industries Ltd. | | | | | | | | | | | 20,400 | | | | 372,314 | (b) |
Total Information Technology | | | | | | | | | | | | | | | 7,219,929 | |
| Materials — 10.3% | | | | | | | | | | | | | | | | |
Chemicals — 3.6% | | | | | | | | | | | | | | | | |
Daicel Corp. | | | | | | | | | | | 20,600 | | | | 175,268 | (b) |
Eastman Chemical Co. | | | | | | | | | | | 5,300 | | | | 391,299 | (a) |
Incitec Pivot Ltd. | | | | | | | | | | | 124,885 | | | | 286,166 | (b) |
Lintec Corp. | | | | | | | | | | | 13,800 | | | | 274,970 | (b) |
Methanex Corp. | | | | | | | | | | | 6,000 | | | | 212,900 | |
Mitsubishi Gas Chemical Co. Inc. | | | | | | | | | | | 24,400 | | | | 327,955 | (b) |
Showa Denko KK | | | | | | | | | | | 9,300 | | | | 245,118 | (b) |
Ube Industries Ltd. | | | | | | | | | | | 17,200 | | | | 349,385 | (b) |
Total Chemicals | | | | | | | | | | | | | | | 2,263,061 | |
See Notes to Financial Statements.
| | |
| QS Global Market Neutral Fund 2019 Annual Report | | 21 |
Schedule of investments (cont’d)
September 30, 2019
QS Global Market Neutral Fund
| | | | | | | | | | | | | | | | |
| Security | | | | | | | | Shares | | | Value | |
Construction Materials — 0.9% | | | | | | | | | | | | | | | | |
LafargeHolcim Ltd., Registered Shares | | | | | | | | | | | 7,187 | | | $ | 354,201 | *(b) |
Sumitomo Osaka Cement Co. Ltd. | | | | | | | | | | | 4,400 | | | | 189,523 | (b) |
Total Construction Materials | | | | | | | | | | | | | | | 543,724 | |
Containers & Packaging — 0.3% | | | | | | | | | | | | | | | | |
Rengo Co. Ltd. | | | | | | | | | | | 30,000 | | | | 217,137 | (b) |
Metals & Mining — 4.7% | | | | | | | | | | | | | | | | |
BHP Group PLC | | | | | | | | | | | 17,059 | | | | 364,839 | (b) |
BlueScope Steel Ltd. | | | | | | | | | | | 23,508 | | | | 190,751 | (b) |
Centerra Gold Inc. | | | | | | | | | | | 41,100 | | | | 349,312 | * |
Evraz PLC | | | | | | | | | | | 41,138 | | | | 236,713 | (b) |
Fortescue Metals Group Ltd. | | | | | | | | | | | 61,000 | | | | 365,842 | (b) |
Glencore PLC | | | | | | | | | | | 131,161 | | | | 395,156 | *(b) |
Mitsubishi Materials Corp. | | | | | | | | | | | 9,500 | | | | 257,884 | (b) |
Nippon Light Metal Holdings Co. Ltd. | | | | | | | | | | | 135,000 | | | | 243,794 | (b) |
Steel Dynamics Inc. | | | | | | | | | | | 7,346 | | | | 218,911 | (a) |
Tokyo Steel Manufacturing Co. Ltd. | | | | | | | | | | | 29,000 | | | | 223,354 | (b) |
Warrior Met Coal Inc. | | | | | | | | | | | 6,758 | | | | 131,916 | (a) |
Total Metals & Mining | | | | | | | | | | | | | | | 2,978,472 | |
Paper & Forest Products — 0.8% | | | | | | | | | | | | | | | | |
Norbord Inc. | | | | | | | | | | | 9,400 | | | | 225,342 | |
Oji Holdings Corp. | | | | | | | | | | | 60,000 | | | | 281,612 | (b) |
Total Paper & Forest Products | | | | | | | | | | | | | | | 506,954 | |
Total Materials | | | | | | | | | | | | | | | 6,509,348 | |
| Real Estate — 4.3% | | | | | | | | | | | | | | | | |
Equity Real Estate Investment Trusts (REITs) — 2.9% | | | | | | | | | | | | | | | | |
Artis Real Estate Investment Trust | | | | | | | | | | | 38,300 | | | | 363,674 | |
CoreCivic Inc. | | | | | | | | | | | 8,668 | | | | 149,783 | (a) |
Japan Retail Fund Investment Corp. | | | | | | | | | | | 109 | | | | 230,462 | (b) |
Klepierre SA | | | | | | | | | | | 10,285 | | | | 349,248 | (b) |
Life Storage Inc. | | | | | | | | | | | 2,792 | | | | 294,305 | (a) |
Sunstone Hotel Investors Inc. | | | | | | | | | | | 13,958 | | | | 191,783 | (a) |
Vicinity Centres | | | | | | | | | | | 173,369 | | | | 300,930 | (b) |
Total Equity Real Estate Investment Trusts (REITs) | | | | | | | | | | | | | | | 1,880,185 | |
Real Estate Management & Development — 1.4% | | | | | | | | | | | | | | | | |
PSP Swiss Property AG, Registered Shares | | | | | | | | | | | 1,800 | | | | 228,507 | (b) |
TAG Immobilien AG | | | | | | | | | | | 16,162 | | | | 368,799 | *(b) |
TLG Immobilien AG | | | | | | | | | | | 10,285 | | | | 279,665 | (b) |
Total Real Estate Management & Development | | | | | | | | | | | | | | | 876,971 | |
Total Real Estate | | | | | | | | | | | | | | | 2,757,156 | |
See Notes to Financial Statements.
| | |
| 22 | | QS Global Market Neutral Fund 2019 Annual Report |
QS Global Market Neutral Fund
| | | | | | | | | | | | | | | | |
| Security | | | | | | | | Shares | | | Value | |
| Utilities — 3.0% | | | | | | | | | | | | | | | | |
Electric Utilities — 1.7% | | | | | | | | | | | | | | | | |
Chubu Electric Power Co. Inc. | | | | | | | | | | | 21,500 | | | $ | 311,404 | (b) |
Fortum oyj | | | | | | | | | | | 11,754 | | | | 278,057 | (b) |
Tohoku Electric Power Co. Inc. | | | | | | | | | | | 27,800 | | | | 272,025 | (b) |
Tokyo Electric Power Co. Holdings Inc. | | | | | | | | | | | 49,200 | | | | 240,876 | *(b) |
Total Electric Utilities | | | | | | | | | | | | | | | 1,102,362 | |
Independent Power and Renewable Electricity Producers — 1.3% | | | | | | | | | |
Atlantica Yield PLC | | | | | | | | | | | 9,000 | | | | 216,810 | (a) |
Drax Group PLC | | | | | | | | | | | 95,227 | | | | 323,598 | (b) |
Northland Power Inc. | | | | | | | | | | | 14,400 | | | | 276,294 | |
Total Independent Power and Renewable Electricity Producers | | | | | | | | 816,702 | |
Total Utilities | | | | | | | | | | | | | | | 1,919,064 | |
Total Common Stocks (Cost — $57,099,936) | | | | | | | | | | | | | | | 57,516,617 | |
| | | | |
| | | | | | Rate | | | | | | | |
| Preferred Stocks — 0.6% | | | | | | | | | | | | | | | | |
| Consumer Discretionary — 0.6% | | | | | | | | | | | | | | | | |
Automobiles — 0.6% | | | | | | | | | | | | | | | | |
Porsche Automobil Holding SE (Cost — $366,757) | | | | | | | 2.210% | | | | 5,534 | | | | 360,021 | (b) |
Total Investments before Short-Term Investments (Cost — $57,466,693) | | | | | | | | 57,876,638 | |
| Short-Term Investments — 6.0% | | | | | | | | | | | | | | | | |
Invesco Treasury Portfolio, Institutional Class
(Cost — $3,816,481) | | | | | | | 1.940% | | | | 3,816,481 | | | | 3,816,481 | |
Total Investments — 97.3% (Cost — $61,283,174) | | | | | | | | | | | | | | | 61,693,119 | |
Other Assets in Excess of Liabilities — 2.7% | | | | | | | | | | | | | | | 1,738,586 | |
Total Net Assets — 100.0% | | | | | | | | | | | | | | $ | 63,431,705 | |
| * | Non-income producing security. |
| (a) | All or a portion of this security is held at the broker as collateral for open securities sold short. |
| (b) | Security is valued in good faith in accordance with procedures approved by the Board of Trustees (Note 1). |
See Notes to Financial Statements.
| | |
| QS Global Market Neutral Fund 2019 Annual Report | | 23 |
Schedule of investments (cont’d)
September 30, 2019
QS Global Market Neutral Fund
| | | | |
| Summary of Investments by Country**(unaudited) | | | |
| United States | | | 28.1 | % |
| Japan | | | 20.3 | |
| United Kingdom | | | 11.4 | |
| Canada | | | 8.2 | |
| Netherlands | | | 4.5 | |
| Germany | | | 3.4 | |
| Australia | | | 3.2 | |
| Switzerland | | | 3.0 | |
| Sweden | | | 2.6 | |
| Spain | | | 2.4 | |
| France | | | 1.9 | |
| Israel | | | 1.0 | |
| Ireland | | | 0.9 | |
| Finland | | | 0.5 | |
| Russia | | | 0.4 | |
| Thailand | | | 0.4 | |
| Belgium | | | 0.4 | |
| Norway | | | 0.3 | |
| Italy | | | 0.3 | |
| Jordan | | | 0.3 | |
| Denmark | | | 0.3 | |
| Short-Term Investments | | | 6.2 | |
| | | | 100.0 | % |
| ** | As a percentage of total investments. Please note that the Fund holdings are as of September 30, 2019 and are subject to change. |
See Notes to Financial Statements.
| | |
| 24 | | QS Global Market Neutral Fund 2019 Annual Report |
QS Global Market Neutral Fund
| | | | | | | | | | | | | | | | |
| Security | | | | | | | | Shares | | | Value | |
| Securities Sold Short ‡ — (91.0)% | | | | | | | | | | | | | | | | |
| Common Stocks — (91.0)% | | | | | | | | | | | | | | | | |
| Communication Services — (5.6)% | | | | | | | | | | | | | | | | |
Diversified Telecommunication Services — (1.8)% | | | | | | | | | | | | | | | | |
Cellnex Telecom SA | | | | | | | | | | | (7,854 | ) | | $ | (324,435 | ) *(a) |
Iliad SA | | | | | | | | | | | (1,724 | ) | | | (161,901 | ) (a) |
Masmovil Ibercom SA | | | | | | | | | | | (8,836 | ) | | | (179,655 | ) *(a) |
Telecom Italia SpA | | | | | | | | | | | (450,000 | ) | | | (257,022 | ) *(a) |
TPG Telecom Ltd. | | | | | | | | | | | (38,289 | ) | | | (179,640 | ) (a) |
Total Diversified Telecommunication Services | | | | | | | | | | | | | | | (1,102,653 | ) |
Entertainment — (1.0)% | | | | | | | | | | | | | | | | |
Entertainment One Ltd. | | | | | | | | | | | (29,453 | ) | | | (204,957 | ) (a) |
Modern Times Group MTG AB, Class B Shares | | | | | | | | | | | (16,302 | ) | | | (135,173 | ) *(a) |
Square Enix Holdings Co. Ltd. | | | | | | | | | | | (6,000 | ) | | | (291,557 | ) (a) |
Total Entertainment | | | | | | | | | | | | | | | (631,687 | ) |
Interactive Media & Services — (0.3)% | | | | | | | | | | | | | | | | |
LINE Corp. | | | | | | | | | | | (4,600 | ) | | | (164,713 | ) *(a) |
Media — (1.6)% | | | | | | | | | | | | | | | | |
Axel Springer SE | | | | | | | | | | | (3,599 | ) | | | (248,283 | ) (a) |
Charter Communications Inc., Class A Shares | | | | | | | | | | | (750 | ) | | | (309,090 | ) * |
CyberAgent Inc. | | | | | | | | | | | (6,000 | ) | | | (231,812 | ) (a) |
Vector Inc. | | | | | | | | | | | (21,400 | ) | | | (179,226 | ) *(a) |
Total Media | | | | | | | | | | | | | | | (968,411 | ) |
Wireless Telecommunication Services — (0.9)% | | | | | | | | | | | | | | | | |
Sprint Corp. | | | | | | | | | | | (46,000 | ) | | | (283,820 | ) * |
Tele2 AB, Class B Shares | | | | | | | | | | | (19,779 | ) | | | (294,149 | ) (a) |
Total Wireless Telecommunication Services | | | | | | | | | | | | | | | (577,969 | ) |
Total Communication Services | | | | | | | | | | | | | | | (3,445,433 | ) |
| Consumer Discretionary — (13.4)% | | | | | | | | | | | | | | | | |
Auto Components — (0.9)% | | | | | | | | | | | | | | | | |
Continental AG | | | | | | | | | | | (2,200 | ) | | | (282,423 | ) (a) |
Dorman Products Inc. | | | | | | | | | | | (2,209 | ) | | | (175,704 | ) * |
Freni Brembo SpA | | | | | | | | | | | (15,904 | ) | | | (155,108 | ) (a) |
Total Auto Components | | | | | | | | | | | | | | | (613,235 | ) |
Automobiles — (1.0)% | | | | | | | | | | | | | | | | |
Bayerische Motoren Werke AG | | | | | | | | | | | (3,100 | ) | | | (218,052 | ) (a) |
Daimler AG, Registered Shares | | | | | | | | | | | (5,653 | ) | | | (280,789 | ) (a) |
Thor Industries Inc. | | | | | | | | | | | (3,534 | ) | | | (200,166 | ) |
Total Automobiles | | | | | | | | | | | | | | | (699,007 | ) |
Hotels, Restaurants & Leisure — (5.7)% | | | | | | | | | | | | | | | | |
Caesars Entertainment Corp. | | | | | | | | | | | (25,918 | ) | | | (302,204 | ) * |
See Notes to Financial Statements.
| | |
| QS Global Market Neutral Fund 2019 Annual Report | | 25 |
Schedule of investments (cont’d)
September 30, 2019
QS Global Market Neutral Fund
| | | | | | | | | | | | | | | | |
| Security | | | | | | | | Shares | | | Value | |
Hotels, Restaurants & Leisure — continued | | | | | | | | | | | | | | | | |
Eldorado Resorts Inc. | | | | | | | | | | | (4,565 | ) | | $ | (182,007 | ) * |
Elior Group SA | | | | | | | | | | | (10,082 | ) | | | (133,931 | ) (a) |
GVC Holdings PLC | | | | | | | | | | | (36,585 | ) | | | (334,766 | ) (a) |
InterContinental Hotels Group PLC | | | | | | | | | | | (2,945 | ) | | | (183,788 | ) (a) |
International Game Technology PLC | | | | | | | | | | | (17,700 | ) | | | (251,517 | ) |
Marriott Vacations Worldwide Corp. | | | | | | | | | | | (1,914 | ) | | | (198,310 | ) |
Oriental Land Co. Ltd. | | | | | | | | | | | (2,300 | ) | | | (349,899 | ) (a) |
Penn National Gaming Inc. | | | | | | | | | | | (7,363 | ) | | | (137,136 | ) * |
Restaurant Group PLC | | | | | | | | | | | (95,721 | ) | | | (167,507 | ) (a) |
SSP Group PLC | | | | | | | | | | | (31,000 | ) | | | (236,285 | ) (a) |
Stars Group Inc. (The) | | | | | | | | | | | (12,800 | ) | | | (191,587 | ) * |
TUI AG | | | | | | | | | | | (24,299 | ) | | | (282,785 | ) (a) |
Whitbread PLC | | | | | | | | | | | (5,000 | ) | | | (263,949 | ) (a) |
Wingstop Inc. | | | | | | | | | | | (1,620 | ) | | | (141,394 | ) |
Zensho Holdings Co. Ltd. | | | | | | | | | | | (10,300 | ) | | | (222,111 | ) (a) |
Total Hotels, Restaurants & Leisure | | | | | | | | | | | | | | | (3,579,176 | ) |
Household Durables — (1.0)% | | | | | | | | | | | | | | | | |
Iida Group Holdings Co. Ltd. | | | | | | | | | | | (9,500 | ) | | | (155,463 | ) (a) |
Sharp Corp. | | | | | | | | | | | (14,300 | ) | | | (159,637 | ) (a) |
Sony Corp., ADR | | | | | | | | | | | (5,100 | ) | | | (301,563 | ) |
Total Household Durables | | | | | | | | | | | | | | | (616,663 | ) |
Internet & Direct Marketing Retail — (2.1)% | | | | | | | | | | | | | | | | |
Delivery Hero SE | | | | | | | | | | | (5,301 | ) | | | (235,481 | ) *(a) |
Farfetch Ltd., Class A Shares | | | | | | | | | | | (15,000 | ) | | | (129,600 | ) * |
Groupon Inc. | | | | | | | | | | | (63,323 | ) | | | (168,439 | ) * |
GrubHub Inc. | | | | | | | | | | | (3,682 | ) | | | (206,965 | ) * |
Ocado Group PLC | | | | | | | | | | | (18,500 | ) | | | (301,127 | ) *(a) |
Zalando SE | | | | | | | | | | | (5,700 | ) | | | (260,144 | ) *(a) |
Total Internet & Direct Marketing Retail | | | | | | | | | | | | | | | (1,301,756 | ) |
Leisure Products — (1.5)% | | | | | | | | | | | | | | | | |
Brunswick Corp. | | | | | | | | | | | (4,565 | ) | | | (237,928 | ) |
Callaway Golf Co. | | | | | | | | | | | (10,308 | ) | | | (200,078 | ) |
Spin Master Corp. | | | | | | | | | | | (5,900 | ) | | | (180,271 | ) * |
Yamaha Corp. | | | | | | | | | | | (6,900 | ) | | | (312,154 | ) (a) |
Total Leisure Products | | | | | | | | | | | | | | | (930,431 | ) |
Specialty Retail — (0.5)% | | | | | | | | | | | | | | | | |
Penske Automotive Group Inc. | | | | | | | | | | | (4,123 | ) | | | (194,935 | ) |
Valora Holding AG, Registered Shares | | | | | | | | | | | (400 | ) | | | (108,392 | ) *(a) |
Total Specialty Retail | | | | | | | | | | | | | | | (303,327 | ) |
See Notes to Financial Statements.
| | |
| 26 | | QS Global Market Neutral Fund 2019 Annual Report |
QS Global Market Neutral Fund
| | | | | | | | | | | | | | | | |
| Security | | | | | | | | Shares | | | Value | |
Textiles, Apparel & Luxury Goods — (0.7)% | | | | | | | | | | | | | | | | |
EssilorLuxottica SA | | | | | | | | | | | (1,673 | ) | | $ | (241,342 | ) (a) |
Wolverine World Wide Inc. | | | | | | | | | | | (6,900 | ) | | | (194,994 | ) |
Total Textiles, Apparel & Luxury Goods | | | | | | | | | | | | | | | (436,336 | ) |
Total Consumer Discretionary | | | | | | | | | | | | | | | (8,479,931 | ) |
| Consumer Staples — (4.0)% | | | | | | | | | | | | | | | | |
Beverages — (0.4)% | | | | | | | | | | | | | | | | |
Coca-Cola Bottlers Japan Holdings Inc. | | | | | | | | | | | (11,500 | ) | | | (259,316 | ) (a) |
Food & Staples Retailing — (0.8)% | | | | | | | | | | | | | | | | |
Aeon Co. Ltd. | | | | | | | | | | | (15,400 | ) | | | (283,259 | ) (a) |
J Sainsbury PLC | | | | | | | | | | | (85,413 | ) | | | (230,828 | ) (a) |
Total Food & Staples Retailing | | | | | | | | | | | | | | | (514,087 | ) |
Food Products — (2.1)% | | | | | | | | | | | | | | | | |
Conagra Brands Inc. | | | | | | | | | | | (8,247 | ) | | | (253,018 | ) |
Cranswick PLC | | | | | | | | | | | (3,048 | ) | | | (110,554 | ) (a) |
Hain Celestial Group Inc. | | | | | | | | | | | (7,363 | ) | | | (158,120 | ) * |
Kerry Group PLC, Class A Shares | | | | | | | | | | | (2,209 | ) | | | (259,282 | ) (a) |
Kraft Heinz Co. | | | | | | | | | | | (13,700 | ) | | | (382,709 | ) |
Premium Brands Holdings Corp. | | | | | | | | | | | (2,900 | ) | | | (203,855 | ) |
Total Food Products | | | | | | | | | | | | | | | (1,367,538 | ) |
Personal Products — (0.7)% | | | | | | | | | | | | | | | | |
Ontex Group NV | | | | | | | | | | | (7,545 | ) | | | (135,851 | ) (a) |
Shiseido Co. Ltd. | | | | | | | | | | | (3,600 | ) | | | (287,608 | ) (a) |
Total Personal Products | | | | | | | | | | | | | | | (423,459 | ) |
Total Consumer Staples | | | | | | | | | | | | | | | (2,564,400 | ) |
| Energy — (5.9)% | | | | | | | | | | | | | | | | |
Energy Equipment & Services — (0.4)% | | | | | | | | | | | | | | | | |
Cactus Inc., Class A Shares | | | | | | | | | | | (5,007 | ) | | | (144,903 | ) * |
John Wood Group PLC | | | | | | | | | | | (29,500 | ) | | | (137,428 | ) (a) |
Total Energy Equipment & Services | | | | | | | | | | | | | | | (282,331 | ) |
Oil, Gas & Consumable Fuels — (5.5)% | | | | | | | | | | | | | | | | |
Cairn Energy PLC | | | | | | | | | | | (74,306 | ) | | | (174,920 | ) *(a) |
Cheniere Energy Inc. | | | | | | | | | | | (4,093 | ) | | | (258,105 | ) * |
Chesapeake Energy Corp. | | | | | | | | | | | (59,000 | ) | | | (83,190 | ) * |
Cimarex Energy Co. | | | | | | | | | | | (4,418 | ) | | | (211,799 | ) |
Concho Resources Inc. | | | | | | | | | | | (1,620 | ) | | | (109,998 | ) |
Diamondback Energy Inc. | | | | | | | | | | | (2,651 | ) | | | (238,351 | ) |
Inter Pipeline Ltd. | | | | | | | | | | | (11,000 | ) | | | (193,041 | ) |
Magnolia Oil & Gas Corp., Class A Shares | | | | | | | | | | | (23,268 | ) | | | (258,275 | ) * |
Matador Resources Co. | | | | | | | | | | | (9,830 | ) | | | (162,490 | ) * |
Noble Energy Inc. | | | | | | | | | | | (13,254 | ) | | | (297,685 | ) |
See Notes to Financial Statements.
| | |
| QS Global Market Neutral Fund 2019 Annual Report | | 27 |
Schedule of investments (cont’d)
September 30, 2019
QS Global Market Neutral Fund
| | | | | | | | | | | | | | | | |
| Security | | | | | | | | Shares | | | Value | |
Oil, Gas & Consumable Fuels — continued | | | | | | | | | | | | | | | | |
ONEOK Inc. | | | | | | | | | | | (3,534 | ) | | $ | (260,420 | ) |
Pembina Pipeline Corp. | | | | | | | | | | | (8,405 | ) | | | (311,559 | ) |
Ship Finance International Ltd. | | | | | | | | | | | (11,800 | ) | | | (165,672 | ) |
Targa Resources Corp. | | | | | | | | | | | (6,921 | ) | | | (278,017 | ) |
TC Energy Corp. | | | | | | | | | | | (6,500 | ) | | | (336,566 | ) |
Western Midstream Partners LP | | | | | | | | | | | (5,891 | ) | | | (146,627 | ) |
Total Oil, Gas & Consumable Fuels | | | | | | | | | | | | | | | (3,486,715 | ) |
Total Energy | | | | | | | | | | | | | | | (3,769,046 | ) |
| Financials — (8.6)% | | | | | | | | | | | | | | | | |
Banks — (2.4)% | | | | | | | | | | | | | | | | |
Atlantic Union Bankshares Corp. | | | | | | | | | | | (4,123 | ) | | | (153,561 | ) |
Banco Santander SA, ADR | | | | | | | | | | | (54,500 | ) | | | (219,090 | ) |
Commonwealth Bank of Australia | | | | | | | | | | | (3,534 | ) | | | (193,381 | ) (a) |
First Financial Bankshares Inc. | | | | | | | | | | | (5,891 | ) | | | (196,347 | ) |
First Republic Bank | | | | | | | | | | | (1,767 | ) | | | (170,869 | ) |
HSBC Holdings PLC | | | | | | | | | | | (43,107 | ) | | | (330,748 | ) (a) |
Independent Bank Group Inc. | | | | | | | | | | | (2,945 | ) | | | (154,936 | ) |
United Bankshares Inc. | | | | | | | | | | | (4,860 | ) | | | (184,048 | ) |
Total Banks | | | | | | | | | | | | | | | (1,602,980 | ) |
Capital Markets — (4.0)% | | | | | | | | | | | | | | | | |
Anima Holding SpA | | | | | | | | | | | (41,234 | ) | | | (157,330 | ) (a) |
ASX Ltd. | | | | | | | | | | | (4,600 | ) | | | (252,097 | ) (a) |
Brookfield Asset Management Inc., Class A Shares | | | | | | | | | | | (4,000 | ) | | | (212,360 | ) |
Brookfield Asset Management Inc., Class A Shares | | | | | | | | | | | (4,000 | ) | | | (212,401 | ) |
CME Group Inc. | | | | | | | | | | | (1,400 | ) | | | (295,876 | ) |
Credit Suisse Group AG, Registered Shares | | | | | | | | | | | (24,000 | ) | | | (294,670 | ) *(a) |
Deutsche Bank AG, Registered Shares | | | | | | | | | | | (41,000 | ) | | | (307,131 | ) (a) |
London Stock Exchange Group PLC | | | | | | | | | | | (3,700 | ) | | | (332,283 | ) (a) |
MarketAxess Holdings Inc. | | | | | | | | | | | (792 | ) | | | (259,380 | ) |
St. James’s Place PLC | | | | | | | | | | | (22,000 | ) | | | (264,860 | ) (a) |
Total Capital Markets | | | | | | | | | | | | | | | (2,588,388 | ) |
Diversified Financial Services — (0.2)% | | | | | | | | | | | | | | | | |
GRENKE AG | | | | | | | | | | | (1,600 | ) | | | (131,875 | ) (a) |
Insurance — (1.8)% | | | | | | | | | | | | | | | | |
Arthur J Gallagher & Co. | | | | | | | | | | | (3,000 | ) | | | (268,710 | ) |
Brown & Brown Inc. | | | | | | | | | | | (7,363 | ) | | | (265,510 | ) |
Hiscox Ltd. | | | | | | | | | | | (8,836 | ) | | | (180,344 | ) (a) |
Marsh & McLennan Cos. Inc. | | | | | | | | | | | (2,503 | ) | | | (250,425 | ) |
Sony Financial Holdings Inc. | | | | | | | | | | | (9,600 | ) | | | (209,094 | ) (a) |
Total Insurance | | | | | | | | | | | | | | | (1,174,083 | ) |
See Notes to Financial Statements.
| | |
| 28 | | QS Global Market Neutral Fund 2019 Annual Report |
QS Global Market Neutral Fund
| | | | | | | | | | | | | | | | |
| Security | | | | | | | | Shares | | | Value | |
Thrifts & Mortgage Finance — (0.2)% | | | | | | | | | | | | | | | | |
LendingTree Inc. | | | | | | | | | | | (501 | ) | | $ | (155,525 | ) * |
Total Financials | | | | | | | | | | | | | | | (5,652,851 | ) |
| Health Care — (6.7)% | | | | | | | | | | | | | | | | |
Biotechnology — (0.2)% | | | | | | | | | | | | | | | | |
Grifols SA, ADR | | | | | | | | | | | (7,400 | ) | | | (148,296 | ) |
Health Care Equipment & Supplies — (2.4)% | | | | | | | | | | | | | | | | |
Asahi Intecc Co. Ltd. | | | | | | | | | | | (12,100 | ) | | | (320,196 | ) (a) |
Avanos Medical Inc. | | | | | | | | | | | (4,300 | ) | | | (161,078 | ) * |
AxoGen Inc. | | | | | | | | | | | (10,000 | ) | | | (124,800 | ) * |
Becton Dickinson and Co. | | | | | | | | | | | (1,104 | ) | | | (279,268 | ) |
Cantel Medical Corp. | | | | | | | | | | | (2,209 | ) | | | (165,233 | ) |
Hoya Corp. | | | | | | | | | | | (2,300 | ) | | | (187,764 | ) (a) |
Sysmex Corp. | | | | | | | | | | | (3,800 | ) | | | (255,421 | ) (a) |
Total Health Care Equipment & Supplies | | | | | | | | | | | | | | | (1,493,760 | ) |
Health Care Providers & Services — (0.6)% | | | | | | | | | | | | | | | | |
Fresenius SE & Co. KGaA | | | | | | | | | | | (2,735 | ) | | | (127,861 | ) (a) |
Sonic Healthcare Ltd. | | | | | | | | | | | (11,781 | ) | | | (223,583 | ) (a) |
Total Health Care Providers & Services | | | | | | | | | | | | | | | (351,444 | ) |
Health Care Technology — (0.7)% | | | | | | | | | | | | | | | | |
M3 Inc. | | | | | | | | | | | (10,900 | ) | | | (263,938 | ) (a) |
Tabula Rasa HealthCare Inc. | | | | | | | | | | | (3,240 | ) | | | (178,006 | ) * |
Total Health Care Technology | | | | | | | | | | | | | | | (441,944 | ) |
Life Sciences Tools & Services — (1.0)% | | | | | | | | | | | | | | | | |
Lonza Group AG, Registered Shares | | | | | | | | | | | (685 | ) | | | (231,794 | ) *(a) |
QIAGEN NV | | | | | | | | | | | (5,449 | ) | | | (178,401 | ) *(a) |
QIAGEN NV | | | | | | | | | | | (6,600 | ) | | | (217,602 | ) * |
Total Life Sciences Tools & Services | | | | | | | | | | | | | | | (627,797 | ) |
Pharmaceuticals — (1.8)% | | | | | | | | | | | | | | | | |
Bayer AG, Registered Shares | | | | | | | | | | | (3,093 | ) | | | (218,078 | ) (a) |
Catalent Inc. | | | | | | | | | | | (4,300 | ) | | | (204,938 | ) * |
Dechra Pharmaceuticals PLC | | | | | | | | | | | (4,565 | ) | | | (155,329 | ) (a) |
MyoKardia Inc. | | | | | | | | | | | (2,945 | ) | | | (153,582 | ) * |
Takeda Pharmaceutical Co. Ltd., ADR | | | | | | | | | | | (17,000 | ) | | | (292,400 | ) |
Teva Pharmaceutical Industries Ltd., ADR | | | | | | | | | | | (25,600 | ) | | | (176,128 | ) * |
Total Pharmaceuticals | | | | | | | | | | | | | | | (1,200,455 | ) |
Total Health Care | | | | | | | | | | | | | | | (4,263,696 | ) |
| Industrials — (17.7)% | | | | | | | | | | | | | | | | |
Aerospace & Defense — (1.7)% | | | | | | | | | | | | | | | | |
BWX Technologies Inc. | | | | | | | | | | | (5,300 | ) | | | (303,213 | ) |
CAE Inc. | | | | | | | | | | | (7,800 | ) | | | (198,172 | ) |
See Notes to Financial Statements.
| | |
| QS Global Market Neutral Fund 2019 Annual Report | | 29 |
Schedule of investments (cont’d)
September 30, 2019
QS Global Market Neutral Fund
| | | | | | | | | | | | | | | | |
| Security | | | | | | | | Shares | | | Value | |
Aerospace & Defense — continued | | | | | | | | | | | | | | | | |
Rolls-Royce Holdings PLC | | | | | | | | | | | (38,000 | ) | | $ | (370,079 | ) *(a) |
Saab AB, Class B Shares | | | | | | | | | | | (6,846 | ) | | | (196,697 | ) (a) |
Total Aerospace & Defense | | | | | | | | | | | | | | | (1,068,161 | ) |
Air Freight & Logistics — (0.9)% | | | | | | | | | | | | | | | | |
Bollore SA | | | | | | | | | | | (70,765 | ) | | | (293,455 | ) (a) |
Cargojet Inc. | | | | | | | | | | | (3,500 | ) | | | (248,647 | ) |
Total Air Freight & Logistics | | | | | | | | | | | | | | | (542,102 | ) |
Airlines — (0.3)% | | | | | | | | | | | | | | | | |
easyJet PLC | | | | | | | | | | | (14,874 | ) | | | (210,280 | ) (a) |
Building Products — (0.3)% | | | | | | | | | | | | | | | | |
TOTO Ltd. | | | | | | | | | | | (4,900 | ) | | | (184,692 | ) (a) |
Commercial Services & Supplies — (1.4)% | | | | | | | | | | | | | | | | |
Babcock International Group PLC | | | | | | | | | | | (26,507 | ) | | | (182,051 | ) (a) |
Elis SA | | | | | | | | | | | (15,614 | ) | | | (276,217 | ) (a) |
Stericycle Inc. | | | | | | | | | | | (3,682 | ) | | | (187,524 | ) * |
Waste Connections Inc. | | | | | | | | | | | (2,700 | ) | | | (248,041 | ) |
Total Commercial Services & Supplies | | | | | | | | | | | | | | | (893,833 | ) |
Construction & Engineering — (0.6)% | | | | | | | | | | | | | | | | |
Balfour Beatty PLC | | | | | | | | | | | (84,803 | ) | | | (231,474 | ) (a) |
SNC-Lavalin Group Inc. | | | | | | | | | | | (9,000 | ) | | | (126,761 | ) |
Total Construction & Engineering | | | | | | | | | | | | | | | (358,235 | ) |
Electrical Equipment — (2.3)% | | | | | | | | | | | | | | | | |
ABB Ltd., ADR | | | | | | | | | | | (15,300 | ) | | | (300,951 | ) |
Melrose Industries PLC | | | | | | | | | | | (124,057 | ) | | | (307,329 | ) (a) |
Nidec Corp. | | | | | | | | | | | (2,400 | ) | | | (325,221 | ) (a) |
Prysmian SpA | | | | | | | | | | | (12,379 | ) | | | (266,065 | ) (a) |
Sanyo Denki Co. Ltd. | | | | | | | | | | | (2,200 | ) | | | (97,007 | ) (a) |
TKH Group NV | | | | | | | | | | | (2,798 | ) | | | (139,578 | ) (a) |
Total Electrical Equipment | | | | | | | | | | | | | | | (1,436,151 | ) |
Industrial Conglomerates — (0.6)% | | | | | | | | | | | | | | | | |
DCC PLC | | | | | | | | | | | (2,209 | ) | | | (192,665 | ) (a) |
Keihan Holdings Co. Ltd. | | | | | | | | | | | (4,400 | ) | | | (196,313 | ) (a) |
Total Industrial Conglomerates | | | | | | | | | | | | | | | (388,978 | ) |
Machinery — (3.8)% | | | | | | | | | | | | | | | | |
CNH Industrial NV | | | | | | | | | | | (20,500 | ) | | | (209,044 | ) (a) |
Daifuku Co. Ltd. | | | | | | | | | | | (5,200 | ) | | | (270,617 | ) (a) |
FANUC Corp. | | | | | | | | | | | (1,800 | ) | | | (341,459 | ) (a) |
Knorr-Bremse AG | | | | | | | | | | | (2,062 | ) | | | (193,824 | ) (a) |
MISUMI Group Inc. | | | | | | | | | | | (14,300 | ) | | | (339,714 | ) (a) |
SMC Corp. | | | | | | | | | | | (670 | ) | | | (288,269 | ) (a) |
See Notes to Financial Statements.
| | |
| 30 | | QS Global Market Neutral Fund 2019 Annual Report |
QS Global Market Neutral Fund
| | | | | | | | | | | | | | | | |
| Security | | | | | | | | Shares | | | Value | |
Machinery — continued | | | | | | | | | | | | | | | | |
Wabtec Corp. | | | | | | | | | | | (2,577 | ) | | $ | (185,183 | ) |
Wartsila OYJ Abp | | | | | | | | | | | (14,000 | ) | | | (157,045 | ) (a) |
Weir Group PLC | | | | | | | | | | | (16,962 | ) | | | (297,665 | ) (a) |
Xylem Inc. | | | | | | | | | | | (2,651 | ) | | | (211,073 | ) |
Total Machinery | | | | | | | | | | | | | | | (2,493,893 | ) |
Professional Services — (1.4)% | | | | | | | | | | | | | | | | |
Capita PLC | | | | | | | | | | | (176,717 | ) | | | (314,726 | ) *(a) |
Equifax Inc. | | | | | | | | | | | (1,767 | ) | | | (248,564 | ) |
Morneau Shepell Inc. | | | | | | | | | | | (12,400 | ) | | | (308,491 | ) |
Total Professional Services | | | | | | | | | | | | | | | (871,781 | ) |
Road & Rail — (2.4)% | | | | | | | | | | | | | | | | |
Keio Corp. | | | | | | | | | | | (2,800 | ) | | | (174,860 | ) (a) |
Keisei Electric Railway Co. Ltd. | | | | | | | | | | | (5,400 | ) | | | (222,909 | ) (a) |
Kintetsu Group Holdings Co. Ltd., Class L Shares | | | | | | | | | | | (5,200 | ) | | | (271,582 | ) (a) |
Kyushu Railway Co. | | | | | | | | | | | (7,200 | ) | | | (230,263 | ) (a) |
Odakyu Electric Railway Co. Ltd. | | | | | | | | | | | (11,000 | ) | | | (264,316 | ) (a) |
Tokyu Corp. | | | | | | | | | | | (15,500 | ) | | | (291,869 | ) (a) |
Total Road & Rail | | | | | | | | | | | | | | | (1,455,799 | ) |
Trading Companies & Distributors — (0.5)% | | | | | | | | | | | | | | | | |
Trusco Nakayama Corp. | | | | | | | | | | | (12,400 | ) | | | (290,779 | ) (a) |
Transportation Infrastructure — (1.5)% | | | | | | | | | | | | | | | | |
Auckland International Airport Ltd. | | | | | | | | | | | (54,039 | ) | | | (308,928 | ) (a) |
Japan Airport Terminal Co. Ltd. | | | | | | | | | | | (7,000 | ) | | | (304,875 | ) (a) |
Transurban Group | | | | | | | | | | | (32,000 | ) | | | (317,654 | ) (a) |
Total Transportation Infrastructure | | | | | | | | | | | | | | | (931,457 | ) |
Total Industrials | | | | | | | | | | | | | | | (11,126,141 | ) |
| Information Technology — (10.6)% | | | | | | | | | | | | | | | | |
Electronic Equipment, Instruments & Components — (2.7)% | | | | | | | | | | | | | | | | |
Corning Inc. | | | | | | | | | | | (9,200 | ) | | | (262,384 | ) |
Hexagon AB, Class B Shares | | | | | | | | | | | (5,800 | ) | | | (280,258 | ) (a) |
Keyence Corp. | | | | | | | | | | | (550 | ) | | | (342,670 | ) (a) |
nLight Inc. | | | | | | | | | | | (9,130 | ) | | | (142,976 | ) * |
Renishaw PLC | | | | | | | | | | | (2,960 | ) | | | (133,304 | ) (a) |
Spectris PLC | | | | | | | | | | | (6,038 | ) | | | (181,634 | ) (a) |
Taiyo Yuden Co. Ltd. | | | | | | | | | | | (5,800 | ) | | | (142,913 | ) (a) |
Yaskawa Electric Corp. | | | | | | | | | | | (7,800 | ) | | | (289,731 | ) (a) |
Total Electronic Equipment, Instruments & Components | | | | | | | | | | | | | | | (1,775,870 | ) |
IT Services — (2.3)% | | | | | | | | | | | | | | | | |
Digital Garage Inc. | | | | | | | | | | | (4,400 | ) | | | (141,127 | ) (a) |
See Notes to Financial Statements.
| | |
| QS Global Market Neutral Fund 2019 Annual Report | | 31 |
Schedule of investments (cont’d)
September 30, 2019
QS Global Market Neutral Fund
| | | | | | | | | | | | | | | | |
| Security | | | | | | | | Shares | | | Value | |
IT Services — continued | | | | | | | | | | | | | | | | |
GMO Payment Gateway Inc. | | | | | | | | | | | (2,900 | ) | | $ | (193,795 | ) (a) |
InterXion Holding NV | | | | | | | | | | | (3,742 | ) | | | (304,823 | ) * |
Nexi SpA | | | | | | | | | | | (20,322 | ) | | | (207,358 | ) *(a) |
NEXTDC Ltd. | | | | | | | | | | | (60,218 | ) | | | (250,010 | ) *(a) |
Twilio Inc., Class A Shares | | | | | | | | | | | (1,694 | ) | | | (186,272 | ) * |
Worldline SA | | | | | | | | | | | (3,093 | ) | | | (195,365 | ) *(a) |
Total IT Services | | | | | | | | | | | | | | | (1,478,750 | ) |
Semiconductors & Semiconductor Equipment — (2.8)% | | | | | | | | | | | | | | | | |
Advanced Micro Devices Inc. | | | | | | | | | | | (9,719 | ) | | | (281,754 | ) * |
Disco Corp. | | | | | | | | | | | (1,200 | ) | | | (229,627 | ) (a) |
Infineon Technologies AG | | | | | | | | | | | (15,816 | ) | | | (284,309 | ) (a) |
Marvell Technology Group Ltd. | | | | | | | | | | | (12,000 | ) | | | (299,640 | ) |
MitsuiHigh-Tec Inc. | | | | | | | | | | | (10,700 | ) | | | (169,659 | ) (a) |
SCREEN Holdings Co. Ltd. | | | | | | | | | | | (4,400 | ) | | | (262,609 | ) (a) |
u-blox Holding AG | | | | | | | | | | | (2,026 | ) | | | (146,229 | ) *(a) |
Ultra Clean Holdings Inc. | | | | | | | | | | | (10,000 | ) | | | (146,350 | ) * |
Total Semiconductors & Semiconductor Equipment | | | | | | | | | | | | | | | (1,820,177 | ) |
Software — (2.1)% | | | | | | | | | | | | | | | | |
2U Inc. | | | | | | | | | | | (7,185 | ) | | | (116,972 | ) * |
8x8 Inc. | | | | | | | | | | | (7,216 | ) | | | (149,515 | ) * |
Altair Engineering Inc., Class A Shares | | | | | | | | | | | (4,565 | ) | | | (158,040 | ) * |
Appfolio Inc., Class A Shares | | | | | | | | | | | (1,620 | ) | | | (154,127 | ) * |
Guidewire Software Inc. | | | | | | | | | | | (2,503 | ) | | | (263,766 | ) * |
PTC Inc. | | | | | | | | | | | (2,062 | ) | | | (140,587 | ) * |
SAP SE, ADR | | | | | | | | | | | (2,600 | ) | | | (306,462 | ) |
Talend SA, ADR | | | | | | | | | | | (4,400 | ) | | | (149,512 | ) * |
Total Software | | | | | | | | | | | | | | | (1,438,981 | ) |
Technology Hardware, Storage & Peripherals — (0.7)% | | | | | | | | | | | | | | | | |
S&T AG | | | | | | | | | | | (6,332 | ) | | | (126,083 | ) (a) |
Western Digital Corp. | | | | | | | | | | | (4,800 | ) | | | (286,272 | ) |
Total Technology Hardware, Storage & Peripherals | | | | | | | | | | | | | | | (412,355 | ) |
Total Information Technology | | | | | | | | | | | | | | | (6,926,133 | ) |
| Materials — (10.7)% | | | | | | | | | | | | | | | | |
Chemicals — (6.6)% | | | | | | | | | | | | | | | | |
Chr Hansen Holding A/S | | | | | | | | | | | (2,600 | ) | | | (220,746 | ) (a) |
Elementis PLC | | | | | | | | | | | (99,877 | ) | | | (181,621 | ) (a) |
Givaudan SA, Registered Shares | | | | | | | | | | | (109 | ) | | | (304,222 | ) (a) |
Hitachi Chemical Co. Ltd. | | | | | | | | | | | (6,800 | ) | | | (222,423 | ) (a) |
See Notes to Financial Statements.
| | |
| 32 | | QS Global Market Neutral Fund 2019 Annual Report |
QS Global Market Neutral Fund
| | | | | | | | | | | | | | | | |
| Security | | | | | | | | Shares | | | Value | |
Chemicals — continued | | | | | | | | | | | | | | | | |
Ingevity Corp. | | | | | | | | | | | (2,062 | ) | | $ | (174,940 | ) * |
International Flavors & Fragrances Inc. | | | | | | | | | | | (2,209 | ) | | | (271,022 | ) |
Johnson Matthey PLC | | | | | | | | | | | (6,500 | ) | | | (244,539 | ) (a) |
Linde PLC | | | | | | | | | | | (1,399 | ) | | | (271,014 | ) |
Nippon Paint Holdings Co. Ltd. | | | | | | | | | | | (6,600 | ) | | | (344,294 | ) (a) |
Nufarm Ltd. | | | | | | | | | | | (54,000 | ) | | | (205,987 | ) (a) |
Scapa Group PLC | | | | | | | | | | | (40,000 | ) | | | (105,754 | ) (a) |
Shin-Etsu Chemical Co. Ltd. | | | | | | | | | | | (1,800 | ) | | | (193,944 | ) (a) |
Sika AG, Registered Shares | | | | | | | | | | | (2,062 | ) | | | (301,812 | ) (a) |
Symrise AG | | | | | | | | | | | (3,093 | ) | | | (300,603 | ) (a) |
Taiyo Nippon Sanso Corp. | | | | | | | | | | | (16,000 | ) | | | (324,857 | ) (a) |
Umicore SA | | | | | | | | | | | (6,851 | ) | | | (258,860 | ) (a) |
Victrex PLC | | | | | | | | | | | (8,836 | ) | | | (234,553 | ) (a) |
Total Chemicals | | | | | | | | | | | | | | | (4,161,191 | ) |
Construction Materials — (0.8)% | | | | | | | | | | | | | | | | |
James Hardie Industries PLC | | | | | | | | | | | (13,254 | ) | | | (222,591 | ) (a) |
Summit Materials Inc., Class A Shares | | | | | | | | | | | (10,314 | ) | | | (228,971 | ) * |
Total Construction Materials | | | | | | | | | | | | | | | (451,562 | ) |
Containers & Packaging — (0.4)% | | | | | | | | | | | | | | | | |
DS Smith PLC | | | | | | | | | | | (57,875 | ) | | | (256,645 | ) (a) |
Metals & Mining — (2.6)% | | | | | | | | | | | | | | | | |
Agnico Eagle Mines Ltd. | | | | | | | | | | | (5,400 | ) | | | (289,391 | ) |
Barrick Gold Corp. | | | | | | | | | | | (16,000 | ) | | | (276,801 | ) |
Franco-Nevada Corp. | | | | | | | | | | | (3,200 | ) | | | (291,583 | ) |
Fresnillo PLC | | | | | | | | | | | (33,463 | ) | | | (281,550 | ) (a) |
SSR Mining Inc. | | | | | | | | | | | (19,600 | ) | | | (284,195 | ) * |
thyssenkrupp AG | | | | | | | | | | | (20,100 | ) | | | (278,544 | ) (a) |
Total Metals & Mining | | | | | | | | | | | | | | | (1,702,064 | ) |
Paper & Forest Products — (0.3)% | | | | | | | | | | | | | | | | |
Mondi PLC | | | | | | | | | | | (9,867 | ) | | | (188,938 | ) (a) |
Total Materials | | | | | | | | | | | | | | | (6,760,400 | ) |
| Real Estate — (4.6)% | | | | | | | | | | | | | | | | |
Equity Real Estate Investment Trusts (REITs) — (4.3)% | | | | | | | | | | | | | | | | |
Agree Realty Corp. | | | | | | | | | | | (2,651 | ) | | | (193,921 | ) |
Daiwa House REIT Investment Corp. | | | | | | | | | | | (110 | ) | | | (309,309 | ) (a) |
Digital Realty Trust Inc. | | | | | | | | | | | (2,400 | ) | | | (311,544 | ) |
GLP J-Reit | | | | | | | | | | | (191 | ) | | | (253,296 | ) (a) |
Healthcare Realty Trust Inc. | | | | | | | | | | | (6,627 | ) | | | (222,004 | ) |
Nippon Building Fund Inc. | | | | | | | | | | | (40 | ) | | | (307,171 | ) (a) |
Nomura Real Estate Master Fund Inc. | | | | | | | | | | | (166 | ) | | | (299,734 | ) (a) |
See Notes to Financial Statements.
| | |
| QS Global Market Neutral Fund 2019 Annual Report | | 33 |
Schedule of investments (cont’d)
September 30, 2019
QS Global Market Neutral Fund
| | | | | | | | | | | | | | | | |
| Security | | | | | | | | Shares | | | Value | |
Equity Real Estate Investment Trusts (REITs) — continued | | | | | | | | | | | | | | | | |
Primary Health Properties PLC | | | | | | | | | | | (48,587 | ) | | $ | (79,233 | ) (a) |
Shaftesbury PLC | | | | | | | | | | | (15,904 | ) | | | (177,652 | ) (a) |
Washington Real Estate Investment Trust | | | | | | | | | | | (5,891 | ) | | | (161,178 | ) |
WP Carey Inc. | | | | | | | | | | | (3,240 | ) | | | (289,980 | ) |
Total Equity Real Estate Investment Trusts (REITs) | | | | | | | | | | | | | | | (2,605,022 | ) |
Real Estate Management & Development — (0.3)% | | | | | | | | | | | | | | | | |
Capital & Counties Properties PLC | | | | | | | | | | | (59,013 | ) | | | (170,626 | ) (a) |
Total Real Estate | | | | | | | | | | | | | | | (2,775,648 | ) |
| Utilities — (3.2)% | | | | | | | | | | | | | | | | |
Electric Utilities — (0.7)% | | | | | | | | | | | | | | | | |
Emera Inc. | | | | | | | | | | | (5,900 | ) | | | (259,006 | ) |
Fortis Inc. | | | | | | | | | | | (5,200 | ) | | | (219,838 | ) |
Total Electric Utilities | | | | | | | | | | | | | | | (478,844 | ) |
Independent Power and Renewable Electricity Producers — (0.6)% | | | | | | | | | | | | | | | | |
Boralex Inc., Class A Shares | | | | | | | | | | | (14,300 | ) | | | (244,261 | ) |
Scatec Solar ASA | | | | | | | | | | | (9,623 | ) | | | (123,645 | ) (a) |
Total Independent Power and Renewable Electricity Producers | | | | | | | | | | | | | | | (367,906 | ) |
Multi-Utilities — (0.5)% | | | | | | | | | | | | | | | | |
Innogy SE | | | | | | | | | | | (6,367 | ) | | | (309,887 | ) (a) |
Water Utilities — (1.4)% | | | | | | | | | | | | | | | | |
American Water Works Co. Inc. | | | | | | | | | | | (2,356 | ) | | | (292,686 | ) |
Aqua America Inc. | | | | | | | | | | | (6,500 | ) | | | (291,395 | ) |
Severn Trent PLC | | | | | | | | | | | (8,600 | ) | | | (229,018 | ) (a) |
Total Water Utilities | | | | | | | | | | | | | | | (813,099 | ) |
Total Utilities | | | | | | | | | | | | | | | (1,969,736 | ) |
Total Securities Sold Short (Proceeds — $(56,430,581)) | | | | | | | | | | | | | | $ | (57,733,415 | ) |
| * | Non-income producing security. |
| ‡ | Percentages indicated are based on net assets. |
| (a) | Security is valued in good faith in accordance with procedures approved by the Board of Trustees (Note 1). |
| | |
Abbreviations used in this schedule: |
| |
| ADR | | — American Depositary Receipts |
| |
| REIT | | — Real Estate Investment Trust |
See Notes to Financial Statements.
| | |
| 34 | | QS Global Market Neutral Fund 2019 Annual Report |
QS Global Market Neutral Fund
| | | | |
| Summary of Securities Sold Short by Country±(unaudited) | | | |
| United States | | | 29.8 | % |
| Japan | | | 22.3 | |
| United Kingdom | | | 14.4 | |
| Canada | | | 8.3 | |
| Germany | | | 7.4 | |
| Switzerland | | | 2.9 | |
| Australia | | | 2.8 | |
| France | | | 2.2 | |
| Italy | | | 1.8 | |
| Sweden | | | 1.6 | |
| Spain | | | 1.5 | |
| Ireland | | | 0.8 | |
| Netherlands | | | 0.8 | |
| Belgium | | | 0.7 | |
| New Zealand | | | 0.5 | |
| Norway | | | 0.5 | |
| Mexico | | | 0.5 | |
| Denmark | | | 0.4 | |
| Israel | | | 0.3 | |
| Finland | | | 0.3 | |
| Austria | | | 0.2 | |
| | | | 100.0 | % |
| ± | As a percentage of total securities sold short. Please note that the Fund holdings are as of September 30, 2019 and are subject to change. |
At September 30, 2019, the Fund had the following open forward foreign currency contracts:
| | | | | | | | | | | | | | | | | | | | |
Currency
Purchased | | | Currency
Sold | | | Counterparty | | Settlement
Date | | | Unrealized
Appreciation
(Depreciation) | |
| USD | | | 7,495,800 | | | GBP | | | 6,000,000 | | | Bank of New York | | | 10/18/19 | | | $ | 112,794 | |
| USD | | | 11,715,096 | | | JPY | | | 1,264,668,000 | | | Bank of New York | | | 10/18/19 | | | | 3,990 | |
| USD | | | 4,821,177 | | | CAD | | | 6,388,000 | | | Citibank N.A. | | | 10/18/19 | | | | (1,917 | ) |
| USD | | | 7,618,572 | | | EUR | | | 6,875,000 | | | Northern Trust Co. | | | 10/18/19 | | | | 114,474 | |
| Total | | | | | | | | | | | | | | | $ | 229,341 | |
| | |
Abbreviations used in this table: |
| |
| CAD | | — Canadian Dollar |
| |
| EUR | | — Euro |
| |
| GBP | | — British Pound |
| |
| JPY | | — Japanese Yen |
| |
| USD | | — United States Dollar |
See Notes to Financial Statements.
| | |
| QS Global Market Neutral Fund 2019 Annual Report | | 35 |
Statement of assets and liabilities
September 30, 2019
| | | | |
| |
| Assets: | | | | |
Investments, at value (Cost — $61,283,174) | | $ | 61,693,119 | |
Foreign currency, at value (Cost — $71,344) | | | 71,102 | |
Cash | | | 16,561 | |
Foreign cash collateral held at broker for securities sold short, at value (Cost — $38,167,218) | | | 38,036,899 | |
Deposits with brokers for securities sold short | | | 20,923,472 | |
Interest and dividends receivable | | | 272,681 | |
Unrealized appreciation on forward foreign currency contracts | | | 231,258 | |
Receivable for Fund shares sold | | | 53,018 | |
Prepaid expenses | | | 35,461 | |
Total Assets | | | 121,333,571 | |
| |
| Liabilities: | | | | |
Investments sold short, at value (proceeds received $56,430,581) | | | 57,733,415 | |
Dividends payable on securities sold short | | | 81,604 | |
Investment management fee payable | | | 25,071 | |
Unrealized depreciation on forward foreign currency contracts | | | 1,917 | |
Trustees’ fees payable | | | 1,015 | |
Service and/or distribution fees payable | | | 59 | |
Payable for Fund shares repurchased | | | 4 | |
Accrued expenses | | | 58,781 | |
Total Liabilities | | | 57,901,866 | |
| Total Net Assets | | $ | 63,431,705 | |
| |
| Net Assets: | | | | |
Par value (Note 7) | | $ | 67 | |
Paid-in capital in excess of par value | | | 66,893,085 | |
Total distributable earnings (loss) | | | (3,461,447) | |
| Total Net Assets | | $ | 63,431,705 | |
See Notes to Financial Statements.
| | |
| 36 | | QS Global Market Neutral Fund 2019 Annual Report |
| | | | |
| |
| Net Assets: | | | | |
Class A | | | $100,334 | |
Class C | | | $47,010 | |
Class I | | | $5,355,384 | |
Class IS | | | $57,928,977 | |
| |
| Shares Outstanding: | | | | |
Class A | | | 10,676 | |
Class C | | | 5,057 | |
Class I | | | 568,213 | |
Class IS | | | 6,134,419 | |
| |
| Net Asset Value: | | | | |
Class A (and redemption price) | | | $9.40 | |
Class C* | | | $9.30 | |
Class I (and redemption price) | | | $9.42 | |
Class IS (and redemption price) | | | $9.44 | |
| Maximum Public Offering Price Per Share: | | | | |
Class A (based on maximum initial sales charge of 5.75%) | | | $9.97 | |
| * | Redemption price per share is NAV of Class C shares reduced by a 1.00% CDSC if shares are redeemed within one year from purchase payment (Note 2). |
See Notes to Financial Statements.
| | |
| QS Global Market Neutral Fund 2019 Annual Report | | 37 |
Statement of operations
For the Year Ended September 30, 2019
| | | | |
| |
| Investment Income: | | | | |
Dividends | | $ | 1,154,571 | |
Interest | | | 248,913 | |
Less: Foreign taxes withheld | | | (87,292) | |
Total Investment Income | | | 1,316,192 | |
| |
| Expenses: | | | | |
Dividend expense on securities sold short | | | 878,231 | |
Investment management fee (Note 2) | | | 399,917 | |
Registration fees | | | 79,634 | |
Fund accounting fees | | | 74,278 | |
Audit and tax fees | | | 56,988 | |
Legal fees | | | 26,619 | |
Custody fees | | | 9,903 | |
Trustees’ fees | | | 6,370 | |
Fees recaptured by investment manager (Note 2) | | | 5,845 | |
Shareholder reports | | | 4,713 | |
Insurance | | | 1,403 | |
Transfer agent fees (Note 5) | | | 1,289 | |
Service and/or distribution fees (Notes 2 and 5) | | | 769 | |
Interest expense | | | 375 | |
Miscellaneous expenses | | | 5,953 | |
Total Expenses | | | 1,552,287 | |
Less: Fee waivers and/or expense reimbursements (Notes 2 and 5) | | | (204,547) | |
Net Expenses | | | 1,347,740 | |
| Net Investment Loss | | | (31,548) | |
| |
Realized and Unrealized Gain (Loss) on Investments, Short Sales, Forward Foreign Currency Contracts and Foreign Currency Transactions (Notes 1, 3 and 4): | | | | |
Net Realized Gain (Loss) From: | | | | |
Investment transactions | | | (949,223) | |
Securities sold short | | | 2,041,143 | |
Forward foreign currency contracts | | | 800,618 | |
Foreign currency transactions | | | (713,267) | |
Net Realized Gain | | | 1,179,271 | |
Change in Net Unrealized Appreciation (Depreciation) From: | | | | |
Investments | | | (2,552,050) | |
Securities sold short | | | (1,412,073) | |
Forward foreign currency contracts | | | 95,270 | |
Foreign currencies | | | 31,092 | |
Change in Net Unrealized Appreciation (Depreciation) | | | (3,837,761) | |
| Net Loss on Investments, Short Sales, Forward Foreign Currency Contracts and Foreign Currency Transactions | | | (2,658,490) | |
| Decrease in Net Assets From Operations | | $ | (2,690,038) | |
See Notes to Financial Statements.
| | |
| 38 | | QS Global Market Neutral Fund 2019 Annual Report |
Statements of changes in net assets
| | | | | | | | |
| For the Years Ended September 30, | | 2019 | | | 2018 | |
| | |
| Operations: | | | | | | | | |
Net investment loss | | $ | (31,548) | | | $ | (49,164) | |
Net realized gain (loss) | | | 1,179,271 | | | | (1,675,983) | |
Change in net unrealized appreciation (depreciation) | | | (3,837,761) | | | | 1,862,888 | |
Increase (Decrease) in Net Assets From Operations | | | (2,690,038) | | | | 137,741 | |
| | |
| Distributions to Shareholders From (Notes 1 and 6): | | | | | | | | |
Total distributable earnings(a) | | | (950,002) | | | | (431,007) | |
Decrease in Net Assets From Distributions to Shareholders | | | (950,002) | | | | (431,007) | |
| | |
| Fund Share Transactions (Note 7): | | | | | | | | |
Net proceeds from sale of shares | | | 26,717,220 | | | | 4,474,739 | |
Reinvestment of distributions | | | 947,360 | | | | 430,486 | |
Cost of shares repurchased | | | (3,603,629) | | | | (2,587,607) | |
Increase in Net Assets From Fund Share Transactions | | | 24,060,951 | | | | 2,317,618 | |
Increase in Net Assets | | | 20,420,911 | | | | 2,024,352 | |
| | |
| Net Assets: | | | | | | | | |
Beginning of year | | | 43,010,794 | | | | 40,986,442 | |
End of year(b) | | $ | 63,431,705 | | | $ | 43,010,794 | |
| (a) | Distributions from net investment income and from realized gains are no longer required to be separately disclosed (Note 9). For the year ended September 30, 2018, distributions from net investment income were $431,007. |
| (b) | Parenthetical disclosure of undistributed net investment income is no longer required (Note 9). For the year ended September 30, 2018, end of year net assets included undistributed net investment income of $306,098. |
See Notes to Financial Statements.
| | |
| QS Global Market Neutral Fund 2019 Annual Report | | 39 |
Financial highlights
| | | | | | | | | | | | | | | | |
For a share of each class of beneficial interest outstanding throughout each year ended September 30,
unless otherwise noted: | |
| Class A Shares1 | | 2019 | | | 2018 | | | 2017 | | | 20162 | |
| | | | |
| Net asset value, beginning of year | | | $10.35 | | | | $10.44 | | | | $9.62 | | | | $10.00 | |
| | | | |
| Income (loss) from operations: | | | | | | | | | | | | | | | | |
Net investment loss | | | (0.07) | | | | (0.04) | | | | (0.12) | | | | (0.16) | |
Net realized and unrealized gain (loss) | | | (0.71) | | | | 0.04 | | | | 0.94 | | | | (0.22) | |
Total income (loss) from operations | | | (0.78) | | | | 0.00 | 3 | | | 0.82 | | | | (0.38) | |
| | | | |
| Less distributions from: | | | | | | | | | | | | | | | | |
Net investment income | | | (0.17) | | | | (0.09) | | | | — | | | | — | |
Total distributions | | | (0.17) | | | | (0.09) | | | | — | | | | — | |
| | | | |
| Net asset value, end of year | | | $9.40 | | | | $10.35 | | | | $10.44 | | | | $9.62 | |
Total return4 | | | (7.49) | % | | | (0.13) | % | | | 8.52 | % | | | (3.80) | % |
| | | | |
| Net assets, end of year (000s) | | | $100 | | | | $140 | | | | $194 | | | | $96 | |
| | | | |
| Ratios to average net assets: | | | | | | | | | | | | | | | | |
Gross expenses | | | 4.11 | %5 | | | 3.67 | %5 | | | 6.13 | % | | | 9.69 | %6 |
Net expenses7,8 | | | 3.61 | 5 | | | 3.20 | 5 | | | 3.38 | | | | 4.09 | 6 |
Net investment loss | | | (0.70) | | | | (0.35) | | | | (1.18) | | | | (1.97) | 6 |
| | | | |
| Portfolio turnover rate9 | | | 147 | % | | | 64 | % | | | 100 | % | | | 143 | % |
| 1 | Per share amounts have been calculated using the average shares method. |
| 2 | For the period November 30, 2015 (inception date) to September 30, 2016. |
| 3 | Amount represents less than $0.005 per share. |
| 4 | Performance figures, exclusive of sales charges, may reflect compensating balance arrangements, fee waivers and/or expense reimbursements. In the absence of compensating balance arrangements, fee waivers and/or expense reimbursements, the total return would have been lower. Past performance is no guarantee of future results. Total returns for periods of less than one year are not annualized. |
| 5 | Reflects recapture of expenses waived/reimbursed from prior fiscal years. |
| 7 | Reflects fee waivers and/or expense reimbursements. |
| 8 | As a result of an expense limitation arrangement, the ratio of total annual fund operating expenses, other than interest, brokerage commissions and expenses; fees, costs and expenses associated with any prime brokerage arrangement (including costs of any securities borrowing arrangement); dividend and interest expenses on securities sold short, taxes, extraordinary expenses and acquired fund fees and expenses, to average net assets of Class A shares did not exceed 1.55%. Total annual fund operating expenses after waiving fees and/or reimbursing expenses exceed the expense cap as a result of dividend and interest expenses on securities sold short. This expense limitation arrangement cannot be terminated prior to December 31, 2020 without the Board of Trustees’ consent. |
| 9 | Excluding short sale transactions. If short sale transactions had been included, the portfolio turnover rate would have been 335% for the year ended September 30, 2019, 141% for the year ended September 30, 2018, 576% for the year ended September 30, 2017 and 398% for the period ended September 30, 2016. |
See Notes to Financial Statements.
| | |
| 40 | | QS Global Market Neutral Fund 2019 Annual Report |
| | | | | | | | |
For a share of each class of beneficial interest outstanding throughout each year ended September 30,
unless otherwise noted: | |
| Class C Shares1 | | 2019 | | | 20182 | |
| | |
| Net asset value, beginning of year | | | $10.33 | | | | $10.09 | |
| | |
| Income (loss) from operations: | | | | | | | | |
Net investment loss | | | (0.13) | | | | (0.01) | |
Net realized and unrealized gain (loss) | | | (0.70) | | | | 0.25 | |
Total income (loss) from operations | | | (0.83) | | | | 0.24 | |
| | |
| Less distributions from: | | | | | | | | |
Net investment income | | | (0.20) | | | | — | |
Total distributions | | | (0.20) | | | | — | |
| | |
| Net asset value, end of year | | | $9.30 | | | | $10.33 | |
Total return3 | | | (8.14) | % | | | 2.28 | % |
| | |
| Net assets, end of year (000s) | | | $47 | | | | $51 | |
| | |
| Ratios to average net assets: | | | | | | | | |
Gross expenses | | | 4.76 | %4 | | | 4.68 | %5 |
Net expenses6,7 | | | 4.27 | 4 | | | 4.03 | 5 |
Net investment loss | | | (1.28) | | | | (0.54) | 5 |
| | |
| Portfolio turnover rate8 | | | 147 | % | | | 64 | %9 |
| 1 | Per share amounts have been calculated using the average shares method. |
| 2 | For the period July 16, 2018 (inception date) to September 30, 2018. |
| 3 | Performance figures, exclusive of CDSC, may reflect compensating balance arrangements, fee waivers and/or expense reimbursements. In the absence of compensating balance arrangements, fee waivers and/or expense reimbursements, the total return would have been lower. Past performance is no guarantee of future results. Total returns for periods of less than one year are not annualized. |
| 4 | Reflects recapture of expenses waived/reimbursed from prior fiscal years. |
| 6 | Reflects fee waivers and/or expense reimbursements. |
| 7 | As a result of an expense limitation arrangement, the ratio of total annual fund operating expenses, other than interest, brokerage commissions and expenses; fees, costs and expenses associated with any prime brokerage arrangement (including costs of any securities borrowing arrangement); dividend and interest expenses on securities sold short, taxes, extraordinary expenses and acquired fund fees and expenses, to average net assets of Class C shares did not exceed 2.30%. Total annual fund operating expenses after waiving fees and/or reimbursing expenses exceed the expense cap as a result of dividend and interest expenses on securities sold short. This expense limitation arrangement cannot be terminated prior to December 31, 2020 without the Board of Trustees’ consent. |
| 8 | Excluding short sale transactions. If short sale transactions had been included, the portfolio turnover rate would have been 335% for the year ended September 30, 2019 and 141% for the year ended September 30, 2018. |
| 9 | For the year ended September 30, 2018. |
See Notes to Financial Statements.
| | |
| QS Global Market Neutral Fund 2019 Annual Report | | 41 |
Financial highlights (cont’d)
| | | | | | | | | | | | | | | | |
For a share of each class of beneficial interest outstanding throughout each year ended September 30,
unless otherwise noted: | |
| Class I Shares1 | | 2019 | | | 2018 | | | 2017 | | | 20162 | |
| | | | |
| Net asset value, beginning of year | | | $10.42 | | | | $10.50 | | | | $9.64 | | | | $10.00 | |
| | | | |
| Income (loss) from operations: | | | | | | | | | | | | | | | | |
Net investment loss | | | (0.03) | | | | (0.01) | | | | (0.09) | | | | (0.11) | |
Net realized and unrealized gain (loss) | | | (0.72) | | | | 0.04 | | | | 0.95 | | | | (0.25) | |
Total income (loss) from operations | | | (0.75) | | | | 0.03 | | | | 0.86 | | | | (0.36) | |
| | | | |
| Less distributions from: | | | | | | | | | | | | | | | | |
Net investment income | | | (0.25) | | | | (0.11) | | | | — | | | | — | |
Total distributions | | | (0.25) | | | | (0.11) | | | | — | | | | — | |
| | | | |
| Net asset value, end of year | | | $9.42 | | | | $10.42 | | | | $10.50 | | | | $9.64 | |
Total return3 | | | (7.25) | % | | | 0.18 | % | | | 8.81 | % | | | (3.50) | % |
| | | | |
| Net assets, end of year (000s) | | | $5,355 | | | | $4,807 | | | | $4,378 | | | | $1,545 | |
| | | | |
| Ratios to average net assets: | | | | | | | | | | | | | | | | |
Gross expenses | | | 3.79 | %4 | | | 3.18 | %4 | | | 5.98 | %4 | | | 9.01 | %5 |
Net expenses6,7 | | | 3.31 | 4 | | | 2.71 | 4 | | | 3.24 | 4 | | | 3.99 | 5 |
Net investment loss | | | (0.27) | | | | (0.12) | | | | (0.88) | | | | (1.36) | 5 |
| | | | |
| Portfolio turnover rate8 | | | 147 | % | | | 64 | % | | | 100 | % | | | 143 | % |
| 1 | Per share amounts have been calculated using the average shares method. |
| 2 | For the period November 30, 2015 (inception date) to September 30, 2016. |
| 3 | Performance figures may reflect compensating balance arrangements, fee waivers and/or expense reimbursements. In the absence of compensating balance arrangements, fee waivers and/or expense reimbursements, the total return would have been lower. Past performance is no guarantee of future results. Total returns for periods of less than one year are not annualized. |
| 4 | Reflects recapture of expenses waived/reimbursed from prior fiscal years. |
| 6 | Reflects fee waivers and/or expense reimbursements. |
| 7 | As a result of an expense limitation arrangement, the ratio of total annual fund operating expenses, other than interest, brokerage commissions and expenses; fees, costs and expenses associated with any prime brokerage arrangement (including costs of any securities borrowing arrangement); dividend and interest expenses on securities sold short, taxes, extraordinary expenses and acquired fund fees and expenses, to average net assets of Class I shares did not exceed 1.20%. Total annual fund operating expenses after waiving fees and/or reimbursing expenses exceed the expense cap as a result of dividend and interest expenses on securities sold short. This expense limitation arrangement cannot be terminated prior to December 31, 2020 without the Board of Trustees’ consent. |
| 8 | Excluding short sale transactions. If short sale transactions had been included, the portfolio turnover rate would have been 335% for the year ended September 30, 2019, 141% for the year ended September 30, 2018, 576% for the year ended September 30, 2017 and 398% for the period ended September 30, 2016. |
See Notes to Financial Statements.
| | |
| 42 | | QS Global Market Neutral Fund 2019 Annual Report |
| | | | | | | | | | | | | | | | |
For a share of each class of beneficial interest outstanding throughout each year ended September 30,
unless otherwise noted: | |
| Class IS Shares1 | | 2019 | | | 2018 | | | 2017 | | | 20162 | |
| | | | |
| Net asset value, beginning of year | | | $10.43 | | | | $10.51 | | | | $9.65 | | | | $10.00 | |
| | | | |
| Income (loss) from operations: | | | | | | | | | | | | | | | | |
Net investment loss | | | (0.00) | 3 | | | (0.01) | | | | (0.02) | | | | (0.14) | |
Net realized and unrealized gain (loss) | | | (0.74) | | | | 0.04 | | | | 0.88 | | | | (0.21) | |
Total income (loss) from operations | | | (0.74) | | | | 0.03 | | | | 0.86 | | | | (0.35) | |
| | | | |
| Less distributions from: | | | | | | | | | | | | | | | | |
Net investment income | | | (0.25) | | | | (0.11) | | | | — | | | | — | |
Total distributions | | | (0.25) | | | | (0.11) | | | | — | | | | — | |
| | | | |
| Net asset value, end of year | | | $9.44 | | | | $10.43 | | | | $10.51 | | | | $9.65 | |
Total return4 | | | (7.13) | % | | | 0.18 | % | | | 8.91 | % | | | (3.50) | % |
| | | | |
| Net assets, end of year (000s) | | | $57,929 | | | | $38,012 | | | | $36,415 | | | | $4,631 | |
| | | | |
| Ratios to average net assets: | | | | | | | | | | | | | | | | |
Gross expenses | | | 3.67 | %5 | | | 3.17 | %5 | | | 5.52 | % | | | 9.40 | %6 |
Net expenses7,8 | | | 3.18 | 5 | | | 2.70 | 5 | | | 2.81 | | | | 3.78 | 6 |
Net investment loss | | | (0.05) | | | | (0.11) | | | | (0.17) | | | | (1.66) | 6 |
| | | | |
| Portfolio turnover rate9 | | | 147 | % | | | 64 | % | | | 100 | % | | | 143 | % |
| 1 | Per share amounts have been calculated using the average shares method. |
| 2 | For the period November 30, 2015 (inception date) to September 30, 2016. |
| 3 | Amount represents less than $0.005 per share. |
| 4 | Performance figures may reflect compensating balance arrangements, fee waivers and/or expense reimbursements. In the absence of compensating balance arrangements, fee waivers and/or expense reimbursements, the total return would have been lower. Past performance is no guarantee of future results. Total returns for periods of less than one year are not annualized. |
| 5 | Reflects recapture of expenses waived/reimbursed from prior fiscal years. |
| 7 | Reflects fee waivers and/or expense reimbursements. |
| 8 | As a result of an expense limitation arrangement, the ratio of total annual fund operating expenses, other than interest, brokerage commissions and expenses; fees, costs and expenses associated with any prime brokerage arrangement (including costs of any securities borrowing arrangement); dividend and interest expenses on securities sold short, taxes, extraordinary expenses and acquired fund fees and expenses, to average net assets of Class IS shares did not exceed 1.10%. In addition, the ratio of the total annual fund operating expenses for Class IS shares did not exceed the ratio of total annual fund operating expenses for Class I shares. Total annual fund operating expenses after waiving fees and/or reimbursing expenses exceed the expense cap as a result of dividend and interest expenses on securities sold short. These expense limitation arrangements cannot be terminated prior to December 31, 2020 without the Board of Trustees’ consent. |
| 9 | Excluding short sale transactions. If short sale transactions had been included, the portfolio turnover rate would have been 335% for the year ended September 30, 2019, 141% for the year ended September 30, 2018, 576% for the year ended September 30, 2017 and 398% for the period ended September 30, 2016. |
See Notes to Financial Statements.
| | |
| QS Global Market Neutral Fund 2019 Annual Report | | 43 |
Notes to financial statements
1. Organization and significant accounting policies
QS Global Market Neutral Fund (the “Fund”) is a separate diversified investment series of Legg Mason Global Asset Management Trust (the “Trust”). The Trust, a Maryland statutory trust, is registered under the Investment Company Act of 1940, as amended (the “1940 Act”), as an open-end management investment company.
The following are significant accounting policies consistently followed by the Fund and are in conformity with U.S. generally accepted accounting principles (“GAAP”). Estimates and assumptions are required to be made regarding assets, liabilities and changes in net assets resulting from operations when financial statements are prepared. Changes in the economic environment, financial markets and any other parameters used in determining these estimates could cause actual results to differ. Subsequent events have been evaluated through the date the financial statements were issued.
(a) Investment valuation. Equity securities for which market quotations are available are valued at the last reported sales price or official closing price on the primary market or exchange on which they trade. The valuations for fixed income securities (which may include, but are not limited to, corporate, government, municipal, mortgage-backed, collateralized mortgage obligations and asset-backed securities) and certain derivative instruments are typically the prices supplied by independent third party pricing services, which may use market prices or broker/dealer quotations or a variety of valuation techniques and methodologies. The independent third party pricing services use inputs that are observable such as issuer details, interest rates, yield curves, prepayment speeds, credit risks/spreads, default rates and quoted prices for similar securities. Investments in open-end funds are valued at the closing net asset value per share of each fund on the day of valuation. When the Fund holds securities or other assets that are denominated in a foreign currency, the Fund will normally use the currency exchange rates as of 4:00 p.m. (Eastern Time). If independent third party pricing services are unable to supply prices for a portfolio investment, or if the prices supplied are deemed by the manager to be unreliable, the market price may be determined by the manager using quotations from one or more broker/dealers or at the transaction price if the security has recently been purchased and no value has yet been obtained from a pricing service or pricing broker. When reliable prices are not readily available, such as when the value of a security has been significantly affected by events after the close of the exchange or market on which the security is principally traded, but before the Fund calculates its net asset value, the Fund values these securities as determined in accordance with procedures approved by the Fund’s Board of Trustees.
The Board of Trustees is responsible for the valuation process and has delegated the supervision of the daily valuation process to the Legg Mason North Atlantic Fund Valuation Committee (the “Valuation Committee”). The Valuation Committee, pursuant to the policies adopted by the Board of Trustees, is responsible for making fair value determinations, evaluating the effectiveness of the Fund’s pricing policies, and reporting to the Board of Trustees. When determining the reliability of third party pricing information for investments
| | |
| 44 | | QS Global Market Neutral Fund 2019 Annual Report |
owned by the Fund, the Valuation Committee, among other things, conducts due diligence reviews of pricing vendors, monitors the daily change in prices and reviews transactions among market participants.
The Valuation Committee will consider pricing methodologies it deems relevant and appropriate when making fair value determinations. Examples of possible methodologies include, but are not limited to, multiple of earnings; discount from market of a similar freely traded security; discounted cash-flow analysis; book value or a multiple thereof; risk premium/yield analysis; yield to maturity; and/or fundamental investment analysis. The Valuation Committee will also consider factors it deems relevant and appropriate in light of the facts and circumstances. Examples of possible factors include, but are not limited to, the type of security; the issuer’s financial statements; the purchase price of the security; the discount from market value of unrestricted securities of the same class at the time of purchase; analysts’ research and observations from financial institutions; information regarding any transactions or offers with respect to the security; the existence of merger proposals or tender offers affecting the security; the price and extent of public trading in similar securities of the issuer or comparable companies; and the existence of a shelf registration for restricted securities.
For each portfolio security that has been fair valued pursuant to the policies adopted by the Board of Trustees, the fair value price is compared against the last available and next available market quotations. The Valuation Committee reviews the results of such back testing monthly and fair valuation occurrences are reported to the Board of Trustees quarterly.
The Fund uses valuation techniques to measure fair value that are consistent with the market approach and/or income approach, depending on the type of security and the particular circumstance. The market approach uses prices and other relevant information generated by market transactions involving identical or comparable securities. The income approach uses valuation techniques to discount estimated future cash flows to present value.
GAAP establishes a disclosure hierarchy that categorizes the inputs to valuation techniques used to value assets and liabilities at measurement date. These inputs are summarized in the three broad levels listed below:
| • | | Level 1 — quoted prices in active markets for identical investments |
| • | | Level 2 — other significant observable inputs (including quoted prices for similar investments, interest rates, prepayment speeds, credit risk, etc.) |
| • | | Level 3 — significant unobservable inputs (including the Fund’s own assumptions in determining the fair value of investments) |
The inputs or methodologies used to value securities are not necessarily an indication of the risk associated with investing in those securities.
| | |
| QS Global Market Neutral Fund 2019 Annual Report | | 45 |
Notes to financial statements (cont’d)
The following is a summary of the inputs used in valuing the Fund’s assets and liabilities carried at fair value:
| | | | | | | | | | | | | | | | |
| ASSETS | |
| Description | | Quoted Prices
(Level 1) | | | Other Significant
Observable Inputs
(Level 2) | | | Significant
Unobservable
Inputs
(Level 3) | | | Total | |
| Long-Term Investments†: | | | | | | | | | | | | | | | | |
Common Stocks: | | | | | | | | | | | | | | | | |
Communication Services | | $ | 2,282,830 | | | $ | 923,713 | | | | — | | | $ | 3,206,543 | |
Consumer Discretionary | | | 3,155,590 | | | | 5,232,456 | | | | — | | | | 8,388,046 | |
Consumer Staples | | | 702,421 | | | | 1,777,760 | | | | — | | | | 2,480,181 | |
Energy | | | 2,173,443 | | | | 1,676,021 | | | | — | | | | 3,849,464 | |
Financials | | | 2,009,450 | | | | 3,804,094 | | | | — | | | | 5,813,544 | |
Health Care | | | 3,261,062 | | | | 1,034,678 | | | | — | | | | 4,295,740 | |
Industrials | | | 3,896,230 | | | | 7,181,372 | | | | — | | | | 11,077,602 | |
Information Technology | | | 3,887,436 | | | | 3,332,493 | | | | — | | | | 7,219,929 | |
Materials | | | 1,529,680 | | | | 4,979,668 | | | | — | | | | 6,509,348 | |
Real Estate | | | 999,545 | | | | 1,757,611 | | | | — | | | | 2,757,156 | |
Utilities | | | 493,104 | | | | 1,425,960 | | | | — | | | | 1,919,064 | |
Preferred Stocks | | | — | | | | 360,021 | | | | — | | | | 360,021 | |
| Total Long-Term Investments | | | 24,390,791 | | | | 33,485,847 | | | | — | | | | 57,876,638 | |
| Short-Term Investments† | | | 3,816,481 | | | | — | | | | — | | | | 3,816,481 | |
| Total Investments | | $ | 28,207,272 | | | $ | 33,485,847 | | | | — | | | $ | 61,693,119 | |
| Other Financial Instruments: | | | | | | | | | | | | | | | | |
Forward Foreign Currency Contracts | | | — | | | $ | 231,258 | | | | — | | | $ | 231,258 | |
| Total | | $ | 28,207,272 | | | $ | 33,717,105 | | | | — | | | $ | 61,924,377 | |
| | |
| 46 | | QS Global Market Neutral Fund 2019 Annual Report |
| | | | | | | | | | | | | | | | |
| LIABILITIES | |
| Description | | Quoted Prices
(Level 1) | | | Other Significant
Observable Inputs
(Level 2) | | | Significant
Unobservable
Inputs
(Level 3) | | | Total | |
| Securities Sold Short†: | | | | | | | | | | | | | | | | |
Common Stocks: | | | | | | | | | | | | | | | | |
Communication Services | | $ | 592,910 | | | $ | 2,852,523 | | | | — | | | $ | 3,445,433 | |
Consumer Discretionary | | | 3,594,798 | | | | 4,885,133 | | | | — | | | | 8,479,931 | |
Consumer Staples | | | 997,702 | | | | 1,566,698 | | | | — | | | | 2,564,400 | |
Energy | | | 3,456,698 | | | | 312,348 | | | | — | | | | 3,769,046 | |
Financials | | | 2,999,038 | | | | 2,653,813 | | | | — | | | | 5,652,851 | |
Health Care | | | 2,101,331 | | | | 2,162,365 | | | | — | | | | 4,263,696 | |
Industrials | | | 2,566,620 | | | | 8,559,521 | | | | — | | | | 11,126,141 | |
Information Technology | | | 3,349,452 | | | | 3,576,681 | | | | — | | | | 6,926,133 | |
Materials | | | 2,087,917 | | | | 4,672,483 | | | | — | | | | 6,760,400 | |
Real Estate | | | 1,178,627 | | | | 1,597,021 | | | | — | | | | 2,775,648 | |
Utilities | | | 1,307,186 | | | | 662,550 | | | | — | | | | 1,969,736 | |
Total Securities Sold Short | | | 24,232,279 | | | | 33,501,136 | | | | — | | | | 57,733,415 | |
| Other Financial Instruments: | | | | | | | | | | | | | | | | |
Forward Foreign Currency Contracts | | | — | | | | 1,917 | | | | — | | | | 1,917 | |
| Total | | $ | 24,232,279 | | | $ | 33,503,053 | | | | — | | | $ | 57,735,332 | |
| † | See Schedule of Investments for additional detailed categorizations. |
(b) Forward foreign currency contracts. The Fund enters into a forward foreign currency contract to hedge against foreign currency exchange rate risk on its non-U.S. dollar denominated securities or to facilitate settlement of a foreign currency denominated portfolio transaction. A forward foreign currency contract is an agreement between two parties to buy and sell a currency at a set price with delivery and settlement at a future date. The contract is marked-to-market daily and the change in value is recorded by the Fund as an unrealized gain or loss. When a forward foreign currency contract is closed, through either delivery or offset by entering into another forward foreign currency contract, the Fund recognizes a realized gain or loss equal to the difference between the value of the contract at the time it was opened and the value of the contract at the time it is closed.
Forward foreign currency contracts involve elements of market risk in excess of the amounts reflected on the Statement of Assets and Liabilities. The Fund bears the risk of an unfavorable change in the foreign exchange rate underlying the forward foreign currency contract. Risks may also arise upon entering into these contracts from the potential inability of the counterparties to meet the terms of their contracts.
(c) Short sale transactions. Short sales are transactions in which the Fund sells a security it does not own in anticipation of a decline in the market value of that security. To complete such a transaction, a Fund must borrow the security to deliver to the buyer. The Fund
| | |
| QS Global Market Neutral Fund 2019 Annual Report | | 47 |
Notes to financial statements (cont’d)
is then obligated to replace the security borrowed by purchasing it in the open market at the time of replacement. The proceeds received by the Fund for the short sale are retained by the broker as collateral until the Fund replaces the borrowed security. If the market value of the security sold short increases, additional collateral may be required. The amount of collateral required is determined daily by reference to the market value of the short positions. Liabilities for securities sold short are marked-to-market daily and reported at market value in the financial statements.
Short sale transactions may result in a risk of loss that may exceed the amount shown on the Statement of Assets and Liabilities. Again, limited to the price at which the Fund sold the security short, or a loss, potentially unlimited in size, will be recognized upon termination of a short sale. Dividends on short positions are recorded as a liability on the ex-dividend date and are shown in the Statement of Operations as Dividend Expense because the Fund must pay the dividend to the lender of the security.
Short selling is a technique that may be considered speculative, involves risk beyond the amount of money used to secure each transaction and may represent a form of leverage.
(d) Foreign currency translation. Investment securities and other assets and liabilities denominated in foreign currencies are translated into U.S. dollar amounts based upon prevailing exchange rates on the date of valuation. Purchases and sales of investment securities and income and expense items denominated in foreign currencies are translated into U.S. dollar amounts based upon prevailing exchange rates on the respective dates of such transactions.
The Fund does not isolate that portion of the results of operations resulting from fluctuations in foreign exchange rates on investments from the fluctuations arising from changes in market prices of securities held. Such fluctuations are included with the net realized and unrealized gain or loss on investments.
Net realized foreign exchange gains or losses arise from sales of foreign currencies, including gains and losses on forward foreign currency contracts, currency gains or losses realized between the trade and settlement dates on securities transactions, and the difference between the amounts of dividends, interest, and foreign withholding taxes recorded on the Fund’s books and the U.S. dollar equivalent of the amounts actually received or paid. Net unrealized foreign exchange gains and losses arise from changes in the values of assets and liabilities, other than investments in securities, on the date of valuation, resulting from changes in exchange rates.
Foreign security and currency transactions may involve certain considerations and risks not typically associated with those of U.S. dollar denominated transactions as a result of, among other factors, the possibility of lower levels of governmental supervision and regulation of foreign securities markets and the possibility of political or economic instability.
| | |
| 48 | | QS Global Market Neutral Fund 2019 Annual Report |
(e) Foreign investment risks. The Fund’s investments in foreign securities may involve risks not present in domestic investments. Since securities may be denominated in foreign currencies, may require settlement in foreign currencies or pay interest or dividends in foreign currencies, changes in the relationship of these foreign currencies to the U.S. dollar can significantly affect the value of the investments and earnings of the Fund. Foreign investments may also subject the Fund to foreign government exchange restrictions, expropriation, taxation or other political, social or economic developments, all of which affect the market and/or credit risk of the investments.
(f) Counterparty risk and credit-risk-related contingent features of derivative instruments. The Fund may invest in certain securities or engage in other transactions, where the Fund is exposed to counterparty credit risk in addition to broader market risks. The Fund may invest in securities of issuers, which may also be considered counterparties as trading partners in other transactions. This may increase the risk of loss in the event of default or bankruptcy by the counterparty or if the counterparty otherwise fails to meet its contractual obligations. The Fund’s subadviser attempts to mitigate counterparty risk by (i) periodically assessing the creditworthiness of its trading partners, (ii) monitoring and/or limiting the amount of its net exposure to each individual counterparty based on its assessment and (iii) requiring collateral from the counterparty for certain transactions. Market events and changes in overall economic conditions may impact the assessment of such counterparty risk by the subadviser. In addition, declines in the values of underlying collateral received may expose the Fund to increased risk of loss.
With exchange traded and centrally cleared derivatives, there is less counterparty risk to the Fund since the exchange or clearinghouse, as counterparty to such instruments, guarantees against a possible default. The clearinghouse stands between the buyer and the seller of the contract; therefore, the credit risk is limited to failure of the clearinghouse. While offset rights may exist under applicable law, the Fund does not have a contractual right of offset against a clearing broker or clearinghouse in the event of a default of the clearing broker or clearinghouse.
The Fund has entered into master agreements, such as an International Swaps and Derivatives Association, Inc. Master Agreement (“ISDA Master Agreement”) or similar agreement, with certain of its derivative counterparties that govern over-the-counter derivatives and provide for general obligations, representations, agreements, collateral posting terms, netting provisions in the event of default or termination and credit related contingent features. The credit related contingent features include, but are not limited to, a percentage decrease in the Fund’s net assets or NAV over a specified period of time. If these credit related contingent features were triggered, the derivatives counterparty could terminate the positions and demand payment or require additional collateral.
Under an ISDA Master Agreement, the Fund may, under certain circumstances, offset with the counterparty certain derivative financial instruments’ payables and/or receivables with collateral held and/or posted and create one single net payment. However, absent an event
| | |
| QS Global Market Neutral Fund 2019 Annual Report | | 49 |
Notes to financial statements (cont’d)
of default by the counterparty or a termination of the agreement, the terms of the ISDA Master Agreements do not result in an offset of reported amounts of financial assets and financial liabilities in the Statement of Assets and Liabilities across transactions between the Fund and the applicable counterparty. The enforceability of the right to offset may vary by jurisdiction.
Collateral requirements differ by type of derivative. Collateral or margin requirements are set by the broker or exchange clearinghouse for exchange traded derivatives while collateral terms are contract specific for over-the-counter traded derivatives. Cash collateral that has been pledged to cover obligations of the Fund under derivative contracts, if any, will be reported separately in the Statement of Assets and Liabilities. Securities pledged as collateral, if any, for the same purpose are noted in the Schedule of Investments.
As of September 30, 2019, the Fund held forward foreign currency contracts with credit related contingent features which had a liability position of $1,917. If a contingent feature in the master agreements would have been triggered, the Fund would have been required to pay this amount to its derivative counterparties.
(g) Security transactions and investment income. Security transactions are accounted for on a trade date basis. Interest income (including interest income from payment-in-kind securities), adjusted for amortization of premium and accretion of discount, is recorded on the accrual basis. Dividend income is recorded on the ex-dividend date for dividends received in cash and/or securities. Foreign dividend income is recorded on the ex-dividend date or as soon as practicable after the Fund determines the existence of a dividend declaration after exercising reasonable due diligence. The cost of investments sold is determined by use of the specific identification method. To the extent any issuer defaults or a credit event occurs that impacts the issuer, the Fund may halt any additional interest income accruals and consider the realizability of interest accrued up to the date of default or credit event.
(h) REIT distributions. The character of distributions received from Real Estate Investment Trusts (‘‘REITs’’) held by the Fund is generally comprised of net investment income, capital gains, and return of capital. It is the policy of the Fund to estimate the character of distributions received from underlying REITs based on historical data provided by the REITs. After each calendar year end, REITs report the actual tax character of these distributions. Differences between the estimated and actual amounts reported by the REITs are reflected in the Fund’s records in the year in which they are reported by the REITs by adjusting related investment cost basis, capital gains and income, as necessary.
(i) Distributions to shareholders. Distributions from net investment income and distributions of net realized gains, if any, are declared at least annually. Distributions to shareholders of the Fund are recorded on the ex-dividend date and are determined in accordance with income tax regulations, which may differ from GAAP.
| | |
| 50 | | QS Global Market Neutral Fund 2019 Annual Report |
(j) Share class accounting. Investment income, common expenses and realized/ unrealized gains (losses) on investments are allocated to the various classes of the Fund on the basis of daily net assets of each class. Fees relating to a specific class are charged directly to that share class.
(k) Compensating balance arrangements. The Fund has an arrangement with its custodian bank whereby a portion of the custodian’s fees is paid indirectly by credits earned on the Fund’s cash on deposit with the bank.
(l) Federal and other taxes. It is the Fund’s policy to comply with the federal income and excise tax requirements of the Internal Revenue Code of 1986 (the “Code”), as amended, applicable to regulated investment companies. Accordingly, the Fund intends to distribute its taxable income and net realized gains, if any, to shareholders in accordance with timing requirements imposed by the Code. Therefore, no federal or state income tax provision is required in the Fund’s financial statements.
Management has analyzed the Fund’s tax positions taken on income tax returns for all open tax years and has concluded that as of September 30, 2019, no provision for income tax is required in the Fund’s financial statements. The Fund’s federal and state income and federal excise tax returns for tax years for which the applicable statutes of limitations have not expired are subject to examination by the Internal Revenue Service and state departments of revenue.
Under the applicable foreign tax laws, a withholding tax may be imposed on interest, dividends and capital gains at various rates.
(m) Reclassification. GAAP requires that certain components of net assets be reclassified to reflect permanent differences between financial and tax reporting. These reclassifications have no effect on net assets or net asset value per share. During the current year, the Fund had no reclassifications.
2. Investment management agreement and other transactions with affiliates
Legg Mason Partners Fund Advisor, LLC (“LMPFA”) is the Fund’s investment manager and QS Investors, LLC (“QS Investors”) is the Fund’s subadviser. Western Asset Management Company, LLC (“Western Asset”) manages the portion of the Fund’s cash and short-term instruments allocated to it. LMPFA, QS Investors and Western Asset are wholly-owned subsidiaries of Legg Mason, Inc. (“Legg Mason”).
Under the investment management agreement, the Fund pays an investment management fee, calculated daily and paid monthly, at an annual rate of 0.95% of the Fund’s average daily net assets.
LMPFA provides administrative and certain oversight services to the Fund. LMPFA delegates to the subadviser the day-to-day portfolio management of the Fund, except for the management of the portion of the cash and short-term instruments allocated to Western Asset. For its services, LMPFA pays QS Investors monthly an aggregate fee equal to 70% of the net
| | |
| QS Global Market Neutral Fund 2019 Annual Report | | 51 |
Notes to financial statements (cont’d)
management fee it receives from the Fund. For Western Asset’s services to the Fund, LMPFA pays Western Asset monthly 0.02% of the portion of the Fund’s average daily net assets that are allocated to Western Asset by LMPFA.
As a result of expense limitation arrangements between the Fund and LMPFA, the ratio of total annual fund operating expenses, other than interest, brokerage commissions and expenses; fees, costs and expenses associated with any prime brokerage arrangement (including costs of any securities borrowing arrangement); dividend and interest expenses on securities sold short, taxes, extraordinary expenses and acquired fund fees and expenses, to average net assets of Class A, Class C, Class I and Class IS shares did not exceed 1.55%, 2.30%, 1.20% and 1.10%, respectively. In addition, the ratio of total annual fund operating expenses for Class IS shares did not exceed the ratio of total annual fund operating expenses for Class I shares. Total annual fund operating expenses after waiving fees and reimbursing expenses, as applicable, exceed the expense cap for each class as a result of dividend and interest expenses on securities sold short. These expense limitation arrangements cannot be terminated prior to December 31, 2020 without the Board of Trustees’ consent.
During the year ended September 30, 2019, fees waived and/or expenses reimbursed amounted to $204,547.
LMPFA is permitted to recapture amounts waived and/or reimbursed to a class within three years after the fiscal year in which LMPFA earned the fee or incurred the expense if the class’ total annual operating expenses have fallen to a level below the expense limitation (“expense cap”) in effect at the time the fees were earned or the expenses incurred. In no case will LMPFA recapture any amount that would result, on any particular business day of the Fund, in the class’ total annual operating expenses exceeding the expense cap or any other lower limit then in effect.
Pursuant to these arrangements, at September 30, 2019, the Fund had remaining fee waivers and/or expense reimbursements subject to recapture by LMPFA and respective dates of expiration as follows:
| | | | | | | | | | | | | | | | |
| | | Class A | | | Class C | | | Class I | | | Class IS | |
| Expires September 30, 2020 | | $ | 3,302 | | | | — | | | $ | 46,377 | | | $ | 175,816 | |
| Expires September 30, 2021 | | | 1,041 | | | $ | 61 | | | | 20,800 | | | | 177,839 | |
| Expires September 30, 2022 | | | 563 | | | | 244 | | | | 24,282 | | | | 179,458 | |
| Total fee waivers/expense reimbursements subject to recapture | | $ | 4,906 | | | $ | 305 | | | $ | 91,459 | | | $ | 533,113 | |
For the year ended September 30, 2019, fee waivers and/or expense reimbursements recaptured by LMPFA, if any, were as follows:
| | | | | | | | | | | | | | | | |
| | | Class A | | | Class C | | | Class I | | | Class IS | |
| LMPFA recaptured | | $ | 79 | | | $ | 7 | | | $ | 3,902 | | | $ | 1,857 | |
| | |
| 52 | | QS Global Market Neutral Fund 2019 Annual Report |
Legg Mason Investor Services, LLC (“LMIS”), a wholly-owned broker-dealer subsidiary of Legg Mason, serves as the Fund’s sole and exclusive distributor.
There is a maximum initial sales charge of 5.75% for Class A shares. There is a contingent deferred sales charge (“CDSC”) of 1.00% on Class C shares, which applies if redemption occurs within 12 months from purchase payment. In certain cases, Class A shares have a 1.00% CDSC, which applies if redemption occurs within 18 months from purchase payment. This CDSC only applies to those purchases of Class A shares, which, when combined with current holdings of other shares of funds sold by LMIS, equal or exceed $1,000,000 in the aggregate. These purchases do not incur an initial sales charge.
For the year ended September 30, 2019, LMIS and its affiliates did not receive any sales charges on sales of the Fund’s Class A shares. In addition, for the year ended September 30, 2019, there were no CDSCs paid to LMIS and its affiliates.
All officers and one Trustee of the Trust are employees of Legg Mason or its affiliates and do not receive compensation from the Trust.
As of September 30, 2019, Legg Mason and its affiliates owned 87% of the Fund.
3. Investments
During the year ended September 30, 2019, the aggregate cost of purchases and proceeds from sales of investments (excluding short-term investments) were as follows:
| | | | |
| | | Investments* | |
| Purchases | | | $79,735,635 | |
| Sales | | | 57,948,813 | |
| * | Excluding securities sold short and covers on securities sold short in the amount of $74,089,158 and $57,394,524, respectively. |
At September 30, 2019, the aggregate cost of investments and the aggregate gross unrealized appreciation and depreciation of investments for federal income tax purposes were as follows:
| | | | | | | | | | | | | | | | |
| | | Cost/
(Proceeds) | | | Gross
Unrealized
Appreciation | | | Gross
Unrealized
Depreciation | | | Net
Unrealized
Appreciation
(Depreciation) | |
| Securities | | $ | 61,374,865 | | | $ | 2,765,711 | | | $ | (2,447,457) | | | $ | 318,254 | |
| Forward foreign currency contracts | | | — | | | | 231,258 | | | | (1,917) | | | | 229,341 | |
| Securities sold short | | | (56,396,847) | | | | 2,616,003 | | | | (3,952,571) | | | | (1,336,568) | |
| | |
| QS Global Market Neutral Fund 2019 Annual Report | | 53 |
Notes to financial statements (cont’d)
4. Derivative instruments and hedging activities
Below is a table, grouped by derivative type, that provides information about the fair value and the location of derivatives within the Statement of Assets and Liabilities at September 30, 2019.
| | | | |
| ASSET DERIVATIVES1 | |
| | | Foreign
Exchange Risk | |
| Forward foreign currency contracts | | $ | 231,258 | |
| |
| LIABILITY DERIVATIVES1 | | | |
| | | Foreign
Exchange Risk | |
| Forward foreign currency contracts | | $ | 1,917 | |
| 1 | Generally, the balance sheet location for asset derivatives is receivables/net unrealized appreciation (depreciation) and for liability derivatives is payables/net unrealized appreciation (depreciation). |
The following tables provide information about the effect of derivatives and hedging activities on the Fund’s Statement of Operations for the year ended September 30, 2019. The first table provides additional detail about the amounts and sources of gains (losses) realized on derivatives during the period. The second table provides additional information about the change in unrealized appreciation (depreciation) resulting from the Fund’s derivatives and hedging activities during the period.
| | | | |
| AMOUNT OF REALIZED GAIN (LOSS) ON DERIVATIVES RECOGNIZED | |
| | | Foreign
Exchange Risk | |
| Forward foreign currency contracts | | | $800,618 | |
|
| CHANGE IN UNREALIZED APPRECIATION (DEPRECIATION) ON DERIVATIVES RECOGNIZED | |
| | | Foreign Exchange Risk | |
| Forward foreign currency contracts | | $ | 95,270 | |
During the year ended September 30, 2019, the volume of derivative activity for the Fund was as follows:
| | | | |
| | | Average
Market Value | |
| Forward foreign currency contracts (to buy)† | | $ | 66,476 | |
| Forward foreign currency contracts (to sell) | | | 22,142,579 | |
| † | At September 30, 2019, there were no open positions held in this derivative. |
| | |
| 54 | | QS Global Market Neutral Fund 2019 Annual Report |
The following table presents the Fund’s OTC derivative assets and liabilities by counterparty net of amounts available for offset under an ISDA Master Agreement and net of the related collateral pledged (received) by the Fund as of September 30, 2019.
| | | | | | | | | | | | | | | | | | |
| Counterparty | | Gross Assets
Subject to
Master
Agreements1 | | | Gross
Liabilities
Subject to
Master
Agreements1 | | | Net Assets
(Liabilities)
Subject to
Master
Agreements | | | Collateral
Pledged
(Received) | | Net
Amount2 | |
| Bank of New York | | $ | 116,784 | | | | — | | | $ | 116,784 | | | — | | $ | 116,784 | |
| Citibank N.A. | | | — | | | $ | (1,917) | | | | (1,917) | | | — | | | (1,917) | |
| Northern Trust Co. | | | 114,474 | | | | — | | | | 114,474 | | | — | | | 114,474 | |
| Total | | $ | 231,258 | | | $ | (1,917) | | | $ | 229,341 | | | — | | $ | 229,341 | |
| 1 | Absent an event of default or early termination, derivative assets and liabilities are presented gross and not offset in the Statement of Assets and Liabilities. |
| 2 | Represents the net amount receivable (payable) from (to) the counterparty in the event of default. |
5. Class specific expenses, waivers and/or expense reimbursements
The Fund has adopted a Rule 12b-1 shareholder services and distribution plan and under that plan the Fund pays service and/or distribution fees with respect to its Class A and Class C shares calculated at the annual rate of 0.25% and 1.00% of the average daily net assets of each class, respectively. Service and/or distribution fees are accrued daily and paid monthly.
For the year ended September 30, 2019, class specific expenses were as follows:
| | | | | | | | |
| | | Service and/or
Distribution Fees | | | Transfer Agent
Fees | |
| Class A | | | $276 | | | | $ 172 | |
| Class C | | | 493 | | | | 31 | |
| Class I | | | — | | | | 1,308 | |
| Class IS | | | — | | | | (222) | |
| Total | | | $769 | | | | $1,289 | |
For the year ended September 30, 2019, waivers and/or expense reimbursements by class were as follows:
| | | | |
| | | Waivers/Expense
Reimbursements | |
| Class A | | $ | 563 | |
| Class C | | | 244 | |
| Class I | | | 24,282 | |
| Class IS | | | 179,458 | |
| Total | | $ | 204,547 | |
| | |
| QS Global Market Neutral Fund 2019 Annual Report | | 55 |
Notes to financial statements (cont’d)
6. Distributions to shareholders by class
| | | | | | | | |
| | | Year Ended
September 30, 2019 | | | Year Ended
September 30, 2018 | |
| Net Investment Income: | | | | | | | | |
| Class A | | $ | 1,910 | | | $ | 1,596 | |
| Class C | | | 995 | | | | — | 1 |
| Class I | | | 114,373 | | | | 45,019 | |
| Class IS | | | 832,724 | | | | 384,392 | |
| Total | | $ | 950,002 | | | $ | 431,007 | |
| 1 | For the period July 16, 2018 (inception date) to September 30, 2018. |
7. Shares of beneficial interest
At September 30, 2019, the Trust had an unlimited number of shares of beneficial interest authorized with a par value of $0.00001 per share. The Fund has the ability to issue multiple classes of shares. Each class of shares represents an identical interest and has the same rights, except that each class bears certain direct expenses, including those specifically related to the distribution of its shares.
Transactions in shares of each class were as follows:
| | | | | | | | | | | | | | | | | | | | |
| | | Year Ended
September 30, 2019 | | Year Ended
September 30, 2018 |
| | | Shares | | Amount | | Shares | | Amount |
| Class A | | | | | | | | | | | | | | | | | | | | |
| Shares sold | | | | 29 | | | | $ | 287 | | | | | 21,053 | | | | $ | 220,160 | |
| Shares issued on reinvestment | | | | 194 | | | | | 1,910 | | | | | 155 | | | | | 1,596 | |
| Shares repurchased | | | | (3,063) | | | | | (31,356) | | | | | (26,237) | | | | | (269,801) | |
| Net decrease | | | | (2,840) | | | | $ | (29,159) | | | | | (5,029) | | | | $ | (48,045) | |
| | | | |
| Class C | | | | | | | | | | | | | | | | | | | | |
| Shares sold | | | | — | | | | | — | | | | | 4,955 | 1 | | | $ | 50,000 | 1 |
| Shares issued on reinvestment | | | | 102 | | | | $ | 995 | | | | | — | | | | | — | |
| Shares repurchased | | | | — | | | | | — | | | | | — | | | | | — | |
| Net increase | | | | 102 | | | | $ | 995 | | | | | 4,955 | 1 | | | $ | 50,000 | 1 |
| | | | |
| Class I | | | | | | | | | | | | | | | | | | | | |
| Shares sold | | | | 99,188 | | | | $ | 969,804 | | | | | 40,059 | | | | $ | 410,000 | |
| Shares issued on reinvestment | | | | 11,588 | | | | | 114,373 | | | | | 4,354 | | | | | 45,019 | |
| Shares repurchased | | | | (4,076) | | | | | (38,825) | | | | | — | | | | | — | |
| Net increase | | | | 106,700 | | | | $ | 1,045,352 | | | | | 44,413 | | | | $ | 455,019 | |
| | | | |
| Class IS | | | | | | | | | | | | | | | | | | | | |
| Shares sold | | | | 2,747,576 | | | | $ | 25,747,129 | | | | | 362,605 | | | | $ | 3,794,579 | |
| Shares issued on reinvestment | | | | 84,016 | | | | | 830,082 | | | | | 37,089 | | | | | 383,871 | |
| Shares repurchased | | | | (341,807) | | | | | (3,533,448) | | | | | (220,912) | | | | | (2,317,806) | |
| Net increase | | | | 2,489,785 | | | | $ | 23,043,763 | | | | | 178,782 | | | | $ | 1,860,644 | |
| 1 | For the period July 16, 2018 (inception date) to September 30, 2018. |
| | |
| 56 | | QS Global Market Neutral Fund 2019 Annual Report |
8. Income tax information and distributions to shareholders
The tax character of distributions paid during the fiscal years ended September 30, was as follows:
| | | | | | | | |
| | | 2019 | | | 2018 | |
| Distributions paid from: | | | | | | | | |
| Ordinary income | | $ | 950,002 | | | $ | 431,007 | |
As of September 30, 2019, the components of accumulated earnings (losses) on a tax basis were as follows:
| | | | |
| Undistributed ordinary income — net | | | $ 176,790 | |
| Deferred capital losses* | | | (2,444,085) | |
| Other book/tax temporary differences(a) | | | (306,142) | |
| Unrealized appreciation (depreciation)(b) | | | (888,010) | |
| Total accumulated earnings (losses) — net | | | $(3,461,447) | |
| * | These capital losses have been deferred in the current year as either short-term or long-term losses. The losses will be deemed to occur on the first day of the next taxable year in the same character as they were originally deferred and will be available to offset future taxable capital gains. |
| (a) | Other book/tax temporary differences are attributable to the realization for tax purposes of unrealized gains (losses) on certain foreign currency contracts and book/tax differences in the timing of the deductibility of various expenses. |
| (b) | The difference between book-basis and tax-basis unrealized appreciation (depreciation) is attributable to the tax deferral of losses on wash sales and the realization for tax purposes of unrealized gains on investments in passive foreign investment companies. |
9. Recent accounting pronouncements
The Fund has adopted the disclosure provisions of the Financial Accounting Standards Board Accounting Standards Update No. 2018-13,Fair Value Measurement (Topic 820)—Disclosure Framework— Changes to the Disclosure Requirements for Fair Value Measurement (“ASU 2018-13”) which introduces new fair value disclosure requirements as well as eliminates and modifies certain existing fair value disclosure requirements. ASU 2018-13 would be effective for fiscal years beginning after December 15, 2019, and interim periods within those fiscal years; however, management has elected to early adopt ASU 2018-13. The impact of the Fund’s adoption was limited to changes in the Fund’s financial statement disclosures regarding fair value, primarily those disclosures related to transfers between levels of the fair value hierarchy.
In August 2018, the Securities and Exchange Commission released its Final Rule on Disclosure Update and Simplification (the “Final Rule”) which is intended to simplify an issuer’s disclosure compliance efforts by removing redundant or outdated disclosure requirements without significantly altering the mix of information provided to investors. Effective with the current reporting period, the Fund adopted the Final Rule with the most notable impacts
| | |
| QS Global Market Neutral Fund 2019 Annual Report | | 57 |
Notes to financial statements (cont’d)
being that the Fund is no longer required to present the components of distributable earnings on the Statement of Assets and Liabilities or the sources of distributions to shareholders and the amount of undistributed net investment income on the Statements of Changes in Net Assets. The tax components of distributable earnings and distributions to shareholders continue to be disclosed within the Notes to Financial Statements.
| | |
| 58 | | QS Global Market Neutral Fund 2019 Annual Report |
Report of independent registered public accounting firm
To the Board of Trustees of Legg Mason Global Asset Management Trust and Shareholders of QS Global Market Neutral Fund
Opinion on the Financial Statements
We have audited the accompanying statement of assets and liabilities, including the schedule of investments, of QS Global Market Neutral Fund (one of the funds constituting Legg Mason Global Asset Management Trust, referred to hereafter as the “Fund”) as of September 30, 2019, the related statement of operations for the year ended September 30, 2019, the statement of changes in net assets for each of the two years in the period ended September 30, 2019, including the related notes, and the financial highlights for each of the periods indicated therein (collectively referred to as the “financial statements”). In our opinion, the financial statements present fairly, in all material respects, the financial position of the Fund as of September 30, 2019, the results of its operations for the year then ended, the changes in its net assets for each of the two years in the period ended September 30, 2019 and the financial highlights for each of the periods indicated therein in conformity with accounting principles generally accepted in the United States of America.
Basis for Opinion
These financial statements are the responsibility of the Fund’s management. Our responsibility is to express an opinion on the Fund’s financial statements based on our audits. We are a public accounting firm registered with the Public Company Accounting Oversight Board (United States) (PCAOB) and are required to be independent with respect to the Fund in accordance with the U.S. federal securities laws and the applicable rules and regulations of the Securities and Exchange Commission and the PCAOB.
We conducted our audits of these financial statements in accordance with the standards of the PCAOB. Those standards require that we plan and perform the audit to obtain reasonable assurance about whether the financial statements are free of material misstatement, whether due to error or fraud.
Our audits included performing procedures to assess the risks of material misstatement of the financial statements, whether due to error or fraud, and performing procedures that respond to those risks. Such procedures included examining, on a test basis, evidence regarding the amounts and disclosures in the financial statements. Our audits also included evaluating the accounting principles used and significant estimates made by management, as well as evaluating the overall presentation of the financial statements. Our procedures included confirmation of securities owned as of September 30, 2019 by correspondence with the custodian and brokers; when replies were not received from brokers, we performed other auditing procedures. We believe that our audits provide a reasonable basis for our opinion.
/s/PricewaterhouseCoopersLLP
Baltimore, Maryland
November 18, 2019
We have served as the auditor of one or more investment companies in Legg Mason investment company group since at least 1973. We have not been able to determine the specific year we began serving as auditor.
| | |
| QS Global Market Neutral Fund 2019 Annual Report | | 59 |
Additional information(unaudited)
Information about Trustees and Officers
The business and affairs of QS Global Market Neutral Fund (the “Fund”) are conducted by management under the supervision and subject to the direction of its Board of Trustees. The business address of each Trustee is c/o Jane Trust, Legg Mason, 100 International Drive, 11th Floor, Baltimore, Maryland 21202. Information pertaining to the Trustees and officers of the Fund is set forth below.
The Statement of Additional Information includes additional information about Trustees and is available, without charge, upon request by calling the Fund at 1-877-721-1926.
| | |
| Independent Trustees† |
| |
| Ruby P. Hearn | | |
| |
| Year of birth | | 1940 |
| Position(s) with Trust | | Trustee |
| Term of office1and length of time served2 | | Since 2004 |
| Principal occupation(s) during the past five years | | Senior Vice President Emerita of The Robert Wood Johnson Foundation (non-profit) (since 2001); Member of the Institute of Medicine (since 1982); formerly, Trustee of the New York Academy of Medicine (2004 to 2012); Director of the Institute for Healthcare Improvement (2002 to 2012); Senior Vice President of The Robert Wood Johnson Foundation (1996 to 2001); Fellow of The Yale Corporation (1992 to 1998) |
| Number of funds in fund complex overseen by Trustee | | 20 |
| Other board memberships held by Trustee during the past five years | | None |
|
| Arnold L. Lehman |
| |
| Year of birth | | 1944 |
| Position(s) with Trust | | Trustee and Chairman |
| Term of office1and length of time served2 | | Since 1982 and since 2015 |
| Principal occupation(s) during the past five years | | Senior Advisor, Phillips (auction house) (since 2015); formerly, Fellow, Ford Foundation (2015 to 2016); Director of the Brooklyn Museum (1997 to 2015) |
| Number of funds in fund complex overseen by Trustee | | 20 |
| Other board memberships held by Trustee during the past five years | | Trustee of American Federation of Arts (since 2002) |
|
| Robin J.W. Masters |
| |
| Year of birth | | 1955 |
| Position(s) with Trust | | Trustee |
| Term of office1and length of time served2 | | Since 2002 |
| Principal occupation(s) during the past five years | | Retired; formerly, Chief Investment Officer of ACE Limited (insurance) (1986 to 2000) |
| Number of funds in fund complex overseen by Trustee | | 20 |
| Other board memberships held by Trustee during the past five years | | Director of Cheyne Capital International Limited (investment advisory firm) (since 2005); formerly, Director/Trustee of Legg Mason Institutional Funds plc, Western Asset Fixed Income Funds plc and Western Asset Debt Securities Fund plc. (2007 to 2011) |
| | |
| 60 | | QS Global Market Neutral Fund 2019 Annual Report |
| | |
| Independent Trustees†(cont’d) |
|
| Jill E. McGovern |
| |
| Year of birth | | 1944 |
| Position(s) with Trust | | Trustee |
| Term of office1and length of time served2 | | Since 1989 |
| Principal occupation(s) during the past five years | | Senior Consultant, American Institute for Contemporary German Studies (AICGS) (since 2007); formerly, Chief Executive Officer of The Marrow Foundation (non-profit) (1993 to 2007); Executive Director of the Baltimore International Festival (1991 to 1993); Senior Assistant to the President of The Johns Hopkins University (1986 to 1990) |
| Number of funds in fund complex overseen by Trustee | | 20 |
| Other board memberships held by Trustee during the past five years | | Director of International Biomedical Research Alliance (2002 to 2010); Director of Lois Roth Endowment (2005 to 2012) |
|
| Arthur S. Mehlman |
| |
| Year of birth | | 1942 |
| Position(s) with Trust | | Trustee |
| Term of office1and length of time served2 | | Since 2002 |
| Principal occupation(s) during the past five years | | Retired. Director, The University of Maryland Foundation (since 1992); formerly, Director, The League for People with Disabilities (2003 to 2017); Director, Municipal Mortgage & Equity LLC (2004 to 2011); Partner, KPMG LLP (international accounting firm) (1972 to 2002) |
| Number of funds in fund complex overseen by Trustee | | Trustee of all Legg Mason Funds consisting of 20 portfolios; Director/Trustee of the Royce Family of Funds consisting of 22 portfolios |
| Other board memberships held by Trustee during the past five years | | Director of Municipal Mortgage & Equity, LLC. (2004 to 2011) |
|
| G. Peter O’Brien |
| |
| Year of birth | | 1945 |
| Position(s) with Trust | | Trustee |
| Term of office1and length of time served2 | | Since 1999 |
| Principal occupation(s) during the past five years | | Retired. Trustee Emeritus of Colgate University (since 2005); Board Member, Hill House, Inc. (residential home care) (since 1999); formerly, Board Member, Bridges School (pre-school) (2006 to 2017); Managing Director, Equity Capital Markets Group of Merrill Lynch & Co. (1971 to 1999) |
| Number of funds in fund complex overseen by Trustee | | Trustee of all Legg Mason funds consisting of 20 portfolios; Director/Trustee of the Royce Family of Funds consisting of 22 portfolios |
| Other board memberships held by Trustee during the past five years | | Director of TICC Capital Corp. (2003 to 2017) |
| | |
| QS Global Market Neutral Fund 2019 Annual Report | | 61 |
Additional information(unaudited) (cont’d)
Information about Trustees and Officers
| | |
| Independent Trustees†(cont’d) |
|
| S. Ford Rowan |
| |
| Year of birth | | 1943 |
| Position(s) with Trust | | Trustee |
| Term of office1and length of time served2 | | Since 2002 |
| Principal occupation(s) during the past five years | | Consultant to University of Maryland University College (since 2013); formerly, Chairman, National Center for Critical Incident Analysis (2004 to 2018); Lecturer in Organizational Sciences, George Washington University (2000 to 2014); Trustee, St. John’s College (2006 to 2012); Consultant, Rowan & Blewitt Inc. (management consulting) (1984 to 2007); Lecturer in Journalism, Northwestern University (1980 to 1993); Director, Santa Fe Institute (1999 to 2008) |
| Number of funds in fund complex overseen by Trustee | | 20 |
| Other board memberships held by Trustee during the past five years | | None |
|
| Robert M. Tarola |
| |
| Year of birth | | 1950 |
| Position(s) with Trust | | Trustee |
| Term of office1and length of time served2 | | Since 2004 |
| Principal occupation(s) during the past five years | | President of Rights Advisory LLC (corporate finance and governance consulting) (since 2008); Member, Investor Advisory Group of the Public Company Accounting Oversight Board (since 2009); formerly, Chief Financial Officer, Little Company of Mary Hospital and Health Care Centers (healthcare provider network) (2018); Executive Vice President and Chief Financial Officer, Southcoast Health System, Inc. (healthcare provider network) (2015 to 2017); Senior Vice President and Chief Financial Officer of The Howard University (higher education and health care) (2009 to 2013); Senior Vice President and Chief Financial Officer of W.R. Grace & Co. (specialty chemicals) (1999 to 2008) and MedStar Health, Inc. (healthcare) (1996 to 1999); Partner, PriceWaterhouse, LLP (accounting and auditing) (1984 to 1996) |
| Number of funds in fund complex overseen by Trustee | | 20 |
| Other board memberships held by Trustee during the past five years | | Director of American Kidney Fund (renal disease assistance) (since 2008); Director and Board Chair of XBRL International, Inc. (global data standard setting) (since 2015); Director of Vista Outdoor, Inc. (consumer recreation products) (since 2015); formerly, Director of TeleTech Holdings, Inc. (business processing outsourcing) (since 2008) |
| | |
| 62 | | QS Global Market Neutral Fund 2019 Annual Report |
| | |
| Interested Trustee and Officer |
|
| Jane Trust, CFA3 |
| |
| Year of birth | | 1962 |
| Position(s) with Trust | | Trustee, President and Chief Executive Officer |
| Term of office1and length of time served2 | | Since 2015 |
| Principal occupation(s) during the past five years | | Senior Managing Director of Legg Mason & Co., LLC (“Legg Mason & Co.”) (since 2018); Managing Director of Legg Mason & Co. (2016 to 2018); Officer and/or Trustee/Director of 142 funds associated with Legg Mason Partners Fund Advisor, LLC (“LMPFA”) or its affiliates (since 2015); President and Chief Executive Officer of LMPFA (since 2015); formerly, Senior Vice President of LMPFA (2015); Director of ClearBridge, LLC (formerly, Legg Mason Capital Management, LLC) (2007 to 2014); Managing Director of Legg Mason Investment Counsel & Trust Co. (2000 to 2007) |
| Number of funds in fund complex overseen by Trustee | | 133 |
| Other board memberships held by Trustee during the past five years | | None |
| | |
| Additional Officers |
|
Christopher Berarducci*
Legg Mason 620 Eighth Avenue, 49th Floor, New York, NY 10018 |
| |
| Year of birth | | 1974 |
| Position(s) with Trust | | Treasurer and Principal Financial Officer |
| Term of office1and length of time served2 | | Since 2010 and 2019 |
| Principal occupation(s) during the past five years | | Treasurer (since 2010) and Principal Financial Officer (since 2019) of certain mutual funds associated with Legg Mason & Co. or its affiliates; Director of Legg Mason & Co. (since 2015); formerly, Vice President of Legg Mason & Co. (2011 to 2015); Assistant Controller of certain mutual funds associated with Legg Mason & Co. or its affiliates (prior to 2010) |
|
Robert I. Frenkel
Legg Mason 100 First Stamford Place, 6th Floor, Stamford, CT 06902 |
| |
| Year of birth | | 1954 |
| Position(s) with Trust | | Secretary and Chief Legal Officer |
| Term of office1and length of time served2 | | Since 2007 |
| Principal occupation(s) during the past five years | | Vice President and Deputy General Counsel of Legg Mason, Inc. (since 2006); Managing Director and General Counsel — U.S. Mutual Funds for Legg Mason & Co. (since 2006) and Legg Mason & Co. predecessors (since 1994); Secretary and Chief Legal Officer of certain mutual funds associated with Legg Mason & Co. or its affiliates (since 2006) and Legg Mason & Co. predecessors (prior to 2006) |
| | |
| QS Global Market Neutral Fund 2019 Annual Report | | 63 |
Additional information(unaudited) (cont’d)
Information about Trustees and Officers
| | |
| Additional Officers (cont’d) |
|
Thomas C. Mandia
Legg Mason 100 First Stamford Place, 6th Floor, Stamford, CT 06902 |
| |
| Year of birth | | 1962 |
| Position(s) with Trust | | Assistant Secretary |
| Term of office1and length of time served2 | | Since 2007 |
| Principal occupation(s) during the past five years | | Managing Director and Deputy General Counsel of Legg Mason & Co. (since 2005) and Legg Mason & Co. predecessors (prior to 2005); Secretary of LMPFA (since 2006); Assistant Secretary of certain mutual funds associated with Legg Mason & Co. or its affiliates (since 2006) and Legg Mason & Co. predecessors (prior to 2006); Secretary of LM Asset Services, LLC (“LMAS”) (since 2002) and Legg Mason Fund Asset Management, Inc. (“LMFAM”) (since 2013) (formerly registered investment advisers) |
|
Ted P. Becker
Legg Mason 620 Eighth Avenue, 49th Floor, New York, NY 10018 |
| |
| Year of birth | | 1951 |
| Position(s) with Trust | | Chief Compliance Officer |
| Term of office1and length of time served2 | | Since 2007 |
| Principal occupation(s) during the past five years | | Director of Global Compliance at Legg Mason (since 2006); Chief Compliance Officer of LMPFA (since 2006); Managing Director of Compliance of Legg Mason & Co. (since 2005); Chief Compliance Officer of certain mutual funds associated with Legg Mason & Co. or its affiliates (since 2006) |
|
Susan Kerr
Legg Mason 620 Eighth Avenue, 49th Floor, New York, NY 10018 |
| |
| Year of birth | | 1949 |
| Position(s) with Trust | | Chief Anti-Money Laundering Compliance Officer |
| Term of office1and length of time served2 | | Since 2013 |
| Principal occupation(s) during the past five years | | Assistant Vice President of Legg Mason & Co. and Legg Mason Investor Services, LLC (“LMIS”) (since 2010); Chief Anti-Money Laundering Compliance Officer of certain mutual funds associated with Legg Mason & Co. or its affiliates (since 2013) and Anti-Money Laundering Compliance Officer of LMIS (since 2012); Senior Compliance Officer of LMIS (since 2011); formerly, AML Consultant, DTCC (2010); AML Consultant, Rabobank Netherlands, (2009); First Vice President, Director of Marketing & Advertising Compliance and Manager of Communications Review Group at Citigroup Inc. (1996 to 2008) |
| | |
| 64 | | QS Global Market Neutral Fund 2019 Annual Report |
| | |
| Additional Officers (cont’d) |
|
Jenna Bailey
Legg Mason 100 First Stamford Place, 5th Floor, Stamford, CT 06902 |
| |
| Year of birth | | 1978 |
| Position(s) with Trust | | Identity Theft Prevention Officer |
| Term of office1and length of time served2 | | Since 2015 |
| Principal occupation(s) during the past five years | | Identity Theft Prevention Officer of certain mutual funds associated with Legg Mason & Co. or its affiliates (since 2015); Compliance Officer of Legg Mason & Co. (since 2013); Assistant Vice President of Legg Mason & Co. (since 2011); formerly, Associate Compliance Officer of Legg Mason & Co. (2011 to 2013) |
|
Jeanne M. Kelly
Legg Mason 620 Eighth Avenue, 49th Floor, New York, NY 10018 |
| |
| Year of birth | | 1951 |
| Position(s) with Trust | | Senior Vice President |
| Term of office1and length of time served2 | | Since 2007 |
| Principal occupation(s) during the past five years | | Senior Vice President of certain mutual funds associated with Legg Mason & Co. or its affiliates (since 2007); Senior Vice President of LMPFA (since 2006); President and Chief Executive Officer of LMAS and LMFAM (since 2015); Managing Director of Legg Mason & Co. (since 2005) and Legg Mason & Co. predecessors (prior to 2005); formerly, Senior Vice President of LMFAM (2013 to 2015) |
| † | Trustees who are not “interested persons” of the Fund within the meaning of Section 2(a)(19) of the Investment Company Act of 1940, as amended (the “1940 Act”). Each of the Independent Trustees serves on the standing committees of the Board of Trustees, which include the Audit Committee (chair: Arthur S. Mehlman), the Nominating Committee (co-chairs: G. Peter O’Brien and Jill E. McGovern), and the Independent Trustees Committee (chair: Arnold L. Lehman). |
| * | Effective September 27, 2019, Mr. Berarducci became Treasurer and Principal Financial Officer. |
| 1 | Each Trustee and officer serves until his or her respective successor has been duly elected and qualified or until his or her earlier death, resignation, retirement or removal. |
| 2 | Indicates the earliest year in which the Trustee became a board member for a fund in the Legg Mason fund complex or the officer took such office. |
| 3 | Ms. Trust is an “interested person” of the Fund, as defined in the 1940 Act, because of her position with LMPFA and/or certain of its affiliates. |
| | |
| QS Global Market Neutral Fund 2019 Annual Report | | 65 |
Important tax information(unaudited)
The following information is provided with respect to the distributions paid during the taxable year ended September 30, 2019:
| | | | |
| Record Date: | | | 12/18/2018 | |
| Payable Date: | | | 12/19/2018 | |
| Ordinary Income: | | | | |
Qualified Dividend Income for Individuals | | | 67.12 | % |
Dividends Qualifying for the Dividends | | | | |
Received Deduction for Corporation: | | | 11.23 | % |
Please retain this information for your records.
| | |
| 66 | | QS Global Market Neutral Fund 2019 Annual Report |
QS
Global Market Neutral Fund
Trustees
Ruby P. Hearn
Arnold L. Lehman
Chairman
Robin J.W. Masters
Jill E. McGovern
Arthur S. Mehlman
G. Peter O’Brien
S. Ford Rowan
Robert M. Tarola
Jane Trust
Investment manager
Legg Mason Partners Fund Advisor, LLC
Subadviser
QS Investors, LLC
Distributor
Legg Mason Investor Services, LLC
Custodian
The Bank of New York Mellon
Transfer agent
BNY Mellon Investment Servicing (US) Inc.
4400 Computer Drive
Westborough, MA 01581
Independent registered public accounting firm
PricewaterhouseCoopers LLP
Baltimore, MD
QS Global Market Neutral Fund
The Fund is a separate investment series of Legg Mason Global Asset Management Trust, a Maryland statutory trust.
QS Global Market Neutral Fund
Legg Mason Funds
620 Eighth Avenue, 49th Floor
New York, NY 10018
The Fund files its complete schedule of portfolio holdings with the Securities and Exchange Commission (“SEC”) for the first and third quarters of each fiscal year as an exhibit to its reports on Form N-PORT. Previously, the Fund filed a complete schedule of portfolio holdings with the SEC for the first and third quarters of each fiscal year on Form N-Q. The Fund’s Forms N-PORT and N-Q are available on the SEC’s website at www.sec.gov. To obtain information on Forms N-PORT and N-Q, shareholders can call the Fund at 1-877-721-1926.
.
Information on how the Fund voted proxies relating to portfolio securities during the prior 12-month period ended June 30th of each year and a description of the policies and procedures that the Fund uses to determine how to vote proxies related to portfolio transactions are available (1) without charge, upon request, by calling the Fund at 1-877-721-1926, (2) at www.leggmason.com/mutualfunds and (3) on the SEC’s website at www.sec.gov
This report is submitted for the general information of the shareholders of QS Global Market Neutral Fund. This report is not authorized for distribution to prospective investors in the Fund unless preceded or accompanied by a current prospectus.
Investors should consider the Fund’s investment objectives, risks, charges and expenses carefully before investing. The prospectus contains this and other important information about the Fund. Please read the prospectus carefully before investing.
www.leggmason.com
©2019 Legg Mason Investor Services, LLC
Member FINRA, SIPC
Legg Mason Funds Privacy and Security Notice
Your Privacy and the Security of Your Personal Information is Very Important to the Legg Mason Funds
This Privacy and Security Notice (the “Privacy Notice”) addresses the Legg Mason Funds’ privacy and data protection practices with respect to nonpublic personal information the Funds receive. The Legg Mason Funds include any funds sold by the Funds’ distributor, Legg Mason Investor Services, LLC, as well as Legg Mason-sponsored closed-end funds. The provisions of this Privacy Notice apply to your information both while you are a shareholder and after you are no longer invested with the Funds.
The Type of Nonpublic Personal Information the Funds Collect About You
The Funds collect and maintain nonpublic personal information about you in connection with your shareholder account. Such information may include, but is not limited to:
| • | | Personal information included on applications or other forms; |
| • | | Account balances, transactions, and mutual fund holdings and positions; |
| • | | Bank account information, legal documents, and identity verification documentation; |
| • | | Online account access user IDs, passwords, security challenge question responses; and |
| • | | Information received from consumer reporting agencies regarding credit history and creditworthiness (such as the amount of an individual’s total debt, payment history, etc.). |
How the Funds Use Nonpublic Personal Information About You
The Funds do not sell or share your nonpublic personal information with third parties or with affiliates for their marketing purposes, or with other financial institutions or affiliates for joint marketing purposes, unless you have authorized the Funds to do so. The Funds do not disclose any nonpublic personal information about you except as may be required to perform transactions or services you have authorized or as permitted or required by law. The Funds may disclose information about you to:
| • | | Employees, agents, and affiliates on a “need to know” basis to enable the Funds to conduct ordinary business or to comply with obligations to government regulators; |
| • | | Service providers, including the Funds’ affiliates, who assist the Funds as part of the ordinary course of business (such as printing, mailing services, or processing or servicing your account with us) or otherwise perform services on the Funds’ behalf, including companies that may perform statistical analysis, market research and marketing services solely for the Funds; |
| • | | Permit access to transfer, whether in the United States or countries outside of the United States to such Funds’ employees, agents and affiliates and service providers as required to enable the Funds to conduct ordinary business, or to comply with obligations to government regulators; |
| • | | The Funds’ representatives such as legal counsel, accountants and auditors to enable the Funds to conduct ordinary business, or to comply with obligations to government regulators; |
| • | | Fiduciaries or representatives acting on your behalf, such as an IRA custodian or trustee of a grantor trust. |
|
| NOT PART OF THE ANNUAL REPORT |
Legg Mason Funds Privacy and Security Notice (cont’d)
Except as otherwise permitted by applicable law, companies acting on the Funds’ behalf, including those outside the United States, are contractually obligated to keep nonpublic personal information the Funds provide to them confidential and to use the information the Funds share only to provide the services the Funds ask them to perform.
The Funds may disclose nonpublic personal information about you when necessary to enforce their rights or protect against fraud, or as permitted or required by applicable law, such as in connection with a law enforcement or regulatory request, subpoena, or similar legal process. In the event of a corporate action or in the event a Fund service provider changes, the Funds may be required to disclose your nonpublic personal information to third parties. While it is the Funds’ practice to obtain protections for disclosed information in these types of transactions, the Funds cannot guarantee their privacy policy will remain unchanged.
Keeping You Informed of the Funds’ Privacy and Security Practices
The Funds will notify you annually of their privacy policy as required by federal law. While the Funds reserve the right to modify this policy at any time they will notify you promptly if this privacy policy changes.
The Funds’ Security Practices
The Funds maintain appropriate physical, electronic and procedural safeguards designed to guard your nonpublic personal information. The Funds’ internal data security policies restrict access to your nonpublic personal information to authorized employees, who may use your nonpublic personal information for Fund business purposes only.
Although the Funds strive to protect your nonpublic personal information, they cannot ensure or warrant the security of any information you provide or transmit to them, and you do so at your own risk. In the event of a breach of the confidentiality or security of your nonpublic personal information, the Funds will attempt to notify you as necessary so you can take appropriate protective steps. If you have consented to the Funds using electronic communications or electronic delivery of statements, they may notify you under such circumstances using the most current email address you have on record with them.
In order for the Funds to provide effective service to you, keeping your account information accurate is very important. If you believe that your account information is incomplete, not accurate or not current, if you have questions about the Funds’ privacy practices, or our use of your nonpublic personal information, write the Funds using the contact information on your account statements, email the Funds by clicking on the Contact Us section of the Funds’ website at www.leggmason.com, or contact the Funds at 1-877-721-1926.
Revised April 2018
|
| NOT PART OF THE ANNUAL REPORT |
www.leggmason.com
©2019 Legg Mason Investor Services, LLC Member FINRA, SIPC
QSIN316994 11/19 SR19-3742
The registrant has adopted a code of ethics that applies to the registrant’s principal executive officer, principal financial officer, principal accounting officer or controller.
| ITEM 3. | AUDIT COMMITTEE FINANCIAL EXPERT. |
The Board of Trustees of the registrant has determined that Arthur S. Mehlman the Chairman of the Board’s Audit Committee and Robert M. Tarola, possess the technical attributes identified in Instruction 2(b) of Item 3 to FormN-CSR to qualify as “audit committee financial experts,” and have designated Mr. Mehlman and Mr. Tarola as the Audit Committee’s financial experts. Mr. Mehlman and Mr. Tarola are “independent” Trustees pursuant to paragraph (a) (2) of Item 3 to FormN-CSR.
| ITEM 4. | PRINCIPAL ACCOUNTANT FEES AND SERVICES. |
a)Audit Fees. The aggregate fees billed in the last two fiscal years ending September 30, 2018 and September 30, 2019 (the “Reporting Periods”) for professional services rendered by the Registrant’s principal accountant (the “Auditor”) for the audit of the Registrant’s annual financial statements, or services that are normally provided by the Auditor in connection with the statutory and regulatory filings or engagements for the Reporting Periods, were $306,746 in September 30, 2018 and $336,010 in September 30, 2019.
b)Audit-Related Fees. The aggregate fees billed in the Reporting Period for assurance and related services by the Auditor that are reasonably related to the performance of the Registrant’s financial statements were $0 in September 30, 2018 and $3,000 in September 30, 2019.
In addition, there were no Audit-Related Fees billed in the Reporting Period for assurance and related services by the Auditor to the Registrant’s investment adviser (not including anysub-adviser whose role is primarily portfolio management and is subcontracted with or overseen by another investment adviser), and any entity controlling, controlled by or under common control with the investment adviser that provides ongoing services to the Legg Mason Global Asset Management Trust (“service affiliates”), that were reasonably related to the performance of the annual audit of the service affiliates. Accordingly, there were no such fees that requiredpre-approval by the Audit Committee for the Reporting Period.
(c)Tax Fees. The aggregate fees billed in the Reporting Periods for professional services rendered by the Auditor for tax compliance, tax advice and tax planning (“Tax Services”) were $45,424 in September 30, 2018 and $0 in September 30, 2019. These services consisted of (i) review or preparation of U.S. federal, state, local and excise tax returns; (ii) U.S. federal, state and local tax planning, advice and assistance regarding statutory, regulatory or administrative developments, and (iii) tax advice regarding tax qualification matters and/or treatment of various financial instruments held or proposed to be acquired or held.
There were no fees billed for tax services by to the service affiliates during the Reporting Periods that requiredpre-approval by the Audit Auditors Committee.
d)All Other Fees. The aggregate fees for other fees billed in the Reporting Periods for products and services provided by the Auditor were $0 in September 30, 2018 and $0 in September 30, 2019, other than the services reported in paragraphs (a) through (c) of this item for the Legg Mason Global Asset Management Trust.
All Other Fees. There were no othernon-audit services rendered by the Auditor to Legg Mason Partners Fund Advisors, LLC (“LMPFA”), and any entity controlling, controlled by or under common control with LMPFA that provided ongoing services to Legg Mason Global Asset Management Trust requiringpre-approval by the Audit Committee in the Reporting Period.
(e) Audit Committee’s pre–approval policies and procedures described in paragraph (c)
(7) of Rule2-01 of RegulationS-X.
(1) The Charter for the Audit Committee (the “Committee”) of the Board of each registered investment company (the “Fund”) advised by LMPFA or one of their affiliates (each, an “Adviser”) requires that the Committee shall approve (a) all audit and permissiblenon-audit services to be provided to the Fund and (b) all permissiblenon-audit services to be provided by the Fund’s independent auditors to the Adviser and any Covered Service Providers if the engagement relates directly to the operations and financial reporting of the Fund. The Committee may implement policies and procedures by which such services are approved other than by the full Committee.
The Committee shall not approvenon-audit services that the Committee believes may impair the independence of the auditors. As of the date of the approval of this Audit Committee Charter, permissiblenon-audit services include any professional services (including tax services), that are not prohibited services as described below, provided to the Fund by the independent auditors, other than those provided to the Fund in connection with an audit or a review of the financial statements of the Fund. Permissiblenon-audit services may not include: (i) bookkeeping or other services related to the accounting records or financial statements of the Fund; (ii) financial information systems design and implementation; (iii) appraisal or valuation services, fairness opinions orcontribution-in-kind reports; (iv) actuarial services; (v) internal audit outsourcing services; (vi) management functions or human resources; (vii) broker or dealer, investment adviser or investment banking services; (viii) legal services and expert services unrelated to the audit; and (ix) any other service the Public Company Accounting Oversight Board determines, by regulation, is impermissible.
Pre-approval by the Committee of any permissiblenon-audit services is not required so long as: (i) the aggregate amount of all such permissiblenon-audit services provided to the Fund, the Adviser and any service providers controlling, controlled by or under common control with the Adviser that provide ongoing services to the Fund (“Covered Service Providers”) constitutes not more than 5% of the total amount of revenues paid to the independent auditors during the fiscal year in which the permissiblenon-audit services are provided to (a) the Fund, (b) the Adviser and (c) any entity controlling, controlled by or under common control with the Adviser that provides ongoing services to the Fund during the fiscal year in which the services are provided that would have to be approved by the Committee; (ii) the permissiblenon-audit services were not recognized by the Fund at the time of the engagement to benon-audit services; and (iii) such services are promptly brought to the attention of the Committee and approved by the Committee (or its delegate(s)) prior to the completion of the audit.
(2) For the Legg Mason Global Asset Management Trust, the percentage of fees that were approved by the audit committee, with respect to: Audit-Related Fees were 100% and 100% for September 30, 2018 and September 30, 2019; Tax Fees were 100% and 100% for September 30, 2018 and September 30, 2019; and Other Fees were 100% and 100% for September 30, 2018 and September 30, 2019.
(f) N/A
(g)Non-audit fees billed by the Auditor for services rendered to Legg Mason Global Asset Management Trust, LMPFA and any entity controlling, controlled by, or under common control with LMPFA that provides ongoing services to Legg Mason Global Asset Management Trust during the reporting period were $477,227 in September 30, 2018 and $386,151 in September 30, 2019.
(h) Yes. Legg Mason Global Asset Management Trust’s Audit Committee has considered whether the provision ofnon-audit services that were rendered to Service Affiliates, which were notpre-approved (not requiringpre-approval), is compatible with maintaining the Accountant’s independence. All services provided by the Auditor to the Legg Mason Global Asset Management Trust or to Service Affiliates, which were required to bepre-approved, werepre-approved as required.
| ITEM 5. | AUDIT COMMITTEE OF LISTED REGISTRANTS. |
| | a) | The independent board members are acting as the registrant’s audit committee as specified in Section 3(a)(58)(B) of the Exchange Act. The Audit Committee consists of the following Board members: |
Ruby P. Hearn
Arnold L. Lehman
Robin J.W. Masters
Jill E. McGovern
Arthur S. Mehlman
G. Peter O’Brien
S. Ford Rowan
Robert M. Tarola
| ITEM 6. | SCHEDULE OF INVESTMENTS. |
Included herein under Item 1.
| ITEM 7. | DISCLOSURE OF PROXY VOTING POLICIES AND PROCEDURES FORCLOSED-END MANAGEMENT INVESTMENT COMPANIES. |
Not applicable.
| ITEM 8. | PORTFOLIO MANAGERS OFCLOSED-END MANAGEMENT INVESTMENT COMPANIES. |
Not applicable.
| ITEM 9. | PURCHASES OF EQUITY SECURITIES BYCLOSED-END MANAGEMENT INVESTMENT COMPANY AND AFFILIATED PURCHASERS. |
Not applicable.
| ITEM 10. | SUBMISSION OF MATTERS TO A VOTE OF SECURITY HOLDERS. |
Not applicable.
| ITEM 11. | CONTROLS AND PROCEDURES. |
| | (a) | The registrant’s principal executive officer and principal financial officer have concluded that the registrant’s disclosure controls and procedures (as defined in Rule30a- 3(c) under the Investment Company Act of 1940, as amended (the “1940 Act”)) are effective as of a date within 90 days of the filing date of this report that includes the disclosure required by this paragraph, based on their evaluation of the disclosure controls and procedures required by Rule30a-3(b) under the 1940 Act and15d-15(b) under the Securities Exchange Act of 1934. |
| | (b) | There were no changes in the registrant’s internal control over financial reporting (as defined in Rule30a-3(d) under the 1940 Act) that occurred during the second fiscal quarter of the period covered by this report that have materially affected, or are likely to materially affect the registrant’s internal control over financial reporting. |
| ITEM 12. | DISCLOSURE OF SECURITIES LENDING ACTIVITIES FORCLOSED-END MANAGEMENT INVESTMENT COMPANIES. |
Not applicable.
(a) (1) Code of Ethics attached hereto.
Exhibit 99.CODE ETH
(a) (2) Certifications pursuant to section 302 of the Sarbanes-Oxley Act of 2002 attached hereto.
Exhibit 99.CERT
(b) Certifications pursuant to Section 906 of the Sarbanes-Oxley Act of 2002 attached hereto.
Exhibit 99.906CERT
SIGNATURES
Pursuant to the requirements of the Securities Exchange Act of 1934 and the Investment Company Act of 1940, the registrant has duly caused this Report to be signed on its behalf by the undersigned, there unto duly authorized.
Legg Mason Global Asset Management Trust
| | |
| By: | | /s/ Jane Trust |
| | Jane Trust |
| | Chief Executive Officer |
| |
| Date: | | November 21, 2019 |
Pursuant to the requirements of the Securities Exchange Act of 1934 and the Investment Company Act of 1940, this report has been signed below by the following persons on behalf of the registrant and in the capacities and on the dates indicated.
| | |
| By: | | /s/ Jane Trust |
| | Jane Trust |
| | Chief Executive Officer |
| |
| Date: | | November 21, 2019 |
| | |
| By: | | /s/ Christopher Berarducci |
| | Christopher Berarducci |
| | Principal Financial Officer |
| |
| Date: | | November 21, 2019 |