UNITED STATES
SECURITIES AND EXCHANGE COMMISSION
Washington, D.C. 20549
FORMN-CSR
CERTIFIED SHAREHOLDER REPORT OF REGISTERED
MANAGEMENT INVESTMENT COMPANIES
Investment Company Act file number811-22338
Legg Mason Global Asset Management Trust
(Exact name of registrant as specified in charter)
620 Eighth Avenue, 49th Floor, New York, NY 10018
(Address of principal executive offices) (Zip code)
Robert I. Frenkel, Esq.
Legg Mason & Co., LLC
100 First Stamford Place
Stamford, CT 06902
(Name and address of agent for service)
Registrant’s telephone number, including area code:1-877-721-1926
Date of fiscal year end: October 31
Date of reporting period: October 31, 2019
| ITEM 1. | REPORT TO STOCKHOLDERS |
TheAnnual Report to Stockholders is filed herewith.

| | |
| Annual Report | | October 31, 2019 |
BrandywineGLOBAL —
GLOBAL UNCONSTRAINED BOND FUND
Beginning in April 2021, as permitted by regulations adopted by the Securities and Exchange Commission, the Fund intends to no longer mail paper copies of the Fund’s shareholder reports like this one, unless you specifically request paper copies of the reports from the Fund or from your Service Agent or financial intermediary (such as a broker-dealer or bank). Instead, the reports will be made available on a website, and you will be notified by mail each time a report is posted and provided with a website link to access the report.
If you already elected to receive shareholder reports electronically(“e-delivery”), you will not be affected by this change and you need not take any action. If you have not already electede-delivery, you may elect to receive shareholder reports and other communications from the Fund electronically by contacting your Service Agent or, if you are a direct shareholder with the Fund, by calling1-877-721-1926.
You may elect to receive all future reports in paper free of charge. If you invest through a Service Agent, you can contact your Service Agent to request that you continue to receive paper copies of your shareholder reports. That election will apply to all Legg Mason Funds held in your account at that Service Agent. If you are a direct shareholder with the Fund, you can call the Fund at1-877-721-1926, or write to the Fund by regular mail at Legg Mason Funds, P.O. Box 9699, Providence, RI 02940-9699 or by express, certified or registered mail to Legg Mason Funds, 4400 Computer Drive, Westborough, MA 01581 to let the Fund know you wish to continue receiving paper copies of your shareholder reports. That election will apply to all Legg Mason Funds held in your account held directly with the fund complex.

|
| INVESTMENT PRODUCTS: NOT FDIC INSURED • NO BANK GUARANTEE • MAY LOSE VALUE |
Fund objective
The Fund seeks to generate positive returns that are independent of market cycles.
Letter from the president

Dear Shareholder,
We are pleased to provide the annual report of BrandywineGLOBAL — Global Unconstrained Bond Fund for the twelve-month reporting period ended October 31, 2019. Please read on for a detailed look at prevailing economic and market conditions during the Fund’s reporting period and to learn how those conditions have affected Fund performance.
As always, we remain committed to providing you with excellent service and a full spectrum of investment choices. We also remain committed to supplementing the support you receive from your financial advisor. One way we accomplish this is through our website, www.leggmason.com. Here you can gain immediate access to market and investment information, including:
| • | | Fund prices and performance, |
| • | | Market insights and commentaries from our portfolio managers, and |
| • | | A host of educational resources. |
We look forward to helping you meet your financial goals.
Sincerely,

Jane Trust, CFA
President and Chief Executive Officer
November 29, 2019
| | |
| II | | BrandywineGLOBAL — Global Unconstrained Bond Fund |
Fund overview
Q. What is the Fund’s investment strategy?
A.The Fund seeks to generate positive returns that are independent of market cycles. Under normal market conditions, the Fund seeks to meet its investment objective through strategic investments in domestic and foreign fixed income securities, currencies and derivatives. The Fund will initiate long and short exposures by investing across bond sectors, including sovereign debt and corporate bonds; currencies; and derivative instruments. Short exposure will be established primarily through the use of derivatives, including currency forwards, interest rate swaps and futures. The Fund is “unconstrained” in that we do not attempt to keep the portfolio structure or the Fund’s performance consistent with any designated stock, bond or market index.
The Fund normally invests at least 80% of its net assets, plus the amount of borrowings for investment purposes, if any, in fixed income securities or other instruments with similar economic characteristics. Fixed income securities in which the Fund may invest are debt securities issued or guaranteed by national governments, their agencies or instrumentalities and politicalsub-divisions (including inflation index-linked securities and municipal bonds); debt securities of supranational organizations such as bonds, debentures and freely transferable promissory notes; corporate debt securities, including debentures, bonds (including zero coupon bonds), convertible andnon-convertible notes, commercial paper, certificates of deposits, freely transferable promissory notes and bankers acceptances issued by industrial, utility, finance, commercial banking or bank holding company organizations; mortgage-backed securities (including collateralized debt obligations); asset-backed securities; emerging markets debt; and high yield debt (often called “junk bonds”).
While the Fund may invest in securities of any rating level, or unrated securities, we intend to maintain an average weighted portfolio quality ofA-or better, whether composed of rated securities or unrated securities that we deemed to be of comparable quality. The Fund will invest in both investment grade and below investment grade securities (commonly known as “junk bonds”) and currencies of developed and emerging countries.
The Fund typically has significant exposure to foreign currencies and foreign countries. As a global fund, under normal market conditions, the Fund will invest in or have exposure to at least three countries, which may include the United States. The Fund may invest a significant portion of its assets in a particular geographic region or country, including emerging market countries. Normally, the Fund will not invest more than 20% of the Fund’s assets in securities or issuers in any one foreign country, other than the United States, Canada, the United Kingdom, Japan, Australia and member countries of the European Union, or denominated in any one currency, other than the U.S. dollar, the Canadian dollar, the pound, the euro, the Australian dollar or the yen.
The Fund may invest in securities of any maturity. The weighted average effective durationi of the Fund’s portfolio, including derivatives, is expected to range from-5 to +5 years. The
| | |
| BrandywineGLOBAL — Global Unconstrained Bond Fund 2019 Annual Report | | 1 |
Fund overview (cont’d)
Fund may have a negative weighted average effective duration due to holding certain instruments that have negative effective duration, such as through the use of derivative instruments.
The Fund achieves certain investment exposures, including short positions, primarily through derivative transactions, including foreign currency forwards, bond futures, interest rate futures, swaps (including interest rate, total return and inflation swaps), credit default swaps, credit default swap index products, instruments involved in currency risk management strategies, including cross hedges, options and options on futures and warrants. The Fund may use derivatives in an effort to enhance total return, to hedge against fluctuations in securities prices, interest rates or currency exchange rates, to change the effective duration of its portfolio, to manage certain investment risks and/or as a substitute for the purchase or sale of securities or currencies. These instruments are taken into account when determining compliance with the Fund’s 80% policy. The Fund’s use of derivatives may be extensive. However, the notional principal of the Fund’s aggregate net short currency exposure will not be greater than 70% of the Fund’s total assets.
The Fund’s broad mandate gives us strategic flexibility to change allocations and shift between long and short exposures in an attempt to take advantage of evolving opportunities. In making investment decisions on behalf of the Fund, we apply atop-down, macro-driven investment process and invest where we believe opportunities exist with respect to interest rate levels and currency valuations. Long investments are typically concentrated in sovereign debt or currencies of 6 to 12 countries, or corporate debt of issuers in those countries that we believe offer the most attractive absolute return opportunities. Short positions are typically established in interest rates, bonds or currencies that we believe are overvalued, will fall in value and can potentially generate returns. We consider secular trends, political and monetary conditions and business cycle, and material and relevant environmental, social and governance (ESG) risks when making investment decisions. We also take into account the relative risk and return characteristics of prospective investments when determining how to achieve desired exposures.
Q. What were the overall market conditions during the Fund’s reporting period?
A.The global fixed income market experienced periods of volatility but generated strong results during the twelve-month reporting period ended October 31, 2019. Global yields generally declined over the period, which was supportive for fixed income assets.
The U.S. Federal Reserve Board (the “Fed”)ii raised interest rates four times in 2018,with its December 2018 increase bringing the federal funds target rate to a range between 2.00% and 2.25%. In early 2019, the Fed had a “dovish pivot” and reassessed the need for additional increases in 2019 given moderating global growth and the ongoing trade dispute between the U.S. and China. Then, as expected, the Fed lowered rates at its meetings in July, September and October 2019. The last rate cut pushed the federal funds target rate to a range between 1.50% and 1.75%. Elsewhere, central banks outside the U.S. generally pursued accommodative monetary policies. In September 2019, the European Central Bank
| | |
| 2 | | BrandywineGLOBAL — Global Unconstrained Bond Fund 2019 Annual Report |
(“ECB”)iii cut its key interest rate and launched a new package of bond purchases that laid the groundwork for continued ultra-loose monetary policy. While the Bank of Englandiv kept rates on hold, late in the period it warned that Brexit risks remained elevated. Elsewhere, both the Bank of Japanv and the People’s Bank of Chinavikept rates steady during the reporting period.
All told, the Bloomberg Barclays Global Aggregate Indexvii returned 9.54% during the twelve months ended October 31, 2019. Investors who took on additional risk also experienced positive results over the reporting period. Global high-yield corporate bonds, as measured by the Bloomberg Barclays Global High Yield Index (USD hedged)viii returned 8.54%.
Meanwhile, the JPMorgan Emerging Markets Bond Index Global (“EMBI Global”)ixgained 10.74%. Within the currency markets, the U.S. dollar generally appreciated against most other currencies. The U.S. dollar was supported by a resilient economy.
Q. How did we respond to these changing market conditions?
A.Given uncertain global macro conditions, we made several adjustments to the Fund’s portfolio during the reporting period. We marginally decreased the Fund’s durationx. Meanwhile, we covered the Fund’s U.K. gilt short position and reduced its short exposure to French government bonds, while increasing its short exposure to German bunds. We reduced the Fund’s U.S. Treasury exposure given sharply falling yields, which made them less attractively valued. Elsewhere, we eliminated the Fund’s positions in Peruvian and South African government bonds. From a currency perspective, larger allocation changes included removing the Fund’s short to the Swiss franc, increasing its Japanese yen short and reducing its allocation to the Swedish krona. In aggregate, the Fund’s U.S. dollar position ended the period slightly lower.
During the reporting period, the Fund used interest rate futures to manage its bond exposure. The use of these instruments detracted from performance. Currency forwards, which were used to manage the Fund’s currency exposures, were also a headwind for results.
Performance review
For the twelve months ended October 31, 2019, Class A shares of BrandywineGLOBAL — Global Unconstrained Bond Fund, excluding sales charges, returned 4.69%. The Fund’s unmanaged benchmark, the FTSE3-Month U.S. Treasury Bill Indexxi, returned 2.35% for the same period. The Lipper Alternative Global Macro Funds Category Averagexii returned 7.66% over the same time frame.
| | |
| BrandywineGLOBAL — Global Unconstrained Bond Fund 2019 Annual Report | | 3 |
Fund overview (cont’d)
| | | | | | | | |
Performance Snapshotas of October 31, 2019
(unaudited) | |
| (excluding sales charges) | | 6 months | | | 12 months | |
| BrandywineGLOBAL — Global Unconstrained Bond Fund: | | | | | | | | |
Class A | | | 0.96 | % | | | 4.69 | % |
Class C | | | 0.70 | % | | | 4.13 | % |
Class C11 | | | 0.79 | % | | | 4.28 | % |
Class FI | | | 1.56 | % | | | 5.31 | % |
Class R | | | 0.87 | % | | | 4.43 | % |
Class I | | | 1.12 | % | | | 5.05 | % |
Class IS | | | 1.30 | % | | | 5.26 | % |
| FTSE3-Month U.S. Treasury Bill Index | | | 1.15 | % | | | 2.35 | % |
| Lipper Alternative Global Macro Funds Category Average | | | 2.17 | % | | | 7.66 | % |
The performance shown represents past performance. Past performance is no guarantee of future results and current performance may be higher or lower than the performance shown above. Principal value, investment returns and yields will fluctuate and investors’ shares, when redeemed, may be worth more or less than their original cost. To obtain performance data current to the most recentmonth-end, please visit our website at www.leggmason.com/mutualfunds.
All share class returns assume the reinvestment of all distributions at net asset value and the deduction of all Fund expenses. Returns have not been adjusted to include sales charges that may apply or the deduction of taxes that a shareholder would pay on Fund distributions. If sales charges were reflected, the performance quoted would be lower. Performance figures for periods shorter than one year represent cumulative figures and are not annualized.
Fund performance figures reflect fee waivers and/or expense reimbursements, without which the performance would have been lower.
The30-Day SEC Yields for the period ended October 31, 2019 for Class A, Class C, Class C1, Class FI, Class R, Class I and Class IS shares were 2.30%, 1.85%, 2.03%, 5.17%, 2.11%, 2.69% and 2.80%, respectively. Absent fee waivers and/or expense reimbursements, the30-Day SEC Yield for Class R, Class I and Class IS shares would have been 2.03%, 2.58% and 2.80%, respectively. The30-Day SEC Yield, calculated pursuant to the standard SEC formula, is based on a Fund’s investments over an annualized trailing30-day period, and not on the distributions paid by the Fund, which may differ.
|
| Total Annual Operating Expenses(unaudited) |
As of the Fund’s current prospectus dated March 1, 2019, the gross total annual fund operating expense ratios for Class A, Class C, Class C1, Class FI, Class R, Class I and Class IS shares were 1.25%, 1.83%, 1.56%, 1.18%, 1.38%, 0.91% and 0.73%, respectively.
Actual expenses may be higher. For example, expenses may be higher than those shown if average net assets decrease. Net assets are more likely to decrease and Fund expense ratios are more likely to increase when markets are volatile.
| 1 | Class C1 shares are not available for purchase by new or existing investors (except for certain retirement plan programs authorized by the Fund’s distributor). Class C1 shares continue to be available for dividend reinvestment and incoming exchanges. |
| | |
| 4 | | BrandywineGLOBAL — Global Unconstrained Bond Fund 2019 Annual Report |
As a result of expense limitation arrangements, the ratio of total annual fund operating expenses, other than interest, brokerage commissions, dividend expense on short sales, taxes, extraordinary expenses and acquired fund fees and expenses, to average net assets will not exceed 1.20% for Class A shares, 1.95% for Class C shares, 1.70% for Class C1 shares, 1.20% for Class FI shares, 1.45% for Class R shares, 0.85% for Class I shares and 0.75% for Class IS shares. In addition, the ratio of total annual fund operating expenses for Class IS shares will not exceed the ratio of total annual fund operating expenses for Class I shares. These expense limitation arrangements cannot be terminated prior to December 31, 2021 without the Board of Trustees’ consent.
The manager is permitted to recapture amounts waived and/or reimbursed to a class within three years after the fiscal year in which the manager earned the fee or incurred the expense if the class’ total annual operating expenses have fallen to a level below the expense limitation (“expense cap”) in effect at the time the fees were earned or the expenses incurred. In no case will the manager recapture any amount that would result, on any particular business day of the Fund, in the class’ total annual operating expenses exceeding the expense cap or any other lower limit then in effect.
Q. What were the leading contributors to performance?
A.The largest contributor to the Fund’s performance during the reporting period was its exposure to local currency emerging market debt. In particular, Mexico and Indonesia were the best performers. Both markets have high nominal and inflation-adjusted yields which attracted capital. In addition, both countries’ central banks have been lowering rates.
The Fund’s exposure to longer-term U.S. Treasury securities was beneficial. Their yields declined — and their prices moved higher — as economic growth moderated, trade concerns continued and the Fed lowered interest rates in July, September and October 2019.
Elsewhere, the Fund’s allocation to short duration corporate debt was rewarded, as these securities offered incremental yields versus Treasuries, coupled with minimal interest rate risk.
Q. What were the leading detractors from performance?
A.The largest detractor from the Fund’s performance over the reporting period was its European exposure. Having a short position in U.K. gilts was negative for returns as ongoing uncertainties related to Brexit created volatility and pushed yields lower (and their prices higher). The Fund’s short exposures to both German and French government bonds were headwinds for returns. Slowing growth and a dovish pivot by the ECB pushed core Continental European yields deep into negative territory. As such the Fund’s short positions detracted from performance. From a currency perspective, long positions in the Swedish krona and Norwegian krone were not rewarded. Lackluster growth across Europe and ultra-accommodative monetary policies depressed assets in peripheral Europe. Against this backdrop, the Swedish krona and Norwegian krone depreciated against the U.S. dollar during the reporting period.
| | |
| BrandywineGLOBAL — Global Unconstrained Bond Fund 2019 Annual Report | | 5 |
Fund overview (cont’d)
Thank you for your investment in BrandywineGLOBAL — Global Unconstrained Bond Fund. As always, we appreciate that you have chosen us to manage your assets and we remain focused on achieving the Fund’s investment goals.
Sincerely,

David F. Hoffman, CFA
Portfolio Manager
Brandywine Global Investment Management, LLC

Stephen S. Smith
Portfolio Manager
Brandywine Global Investment Management, LLC

John P. Mclntyre, CFA
Portfolio Manager
Brandywine Global Investment Management, LLC

Anujeet Sareen, CFA
Portfolio Manager
Brandywine Global Investment Management, LLC
November18, 2019
RISKS: Fixed-income securities are subject to interest rate, credit, inflation, and reinvestment risks. As interest rates rise, the value of fixed income securities falls. High yield bonds are generally subject to greater price volatility, illiquidity, and possibility of default than investment grade bonds. International investments are subject to special risks, including currency fluctuations and social, economic and political uncertainties, which could increase volatility. These risks are magnified in emerging markets. Sovereign government and supranational debt involve many of the risks of foreign and emerging markets investments as well as the risk of debt moratorium, repudiation or renegotiation and the Fund may be unable to enforce its rights against the issuers. The Fund may be significantly overweight or underweight in certain
| | |
| 6 | | BrandywineGLOBAL — Global Unconstrained Bond Fund 2019 Annual Report |
companies, industries or market sectors, which may cause the Fund’s performance to be more sensitive to developments affecting those companies, industries or market sectors. While the portfolio managers may invest in long positions and short positions, there is the risk that the investments will not perform as expected and losses on one type of position could more than offset gains on the other, or the Fund could lose money on both positions, if the portfolio managers judge the market incorrectly. Short selling is a speculative strategy. Unlike the possible loss on a security that is purchased, there is no limit on the amount of loss on an appreciating security that is sold short. The portfolio manager does not attempt to keep the portfolio structure or the Fund’s performance consistent with any designated stock, bond or market index and during times of market rallies, the Fund may not perform as well as other Funds that seek to outperform an index. Derivatives, such as options and futures, can be illiquid, may disproportionately increase losses, and have a potentially large impact on Fund performance. Leverage may increase volatility and possibility of loss. Active management does not ensure gains or protect against market declines. As a non-diversified Fund, it is permitted to invest a higher percentage of its assets in any one issuer than a diversified fund, which may magnify the Fund’s losses from events affecting a particular issuer. Please see the Fund’s prospectus for a more complete discussion of these and other risks and the Fund’s investment strategies.
All investments are subject to risk including the possible loss of principal. Past performance is no guarantee of future results. All index performance reflects no deduction for fees, expenses or taxes. Please note that an investor cannot invest directly in an index.
The information provided is not intended to be a forecast of future events, a guarantee of future results or investment advice. Views expressed may differ from those of the firm as a whole.
| | |
| BrandywineGLOBAL — Global Unconstrained Bond Fund 2019 Annual Report | | 7 |
Fund overview (cont’d)
| i | Effective duration is a duration calculation for bonds with embedded options. Effective duration takes into account that expected cash flows will fluctuate as interest rates change. Please note, duration measures the sensitivity of price (the value of principal) of a fixed-income investment to a change in interest rates. |
| ii | The Federal Reserve Board (the “Fed”) is responsible for the formulation of U.S. policies designed to promote economic growth, full employment, stable prices and a sustainable pattern of international trade and payments. |
| iii | The European Central Bank (“ECB”) is responsible for the monetary system of the European Union and the euro currency. |
| iv | The Bank of England (“BoE”), formally the Governor and Company of the BoE, is the central bank of the United Kingdom. The BoE’s purpose is to maintain monetary and financial stability. |
| v | The Bank of Japan is the central bank of Japan. The bank is responsible for issuing and handling currency and treasury securities, implementing monetary policy, maintaining the stability of the Japanese financial system and the yen currency. |
| vi | The People’s Bank of China is the central bank of the People’s Republic of China with the power to carry out monetary policy and regulate financial institutions in mainland China. |
| vii | The Bloomberg Barclays Global Aggregate Index is an index comprised of several other Bloomberg Barclays indices that measure fixed-income performance of regions around the world. |
| viii | The Bloomberg Barclays Global High Yield Index is a multi-currency measure of the global high-yield debt market. The Index represents the union of the U.S. High-Yield,Pan-European High-Yield, U.S. Emerging Markets (EM) Hard Currency High Yield Indices. |
| ix | The JPMorgan Emerging Markets Bond Index Global (“EMBI Global”) tracks total returns for U.S. dollar-denominated debt instruments issued by emerging market sovereign and quasi-sovereign entities: Brady bonds, loans, Eurobonds and local market instruments. |
| x | Duration is the measure of the price sensitivity of a fixed-income security to an interest rate change of 100 basis points. Calculation is based on the weighted average of the present values for all cash flows. |
| xi | The FTSE3-Month U.S. Treasury Bill Index (formerly known as the Citigroup3-Month U.S. Treasury Bill Index) is an unmanaged index generally representative of the average yield of3-month U.S. Treasury bills. |
| xii | Lipper, Inc., a wholly-owned subsidiary of Reuters, provides independent insight on global collective investments. Returns are based on the period ended October 31, 2019, including the reinvestment of all distributions, including returns of capital, if any, calculated among the 223 funds for thesix-month period and among the 216 funds for the twelve-month period in the Fund’s Lipper category, and excluding sales charges, if any. |
| | |
| 8 | | BrandywineGLOBAL — Global Unconstrained Bond Fund 2019 Annual Report |
Fund at a glance†(unaudited)
Investment breakdown (%) as a percent of total investments
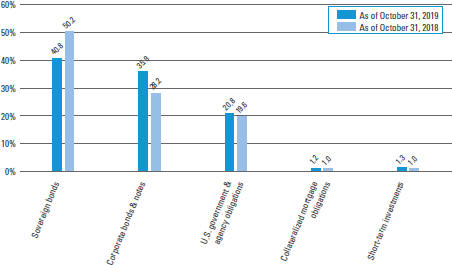
| † | The bar graph above represents the composition of the Fund’s investments as of October 31, 2019 and October 31, 2018 and does not include derivatives, such as future contracts and forward foreign currency contracts. The Fund is actively managed. As a result, the composition of the Fund’s investments is subject to change at any time. |
| | |
| BrandywineGLOBAL — Global Unconstrained Bond Fund 2019 Annual Report | | 9 |
Fund expenses(unaudited)
Example
As a shareholder of the Fund, you may incur two types of costs: (1) transaction costs, includingfront-end andback-end sales charges (loads) on purchase payments; and (2) ongoing costs, including management fees; service and/or distribution(12b-1) fees; and other Fund expenses. This example is intended to help you understand your on going costs (in dollars) of investing in the Fund and to compare these costs with the ongoing costs of investing in other mutual funds.
This example is based on an investment of $1,000 invested on May 1, 2019 and held for the six months ended October 31, 2019.
Actual expenses
The table below titled “Based on Actual Total Return” provides information about actual account values and actual expenses. You may use the information provided in this table, together with the amount you invested, to estimate the expenses that you paid over the period. To estimate the expenses you paid on your account, divide your ending account value by $1,000 (for example, an $8,600 ending account value divided by $1,000 = 8.6), then multiply the result by the number under the heading entitled “Expenses Paid During the Period”.
Hypothetical example for comparison purposes
The table below titled “Based on Hypothetical Total Return” provides information about hypothetical account values and hypothetical expenses based on the actual expense ratio and an assumed rate of return of 5.00% per year before expenses, which is not the Fund’s actual return. The hypothetical account values and expenses may not be used to estimate the actual ending account balance or expenses you paid for the period. You may use the information provided in this table to compare the ongoing costs of investing in the Fund and other funds. To do so, compare the 5.00% hypothetical example relating to the Fund with the 5.00% hypothetical examples that appear in the shareholder reports of the other funds.
Please note that the expenses shown in the table below are meant to highlight your ongoing costs only and do not reflect any transactional costs, such asfront-end orback-end sales charges (loads). Therefore, the table is useful in comparing ongoing costs only, and will not help you determine the relative total costs of owning different funds. In addition, if these transaction costs were included, your costs would have been higher.
| | | | | | | | | | | | | | | | | | | | | | | | | | | | | | | | | | | | | | | | | | | | | | |
| | | |
| Based on actual total return1 | | | | | | | | | Based on hypothetical total return1 | |
| | | Actual
Total Return
Without
Sales
Charge2 | | | Beginning
Account
Value | | | Ending
Account
Value | | | Annualized
Expense
Ratio | | | Expenses
Paid
During
the
Period3 | | | | | | | | Hypothetical
Annualized
Total Return | | | Beginning
Account
Value | | | Ending
Account
Value | | | Annualized
Expense
Ratio | | | Expenses
Paid
During
the
Period3 | |
| Class A | | | 0.96 | % | | $ | 1,000.00 | | | $ | 1,009.60 | | | | 1.20 | % | | $ | 6.08 | | | | | | | Class A | | | 5.00 | % | | $ | 1,000.00 | | | $ | 1,019.16 | | | | 1.20 | % | | $ | 6.11 | |
| Class C | | | 0.70 | | | | 1,000.00 | | | | 1,007.00 | | | | 1.79 | | | | 9.06 | | | | | | | Class C | | | 5.00 | | | | 1,000.00 | | | | 1,016.18 | | | | 1.79 | | | | 9.10 | |
| Class C1 | | | 0.79 | | | | 1,000.00 | | | | 1,007.90 | | | | 1.60 | | | | 8.10 | | | | | | | Class C1 | | | 5.00 | | | | 1,000.00 | | | | 1,017.14 | | | | 1.60 | | | | 8.13 | |
| Class FI | | | 1.56 | | | | 1,000.00 | | | | 1,015.60 | | | | 0.10 | | | | 0.51 | | | | | | | Class FI | | | 5.00 | | | | 1,000.00 | | | | 1,019.16 | | | | 1.20 | 4 | | | 6.11 | |
| Class R | | | 0.87 | | | | 1,000.00 | | | | 1,008.70 | | | | 1.45 | | | | 7.34 | | | | | | | Class R | | | 5.00 | | | | 1,000.00 | | | | 1,017.90 | | | | 1.45 | | | | 7.38 | |
| Class I | | | 1.12 | | | | 1,000.00 | | | | 1,011.20 | | | | 0.85 | | | | 4.31 | | | | | | | Class I | | | 5.00 | | | | 1,000.00 | | | | 1,020.92 | | | | 0.85 | | | | 4.33 | |
| Class IS | | | 1.30 | | | | 1,000.00 | | | | 1,013.00 | | | | 0.75 | | | | 3.81 | | | | | | | Class IS | | | 5.00 | | | | 1,000.00 | | | | 1,021.42 | | | | 0.75 | | | | 3.82 | |
| | |
| 10 | | BrandywineGLOBAL — Global Unconstrained Bond Fund 2019 Annual Report |
| 1 | For the six months ended October 31, 2019. |
| 2 | Assumes the reinvestment of all distributions, including returns of capital, if any, at net asset value and does not reflect the deduction of the applicable sales charge with respect to Class A shares or the applicable contingent deferred sales charge (“CDSC”) with respect to Class C shares. Total return is not annualized, as it may not be representative of the total return for the year. Performance figures may reflect compensating balance arrangements, fee waivers and/or expense reimbursements. In the absence of compensating balance arrangements, fee waivers and/or expense reimbursements, the total return would have been lower. Past performance is no guarantee of future results. |
| 3 | Expenses (net of compensating balance arrangements, fee waivers and/or expense reimbursements) are equal to each class’ respective annualized expense ratio multiplied by the average account value over the period, multiplied by the number of days in the most recent fiscal half-year (184), then divided by 365. |
| 4 | Annualized expense ratio for the six months ended October 31, 2019 does not reflect theone-time transfer agent fee adjustment of $306 related to a prior period over accrual. If this adjustment were included, annualized expense ratio for Class FI shares for the six months ended October 31, 2019 would have been 0.10%. |
| | |
| BrandywineGLOBAL — Global Unconstrained Bond Fund 2019 Annual Report | | 11 |
Fund performance(unaudited)
| | | | | | | | | | | | | | | | | | | | | | | | | | | | |
| Average annual total returns | | | | | | | | | | | | | | | | | | | | | |
| Without sales charges1 | | Class A | | | Class C | | | Class C12 | | | Class FI | | | Class R | | | Class I | | | Class IS | |
| Twelve Months Ended 10/31/19 | | | 4.69 | % | | | 4.13 | % | | | 4.28 | % | | | 5.31 | % | | | 4.43 | % | | | 5.05 | % | | | 5.26 | % |
| Five Years Ended 10/31/19 | | | 0.61 | | | | 0.00 | | | | 0.19 | | | | 0.73 | | | | 0.35 | | | | 0.97 | | | | 1.10 | |
| Inception* through 10/31/19 | | | 2.56 | | | | 1.32 | | | | 2.09 | | | | 2.78 | | | | 2.44 | | | | 2.93 | | | | 1.57 | |
| | | | | | | |
| With sales charges3 | | Class A | | | Class C | | | Class C12 | | | Class FI | | | Class R | | | Class I | | | Class IS | |
| Twelve Months Ended 10/31/19 | | | 2.30 | % | | | 3.13 | % | | | 4.28 | % | | | 5.31 | % | | | 4.43 | % | | | 5.05 | % | | | 5.26 | % |
| Five Years Ended 10/31/19 | | | 0.16 | | | | 0.00 | | | | 0.19 | | | | 0.73 | | | | 0.35 | | | | 0.97 | | | | 1.10 | |
| Inception* through 10/31/19 | | | 2.29 | | | | 1.32 | | | | 2.09 | | | | 2.78 | | | | 2.44 | | | | 2.93 | | | | 1.57 | |
| | | | |
| Cumulative total returns | |
| Without sales charges1 | | | |
| Class A (Inception date of 2/28/11 through 10/31/19) | | | 24.52 | % |
| Class C (Inception date of 8/1/12 through 10/31/19) | | | 10.00 | |
| Class C1 (Inception date of 2/28/11 through 10/31/19) | | | 19.66 | |
| Class FI (Inception date of 10/31/11 through 10/31/19) | | | 24.55 | |
| Class R (Inception date of 10/31/11 through 10/31/19) | | | 21.32 | |
| Class I (Inception date of 2/28/11 through 10/31/19) | | | 28.41 | |
| Class IS (Inception date of 3/1/13 through 10/31/19) | | | 10.97 | |
All figures represent past performance and are not a guarantee of future results. Investment return and principal value of an investment will fluctuate so that an investor’s shares, when redeemed, may be worth more or less than their original cost. The returns shown do not reflect the deduction of taxes that a shareholder would pay on Fund distributions or the redemption of Fund shares. Performance figures may reflect compensating balance arrangements, fee waivers and/or expense reimbursements. In the absence of compensating balance arrangements, fee waivers and/or expense reimbursements, the total return would have been lower.
| 1 | Assumes the reinvestment of all distributions, including returns of capital, if any, at net asset value and does not reflect the deduction of the applicable sales charge with respect to Class A shares or the applicable contingent deferred sales charge (“CDSC”) with respect to Class C shares. |
| 2 | Effective August 1, 2012, Class C shares were reclassified as Class C1 shares. |
| 3 | Assumes the reinvestment of all distributions, including returns of capital, if any, at net asset value. In addition, Class A shares reflect the deduction of the maximum initial sales charge of 2.25%. Class C shares reflect the deduction of a 1.00% CDSC, which applies if shares are redeemed within one year from purchase payment. |
| * | Inception dates for Class A, C, C1, FI, R, I and IS shares are February 28, 2011, August 1, 2012, February 28, 2011, October 31, 2011, October 31, 2011, February 28, 2011 and March 1, 2013, respectively. |
| | |
| 12 | | BrandywineGLOBAL — Global Unconstrained Bond Fund 2019 Annual Report |
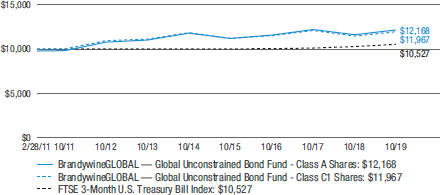
Historical performance
Value of $10,000 invested in
Class A and C1 Shares of BrandywineGLOBAL — Global Unconstrained Bond Fund vs. FTSE3-Month U.S. Treasury Bill Index† — February 28, 2011 — October 2019
Value of $1,000,000 invested in
Class I Shares of BrandywineGLOBAL — Global Unconstrained Bond Fund vs. FTSE3-Month U.S. Treasury Bill Index† — February 28, 2011 — October 31, 2019
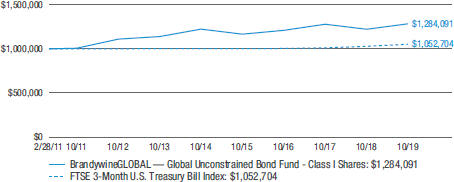
All figures represent past performance and are not a guarantee of future results. Investment return and principal value of an investment will fluctuate so that an investor’s shares, when redeemed, may be worth more or less than their original cost. The returns shown do not reflect the deduction of taxes that a shareholder would pay on Fund distributions or the redemption of Fund shares. Performance figures may reflect compensating balance arrangements, fee waivers and/or expense reimbursements. In the absence of compensating balance arrangements, fee waivers and/or expense reimbursements, the total return would have been lower.
| | |
| BrandywineGLOBAL — Global Unconstrained Bond Fund 2019 Annual Report | | 13 |
Fund performance (unaudited) (cont’d)
| † | Hypothetical illustration of $10,000 invested in Class A and C1 shares and $1,000,000 invested in Class I shares of BrandywineGLOBAL — Global Unconstrained Bond Fund on February 28, 2011 (inception date), assuming the deduction of the maximum initial sales charge of 2.25% at the time of investment for Class A shares and the reinvestment of all distributions, including returns of capital, if any, at net asset value through October 31, 2019. The hypothetical illustration also assumes a $10,000 or $1,000,000 investment, as applicable, in the FTSE3-Month U.S. Treasury Bill Index (formerly known as the Citigroup3-month U.S. Treasury Bill Index). The FTSE3-Month U.S. Treasury Bill Index is an unmanaged index generally representative of the average yield of3-Month U.S. Treasury bills. The index is unmanaged and is not subject to the same management and trading expenses as a mutual fund. Please note that an investor cannot invest directly in an index. The performance of the Fund’s other classes may be greater or less than the Class A, C1 and I shares performance indicated on these charts, depending on whether greater or lesser sales charges and fees were incurred by shareholders investing in the other classes. |
| | |
| 14 | | BrandywineGLOBAL — Global Unconstrained Bond Fund 2019 Annual Report |
Schedule of investments
October 31, 2019
BrandywineGLOBAL — Global Unconstrained Bond Fund
| | | | | | | | | | | | | | | | |
| Security | | Rate | | | Maturity
Date | | | Face Amount† | | | Value | |
| Sovereign Bonds — 39.9% | | | | | | | | | | | | | | | | |
Australia — 2.0% | | | | | | | | | | | | | | | | |
Australia Government Bond, Senior Notes | | | 5.750 | % | | | 7/15/22 | | | | 25,810,000 | AUD | | $ | 20,133,874 | (a) |
Brazil — 4.8% | | | | | | | | | | | | | | | | |
Brazil Notas do Tesouro Nacional Serie F, Notes | | | 10.000 | % | | | 1/1/21 | | | | 71,660,000 | BRL | | | 18,981,050 | |
Brazil Notas do Tesouro Nacional Serie F, Notes | | | 10.000 | % | | | 1/1/27 | | | | 95,200,000 | BRL | | | 28,678,691 | |
Total Brazil | | | | | | | | | | | | | | | 47,659,741 | |
Colombia — 4.8% | | | | | | | | | | | | | | | | |
Colombian TES, Bonds | | | 6.000 | % | | | 4/28/28 | | | | 159,560,000,000 | COP | | | 47,856,681 | |
Indonesia — 4.1% | | | | | | | | | | | | | | | | |
Indonesia Treasury Bond, Senior Notes | | | 9.000 | % | | | 3/15/29 | | | | 420,900,000,000 | IDR | | | 33,983,283 | |
Indonesia Treasury Bond, Senior Notes | | | 8.750 | % | | | 2/15/44 | | | | 89,300,000,000 | IDR | | | 6,922,332 | |
Total Indonesia | | | | | | | | | | | | | | | 40,905,615 | |
Malaysia — 4.5% | | | | | | | | | | | | | | | | |
Malaysia Government Bond, Senior Notes | | | 3.659 | % | | | 10/15/20 | | | | 19,095,000 | MYR | | | 4,593,803 | |
Malaysia Government Bond, Senior Notes | | | 3.882 | % | | | 3/10/22 | | | | 54,500,000 | MYR | | | 13,260,738 | |
Malaysia Government Bond, Senior Notes | | | 3.480 | % | | | 3/15/23 | | | | 40,960,000 | MYR | | | 9,873,558 | |
Malaysia Government Bond, Senior Notes | | | 3.955 | % | | | 9/15/25 | | | | 31,835,000 | MYR | | | 7,845,643 | |
Malaysia Government Bond, Senior Notes | | | 3.899 | % | | | 11/16/27 | | | | 36,850,000 | MYR | | | 9,082,112 | |
Total Malaysia | | | | | | | | | | | | | | | 44,655,854 | |
Mexico — 12.9% | | | | | | | | | | | | | | | | |
Mexican Bonos, Bonds | | | 8.000 | % | | | 11/7/47 | | | | 171,000,000 | MXN | | | 9,794,135 | |
Mexican Bonos, Senior Notes | | | 8.500 | % | | | 5/31/29 | | | | 508,200,000 | MXN | | | 29,624,680 | |
Mexican Bonos, Senior Notes | | | 7.750 | % | | | 11/23/34 | | | | 168,100,000 | MXN | | | 9,383,242 | |
Mexican Bonos, Senior Notes | | | 8.500 | % | | | 11/18/38 | | | | 539,800,000 | MXN | | | 32,206,163 | |
Mexican Bonos, Senior Notes | | | 7.750 | % | | | 11/13/42 | | | | 845,800,000 | MXN | | | 47,010,678 | |
Total Mexico | | | | | | | | | | | | | | | 128,018,898 | |
Norway — 2.2% | | | | | | | | | | | | | | | | |
Kommunalbanken AS, Senior Notes (3 mo. USD LIBOR +0.330%) | | | 2.449 | % | | | 6/16/20 | | | | 22,242,000 | | | | 22,292,602 | (b)(c) |
Poland — 4.6% | | | | | | | | | | | | | | | | |
Republic of Poland Government Bond | | | 1.500 | % | | | 4/25/20 | | | | 102,200,000 | PLN | | | 26,818,923 | |
Republic of Poland Government Bond | | | 5.250 | % | | | 10/25/20 | | | | 32,365,000 | PLN | | | 8,815,929 | |
Republic of Poland Government Bond | | | 2.000 | % | | | 4/25/21 | | | | 37,980,000 | PLN | | | 10,039,130 | |
Total Poland | | | | | | | | | | | | | | | 45,673,982 | |
Total Sovereign Bonds (Cost — $424,168,958) | | | | | | | | | | | | | | | 397,197,247 | |
See Notes to Financial Statements.
| | |
| BrandywineGLOBAL — Global Unconstrained Bond Fund 2019 Annual Report | | 15 |
Schedule of investments (cont’d)
October 31, 2019
BrandywineGLOBAL — Global Unconstrained Bond Fund
| | | | | | | | | | | | | | | | |
| Security | | Rate | | | Maturity
Date | | | Face
Amount† | | | Value | |
| Corporate Bonds & Notes — 35.1% | | | | | | | | | | | | | | | | |
| Communication Services — 3.1% | | | | | | | | | | | | | | | | |
Media — 3.1% | | | | | | | | | | | | | | | | |
NBCUniversal Enterprise Inc., Senior Notes (3 mo. USD LIBOR + 0.400%) | | | 2.499 | % | | | 4/1/21 | | | | 31,020,000 | | | $ | 31,132,638 | (b)(c) |
| Consumer Discretionary — 7.9% | | | | | | | | | | | | | | | | |
Automobiles — 7.9% | | | | | | | | | | | | | | | | |
BMW US Capital LLC, Senior Notes (3 mo. USD LIBOR + 0.380%) | | | 2.423 | % | | | 4/6/20 | | | | 17,025,000 | | | | 17,046,871 | (b)(c) |
Ford Motor Credit Co. LLC, Senior Notes (3 mo. USD LIBOR + 0.810%) | | | 2.853 | % | | | 4/5/21 | | | | 18,725,000 | | | | 18,582,791 | (c) |
Ford Motor Credit Co. LLC, Senior Notes (3 mo. USD LIBOR + 1.000%) | | | 3.012 | % | | | 1/9/20 | | | | 10,115,000 | | | | 10,124,113 | (c) |
General Motors Financial Co. Inc., Senior Notes (3 mo. USD LIBOR + 0.930%) | | | 2.916 | % | | | 4/13/20 | | | | 32,685,000 | | | | 32,755,794 | (c) |
Total Consumer Discretionary | | | | | | | | | | | | | | | 78,509,569 | |
| Energy — 2.1% | | | | | | | | | | | | | | | | |
Oil, Gas & Consumable Fuels — 2.1% | | | | | | | | | | | | | | | | |
Petroleos Mexicanos, Senior Notes | | | 6.750 | % | | | 9/21/47 | | | | 2,940,000 | | | | 2,932,650 | |
Petroleos Mexicanos, Senior Notes | | | 7.690 | % | | | 1/23/50 | | | | 16,160,000 | | | | 17,600,502 | (b) |
Total Energy | | | | | | | | | | | | | | | 20,533,152 | |
| Financials — 19.5% | | | | | | | | | | | | | | | | |
Banks — 7.3% | | | | | | | | | | | | | | | | |
Citibank NA, Senior Notes (3 mo. USD LIBOR + 0.350%) | | | 2.531 | % | | | 2/12/21 | | | | 23,305,000 | | | | 23,345,363 | (c) |
Citigroup Inc., Senior Notes (3 mo. USD LIBOR + 0.790%) | | | 2.800 | % | | | 1/10/20 | | | | 7,990,000 | | | | 7,996,871 | (c) |
National Australia Bank Ltd., Senior Notes (3 mo. USD LIBOR + 0.510%) | | | 2.660 | % | | | 5/22/20 | | | | 19,275,000 | | | | 19,329,677 | (b)(c) |
Wells Fargo & Co., Senior Notes (3 mo. USD LIBOR + 1.025%) | | | 2.961 | % | | | 7/26/21 | | | | 21,540,000 | | | | 21,808,860 | (c) |
Total Banks | | | | | | | | | | | | | | | 72,480,771 | |
Capital Markets — 7.6% | | | | | | | | | | | | | | | | |
Daimler Finance North America LLC, Senior Notes (3 mo. USD LIBOR + 0.450%) | | | 2.600 | % | | | 2/22/21 | | | | 26,410,000 | | | | 26,422,365 | (b)(c) |
Goldman Sachs Group Inc., Senior Notes (3 mo. USD LIBOR + 0.750%) | | | 2.898 | % | | | 2/23/23 | | | | 48,640,000 | | | | 48,791,757 | (c) |
Total Capital Markets | | | | | | | | | | | | | | | 75,214,122 | |
Consumer Finance — 1.3% | | | | | | | | | | | | | | | | |
American Express Co., Senior Notes (3 mo. USD LIBOR + 0.600%) | | | 2.887 | % | | | 11/5/21 | | | | 13,000,000 | | | | 13,072,441 | (c) |
See Notes to Financial Statements.
| | |
| 16 | | BrandywineGLOBAL — Global Unconstrained Bond Fund 2019 Annual Report |
BrandywineGLOBAL — Global Unconstrained Bond Fund
| | | | | | | | | | | | | | | | |
| Security | | Rate | | | Maturity
Date | | | Face
Amount† | | | Value | |
Insurance — 3.3% | | | | | | | | | | | | | | | | |
Metropolitan Life Global Funding I, Senior Secured Notes (3 mo. USD LIBOR + 0.230%) | | | 2.257 | % | | | 1/8/21 | | | | 17,930,000 | | | $ | 17,954,503 | (b)(c) |
New York Life Global Funding, Secured Notes (3 mo. USD LIBOR + 0.160%) | | | 2.259 | % | | | 10/1/20 | | | | 15,255,000 | | | | 15,275,382 | (b)(c) |
Total Insurance | | | | | | | | | | | | | | | 33,229,885 | |
Total Financials | | | | | | | | | | | | | | | 193,997,219 | |
| Industrials — 2.5% | | | | | | | | | | | | | | | | |
Machinery — 2.5% | | | | | | | | | | | | | | | | |
Caterpillar Financial Services Corp., Senior Notes (3 mo. USD LIBOR + 0.230%) | | | 2.349 | % | | | 3/15/21 | | | | 25,220,000 | | | | 25,248,053 | (c) |
Total Corporate Bonds & Notes (Cost — $347,417,993) | | | | | | | | | | | | | | | 349,420,631 | |
| U.S. Government & Agency Obligations — 20.4% | | | | | | | | | | | | | | | | |
U.S. Government Obligations — 20.4% | | | | | | | | | | | | | | | | |
U.S. Treasury Notes (3 mo. U.S. Treasury Money Market Yield + 0.139%) | | | 1.766 | % | | | 4/30/21 | | | | 129,105,000 | | | | 128,958,440 | (c) |
U.S. Treasury Notes (3 mo. U.S. Treasury Money Market Yield + 0.220%) | | | 1.847 | % | | | 7/31/21 | | | | 73,475,000 | | | | 73,476,574 | (c) |
Total U.S. Government & Agency Obligations (Cost — $202,457,098) | | | | 202,435,014 | |
| Collateralized Mortgage Obligations(d)— 1.2% | | | | | | | | | | | | | | | | |
Barclays Commercial Mortgage Securities Trust, 2017-DELC E (1 mo. USD LIBOR + 2.500%) | | | 4.414 | % | | | 8/15/36 | | | | 7,915,000 | | | | 7,965,687 | (b)(c) |
IM Pastor Fondo de Titulizacion de Activos, 2004 A (3 mo. EURIBOR + 0.140%, 0.000% Floor) | | | 0.000 | % | | | 3/22/44 | | | | 4,103,531 | EUR | | | 4,243,825 | (a)(c) |
Total Collateralized Mortgage Obligations (Cost — $12,869,010) | | | | 12,209,512 | |
Total Investments before Short-Term Investments (Cost — $986,913,059) | | | | 961,262,404 | |
| | | | |
| | | | | | | | | Shares | | | | |
| Short-Term Investments — 1.3% | | | | | | | | | | | | | | | | |
JPMorgan U.S. Government Money Market Fund, Institutional Class (Cost — $13,062,430) | | | 1.641 | % | | | | | | | 13,062,430 | | | | 13,062,430 | |
Total Investments — 97.9% (Cost — $999,975,489) | | | | | | | | | | | | | | | 974,324,834 | |
Other Assets in Excess of Liabilities — 2.1% | | | | | | | | | | | | | | | 21,370,382 | |
Total Net Assets — 100.0% | | | | | | | | | | | | | | $ | 995,695,216 | |
See Notes to Financial Statements.
| | |
| BrandywineGLOBAL — Global Unconstrained Bond Fund 2019 Annual Report | | 17 |
Schedule of investments (cont’d)
October 31, 2019
BrandywineGLOBAL — Global Unconstrained Bond Fund
| † | Face amount denominated in U.S. dollars, unless otherwise noted. |
| (a) | Security is exempt from registration under Regulation S of the Securities Act of 1933. Regulation S applies to securities offerings that are made outside of the United States and do not involve direct selling efforts in the United States. This security has been deemed liquid pursuant to guidelines approved by the Board of Trustees. |
| (b) | Security is exempt from registration under Rule 144A of the Securities Act of 1933. This security may be resold in transactions that are exempt from registration, normally to qualified institutional buyers. This security has been deemed liquid pursuant to guidelines approved by the Board of Trustees. |
| (c) | Variable rate security. Interest rate disclosed is as of the most recent information available. Certain variable rate securities are not based on a published reference rate and spread but are determined by the issuer or agent and are based on current market conditions. These securities do not indicate a reference rate and spread in their description above. |
| (d) | Collateralized mortgage obligations are secured by an underlying pool of mortgages or mortgage pass-through certificates that are structured to direct payments on underlying collateral to different series or classes of the obligations. The interest rate may change positively or inversely in relation to one or more interest rates, financial indices or other financial indicators and may be subject to an upper and/or lower limit. |
| | |
Abbreviations used in this schedule: |
| |
| AUD | | — Australian Dollar |
| |
| BRL | | — Brazilian Real |
| |
| COP | | — Colombian Peso |
| |
| EUR | | — Euro |
| |
| EURIBOR | | — Euro Interbank Offered Rate |
| |
| IDR | | — Indonesian Rupiah |
| |
| LIBOR | | — London Interbank Offered Rate |
| |
| MXN | | — Mexican Peso |
| |
| MYR | | — Malaysian Ringgit |
| |
| PLN | | — Polish Zloty |
| |
| USD | | — United States Dollar |
At October 31, 2019, the Fund had the following open futures contracts:
| | | | | | | | | | | | | | | | | | | | |
| | | Number of
Contracts | | | Expiration
Date | | | Notional
Amount | | | Market
Value | | | Unrealized
Appreciation | |
| Contracts to Sell: | | | | | | | | | | | | | | | | | | | | |
| Euro-Buxl | | | 388 | | | | 12/19 | | | $ | 96,685,133 | | | $ | 90,857,335 | | | $ | 5,827,798 | |
| Euro-Oat | | | 256 | | | | 12/19 | | | | 48,896,607 | | | | 48,075,319 | | | | 821,288 | |
| Net unrealized appreciation on open futures contracts | | | | | | | $ | 6,649,086 | |
At October 31, 2019, the Fund had the following open forward foreign currency contracts:
| | | | | | | | | | | | | | | | | | | | |
Currency
Purchased | | | Currency
Sold | | | Counterparty | | Settlement
Date | | | Unrealized
Appreciation
(Depreciation) | |
| RUB | | | 937,000,000 | | | USD | | | 14,208,810 | | | Citibank N.A. | | | 11/8/19 | | | $ | 388,144 | |
| SGD | | | 4,900,000 | | | USD | | | 3,551,180 | | | Citibank N.A. | | | 11/13/19 | | | | 50,983 | |
| USD | | | 53,737,506 | | | SGD | | | 74,190,000 | | | Citibank N.A. | | | 11/13/19 | | | | (802,178) | |
| CLP | | | 12,940,000,000 | | | USD | | | 18,178,242 | | | HSBC Securities Inc. | | | 11/13/19 | | | | (723,691) | |
See Notes to Financial Statements.
| | |
| 18 | | BrandywineGLOBAL — Global Unconstrained Bond Fund 2019 Annual Report |
BrandywineGLOBAL — Global Unconstrained Bond Fund
| | | | | | | | | | | | | | | | | | | | |
Currency
Purchased | | | Currency
Sold | | | Counterparty | | Settlement
Date | | | Unrealized
Appreciation
(Depreciation) | |
| USD | | | 2,238,651 | | | CLP | | | 1,620,000,000 | | | HSBC Securities Inc. | | | 11/13/19 | | | $ | 53,460 | |
| USD | | | 34,819,056 | | | ZAR | | | 543,710,000 | | | HSBC Securities Inc. | | | 11/15/19 | | | | (1,087,709) | |
| ZAR | | | 255,900,000 | | | USD | | | 16,713,474 | | | HSBC Securities Inc. | | | 11/15/19 | | | | 186,235 | |
| ZAR | | | 287,810,000 | | | USD | | | 18,574,918 | | | HSBC Securities Inc. | | | 11/15/19 | | | | 432,137 | |
| MXN | | | 77,800,000 | | | USD | | | 4,066,485 | | | Citibank N.A. | | | 11/19/19 | | | | (34,398) | |
| USD | | | 47,212,924 | | | MXN | | | 942,200,000 | | | Citibank N.A. | | | 11/19/19 | | | | (1,617,829) | |
| MXN | | | 140,000,000 | | | USD | | | 7,086,968 | | | Goldman Sachs Group Inc. | | | 11/19/19 | | | | 168,716 | |
| MXN | | | 77,600,000 | | | USD | | | 4,025,857 | | | HSBC Securities Inc. | | | 11/19/19 | | | | (4,135) | |
| MXN | | | 179,300,000 | | | USD | | | 9,156,462 | | | HSBC Securities Inc. | | | 11/19/19 | | | | 135,996 | |
| USD | | | 2,643,210 | | | AUD | | | 3,870,000 | | | Goldman Sachs Group Inc. | | | 11/22/19 | | | | (26,228) | |
| AUD | | | 54,600,000 | | | USD | | | 37,143,288 | | | Morgan Stanley & Co. Inc. | | | 11/22/19 | | | | 518,555 | |
| USD | | | 2,457,538 | | | NZD | | | 3,880,000 | | | Goldman Sachs Group Inc. | | | 12/5/19 | | | | (31,753) | |
| NZD | | | 32,980,000 | | | USD | | | 21,092,359 | | | HSBC Securities Inc. | | | 12/5/19 | | | | 66,608 | |
| USD | | | 1,935,232 | | | NOK | | | 17,800,000 | | | Barclays Bank PLC | | | 12/6/19 | | | | (766) | |
| NOK | | | 413,400,000 | | | USD | | | 46,275,774 | | | Goldman Sachs Group Inc. | | | 12/6/19 | | | | (1,312,762) | |
| GBP | | | 30,980,000 | | | USD | | | 38,331,554 | | | JPMorgan Chase & Co. | | | 12/9/19 | | | | 1,851,061 | |
| USD | | | 3,858,600 | | | GBP | | | 3,000,000 | | | UBS Securities LLC | | | 12/9/19 | | | | (32,551) | |
| USD | | | 52,180,840 | | | EUR | | | 46,870,000 | | | JPMorgan Chase & Co. | | | 12/12/19 | | | | (247,766) | |
| CLP | | | 12,039,000,000 | | | USD | | | 16,932,966 | | | HSBC Securities Inc. | | | 12/13/19 | | | | (681,492) | |
| JPY | | | 1,280,000,000 | | | USD | | | 12,000,523 | | | Barclays Bank PLC | | | 1/9/20 | | | | (88,994) | |
| USD | | | 186,355,103 | | | JPY | | | 19,802,000,000 | | | Citibank N.A. | | | 1/9/20 | | | | 2,080,026 | |
| USD | | | 1,831,817 | | | CZK | | | 42,000,000 | | | Citibank N.A. | | | 1/10/20 | | | | (6,380) | |
| CZK | | | 491,100,000 | | | USD | | | 20,905,256 | | | JPMorgan Chase & Co. | | | 1/10/20 | | | | 588,527 | |
| KRW | | | 50,483,000,000 | | | USD | | | 42,285,882 | | | Citibank N.A. | | | 1/13/20 | | | | 1,190,783 | |
| USD | | | 2,530,271 | | | KRW | | | 3,030,000,000 | | | Citibank N.A. | | | 1/13/20 | | | | (79,207) | |
| CLP | | | 9,280,000,000 | | | USD | | | 12,798,411 | | | HSBC Securities Inc. | | | 1/14/20 | | | | (260,371) | |
| PLN | | | 69,020,000 | | | USD | | | 17,905,693 | | | Citibank N.A. | | | 1/16/20 | | | | 169,489 | |
| USD | | | 10,725,976 | | | PLN | | | 42,270,000 | | | Citibank N.A. | | | 1/16/20 | | | | (343,829) | |
| NOK | | | 146,300,000 | | | USD | | | 16,344,542 | | | HSBC Securities Inc. | | | 1/17/20 | | | | (427,725) | |
| NZD | | | 32,980,000 | | | USD | | | 20,739,968 | | | HSBC Securities Inc. | | | 1/17/20 | | | | 435,021 | |
| SEK | | | 518,100,000 | | | USD | | | 54,066,746 | | | HSBC Securities Inc. | | | 1/17/20 | | | | (159,992) | |
| USD | | | 3,353,852 | | | SEK | | | 32,400,000 | | | Morgan Stanley & Co. Inc. | | | 1/17/20 | | | | (17,271) | |
| GBP | | | 8,620,000 | | | USD | | | 10,829,220 | | | Citibank N.A. | | | 1/24/20 | | | | 368,101 | |
| IDR | | | 151,000,000,000 | | | USD | | | 10,570,529 | | | JPMorgan Chase & Co. | | | 1/29/20 | | | | 85,788 | |
| CLP | | | 12,170,000,000 | | | USD | | | 16,813,340 | | | HSBC Securities Inc. | | | 1/31/20 | | | | (361,836) | |
| AUD | | | 32,770,000 | | | USD | | | 22,555,263 | | | Morgan Stanley & Co. Inc. | | | 1/31/20 | | | | 86,185 | |
| GBP | | | 49,220,000 | | | USD | | | 64,160,731 | | | HSBC Securities Inc. | | | 2/24/20 | | | | (178,492) | |
| Total | | | | | | | | | | | | $ | 328,460 | |
See Notes to Financial Statements.
| | |
| BrandywineGLOBAL — Global Unconstrained Bond Fund 2019 Annual Report | | 19 |
Schedule of investments(cont’d)
October 31, 2019
BrandywineGLOBAL — Global Unconstrained Bond Fund
| | |
Abbreviations used in this table: |
| |
| AUD | | — Australian Dollar |
| |
| CLP | | — Chilean Peso |
| |
| CZK | | — Czech Koruna |
| |
| EUR | | — Euro |
| |
| GBP | | — British Pound |
| |
| IDR | | — Indonesian Rupiah |
| |
| JPY | | — Japanese Yen |
| |
| KRW | | — South Korean Won |
| |
| MXN | | — Mexican Peso |
| |
| NOK | | — Norwegian Krone |
| |
| NZD | | — New Zealand Dollar |
| |
| PLN | | — Polish Zloty |
| |
| RUB | | — Russian Ruble |
| SEK | | — Swedish Krona |
| SGD | | — Singapore Dollar |
| USD | | — United States Dollar |
| ZAR | | — South African Rand |
| | | | |
| Summary of Investments by Country*(unaudited) | |
| United States | | | 48.9 | % |
| Mexico | | | 15.2 | |
| Colombia | | | 4.9 | |
| Brazil | | | 4.9 | |
| Poland | | | 4.7 | |
| Malaysia | | | 4.6 | |
| Germany | | | 4.5 | |
| Indonesia | | | 4.2 | |
| Australia | | | 4.1 | |
| Norway | | | 2.3 | |
| Spain | | | 0.4 | |
| Short-Term Investments | | | 1.3 | |
| | | | 100.0 | % |
| * | As a percentage of total investments. Please note that the Fund holdings are as of October 31, 2019 and are subject to change. |
See Notes to Financial Statements.
| | |
| 20 | | BrandywineGLOBAL — Global Unconstrained Bond Fund 2019 Annual Report |
Statement of assets and liabilities
October 31, 2019
| | | | |
| |
| Assets: | | | | |
Investments, at value (Cost — $999,975,489) | | $ | 974,324,834 | |
Foreign currency, at value (Cost — $175) | | | 175 | |
Cash | | | 2,018,887 | |
Interest receivable | | | 9,911,523 | |
Unrealized appreciation on forward foreign currency contracts | | | 8,855,815 | |
Foreign currency collateral for open futures contracts, at value (Cost — $7,893,356) | | | 7,992,442 | |
Receivable for securities sold | | | 3,527,568 | |
Deposits with brokers for OTC derivatives | | | 1,790,000 | |
Receivable for Fund shares sold | | | 1,124,148 | |
Deposits with brokers for centrally cleared swap contracts | | | 210 | |
Prepaid expenses | | | 61,668 | |
Total Assets | | | 1,009,607,270 | |
| |
| Liabilities: | | | | |
Unrealized depreciation on forward foreign currency contracts | | | 8,527,355 | |
Payable for securities purchased | | | 2,020,060 | |
Payable to broker — variation margin on open futures contracts | | | 1,342,464 | |
Payable for Fund shares repurchased | | | 849,555 | |
Investment management fee payable | | | 524,711 | |
Deposits from brokers for open futures contracts | | | 147,058 | |
Trustees’ fees payable | | | 11,545 | |
Service and/or distribution fees payable | | | 9,361 | |
Accrued expenses | | | 479,945 | |
Total Liabilities | | | 13,912,054 | |
| Total Net Assets | | $ | 995,695,216 | |
| |
| Net Assets: | | | | |
Par value (Note 7) | | $ | 851 | |
Paid-in capital in excess of par value | | | 1,110,029,111 | |
Total distributable earnings (loss) | | | (114,334,746) | |
| Total Net Assets | | $ | 995,695,216 | |
See Notes to Financial Statements.
| | |
| BrandywineGLOBAL — Global Unconstrained Bond Fund 2019 Annual Report | | 21 |
Statement of assets and liabilities (cont’d)
October 31, 2019
| | | | |
| |
| Net Assets: | | | | |
Class A | | | $29,821,988 | |
Class C | | | $3,063,645 | |
Class C1 | | | $433,594 | |
Class FI | | | $49,115 | |
Class R | | | $50,142 | |
Class I | | | $540,611,088 | |
Class IS | | | $421,665,644 | |
| |
| Shares Outstanding: | | | | |
Class A | | | 2,566,223 | |
Class C | | | 266,651 | |
Class C1 | | | 37,627 | |
Class FI | | | 4,175 | |
Class R | | | 4,329 | |
Class I | | | 46,235,939 | |
Class IS | | | 35,957,542 | |
| |
| Net Asset Value: | | | | |
Class A (and redemption price) | | | $11.62 | |
Class C* | | | $11.49 | |
Class C1 (and redemption price) | | | $11.52 | |
Class FI (and redemption price) | | | $11.76 | |
Class R (and redemption price) | | | $11.58 | |
Class I (and redemption price) | | | $11.69 | |
Class IS (and redemption price) | | | $11.73 | |
| Maximum Public Offering Price Per Share: | | | | |
Class A (based on maximum initial sales charge of 2.25%) | | | $11.89 | |
| * | Redemption price per share is NAV of Class C shares reduced by a 1.00% CDSC if shares are redeemed within one year from purchase payment (Note 2). |
See Notes to Financial Statements.
| | |
| 22 | | BrandywineGLOBAL — Global Unconstrained Bond Fund 2019 Annual Report |
Statement of operations
For the Year Ended October 31, 2019
| | | | |
| |
| Investment Income: | | | | |
Interest | | $ | 51,809,456 | |
Less: Foreign taxes withheld | | | (425,984) | |
Total Investment Income | | | 51,383,472 | |
| |
| Expenses: | | | | |
Investment management fee (Note 2) | | | 7,460,061 | |
Transfer agent fees (Note 5) | | | 1,483,267 | |
Custody fees | | | 438,238 | |
Fees recaptured by investment manager (Note 2) | | | 233,766 | |
Registration fees | | | 195,971 | |
Trustees’ fees | | | 190,380 | |
Service and/or distribution fees (Notes 2 and 5) | | | 155,542 | |
Legal fees | | | 128,311 | |
Fund accounting fees | | | 78,756 | |
Audit and tax fees | | | 53,065 | |
Commitment fees (Note 8) | | | 44,845 | |
Shareholder reports | | | 31,283 | |
Insurance | | | 17,927 | |
Interest expense | | | 1,620 | |
Miscellaneous expenses | | | 78,166 | |
Total Expenses | | | 10,591,198 | |
Less: Fee waivers and/or expense reimbursements (Notes 2 and 5) | | | (1,049,549) | |
Net Expenses | | | 9,541,649 | |
| Net Investment Income | | | 41,841,823 | |
| |
| Realized and Unrealized Gain (Loss) on Investments, Futures Contracts, Forward Foreign Currency Contracts and Foreign Currency Transactions (Notes 1, 3 and 4): | | | | |
Net Realized Loss From: | | | | |
Investment transactions | | | (60,034,420) | † |
Futures contracts | | | (35,517,230) | |
Forward foreign currency contracts | | | (27,701,614) | |
Foreign currency transactions | | | (420,433) | |
Net Realized Loss | | | (123,673,697) | |
Change in Net Unrealized Appreciation (Depreciation) From: | | | | |
Investments | | | 124,166,129 | ‡ |
Futures contracts | | | 11,437,060 | |
Forward foreign currency contracts | | | 4,655,250 | |
Foreign currencies | | | 578,117 | |
Change in Net Unrealized Appreciation (Depreciation) | | | 140,836,556 | |
| Net Gain on Investments, Futures Contracts, Forward Foreign Currency Contracts and Foreign Currency Transactions | | | 17,162,859 | |
| Increase in Net Assets From Operations | | $ | 59,004,682 | |
| † | Net of foreign capital gains tax of $(128,289). |
| ‡ | Net of change in accrued foreign capital gains tax of $(11,522). |
See Notes to Financial Statements.
| | |
| BrandywineGLOBAL — Global Unconstrained Bond Fund 2019 Annual Report | | 23 |
Statements of changes in net assets
| | | | | | | | |
| For the Years Ended October 31, | | 2019 | | | 2018 | |
| | |
| Operations: | | | | | | | | |
Net investment income | | $ | 41,841,823 | | | $ | 49,520,023 | |
Net realized loss | | | (123,673,697) | | | | (19,449,448) | |
Change in net unrealized appreciation (depreciation) | | | 140,836,556 | | | | (88,432,779) | |
Increase (Decrease) in Net Assets From Operations | | | 59,004,682 | | | | (58,362,204) | |
| | |
| Distributions to Shareholders From (Notes 1 and 6) : | | | | | | | | |
Total distributable earnings(a) | | | (6,000,060) | | | | (76,320,678) | |
Decrease in Net Assets From Distributions to Shareholders | | | (6,000,060) | | | | (76,320,678) | |
| | |
| Fund Share Transactions (Note 7): | | | | | | | | |
Net proceeds from sale of shares | | | 293,499,515 | | | | 603,987,756 | |
Reinvestment of distributions | | | 5,176,861 | | | | 65,063,367 | |
Cost of shares repurchased | | | (719,485,731) | | | | (784,599,850) | |
Decrease in Net Assets From Fund Share Transactions | | | (420,809,355) | | | | (115,548,727) | |
Decrease in Net Assets | | | (367,804,733) | | | | (250,231,609) | |
| | |
| Net Assets: | | | | | | | | |
Beginning of year | | | 1,363,499,949 | | | | 1,613,731,558 | |
End of year(b) | | $ | 995,695,216 | | | $ | 1,363,499,949 | |
| (a) | Distributions from net investment income and from realized gains are no longer required to be separately disclosed (Note 10). For the year ended October 31, 2018, distributions from net investment income and net realized gains were $52,903,212 and $23,417,466, respectively. |
| (b) | Parenthetical disclosure of undistributed net investment income is no longer required (Note 10). For the year ended October 31, 2018, end of year net assets included undistributed net investment income of $2,679,800. |
See Notes to Financial Statements.
| | |
| 24 | | BrandywineGLOBAL — Global Unconstrained Bond Fund 2019 Annual Report |
Financial highlights
| | | | | | | | | | | | | | | | | | | | |
| For a share of each class of beneficial interest outstanding throughout each year ended October 31: | |
| Class A Shares1 | | 2019 | | | 2018 | | | 2017 | | | 2016 | | | 2015 | |
| | | | | |
| Net asset value, beginning of year | | | $11.14 | | | | $12.28 | | | | $11.77 | | | | $11.75 | | | | $13.09 | |
| | | | | |
| Income (loss) from operations: | | | | | | | | | | | | | | | | | | | | |
Net investment income | | | 0.38 | | | | 0.35 | | | | 0.29 | | | | 0.26 | | | | 0.23 | |
Net realized and unrealized gain (loss) | | | 0.14 | | | | (0.92) | | | | 0.35 | | | | 0.12 | | | | (0.87) | |
Total income (loss) from operations | | | 0.52 | | | | (0.57) | | | | 0.64 | | | | 0.38 | | | | (0.64) | |
| | | | | |
| Less distributions from: | | | | | | | | | | | | | | | | | | | | |
Net investment income | | | (0.04) | | | | (0.39) | | | | (0.13) | | | | (0.20) | | | | (0.36) | |
Net realized gains | | | — | | | | (0.18) | | | | — | | | | (0.16) | | | | (0.34) | |
Total distributions | | | (0.04) | | | | (0.57) | | | | (0.13) | | | | (0.36) | | | | (0.70) | |
| | | | | |
| Net asset value, end of year | | | $11.62 | | | | $11.14 | | | | $12.28 | | | | $11.77 | | | | $11.75 | |
Total return2 | | | 4.69 | % | | | (4.84) | % | | | 5.45 | % | | | 3.37 | % | | | (5.05) | % |
| | | | | |
| Net assets, end of year (000s) | | | $29,822 | | | | $67,791 | | | | $126,963 | | | | $363,993 | | | | $478,872 | |
| | | | | |
| Ratios to average net assets: | | | | | | | | | | | | | | | | | | | | |
Gross expenses3 | | | 1.39 | % | | | 1.29 | % | | | 1.35 | % | | | 1.31 | % | | | 1.30 | % |
Net expenses3,4,5 | | | 1.20 | | | | 1.20 | | | | 1.20 | | | | 1.20 | | | | 1.20 | |
Net investment income | | | 3.28 | | | | 2.91 | | | | 2.44 | | | | 2.23 | | | | 1.87 | |
| | | | | |
| Portfolio turnover rate | | | 44 | % | | | 46 | % | | | 62 | % | | | 30 | % | | | 43 | % |
| 1 | Per share amounts have been calculated using the average shares method. |
| 2 | Performance figures, exclusive of sales charges, may reflect compensating balance arrangements, fee waivers and/or expense reimbursements. In the absence of compensating balance arrangements, fee waivers and/or expense reimbursements, the total return would have been lower. Past performance is no guarantee of future results. |
| 3 | Reflects recapture of fees waived and/or expenses reimbursed from prior fiscal years. |
| 4 | As a result of an expense limitation arrangement, the ratio of total annual fund operating expenses, other than interest, brokerage commissions, dividend expenses on short sales, taxes, extraordinary expenses and acquired fund fees and expenses, to average net assets of Class A shares did not exceed 1.20%. This expense limitation arrangement cannot be terminated prior to December 31, 2021 without the Board of Trustees’ consent. |
| 5 | Reflects fee waivers and/or expense reimbursements. |
See Notes to Financial Statements.
| | |
| BrandywineGLOBAL — Global Unconstrained Bond Fund 2019 Annual Report | | 25 |
Financial highlights (cont’d)
| | | | | | | | | | | | | | | | | | | | |
| For a share of each class of beneficial interest outstanding throughout each year ended October 31: | |
| Class C Shares1 | | 2019 | | | 2018 | | | 2017 | | | 2016 | | | 2015 | |
| | | | | |
| Net asset value, beginning of year | | | $11.07 | | | | $12.19 | | | | $11.72 | | | | $11.75 | | | | $13.08 | |
| | | | | |
| Income (loss) from operations: | | | | | | | | | | | | | | | | | | | | |
Net investment income | | | 0.30 | | | | 0.28 | | | | 0.22 | | | | 0.18 | | | | 0.15 | |
Net realized and unrealized gain (loss) | | | 0.15 | | | | (0.91) | | | | 0.33 | | | | 0.13 | | | | (0.85) | |
Total income (loss) from operations | | | 0.45 | | | | (0.63) | | | | 0.55 | | | | 0.31 | | | | (0.70) | |
| | | | | |
| Less distributions from: | | | | | | | | | | | | | | | | | | | | |
Net investment income | | | (0.03) | | | | (0.31) | | | | (0.08) | | | | (0.18) | | | | (0.29) | |
Net realized gains | | | — | | | | (0.18) | | | | — | | | | (0.16) | | | | (0.34) | |
Total distributions | | | (0.03) | | | | (0.49) | | | | (0.08) | | | | (0.34) | | | | (0.63) | |
| | | | | |
| Net asset value, end of year | | | $11.49 | | | | $11.07 | | | | $12.19 | | | | $11.72 | | | | $11.75 | |
Total return2 | | | 4.13 | % | | | (5.46) | % | | | 4.69 | % | | | 2.74 | % | | | (5.56) | % |
| | | | | |
| Net assets, end of year (000s) | | | $3,064 | | | | $5,429 | | | | $8,313 | | | | $10,307 | | | | $15,654 | |
| | | | | |
| Ratios to average net assets: | | | | | | | | | | | | | | | | | | | | |
Gross expenses | | | 1.84 | % | | | 1.83 | % | | | 1.82 | % | | | 1.83 | % | | | 1.81 | %3 |
Net expenses4 | | | 1.84 | 5 | | | 1.83 | | | | 1.82 | 5 | | | 1.83 | | | | 1.81 | 3 |
Net investment income | | | 2.65 | | | | 2.31 | | | | 1.87 | | | | 1.59 | | | | 1.26 | |
| | | | | |
| Portfolio turnover rate | | | 44 | % | | | 46 | % | | | 62 | % | | | 30 | % | | | 43 | % |
| 1 | Per share amounts have been calculated using the average shares method. |
| 2 | Performance figures, exclusive of CDSC, may reflect compensating balance arrangements, fee waivers and/or expense reimbursements. In the absence of compensating balance arrangements, fee waivers and/or expense reimbursements, the total return would have been lower. Past performance is no guarantee of future results. |
| 3 | Reflects recapture of fees waived and/or expenses reimbursed from prior fiscal years. |
| 4 | As a result of an expense limitation arrangement, the ratio of total annual fund operating expenses, other than interest, brokerage commissions, dividend expense on short sales, taxes, extraordinary expenses and acquired fund fees and expenses, to average net assets of Class C shares did not exceed 1.95%. This expense limitation arrangement cannot be terminated prior to December 31, 2021 without the Board of Trustees’ consent. |
| 5 | Reflects fee waivers and/or expense reimbursements. |
See Notes to Financial Statements.
| | |
| 26 | | BrandywineGLOBAL — Global Unconstrained Bond Fund 2019 Annual Report |
| | | | | | | | | | | | | | | | | | | | |
| For a share of each class of beneficial interest outstanding throughout each year ended October 31: | |
| Class C1 Shares1 | | 2019 | | | 2018 | | | 2017 | | | 2016 | | | 2015 | |
| | | | | |
| Net asset value, beginning of year | | | $11.08 | | | | $12.22 | | | | $11.73 | | | | $11.76 | | | | $13.08 | |
| | | | | |
| Income (loss) from operations: | | | | | | | | | | | | | | | | | | | | |
Net investment income | | | 0.33 | | | | 0.31 | | | | 0.25 | | | | 0.20 | | | | 0.17 | |
Net realized and unrealized gain (loss) | | | 0.14 | | | | (0.92) | | | | 0.34 | | | | 0.11 | | | | (0.85) | |
Total income (loss) from operations | | | 0.47 | | | | (0.61) | | | | 0.59 | | | | 0.31 | | | | (0.68) | |
| | | | | |
| Less distributions from: | | | | | | | | | | | | | | | | | | | | |
Net investment income | | | (0.03) | | | | (0.35) | | | | (0.10) | | | | (0.18) | | | | (0.30) | |
Net realized gains | | | — | | | | (0.18) | | | | — | | | | (0.16) | | | | (0.34) | |
Total distributions | | | (0.03) | | | | (0.53) | | | | (0.10) | | | | (0.34) | | | | (0.64) | |
| | | | | |
| Net asset value, end of year | | | $11.52 | | | | $11.08 | | | | $12.22 | | | | $11.73 | | | | $11.76 | |
Total return2 | | | 4.28 | % | | | (5.18) | % | | | 5.04 | % | | | 2.80 | % | | | (5.42) | % |
| | | | | |
| Net assets, end of year (000s) | | | $434 | | | | $1,643 | | | | $2,016 | | | | $2,552 | | | | $3,592 | |
| | | | | |
| Ratios to average net assets: | | | | | | | | | | | | | | | | | | | | |
Gross expenses | | | 1.60 | % | | | 1.56 | % | | | 1.60 | %3 | | | 1.70 | %3 | | | 1.70 | %3 |
Net expenses4 | | | 1.59 | 5 | | | 1.56 | | | | 1.58 | 3,5 | | | 1.70 | 3 | | | 1.70 | 3 |
Net investment income | | | 2.94 | | | | 2.59 | | | | 2.10 | | | | 1.73 | | | | 1.37 | |
| | | | | |
| Portfolio turnover rate | | | 44 | % | | | 46 | % | | | 62 | % | | | 30 | % | | | 43 | % |
| 1 | Per share amounts have been calculated using the average shares method. |
| 2 | Performance figures may reflect compensating balance arrangements, fee waivers and/or expense reimbursements. In the absence of compensating balance arrangements, fee waivers and/or expense reimbursements, the total return would have been lower. Past performance is no guarantee of future results. |
| 3 | Reflects recapture of fees waived and/or expenses reimbursed from prior fiscal years. |
| 4 | As a result of an expense limitation arrangement, the ratio of total annual fund operating expenses, other than interest, brokerage commissions, dividend expense on short sales, taxes, extraordinary expenses and acquired fund fees and expenses, to average net assets of Class C1 shares did not exceed 1.70%. This expense limitation arrangement cannot be terminated prior to December 31, 2021 without the Board of Trustees’ consent. |
| 5 | Reflects fee waivers and/or expense reimbursements. |
See Notes to Financial Statements.
| | |
| BrandywineGLOBAL — Global Unconstrained Bond Fund 2019 Annual Report | | 27 |
Financial highlights (cont’d)
| | | | | | | | | | | | | | | | | | | | |
| For a share of each class of beneficial interest outstanding throughout each year ended October 31: | |
| Class FI Shares1 | | 2019 | | | 2018 | | | 2017 | | | 2016 | | | 2015 | |
| | | | | |
| Net asset value, beginning of year | | | $11.20 | | | | $12.33 | | | | $11.77 | | | | $11.74 | | | | $13.07 | |
| | | | | |
| Income (loss) from operations: | | | | | | | | | | | | | | | | | | | | |
Net investment income | | | 0.42 | | | | 0.36 | | | | 0.30 | | | | 0.27 | | | | 0.24 | |
Net realized and unrealized gain (loss) | | | 0.17 | | | | (0.94) | | | | 0.31 | | | | 0.12 | | | | (0.85) | |
Total income (loss) from operations | | | 0.59 | | | | (0.58) | | | | 0.61 | | | | 0.39 | | | | (0.61) | |
| | | | | |
| Less distributions from: | | | | | | | | | | | | | | | | | | | | |
Net investment income | | | (0.03) | | | | (0.37) | | | | (0.05) | | | | (0.20) | | | | (0.38) | |
Net realized gains | | | — | | | | (0.18) | | | | — | | | | (0.16) | | | | (0.34) | |
Total distributions | | | (0.03) | | | | (0.55) | | | | (0.05) | | | | (0.36) | | | | (0.72) | |
| | | | | |
| Net asset value, end of year | | | $11.76 | | | | $11.20 | | | | $12.33 | | | | $11.77 | | | | $11.74 | |
Total return2 | | | 5.31 | % | | | (4.86) | % | | | 5.18 | % | | | 3.46 | % | | | (4.89) | % |
| | | | | |
| Net assets, end of year (000s) | | | $49 | | | | $128 | | | | $545 | | | | $3,294 | | | | $3,516 | |
| | | | | |
| Ratios to average net assets: | | | | | | | | | | | | | | | | | | | | |
Gross expenses | | | 1.25 | %3 | | | 1.18 | % | | | 1.15 | % | | | 1.14 | % | | | 1.13 | %4 |
Net expenses5 | | | 1.20 | 3,6 | | | 1.18 | | | | 1.15 | | | | 1.14 | | | | 1.13 | 4 |
Net investment income | | | 3.29 | 3 | | | 2.94 | | | | 2.60 | | | | 2.32 | | | | 1.94 | |
| | | | | |
| Portfolio turnover rate | | | 44 | % | | | 46 | % | | | 62 | % | | | 30 | % | | | 43 | % |
| 1 | Per share amounts have been calculated using the average shares method. |
| 2 | Performance figures may reflect compensating balance arrangements, fee waivers and/or expense reimbursements. In the absence of compensating balance arrangements, fee waivers and/or expense reimbursements, the total return would have been lower. Past performance is no guarantee of future results. |
| 3 | Ratios for the year ended October 31, 2019 do not reflect theone-time transfer agent fee adjustment of $306 related to a prior period over accrual. If this adjustment were included, the gross expense, net expense and net investment income ratios for Class FI shares for the year ended October 31, 2019 would have been 0.81%, 0.81%, and 3.68%, respectively. |
| 4 | Reflects recapture of fees waived and/or expenses reimbursed from prior fiscal years. |
| 5 | As a result of an expense limitation arrangement, the ratio of total annual fund operating expenses, other than interest, brokerage commissions, dividend expense on short sales, taxes, extraordinary expenses and acquired fund fees and expenses, to average net assets of Class FI shares did not exceed 1.20%. This expense limitation arrangement cannot be terminated prior to December 31, 2021 without the Board of Trustees’ consent. |
| 6 | Reflects fee waivers and/or expense reimbursements. |
See Notes to Financial Statements.
| | |
| 28 | | BrandywineGLOBAL — Global Unconstrained Bond Fund 2019 Annual Report |
| | | | | | | | | | | | | | | | | | | | |
| For a share of each class of beneficial interest outstanding throughout each year ended October 31: | |
| Class R Shares1 | | 2019 | | | 2018 | | | 2017 | | | 2016 | | | 2015 | |
| | | | | |
| Net asset value, beginning of year | | | $11.12 | | | | $12.27 | | | | $11.79 | | | | $11.80 | | | | $13.13 | |
| | | | | |
| Income (loss) from operations: | | | | | | | | | | | | | | | | | | | | |
Net investment income | | | 0.34 | | | | 0.33 | | | | 0.27 | | | | 0.22 | | | | 0.20 | |
Net realized and unrealized gain (loss) | | | 0.15 | | | | (0.92) | | | | 0.33 | | | | 0.12 | | | | (0.86) | |
Total income (loss) from operations | | | 0.49 | | | | (0.59) | | | | 0.60 | | | | 0.34 | | | | (0.66) | |
| | | | | |
| Less distributions from: | | | | | | | | | | | | | | | | | | | | |
Net investment income | | | (0.03) | | | | (0.38) | | | | (0.12) | | | | (0.19) | | | | (0.33) | |
Net realized gains | | | — | | | | (0.18) | | | | — | | | | (0.16) | | | | (0.34) | |
Total distributions | | | (0.03) | | | | (0.56) | | | | (0.12) | | | | (0.35) | | | | (0.67) | |
| | | | | |
| Net asset value, end of year | | | $11.58 | | | | $11.12 | | | | $12.27 | | | | $11.79 | | | | $11.80 | |
Total return2 | | | 4.43 | % | | | (4.97) | % | | | 5.04 | % | | | 3.03 | % | | | (5.25) | % |
| | | | | |
| Net assets, end of year (000s) | | | $50 | | | | $48 | | | | $12 | | | | $12 | | | | $11 | |
| | | | | |
| Ratios to average net assets: | | | | | | | | | | | | | | | | | | | | |
Gross expenses | | | 1.47 | %3 | | | 1.45 | %3 | | | 2.22 | % | | | 1.58 | %3 | | | 1.56 | %3 |
Net expenses4 | | | 1.45 | 3,5 | | | 1.45 | 3 | | | 1.45 | 5 | | | 1.45 | 3,5 | | | 1.45 | 3,5 |
Net investment income | | | 2.98 | | | | 2.76 | | | | 2.24 | | | | 1.94 | | | | 1.59 | |
| | | | | |
| Portfolio turnover rate | | | 44 | % | | | 46 | % | | | 62 | % | | | 30 | % | | | 43 | % |
| 1 | Per share amounts have been calculated using the average shares method. |
| 2 | Performance figures may reflect compensating balance arrangements, fee waivers and/or expense reimbursements. In the absence of compensating balance arrangements, fee waivers and/or expense reimbursements, the total return would have been lower. Past performance is no guarantee of future results. |
| 3 | Reflects recapture of fees waived and/or expenses reimbursed from prior fiscal years. |
| 4 | As a result of an expense limitation arrangement, the ratio of total annual fund operating expenses, other than interest, brokerage commissions, dividend expense on short sales, taxes, extraordinary expenses and acquired fund fees and expenses, to average net assets of Class R shares did not exceed 1.45%. This expense limitation arrangement cannot be terminated prior to December 31, 2021 without the Board of Trustees’ consent. |
| 5 | Reflects fee waivers and/or expense reimbursements. |
See Notes to Financial Statements.
| | |
| BrandywineGLOBAL — Global Unconstrained Bond Fund 2019 Annual Report | | 29 |
Financial highlights (cont’d)
| | | | | | | | | | | | | | | | | | | | |
| For a share of each class of beneficial interest outstanding throughout each year ended October 31: | |
| Class I Shares1 | | 2019 | | | 2018 | | | 2017 | | | 2016 | | | 2015 | |
| | | | | |
| Net asset value, beginning of year | | | $11.18 | | | | $12.32 | | | | $11.82 | | | | $11.77 | | | | $13.10 | |
| | | | | |
| Income (loss) from operations: | | | | | | | | | | | | | | | | | | | | |
Net investment income | | | 0.41 | | | | 0.40 | | | | 0.35 | | | | 0.30 | | | | 0.27 | |
Net realized and unrealized gain (loss) | | | 0.15 | | | | (0.92) | | | | 0.32 | | | | 0.12 | | | | (0.86) | |
Total income (loss) from operations | | | 0.56 | | | | (0.52) | | | | 0.67 | | | | 0.42 | | | | (0.59) | |
| | | | | |
| Less distributions from: | | | | | | | | | | | | | | | | | | | | |
Net investment income | | | (0.05) | | | | (0.44) | | | | (0.17) | | | | (0.21) | | | | (0.40) | |
Net realized gains | | | — | | | | (0.18) | | | | — | | | | (0.16) | | | | (0.34) | |
Total distributions | | | (0.05) | | | | (0.62) | | | | (0.17) | | | | (0.37) | | | | (0.74) | |
| | | | | |
| Net asset value, end of year | | | $11.69 | | | | $11.18 | | | | $12.32 | | | | $11.82 | | | | $11.77 | |
Total return2 | | | 5.05 | % | | | (4.45) | % | | | 5.70 | % | | | 3.73 | % | | | (4.66) | % |
| | | | | |
| Net assets, end of year (millions) | | | $541 | | | | $729 | | | | $799 | | | | $575 | | | | $633 | |
| | | | | |
| Ratios to average net assets: | | | | | | | | | | | | | | | | | | | | |
Gross expenses3 | | | 0.99 | % | | | 0.93 | % | | | 0.89 | % | | | 0.86 | % | | | 0.86 | % |
Net expenses3,4,5 | | | 0.85 | | | | 0.85 | | | | 0.85 | | | | 0.85 | | | | 0.85 | |
Net investment income | | | 3.60 | | | | 3.31 | | | | 2.86 | | | | 2.59 | | | | 2.22 | |
| | | | | |
| Portfolio turnover rate | | | 44 | % | | | 46 | % | | | 62 | % | | | 30 | % | | | 43 | % |
| 1 | Per share amounts have been calculated using the average shares method. |
| 2 | Performance figures may reflect compensating balance arrangements, fee waivers and/or expense reimbursements. In the absence of compensating balance arrangements, fee waivers and/or expense reimbursements, the total return would have been lower. Past performance is no guarantee of future results. |
| 3 | Reflects recapture of fees waived and/or expenses reimbursed from prior fiscal years. |
| 4 | As a result of an expense limitation arrangement, the ratio of total annual fund operating expenses, other than interest, brokerage commissions, dividend expense on short sales, taxes, extraordinary expenses and acquired fund fees and expenses, to average net assets of Class I shares did not exceed 0.85%. This expense limitation arrangement cannot be terminated prior to December 31, 2021 without the Board of Trustees’ consent. |
| 5 | Reflects fee waivers and/or expense reimbursements. |
See Notes to Financial Statements.
| | |
| 30 | | BrandywineGLOBAL — Global Unconstrained Bond Fund 2019 Annual Report |
| | | | | | | | | | | | | | | | | | | | |
| For a share of each class of beneficial interest outstanding throughout each year ended October 31: | |
| Class IS Shares1 | | 2019 | | | 2018 | | | 2017 | | | 2016 | | | 2015 | |
| | | | | |
| Net asset value, beginning of year | | | $11.20 | | | | $12.35 | | | | $11.84 | | | | $11.78 | | | | $13.11 | |
| | | | | |
| Income (loss) from operations: | | | | | | | | | | | | | | | | | | | | |
Net investment income | | | 0.43 | | | | 0.41 | | | | 0.36 | | | | 0.31 | | | | 0.29 | |
Net realized and unrealized gain (loss) | | | 0.16 | | | | (0.93) | | | | 0.34 | | | | 0.12 | | | | (0.86) | |
Total income (loss) from operations | | | 0.59 | | | | (0.52) | | | | 0.70 | | | | 0.43 | | | | (0.57) | |
| | | | | |
| Less distributions from: | | | | | | | | | | | | | | | | | | | | |
Net investment income | | | (0.06) | | | | (0.45) | | | | (0.19) | | | | (0.21) | | | | (0.42) | |
Net realized gains | | | — | | | | (0.18) | | | | — | | | | (0.16) | | | | (0.34) | |
Total distributions | | | (0.06) | | | | (0.63) | | | | (0.19) | | | | (0.37) | | | | (0.76) | |
| | | | | |
| Net asset value, end of year | | | $11.73 | | | | $11.20 | | | | $12.35 | | | | $11.84 | | | | $11.78 | |
Total return2 | | | 5.26 | % | | | (4.41) | % | | | 5.87 | % | | | 3.85 | % | | | (4.53) | % |
| | | | | |
| Net assets, end of year (millions) | | | $422 | | | | $559 | | | | $677 | | | | $507 | | | | $576 | |
| | | | | |
| Ratios to average net assets: | | | | | | | | | | | | | | | | | | | | |
Gross expenses | | | 0.76 | % | | | 0.73 | % | | | 0.73 | % | | | 0.72 | % | | | 0.72 | %3 |
Net expenses4 | | | 0.75 | 5 | | | 0.73 | | | | 0.73 | | | | 0.72 | | | | 0.72 | 3 |
Net investment income | | | 3.71 | | | | 3.42 | | | | 2.99 | | | | 2.71 | | | | 2.35 | |
| | | | | |
| Portfolio turnover rate | | | 44 | % | | | 46 | % | | | 62 | % | | | 30 | % | | | 43 | % |
| 1 | Per share amounts have been calculated using the average shares method. |
| 2 | Performance figures may reflect compensating balance arrangements, fee waivers and/or expense reimbursements. In the absence of compensating balance arrangements, fee waivers and/or expense reimbursements, the total return would have been lower. Past performance is no guarantee of future results. |
| 3 | Reflects recapture of fees waived and/or expenses reimbursed from prior fiscal years. |
| 4 | As a result of an expense limitation arrangement, the ratio of total annual fund operating expenses, other than interest, brokerage commissions, dividend expense on short sales, taxes, extraordinary expenses and acquired fund fees and expenses, to average net assets of Class IS shares did not exceed 0.75%. In addition, the ratio of total annual fund operating expenses for Class IS shares did not exceed the ratio of total annual fund operating expenses for Class I shares. These expense limitation arrangements cannot be terminated prior to December 31, 2021 without the Board of Trustees’ consent. |
| 5 | Reflects fee waivers and/or expense reimbursements. |
See Notes to Financial Statements.
| | |
| BrandywineGLOBAL — Global Unconstrained Bond Fund 2019 Annual Report | | 31 |
Notes to financial statements
1. Organization and significant accounting policies
BrandywineGLOBAL — Global Unconstrained Bond Fund (the “Fund”) is a separatenon-diversified investment series of Legg Mason Global Asset Management Trust (the “Trust”). The Trust, a Maryland statutory trust, is registered under the Investment Company Act of 1940, as amended (the “1940 Act”), as anopen-end management investment company.
The following are significant accounting policies consistently followed by the Fund and are in conformity with U.S. generally accepted accounting principles (“GAAP”). Estimates and assumptions are required to be made regarding assets, liabilities and changes in net assets resulting from operations when financial statements are prepared. Changes in the economic environment, financial markets and any other parameters used in determining these estimates could cause actual results to differ. Subsequent events have been evaluated through the date the financial statements were issued.
(a) Investment valuation. The valuations for fixed income securities (which may include, but are not limited to, corporate, government, municipal, mortgage-backed, collateralized mortgage obligations and asset-backed securities) and certain derivative instruments are typically the prices supplied by independent third party pricing services, which may use market prices or broker/dealer quotations or a variety of valuation techniques and methodologies. The independent third party pricing services use inputs that are observable such as issuer details, interest rates, yield curves, prepayment speeds, credit risks/spreads, default rates and quoted prices for similar securities. Investments inopen-end funds are valued at the closing net asset value per share of each fund on the day of valuation. Futures contracts are valued daily at the settlement price established by the board of trade or exchange on which they are traded. When the Fund holds securities or other assets that are denominated in a foreign currency, the Fund will normally use the currency exchange rates as of 4:00 p.m. (Eastern Time). If independent third party pricing services are unable to supply prices for a portfolio investment, or if the prices supplied are deemed by the manager to be unreliable, the market price may be determined by the manager using quotations from one or more broker/dealers or at the transaction price if the security has recently been purchased and no value has yet been obtained from a pricing service or pricing broker. When reliable prices are not readily available, such as when the value of a security has been significantly affected by events after the close of the exchange or market on which the security is principally traded, but before the Fund calculates its net asset value, the Fund values these securities as determined in accordance with procedures approved by the Fund’s Board of Trustees.
The Board of Trustees is responsible for the valuation process and has delegated the supervision of the daily valuation process to the Legg Mason North Atlantic Fund Valuation Committee (the “Valuation Committee”). The Valuation Committee, pursuant to the policies adopted by the Board of Trustees, is responsible for making fair value determinations, evaluating the effectiveness of the Fund’s pricing policies, and reporting to the Board of Trustees. When determining the reliability of third party pricing information for investments
| | |
| 32 | | BrandywineGLOBAL — Global Unconstrained Bond Fund 2019 Annual Report |
owned by the Fund, the Valuation Committee, among other things, conducts due diligence reviews of pricing vendors, monitors the daily change in prices and reviews transactions among market participants.
The Valuation Committee will consider pricing methodologies it deems relevant and appropriate when making fair value determinations. Examples of possible methodologies include, but are not limited to, multiple of earnings; discount from market of a similar freely traded security; discounted cash-flow analysis; book value or a multiple thereof; risk premium/yield analysis; yield to maturity; and/or fundamental investment analysis. The Valuation Committee will also consider factors it deems relevant and appropriate in light of the facts and circumstances. Examples of possible factors include, but are not limited to, the type of security; the issuer’s financial statements; the purchase price of the security; the discount from market value of unrestricted securities of the same class at the time of purchase; analysts’ research and observations from financial institutions; information regarding any transactions or offers with respect to the security; the existence of merger proposals or tender offers affecting the security; the price and extent of public trading in similar securities of the issuer or comparable companies; and the existence of a shelf registration for restricted securities.
For each portfolio security that has been fair valued pursuant to the policies adopted by the Board of Trustees, the fair value price is compared against the last available and next available market quotations. The Valuation Committee reviews the results of such back testing monthly and fair valuation occurrences are reported to the Board of Trustees quarterly.
The Fund uses valuation techniques to measure fair value that are consistent with the market approach and/or income approach, depending on the type of security and the particular circumstance. The market approach uses prices and other relevant information generated by market transactions involving identical or comparable securities. The income approach uses valuation techniques to discount estimated future cash flows to present value.
GAAP establishes a disclosure hierarchy that categorizes the inputs to valuation techniques used to value assets and liabilities at measurement date. These inputs are summarized in the three broad levels listed below:
| • | | Level 1 — quoted prices in active markets for identical investments |
| • | | Level 2 — other significant observable inputs (including quoted prices for similar investments, interest rates, prepayment speeds, credit risk, etc.) |
| • | | Level 3 — significant unobservable inputs (including the Fund’s own assumptions in determining the fair value of investments) |
The inputs or methodologies used to value securities are not necessarily an indication of the risk associated with investing in those securities.
| | |
| BrandywineGLOBAL — Global Unconstrained Bond Fund 2019 Annual Report | | 33 |
Notes to financial statements (cont’d)
The following is a summary of the inputs used in valuing the Fund’s assets and liabilities carried at fair value:
| | | | | | | | | | | | | | | | |
| ASSETS | |
| Description | | Quoted Prices
(Level 1) | | | Other Significant
Observable Inputs
(Level 2) | | | Significant
Unobservable
Inputs
(Level 3) | | | Total | |
| Long-Term Investments†: | | | | | | | | | | | | | | | | |
Sovereign Bonds | | | — | | | $ | 397,197,247 | | | | — | | | $ | 397,197,247 | |
Corporate Bonds & Notes | | | — | | | | 349,420,631 | | | | — | | | | 349,420,631 | |
U.S. Government & Agency Obligations | | | — | | | | 202,435,014 | | | | — | | | | 202,435,014 | |
Collateralized Mortgage Obligations | | | — | | | | 12,209,512 | | | | — | | | | 12,209,512 | |
| Total Long-Term Investments | | | — | | | | 961,262,404 | | | | — | | | | 961,262,404 | |
| Short-Term Investments† | | $ | 13,062,430 | | | | — | | | | — | | | | 13,062,430 | |
| Total Investments | | $ | 13,062,430 | | | $ | 961,262,404 | | | | — | | | $ | 974,324,834 | |
| Other Financial Instruments: | | | | | | | | | | | | | | | | |
Futures Contracts | | $ | 6,649,086 | | | | — | | | | — | | | $ | 6,649,086 | |
Forward Foreign Currency Contracts | | | — | | | $ | 8,855,815 | | | | — | | | | 8,855,815 | |
| Total Other Financial Instruments | | $ | 6,649,086 | | | $ | 8,855,815 | | | | — | | | $ | 15,504,901 | |
| Total | | $ | 19,711,516 | | | $ | 970,118,219 | | | | — | | | $ | 989,829,735 | |
|
| LIABILITIES | |
| Description | | Quoted Prices
(Level 1) | | | Other Significant
Observable Inputs
(Level 2) | | | Significant
Unobservable
Inputs
(Level 3) | | | Total | |
| Other Financial Instruments: | | | | | | | | | | | | | | | | |
Forward Foreign Currency | | | | | | | | | | | | | | | | |
Contracts | | | — | | | $ | 8,527,355 | | | | — | | | $ | 8,527,355 | |
| † | See Schedule of Investments for additional detailed categorizations. |
(b) Futures contracts. The Fund uses futures contracts generally to gain exposure to, or hedge against, changes in interest rates or gain exposure to, or hedge against, changes in certain asset classes. A futures contract represents a commitment for the future purchase or sale of an asset at a specified price on a specified date.
Upon entering into a futures contract, the Fund is required to deposit cash or securities with a broker in an amount equal to a certain percentage of the contract amount. This is known as the ‘‘initial margin’’ and subsequent payments (‘‘variation margin’’) are made or received by the Fund each day, depending on the daily fluctuation in the value of the contract. For certain futures, including foreign denominated futures, variation margin is not settled daily,
| | |
| 34 | | BrandywineGLOBAL — Global Unconstrained Bond Fund 2019 Annual Report |
but is recorded as a net variation margin payable or receivable. The daily changes in contract value are recorded as unrealized gains or losses in the Statement of Operations and the Fund recognizes a realized gain or loss when the contract is closed.
Futures contracts involve, to varying degrees, risk of loss in excess of the amounts reflected in the financial statements. In addition, there is the risk that the Fund may not be able to enter into a closing transaction because of an illiquid secondary market.
(c) Forward foreign currency contracts. The Fund enters into a forward foreign currency contract to hedge exposure of bond positions or in an attempt to increase the Fund’s return. A forward foreign currency contract is an agreement between two parties to buy and sell a currency at a set price with delivery and settlement at a future date. The contract ismarked-to-market daily and the change in value is recorded by the Fund as an unrealized gain or loss. When a forward foreign currency contract is closed, through either delivery or offset by entering into another forward foreign currency contract, the Fund recognizes a realized gain or loss equal to the difference between the value of the contract at the time it was opened and the value of the contract at the time it is closed.
Non-deliverable forward foreign currency exchange contracts are settled with the counterparty in cash without the delivery of foreign currency.
Forward foreign currency contracts involve elements of market risk in excess of the amounts reflected on the Statement of Assets and Liabilities. The Fund bears the risk of an unfavorable change in the foreign exchange rate underlying the forward foreign currency contract. Risks may also arise upon entering into these contracts from the potential inability of the counterparties to meet the terms of their contracts.
(d) Foreign currency translation. Investment securities and other assets and liabilities denominated in foreign currencies are translated into U.S. dollar amounts based upon prevailing exchange rates on the date of valuation. Purchases and sales of investment securities and income and expense items denominated in foreign currencies are translated into U.S. dollar amounts based upon prevailing exchange rates on the respective dates of such transactions.
The Fund does not isolate that portion of the results of operations resulting from fluctuations in foreign exchange rates on investments from the fluctuations arising from changes in market prices of securities held. Such fluctuations are included with the net realized and unrealized gain or loss on investments.
Net realized foreign exchange gains or losses arise from sales of foreign currencies, including gains and losses on forward foreign currency contracts, currency gains or losses realized between the trade and settlement dates on securities transactions, and the difference between the amounts of dividends, interest, and foreign withholding taxes recorded on the Fund’s books and the U.S. dollar equivalent of the amounts actually received or paid. Net unrealized foreign exchange gains and losses arise from changes in the values of assets
| | |
| BrandywineGLOBAL — Global Unconstrained Bond Fund 2019 Annual Report | | 35 |
Notes to financial statements (cont’d)
and liabilities, other than investments in securities, on the date of valuation, resulting from changes in exchange rates.
Foreign security and currency transactions may involve certain considerations and risks not typically associated with those of U.S. dollar denominated transactions as a result of, among other factors, the possibility of lower levels of governmental supervision and regulation of foreign securities markets and the possibility of political or economic instability.
(e) Credit and market risk. Investments in securities that are collateralized by real estate mortgages are subject to certain credit and liquidity risks. When market conditions result in an increase in default rates of the underlying mortgages and the foreclosure values of underlying real estate properties are materially below the outstanding amount of these underlying mortgages, collection of the full amount of accrued interest and principal on these investments may be doubtful. Such market conditions may significantly impair the value and liquidity of these investments and may result in a lack of correlation between their credit ratings and values.
The Fund invests in high-yield and emerging market instruments that are subject to certain credit and market risks. The yields of high-yield and emerging market debt obligations reflect, among other things, perceived credit and market risks. The Fund’s investments in securities rated below investment grade typically involve risks not associated with higher rated securities including, among others, greater risk related to timely and ultimate payment of interest and principal, greater market price volatility and less liquid secondary market trading. The consequences of political, social, economic or diplomatic changes may have disruptive effects on the market prices of investments held by the Fund. The Fund’s investments innon-U.S. dollar denominated securities may also result in foreign currency losses caused by devaluations and exchange rate fluctuations.
(f) Foreign investment risks. The Fund’s investments in foreign securities may involve risks not present in domestic investments. Since securities may be denominated in foreign currencies, may require settlement in foreign currencies or pay interest or dividends in foreign currencies, changes in the relationship of these foreign currencies to the U.S. dollar can significantly affect the value of the investments and earnings of the Fund. Foreign investments may also subject the Fund to foreign government exchange restrictions, expropriation, taxation or other political, social or economic developments, all of which affect the market and/or credit risk of the investments.
(g) Counterparty risk and credit-risk-related contingent features of derivative instruments.The Fund may invest in certain securities or engage in other transactions, where the Fund is exposed to counterparty credit risk in addition to broader market risks. The Fund may invest in securities of issuers, which may also be considered counterparties as trading partners in other transactions. This may increase the risk of loss in the event of default or bankruptcy by the counterparty or if the counterparty otherwise fails to meet its contractual obligations. The Fund’s subadviser attempts to mitigate counterparty risk by (i)
| | |
| 36 | | BrandywineGLOBAL — Global Unconstrained Bond Fund 2019 Annual Report |
periodically assessing the creditworthiness of its trading partners, (ii) monitoring and/or limiting the amount of its net exposure to each individual counterparty based on its assessment and (iii) requiring collateral from the counterparty for certain transactions. Market events and changes in overall economic conditions may impact the assessment of such counterparty risk by the subadviser. In addition, declines in the values of underlying collateral received may expose the Fund to increased risk of loss.
With exchange traded and centrally cleared derivatives, there is less counterparty risk to the Fund since the exchange or clearinghouse, as counterparty to such instruments, guarantees against a possible default. The clearinghouse stands between the buyer and the seller of the contract; therefore, the credit risk is limited to failure of the clearinghouse. While offset rights may exist under applicable law, the Fund does not have a contractual right of offset against a clearing broker or clearinghouse in the event of a default of the clearing broker or clearinghouse.
The Fund has entered into master agreements, such as an International Swaps and Derivatives Association, Inc. Master Agreement (“ISDA Master Agreement”) or similar agreement, with certain of its derivative counterparties that governover-the-counter derivatives and provide for general obligations, representations, agreements, collateral posting terms, netting provisions in the event of default or termination and credit related contingent features. The credit related contingent features include, but are not limited to, a percentage decrease in the Fund’s net assets or NAV over a specified period of time. If these credit related contingent features were triggered, the derivatives counterparty could terminate the positions and demand payment or require additional collateral.
Under an ISDA Master Agreement, the Fund may, under certain circumstances, offset with the counterparty certain derivative financial instruments’ payables and/or receivables with collateral held and/or posted and create one single net payment. However, absent an event of default by the counterparty or a termination of the agreement, the terms of the ISDA Master Agreements do not result in an offset of reported amounts of financial assets and financial liabilities in the Statement of Assets and Liabilities across transactions between the Fund and the applicable counterparty. The enforceability of the right to offset may vary by jurisdiction.
Collateral requirements differ by type of derivative. Collateral or margin requirements are set by the broker or exchange clearinghouse for exchange traded derivatives while collateral terms are contract specific forover-the-counter traded derivatives. Cash collateral that has been pledged to cover obligations of the Fund under derivative contracts, if any, will be reported separately in the Statement of Assets and Liabilities. Securities pledged as collateral, if any, for the same purpose are noted in the Schedule of Investments.
As of October 31, 2019, the Fund held forward foreign currency contracts with credit related contingent features which had a liability position of $8,527,355. If a contingent feature in the master agreements would have been triggered, the Fund would have been required to pay this amount to its derivatives counterparties.
| | |
| BrandywineGLOBAL — Global Unconstrained Bond Fund 2019 Annual Report | | 37 |
Notes to financial statements (cont’d)
As of October 31, 2019, the Fund has posted with its counterparties cash and/or securities as collateral to cover the net liability of these derivatives amounting to $1,790,000 which could be used to reduce the required payment.
(h) Security transactions and investment income. Security transactions are accounted for on a trade date basis. Interest income (including interest income frompayment-in-kind securities), adjusted for amortization of premium and accretion of discount, is recorded on the accrual basis. Dividend income is recorded on theex-dividend date for dividends received in cash and/or securities. The cost of investments sold is determined by use of the specific identification method. To the extent any issuer defaults or a credit event occurs that impacts the issuer, the Fund may halt any additional interest income accruals and consider the realizability of interest accrued up to the date of default or credit event.
(i) Distributions to shareholders. Distributions from net investment income of the Fund, if any, are declared and paid on a quarterly basis. Distributions of net realized gains, if any, are declared at least annually. Distributions to shareholders of the Fund are recorded on theex-dividend date and are determined in accordance with income tax regulations, which may differ from GAAP.
(j) Share class accounting. Investment income, common expenses and realized/ unrealized gains (losses) on investments are allocated to the various classes of the Fund on the basis of daily net assets of each class. Fees relating to a specific class are charged directly to that share class.
(k) Compensating balance arrangements. The Fund has an arrangement with its custodian bank whereby a portion of the custodian’s fees is paid indirectly by credits earned on the Fund’s cash on deposit with the bank.
(l) Federal and other taxes. It is the Fund’s policy to comply with the federal income and excise tax requirements of the Internal Revenue Code of 1986 (the “Code”), as amended, applicable to regulated investment companies. Accordingly, the Fund intends to distribute its taxable income and net realized gains, if any, to shareholders in accordance with timing requirements imposed by the Code. Therefore, no federal or state income tax provision is required in the Fund’s financial statements.
Management has analyzed the Fund’s tax positions taken on income tax returns for all open tax years and has concluded that as of October 31, 2019, no provision for income tax is required in the Fund’s financial statements. The Fund’s federal and state income and federal excise tax returns for tax years for which the applicable statutes of limitations have not expired are subject to examination by the Internal Revenue Service and state departments of revenue.
| | |
| 38 | | BrandywineGLOBAL — Global Unconstrained Bond Fund 2019 Annual Report |
Under the applicable foreign tax laws, a withholding tax may be imposed on interest, dividends and capital gains at various rates. Realized gains upon disposition of securities issued in or by certain foreign countries are subject to capital gains tax imposed by those countries.
(m) Reclassification. GAAP requires that certain components of net assets be reclassified to reflect permanent differences between financial and tax reporting. These reclassifications have no effect on net assets or net asset value per share. During the current year, the following reclassifications have been made:
| | | | | | | | |
| | | Total Distributable
Earnings (Loss) | | | Paid-in
Capital | |
| (a) | | $ | 17,810,106 | | | $ | (17,810,106) | |
| (a) | Reclassifications are due to a tax net operating loss and a taxable overdistribution. |
2. Investment management agreement and other transactions with affiliates
Legg Mason Partners Fund Advisor, LLC (“LMPFA”) is the Fund’s investment manager and Brandywine Global Investment Management, LLC (“Brandywine Global”) is the Fund’ssub-adviser. LMPFA and Brandywine Global are wholly-owned subsidiaries of Legg Mason, Inc. (“Legg Mason”).
Under the investment management agreement, the Fund pays an investment management fee, calculated daily and paid monthly, in accordance with the following breakpoint schedule:
| | | | |
| Average Daily Net Assets | | Annual Rate | |
| First $1 billion | | | 0.650 | % |
| Next $1 billion | | | 0.625 | |
| Next $3 billion | | | 0.600 | |
| Next $5 billion | | | 0.575 | |
| Over $10 billion | | | 0.550 | |
LMPFA provides administrative and certain oversight services to the Fund. LMPFA delegates to the subadviser theday-to-day portfolio management of the Fund. LMPFA pays Brandy-wine Global monthly 70% of the net management fee it receives from the Fund.
As a result of expense limitation arrangements between the Fund and LMPFA, the ratio of total annual fund operating expenses, other than interest, brokerage commissions, dividend expense on short sales, taxes, extraordinary expenses and acquired fund fees and expenses, to average net assets of Class A, Class C, Class C1, Class FI, Class R, Class I and Class IS shares did not exceed 1.20%, 1.95%, 1.70%, 1.20%, 1.45%, 0.85% and 0.75%, respectively. In addition, the ratio of total annual fund operating expenses for Class IS shares did not exceed the ratio of total annual fund operating expenses for Class I shares. These expense limitation arrangements cannot be terminated prior to December 31, 2021 without the Board of Trustees’ consent.
| | |
| BrandywineGLOBAL — Global Unconstrained Bond Fund 2019 Annual Report | | 39 |
Notes to financial statements (cont’d)
During the year ended October 31, 2019, fees waived and/or expenses reimbursed amounted to $1,049,549.
LMPFA is permitted to recapture amounts waived and/or reimbursed to a class within three years after the fiscal year in which LMPFA earned the fee or incurred the expense if the class’ total annual operating expenses have fallen to a level below the expense limitation (“expense cap”) in effect at the time the fees were earned or the expenses incurred. In no case will LMPFA recapture any amount that would result, on any particular business day of the Fund, in the class’ total annual operating expenses exceeding the expense cap or any other lower limit then in effect.
Pursuant to these arrangements, at October 31, 2019, the Fund had remaining fee waivers and/or expense reimbursements subject to recapture by LMPFA and respective dates of expiration as follows:
| | | | | | | | | | | | | | | | | | | | | | | | | | | | |
| | | Class A | | | Class C | | | Class C1 | | | Class FI | | | Class R | | | Class I | | | Class IS | |
| Expires October 31, 2020 | | $ | 321,846 | | | | — | | | | — | | | | — | | | $ | 66 | | | $ | 129,719 | | | | — | |
| Expires October 31, 2021 | | | 94,483 | | | | — | | | | — | | | | — | | | | — | | | | 568,795 | | | | — | |
| Expires October 31, 2022 | | | 79,634 | | | $ | 271 | | | $ | 83 | | | $ | 4 | | | | 12 | | | | 929,947 | | | $ | 39,598 | |
| Total fee waivers/ expense reimbursements subject to recapture | | $ | 495,963 | | | $ | 271 | | | $ | 83 | | | $ | 4 | | | $ | 78 | | | $ | 1,628,461 | | | $ | 39,598 | |
For the year ended October 31, 2019, fee waivers and/or expense reimbursements recaptured by LMPFA, if any, were as follows:
| | | | | | | | | | | | |
| | | Class A | | | Class R | | | Class I | |
| LMPFA recaptured | | $ | 163,687 | | | $ | 22 | | | $ | 70,057 | |
Legg Mason Investor Services, LLC (“LMIS”), a wholly-owned broker-dealer subsidiary of Legg Mason, serves as the Fund’s sole and exclusive distributor.
There is a maximum initial sales charge of 2.25% for Class A shares. In certain cases, Class A shares have a 0.50% contingent deferred sales charge (“CDSC”), which applies if redemption occurs within 18 months from purchase payment. This CDSC only applies to those purchases of Class A shares, which, when combined with current holdings of other shares of funds sold by LMIS, equal or exceed $500,000 in the aggregate. These purchases do not incur an initial sales charge. Class C1 shares are not available for purchase by new or existing investors. Class C1 shares will continue to be available for dividend reinvestment and incoming exchanges. There is a CDSC of 1.00% on Class C shares which applies if redemption occurs within 12 months from purchase payment.
| | |
| 40 | | BrandywineGLOBAL — Global Unconstrained Bond Fund 2019 Annual Report |
For the year ended October 31, 2019, sales charges retained by and CDSCs paid to LMIS and its affiliates, if any, were as follows:
| | | | | | | | |
| | | Class A | | | Class C | |
| Sales charges | | $ | 1,855 | | | | — | |
| CDSCs | | | — | | | $ | 176 | |
Under a Deferred Compensation Plan (the “Plan”), Trustees may have elected to defer receipt of all or a specified portion of their compensation. A participating Trustee selected one or more funds managed by affiliates of Legg Mason in which his or her deferred trustee’s fees were deemed to be invested. Deferred amounts remain in the Fund until distributed in accordance with the Plan. In May 2015, the Board of Trustees approved an amendment to the Plan so that effective January 1, 2016, no compensation earned after that date may be deferred under the Plan.
All officers and one Trustee of the Trust are employees of Legg Mason or its affiliates and do not receive compensation from the Trust.
3. Investments
During the year ended October 31, 2019, the aggregate cost of purchases and proceeds from sales of investments (excluding short-term investments) and U.S. Government & Agency Obligations were as follows:
| | | | | | | | |
| | | Investments | | | U.S. Government &
Agency Obligations | |
| Purchases | | $ | 97,257,347 | | | $ | 394,126,830 | |
| Sales | | | 452,682,329 | | | | 457,301,539 | |
At October 31, 2019, the aggregate cost of investments and the aggregate gross unrealized appreciation and depreciation of investments for federal income tax purposes were as follows:
| | | | | | | | | | | | | | | | |
| | | Cost | | | Gross
Unrealized
Appreciation | | | Gross
Unrealized
Depreciation | | | Net
Unrealized
Appreciation
(Depreciation) | |
| Securities | | $ | 999,975,489 | | | $ | 11,473,818 | | | $ | (37,124,473) | | | $ | (25,650,655) | |
| Futures contracts | | | — | | | | 6,649,086 | | | | — | | | | 6,649,086 | |
| Forward foreign currency contracts | | | — | | | | 8,855,815 | | | | (8,527,355) | | | | 328,460 | |
| | |
| BrandywineGLOBAL — Global Unconstrained Bond Fund 2019 Annual Report | | 41 |
Notes to financial statements (cont’d)
4. Derivative instruments and hedging activities
Below is a table, grouped by derivative type, that provides information about the fair value and the location of derivatives within the Statement of Assets and Liabilities at October 31, 2019.
| | | | | | | | | | | | |
ASSET DERIVATIVES1 | |
| | | Interest
Rate Risk | | | Foreign
Exchange Risk | | | Total | |
| Futures contracts2 | | $ | 6,649,086 | | | | — | | | $ | 6,649,086 | |
| Forward foreign currency contracts | | | — | | | $ | 8,855,815 | | | | 8,855,815 | |
| Total | | $ | 6,649,086 | | | $ | 8,855,815 | | | $ | 15,504,901 | |
|
| LIABILITY DERIVATIVES1 | |
| | | | | | | | | Foreign
Exchange Risk | |
| Forward foreign currency contracts | | | | | | | | | | $ | 8,527,355 | |
| 1 | Generally, the balance sheet location for asset derivatives is receivables/net unrealized appreciation (depreciation) and for liability derivatives is payables/net unrealized appreciation (depreciation). |
| 2 | Includes cumulative appreciation (depreciation) of futures contracts as reported in the Schedule of Investments. Only variation margin is reported within the receivables and/or payables on the Statement of Assets and Liabilities. |
The following tables provide information about the effect of derivatives and hedging activities on the Fund’s Statement of Operations for the year ended October 31, 2019. The first table provides additional detail about the amounts and sources of gains (losses) realized on derivatives during the period. The second table provides additional information about the change in unrealized appreciation (depreciation) resulting from the Fund’s derivatives and hedging activities during the period.
| | | | | | | | | | | | |
| AMOUNT OF REALIZED GAIN (LOSS) ON DERIVATIVES RECOGNIZED | |
| | | Interest
Rate Risk | | | Foreign
Exchange Risk | | | Total | |
| Futures contracts | | $ | (35,517,230) | | | | — | | | $ | (35,517,230) | |
| Forward foreign currency contracts | | | — | | | $ | (27,701,614) | | | | (27,701,614) | |
| Total | | $ | (35,517,230) | | | $ | (27,701,614) | | | $ | (63,218,844) | |
|
| CHANGE IN UNREALIZED APPRECIATION (DEPRECIATION) ON DERIVATIVES RECOGNIZED | |
| | | Interest
Rate Risk | | | Foreign
Exchange Risk | | | Total | |
| Futures contracts | | $ | 11,437,060 | | | | — | | | $ | 11,437,060 | |
| Forward foreign currency contracts | | | — | | | $ | 4,655,250 | | | | 4,655,250 | |
| Total | | $ | 11,437,060 | | | $ | 4,655,250 | | | $ | 16,092,310 | |
| | |
| 42 | | BrandywineGLOBAL — Global Unconstrained Bond Fund 2019 Annual Report |
During the year ended October 31, 2019, the volume of derivative activity for the Fund was as follows:
| | | | |
| | | Average Market
Value | |
| Futures contracts (to buy)† | | $ | 157,331,188 | |
| Futures contracts (to sell) | | | 492,254,774 | |
| Forward foreign currency contracts (to buy) | | | 514,170,133 | |
| Forward foreign currency contracts (to sell) | | | 401,994,909 | |
| † | At October 31, 2019, there were no open positions held in this derivative. |
The following table presents the Fund’s OTC derivative assets and liabilities by counterparty net of amounts available for offset under an ISDA Master Agreement and net of the related collateral pledged (received) by the Fund as of October 31, 2019.
| | | | | | | | | | | | | | | | | | | | |
| Counterparty | | Gross Assets
Subject to
Master
Agreements1 | | | Gross
Liabilities
Subject to
Master
Agreements1 | | | Net Assets
(Liabilities)
Subject to
Master
Agreements | | | Collateral
Pledged
(Received)2,3 | | | Net
Amount4,5 | |
| Barclays Bank PLC | | | — | | | $ | (89,760) | | | $ | (89,760) | | | | — | | | $ | (89,760) | |
| Citibank N.A. | | $ | 4,247,526 | | | | (2,883,821) | | | | 1,363,705 | | | | — | | | | 1,363,705 | |
| Goldman Sachs Group Inc. | | | 168,716 | | | | (1,370,743) | | | | (1,202,027) | | | | — | | | | (1,202,027) | |
| HSBC Securities Inc. | | | 1,309,457 | | | | (3,885,443) | | | | (2,575,986) | | | $ | 1,790,000 | | | | (785,986) | |
| JPMorgan Chase & Co. | | | 2,525,376 | | | | (247,766) | | | | 2,277,610 | | | | — | | | | 2,277,610 | |
| Morgan Stanley & Co. Inc. | | | 604,740 | | | | (17,271) | | | | 587,469 | | | | — | | | | 587,469 | |
| UBS Securities LLC | | | — | | | | (32,551) | | | | (32,551) | | | | — | | | | (32,551) | |
| Total | | $ | 8,855,815 | | | $ | (8,527,355) | | | $ | 328,460 | | | $ | 1,790,000 | | | $ | 2,118,460 | |
| 1 | Absent an event of default or early termination, derivative assets and liabilities are presented gross and notoff-set in the Statement of Assets and Liabilities. |
| 2 | Gross amounts are not offset in the Statement of Assets and Liabilities. |
| 3 | In some instances, the actual collateral received and/or pledged may be more than the amount shown here due to overcollateralization. |
| 4 | Net amount may also include forward foreign currency exchange contracts that are not required to be collateralized. |
| 5 | Represents the net amount receivable (payable) from (to) the counterparty in the event of default. |
5. Class specific expenses, waivers and/or expense reimbursements
The Fund has adopted a Rule12b-1 shareholder services and distribution plan and under that plan the Fund pays service and/or distribution fees with respect to its Class A, Class C, Class C1, Class FI and Class R shares calculated at the annual rate of 0.25%, 1.00%, 0.75%, 0.25% and 0.50% of the average daily net assets of each class, respectively. Service and/or distribution fees are accrued daily and paid monthly.
| | |
| BrandywineGLOBAL — Global Unconstrained Bond Fund 2019 Annual Report | | 43 |
Notes to financial statements (cont’d)
For the year ended October 31, 2019, class specific expenses were as follows:
| | | | | | | | |
| | | Service and/or
Distribution Fees | | | Transfer Agent
Fees | |
| Class A | | $ | 103,172 | | | $ | (3,087) | |
| Class C | | | 42,207 | | | | 3,631 | |
| Class C1 | | | 9,744 | | | | 1,224 | |
| Class FI | | | 173 | | | | (132) | |
| Class R | | | 246 | | | | 84 | |
| Class I | | | — | | | | 1,471,568 | |
| Class IS | | | — | | | | 9,979 | |
| Total | | $ | 155,542 | | | $ | 1,483,267 | |
For the year ended October 31, 2019, waivers and/or expense reimbursements by class were as follows:
| | | | |
| | | Waivers/Expense
Reimbursements | |
| Class A | | $ | 79,634 | |
| Class C | | | 271 | |
| Class C1 | | | 83 | |
| Class FI | | | 4 | |
| Class R | | | 12 | |
| Class I | | | 929,947 | |
| Class IS | | | 39,598 | |
| Total | | $ | 1,049,549 | |
6. Distributions to shareholders by class
| | | | | | | | |
| | | Year Ended
October 31, 2019 | | | Year Ended
October 31, 2018 | |
| Net Investment Income: | | | | | | | | |
| Class A | | $ | 208,161 | | | $ | 3,365,288 | |
| Class C | | | 12,250 | | | | 190,256 | |
| Class C1 | | | 4,899 | | | | 53,704 | |
| Class FI | | | 248 | | | | 13,478 | |
| Class R | | | 135 | | | | 1,608 | |
| Class I | | | 3,198,759 | | | | 26,235,751 | |
| Class IS | | | 2,575,608 | | | | 23,043,127 | |
| Total | | $ | 6,000,060 | | | $ | 52,903,212 | |
| | |
| 44 | | BrandywineGLOBAL — Global Unconstrained Bond Fund 2019 Annual Report |
| | | | | | | | |
| | | Year Ended
October 31, 2019 | | | Year Ended
October 31, 2018 | |
| Net Realized Gains: | | | | | | | | |
| Class A | | | — | | | $ | 1,807,965 | |
| Class C | | | — | | | | 121,086 | |
| Class C1 | | | — | | | | 28,684 | |
| Class FI | | | — | | | | 7,565 | |
| Class R | | | — | | | | 747 | |
| Class I | | | — | | | | 11,435,865 | |
| Class IS | | | — | | | | 10,015,554 | |
| Total | | | — | | | $ | 23,417,466 | |
7. Shares of beneficial interest
At October 31, 2019, the Trust had an unlimited number of shares of beneficial interest authorized with a par value of $0.00001 per share. The Fund has the ability to issue multiple classes of shares. Each class of shares represents an identical interest and has the same rights, except that each class bears certain direct expenses, including those specifically related to the distribution of its shares.
Transactions in shares of each class were as follows:
| | | | | | | | | | | | | | | | |
| | | Year Ended
October 31, 2019 | | | Year Ended
October 31, 2018 | |
| | | Shares | | | Amount | | | Shares | | | Amount | |
| Class A | | | | | | | | | | | | | | | | |
| Shares sold | | | 328,506 | | | $ | 3,775,507 | | | | 2,652,009 | | | $ | 32,939,606 | |
| Shares issued on reinvestment | | | 18,389 | | | | 206,146 | | | | 428,979 | | | | 5,114,663 | |
| Shares repurchased | | | (3,867,837) | | | | (43,972,745) | | | | (7,337,011) | | | | (88,320,519) | |
| Net decrease | | | (3,520,942) | | | $ | (39,991,092) | | | | (4,256,023) | | | $ | (50,266,250) | |
| | | | |
| Class C | | | | | | | | | | | | | | | | |
| Shares sold | | | 43,877 | | | $ | 492,466 | | | | 44,359 | | | $ | 535,269 | |
| Shares issued on reinvestment | | | 994 | | | | 11,074 | | | | 23,763 | | | | 280,919 | |
| Shares repurchased | | | (268,843) | | | | (3,054,203) | | | | (259,379) | | | | (3,032,750) | |
| Net decrease | | | (223,972) | | | $ | (2,550,663) | | | | (191,257) | | | $ | (2,216,562) | |
| | | | |
| Class C1 | | | | | | | | | | | | | | | | |
| Shares sold | | | 152 | | | $ | 2,155 | | | | 967 | | | $ | 11,569 | |
| Shares issued on reinvestment | | | 425 | | | | 4,738 | | | | 6,749 | | | | 79,818 | |
| Shares repurchased | | | (111,229) | | | | (1,284,407) | | | | (24,452) | | | | (292,321) | |
| Net decrease | | | (110,652) | | | $ | (1,277,514) | | | | (16,736) | | | $ | (200,934) | |
| | | | |
| Class FI | | | | | | | | | | | | | | | | |
| Shares sold | | | — | | | | — | | | | 1,918 | | | $ | 22,145 | |
| Shares issued on reinvestment | | | 22 | | | $ | 248 | | | | 1,759 | | | | 21,043 | |
| Shares repurchased | | | (7,313) | | | | (83,254) | | | | (36,405) | | | | (426,173) | |
| Net decrease | | | (7,291) | | | $ | (83,006) | | | | (32,728) | | | $ | (382,985) | |
| | |
| BrandywineGLOBAL — Global Unconstrained Bond Fund 2019 Annual Report | | 45 |
Notes to financial statements (cont’d)
| | | | | | | | | | | | | | | | |
| | | Year Ended
October 31, 2019 | | | Year Ended
October 31, 2018 | |
| | | Shares | | | Amount | | | Shares | | | Amount | |
| Class R | | | | | | | | | | | | | | | | |
| Shares sold | | | 21 | | | $ | 241 | | | | 3,103 | | | $ | 37,882 | |
| Shares issued on reinvestment | | | 12 | | | | 135 | | | | 199 | | | | 2,355 | |
| Shares repurchased | | | (2) | | | | (20) | | | | — | | | | — | |
| Net increase | | | 31 | | | $ | 356 | | | | 3,302 | | | $ | 40,237 | |
| | | | |
| Class I | | | | | | | | | | | | | | | | |
| Shares sold | | | 14,598,401 | | | $ | 167,254,068 | | | | 36,697,363 | | | $ | 439,744,794 | |
| Shares issued on reinvestment | | | 213,028 | | | | 2,394,440 | | | | 2,272,863 | | | | 27,051,851 | |
| Shares repurchased | | | (33,828,591) | | | | (386,240,167) | | | | (38,582,225) | | | | (467,827,457) | |
| Net increase (decrease) | | | (19,017,162) | | | $ | (216,591,659) | | | | 388,001 | | | $ | (1,030,812) | |
| | | | |
| Class IS | | | | | | | | | | | | | | | | |
| Shares sold | | | 10,594,368 | | | $ | 121,975,078 | | | | 10,754,737 | | | $ | 130,696,491 | |
| Shares issued on reinvestment | | | 227,360 | | | | 2,560,080 | | | | 2,721,688 | | | | 32,512,718 | |
| Shares repurchased | | | (24,775,014) | | | | (284,850,935) | | | | (18,361,425) | | | | (224,700,630) | |
| Net decrease | | | (13,953,286) | | | $ | (160,315,777) | | | | (4,885,000) | | | $ | (61,491,421) | |
8. Redemption facility
The Fund and certain other participating funds within the Trust (the “Participating Funds”) have available an unsecured revolving credit facility (the “Redemption Facility”) from the lenders and The Bank of New York Mellon (“BNY Mellon”), as administrative agent for the lenders. The Redemption Facility is to be used for temporary or emergency purposes as an additional source of liquidity to fund redemptions of shares. Under the agreement, BNY Mellon provides a364-day revolving credit facility, in the aggregate amount of $190 million. Unless renewed, the agreement will terminate on November 18, 2019. Any borrowings under the Redemption Facility will bear interest at current market rates as set forth in the credit agreement. The annual commitment fee to maintain the Redemption Facility is 0.10% and is incurred on the unused portion of the facility and is allocated to all Participating Funds pro rata based on net assets. For the year ended October 31, 2019, the Fund incurred a commitment fee in the amount of $44,845. The Fund did not utilize the Redemption Facility during the year ended October 31, 2019.
9. Income tax information and distributions to shareholders
The tax character of distributions paid during the fiscal years ended October 31, was as follows:
| | | | | | | | |
| | | 2019 | | | 2018 | |
| Distributions paid from: | | | | | | | | |
| Ordinary income | | $ | 6,000,060 | | | $ | 63,667,338 | |
| Net long-term capital gains | | | — | | | | 12,653,340 | |
| Total distributions paid | | $ | 6,000,060 | | | $ | 76,320,678 | |
| | |
| 46 | | BrandywineGLOBAL — Global Unconstrained Bond Fund 2019 Annual Report |
As of October 31, 2019, the components of accumulated earnings (losses) on a tax basis were as follows:
| | | | |
| Deferred capital losses* | | $ | (88,013,684) | |
| Other book/tax temporary differences(a) | | | (7,697,193) | |
| Unrealized appreciation (depreciation) | | | (18,623,869) | |
| Total accumulated earnings (losses) — net | | $ | (114,334,746) | |
| * | These capital losses have been deferred in the current year as either short-term or long-term losses. The losses will be deemed to occur on the first day of the next taxable year in the same character as they were originally deferred and will be available to offset future taxable capital gains. |
| (a) | Other book/tax temporary differences are attributable to the tax deferral of losses on straddles, the realization for tax purposes of unrealized gains (losses) on certain futures and foreign currency contracts and book/tax differences in the timing of the deductibility of various expenses. |
10. Recent accounting pronouncements
The Fund has adopted the disclosure provisions of the Financial Accounting Standards Board Accounting Standards UpdateNo. 2018-13,Fair Value Measurement (Topic 820)—Disclosure Framework—Changes to the Disclosure Requirements for Fair Value Measurement(“ASU2018-13”) which introduces new fair value disclosure requirements as well as eliminates and modifies certain existing fair value disclosure requirements. ASU2018-13 would be effective for fiscal years beginning after December 15, 2019, and interim periods within those fiscal years; however, management has elected to early adopt ASU2018-13. The impact of the Fund’s adoption was limited to changes in the Fund’s financial statement disclosures regarding fair value, primarily those disclosures related to transfers between levels of the fair value hierarchy.
In August 2018, the Securities and Exchange Commission released its Final Rule on Disclosure Update and Simplification (the “Final Rule”) which is intended to simplify an issuer’s disclosure compliance efforts by removing redundant or outdated disclosure requirements without significantly altering the mix of information provided to investors. Effective with the current reporting period, the Fund adopted the Final Rule with the most notable impacts being that the Fund is no longer required to present the components of distributable earnings on the Statement of Assets and Liabilities or the sources of distributions to shareholders and the amount of undistributed net investment income on the Statements of Changes in Net Assets. The tax components of distributable earnings and distributions to shareholders continue to be disclosed within the Notes to Financial Statements.
11. Subsequent event
Effective November 18, 2019, the Redemption Facility was renewed for a364-day term. Under the agreement, BNY Mellon provides a364-day revolving credit facility, in the aggregate amount of $190 million. Unless renewed, the agreement will terminate on November 16, 2020. Any borrowings under the Redemption Facility will bear interest at current market rates as set forth in the credit agreement. The annual commitment fee to maintain the Redemption Facility is 0.15% and is incurred on the unused portion of the facility and is allocated to all Participating Funds pro rata based on net assets.
| | |
| BrandywineGLOBAL — Global Unconstrained Bond Fund 2019 Annual Report | | 47 |
Report of independent registered public accounting firm
To the Board of Trustees of Legg Mason Global Asset Management Trust and Shareholders of BrandywineGLOBAL — Global Unconstrained Bond Fund
Opinion on the Financial Statements
We have audited the accompanying statement of assets and liabilities, including the schedule of investments, of BrandywineGLOBAL — Global Unconstrained Bond Fund (one of the funds constituting Legg Mason Global Asset Management Trust, referred to hereafter as the “Fund”) as of October 31, 2019, the related statement of operations for the year ended October 31, 2019, the statement of changes in net assets for each of the two years in the period ended October 31, 2019, including the related notes, and the financial highlights for each of the five years in the period ended October 31, 2019 (collectively referred to as the “financial statements”). In our opinion, the financial statements present fairly, in all material respects, the financial position of the Fund as of October 31, 2019, the results of its operations for the year then ended, the changes in its net assets for each of the two years in the period ended October 31, 2019 and the financial highlights for each of the five years in the period ended October 31, 2019 in conformity with accounting principles generally accepted in the United States of America.
Basis for Opinion
These financial statements are the responsibility of the Fund’s management. Our responsibility is to express an opinion on the Fund’s financial statements based on our audits. We are a public accounting firm registered with the Public Company Accounting Oversight Board (United States) (PCAOB) and are required to be independent with respect to the Fund in accordance with the U.S. federal securities laws and the applicable rules and regulations of the Securities and Exchange Commission and the PCAOB.
We conducted our audits of these financial statements in accordance with the standards of the PCAOB. Those standards require that we plan and perform the audit to obtain reasonable assurance about whether the financial statements are free of material misstatement, whether due to error or fraud.
Our audits included performing procedures to assess the risks of material misstatement of the financial statements, whether due to error or fraud, and performing procedures that respond to those risks. Such procedures included examining, on a test basis, evidence regarding the amounts and disclosures in the financial statements. Our audits also included evaluating the accounting principles used and significant estimates made by management, as well as evaluating the overall presentation of the financial statements. Our procedures included confirmation of securities owned as of October 31, 2019 by correspondence with the custodian and brokers; when replies were not received from brokers, we performed other auditing procedures. We believe that our audits provide a reasonable basis for our opinion.
/s/PricewaterhouseCoopers LLP
Baltimore, Maryland
December 18, 2019
We have served as the auditor of one or more investment companies in Legg Mason investment company group since at least 1973. We have not been able to determine the specific year we began serving as auditor.
| | |
| 48 | | BrandywineGLOBAL — Global Unconstrained Bond Fund 2019 Annual Report |
Additional information(unaudited)
Information about Trustees and Officers
The business and affairs of BrandywineGLOBAL — Global Unconstrained Bond Fund (the “Fund”) are conducted by management under the supervision and subject to the direction of its Board of Trustees. The business address of each Trustee is c/o Jane Trust, Legg Mason, 100 International Drive, 11th Floor, Baltimore, Maryland 21202. Information pertaining to the Trustees and officers of the Fund is set forth below.
The Statement of Additional Information includes additional information about Trustees and is available, without charge, upon request by calling the Fund at1-877-721-1926.
| | |
| Independent Trustees† |
|
| Ruby P. Hearn |
| |
| Year of birth | | 1940 |
| Position(s) with Trust | | Trustee |
| Term of office1and length of time served2 | | Since 2004 |
| Principal occupation(s) during the past five years | | Senior Vice President Emerita of The Robert Wood Johnson Foundation(non-profit) (since 2001); Member of the Institute of Medicine (since 1982); formerly, Trustee of the New York Academy of Medicine (2004 to 2012); Director of the Institute for Healthcare Improvement (2002 to 2012); Senior Vice President of The Robert Wood Johnson Foundation (1996 to 2001); Fellow of The Yale Corporation (1992 to 1998) |
| Number of funds in fund complex overseen by Trustee | | 20 |
| Other board memberships held by Trustee during the past five years | | None |
|
| Arnold L. Lehman |
| |
| Year of birth | | 1944 |
| Position(s) with Trust | | Trustee and Chairman |
| Term of office1and length of time served2 | | Since 1982 and since 2015 |
| Principal occupation(s) during the past five years | | Senior Advisor, Phillips (auction house) (since 2015); formerly, Fellow, Ford Foundation (2015 to 2016); Director of the Brooklyn Museum (1997 to 2015) |
| Number of funds in fund complex overseen by Trustee | | 20 |
| Other board memberships held by Trustee during the past five years | | Trustee of American Federation of Arts (since 2002) |
|
| Robin J.W. Masters |
| |
| Year of birth | | 1955 |
| Position(s) with Trust | | Trustee |
| Term of office1and length of time served2 | | Since 2002 |
| Principal occupation(s) during the past five years | | Retired; formerly, Chief Investment Officer of ACE Limited (insurance) (1986 to 2000) |
| Number of funds in fund complex overseen by Trustee | | 20 |
| Other board memberships held by Trustee during the past five years | | Director of Cheyne Capital International Limited (investment advisory firm) (since 2005); formerly, Director/Trustee of Legg Mason Institutional Funds plc, Western Asset Fixed Income Funds plc and Western Asset Debt Securities Fund plc. (2007 to 2011) |
| | |
| BrandywineGLOBAL — Global Unconstrained Bond Fund | | 49 |
Additional information(unaudited) (cont’d)
Information about Trustees and Officers
| | |
| Independent Trustees†cont’d |
|
| Jill E. McGovern |
| |
| Year of birth | | 1944 |
| Position(s) with Trust | | Trustee |
| Term of office1and length of time served2 | | Since 1989 |
| Principal occupation(s) during the past five years | | Senior Consultant, American Institute for Contemporary German Studies (AICGS) (since 2007); formerly, Chief Executive Officer of The Marrow Foundation(non-profit) (1993 to 2007); Executive Director of the Baltimore International Festival (1991 to 1993); Senior Assistant to the President of The Johns Hopkins University (1986 to 1990) |
| Number of funds in fund complex overseen by Trustee | | 20 |
| Other board memberships held by Trustee during the past five years | | Director of International Biomedical Research Alliance (2002 to 2010); Director of Lois Roth Endowment (2005 to 2012) |
|
| Arthur S. Mehlman |
| |
| Year of birth | | 1942 |
| Position(s) with Trust | | Trustee |
| Term of office1and length of time served2 | | Since 2002 |
| Principal occupation(s) during the past five years | | Retired. Director, The University of Maryland Foundation (since 1992); formerly, Director, The League for People with Disabilities (2003 to 2017); Director, Municipal Mortgage & Equity LLC (2004 to 2011); Partner, KPMG LLP (international accounting firm) (1972 to 2002) |
| Number of funds in fund complex overseen by Trustee | | Trustee of all Legg Mason Funds consisting of 20 portfolios; Director/Trustee of the Royce Family of Funds consisting of 22 portfolios |
| Other board memberships held by Trustee during the past five years | | Director of Municipal Mortgage & Equity, LLC. (2004 to 2011) |
|
| G. Peter O’Brien |
| |
| Year of birth | | 1945 |
| Position(s) with Trust | | Trustee |
| Term of office1and length of time served2 | | Since 1999 |
| Principal occupation(s) during the past five years | | Retired. Trustee Emeritus of Colgate University (since 2005); Board Member, Hill House, Inc. (residential home care) (since 1999); formerly, Board Member, Bridges School(pre-school) (2006 to 2017); Managing Director, Equity Capital Markets Group of Merrill Lynch & Co. (1971 to 1999) |
| Number of funds in fund complex overseen by Trustee | | Trustee of all Legg Mason funds consisting of 20 portfolios; Director/Trustee of the Royce Family of Funds consisting of 22 portfolios |
| Other board memberships held by Trustee during the past five years | | Director of TICC Capital Corp. (2003 to 2017) |
| | |
| 50 | | BrandywineGLOBAL — Global Unconstrained Bond Fund |
| | |
| Independent Trustees†cont’d |
|
| S. Ford Rowan |
| |
| Year of birth | | 1943 |
| Position(s) with Trust | | Trustee |
| Term of office1and length of time served2 | | Since 2002 |
| Principal occupation(s) during the past five years | | Consultant to University of Maryland University College (since 2013); formerly, Chairman, National Center for Critical Incident Analysis (2004 to 2018); Lecturer in Organizational Sciences, George Washington University (2000 to 2014); Trustee, St. John’s College (2006 to 2012); Consultant, Rowan & Blewitt Inc. (management consulting) (1984 to 2007); Lecturer in Journalism, Northwestern University (1980 to 1993); Director, Santa Fe Institute (1999 to 2008) |
| Number of funds in fund complex overseen by Trustee | | 20 |
| Other board memberships held by Trustee during the past five years | | None |
|
| Robert M. Tarola |
| |
| Year of birth | | 1950 |
| Position(s) with Trust | | Trustee |
| Term of office1and length of time served2 | | Since 2004 |
| Principal occupation(s) during the past five years | | President of Rights Advisory LLC (corporate finance and governance consulting) (since 2008); Member, Investor Advisory Group of the Public Company Accounting Oversight Board (since 2009); formerly, Chief Financial Officer, Little Company of Mary Hospital and Health Care Centers (healthcare provider network) (2018); Executive Vice President and Chief Financial Officer, Southcoast Health System, Inc. (healthcare provider network) (2015 to 2017); Senior Vice President and Chief Financial Officer of The Howard University (higher education and health care) (2009 to 2013); Senior Vice President and Chief Financial Officer of W.R. Grace & Co. (specialty chemicals) (1999 to 2008) and MedStar Health, Inc. (healthcare) (1996 to 1999); Partner, PriceWaterhouse, LLP (accounting and auditing) (1984 to 1996) |
| Number of funds in fund complex overseen by Trustee | | 20 |
| Other board memberships held by Trustee during the past five years | | Director of American Kidney Fund (renal disease assistance) (since 2008); Director and Board Chair of XBRL International, Inc. (global data standard setting) (since 2015); Director of Vista Outdoor, Inc. (consumer recreation products) (since 2015); formerly, Director of TeleTech Holdings, Inc. (business processing outsourcing) (since 2008) |
| | |
| BrandywineGLOBAL — Global Unconstrained Bond Fund | | 51 |
Additional information(unaudited) (cont’d)
Information about Trustees and Officers
| | |
| Interested Trustee and Officer |
|
| Jane Trust, CFA3 |
| |
| Year of birth | | 1962 |
| Position(s) with Trust | | Trustee, President and Chief Executive Officer |
| Term of office1and length of time served2 | | Since 2015 |
| Principal occupation(s) during the past five years | | Senior Managing Director of Legg Mason & Co., LLC (“Legg Mason & Co.”) (since 2018); Managing Director of Legg Mason & Co. (2016 to 2018); Officer and/or Trustee/Director of 145 funds associated with Legg Mason Partners Fund Advisor, LLC (“LMPFA”) or its affiliates (since 2015); President and Chief Executive Officer of LMPFA (since 2015); formerly, Senior Vice President of LMPFA (2015); Director of ClearBridge, LLC (formerly, Legg Mason Capital Management, LLC) (2007 to 2014); Managing Director of Legg Mason Investment Counsel & Trust Co. (2000 to 2007) |
| Number of funds in fund complex overseen by Trustee | | 136 |
| Other board memberships held by Trustee during the past five years | | None |
| | |
| Additional Officers |
|
Christopher Berarducci* Legg Mason 620 Eighth Avenue, 49th Floor, New York, NY 10018 |
| |
| Year of birth | | 1974 |
| Position(s) with Trust | | Treasurer and Principal Financial Officer |
| Term of office1and length of time served2 | | Since 2010 and 2019 |
| Principal occupation(s) during the past five years | | Treasurer (since 2010) and Principal Financial Officer (since 2019) of certain mutual funds associated with Legg Mason & Co. or its affiliates; Director of Legg Mason & Co. (since 2015); formerly, Vice President of Legg Mason & Co. (2011 to 2015); Assistant Controller of certain mutual funds associated with Legg Mason & Co. or its affiliates (prior to 2010) |
|
Robert I. Frenkel Legg Mason 100 First Stamford Place, 6th Floor, Stamford, CT 06902 |
| |
| Year of birth | | 1954 |
| Position(s) with Trust | | Secretary and Chief Legal Officer |
| Term of office1and length of time served2 | | Since 2007 |
| Principal occupation(s) during the past five years | | Vice President and Deputy General Counsel of Legg Mason, Inc. (since 2006); Managing Director and General Counsel — U.S. Mutual Funds for Legg Mason & Co. (since 2006) and Legg Mason & Co. predecessors (since 1994); Secretary and Chief Legal Officer of certain mutual funds associated with Legg Mason & Co. or its affiliates (since 2006) and Legg Mason & Co. predecessors (prior to 2006) |
| | |
| 52 | | BrandywineGLOBAL — Global Unconstrained Bond Fund |
| | |
| Additional Officers cont’d |
|
Thomas C. Mandia Legg Mason 100 First Stamford Place, 6th Floor, Stamford, CT 06902 |
| |
| Year of birth | | 1962 |
| Position(s) with Trust | | Assistant Secretary |
| Term of office1and length of time served2 | | Since 2007 |
| Principal occupation(s) during the past five years | | Managing Director and Deputy General Counsel of Legg Mason & Co. (since 2005) and Legg Mason & Co. predecessors (prior to 2005); Secretary of LMPFA (since 2006); Assistant Secretary of certain mutual funds associated with Legg Mason & Co. or its affiliates (since 2006) and Legg Mason & Co. predecessors (prior to 2006); Secretary of LM Asset Services, LLC (“LMAS”) (since 2002) and Legg Mason Fund Asset Management, Inc. (“LMFAM”) (since 2013) (formerly registered investment advisers) |
|
Ted P. Becker Legg Mason 620 Eighth Avenue, 49th Floor, New York, NY 10018 |
| |
| Year of birth | | 1951 |
| Position(s) with Trust | | Chief Compliance Officer |
| Term of office1and length of time served2 | | Since 2007 |
| Principal occupation(s) during the past five years | | Director of Global Compliance at Legg Mason (since 2006); Chief Compliance Officer of LMPFA (since 2006); Managing Director of Compliance of Legg Mason & Co. (since 2005); Chief Compliance Officer of certain mutual funds associated with Legg Mason & Co. or its affiliates (since 2006) |
|
Susan Kerr Legg Mason 620 Eighth Avenue, 49th Floor, New York, NY 10018 |
| |
| Year of birth | | 1949 |
| Position(s) with Trust | | Chief Anti-Money Laundering Compliance Officer |
| Term of office1and length of time served2 | | Since 2013 |
| Principal occupation(s) during the past five years | | Assistant Vice President of Legg Mason & Co. and Legg Mason Investor Services, LLC (“LMIS”) (since 2010); Chief Anti-Money Laundering Compliance Officer of certain mutual funds associated with Legg Mason & Co. or its affiliates (since 2013) and Anti-Money Laundering Compliance Officer of LMIS (since 2012); Senior Compliance Officer of LMIS (since 2011); formerly, AML Consultant, DTCC (2010); AML Consultant, Rabobank Netherlands, (2009); First Vice President, Director of Marketing & Advertising Compliance and Manager of Communications Review Group at Citigroup Inc. (1996 to 2008) |
| | |
| BrandywineGLOBAL — Global Unconstrained Bond Fund | | 53 |
Additional information(unaudited) (cont’d)
Information about Trustees and Officers
| | |
| Additional Officers cont’d |
|
Jenna Bailey Legg Mason 100 First Stamford Place, 5th Floor, Stamford, CT 06902 |
| |
| Year of birth | | 1978 |
| Position(s) with Trust | | Identity Theft Prevention Officer |
| Term of office1and length of time served2 | | Since 2015 |
| Principal occupation(s) during the past five years | | Identity Theft Prevention Officer of certain mutual funds associated with Legg Mason & Co. or its affiliates (since 2015); Compliance Officer of Legg Mason & Co. (since 2013); Assistant Vice President of Legg Mason & Co. (since 2011); formerly, Associate Compliance Officer of Legg Mason & Co. (2011 to 2013) |
|
Jeanne M. Kelly Legg Mason 620 Eighth Avenue, 49th Floor, New York, NY 10018 |
| |
| Year of birth | | 1951 |
| Position(s) with Trust | | Senior Vice President |
| Term of office1and length of time served2 | | Since 2007 |
| Principal occupation(s) during the past five years | | Senior Vice President of certain mutual funds associated with Legg Mason & Co. or its affiliates (since 2007); Senior Vice President of LMPFA (since 2006); President and Chief Executive Officer of LMAS and LMFAM (since 2015); Managing Director of Legg Mason & Co. (since 2005) and Legg Mason & Co. predecessors (prior to 2005); formerly, Senior Vice President of LMFAM (2013 to 2015) |
| † | Trustees who are not “interested persons” of the Fund within the meaning of Section 2(a)(19) of the Investment Company Act of 1940, as amended (the “1940 Act”). Each of the Independent Trustees serves on the standing committees of the Board of Trustees, which include the Audit Committee (chair: Arthur S. Mehlman), the Nominating Committee(co-chairs: G. Peter O’Brien and Jill E. McGovern), and the Independent Trustees Committee (chair: Arnold L. Lehman). |
| * | Effective September 27, 2019, Mr. Berarducci became Treasurer and Principal Financial Officer. |
| 1 | Each Trustee and officer serves until his or her respective successor has been duly elected and qualified or until his or her earlier death, resignation, retirement or removal. |
| 2 | Indicates the earliest year in which the Trustee became a board member for a fund in the Legg Mason fund complex or the officer took such office. |
| 3 | Ms. Trust is an “interested person” of the Fund, as defined in the 1940 Act, because of her position with LMPFA and/or certain of its affiliates. |
| | |
| 54 | | BrandywineGLOBAL — Global Unconstrained Bond Fund |
Important tax information(unaudited)
The following information is provided with respect to the distributions paid during the taxable year ended October 31, 2019:
| | | | |
| Record date: | | | 12/19/2018 | |
| Payable date: | | | 12/20/2018 | |
| Interest from Federal Obligations | | | 9.42 | % |
| Foreign Source Income* | | | 75.54 | % |
| Foreign Taxes Paid Per Share | | | $ 0.000652 | |
| * | Expressed as a percentage of the cash distributiongrossed-up for foreign taxes. |
The law varies in each state as to whether and what percentage of dividend income attributable to Federal obligations is exempt from state income tax. We recommend that you consult with your tax adviser to determine if any portion of the dividends you received is exempt from state income taxes.
The foreign taxes paid represent taxes incurred by the Fund on income received by the Fund from foreign sources. Foreign taxes paid may be included in taxable income with an offsetting deduction from gross income or may be taken as a credit for taxes paid to foreign governments. You should consult your tax adviser regarding the appropriate treatment of foreign taxes paid.
Please retain this information for your records.
| | |
| BrandywineGLOBAL — Global Unconstrained Bond Fund | | 55 |
BrandywineGLOBAL—
Global Unconstrained Bond Fund
Trustees
Ruby P. Hearn
Arnold L. Lehman
Chairman
Robin J.W. Masters
Jill E. McGovern
Arthur S. Mehlman
G. Peter O’Brien
S. Ford Rowan
Robert M. Tarola
Jane Trust
Investment manager
Legg Mason Partners Fund Advisor, LLC
Subadviser
Brandywine Global Investment
Management, LLC
Distributor
Legg Mason Investor Services, LLC
Custodian
The Bank of New York Mellon
Transfer agent
BNY Mellon Investment Servicing (US) Inc.
4400 Computer Drive
Westborough, MA 01581
Independent registered public accounting firm
PricewaterhouseCoopers LLP
Baltimore, MD
BrandywineGLOBAL — Global Unconstrained Bond Fund
The Fund is a separate investment series of Legg Mason Global Asset Management Trust, a Maryland statutory trust.
BrandywineGLOBAL — Global Unconstrained Bond Fund
Legg Mason Funds
620 Eighth Avenue, 49th Floor
New York, NY 10018
The Fund files its complete schedule of portfolio holdings with the Securities and Exchange Commission (“SEC”) for the first and third quarters of each fiscal year as an exhibit to its reports on FormN-PORT. Previously, the Fund filed a complete schedule of portfolio holdings with the SEC for the first and third quarters of each fiscal year on FormN-Q. The Fund’s FormsN-PORT andN-Q are available on the SEC’s website at www.sec.gov. To obtain information on FormsN-PORT andN-Q, shareholders can call the Fund at1-877-721-1926.
Information on how the Fund voted proxies relating to portfolio securities during the prior12-month period ended June 30th of each year and a description of the policies and procedures that the Fund uses to determine how to vote proxies related to portfolio transactions are available (1) without charge, upon request, by calling the Fund at1-877-721-1926, (2) at www.leggmason.com/mutualfunds and (3) on the SEC’s website at www.sec.gov.
This report is submitted for the general information of the shareholders of BrandywineGLOBAL — Global Unconstrained Bond Fund. This report is not authorized for distribution to prospective investors in the Fund unless preceded or accompanied by a current prospectus.
Investors should consider the Fund’s investment objectives, risks, charges and expenses carefully before investing. The prospectus contains this and other important information about the Fund. Please read the prospectus carefully before investing.
www.leggmason.com
© 2019 Legg Mason Investor Services, LLC
Member FINRA, SIPC
Legg Mason Funds Privacy and Security Notice
Your Privacy and the Security of Your Personal Information is Very Important to the Legg Mason Funds
This Privacy and Security Notice (the “Privacy Notice”) addresses the Legg Mason Funds’ privacy and data protection practices with respect to nonpublic personal information the Funds receive. The Legg Mason Funds include any funds sold by the Funds’ distributor, Legg Mason Investor Services, LLC, as well as Legg Mason-sponsoredclosed-end funds. The provisions of this Privacy Notice apply to your information both while you are a shareholder and after you are no longer invested with the Funds.
The Type of Nonpublic Personal Information the Funds Collect About You
The Funds collect and maintain nonpublic personal information about you in connection with your shareholder account. Such information may include, but is not limited to:
| • | | Personal information included on applications or other forms; |
| • | | Account balances, transactions, and mutual fund holdings and positions; |
| • | | Bank account information, legal documents, and identity verification documentation; |
| • | | Online account access user IDs, passwords, security challenge question responses; and |
| • | | Information received from consumer reporting agencies regarding credit history and creditworthiness (such as the amount of an individual’s total debt, payment history, etc.). |
How the Funds Use Nonpublic Personal Information About You
The Funds do not sell or share your nonpublic personal information with third parties or with affiliates for their marketing purposes, or with other financial institutions or affiliates for joint marketing purposes, unless you have authorized the Funds to do so. The Funds do not disclose any nonpublic personal information about you except as may be required to perform transactions or services you have authorized or as permitted or required by law. The Funds may disclose information about you to:
| • | | Employees, agents, and affiliates on a “need to know” basis to enable the Funds to conduct ordinary business or to comply with obligations to government regulators; |
| • | | Service providers, including the Funds’ affiliates, who assist the Funds as part of the ordinary course of business (such as printing, mailing services, or processing or servicing your account with us) or otherwise perform services on the Funds’ behalf, including companies that may perform statistical analysis, market research and marketing services solely for the Funds; |
| • | | Permit access to transfer, whether in the United States or countries outside of the United States to such Funds’ employees, agents and affiliates and service providers as required to enable the Funds to conduct ordinary business, or to comply with obligations to government regulators; |
| • | | The Funds’ representatives such as legal counsel, accountants and auditors to enable the Funds to conduct ordinary business, or to comply with obligations to government regulators; |
| • | | Fiduciaries or representatives acting on your behalf, such as an IRA custodian or trustee of a grantor trust. |
|
| NOT PART OF THE ANNUAL REPORT |
Legg Mason Funds Privacy and Security Notice (cont’d)
Except as otherwise permitted by applicable law, companies acting on the Funds’ behalf, including those outside the United States, are contractually obligated to keep nonpublic personal information the Funds provide to them confidential and to use the information the Funds share only to provide the services the Funds ask them to perform.
The Funds may disclose nonpublic personal information about you when necessary to enforce their rights or protect against fraud, or as permitted or required by applicable law, such as in connection with a law enforcement or regulatory request, subpoena, or similar legal process. In the event of a corporate action or in the event a Fund service provider changes, the Funds may be required to disclose your nonpublic personal information to third parties. While it is the Funds’ practice to obtain protections for disclosed information in these types of transactions, the Funds cannot guarantee their privacy policy will remain unchanged.
Keeping You Informed of the Funds’ Privacy and Security Practices
The Funds will notify you annually of their privacy policy as required by federal law. While the Funds reserve the right to modify this policy at any time they will notify you promptly if this privacy policy changes.
The Funds’ Security Practices
The Funds maintain appropriate physical, electronic and procedural safeguards designed to guard your nonpublic personal information. The Funds’ internal data security policies restrict access to your nonpublic personal information to authorized employees, who may use your nonpublic personal information for Fund business purposes only.
Although the Funds strive to protect your nonpublic personal information, they cannot ensure or warrant the security of any information you provide or transmit to them, and you do so at your own risk. In the event of a breach of the confidentiality or security of your nonpublic personal information, the Funds will attempt to notify you as necessary so you can take appropriate protective steps. If you have consented to the Funds using electronic communications or electronic delivery of statements, they may notify you under such circumstances using the most current email address you have on record with them.
In order for the Funds to provide effective service to you, keeping your account information accurate is very important. If you believe that your account information is incomplete, not accurate or not current, if you have questions about the Funds’ privacy practices, or our use of your nonpublic personal information, write the Funds using the contact information on your account statements, email the Funds by clicking on the Contact Us section of the Funds’ website at www.leggmason.com, or contact the Funds at1-877-721-1926.
Revised April 2018
|
| NOT PART OF THE ANNUAL REPORT |
www.leggmason.com
© 2019 Legg Mason Investor Services, LLC Member FINRA, SIPC
LMFX014206 12/19 SR19-3765
The registrant has adopted a code of ethics that applies to the registrant’s principal executive officer, principal financial officer, principal accounting officer or controller.
| ITEM 3. | AUDIT COMMITTEE FINANCIAL EXPERT. |
The Board of Trustees of the registrant has determined that Arthur S. Mehlman the Chairman of the Board’s Audit Committee and Robert M. Tarola, possess the technical attributes identified in Instruction 2(b) of Item 3 to FormN-CSR to qualify as “audit committee financial experts,” and have designated Mr. Mehlman and Mr. Tarola as the Audit Committee’s financial experts. Mr. Mehlman and Mr. Tarola are “independent” Trustees pursuant to paragraph (a) (2) of Item 3 to FormN-CSR.
| ITEM 4. | PRINCIPAL ACCOUNTANT FEES AND SERVICES. |
a)Audit Fees. The aggregate fees billed in the last two fiscal years ending October 31, 2018 and October 31, 2019 (the “Reporting Periods”) for professional services rendered by the Registrant’s principal accountant (the “Auditor”) for the audit of the Registrant’s annual financial statements, or services that are normally provided by the Auditor in connection with the statutory and regulatory filings or engagements for the Reporting Periods, were $190,644 in October 31, 2018 and $208,901 in October 31, 2019.
b)Audit-Related Fees. The aggregate fees billed in the Reporting Period for assurance and related services by the Auditor that are reasonably related to the performance of the Registrant’s financial statements were $0 in October 31, 2018 and $0 in October 31, 2019.
(c)Tax Fees. The aggregate fees billed in the Reporting Periods for professional services rendered by the Auditor for tax compliance, tax advice and tax planning (“Tax Services”) were $0 in October 31, 2018 and $0 in October 31, 2019. These services consisted of (i) review or preparation of U.S. federal, state, local and excise tax returns; (ii) U.S. federal, state and local tax planning, advice and assistance regarding statutory, regulatory or administrative developments, and (iii) tax advice regarding tax qualification matters and/or treatment of various financial instruments held or proposed to be acquired or held.
There were no fees billed for tax services by to the service affiliates during the Reporting Periods that requiredpre-approval by the Audit Auditors Committee.
d)All Other Fees. The aggregate fees for other fees billed in the Reporting Periods for products and services provided by the Auditor were $0 in October 31, 2018 and $0 in October 31, 2019, other than the services reported in paragraphs (a) through (c) of this item for the Legg Mason Global Asset Management Trust.
All Other Fees. There were no othernon-audit services rendered by the Auditor to Legg Mason Partners Fund Advisors, LLC (“LMPFA”), and any entity controlling, controlled by or under common control with LMPFA that provided ongoing services to Legg Mason Global Asset Management Trust requiringpre-approval by the Audit Committee in the Reporting Period.
(e) Audit Committee’s pre–approval policies and procedures described in paragraph (c)
(7) of Rule2-01 of RegulationS-X.
(1) The Charter for the Audit Committee (the “Committee”) of the Board of each registered investment company (the “Fund”) advised by LMPFA or one of their affiliates (each, an “Adviser”) requires that the Committee shall approve (a) all audit and permissiblenon-audit services to be provided to the Fund and (b) all permissiblenon-audit services to be provided by the Fund’s independent auditors to the Adviser and any Covered Service Providers if the engagement relates directly to the operations and financial reporting of the Fund. The Committee may implement policies and procedures by which such services are approved other than by the full Committee.
The Committee shall not approvenon-audit services that the Committee believes may impair the independence of the auditors. As of the date of the approval of this Audit Committee Charter, permissiblenon-audit services include any professional services (including tax services), that are not prohibited services as described below, provided to the Fund by the independent auditors, other than those provided to the Fund in connection with an audit or a review of the financial statements of the Fund. Permissiblenon-audit services may not include: (i) bookkeeping or other services related to the accounting records or financial statements of the Fund; (ii) financial information systems design and implementation; (iii) appraisal or valuation services, fairness opinions orcontribution-in-kind reports; (iv) actuarial services; (v) internal audit outsourcing services; (vi) management functions or human resources; (vii) broker or dealer, investment adviser or investment banking services; (viii) legal services and expert services unrelated to the audit; and (ix) any other service the Public Company Accounting Oversight Board determines, by regulation, is impermissible.
Pre-approval by the Committee of any permissiblenon-audit services is not required so long as: (i) the aggregate amount of all such permissiblenon-audit services provided to the Fund, the Adviser and any service providers controlling, controlled by or under common control with the Adviser that provide ongoing services to the Fund (“Covered Service Providers”) constitutes not more than 5% of the total amount of revenues paid to the independent auditors during the fiscal year in which the permissiblenon-audit services are provided to (a) the Fund, (b) the Adviser and (c) any entity controlling, controlled by or under common control with the Adviser that provides ongoing services to the Fund during the fiscal year in which the services are provided that would have to be approved by the Committee; (ii) the permissiblenon-audit services were not recognized by the Fund at the time of the engagement to benon-audit services; and (iii) such services are promptly brought to the attention of the Committee and approved by the Committee (or its delegate(s)) prior to the completion of the audit.
(2) For the Legg Mason Global Asset Management Trust, the percentage of fees that were approved by the audit committee, with respect to: Audit-Related Fees were 100% and 100% for October 31, 2018 and October 31, 2019; Tax Fees were 100% and 100% for October 31, 2018 and October 31, 2019; and Other Fees were 100% and 100% for October 31, 2018 and October 31, 2019.
(f) N/A
(g)Non-audit fees billed by the Auditor for services rendered to Legg Mason Global Asset Management Trust, LMPFA and any entity controlling, controlled by, or under common control with LMPFA that provides ongoing services to Legg Mason Global Asset Management Trust during the reporting period were $678,000 in October 31, 2018 and $526,116 in October 31, 2019.
(h) Yes. Legg Mason Global Asset Management Trust’s Audit Committee has considered whether the provision ofnon-audit services that were rendered to Service Affiliates, which were notpre-approved (not requiringpre-approval), is compatible with maintaining the Accountant’s independence. All services provided by the Auditor to the Legg Mason Global Asset Management Trust or to Service Affiliates, which were required to bepre-approved, werepre-approved as required.
| ITEM 5. | AUDIT COMMITTEE OF LISTED REGISTRANTS. |
| | a) | The independent board members are acting as the registrant’s audit committee as specified in Section 3(a)(58)(B) of the Exchange Act. The Audit Committee consists of the following Board members: |
Ruby P. Hearn
Arnold L. Lehman
Robin J.W. Masters
Jill E. McGovern
Arthur S. Mehlman
G. Peter O’Brien
S. Ford Rowan
Robert M. Tarola
| ITEM 6. | SCHEDULE OF INVESTMENTS. |
Included herein under Item 1.
| ITEM 7. | DISCLOSURE OF PROXY VOTING POLICIES AND PROCEDURES FORCLOSED-END MANAGEMENT INVESTMENT COMPANIES. |
Not applicable.
| ITEM 8. | PORTFOLIO MANAGERS OFCLOSED-END MANAGEMENT INVESTMENT COMPANIES. |
Not applicable.
| ITEM 9. | PURCHASES OF EQUITY SECURITIES BYCLOSED-END MANAGEMENT INVESTMENT COMPANY AND AFFILIATED PURCHASERS. |
Not applicable.
| ITEM 10. | SUBMISSION OF MATTERS TO A VOTE OF SECURITY HOLDERS. |
Not applicable.
| ITEM 11. | CONTROLS AND PROCEDURES. |
| | (a) | The registrant’s principal executive officer and principal financial officer have concluded that the registrant’s disclosure controls and procedures (as defined in Rule30a- 3(c) under the Investment Company Act of 1940, as amended (the “1940 Act”)) are effective as of a date within 90 days of the filing date of this report that includes the disclosure required by this paragraph, based on their evaluation of the disclosure controls and procedures required by Rule30a-3(b) under the 1940 Act and15d-15(b) under the Securities Exchange Act of 1934. |
| | (b) | There were no changes in the registrant’s internal control over financial reporting (as defined in Rule30a-3(d) under the 1940 Act) that occurred during the second fiscal quarter of the period covered by this report that have materially affected, or are likely to materially affect the registrant’s internal control over financial reporting. |
| ITEM 12. | DISCLOSURE OF SECURITIES LENDING ACTIVITIES FORCLOSED-END MANAGEMENT INVESTMENT COMPANIES. |
Not applicable.
(a) (1) Code of Ethics attached hereto.
(a) (2) Certifications pursuant to section 302 of the Sarbanes-Oxley Act of 2002 attached hereto.
(b) Certifications pursuant to Section 906 of the Sarbanes-Oxley Act of 2002 attached hereto.
SIGNATURES
Pursuant to the requirements of the Securities Exchange Act of 1934 and the Investment Company Act of 1940, the registrant has duly caused this Report to be signed on its behalf by the undersigned, there unto duly authorized.
Legg Mason Global Asset Management Trust
| | |
| By: | | /s/ Jane Trust |
| | Jane Trust |
| | Chief Executive Officer |
| |
| Date: | | December 27, 2019 |
Pursuant to the requirements of the Securities Exchange Act of 1934 and the Investment Company Act of 1940, this report has been signed below by the following persons on behalf of the registrant and in the capacities and on the dates indicated.
| | |
| By: | | /s/ Jane Trust |
| | Jane Trust |
| | Chief Executive Officer |
| |
| Date: | | December 27, 2019 |
| |
| By: | | /s/ Christopher Berarducci |
| | Christopher Berarducci |
| | Principal Financial Officer |
| |
| Date: | | December 27, 2019 |