UNITED STATES
SECURITIES AND EXCHANGE COMMISSION
Washington, D.C. 20549
FORM N-CSR
CERTIFIED SHAREHOLDER REPORT OF REGISTERED
MANAGEMENT INVESTMENT COMPANIES
Investment Company Act file number 811-22338
Legg Mason Global Asset Management Trust
(Exact name of registrant as specified in charter)
620 Eighth Avenue, 47th Floor,
New York, NY 10018
(Address of principal executive offices) (Zip code)
Marc A. De Oliveira,
Legg Mason & Co., LLC
100 First Stamford Place
Stamford, CT 06902
(Name and address of agent for service)
Registrant’s telephone number, including area code: 1-877-721-1926
Date of fiscal year end: September 30
Date of reporting period: September 30, 2020
| ITEM 1. | REPORT TO STOCKHOLDERS |
The Annual Report to Stockholders is filed herewith.

| | |
| Annual Report | | September 30, 2020 |
QS
GLOBAL MARKET NEUTRAL FUND
Beginning in or after March 2021, as permitted by regulations adopted by the Securities and Exchange Commission, the Fund intends to no longer mail paper copies of the Fund’s shareholder reports like this one, unless you specifically request paper copies of the reports from the Fund or from your Service Agent or financial intermediary (such as a broker-dealer or bank). Instead, the reports will be made available on a website, and you will be notified by mail each time a report is posted and provided with a website link to access the report.
If you already elected to receive shareholder reports electronically (“e-delivery”), you will not be affected by this change and you need not take any action. If you have not already elected e-delivery, you may elect to receive shareholder reports and other communications from the Fund electronically by contacting your Service Agent or, if you are a direct shareholder with the Fund, by calling 1-877-721-1926.
You may elect to receive all future reports in paper free of charge. If you invest through a Service Agent, you can contact your Service Agent to request that you continue to receive paper copies of your shareholder reports. That election will apply to all Legg Mason Funds held in your account at that Service Agent. If you are a direct shareholder with the Fund, you can call the Fund at 1-877-721-1926, or write to the Fund by regular mail at Legg Mason Funds, P.O. Box 9699, Providence, RI 02940-9699 or by express, certified or registered mail to Legg Mason Funds, 4400 Computer Drive, Westborough, MA 01581 to let the Fund know you wish to continue receiving paper copies of your shareholder reports. That election will apply to all Legg Mason Funds held in your account held directly with the fund complex.

|
| INVESTMENT PRODUCTS: NOT FDIC INSURED • NO BANK GUARANTEE • MAY LOSE VALUE |
Fund objective
The Fund seeks long-term capital appreciation.
Letter from the president

Dear Shareholder,
We are pleased to provide the annual report of QS Global Market Neutral Fund for the twelve-month reporting period ended September 30, 2020. Please read on for a detailed look at prevailing economic and market conditions during the Fund’s reporting period and to learn how those conditions have affected Fund performance.
Special shareholder notice
On July 31, 2020, Franklin Resources, Inc. (“Franklin Resources”) acquired Legg Mason, Inc. (“Legg Mason”) in an all-cash transaction. As a result of the transaction, Legg Mason Partners Fund Advisor, LLC (“LMPFA”) and the subadviser(s) became indirect, wholly-owned subsidiaries of Franklin Resources. Under the Investment Company Act of 1940, as amended, consummation of the transaction automatically terminated the management and subadvisory agreements that were in place for the Fund prior to the transaction. The Fund’s manager and subadviser(s) continue to provide uninterrupted services with respect to the Fund pursuant to new management and sub advisory agreements that were approved by Fund shareholders.
Franklin Resources, whose principal executive offices are at One Franklin Parkway, San Mateo, California 94403, is a global investment management organization operating, together with its subsidiaries, as Franklin Templeton. As of September 30, 2020, after giving effect to the transaction described above, Franklin Templeton’s asset management operations had aggregate assets under management of approximately $1.4 trillion.
| | |
II | | QS Global Market Neutral Fund |
As always, we remain committed to providing you with excellent service and a full spectrum of investment choices. We also remain committed to supplementing the support you receive from your financial advisor. One way we accomplish this is through our website, www.leggmason.com. Here you can gain immediate access to market and investment information, including:
| • | | Fund prices and performance, |
| • | | Market insights and commentaries from our portfolio managers, and |
| • | | A host of educational resources. |
We look forward to helping you meet your financial goals.
Sincerely,

Jane Trust, CFA
President and Chief Executive Officer
October 30, 2020
| | |
| QS Global Market Neutral Fund | | III |
Fund overview
Q. What is the Fund’s investment strategy?
A. The Fund seeks to provide long-term capital appreciation. The Fund seeks positive returns unrelated to the broad global market by selecting both long and short positions in equity securities from anywhere in the world while applying measures that attempt to control for risk. We at QS Investors, LLC, the Fund’s subadviser, buy equity securities that we consider to be undervalued (“long positions”) and sell short equity securities that we consider to be overvalued (“short positions”). We use quantitative models to select long and short position sizes that we believe will achieve overall market neutrality, thereby attempting to limit the effects of global stock market movements on overall Fund performance. We view market neutrality to mean that the exposure of the long and short positions should offset one another producing a net equity exposure that is approximately +/- 1% under normal market conditions. Because of the Fund’s market neutral strategy, the Fund is intended to have returns that are generally independent of the returns and direction of the global stock market, although there can be no assurance that it will achieve that result.
Under normal market conditions, the Fund will invest primarily in common stocks, preferred stocks, convertible securities, American depositary receipts, global depository receipts, master limited partnerships (MLPs), real estate investment trusts (REITs)i, and securities of other investment companies including exchange-traded funds (ETFs). As a global fund, the Fund can seek investment opportunities anywhere in the world, and under normal market conditions, the Fund will invest in or have exposure to at least three countries, which may include the United States. The Fund may invest without limit in securities in any country, including countries with developed or emerging markets. The Fund may invest in issuers of any market capitalization.
When we deem it to be appropriate, the Fund may enter into various derivative transactions as a principal investment strategy using total return swaps, equity futures, options, warrants, and other similar investments. Derivatives may be used by the Fund as a hedging technique in an attempt to manage risk; as a substitute for buying or selling securities; to provide additional exposure to investment types or market factors; to change the characteristics of the Fund’s portfolio; in an attempt to enhance returns; and to manage cash.
Q. What were the overall market conditions during the Fund’s reporting period?
A. Global equity returns were volatile but positive across most regions and sectors for the twelve-months reporting ended September 30, 2020, despite reaching historical lows in the first quarter of 2020. The MSCI All Country World Index (“MSCI ACWI”)ii returned approximately 10.44% for the reporting period. The positive result was driven in the major markets by the U.S., while Japan was the laggard, with the only negative return among the major markets.
| | |
| QS Global Market Neutral Fund 2020 Annual Report | | 1 |
Fund overview (cont’d)
Global equity markets began the reporting period with a strong fourth quarter of 2019. Despite concerns regarding the softening of global economic growth, the inversion of the U.S. yield curveiii (earlier in 2019), trade related tensions between the U.S. and China, frictions in the Middle East, and uncertainty around Brexit, investors continued to favor global equities. Overall, Chinese equities were the leading performer out of the major global equity regions, driven by the improving prospects of a trade deal with the U.S. The Federal Reserve Board (the “Fed”)iv cut interest rates in October for the third time in 2019 and reduced its expectations of additional rate cuts.
With the rapid spread of COVID-19 in the first quarter of 2020, global equity markets experienced one of the most volatile periods in history, with many regions seeing their largest declines since 2008. The rapid spread of the virus across the globe fueled investors’ “risk off” sentiment, amid mounting concerns regarding global economic growth and public health. By the end of the quarter, governments across the globe were implementing policies to maintain liquidity and support their economies as employment and demand significantly slowed down. In the U.S., the White House and Congress reached a deal on a two trillion-dollar stimulus package (approximately 10% of U.S. GDPv), against the backdrop of the largest ever unemployment claims filed. All regions saw double digit declines. Emerging markets marginally outperformed developed markets, with Chinese equities experiencing a smaller decline.
Positive investor sentiment returned in the second quarter, driven by slowing infection rates across the globe and plans to incrementally reopen major economies (including some U.S. states). Supportive policies from central banks to offset economic decline, including the purchase of government and corporate bonds and keeping interest rates low, was coupled with massive fiscal stimulus such as unemployment benefits and direct payments to consumers. Most major regions, both developed and emerging, experienced double-digit equity gains, led by the U.S. Positive results persisted through August 2020, driven by better-than-expected economic data and positive earnings surprises as well as prospects of a COVID-19 vaccine. Markets pulled back in September 2020 as COVID-19 numbers were surging again, especially in the U.K. and continental Europe, raising the prospect of new lockdowns.
The U.S. equity market was the best performing for the reporting period. The market finished 2019 with a strong final quarter return, propelled by progress in U.S. and China trade discussions and an increasingly dovish Fed stance. In October 2019, the Fed cut interest rates by twenty-five basis pointsvi for the third time in 2019. The first quarter of 2020 brought a decline of almost 20% in the MSCI ACWI, despite a series of moves by the Fed to mitigate the impact of the pandemic. On March 15, it embarked on a large-scale program employing emergency powers in order to stabilize the economy.
U.S. retail sales increased 17% between April 2020 and May 2020 as states began to lift restrictions. This led to a strong recovery in equity markets in the second calendar quarter of 2020, which persisted into the summer. News of a potential treatment for the virus seemed to offset the impact on the markets of a surge in COVID-19 numbers in July 2020
| | |
2 | | QS Global Market Neutral Fund 2020 Annual Report |
and August 2020. August 2020 also saw an increase in manufacturing activity, better-than-expected factory orders and fewer jobless claims, pushing U.S. equity markets as measured by the S&P 500 Indexvii to record highs. In addition, the Fed indicated a shift in approach with respect to inflation, suggesting that interest rates may remain low for longer than expected. September 2020 saw a modest pullback, driven by a rise in COVID-19 cases, delays regarding additional fiscal-stimulus within the U.S., and rising political uncertainty with the upcoming U.S. presidential election.
Continental Europe began by outperforming in the final quarter of 2019 before declining in the first quarter of 2020 when Germany was especially hard hit by the pandemic; it implemented among the strictest coronavirus mitigation measures early on, but as an exports-based economy, it was impacted by a perceived slowing of global demand. In the second quarter of 2020, as countries began to lift lockdown restrictions and the European Central Bank (“ECB”)viii announced a doubling of its monetary stimulus program, Continental Europe outperformed MSCI ACWI overall. Concerns of a second-wave of COVID-19 infections throughout Europe in the final quarter of the reporting period prompted additional fiscal support. In July 2020, the European Union approved a 750 billion euro fund to help member states. However, the flash Euro zone Purchasing Manager’s Composite Index (PMI)ix fell to 50.1 in September 2020, bordering on economic contraction territory. The region underperformed the MSCI ACWI in the final quarter of the reporting period and for the twelve-month reporting period ended September 30, 2020.
While Japan’s return was one of the weakest for the last quarter of 2019, Japan’s first quarter 2020 decline was one of the lowest globally. Despite being one of the first countries outside of China hit by the coronavirus, it was one of least affected among developed nations during the quarter. Returns oscillated significantly throughout the second quarter of 2020; after weakness in early April 2020, the Japanese equity market spiked in May 2020, only to fall again in June 2020. Restrictions on social and business activities due to COVID-19 remained far less restrictive than those seen in Europe. Nevertheless, the Japanese government continued to step up its fiscal response to the crisis and drew up a second supplementary budget in May 2020, and the Bank of Japanx announced additional monetary policy initiatives. Equity performance for the remainder of the period was in line with the benchmark. In September 2020, it was the only large developed country with a positive return, having a smooth leadership transition with expected continuation of fiscal and monetary stimulus policies.
The United Kingdom was the laggard of the MSCI ACWI for the reporting period and the only major market in negative territory. After outperforming other developed markets for the final quarter of 2019, the U.K. was the hardest hit in the first quarter of 2020; a slow start to dealing with COVID-19 created greater uncertainty in its markets for much of that quarter. Similarly, the U.K. had the weakest performance (albeit still positive) for the second quarter of 2020. The U.K. banks (in the Financials sector) represented one of the few sectors globally posting a negative return for that quarter; already leveraged to the economy,
| | |
| QS Global Market Neutral Fund 2020 Annual Report | | 3 |
Fund overview (cont’d)
weakness in banks could also largely be attributed to the cancellation of their dividends in March 2020, a move urged by the Bank of Englandxi. In the final quarter of the reporting period, COVID-19 cases again began to surge sparking fears of new lockdowns, and equity markets pulled back modestly.
Emerging markets equities performed in line with developed markets for the reporting period, despite a period of underperformance in the first quarter of 2020. They began by rallying and outperforming developed markets in the final quarter of 2019. Easing of trade tariff tensions between the U.S. and China boosted performance of the Chinese equity market, which posted a strong gain and outperformed most of its peers. After underperformance in the first quarter of 2020 and despite an acceleration of COVID-19 cases in a number of countries, emerging market equities rallied and outperformed for the remainder of the twelve-month period, benefiting from U.S. dollar weakness.
The smaller regions underperformed the MSCI ACWI and posted a negative return for the reporting period. The resource-based Australia, New Zealand & Canada region declined almost 4% as a result of a dramatic double-digit loss in Financials, and Asia Developed ex-Japan declined 5.4%; less impacted by the downturn, it experienced a similarly weak recovery.
Q. How did we respond to these changing market conditions?
A. Given that our process is designed to limit the effects of global stock market movements on overall fund performance, changing market conditions do not necessitate a change in our process.
Performance review
For the twelve months ended September 30, 2020, Class A shares of QS Global Market Neutral Fund, excluding sales charges, returned -4.04%. The Fund’s unmanaged benchmark, the FTSE 3-Month U.S. Treasury Bill Indexxii, returned 1.02% for the same period. The Lipper Alternative Equity Market Neutral Funds Category Averagexiii returned -6.08% over the same time frame.
| | | | | | | | |
Performance Snapshot as of September 30, 2020
(unaudited) | |
| (excluding sales charges) | | 6 months | | | 12 months | |
| QS Global Market Neutral Fund: | | | | | | | | |
Class A | | | 1.58 | % | | | -4.04 | % |
Class C | | | 1.26 | % | | | -4.52 | % |
Class I | | | 1.80 | % | | | -3.63 | % |
Class IS | | | 1.79 | % | | | -3.54 | % |
| FTSE 3-Month U.S. Treasury Bill Index | | | 0.17 | % | | | 1.02 | % |
| Lipper Alternative Equity Market Neutral Funds Category Average | | | -1.92 | % | | | -6.08 | % |
| | |
4 | | QS Global Market Neutral Fund 2020 Annual Report |
The performance shown represents past performance. Past performance is no guarantee of future results and current performance may be higher or lower than the performance shown above. Principal value and investment returns will fluctuate and investors’ shares, when redeemed, may be worth more or less than their original cost. To obtain performance data current to the most recent month-end, please visit our website at www.leggmason.com/mutualfunds.
All share class returns assume the reinvestment of all distributions at net asset value and the deduction of all Fund expenses. Returns have not been adjusted to include sales charges that may apply or the deduction of taxes that a shareholder would pay on Fund distributions. If sales charges were reflected, the performance quoted would be lower. Performance figures for periods shorter than one year represent cumulative figures and are not annualized.
Fund performance figures reflect fee waivers and/or expense reimbursements, without which the performance would have been lower.
|
| Total Annual Operating Expenses (unaudited) |
As of the Fund’s current prospectus dated February 1, 2020, the gross total annual fund operating expense ratios for Class A, Class C, Class I and Class IS shares were 4.08%, 4.74%, 3.70% and 3.68%, respectively.
Actual expenses may be higher. For example, expenses may be higher than those shown if average net assets decrease. Net assets are more likely to decrease and Fund expense ratios are more likely to increase when markets are volatile.
As a result of expense limitation arrangements, the ratio of total annual fund operating expenses, other than interest, brokerage commissions and expenses, fees, costs and expenses associated with any prime brokerage arrangement (including the costs of any securities borrowing arrangement); dividend and interest expenses on securities sold short, taxes, extraordinary expenses and acquired fund fees and expenses, to average net assets will not exceed 1.55% for Class A shares, 2.30% for Class C shares, 1.20% for Class I shares and 1.10% for Class IS shares. In addition, the ratio of total annual fund operating expenses for Class IS shares will not exceed the ratio of total annual fund operating expenses for Class I shares. Total annual fund operating expenses after waiving fees and/or reimbursing expenses exceed the expense cap for each class as a result of acquired fund fees and expenses and dividend and interest expenses on securities sold short. These expense limitation arrangements cannot be terminated prior to December 31, 2021 without the Board of Trustees’ consent.
The manager is permitted to recapture amounts waived and/or reimbursed to a class within three years after the fiscal year in which the manager earned the fee or incurred the expense if the class’ total annual fund operating expenses have fallen to a level below the expense limitation (“expense cap”) in effect at the time the fees were earned or the expenses incurred. In no case will the manager recapture any amount that would result, on any particular business day of the Fund, in the class’ total annual fund operating expenses exceeding the expense cap or any other lower limit then in effect.
| | |
| QS Global Market Neutral Fund 2020 Annual Report | | 5 |
Fund overview (cont’d)
Q. What were the leading contributors to performance?
A. The leading contributor to performance at the regional level was stock selection within the UK. Stock selection in the U.S. contributed as well. Across sectors, performance was positive in Financials, Industrials and Energy, where having short positions in names like Diamondback Energy, Occidental Petroleum, Oneok, and Targa Resources had a positive contribution to performance; they were down over 70%. The sentiment and valuation dimensions are components of our stock selection model. The stock selection model had positive performance in the sentiment dimension (including earnings’ growth, analysts’ expectations and momentum), where companies with positive earnings expectations and strong price momentum performed well, and those with weak outlooks performed poorly. The second quarter of 2020 had strong model and portfolio performance, reversing the trend seen in the first half of the last twelve-month reporting period.
Q. What were the leading detractors from performance?
A. Stock selection in Japan was a leading detractor from performance at the regional level for the reporting period. Weak performance across the Communication Services sector, where short positions in names like SoftBank, Line Corp and Konami Holdings, which were up over 30%, had a negative impact, as did holdings in the non-bank portion of Financials and Information Technology. The stock selection model had weak performance in the valuation dimension (including value and cash flow) of the model, where many of the factors had double-digit negative performance. The first quarter of 2020 was the worst performing quarter in the last twelve-month reporting period.
Q. Were there any significant changes to the Fund during the reporting period?
A. There were no significant changes to the Fund during the period.
Thank you for your investment in QS Global Market Neutral Fund. As always, we appreciate that you have chosen us to manage your assets and we remain focused on achieving the Fund’s investment goals.
Sincerely,
QS Investors, LLC
October 30, 2020
RISKS: Equity securities are subject to market and price fluctuations. Small- and mid-cap stocks involve greater risks and volatility than large-cap stocks. Foreign investments are subject to special risks including currency fluctuations and social, economic and political uncertainties, which could increase volatility. These risks are magnified in emerging markets. Emerging market countries tend to have economic, political, and legal systems that are less developed and are less stable than those of more developed countries. The Fund uses short positions in combination with long positions in a market neutral strategy to try to neutralize exposure to the global stock market and capture a positive return, regardless of the direction of the market. The Fund’s market neutral strategy may result in greater losses or lower positive returns than if the Fund held only long positions. Although the subadviser’s models were created to improve performance and to reduce overall portfolio risk, there is no guarantee that these models and the Fund’s market neutral strategy will be successful. The overall performance of the Fund depends
| | |
6 | | QS Global Market Neutral Fund 2020 Annual Report |
on the net performance of its long and short positions, and it is possible for the Fund to experience a net loss across all positions. The Fund may employ leverage, which increases the volatility of investment returns and subjects the Fund to magnified losses if the Fund’s investments decline in value. The Fund may use derivatives, such as options and futures, which can be illiquid, may disproportionately increase losses, and have a potentially large impact on Fund performance. The Fund may employ short selling, a speculative strategy. Unlike the possible loss on a security that is purchased, there is no limit on the amount of loss on an appreciating security that is sold short. There is no assurance strategies used by the Fund will be successful. Active and frequent trading may increase a shareholder’s tax liability and transaction costs, which could detract from Fund performance. Some assets held by the Fund may be impossible or difficult to sell, particularly during times of market turmoil. These illiquid assets may also be difficult to value. If the Fund is forced to sell an illiquid asset to meet redemption requests or other cash needs, the Fund may be forced to sell at a loss. There can be no assurance that the Fund will engage in hedging transactions at any given time, even under volatile market conditions, or that any hedging transactions the Fund engages in will be successful. Hedging transactions involve costs and may reduce gains or result in losses. Additional risks may include those risks associated with REITs, MLPs and investing in securities issued by other investment companies, including ETFs. Please see the Fund’s prospectus for a more complete discussion of these and other risks and the Fund’s investment strategies.
Portfolio holdings and breakdowns are as of September 30, 2020 and are subject to change and may not be representative of the portfolio managers’ current or future investments. The Fund’s top ten holdings (as a percentage of net assets) as of September 30, 2020 were: IR Japan Holdings Ltd. (0.8%), Meritage Homes Corp. (0.8%), Signify NV (0.7%), PulteGroup Inc. (0.7%), Sanwa Holdings Corp. (0.7%), Veeva Systems Inc. (0.7%), Deckers Outdoor Corp. (0.7%), Humana Inc. (0.7%), NVIDIA Corp. (0.7%) and Nomura Research Institute Ltd. (0.7%). Please refer to pages 15 through 35 for a list and percentage breakdown of the Fund’s holdings.
The mention of sector breakdowns is for informational purposes only and should not be construed as a recommendation to purchase or sell any securities. The information provided regarding such sectors is not a sufficient basis upon which to make an investment decision. Investors seeking financial advice regarding the appropriateness of investing in any securities or investment strategies discussed should consult their financial professional. The Fund’s top five sector holdings (as a percentage of net assets) as of September 30, 2020 were: Industrials (15.1%), Information Technology (13.2 %), Consumer Discretionary (12.3%), Financials (11.9%) and Health Care (8.3%). The Fund’s portfolio composition is subject to change at any time.
All investments are subject to risk including the possible loss of principal. Past performance is no guarantee of future results. All index performance reflects no deduction for fees, expenses or taxes. Please note that an investor cannot invest directly in an index.
The information provided is not intended to be a forecast of future events, a guarantee of future results or investment advice. Views expressed may differ from those of the firm as a whole.
| | |
| QS Global Market Neutral Fund 2020 Annual Report | | 7 |
Fund overview (cont’d)
| i | Real estate investment trusts (“REITs”) invest in real estate or loans secured by real estate and issue shares in such investments, which can be illiquid. |
| ii | The MSCI All Country World Index (“MSCI ACWI”) a market capitalization weighted index that is designed to measure the equity market performance of developed and emerging markets. The MSCI ACWI consists of 45 country indices comprising 24 developed and 21 emerging market country indices. |
| iii | The yield curve is the graphical depiction of the relationship between the yield on bonds of the same credit quality but different maturities. |
| iv | The Federal Reserve Board (the “Fed”) is responsible for the formulation of U.S. policies designed to promote economic growth, full employment, stable prices and a sustainable pattern of international trade and payments. |
| v | Gross domestic product (“GDP”) is the market value of all final goods and services produced within a country in a given period of time. |
| vi | A basis point is one-hundredth (1/100 or 0.01) of one percent. |
| vii | The S&P 500 Index is an unmanaged index of the stocks of 500 leading companies and is generally representative of the performance of larger companies in the U.S. |
| viii | The European Central Bank (“ECB”) is responsible for the monetary system of the European Union and the euro currency. |
| ix | The Purchasing Managers’ Index (PMI) is an index of the prevailing direction of economic trends in the manufacturing and service sectors. It consists of a diffusion index that summarizes whether market conditions, as viewed by purchasing managers, are expanding, staying the same, or contracting. |
| x | The Bank of Japan is the central bank of Japan. The bank is responsible for issuing and handling currency and treasury securities, implementing monetary policy, maintaining the stability of the Japanese financial system and the yen currency. |
| xi | The Bank of England (“BoE”), formally the Governor and Company of the BoE, is the central bank of the United Kingdom. The BoE’s purpose is to maintain monetary and financial stability. |
| xii | The FTSE 3-Month U.S. Treasury Bill Index is an unmanaged index generally representative of the average yield of 3-month U.S. Treasury bills. |
| xiii | Lipper, Inc., a wholly-owned subsidiary of Reuters, provides independent insight on global collective investments. Returns are based on the period ended September 30, 2020, including the reinvestment of all distributions, including returns of capital, if any, calculated among the 64 funds for the six-month period and among the 62 funds for the twelve-month period in the Fund’s Lipper category, and excluding sales charges, if any. |
| | |
8 | | QS Global Market Neutral Fund 2020 Annual Report |
Fund at a glance (unaudited)
Investment breakdown† (%) as a percent of total investments
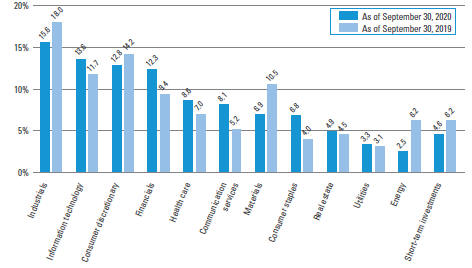
| † | The bar graph above represents the composition of the Fund’s investments as of September 30, 2020 and September 30, 2019 and does not include derivatives, such as forward foreign currency contracts. The Fund is actively managed. As a result, the composition of the Fund’s investments is subject to change at any time. |
Securities sold short breakdown* (%) as a percent of total securities sold short
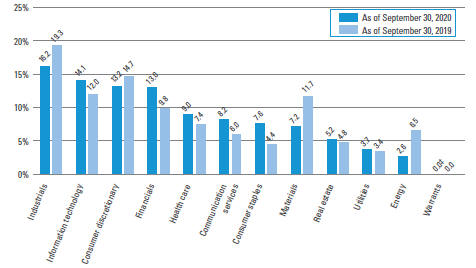
| * | The bar graph above represents the composition of the Fund’s investments sold short as of September 30, 2020 and September 30, 2019 and does not include derivatives. The Fund is actively managed. As a result, the composition of the Fund’s investments is subject to change at any time. |
| ‡ | Represents less than 0.1%. |
| | |
| QS Global Market Neutral Fund 2020 Annual Report | | 9 |
Fund expenses (unaudited)
Example
As a shareholder of the Fund, you may incur two types of costs: (1) transaction costs, including front-end and back-end sales charges (loads) on purchase payments; and (2) ongoing costs, including management fees; service and/or distribution (12b-1) fees; and other Fund expenses. This example is intended to help you understand your ongoing costs (in dollars) of investing in the Fund and to compare these costs with the ongoing costs of investing in other mutual funds.
This example is based on an investment of $1,000 invested on April 1, 2020 and held for the six months ended September 30, 2020.
Actual expenses
The table below titled “Based on Actual Total Return” provides information about actual account values and actual expenses. You may use the information provided in this table, together with the amount you invested, to estimate the expenses that you paid over the period. To estimate the expenses you paid on your account, divide your ending account value by $1,000 (for example, an $8,600 ending account value divided by $1,000 = 8.6), then multiply the result by the number under the heading entitled “Expenses Paid During the Period”.
Hypothetical example for comparison purposes
The table below titled “Based on Hypothetical Total Return” provides information about hypothetical account values and hypothetical expenses based on the actual expense ratio and an assumed rate of return of 5.00% per year before expenses, which is not the Fund’s actual return. The hypothetical account values and expenses may not be used to estimate the actual ending account balance or expenses you paid for the period. You may use the information provided in this table to compare the ongoing costs of investing in the Fund and other funds. To do so, compare the 5.00% hypothetical example relating to the Fund with the 5.00% hypothetical examples that appear in the shareholder reports of the other funds.
Please note that the expenses shown in the table below are meant to highlight your ongoing costs only and do not reflect any transactional costs, such as front-end or back-end sales charges (loads). Therefore, the table is useful in comparing ongoing costs only, and will not help you determine the relative total costs of owning different funds. In addition, if these transaction costs were included, your costs would have been higher.
| | | | | | | | | | | | | | | | | | | | | | | | | | | | | | | | | | | | | | | | | | | | | | |
| | | |
| Based on actual total return1 | | | | | | | | | Based on hypothetical total return1 | |
| | | Actual
Total Return
Without
Sales
Charge2 | | | Beginning
Account
Value | | | Ending
Account
Value | | | Annualized
Expense
Ratio | | | Expenses
Paid
During
the
Period3 | | | | | | | | Hypothetical
Annualized
Total Return | | | Beginning
Account
Value | | | Ending
Account
Value | | | Annualized
Expense
Ratio | | | Expenses
Paid
During
the
Period3 | |
| Class A | | | 1.58 | % | | $ | 1,000.00 | | | $ | 1,015.80 | | | | 3.05 | % | | $ | 15.37 | | | | | | | Class A | | | 5.00 | % | | $ | 1,000.00 | | | $ | 1,009.75 | | | | 3.05 | % | | $ | 15.32 | |
| Class C | | | 1.26 | | | | 1,000.00 | | | | 1,012.60 | | | | 3.67 | | | | 18.47 | | | | | | | Class C | | | 5.00 | | | | 1,000.00 | | | | 1,006.65 | | | | 3.67 | | | | 18.41 | |
| Class I | | | 1.80 | | | | 1,000.00 | | | | 1,018.00 | | | | 2.63 | | | | 13.27 | | | | | | | Class I | | | 5.00 | | | | 1,000.00 | | | | 1,011.85 | | | | 2.63 | | | | 13.23 | |
| Class IS | | | 1.79 | | | | 1,000.00 | | | | 1,017.90 | | | | 2.59 | | | | 13.07 | | | | | | | Class IS | | | 5.00 | | | | 1,000.00 | | | | 1,012.05 | | | | 2.59 | | | | 13.03 | |
| | |
10 | | QS Global Market Neutral Fund 2020 Annual Report |
| 1 | For the six months ended September 30, 2020. |
| 2 | Assumes the reinvestment of all distributions, including returns of capital, if any, at net asset value and does not reflect the deduction of the applicable sales charge with respect to Class A shares or the applicable contingent deferred sales charge (“CDSC”) with respect to Class C shares. Total return is not annualized, as it may not be representative of the total return for the year. Performance figures may reflect compensating balance arrangements, fee waivers and/or expense reimbursements. In the absence of compensating balance arrangements, fee waivers and/or expense reimbursements, the total return would have been lower. Past performance is no guarantee of future results. |
| 3 | Expenses (net of compensating balance arrangements, fee waivers and/or expense reimbursements) are equal to each class’ respective annualized expense ratio multiplied by the average account value over the period, multiplied by the number of days in the most recent fiscal half-year (183), then divided by 366. |
| | |
| QS Global Market Neutral Fund 2020 Annual Report | | 11 |
Fund performance (unaudited)
| | | | | | | | | | | | | | | | |
| Average annual total returns | | | | | | | | | | | | |
| Without sales charges1 | | Class A | | | Class C | | | Class I | | | Class IS | |
| Twelve Months Ended 9/30/20 | | | -4.04 | % | | | -4.52 | % | | | -3.63 | % | | | -3.54 | % |
| Inception* through 9/30/20 | | | -1.59 | | | | -4.80 | | | | -1.27 | | | | -1.20 | |
| | | | |
| With sales charges2 | | Class A | | | Class C | | | Class I | | | Class IS | |
| Twelve Months Ended 9/30/20 | | | -9.53 | % | | | -5.48 | % | | | -3.63 | % | | | -3.54 | % |
| Inception* through 9/30/20 | | | -2.78 | | | | -4.80 | | | | -1.27 | | | | -1.20 | |
| | | | |
| Cumulative total returns | |
| Without sales charges1 | | | |
| Class A (Inception date of 11/30/15 through 9/30/20) | | | -7.44 | % |
| Class C (Inception date of 7/16/18 through 9/30/20) | | | -10.29 | |
| Class I (Inception date of 11/30/15 through 9/30/20) | | | -5.98 | |
| Class IS (Inception date of 11/30/15 through 9/30/20) | | | -5.68 | |
All figures represent past performance and are not a guarantee of future results. Investment return and principal value of an investment will fluctuate so that an investor’s shares, when redeemed, may be worth more or less than their original cost. The returns shown do not reflect the deduction of taxes that a shareholder would pay on Fund distributions or the redemption of Fund shares. Performance figures may reflect compensating balance arrangements, fee waivers and/or expense reimbursements. In the absence of compensating balance arrangements, fee waivers and/or expense reimbursements, the total return would have been lower.
| 1 | Assumes the reinvestment of all distributions, including returns of capital, if any, at net asset value and does not reflect the deduction of the applicable sales charge with respect to Class A shares or the applicable contingent deferred sales charge (“CDSC”) with respect to Class C shares. |
| 2 | Assumes the reinvestment of all distributions, including returns of capital, if any, at net asset value. In addition, Class A shares reflect the deduction of the maximum initial sales charge of 5.75%. Class C shares reflect the deduction of a 1.00% CDSC, which applies if shares are redeemed within one year from purchase payment. |
| * | Inception date for Class A, I and IS shares is November 30, 2015 and for Class C is July 16, 2018. |
| | |
12 | | QS Global Market Neutral Fund 2020 Annual Report |
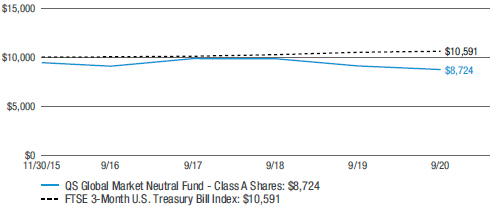
Historical performance
Value of $10,000 invested in
Class A Shares of QS Global Market Neutral Fund vs. FTSE 3-Month U.S. Treasury Bill Index† — November 30, 2015 - September 30, 2020
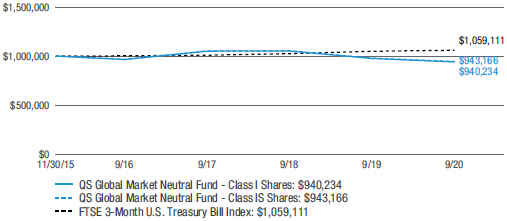
Value of $1,000,000 invested in
Class I and IS Shares of QS Global Market Neutral Fund vs. FTSE 3-Month U.S. Treasury Bill Index† —November 30, 2015 - September 30, 2020
All figures represent past performance and are not a guarantee of future results. Investment return and principal value of an investment will fluctuate so that an investor’s shares, when redeemed, may be worth more or less than their original cost. The returns shown do not reflect the deduction of taxes that a shareholder would pay on Fund distributions or the redemption of Fund shares. Performance figures may reflect compensating balance arrangements, fee waivers and/or expense reimbursements. In the absence of compensating balance arrangements, fee waivers and/or expense reimbursements, the total return would have been lower.
| | |
| QS Global Market Neutral Fund 2020 Annual Report | | 13 |
Fund performance (unaudited) (cont’d)
| † | Hypothetical illustration of $10,000 invested in Class A shares and $1,000,000 invested in Class I and IS shares of QS Global Market Neutral Fund on November 30, 2015 (inception date), assuming the deduction of the maximum initial sales charge of 5.75% at the time of investment for Class A shares and the reinvestment of all distributions, including returns of capital, if any, at net asset value through September 30, 2020. The hypothetical illustration also assumes a $10,000 or $1,000,000 investment, as applicable, in the FTSE 3-Month U.S. Treasury Bill Index. The FTSE 3-Month U.S. Treasury Bill Index (the “Index”) is an unmanaged market index generally representative of the average yield of 3-month U.S. Treasury bills. The Index is unmanaged and not subject to the same management and trading expenses as a mutual fund. Please note that an investor cannot invest directly in an index. The performance of the Fund’s other class may be greater or less than the Class A, I and IS shares’ performance indicated on these charts, depending on whether greater or lesser sales charges and fees were incurred by shareholders investing in the other class. |
| | |
14 | | QS Global Market Neutral Fund 2020 Annual Report |
Schedule of investments
September 30, 2020
QS Global Market Neutral Fund
| | | | | | | | | | | | | | | | |
| Security | | | | | | | | Shares | | | Value | |
| Common Stocks — 92.3% | | | | | | | | | | | | | | | | |
| Communication Services — 7.9% | | | | | | | | | | | | | | | | |
Diversified Telecommunication Services — 0.9% | | | | | | | | | | | | | | | | |
Altice Europe NV | | | | | | | | | | | 43,800 | | | $ | 209,771 | *(a) |
Nippon Telegraph & Telephone Corp. | | | | | | | | | | | 7,800 | | | | 159,581 | (a) |
Orange SA | | | | | | | | | | | 17,700 | | | | 184,178 | (a) |
Total Diversified Telecommunication Services | | | | | | | | | | | | | | | 553,530 | |
Entertainment — 3.4% | | | | | | | | | | | | | | | | |
Activision Blizzard Inc. | | | | | | | | | | | 2,600 | | | | 210,470 | (b) |
Electronic Arts Inc. | | | | | | | | | | | 2,645 | | | | 344,934 | *(b) |
G5 Entertainment AB | | | | | | | | | | | 3,423 | | | | 143,015 | (a) |
Nexon Co. Ltd. | | | | | | | | | | | 8,500 | | | | 211,096 | (a) |
Nintendo Co. Ltd. | | | | | | | | | | | 400 | | | | 227,392 | (a) |
Take-Two Interactive Software Inc. | | | | | | | | | | | 2,000 | | | | 330,440 | *(b) |
Vivendi SA | | | | | | | | | | | 7,400 | | | | 206,254 | (a) |
Zynga Inc., Class A Shares | | | | | | | | | | | 30,700 | | | | 279,984 | *(b) |
Total Entertainment | | | | | | | | | | | | | | | 1,953,585 | |
Interactive Media & Services — 1.4% | | | | | | | | | | | | | | | | |
Cargurus Inc. | | | | | | | | | | | 9,300 | | | | 201,159 | *(b) |
Dip Corp. | | | | | | | | | | | 13,800 | | | | 283,570 | (a) |
Rightmove PLC | | | | | | | | | | | 38,300 | | | | 308,282 | (a) |
Total Interactive Media & Services | | | | | | | | | | | | | | | 793,011 | |
Media — 1.5% | | | | | | | | | | | | | | | | |
Criteo SA, ADR | | | | | | | | | | | 22,600 | | | | 275,494 | *(b) |
ITV PLC | | | | | | | | | | | 375,000 | | | | 325,373 | (a) |
Nippon Television Holdings Inc. | | | | | | | | | | | 26,200 | | | | 281,708 | (a) |
Total Media | | | | | | | | | | | | | | | 882,575 | |
Wireless Telecommunication Services — 0.7% | | | | | | | | | | | | | | | | |
KDDI Corp. | | | | | | | | | | | 5,700 | | | | 144,187 | (a) |
NTT DOCOMO Inc. | | | | | | | | | | | 6,800 | | | | 252,175 | (a) |
Total Wireless Telecommunication Services | | | | | | | | | | | | | | | 396,362 | |
Total Communication Services | | | | | | | | | | | | | | | 4,579,063 | |
| Consumer Discretionary — 12.3% | | | | | | | | | | | | | | | | |
Auto Components — 0.3% | | | | | | | | | | | | | | | | |
Magna International Inc. | | | | | | | | | | | 4,000 | | | | 183,035 | |
Hotels, Restaurants & Leisure — 0.7% | | | | | | | | | | | | | | | | |
Betsson AB | | | | | | | | | | | 34,000 | | | | 261,141 | (a) |
Kindred Group PLC | | | | | | | | | | | 20,000 | | | | 145,295 | (a) |
Total Hotels, Restaurants & Leisure | | | | | | | | | | | | | | | 406,436 | |
Household Durables — 3.1% | | | | | | | | | | | | | | | | |
Berkeley Group Holdings PLC | | | | | | | | | | | 3,600 | | | | 195,855 | (a) |
See Notes to Financial Statements.
| | |
| QS Global Market Neutral Fund 2020 Annual Report | | 15 |
Schedule of investments (cont’d)
September 30, 2020
QS Global Market Neutral Fund
| | | | | | | | | | | | | | | | |
| Security | | | | | | | | Shares | | | Value | |
Household Durables — continued | | | | | | | | | | | | | | | | |
Forbo Holding AG, Registered Shares | | | | | | | | | | | 125 | | | $ | 204,772 | (a) |
Lennar Corp., Class A Shares | | | | | | | | | | | 2,400 | | | | 196,032 | (b) |
Meritage Homes Corp. | | | | | | | | | | | 4,100 | | | | 452,599 | *(b) |
PulteGroup Inc. | | | | | | | | | | | 9,200 | | | | 425,868 | (b) |
Sekisui House Ltd. | | | | | | | | | | | 19,700 | | | | 348,409 | (a) |
Total Household Durables | | | | | | | | | | | | | | | 1,823,535 | |
Internet & Direct Marketing Retail — 1.4% | | | | | | | | | | | | | | | | |
boohoo Group PLC | | | | | | | | | | | 78,400 | | | | 378,298 | *(a) |
HelloFresh SE | | | | | | | | | | | 7,200 | | | | 403,295 | *(a) |
Total Internet & Direct Marketing Retail | | | | | | | | | | | | | | | 781,593 | |
Leisure Products — 0.3% | | | | | | | | | | | | | | | | |
Sankyo Co. Ltd. | | | | | | | | | | | 6,700 | | | | 175,609 | (a) |
Multiline Retail — 2.8% | | | | | | | | | | | | | | | | |
B&M European Value Retail SA | | | | | | | | | | | 31,000 | | | | 197,248 | (a) |
Dollar General Corp. | | | | | | | | | | | 1,000 | | | | 209,620 | (b) |
Dollarama Inc. | | | | | | | | | | | 5,400 | | | | 206,989 | |
Izumi Co. Ltd. | | | | | | | | | | | 7,200 | | | | 262,386 | (a) |
Next PLC | | | | | | | | | | | 5,200 | | | | 398,518 | (a) |
Target Corp. | | | | | | | | | | | 2,400 | | | | 377,808 | (b) |
Total Multiline Retail | | | | | | | | | | | | | | | 1,652,569 | |
Specialty Retail — 2.4% | | | | | | | | | | | | | | | | |
AutoZone Inc. | | | | | | | | | | | 140 | | | | 164,870 | *(b) |
Best Buy Co. Inc. | | | | | | | | | | | 3,573 | | | | 397,639 | (b) |
JD Sports Fashion PLC | | | | | | | | | | | 24,600 | | | | 257,449 | (a) |
Lowe’s Cos. Inc. | | | | | | | | | | | 1,450 | | | | 240,497 | (b) |
Tractor Supply Co. | | | | | | | | | | | 2,351 | | | | 336,992 | (b) |
Total Specialty Retail | | | | | | | | | | | | | | | 1,397,447 | |
Textiles, Apparel & Luxury Goods — 1.3% | | | | | | | | | | | | | | | | |
Deckers Outdoor Corp. | | | | | | | | | | | 1,900 | | | | 418,019 | *(b) |
Pandora A/S | | | | | | | | | | | 4,900 | | | | 352,599 | (a) |
Total Textiles, Apparel & Luxury Goods | | | | | | | | | | | | | | | 770,618 | |
Total Consumer Discretionary | | | | | | | | | | | | | | | 7,190,842 | |
| Consumer Staples — 6.6% | | | | | | | | | | | | | | | | |
Beverages — 0.9% | | | | | | | | | | | | | | | | |
Constellation Brands Inc., Class A Shares | | | | | | | | | | | 940 | | | | 178,139 | (b) |
Monster Beverage Corp. | | | | | | | | | | | 4,100 | | | | 328,820 | *(b) |
Total Beverages | | | | | | | | | | | | | | | 506,959 | |
Food & Staples Retailing — 2.8% | | | | | | | | | | | | | | | | |
George Weston Ltd. | | | | | | | | | | | 3,000 | | | | 220,592 | |
Kesko oyj, Class B Shares | | | | | | | | | | | 8,100 | | | | 208,848 | (a) |
See Notes to Financial Statements.
| | |
16 | | QS Global Market Neutral Fund 2020 Annual Report |
QS Global Market Neutral Fund
| | | | | | | | | | | | | | | | |
| Security | | | | | | | | Shares | | | Value | |
Food & Staples Retailing — continued | | | | | | | | | | | | | | | | |
Koninklijke Ahold Delhaize NV | | | | | | | | | | | 12,200 | | | $ | 361,067 | (a) |
Lawson Inc. | | | | | | | | | | | 3,600 | | | | 171,505 | (a) |
Loblaw Cos. Ltd. | | | | | | | | | | | 3,400 | | | | 178,050 | |
Seven & i Holdings Co. Ltd. | | | | | | | | | | | 5,600 | | | | 173,113 | (a) |
Sprouts Farmers Market Inc. | | | | | | | | | | | 15,800 | | | | 330,694 | *(b) |
Total Food & Staples Retailing | | | | | | | | | | | | | | | 1,643,869 | |
Food Products — 1.7% | | | | | | | | | | | | | | | | |
a2 Milk Co. Ltd. | | | | | | | | | | | 26,500 | | | | 269,901 | *(a) |
Calbee Inc. | | | | | | | | | | | 5,400 | | | | 178,020 | (a) |
Premier Foods PLC | | | | | | | | | | | 131,600 | | | | 156,478 | *(a) |
Viscofan SA | | | | | | | | | | | 5,450 | | | | 363,570 | (a) |
Total Food Products | | | | | | | | | | | | | | | 967,969 | |
Tobacco — 1.2% | | | | | | | | | | | | | | | | |
Scandinavian Tobacco Group A/S | | | | | | | | | | | 21,800 | | | | 323,213 | (a) |
Swedish Match AB | | | | | | | | | | | 4,800 | | | | 391,622 | (a) |
Total Tobacco | | | | | | | | | | | | | | | 714,835 | |
Total Consumer Staples | | | | | | | | | | | | | | | 3,833,632 | |
| Energy — 2.5% | | | | | | | | | | | | | | | | |
Energy Equipment & Services — 0.3% | | | | | | | | | | | | | | | | |
Tecnicas Reunidas SA | | | | | | | | | | | 15,300 | | | | 163,538 | *(a) |
Oil, Gas & Consumable Fuels — 2.2% | | | | | | | | | | | | | | | | |
Cosmo Energy Holdings Co. Ltd. | | | | | | | | | | | 16,900 | | | | 241,866 | (a) |
ENEOS Holdings Inc. | | | | | | | | | | | 97,500 | | | | 348,167 | (a) |
Euronav NV | | | | | | | | | | | 27,400 | | | | 242,378 | (a) |
Inpex Corp. | | | | | | | | | | | 26,500 | | | | 141,768 | (a) |
Lundin Energy AB | | | | | | | | | | | 8,850 | | | | 175,290 | (a) |
Seven Generations Energy Ltd., Class A Shares | | | | | | | | | | | 45,000 | | | | 121,325 | * |
Total Oil, Gas & Consumable Fuels | | | | | | | | | | | | | | | 1,270,794 | |
Total Energy | | | | | | | | | | | | | | | 1,434,332 | |
| Financials — 11.9% | | | | | | | | | | | | | | | | |
Banks — 3.3% | | | | | | | | | | | | | | | | |
Aozora Bank Ltd. | | | | | | | | | | | 12,000 | | | | 199,418 | (a) |
Bank of Nova Scotia | | | | | | | | | | | 4,200 | | | | 174,491 | |
BAWAG Group AG | | | | | | | | | | | 8,800 | | | | 317,168 | *(a) |
Citigroup Inc. | | | | | | | | | | | 3,600 | | | | 155,196 | (b) |
Citizens Financial Group Inc. | | | | | | | | | | | 14,200 | | | | 358,976 | (b) |
Comerica Inc. | | | | | | | | | | | 4,600 | | | | 175,950 | (b) |
Huntington Bancshares Inc. | | | | | | | | | | | 20,700 | | | | 189,819 | (b) |
See Notes to Financial Statements.
| | |
| QS Global Market Neutral Fund 2020 Annual Report | | 17 |
Schedule of investments (cont’d)
September 30, 2020
QS Global Market Neutral Fund
| | | | | | | | | | | | | | | | |
| Security | | | | | | | | Shares | | | Value | |
Banks — continued | | | | | | | | | | | | | | | | |
ING Groep NV | | | | | | | | | | | 24,100 | | | $ | 170,649 | *(a) |
Yamaguchi Financial Group Inc. | | | | | | | | | | | 31,200 | | | | 203,460 | (a) |
Total Banks | | | | | | | | | | | | | | | 1,945,127 | |
Capital Markets — 0.9% | | | | | | | | | | | | | | | | |
Banca Generali SpA | | | | | | | | | | | 5,000 | | | | 151,917 | *(a) |
Investec PLC | | | | | | | | | | | 95,500 | | | | 175,615 | (a) |
Man Group PLC | | | | | | | | | | | 123,882 | | | | 184,067 | (a) |
Total Capital Markets | | | | | | | | | | | | | | | 511,599 | |
Consumer Finance — 0.3% | | | | | | | | | | | | | | | | |
Synchrony Financial | | | | | | | | | | | 7,300 | | | | 191,041 | (b) |
Diversified Financial Services — 1.0% | | | | | | | | | | | | | | | | |
M&G PLC | | | | | | | | | | | 104,000 | | | | 212,854 | (a) |
Plus500 Ltd. | | | | | | | | | | | 17,000 | | | | 343,474 | (a) |
Total Diversified Financial Services | | | | | | | | | | | | | | | 556,328 | |
Insurance — 5.3% | | | | | | | | | | | | | | | | |
ASR Nederland NV | | | | | | | | | | | 6,200 | | | | 208,527 | (a) |
Aviva PLC | | | | | | | | | | | 105,000 | | | | 386,104 | (a) |
Direct Line Insurance Group PLC | | | | | | | | | | | 100,000 | | | | 348,092 | (a) |
Helvetia Holding AG, Registered Shares | | | | | | | | | | | 2,900 | | | | 246,161 | (a) |
Japan Post Insurance Co. Ltd. | | | | | | | | | | | 22,000 | | | | 346,152 | (a) |
Legal & General Group PLC | | | | | | | | | | | 76,600 | | | | 185,642 | (a) |
Manulife Financial Corp. | | | | | | | | | | | 26,000 | | | | 361,624 | |
MetLife Inc. | | | | | | | | | | | 6,612 | | | | 245,768 | (b) |
NN Group NV | | | | | | | | | | | 4,600 | | | | 172,784 | (a) |
SCOR SE | | | | | | | | | | | 7,900 | | | | 218,884 | *(a) |
T&D Holdings Inc. | | | | | | | | | | | 35,000 | | | | 346,140 | (a) |
Total Insurance | | | | | | | | | | | | | | | 3,065,878 | |
Thrifts & Mortgage Finance — 1.1% | | | | | | | | | | | | | | | | |
First National Financial Corp. | | | | | | | | | | | 12,500 | | | | 300,496 | |
Genworth MI Canada Inc. | | | | | | | | | | | 7,400 | | | | 191,898 | |
MGIC Investment Corp. | | | | | | | | | | | 17,700 | | | | 156,822 | (b) |
Total Thrifts & Mortgage Finance | | | | | | | | | | | | | | | 649,216 | |
Total Financials | | | | | | | | | | | | | | | 6,919,189 | |
| Health Care — 8.3% | | | | | | | | | | | | | | | | |
Biotechnology — 0.9% | | | | | | | | | | | | | | | | |
Pharma Mar SA | | | | | | | | | | | 1,750 | | | | 221,137 | (a) |
Regeneron Pharmaceuticals Inc. | | | | | | | | | | | 500 | | | | 279,890 | *(b) |
Total Biotechnology | | | | | | | | | | | | | | | 501,027 | |
See Notes to Financial Statements.
| | |
18 | | QS Global Market Neutral Fund 2020 Annual Report |
QS Global Market Neutral Fund
| | | | | | | | | | | | | | | | |
| Security | | | | | | | | Shares | | | Value | |
Health Care Equipment & Supplies — 0.8% | | | | | | | | | | | | | | | | |
Hologic Inc. | | | | | | | | | | | 4,600 | | | $ | 305,762 | *(b) |
Nanosonics Ltd. | | | | | | | | | | | 38,000 | | | | 156,490 | *(a) |
Total Health Care Equipment & Supplies | | | | | | | | | | | | | | | 462,252 | |
Health Care Providers & Services — 3.1% | | | | | | | | | | | | | | | | |
Cardinal Health Inc. | | | | | | | | | | | 6,600 | | | | 309,870 | (b) |
Chemed Corp. | | | | | | | | | | | 735 | | | | 353,057 | (b) |
Galenica AG | | | | | | | | | | | 2,500 | | | | 174,250 | (a) |
Humana Inc. | | | | | | | | | | | 1,000 | | | | 413,890 | (b) |
McKesson Corp. | | | | | | | | | | | 2,057 | | | | 306,349 | (b) |
Molina Healthcare Inc. | | | | | | | | | | | 1,500 | | | | 274,560 | *(b) |
Total Health Care Providers & Services | | | | | | | | | | | | | | | 1,831,976 | |
Health Care Technology — 0.7% | | | | | | | | | | | | | | | | |
Veeva Systems Inc., Class A Shares | | | | | | | | | | | 1,500 | | | | 421,785 | *(b) |
Life Sciences Tools & Services — 0.6% | | | | | | | | | | | | | | | | |
ICON PLC | | | | | | | | | | | 1,700 | | | | 324,853 | *(b) |
Pharmaceuticals — 2.2% | | | | | | | | | | | | | | | | |
Hikma Pharmaceuticals PLC | | | | | | | | | | | 8,200 | | | | 274,648 | (a) |
Kaken Pharmaceutical Co. Ltd. | | | | | | | | | | | 5,100 | | | | 234,180 | (a) |
Novo Nordisk A/S, Class B Shares | | | | | | | | | | | 4,300 | | | | 298,686 | (a) |
Orion oyj, Class B Shares | | | | | | | | | | | 6,658 | | | | 301,314 | (a) |
Shionogi & Co. Ltd. | | | | | | | | | | | 3,700 | | | | 197,954 | (a) |
Total Pharmaceuticals | | | | | | | | | | | | | | | 1,306,782 | |
Total Health Care | | | | | | | | | | | | | | | 4,848,675 | |
| Industrials — 15.1% | | | | | | | | | | | | | | | | |
Aerospace & Defense — 1.1% | | | | | | | | | | | | | | | | |
Lockheed Martin Corp. | | | | | | | | | | | 800 | | | | 306,624 | (b) |
Northrop Grumman Corp. | | | | | | | | | | | 600 | | | | 189,294 | (b) |
Ultra Electronics Holdings PLC | | | | | | | | | | | 5,700 | | | | 153,556 | (a) |
Total Aerospace & Defense | | | | | | | | | | | | | | | 649,474 | |
Building Products — 1.1% | | | | | | | | | | | | | | | | |
Masco Corp. | | | | | | | | | | | 3,500 | | | | 192,955 | (b) |
Sanwa Holdings Corp. | | | | | | | | | | | 40,000 | | | | 424,333 | (a) |
Total Building Products | | | | | | | | | | | | | | | 617,288 | |
Commercial Services & Supplies — 1.0% | | | | | | | | | | | | | | | | |
G4S PLC | | | | | | | | | | | 95,500 | | | | 246,489 | *(a) |
Ritchie Bros Auctioneers Inc. | | | | | | | | | | | 3,600 | | | | 213,504 | |
Steelcase Inc., Class A Shares | | | | | | | | | | | 13,400 | | | | 135,474 | (b) |
Total Commercial Services & Supplies | | | | | | | | | | | | | | | 595,467 | |
Construction & Engineering — 2.4% | | | | | | | | | | | | | | | | |
Balfour Beatty PLC | | | | | | | | | | | 73,519 | | | | 211,231 | (a) |
See Notes to Financial Statements.
| | |
| QS Global Market Neutral Fund 2020 Annual Report | | 19 |
Schedule of investments (cont’d)
September 30, 2020
QS Global Market Neutral Fund
| | | | | | | | | | | | | | | | |
| Security | | | | | | | | Shares | | | Value | |
Construction & Engineering — continued | | | | | | | | | | | | | | | | |
Kyudenko Corp. | | | | | | | | | | | 11,400 | | | $ | 329,052 | (a) |
MasTec Inc. | | | | | | | | | | | 6,400 | | | | 270,080 | *(b) |
Obayashi Corp. | | | | | | | | | | | 41,100 | | | | 372,492 | (a) |
Taisei Corp. | | | | | | | | | | | 5,500 | | | | 185,326 | (a) |
Total Construction & Engineering | | | | | | | | | | | | | | | 1,368,181 | |
Electrical Equipment — 0.7% | | | | | | | | | | | | | | | | |
Signify NV | | | | | | | | | | | 11,700 | | | | 432,983 | *(a) |
Industrial Conglomerates — 0.5% | | | | | | | | | | | | | | | | |
Carlisle Cos. Inc. | | | | | | | | | | | 2,500 | | | | 305,925 | (b) |
Machinery — 1.7% | | | | | | | | | | | | | | | | |
IMI PLC | | | | | | | | | | | 29,365 | | | | 395,664 | (a) |
Terex Corp. | | | | | | | | | | | 9,300 | | | | 180,048 | (b) |
Trelleborg AB, Class B Shares | | | | | | | | | | | 14,700 | | | | 259,798 | *(a) |
Valmet oyj | | | | | | | | | | | 5,400 | | | | 133,695 | (a) |
Total Machinery | | | | | | | | | | | | | | | 969,205 | |
Marine — 0.6% | | | | | | | | | | | | | | | | |
A.P. Moller - Maersk A/S, Class B Shares | | | | | | | | | | | 130 | | | | 206,103 | (a) |
Kuehne + Nagel International AG, Registered Shares | | | | | | | | | | | 800 | | | | 155,124 | (a) |
Total Marine | | | | | | | | | | | | | | | 361,227 | |
Professional Services — 3.8% | | | | | | | | | | | | | | | | |
BayCurrent Consulting Inc. | | | | | | | | | | | 2,200 | | | | 307,343 | (a) |
IR Japan Holdings Ltd. | | | | | | | | | | | 3,800 | | | | 481,312 | (a) |
JAC Recruitment Co. Ltd. | | | | | | | | | | | 13,300 | | | | 166,547 | (a) |
ManpowerGroup Inc. | | | | | | | | | | | 2,300 | | | | 168,659 | (b) |
McMillan Shakespeare Ltd. | | | | | | | | | | | 25,000 | | | | 147,483 | (a) |
Meitec Corp. | | | | | | | | | | | 6,500 | | | | 331,258 | (a) |
Robert Half International Inc. | | | | | | | | | | | 5,877 | | | | 311,128 | (b) |
TriNet Group Inc. | | | | | | | | | | | 5,500 | | | | 326,260 | *(b) |
Total Professional Services | | | | | | | | | | | | | | | 2,239,990 | |
Road & Rail — 0.8% | | | | | | | | | | | | | | | | |
Aurizon Holdings Ltd. | | | | | | | | | | | 98,100 | | | | 299,349 | (a) |
CSX Corp. | | | | | | | | | | | 2,100 | | | | 163,107 | (b) |
Total Road & Rail | | | | | | | | | | | | | | | 462,456 | |
Trading Companies & Distributors — 0.9% | | | | | | | | | | | | | | | | |
Bunzl PLC | | | | | | | | | | | 8,700 | | | | 280,692 | (a) |
Hanwa Co. Ltd. | | | | | | | | | | | 11,900 | | | | 237,597 | (a) |
Total Trading Companies & Distributors | | | | | | | | | | | | | | | 518,289 | |
Transportation Infrastructure — 0.5% | | | | | | | | | | | | | | | | |
Kamigumi Co. Ltd. | | | | | | | | | | | 13,600 | | | | 267,761 | (a) |
Total Industrials | | | | | | | | | | | | | | | 8,788,246 | |
See Notes to Financial Statements.
| | |
20 | | QS Global Market Neutral Fund 2020 Annual Report |
QS Global Market Neutral Fund
| | | | | | | | | | | | | | | | |
| Security | | | | | | | | Shares | | | Value | |
| Information Technology — 13.2% | | | | | | | | | | | | | | | | |
Communications Equipment — 0.6% | | | | | | | | | | | | | | | | |
Spirent Communications PLC | | | | | | | | | | | 102,000 | | | $ | 374,326 | (a) |
Electronic Equipment, Instruments & Components — 0.7% | | | | | | | | | | | | | | | | |
ALSO Holding AG, Registered Shares | | | | | | | | | | | 1,500 | | | | 395,302 | (a) |
IT Services — 2.6% | | | | | | | | | | | | | | | | |
Adyen NV | | | | | | | | | | | 155 | | | | 285,643 | *(a) |
Alliance Data Systems Corp. | | | | | | | | | | | 4,500 | | | | 188,910 | (b) |
Computacenter PLC | | | | | | | | | | | 9,000 | | | | 275,115 | (a) |
Nomura Research Institute Ltd. | | | | | | | | | | | 13,800 | | | | 405,583 | (a) |
SCSK Corp. | | | | | | | | | | | 6,900 | | | | 386,038 | (a) |
Total IT Services | | | | | | | | | | | | | | | 1,541,289 | |
Semiconductors & Semiconductor Equipment — 4.8% | | | | | | | | | | | | | | | | |
Applied Materials Inc. | | | | | | | | | | | 6,000 | | | | 356,700 | (b) |
ASM International NV | | | | | | | | | | | 2,500 | | | | 358,349 | (a) |
BE Semiconductor Industries NV | | | | | | | | | | | 4,600 | | | | 197,217 | (a) |
Cirrus Logic Inc. | | | | | | | | | | | 3,100 | | | | 209,095 | *(b) |
Dialog Semiconductor PLC | | | | | | | | | | | 8,300 | | | | 360,974 | *(a) |
Lam Research Corp. | | | | | | | | | | | 800 | | | | 265,400 | (b) |
NVIDIA Corp. | | | | | | | | | | | 750 | | | | 405,915 | (b) |
Optorun Co. Ltd. | | | | | | | | | | | 11,700 | | | | 236,873 | (a) |
Qorvo Inc. | | | | | | | | | | | 3,000 | | | | 387,030 | *(b) |
Total Semiconductors & Semiconductor Equipment | | | | | | | | | | | | | | | 2,777,553 | |
Software — 3.4% | | | | | | | | | | | | | | | | |
Check Point Software Technologies Ltd. | | | | | | | | | | | 3,129 | | | | 376,544 | *(b) |
Citrix Systems Inc. | | | | | | | | | | | 2,300 | | | | 316,733 | (b) |
Fortinet Inc. | | | | | | | | | | | 2,700 | | | | 318,087 | *(b) |
Justsystems Corp. | | | | | | | | | | | 2,200 | | | | 155,805 | (a) |
Manhattan Associates Inc. | | | | | | | | | | | 2,800 | | | | 267,372 | *(b) |
Qualys Inc. | | | | | | | | | | | 2,950 | | | | 289,129 | *(b) |
SimCorp A/S | | | | | | | | | | | 1,800 | | | | 236,610 | (a) |
Total Software | | | | | | | | | | | | | | | 1,960,280 | |
Technology Hardware, Storage & Peripherals — 1.1% | | | | | | | | | | | | | | | | |
Brother Industries Ltd. | | | | | | | | | | | 20,400 | | | | 324,011 | (a) |
Logitech International SA, Registered Shares | | | | | | | | | | | 2,400 | | | | 185,720 | (a) |
Xerox Holdings Corp. | | | | | | | | | | | 6,900 | | | | 129,513 | (b) |
Total Technology Hardware, Storage & Peripherals | | | | | | | | | | | | | | | 639,244 | |
Total Information Technology | | | | | | | | | | | | | | | 7,687,994 | |
| Materials — 6.6% | | | | | | | | | | | | | | | | |
Chemicals — 2.1% | | | | | | | | | | | | | | | | |
CF Industries Holdings Inc. | | | | | | | | | | | 9,700 | | | | 297,887 | (b) |
See Notes to Financial Statements.
| | |
| QS Global Market Neutral Fund 2020 Annual Report | | 21 |
Schedule of investments (cont’d)
September 30, 2020
QS Global Market Neutral Fund
| | | | | | | | | | | | | | | | |
| Security | | | | | | | | Shares | | | Value | |
Chemicals — continued | | | | | | | | | | | | | | | | |
Mitsubishi Gas Chemical Co. Inc. | | | | | | | | | | | 15,200 | | | $ | 281,999 | (a) |
Tokuyama Corp. | | | | | | | | | | | 10,600 | | | | 255,349 | (a) |
Wacker Chemie AG | | | | | | | | | | | 1,800 | | | | 174,858 | (a) |
Yara International ASA | | | | | | | | | | | 5,100 | | | | 196,370 | (a) |
Total Chemicals | | | | | | | | | | | | | | | 1,206,463 | |
Construction Materials — 0.7% | | | | | | | | | | | | | | | | |
LafargeHolcim Ltd., Registered Shares | | | | | | | | | | | 4,100 | | | | 186,892 | (a) |
Sumitomo Osaka Cement Co. Ltd. | | | | | | | | | | | 7,500 | | | | 242,457 | (a) |
Total Construction Materials | | | | | | | | | | | | | | | 429,349 | |
Metals & Mining — 3.5% | | | | | | | | | | | | | | | | |
Acerinox SA | | | | | | | | | | | 37,400 | | | | 305,980 | *(a) |
APERAM SA | | | | | | | | | | | 5,700 | | | | 160,580 | (a) |
Centamin PLC | | | | | | | | | | | 89,300 | | | | 232,694 | (a) |
Centerra Gold Inc. | | | | | | | | | | | 33,800 | | | | 393,197 | |
Dundee Precious Metals Inc. | | | | | | | | | | | 26,600 | | | | 190,578 | |
Endeavour Mining Corp. | | | | | | | | | | | 9,954 | | | | 247,813 | * |
Fortescue Metals Group Ltd. | | | | | | | | | | | 30,500 | | | | 357,028 | (a) |
Kinross Gold Corp. | | | | | | | | | | | 20,400 | | | | 180,016 | * |
Total Metals & Mining | | | | | | | | | | | | | | | 2,067,886 | |
Paper & Forest Products — 0.3% | | | | | | | | | | | | | | | | |
Canfor Corp. | | | | | | | | | | | 14,100 | | | | 158,731 | * |
Total Materials | | | | | | | | | | | | | | | 3,862,429 | |
| Real Estate — 4.8% | | | | | | | | | | | | | | | | |
Equity Real Estate Investment Trusts (REITs) — 3.0% | | | | | | | | | | | | | | | | |
CoreCivic Inc. | | | | | | | | | | | 12,400 | | | | 99,200 | (b) |
CT Real Estate Investment Trust | | | | | | | | | | | 21,200 | | | | 222,420 | |
H&R Real Estate Investment Trust | | | | | | | | | | | 32,800 | | | | 238,201 | |
Japan Retail Fund Investment Corp. | | | | | | | | | | | 200 | | | | 309,708 | (a) |
Kimco Realty Corp. | | | | | | | | | | | 15,800 | | | | 177,908 | (b) |
Mori Trust Sogo Reit Inc. | | | | | | | | | | | 125 | | | | 158,259 | (a) |
NIPPON REIT Investment Corp. | | | | | | | | | | | 61 | | | | 208,166 | (a) |
Stockland | | | | | | | | | | | 114,300 | | | | 310,480 | (a) |
Total Equity Real Estate Investment Trusts (REITs) | | | | | | | | | | | | | | | 1,724,342 | |
Real Estate Management & Development — 1.8% | | | | | | | | | | | | | | | | |
Daito Trust Construction Co. Ltd. | | | | | | | | | | | 3,000 | | | | 265,984 | (a) |
Heiwa Real Estate Co. Ltd. | | | | | | | | | | | 6,800 | | | | 187,647 | (a) |
Kenedix Inc. | | | | | | | | | | | 40,000 | | | | 210,959 | (a) |
Real Matters Inc. | | | | | | | | | | | 19,400 | | | | 378,078 | * |
Total Real Estate Management & Development | | | | | | | | | | | | | | | 1,042,668 | |
Total Real Estate | | | | | | | | | | | | | | | 2,767,010 | |
See Notes to Financial Statements.
| | |
22 | | QS Global Market Neutral Fund 2020 Annual Report |
QS Global Market Neutral Fund
| | | | | | | | | | | | | | | | |
| Security | | | | | | | | Shares | | | Value | |
| Utilities — 3.1% | | | | | | | | | | | | | | | | |
Electric Utilities — 0.3% | | | | | | | | | | | | | | | | |
BKW AG | | | | | | | | | | | 1,900 | | | $ | 202,306 | (a) |
Gas Utilities — 0.6% | | | | | | | | | | | | | | | | |
Nippon Gas Co. Ltd. | | | | | | | | | | | 7,400 | | | | 373,907 | (a) |
Independent Power and Renewable Electricity Producers — 1.0% | | | | | | | | | | | | | | | | |
Capital Power Corp. | | | | | | | | | | | 8,100 | | | | 178,783 | |
Drax Group PLC | | | | | | | | | | | 109,000 | | | | 374,297 | (a) |
Total Independent Power and Renewable Electricity Producers | | | | | | | | | | | | | | | 553,080 | |
Multi-Utilities — 1.2% | | | | | | | | | |
Atco Ltd., Class I Shares | | | | | | | | | | | 13,000 | | | | 375,780 | |
Canadian Utilities Ltd., Class A Shares | | | | | | | | | | | 13,800 | | | | 329,157 | |
Total Multi-Utilities | | | | | | | | 704,937 | |
Total Utilities | | | | | | | | | | | | | | | 1,834,230 | |
Total Investments before Short-Term Investments (Cost — $47,068,546) | | | | | | | | 53,745,642 | |
| | | | |
| | | | | | Rate | | | | | | | |
| Short-Term Investments — 4.4% | | | | | | | | | | | | | | | | |
Invesco Treasury Portfolio, Institutional Class
(Cost — $2,587,870) | | | | | | | 0.010% | | | | 2,587,870 | | | | 2,587,870 | |
Total Investments — 96.7% (Cost — $49,656,416) | | | | | | | | | | | | | | | 56,333,512 | |
Other Assets in Excess of Liabilities — 3.3% | | | | | | | | | | | | | | | 1,892,368 | |
Total Net Assets — 100.0% | | | | | | | | | | | | | | $ | 58,225,880 | |
| * | Non-income producing security. |
| (a) | Security is valued in good faith in accordance with procedures approved by the Board of Trustees (Note 1). (b) All or a portion of this security is held at the broker as collateral for open securities sold short. |
| | |
Abbreviation(s) used in this schedule: |
| |
| ADR | | — American Depositary Receipts |
| |
| REIT | | — Real Estate Investment Trust |
See Notes to Financial Statements.
| | |
| QS Global Market Neutral Fund 2020 Annual Report | | 23 |
Schedule of investments (cont’d)
September 30, 2020
QS Global Market Neutral Fund
| | | | |
| Summary of Investments by Country** (unaudited) | | | |
| United States | | | 28.1 | % |
| Japan | | | 21.7 | |
| United Kingdom | | | 11.0 | |
| Canada | | | 7.8 | |
| Netherlands | | | 4.2 | |
| Switzerland | | | 3.1 | |
| Denmark | | | 2.5 | |
| Australia | | | 2.3 | |
| Sweden | | | 2.2 | |
| Spain | | | 1.9 | |
| France | | | 1.6 | |
| Israel | | | 1.3 | |
| Finland | | | 1.1 | |
| Germany | | | 1.0 | |
| Kyrgyzstan | | | 0.7 | |
| Ireland | | | 0.6 | |
| Austria | | | 0.6 | |
| Jordan | | | 0.5 | |
| New Zealand | | | 0.5 | |
| Ivory Coast | | | 0.4 | |
| Belgium | | | 0.4 | |
| Egypt | | | 0.4 | |
| Norway | | | 0.3 | |
| South Africa | | | 0.3 | |
| Luxembourg | | | 0.3 | |
| Italy | | | 0.3 | |
| Malta | | | 0.3 | |
| Short-Term Investments | | | 4.6 | |
| | | | 100.0 | % |
| ** | As a percentage of total investments. Please note that the Fund holdings are as of September 30, 2020 and are subject to change. |
See Notes to Financial Statements.
| | |
24 | | QS Global Market Neutral Fund 2020 Annual Report |
QS Global Market Neutral Fund
| | | | | | | | | | | | | | | | |
| Security | | | | | | | | Shares | | | Value | |
| Securities Sold Short‡ — (92.2)% | | | | | | | | | | | | | | | | |
| Common Stocks — (92.2)% | | | | | | | | | | | | | | | | |
| Communication Services — (7.5)% | | | | | | | | | | | | | | | | |
Diversified Telecommunication Services — (1.6)% | | | | | | | | | | | | | | | | |
BT Group PLC | | | | | | | | | | | (134,000 | ) | | $ | (170,289 | ) (a) |
Cellnex Telecom SA | | | | | | | | | | | (5,900 | ) | | | (358,577 | ) (a) |
Infrastrutture Wireless Italiane SpA | | | | | | | | | | | (20,800 | ) | | | (230,647 | ) (a) |
Sunrise Communications Group AG | | | | | | | | | | | (1,500 | ) | | | (177,515 | ) (a) |
Total Diversified Telecommunication Services | | | | | | | | | | | | | | | (937,028 | ) |
Entertainment — (2.4)% | | | | | | | | | | | | | | | | |
Cineworld Group PLC | | | | | | | | | | | (190,000 | ) | | | (99,226 | ) (a) |
CTS Eventim AG & Co. KGaA | | | | | | | | | | | (3,400 | ) | | | (164,469 | ) *(a) |
Koei Tecmo Holdings Co. Ltd. | | | | | | | | | | | (4,400 | ) | | | (212,292 | ) (a) |
Konami Holdings Corp. | | | | | | | | | | | (5,900 | ) | | | (255,739 | ) (a) |
Madison Square Garden Sports Corp., Class A Shares | | | | | | | | | | | (900 | ) | | | (135,432 | ) * |
Toho Co. Ltd. | | | | | | | | | | | (4,400 | ) | | | (181,365 | ) (a) |
Walt Disney Co. | | | | | | | | | | | (3,000 | ) | | | (372,240 | ) |
Total Entertainment | | | | | | | | | | | | | | | (1,420,763 | ) |
Interactive Media & Services — (1.2)% | | | | | | | | | | | | | | | | |
Adevinta ASA | | | | | | | | | | | (10,000 | ) | | | (171,499 | ) *(a) |
LINE Corp. | | | | | | | | | | | (4,600 | ) | | | (234,315 | ) *(a) |
SEEK Ltd. | | | | | | | | | | | (18,900 | ) | | | (289,122 | ) (a) |
Total Interactive Media & Services | | | | | | | | | | | | | | | (694,936 | ) |
Media — (1.5)% | | | | | | | | | | | | | | | | |
Ascential PLC | | | | | | | | | | | (38,400 | ) | | | (145,020 | ) *(a) |
Comcast Corp., Class A Shares | | | | | | | | | | | (4,500 | ) | | | (208,170 | ) |
Nexstar Media Group Inc., Class A Shares | | | | | | | | | | | (1,800 | ) | | | (161,874 | ) |
ViacomCBS Inc., Class A Shares | | | | | | | | | | | (12,000 | ) | | | (363,480 | ) |
Total Media | | | | | | | | | | | | | | | (878,544 | ) |
Wireless Telecommunication Services — (0.8)% | | | | | | | | | | | | | | | | |
Millicom International Cellular SA | | | | | | | | | | | (5,900 | ) | | | (178,511 | ) (a) |
SoftBank Group Corp. | | | | | | | | | | | (4,900 | ) | | | (302,562 | ) (a) |
Total Wireless Telecommunication Services | | | | | | | | | | | | | | | (481,073 | ) |
Total Communication Services | | | | | | | | | | | | | | | (4,412,344 | ) |
| Consumer Discretionary — (12.1)% | | | | | | | | | | | | | | | | |
Auto Components — (2.4)% | | | | | | | | | | | | | | | | |
Denso Corp. | | | | | | | | | | | (4,800 | ) | | | (210,252 | ) (a) |
Faurecia SE | | | | | | | | | | | (4,500 | ) | | | (194,328 | ) *(a) |
Freni Brembo SpA | | | | | | | | | | | (15,904 | ) | | | (158,805 | ) *(a) |
See Notes to Financial Statements.
| | |
| QS Global Market Neutral Fund 2020 Annual Report | | 25 |
Schedule of investments (cont’d)
September 30, 2020
QS Global Market Neutral Fund
| | | | | | | | | | | | | | | | |
| Security | | | | | | | | Shares | | | Value | |
Auto Components — continued | | | | | | | | | | | | | | | | |
Keihin Corp. | | | | | | | | | | | (6,800 | ) | | $ | (167,137 | ) *(a) |
Nokian Renkaat oyj | | | | | | | | | | | (9,800 | ) | | | (277,269 | ) (a) |
Toyo Tire Corp. | | | | | | | | | | | (20,600 | ) | | | (332,808 | ) (a) |
Total Auto Components | | | | | | | | | | | | | | | (1,340,599 | ) |
Automobiles — (2.3)% | | | | | | | | | | | | | | | | |
Fiat Chrysler Automobiles NV | | | | | | | | | | | (15,800 | ) | | | (193,429 | ) *(a) |
Isuzu Motors Ltd. | | | | | | | | | | | (20,500 | ) | | | (179,593 | ) (a) |
Mitsubishi Motors Corp. | | | | | | | | | | | (92,000 | ) | | | (203,077 | ) *(a) |
Peugeot SA | | | | | | | | | | | (8,000 | ) | | | (144,243 | ) *(a) |
Renault SA | | | | | | | | | | | (8,900 | ) | | | (229,728 | ) *(a) |
Subaru Corp. | | | | | | | | | | | (8,600 | ) | | | (166,948 | ) (a) |
Toyota Motor Corp. | | | | | | | | | | | (4,600 | ) | | | (304,242 | ) (a) |
Total Automobiles | | | | | | | | | | | | | | | (1,421,260 | ) |
Hotels, Restaurants & Leisure — (3.1)% | | | | | | | | | | | | | | | | |
Aramark | | | | | | | | | | | (7,600 | ) | | | (201,020 | ) |
Crown Resorts Ltd. | | | | | | | | | | | (34,000 | ) | | | (214,729 | ) (a) |
Great Canadian Gaming Corp. | | | | | | | | | | | (5,500 | ) | | | (99,587 | ) * |
Oriental Land Co. Ltd. | | | | | | | | | | | (2,300 | ) | | | (322,213 | ) (a) |
Restaurant Group PLC | | | | | | | | | | | (95,721 | ) | | | (61,083 | ) (a) |
SSP Group PLC | | | | | | | | | | | (42,200 | ) | | | (97,865 | ) (a) |
Vail Resorts Inc. | | | | | | | | | | | (800 | ) | | | (171,176 | ) |
Whitbread PLC | | | | | | | | | | | (6,300 | ) | | | (171,835 | ) *(a) |
William Hill PLC | | | | | | | | | | | (121,000 | ) | | | (432,857 | ) (a) |
Total Hotels, Restaurants & Leisure | | | | | | | | | | | | | | | (1,772,365 | ) |
Household Durables — (1.0)% | | | | | | | | | | | | | | | | |
Countryside Properties PLC | | | | | | | | | | | (40,400 | ) | | | (174,525 | ) (a) |
Electrolux AB, Class B Shares | | | | | | | | | | | (12,400 | ) | | | (289,020 | ) (a) |
Taylor Wimpey PLC | | | | | | | | | | | (93,500 | ) | | | (130,106 | ) (a) |
Total Household Durables | | | | | | | | | | | | | | | (593,651 | ) |
Internet & Direct Marketing Retail — (1.2)% | | | | | | | | | | | | | | | | |
Expedia Group Inc. | | | | | | | | | | | (2,300 | ) | | | (210,887 | ) |
Farfetch Ltd., Class A Shares | | | | | | | | | | | (10,700 | ) | | | (269,212 | ) * |
Ocado Group PLC | | | | | | | | | | | (5,300 | ) | | | (187,301 | ) *(a) |
Total Internet & Direct Marketing Retail | | | | | | | | | | | | | | | (667,400 | ) |
Leisure Products — (0.3)% | | | | | | | | | | | | | | | | |
Hasbro Inc. | | | | | | | | | | | (2,200 | ) | | | (181,984 | ) |
See Notes to Financial Statements.
| | |
26 | | QS Global Market Neutral Fund 2020 Annual Report |
QS Global Market Neutral Fund
| | | | | | | | | | | | | | | | |
| Security | | | | | | | | Shares | | | Value | |
Specialty Retail — (0.6)% | | | | | | | | | | | | | | | | |
Carvana Co. | | | | | | | | | | | (1,350 | ) | | $ | (301,131 | ) * |
Valora Holding AG, Registered Shares | | | | | | | | | | | (400 | ) | | | (74,450 | ) *(a) |
Total Specialty Retail | | | | | | | | | | | | | | | (375,581 | ) |
Textiles, Apparel & Luxury Goods — (1.2)% | | | | | | | | | | | | | | | | |
Cie Financiere Richemont SA, Registered Shares | | | | | | | | | | | (4,265 | ) | | | (285,673 | ) (a) |
Kering SA | | | | | | | | | | | (380 | ) | | | (252,466 | ) (a) |
LVMH Moet Hennessy Louis Vuitton SE | | | | | | | | | | | (370 | ) | | | (172,973 | ) (a) |
Total Textiles, Apparel & Luxury Goods | | | | | | | | | | | | | | | (711,112 | ) |
Total Consumer Discretionary | | | | | | | | | | | | | | | (7,063,952 | ) |
| Consumer Staples — (7.2)% | | | | | | | | | | | | | | | | |
Beverages — (3.1)% | | | | | | | | | | | | | | | | |
Anheuser-Busch InBev SA | | | | | | | | | | | (6,000 | ) | | | (323,866 | ) (a) |
Coca-Cola Bottlers Japan Holdings Inc. | | | | | | | | | | | (11,500 | ) | | | (192,495 | ) (a) |
Coca-Cola HBC AG | | | | | | | | | | | (5,900 | ) | | | (145,843 | ) (a) |
Diageo PLC | | | | | | | | | | | (7,000 | ) | | | (239,808 | ) (a) |
Heineken NV | | | | | | | | | | | (2,850 | ) | | | (253,269 | ) (a) |
Pernod Ricard SA | | | | | | | | | | | (1,400 | ) | | | (223,426 | ) (a) |
Primo Water Corp. | | | | | | | | | | | (12,200 | ) | | | (173,258 | ) |
Remy Cointreau SA | | | | | | | | | | | (1,300 | ) | | | (237,294 | ) (a) |
Total Beverages | | | | | | | | | | | | | | | (1,789,259 | ) |
Food & Staples Retailing — (1.6)% | | | | | | | | | | | | | | | | |
Aeon Co. Ltd. | | | | | | | | | | | (10,000 | ) | | | (268,816 | ) (a) |
Metro Inc. | | | | | | | | | | | (5,300 | ) | | | (254,303 | ) |
Sysco Corp. | | | | | | | | | | | (2,800 | ) | | | (174,216 | ) |
Tesco PLC | | | | | | | | | | | (84,500 | ) | | | (231,664 | ) (a) |
Total Food & Staples Retailing | | | | | | | | | | | | | | | (928,999 | ) |
Food Products — (1.3)% | | | | | | | | | | | | | | | | |
Bakkafrost P/F | | | | | | | | | | | (4,200 | ) | | | (270,882 | ) *(a) |
House Foods Group Inc. | | | | | | | | | | | (4,800 | ) | | | (170,799 | ) (a) |
Kikkoman Corp. | | | | | | | | | | | (5,000 | ) | | | (277,469 | ) (a) |
Total Food Products | | | | | | | | | | | | | | | (719,150 | ) |
Personal Products — (1.2)% | | | | | | | | | | | | | | | | |
Fancl Corp. | | | | | | | | | | | (6,400 | ) | | | (209,279 | ) (a) |
Kose Corp. | | | | | | | | | | | (1,400 | ) | | | (171,178 | ) (a) |
Shiseido Co. Ltd. | | | | | | | | | | | (4,700 | ) | | | (269,688 | ) (a) |
Total Personal Products | | | | | | | | | | | | | | | (650,145 | ) |
Total Consumer Staples | | | | | | | | | | | | | | | (4,087,553 | ) |
See Notes to Financial Statements.
| | |
| QS Global Market Neutral Fund 2020 Annual Report | | 27 |
Schedule of investments (cont’d)
September 30, 2020
QS Global Market Neutral Fund
| | | | | | | | | | | | | | | | |
| Security | | | | | | | | Shares | | | Value | |
| Energy — (2.4)% | | | | | | | | | | | | | | | | |
Oil, Gas & Consumable Fuels — (2.4)% | | | | | | | | | | | | | | | | |
Aker BP ASA | | | | | | | | | | | (14,700 | ) | | $ | (229,299 | ) (a) |
Equinor ASA | | | | | | | | | | | (15,800 | ) | | | (222,979 | ) (a) |
Hess Corp. | | | | | | | | | | | (6,500 | ) | | | (266,045 | ) |
Inter Pipeline Ltd. | | | | | | | | | | | (24,700 | ) | | | (242,446 | ) |
Occidental Petroleum Corp. | | | | | | | | | | | (18,000 | ) | | | (180,180 | ) |
Oil Search Ltd. | | | | | | | | | | | (68,800 | ) | | | (130,666 | ) (a) |
Pembina Pipeline Corp. | | | | | | | | | | | (6,305 | ) | | | (133,813 | ) |
Total Energy | | | | | | | | | | | | | | | (1,405,428 | ) |
| Financials — (12.1)% | | | | | | | | | | | | | | | | |
Banks — (4.4)% | | | | | | | | | | | | | | | | |
Allegiance Bancshares Inc. | | | | | | | | | | | (4,500 | ) | | | (105,165 | ) |
Banco Santander SA, ADR | | | | | | | | | | | (104,300 | ) | | | (192,955 | ) * |
Bankinter SA | | | | | | | | | | | (27,400 | ) | | | (117,891 | ) (a) |
Barclays PLC, ADR | | | | | | | | | | | (52,000 | ) | | | (260,520 | ) * |
Commerzbank AG | | | | | | | | | | | (39,700 | ) | | | (195,122 | ) *(a) |
Commonwealth Bank of Australia | | | | | | | | | | | (4,700 | ) | | | (214,811 | ) (a) |
First Republic Bank | | | | | | | | | | | (2,400 | ) | | | (261,744 | ) |
HSBC Holdings PLC | | | | | | | | | | | (61,400 | ) | | | (238,534 | ) (a) |
Kyushu Financial Group Inc. | | | | | | | | | | | (44,400 | ) | | | (208,464 | ) (a) |
National Australia Bank Ltd. | | | | | | | | | | | (27,200 | ) | | | (347,053 | ) (a) |
UniCredit SpA | | | | | | | | | | | (18,300 | ) | | | (150,915 | ) *(a) |
Westpac Banking Corp. | | | | | | | | | | | (25,800 | ) | | | (311,304 | ) (a) |
Total Banks | | | | | | | | | | | | | | | (2,604,478 | ) |
Capital Markets — (4.6)% | | | | | | | | | | | | | | | | |
ASX Ltd. | | | | | | | | | | | (4,600 | ) | | | (269,434 | ) (a) |
Brookfield Asset Management Inc., Class A Shares | | | | | | | | | | | (9,000 | ) | | | (297,540 | ) |
Carlyle Group Inc. | | | | | | | | | | | (6,400 | ) | | | (157,888 | ) |
CME Group Inc. | | | | | | | | | | | (1,000 | ) | | | (167,310 | ) |
Interactive Brokers Group Inc., Class A Shares | | | | | | | | | | | (5,800 | ) | | | (280,314 | ) |
Japan Exchange Group Inc. | | | | | | | | | | | (10,500 | ) | | | (293,837 | ) (a) |
KKR & Co. Inc., Class A Shares | | | | | | | | | | | (6,400 | ) | | | (219,776 | ) |
Macquarie Group Ltd. | | | | | | | | | | | (4,500 | ) | | | (386,538 | ) (a) |
SBI Holdings Inc. | | | | | | | | | | | (10,500 | ) | | | (271,695 | ) (a) |
TMX Group Ltd. | | | | | | | | | | | (2,200 | ) | | | (226,254 | ) |
Total Capital Markets | | | | | | | | | | | | | | | (2,570,586 | ) |
Diversified Financial Services — (1.5)% | | | | | | | | | | | | | | | | |
Aker ASA, Class A Shares | | | | | | | | | | | (3,300 | ) | | | (142,044 | ) (a) |
Groupe Bruxelles Lambert SA | | | | | | | | | | | (2,450 | ) | | | (220,821 | ) (a) |
Industrivarden AB, Class C Shares | | | | | | | | | | | (7,385 | ) | | | (196,784 | ) *(a) |
See Notes to Financial Statements.
| | |
28 | | QS Global Market Neutral Fund 2020 Annual Report |
QS Global Market Neutral Fund
| | | | | | | | | | | | | | | | |
| Security | | | | | | | | Shares | | | Value | |
Diversified Financial Services — continued | | | | | | | | | | | | | | | | |
Investor AB, Class B Shares | | | | | | | | | | | (2,750 | ) | | $ | (179,322 | ) (a) |
Tokyo Century Corp. | | | | | | | | | | | (3,100 | ) | | | (168,698 | ) (a) |
Total Diversified Financial Services | | | | | | | | | | | | | | | (907,669 | ) |
Insurance — (1.6)% | | | | | | | | | | | | | | | | |
Brown & Brown Inc. | | | | | | | | | | | (7,363 | ) | | | (333,323 | ) |
Marsh & McLennan Cos. Inc. | | | | | | | | | | | (1,750 | ) | | | (200,725 | ) |
Tryg A/S | | | | | | | | | | | (5,750 | ) | | | (181,230 | ) (a) |
Willis Towers Watson PLC | | | | | | | | | | | (980 | ) | | | (204,644 | ) |
Total Insurance | | | | | | | | | | | | | | | (919,922 | ) |
Total Financials | | | | | | | | | | | | | | | (7,002,655 | ) |
| Health Care — (7.9)% | | | | | | | | | | | | | | | | |
Health Care Equipment & Supplies — (5.0)% | | | | | | | | | | | | | | | | |
Asahi Intecc Co. Ltd. | | | | | | | | | | | (12,100 | ) | | | (380,087 | ) (a) |
Avanos Medical Inc. | | | | | | | | | | | (4,300 | ) | | | (142,846 | ) * |
Axonics Modulation Technologies Inc. | | | | | | | | | | | (6,700 | ) | | | (341,968 | ) * |
Becton Dickinson and Co. | | | | | | | | | | | (1,050 | ) | | | (244,314 | ) |
Boston Scientific Corp. | | | | | | | | | | | (6,700 | ) | | | (256,007 | ) * |
Cooper Cos. Inc. | | | | | | | | | | | (1,000 | ) | | | (337,120 | ) |
Elekta AB, Class B Shares | | | | | | | | | | | (20,600 | ) | | | (259,061 | ) (a) |
Integra LifeSciences Holdings Corp. | | | | | | | | | | | (3,300 | ) | | | (155,826 | ) * |
Merit Medical Systems Inc. | | | | | | | | | | | (5,100 | ) | | | (221,850 | ) * |
Penumbra Inc. | | | | | | | | | | | (725 | ) | | | (140,926 | ) * |
Straumann Holding AG, Registered Shares | | | | | | | | | | | (200 | ) | | | (201,213 | ) (a) |
Terumo Corp. | | | | | | | | | | | (8,000 | ) | | | (318,732 | ) (a) |
Total Health Care Equipment & Supplies | | | | | | | | | | | | | | | (2,999,950 | ) |
Health Care Providers & Services — (0.5)% | | | | | | | | | | | | | | | | |
HealthEquity Inc. | | | | | | | | | | | (2,800 | ) | | | (143,836 | ) * |
Ramsay Health Care Ltd. | | | | | | | | | | | (4,000 | ) | | | (189,749 | ) (a) |
Total Health Care Providers & Services | | | | | | | | | | | | | | | (333,585 | ) |
Health Care Technology — (0.2)% | | | | | | | | | | | | | | | | |
Tabula Rasa HealthCare Inc. | | | | | | | | | | | (3,240 | ) | | | (132,095 | ) * |
Pharmaceuticals — (2.2)% | | | | | | | | | | | | | | | | |
Catalent Inc. | | | | | | | | | | | (4,300 | ) | | | (368,338 | ) * |
Dechra Pharmaceuticals PLC | | | | | | | | | | | (4,900 | ) | | | (203,618 | ) (a) |
H Lundbeck A/S | | | | | | | | | | | (5,700 | ) | | | (187,895 | ) (a) |
See Notes to Financial Statements.
| | |
| QS Global Market Neutral Fund 2020 Annual Report | | 29 |
Schedule of investments (cont’d)
September 30, 2020
QS Global Market Neutral Fund
| | | | | | | | | | | | | | | | |
| Security | | | | | | | | Shares | | | Value | |
Pharmaceuticals — continued | | | | | | | | | | | | | | | | |
MyoKardia Inc. | | | | | | | | | | | (2,945 | ) | | $ | (401,492 | ) * |
Sumitomo Dainippon Pharma Co. Ltd. | | | | | | | | | | | (13,400 | ) | | | (176,452 | ) (a) |
Total Pharmaceuticals | | | | | | | | | | | | | | | (1,337,795 | ) |
Total Health Care | | | | | | | | | | | | | | | (4,803,425 | ) |
| Industrials — (15.3)% | | | | | | | | | | | | | | | | |
Aerospace & Defense — (1.8)% | | | | | | | | | | | | | | | | |
Airbus SE | | | | | | | | | | | (2,500 | ) | | | (181,462 | ) *(a) |
Boeing Co. | | | | | | | | | | | (1,700 | ) | | | (280,942 | ) |
Bombardier Inc., Class B shares | | | | | | | | | | | (175,500 | ) | | | (43,494 | ) * |
Cubic Corp. | | | | | | | | | | | (4,800 | ) | | | (279,216 | ) |
MTU Aero Engines AG | | | | | | | | | | | (940 | ) | | | (156,340 | ) (a) |
Rolls-Royce Holdings PLC | | | | | | | | | | | (47,100 | ) | | | (78,152 | ) (a) |
Total Aerospace & Defense | | | | | | | | | | | | | | | (1,019,606 | ) |
Air Freight & Logistics — (0.5)% | | | | | | | | | | | | | | | | |
SG Holdings Co. Ltd. | | | | | | | | | | | (5,300 | ) | | | (275,466 | ) (a) |
Airlines — (0.3)% | | | | | | | | | | | | | | | | |
Wizz Air Holdings PLC | | | | | | | | | | | (3,800 | ) | | | (152,517 | ) *(a) |
Building Products — (0.6)% | | | | | | | | | | | | | | | | |
Nitto Boseki Co. Ltd. | | | | | | | | | | | (4,600 | ) | | | (195,747 | ) (a) |
Resideo Technologies Inc. | | | | | | | | | | | (15,600 | ) | | | (171,600 | ) * |
Total Building Products | | | | | | | | | | | | | | | (367,347 | ) |
Commercial Services & Supplies — (1.3)% | | | | | | | | | | | | | | | | |
Babcock International Group PLC | | | | | | | | | | | (42,500 | ) | | | (136,611 | ) (a) |
Stericycle Inc. | | | | | | | | | | | (5,000 | ) | | | (315,300 | ) * |
Waste Connections Inc. | | | | | | | | | | | (3,100 | ) | | | (322,211 | ) |
Total Commercial Services & Supplies | | | | | | | | | | | | | | | (774,122 | ) |
Electrical Equipment — (1.2)% | | | | | | | | | | | | | | | | |
Melrose Industries PLC | | | | | | | | | | | (194,500 | ) | | | (286,971 | ) *(a) |
Nidec Corp. | | | | | | | | | | | (4,300 | ) | | | (399,904 | ) (a) |
Total Electrical Equipment | | | | | | | | | | | | | | | (686,875 | ) |
Industrial Conglomerates — (0.5)% | | | | | | | | | | | | | | | | |
Smiths Group PLC | | | | | | | | | | | (15,200 | ) | | | (267,229 | ) (a) |
Machinery — (3.9)% | | | | | | | | | | | | | | | | |
CNH Industrial NV | | | | | | | | | | | (33,600 | ) | | | (261,126 | ) *(a) |
Daifuku Co. Ltd. | | | | | | | | | | | (2,700 | ) | | | (271,755 | ) (a) |
Hitachi Construction Machinery Co. Ltd. | | | | | | | | | | | (10,800 | ) | | | (391,106 | ) (a) |
Makita Corp. | | | | | | | | | | | (8,400 | ) | | | (400,657 | ) (a) |
MISUMI Group Inc. | | | | | | | | | | | (14,300 | ) | | | (399,677 | ) (a) |
See Notes to Financial Statements.
| | |
30 | | QS Global Market Neutral Fund 2020 Annual Report |
QS Global Market Neutral Fund
| | | | | | | | | | | | | | | | |
| Security | | | | | | | | Shares | | | Value | |
Machinery — continued | | | | | | | | | | | | | | | | |
Wartsila oyj Abp | | | | | | | | | | | (27,800 | ) | | $ | (218,749 | ) (a) |
Yaskawa Electric Corp. | | | | | | | | | | | (7,800 | ) | | | (304,600 | ) (a) |
Total Machinery | | | | | | | | | | | | | | | (2,247,670 | ) |
Professional Services — (1.3)% | | | | | | | | | | | | | | | | |
Equifax Inc. | | | | | | | | | | | (1,750 | ) | | | (274,575 | ) |
Morneau Shepell Inc. | | | | | | | | | | | (10,400 | ) | | | (217,130 | ) |
RELX PLC | | | | | | | | | | | (10,500 | ) | | | (232,417 | ) (a) |
Total Professional Services | | | | | | | | | | | | | | | (724,122 | ) |
Road & Rail — (2.0)% | | | | | | | | | | | | | | | | |
Kintetsu Group Holdings Co. Ltd. | | | | | | | | | | | (5,200 | ) | | | (221,830 | ) (a) |
Kyushu Railway Co. | | | | | | | | | | | (7,200 | ) | | | (153,810 | ) (a) |
Odakyu Electric Railway Co. Ltd. | | | | | | | | | | | (11,000 | ) | | | (276,754 | ) (a) |
Saia Inc. | | | | | | | | | | | (1,500 | ) | | | (189,210 | ) * |
Uber Technologies Inc. | | | | | | | | | | | (7,600 | ) | | | (277,248 | ) * |
Total Road & Rail | | | | | | | | | | | | | | | (1,118,852 | ) |
Trading Companies & Distributors — (0.5)% | | | | | | | | | | | | | | | | |
Electrocomponents PLC | | | | | | | | | | | (31,500 | ) | | | (288,131 | ) (a) |
Transportation Infrastructure — (1.4)% | | | | | | | | | | | | | | | | |
Flughafen Zurich AG, Registered Shares | | | | | | | | | | | (1,175 | ) | | | (160,895 | ) *(a) |
Japan Airport Terminal Co. Ltd. | | | | | | | | | | | (7,000 | ) | | | (308,845 | ) (a) |
Transurban Group | | | | | | | | | | | (32,000 | ) | | | (324,302 | ) (a) |
Total Transportation Infrastructure | | | | | | | | | | | | | | | (794,042 | ) |
Total Industrials | | | | | | | | | | | | | | | (8,715,979 | ) |
| Information Technology — (13.0)% | | | | | | | | | | | | | | | | |
Electronic Equipment, Instruments & Components — (2.3)% | | | | | | | | | | | | | | | | |
Hamamatsu Photonics KK | | | | | | | | | | | (4,200 | ) | | | (211,627 | ) (a) |
Ibiden Co. Ltd. | | | | | | | | | | | (6,700 | ) | | | (226,873 | ) (a) |
Ingenico Group SA | | | | | | | | | | | (1,120 | ) | | | (173,304 | ) *(a) |
Keyence Corp. | | | | | | | | | | | (900 | ) | | | (419,438 | ) (a) |
Renishaw PLC | | | | | | | | | | | (4,300 | ) | | | (311,368 | ) *(a) |
Total Electronic Equipment, Instruments & Components | | | | | | | | | | | | | | | (1,342,610 | ) |
IT Services — (4.2)% | | | | | | | | | | | | | | | | |
Amadeus IT Group SA | | | | | | | | | | | (3,400 | ) | | | (188,686 | ) (a) |
Broadridge Financial Solutions Inc. | | | | | | | | | | | (1,300 | ) | | | (171,600 | ) |
Capita PLC | | | | | | | | | | | (316,600 | ) | | | (124,070 | ) *(a) |
Computershare Ltd. | | | | | | | | | | | (29,500 | ) | | | (259,004 | ) (a) |
Edenred | | | | | | | | | | | (3,600 | ) | | | (161,515 | ) (a) |
Fidelity National Information Services Inc. | | | | | | | | | | | (2,350 | ) | | | (345,944 | ) |
Global Payments Inc. | | | | | | | | | | | (1,600 | ) | | | (284,128 | ) |
See Notes to Financial Statements.
| | |
| QS Global Market Neutral Fund 2020 Annual Report | | 31 |
Schedule of investments (cont’d)
September 30, 2020
QS Global Market Neutral Fund
| | | | | | | | | | | | | | | | |
| Security | | | | | | | | Shares | | | Value | |
IT Services — continued | | | | | | | | | | | | | | | | |
NEXTDC Ltd. | | | | | | | | | | | (46,213 | ) | | $ | (411,426 | ) *(a) |
Sabre Corp. | | | | | | | | | | | (23,300 | ) | | | (151,683 | ) |
Worldline SA | | | | | | | | | | | (4,100 | ) | | | (336,191 | ) *(a) |
Total IT Services | | | | | | | | | | | | | | | (2,434,247 | ) |
Semiconductors & Semiconductor Equipment — (1.6)% | | | | | | | | | | | | | | | | |
Cabot Microelectronics Corp. | | | | | | | | | | | (1,130 | ) | | | (161,375 | ) |
Cree Inc. | | | | | | | | | | | (4,500 | ) | | | (286,830 | ) * |
Disco Corp. | | | | | | | | | | | (700 | ) | | | (170,327 | ) (a) |
SOITEC | | | | | | | | | | | (2,100 | ) | | | (302,454 | ) *(a) |
Total Semiconductors & Semiconductor Equipment | | | | | | | | | | | | | | | (920,986 | ) |
Software — (3.7)% | | | | | | | | | | | | | | | | |
8x8 Inc. | | | | | | | | | | | (10,416 | ) | | | (161,969 | ) * |
Altair Engineering Inc., Class A Shares | | | | | | | | | | | (4,565 | ) | | | (191,639 | ) * |
Appfolio Inc., Class A Shares | | | | | | | | | | | (1,620 | ) | | | (229,732 | ) * |
AVEVA Group PLC | | | | | | | | | | | (2,750 | ) | | | (170,039 | ) (a) |
Ceridian HCM Holding Inc. | | | | | | | | | | | (3,500 | ) | | | (289,275 | ) * |
Lightspeed POS Inc. | | | | | | | | | | | (5,700 | ) | | | (182,616 | ) * |
LivePerson Inc. | | | | | | | | | | | (4,600 | ) | | | (239,154 | ) * |
Pegasystems Inc. | | | | | | | | | | | (2,100 | ) | | | (254,184 | ) |
Splunk Inc. | | | | | | | | | | | (1,700 | ) | | | (319,821 | ) * |
Temenos AG, Registered Shares | | | | | | | | | | | (1,500 | ) | | | (202,000 | ) (a) |
Total Software | | | | | | | | | | | | | | | (2,240,429 | ) |
Technology Hardware, Storage & Peripherals — (1.2)% | | | | | | | | | | | | | | | | |
FUJIFILM Holdings Corp. | | | | | | | | | | | (5,400 | ) | | | (266,088 | ) (a) |
Ricoh Co. Ltd. | | | | | | | | | | | (24,600 | ) | | | (165,836 | ) (a) |
Toshiba TEC Corp. | | | | | | | | | | | (4,900 | ) | | | (204,677 | ) (a) |
Total Technology Hardware, Storage & Peripherals | | | | | | | | | | | | | | | (636,601 | ) |
Total Information Technology | | | | | | | | | | | | | | | (7,574,873 | ) |
| Materials — (6.6)% | | | | | | | | | | | | | | | | |
Chemicals — (4.9)% | | | | | | | | | | | | | | | | |
Air Liquide SA | | | | | | | | | | | (1,800 | ) | | | (285,630 | ) (a) |
Albemarle Corp. | | | | | | | | | | | (2,900 | ) | | | (258,912 | ) |
Clariant AG, Registered Shares | | | | | | | | | | | (11,900 | ) | | | (233,961 | ) (a) |
Ecolab Inc. | | | | | | | | | | | (1,680 | ) | | | (335,731 | ) |
International Flavors & Fragrances Inc. | | | | | | | | | | | (2,209 | ) | | | (270,492 | ) |
Nippon Paint Holdings Co. Ltd. | | | | | | | | | | | (3,800 | ) | | | (391,058 | ) (a) |
OCI NV | | | | | | | | | | | (13,300 | ) | | | (170,753 | ) *(a) |
Quaker Chemical Corp. | | | | | | | | | | | (800 | ) | | | (143,768 | ) |
See Notes to Financial Statements.
| | |
32 | | QS Global Market Neutral Fund 2020 Annual Report |
QS Global Market Neutral Fund
| | | | | | | | | | | | | | | | |
| Security | | | | | | | | Shares | | | Value | |
Chemicals — continued | | | | | | | | | | | | | | | | |
Scapa Group PLC | | | | | | | | | | | (91,000 | ) | | $ | (137,593 | ) *(a) |
Showa Denko KK | | | | | | | | | | | (7,400 | ) | | | (135,637 | ) (a) |
Umicore SA | | | | | | | | | | | (6,851 | ) | | | (285,264 | ) (a) |
Victrex PLC | | | | | | | | | | | (8,836 | ) | | | (208,321 | ) (a) |
Total Chemicals | | | | | | | | | | | | | | | (2,857,120 | ) |
Containers & Packaging — (0.3)% | | | | | | | | | | | | | | | | |
Ball Corp. | | | | | | | | | | | (2,200 | ) | | | (182,864 | ) |
Metals & Mining — (1.1)% | | | | | | | | | | | | | | | | |
BHP Group Ltd. | | | | | | | | | | | (9,300 | ) | | | (239,315 | ) (a) |
Ivanhoe Mines Ltd., Class A Shares | | | | | | | | | | | (75,000 | ) | | | (272,615 | ) * |
thyssenkrupp AG | | | | | | | | | | | (20,100 | ) | | | (101,588 | ) *(a) |
Total Metals & Mining | | | | | | | | | | | | | | | (613,518 | ) |
Paper & Forest Products — (0.3)% | | | | | | | | | | | | | | | | |
Svenska Cellulosa AB SCA, Class B Shares | | | | | | | | | | | (13,500 | ) | | | (185,051 | ) *(a) |
Total Materials | | | | | | | | | | | | | | | (3,838,553 | ) |
| Real Estate — (4.8)% | | | | | | | | | | | | | | | | |
Equity Real Estate Investment Trusts (REITs) — (4.4)% | | | | | | | | | | | | | | | | |
Alexandria Real Estate Equities Inc. | | | | | | | | | | | (1,700 | ) | | | (272,000 | ) |
Americold Realty Trust | | | | | | | | | | | (4,600 | ) | | | (164,450 | ) |
Big Yellow Group PLC | | | | | | | | | | | (17,500 | ) | | | (234,577 | ) (a) |
Digital Realty Trust Inc. | | | | | | | | | | | (2,174 | ) | | | (319,056 | ) |
Equinix Inc. | | | | | | | | | | | (500 | ) | | | (380,065 | ) |
Healthpeak Properties Inc. | | | | | | | | | | | (10,000 | ) | | | (271,500 | ) |
JBG SMITH Properties | | | | | | | | | | | (6,400 | ) | | | (171,136 | ) |
Nippon Prologis REIT Inc. | | | | | | | | | | | (70 | ) | | | (236,360 | ) (a) |
Shaftesbury PLC | | | | | | | | | | | (29,600 | ) | | | (189,990 | ) (a) |
Tritax Big Box REIT PLC | | | | | | | | | | | (95,000 | ) | | | (190,150 | ) (a) |
UNITE Group PLC | | | | | | | | | | | (11,632 | ) | | | (126,124 | ) *(a) |
Total Equity Real Estate Investment Trusts (REITs) | | | | | | | | | | | | | | | (2,555,408 | ) |
Real Estate Management & Development — (0.4)% | | | | | | | | | | | | | | | | |
Altus Group Ltd. | | | | | | | | | | | (5,500 | ) | | | (228,542 | ) |
Total Real Estate | | | | | | | | | | | | | | | (2,783,950 | ) |
| Utilities — (3.3)% | | | | | | | | | | | | | | | | |
Electric Utilities — (0.8)% | | | | | | | | | | | | | | | | |
Elia Group SA | | | | | | | | | | | (1,700 | ) | | | (169,733 | ) (a) |
Orsted A/S | | | | | | | | | | | (2,100 | ) | | | (289,663 | ) (a) |
Total Electric Utilities | | | | | | | | | | | | | | | (459,396 | ) |
Gas Utilities — (0.3)% | | | | | | | | | | | | | | | | |
Atmos Energy Corp. | | | | | | | | | | | (1,900 | ) | | | (181,621 | ) |
See Notes to Financial Statements.
| | |
| QS Global Market Neutral Fund 2020 Annual Report | | 33 |
Schedule of investments (cont’d)
September 30, 2020
QS Global Market Neutral Fund
| | | | | | | | | | | | | | | | |
| Security | | | | | | | | Shares | | | Value | |
Independent Power and Renewable Electricity Producers — (0.8)% | | | | | | | | | | | | | | | | |
Innergex Renewable Energy Inc. | | | | | | | | | | | (12,700 | ) | | $ | (229,478 | ) |
Scatec Solar ASA | | | | | | | | | | | (10,500 | ) | | | (242,777 | ) (a) |
Total Independent Power and Renewable Electricity Producers | | | | | | | | | | | | | | | (472,255 | ) |
Multi-Utilities — (1.0)% | | | | | | | | | | | | | | | | |
Algonquin Power & Utilities Corp. | | | | | | | | | | | (13,500 | ) | | | (196,080 | ) |
E.ON SE | | | | | | | | | | | (22,400 | ) | | | (247,490 | ) (a) |
National Grid PLC, ADR | | | | | | | | | | | (3,400 | ) | | | (196,486 | ) |
Total Multi-Utilities | | | | | | | | | | | | | | | (640,056 | ) |
Water Utilities — (0.4)% | | | | | | | | | | | | | | | | |
Essential Utilities Inc. | | | | | | | | | | | (5,550 | ) | | | (223,388 | ) |
Total Utilities | | | | | | | | | | | | | | | (1,976,716 | ) |
Total Common Stocks (Proceeds — $(49,759,631)) | | | | | | | | | | | | | | | (53,665,428 | ) |
| | | | |
| | | | | | Expiration
Date | | | Warrants | | | | |
| Warrants — (0.0)%†† | | | | | | | | | | | | | | | | |
Occidental Petroleum Corp. (Proceeds — $(11,138)) | | | | 8/3/27 | | | | (2,250 | ) | | | (6,750 | ) * |
Total Securities Sold Short (Proceeds — $(49,770,769)) | | | | | | | | | | | | | | $ | (53,672,178 | ) |
| †† | Represents less than 0.1%. |
| * | Non-income producing security. |
| ‡ | Percentages indicated are based on net assets. |
| (a) | Security is valued in good faith in accordance with procedures approved by the Board of Trustees (Note 1). |
| | |
Abbreviation(s) used in this schedule: |
| |
| ADR | | — American Depositary Receipts |
| |
| REIT | | — Real Estate Investment Trust |
See Notes to Financial Statements.
| | |
34 | | QS Global Market Neutral Fund 2020 Annual Report |
QS Global Market Neutral Fund
| | | | |
| Summary of Securities Sold Short by Country± (unaudited) | | | |
| United States | | | 30.4 | % |
| Japan | | | 23.2 | |
| United Kingdom | | | 12.6 | |
| Australia | | | 6.7 | |
| France | | | 5.7 | |
| Canada | | | 4.9 | |
| Switzerland | | | 3.0 | |
| Sweden | | | 2.1 | |
| Belgium | | | 1.9 | |
| Germany | | | 1.6 | |
| Spain | | | 1.6 | |
| Norway | | | 1.6 | |
| Denmark | | | 1.2 | |
| Italy | | | 1.0 | |
| Finland | | | 0.9 | |
| Netherlands | | | 0.8 | |
| Faroe Islands | | | 0.5 | |
| Colombia | | | 0.3 | |
| | | | 100.0 | % |
| ± | As a percentage of total securities sold short. Please note that the Fund holdings are as of September 30, 2020 and are subject to change. |
At September 30, 2020, the Fund had the following open forward foreign currency contracts:
| | | | | | | | | | | | | | | | | | | | |
Currency
Purchased | | | Currency
Sold | | | Counterparty | | Settlement
Date | | | Unrealized
Appreciation
(Depreciation) | |
| USD | | | 6,129,262 | | | GBP | | | 4,769,000 | | | Bank of New York | | | 10/23/20 | | | $ | (25,148) | |
| USD | | | 11,105,910 | | | JPY | | | 1,170,785,000 | | | Bank of New York | | | 10/23/20 | | | | 1,945 | |
| USD | | | 4,714,280 | | | CAD | | | 6,217,000 | | | Citibank N.A. | | | 10/23/20 | | | | 44,958 | |
| USD | | | 6,039,650 | | | EUR | | | 5,094,000 | | | Northern Trust Co. | | | 10/23/20 | | | | 64,354 | |
| Total | | | | | | | | | | | | | | | $ | 86,109 | |
| | |
Abbreviation(s) used in this table: |
| |
| CAD | | — Canadian Dollar |
| |
| EUR | | — Euro |
| |
| GBP | | — British Pound |
| |
| JPY | | — Japanese Yen |
| |
| USD | | — United States Dollar |
See Notes to Financial Statements.
| | |
| QS Global Market Neutral Fund 2020 Annual Report | | 35 |
Statement of assets and liabilities
September 30, 2020
| | | | |
| |
| Assets: | | | | |
Investments, at value (Cost — $49,656,416) | | $ | 56,333,512 | |
Foreign currency, at value (Cost — $66,187) | | | 66,506 | |
Foreign cash collateral held at broker for securities sold short, at value (Cost — $34,791,076) | | | 36,933,661 | |
Deposits with brokers for securities sold short | | | 18,252,460 | |
Receivable from broker for collateral for securities sold short | | | 307,941 | |
Interest and dividends receivable | | | 208,100 | |
Receivable for securities sold | | | 148,424 | |
Unrealized appreciation on forward foreign currency contracts | | | 111,257 | |
Receivable for Fund shares sold | | | 46 | |
Prepaid expenses | | | 34,074 | |
Total Assets | | | 112,395,981 | |
| |
| Liabilities: | | | | |
Investments sold short, at value (proceeds received $49,770,769) | | | 53,672,178 | |
Payable for securities purchased | | | 307,941 | |
Dividends payable on securities sold short | | | 64,121 | |
Investment management fee payable | | | 25,210 | |
Unrealized depreciation on forward foreign currency contracts | | | 25,148 | |
Trustees’ fees payable | | | 1,810 | |
Service and/or distribution fees payable | | | 56 | |
Accrued expenses | | | 73,637 | |
Total Liabilities | | | 54,170,101 | |
| Total Net Assets | | $ | 58,225,880 | |
| |
| Net Assets: | | | | |
Par value (Note 7) | | $ | 64 | |
Paid-in capital in excess of par value | | | 63,706,042 | |
Total distributable earnings (loss) | | | (5,480,226) | |
| Total Net Assets | | $ | 58,225,880 | |
See Notes to Financial Statements.
| | |
36 | | QS Global Market Neutral Fund 2020 Annual Report |
| | | | |
| |
| Net Assets: | | | | |
Class A | | | $96,171 | |
Class C | | | $44,850 | |
Class I | | | $4,903,106 | |
Class IS | | | $53,181,753 | |
| |
| Shares Outstanding: | | | | |
Class A | | | 10,660 | |
Class C | | | 5,057 | |
Class I | | | 541,149 | |
Class IS | | | 5,857,115 | |
| |
| Net Asset Value: | | | | |
Class A (and redemption price) | | | $9.02 | |
Class C* | | | $8.87 | |
Class I (and redemption price) | | | $9.06 | |
Class IS (and redemption price) | | | $9.08 | |
| Maximum Public Offering Price Per Share: | | | | |
Class A (based on maximum initial sales charge of 5.75%) | | | $9.57 | |
| * | Redemption price per share is NAV of Class C shares reduced by a 1.00% CDSC if shares are redeemed within one year from purchase payment (Note 2). |
See Notes to Financial Statements.
| | |
| QS Global Market Neutral Fund 2020 Annual Report | | 37 |
Statement of operations
For the Year Ended September 30, 2020
| | | | |
| |
| Investment Income: | | | | |
Dividends | | $ | 1,417,089 | |
Interest | | | 30,751 | |
Less: Foreign taxes withheld | | | (119,598) | |
Total Investment Income | | | 1,328,242 | |
| |
| Expenses: | | | | |
Dividend expense on securities sold short | | | 879,839 | |
Investment management fee (Note 2) | | | 593,249 | |
Fund accounting fees | | | 77,115 | |
Interest expense on securities sold short | | | 72,572 | |
Registration fees | | | 67,104 | |
Audit and tax fees | | | 47,620 | |
Custody fees | | | 25,968 | |
Legal fees | | | 24,213 | |
Trustees’ fees | | | 11,510 | |
Shareholder reports | | | 6,421 | |
Fees recaptured by investment manager (Note 2) | | | 5,809 | |
Transfer agent fees (Note 5) | | | 2,142 | |
Insurance | | | 1,330 | |
Service and/or distribution fees (Notes 2 and 5) | | | 697 | |
Interest expense | | | 358 | |
Miscellaneous expenses | | | 5,811 | |
Total Expenses | | | 1,821,758 | |
Less: Fee waivers and/or expense reimbursements (Notes 2 and 5) | | | (176,954) | |
Net Expenses | | | 1,644,804 | |
| Net Investment Loss | | | (316,562) | |
| |
Realized and Unrealized Gain (Loss) on Investments, Short Sales, Forward Foreign Currency Contracts and Foreign Currency Transactions (Notes 1, 3 and 4): | | | | |
Net Realized Loss From: | | | | |
Investment transactions | | | (990,418) | |
Securities sold short | | | (5,834,476) | |
Forward foreign currency contracts | | | (496,957) | |
Foreign currency transactions | | | (475,576) | |
Net Realized Loss | | | (7,797,427) | |
Change in Net Unrealized Appreciation (Depreciation) From: | | | | |
Investments | | | 6,267,151 | |
Securities sold short | | | (2,598,575) | |
Forward foreign currency contracts | | | (143,232) | |
Foreign currencies | | | 2,275,574 | |
Change in Net Unrealized Appreciation (Depreciation) | | | 5,800,918 | |
| Net Loss on Investments, Short Sales, Forward Foreign Currency Contracts and Foreign Currency Transactions | | | (1,996,509) | |
| Decrease in Net Assets From Operations | | $ | (2,313,071) | |
See Notes to Financial Statements.
| | |
38 | | QS Global Market Neutral Fund 2020 Annual Report |
Statements of changes in net assets
| | | | | | | | |
| For the Years Ended September 30, | | 2020 | | | 2019 | |
| | |
| Operations: | | | | | | | | |
Net investment loss | | $ | (316,562) | | | $ | (31,548) | |
Net realized gain (loss) | | | (7,797,427) | | | | 1,179,271 | |
Change in net unrealized appreciation (depreciation) | | | 5,800,918 | | | | (3,837,761) | |
Decrease in Net Assets From Operations | | | (2,313,071) | | | | (2,690,038) | |
| | |
| Distributions to Shareholders From (Notes 1 and 6): | | | | | | | | |
Total distributable earnings | | | (176,808) | | | | (950,002) | |
Decrease in Net Assets From Distributions to Shareholders | | | (176,808) | | | | (950,002) | |
| | |
| Fund Share Transactions (Note 7): | | | | | | | | |
Net proceeds from sale of shares | | | 7,129,796 | | | | 26,717,220 | |
Reinvestment of distributions | | | 169,561 | | | | 947,360 | |
Cost of shares repurchased | | | (10,015,303) | | | | (3,603,629) | |
Increase (Decrease) in Net Assets From Fund Share Transactions | | | (2,715,946) | | | | 24,060,951 | |
Increase (Decrease) in Net Assets | | | (5,205,825) | | | | 20,420,911 | |
| | |
| Net Assets: | | | | | | | | |
Beginning of year | | | 63,431,705 | | | | 43,010,794 | |
End of year | | $ | 58,225,880 | | | $ | 63,431,705 | |
See Notes to Financial Statements.
| | |
| QS Global Market Neutral Fund 2020 Annual Report | | 39 |
Financial highlights
| | | | | | | | | | | | | | | | | | | | |
For a share of each class of beneficial interest outstanding throughout each year ended September 30,
unless otherwise noted: | |
| Class A Shares1 | | 2020 | | | 2019 | | | 2018 | | | 2017 | | | 20162 | |
| | | | | |
| Net asset value, beginning of year | | | $9.40 | | | | $10.35 | | | | $10.44 | | | | $9.62 | | | | $10.00 | |
| | | | | |
| Income (loss) from operations: | | | | | | | | | | | | | | | | | | | | |
Net investment loss | | | (0.09) | | | | (0.07) | | | | (0.04) | | | | (0.12) | | | | (0.16) | |
Net realized and unrealized gain (loss) | | | (0.29) | | | | (0.71) | | | | 0.04 | | | | 0.94 | | | | (0.22) | |
Total income (loss) from operations | | | (0.38) | | | | (0.78) | | | | 0.00 | 3 | | | 0.82 | | | | (0.38) | |
| | | | | |
| Less distributions from: | | | | | | | | | | | | | | | | | | | | |
Net investment income | | | — | | | | (0.17) | | | | (0.09) | | | | — | | | | — | |
Total distributions | | | — | | | | (0.17) | | | | (0.09) | | | | — | | | | — | |
| | | | | |
| Net asset value, end of year | | | $9.02 | | | | $9.40 | | | | $10.35 | | | | $10.44 | | | | $9.62 | |
Total return4 | | | (4.04) | % | | | (7.49) | % | | | (0.13) | % | | | 8.52 | % | | | (3.80) | % |
| | | | | |
| Net assets, end of year (000s) | | | $96 | | | | $100 | | | | $140 | | | | $194 | | | | $96 | |
| | | | | |
| Ratios to average net assets: | | | | | | | | | | | | | | | | | | | | |
Gross expenses | | | 3.36 | %5 | | | 4.11 | %5 | | | 3.67 | %5 | | | 6.13 | % | | | 9.69 | %6 |
Net expenses7,8 | | | 3.08 | 5 | | | 3.61 | 5 | | | 3.20 | 5 | | | 3.38 | | | | 4.09 | 6 |
Net investment loss | | | (0.94) | | | | (0.70) | | | | (0.35) | | | | (1.18) | | | | (1.97) | 6 |
| | | | | |
| Portfolio turnover rate9 | | | 139 | % | | | 147 | % | | | 64 | % | | | 100 | % | | | 143 | % |
| 1 | Per share amounts have been calculated using the average shares method. |
| 2 | For the period November 30, 2015 (inception date) to September 30, 2016. |
| 3 | Amount represents less than $0.005 per share. |
| 4 | Performance figures, exclusive of sales charges, may reflect compensating balance arrangements, fee waivers and/or expense reimbursements. In the absence of compensating balance arrangements, fee waivers and/or expense reimbursements, the total return would have been lower. Past performance is no guarantee of future results. Total returns for periods of less than one year are not annualized. |
| 5 | Reflects recapture of expenses waived/reimbursed from prior fiscal years. |
| 7 | Reflects fee waivers and/or expense reimbursements. |
| 8 | As a result of an expense limitation arrangement, the ratio of total annual fund operating expenses, other than interest; brokerage commissions and expenses; fees, costs and expenses associated with any prime brokerage arrangement (including the costs of any securities borrowing arrangement); dividend and interest expenses on securities sold short, taxes, extraordinary expenses and acquired fund fees and expenses, to average net assets of Class A shares did not exceed 1.55%. Total annual fund operating expenses after waiving fees and/or reimbursing expenses exceed the expense cap as a result of dividend and interest expenses on securities sold short. This expense limitation arrangement cannot be terminated prior to December 31, 2021 without the Board of Trustees’ consent. |
| 9 | Excluding short sale transactions. If short sale transactions had been included, the portfolio turnover rate would have been 280% for the year ended September 30, 2020, 335% for the year ended September 30, 2019, 141% for the year ended September 30, 2018, 576% for the year ended September 30, 2017 and 398% for the period ended September 30, 2016. |
See Notes to Financial Statements.
| | |
40 | | QS Global Market Neutral Fund 2020 Annual Report |
| | | | | | | | | | | | |
For a share of each class of beneficial interest outstanding throughout each year ended September 30,
unless otherwise noted: | |
| Class C Shares1 | | 2020 | | | 2019 | | | 20182 | |
| | | |
| Net asset value, beginning of year | | | $9.30 | | | | $10.33 | | | | $10.09 | |
| | | |
| Income (loss) from operations: | | | | | | | | | | | | |
Net investment loss | | | (0.14) | | | | (0.13) | | | | (0.01) | |
Net realized and unrealized gain (loss) | | | (0.29) | | | | (0.70) | | | | 0.25 | |
Total income (loss) from operations | | | (0.43) | | | | (0.83) | | | | 0.24 | |
| | | |
| Less distributions from: | | | | | | | | | | | | |
Net investment income | | | — | | | | (0.20) | | | | — | |
Total distributions | | | — | | | | (0.20) | | | | — | |
| | | |
| Net asset value, end of year | | | $8.87 | | | | $9.30 | | | | $10.33 | |
Total return3 | | | (4.52) | % | | | (8.14) | % | | | 2.28 | % |
| | | |
| Net assets, end of year (000s) | | | $45 | | | | $47 | | | | $51 | |
| | | |
| Ratios to average net assets: | | | | | | | | | | | | |
Gross expenses | | | 3.97 | % | | | 4.76 | %4 | | | 4.68 | %5 |
Net expenses6,7 | | | 3.69 | | | | 4.27 | 4 | | | 4.03 | 5 |
Net investment loss | | | (1.55) | | | | (1.28) | | | | (0.54) | 5 |
| | | |
| Portfolio turnover rate8 | | | 139 | % | | | 147 | % | | | 64 | %9 |
| 1 | Per share amounts have been calculated using the average shares method. |
| 2 | For the period July 16, 2018 (inception date) to September 30, 2018. |
| 3 | Performance figures, exclusive of CDSC, may reflect compensating balance arrangements, fee waivers and/or expense reimbursements. In the absence of compensating balance arrangements, fee waivers and/or expense reimbursements, the total return would have been lower. Past performance is no guarantee of future results. Total returns for periods of less than one year are not annualized. |
| 4 | Reflects recapture of expenses waived/reimbursed from prior fiscal years. |
| 6 | Reflects fee waivers and/or expense reimbursements. |
| 7 | As a result of an expense limitation arrangement, the ratio of total annual fund operating expenses, other than interest; brokerage commissions and expenses; fees, costs and expenses associated with any prime brokerage arrangement (including the costs of any securities borrowing arrangement); dividend and interest expenses on securities sold short, taxes, extraordinary expenses and acquired fund fees and expenses, to average net assets of Class C shares did not exceed 2.30%. Total annual fund operating expenses after waiving fees and/or reimbursing expenses exceed the expense cap as a result of dividend and interest expenses on securities sold short. This expense limitation arrangement cannot be terminated prior to December 31, 2021 without the Board of Trustees’ consent. |
| 8 | Excluding short sale transactions. If short sale transactions had been included, the portfolio turnover rate would have been 280% for the year ended September 30, 2020, 335% for the year ended September 30, 2019 and 141% for the year ended September 30, 2018. |
| 9 | For the year ended September 30, 2018. |
See Notes to Financial Statements.
| | |
| QS Global Market Neutral Fund 2020 Annual Report | | 41 |
Financial highlights (cont’d)
| | | | | | | | | | | | | | | | | | | | |
For a share of each class of beneficial interest outstanding throughout each year ended September 30,
unless otherwise noted: | |
| Class I Shares1 | | 2020 | | | 2019 | | | 2018 | | | 2017 | | | 20162 | |
| | | | | |
| Net asset value, beginning of year | | | $9.42 | | | | $10.42 | | | | $10.50 | | | | $9.64 | | | | $10.00 | |
| | | | | |
| Income (loss) from operations: | | | | | | | | | | | | | | | | | | | | |
Net investment loss | | | (0.05) | | | | (0.03) | | | | (0.01) | | | | (0.09) | | | | (0.11) | |
Net realized and unrealized gain (loss) | | | (0.29) | | | | (0.72) | | | | 0.04 | | | | 0.95 | | | | (0.25) | |
Total income (loss) from operations | | | (0.34) | | | | (0.75) | | | | 0.03 | | | | 0.86 | | | | (0.36) | |
| | | | | |
| Less distributions from: | | | | | | | | | | | | | | | | | | | | |
Net investment income | | | (0.02) | | | | (0.25) | | | | (0.11) | | | | — | | | | — | |
Total distributions | | | (0.02) | | | | (0.25) | | | | (0.11) | | | | — | | | | — | |
| | | | | |
| Net asset value, end of year | | | $9.06 | | | | $9.42 | | | | $10.42 | | | | $10.50 | | | | $9.64 | |
Total return3 | | | (3.63) | % | | | (7.25) | % | | | 0.18 | % | | | 8.81 | % | | | (3.50) | % |
| | | | | |
| Net assets, end of year (000s) | | | $4,903 | | | | $5,355 | | | | $4,807 | | | | $4,378 | | | | $1,545 | |
| | | | | |
| Ratios to average net assets: | | | | | | | | | | | | | | | | | | | | |
Gross expenses | | | 2.99 | %4 | | | 3.79 | %4 | | | 3.18 | %4 | | | 5.98 | %4 | | | 9.01 | %5 |
Net expenses6,7 | | | 2.71 | 4 | | | 3.31 | 4 | | | 2.71 | 4 | | | 3.24 | 4 | | | 3.99 | 5 |
Net investment loss | | | (0.54) | | | | (0.27) | | | | (0.12) | | | | (0.88) | | | | (1.36) | 5 |
| | | | | |
| Portfolio turnover rate8 | | | 139 | % | | | 147 | % | | | 64 | % | | | 100 | % | | | 143 | % |
| 1 | Per share amounts have been calculated using the average shares method. |
| 2 | For the period November 30, 2015 (inception date) to September 30, 2016. |
| 3 | Performance figures may reflect compensating balance arrangements, fee waivers and/or expense reimbursements. In the absence of compensating balance arrangements, fee waivers and/or expense reimbursements, the total return would have been lower. Past performance is no guarantee of future results. Total returns for periods of less than one year are not annualized. |
| 4 | Reflects recapture of expenses waived/reimbursed from prior fiscal years. |
| 6 | Reflects fee waivers and/or expense reimbursements. |
| 7 | As a result of an expense limitation arrangement, the ratio of total annual fund operating expenses, other than interest; brokerage commissions and expenses; fees, costs and expenses associated with any prime brokerage arrangement (including the costs of any securities borrowing arrangement); dividend and interest expenses on securities sold short, taxes, extraordinary expenses and acquired fund fees and expenses, to average net assets of Class I shares did not exceed 1.20%. Total annual fund operating expenses after waiving fees and/or reimbursing expenses exceed the expense cap as a result of dividend and interest expenses on securities sold short. This expense limitation arrangement cannot be terminated prior to December 31, 2021 without the Board of Trustees’ consent. |
| 8 | Excluding short sale transactions. If short sale transactions had been included, the portfolio turnover rate would have been 280% for the year ended September 30, 2020, 335% for the year ended September 30, 2019, 141% for the year ended September 30, 2018, 576% for the year ended September 30, 2017 and 398% for the period ended September 30, 2016. |
See Notes to Financial Statements.
| | |
42 | | QS Global Market Neutral Fund 2020 Annual Report |
| | | | | | | | | | | | | | | | | | | | |
For a share of each class of beneficial interest outstanding throughout each year ended September 30,
unless otherwise noted: | |
| Class IS Shares1 | | 2020 | | | 2019 | | | 2018 | | | 2017 | | | 20162 | |
| | | | | |
| Net asset value, beginning of year | | | $9.44 | | | | $10.43 | | | | $10.51 | | | | $9.65 | | | | $10.00 | |
| | | | | |
| Income (loss) from operations: | | | | | | | | | | | | | | | | | | | | |
Net investment loss | | | (0.05) | | | | (0.00) | 3 | | | (0.01) | | | | (0.02) | | | | (0.14) | |
Net realized and unrealized gain (loss) | | | (0.28) | | | | (0.74) | | | | 0.04 | | | | 0.88 | | | | (0.21) | |
Total income (loss) from operations | | | (0.33) | | | | (0.74) | | | | 0.03 | | | | 0.86 | | | | (0.35) | |
| | | | | |
| Less distributions from: | | | | | | | | | | | | | | | | | | | | |
Net investment income | | | (0.03) | | | | (0.25) | | | | (0.11) | | | | — | | | | — | |
Total distributions | | | (0.03) | | | | (0.25) | | | | (0.11) | | | | — | | | | — | |
| | | | | |
| Net asset value, end of year | | | $9.08 | | | | $9.44 | | | | $10.43 | | | | $10.51 | | | | $9.65 | |
Total return4 | | | (3.54) | % | | | (7.13) | % | | | 0.18 | % | | | 8.91 | % | | | (3.50) | % |
| | | | | |
| Net assets, end of year (000s) | | | $53,182 | | | | $57,929 | | | | $38,012 | | | | $36,415 | | | | $4,631 | |
| | | | | |
| Ratios to average net assets: | | | | | | | | | | | | | | | | | | | | |
Gross expenses | | | 2.91 | %5 | | | 3.67 | %5 | | | 3.17 | %5 | | | 5.52 | % | | | 9.40 | %6 |
Net expenses7,8 | | | 2.63 | 5 | | | 3.18 | 5 | | | 2.70 | 5 | | | 2.81 | | | | 3.78 | 6 |
Net investment loss | | | (0.50) | | | | (0.05) | | | | (0.11) | | | | (0.17) | | | | (1.66) | 6 |
| | | | | |
| Portfolio turnover rate9 | | | 139 | % | | | 147 | % | | | 64 | % | | | 100 | % | | | 143 | % |
| 1 | Per share amounts have been calculated using the average shares method. |
| 2 | For the period November 30, 2015 (inception date) to September 30, 2016. |
| 3 | Amount represents less than $0.005 per share. |
| 4 | Performance figures may reflect compensating balance arrangements, fee waivers and/or expense reimbursements. In the absence of compensating balance arrangements, fee waivers and/or expense reimbursements, the total return would have been lower. Past performance is no guarantee of future results. Total returns for periods of less than one year are not annualized. |
| 5 | Reflects recapture of expenses waived/reimbursed from prior fiscal years. |
| 7 | Reflects fee waivers and/or expense reimbursements. |
| 8 | As a result of an expense limitation arrangement, the ratio of total annual fund operating expenses, other than interest; brokerage commissions and expenses; fees, costs and expenses associated with any prime brokerage arrangement (including the costs of any securities borrowing arrangement); dividend and interest expenses on securities sold short, taxes, extraordinary expenses and acquired fund fees and expenses, to average net assets of Class IS shares did not exceed 1.10%. In addition, the ratio of the total annual fund operating expenses for Class IS shares did not exceed the ratio of total annual fund operating expenses for Class I shares. Total annual fund operating expenses after waiving fees and/or reimbursing expenses exceed the expense cap as a result of dividend and interest expenses on securities sold short. These expense limitation arrangements cannot be terminated prior to December 31, 2021 without the Board of Trustees’ consent. |
| 9 | Excluding short sale transactions. If short sale transactions had been included, the portfolio turnover rate would have been 280% for the year ended September 30, 2020, 335% for the year ended September 30, 2019, 141% for the year ended September 30, 2018, 576% for the year ended September 30, 2017 and 398% for the period ended September 30, 2016. |
See Notes to Financial Statements.
| | |
| QS Global Market Neutral Fund 2020 Annual Report | | 43 |
Notes to financial statements
1. Organization and significant accounting policies
QS Global Market Neutral Fund (the “Fund”) is a separate diversified investment series of Legg Mason Global Asset Management Trust (the “Trust”). The Trust, a Maryland statutory trust, is registered under the Investment Company Act of 1940, as amended (the “1940 Act”), as an open-end management investment company.
The following are significant accounting policies consistently followed by the Fund and are in conformity with U.S. generally accepted accounting principles (“GAAP”). Estimates and assumptions are required to be made regarding assets, liabilities and changes in net assets resulting from operations when financial statements are prepared. Changes in the economic environment, financial markets and any other parameters used in determining these estimates could cause actual results to differ. Subsequent events have been evaluated through the date the financial statements were issued.
(a) Investment valuation. Equity securities for which market quotations are available are valued at the last reported sales price or official closing price on the primary market or exchange on which they trade. The valuations for fixed income securities (which may include, but are not limited to, corporate, government, municipal, mortgage-backed, collateralized mortgage obligations and asset-backed securities) and certain derivative instruments are typically the prices supplied by independent third party pricing services, which may use market prices or broker/dealer quotations or a variety of valuation techniques and methodologies. The independent third party pricing services use inputs that are observable such as issuer details, interest rates, yield curves, prepayment speeds, credit risks/spreads, default rates and quoted prices for similar securities. Investments in open-end funds are valued at the closing net asset value per share of each fund on the day of valuation. When the Fund holds securities or other assets that are denominated in a foreign currency, the Fund will normally use the currency exchange rates as of 4:00 p.m. (Eastern Time). If independent third party pricing services are unable to supply prices for a portfolio investment, or if the prices supplied are deemed by the manager to be unreliable, the market price may be determined by the manager using quotations from one or more broker/dealers or at the transaction price if the security has recently been purchased and no value has yet been obtained from a pricing service or pricing broker. When reliable prices are not readily available, such as when the value of a security has been significantly affected by events after the close of the exchange or market on which the security is principally traded, but before the Fund calculates its net asset value, the Fund values these securities as determined in accordance with procedures approved by the Fund’s Board of Trustees.
The Board of Trustees is responsible for the valuation process and has delegated the supervision of the daily valuation process to the Legg Mason North Atlantic Fund Valuation Committee (the “Valuation Committee”). The Valuation Committee, pursuant to the policies adopted by the Board of Trustees, is responsible for making fair value determinations, evaluating the effectiveness of the Fund’s pricing policies, and reporting to the Board of Trustees. When determining the reliability of third party pricing information for investments owned by the Fund, the Valuation Committee, among other things, conducts due diligence reviews of pricing vendors, monitors the daily change in prices and reviews transactions among market participants.
| | |
44 | | QS Global Market Neutral Fund 2020 Annual Report |
The Valuation Committee will consider pricing methodologies it deems relevant and appropriate when making fair value determinations. Examples of possible methodologies include, but are not limited to, multiple of earnings; discount from market of a similar freely traded security; discounted cash-flow analysis; book value or a multiple thereof; risk premium/yield analysis; yield to maturity; and/or fundamental investment analysis. The Valuation Committee will also consider factors it deems relevant and appropriate in light of the facts and circumstances. Examples of possible factors include, but are not limited to, the type of security; the issuer’s financial statements; the purchase price of the security; the discount from market value of unrestricted securities of the same class at the time of purchase; analysts’ research and observations from financial institutions; information regarding any transactions or offers with respect to the security; the existence of merger proposals or tender offers affecting the security; the price and extent of public trading in similar securities of the issuer or comparable companies; and the existence of a shelf registration for restricted securities.
For each portfolio security that has been fair valued pursuant to the policies adopted by the Board of Trustees, the fair value price is compared against the last available and next available market quotations. The Valuation Committee reviews the results of such back testing monthly and fair valuation occurrences are reported to the Board of Trustees quarterly.
The Fund uses valuation techniques to measure fair value that are consistent with the market approach and/or income approach, depending on the type of security and the particular circumstance. The market approach uses prices and other relevant information generated by market transactions involving identical or comparable securities. The income approach uses valuation techniques to discount estimated future cash flows to present value.
GAAP establishes a disclosure hierarchy that categorizes the inputs to valuation techniques used to value assets and liabilities at measurement date. These inputs are summarized in the three broad levels listed below:
| • | | Level 1 — quoted prices in active markets for identical investments |
| • | | Level 2 — other significant observable inputs (including quoted prices for similar investments, interest rates, prepayment speeds, credit risk, etc.) |
| • | | Level 3 — significant unobservable inputs (including the Fund’s own assumptions in determining the fair value of investments) |
The inputs or methodologies used to value securities are not necessarily an indication of the risk associated with investing in those securities.
| | |
| QS Global Market Neutral Fund 2020 Annual Report | | 45 |
Notes to financial statements (cont’d)
The following is a summary of the inputs used in valuing the Fund’s assets and liabilities carried at fair value:
| | | | | | | | | | | | | | | | |
| ASSETS | |
| Description | | Quoted
Prices (Level 1) | | | Other Significant
Observable Inputs
(Level 2)* | | | Significant
Unobservable
Inputs
(Level 3) | | | Total | |
| Long-Term Investments†: | | | | | | | | | | | | | | | | |
Common Stocks: | | | | | | | | | | | | | | | | |
Communication Services | | $ | 1,642,481 | | | $ | 2,936,582 | | | | — | | | $ | 4,579,063 | |
Consumer Discretionary | | | 3,609,968 | | | | 3,580,874 | | | | — | | | | 7,190,842 | |
Consumer Staples | | | 1,236,295 | | | | 2,597,337 | | | | — | | | | 3,833,632 | |
Energy | | | 121,325 | | | | 1,313,007 | | | | — | | | | 1,434,332 | |
Financials | | | 2,502,081 | | | | 4,417,108 | | | | — | | | | 6,919,189 | |
Health Care | | | 2,990,016 | | | | 1,858,659 | | | | — | | | | 4,848,675 | |
Industrials | | | 2,763,058 | | | | 6,025,188 | | | | — | | | | 8,788,246 | |
Information Technology | | | 3,510,428 | | | | 4,177,566 | | | | — | | | | 7,687,994 | |
Materials | | | 1,468,222 | | | | 2,394,207 | | | | — | | | | 3,862,429 | |
Real Estate | | | 1,115,807 | | | | 1,651,203 | | | | — | | | | 2,767,010 | |
Utilities | | | 883,720 | | | | 950,510 | | | | — | | | | 1,834,230 | |
| Total Long-Term Investments | | | 21,843,401 | | | | 31,902,241 | | | | — | | | | 53,745,642 | |
| Short-Term Investments† | | | 2,587,870 | | | | — | | | | — | | | | 2,587,870 | |
| Total Investments | | $ | 24,431,271 | | | $ | 31,902,241 | | | | — | | | $ | 56,333,512 | |
| Other Financial Instruments: | | | | | | | | | | | | | | | | |
Forward Foreign Currency Contracts | | | — | | | $ | 111,257 | | | | — | | | $ | 111,257 | |
| Total | | $ | 24,431,271 | | | $ | 32,013,498 | | | | — | | | $ | 56,444,769 | |
| | |
46 | | QS Global Market Neutral Fund 2020 Annual Report |
| | | | | | | | | | | | | | | | |
| LIABILITIES | |
| Description | | Quoted Prices
(Level 1) | | | Other Significant
Observable Inputs
(Level 2)* | | | Significant
Unobservable
Inputs
(Level 3) | | | Total | |
| Securities Sold Short†: | | | | | | | | | | | | | | | | |
Common Stocks: | | | | | | | | | | | | | | | | |
Communication Services | | $ | 1,241,196 | | | $ | 3,171,148 | | | | — | | | $ | 4,412,344 | |
Consumer Discretionary | | | 1,434,997 | | | | 5,628,955 | | | | — | | | | 7,063,952 | |
Consumer Staples | | | 601,777 | | | | 3,485,776 | | | | — | | | | 4,087,553 | |
Energy | | | 822,484 | | | | 582,944 | | | | — | | | | 1,405,428 | |
Financials | | | 2,908,158 | | | | 4,094,497 | | | | — | | | | 7,002,655 | |
Health Care | | | 2,886,618 | | | | 1,916,807 | | | | — | | | | 4,803,425 | |
Industrials | | | 2,370,926 | | | | 6,345,053 | | | | — | | | | 8,715,979 | |
Information Technology | | | 3,269,950 | | | | 4,304,923 | | | | — | | | | 7,574,873 | |
Materials | | | 1,464,382 | | | | 2,374,171 | | | | — | | | | 3,838,553 | |
Real Estate | | | 1,806,749 | | | | 977,201 | | | | — | | | | 2,783,950 | |
Utilities | | | 1,027,053 | | | | 949,663 | | | | — | | | | 1,976,716 | |
Warrants | | | 6,750 | | | | — | | | | — | | | | 6,750 | |
Total Securities Sold Short | | | 19,841,040 | | | | 33,831,138 | | | | — | | | | 53,672,178 | |
| Other Financial Instruments: | | | | | | | | | | | | | | | | |
Forward Foreign Currency Contracts | | | — | | | | 25,148 | | | | — | | | | 25,148 | |
| Total | | $ | 19,841,040 | | | $ | 33,856,286 | | | | — | | | $ | 53,697,326 | |
| * | As a result of the fair value pricing procedures for international equities utilized by the Fund, which account for events occurring after the close of the principal market of the security but prior to the calculation of the Fund’s net asset value, certain securities were classified as Level 2 within the fair value hierarchy. |
| † | See Schedule of Investments for additional detailed categorizations. |
(b) Forward foreign currency contracts. The Fund enters into a forward foreign currency contract to hedge against foreign currency exchange rate risk on its non-U.S. dollar denominated securities or to facilitate settlement of a foreign currency denominated portfolio transaction. A forward foreign currency contract is an agreement between two parties to buy and sell a currency at a set price with delivery and settlement at a future date. The contract is marked-to-market daily and the change in value is recorded by the Fund as an unrealized gain or loss. When a forward foreign currency contract is closed, through either delivery or offset by entering into another forward foreign currency contract, the Fund recognizes a realized gain or loss equal to the difference between the value of the contract at the time it was opened and the value of the contract at the time it is closed.
Forward foreign currency contracts involve elements of market risk in excess of the amounts reflected on the Statement of Assets and Liabilities. The Fund bears the risk of an unfavorable change in the foreign exchange rate underlying the forward foreign currency contract. Risks may also arise upon entering into these contracts from the potential inability of the counterparties to meet the terms of their contracts.
| | |
| QS Global Market Neutral Fund 2020 Annual Report | | 47 |
Notes to financial statements (cont’d)
(c) Short sale transactions. Short sales are transactions in which the Fund sells a security it does not own in anticipation of a decline in the market value of that security. To complete such a transaction, a Fund must borrow the security to deliver to the buyer. The Fund is then obligated to replace the security borrowed by purchasing it in the open market at the time of replacement. The proceeds received by the Fund for the short sale are retained by the broker as collateral until the Fund replaces the borrowed security. If the market value of the security sold short increases, additional collateral may be required. The amount of collateral required is determined daily by reference to the market value of the short positions. Liabilities for securities sold short are marked-to-market daily and reported at market value in the financial statements.
Short sale transactions may result in a risk of loss that may exceed the amount shown on the Statement of Assets and Liabilities. A gain, limited to the price at which the Fund sold the security short, or a loss, potentially unlimited in size, will be recognized upon termination of a short sale. Dividends on short positions are recorded as a liability on the ex-dividend date and are shown in the Statement of Operations as Dividend Expense because the Fund must pay the dividend to the lender of the security.
Short selling is a technique that may be considered speculative, involves risk beyond the amount of money used to secure each transaction and may represent a form of leverage.
(d) Foreign currency translation. Investment securities and other assets and liabilities denominated in foreign currencies are translated into U.S. dollar amounts based upon prevailing exchange rates on the date of valuation. Purchases and sales of investment securities and income and expense items denominated in foreign currencies are translated into U.S. dollar amounts based upon prevailing exchange rates on the respective dates of such transactions.
The Fund does not isolate that portion of the results of operations resulting from fluctuations in foreign exchange rates on investments from the fluctuations arising from changes in market prices of securities held. Such fluctuations are included with the net realized and unrealized gain or loss on investments.
Net realized foreign exchange gains or losses arise from sales of foreign currencies, including gains and losses on forward foreign currency contracts, currency gains or losses realized between the trade and settlement dates on securities transactions, and the difference between the amounts of dividends, interest, and foreign withholding taxes recorded on the Fund’s books and the U.S. dollar equivalent of the amounts actually received or paid. Net unrealized foreign exchange gains and losses arise from changes in the values of assets and liabilities, other than investments in securities, on the date of valuation, resulting from changes in exchange rates.
Foreign security and currency transactions may involve certain considerations and risks not typically associated with those of U.S. dollar denominated transactions as a result of, among other factors, the possibility of lower levels of governmental supervision and regulation of foreign securities markets and the possibility of political or economic instability.
| | |
48 | | QS Global Market Neutral Fund 2020 Annual Report |
(e) Foreign investment risks. The Fund’s investments in foreign securities may involve risks not present in domestic investments. Since securities may be denominated in foreign currencies, may require settlement in foreign currencies or pay interest or dividends in foreign currencies, changes in the relationship of these foreign currencies to the U.S. dollar can significantly affect the value of the investments and earnings of the Fund. Foreign investments may also subject the Fund to foreign government exchange restrictions, expropriation, taxation or other political, social or economic developments, all of which affect the market and/or credit risk of the investments.
(f) Counterparty risk and credit-risk-related contingent features of derivative instruments. The Fund may invest in certain securities or engage in other transactions, where the Fund is exposed to counterparty credit risk in addition to broader market risks. The Fund may invest in securities of issuers, which may also be considered counterparties as trading partners in other transactions. This may increase the risk of loss in the event of default or bankruptcy by the counterparty or if the counterparty otherwise fails to meet its contractual obligations. The Fund’s subadviser attempts to mitigate counterparty risk by (i) periodically assessing the creditworthiness of its trading partners, (ii) monitoring and/or limiting the amount of its net exposure to each individual counterparty based on its assessment and (iii) requiring collateral from the counterparty for certain transactions. Market events and changes in overall economic conditions may impact the assessment of such counterparty risk by the subadviser. In addition, declines in the values of underlying collateral received may expose the Fund to increased risk of loss.
With exchange traded and centrally cleared derivatives, there is less counterparty risk to the Fund since the exchange or clearinghouse, as counterparty to such instruments, guarantees against a possible default. The clearinghouse stands between the buyer and the seller of the contract; therefore, the credit risk is limited to failure of the clearinghouse. While offset rights may exist under applicable law, the Fund does not have a contractual right of offset against a clearing broker or clearinghouse in the event of a default of the clearing broker or clearinghouse.
The Fund has entered into master agreements, such as an International Swaps and Derivatives Association, Inc. Master Agreement (“ISDA Master Agreement”) or similar agreement, with certain of its derivative counterparties that govern over-the-counter derivatives and provide for general obligations, representations, agreements, collateral posting terms, netting provisions in the event of default or termination and credit related contingent features. The credit related contingent features include, but are not limited to, a percentage decrease in the Fund’s net assets or NAV over a specified period of time. If these credit related contingent features were triggered, the derivatives counterparty could terminate the positions and demand payment or require additional collateral.
Under an ISDA Master Agreement, the Fund may, under certain circumstances, offset with the counterparty certain derivative financial instruments’ payables and/or receivables with collateral held and/or posted and create one single net payment. However, absent an event of default by the counterparty or a termination of the agreement, the terms of the ISDA Master Agreements do not result in an offset of reported amounts of financial assets and
| | |
| QS Global Market Neutral Fund 2020 Annual Report | | 49 |
Notes to financial statements (cont’d)
financial liabilities in the Statement of Assets and Liabilities across transactions between the Fund and the applicable counterparty. The enforceability of the right to offset may vary by jurisdiction.
Collateral requirements differ by type of derivative. Collateral or margin requirements are set by the broker or exchange clearinghouse for exchange traded derivatives while collateral terms are contract specific for over-the-counter traded derivatives. Cash collateral that has been pledged to cover obligations of the Fund under derivative contracts, if any, will be reported separately in the Statement of Assets and Liabilities. Securities pledged as collateral, if any, for the same purpose are noted in the Schedule of Investments.
As of September 30, 2020, the Fund held forward foreign currency contracts with credit related contingent features which had a liability position of $25,148. If a contingent feature in the master agreements would have been triggered, the Fund would have been required to pay this amount to its derivative counterparties.
(g) Security transactions and investment income. Security transactions are accounted for on a trade date basis. Interest income (including interest income from payment-in-kind securities), adjusted for amortization of premium and accretion of discount, is recorded on the accrual basis. Dividend income is recorded on the ex-dividend date for dividends received in cash and/or securities. Foreign dividend income is recorded on the ex-dividend date or as soon as practicable after the Fund determines the existence of a dividend declaration after exercising reasonable due diligence. The cost of investments sold is determined by use of the specific identification method. To the extent any issuer defaults or a credit event occurs that impacts the issuer, the Fund may halt any additional interest income accruals and consider the realizability of interest accrued up to the date of default or credit event.
(h) REIT distributions. The character of distributions received from Real Estate Investment Trusts (‘‘REITs’’) held by the Fund is generally comprised of net investment income, capital gains, and return of capital. It is the policy of the Fund to estimate the character of distributions received from underlying REITs based on historical data provided by the REITs. After each calendar year end, REITs report the actual tax character of these distributions. Differences between the estimated and actual amounts reported by the REITs are reflected in the Fund’s records in the year in which they are reported by the REITs by adjusting related investment cost basis, capital gains and income, as necessary.
(i) Distributions to shareholders. Distributions from net investment income and distributions of net realized gains, if any, are declared at least annually. Distributions to shareholders of the Fund are recorded on the ex-dividend date and are determined in accordance with income tax regulations, which may differ from GAAP.
(j) Share class accounting. Investment income, common expenses and realized/ unrealized gains (losses) on investments are allocated to the various classes of the Fund on the basis of daily net assets of each class. Fees relating to a specific class are charged directly to that share class.
| | |
50 | | QS Global Market Neutral Fund 2020 Annual Report |
(k) Compensating balance arrangements. The Fund has an arrangement with its custodian bank whereby a portion of the custodian’s fees is paid indirectly by credits earned on the Fund’s cash on deposit with the bank.
(l) Federal and other taxes. It is the Fund’s policy to comply with the federal income and excise tax requirements of the Internal Revenue Code of 1986 (the “Code”), as amended, applicable to regulated investment companies. Accordingly, the Fund intends to distribute its taxable income and net realized gains, if any, to shareholders in accordance with timing requirements imposed by the Code. Therefore, no federal or state income tax provision is required in the Fund’s financial statements.
Management has analyzed the Fund’s tax positions taken on income tax returns for all open tax years and has concluded that as of September 30, 2020, no provision for income tax is required in the Fund’s financial statements. The Fund’s federal and state income and federal excise tax returns for tax years for which the applicable statutes of limitations have not expired are subject to examination by the Internal Revenue Service and state departments of revenue.
Under the applicable foreign tax laws, a withholding tax may be imposed on interest, dividends and capital gains at various rates.
(m) Reclassification. GAAP requires that certain components of net assets be reclassified to reflect permanent differences between financial and tax reporting. These reclassifications have no effect on net assets or net asset value per share. During the current year, the following reclassifications have been made:
| | | | | | | | |
| | | Total Distributable
Earnings (Loss) | | | Paid-in
Capital | |
| (a) | | $ | 471,100 | | | $ | (471,100) | |
| (a) | Reclassifications are due to a tax net operating loss and a taxable overdistribution. |
2. Investment management agreement and other transactions with affiliates
Legg Mason Partners Fund Advisor, LLC (“LMPFA”) is the Fund’s investment manager and QS Investors, LLC (“QS Investors”) is the Fund’s subadviser. Western Asset Management Company, LLC (“Western Asset”) manages the portion of the Fund’s cash and short-term instruments allocated to it. As of July 31, 2020, LMPFA, QS Investors and Western Asset are indirect, wholly-owned subsidiaries of Franklin Resources, Inc. (“Franklin Resources”). Prior to July 31, 2020, LMPFA, QS Investors and Western Asset were wholly-owned subsidiaries of Legg Mason, Inc. (“Legg Mason”). As of July 31, 2020, Legg Mason is a subsidiary of Franklin Resources.
Under the investment management agreement, the Fund pays an investment management fee, calculated daily and paid monthly, at an annual rate of 0.95% of the Fund’s average daily net assets.
LMPFA provides administrative and certain oversight services to the Fund. LMPFA delegates to the subadviser the day-to-day portfolio management of the Fund, except for the management of the portion of the cash and short-term instruments allocated to Western Asset. For its services, LMPFA pays QS Investors a fee monthly, at an annual rate equal to
| | |
| QS Global Market Neutral Fund 2020 Annual Report | | 51 |
Notes to financial statements (cont’d)
70% of the net management fee it receives from the Fund. For Western Asset’s services to the Fund, LMPFA pays Western Asset monthly 0.02% of the portion of the Fund’s average daily net assets that are allocated to Western Asset by LMPFA.
As a result of expense limitation arrangements between the Fund and LMPFA, the ratio of total annual fund operating expenses, other than interest; brokerage commissions and expenses; fees, costs and expenses associated with any prime brokerage arrangement (including the costs of any securities borrowing arrangement); dividend and interest expenses on securities sold short, taxes, extraordinary expenses and acquired fund fees and expenses, to average net assets of Class A, Class C, Class I and Class IS shares did not exceed 1.55%, 2.30%, 1.20% and 1.10%, respectively. In addition, the ratio of total annual fund operating expenses for Class IS shares did not exceed the ratio of total annual fund operating expenses for Class I shares. Total annual fund operating expenses after waiving fees and reimbursing expenses, as applicable, exceed the expense cap for each class as a result of dividend and interest expenses on securities sold short. These expense limitation arrangements cannot be terminated prior to December 31, 2021 without the Board of Trustees’ consent.
During the year ended September 30, 2020, fees waived and/or expenses reimbursed amounted to $176,954.
LMPFA is permitted to recapture amounts waived and/or reimbursed to a class within three years after the fiscal year in which LMPFA earned the fee or incurred the expense if the class’ total annual fund operating expenses have fallen to a level below the expense limitation (“expense cap”) in effect at the time the fees were earned or the expenses incurred. In no case will LMPFA recapture any amount that would result, on any particular business day of the Fund, in the class’ total annual fund operating expenses exceeding the expense cap or any other lower limit then in effect.
Pursuant to these arrangements, at September 30, 2020, the Fund had remaining fee waivers and/or expense reimbursements subject to recapture by LMPFA and respective dates of expiration as follows:
| | | | | | | | | | | | | | | | |
| | | Class A | | | Class C | | | Class I | | | Class IS | |
| Expires September 30, 2021 | | $ | 1,041 | | | $ | 61 | | | $ | 20,800 | | | $ | 177,839 | |
| Expires September 30, 2022 | | | 563 | | | | 244 | | | | 24,282 | | | | 179,458 | |
| Expires September 30, 2023 | | | 276 | | | | 126 | | | | 14,342 | | | | 161,282 | |
| Total fee waivers/expense reimbursements subject to recapture | | $ | 1,880 | | | $ | 431 | | | $ | 59,424 | | | $ | 518,579 | |
For the year ended September 30, 2020, fee waivers and/or expense reimbursements recaptured by LMPFA, if any, were as follows:
| | | | | | | | | | | | |
| | | Class A | | | Class I | | | Class IS | |
| LMPFA recaptured | | $ | 44 | | | $ | 4,483 | | | $ | 1,282 | |
As of July 31, 2020, Legg Mason Investor Services, LLC (“LMIS”) is an indirect, wholly-owned broker-dealer subsidiary of Franklin Resources and serves as the Fund’s sole and exclusive distributor. Prior to July 31, 2020, LMIS was a wholly-owned broker-dealer subsidiary of Legg Mason.
| | |
52 | | QS Global Market Neutral Fund 2020 Annual Report |
There is a maximum initial sales charge of 5.75% for Class A shares. There is a contingent deferred sales charge (“CDSC”) of 1.00% on Class C shares, which applies if redemption occurs within 12 months from purchase payment. In certain cases, Class A shares have a 1.00% CDSC, which applies if redemption occurs within 18 months from purchase payment. This CDSC only applies to those purchases of Class A shares, which, when combined with current holdings of other shares of funds sold by LMIS, equal or exceed $1,000,000 in the aggregate. These purchases do not incur an initial sales charge.
For the year ended September 30, 2020, LMIS and its affiliates did not receive any sales charges on sales of the Fund’s Class A shares. In addition, for the year ended September 30, 2020, there were no CDSCs paid to LMIS and its affiliates.
As of July 31, 2020, all officers and one Trustee of the Trust are employees of Franklin Resources or its affiliates and do not receive compensation from the Trust. Prior to July 31, 2020, all officers and one Trustee of the Trust were employees of Legg Mason and did not receive compensation from the Trust.
As of September 30, 2020, Legg Mason and its affiliates owned 91% of the Fund.
3. Investments
During the year ended September 30, 2020, the aggregate cost of purchases and proceeds from sales of investments (excluding short-term investments) were as follows:
| | | | |
| | | Investments* | |
| Purchases | | $ | 80,412,723 | |
| Sales | | | 89,836,480 | |
| * | Excluding securities sold short and covers on securities sold short in the amount of $72,553,160 and $85,043,796, respectively. |
At September 30, 2020, the aggregate cost of investments and the aggregate gross unrealized appreciation and depreciation of investments for federal income tax purposes were as follows:
| | | | | | | | | | | | | | | | |
| | | Cost/
(Proceeds) | | | Gross
Unrealized
Appreciation | | | Gross
Unrealized
Depreciation | | | Net
Unrealized
Appreciation
(Depreciation) | |
| Securities | | $ | 50,453,415 | | | $ | 8,136,707 | | | $ | (2,256,610) | | | $ | 5,880,097 | |
| Securities sold short | | | (49,770,769) | | | | 3,774,195 | | | | (7,675,604) | | | | (3,901,409) | |
| Forward foreign currency contracts | | | — | | | | 111,257 | | | | (25,148) | | | | 86,109 | |
| | |
| QS Global Market Neutral Fund 2020 Annual Report | | 53 |
Notes to financial statements (cont’d)
4. Derivative instruments and hedging activities
Below is a table, grouped by derivative type, that provides information about the fair value and the location of derivatives within the Statement of Assets and Liabilities at September 30, 2020.
| | | | |
| ASSET DERIVATIVES1 | |
| | | Foreign
Exchange Risk | |
| Forward foreign currency contracts | | $ | 111,257 | |
| |
| LIABILITY DERIVATIVES1 | | | |
| | | Foreign
Exchange Risk | |
| Forward foreign currency contracts | | $ | 25,148 | |
| 1 | Generally, the balance sheet location for asset derivatives is receivables/net unrealized appreciation and for liability derivatives is payables/net unrealized depreciation. |
The following tables provide information about the effect of derivatives and hedging activities on the Fund’s Statement of Operations for the year ended September 30, 2020. The first table provides additional detail about the amounts and sources of gains (losses) realized on derivatives during the period. The second table provides additional information about the change in unrealized appreciation (depreciation) resulting from the Fund’s derivatives and hedging activities during the period.
| | | | |
| AMOUNT OF REALIZED GAIN (LOSS) ON DERIVATIVES RECOGNIZED | |
| | | Foreign
Exchange Risk | |
| Forward foreign currency contracts | | | $(496,957) | |
|
| CHANGE IN UNREALIZED APPRECIATION (DEPRECIATION) ON DERIVATIVES RECOGNIZED | |
| | | Foreign
Exchange Risk | |
| Forward foreign currency contracts | | $ | (143,232) | |
During the year ended September 30, 2020, the volume of derivative activity for the Fund was as follows:
| | | | |
| | | Average
Market Value | |
| Forward foreign currency contracts (to sell) | | $ | 29,818,402 | |
| | |
54 | | QS Global Market Neutral Fund 2020 Annual Report |
The following table presents the Fund’s OTC derivative assets and liabilities by counterparty net of amounts available for offset under an ISDA Master Agreement and net of the related collateral pledged (received) by the Fund as of September 30, 2020.
| | | | | | | | | | | | | | | | | | |
| Counterparty | | Gross Assets
Subject to
Master
Agreements1 | | | Gross Liabilities
Subject to
Master
Agreements1 | | | Net Assets
(Liabilities)
Subject to
Master
Agreements | | | Collateral
Pledged
(Received) | | Net
Amount2
| |
| Bank of New York | | $ | 1,945 | | | $ | (25,148) | | | $ | (23,203) | | | — | | $ | (23,203) | |
| Citibank N.A. | | | 44,958 | | | | — | | | | 44,958 | | | — | | | 44,958 | |
| Northern Trust Co. | | | 64,354 | | | | — | | | | 64,354 | | | — | | | 64,354 | |
| Total | | $ | 111,257 | | | $ | (25,148) | | | $ | 86,109 | | | — | | $ | 86,109 | |
| 1 | Absent an event of default or early termination, derivative assets and liabilities are presented gross and not offset in the Statement of Assets and Liabilities. |
| 2 | Represents the net amount receivable (payable) from (to) the counterparty in the event of default. |
5. Class specific expenses, waivers and/or expense reimbursements
The Fund has adopted a Rule 12b-1 shareholder services and distribution plan and under that plan the Fund pays service and/or distribution fees with respect to its Class A and Class C shares calculated at the annual rate of 0.25% and 1.00% of the average daily net assets of each class, respectively. Service and/or distribution fees are accrued daily and paid monthly.
For the year ended September 30, 2020, class specific expenses were as follows:
| | | | | | | | |
| | | Service and/or
Distribution Fees | | | Transfer Agent
Fees | |
| Class A | | $ | 243 | | | $ | 154 | |
| Class C | | | 454 | | | | 28 | |
| Class I | | | — | | | | 718 | |
| Class IS | | | — | | | | 1,242 | |
| Total | | $ | 697 | | | $ | 2,142 | |
For the year ended September 30, 2020, waivers and/or expense reimbursements by class were as follows:
| | | | |
| | | Waivers/Expense
Reimbursements | |
| Class A | | $ | 277 | |
| Class C | | | 127 | |
| Class I | | | 14,423 | |
| Class IS | | | 162,127 | |
| Total | | $ | 176,954 | |
| | |
| QS Global Market Neutral Fund 2020 Annual Report | | 55 |
Notes to financial statements (cont’d)
6. Distributions to shareholders by class
| | | | | | | | |
| | | Year Ended
September 30, 2020 | | | Year Ended
September 30, 2019 | |
| Net Investment Income: | | | | | | | | |
| Class A | | | — | | | $ | 1,910 | |
| Class C | | | — | | | | 995 | |
| Class I | | $ | 10,593 | | | | 114,373 | |
| Class IS | | | 166,215 | | | | 832,724 | |
| Total | | $ | 176,808 | | | $ | 950,002 | |
7. Shares of beneficial interest
At September 30, 2020, the Trust had an unlimited number of shares of beneficial interest authorized with a par value of $0.00001 per share. The Fund has the ability to issue multiple classes of shares. Each class of shares represents an identical interest and has the same rights, except that each class bears certain direct expenses, including those specifically related to the distribution of its shares.
Transactions in shares of each class were as follows:
| | | | | | | | | | | | | | | | |
| | | Year Ended
September 30, 2020 | | | Year Ended
September 30, 2019 | |
| | | Shares | | | Amount | | | Shares | | | Amount | |
| Class A | | | | | | | | | | | | | | | | |
| Shares sold | | | — | | | | — | | | | 29 | | | $ | 287 | |
| Shares issued on reinvestment | | | — | | | | — | | | | 194 | | | | 1,910 | |
| Shares repurchased | | | (16) | | | $ | (143) | | | | (3,063) | | | | (31,356) | |
| Net decrease | | | (16) | | | $ | (143) | | | | (2,840) | | | $ | (29,159) | |
| | | | |
| Class C | | | | | | | | | | | | | | | | |
| Shares sold | | | — | | | | — | | | | — | | | | — | |
| Shares issued on reinvestment | | | — | | | | — | | | | 102 | | | $ | 995 | |
| Shares repurchased | | | — | | | | — | | | | — | | | | — | |
| Net increase | | | — | | | | — | | | | 102 | | | $ | 995 | |
| | | | |
| Class I | | | | | | | | | | | | | | | | |
| Shares sold | | | 171,428 | | | $ | 1,576,242 | | | | 99,188 | | | $ | 969,804 | |
| Shares issued on reinvestment | | | 1,133 | | | | 10,593 | | | | 11,588 | | | | 114,373 | |
| Shares repurchased | | | (199,625) | | | | (1,815,875) | | | | (4,076) | | | | (38,825) | |
| Net increase (decrease) | | | (27,064) | | | $ | (229,040) | | | | 106,700 | | | $ | 1,045,352 | |
| | | | |
| Class IS | | | | | | | | | | | | | | | | |
| Shares sold | | | 605,735 | | | $ | 5,553,554 | | | | 2,747,576 | | | $ | 25,747,129 | |
| Shares issued on reinvestment | | | 16,984 | | | | 158,968 | | | | 84,016 | | | | 830,082 | |
| Shares repurchased | | | (900,023) | | | | (8,199,285) | | | | (341,807) | | | | (3,533,448) | |
| Net increase (decrease) | | | (277,304) | | | $ | (2,486,763) | | | | 2,489,785 | | | $ | 23,043,763 | |
| | |
56 | | QS Global Market Neutral Fund 2020 Annual Report |
8. Income tax information and distributions to shareholders
The tax character of distributions paid during the fiscal years ended September 30, was as follows:
| | | | | | | | |
| | | 2020 | | | 2019 | |
| Distributions paid from: | | | | | | | | |
| Ordinary income | | $ | 176,808 | | | $ | 950,002 | |
As of September 30, 2020, the components of distributable earnings (loss) on a tax basis were as follows:
| | | | |
| Deferred capital losses* | | $ | (9,238,937) | |
| Other book/tax temporary differences(a) | | | (448,889) | |
| Unrealized appreciation (depreciation)(b) | | | 4,207,600 | |
| Total distributable earnings (loss) — net | | $ | (5,480,226) | |
| * | These capital losses have been deferred in the current year as either short-term or long-term losses. The losses will be deemed to occur on the first day of the next taxable year in the same character as they were originally deferred and will be available to offset future taxable capital gains. |
| (a) | Other book/tax temporary differences are attributable to the realization for tax purposes of unrealized gains (losses) on certain foreign currency contracts, deferral of certain late year losses for tax purposes, deferral of short sale losses for tax purposes and book/tax differences in the timing of the deductibility of various expenses. |
| (b) | The difference between book-basis and tax-basis unrealized appreciation (depreciation) is attributable to the tax deferral of losses on wash sales and the realization for tax purposes of unrealized gains on investments in passive foreign investment companies and book/tax differences in the cost basis of partnership investments. |
9. Other matter
The outbreak of the respiratory illness COVID-19 (commonly referred to as “coronavirus”) has continued to rapidly spread around the world, causing considerable uncertainty for the global economy and financial markets. The ultimate economic fallout from the pandemic, and the long-term impact on economies, markets, industries and individual issuers, are not known. The COVID-19 pandemic could adversely affect the value and liquidity of the Fund’s investments, impair the Fund’s ability to satisfy redemption requests, and negatively impact the Fund’s performance. In addition, the outbreak of COVID-19, and measures taken to mitigate its effects, could result in disruptions to the services provided to the Fund by its service providers.
| | |
| QS Global Market Neutral Fund 2020 Annual Report | | 57 |
Report of independent registered public accounting firm
To the Board of Trustees of Legg Mason Global Asset Management Trust and Shareholders of QS Global Market Neutral Fund
Opinion on the Financial Statements
We have audited the accompanying statement of assets and liabilities, including the schedule of investments, of QS Global Market Neutral Fund (one of the funds constituting Legg Mason Global Asset Management Trust, referred to hereafter as the “Fund”) as of September 30, 2020, the related statement of operations for the year ended September 30, 2020, the statement of changes in net assets for each of the two years in the period ended September 30, 2020, including the related notes, and the financial highlights for each of the periods indicated therein (collectively referred to as the “financial statements”). In our opinion, the financial statements present fairly, in all material respects, the financial position of the Fund as of September 30, 2020, the results of its operations for the year then ended, the changes in its net assets for each of the two years in the period ended September 30, 2020 and the financial highlights for each of the periods indicated therein in conformity with accounting principles generally accepted in the United States of America.
Basis for Opinion
These financial statements are the responsibility of the Fund’s management. Our responsibility is to express an opinion on the Fund’s financial statements based on our audits. We are a public accounting firm registered with the Public Company Accounting Oversight Board (United States) (PCAOB) and are required to be independent with respect to the Fund in accordance with the U.S. federal securities laws and the applicable rules and regulations of the Securities and Exchange Commission and the PCAOB.
We conducted our audits of these financial statements in accordance with the standards of the PCAOB. Those standards require that we plan and perform the audit to obtain reasonable assurance about whether the financial statements are free of material misstatement, whether due to error or fraud.
Our audits included performing procedures to assess the risks of material misstatement of the financial statements, whether due to error or fraud, and performing procedures that respond to those risks. Such procedures included examining, on a test basis, evidence regarding the amounts and disclosures in the financial statements. Our audits also included evaluating the accounting principles used and significant estimates made by management, as well as evaluating the overall presentation of the financial statements. Our procedures included confirmation of securities owned as of September 30, 2020 by correspondence with the custodian and brokers; when replies were not received from brokers, we performed other auditing procedures. We believe that our audits provide a reasonable basis for our opinion.
/s/PricewaterhouseCoopers LLP
Baltimore, Maryland
November 18, 2020
We have served as the auditor of one or more investment companies in the Franklin Templeton Group of Funds since 1948.
| | |
�� 58 | | QS Global Market Neutral Fund 2020 Annual Report |
Board approval of new management and
new subadvisory agreements (unaudited)
On February 18, 2020, Franklin Resources, Inc., a global investment management organization operating, together with its subsidiaries, as Franklin Templeton (“Franklin Templeton”), and Legg Mason, Inc. (“Legg Mason”) announced that they had entered into a definitive agreement (the “Transaction Agreement”) for Franklin Templeton to acquire Legg Mason in an all-cash transaction. As part of this transaction, the Fund’s manager, Legg Mason Partners Fund Advisor, LLC (the “Manager”), and the Fund’s subadvisers, QS Investors, LLC (the “Subadviser”) and Western Asset Management Company, LLC (“Western Asset”), each a wholly owned subsidiary of Legg Mason, would become subsidiaries of Franklin Templeton (the “Transaction”). The Transaction was subject to approval by Legg Mason’s shareholders and customary closing conditions, including receipt of applicable regulatory approvals. The Transaction was consummated on July 31, 2020. Under the Investment Company Act of 1940, as amended (the “1940 Act”), consummation of the Transaction resulted in the automatic termination of the Fund’s existing investment management agreement and subadvisory agreements (the “Existing Agreements”).
At a meeting held on April 6, 2020, the Fund’s Board of Trustees (the “Board”) approved a new management agreement (the “Management Agreement”) with the Manager, a new subadvisory agreement between the Manager and the Subadviser and a new subadvisory agreement between the Manager and Western Asset pursuant to which Western Asset is engaged to provide day-to-day management of that portion of the Fund’s cash and short-term investments allocated to Western Asset under such subadvisory agreement. (Each subadvisory agreement is referred to as a “Subadvisory Agreement,” and the Management Agreement and Subadvisory Agreements are collectively referred to as the “Agreements.”) The meeting was held telephonically based on exemptive relief issued by the Securities and Exchange Commission, with the Board’s intention to ratify the approval of the Agreements at its next in-person meeting.
On March 9, 2020, during a telephonic meeting of the Board, the Board met with representatives of Legg Mason, the parent company of the Manager, the Subadviser and Western Asset and representatives of Franklin Templeton to discuss the Transaction. The Board was advised that the Fund would not bear the costs of obtaining shareholder approval of the Agreements, including proxy solicitation costs, legal fees and the costs of printing and mailing the proxy statement, regardless of whether the Transaction was consummated. On March 31, 2020 and April 2, 2020, the trustees who are not “interested persons” of the Fund (as defined in the 1940 Act) (the “Independent Trustees”), separately met, with the assistance of their independent legal counsel, to review and evaluate the materials provided by Legg Mason, Franklin Templeton, the Manager, the Subadviser and Western Asset to assist the Board, and in particular the Independent Trustees, in considering the Agreements. On April 6, 2020, the Board received a presentation from senior Fund management and representatives from Franklin Templeton and reviewed and evaluated the materials, including supplemental materials, provided to assist the Board in
| | |
| QS Global Market Neutral Fund 2020 Annual Report | | 59 |
Board approval of new management and
new subadvisory agreements (unaudited) (cont’d)
considering the Agreements. Prior to the Board’s approval of the Agreements, as a part of the April 6 meeting, the Independent Trustees further discussed the Agreements in an executive session with independent legal counsel and recommended their approval.
In the event the Fund’s shareholders did not approve the Agreements prior to the closing of the Transaction, at its April 6, 2020 meeting, the Board also approved an interim investment management agreement with the Manager and interim subadvisory agreements between the Manager and the Subadviser and between the Manager and Western Asset that would take effect upon the closing of the Transaction to enable the Manager, Subadviser and Western Asset to serve as investment managers of the Fund following the termination of the Existing Agreements and pending shareholder approval of the Agreements. At a meeting held on July 14, 2020, shareholders of the Fund approved the Agreements. The Agreements became effective on July 31, 2020 following consummation of the Transaction. Effective October 1, 2020, QS Investors and Franklin Templeton Multi-Asset Solutions formed a new business unit called Franklin Templeton Investment Solutions, but QS Investors retains its separate existence and continues as party to the Agreements.
In voting to approve the Agreements, the Board, including the Independent Trustees, considered whether approval of the Agreements would be in the best interests of the Fund. No single factor or item of information reviewed by the Board was identified as the principal factor in determining whether to approve the Agreements. The Board considered that the terms of the Agreements were identical to the Existing Agreements, except for the dates of execution, effectiveness and termination, and that the Board had considered and approved the renewal of the Existing Agreements in November 2019. The Board also considered that the Existing Agreements were the product of multiple years of review and negotiation and information received and considered by the Board in the exercise of its business judgment during those years. The Board further considered that although no assets were currently being allocated to Western Asset, the Manager recommended that the Subadvisory Agreement with Western Asset be approved to permit allocation of assets to Western Asset at such time as the Manager determined to be appropriate. Based upon its evaluation of all material factors, including those described below, the Board concluded that the terms of each of the Agreements were reasonable and fair and that it was in the best interests of the Fund to approve the Agreements.
In evaluating the Agreements, the Board considered the information previously provided for the November 2019 renewal of the Existing Agreements, updated with more recent statistics, information and representations. Among such information was the nature, extent and quality of services provided to the Fund by the Manager and the Subadviser and available to be provided by Western Asset under the Management Agreement and Subadvisory Agreements and information regarding the administrative and other services rendered to the Fund and its shareholders by the Manager and its affiliates and the
| | |
60 | | QS Global Market Neutral Fund 2020 Annual Report |
Manager’s supervisory activities over the Subadviser and Western Asset. The Board noted that Franklin Templeton and Legg Mason had informed the Board that, following the Transaction, there is not expected to be any diminution in the nature, quality and extent of services provided to the Fund and its shareholders by the Manager the Subadviser and Western Asset, including compliance and other non-advisory services. The Board’s evaluation of the services provided by the Manager and the Subadviser took into account Franklin Templeton’s plans and intentions regarding the Fund and Legg Mason’s asset management business, including the preservation and continued operational and investment autonomy of the investment advisory businesses conducted by the Subadviser and Western Asset. The Board noted that Franklin Templeton did not expect to propose any changes to the investment objective of the Fund or any changes to the principal investment strategies of the Fund as a result of the Transaction. The Board also considered that there were not expected to be any changes to the Fund’s custodian or other service providers as a result of the Transaction. The Board also considered that Franklin Templeton’s distribution capabilities, particularly with respect to retail investors, and significant network of intermediary relationships may provide additional opportunities for the Fund to grow assets and lower expense ratios by spreading expenses over a larger asset base.
The Board also considered its knowledge and familiarity gained as Trustees of funds in the Legg Mason fund complex, including the scope and quality of the investment management and other capabilities of the Manager, the Subadviser and Western Asset, and the quality of the Manager’s administrative and other services. The Board considered information received at regular meetings throughout the year, including the policies and practices of the Subadviser regarding the selection of brokers and dealers and the execution of portfolio transactions for the Fund. The Board also considered the reputation, experience, financial strength and resources of Franklin Templeton and its investment advisory subsidiaries. The Board considered that on a regular basis it received and reviewed information from the Manager and the Fund’s Chief Compliance Officer regarding the compliance policies and procedures established pursuant to Rule 38a-1 under the 1940 Act for the funds in the Legg Mason fund complex, including liquidity management programs and cybersecurity programs. The Board also considered information about Franklin Templeton’s compliance and risk management programs.
The Board noted that it had reviewed the qualifications, backgrounds and responsibilities of the senior personnel currently serving the Fund and had met and reviewed the backgrounds and qualifications of the senior personnel of Franklin Templeton responsible for the management of the advisory business. The Board considered that Legg Mason had put in place retention incentives for key personnel at the Manager until the closing of the Transaction and Franklin Templeton had provided long-term retention mechanisms for certain personnel, and that Franklin Templeton had represented that there were not expected to be any changes in the portfolio management personnel managing the Fund as a
| | |
| QS Global Market Neutral Fund 2020 Annual Report | | 61 |
Board approval of new management and
new subadvisory agreements (unaudited) (cont’d)
result of the Transaction. The Board considered Franklin Templeton’s and the Manager’s commitment to an effective transition and to continued high quality investment management and shareholder services following the Transaction.
The Board received and reviewed performance information for the Fund and for a group of funds (the “Performance Universe”) selected by Broadridge Financial Solutions Inc. (“Broadridge”), an independent provider of investment company data. The Board was provided a description of the methodology Broadridge used to determine the similarity of the Fund to the funds included in the Performance Universe. The Broadridge data also included a comparison of the Fund’s performance to the Fund’s designated benchmark index. The Board noted that although useful, the data provided by Broadridge may vary depending on the year-end dates selected and the selection of a peer group and, therefore, recognized its limitations. In addition, the Board noted that it had received and discussed at periodic intervals information comparing the Fund’s performance to that of its Performance Universe and benchmark index, as well as other performance measures, such as Morningstar rankings, and had met with the Fund’s portfolio managers at in-person meetings during the year.
The Board noted that the Fund’s performance for the one- and three-year periods ended December 31, 2019 placed the Class I Shares in the third quintile (the first quintile being the best performers and the fifth quintile being the worst performers). The Board also reviewed updated performance information. In addition, based on their review of materials provided and assurances received, the Board determined that the Transaction was not expected to affect adversely the nature, extent and quality of services provided. The Board noted that its evaluation of the factors of the nature, extent and quality of services and performance led it to conclude that it was in the best interests of the Fund to approve the Agreements.
The Board reviewed and considered the contractual management fee (the “Contractual Management Fee”), payable by the Fund to the Manager in light of the nature, extent and quality of the management and subadvisory services provided by the Manager and the Subadviser, respectively. The Board considered that it had reviewed the Fund’s Contractual Management Fee and total expense ratio in connection with its consideration of the Existing Agreements during the 2019 contract renewal process and that the new Management Agreement did not change the Fund’s management fee rate or the computation method for calculating such fees. The Board reviewed the subadvisory fees, noting that the Manager, and not the Fund, pays the fee to the Subadviser and would pay the fee to Western Asset. In addition, the Board reviewed and considered the actual management fee rate (after taking into account fees waived by the Manager which partially reduced the management fee owed to the Manager under the Management Agreement) (the “Actual Management Fee”). The Board also considered that the contractual expense waiver continued until December 31, 2021 and Franklin Templeton’s statement that it had
| | |
62 | | QS Global Market Neutral Fund 2020 Annual Report |
no current intention to change the waiver after its expiration. Based on their review of the materials provided and the assurances they had received from Franklin Templeton and Legg Mason, the Board determined that the Transaction would not increase the total fees payable by the Fund for management services.
The Board received and reviewed an analysis of Legg Mason complex-wide management fees for funds with a similar strategy provided by the Manager, which, among other things, set out a framework of fees based on asset classes. The Manager reviewed with the Board the differences in services provided to these different types of accounts, including that the Fund is provided with certain administrative services, office facilities, and Fund officers (including the Fund’s chief executive, chief financial and chief compliance officers), and that the Manager coordinates and oversees the provision of services to the Fund by other Fund service providers. The Board considered the fee comparisons in light of the differences in management of these different types of accounts and the differences in associated risks borne by the Manager.
Additionally, the Board received and considered information comparing the Fund’s Contractual Management Fee, Actual Management Fee and the Fund’s overall expense ratio with those of a group of funds selected by Broadridge as comparable to the Fund and with a broader universe of funds also selected by Broadridge. With respect to the Fund, the Board noted that for the Class I Shares the Contractual Management Fee and Actual Management Fee were lower than the median of the Broadridge expense group (first quintile) and the actual total expense ratio was lower than the Broadridge expense group median (second quintile) and higher than the expense universe median (third quintile) (the first quintile being the lowest fees and the fifth quintile being the highest fees). It was noted that, while the Board has found the Broadridge data generally useful, they recognized its limitations, including that the data may vary depending on the selection of the peer group.
The Board was provided an overview of the process followed in conducting the profitability study and received an updated report on the profitability of Legg Mason in providing services to the Fund, based on financial information and business data for the 12 months ended March 31, 2019, which corresponds to Legg Mason’s fiscal year end, and for the period from September 2019 to February 2020. The Board also received certain information showing historical profitability for fiscal years 2016 through 2019. The Board noted that it previously had received a report from the independent consultant engaged by Legg Mason to assess the methodologies used by Legg Mason for its profitability study in connection with its review of the Existing Agreements. The Board considered the profitability study along with the other materials previously provided to the Board and concluded that the profitability was not excessive in light of the nature, extent and quality of the services provided to the Fund.
| | |
| QS Global Market Neutral Fund 2020 Annual Report | | 63 |
Board approval of new management and
new subadvisory agreements (unaudited) (cont’d)
The Board received and considered information regarding whether there have been economies of scale with respect to the management of the Fund as the Fund’s assets have grown and whether the Fund has appropriately benefited from any economies of scale. Among other information, the Board reviewed management fee reductions due to waivers during Legg Mason’s 2016 through 2019 fiscal years and for the pro forma fiscal year 2020. The Board noted that Franklin Templeton and Legg Mason expected to realize cost savings from the Transaction based on synergies of operations, as well as to benefit from possible growth of the funds resulting from enhanced distribution capabilities. However, they noted that other factors could also affect profitability and potential economies of scale, and that it was not possible to predict with any degree of certainty how the Transaction would affect the Manager’s profitability from its relationship with the Fund, nor to quantify at this time any possible future economies of scale. The Board noted they will have the opportunity to periodically re-examine such profitability and any economies of scale going forward. The Board also considered the potential benefits to shareholders from being part of a combined fund family with Franklin Templeton-sponsored funds and having access to a greater array of investment opportunities. Given the asset size of the Fund and the complex and the fee waivers, the Board concluded that, although there were no current breakpoints, any economies of scale currently being realized were appropriately being reflected in the Actual Management Fee paid by the Fund.
The Board considered other benefits received by the Manager and its affiliates as a result of the Manager’s relationship with the Fund, including the opportunity to offer additional products and services to Fund shareholders, enhanced industry recognition and the potential for reduced vendor pricing. The Board also considered that Franklin Templeton may derive reputational and other benefits from its ability to use the Legg Mason investment affiliates’ names in connection with operating and marketing the funds. The Board considered that the Transaction would significantly increase Franklin Templeton’s assets under management and expand Franklin Templeton’s investment capabilities. The Board noted that Franklin Templeton and Legg Mason, as a result of the potential benefits derived from the Transaction, have a financial interest in the matters that were being considered. The Board also took note of information provided regarding amounts received by the Fund’s distributor and intermediary arrangements.
The Board considered that the senior management team at Legg Mason expressed support for the Transaction and Legg Mason recommended that the Board approve the Agreements. The Board also considered that, under the Transaction Agreement, Franklin Templeton has acknowledged that Legg Mason had entered into the Transaction Agreement in reliance upon the benefits and protections provided by Section 15(f) of the 1940 Act, and that Franklin Templeton represented to the Board that it would conduct its business such that (a) for a period of not less than three years after the closing of the Transaction no more than 25% of the members of the Board shall be “interested persons” (as defined in the 1940 Act)
| | |
64 | | QS Global Market Neutral Fund 2020 Annual Report |
of any investment adviser of the Fund, and (b) for a period of not less than two years after the closing, neither Franklin Templeton nor any of its affiliates shall impose an “unfair burden” (within the meaning of the 1940 Act) on the Fund as a result of the transactions contemplated by the Transaction Agreement.
After consideration of the factors described above as well as other factors, and in the exercise of their business judgment, the Board, including the Independent Trustees, concluded that the Agreements for the Fund, including the fees payable thereunder, were fair and reasonable and that entering into the Agreements for the Fund was in the best interests of the Fund’s shareholders, and the Board voted to approve the Agreements and to recommend that shareholders approve the Agreements.
| | |
| QS Global Market Neutral Fund 2020 Annual Report | | 65 |
Additional shareholder information (unaudited)
Results of special meeting of shareholders
On July 14, 2020 a special meeting of shareholders was held for the following purposes: 1) to approve a new management agreement between the Fund and its investment manager; and 2) to approve a new subadvisory agreement with respect to each of the Fund’s subadvisers. The following table provides the number of votes cast for or against, as well as the number of abstentions and broker non-votes as to each matter voted on at the special meeting of shareholders. Each item voted on was approved.
| | | | | | | | | | | | | | | | |
| Item Voted On | | Voted For | | | Voted
Against | | | Abstentions | | | Broker
Non-Votes | |
To Approve a New Management Agreement with Legg Mason Partners Fund Advisor, LLC | | | 62,146,093.265 | | | | 53.024 | | | | 170,273.167 | | | | 0 | |
To Approve a New Subadvisory Agreement with QS Investors, LLC | | | 62,146,093.265 | | | | 53.024 | | | | 170,273.167 | | | | 0 | |
To Approve a New Subadvisory Agreement with Western Asset Management Company, LLC | | | 62,146,093.265 | | | | 53.024 | | | | 170,273.167 | | | | 0 | |
| | |
66 | | QS Global Market Neutral Fund 2020 Annual Report |
Statement regarding liquidity risk management program (unaudited)
As required by law, the fund has adopted and implemented a liquidity risk management program (the “Program”) that is designed to assess and manage liquidity risk. Liquidity risk is the risk that the fund could not meet requests to redeem its shares without significant dilution of remaining investors’ interests in the fund. Legg Mason Partners Fund Advisor, LLC (the “Manager”), the fund’s manager, is the administrator of the Program. The Manager has established a liquidity risk management committee (the “Committee”) to administer the Program on a day-to-day basis.
The Committee, on behalf of the Manager, provided the fund’s Board of Trustees with a report that addressed the operation of the Program, assessed its adequacy and effectiveness of implementation, including, if applicable, the operation of any highly liquid investment minimum (“HLIM”), and described any material changes that had been made to the Program or were recommended (the “Report”). The Report covered the period from December 1, 2018 through December 31, 2019 (the “Reporting Period”).
The Report confirmed that there were no material changes to the Program during the Reporting Period and that no changes were recommended.
The Report also confirmed that, throughout the Reporting Period, the Committee had monitored the fund’s portfolio liquidity and liquidity risk on an ongoing basis, as described in the Program and in Board reporting throughout the Reporting Period.
The Report discussed the Committee’s annual review of the Program, which addressed, among other things, the following elements of the Program:
Assessment, Management, and Periodic Review of Liquidity Risk. The Committee reviewed the fund’s investment strategy and liquidity of portfolio investments during both normal and reasonably foreseeable stressed conditions. The Committee noted that the fund’s investment strategy continues to be appropriate for an open-end fund, taking into account, among other things, whether and to what extent the fund held less liquid and illiquid assets and the extent to which any such investments affected the fund’s ability to meet redemption requests. In managing and reviewing the fund’s liquidity risk, the Committee also considered the extent to which the fund’s investment strategy involves a relatively concentrated portfolio or large positions in particular issuers, the extent to which the fund uses borrowing for investment purposes, and the extent to which the fund uses derivatives (including for hedging purposes). The Committee also reviewed the fund’s short-term and long-term cash flow projections during both normal and reasonably foreseeable stressed conditions. In assessing the fund’s cash flow projections, the Committee considered, among other factors, historical net redemption activity, redemption policies, ownership concentration, distribution channels, and the degree of certainty associated with the fund’s short-term and long-term cash flow projections. The Committee also considered the fund’s holdings of cash and cash equivalents, as well as borrowing arrangements and other funding sources, including, if applicable, the fund’s participation in a credit facility, as components of the fund’s ability to meet redemption requests.
| | |
| QS Global Market Neutral Fund 2020 Annual Report | | 67 |
Statement regarding liquidity risk management program
(unaudited) (cont’d)
Liquidity Classification. The Committee reviewed the Program’s liquidity classification methodology for categorizing the fund’s investments into one of four liquidity buckets. In reviewing the fund’s investments, the Committee considered, among other factors, whether trading varying portions of a position in a particular portfolio investment or asset class in sizes the fund would reasonably anticipate trading, would be reasonably expected to significantly affect liquidity.
Highly Liquid Investment Minimum. The Committee performed an analysis to determine whether the fund is required to maintain a Highly Liquid Investment Minimum, and determined that no such minimum is required because the fund primarily holds highly liquid investments.
Compliance with Limitation on Illiquid Investments. The Committee confirmed that during the Reporting Period, the fund did not acquire any illiquid investment such that, after the acquisition, the fund would have invested more than 15% of its assets in illiquid investments that are assets, in accordance with the Program and applicable SEC rules.
Redemptions in Kind. The Committee confirmed that no redemptions in-kind were effected by the fund during the Reporting Period.
The Report stated that the Committee concluded that the Program is reasonably designed and operated effectively to assess and manage the fund’s liquidity risk throughout the Reporting Period.
| | |
68 | | QS Global Market Neutral Fund 2020 Annual Report |
Additional information (unaudited)
Information about Trustees and Officers
The business and affairs of QS Global Market Neutral Fund (the “Fund”) are conducted by management under the supervision and subject to the direction of its Board of Trustees. The business address of each Trustee is c/o Jane Trust, Legg Mason, 100 International Drive, 11th Floor, Baltimore, Maryland 21202. Information pertaining to the Trustees and officers of the Fund is set forth below.
The Statement of Additional Information includes additional information about Trustees and is available, without charge, upon request by calling the Fund at 1-877-721-1926.
| | |
| Independent Trustees† |
| |
| Ruby P. Hearn | | |
| |
| Year of birth | | 1940 |
| Position(s) with Trust | | Trustee |
| Term of office1 and length of time served2 | | Since 2004 |
| Principal occupation(s) during the past five years | | Senior Vice President Emerita of The Robert Wood Johnson Foundation (non-profit) (since 2001); Member of the National Academy of Medicine (formerly known as the Institute of Medicine) (since 1982); formerly, Trustee of the New York Academy of Medicine (2004 to 2011); Director of the Institute for Healthcare Improvement (2002 to 2011); Senior Vice President of The Robert Wood Johnson Foundation (1996 to 2001); Fellow of The Yale Corporation (1992 to 1998) |
| Number of funds in fund complex overseen by Trustee | | 20 |
| Other board memberships held by Trustee during the past five years | | None |
|
| Arnold L. Lehman |
| |
| Year of birth | | 1944 |
| Position(s) with Trust | | Trustee and Chairman |
| Term of office1 and length of time served2 | | Since 1982 and since 2015 |
| Principal occupation(s) during the past five years | | Senior Advisor, Phillips (auction house) (since 2015); formerly, Fellow, Ford Foundation (2015 to 2016); Director of the Brooklyn Museum
(1997 to 2015) |
| Number of funds in fund complex overseen by Trustee | | 20 |
| Other board memberships held by Trustee during the past five years | | Trustee of American Federation of Arts (since 2002) |
| | |
| QS Global Market Neutral Fund 2020 Annual Report | | 69 |
Additional information (unaudited) (cont’d)
Information about Trustees and Officers
| | |
| Independent Trustees† (cont’d) |
|
| Robin J.W. Masters |
| |
| Year of birth | | 1955 |
| Position(s) with Trust | | Trustee |
| Term of office1 and length of time served2 | | Since 2002 |
| Principal occupation(s) during the past five years | | Retired; formerly, Chief Investment Officer of ACE Limited (insurance) (1986 to 2000) |
| Number of funds in fund complex overseen by Trustee | | 20 |
| Other board memberships held by Trustee during the past five years | | Director of HSBC Managed Portfolios Limited, HSBC Corporate Money Funds Limited and HSBC Specialist Funds Limited (since 2020); formerly, Director of Cheyne Capital International Limited (investment advisory firm) (2005 to 2020); Director/ Trustee of Legg Mason Institutional Funds plc, Western Asset Fixed Income Funds plc and Western Asset Debt Securities Fund plc. (2007 to 2011) |
|
| Jill E. McGovern |
| |
| Year of birth | | 1944 |
| Position(s) with Trust | | Trustee |
| Term of office1 and length of time served2 | | Since 1989 |
| Principal occupation(s) during the past five years | | Senior Consultant, American Institute for Contemporary German Studies (AICGS) (since 2007); formerly, Chief Executive Officer of The Marrow Foundation (non-profit) (1993 to 2007); Executive Director of the Baltimore International Festival (1991 to 1993); Senior Assistant to the President of The Johns Hopkins University (1986 to 1990) |
| Number of funds in fund complex overseen by Trustee | | 20 |
| Other board memberships held by Trustee during the past five years | | Director of International Biomedical Research Alliance (2002 to 2010); Director of Lois Roth Endowment (2005 to 2012) |
|
| Arthur S. Mehlman |
| |
| Year of birth | | 1942 |
| Position(s) with Trust | | Trustee |
| Term of office1 and length of time served2 | | Since 2002 |
| Principal occupation(s) during the past five years | | Retired. Director, The University of Maryland Foundation (since 1992); formerly, Director, The League for People with Disabilities (2003 to 2017); Director, Municipal Mortgage & Equity LLC (2004 to 2011); Partner
(1972 to 2002), Partner-in-Charge of the Audit Practice for Baltimore and Washington offices (1998 to 2001), and Managing Partner of the Baltimore office (1992 to 1995) at KPMG LLP (international accounting firm) |
| Number of funds in fund complex overseen by Trustee | | Trustee of all Legg Mason Funds consisting of 20 portfolios; Director/Trustee of the Royce Family of Funds consisting of 22 portfolios |
| Other board memberships held by Trustee during the past five years | | Director of Municipal Mortgage & Equity, LLC. (2004 to 2011) |
| | |
70 | | QS Global Market Neutral Fund 2020 Annual Report |
| | |
| Independent Trustees† (cont’d) |
|
| G. Peter O’Brien |
| |
| Year of birth | | 1945 |
| Position(s) with Trust | | Trustee |
| Term of office1 and length of time served2 | | Since 1999 |
| Principal occupation(s) during the past five years | | Retired. Trustee Emeritus of Colgate University (since 2005); Board Member, Hill House, Inc. (residential home care) (since 1999); formerly, Board Member, Bridges School (pre-school) (2006 to 2017); Managing Director, Equity Capital Markets Group of Merrill Lynch & Co.
(1971 to 1999) |
| Number of funds in fund complex overseen by Trustee | | Trustee of all Legg Mason funds consisting of 20 portfolios; Director/Trustee of the Royce Family of Funds consisting of 22 portfolios |
| Other board memberships held by Trustee during the past five years | | Director of TICC Capital Corp. (2003 to 2017) |
|
| S. Ford Rowan |
| |
| Year of birth | | 1943 |
| Position(s) with Trust | | Trustee |
| Term of office1 and length of time served2 | | Since 2002 |
| Principal occupation(s) during the past five years | | Consultant to University of Maryland University College (since 2013); formerly, Chairman, National Center for Critical Incident Analysis
(2004 to 2018); Lecturer in Organizational Sciences, George Washington University (2000 to 2014); Trustee, St. John’s College (2006 to 2012); Consultant, Rowan & Blewitt Inc. (management consulting) (1984 to 2007); Lecturer in Journalism, Northwestern University (1980 to 1993); Director, Santa Fe Institute (1999 to 2008) |
| Number of funds in fund complex overseen by Trustee | | 20 |
| Other board memberships held by Trustee during the past five years | | None |
| | |
| QS Global Market Neutral Fund 2020 Annual Report | | 71 |
Additional information (unaudited) (cont’d)
Information about Trustees and Officers
| | |
| Independent Trustees† (cont’d) |
|
| Robert M. Tarola |
| |
| Year of birth | | 1950 |
| Position(s) with Trust | | Trustee |
| Term of office1 and length of time served2 | | Since 2004 |
| Principal occupation(s) during the past five years | | President of Rights Advisory LLC (corporate finance and governance consulting) (since 2008); Member, Investor Advisory Group of the Public Company Accounting Oversight Board (since 2009); formerly, Chief Financial Officer, Little Company of Mary Hospital and Health Care Centers (healthcare provider network) (2018); Executive Vice President and Chief Financial Officer, Southcoast Health System, Inc. (healthcare provider network) (2015 to 2017); Senior Vice President and Chief Financial Officer of The Howard University (higher education and health care) (2009 to 2013); Senior Vice President and Chief Financial Officer of W.R. Grace & Co. (specialty chemicals) (1999 to 2008); Chief Financial Officer of MedStar Health, Inc. (healthcare) (1996 to 1999); Partner, PriceWaterhouse, LLP (accounting and auditing) (1984 to 1996) |
| Number of funds in fund complex overseen by Trustee | | 20 |
| Other board memberships held by Trustee during the past five years | | Director of American Kidney Fund (renal disease assistance) (since 2008); Director and Board Chair of XBRL International, Inc. (global data standard setting) (since 2015); Director of Vista Outdoor, Inc. (consumer recreation products) (since 2015); formerly, Director of TeleTech Holdings, Inc. (business processing outsourcing) (2008 to 2018) |
| | |
| Interested Trustee and Officer |
|
| Jane Trust, CFA3 |
| |
| Year of birth | | 1962 |
| Position(s) with Trust | | Trustee, President and Chief Executive Officer |
| Term of office1 and length of time served2 | | Since 2015 |
| Principal occupation(s) during the past five years | | Senior Vice President, Fund Board Management, Franklin Templeton (since 2020); Officer and/or Trustee/Director of 150 funds associated with Legg Mason Partners Fund Advisor, LLC (“LMPFA”) or its affiliates (since 2015); President and Chief Executive Officer of LMPFA (since 2015); formerly, Senior Managing Director (2018 to 2020) and Managing Director (2016 to 2018) of Legg Mason & Co., LLC (“Legg Mason & Co.”);
Senior Vice President of LMPFA (2015) |
| Number of funds in fund complex overseen by Trustee | | 147 |
| Other board memberships held by Trustee during the past five years | | None |
| | |
72 | | QS Global Market Neutral Fund 2020 Annual Report |
| | |
| Additional Officers |
|
Christopher Berarducci Legg Mason 620 Eighth Avenue, 47th Floor, New York, NY 10018 |
| |
| Year of birth | | 1974 |
| Position(s) with Trust | | Treasurer and Principal Financial Officer |
| Term of office1 and length of time served2 | | Since 2010 and 2019 |
| Principal occupation(s) during the past five years | | Vice President, Fund Administration and Reporting, Franklin Templeton (since 2020); Treasurer (since 2010) and Principal Financial Officer (since 2019) of certain funds associated with Legg Mason & Co. or its affiliates; formerly, Managing Director (2020), Director (2015 to 2020), and
Vice President (2011 to 2015) of Legg Mason & Co. |
|
Marc A. De Oliveira* Legg Mason 100 First Stamford Place, 6th Floor, Stamford, CT 06902 |
| |
| Year of birth | | 1971 |
| Position(s) with Trust | | Secretary and Chief Legal Officer |
| Term of office1 and length of time served2 | | Since 2020 |
| Principal occupation(s) during the past five years | | Associate General Counsel of Franklin Templeton (since 2020); Assistant Secretary of certain funds associated with Legg Mason & Co. or its affiliates (since 2006); formerly, Managing Director (2016 to 2020) and Associate General Counsel of Legg Mason & Co. (2005 to 2020) |
|
Thomas C. Mandia Legg Mason 100 First Stamford Place, 6th Floor, Stamford, CT 06902 |
| |
| Year of birth | | 1962 |
| Position(s) with Trust | | Senior Vice President |
| Term of office1 and length of time served2 | | Since 2020 |
| Principal occupation(s) during the past five years | | Senior Associate General Counsel of Franklin Templeton (since 2020); Secretary of LMPFA (since 2006); Assistant Secretary of certain funds associated with Legg Mason & Co. or its affiliates (since 2006); Secretary of LM Asset Services, LLC (“LMAS”) (since 2002) and Legg Mason Fund Asset Management, Inc. (“LMFAM”) (since 2013) (formerly registered investment advisers); formerly, Managing Director and Deputy General Counsel of Legg Mason & Co. (2005 to 2020) |
| | |
QS Global Market Neutral Fund 2020 Annual Report | | 73 |
Additional information (unaudited) (cont’d)
Information about Trustees and Officers
| | |
| Additional Officers (cont’d) |
|
Ted P. Becker Legg Mason 620 Eighth Avenue, 47th Floor, New York, NY 10018 |
| |
| Year of birth | | 1951 |
| Position(s) with Trust | | Chief Compliance Officer |
| Term of office1 and length of time served2 | | Since 2007 |
| Principal occupation(s) during the past five years | | Vice President, Global Compliance of Franklin Templeton (since 2020); Chief Compliance Officer of LMPFA (since 2006); Chief Compliance Officer of certain funds associated with Legg Mason & Co. or its affiliates (since 2006); formerly, Director of Global Compliance at Legg Mason, Inc. (2006 to 2020); Managing Director of Compliance of Legg Mason & Co. (2005 to 2020) |
|
Susan Kerr Legg Mason 620 Eighth Avenue, 47th Floor, New York, NY 10018 |
| |
| Year of birth | | 1949 |
| Position(s) with Trust | | Chief Anti-Money Laundering Compliance Officer |
| Term of office1 and length of time served2 | | Since 2013 |
| Principal occupation(s) during the past five years | | Senior Compliance Analyst, Franklin Templeton (since 2020); Chief
Anti-Money Laundering Compliance Officer of certain funds associated with Legg Mason & Co. or its affiliates (since 2013) and Anti-Money Laundering Compliance Officer (since 2012), Senior Compliance Officer (since 2011) and Assistant Vice President (since 2010) of Legg Mason Investor Services, LLC (“LMIS”); formerly, Assistant Vice President of Legg Mason & Co. (2010 to 2020) |
|
Jenna Bailey Legg Mason 100 First Stamford Place, 5th Floor, Stamford, CT 06902 |
| |
| Year of birth | | 1978 |
| Position(s) with Trust | | Identity Theft Prevention Officer |
| Term of office1 and length of time served2 | | Since 2015 |
| Principal occupation(s) during the past five years | | Senior Compliance Analyst of Franklin Templeton (since 2020); Identity Theft Prevention Officer of certain funds associated with Legg Mason & Co. or its affiliates (since 2015); formerly, Compliance Officer of Legg Mason & Co. (2013 to 2020); Assistant Vice President of Legg Mason & Co. (2011 to 2020) |
| | |
74 | | QS Global Market Neutral Fund 2020 Annual Report |
| | |
| Additional Officers (cont’d) |
|
Jeanne M. Kelly Legg Mason 620 Eighth Avenue, 47th Floor, New York, NY 10018 |
| |
| Year of birth | | 1951 |
| Position(s) with Trust | | Senior Vice President |
| Term of office1 and length of time served2 | | Since 2007 |
| Principal occupation(s) during the past five years | | U.S. Fund Board Team Manager, Franklin Templeton (since 2020); Senior Vice President of certain funds associated with Legg Mason & Co. or its affiliates (since 2007); Senior Vice President of LMPFA (since 2006); President and Chief Executive Officer of LMAS and LMFAM (since 2015); formerly, Managing Director of Legg Mason & Co. (2005 to 2020);
Senior Vice President of LMFAM (2013 to 2015) |
| † | Trustees who are not “interested persons” of the Fund within the meaning of Section 2(a)(19) of the Investment Company Act of 1940, as amended (the “1940 Act”). Each of the Independent Trustees serves on the standing committees of the Board of Trustees, which include the Audit Committee (chair: Arthur S. Mehlman), the Nominating Committee (co-chairs: G. Peter O’Brien and Jill E. McGovern), and the Independent Trustees Committee (chair: Arnold L. Lehman). |
| * | Effective September 10, 2020, Mr. De Oliveira became Secretary and Chief Legal Officer. |
| 1 | Each Trustee and officer serves until his or her respective successor has been duly elected and qualified or until his or her earlier death, resignation, retirement or removal. |
| 2 | Indicates the earliest year in which the Trustee became a board member for a fund in the Legg Mason fund complex or the officer took such office. |
| 3 | Ms. Trust is an “interested person” of the Fund, as defined in the 1940 Act, because of her position with LMPFA and/or certain of its affiliates. |
| | |
| QS Global Market Neutral Fund 2020 Annual Report | | 75 |
Important tax information (unaudited)
The following information is provided with respect to the distributions paid during the taxable year ended September 30, 2020:
| | | | |
| Record date: | | | 12/17/2019 | |
| Payable date: | | | 12/18/2019 | |
| Ordinary Income: | | | | |
Qualified Dividend Income for Individuals | | | 100.00 | % |
Dividends Qualifying for the Dividends | | | | |
Received Deduction for Corporations | | | 75.51 | % |
| | |
76 | | QS Global Market Neutral Fund 2020 Annual Report |
QS
Global Market Neutral Fund
Trustees
Ruby P. Hearn
Arnold L. Lehman
Chairman
Robin J.W. Masters
Jill E. McGovern
Arthur S. Mehlman
G. Peter O’Brien
S. Ford Rowan
Robert M. Tarola
Jane Trust
Investment manager
Legg Mason Partners Fund Advisor, LLC
Subadviser
QS Investors, LLC
Distributor
Legg Mason Investor Services, LLC
Custodian
The Bank of New York Mellon
Transfer agent
BNY Mellon Investment Servicing (US) Inc.
4400 Computer Drive
Westborough, MA 01581
Independent registered
public accounting firm
PricewaterhouseCoopers LLP
Baltimore, MD
QS Global Market Neutral Fund
The Fund is a separate investment series of Legg Mason Global Asset Management Trust, a Maryland statutory trust.
QS Global Market Neutral Fund
Legg Mason Funds
620 Eighth Avenue, 47th Floor
New York, NY 10018
The Fund files its complete schedule of portfolio holdings with the Securities and Exchange Commission (“SEC”) for the first and third quarters of each fiscal year as an exhibit to its reports on Form N-PORT. The Fund’s Forms N-PORT are available on the SEC’s website at www.sec.gov. To obtain information on Form N-PORT, shareholders can call the Fund at 1-877-721-1926.
Information on how the Fund voted proxies relating to portfolio securities during the prior 12-month period ended June 30th of each year and a description of the policies and procedures that the Fund uses to determine how to vote proxies related to portfolio transactions are available (1) without charge, upon request, by calling the Fund at 1-877-721-1926, (2) at www.leggmason.com/mutualfunds and (3) on the SEC’s website at www.sec.gov.
This report is submitted for the general information of the shareholders of QS Global Market Neutral Fund. This report is not authorized for distribution to prospective investors in the Fund unless preceded or accompanied by a current prospectus.
Investors should consider the Fund’s investment objectives, risks, charges and expenses carefully before investing. The prospectus contains this and other important information about the Fund. Please read the prospectus carefully before investing.
www.leggmason.com
© 2020 Legg Mason Investor Services, LLC
Member FINRA, SIPC
Legg Mason Funds Privacy and Security Notice
Your Privacy and the Security of Your Personal Information is Very Important to the Legg Mason Funds
This Privacy and Security Notice (the “Privacy Notice”) addresses the Legg Mason Funds’ privacy and data protection practices with respect to nonpublic personal information the Funds receive. The Legg Mason Funds include any funds sold by the Funds’ distributor, Legg Mason Investor Services, LLC, as well as Legg Mason-sponsored closed-end funds. The provisions of this Privacy Notice apply to your information both while you are a shareholder and after you are no longer invested with the Funds.
The Type of Nonpublic Personal Information the Funds Collect About You
The Funds collect and maintain nonpublic personal information about you in connection with your shareholder account. Such information may include, but is not limited to:
| • | | Personal information included on applications or other forms; |
| • | | Account balances, transactions, and mutual fund holdings and positions; |
| • | | Bank account information, legal documents, and identity verification documentation; |
| • | | Online account access user IDs, passwords, security challenge question responses; and |
| • | | Information received from consumer reporting agencies regarding credit history and creditworthiness (such as the amount of an individual’s total debt, payment history, etc.). |
How the Funds Use Nonpublic Personal Information About You
The Funds do not sell or share your nonpublic personal information with third parties or with affiliates for their marketing purposes, or with other financial institutions or affiliates for joint marketing purposes, unless you have authorized the Funds to do so. The Funds do not disclose any nonpublic personal information about you except as may be required to perform transactions or services you have authorized or as permitted or required by law. The Funds may disclose information about you to:
| • | | Employees, agents, and affiliates on a “need to know” basis to enable the Funds to conduct ordinary business or to comply with obligations to government regulators; |
| • | | Service providers, including the Funds’ affiliates, who assist the Funds as part of the ordinary course of business (such as printing, mailing services, or processing or servicing your account with us) or otherwise perform services on the Funds’ behalf, including companies that may perform statistical analysis, market research and marketing services solely for the Funds; |
| • | | Permit access to transfer, whether in the United States or countries outside of the United States to such Funds’ employees, agents and affiliates and service providers as required to enable the Funds to conduct ordinary business, or to comply with obligations to government regulators; |
| • | | The Funds’ representatives such as legal counsel, accountants and auditors to enable the Funds to conduct ordinary business, or to comply with obligations to government regulators; |
| • | | Fiduciaries or representatives acting on your behalf, such as an IRA custodian or trustee of a grantor trust. |
|
| NOT PART OF THE ANNUAL REPORT |
Legg Mason Funds Privacy and Security Notice (cont’d)
Except as otherwise permitted by applicable law, companies acting on the Funds’ behalf, including those outside the United States, are contractually obligated to keep nonpublic personal information the Funds provide to them confidential and to use the information the Funds share only to provide the services the Funds ask them to perform.
The Funds may disclose nonpublic personal information about you when necessary to enforce their rights or protect against fraud, or as permitted or required by applicable law, such as in connection with a law enforcement or regulatory request, subpoena, or similar legal process. In the event of a corporate action or in the event a Fund service provider changes, the Funds may be required to disclose your nonpublic personal information to third parties. While it is the Funds’ practice to obtain protections for disclosed information in these types of transactions, the Funds cannot guarantee their privacy policy will remain unchanged.
Keeping You Informed of the Funds’ Privacy and Security Practices
The Funds will notify you annually of their privacy policy as required by federal law. While the Funds reserve the right to modify this policy at any time they will notify you promptly if this privacy policy changes.
The Funds’ Security Practices
The Funds maintain appropriate physical, electronic and procedural safeguards designed to guard your nonpublic personal information. The Funds’ internal data security policies restrict access to your nonpublic personal information to authorized employees, who may use your nonpublic personal information for Fund business purposes only.
Although the Funds strive to protect your nonpublic personal information, they cannot ensure or warrant the security of any information you provide or transmit to them, and you do so at your own risk. In the event of a breach of the confidentiality or security of your nonpublic personal information, the Funds will attempt to notify you as necessary so you can take appropriate protective steps. If you have consented to the Funds using electronic communications or electronic delivery of statements, they may notify you under such circumstances using the most current email address you have on record with them.
In order for the Funds to provide effective service to you, keeping your account information accurate is very important. If you believe that your account information is incomplete, not accurate or not current, if you have questions about the Funds’ privacy practices, or our use of your nonpublic personal information, write the Funds using the contact information on your account statements, email the Funds by clicking on the Contact Us section of the Funds’ website at www.leggmason.com, or contact the Funds at 1-877-721-1926.
Revised April 2018
|
| NOT PART OF THE ANNUAL REPORT |
www.leggmason.com
© 2020 Legg Mason Investor Services, LLC Member FINRA, SIPC
QSIN316994 11/20 SR20-4009
The registrant has adopted a code of ethics that applies to the registrant’s principal executive officer, principal financial officer, principal accounting officer or controller.
| ITEM 3. | AUDIT COMMITTEE FINANCIAL EXPERT. |
The Board of Trustees of the registrant has determined that Arthur S. Mehlman the Chairman of the Board’s Audit Committee and Robert M. Tarola, possess the technical attributes identified in Instruction 2(b) of Item 3 to Form N-CSR to qualify as “audit committee financial experts,” and have designated Mr. Mehlman and Mr. Tarola as the Audit Committee’s financial experts. Mr. Mehlman and Mr. Tarola are “independent” Trustees pursuant to paragraph (a) (2) of Item 3 to Form N-CSR.
| ITEM 4. | PRINCIPAL ACCOUNTANT FEES AND SERVICES. |
a) Audit Fees. The aggregate fees billed in the last two fiscal years ending September 30, 2019 and September 30, 2020 (the “Reporting Periods”) for professional services rendered by the Registrant’s principal accountant (the “Auditor”) for the audit of the Registrant’s annual financial statements, or services that are normally provided by the Auditor in connection with the statutory and regulatory filings or engagements for the Reporting Periods, were $336,010 in September 30, 2019 and $322,330 in September 30, 2020.
b) Audit-Related Fees. The aggregate fees billed in the Reporting Period for assurance and related services by the Auditor that are reasonably related to the performance of the Registrant’s financial statements were $3,000 in September 30, 2019 and $0 in September 30, 2020.
In addition, there were no Audit-Related Fees billed in the Reporting Period for assurance and related services by the Auditor to the Registrant’s investment adviser (not including any sub-adviser whose role is primarily portfolio management and is subcontracted with or overseen by another investment adviser), and any entity controlling, controlled by or under common control with the investment adviser that provides ongoing services to the Legg Mason Global Asset Management Trust (“service affiliates”), that were reasonably related to the performance of the annual audit of the service affiliates. Accordingly, there were no such fees that required pre-approval by the Audit Committee for the Reporting Period.
(c) Tax Fees. The aggregate fees billed in the Reporting Periods for professional services rendered by the Auditor for tax compliance, tax advice and tax planning (“Tax Services”) were $0 in September 30, 2019 and $0 in September 30, 2020. These services consisted of (i) review or preparation of U.S. federal, state, local and excise tax returns; (ii) U.S. federal, state and local tax planning, advice and assistance regarding statutory, regulatory or administrative developments, and (iii) tax advice regarding tax qualification matters and/or treatment of various financial instruments held or proposed to be acquired or held.
There were no fees billed for tax services by to the service affiliates during the Reporting Periods that required pre-approval by the Audit Auditors Committee.
d) All Other Fees. The aggregate fees for other fees billed in the Reporting Periods for products and services provided by the Auditor were $0 in September 30, 2019 and $0 in September 30, 2020, other than the services reported in paragraphs (a) through (c) of this item for the Legg Mason Global Asset Management Trust.
All Other Fees. There were no other non-audit services rendered by the Auditor to Legg Mason Partners Fund Advisors, LLC (“LMPFA”), and any entity controlling, controlled by or under common control with LMPFA that provided ongoing services to Legg Mason Global Asset Management Trust requiring pre-approval by the Audit Committee in the Reporting Period.
(e) Audit Committee’s pre–approval policies and procedures described in paragraph (c)
(7) of Rule 2-01 of Regulation S-X.
(1) The Charter for the Audit Committee (the “Committee”) of the Board of each registered investment company (the “Fund”) advised by LMPFA or one of their affiliates (each, an “Adviser”) requires that the Committee shall approve (a) all audit and permissible non-audit services to be provided to the Fund and (b) all permissible non-audit services to be provided by the Fund’s independent auditors to the Adviser and any Covered Service Providers if the engagement relates directly to the operations and financial reporting of the Fund. The Committee may implement policies and procedures by which such services are approved other than by the full Committee.
The Committee shall not approve non-audit services that the Committee believes may impair the independence of the auditors. As of the date of the approval of this Audit Committee Charter, permissible non-audit services include any professional services (including tax services), that are not prohibited services as described below, provided to the Fund by the independent auditors, other than those provided to the Fund in connection with an audit or a review of the financial statements of the Fund. Permissible non-audit services may not include: (i) bookkeeping or other services related to the accounting records or financial statements of the Fund; (ii) financial information systems design and implementation; (iii) appraisal or valuation services, fairness opinions or contribution-in-kind reports; (iv) actuarial services; (v) internal audit outsourcing services; (vi) management functions or human resources; (vii) broker or dealer, investment adviser or investment banking services; (viii) legal services and expert services unrelated to the audit; and (ix) any other service the Public Company Accounting Oversight Board determines, by regulation, is impermissible.
Pre-approval by the Committee of any permissible non-audit services is not required so long as: (i) the aggregate amount of all such permissible non-audit services provided to the Fund, the Adviser and any service providers controlling, controlled by or under common control with the Adviser that provide ongoing services to the Fund (“Covered Service Providers”) constitutes not more than 5% of the total amount of revenues paid to the independent auditors during the fiscal year in which the permissible non-audit services are provided to (a) the Fund, (b) the Adviser and (c) any entity controlling, controlled by or under common control with the Adviser that provides ongoing services to the Fund during the fiscal year in which the services are provided that would have to be approved by the Committee; (ii) the permissible non-audit services were not recognized by the Fund at the time of the engagement to be non-audit services; and (iii) such services are promptly brought to the attention of the Committee and approved by the Committee (or its delegate(s)) prior to the completion of the audit.
(2) For the Legg Mason Global Asset Management Trust, the percentage of fees that were approved by the audit committee, with respect to: Audit-Related Fees were 100% and 100% for September 30, 2019 and September 30, 2020; Tax Fees were 100% and 100% for September 30, 2019 and September 30, 2020; and Other Fees were 100% and 100% for September 30, 2019 and September 30, 2020.
(f) N/A
(g) Non-audit fees billed by the Auditor for services rendered to Legg Mason Global Asset Management Trust, LMPFA and any entity controlling, controlled by, or under common control with LMPFA that provides ongoing services to Legg Mason Global Asset Management Trust during the reporting period were $386,151 in September 30, 2019 and $1,105,712 in September 30, 2020.
(h) Yes. Legg Mason Global Asset Management Trust’s Audit Committee has considered whether the provision of non-audit services that were rendered to Service Affiliates, which were not pre-approved (not requiring pre-approval), is compatible with maintaining the Accountant’s independence. All services provided by the Auditor to the Legg Mason Global Asset Management Trust or to Service Affiliates, which were required to be pre-approved, were pre-approved as required.
| ITEM 5. | AUDIT COMMITTEE OF LISTED REGISTRANTS. |
| | a) | The independent board members are acting as the registrant’s audit committee as specified in Section 3(a)(58)(B) of the Exchange Act. The Audit Committee consists of the following Board members: |
Ruby P. Hearn
Arnold L. Lehman
Robin J.W. Masters
Jill E. McGovern
Arthur S. Mehlman
G. Peter O’Brien
S. Ford Rowan
Robert M. Tarola
| ITEM 6. | SCHEDULE OF INVESTMENTS. |
Included herein under Item 1.
| ITEM 7. | DISCLOSURE OF PROXY VOTING POLICIES AND PROCEDURES FOR CLOSED-END MANAGEMENT INVESTMENT COMPANIES. |
Not applicable.
| ITEM 8. | PORTFOLIO MANAGERS OF CLOSED-END MANAGEMENT INVESTMENT COMPANIES. |
Not applicable.
| ITEM 9. | PURCHASES OF EQUITY SECURITIES BY CLOSED-END MANAGEMENT INVESTMENT COMPANY AND AFFILIATED PURCHASERS. |
Not applicable.
| ITEM 10. | SUBMISSION OF MATTERS TO A VOTE OF SECURITY HOLDERS. |
Not applicable.
| ITEM 11. | CONTROLS AND PROCEDURES. |
| | (a) | The registrant’s principal executive officer and principal financial officer have concluded that the registrant’s disclosure controls and procedures (as defined in Rule 30a- 3(c) under the Investment Company Act of 1940, as amended (the “1940 Act”)) are effective as of a date within 90 days of the filing date of this report that includes the disclosure required by this paragraph, based on their evaluation of the disclosure controls and procedures required by Rule 30a-3(b) under the 1940 Act and 15d-15(b) under the Securities Exchange Act of 1934. |
| | (b) | There were no changes in the registrant’s internal control over financial reporting (as defined in Rule 30a-3(d) under the 1940 Act) that occurred during the second fiscal quarter of the period covered by this report that have materially affected, or are likely to materially affect the registrant’s internal control over financial reporting. |
| ITEM 12. | DISCLOSURE OF SECURITIES LENDING ACTIVITIES FOR CLOSED-END MANAGEMENT INVESTMENT COMPANIES. |
Not applicable.
(a) (1) Code of Ethics attached hereto.
Exhibit 99.CODE ETH
(a) (2) Certifications pursuant to section 302 of the Sarbanes-Oxley Act of 2002 attached hereto.
Exhibit 99.CERT
(b) Certifications pursuant to Section 906 of the Sarbanes-Oxley Act of 2002 attached hereto.
Exhibit 99.906CERT
SIGNATURES
Pursuant to the requirements of the Securities Exchange Act of 1934 and the Investment Company Act of 1940, the registrant has duly caused this Report to be signed on its behalf by the undersigned, there unto duly authorized.
| | |
| Legg Mason Global Asset Management Trust |
| |
| By: | | /s/ Jane Trust |
| | Jane Trust |
| | Chief Executive Officer |
| |
| Date: | | November 24, 2020 |
Pursuant to the requirements of the Securities Exchange Act of 1934 and the Investment Company Act of 1940, this report has been signed below by the following persons on behalf of the registrant and in the capacities and on the dates indicated.
| | |
| By: | | /s/ Jane Trust |
| | Jane Trust |
| | Chief Executive Officer |
| |
| Date: | | November 24, 2020 |
| | |
| By: | | /s/ Christopher Berarducci |
| | Christopher Berarducci |
| | Principal Financial Officer |
| |
| Date: | | November 24, 2020 |