UNITED STATES
SECURITIES AND EXCHANGE COMMISSION
Washington, D.C. 20549
FORM N-CSR
CERTIFIED SHAREHOLDER REPORT OF REGISTERED
MANAGEMENT INVESTMENT COMPANIES
Investment Company Act file number 811-22338
Legg Mason Global Asset Management Trust
(Exact name of registrant as specified in charter)
620 Eighth Avenue, 47th Floor,
New York, NY 10018
(Address of principal executive offices) (Zip code)
Marc A. De Oliveira,
Legg Mason & Co., LLC
100 First Stamford Place
Stamford, CT 06902
(Name and address of agent for service)
Registrant’s telephone number, including area code: 1-877-721-1926
Date of fiscal year end: September 30
Date of reporting period: September 30, 2020
| ITEM 1. | REPORT TO STOCKHOLDERS |
The Annual Report to Stockholders is filed herewith.

| | |
| Annual Report | | September 30, 2020 |
BrandywineGLOBAL —
GLOBAL HIGH YIELD FUND
Beginning in or after March 2021, as permitted by regulations adopted by the Securities and Exchange Commission, the Fund intends to no longer mail paper copies of the Fund’s shareholder reports like this one, unless you specifically request paper copies of the reports from the Fund or from your Service Agent or financial intermediary (such as a broker-dealer or bank). Instead, the reports will be made available on a website, and you will be notified by mail each time a report is posted and provided with a website link to access the report.
If you already elected to receive shareholder reports electronically (“e-delivery”), you will not be affected by this change and you need not take any action. If you have not already elected e-delivery, you may elect to receive shareholder reports and other communications from the Fund electronically by contacting your Service Agent or, if you are a direct shareholder with the Fund, by calling 1-877-721-1926.
You may elect to receive all future reports in paper free of charge. If you invest through a Service Agent, you can contact your Service Agent to request that you continue to receive paper copies of your shareholder reports. That election will apply to all Legg Mason Funds held in your account at that Service Agent. If you are a direct shareholder with the Fund, you can call the Fund at 1-877-721-1926, or write to the Fund by regular mail at Legg Mason Funds, P.O. Box 9699, Providence, RI 02940-9699 or by express, certified or registered mail to Legg Mason Funds, 4400 Computer Drive, Westborough, MA 01581 to let the Fund know you wish to continue receiving paper copies of your shareholder reports. That election will apply to all Legg Mason Funds held in your account held directly with the fund complex.

|
| INVESTMENT PRODUCTS: NOT FDIC INSURED • NO BANK GUARANTEE • MAY LOSE VALUE |
Fund objectives
The Fund’s primary objective is to provide a high level of current income. Long-term capital appreciation is its secondary objective.
Letter from the president

Dear Shareholder,
We are pleased to provide the annual report of BrandywineGLOBAL — Global High Yield Fund for the twelve-month reporting period ended September 30, 2020. Please read on for a detailed look at prevailing economic and market conditions during the Fund’s reporting period and to learn how those conditions have affected Fund performance.
Special shareholder notice
On July 31, 2020, Franklin Resources, Inc. (“Franklin Resources”) acquired Legg Mason, Inc. (“Legg Mason”) in an all-cash transaction. As a result of the transaction, Legg Mason Partners Fund Advisor, LLC (“LMPFA”) and the subadviser(s) became indirect, wholly-owned subsidiaries of Franklin Resources. Under the Investment Company Act of 1940, as amended, consummation of the transaction automatically terminated the management and subadvisory agreements that were in place for the Fund prior to the transaction. The Fund’s manager and subadviser(s) continue to provide uninterrupted services with respect to the Fund pursuant to new management and subadvisory agreements that were approved by Fund shareholders.
Franklin Resources, whose principal executive offices are at One Franklin Parkway, San Mateo, California 94403, is a global investment management organization operating, together with its subsidiaries, as Franklin Templeton. As of September 30, 2020, after giving effect to the transaction described above, Franklin Templeton’s asset management operations had aggregate assets under management of approximately $1.4 trillion.
| | |
II | | BrandywineGLOBAL — Global High Yield Fund |
As always, we remain committed to providing you with excellent service and a full spectrum of investment choices. We also remain committed to supplementing the support you receive from your financial advisor. One way we accomplish this is through our website, www.leggmason.com. Here you can gain immediate access to market and investment information, including:
| • | | Fund prices and performance, |
| • | | Market insights and commentaries from our portfolio managers, and |
| • | | A host of educational resources. |
We look forward to helping you meet your financial goals.
Sincerely,

Jane Trust, CFA
President and Chief Executive Officer
October 30, 2020
| | |
| BrandywineGLOBAL — Global High Yield Fund | | III |
(This page intentionally left blank.)
Fund overview
Q. What is the Fund’s investment strategy?
A. The Fund’s primary objective is to provide a high level of current income. Long-term capital appreciation is its secondary objective. Under normal market conditions, the Fund will invest at least 80% of its total assets in high yield securities. High yield securities are those rated below investment grade (that is, securities rated below Baa/BBB assigned by at least one Nationally Recognized Statistical Rating Organization (“NRSRO”) that provide such a rating) or unrated securities that we determined to be of comparable credit quality; they are commonly known as “junk bonds.” The Fund’s high yield securities may include distressed and defaulted securities.
As a global fund, the Fund can seek investment opportunities anywhere in the world, and under normal market conditions, the Fund will be invested in at least three countries, which may include the United States. The Fund can invest without limit in securities of issuers in the United States or in any other country, including countries with developing or emerging markets. The Fund’s investments may be denominated in foreign currency or U.S. dollar-denominated.
Under normal market conditions, the investment universe primarily consists of high yield debt of corporate or sovereign issuers. We may also consider investment in other instruments including: bank loans, defaulted bonds, defaulted bank loans, debtor-in possession loans (“DIP loans”), investment grade corporate bonds, U.S. Treasuries and agencies, mortgage-backed securities, asset-backed securities, zero coupon bonds, securities representing securitized assets, currencies, preferred stock, convertible bonds, and other fixed income securities.
The Fund may enter into various derivative transactions including, but not limited to, forwards, futures, swaps and credit default swaps (index and single name). Derivatives may be used by the Fund as a hedging technique in an attempt to manage risk; as a substitute for buying or selling securities; to provide additional exposure to investment types or market factors; to change the characteristics of the Fund’s portfolio; in an attempt to enhance returns; and to manage cash. These instruments are taken into account when determining compliance with the Fund’s 80% policy.
The Fund may invest in currency forwards in order to hedge its currency exposure in bond positions or to gain currency exposure. These investments may be significant at times. Although we have the flexibility to make use of currency forwards, we may choose not to for a variety of reasons, even under very volatile market conditions. The Fund may invest in securities of any maturity. The weighted average effective durationi of the Fund’s portfolio, including derivatives, is expected to range from 0 to 7 years.
The Fund’s investment style is disciplined, active, value-driven, and strategic. The investment strategy combines top-down analysis of macro-economic conditions with bottom-up fundamental analysis in an effort to determine where the most attractive valuations exist during the business cycle — while considering credit quality, sector
| | |
| BrandywineGLOBAL — Global High Yield Fund 2020 Annual Report | | 1 |
Fund overview (cont’d)
allocation and security selection. We use the strategy to identify and invest in foreign or U.S. bonds which we believe have attractive “real” and “risk” adjusted yields. We rotate portfolio positions mindful of credit quality, sector allocation and security selection given the state of the economy, and endeavor to control risk by purchasing securities we believe to be undervalued. We consider secular trends, political and monetary conditions and business cycle risks when making investment decisions. We also take into account the relative risk and return characteristics of prospective investments when determining how to achieve desired exposures.
Q. What were the overall market conditions during the Fund’s reporting period?
A. The economy and financial markets were impacted by the COVID-19 pandemic for much of the twelve-month reporting period ended September 30, 2020. Looking at the U.S. economy, fourth quarter of 2019 annualized gross domestic product (GDP)ii growth was 2.4%. Lockdowns and social distancing then started to take their toll on the economy, as the Commerce Department reported that first quarter 2020 annualized GDP growth was -5.0%. This marked the steepest quarterly decline since the first quarter of 2009. Second quarter of 2020 annualized GDP growth then contracted 31.4%, marking the steepest quarterly decline on record. Finally, the initial estimate for third quarter GDP — released after the reporting period ended — was 33.1%.
Against this backdrop, the Federal Reserve Board (the “Fed”)iii took a number of unprecedented actions to support the economy and the proper functioning of the financial markets. During the Fed’s January 2020 meeting, it kept rates unchanged in a range between 1.50% and 1.75%. However, the Fed acknowledged that the outbreak of the coronavirus “warranted close watching.” The Fed then took a number of aggressive actions in March 2020. First, on March 3, 2020 the Fed lowered the federal funds rateiv from a range between 1.50% and 1.75% to a range between 1.00% and 1.25%. Then, on March 15, 2020, the Fed lowered the federal funds rate to a range between 0.00% and 0.25%. In addition, the Fed announced that, “over coming months the Committee will increase its holdings of Treasury securities by at least $500 billion and its holdings of agency mortgage-backed securities by at least $200 billion.” Finally, on March 23, 2020 the Fed announced that it would make unlimited purchases of Treasury and mortgage securities, and introduced a new credit facility to buy investment-grade credit rated down to BBB- in the primary and secondary markets. During the second quarter of 2020, the Fed expanded its credit facilities to include the purchase of individual corporate bonds, which supported spread tightening. In the minutes from the Fed’s July meeting it said, “additional accommodation could be required.” In August 2020, Fed Chair Jerome Powell said the central bank had changed how it viewed the tradeoff between lower unemployment and higher inflation. Its new approach to setting U.S. monetary policy will entail letting inflation and employment run higher, which could mean interest rates remain “low for longer.” At its meeting in September, projections from individual members of the Federal Open Market Committee indicated that rates could stay anchored near zero through 2023.
| | |
2 | | BrandywineGLOBAL — Global High Yield Fund 2020 Annual Report |
Turning to the fixed income markets, they generated mixed results over the twelve-months ended September 30, 2020. Most spread sectors (non-Treasuries) underperformed equal duration Treasuries given periods of heightened risk aversion. This was driven by the ongoing pandemic, sharply falling global growth, aggressive monetary policy accommodation, ongoing trade conflicts and a number of geopolitical issues.
Both short- and long-term U.S. Treasury yields moved sharply lower during the reporting period. The yield for the two-year Treasury note began the reporting period at 1.63% and rose as high as 1.68% on November 7 and 8, 2019. The low for the period of 0.11% occurred several times toward the end of July 2020, the beginning of August 2020, and the end of September 2020, and ended the reporting period at 0.13%. The yield for the ten-year Treasury began the reporting period at 1.68% and moved as high as 1.94% on November 8, 2019. The low of 0.52% occurred on August 4, 2020, and ended the period at 0.69%.
All told, the Bloomberg Barclays U.S. Aggregate Indexv returned 6.98% for the twelve months ended September 30, 2020. For comparison purposes, riskier fixed income securities, including high-yield bond and emerging market debt, produced weaker results. Over the fiscal year, the Barclays U.S. Corporate High Yield — 2% Issuer Cap Indexvi and the JPMorgan Emerging Markets Bond Index Global (“EMBI Global”)vii returned 3.20% and 2.47%, respectively.
Q. How did we respond to these changing market conditions?
A. During the reporting period, the Fund continued to decrease its U.S. exposure, ending the period roughly around 63% invested domestically, compared to approximately 74% when the period began. The Fund now has a shorter duration than that of the benchmark given the current uncertain macro-environment. From a sector perspective, the Fund has a large overweight to Basic Industries1, with more modest overweights in Communication Services and Information Technology. The Fund’s largest underweight was Financials, followed by Energy and Consumer Cyclicals2. During the reporting period, we gradually increased our allocation to lower-quality CCC-rated securities and ended the reporting period with an overweight allocation versus the fund’s unmanaged benchmark, the Bloomberg Barclays Global High Yield Index.
Similar to the prior twelve-month period, we were long credit risk exposure via a credit default swap index (“CDX”) and several single-name credit default swaps (“CDS”) as a way to tactically manage the risk profile of the Fund. These derivative instruments, in aggregate, modestly contributed to performance.
| 1 | Basic Industries consists of the following industries: Chemicals, Metals & Mining and Paper. |
| 2 | Consumer Cyclicals consists of the following industries: Automotive, Entertainment, Gaming, Home Construction, Lodging, Retailers, Restaurants, Textiles, and other consumer services. |
| | |
| BrandywineGLOBAL — Global High Yield Fund 2020 Annual Report | | 3 |
Fund overview (cont’d)
Performance review
For the twelve months ended September 30, 2020, Class IS shares of BrandywineGLOBAL — Global High Yield Fund returned 4.11%. The Fund’s unmanaged benchmark, the Bloomberg Barclays Global High Yield Index, returned 2.90% for the same period. The Lipper Global High Yield Funds Category Averageviii returned 1.03% over the same time frame.
| | | | | | | | |
Performance Snapshot as of September 30, 2020
(unaudited) | |
| (excluding sales charges) | | 6 months | | | 12 months | |
| BrandywineGLOBAL — Global High Yield Fund: | | | | | | | | |
Class A | | | 12.68 | % | | | 3.71 | % |
Class C | | | 12.24 | % | | | 2.93 | % |
Class FI | | | 12.65 | % | | | 3.59 | % |
Class I | | | 12.82 | % | | | 4.01 | % |
Class IS | | | 12.89 | % | | | 4.11 | % |
| Bloomberg Barclays Global High Yield Index | | | 16.99 | % | | | 2.90 | % |
| Lipper Global High Yield Funds Category Average | | | 15.69 | % | | | 1.03 | % |
The performance shown represents past performance. Past performance is no guarantee of future results and current performance may be higher or lower than the performance shown above. Principal value, investment returns and yields will fluctuate and investors’ shares, when redeemed, may be worth more or less than their original cost. To obtain performance data current to the most recent month-end, please visit our website at www.leggmason.com/mutualfunds.
All share class returns assume the reinvestment of all distributions at net asset value and the deduction of all Fund expenses. Returns have not been adjusted to include sales charges that may apply or the deduction of taxes that a shareholder would pay on Fund distributions. If sales charges were reflected, the performance quoted would be lower. Performance figures for periods shorter than one year represent cumulative figures and are not annualized.
Fund performance figures reflect fee waivers and/or expense reimbursements, without which the performance would have been lower.
The 30-Day SEC Yields for the period ended September 30, 2020 for Class A, Class C, Class FI, Class I and Class IS shares were 4.07%, 3.49%, 4.26%, 4.56% and 4.66%, respectively. Absent fee waivers and/or expense reimbursements, the 30-Day SEC Yields for Class A, Class C, Class FI, Class I and Class IS shares would have been 1.95%, 3.20%, 3.91%, 4.22% and 4.46%, respectively. The 30-Day SEC Yield, calculated pursuant to the standard SEC formula, is based on the Fund’s investments over an annualized trailing 30-day period, and not on the distributions paid by the Fund, which may differ.
This Fund is the successor to an institutional account (the “Predecessor”). On November 30, 2012, the Predecessor transferred its assets to the Fund in exchange for the Fund’s Class IS shares.
|
| Total Annual Operating Expenses (unaudited) |
As of the Fund’s current prospectus dated February 1, 2020, the gross total annual fund operating expense ratios for Class A, Class C, Class FI, Class I and Class IS shares were 1.91%, 2.49%, 1.83%, 1.47% and 1.39%, respectively.
| | |
4 | | BrandywineGLOBAL — Global High Yield Fund 2020 Annual Report |
Actual expenses may be higher. For example, expenses may be higher than those shown if average net assets decrease. Net assets are more likely to decrease and Fund expense ratios are more likely to increase when markets are volatile.
As a result of expense limitation arrangements, the ratio of total annual fund operating expenses, other than interest, brokerage commissions, dividend expense on short sales, taxes, extraordinary expenses and acquired fund fees and expenses, to average net assets will not exceed 1.15% for Class A shares, 1.90% for Class C shares, 1.15% for Class FI shares, 0.85% for Class I shares and 0.75% for Class IS shares. In addition, the ratio of total annual fund operating expenses for Class IS shares will not exceed the ratio of total annual fund operating expenses for Class I shares. Total annual fund operating expenses after waiving fees and/or reimbursing expenses exceed the expense cap for each class as a result of acquired fund fees and expenses. These expense limitation arrangements cannot be terminated prior to December 31, 2021 without the Board of Trustees’ consent.
The manager is permitted to recapture amounts waived and/or reimbursed to a class within three years after the fiscal year in which the manager earned the fee or incurred the expense if the class’ total annual fund operating expenses have fallen to a level below the expense limitation (“expense cap”) in effect at the time the fees were earned or the expenses incurred. In no case will the manager recapture any amount that would result, on any particular business day of the Fund, in the class’ total annual operating expenses exceeding the expense cap or any other lower limit then in effect.
Q. What were the leading contributors to performance?
A. Among the Fund’s largest contributors to performance was its overweight to local currency Egyptian government Treasury-bills. We transitioned out of the position during April 2020 in favor of U.S. dollars.
From a government bond perspective, positions in quasi-sovereigns, such as Petrobras and Pemex, contributed to performance. During the period, the former kept its 2020 output target despite the impacts of COVID-19, while the latter stated its intention to increase production during the back half of the 2020 calendar year.
Elsewhere, auto sales rebounded quicker than expected and global reopening started to take place at the end of the reporting period. Against this backdrop, we shifted the portfolio’s largest overweight sector exposure into Basic Industries. We maintained additional overweight exposures to more ballast-like sectors, including Communications and Technology.
Q. What were the leading detractors from performance?
A. While the Fund outperformed its benchmark, its exposure to the Russell 2000 Indexix, using stock index futures during the first half of the reporting period, detracted from performance. This tactical proxy for credit risk ended up declining and we eliminated this position in March 2020.
Additionally, despite having an underweight exposure, our corporate bond Energy sector allocation was a negative due to the decline in oil prices over the reporting period.
| | |
| BrandywineGLOBAL — Global High Yield Fund 2020 Annual Report | | 5 |
Fund overview (cont’d)
Lastly, currency selection was a slight detractor from returns, mostly focused on an underweight euro allocation. At one point, we reduced the underweight with the view that longer-term growth trajectories for continental Europe and the U.S. had started to close. However, recent economic news from Europe caused us to revert to the initial period’s underweight position in the euro.
Thank you for your investment in BrandywineGLOBAL — Global High Yield Fund. As always, we appreciate that you have chosen us to manage your assets and we remain focused on achieving the Fund’s investment goals.
Sincerely,

Brian L. Kloss, JD, CPA
Portfolio Manager
Brandywine Global Investment Management, LLC

Tracy Chen, CFA, CAIA
Portfolio Manager, Structured Credit
Brandywine Global Investment Management, LLC
October 30, 2020
RISKS: Fixed income securities involve interest rate, credit, inflation, and reinvestment risks. As interest rates rise, the value of fixed income securities falls. High-yield bonds, known as “junk bonds”, possess greater price volatility, illiquidity, and possibility of default. International investments are subject to special risks including currency fluctuations, social, economic, and political uncertainties, which could increase volatility. These risks are magnified in emerging markets. Emerging market countries tend to have economic, political, and legal systems that are less developed and are less stable than those of more developed countries. Derivatives, such as options and futures, can be illiquid, may disproportionately increase losses, and have a potentially large impact on fund performance. As a non-diversified fund, the Fund is permitted to invest a larger percentage of its assets in a smaller number of issuers than a diversified fund, which may magnify the Fund’s losses from events affecting a particular issuer. Because the Fund may focus a significant portion of its investments in a single country or currency, it will be more susceptible to factors adversely affecting such currency or issuers within that country than would a more diversified portfolio of securities. Please see the Fund’s prospectus for a more complete discussion of these and other risks and the Fund’s investment strategies.
All investments are subject to risk including the possible loss of principal. Past performance is no guarantee of future results. All index performance reflects no deduction for fees, expenses or taxes. Please note that an investor cannot invest directly in an index.
| | |
6 | | BrandywineGLOBAL — Global High Yield Fund 2020 Annual Report |
The information provided is not intended to be a forecast of future events, a guarantee of future results or investment advice. Views expressed may differ from those of the firm as a whole.
| i | Effective duration is a duration calculation for bonds with embedded options. Effective duration takes into account that expected cash flows will fluctuate as interest rates change. Please note, duration measures the sensitivity of price (the value of principal) of a fixed income investment to a change in interest rates. |
| ii | Gross domestic product (“GDP”) is the market value of all final goods and services produced within a country in a given period of time. |
| iii | The Federal Reserve Board (the “Fed”) is responsible for the formulation of policies designed to promote economic growth, full employment, stable prices, and a sustainable pattern of international trade and payments. |
| iv | The federal funds rate is the rate charged by one depository institution on an overnight sale of immediately available funds (balances at the Federal Reserve) to another depository institution; the rate may vary from depository institution to depository institution and from day to day. |
| v | The Bloomberg Barclays U.S. Aggregate Index is a broad-based bond index comprised of government, corporate, mortgage- and asset-backed issues, rated investment grade or higher, and having at least one year to maturity. |
| vi | The Bloomberg Barclays U.S. Corporate High Yield — 2% Issuer Cap Index is an index of the 2%Issuer Cap component of the Bloomberg Barclays U.S. Corporate High Yield Index, which covers the U.S. dollar-denominated, non-investment grade, fixed-rate, taxable corporate bond market. |
| vii | The JPMorgan Emerging Markets Bond Index Global (“EMBI Global”) tracks total returns for U.S. dollar-denominated debt instruments issued by emerging market sovereign and quasi-sovereign entities: Brady bonds, loans, Eurobonds and local market instruments. |
| viii | Lipper, Inc., a wholly-owned subsidiary of Reuters, provides independent insight on global collective investments. Returns are based on the period ended September 30, 2020, including the reinvestment of all distributions, including returns of capital, if any, calculated among the 108 funds for the six-month period and among the 106 funds for the twelve-month period in the Fund’s Lipper category, and excluding sales charges, if any. |
| ix | The Russell 2000 Index measures the performance of the small-cap segment of the U.S. equity universe. The Russell 2000 is a subset of the Russell 3000 Index representing approximately 10% of the total market capitalization of that index. It includes approximately 2,000 of the smallest securities based on a combination of their market cap and current index membership. The Russell 3000 Index measures the performance of the 3,000 largest U.S. companies based on total market capitalization, which represents approximately 98% of the U.S. equity market. |
| | |
| BrandywineGLOBAL — Global High Yield Fund 2020 Annual Report | | 7 |
Fund at a glance† (unaudited)
Investment breakdown (%) as a percent of total investments
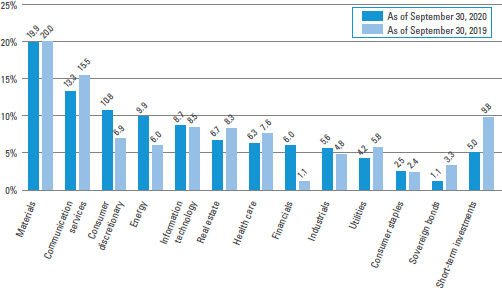
| † | The bar graph above represents the composition of the Fund’s investments as of September 30, 2020 and September 30, 2019 and does not include derivatives, such as futures contracts, forward foreign currency contracts and swap contracts. The Fund is actively managed. As a result, the composition of the Fund’s investments is subject to change at any time. |
| | |
8 | | BrandywineGLOBAL — Global High Yield Fund 2020 Annual Report |
Fund expenses (unaudited)
Example
As a shareholder of the Fund, you may incur two types of costs: (1) transaction costs, including front-end and back-end sales charges (loads) on purchase payments; and (2) ongoing costs, including management fees; service and/or distribution (12b-1) fees; and other Fund expenses. This example is intended to help you understand your ongoing costs (in dollars) of investing in the Fund and to compare these costs with the ongoing costs of investing in other mutual funds.
This example is based on an investment of $1,000 invested on April 1, 2020 and held for the six months ended September 30, 2020.
Actual expenses
The table below titled “Based on Actual Total Return” provides information about actual account values and actual expenses. You may use the information provided in this table, together with the amount you invested, to estimate the expenses that you paid over the period. To estimate the expenses you paid on your account, divide your ending account value by $1,000 (for example, an $8,600 ending account value divided by $1,000 = 8.6), then multiply the result by the number under the heading entitled “Expenses Paid During the Period”.
Hypothetical example for comparison purposes
The table below titled “Based on Hypothetical Total Return” provides information about hypothetical account values and hypothetical expenses based on the actual expense ratio and an assumed rate of return of 5.00% per year before expenses, which is not the Fund’s actual return. The hypothetical account values and expenses may not be used to estimate the actual ending account balance or expenses you paid for the period. You may use the information provided in this table to compare the ongoing costs of investing in the Fund and other funds. To do so, compare the 5.00% hypothetical example relating to the Fund with the 5.00% hypothetical examples that appear in the shareholder reports of the other funds.
Please note that the expenses shown in the table below are meant to highlight your ongoing costs only and do not reflect any transactional costs, such as front-end or back-end sales charges (loads). Therefore, the table is useful in comparing ongoing costs only, and will not help you determine the relative total costs of owning different funds. In addition, if these transaction costs were included, your costs would have been higher.
| | | | | | | | | | | | | | | | | | | | | | | | | | | | | | | | | | | | | | | | | | | | | | |
| | | |
| Based on actual total return1 | | | | | | | | | Based on hypothetical total return1 | |
| | | Actual
Total Return
Without
Sales
Charge2 | | | Beginning
Account Value | | | Ending Account Value | | | Annualized
Expense
Ratio | | | Expenses
Paid
During the Period3 | | | | | | | | Hypothetical
Annualized
Total Return | | | Beginning
Account Value | | | Ending Account
Value | | | Annualized
Expense
Ratio | | | Expenses
Paid During
the
Period3 | |
| Class A | | | 12.68 | % | | $ | 1,000.00 | | | $ | 1,126.80 | | | | 1.15 | % | | $ | 6.11 | | | | | | | Class A | | | 5.00 | % | | $ | 1,000.00 | | | $ | 1,019.25 | | | | 1.15 | % | | $ | 5.81 | |
| Class C | | | 12.24 | | | | 1,000.00 | | | | 1,122.40 | | | | 1.90 | | | | 10.08 | | | | | | | Class C | | | 5.00 | | | | 1,000.00 | | | | 1,015.50 | | | | 1.90 | | | | 9.57 | |
| Class FI | | | 12.65 | | | | 1,000.00 | | | | 1,126.50 | | | | 1.15 | | | | 6.11 | | | | | | | Class FI | | | 5.00 | | | | 1,000.00 | | | | 1,019.25 | | | | 1.15 | | | | 5.81 | |
| Class I | | | 12.82 | | | | 1,000.00 | | | | 1,128.20 | | | | 0.85 | | | | 4.52 | | | | | | | Class I | | | 5.00 | | | | 1,000.00 | | | | 1,020.75 | | | | 0.85 | | | | 4.29 | |
| Class IS | | | 12.89 | | | | 1,000.00 | | | | 1,128.90 | | | | 0.75 | | | | 3.99 | | | | | | | Class IS | | | 5.00 | | | | 1,000.00 | | | | 1,021.25 | | | | 0.75 | | | | 3.79 | |
| | |
| BrandywineGLOBAL — Global High Yield Fund 2020 Annual Report | | 9 |
Fund expenses (unaudited) (cont’d)
| 1 | For the six months ended September 30, 2020. |
| 2 | Assumes the reinvestment of all distributions, including returns of capital, if any, at net asset value and does not reflect the deduction of the applicable sales charge with respect to Class A shares or the applicable contingent deferred sales charge (“CDSC”) with respect to Class C shares. Total return is not annualized, as it may not be representative of the total return for the year. Performance figures may reflect compensating balance arrangements, fee waivers and/or expense reimbursements. In the absence of compensating balance arrangements, fee waivers and/or expense reimbursements, the total return would have been lower. Past performance is no guarantee of future results. |
| 3 | Expenses (net of compensating balance arrangements, fee waivers and/or expense reimbursements) are equal to each class’ respective annualized expense ratio multiplied by the average account value over the period, multiplied by the number of days in the most recent fiscal half-year (183), then divided by 366. |
| | |
10 | | BrandywineGLOBAL — Global High Yield Fund 2020 Annual Report |
Fund performance (unaudited)
The BrandywineGLOBAL — Global High Yield Fund (the “Fund”) is the successor to an institutional account (the “Predecessor”). The performance in the accompanying table and line graph for Class IS shares includes performance of the Predecessor. The Predecessor’s inception date was December 28, 2009. On November 30, 2012, the Predecessor transferred its assets to the Fund in exchange for the Fund’s Class IS shares. The investment policies, objectives, guidelines and restrictions of the Fund are in all material respects equivalent to those of the Predecessor. In addition, the current portfolio managers of the Fund served as portfolio managers to the Predecessor. As a mutual fund registered under the Investment Company Act of 1940, the Fund is subject to certain restrictions under the 1940 Act and the Internal Revenue Code to which the Predecessor was not subject. Had the Predecessor been registered under the 1940 Act and been subject to the provisions of the 1940 Act and the Code, its investment performance may have been adversely affected. The performance information reflects the gross expenses of the Predecessor adjusted to reflect the higher fees and expenses of Class IS of the Fund. The performance is shown net of annual management fees and other expenses, which reflects the application of the Class IS expense limitation agreement. If the expense limitation agreement were not applicable, expenses would be higher and performance lower.
The Predecessor did not have distribution policies. The Predecessor was an unregistered separately managed account, did not qualify as a regulated investment company for federal income tax purposes and did not pay dividends or distributions.
| | | | | | | | | | | | | | | | | | | | |
| Average annual total returns | | | | | | | | | | | | | |
| Without sales charges1 | | Class A | | | Class C | | | Class FI | | | Class I | | | Class IS | |
| Twelve Months Ended 9/30/20 | | | 3.71 | % | | | 2.93 | % | | | 3.59 | % | | | 4.01 | % | | | 4.11 | % |
| Five Years Ended 9/30/20 | | | 5.45 | | | | 4.71 | | | | 5.51 | | | | 5.82 | | | | 5.89 | |
| Ten Years Ended 9/30/20 | | | N/A | | | | N/A | | | | N/A | | | | N/A | | | | 5.91 | |
| Inception* through 9/30/20 | | | 3.25 | | | | 2.52 | | | | 3.29 | | | | 3.60 | | | | — | |
| | | | | |
| With sales charges2 | | Class A | | | Class C | | | Class FI | | | Class I | | | Class IS | |
| Twelve Months Ended 9/30/20 | | | -0.70 | % | | | 1.95 | % | | | 3.59 | % | | | 4.01 | % | | | 4.11 | % |
| Five Years Ended 9/30/20 | | | 4.54 | | | | 4.71 | | | | 5.51 | | | | 5.82 | | | | 5.89 | |
| Ten Years Ended 9/30/20 | | | N/A | | | | N/A | | | | N/A | | | | N/A | | | | 5.91 | |
| Inception* through 9/30/20 | | | 2.57 | | | | 2.52 | | | | 3.29 | | | | 3.60 | | | | — | |
| | | | |
| Cumulative total returns | | | |
| Without sales charges1 | | | |
| Class A (Inception date of 2/18/14 through 9/30/20) | | | 23.53 | % |
| Class C (Inception date of 2/18/14 through 9/30/20) | | | 17.88 | |
| Class FI (Inception date of 2/18/14 through 9/30/20) | | | 23.88 | |
| Class I (Inception date of 2/18/14 through 9/30/20) | | | 26.38 | |
| Class IS (9/30/10 through 9/30/20) | | | 77.60 | |
All figures represent past performance and are not a guarantee of future results. Investment return and principal value of an investment will fluctuate so that an investor’s shares, when redeemed, may be worth more or less than their original cost. The returns shown do not reflect the deduction of taxes that a shareholder would pay on Fund distributions or the redemption of Fund shares. Performance figures may reflect compensating balance arrangements, fee waivers and/or expense reimbursements. In the absence of compensating balance arrangements, fee waivers and/or expense reimbursements, the total return would have been lower.
| | |
| BrandywineGLOBAL — Global High Yield Fund 2020 Annual Report | | 11 |
Fund performance (unaudited) (cont’d)
| 1 | Assumes the reinvestment of all distributions, including returns of capital, if any, at net asset value and does not reflect the deduction of the applicable sales charge with respect to Class A shares or the applicable contingent deferred sales charge (“CDSC”) with respect to Class C shares. |
| 2 | Assumes the reinvestment of all distributions, including returns of capital, if any, at net asset value. In addition, Class A shares reflect the deduction of the maximum initial sales charge of 4.25% and Class C shares reflect the deduction of a 1.00% CDSC, which applies if shares are redeemed within one year from purchase payment. |
| * | Inception dates for Class A, C, FI, I and IS shares are February 18, 2014, February 18, 2014, February 18, 2014, February 18, 2014 and December 28, 2009, respectively. |
| | |
12 | | BrandywineGLOBAL — Global High Yield Fund 2020 Annual Report |
Historical performance
Value of $1,000,000 invested in
Class IS Shares of BrandywineGLOBAL — Global High Yield Fund vs. Bloomberg Barclays Global High Yield Index† — September 2010 - September 2020
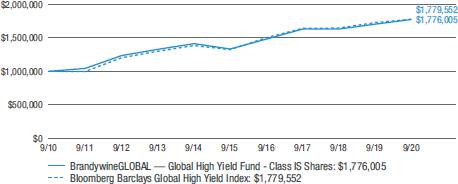
All figures represent past performance and are not a guarantee of future results. Investment return and principal value of an investment will fluctuate so that an investor’s shares, when redeemed, may be worth more or less than their original cost. The returns shown do not reflect the deduction of taxes that a shareholder would pay on Fund distributions or the redemption of Fund shares. Performance figures may reflect compensating balance arrangements, fee waivers and/or expense reimbursements. In the absence of compensating balance arrangements, fee waivers and/or expense reimbursements, the total return would have been lower.
| † | Hypothetical illustration of $1,000,000 invested in Class IS shares of BrandywineGLOBAL — Global High Yield Fund on September 30, 2010, assuming the reinvestment of all distributions, including returns of capital, if any, at net asset value through September 30, 2020. The hypothetical illustration also assumes a $1,000,000 investment, as applicable, in the Bloomberg Barclays Global High Yield Index. The Bloomberg Barclays Global High Yield Index (the “Index”) provides a broad-based measure of the global high-yield fixed-income markets. The Index is unmanaged and is not subject to the same management and trading expenses as a mutual fund. Please note that an investor cannot invest directly in an index. The performance of the Fund’s other classes may be greater or less than Class IS shares’ performance indicated on this chart, depending on whether greater or lesser sales charges and fees were incurred by shareholders investing in the other classes. |
| | |
| BrandywineGLOBAL — Global High Yield Fund 2020 Annual Report | | 13 |
Schedule of investments
September 30, 2020
BrandywineGLOBAL — Global High Yield Fund
| | | | | | | | | | | | | | | | |
| Security | | Rate | | | Maturity
Date | | | Face
Amount† | | | Value | |
| Corporate Bonds & Notes — 91.6% | | | | | | | | | | | | | | | | |
| Communication Services — 11.6% | | | | | | | | | | | | | | | | |
Diversified Telecommunication Services — 2.6% | | | | | | | | | | | | | | | | |
Consolidated Communications Inc., Senior Secured Notes | | | 6.500 | % | | | 10/1/28 | | | | 135,000 | | | $ | 138,038 | (a)(b) |
Embarq Corp., Senior Notes | | | 7.995 | % | | | 6/1/36 | | | | 415,000 | | | | 491,651 | |
Level 3 Financing Inc., Senior Notes | | | 4.625 | % | | | 9/15/27 | | | | 425,000 | | | | 437,450 | (a) |
Total Diversified Telecommunication Services | | | | | | | | | | | | | | | 1,067,139 | |
Media — 6.2% | | | | | | | | | | | | | | | | |
Altice France Holding SA, Senior Notes | | | 6.000 | % | | | 2/15/28 | | | | 420,000 | | | | 401,371 | (a) |
Altice France SA, Senior Secured Notes | | | 3.375 | % | | | 1/15/28 | | | | 435,000 | EUR | | | 493,137 | (a) |
Colombia Telecomunicaciones SA ESP, Senior Notes | | | 4.950 | % | | | 7/17/30 | | | | 200,000 | | | | 208,250 | (a) |
Gray Television Inc., Senior Notes | | | 5.125 | % | | | 10/15/24 | | | | 360,000 | | | | 367,875 | (a) |
Liberty Interactive LLC, Senior Notes | | | 8.250 | % | | | 2/1/30 | | | | 160,000 | | | | 173,306 | |
Sinclair Television Group Inc., Senior Notes | | | 5.625 | % | | | 8/1/24 | | | | 180,000 | | | | 179,438 | (a) |
Sinclair Television Group Inc., Senior Notes | | | 5.875 | % | | | 3/15/26 | | | | 370,000 | | | | 365,767 | (a) |
TEGNA Inc., Senior Notes | | | 4.625 | % | | | 3/15/28 | | | | 345,000 | | | | 338,203 | (a) |
Total Media | | | | | | | | | | | | | | | 2,527,347 | |
Wireless Telecommunication Services — 2.8% | | | | | | | | | | | | | | | | |
Millicom International Cellular SA, Senior Notes | | | 6.250 | % | | | 3/25/29 | | | | 595,000 | | | | 636,540 | (a) |
Sprint Capital Corp., Senior Notes | | | 6.875 | % | | | 11/15/28 | | | | 390,000 | | | | 488,231 | |
Total Wireless Telecommunication Services | | | | | | | | | | | | | | | 1,124,771 | |
Total Communication Services | | | | | | | | | | | | | | | 4,719,257 | |
| Consumer Discretionary — 10.9% | | | | | | | | | | | | | | | | |
Automobiles — 1.5% | | | | | | | | | | | | | | | | |
Ford Motor Co., Senior Notes | | | 8.500 | % | | | 4/21/23 | | | | 580,000 | | | | 633,125 | |
Hotels, Restaurants & Leisure — 3.3% | | | | | | | | | | | | | | | | |
International Game Technology PLC, Senior Secured Notes | | | 5.250 | % | | | 1/15/29 | | | | 375,000 | | | | 379,821 | (a) |
Scientific Games International Inc., Senior Notes | | | 8.625 | % | | | 7/1/25 | | | | 375,000 | | | | 392,006 | (a) |
Scientific Games International Inc., Senior Secured Notes | | | 5.000 | % | | | 10/15/25 | | | | 165,000 | | | | 166,134 | (a) |
Wyndham Destinations Inc., Senior Secured Notes | | | 6.000 | % | | | 4/1/27 | | | | 380,000 | | | | 390,925 | |
Total Hotels, Restaurants & Leisure | | | | | | | | | | | | | | | 1,328,886 | |
Leisure Products — 1.4% | | | | | | | | | | | | | | | | |
Vista Outdoor Inc., Senior Notes | | | 5.875 | % | | | 10/1/23 | | | | 565,000 | | | | 568,472 | |
Specialty Retail — 4.0% | | | | | | | | | | | | | | | | |
Gap Inc., Senior Secured Notes | | | 8.875 | % | | | 5/15/27 | | | | 350,000 | | | | 398,562 | (a) |
See Notes to Financial Statements.
| | |
14 | | BrandywineGLOBAL — Global High Yield Fund 2020 Annual Report |
BrandywineGLOBAL — Global High Yield Fund
| | | | | | | | | | | | | | | | |
Security | | Rate | | | Maturity
Date | | | Face
Amount† | | | Value | |
Specialty Retail — continued | | | | | | | | | | | | | | | | |
L Brands Inc., Senior Notes | | | 6.625 | % | | | 10/1/30 | | | | 100,000 | | | $ | 102,000 | (a) |
PetSmart Inc., Senior Secured Notes | | | 5.875 | % | | | 6/1/25 | | | | 1,096,000 | | | | 1,124,606 | (a) |
Total Specialty Retail | | | | | | | | | | | | | | | 1,625,168 | |
Textiles, Apparel & Luxury Goods — 0.7% | | | | | | | | | | | | | | | | |
PVH Corp., Senior Notes | | | 4.625 | % | | | 7/10/25 | | | | 260,000 | | | | 271,375 | (a) |
Total Consumer Discretionary | | | | | | | | | | | | | | | 4,427,026 | |
| Consumer Staples — 2.5% | | | | | | | | | | | | | | | | |
Food Products — 2.2% | | | | | | | | | | | | | | | | |
BRF SA, Senior Notes | | | 3.950 | % | | | 5/22/23 | | | | 320,000 | | | | 329,567 | (a) |
BRF SA, Senior Notes | | | 4.875 | % | | | 1/24/30 | | | | 325,000 | | | | 333,934 | (a) |
JBS Investments II GmbH, Senior Notes | | | 7.000 | % | | | 1/15/26 | | | | 200,000 | | | | 213,826 | (a) |
Total Food Products | | | | | | | | | | | | | | | 877,327 | |
Personal Products — 0.3% | | | | | | | | | | | | | | | | |
Edgewell Personal Care Co., Senior Notes | | | 5.500 | % | | | 6/1/28 | | | | 130,000 | | | | 136,970 | (a) |
Total Consumer Staples | | | | | | | | | | | | | | | 1,014,297 | |
| Energy — 10.0% | | | | | | | | | | | | | | | | |
Oil, Gas & Consumable Fuels — 10.0% | | | | | | | | | | | | | | | | |
Apache Corp., Senior Notes | | | 4.875 | % | | | 11/15/27 | | | | 510,000 | | | | 482,906 | |
Geopark Ltd., Senior Notes | | | 5.500 | % | | | 1/17/27 | | | | 450,000 | | | | 394,875 | (a) |
Murphy Oil Corp., Senior Notes | | | 6.875 | % | | | 8/15/24 | | | | 570,000 | | | | 528,319 | |
Occidental Petroleum Corp., Senior Notes | | | 6.625 | % | | | 9/1/30 | | | | 400,000 | | | | 369,750 | |
Occidental Petroleum Corp., Senior Notes | | | 4.200 | % | | | 3/15/48 | | | | 555,000 | | | | 382,256 | |
Petrobras Global Finance BV, Senior Notes | | | 5.600 | % | | | 1/3/31 | | | | 895,000 | | | | 956,831 | |
Petroleos Mexicanos, Senior Notes | | | 4.875 | % | | | 1/24/22 | | | | 265,000 | | | | 268,582 | |
Petroleos Mexicanos, Senior Notes | | | 6.950 | % | | | 1/28/60 | | | | 880,000 | | | | 681,802 | (a) |
Total Energy | | | | | | | | | | | | | | | 4,065,321 | |
| Financials — 6.1% | | | | | | | | | | | | | | | | |
Banks — 3.7% | | | | | | | | | | | | | | | | |
Banco do Brasil SA, Junior Subordinated Notes (6.250% to 4/15/24 then 10 year Treasury Constant Maturity Rate + 4.398%) | | | 6.250 | % | | | 4/15/24 | | | | 415,000 | | | | 389,840 | (a)(c)(d) |
Banco Mercantil del Norte SA, Junior Subordinated Notes (6.750% to 9/27/24 then 5 year Treasury Constant Maturity Rate + 4.967%) | | | 6.750 | % | | | 9/27/24 | | | | 410,000 | | | | 404,504 | (c)(d)(e) |
Itau Unibanco Holding SA, Junior Subordinated Notes (6.125% to 12/12/22 then 5 year Treasury Constant Maturity Rate + 3.981%) | | | 6.125 | % | | | 12/12/22 | | | | 745,000 | | | | 720,769 | (c)(d)(e) |
Total Banks | | | | | | | | | | | | | | | 1,515,113 | |
See Notes to Financial Statements.
| | |
| BrandywineGLOBAL — Global High Yield Fund 2020 Annual Report | | 15 |
Schedule of investments (cont’d)
September 30, 2020
BrandywineGLOBAL — Global High Yield Fund
| | | | | | | | | | | | | | | | |
| Security | | Rate | | | Maturity
Date | | | Face
Amount† | | | Value | |
Capital Markets — 0.7% | | | | | | | | | | | | | | | | |
Owl Rock Capital Corp., Senior Notes | | | 4.000 | % | | | 3/30/25 | | | | 260,000 | | | $ | 262,616 | |
Consumer Finance — 0.9% | | | | | | | | | | | | | | | | |
Blackstone/GSO Secured Lending Fund, Senior Notes | | | 3.650 | % | | | 7/14/23 | | | | 370,000 | | | | 373,118 | (a) |
Insurance — 0.8% | | | | | | | | | | | | | | | | |
Genworth Holdings Inc., Senior Notes | | | 7.200 | % | | | 2/15/21 | | | | 160,000 | | | | 161,380 | |
Genworth Holdings Inc., Senior Notes | | | 4.900 | % | | | 8/15/23 | | | | 170,000 | | | | 156,931 | |
Total Insurance | | | | | | | | | | | | | | | 318,311 | |
Total Financials | | | | | | | | | | | | | | | 2,469,158 | |
| Health Care — 6.3% | | | | | | | | | | | | | | | | |
Health Care Providers & Services — 0.4% | | | | | | | | | | | | | | | | |
Select Medical Corp., Senior Notes | | | 6.250 | % | | | 8/15/26 | | | | 145,000 | | | | 151,023 | (a) |
Pharmaceuticals — 5.9% | | | | | | | | | | | | | | | | |
Bausch Health Cos. Inc., Senior Notes | | | 6.125 | % | | | 4/15/25 | | | | 675,000 | | | | 691,706 | (a) |
Bausch Health Cos. Inc., Senior Notes | | | 6.250 | % | | | 2/15/29 | | | | 240,000 | | | | 247,200 | (a) |
Bausch Health Cos. Inc., Senior Notes | | | 7.250 | % | | | 5/30/29 | | | | 150,000 | | | | 161,878 | (a) |
Endo Dac/Endo Finance LLC/Endo Finco Inc., Senior Secured Notes | | | 5.875 | % | | | 10/15/24 | | | | 545,000 | | | | 546,442 | (a) |
Teva Pharmaceutical Finance Netherlands III BV, Senior Notes | | | 7.125 | % | | | 1/31/25 | | | | 350,000 | | | | 368,193 | |
Teva Pharmaceutical Finance Netherlands III BV, Senior Notes | | | 3.150 | % | | | 10/1/26 | | | | 460,000 | | | | 406,679 | |
Total Pharmaceuticals | | | | | | | | | | | | | | | 2,422,098 | |
Total Health Care | | | | | | | | | | | | | | | 2,573,121 | |
| Industrials — 5.6% | | | | | | | | | | | | | | | | |
Aerospace & Defense — 1.0% | | | | | | | | | | | | | | | | |
Embraer Netherlands Finance BV, Senior Notes | | | 6.950 | % | | | 1/17/28 | | | | 410,000 | | | | 415,127 | (a) |
Airlines — 1.1% | | | | | | | | | | | | | | | | |
Air Canada, Senior Notes | | | 7.750 | % | | | 4/15/21 | | | | 435,000 | | | | 436,903 | (a) |
Commercial Services & Supplies — 0.8% | | | | | | | | | | | | | | | | |
Harsco Corp., Senior Notes | | | 5.750 | % | | | 7/31/27 | | | | 330,000 | | | | 334,744 | (a) |
Industrial Conglomerates — 1.4% | | | | | | | | | | | | | | | | |
Icahn Enterprises LP/Icahn Enterprises Finance Corp., Senior Notes | | | 6.250 | % | | | 5/15/26 | | | | 555,000 | | | | 579,886 | |
See Notes to Financial Statements.
| | |
16 | | BrandywineGLOBAL — Global High Yield Fund 2020 Annual Report |
BrandywineGLOBAL — Global High Yield Fund
| | | | | | | | | | | | | | | | |
Security | | Rate | | | Maturity
Date | | | Face
Amount† | | | Value | |
Marine — 0.9% | | | | | | | | | | | | | | | | |
Navios Maritime Acquisition Corp./Navios Acquisition Finance U.S. Inc., Senior Secured Notes | | | 8.125 | % | | | 11/15/21 | | | | 110,000 | | | $ | 75,590 | (a) |
Navios South American Logistics Inc./Navios Logistics Finance U.S. Inc., Senior Secured Notes | | | 10.750 | % | | | 7/1/25 | | | | 255,000 | | | | 270,938 | (a) |
Total Marine | | | | | | | | | | | | | | | 346,528 | |
Road & Rail — 0.4% | | | | | | | | | | | | | | | | |
Uber Technologies Inc., Senior Notes | | | 6.250 | % | | | 1/15/28 | | | | 165,000 | | | | 169,797 | (a) |
Total Industrials | | | | | | | | | | | | | | | 2,282,985 | |
| Information Technology — 7.8% | | | | | | | | | | | | | | | | |
Communications Equipment — 5.2% | | | | | | | | | | | | | | | | |
CommScope Inc., Senior Notes | | | 8.250 | % | | | 3/1/27 | | | | 350,000 | | | | 364,439 | (a) |
CommScope Inc., Senior Notes | | | 7.125 | % | | | 7/1/28 | | | | 125,000 | | | | 128,602 | (a) |
CommScope Inc., Senior Secured Notes | | | 6.000 | % | | | 3/1/26 | | | | 320,000 | | | | 334,021 | (a) |
Connect Finco SARL/Connect US Finco LLC, Senior Secured Notes | | | 6.750 | % | | | 10/1/26 | | | | 535,000 | | | | 537,514 | (a) |
ViaSat Inc., Senior Notes | | | 5.625 | % | | | 9/15/25 | | | | 375,000 | | | | 367,969 | (a) |
ViaSat Inc., Senior Secured Notes | | | 5.625 | % | | | 4/15/27 | | | | 350,000 | | | | 360,719 | (a) |
Total Communications Equipment | | | | | | | | | | | | | | | 2,093,264 | |
Semiconductors & Semiconductor Equipment — 1.4% | | | | | | | | | | | | | | | | |
Broadcom Inc., Senior Notes | | | 4.750 | % | | | 4/15/29 | | | | 325,000 | | | | 378,907 | |
Entegris Inc., Senior Notes | | | 4.375 | % | | | 4/15/28 | | | | 175,000 | | | | 180,360 | (a) |
Total Semiconductors & Semiconductor Equipment | | | | | | | | 559,267 | |
Technology Hardware, Storage & Peripherals — 1.2% | | | | | | | | | | | | | | | | |
Dell International LLC/EMC Corp., Senior Notes | | | 7.125 | % | | | 6/15/24 | | | | 490,000 | | | | 510,183 | (a) |
Total Information Technology | | | | | | | | | | | | | | | 3,162,714 | |
| Materials — 19.7% | | | | | | | | | | | | | | | | |
Chemicals — 3.8% | | | | | | | | | | | | | | | | |
Braskem Netherlands Finance BV, Senior Notes | | | 5.875 | % | | | 1/31/50 | | | | 425,000 | | | | 389,512 | (e) |
Braskem Netherlands Finance BV, Senior Notes (8.500% to 1/23/26 then 5 year Treasury Constant Maturity Rate + 8.220%) | | | 8.500 | % | | | 1/23/81 | | | | 370,000 | | | | 374,027 | (a)(d) |
Methanex Corp., Senior Notes | | | 5.125 | % | | | 10/15/27 | | | | 210,000 | | | | 209,213 | |
Tronox Inc., Senior Notes | | | 6.500 | % | | | 4/15/26 | | | | 265,000 | | | | 265,497 | (a) |
Tronox Inc., Senior Secured Notes | | | 6.500 | % | | | 5/1/25 | | | | 300,000 | | | | 313,313 | (a) |
Total Chemicals | | | | | | | | | | | | | | | 1,551,562 | |
See Notes to Financial Statements.
| | |
| BrandywineGLOBAL — Global High Yield Fund 2020 Annual Report | | 17 |
Schedule of investments (cont’d)
September 30, 2020
BrandywineGLOBAL — Global High Yield Fund
| | | | | | | | | | | | | | | | |
Security | | Rate | | | Maturity
Date | | | Face
Amount† | | | Value | |
Construction Materials — 1.5% | | | | | | | | | | | | | | | | |
Cemex SAB de CV, Senior Secured Notes | | | 7.750 | % | | | 4/16/26 | | | | 335,000 | | | $ | 353,425 | (e) |
Cemex SAB de CV, Senior Secured Notes | | | 7.375 | % | | | 6/5/27 | | | | 210,000 | | | | 227,198 | (a) |
Total Construction Materials | | | | | | | | | | | | | | | 580,623 | |
Containers & Packaging — 3.4% | | | | | | | | | | | | | | | | |
Ardagh Packaging Finance PLC/Ardagh Holdings USA Inc., Senior Notes | | | 6.000 | % | | | 2/15/25 | | | | 206,000 | | | | 214,096 | (a) |
Ardagh Packaging Finance PLC/Ardagh Holdings USA Inc., Senior Notes | | | 5.250 | % | | | 8/15/27 | | | | 370,000 | | | | 377,400 | (a) |
Cascades Inc./Cascades USA Inc., Senior Notes | | | 5.125 | % | | | 1/15/26 | | | | 350,000 | | | | 366,843 | (a) |
Reynolds Group Issuer Inc./Reynolds Group Issuer LLC/Reynolds Group Issuer (Luxembourg) SA, Senior Secured Notes | | | 5.125 | % | | | 7/15/23 | | | | 400,000 | | | | 405,200 | (a) |
Total Containers & Packaging | | | | | | | | | | | | | | | 1,363,539 | |
Metals & Mining — 10.7% | | | | | | | | | | | | | | | | |
Allegheny Technologies Inc., Senior Notes | | | 7.875 | % | | | 8/15/23 | | | | 415,000 | | | | 425,464 | |
Big River Steel LLC/BRS Finance Corp., Senior Secured Notes | | | 6.625 | % | | | 1/31/29 | | | | 205,000 | | | | 207,670 | (a) |
Century Aluminum Co., Senior Secured Notes | | | 12.000 | % | | | 7/1/25 | | | | 185,000 | | | | 196,100 | (a) |
Cleveland-Cliffs Inc., Senior Notes | | | 5.750 | % | | | 3/1/25 | | | | 170,000 | | | | 158,100 | |
Cleveland-Cliffs Inc., Senior Notes | | | 5.875 | % | | | 6/1/27 | | | | 515,000 | | | | 479,594 | |
Cleveland-Cliffs Inc., Senior Secured Notes | | | 4.875 | % | | | 1/15/24 | | | | 170,000 | | | | 168,070 | (a) |
CSN Resources SA, Senior Notes | | | 7.625 | % | | | 4/17/26 | | | | 380,000 | | | | 384,987 | (a) |
First Quantum Minerals Ltd., Senior Notes | | | 7.250 | % | | | 5/15/22 | | | | 735,000 | | | | 736,029 | (a) |
First Quantum Minerals Ltd., Senior Notes | | | 7.250 | % | | | 4/1/23 | | | | 200,000 | | | | 200,055 | (a) |
First Quantum Minerals Ltd., Senior Notes | | | 6.875 | % | | | 10/15/27 | | | | 825,000 | | | | 796,125 | (a)(b) |
Freeport-McMoRan Inc., Senior Notes | | | 4.125 | % | | | 3/1/28 | | | | 340,000 | | | | 344,888 | |
Freeport-McMoRan Inc., Senior Notes | | | 4.625 | % | | | 8/1/30 | | | | 240,000 | | | | 252,774 | |
Total Metals & Mining | | | | | | | | | | | | | | | 4,349,856 | |
Paper & Forest Products — 0.3% | | | | | | | | | | | | | | | | |
Boise Cascade Co., Senior Notes | | | 4.875 | % | | | 7/1/30 | | | | 120,000 | | | | 129,300 | (a) |
Total Materials | | | | | | | | | | | | | | | 7,974,880 | |
| Real Estate — 6.8% | | | | | | | | | | | | | | | | |
Equity Real Estate Investment Trusts (REITs) — 3.0% | | | | | | | | | | | | | | | | |
Iron Mountain Inc., Senior Notes | | | 5.250 | % | | | 3/15/28 | | | | 430,000 | | | | 448,544 | (a) |
Sunac China Holdings Ltd., Senior Secured Notes | | | 8.350 | % | | | 4/19/23 | | | | 750,000 | | | | 765,906 | (e) |
Total Equity Real Estate Investment Trusts (REITs) | | | | | | | | 1,214,450 | |
See Notes to Financial Statements.
| | |
18 | | BrandywineGLOBAL — Global High Yield Fund 2020 Annual Report |
BrandywineGLOBAL — Global High Yield Fund
| | | | | | | | | | | | | | | | |
Security | | Rate | | | Maturity
Date | | | Face
Amount† | | | Value | |
Real Estate Management & Development — 3.8% | | | | | | | | | | | | | | | | |
China Evergrande Group, Senior Secured Notes | | | 6.250 | % | | | 6/28/21 | | | | 810,000 | | | $ | 764,438 | (e) |
Realogy Group LLC/Realogy Co-Issuer Corp., Secured Notes | | | 7.625 | % | | | 6/15/25 | | | | 735,000 | | | | 771,026 | (a) |
Total Real Estate Management & Development | | | | | | | | | | | | | | | 1,535,464 | |
Total Real Estate | | | | | | | | | | | | | | | 2,749,914 | |
| Utilities — 4.3% | | | | | | | | | | | | | | | | |
Electric Utilities — 3.3% | | | | | | | | | | | | | | | | |
AES Panama Generation Holdings SRL, Senior Secured Notes | | | 4.375 | % | | | 5/31/30 | | | | 315,000 | | | | 323,663 | (a) |
NRG Energy Inc., Senior Notes | | | 6.625 | % | | | 1/15/27 | | | | 335,000 | | | | 354,752 | |
Sensata Technologies Inc., Senior Notes | | | 4.375 | % | | | 2/15/30 | | | | 110,000 | | | | 115,778 | (a) |
Talen Energy Supply LLC, Senior Notes | | | 6.500 | % | | | 6/1/25 | | | | 230,000 | | | | 151,202 | |
Talen Energy Supply LLC, Senior Secured Notes | | | 7.250 | % | | | 5/15/27 | | | | 85,000 | | | | 84,856 | (a) |
Talen Energy Supply LLC, Senior Secured Notes | | | 6.625 | % | | | 1/15/28 | | | | 305,000 | | | | 296,364 | (a) |
Total Electric Utilities | | | | | | | | | | | | | | | 1,326,615 | |
Independent Power and Renewable Electricity Producers — 1.0% | | | | | | | | | | | | | | | | |
Clearway Energy Operating LLC, Senior Notes | | | 5.000 | % | | | 9/15/26 | | | | 405,000 | | | | 417,579 | |
Total Utilities | | | | | | | | | | | | | | | 1,744,194 | |
Total Corporate Bonds & Notes (Cost — $36,361,161) | | | | | | | | 37,182,867 | |
| Convertible Bonds & Notes — 3.4% | | | | | | | | | | | | | | | | |
| Communication Services — 1.9% | | | | | | | | | | | | | | | | |
Media — 1.9% | | | | | | | | | | | | | | | | |
DISH Network Corp., Senior Notes | | | 3.375 | % | | | 8/15/26 | | | | 810,000 | | | | 745,602 | |
| Information Technology — 1.0% | | | | | | | | | | | | | | | | |
Electronic Equipment, Instruments & Components — 1.0% | | | | | | | | | | | | | | | | |
Vishay Intertechnology Inc., Senior Notes | | | 2.250 | % | | | 6/15/25 | | | | 420,000 | | | | 407,478 | |
| Materials — 0.5% | | | | | | | | | | | | | | | | |
Metals & Mining — 0.5% | | | | | | | | | | | | | | | | |
Cleveland-Cliffs Inc., Senior Notes | | | 1.500 | % | | | 1/15/25 | | | | 205,000 | | | | 212,848 | |
Total Convertible Bonds & Notes (Cost — $1,340,673) | | | | | | | | 1,365,928 | |
| Sovereign Bonds — 1.2% | | | | | | | | | | | | | | | | |
South Africa — 0.7% | | | | | | | | | | | | | | | | |
Republic of South Africa Government International Bond, Senior Notes | | | 5.750 | % | | | 9/30/49 | | | | 335,000 | | | | 285,182 | |
Ukraine — 0.5% | | | | | | | | | | | | | | | | |
Ukraine Government International Bond, Senior Notes | | | 7.253 | % | | | 3/15/33 | | | | 200,000 | | | | 184,760 | (a) |
Total Sovereign Bonds (Cost — $532,741) | | | | | | | | | | | | | | | 469,942 | |
Total Investments before Short-Term Investments (Cost — $38,234,575) | | | | 39,018,737 | |
See Notes to Financial Statements.
| | |
| BrandywineGLOBAL — Global High Yield Fund 2020 Annual Report | | 19 |
Schedule of investments (cont’d)
September 30, 2020
BrandywineGLOBAL — Global High Yield Fund
| | | | | | | | | | | | | | | | |
| Security | | Rate | | | | | | Shares | | | Value | |
| Short-Term Investments — 5.1% | | | | | | | | | | | | | | | | |
JPMorgan U.S. Government Money Market Fund, Institutional Class (Cost — $2,073,105) | | | 0.010 | % | | | | | | | 2,073,105 | | | $ | 2,073,105 | |
Total Investments — 101.3% (Cost — $40,307,680) | | | | | | | | | | | | | | | 41,091,842 | |
Liabilities in Excess of Other Assets — (1.3)% | | | | | | | | | | | | | | | (512,416 | ) |
Total Net Assets — 100.0% | | | | | | | | | | | | | | $ | 40,579,426 | |
| † | Face amount denominated in U.S. dollars, unless otherwise noted. |
| (a) | Security is exempt from registration under Rule 144A of the Securities Act of 1933. This security may be resold in transactions that are exempt from registration, normally to qualified institutional buyers. This security has been deemed liquid pursuant to guidelines approved by the Board of Trustees. |
| (b) | Securities traded on a when-issued or delayed delivery basis. |
| (c) | Security has no maturity date. The date shown represents the next call date. |
| (d) | Variable rate security. Interest rate disclosed is as of the most recent information available. Certain variable rate securities are not based on a published reference rate and spread but are determined by the issuer or agent and are based on current market conditions. These securities do not indicate a reference rate and spread in their description above. |
| (e) | Security is exempt from registration under Regulation S of the Securities Act of 1933. Regulation S applies to securities offerings that are made outside of the United States and do not involve direct selling efforts in the United States. This security has been deemed liquid pursuant to guidelines approved by the Board of Trustees. |
| | |
Abbreviation(s) used in this schedule: |
| |
| EUR | | — Euro |
At September 30, 2020, the Fund had the following open forward foreign currency contracts:
| | | | | | | | | | | | | | | | | | | | |
Currency
Purchased | | | Currency
Sold | | | Counterparty | | Settlement
Date | | | Unrealized
Appreciation
(Depreciation) | |
| USD | | | 1,790,253 | | | EUR | | | 1,530,000 | | | Citibank N.A. | | | 10/2/20 | | | $ | (3,670) | |
| USD | | | 2,343,545 | | | EUR | | | 1,980,000 | | | Citibank N.A. | | | 10/2/20 | | | | 21,997 | |
| EUR | | | 3,510,000 | | | USD | | | 4,177,812 | | | JPMorgan Chase & Co. | | | 10/2/20 | | | | (62,342) | |
| BRL | | | 5,980,000 | | | USD | | | 1,157,793 | | | JPMorgan Chase & Co. | | | 10/9/20 | | | | (93,272) | |
| USD | | | 1,067,266 | | | BRL | | | 5,980,000 | | | JPMorgan Chase & Co. | | | 10/9/20 | | | | 2,746 | |
| GBP | | | 900,000 | | | USD | | | 1,181,136 | | | HSBC Securities Inc. | | | 11/20/20 | | | | (19,530) | |
| USD | | | 1,166,184 | | | GBP | | | 900,000 | | | HSBC Securities Inc. | | | 11/20/20 | | | | 4,578 | |
| EUR | | | 1,640,000 | | | USD | | | 1,923,630 | | | Citibank N.A. | | | 1/12/21 | | | | 4,034 | |
| Total | | | | | | | | | | | | | | | $ | (145,459) | |
| | |
Abbreviation(s) used in this table: |
| |
| BRL | | — Brazilian Real |
| |
| EUR | | — Euro |
| |
| GBP | | — British Pound |
| |
| USD | | — United States Dollar |
See Notes to Financial Statements.
| | |
20 | | BrandywineGLOBAL — Global High Yield Fund 2020 Annual Report |
BrandywineGLOBAL — Global High Yield Fund
At September 30, 2020, the Fund had the following open swap contracts:
| | | | | | | | | | | | | | | | | | | | | | | | |
| OTC CREDIT DEFAULT SWAPS ON CORPORATE ISSUES — SELL PROTECTION1 | |
Swap Counterparty
(Reference Entity) | | Notional
Amount2 | | | Termination
Date | | | Implied Credit Spread at
September 30,
20203 | | Periodic
Payments
Received by
the Fund† | | Market Value | | | Upfront
Premiums
Paid (Received) | | | Unrealized
Appreciation (Depreciation) | |
| Barclays Bank PLC (CCO Holdings LLC/CCO Holdings Capital Corp., 5.750%, due 1/15/24) | | $ | 350,000 | | | | 6/20/21 | | | 0.213% | | 5.000% quarterly | | $ | 12,206 | | | $ | 11,657 | | | $ | 549 | |
| Barclays Bank PLC (Sprint Communications Inc., 7.000%, due 8/15/20) | | | 715,000 | | | | 6/20/21 | | | 0.437% | | 5.000% quarterly | | | 23,741 | | | | 18,551 | | | | 5,190 | |
| Barclays Bank PLC (T-Mobile USA Inc., 4.000%, due 4/15/22) | | | 230,000 | | | | 6/20/22 | | | 0.567% | | 5.000% quarterly | | | 17,626 | | | | 16,634 | | | | 992 | |
| Goldman Sachs Group Inc. (Goodyear Tire & Rubber Co., 5.000%, due 5/31/26) | | | 670,000 | | | | 6/20/22 | | | 1.604% | | 5.000% quarterly | | | 38,901 | | | | 45,522 | | | | (6,621) | |
| JPMorgan Chase & Co. (Cleveland-Cliffs Inc., 1.500%, due 1/15/25) | | | 360,000 | | | | 6/20/21 | | | 4.415% | | 5.000% quarterly | | | 1,500 | | | | (6,685) | | | | 8,185 | |
See Notes to Financial Statements.
| | |
| BrandywineGLOBAL — Global High Yield Fund 2020 Annual Report | | 21 |
Schedule of investments (cont’d)
September 30, 2020
BrandywineGLOBAL — Global High Yield Fund
| | | | | | | | | | | | | | | | | | | | | | | | |
| OTC CREDIT DEFAULT SWAPS ON CORPORATE ISSUES — SELL PROTECTION1 (cont’d) | |
Swap Counterparty
(Reference Entity) | | Notional
Amount2 | | | Termination
Date | | | Implied Credit Spread at
September 30,
20203 | | Periodic
Payments
Received by
the Fund† | | Market Value | | | Upfront
Premiums
Paid (Received) | | | Unrealized
Appreciation (Depreciation) | |
| JPMorgan Chase & Co. (Occidental Petroleum Corp., 5.550% due 3/15/26) | | $ | 380,000 | | | | 6/20/21 | | | 3.767% | | 1.000% quarterly | | $ | (7,497) | | | $ | (8,183) | | | $ | 686 | |
| JPMorgan Chase & Co. (United States Steel Corp., 6.650%, due 6/1/37) | | | 350,000 | | | | 6/20/21 | | | 6.512% | | 5.000% quarterly | | | (3,719) | | | | 9,990 | | | | (13,709) | |
| Morgan Stanley & Co. Inc. (CenturyLink Inc., 7.500%, due 4/1/24) | | | 380,000 | | | | 6/20/23 | | | 2.043% | | 1.000% quarterly | | | (10,511) | | | | (13,740) | | | | 3,229 | |
| Morgan Stanley & Co. Inc. (CenturyLink Inc., 7.500%, due 4/1/24) | | | 415,000 | | | | 6/20/25 | | | 3.177% | | 1.000% quarterly | | | (39,261) | | | | (41,101) | | | | 1,840 | |
| Morgan Stanley & Co. Inc. (Dell Inc., 7.100%, due 4/15/28) | | | 325,000 | | | | 6/20/22 | | | 0.966% | | 1.000% quarterly | | | 192 | | | | (8,704) | | | | 8,896 | |
| Morgan Stanley & Co. Inc. (Dell Inc., 7.100%, due 4/15/28) | | | 510,000 | | | | 6/20/22 | | | 0.966% | | 1.000% quarterly | | | 301 | | | | (13,668) | | | | 13,969 | |
| Total | | $ | 4,685,000 | | | | | | | | | | | $ | 33,479 | | | $ | 10,273 | | | $ | 23,206 | |
See Notes to Financial Statements.
| | |
22 | | BrandywineGLOBAL — Global High Yield Fund 2020 Annual Report |
BrandywineGLOBAL — Global High Yield Fund
| 1 | If the Fund is a seller of protection and a credit event occurs, as defined under the terms of that particular swap agreement, the Fund will either (i) pay to the buyer of protection an amount equal to the notional amount of the swap and take delivery of the referenced obligation or underlying securities comprising the referenced index or (ii) pay a net settlement amount in the form of cash or securities equal to the notional amount of the swap less the recovery value of the referenced obligation or underlying securities comprising the referenced index. |
| 2 | The maximum potential amount the Fund could be required to pay as a seller of credit protection or receive as a buyer of credit protection if a credit event occurs as defined under the terms of that particular swap agreement. |
| 3 | Implied credit spreads, utilized in determining the market value of credit default swap agreements on corporate or sovereign issues as of period end, serve as an indicator of the current status of the payment/performance risk and represent the likelihood or risk of default for the credit derivative. The implied credit spread of a particular referenced entity reflects the cost of buying/selling protection and may include upfront payments required to be made to enter into the agreement. Wider credit spreads represent a deterioration of the referenced entity’s credit soundness and a greater likelihood or risk of default or other credit event occurring as defined under the terms of the agreement. A credit spread identified as “Defaulted” indicates a credit event has occurred for the referenced entity or obligation. |
| † | Percentage shown is an annual percentage rate. |
| | | | |
| Summary of Investments by Country* (unaudited) | | | |
| United States | | | 58.4 | % |
| Brazil | | | 10.5 | |
| Mexico | | | 4.7 | |
| Zambia | | | 4.2 | |
| China | | | 3.7 | |
| Colombia | | | 3.0 | |
| Canada | | | 2.5 | |
| Israel | | | 1.9 | |
| United Kingdom | | | 1.3 | |
| France | | | 1.2 | |
| Luxembourg | | | 1.0 | |
| Panama | | | 0.8 | |
| South Africa | | | 0.7 | |
| Uruguay | | | 0.7 | |
| Ukraine | | | 0.4 | |
| Short-Term Investments | | | 5.0 | |
| | | | 100.0 | % |
| * | As a percentage of total investments. Please note that the Fund holdings are as of September 30, 2020 and are subject to change. |
See Notes to Financial Statements.
| | |
| BrandywineGLOBAL — Global High Yield Fund 2020 Annual Report | | 23 |
Statement of assets and liabilities
September 30, 2020
| | | | |
| |
| Assets: | | | | |
Investments, at value (Cost — $40,307,680) | | $ | 41,091,842 | |
Foreign currency, at value (Cost — $2) | | | 2 | |
Interest receivable | | | 609,426 | |
OTC swaps, at value (net premiums paid — $63,307) | | | 94,467 | |
Deposits with brokers for OTC derivatives | | | 60,000 | |
Unrealized appreciation on forward foreign currency contracts | | | 33,355 | |
Deposits with brokers for centrally cleared swap contracts | | | 8,543 | |
Receivable for open OTC swap contracts | | | 4,274 | |
Receivable for Fund shares sold | | | 683 | |
Prepaid expenses | | | 30,070 | |
Total Assets | | | 41,932,662 | |
| |
| Liabilities: | | | | |
Payable for securities purchased | | | 960,000 | |
Unrealized depreciation on forward foreign currency contracts | | | 178,814 | |
OTC swaps, at value (net premiums received — $53,034) | | | 60,988 | |
Payable for Fund shares repurchased | | | 58,664 | |
Investment management fee payable | | | 14,740 | |
Distributions payable | | | 7,119 | |
Trustees’ fees payable | | | 882 | |
Service and/or distribution fees payable | | | 140 | |
Accrued expenses | | | 71,889 | |
Total Liabilities | | | 1,353,236 | |
| Total Net Assets | | $ | 40,579,426 | |
| |
| Net Assets: | | | | |
Par value (Note 7) | | $ | 47 | |
Paid-in capital in excess of par value | | | 41,859,122 | |
Total distributable earnings (loss) | | | (1,279,743) | |
| Total Net Assets | | $ | 40,579,426 | |
See Notes to Financial Statements.
| | |
24 | | BrandywineGLOBAL — Global High Yield Fund 2020 Annual Report |
| | | | |
| |
| Net Assets: | | | | |
Class A | | | $101,310 | |
Class C | | | $92,720 | |
Class FI | | | $202,298 | |
Class I | | | $2,755,911 | |
Class IS | | | $37,427,187 | |
| |
| Shares Outstanding: | | | | |
Class A | | | 11,781 | |
Class C | | | 10,773 | |
Class FI | | | 23,465 | |
Class I | | | 319,839 | |
Class IS | | | 4,347,110 | |
| |
| Net Asset Value: | | | | |
Class A (and redemption price) | | | $8.60 | |
Class C* | | | $8.61 | |
Class FI (and redemption price) | | | $8.62 | |
Class I (and redemption price) | | | $8.62 | |
Class IS (and redemption price) | | | $8.61 | |
| Maximum Public Offering Price Per Share: | | | | |
Class A (based on maximum initial sales charge of 4.25%) | | | $8.98 | |
| * | Redemption price per share is NAV of Class C shares reduced by a 1.00% CDSC if shares are redeemed within one year from purchase payment (Note 2). |
See Notes to Financial Statements.
| | |
| BrandywineGLOBAL — Global High Yield Fund 2020 Annual Report | | 25 |
Statement of operations
For the Year Ended September 30, 2020
| | | | |
| |
| Investment Income: | | | | |
Interest | | $ | 2,077,142 | |
Less: Foreign taxes withheld | | | (28,704) | |
Total Investment Income | | | 2,048,438 | |
| |
| Expenses: | | | | |
Investment management fee (Note 2) | | | 229,212 | |
Registration fees | | | 79,918 | |
Fund accounting fees | | | 70,466 | |
Audit and tax fees | | | 51,458 | |
Legal fees | | | 23,551 | |
Custody fees | | | 7,475 | |
Trustees’ fees | | | 6,312 | |
Fees recaptured by investment manager (Note 2) | | | 5,705 | |
Shareholder reports | | | 5,162 | |
Transfer agent fees (Note 5) | | | 4,474 | |
Service and/or distribution fees (Notes 2 and 5) | | | 2,353 | |
Commitment fees (Note 8) | | | 2,141 | |
Insurance | | | 1,141 | |
Interest expense | | | 17 | |
Miscellaneous expenses | | | 8,216 | |
Total Expenses | | | 497,601 | |
Less: Fee waivers and/or expense reimbursements (Notes 2 and 5) | | | (227,963) | |
Net Expenses | | | 269,638 | |
| Net Investment Income | | | 1,778,800 | |
| |
Realized and Unrealized Gain (Loss) on Investments, Futures Contracts, Swap Contracts, Forward Foreign Currency Contracts and Foreign Currency Transactions (Notes 1, 3 and 4): | | | | |
Net Realized Gain (Loss) From: | | | | |
Investment transactions | | | 220,518 | † |
Futures contracts | | | (448,773) | |
Swap contracts | | | 94,175 | |
Forward foreign currency contracts | | | 148,110 | |
Foreign currency transactions | | | (27,667) | |
Net Realized Loss | | | (13,637) | |
Change in Net Unrealized Appreciation (Depreciation) From: | | | | |
Investments | | | 13,105 | ‡ |
Futures contracts | | | (40,653) | |
Swap contracts | | | 8,005 | |
Forward foreign currency contracts | | | (104,862) | |
Foreign currencies | | | (1,988) | |
Change in Net Unrealized Appreciation (Depreciation) | | | (126,393) | |
| Net Loss on Investments, Futures Contracts, Swap Contracts, Forward Foreign Currency Contracts and Foreign Currency Transactions | | | (140,030) | |
| Increase in Net Assets From Operations | | $ | 1,638,770 | |
| † | Net of foreign capital gains tax of $411. |
| ‡ | Net of change in accrued foreign capital gains tax of $(11,160). |
See Notes to Financial Statements.
| | |
26 | | BrandywineGLOBAL — Global High Yield Fund 2020 Annual Report |
Statements of changes in net assets
| | | | | | | | |
For the Years Ended September 30, | | 2020 | | | 2019 | |
| | |
| Operations: | | | | | | | | |
Net investment income | | $ | 1,778,800 | | | $ | 1,616,315 | |
Net realized loss | | | (13,637) | | | | (662,651) | |
Change in net unrealized appreciation (depreciation) | | | (126,393) | | | | 662,583 | |
Increase in Net Assets From Operations | | | 1,638,770 | | | | 1,616,247 | |
| | |
| Distributions to Shareholders From (Notes 1 and 6): | | | | | | | | |
Total distributable earnings | | | (1,988,950) | | | | (1,920,431) | |
Decrease in Net Assets From Distributions to Shareholders | | | (1,988,950) | | | | (1,920,431) | |
| | |
| Fund Share Transactions (Note 7): | | | | | | | | |
Net proceeds from sale of shares | | | 9,028,972 | | | | 4,809,386 | |
Reinvestment of distributions | | | 1,927,091 | | | | 1,867,399 | |
Cost of shares repurchased | | | (4,997,354) | | | | (6,965,760) | |
Increase (Decrease) in Net Assets From Fund Share Transactions | | | 5,958,709 | | | | (288,975) | |
Increase (Decrease) in Net Assets | | | 5,608,529 | | | | (593,159) | |
| | |
| Net Assets: | | | | | | | | |
Beginning of year | | | 34,970,897 | | | | 35,564,056 | |
End of year | | $ | 40,579,426 | | | $ | 34,970,897 | |
See Notes to Financial Statements.
| | |
| BrandywineGLOBAL — Global High Yield Fund 2020 Annual Report | | 27 |
Financial highlights
| | | | | | | | | | | | | | | | | | | | | | | | |
For a share of each class of beneficial interest outstanding throughout each year ended September 30, unless otherwise noted: | |
| Class A Shares1 | | 2020 | | | 2019 | | | 2018 | | | 20172 | | | 20163 | | | 20153 | |
| | | | | | |
| Net asset value, beginning of year | | | $8.74 | | | | $8.82 | | | | $9.23 | | | | $8.80 | | | | $8.46 | | | | $9.69 | |
| | | | | | |
| Income (loss) from operations: | | | | | | | | | | | | | | | | | | | | | | | | |
Net investment income | | | 0.40 | | | | 0.35 | | | | 0.37 | | | | 0.40 | | | | 0.36 | | | | 0.40 | |
Net realized and unrealized gain (loss) | | | (0.09) | | | | (0.01) | | | | (0.40) | | | | 0.42 | | | | 0.33 | | | | (0.79) | |
Total income (loss) from operations | | | 0.31 | | | | 0.34 | | | | (0.03) | | | | 0.82 | | | | 0.69 | | | | (0.39) | |
| | | | | | |
| Less distributions from: | | | | | | | | | | | | | | | | | | | | | | | | |
Net investment income | | | (0.45) | | | | (0.42) | | | | (0.38) | | | | (0.32) | | | | (0.17) | | | | (0.42) | |
Net realized gains | | | — | | | | — | | | | — | | | | — | | | | — | | | | (0.32) | |
Return of capital | | | — | | | | — | | | | — | | | | (0.07) | | | | (0.18) | | | | (0.10) | |
Total distributions | | | (0.45) | | | | (0.42) | | | | (0.38) | | | | (0.39) | | | | (0.35) | | | | (0.84) | |
| | | | | | |
| Net asset value, end of year | | | $8.60 | | | | $8.74 | | | | $8.82 | | | | $9.23 | | | | $8.80 | | | | $8.46 | |
Total return4 | | | 3.71 | % | | | 4.06 | % | | | (0.38) | % | | | 9.51 | % | | | 8.35 | % | | | (4.16) | % |
| | | | | | |
| Net assets, end of year (000s) | | | $101 | | | | $121 | | | | $122 | | | | $238 | | | | $460 | | | | $1,956 | |
| | | | | | |
| Ratios to average net assets: | | | | | | | | | | | | | | | | | | | | | | | | |
Gross expenses | | | 2.14 | %5 | | | 1.91 | %5 | | | 1.87 | %5 | | | 1.76 | %6 | | | 2.32 | %5 | | | 1.79 | % |
Net expenses7,8 | | | 1.15 | 5 | | | 1.15 | 5 | | | 1.15 | 5 | | | 1.15 | 6 | | | 1.15 | 5 | | | 1.15 | |
Net investment income | | | 4.66 | | | | 4.05 | | | | 4.11 | | | | 4.90 | 6 | | | 4.23 | | | | 4.49 | |
| | | | | | |
| Portfolio turnover rate | | | 94 | % | | | 104 | % | | | 93 | % | | | 78 | % | | | 96 | % | | | 54 | % |
| 1 | Per share amounts have been calculated using the average shares method. |
| 2 | For the period November 1, 2016 to September 30, 2017. |
| 3 | For the year ended October 31. |
| 4 | Performance figures, exclusive of sales charges, may reflect compensating balance arrangements, fee waivers and/or expense reimbursements. In the absence of compensating balance arrangements, fee waivers and/or expense reimbursements, the total return would have been lower. Past performance is no guarantee of future results. Total returns for periods of less than one year are not annualized. |
| 5 | Reflects recapture of expenses waived/reimbursed from prior fiscal years. |
| 7 | Reflects fee waivers and/or expense reimbursements. |
| 8 | As a result of an expense limitation arrangement, the ratio of total annual fund operating expenses, other than interest, brokerage commissions, dividend expense on short sales, taxes, extraordinary expenses and acquired fund fees and expenses, to average net assets of Class A shares did not exceed 1.15%. This expense limitation arrangement cannot be terminated prior to December 31, 2021 without the Board of Trustees’ consent. |
See Notes to Financial Statements.
| | |
28 | | BrandywineGLOBAL — Global High Yield Fund 2020 Annual Report |
| | | | | | | | | | | | | | | | | | | | | | | | |
For a share of each class of beneficial interest outstanding throughout each year ended September 30, unless otherwise noted: | |
| Class C Shares1 | | 2020 | | | 2019 | | | 2018 | | | 20172 | | | 20163 | | | 20153 | |
| | | | | | |
| Net asset value, beginning of year | | | $8.75 | | | | $8.83 | | | | $9.24 | | | | $8.79 | | | | $8.46 | | | | $9.69 | |
| | | | | | |
| Income (loss) from operations: | | | | | | | | | | | | | | | | | | | | | | | | |
Net investment income | | | 0.33 | | | | 0.28 | | | | 0.29 | | | | 0.34 | | | | 0.30 | | | | 0.34 | |
Net realized and unrealized gain (loss) | | | (0.08) | | | | (0.01) | | | | (0.39) | | | | 0.45 | | | | 0.32 | | | | (0.80) | |
Total income (loss) from operations | | | 0.25 | | | | 0.27 | | | | (0.10) | | | | 0.79 | | | | 0.62 | | | | (0.46) | |
| | | | | | |
| Less distributions from: | | | | | | | | | | | | | | | | | | | | | | | | |
Net investment income | | | (0.39) | | | | (0.35) | | | | (0.31) | | | | (0.28) | | | | (0.14) | | | | (0.37) | |
Net realized gains | | | — | | | | — | | | | — | | | | — | | | | — | | | | (0.32) | |
Return of capital | | | — | | | | — | | | | — | | | | (0.06) | | | | (0.15) | | | | (0.08) | |
Total distributions | | | (0.39) | | | | (0.35) | | | | (0.31) | | | | (0.34) | | | | (0.29) | | | | (0.77) | |
| | | | | | |
| Net asset value, end of year | | | $8.61 | | | | $8.75 | | | | $8.83 | | | | $9.24 | | | | $8.79 | | | | $8.46 | |
Total return4 | | | 2.93 | % | | | 3.28 | % | | | (1.13) | % | | | 9.11 | % | | | 7.47 | % | | | (4.88) | % |
| | | | | | |
| Net assets, end of year (000s) | | | $93 | | | | $179 | | | | $173 | | | | $349 | | | | $395 | | | | $15 | |
| | | | | | |
| Ratios to average net assets: | | | | | | | | | | | | | | | | | | | | | | | | |
Gross expenses | | | 2.58 | %5 | | | 2.54 | %5 | | | 2.48 | % | | | 2.27 | %6 | | | 2.40 | % | | | 2.68 | % |
Net expenses7,8 | | | 1.90 | 5 | | | 1.90 | 5 | | | 1.90 | | | | 1.82 | 6 | | | 1.80 | | | | 1.90 | |
Net investment income | | | 3.89 | | | | 3.31 | | | | 3.15 | | | | 4.10 | 6 | | | 3.52 | | | | 3.78 | |
| | | | | | |
| Portfolio turnover rate | | | 94 | % | | | 104 | % | | | 93 | % | | | 78 | % | | | 96 | % | | | 54 | % |
| 1 | Per share amounts have been calculated using the average shares method. |
| 2 | For the period November 1, 2016 to September 30, 2017. |
| 3 | For the year ended October 31. |
| 4 | Performance figures, exclusive of CDSC, may reflect compensating balance arrangements, fee waivers and/or expense reimbursements. In the absence of compensating balance arrangements, fee waivers and/or expense reimbursements, the total return would have been lower. Past performance is no guarantee of future results. Total returns for periods of less than one year are not annualized. |
| 5 | Reflects recapture of expenses waived/reimbursed from prior fiscal years. |
| 7 | Reflects fee waivers and/or expense reimbursements. |
| 8 | As a result of an expense limitation arrangement, the ratio of total annual fund operating expenses, other than interest, brokerage commissions, dividend expense on short sales, taxes, extraordinary expenses and acquired fund fees and expenses, to average net assets of Class C shares did not exceed 1.90%. This expense limitation arrangement cannot be terminated prior to December 31, 2021 without the Board of Trustees’ consent. |
See Notes to Financial Statements.
| | |
| BrandywineGLOBAL — Global High Yield Fund 2020 Annual Report | | 29 |
Financial highlights (cont’d)
| | | | | | | | | | | | | | | | | | | | | | | | |
For a share of each class of beneficial interest outstanding throughout each year ended September 30, unless otherwise noted: | |
| Class FI Shares1 | | 2020 | | | 2019 | | | 2018 | | | 20172 | | | 20163 | | | 20153 | |
| | | | | | |
| Net asset value, beginning of year | | | $8.77 | | | | $8.85 | | | | $9.26 | | | | $8.81 | | | | $8.46 | | | | $9.69 | |
| | | | | | |
| Income (loss) from operations: | | | | | | | | | | | | | | | | | | | | | | | | |
Net investment income | | | 0.40 | | | | 0.35 | | | | 0.34 | | | | 0.40 | | | | 0.40 | | | | 0.40 | |
Net realized and unrealized gain (loss) | | | (0.10) | | | | (0.01) | | | | (0.38) | | | | 0.45 | | | | 0.30 | | | | (0.79) | |
Total income (loss) from operations | | | 0.30 | | | | 0.34 | | | | (0.04) | | | | 0.85 | | | | 0.70 | | | | (0.39) | |
| | | | | | |
| Less distributions from: | | | | | | | | | | | | | | | | | | | | | | | | |
Net investment income | | | (0.45) | | | | (0.42) | | | | (0.37) | | | | (0.33) | | | | (0.17) | | | | (0.42) | |
Net realized gains | | | — | | | | — | | | | — | | | | — | | | | — | | | | (0.32) | |
Return of capital | | | — | | | | — | | | | — | | | | (0.07) | | | | (0.18) | | | | (0.10) | |
Total distributions | | | (0.45) | | | | (0.42) | | | | (0.37) | | | | (0.40) | | | | (0.35) | | | | (0.84) | |
| | | | | | |
| Net asset value, end of year | | | $8.62 | | | | $8.77 | | | | $8.85 | | | | $9.26 | | | | $8.81 | | | | $8.46 | |
Total return4 | | | 3.59 | % | | | 4.09 | % | | | (0.40) | % | | | 9.82 | % | | | 8.51 | % | | | (4.17) | % |
| | | | | | |
| Net assets, end of year (000s) | | | $202 | | | | $104 | | | | $104 | | | | $99 | | | | $100 | | | | $10 | |
| | | | | | |
| Ratios to average net assets: | | | | | | | | | | | | | | | | | | | | | | | | |
Gross expenses | | | 1.89 | %5 | | | 1.83 | %5 | | | 1.82 | % | | | 1.69 | %6 | | | 1.62 | % | | | 1.86 | % |
Net expenses7,8 | | | 1.15 | 5 | | | 1.15 | 5 | | | 1.15 | | | | 1.14 | 6 | | | 1.02 | | | | 1.15 | |
Net investment income | | | 4.69 | | | | 4.06 | | | | 3.75 | | | | 4.79 | 6 | | | 4.41 | | | | 4.52 | |
| | | | | | |
| Portfolio turnover rate | | | 94 | % | | | 104 | % | | | 93 | % | | | 78 | % | | | 96 | % | | | 54 | % |
| 1 | Per share amounts have been calculated using the average shares method. |
| 2 | For the period November 1, 2016 to September 30, 2017. |
| 3 | For the year ended October 31. |
| 4 | Performance figures may reflect compensating balance arrangements, fee waivers and/or expense reimbursements. In the absence of compensating balance arrangements, fee waivers and/or expense reimbursements, the total return would have been lower. Past performance is no guarantee of future results. Total returns for periods of less than one year are not annualized. |
| 5 | Reflects recapture of expenses waived/reimbursed from prior fiscal years. |
| 7 | Reflects fee waivers and/or expense reimbursements. |
| 8 | As a result of an expense limitation arrangement, the ratio of total annual fund operating expenses, other than interest, brokerage commissions, dividend expense on short sales, taxes, extraordinary expenses and acquired fund fees and expenses, to average net assets of Class FI shares did not exceed 1.15%. This expense limitation arrangement cannot be terminated prior to December 31, 2021 without the Board of Trustees’ consent. |
See Notes to Financial Statements.
| | |
30 | | BrandywineGLOBAL — Global High Yield Fund 2020 Annual Report |
| | | | | | | | | | | | | | | | | | | | | | | | |
For a share of each class of beneficial interest outstanding throughout each year ended September 30, unless otherwise noted: | |
| Class I Shares1 | | 2020 | | | 2019 | | | 2018 | | | 20172 | | | 20163 | | | 20153 | |
| | | | | | |
| Net asset value, beginning of year | | | $8.76 | | | | $8.84 | | | | $9.24 | | | | $8.80 | | | | $8.46 | | | | $9.69 | |
| | | | | | |
| Income (loss) from operations: | | | | | | | | | | | | | | | | | | | | | | | | |
Net investment income | | | 0.42 | | | | 0.37 | | | | 0.40 | | | | 0.41 | | | | 0.38 | | | | 0.43 | |
Net realized and unrealized gain (loss) | | | (0.08) | | | | (0.01) | | | | (0.40) | | | | 0.44 | | | | 0.34 | | | | (0.79) | |
Total income (loss) from operations | | | 0.34 | | | | 0.36 | | | | 0.00 | 4 | | | 0.85 | | | | 0.72 | | | | (0.36) | |
| | | | | | |
| Less distributions from: | | | | | | | | | | | | | | | | | | | | | | | | |
Net investment income | | | (0.48) | | | | (0.44) | | | | (0.40) | | | | (0.34) | | | | (0.19) | | | | (0.45) | |
Net realized gains | | | — | | | | — | | | | — | | | | — | | | | — | | | | (0.32) | |
Return of capital | | | — | | | | — | | | | — | | | | (0.07) | | | | (0.19) | | | | (0.10) | |
Total distributions | | | (0.48) | | | | (0.44) | | | | (0.40) | | | | (0.41) | | | | (0.38) | | | | (0.87) | |
| | | | | | |
| Net asset value, end of year | | | $8.62 | | | | $8.76 | | | | $8.84 | | | | $9.24 | | | | $8.80 | | | | $8.46 | |
Total return5 | | | 4.01 | % | | | 4.36 | % | | | 0.04 | % | | | 9.94 | % | | | 8.74 | % | | | (3.85) | % |
| | | | | | |
| Net assets, end of year (000s) | | | $2,756 | | | | $2,331 | | | | $2,445 | | | | $3,737 | | | | $2,804 | | | | $233 | |
| | | | | | |
| Ratios to average net assets: | | | | | | | | | | | | | | | | | | | | | | | | |
Gross expenses | | | 1.50 | %6 | | | 1.50 | %6 | | | 1.42 | %6 | | | 1.34 | %7 | | | 1.41 | % | | | 1.37 | % |
Net expenses8,9 | | | 0.85 | 6 | | | 0.85 | 6 | | | 0.85 | 6 | | | 0.84 | 7 | | | 0.78 | | | | 0.82 | |
Net investment income | | | 4.96 | | | | 4.35 | | | | 4.37 | | | | 5.01 | 7 | | | 4.49 | | | | 4.80 | |
| | | | | | |
| Portfolio turnover rate | | | 94 | % | | | 104 | % | | | 93 | % | | | 78 | % | | | 96 | % | | | 54 | % |
| 1 | Per share amounts have been calculated using the average shares method. |
| 2 | For the period November 1, 2016 to September 30, 2017. |
| 3 | For the year ended October 31. |
| 4 | Amount represents less than $0.005 per share. |
| 5 | Performance figures may reflect compensating balance arrangements, fee waivers and/or expense reimbursements. In the absence of compensating balance arrangements, fee waivers and/or expense reimbursements, the total return would have been lower. Past performance is no guarantee of future results. Total returns for periods of less than one year are not annualized. |
| 6 | Reflects recapture of expenses waived/reimbursed from prior fiscal years. |
| 8 | Reflects fee waivers and/or expense reimbursements. |
| 9 | As a result of an expense limitation arrangement, the ratio of total annual fund operating expenses, other than interest, brokerage commissions, dividend expense on short sales, taxes, extraordinary expenses and acquired fund fees and expenses, to average net assets of Class I shares did not exceed 0.85%. This expense limitation arrangement cannot be terminated prior to December 31, 2021 without the Board of Trustees’ consent. |
See Notes to Financial Statements.
| | |
| BrandywineGLOBAL — Global High Yield Fund 2020 Annual Report | | 31 |
Financial highlights (cont’d)
| | | | | | | | | | | | | | | | | | | | | | | | |
For a share of each class of beneficial interest outstanding throughout each year ended September 30, unless otherwise noted: | |
| Class IS Shares1 | | 2020 | | | 2019 | | | 2018 | | | 20172 | | | 20163 | | | 20153 | |
| | | | | | |
| Net asset value, beginning of year | | | $8.75 | | | | $8.83 | | | | $9.24 | | | | $8.79 | | | | $8.46 | | | | $9.69 | |
| | | | | | |
| Income (loss) from operations: | | | | | | | | | | | | | | | | | | | | | | | | |
Net investment income | | | 0.43 | | | | 0.38 | | | | 0.41 | | | | 0.42 | | | | 0.39 | | | | 0.44 | |
Net realized and unrealized gain (loss) | | | (0.09) | | | | (0.00) | 4 | | | (0.41) | | | | 0.45 | | | | 0.32 | | | | (0.79) | |
Total income (loss) from operations | | | 0.34 | | | | 0.38 | | | | 0.00 | 4 | | | 0.87 | | | | 0.71 | | | | (0.35) | |
| | | | | | |
| Less distributions from: | | | | | | | | | | | | | | | | | | | | | | | | |
Net investment income | | | (0.48) | | | | (0.46) | | | | (0.41) | | | | (0.35) | | | | (0.19) | | | | (0.45) | |
Net realized gains | | | — | | | | — | | | | — | | | | — | | | | — | | | | (0.32) | |
Return of capital | | | — | | | | — | | | | — | | | | (0.07) | | | | (0.19) | | | | (0.11) | |
Total distributions | | | (0.48) | | | | (0.46) | | | | (0.41) | | | | (0.42) | | | | (0.38) | | | | (0.88) | |
| | | | | | |
| Net asset value, end of year | | | $8.61 | | | | $8.75 | | | | $8.83 | | | | $9.24 | | | | $8.79 | | | | $8.46 | |
Total return5 | | | 4.11 | % | | | 4.50 | % | | | (0.01) | % | | | 10.16 | % | | | 8.66 | % | | | (3.78) | % |
| | | | | | |
| Net assets, end of year (000s) | | | $37,427 | | | | $32,235 | | | | $32,719 | | | | $36,778 | | | | $37,586 | | | | $26,485 | |
| | | | | | |
| Ratios to average net assets: | | | | | | | | | | | | | | | | | | | | | | | | |
Gross expenses | | | 1.39 | %6 | | | 1.39 | %6 | | | 1.38 | %6 | | | 1.21 | %7 | | | 1.35 | % | | | 1.27 | % |
Net expenses8,9 | | | 0.75 | 6 | | | 0.75 | 6 | | | 0.75 | 6 | | | 0.75 | 7 | | | 0.75 | | | | 0.75 | |
Net investment income | | | 5.06 | | | | 4.46 | | | | 4.55 | | | | 5.13 | 7 | | | 4.53 | | | | 4.91 | |
| | | | | | |
| Portfolio turnover rate | | | 94 | % | | | 104 | % | | | 93 | % | | | 78 | % | | | 96 | % | | | 54 | % |
| 1 | Per share amounts have been calculated using the average shares method. |
| 2 | For the period November 1, 2016 to September 30, 2017. |
| 3 | For the year ended October 31. |
| 4 | Amount represents less than $0.005 per share. |
| 5 | Performance figures may reflect compensating balance arrangements, fee waivers and/or expense reimbursements. In the absence of compensating balance arrangements, fee waivers and/or expense reimbursements, the total return would have been lower. Past performance is no guarantee of future results. Total returns for periods of less than one year are not annualized. |
| 6 | Reflects recapture of expenses waived/reimbursed from prior fiscal years. |
| 8 | Reflects fee waivers and/or expense reimbursements. |
| 9 | As a result of an expense limitation arrangement, the ratio of total annual fund operating expenses, other than interest, brokerage commissions, dividend expense on short sales, taxes, extraordinary expenses and acquired fund fees and expenses, to average net assets of Class IS shares did not exceed 0.75%. In addition, the ratio of total annual fund operating expenses for Class IS shares did not exceed the ratio of total annual fund operating expenses for Class I shares. These expense limitation arrangements cannot be terminated prior to December 31, 2021 without the Board of Trustees’ consent. |
See Notes to Financial Statements.
| | |
32 | | BrandywineGLOBAL — Global High Yield Fund 2020 Annual Report |
Notes to financial statements
1. Organization and significant accounting policies
BrandywineGLOBAL — Global High Yield Fund (the “Fund”) is a separate non-diversified investment series of Legg Mason Global Asset Management Trust (the “Trust”). The Trust, a Maryland statutory trust, is registered under the Investment Company Act of 1940, as amended (the “1940 Act”), as an open-end management investment company.
The following are significant accounting policies consistently followed by the Fund and are in conformity with U.S. generally accepted accounting principles (“GAAP”). Estimates and assumptions are required to be made regarding assets, liabilities and changes in net assets resulting from operations when financial statements are prepared. Changes in the economic environment, financial markets and any other parameters used in determining these estimates could cause actual results to differ. Subsequent events have been evaluated through the date the financial statements were issued.
(a) Investment valuation. The valuations for fixed income securities (which may include, but are not limited to, corporate, government, municipal, mortgage-backed, collateralized mortgage obligations and asset-backed securities) and certain derivative instruments are typically the prices supplied by independent third party pricing services, which may use market prices or broker/dealer quotations or a variety of valuation techniques and methodologies. The independent third party pricing services use inputs that are observable such as issuer details, interest rates, yield curves, prepayment speeds, credit risks/spreads, default rates and quoted prices for similar securities. Investments in open-end funds are valued at the closing net asset value per share of each fund on the day of valuation. Futures contracts are valued daily at the settlement price established by the board of trade or exchange on which they are traded. Equity securities for which market quotations are available are valued at the last reported sales price or official closing price on the primary market or exchange on which they trade. When the Fund holds securities or other assets that are denominated in a foreign currency, the Fund will normally use the currency exchange rates as of 4:00 p.m. (Eastern Time). If independent third party pricing services are unable to supply prices for a portfolio investment, or if the prices supplied are deemed by the manager to be unreliable, the market price may be determined by the manager using quotations from one or more broker/dealers or at the transaction price if the security has recently been purchased and no value has yet been obtained from a pricing service or pricing broker. When reliable prices are not readily available, such as when the value of a security has been significantly affected by events after the close of the exchange or market on which the security is principally traded, but before the Fund calculates its net asset value, the Fund values these securities as determined in accordance with procedures approved by the Fund’s Board of Trustees.
The Board of Trustees is responsible for the valuation process and has delegated the supervision of the daily valuation process to the Legg Mason North Atlantic Fund Valuation Committee (the “Valuation Committee”). The Valuation Committee, pursuant to the policies adopted by the Board of Trustees, is responsible for making fair value determinations, evaluating the effectiveness of the Fund’s pricing policies, and reporting to the Board of Trustees. When determining the reliability of third party pricing information for investments owned by the Fund, the Valuation Committee, among other things, conducts due diligence reviews of pricing vendors, monitors the daily change in prices and reviews transactions among market participants.
| | |
| BrandywineGLOBAL — Global High Yield Fund 2020 Annual Report | | 33 |
Notes to financial statements (cont’d)
The Valuation Committee will consider pricing methodologies it deems relevant and appropriate when making fair value determinations. Examples of possible methodologies include, but are not limited to, multiple of earnings; discount from market of a similar freely traded security; discounted cash-flow analysis; book value or a multiple thereof; risk premium/yield analysis; yield to maturity; and/or fundamental investment analysis. The Valuation Committee will also consider factors it deems relevant and appropriate in light of the facts and circumstances. Examples of possible factors include, but are not limited to, the type of security; the issuer’s financial statements; the purchase price of the security; the discount from market value of unrestricted securities of the same class at the time of purchase; analysts’ research and observations from financial institutions; information regarding any transactions or offers with respect to the security; the existence of merger proposals or tender offers affecting the security; the price and extent of public trading in similar securities of the issuer or comparable companies; and the existence of a shelf registration for restricted securities.
For each portfolio security that has been fair valued pursuant to the policies adopted by the Board of Trustees, the fair value price is compared against the last available and next available market quotations. The Valuation Committee reviews the results of such back testing monthly and fair valuation occurrences are reported to the Board of Trustees quarterly.
The Fund uses valuation techniques to measure fair value that are consistent with the market approach and/or income approach, depending on the type of security and the particular circumstance. The market approach uses prices and other relevant information generated by market transactions involving identical or comparable securities. The income approach uses valuation techniques to discount estimated future cash flows to present value.
GAAP establishes a disclosure hierarchy that categorizes the inputs to valuation techniques used to value assets and liabilities at measurement date. These inputs are summarized in the three broad levels listed below:
| • | | Level 1 — quoted prices in active markets for identical investments |
| • | | Level 2 — other significant observable inputs (including quoted prices for similar investments, interest rates, prepayment speeds, credit risk, etc.) |
| • | | Level 3 — significant unobservable inputs (including the Fund’s own assumptions in determining the fair value of investments) |
The inputs or methodologies used to value securities are not necessarily an indication of the risk associated with investing in those securities.
| | |
34 | | BrandywineGLOBAL — Global High Yield Fund 2020 Annual Report |
The following is a summary of the inputs used in valuing the Fund’s assets and liabilities carried at fair value:
| | | | | | | | | | | | | | | | |
ASSETS | |
| Description | | Quoted Prices
(Level 1) | | | Other Significant
Observable Inputs
(Level 2) | | | Significant
Unobservable
Inputs (Level3) | | | Total | |
| Long-Term Investments†: | | | | | | | | | | | | | | | | |
Corporate Bonds & Notes | | | — | | | $ | 37,182,867 | | | | — | | | $ | 37,182,867 | |
Convertible Bonds & Notes | | | — | | | | 1,365,928 | | | | — | | | | 1,365,928 | |
Sovereign Bonds | | | — | | | | 469,942 | | | | — | | | | 469,942 | |
| Total Long-Term Investments | | | — | | | | 39,018,737 | | | | — | | | | 39,018,737 | |
| Short-Term Investments† | | $ | 2,073,105 | | | | — | | | | — | | | | 2,073,105 | |
| Total Investments | | $ | 2,073,105 | | | $ | 39,018,737 | | | | — | | | $ | 41,091,842 | |
| Other Financial Instruments: | | | | | | | | | | | | | | | | |
Forward Foreign Currency Contracts | | | — | | | $ | 33,355 | | | | — | | | $ | 33,355 | |
OTC Credit Default Swaps on Corporate Issues — Sell Protection‡ | | | — | | | | 94,467 | | | | — | | | | 94,467 | |
| Total Other Financial Instruments | | | — | | | $ | 127,822 | | | | — | | | $ | 127,822 | |
| Total | | $ | 2,073,105 | | | $ | 39,146,559 | | | | — | | | $ | 41,219,664 | |
|
| LIABILITIES | |
| Description | | Quoted Prices
(Level 1) | | | Other Significant
Observable Inputs
(Level 2) | | | Significant
Unobservable
Inputs
(Level3) | | | Total | |
| Other Financial Instruments: | | | | | | | | | | | | | | | | |
Forward Foreign Currency Contracts | | | — | | | $ | 178,814 | | | | — | | | $ | 178,814 | |
OTC Credit Default Swaps on Corporate Issues — Sell Protection‡ | | | — | | | | 60,988 | | | | — | | | | 60,988 | |
| Total | | | — | | | $ | 239,802 | | | | — | | | $ | 239,802 | |
| † | See Schedule of Investments for additional detailed categorizations. |
| ‡ | Value includes any premium paid or received with respect to swap contracts. |
(b) Futures contracts. The Fund uses futures contracts generally to gain exposure to, or hedge against, changes in interest rates or gain exposure to, or hedge against, changes in certain asset classes. A futures contract represents a commitment for the future purchase or sale of an asset at a specified price on a specified date.
Upon entering into a futures contract, the Fund is required to deposit cash or securities with a broker in an amount equal to a certain percentage of the contract amount. This is known as the ‘‘initial margin’’ and subsequent payments (‘‘variation margin’’) are made or received by the Fund each day, depending on the daily fluctuation in the value of the contract. For
| | |
| BrandywineGLOBAL — Global High Yield Fund 2020 Annual Report | | 35 |
Notes to financial statements (cont’d)
certain futures, including foreign denominated futures, variation margin is not settled daily, but is recorded as a net variation margin payable or receivable. The daily changes in contract value are recorded as unrealized gains or losses in the Statement of Operations and the Fund recognizes a realized gain or loss when the contract is closed.
Futures contracts involve, to varying degrees, risk of loss in excess of the amounts reflected in the financial statements. In addition, there is the risk that the Fund may not be able to enter into a closing transaction because of an illiquid secondary market.
(c) Forward foreign currency contracts. The Fund enters into a forward foreign currency contract to hedge exposure of bond positions or in an attempt to increase the Fund’s return. A forward foreign currency contract is an agreement between two parties to buy and sell a currency at a set price with delivery and settlement at a future date. The contract is marked-to-market daily and the change in value is recorded by the Fund as an unrealized gain or loss. When a forward foreign currency contract is closed, through either delivery or offset by entering into another forward foreign currency contract, the Fund recognizes a realized gain or loss equal to the difference between the value of the contract at the time it was opened and the value of the contract at the time it is closed.
Forward foreign currency contracts involve elements of market risk in excess of the amounts reflected on the Statement of Assets and Liabilities. The Fund bears the risk of an unfavorable change in the foreign exchange rate underlying the forward foreign currency contract. Risks may also arise upon entering into these contracts from the potential inability of the counterparties to meet the terms of their contracts.
(d) Swap agreements. The Fund invests in swaps for the purpose of managing its exposure to interest rate, credit or market risk, or for other purposes. The use of swaps involves risks that are different from those associated with other portfolio transactions. Swap agreements are privately negotiated in the over-the-counter market and may be entered into as a bilateral contract (“OTC Swaps”) or centrally cleared (“Centrally Cleared Swaps”). Unlike Centrally Cleared Swaps, the Fund has credit exposure to the counterparties of OTC Swaps.
In a Centrally Cleared Swap, immediately following execution of the swap, the swap agreement is submitted to a clearinghouse or central counterparty (the “CCP”) and the CCP becomes the ultimate counterparty of the swap agreement. The Fund is required to interface with the CCP through a broker, acting in an agency capacity. All payments are settled with the CCP through the broker. Upon entering into a Centrally Cleared Swap, the Fund is required to deposit initial margin with the broker in the form of cash or securities.
Swap contracts are marked-to-market daily and changes in value are recorded as unrealized appreciation (depreciation). The daily change in valuation of Centrally Cleared Swaps, if any, is recorded as a net receivable or payable for variation margin on the Statement of Assets and Liabilities. Gains or losses are realized upon termination of the swap agreement. Collateral, in the form of restricted cash or securities, may be required to be held in segregated accounts with the Fund’s custodian in compliance with the terms of the swap contracts. Securities posted as collateral for swap contracts are identified in the Schedule of Investments and restricted cash, if any, is identified on the Statement of Assets
| | |
36 | | BrandywineGLOBAL — Global High Yield Fund 2020 Annual Report |
and Liabilities. Risks may exceed amounts recorded in the Statement of Assets and Liabilities. These risks include changes in the returns of the underlying instruments, failure of the counterparties to perform under the contracts’ terms, and the possible lack of liquidity with respect to the swap agreements.
OTC swap payments received or made at the beginning of the measurement period are reflected as a premium or deposit, respectively, on the Statement of Assets and Liabilities. These upfront payments are amortized over the life of the swap and are recognized as realized gain or loss in the Statement of Operations. Net periodic payments received or paid by the Fund are recognized as a realized gain or loss in the Statement of Operations.
The Fund’s maximum exposure in the event of a defined credit event on a credit default swap to sell protection is the notional amount. As of September 30, 2020, the total notional value of all credit default swaps to sell protection was $4,685,000. These amounts would be offset by the value of the swaps’ reference entity, upfront premiums received on the swap and any amounts received from the settlement of a credit default swap where the Fund bought protection for the same referenced security/entity.
For average notional amounts of swaps held during the year ended September 30, 2020, see Note 4.
Credit default swaps
The Fund enters into credit default swap (“CDS”) contracts for investment purposes, to manage its credit risk or to add leverage. CDS agreements involve one party making a stream of payments to another party in exchange for the right to receive a specified return in the event of a default by a third party, typically corporate or sovereign issuers, on a specified obligation, or in the event of a write-down, principal shortfall, interest shortfall or default of all or part of the referenced entities comprising a credit index. The Fund may use a CDS to provide protection against defaults of the issuers (i.e., to reduce risk where the Fund has exposure to an issuer) or to take an active long or short position with respect to the likelihood of a particular issuer’s default. As a seller of protection, the Fund generally receives an upfront payment or a stream of payments throughout the term of the swap provided that there is no credit event. If the Fund is a seller of protection and a credit event occurs, as defined under the terms of that particular swap agreement, the maximum potential amount of future payments (undiscounted) that the Fund could be required to make under a credit default swap agreement would be an amount equal to the notional amount of the agreement. These amounts of potential payments will be partially offset by any recovery of values from the respective referenced obligations. As a seller of protection, the Fund effectively adds leverage to its portfolio because, in addition to its total net assets, the Fund is subject to investment exposure on the notional amount of the swap. As a buyer of protection, the Fund generally receives an amount up to the notional value of the swap if a credit event occurs.
Implied spreads are the theoretical prices a lender receives for credit default protection. When spreads rise, market perceived credit risk rises and when spreads fall, market perceived credit risk falls. The implied credit spread of a particular referenced entity reflects the cost of buying/selling protection and may include upfront payments required to enter into the agreement. Wider credit spreads and decreasing market values, when compared to
| | |
| BrandywineGLOBAL — Global High Yield Fund 2020 Annual Report | | 37 |
Notes to financial statements (cont’d)
the notional amount of the swap, represent a deterioration of the referenced entity’s credit soundness and a greater likelihood or risk of default or other credit event occurring as defined under the terms of the agreement. Credit spreads utilized in determining the period end market value of credit default swap agreements on corporate or sovereign issues are disclosed in the Schedule of Investments and serve as an indicator of the current status of the payment/performance risk and represent the likelihood or risk of default for credit derivatives. For credit default swap agreements on asset-backed securities and credit indices, the quoted market prices and resulting values, particularly in relation to the notional amount of the contract as well as the annual payment rate, serve as an indication of the current status of the payment/performance risk.
The Fund’s maximum risk of loss from counterparty risk, as the protection buyer, is the fair value of the contract (this risk is mitigated by the posting of collateral by the counterparty to the Fund to cover the Fund’s exposure to the counterparty). As the protection seller, the Fund’s maximum risk is the notional amount of the contract. Credit default swaps are considered to have credit risk-related contingent features since they require payment by the protection seller to the protection buyer upon the occurrence of a defined credit event.
Entering into a CDS agreement involves, to varying degrees, elements of credit, market and documentation risk in excess of the related amounts recognized on the Statement of Assets and Liabilities. Such risks involve the possibility that there will be no liquid market for these agreements, that the counterparty to the agreement may default on its obligation to perform or disagree as to the meaning of the contractual terms in the agreement, and that there will be unfavorable changes in net interest rates.
(e) Securities traded on a when-issued and delayed delivery basis. The Fund may trade securities on a when-issued or delayed delivery basis. In when-issued and delayed delivery transactions, the securities are purchased or sold by the Fund with payment and delivery taking place in the future in order to secure what is considered to be an advantageous price and yield to the Fund at the time of entering into the transaction.
Purchasing such securities involves risk of loss if the value of the securities declines prior to settlement. These securities are subject to market fluctuations and their current value is determined in the same manner as for other securities.
(f) Foreign currency translation. Investment securities and other assets and liabilities denominated in foreign currencies are translated into U.S. dollar amounts based upon prevailing exchange rates on the date of valuation. Purchases and sales of investment securities and income and expense items denominated in foreign currencies are translated into U.S. dollar amounts based upon prevailing exchange rates on the respective dates of such transactions.
The Fund does not isolate that portion of the results of operations resulting from fluctuations in foreign exchange rates on investments from the fluctuations arising from changes in market prices of securities held. Such fluctuations are included with the net realized and unrealized gain or loss on investments.
Net realized foreign exchange gains or losses arise from sales of foreign currencies, including gains and losses on forward foreign currency contracts, currency gains or losses
| | |
38 | | BrandywineGLOBAL — Global High Yield Fund 2020 Annual Report |
realized between the trade and settlement dates on securities transactions, and the difference between the amounts of dividends, interest, and foreign withholding taxes recorded on the Fund’s books and the U.S. dollar equivalent of the amounts actually received or paid. Net unrealized foreign exchange gains and losses arise from changes in the values of assets and liabilities, other than investments in securities, on the date of valuation, resulting from changes in exchange rates.
Foreign security and currency transactions may involve certain considerations and risks not typically associated with those of U.S. dollar denominated transactions as a result of, among other factors, the possibility of lower levels of governmental supervision and regulation of foreign securities markets and the possibility of political or economic instability.
(g) Credit and market risk. Investments in securities that are collateralized by real estate mortgages are subject to certain credit and liquidity risks. When market conditions result in an increase in default rates of the underlying mortgages and the foreclosure values of underlying real estate properties are materially below the outstanding amount of these underlying mortgages, collection of the full amount of accrued interest and principal on these investments may be doubtful. Such market conditions may significantly impair the value and liquidity of these investments and may result in a lack of correlation between their credit ratings and values.
The Fund invests in high-yield and emerging market instruments that are subject to certain credit and market risks. The yields of high-yield and emerging market debt obligations reflect, among other things, perceived credit and market risks. The Fund’s investments in securities rated below investment grade typically involve risks not associated with higher rated securities including, among others, greater risk related to timely and ultimate payment of interest and principal, greater market price volatility and less liquid secondary market trading. The consequences of political, social, economic or diplomatic changes may have disruptive effects on the market prices of investments held by the Fund. The Fund’s investments in non-U.S. dollar denominated securities may also result in foreign currency losses caused by devaluations and exchange rate fluctuations.
(h) Foreign investment risks. The Fund’s investments in foreign securities may involve risks not present in domestic investments. Since securities may be denominated in foreign currencies, may require settlement in foreign currencies or pay interest or dividends in foreign currencies, changes in the relationship of these foreign currencies to the U.S. dollar can significantly affect the value of the investments and earnings of the Fund. Foreign investments may also subject the Fund to foreign government exchange restrictions, expropriation, taxation or other political, social or economic developments, all of which affect the market and/or credit risk of the investments.
(i) Counterparty risk and credit-risk-related contingent features of derivative instruments. The Fund may invest in certain securities or engage in other transactions, where the Fund is exposed to counterparty credit risk in addition to broader market risks. The Fund may invest in securities of issuers, which may also be considered counterparties as trading partners in other transactions. This may increase the risk of loss in the event of default or bankruptcy by the counterparty or if the counterparty otherwise fails to meet its
| | |
| BrandywineGLOBAL — Global High Yield Fund 2020 Annual Report | | 39 |
Notes to financial statements (cont’d)
contractual obligations. The Fund’s subadviser attempts to mitigate counterparty risk by (i) periodically assessing the creditworthiness of its trading partners, (ii) monitoring and/or limiting the amount of its net exposure to each individual counterparty based on its assessment and (iii) requiring collateral from the counterparty for certain transactions. Market events and changes in overall economic conditions may impact the assessment of such counterparty risk by the subadviser. In addition, declines in the values of underlying collateral received may expose the Fund to increased risk of loss.
With exchange traded and centrally cleared derivatives, there is less counterparty risk to the Fund since the exchange or clearinghouse, as counterparty to such instruments, guarantees against a possible default. The clearinghouse stands between the buyer and the seller of the contract; therefore, the credit risk is limited to failure of the clearinghouse. While offset rights may exist under applicable law, the Fund does not have a contractual right of offset against a clearing broker or clearinghouse in the event of a default of the clearing broker or clearinghouse.
The Fund has entered into master agreements, such as an International Swaps and Derivatives Association, Inc. Master Agreement (“ISDA Master Agreement”) or similar agreement, with certain of its derivative counterparties that govern over-the-counter derivatives and provide for general obligations, representations, agreements, collateral posting terms, netting provisions in the event of default or termination and credit related contingent features. The credit related contingent features include, but are not limited to, a percentage decrease in the Fund’s net assets or NAV over a specified period of time. If these credit related contingent features were triggered, the derivatives counterparty could terminate the positions and demand payment or require additional collateral.
Under an ISDA Master Agreement, the Fund may, under certain circumstances, offset with the counterparty certain derivative financial instruments’ payables and/or receivables with collateral held and/or posted and create one single net payment. However, absent an event of default by the counterparty or a termination of the agreement, the terms of the ISDA Master Agreements do not result in an offset of reported amounts of financial assets and financial liabilities in the Statement of Assets and Liabilities across transactions between the Fund and the applicable counterparty. The enforceability of the right to offset may vary by jurisdiction.
Collateral requirements differ by type of derivative. Collateral or margin requirements are set by the broker or exchange clearinghouse for exchange traded derivatives while collateral terms are contract specific for over-the-counter traded derivatives. Cash collateral that has been pledged to cover obligations of the Fund under derivative contracts, if any, will be reported separately in the Statement of Assets and Liabilities. Securities pledged as collateral, if any, for the same purpose are noted in the Schedule of Investments.
As of September 30, 2020, held forward foreign currency contracts and OTC credit default swaps with credit related contingent features which had a liability position of $239,802. If a contingent feature in the master agreements would have been triggered, the Fund would have been required to pay this amount to its derivative counterparties. As of September 30, 2020, the Fund had posted with its counterparties cash and/or securities as collateral to cover the net liability of these derivatives amounting to $60,000, which could be used to reduce the required payment.
| | |
40 | | BrandywineGLOBAL — Global High Yield Fund 2020 Annual Report |
(j) Security transactions and investment income. Security transactions are accounted for on a trade date basis. Interest income (including interest income from payment-in-kind securities), adjusted for amortization of premium and accretion of discount, is recorded on the accrual basis. Paydown gains and losses on mortgage- and asset-backed securities are recorded as adjustments to interest income. Dividend income is recorded on the ex-dividend date for dividends received in cash and/or securities. Foreign dividend income is recorded on the ex-dividend date or as soon as practicable after the Fund determines the existence of a dividend declaration after exercising reasonable due diligence. The cost of investments sold is determined by use of the specific identification method. To the extent any issuer defaults or a credit event occurs that impacts the issuer, the Fund may halt any additional interest income accruals and consider the realizability of interest accrued up to the date of default or credit event.
(k) Distributions to shareholders. Distributions from net investment income of the Fund are declared each business day to shareholders of record and are paid monthly. Distributions of net realized gains, if any, are declared at least annually. Distributions to shareholders of the Fund are recorded on the ex-dividend date and are determined in accordance with income tax regulations, which may differ from GAAP.
(l) Share class accounting. Investment income, common expenses and realized/ unrealized gains (losses) on investments are allocated to the various classes of the Fund on the basis of daily net assets of each class. Fees relating to a specific class are charged directly to that share class.
(m) Compensating balance arrangements. The Fund has an arrangement with its custodian bank whereby a portion of the custodian’s fees is paid indirectly by credits earned on the Fund’s cash on deposit with the bank.
(n) Federal and other taxes. It is the Fund’s policy to comply with the federal income and excise tax requirements of the Internal Revenue Code of 1986 (the “Code”), as amended, applicable to regulated investment companies. Accordingly, the Fund intends to distribute its taxable income and net realized gains, if any, to shareholders in accordance with timing requirements imposed by the Code. Therefore, no federal or state income tax provision is required in the Fund’s financial statements.
Management has analyzed the Fund’s tax positions taken on income tax returns for all open tax years and has concluded that as of September 30, 2020, no provision for income tax is required in the Fund’s financial statements. The Fund’s federal and state income and federal excise tax returns for tax years for which the applicable statutes of limitations have not expired are subject to examination by the Internal Revenue Service and state departments of revenue.
Under the applicable foreign tax laws, a withholding tax may be imposed on interest, dividends and capital gains at various rates. Realized gains upon disposition of securities issued in or by certain foreign countries are subject to capital gains tax imposed by those countries.
| | |
| BrandywineGLOBAL — Global High Yield Fund 2020 Annual Report | | 41 |
Notes to financial statements (cont’d)
(o) Reclassification. GAAP requires that certain components of net assets be reclassified to reflect permanent differences between financial and tax reporting. These reclassifications have no effect on net assets or net asset value per share. During the current year, the Fund had no reclassifications.
2. Investment management agreement and other transactions with affiliates
Legg Mason Partners Fund Advisor, LLC (“LMPFA”) is the Fund’s investment manager and Brandywine Global Investment Management, LLC (“Brandywine Global”) is the Fund’s subadviser. As of July 31, 2020, LMPFA and Brandywine Global are indirect, wholly-owned subsidiaries of Franklin Resources, Inc. (“Franklin Resources”). Prior to July 31, 2020, LMPFA and Brandywine Global were wholly-owned subsidiaries of Legg Mason, Inc. (“Legg Mason”). As of July 31, 2020, Legg Mason is a subsidiary of Franklin Resources.
Under the investment management agreement, the Fund pays an investment management fee, calculated daily and paid monthly, at an annual rate of 0.65% of the Fund’s average daily net assets.
LMPFA provides administrative and certain oversight services to the Fund. LMPFA delegates to the subadviser the day-to-day portfolio management of the Fund. For its services, LMPFA pays Brandywine Global a fee monthly, at an annual rate equal to 90% of the net management fee it receives from the Fund.
As a result of expense limitation arrangements between the Fund and LMPFA, the ratio of total annual fund operating expenses, other than interest, brokerage commissions, dividend expense on short sales, taxes, extraordinary expenses and acquired fund fees and expenses, to average net assets of Class A, Class C, Class FI, Class I and Class IS shares did not exceed 1.15%, 1.90%, 1.15%, 0.85% and 0.75%, respectively. In addition, the ratio of total annual fund operating expenses for Class IS shares did not exceed the ratio of total annual fund operating expenses for Class I shares. These expense limitation arrangements cannot be terminated prior to December 31, 2021 without the Board of Trustees’ consent.
During the year ended September 30, 2020, fees waived and/or expenses reimbursed amounted to $227,963.
LMPFA is permitted to recapture amounts waived and/or reimbursed to a class within three years after the fiscal year in which LMPFA earned the fee or incurred the expense if the class’ total annual fund operating expenses have fallen to a level below the expense limitation (“expense cap”) in effect at the time the fees were earned or the expenses incurred. In no case will LMPFA recapture any amount that would result, on any particular business day of the Fund, in the class’ total annual fund operating expenses exceeding the expense cap or any other lower limit then in effect.
| | |
42 | | BrandywineGLOBAL — Global High Yield Fund 2020 Annual Report |
Pursuant to these arrangements, at September 30, 2020, the Fund had remaining fee waivers and/or expense reimbursements subject to recapture by LMPFA and respective dates of expiration as follows:
| | | | | | | | | | | | | | | | | | | | |
| | | Class A | | | Class C | | | Class FI | | | Class I | | | Class IS | |
| Expires September 30, 2021 | | $ | 1,319 | | | $ | 1,449 | | | $ | 678 | | | $ | 19,014 | | | $ | 214,369 | |
| Expires September 30, 2022 | | | 892 | | | | 1,090 | | | | 754 | | | | 14,619 | | | | 216,538 | |
| Expires September 30, 2023 | | | 1,075 | | | | 896 | | | | 2,245 | | | | 15,905 | | | | 207,386 | |
| Total fee waivers/expense reimbursements subject to recapture | | $ | 3,286 | | | $ | 3,435 | | | $ | 3,677 | | | $ | 49,538 | | | $ | 638,293 | |
For the year ended September 30, 2020, fee waivers and/or expense reimbursements recaptured by LMPFA, if any, were as follows:
| | | | | | | | | | | | | | | | | | | | |
| | | Class A | | | Class C | | | Class FI | | | Class I | | | Class IS | |
| LMPFA recaptured | | $ | 25 | | | $ | 59 | | | $ | 303 | | | $ | 828 | | | $ | 4,490 | |
As of July 31, 2020, Legg Mason Investor Services, LLC (“LMIS”) is an indirect, wholly owned broker-dealer subsidiary of Franklin Resources and serves as the Fund’s sole and exclusive distributor. Prior to July 31, 2020, LMIS was a wholly-owned broker-dealer subsidiary of Legg Mason.
There is a maximum initial sales charge of 4.25% for Class A shares. There is a contingent deferred sales charge (“CDSC”) of 1.00% on Class C shares, which applies if redemption occurs within 12 months from purchase payment. In certain cases, Class A shares have a 1.00% CDSC, which applies if redemption occurs within 18 months from purchase payment. This CDSC only applies to those purchases of Class A shares, which, when combined with current holdings of other shares of funds sold by LMIS, equal or exceed $1,000,000 in the aggregate. These purchases do not incur an initial sales charge.
For the year ended September 30, 2020, sales charges retained by and CDSCs paid to LMIS and its affiliates, if any, were as follows:
| | | | |
| | | Class A | |
| Sales charges | | $ | 1 | |
| CDSCs | | | — | |
Under a Deferred Compensation Plan (the “Plan”), Trustees may have elected to defer receipt of all or a specified portion of their compensation. A participating Trustee selected one or more funds managed by affiliates of Legg Mason in which his or her deferred trustee’s fees were deemed to be invested. Deferred amounts remain in the Fund until distributed in accordance with the Plan. In May 2015, the Board of Trustees approved an amendment to the Plan so that effective January 1, 2016, no compensation earned after that date may be deferred under the Plan.
As of July 31, 2020, all officers and one Trustee of the Trust are employees of Franklin Resources or its affiliates and do not receive compensation from the Trust. Prior to July 31, 2020, all officers and one Trustee of the Trust were employees of Legg Mason and did not receive compensation from the Trust.
| | |
| BrandywineGLOBAL — Global High Yield Fund 2020 Annual Report | | 43 |
Notes to financial statements (cont’d)
3. Investments
During the year ended September 30, 2020, the aggregate cost of purchases and proceeds from sales of investments (excluding short-term investments) were as follows:
| | | | |
| Purchases | | $ | 38,858,871 | |
| Sales | | | 30,321,553 | |
At September 30, 2020, the aggregate cost of investments and the aggregate gross unrealized appreciation and depreciation of investments for federal income tax purposes were as follows:
| | | | | | | | | | | | | | | | |
| | | Cost/Premiums
Paid (Received) | | | Gross
Unrealized
Appreciation | | | Gross
Unrealized
Depreciation | | | Net
Unrealized
Appreciation
(Depreciation) | |
| Securities | | $ | 40,307,680 | | | $ | 1,203,678 | | | $ | (419,516) | | | $ | 784,162 | |
| Forward foreign currency contracts | | | — | | | | 33,355 | | | | (178,814) | | | | (145,459) | |
| Swap contracts | | | 10,273 | | | | 43,536 | | | | (20,330) | | | | 23,206 | |
4. Derivative instruments and hedging activities
Below is a table, grouped by derivative type, that provides information about the fair value and the location of derivatives within the Statement of Assets and Liabilities at September 30, 2020.
| | | | | | | | | | | | |
ASSET DERIVATIVES1 | |
| | | Foreign
Exchange Risk | | | Credit
Risk | | | Total | |
| Forward foreign currency contracts | | | $33,355 | | | | — | | | $ | 33,355 | |
| OTC swap contracts2 | | | — | | | $ | 94,467 | | | | 94,467 | |
| Total | | | $33,355 | | | $ | 94,467 | | | $ | 127,822 | |
|
| LIABILITY DERIVATIVES1 | |
| | | Foreign
Exchange Risk | | | Credit
Risk | | | Total | |
| Forward foreign currency contracts | | $ | 178,814 | | | | — | | | | $178,814 | |
| OTC swap contracts2 | | | — | | | $ | 60,988 | | | | 60,988 | |
| Total | | $ | 178,814 | | | $ | 60,988 | | | $ | 239,802 | |
| 1 | Generally, the balance sheet location for asset derivatives is receivables/net unrealized appreciation and for liability derivatives is payables/net unrealized depreciation. |
| 2 | Values include premiums paid (received) on swap contracts which are shown separately in the Statement of Assets and Liabilities. |
| | |
44 | | BrandywineGLOBAL — Global High Yield Fund 2020 Annual Report |
The following tables provide information about the effect of derivatives and hedging activities on the Fund’s Statement of Operations for the year ended September 30, 2020. The first table provides additional detail about the amounts and sources of gains (losses) realized on derivatives during the period. The second table provides additional information about the change in unrealized appreciation (depreciation) resulting from the Fund’s derivatives and hedging activities during the period.
| | | | | | | | | | | | | | | | | | | | |
| AMOUNT OF REALIZED GAIN (LOSS) ON DERIVATIVES RECOGNIZED | |
| | | Interest
Rate Risk | | | Foreign
Exchange Risk | | | Credit Risk | | | Equity
Risk | | | Total | |
| Futures contracts | | $ | 38,528 | | | | — | | | | — | | | $ | (487,301) | | | $ | (448,773) | |
| Forward foreign currency contracts | | | — | | | $ | 148,110 | | | | — | | | | — | | | | 148,110 | |
| Swap contracts | | | — | | | | — | | | $ | 94,175 | | | | — | | | | 94,175 | |
| Total | | $ | 38,528 | | | $ | 148,110 | | | $ | 94,175 | | | $ | (487,301) | | | $ | (206,488) | |
|
| CHANGE IN UNREALIZED APPRECIATION (DEPRECIATION) ON DERIVATIVES RECOGNIZED | |
| | | | | | Interest
Rate Risk | | | Foreign
Exchange Risk | | | Credit
Risk | | | Total | |
| Futures contracts | | | | | | $ | (40,653) | | | | — | | | | — | | | $ | (40,653) | |
| Forward foreign currency contracts | | | | | | | — | | | $ | (104,862) | | | | — | | | | (104,862) | |
| Swap contracts | | | | | | | — | | | | — | | | $ | 8,005 | | | | 8,005 | |
| Total | | | | | | $ | (40,653) | | | $ | (104,862) | | | $ | 8,005 | | | $ | (137,510) | |
During the year ended September 30, 2020, the volume of derivative activity for the Fund was as follows:
| | | | |
| | | Average Market
Value | |
| Futures contracts (to buy)† | | $ | 743,871 | |
| Forward foreign currency contracts (to buy) | | | 6,283,273 | |
| Forward foreign currency contracts (to sell) | | | 1,735,064 | |
| |
| | | Average Notional
Balance | |
| Credit default swap contracts (to sell protection) | | $ | 7,365,641 | |
| † | At September 30, 2020, there were no open positions held in this derivative. |
The following table presents the Fund’s OTC derivative assets and liabilities by counterparty net of amounts available for offset under an ISDA Master Agreement and net of the related collateral pledged (received) by the Fund as of September 30, 2020.
| | | | | | | | | | | | | | | | | | | | |
| Counterparty | | Gross Assets
Subject to
Master
Agreements1 | | | Gross
Liabilities
Subject to
Master
Agreements1 | | | Net Assets
(Liabilities)
Subject to
Master
Agreements | | | Collateral
Pledged
(Received)2 | | | Net
Amount3,4 | |
| Barclays Bank PLC | | $ | 53,573 | | | | — | | | $ | 53,573 | | | | — | | | $ | 53,573 | |
| Citibank N.A. | | | 26,031 | | | $ | (3,670) | | | | 22,361 | | | | — | | | | 22,361 | |
| Goldman Sachs Group Inc. | | | 38,901 | | | | — | | | | 38,901 | | | | — | | | | 38,901 | |
| | |
| BrandywineGLOBAL — Global High Yield Fund 2020 Annual Report | | 45 |
Notes to financial statements (cont’d)
| | | | | | | | | | | | | | | | | | | | |
| Counterparty (cont’d) | | Gross Assets
Subject to
Master
Agreements1 | | | Gross
Liabilities
Subject to
Master
Agreements1 | | | Net Assets
(Liabilities)
Subject to
Master
Agreements | | | Collateral
Pledged
(Received)2 | | | Net
Amount3,4 | |
| HSBC Securities Inc. | | $ | 4,578 | | | $ | (19,530) | | | $ | (14,952) | | | | — | | | $ | (14,952) | |
| JPMorgan Chase & Co. | | | 4,246 | | | | (166,830) | | | | (162,584) | | | $ | 60,000 | | | | (102,584) | |
| Morgan Stanley & Co. Inc. | | | 493 | | | | (49,772) | | | | (49,279) | | | | — | | | | (49,279) | |
| Total | | $ | 127,822 | | | $ | (239,802) | | | $ | (111,980) | | | $ | 60,000 | | | $ | (51,980) | |
| 1 | Absent an event of default or early termination, derivative assets and liabilities are presented gross and not offset in the Statement of Assets and Liabilities. |
| 2 | Gross amounts are not offset in the Statement of Assets and Liabilities. |
| 3 | Net amount may also include forward foreign currency exchange contracts that are not required to be collateralized. |
| 4 | Represents the net amount receivable (payable) from (to) the counterparty in the event of default. |
5. Class specific expenses, waivers and/or expense reimbursements
The Fund has adopted a Rule 12b-1 shareholder services and distribution plan and under that plan the Fund pays service and/or distribution fees with respect to its Class A, Class C and Class FI shares calculated at the annual rate of 0.25%, 1.00% and 0.25% of the average daily net assets of each class, respectively. Service and/or distribution fees are accrued daily and paid monthly.
For the year ended September 30, 2020, class specific expenses were as follows:
| | | | | | | | |
| | | Service and/or
Distribution Fees | | | Transfer Agent
Fees | |
| Class A | | $ | 271 | | | $ | 520 | |
| Class C | | | 1,320 | | | | 185 | |
| Class FI | | | 762 | | | | 411 | |
| Class I | | | — | | | | 2,297 | |
| Class IS | | | — | | | | 1,061 | |
| Total | | $ | 2,353 | | | $ | 4,474 | |
For the year ended September 30, 2020, waivers and/or expense reimbursements by class were as follows:
| | | | |
| | | Waivers/Expense
Reimbursements | |
| Class A | | $ | 1,077 | |
| Class C | | | 898 | |
| Class FI | | | 2,246 | |
| Class I | | | 15,936 | |
| Class IS | | | 207,806 | |
| Total | | $ | 227,963 | |
| | |
46 | | BrandywineGLOBAL — Global High Yield Fund 2020 Annual Report |
6. Distributions to shareholders by class
| | | | | | | | |
| | | Year Ended
September 30, 2020 | | | Year Ended
September 30, 2019 | |
| Net Investment Income: | | | | | | | | |
| Class A | | $ | 5,785 | | | $ | 5,766 | |
| Class C | | | 6,225 | | | | 6,992 | |
| Class FI | | | 18,623 | | | | 5,385 | |
| Class I | | | 134,391 | | | | 116,984 | |
| Class IS | | | 1,823,926 | | | | 1,785,304 | |
| Total | | $ | 1,988,950 | | | $ | 1,920,431 | |
7. Shares of beneficial interest
At September 30, 2020, the Trust had an unlimited number of shares of beneficial interest authorized with a par value of $0.00001 per share. The Fund has the ability to issue multiple classes of shares. Each class of shares represents an identical interest and has the same rights, except that each class bears certain direct expenses, including those specifically related to the distribution of its shares.
Transactions in shares of each class were as follows:
| | | | | | | | | | | | | | | | |
| | | Year Ended
September 30, 2020 | | | Year Ended
September 30, 2019 | |
| | | Shares | | | Amount | | | Shares | | | Amount | |
| Class A | | | | | | | | | | | | | | | | |
| Shares sold | | | 5,124 | | | $ | 44,823 | | | | 187 | | | $ | 1,617 | |
| Shares issued on reinvestment | | | 678 | | | | 5,780 | | | | 675 | | | | 5,722 | |
| Shares repurchased | | | (7,871) | | | | (65,521) | | | | (860) | | | | (7,354) | |
| Net increase (decrease) | | | (2,069) | | | $ | (14,918) | | | | 2 | | | $ | (15) | |
| | | | |
| Class C | | | | | | | | | | | | | | | | |
| Shares sold | | | 4,260 | | | $ | 37,406 | | | | 810 | | | $ | 7,000 | |
| Shares issued on reinvestment | | | 726 | | | | 6,225 | | | | 818 | | | | 6,889 | |
| Shares repurchased | | | (14,721) | | | | (128,900) | | | | (720) | | | | (6,155) | |
| Net increase (decrease) | | | (9,735) | | | $ | (85,269) | | | | 908 | | | $ | 7,734 | |
| | | | |
| Class FI | | | | | | | | | | | | | | | | |
| Shares sold | | | 79,843 | | | $ | 693,110 | | | | 2,755 | | | $ | 23,323 | |
| Shares issued on reinvestment | | | 2,138 | | | | 18,542 | | | | 629 | | | | 5,351 | |
| Shares repurchased | | | (70,346) | | | | (615,074) | | | | (3,354) | | | | (28,659) | |
| Net increase | | | 11,635 | | | $ | 96,578 | | | | 30 | | | $ | 15 | |
| | | | |
| Class I | | | | | | | | | | | | | | | | |
| Shares sold | | | 101,223 | | | $ | 821,258 | | | | 172,210 | | | $ | 1,480,466 | |
| Shares issued on reinvestment | | | 15,712 | | | | 134,352 | | | | 13,662 | | | | 115,668 | |
| Shares repurchased | | | (63,211) | | | | (526,767) | | | | (196,523) | | | | (1,682,863) | |
| Net increase (decrease) | | | 53,724 | | | $ | 428,843 | | | | (10,651) | | | $ | (86,729) | |
| | |
| BrandywineGLOBAL — Global High Yield Fund 2020 Annual Report | | 47 |
Notes to financial statements (cont’d)
| | | | | | | | | | | | | | | | |
| | | Year Ended
September 30, 2020 | | | Year Ended
September 30, 2019 | |
| | | Shares | | | Amount | | | Shares | | | Amount | |
| Class IS | | | | | | | | | | | | | | | | |
| Shares sold | | | 888,923 | | | $ | 7,432,375 | | | | 385,194 | | | $ | 3,296,980 | |
| Shares issued on reinvestment | | | 206,269 | | | | 1,762,192 | | | | 204,411 | | | | 1,733,769 | |
| Shares repurchased | | | (430,768) | | | | (3,661,092) | | | | (610,997) | | | | (5,240,729) | |
| Net increase (decrease) | | | 664,424 | | | $ | 5,533,475 | | | | (21,392) | | | $ | (209,980) | |
8. Redemption facility
The Fund and certain other participating funds within the Trust (the “Participating Funds”), have available an unsecured revolving credit facility (the “Redemption Facility”) from the lenders and The Bank of New York Mellon (“BNY Mellon”), as administrative agent for the lenders. The Redemption Facility is to be used for temporary or emergency purposes as an additional source of liquidity to fund redemptions of shares. Under the agreement, BNY Mellon provides a 364-day revolving credit facility, in the aggregate amount of $190 million. Unless renewed, the agreement will terminate on November 16, 2020. Any borrowings under the Redemption Facility will bear interest at current market rates as set forth in the credit agreement. The annual commitment fee to maintain the Redemption Facility is 0.15% and is incurred on the unused portion of the facility and is allocated to all Participating Funds pro rata based on net assets; there is no upfront fee. Prior to November 18, 2019, the Fund paid a commitment fee of 0.10% and an upfront fee of 0.05%. For the year ended September 30, 2020, the Fund incurred a commitment fee in the amount of $2,141. The Fund did not utilize the Redemption Facility during the year ended September 30, 2020.
9. Income tax information and distributions to shareholders
The tax character of distributions paid during the fiscal years ended September 30, was as follows:
| | | | | | | | |
| | | 2020 | | | 2019 | |
| Distributions paid from: | | | | | | | | |
| Ordinary income | | $ | 1,988,950 | | | $ | 1,920,431 | |
As of September 30, 2020, the components of distributable earnings (loss) on a tax basis were as follows:
| | | | |
| Undistributed ordinary income — net | | $ | 340,286 | |
| Deferred capital losses* | | | (2,373,809) | |
| Other book/tax temporary differences(a) | | | 91,642 | |
| Unrealized appreciation (depreciation) | | | 662,138 | |
| Total distributable earnings (loss) — net | | $ | (1,279,743) | |
| * | These capital losses have been deferred in the current year as either short-term or long-term losses. The losses will be deemed to occur on the first day of the next taxable year in the same character as they were originally deferred and will be available to offset future taxable capital gains. |
| (a) | Other book/tax temporary differences are attributable to the realization for tax purposes of unrealized gains (losses) on foreign currency contracts and book/tax differences in the timing of the deductibility of various expenses. |
| | |
48 | | BrandywineGLOBAL — Global High Yield Fund 2020 Annual Report |
10. Other matters
The outbreak of the respiratory illness COVID-19 (commonly referred to as “coronavirus”) has continued to rapidly spread around the world, causing considerable uncertainty for the global economy and financial markets. The ultimate economic fallout from the pandemic, and the long-term impact on economies, markets, industries and individual issuers, are not known. The COVID-19 pandemic could adversely affect the value and liquidity of the Fund’s investments, impair the Fund’s ability to satisfy redemption requests, and negatively impact the Fund’s performance. In addition, the outbreak of COVID-19, and measures taken to mitigate its effects, could result in disruptions to the services provided to the Fund by its service providers.
* * *
The Fund’s investments, payment obligations, and financing terms may be based on floating rates, such as the London Interbank Offered Rate, or “LIBOR,” which is the offered rate for short-term Eurodollar deposits between major international banks. Plans are underway to phase out the use of LIBOR by the end of 2021. There remains uncertainty regarding the nature of any replacement rate and the impact of the transition from LIBOR on the Fund’s transactions and the financial markets generally. As such, the potential effect of a transition away from LIBOR on the Fund or the Fund’s investments cannot yet be determined.
| | |
| BrandywineGLOBAL — Global High Yield Fund 2020 Annual Report | | 49 |
Report of independent registered public accounting firm
To the Board of Trustees of Legg Mason Global Asset Management Trust and Shareholders of BrandywineGLOBAL — Global High Yield Fund
Opinion on the Financial Statements
We have audited the accompanying statement of assets and liabilities, including the schedule of investments, of BrandywineGLOBAL — Global High Yield Fund (one of the funds constituting Legg Mason Global Asset Management Trust, referred to hereafter as the “Fund”) as of September 30, 2020, the related statement of operations for the year ended September 30, 2020, the statement of changes in net assets for each of the two years in the period ended September 30, 2020, including the related notes, and the financial highlights for each of the periods indicated therein (collectively referred to as the “financial statements”). In our opinion, the financial statements present fairly, in all material respects, the financial position of the Fund as of September 30, 2020, the results of its operations for the year then ended, the changes in its net assets for each of the two years in the period ended September 30, 2020 and the financial highlights for each of the periods indicated therein in conformity with accounting principles generally accepted in the United States of America.
Basis for Opinion
These financial statements are the responsibility of the Fund’s management. Our responsibility is to express an opinion on the Fund’s financial statements based on our audits. We are a public accounting firm registered with the Public Company Accounting Oversight Board (United States) (PCAOB) and are required to be independent with respect to the Fund in accordance with the U.S. federal securities laws and the applicable rules and regulations of the Securities and Exchange Commission and the PCAOB.
We conducted our audits of these financial statements in accordance with the standards of the PCAOB. Those standards require that we plan and perform the audit to obtain reasonable assurance about whether the financial statements are free of material misstatement, whether due to error or fraud.
Our audits included performing procedures to assess the risks of material misstatement of the financial statements, whether due to error or fraud, and performing procedures that respond to those risks. Such procedures included examining, on a test basis, evidence regarding the amounts and disclosures in the financial statements. Our audits also included evaluating the accounting principles used and significant estimates made by management, as well as evaluating the overall presentation of the financial statements. Our procedures included confirmation of securities owned as of September 30, 2020 by correspondence with the custodian and brokers; when replies were not received from brokers, we performed other auditing procedures. We believe that our audits provide a reasonable basis for our opinion.
/s/PricewaterhouseCoopers LLP
Baltimore, Maryland
November 18, 2020
We have served as the auditor of one or more investment companies in the Franklin Templeton Group of Funds since 1948.
| | |
50 | | BrandywineGLOBAL — Global High Yield Fund 2020 Annual Report |
Board approval of new management and new subadvisory agreements (unaudited)
On February 18, 2020, Franklin Resources, Inc., a global investment management organization operating, together with its subsidiaries, as Franklin Templeton (“Franklin Templeton”), and Legg Mason, Inc. (“Legg Mason”) announced that they had entered into a definitive agreement (the “Transaction Agreement”) for Franklin Templeton to acquire Legg Mason in an all-cash transaction. As part of this transaction, the Fund’s manager, Legg Mason Partners Fund Advisor, LLC (the “Manager”), and the Fund’s subadviser, Brandywine Global Investment Management, LLC (the “Subadviser”), each a wholly owned subsidiary of Legg Mason, would become a subsidiary of Franklin Templeton (the “Transaction”). The Transaction was subject to approval by Legg Mason’s shareholders and customary closing conditions, including receipt of applicable regulatory approvals. The Transaction was consummated on July 31, 2020. Under the Investment Company Act of 1940, as amended (the “1940 Act”), consummation of the Transaction resulted in the automatic termination of the Fund’s existing management agreement, and subadvisory agreement (the “Existing Agreements”).
At a meeting held on April 6, 2020, the Fund’s Board of Trustees (the “Board”) approved a new management agreement (the “Management Agreement”) with the Manager and a new subadvisory agreement (“Subadvisory Agreement”) between the Manager and the Subadviser. (The Management Agreement and the Subadvisory Agreement are jointly referred to as the “Agreements.”) The meeting was held telephonically based on exemptive relief issued by the Securities and Exchange Commission, with the Board’s intention to ratify the approval of the Agreements at its next in-person meeting.
On March 9, 2020, during a telephonic meeting of the Board, the Board met with representatives of Legg Mason, the parent company of the Manager and the Subadviser, and representatives of Franklin Templeton to discuss the Transaction. The Board was advised that the Fund would not bear the costs of obtaining shareholder approval of the Agreements, including proxy solicitation costs, legal fees and the costs of printing and mailing the proxy statement, regardless of whether the Transaction was consummated. On March 31, 2020 and April 2, 2020, the trustees who are not “interested persons” of the Fund (as defined in the 1940 Act) (the “Independent Trustees”), separately met, with the assistance of their independent legal counsel, to review and evaluate the materials provided by Legg Mason, Franklin Templeton, the Manager and the Subadviser to assist the Board, and in particular the Independent Trustees, in considering the Agreements. On April 6, 2020, the Board received a presentation from senior Fund management and representatives from Franklin Templeton and reviewed and evaluated the materials, including supplemental materials, provided to assist the Board in considering the Agreements. Prior to the Board’s approval of the Agreements, as a part of the April 6 meeting the Independent Trustees further discussed the Agreements in an executive session with independent legal counsel and recommended their approval.
| | |
| BrandywineGLOBAL — Global High Yield Fund | | 51 |
Board approval of new management and new subadvisory agreements (unaudited) (cont’d)
In the event the Fund’s shareholders did not approve the Agreements prior to the completion of the Transaction, at its April 6, 2020 meeting, the Board also approved an interim management agreement with the Manager and an interim subadvisory agreement between the Manager and the Subadviser that would take effect upon the closing of the Transaction to enable the Manager and Subadviser to serve as investment managers of the Fund following the termination of the Existing Agreements and pending shareholder approval of the Agreements. At a meeting held on July 14, 2020, shareholders of the Fund approved the Agreements. The Agreements became effective on July 31, 2020 following consummation of the Transaction.
In voting to approve the Agreements, the Board, including the Independent Trustees, considered whether approval of the Agreements would be in the best interests of the Fund. No single factor or item of information reviewed by the Board was identified as the principal factor in determining whether to approve the Agreements. The Board considered that the terms of the Agreements were identical to the Existing Agreements, except for the dates of execution, effectiveness and termination, and that the Board had considered and approved the renewal of the Existing Agreements in November 2019. The Board also considered that the Existing Agreements were the product of multiple years of review and negotiation and information received and considered by the Board in the exercise of its business judgment during those years. Based upon its evaluation of all material factors, including those described below, the Board concluded that the terms of each of the Agreements were reasonable and fair and that it was in the best interests of the Fund to approve the Agreements.
In evaluating the Agreements, the Board considered the information previously provided for the November 2019 renewal of the Existing Agreements, updated with more recent statistics, information and representations. Among such information was the nature, extent and quality of services provided to the Fund by the Manager and the Subadviser under the Management Agreement and Subadvisory Agreement, respectively, and information regarding the administrative and other services rendered to the Fund and its shareholders by the Manager and its affiliates and the Manager’s supervisory activities over the Subadviser. The Board noted that Franklin Templeton and Legg Mason had informed the Board that, following the Transaction, there is not expected to be any diminution in the nature, quality and extent of services provided to the Fund and its shareholders by the Manager and the Subadviser, including compliance and other non-advisory services. The Board’s evaluation of the services provided by the Manager and the Subadviser took into account Franklin Templeton’s plans and intentions regarding the Fund and Legg Mason’s asset management business, including the preservation and continued operational and investment autonomy of the investment advisory business conducted by the Subadviser. The Board noted that Franklin Templeton did not expect to propose any changes to the investment objective of the Fund or any changes to the principal investment strategies of
| | |
52 | | BrandywineGLOBAL — Global High Yield Fund |
the Fund as a result of the Transaction. The Board also considered that there were not expected to be any changes to the Fund’s custodian or other service providers as a result of the Transaction. The Board also considered that Franklin Templeton’s distribution capabilities, particularly with respect to retail investors, and significant network of intermediary relationships may provide additional opportunities for the Fund to grow assets and lower expense ratios by spreading expenses over a larger asset base.
The Board also considered its knowledge and familiarity gained as Trustees of funds in the Legg Mason fund complex, including the scope and quality of the investment management and other capabilities of the Manager and the Subadviser, and the quality of the Manager’s administrative and other services. The Board considered information received at regular meetings throughout the year, including the policies and practices of the Subadviser regarding the selection of brokers and dealers and the execution of portfolio transactions for the Fund. The Board also considered the reputation, experience, financial strength and resources of Franklin Templeton and its investment advisory subsidiaries. The Board considered that on a regular basis it received and reviewed information from the Manager and the Fund’s Chief Compliance Officer regarding the compliance policies and procedures established pursuant to Rule 38a-1 under the 1940 Act for the funds in the Legg Mason fund complex, including liquidity management programs and cybersecurity programs. The Board also considered information about Franklin Templeton’s compliance and risk management programs.
The Board noted that it had reviewed the qualifications, backgrounds and responsibilities of the senior personnel currently serving the Fund and had met and reviewed the backgrounds and qualifications of the senior personnel of Franklin Templeton responsible for the management of the advisory business. The Board considered that Legg Mason had put in place retention incentives for key personnel at the Manager until the closing of the Transaction and Franklin Templeton had provided long-term retention mechanisms for certain personnel, and that Franklin Templeton had represented that there were not expected to be any changes in the portfolio management personnel managing the Fund as a result of the Transaction. The Board considered Franklin Templeton’s and the Manager’s commitment to an effective transition and to continued high quality investment management and shareholder services following the Transaction.
The Board received and reviewed performance information for the Fund and for a group of funds (the “Performance Universe”) selected by Broadridge Financial Solutions Inc. (“Broadridge”), an independent provider of investment company data. The Board was provided a description of the methodology Broadridge used to determine the similarity of the Fund to the funds included in the Performance Universe. The Broadridge data also included a comparison of the Fund’s performance to the Fund’s designated benchmark index. The Board noted that although useful, the data provided by Broadridge may vary depending
| | |
| BrandywineGLOBAL — Global High Yield Fund | | 53 |
Board approval of new management and new subadvisory agreements (unaudited) (cont’d)
on the year-end dates selected and the selection of a peer group and, therefore, recognized its limitations. In addition, the Board noted that it had received and discussed at periodic intervals information comparing the Fund’s performance to that of its Performance Universe and benchmark index, as well as other performance measures, such as Morningstar rankings, and had met with the Fund’s portfolio managers at in-person meetings during the year.
The Board noted that the Fund’s performance for the one- and three-year periods ended December 31, 2019 placed the Class I Shares in the fourth quintile (the first quintile being the best performers and the fifth quintile being the worst performers) and the Fund’s performance for the five-year period ended December 31, 2019 placed the Class I Shares in the third quintile. The Board also reviewed updated performance information. In addition, based on their review of materials provided and assurances received, the Board determined that the Transaction was not expected to affect adversely the nature, extent and quality of services provided. The Board noted that its evaluation of the factors of the nature, extent and quality of services and performance led it to conclude that it was in the best interests of the Fund to approve the Agreements.
The Board reviewed and considered the contractual management fee (the “Contractual Management Fee”), payable by the Fund to the Manager in light of the nature, extent and quality of the management and subadvisory services provided by the Manager and the Subadviser, respectively. The Board considered that it had reviewed the Fund’s Contractual Management Fee and total expense ratio in connection with its consideration of the Existing Agreements during the 2019 contract renewal process and that the new Management Agreement did not change the Fund’s management fee rate or the computation method for calculating such fees. The Board reviewed the subadvisory fee, noting that the Manager, and not the Fund, pays the fee to the Subadviser. In addition, the Board reviewed and considered the actual management fee rate (after taking into account fees waived by the Manager which partially reduced the management fee owed to the Manager under the Management Agreement) (the “Actual Management Fee”). The Board also considered that the contractual expense waiver continued until December 31, 2021 and Franklin Templeton’s statement that it had no current intention to change that waiver after its expiration. Based on their review of the materials provided and the assurances they had received from Franklin Templeton and Legg Mason, the Board determined that the Transaction would not increase the total fees payable by the Fund for management services.
The Board received and reviewed an analysis of Legg Mason complex-wide management fees for funds with a similar strategy provided by the Manager, which, among other things, set out a framework of fees based on asset classes. The Manager reviewed with the Board the differences in services provided to these different types of accounts, including that the Fund is provided with certain administrative services, office facilities, and Fund officers
| | |
54 | | BrandywineGLOBAL — Global High Yield Fund |
(including the Fund’s chief executive, chief financial and chief compliance officers), and that the Manager coordinates and oversees the provision of services to the Fund by other Fund service providers, including the Subadviser. The Board considered the fee comparisons in light of the differences in management of these different types of accounts and the differences in associated risks borne by the Manager.
Additionally, the Board received and considered information comparing the Fund’s Contractual Management Fee, Actual Management Fee and the Fund’s overall expense ratio with those of a group of funds selected by Broadridge as comparable to the Fund and with a broader universe of funds also selected by Broadridge. With respect to the Fund, the Board noted that for the Class I Shares the Contractual Management Fee was at the median of the Broadridge expense group (third quintile), the Actual Management Fee was lower than the median of the Broadridge expense group (first quintile) and the actual total expense ratio was higher than the Broadridge expense group median (fifth quintile) and higher than the expense universe median (fourth quintile) (the first quintile being the lowest fees and the fifth quintile being the highest fees). It was noted that, while the Board has found the Broadridge data generally useful, they recognized its limitations, including that the data may vary depending on the selection of the peer group.
The Board was provided an overview of the process followed in conducting the profitability study and received an updated report on the profitability of Legg Mason in providing services to the Fund, based on financial information and business data for the 12 months ended March 31, 2019, which corresponds to Legg Mason’s fiscal year end, and for the period from September 2019 to February 2020. The Board also received certain information showing historical profitability for fiscal years 2016 through 2019. The Board noted that it previously had received a report from the independent consultant engaged by Legg Mason to assess the methodologies used by Legg Mason for its profitability study in connection with its review of the Existing Agreements. The Board considered the profitability study along with the other materials previously provided to the Board and concluded that the profitability was not excessive in light of the nature, extent and quality of the services provided to the Fund.
The Board received and considered information regarding whether there have been economies of scale with respect to the management of the Fund as the Fund’s assets have grown and whether the Fund has appropriately benefited from any economies of scale. Among other information, the Board reviewed management fee reductions due to waivers during Legg Mason’s 2016 through 2019 fiscal years and for the pro forma fiscal year 2020. The Board noted that Franklin Templeton and Legg Mason expected to realize cost savings from the Transaction based on synergies of operations, as well as to benefit from possible growth of the funds resulting from enhanced distribution capabilities. However, they noted that other factors could also affect profitability and potential economies of scale, and that it
| | |
| BrandywineGLOBAL — Global High Yield Fund | | 55 |
Board approval of new management and new subadvisory agreements (unaudited) (cont’d)
��
was not possible to predict with any degree of certainty how the Transaction would affect the Manager’s profitability from its relationship with the Fund, nor to quantify at this time any possible future economies of scale. The Board noted they will have the opportunity to periodically re-examine such profitability and any economies of scale going forward. The Board also considered the potential benefits to shareholders from being part of a combined fund family with Franklin Templeton-sponsored funds and having access to a greater array of investment opportunities. Given the asset size of the Fund and the complex, as well as the fee waivers, the Board concluded that although there were no current breakpoints, any economies of scale currently being realized were appropriately being reflected in the Actual Management Fee paid by the Fund.
The Board considered other benefits received by the Manager and its affiliates as a result of the Manager’s relationship with the Fund, including the opportunity to offer additional products and services to Fund shareholders, enhanced industry recognition and the potential for reduced vendor pricing. The Board also considered that Franklin Templeton may derive reputational and other benefits from its ability to use the Legg Mason investment affiliates’ names in connection with operating and marketing the funds. The Board considered that the Transaction would significantly increase Franklin Templeton’s assets under management and expand Franklin Templeton’s investment capabilities. The Board noted that Franklin Templeton and Legg Mason, as a result of the potential benefits derived from the Transaction, have a financial interest in the matters that were being considered. The Board also took note of information provided regarding amounts received by the Fund’s distributor and intermediary arrangements.
The Board considered that the senior management team at Legg Mason expressed support for the Transaction and Legg Mason recommended that the Board approve the Agreements. The Board also considered that, under the Transaction Agreement, Franklin Templeton has acknowledged that Legg Mason had entered into the Transaction Agreement in reliance upon the benefits and protections provided by Section 15(f) of the 1940 Act, and that Franklin Templeton represented to the Board that it would conduct its business such that (a) for a period of not less than three years after the closing of the Transaction no more than 25% of the members of the Board shall be “interested persons” (as defined in the 1940 Act) of any investment adviser of the Fund, and (b) for a period of not less than two years after the closing, neither Franklin Templeton nor any of its affiliates shall impose an “unfair burden” (within the meaning of the 1940 Act) on the Fund as a result of the transactions contemplated by the Transaction Agreement.
After consideration of the factors described above as well as other factors, and in the exercise of their business judgment, the Board, including the Independent Trustees, concluded that the Agreements for the Fund, including the fees payable thereunder, were fair and reasonable and that entering into the Agreements for the Fund was in the best interests of the Fund’s shareholders, and the Board voted to approve the Agreements and to recommend that shareholders approve the Agreements.
| | |
56 | | BrandywineGLOBAL — Global High Yield Fund |
Additional shareholder information (unaudited)
Results of special meeting of shareholders
On July 14, 2020 a special meeting of shareholders was held for the following purposes: 1) to approve a new management agreement between the Fund and its investment manager; and 2) to approve a new subadvisory agreement with respect to the Fund’s subadviser. The following table provides the number of votes cast for or against, as well as the number of abstentions and broker non-votes as to each matter voted on at the special meeting of shareholders. Each item voted on was approved.
| | | | | | | | | | | | | | | | |
| Item Voted On | | Voted For | | | Voted Against | | | Abstentions | | | Broker Non-Votes | |
| To Approve a New Management Agreement with Legg Mason Partners Fund Advisor, LLC | | | 27,694,859.604 | | | | 70,728.281 | | | | 5,855.778 | | | | 0 | |
| To Approve a New Subadvisory Agreement with Brandywine Global Investment Management, LLC | | | 27,694,859.604 | | | | 70,728.281 | | | | 5,855.778 | | | | 0 | |
| | |
| BrandywineGLOBAL — Global High Yield Fund | | 57 |
Statement regarding liquidity risk management program (unaudited)
As required by law, the fund has adopted and implemented a liquidity risk management program (the “Program”) that is designed to assess and manage liquidity risk. Liquidity risk is the risk that the fund could not meet requests to redeem its shares without significant dilution of remaining investors’ interests in the fund. Legg Mason Partners Fund Advisor, LLC (the “Manager”), the fund’s manager, is the administrator of the Program. The Manager has established a liquidity risk management committee (the “Committee”) to administer the Program on a day-to-day basis.
The Committee, on behalf of the Manager, provided the fund’s Board of Trustees with a report that addressed the operation of the Program, assessed its adequacy and effectiveness of implementation, including, if applicable, the operation of any highly liquid investment minimum (“HLIM”), and described any material changes that had been made to the Program or were recommended (the “Report”). The Report covered the period from December 1, 2018 through December 31, 2019 (the “Reporting Period”).
The Report confirmed that there were no material changes to the Program during the Reporting Period and that no changes were recommended.
The Report also confirmed that, throughout the Reporting Period, the Committee had monitored the fund’s portfolio liquidity and liquidity risk on an ongoing basis, as described in the Program and in Board reporting throughout the Reporting Period.
The Report discussed the Committee’s annual review of the Program, which addressed, among other things, the following elements of the Program:
Assessment, Management, and Periodic Review of Liquidity Risk. The Committee reviewed the fund’s investment strategy and liquidity of portfolio investments during both normal and reasonably foreseeable stressed conditions. The Committee noted that the fund’s investment strategy continues to be appropriate for an open-end fund, taking into account, among other things, whether and to what extent the fund held less liquid and illiquid assets and the extent to which any such investments affected the fund’s ability to meet redemption requests. In managing and reviewing the fund’s liquidity risk, the Committee also considered the extent to which the fund’s investment strategy involves a relatively concentrated portfolio or large positions in particular issuers, the extent to which the fund uses borrowing for investment purposes, and the extent to which the fund uses derivatives (including for hedging purposes). The Committee also reviewed the fund’s short-term and long-term cash flow projections during both normal and reasonably foreseeable stressed conditions. In assessing the fund’s cash flow projections, the Committee considered, among other factors, historical net redemption activity, redemption policies, ownership concentration, distribution channels, and the degree of certainty associated with the fund’s short-term and long-term cash flow projections. The Committee also considered the fund’s holdings of cash and cash equivalents, as well as borrowing arrangements and other funding sources, including, if applicable, the fund’s participation in a credit facility, as components of the fund’s ability to meet redemption requests.
| | |
58 | | BrandywineGLOBAL — Global High Yield Fund |
Liquidity Classification. The Committee reviewed the Program’s liquidity classification methodology for categorizing the fund’s investments into one of four liquidity buckets. In reviewing the fund’s investments, the Committee considered, among other factors, whether trading varying portions of a position in a particular portfolio investment or asset class in sizes the fund would reasonably anticipate trading, would be reasonably expected to significantly affect liquidity.
Highly Liquid Investment Minimum. The Committee performed an analysis to determine whether the fund is required to maintain a Highly Liquid Investment Minimum, and determined that no such minimum is required because the fund primarily holds highly liquid investments.
Compliance with Limitation on Illiquid Investments. The Committee confirmed that during the Reporting Period, the fund did not acquire any illiquid investment such that, after the acquisition, the fund would have invested more than 15% of its assets in illiquid investments that are assets, in accordance with the Program and applicable SEC rules.
Redemptions in Kind. The Committee confirmed that no redemptions in-kind were effected by the fund during the Reporting Period.
The Report stated that the Committee concluded that the Program is reasonably designed and operated effectively to assess and manage the fund’s liquidity risk throughout the Reporting Period.
| | |
| BrandywineGLOBAL — Global High Yield Fund | | 59 |
Additional information (unaudited)
Information about Trustees and Officers
The business and affairs of BrandywineGLOBAL — Global High Yield Fund (the “Fund”) are conducted by management under the supervision and subject to the direction of its Board of Trustees. The business address of each Trustee is c/o Jane Trust, Legg Mason, 100 International Drive, 11th Floor, Baltimore, Maryland 21202. Information pertaining to the Trustees and officers of the Fund is set forth below.
The Statement of Additional Information includes additional information about Trustees and is available, without charge, upon request by calling the Fund at 1-877-721-1926.
| | |
| Independent Trustees† | | |
| |
| Ruby P. Hearn | | |
| |
| Year of birth | | 1940 |
| Position(s) with Trust | | Trustee |
| Term of office1 and length of time served2 | | Since 2004 |
| Principal occupation(s) during the past five years | | Senior Vice President Emerita of The Robert Wood Johnson Foundation (non-profit) (since 2001); Member of the National Academy of Medicine (formerly known as the Institute of Medicine) (since 1982); formerly, Trustee of the New York Academy of Medicine (2004 to 2011); Director of the Institute for Healthcare Improvement (2002 to 2011); Senior Vice President of The Robert Wood Johnson Foundation (1996 to 2001); Fellow of The Yale Corporation (1992 to 1998) |
| Number of funds in fund complex overseen by Trustee | | 20 |
| Other board memberships held by Trustee during the past five years | | None |
| |
| Arnold L. Lehman | | |
| |
| Year of birth | | 1944 |
| Position(s) with Trust | | Trustee and Chairman |
| Term of office1 and length of time served2 | | Since 1982 and since 2015 |
| Principal occupation(s) during the past five years | | Senior Advisor, Phillips (auction house) (since 2015); formerly, Fellow, Ford Foundation (2015 to 2016); Director of the Brooklyn Museum (1997 to 2015) |
| Number of funds in fund complex overseen by Trustee | | 20 |
| Other board memberships held by Trustee during the past five years | | Trustee of American Federation of Arts (since 2002) |
| | |
60 | | BrandywineGLOBAL — Global High Yield Fund |
| | |
| Independent Trustees† (cont’d) | | |
| |
| Robin J.W. Masters | | |
| |
| Year of birth | | 1955 |
| Position(s) with Trust | | Trustee |
| Term of office1 and length of time served2 | | Since 2002 |
| Principal occupation(s) during the past five years | | Retired; formerly, Chief Investment Officer of ACE Limited (insurance) (1986 to 2000) |
| Number of funds in fund complex overseen by Trustee | | 20 |
| Other board memberships held by Trustee during the past five years | | Director of HSBC Managed Portfolios Limited, HSBC Corporate Money Funds Limited and HSBC Specialist Funds Limited (since 2020); formerly, Director of Cheyne Capital International Limited (investment advisory firm) (2005 to 2020); Director/ Trustee of Legg Mason Institutional Funds plc, Western Asset Fixed Income Funds plc and Western Asset Debt Securities Fund plc. (2007 to 2011) |
| |
| Jill E. McGovern | | |
| |
| Year of birth | | 1944 |
| Position(s) with Trust | | Trustee |
| Term of office1 and length of time served2 | | Since 1989 |
| Principal occupation(s) during the past five years | | Senior Consultant, American Institute for Contemporary German Studies (AICGS) (since 2007); formerly, Chief Executive Officer of The Marrow Foundation (non-profit) (1993 to 2007); Executive Director of the Baltimore International Festival (1991 to 1993); Senior Assistant to the President of The Johns Hopkins University (1986 to 1990) |
| Number of funds in fund complex overseen by Trustee | | 20 |
| Other board memberships held by Trustee during the past five years | | Director of International Biomedical Research Alliance (2002 to 2010); Director of Lois Roth Endowment (2005 to 2012) |
| |
| Arthur S. Mehlman | | |
| |
| Year of birth | | 1942 |
| Position(s) with Trust | | Trustee |
| Term of office1 and length of time served2 | | Since 2002 |
| Principal occupation(s) during the past five years | | Retired. Director, The University of Maryland Foundation (since 1992); formerly, Director, The League for People with Disabilities (2003 to 2017); Director, Municipal Mortgage & Equity LLC (2004 to 2011); Partner (1972 to 2002), Partner-in-Charge of the Audit Practice for Baltimore and Washington offices (1998 to 2001), and Managing Partner of the Baltimore office (1992 to 1995) at KPMG LLP (international accounting firm) |
| Number of funds in fund complex overseen by Trustee | | Trustee of all Legg Mason Funds consisting of 20 portfolios; Director/Trustee of the Royce Family of Funds consisting of 22 portfolios |
| Other board memberships held by Trustee during the past five years | | Director of Municipal Mortgage & Equity, LLC. (2004 to 2011) |
| | |
| BrandywineGLOBAL — Global High Yield Fund | | 61 |
Additional information (unaudited) (cont’d)
Information about Trustees and Officers
| | |
| Independent Trustees† (cont’d) | | |
| |
| G. Peter O’Brien | | |
| |
| Year of birth | | 1945 |
| Position(s) with Trust | | Trustee |
| Term of office1 and length of time served2 | | Since 1999 |
| Principal occupation(s) during the past five years | | Retired. Trustee Emeritus of Colgate University (since 2005); Board Member, Hill House, Inc. (residential home care) (since 1999); formerly, Board Member, Bridges School (pre-school) (2006 to 2017); Managing Director, Equity Capital Markets Group of Merrill Lynch & Co. (1971 to 1999) |
| Number of funds in fund complex overseen by Trustee | | Trustee of all Legg Mason funds consisting of 20 portfolios; Director/Trustee of the Royce Family of Funds consisting of 22 portfolios |
| Other board memberships held by Trustee during the past five years | | Director of TICC Capital Corp. (2003 to 2017) |
| |
| S. Ford Rowan | | |
| |
| Year of birth | | 1943 |
| Position(s) with Trust | | Trustee |
| Term of office1 and length of time served2 | | Since 2002 |
| Principal occupation(s) during the past five years | | Consultant to University of Maryland University College (since 2013); formerly, Chairman, National Center for Critical Incident Analysis (2004 to 2018); Lecturer in Organizational Sciences, George Washington University (2000 to 2014); Trustee, St. John’s College (2006 to 2012); Consultant, Rowan & Blewitt Inc. (management consulting) (1984 to 2007); Lecturer in Journalism, Northwestern University (1980 to 1993); Director, Santa Fe Institute (1999 to 2008) |
| Number of funds in fund complex overseen by Trustee | | 20 |
| Other board memberships held by Trustee during the past five years | | None |
| | |
62 | | BrandywineGLOBAL — Global High Yield Fund |
| | |
| Independent Trustees† (cont’d) | | |
| |
| Robert M. Tarola | | |
| |
| Year of birth | | 1950 |
| Position(s) with Trust | | Trustee |
| Term of office1 and length of time served2 | | Since 2004 |
| Principal occupation(s) during the past five years | | President of Rights Advisory LLC (corporate finance and governance consulting) (since 2008); Member, Investor Advisory Group of the Public Company Accounting Oversight Board (since 2009); formerly, Chief Financial Officer, Little Company of Mary Hospital and Health Care Centers (healthcare provider network) (2018); Executive Vice President and Chief Financial Officer, Southcoast Health System, Inc. (healthcare provider network) (2015 to 2017); Senior Vice President and Chief Financial Officer of The Howard University (higher education and health care) (2009 to 2013); Senior Vice President and Chief Financial Officer of W.R. Grace & Co. (specialty chemicals) (1999 to 2008); Chief Financial Officer of MedStar Health, Inc. (healthcare) (1996 to 1999); Partner, PriceWaterhouse, LLP (accounting and auditing) (1984 to 1996) |
| Number of funds in fund complex overseen by Trustee | | 20 |
| Other board memberships held by Trustee during the past five years | | Director of American Kidney Fund (renal disease assistance) (since 2008); Director and Board Chair of XBRL International, Inc. (global data standard setting) (since 2015); Director of Vista Outdoor, Inc. (consumer recreation products) (since 2015); formerly, Director of TeleTech Holdings, Inc. (business processing outsourcing) (2008 to 2018) |
| | |
| Interested Trustee and Officer |
|
| Jane Trust, CFA3 |
| |
| Year of birth | | 1962 |
| Position(s) with Trust | | Trustee, President and Chief Executive Officer |
| Term of office1 and length of time served2 | | Since 2015 |
| Principal occupation(s) during the past five years | | Senior Vice President, Fund Board Management, Franklin Templeton (since 2020); Officer and/or Trustee/Director of 150 funds associated with Legg Mason Partners Fund Advisor, LLC (“LMPFA”) or its affiliates (since 2015); President and Chief Executive Officer of LMPFA (since 2015); formerly, Senior Managing Director (2018 to 2020) and Managing Director (2016 to 2018) of Legg Mason & Co., LLC (“Legg Mason & Co.”); Senior Vice President of LMPFA (2015) |
| Number of funds in fund complex overseen by Trustee | | 147 |
| Other board memberships held by Trustee during the past five years | | None |
| | |
| BrandywineGLOBAL — Global High Yield Fund | | 63 |
Additional information (unaudited) (cont’d)
Information about Trustees and Officers
| | |
| Additional Officers |
|
Christopher Berarducci Legg Mason 620 Eighth Avenue, 47th Floor, New York, NY 10018 |
| Year of birth | | 1974 |
| Position(s) with Trust | | Treasurer and Principal Financial Officer |
| Term of office1 and length of time served2 | | Since 2010 and 2019 |
| Principal occupation(s) during the past five years | | Vice President, Fund Administration and Reporting, Franklin Templeton (since 2020); Treasurer (since 2010) and Principal Financial Officer (since 2019) of certain funds associated with Legg Mason & Co. or its affiliates; formerly, Managing Director (2020), Director (2015 to 2020), and Vice President (2011 to 2015) of Legg Mason & Co. |
|
Marc A. De Oliveira* Legg Mason 100 First Stamford Place, 6th Floor, Stamford, CT 06902 |
| Year of birth | | 1971 |
| Position(s) with Trust | | Secretary and Chief Legal Officer |
| Term of office1 and length of time served2 | | Since 2020 |
| Principal occupation(s) during the past five years | | Associate General Counsel of Franklin Templeton (since 2020); Assistant Secretary of certain funds associated with Legg Mason & Co. or its affiliates (since 2006); formerly, Managing Director (2016 to 2020) and Associate General Counsel of Legg Mason & Co. (2005 to 2020) |
|
Thomas C. Mandia Legg Mason 100 First Stamford Place, 6th Floor, Stamford, CT 06902 |
| Year of birth | | 1962 |
| Position(s) with Trust | | Senior Vice President |
| Term of office1 and length of time served2 | | Since 2020 |
| Principal occupation(s) during the past five years | | Senior Associate General Counsel of Franklin Templeton (since 2020); Secretary of LMPFA (since 2006); Assistant Secretary of certain funds associated with Legg Mason & Co. or its affiliates (since 2006); Secretary of LM Asset Services, LLC (“LMAS”) (since 2002) and Legg Mason Fund Asset Management, Inc. (“LMFAM”) (since 2013) (formerly registered investment advisers); formerly, Managing Director and Deputy General Counsel of Legg Mason & Co. (2005 to 2020) |
| | |
64 | | BrandywineGLOBAL — Global High Yield Fund |
| | |
| Additional Officers (cont’d) |
|
Ted P. Becker Legg Mason 620 Eighth Avenue, 47th Floor, New York, NY 10018 |
| |
| Year of birth | | 1951 |
| Position(s) with Trust | | Chief Compliance Officer |
| Term of office1 and length of time served2 | | Since 2007 |
| Principal occupation(s) during the past five years | | Vice President, Global Compliance of Franklin Templeton (since 2020); Chief Compliance Officer of LMPFA (since 2006); Chief Compliance Officer of certain funds associated with Legg Mason & Co. or its affiliates (since 2006); formerly, Director of Global Compliance at Legg Mason, Inc. (2006 to 2020); Managing Director of Compliance of Legg Mason & Co. (2005 to 2020) |
|
Susan Kerr Legg Mason 620 Eighth Avenue, 47th Floor, New York, NY 10018 |
| |
| Year of birth | | 1949 |
| Position(s) with Trust | | Chief Anti-Money Laundering Compliance Officer |
| Term of office1 and length of time served2 | | Since 2013 |
| Principal occupation(s) during the past five years | | Senior Compliance Analyst, Franklin Templeton (since 2020); Chief Anti-Money Laundering Compliance Officer of certain funds associated with Legg Mason & Co. or its affiliates (since 2013) and Anti-Money Laundering Compliance Officer (since 2012), Senior Compliance Officer (since 2011) and Assistant Vice President (since 2010) of Legg Mason Investor Services, LLC (“LMIS”); formerly, Assistant Vice President of Legg Mason & Co. (2010 to 2020) |
|
Jenna Bailey Legg Mason 100 First Stamford Place, 5th Floor, Stamford, CT 06902 |
| |
| Year of birth | | 1978 |
| Position(s) with Trust | | Identity Theft Prevention Officer |
| Term of office1 and length of time served2 | | Since 2015 |
| Principal occupation(s) during the past five years | | Senior Compliance Analyst of Franklin Templeton (since 2020); Identity Theft Prevention Officer of certain funds associated with Legg Mason & Co. or its affiliates (since 2015); formerly, Compliance Officer of Legg Mason & Co. (2013 to 2020); Assistant Vice President of Legg Mason & Co. (2011 to 2020) |
| | |
| BrandywineGLOBAL — Global High Yield Fund | | 65 |
Additional information (unaudited) (cont’d)
Information about Trustees and Officers
| | |
| Additional Officers (cont’d) |
|
Jeanne M. Kelly Legg Mason 620 Eighth Avenue, 47th Floor, New York, NY 10018 |
| |
| Year of birth | | 1951 |
| Position(s) with Trust | | Senior Vice President |
| Term of office1 and length of time served2 | | Since 2007 |
| Principal occupation(s) during the past five years | | U.S. Fund Board Team Manager, Franklin Templeton (since 2020); Senior Vice President of certain funds associated with Legg Mason & Co. or its affiliates (since 2007); Senior Vice President of LMPFA (since 2006); President and Chief Executive Officer of LMAS and LMFAM (since 2015); formerly, Managing Director of Legg Mason & Co. (2005 to 2020); Senior Vice President of LMFAM (2013 to 2015) |
| † | Trustees who are not “interested persons” of the Fund within the meaning of Section 2(a)(19) of the Investment Company Act of 1940, as amended (the “1940 Act”). Each of the Independent Trustees serves on the standing committees of the Board of Trustees, which include the Audit Committee (chair: Arthur S. Mehlman), the Nominating Committee (co-chairs: G. Peter O’Brien and Jill E. McGovern), and the Independent Trustees Committee (chair: Arnold L. Lehman). |
| * | Effective September 10, 2020, Mr. De Oliveira became Secretary and Chief Legal Officer. |
| 1 | Each Trustee and officer serves until his or her respective successor has been duly elected and qualified or until his or her earlier death, resignation, retirement or removal. |
| 2 | Indicates the earliest year in which the Trustee became a board member for a fund in the Legg Mason fund complex or the officer took such office. |
| 3 | Ms. Trust is an “interested person” of the Fund, as defined in the 1940 Act, because of her position with LMPFA and/or certain of its affiliates. |
| | |
66 | | BrandywineGLOBAL — Global High Yield Fund |
BrandywineGLOBAL—
Global High Yield Fund
Trustees
Ruby P. Hearn
Arnold L. Lehman
Chairman
Robin J.W. Masters
Jill E. McGovern
Arthur S. Mehlman
G. Peter O’Brien
S. Ford Rowan
Robert M. Tarola
Jane Trust
Investment manager
Legg Mason Partners Fund Advisor, LLC
Subadviser
Brandywine Global Investment Management, LLC
Distributor
Legg Mason Investor Services, LLC
Custodian
The Bank of New York Mellon
Transfer agent
BNY Mellon Investment Servicing (US) Inc.
4400 Computer Drive
Westborough, MA 01581
Independent registered public accounting firm
PricewaterhouseCoopers LLP Baltimore, MD
BrandywineGLOBAL — Global High Yield Fund
The Fund is a separate investment series of Legg Mason Global Asset Management Trust, a Maryland statutory trust.
BrandywineGLOBAL — Global High Yield Fund
Legg Mason Funds
620 Eighth Avenue, 47th Floor
New York, NY 10018
The Fund files its complete schedule of portfolio holdings with the Securities and Exchange Commission (“SEC”) for the first and third quarters of each fiscal year as an exhibit to its reports on Form N-PORT. The Fund’s Forms N-PORT are available on the SEC’s website at www.sec.gov. To obtain information on Form N-PORT, shareholders can call the Fund at 1-877-721-1926.
Information on how the Fund voted proxies relating to portfolio securities during the prior 12-month period ended June 30th of each year and a description of the policies and procedures that the Fund uses to determine how to vote proxies related to portfolio transactions are available (1) without charge, upon request, by calling the Fund at 1-877-721-1926, (2) at www.leggmason.com/mutualfunds and (3) on the SEC’s website at www.sec.gov.
This report is submitted for the general information of the shareholders of BrandywineGLOBAL — Global High Yield Fund. This report is not authorized for distribution to prospective investors in the Fund unless preceded or accompanied by a current prospectus.
Investors should consider the Fund’s investment objectives, risks, charges and expenses carefully before investing. The prospectus contains this and other important information about the Fund. Please read the prospectus carefully before investing.
www.leggmason.com
© 2020 Legg Mason Investor Services, LLC
Member FINRA, SIPC
Legg Mason Funds Privacy and Security Notice
Your Privacy and the Security of Your Personal Information is Very Important to the Legg Mason Funds
This Privacy and Security Notice (the “Privacy Notice”) addresses the Legg Mason Funds’ privacy and data protection practices with respect to nonpublic personal information the Funds receive. The Legg Mason Funds include any funds sold by the Funds’ distributor, Legg Mason Investor Services, LLC, as well as Legg Mason-sponsored closed-end funds. The provisions of this Privacy Notice apply to your information both while you are a shareholder and after you are no longer invested with the Funds.
The Type of Nonpublic Personal Information the Funds Collect About You
The Funds collect and maintain nonpublic personal information about you in connection with your shareholder account. Such information may include, but is not limited to:
| • | | Personal information included on applications or other forms; |
| • | | Account balances, transactions, and mutual fund holdings and positions; |
| • | | Bank account information, legal documents, and identity verification documentation; |
| • | | Online account access user IDs, passwords, security challenge question responses; and |
| • | | Information received from consumer reporting agencies regarding credit history and creditworthiness (such as the amount of an individual’s total debt, payment history, etc.). |
How the Funds Use Nonpublic Personal Information About You
The Funds do not sell or share your nonpublic personal information with third parties or with affiliates for their marketing purposes, or with other financial institutions or affiliates for joint marketing purposes, unless you have authorized the Funds to do so. The Funds do not disclose any nonpublic personal information about you except as may be required to perform transactions or services you have authorized or as permitted or required by law. The Funds may disclose information about you to:
| • | | Employees, agents, and affiliates on a “need to know” basis to enable the Funds to conduct ordinary business or to comply with obligations to government regulators; |
| • | | Service providers, including the Funds’ affiliates, who assist the Funds as part of the ordinary course of business (such as printing, mailing services, or processing or servicing your account with us) or otherwise perform services on the Funds’ behalf, including companies that may perform statistical analysis, market research and marketing services solely for the Funds; |
| • | | Permit access to transfer, whether in the United States or countries outside of the United States to such Funds’ employees, agents and affiliates and service providers as required to enable the Funds to conduct ordinary business, or to comply with obligations to government regulators; |
| • | | The Funds’ representatives such as legal counsel, accountants and auditors to enable the Funds to conduct ordinary business, or to comply with obligations to government regulators; |
| • | | Fiduciaries or representatives acting on your behalf, such as an IRA custodian or trustee |
|
| NOT PART OF THE ANNUAL REPORT |
Legg Mason Funds Privacy and Security Notice (cont’d)
Except as otherwise permitted by applicable law, companies acting on the Funds’ behalf, including those outside the United States, are contractually obligated to keep nonpublic personal information the Funds provide to them confidential and to use the information the Funds share only to provide the services the Funds ask them to perform.
The Funds may disclose nonpublic personal information about you when necessary to enforce their rights or protect against fraud, or as permitted or required by applicable law, such as in connection with a law enforcement or regulatory request, subpoena, or similar legal process. In the event of a corporate action or in the event a Fund service provider changes, the Funds may be required to disclose your nonpublic personal information to third parties. While it is the Funds’ practice to obtain protections for disclosed information in these types of transactions, the Funds cannot guarantee their privacy policy will remain unchanged.
Keeping You Informed of the Funds’ Privacy and Security Practices
The Funds will notify you annually of their privacy policy as required by federal law. While the Funds reserve the right to modify this policy at any time they will notify you promptly if this privacy policy changes.
The Funds’ Security Practices
The Funds maintain appropriate physical, electronic and procedural safeguards designed to guard your nonpublic personal information. The Funds’ internal data security policies restrict access to your nonpublic personal information to authorized employees, who may use your nonpublic personal information for Fund business purposes only.
Although the Funds strive to protect your nonpublic personal information, they cannot ensure or warrant the security of any information you provide or transmit to them, and you do so at your own risk. In the event of a breach of the confidentiality or security of your nonpublic personal information, the Funds will attempt to notify you as necessary so you can take appropriate protective steps. If you have consented to the Funds using electronic communications or electronic delivery of statements, they may notify you under such circumstances using the most current email address you have on record with them.
In order for the Funds to provide effective service to you, keeping your account information accurate is very important. If you believe that your account information is incomplete, not accurate or not current, if you have questions about the Funds’ privacy practices, or our use of your nonpublic personal information, write the Funds using the contact information on your account statements, email the Funds by clicking on the Contact Us section of the Funds’ website at www.leggmason.com, or contact the Funds at 1-877-721-1926.
Revised April 2018
|
| NOT PART OF THE ANNUAL REPORT |
www.leggmason.com
© 2020 Legg Mason Investor Services, LLC Member FINRA, SIPC
BWXX016048 11/20 SR20-4004
The registrant has adopted a code of ethics that applies to the registrant’s principal executive officer, principal financial officer, principal accounting officer or controller.
| ITEM 3. | AUDIT COMMITTEE FINANCIAL EXPERT. |
The Board of Trustees of the registrant has determined that Arthur S. Mehlman the Chairman of the Board’s Audit Committee and Robert M. Tarola, possess the technical attributes identified in Instruction 2(b) of Item 3 to Form N-CSR to qualify as “audit committee financial experts,” and have designated Mr. Mehlman and Mr. Tarola as the Audit Committee’s financial experts. Mr. Mehlman and Mr. Tarola are “independent” Trustees pursuant to paragraph (a) (2) of Item 3 to Form N-CSR.
| ITEM 4. | PRINCIPAL ACCOUNTANT FEES AND SERVICES. |
a) Audit Fees. The aggregate fees billed in the last two fiscal years ending September 30, 2019 and September 30, 2020 (the “Reporting Periods”) for professional services rendered by the Registrant’s principal accountant (the “Auditor”) for the audit of the Registrant’s annual financial statements, or services that are normally provided by the Auditor in connection with the statutory and regulatory filings or engagements for the Reporting Periods, were $336,010 in September 30, 2019 and $322,330 in September 30, 2020.
b) Audit-Related Fees. The aggregate fees billed in the Reporting Period for assurance and related services by the Auditor that are reasonably related to the performance of the Registrant’s financial statements were $3,000 in September 30, 2019 and $0 in September 30, 2020.
In addition, there were no Audit-Related Fees billed in the Reporting Period for assurance and related services by the Auditor to the Registrant’s investment adviser (not including any sub-adviser whose role is primarily portfolio management and is subcontracted with or overseen by another investment adviser), and any entity controlling, controlled by or under common control with the investment adviser that provides ongoing services to the Legg Mason Global Asset Management Trust (“service affiliates”), that were reasonably related to the performance of the annual audit of the service affiliates. Accordingly, there were no such fees that required pre-approval by the Audit Committee for the Reporting Period.
(c) Tax Fees. The aggregate fees billed in the Reporting Periods for professional services rendered by the Auditor for tax compliance, tax advice and tax planning (“Tax Services”) were $0 in September 30, 2019 and $0 in September 30, 2020. These services consisted of (i) review or preparation of U.S. federal, state, local and excise tax returns; (ii) U.S. federal, state and local tax planning, advice and assistance regarding statutory, regulatory or administrative developments, and (iii) tax advice regarding tax qualification matters and/or treatment of various financial instruments held or proposed to be acquired or held.
There were no fees billed for tax services by to the service affiliates during the Reporting Periods that required pre-approval by the Audit Auditors Committee.
d) All Other Fees. The aggregate fees for other fees billed in the Reporting Periods for products and services provided by the Auditor were $0 in September 30, 2019 and $0 in September 30, 2020, other than the services reported in paragraphs (a) through (c) of this item for the Legg Mason Global Asset Management Trust.
All Other Fees. There were no other non-audit services rendered by the Auditor to Legg Mason Partners Fund Advisors, LLC (“LMPFA”), and any entity controlling, controlled by or under common control with LMPFA that provided ongoing services to Legg Mason Global Asset Management Trust requiring pre-approval by the Audit Committee in the Reporting Period.
(e) Audit Committee’s pre–approval policies and procedures described in paragraph (c)
(7) of Rule 2-01 of Regulation S-X.
(1) The Charter for the Audit Committee (the “Committee”) of the Board of each registered investment company (the “Fund”) advised by LMPFA or one of their affiliates (each, an “Adviser”) requires that the Committee shall approve (a) all audit and permissible non-audit services to be provided to the Fund and (b) all permissible non-audit services to be provided by the Fund’s independent auditors to the Adviser and any Covered Service Providers if the engagement relates directly to the operations and financial reporting of the Fund. The Committee may implement policies and procedures by which such services are approved other than by the full Committee.
The Committee shall not approve non-audit services that the Committee believes may impair the independence of the auditors. As of the date of the approval of this Audit Committee Charter, permissible non-audit services include any professional services (including tax services), that are not prohibited services as described below, provided to the Fund by the independent auditors, other than those provided to the Fund in connection with an audit or a review of the financial statements of the Fund. Permissible non-audit services may not include: (i) bookkeeping or other services related to the accounting records or financial statements of the Fund; (ii) financial information systems design and implementation; (iii) appraisal or valuation services, fairness opinions or contribution-in-kind reports; (iv) actuarial services; (v) internal audit outsourcing services; (vi) management functions or human resources; (vii) broker or dealer, investment adviser or investment banking services; (viii) legal services and expert services unrelated to the audit; and (ix) any other service the Public Company Accounting Oversight Board determines, by regulation, is impermissible.
Pre-approval by the Committee of any permissible non-audit services is not required so long as: (i) the aggregate amount of all such permissible non-audit services provided to the Fund, the Adviser and any service providers controlling, controlled by or under common control with the Adviser that provide ongoing services to the Fund (“Covered Service Providers”) constitutes not more than 5% of the total amount of revenues paid to the independent auditors during the fiscal year in which the permissible non-audit services are provided to (a) the Fund, (b) the Adviser and (c) any entity controlling, controlled by or under common control with the Adviser that provides ongoing services to the Fund during the fiscal year in which the services are provided that would have to be approved by the Committee; (ii) the permissible non-audit services were not recognized by the Fund at the time of the engagement to be non-audit services; and (iii) such services are promptly brought to the attention of the Committee and approved by the Committee (or its delegate(s)) prior to the completion of the audit.
(2) For the Legg Mason Global Asset Management Trust, the percentage of fees that were approved by the audit committee, with respect to: Audit-Related Fees were 100% and 100% for September 30, 2019 and September 30, 2020; Tax Fees were 100% and 100% for September 30, 2019 and September 30, 2020; and Other Fees were 100% and 100% for September 30, 2019 and September 30, 2020.
(f) N/A
(g) Non-audit fees billed by the Auditor for services rendered to Legg Mason Global Asset Management Trust, LMPFA and any entity controlling, controlled by, or under common control with LMPFA that provides ongoing services to Legg Mason Global Asset Management Trust during the reporting period were $386,151 in September 30, 2019 and $1,105,712 in September 30, 2020.
(h) Yes. Legg Mason Global Asset Management Trust’s Audit Committee has considered whether the provision of non-audit services that were rendered to Service Affiliates, which were not pre-approved (not requiring pre-approval), is compatible with maintaining the Accountant’s independence. All services provided by the Auditor to the Legg Mason Global Asset Management Trust or to Service Affiliates, which were required to be pre-approved, were pre-approved as required.
| ITEM 5. | AUDIT COMMITTEE OF LISTED REGISTRANTS. |
| | a) | The independent board members are acting as the registrant’s audit committee as specified in Section 3(a)(58)(B) of the Exchange Act. The Audit Committee consists of the following Board members: |
Ruby P. Hearn
Arnold L. Lehman
Robin J.W. Masters
Jill E. McGovern
Arthur S. Mehlman
G. Peter O’Brien
S. Ford Rowan
Robert M. Tarola
| ITEM 6. | SCHEDULE OF INVESTMENTS. |
Included herein under Item 1.
| ITEM 7. | DISCLOSURE OF PROXY VOTING POLICIES AND PROCEDURES FOR CLOSED-END MANAGEMENT INVESTMENT COMPANIES. |
Not applicable.
| ITEM 8. | PORTFOLIO MANAGERS OF CLOSED-END MANAGEMENT INVESTMENT COMPANIES. |
Not applicable.
| ITEM 9. | PURCHASES OF EQUITY SECURITIES BY CLOSED-END MANAGEMENT INVESTMENT COMPANY AND AFFILIATED PURCHASERS. |
Not applicable.
| ITEM 10. | SUBMISSION OF MATTERS TO A VOTE OF SECURITY HOLDERS. |
Not applicable.
| ITEM 11. | CONTROLS AND PROCEDURES. |
| | (a) | The registrant’s principal executive officer and principal financial officer have concluded that the registrant’s disclosure controls and procedures (as defined in Rule 30a- 3(c) under the Investment Company Act of 1940, as amended (the “1940 Act”)) are effective as of a date within 90 days of the filing date of this report that includes the disclosure required by this paragraph, based on their evaluation of the disclosure controls and procedures required by Rule 30a-3(b) under the 1940 Act and 15d-15(b) under the Securities Exchange Act of 1934. |
| | (b) | There were no changes in the registrant’s internal control over financial reporting (as defined in Rule 30a-3(d) under the 1940 Act) that occurred during the second fiscal quarter of the period covered by this report that have materially affected, or are likely to materially affect the registrant’s internal control over financial reporting. |
| ITEM 12. | DISCLOSURE OF SECURITIES LENDING ACTIVITIES FOR CLOSED-END MANAGEMENT INVESTMENT COMPANIES. |
Not applicable.
(a) (1) Code of Ethics attached hereto.
Exhibit 99.CODE ETH
(a) (2) Certifications pursuant to section 302 of the Sarbanes-Oxley Act of 2002 attached hereto.
Exhibit 99.CERT
(b) Certifications pursuant to Section 906 of the Sarbanes-Oxley Act of 2002 attached hereto.
Exhibit 99.906CERT
SIGNATURES
Pursuant to the requirements of the Securities Exchange Act of 1934 and the Investment Company Act of 1940, the registrant has duly caused this Report to be signed on its behalf by the undersigned, there unto duly authorized.
Legg Mason Global Asset Management Trust
| | |
| By: | | /s/ Jane Trust |
| | Jane Trust |
| | Chief Executive Officer |
| |
| Date: | | November 25, 2020 |
Pursuant to the requirements of the Securities Exchange Act of 1934 and the Investment Company Act of 1940, this report has been signed below by the following persons on behalf of the registrant and in the capacities and on the dates indicated.
| | |
| By: | | /s/ Jane Trust |
| | Jane Trust |
| | Chief Executive Officer |
| |
| Date: | | November 25, 2020 |
| | |
| By: | | /s/ Christopher Berarducci |
| | Christopher Berarducci |
| | Principal Financial Officer |
| |
| Date: | | November 25, 2020 |