UNITED STATES
SECURITIES AND EXCHANGE COMMISSION
Washington, D.C. 20549
FORM N-CSR
CERTIFIED SHAREHOLDER REPORT OF REGISTERED
MANAGEMENT INVESTMENT COMPANIES
Investment Company Act file number 811-22338
Legg Mason Global Asset Management Trust
(Exact name of registrant as specified in charter)
620 Eighth Avenue, 47th Floor, New York, NY 10018
(Address of principal executive offices) (Zip code)
Marc A. De Oliveira.
Legg Mason & Co., LLC
100 First Stamford Place
Stamford, CT 06902
(Name and address of agent for service)
Registrant’s telephone number, including area code: 1-877-721-1926
Date of fiscal year end: October 31
Date of reporting period: October 31, 2020
| ITEM 1. | REPORT TO STOCKHOLDERS |
The Annual Report to Stockholders is filed herewith.

| | |
| Annual Report | | October 31, 2020 |
CLEARBRIDGE
SMALL CAP FUND
Beginning in or after April 2021, as permitted by regulations adopted by the Securities and Exchange Commission, the Fund intends to no longer mail paper copies of the Fund’s shareholder reports like this one, unless you specifically request paper copies of the reports from the Fund or from your Service Agent or financial intermediary (such as a broker-dealer or bank). Instead, the reports will be made available on a website, and you will be notified by mail each time a report is posted and provided with a website link to access the report.
If you already elected to receive shareholder reports electronically (“e-delivery”), you will not be affected by this change and you need not take any action. If you have not already elected e-delivery, you may elect to receive shareholder reports and other communications from the Fund electronically by contacting your Service Agent or, if you are a direct shareholder with the Fund, by calling 1-877-721-1926.
You may elect to receive all future reports in paper free of charge. If you invest through a Service Agent, you can contact your Service Agent to request that you continue to receive paper copies of your shareholder reports. That election will apply to all Legg Mason Funds held in your account at that Service Agent. If you are a direct shareholder with the Fund, you can call the Fund at 1-877-721-1926, or write to the Fund by regular mail at Legg Mason Funds, P.O. Box 9699, Providence, RI 02940-9699 or by express, certified or registered mail to Legg Mason Funds, 4400 Computer Drive, Westborough, MA 01581 to let the Fund know you wish to continue receiving paper copies of your shareholder reports. That election will apply to all Legg Mason Funds held in your account held directly with the fund complex.

|
| INVESTMENT PRODUCTS: NOT FDIC INSURED • NO BANK GUARANTEE • MAY LOSE VALUE |
Fund objective
The Fund seeks capital appreciation.
Letter from the president

Dear Shareholder,
We are pleased to provide the annual report of ClearBridge Small Cap Fund for the twelve-month reporting period ended October 31, 2020. Please read on for a detailed look at prevailing economic and market conditions during the Fund’s reporting period and to learn how those conditions have affected Fund performance.
Special shareholder notice
On July 31, 2020, Franklin Resources, Inc. (“Franklin Resources”) acquired Legg Mason, Inc. (“Legg Mason”) in an all-cash transaction. As a result of the transaction, Legg Mason Partners Fund Advisor, LLC (“LMPFA”) and the subadviser(s) became indirect, wholly-owned subsidiaries of Franklin Resources. Under the Investment Company Act of 1940, as amended, consummation of the transaction automatically terminated the management and subadvisory agreements that were in place for the Fund prior to the transaction. The Fund’s manager and subadviser(s) continue to provide uninterrupted services with respect to the Fund pursuant to new management and subadvisory agreements that were approved by Fund shareholders.
Franklin Resources, whose principal executive offices are at One Franklin Parkway, San Mateo, California 94403, is a global investment management organization operating, together with its subsidiaries, as Franklin Templeton. As of October 31, 2020, after giving effect to the transaction described above, Franklin Templeton’s asset management operations had aggregate assets under management of approximately $1.4 trillion.
| | |
II | | ClearBridge Small Cap Fund |
As always, we remain committed to providing you with excellent service and a full spectrum of investment choices. We also remain committed to supplementing the support you receive from your financial advisor. One way we accomplish this is through our website, www.leggmason.com. Here you can gain immediate access to market and investment information, including:
| • | | Fund prices and performance, |
| • | | Market insights and commentaries from our portfolio managers, and |
| • | | A host of educational resources. |
We look forward to helping you meet your financial goals.
Sincerely,

Jane Trust, CFA
President and Chief Executive Officer
November 30, 2020
| | |
ClearBridge Small Cap Fund | | III |
Fund overview
Q. What is the Fund’s investment strategy?
A. The Fund seeks capital appreciation. Under normal circumstances, the Fund invests at least 80% of its net assets plus borrowings for investment purposes, if any, in common stocks and other equity securities of small capitalization companies or in other investments that we believe have similar economic characteristics. (The Fund does not currently intend to borrow for investment purposes.) Small capitalization companies are those companies whose market capitalizations at the time of investment do not exceed the highest month-end market capitalization value of any stock in the Russell 2000 Indexi for the previous twelve months.
The Fund may invest up to 20% of its net assets in equity securities of companies with larger market capitalizations. Under normal circumstances, the Fund’s investments may include equity securities of companies that we consider to be “special situations,” at the time of purchase. We define special situations as companies undergoing unusual or possibly one-time developments that, in our opinion, make them attractive for investment. The Fund will not invest more than 20% of its total assets in securities of companies that, at the time of investment, are involved in reorganizations or restructurings in connection with bankruptcy proceedings. We follow a value discipline in selecting securities, and therefore seek to purchase securities at discounts to our assessment of their intrinsic value. The Fund may invest in foreign equity securities, including securities of emerging market issuers.
Q. What were the overall market conditions during the Fund’s reporting period?
A. U.S. small cap stocks had a volatile twelve-month reporting period ended October 31, 2020, with the Russell 2000 Index ending the period roughly flat at -0.14%. Within small cap stocks, the Russell 2000 Growth Indexii advanced 13.37%, dramatically outperforming its value counterpart, the Russell 2000 Value Indexiii, which returned -13.92%. Large cap stocks made more sizable gains, with the broad market S&P 500 Indexiv rising 9.71%, driven by similar outperformance of growth stocks.
The rapid global spreading of the COVID-19 pandemic early in 2020 brought a shock to markets, creating unprecedented volatility across all asset classes late in the first quarter. The severity and swiftness of this market sell-off caught all by surprise. The Energy sector led the decline on the back of a two-thirds collapse in oil prices from $61 dollars to $20 dollars per barrel over the quarter. Measures taken to combat the spread of COVID-19 —mobility restrictions and the shutdown of schools and all but “essential” businesses —brought economies to a halt.
The market decline differed from prior ones insofar as no asset class or industry was spared. Assets across the board saw losses on a global basis. The U.S. equity market sell-off featured little differentiation in terms of many factors that historically indicated a defensive stock: quality, beta, dividends. Larger stocks outperformed smaller, and companies with stronger balance sheets did better than companies with leverage.
Large fiscal stimulus packages and the Federal Reserve Board (the “Fed”)v lowering rates effectively to 0% helped the market roar back in a similarly unprecedented fashion, with the S&P 500 Index rising 44% in the fifty-three trading days between March 23 and June 8, 2020. The S&P 500 Index’s second-quarter 20%+ total return was the best quarter in over
| | |
| ClearBridge Small Cap Fund 2020 Annual Report | | 1 |
Fund overview (cont’d)
twenty years (the NASDAQ also made a record high). The rebound continued in the third quarter albeit at a slower pace, and with a slight rotation from technology and consumer-focused areas of the market toward more cyclical areas, such as Industrials and Materials, at the end of the period. Strong market returns came amid a shift in Federal Reserve regime as the Fed announced it would no longer preemptively raise interest rates to ward off inflation and would instead tolerate periods of inflation above its 2% target. Continued massive fiscal stimulus buoyed personal income and consumer spending, while unemployment remained high.
In a period of large fiscal stimulus, heavy monetary accommodation and stay-at-home measures, large technology platforms able to meet consumer demand remotely led the market. Within small caps, the growth-focused Health Care sector outperformed the Russell 2000 Index by 34 percentage points, followed by consumer sectors and IT, while Energy dropped 51% and the rate-sensitive Real Estate sector fell 25% amid falling interest rates.
Through most of the period, the “winning” narrative in the stock market was that the combination of low interest rates for an extended period of time and monetary and fiscal stimulus would result in better economic outcomes than what was being discounted in the prices of stocks. If so, the sectors and industries that have led may continue to do so, despite their very lofty valuations. There are several possibilities, however, such as slower economic growth, spiking debt costs, inflation and myriad other things that we may not even know about now. If at some point those factors begin to be discounted in asset values, the narrative will quickly change. We believe we will achieve better long-term returns by staying focused on finding companies with solid competitive strategies and maintaining our valuation discipline and portfolio diversification, rather than by pursuing themes or narratives. It is difficult to do so when cognitive diversity breaks down to the point it has in this market, but we are sticking to our process.
Q. How did we respond to these changing market conditions?
A. We responded to these changing conditions by remaining disciplined and investing according to our process, which seeks to understand market expectations for future value creation, so that we can select investments that we believe are undervalued, using a probabilistic assessment of the fundamental valuation of companies under a wide variety of future scenarios.
Using this process, we acquired new positions in a wide range of sectors and industries. One example is Utz Brands Inc., a snack-food company in the Consumer Staples sector. We believe that Utz’s core business is well-positioned for expansion in the hands of management that has experience building a nationwide platform. The business’ valuation and low correlation to the portfolio also made it an attractive asset. Another example is Omnicell Inc. in the Health Care sector, a provider of pharmacy (central and retail locations) automation solutions. Over the years Omnicell has successfully built a more complete platform to address the long-term goal of providing a fully autonomous pharmacy solution. Digitization of pharmacies will allow for improved service as well as lower cost. We believed the stock price at purchase did not reflect the durability of growth within the growing installed base and/or the long-term opportunity. We also bought BRP Group Inc., an
| | |
2 | | ClearBridge Small Cap Fund 2020 Annual Report |
independent insurance broker in the Financials sector. We believe BRP’s unique approach, modern platform and appropriate incentives will yield considerable growth and margin expansion that was not fully discounted in the stock price.
Our process continuously leads us to reduce or eliminate positions that have reached fair value, been acquired, have invalidated our investment case, or are replaced for a better risk-adjusted opportunity. During the reporting period it led us to sell out of Summit Hotel Properties Inc., a hotel real estate investment trust (REIT)vi company. The coronavirus pandemic has significantly impaired Summit’s business, putting stress on its leverage. We elected to sell Summit Hotel Properties Inc. and buy RLJ Lodging Trust, another hotel REIT, which has greater scale, lower leverage and more ability to improve margins over time.
Within Financials, Great Western Bancorp Inc. significantly underperformed regional banks in the second quarter due to relatively high loan impairments and exposure to controversial sectors of the lending market, including agriculture and hospitality. We exited the position in anticipation of further credit deterioration. We also exited ProAssurance Corp., for which an improving pricing environment was overshadowed by the announcement of further losses from insurance written to a large health care facility provider and an uncertain outlook for potential COVID-19-related claims.
Performance review
For the twelve months ended October 31, 2020, Class C shares of ClearBridge Small Cap Fund, excluding sales charges, returned -11.66%. The Fund’s unmanaged benchmark, the Russell 2000 Index, returned -0.14% for the same period. The Lipper Small-Cap Core Funds Category Averagevii returned -7.68% over the same time frame.
| | | | | | | | |
Performance Snapshot as of October 31, 2020
(unaudited) | |
| (excluding sales charges) | | 6 months | | | 12 months | |
| ClearBridge Small Cap Fund: | | | | | | | | |
Class A | | | 13.28 | % | | | -11.00 | % |
Class A2 | | | 13.12 | % | | | -11.19 | % |
Class C | | | 12.83 | % | | | -11.66 | % |
Class FI | | | 13.22 | % | | | -11.10 | % |
Class R | | | 13.02 | % | | | -11.38 | % |
Class I | | | 13.36 | % | | | -10.83 | % |
Class IS | | | 13.43 | % | | | -10.71 | % |
| Russell 2000 Index | | | 18.13 | % | | | -0.14 | % |
| Lipper Small-Cap Core Funds Category Average | | | 14.49 | % | | | -7.68 | % |
The performance shown represents past performance. Past performance is no guarantee of future results and current performance may be higher or lower than the performance shown above. Principal value and investment returns will fluctuate and investors’ shares, when redeemed, may be worth more or less than their original cost. To obtain performance data current to the most recent month-end, please visit our website at www.leggmason.com/mutualfunds.
| | |
ClearBridge Small Cap Fund 2020 Annual Report | | 3 |
Fund overview (cont’d)
All share class returns assume the reinvestment of all distributions at net asset value and the deduction of all Fund expenses. Returns have not been adjusted to include sales charges that may apply or the deduction of taxes that a shareholder would pay on Fund distributions. If sales charges were reflected, the performance quoted would be lower. Performance figures for periods shorter than one year represent cumulative figures and are not annualized.
Fund performance figures reflect fee waivers and/or expense reimbursements, without which the performance would have been lower.
|
| Total Annual Operating Expenses (unaudited) |
As of the Fund’s current prospectus dated March 1, 2020, the gross total annual fund operating expense ratios for Class A, Class A2, Class C, Class FI, Class R, Class I and Class IS shares were 1.23%, 1.40%, 1.94%, 1.34%, 1.59%, 1.00% and 0.88%, respectively.
Actual expenses may be higher. For example, expenses may be higher than those shown if average net assets decrease. Net assets are more likely to decrease and Fund expense ratios are more likely to increase when markets are volatile.
Q. What were the leading contributors to performance?
A. Stock selection in the Communication Services and Utilities sectors contributed to relative performance. Underweights to the Real Estate and Consumer Discretionary sectors and an overweight to the Financials sector also contributed positively to returns. In terms of individual securities, Covetrus Inc., Intra-Cellular Therapies Inc., K12 Inc., R1 RCM Inc. and Amicus Therapeutics Inc. were the top contributors to absolute returns.
Q. What were the leading detractors from performance?
A. Overall stock selection and sector allocation detracted from relative returns. In particular, stock selection in the Financials, Consumer Discretionary and Health Care sectors were the most detrimental. An underweight to the Health Care sector also detracted. At the security level, Amarin Corp. PLC, Summit Hotel Properties Inc., SkyWest Inc., Kite Realty Group Trust and Great Western Bancorp Inc. detracted the most from returns.
Q. Were there any significant changes to the Fund during the reporting period?
A. We made a number of changes to the Fund’s composition this reporting period, with notable initiated positions including Utz Brands Inc. in the Consumer Staples sector, Omnicell Inc. and Health Catalyst Inc. in the Health Care sector, RLJ Lodging Trust in the Real Estate sector, BRP Group Inc. in the Financials sector and Visteon Corp. in the Consumer Discretionary sector. Among the securities we sold, the largest were Summit Hotel Properties Inc. in the Real Estate sector, Great Western Bancorp Inc., ProAssurance Corp. and Cadence BanCorp in the Financials sector and U.S. Concrete Inc. in the Materials sector.
| | |
4 | | ClearBridge Small Cap Fund 2020 Annual Report |
Thank you for your investment in ClearBridge Small Cap Fund. As always, we appreciate that you have chosen us to manage your assets and we remain focused on achieving the Fund’s investment goals.
Sincerely,

Albert Grosman
Portfolio Manager
ClearBridge Investments, LLC

Brian Lund, CFA
Portfolio Manager
ClearBridge Investments, LLC
November 15, 2020
RISKS: Equity securities are subject to market and price fluctuations. Small-cap stocks involve greater risks and volatility than mid- and large-cap stocks. The managers’ investment style may become out of favor and/or the managers’ selection process may prove incorrect, which may have a negative impact on the Fund’s performance. The value approach to investing involves the risk that those stocks deemed to be undervalued by the portfolio managers may remain undervalued. The Fund may focus its investments in certain companies, industries or market sectors, increasing its vulnerability to market volatility. International investments are subject to special risks including currency fluctuations and social, economic and political uncertainties, which could increase volatility. These risks are magnified in emerging markets. Emerging markets countries tend to have economic, political and legal systems that are less developed and are less stable than those of more developed countries. Please see the Fund’s prospectus for a more complete discussion of these and other risks and the Fund’s investment strategies.
Portfolio holdings and breakdowns are as of October 31, 2020 and are subject to change and may not be representative of the portfolio managers’ current or future investments. The Fund’s top ten holdings (as a percentage of net assets) as of this date were: Gray Television Inc. (2.2%), R1 RCM Inc. (2.1%), Utz Brands Inc. (1.8%), Acadia Healthcare Co. Inc. (1.8%), Murphy USA Inc. (1.8%), Itron Inc. (1.7%), Black Hills Corp. (1.7%), Wintrust Financial Corp. (1.6%), Bank OZK (1.6%) and CommVault Systems Inc. (1.6%). Please refer to pages 12 through 17 for a list and percentage breakdown of the Fund’s holdings.
The mention of sector breakdowns is for informational purposes only and should not be construed as a recommendation to purchase or sell any securities. The information provided regarding such sectors is not a sufficient basis upon which to make an investment decision. Investors seeking financial advice regarding the appropriateness of investing in any securities or investment strategies discussed should consult their financial professional. The Fund’s top five sector holdings (as a percentage of net assets)
| | |
ClearBridge Small Cap Fund 2020 Annual Report | | 5 |
Fund overview (cont’d)
as of October 31, 2020 were: Financials (19.2%), Information Technology (18.1%), Health Care (17.2%), Industrials (12.1%) and Consumer Discretionary (9.7%). The Fund’s portfolio composition is subject to change at any time.
All investments are subject to risk including the possible loss of principal. Past performance is no guarantee of future results. All index performance reflects no deduction for fees, expenses or taxes. Please note that an investor cannot invest directly in an index.
The information provided is not intended to be a forecast of future events, a guarantee of future results or investment advice. Views expressed may differ from those of the firm as a whole.
| i | The Russell 2000 Index measures the performance of the small-cap segment of the U.S. equity universe. The Russell 2000 is a subset of the Russell 3000 Index representing approximately 10% of the total market capitalization of that index. It includes approximately 2,000 of the smallest securities based on a combination of their market cap and current index membership. The Russell 3000 Index measures the performance of the 3,000 largest U.S. companies based on total market capitalization, which represents approximately 98% of the U.S. equity market. |
| ii | The Russell 2000 Growth Index measures the performance of the small-cap growth segment of the U.S. equity universe. It includes those Russell 2000 Index companies with higher price-to-value ratios and higher forecasted growth values. |
| iii | The Russell 2000 Value Index measures the performance of those Russell 2000 Index companies with lower price-to-book ratios and lower forecasted growth values. (A price-to-book ratio is the price of a stock compared to the difference between a company’s assets and liabilities.) |
| iv | The S&P 500 Index is an unmanaged index of the stocks of 500 leading companies, and is generally representative of the performance of larger companies in the U.S. |
| v | The Federal Reserve Board (the “Fed”) is responsible for the formulation of U.S. policies designed to promote economic growth, full employment, stable prices and a sustainable pattern of international trade and payments. |
| vi | Real estate investment trusts (“REITs”) invest in real estate or loans secured by real estate and issue shares in such investments, which can be illiquid. |
| vii | Lipper, Inc., a wholly-owned subsidiary of Reuters, provides independent insight on global collective investments. Returns are based on the period ended October 31, 2020, including the reinvestment of all distributions, including returns of capital, if any, calculated among the 915 funds for the six-month period and among the 901 funds for the twelve-month period in the Fund’s Lipper category, and excluding sales charges, if any. |
| | |
6 | | ClearBridge Small Cap Fund 2020 Annual Report |
Fund at a glance† (unaudited)
Investment breakdown (%) as a percent of total investments
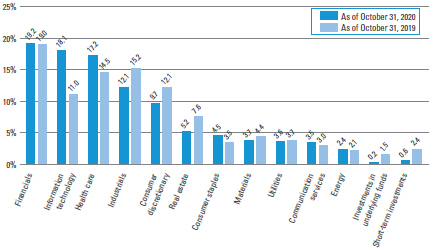
| † | The bar graph above represents the composition of the Fund’s investments as of October 31, 2020 and October 31, 2019. The Fund is actively managed. As a result, the composition of the Fund’s investments is subject to change at any time. |
| | |
| ClearBridge Small Cap Fund 2020 Annual Report | | 7 |
Fund expenses (unaudited)
Example
As a shareholder of the Fund, you may incur two types of costs: (1) transaction costs, including front-end and back-end sales charges (loads) on purchase payments; and (2) ongoing costs, including management fees; service and/or distribution (12b-1) fees; and other Fund expenses. This example is intended to help you understand your ongoing costs (in dollars) of investing in the Fund and to compare these costs with the ongoing costs of investing in other mutual funds.
This example is based on an investment of $1,000 invested on May 1, 2020 and held for the six months ended October 31, 2020.
Actual expenses
The table below titled “Based on Actual Total Return” provides information about actual account values and actual expenses. You may use the information provided in this table, together with the amount you invested, to estimate the expenses that you paid over the period. To estimate the expenses you paid on your account, divide your ending account value by $1,000 (for example, an $8,600 ending account value divided by $1,000 = 8.6), then multiply the result by the number under the heading entitled “Expenses Paid During the Period”.
Hypothetical example for comparison purposes
The table below titled “Based on Hypothetical Total Return” provides information about hypothetical account values and hypothetical expenses based on the actual expense ratio and an assumed rate of return of 5.00% per year before expenses, which is not the Fund’s actual return. The hypothetical account values and expenses may not be used to estimate the actual ending account balance or expenses you paid for the period. You may use the information provided in this table to compare the ongoing costs of investing in the Fund and other funds. To do so, compare the 5.00% hypothetical example relating to the Fund with the 5.00% hypothetical examples that appear in the shareholder reports of the other funds.
Please note that the expenses shown in the table below are meant to highlight your ongoing costs only and do not reflect any transactional costs, such as front-end or back-end sales charges (loads). Therefore, the table is useful in comparing ongoing costs only, and will not help you determine the relative total costs of owning different funds. In addition, if these transaction costs were included, your costs would have been higher.
| | | | | | | | | | | | | | | | | | | | | | | | | | | | | | | | | | | | | | | | | | | | | | |
| | |
| Based on actual total return1 | | | | | | Based on hypothetical total return1 | |
| | | Actual
Total Return
Without
Sales
Charge2 | | | Beginning
Account
Value | | | Ending
Account
Value | | | Annualized
Expense
Ratio | | | Expenses
Paid
During
the
Period3 | | | | | | | | Hypothetical
Annualized
Total Return | | | Beginning
Account
Value | | | Ending
Account
Value | | | Annualized
Expense
Ratio | | | Expenses
Paid
During
the
Period3 | |
| Class A | | | 13.28 | % | | | $1,000.00 | | | $ | 1,132.80 | | | | 1.06 | % | | $ | 5.68 | | | | | | | Class A | | | 5.00 | % | | $ | 1,000.00 | | | $ | 1,019.81 | | | | 1.06 | % | | $ | 5.38 | |
| Class A2 | | | 13.12 | | | | 1,000.00 | | | | 1,131.20 | | | | 1.30 | | | | 6.96 | | | | | | | Class A2 | | | 5.00 | | | | 1,000.00 | | | | 1,018.60 | | | | 1.30 | | | | 6.60 | |
| Class C | | | 12.83 | | | | 1,000.00 | | | | 1,128.30 | | | | 1.81 | | | | 9.68 | | | | | | | Class C | | | 5.00 | | | | 1,000.00 | | | | 1,016.04 | | | | 1.81 | | | | 9.17 | |
| Class FI | | | 13.22 | | | | 1,000.00 | | | | 1,132.20 | | | | 1.14 | | | | 6.11 | | | | | | | Class FI | | | 5.00 | | | | 1,000.00 | | | | 1,019.41 | | | | 1.14 | | | | 5.79 | |
| Class R | | | 13.02 | | | | 1,000.00 | | | | 1,130.20 | | | | 1.48 | | | | 7.92 | | | | | | | Class R | | | 5.00 | | | | 1,000.00 | | | | 1,017.70 | | | | 1.48 | | | | 7.51 | |
| Class I | | | 13.36 | | | | 1,000.00 | | | | 1,133.60 | | | | 0.87 | | | | 4.67 | | | | | | | Class I | | | 5.00 | | | | 1,000.00 | | | | 1,020.76 | | | | 0.87 | | | | 4.42 | |
| Class IS | | | 13.43 | | | | 1,000.00 | | | | 1,134.30 | | | | 0.74 | | | | 3.97 | | | | | | | Class IS | | | 5.00 | | | | 1,000.00 | | | | 1,021.42 | | | | 0.74 | | | | 3.76 | |
| | |
8 | | ClearBridge Small Cap Fund 2020 Annual Report |
| 1 | For the six months ended October 31, 2020. |
| 2 | Assumes the reinvestment of all distributions, including returns of capital, if any, at net asset value and does not reflect the deduction of the applicable sales charge with respect to Class A and Class A2 shares or the applicable contingent deferred sales charge (“CDSC”) with respect to Class C shares. Total return is not annualized, as it may not be representative of the total return for the year. Performance figures may reflect compensating balance arrangements, fee waivers and/or expense reimbursements. In the absence of compensating balance arrangements, fee waivers and/or expense reimbursements, the total return would have been lower. Past performance is no guarantee of future results. |
| 3 | Expenses (net of compensating balance arrangements, fee waivers and/or expense reimbursements) are equal to each class’ respective annualized expense ratio multiplied by the average account value over the period, multiplied by the number of days in the most recent fiscal half-year (184), then divided by 366. |
| | |
| ClearBridge Small Cap Fund 2020 Annual Report | | 9 |
Fund performance (unaudited)
| | | | | | | | | | | | | | | | | | | | | | | | | | | | |
| Average annual total returns | | | | | | | | | | | | | | | | | | | | | |
| Without sales charges1 | | Class A | | | Class A2 | | | Class C | | | Class FI | | | Class R | | | Class I | | | Class IS | |
| Twelve Months Ended 10/31/20 | | | -11.00 | % | | | -11.19 | % | | | -11.66 | % | | | -11.10 | % | | | -11.38 | % | | | -10.83 | % | | | -10.71 | % |
| Five Years Ended 10/31/20 | | | 5.87 | | | | 5.66 | | | | 5.09 | | | | 5.73 | | | | 5.51 | | | | 6.11 | | | | N/A | |
| Ten Years Ended 10/31/20 | | | 7.42 | | | | N/A | | | | 6.60 | | | | 7.25 | | | | 7.00 | | | | 7.66 | | | | N/A | |
| Inception* through 10/31/20 | | | — | | | | 5.40 | | | | — | | | | — | | | | — | | | | — | | | | 1.32 | |
| | | | | | | |
| With sales charges2 | | Class A | | | Class A2 | | | Class C | | | Class FI | | | Class R | | | Class I | | | Class IS | |
| Twelve Months Ended 10/31/20 | | | -16.11 | % | | | -16.30 | % | | | -12.51 | % | | | -11.10 | % | | | -11.38 | % | | | -10.83 | % | | | -10.71 | % |
| Five Years Ended 10/31/20 | | | 4.62 | | | | 4.41 | | | | 5.09 | | | | 5.73 | | | | 5.51 | | | | 6.11 | | | | N/A | |
| Ten Years Ended 10/31/20 | | | 6.79 | | | | N/A | | | | 6.60 | | | | 7.25 | | | | 7.00 | | | | 7.66 | | | | N/A | |
| Inception* through 10/31/20 | | | — | | | | 4.41 | | | | — | | | | — | | | | — | | | | — | | | | 1.32 | |
| | | | |
| Cumulative total returns | |
| Without sales charges1 | | | |
| Class A (10/31/10 through 10/31/20) | | | 104.57 | % |
| Class A2 (Inception date of 8/1/14 through 10/31/20) | | | 38.93 | |
| Class C (10/31/10 through 10/31/20) | | | 89.49 | |
| Class FI (10/31/10 through 10/31/20) | | | 101.38 | |
| Class R (10/31/10 through 10/31/20) | | | 96.64 | |
| Class I (10/31/10 through 10/31/20) | | | 109.19 | |
| Class IS (Inception date of 9/8/17 through 10/31/20) | | | 4.20 | |
All figures represent past performance and are not a guarantee of future results. Investment return and principal value of an investment will fluctuate so that an investor’s shares, when redeemed, may be worth more or less than their original cost. The returns shown do not reflect the deduction of taxes that a shareholder would pay on Fund distributions or the redemption of Fund shares. Performance figures may reflect compensating balance arrangements, fee waivers and/or expense reimbursements. In the absence of compensating balance arrangements, fee waivers and/or expense reimbursements, the total return would have been lower.
| 1 | Assumes the reinvestment of all distributions, including returns of capital, if any, at net asset value and does not reflect the deduction of the applicable sales charge with respect to Class A and Class A2 shares or the applicable contingent deferred sales charge (“CDSC”) with respect to Class C shares. |
| 2 | Assumes the reinvestment of all distributions, including returns of capital, if any, at net asset value. In addition, Class A and Class A2 shares reflect the deduction of the maximum initial sales charge of 5.75%. Class C shares reflect the deduction of a 1.00% CDSC, which applies if shares are redeemed within one year from purchase payment. |
| * | Inception dates for Class A, A2, C, FI, R, I and IS shares are February 3, 2009, August 1, 2014, December 30, 1985, July 30, 2004, December 28, 2006, December 1, 1994 and September 8, 2017, respectively. |
| | |
10 | | ClearBridge Small Cap Fund 2020 Annual Report |
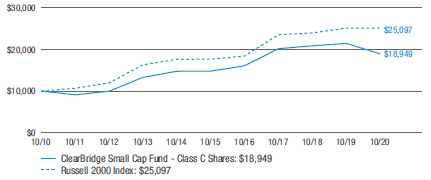
Historical performance
Value of $10,000 invested in
Class C Shares of ClearBridge Small Cap Fund vs. Russell 2000 Index† — October 2010 - October 2020
All figures represent past performance and are not a guarantee of future results. Investment return and principal value of an investment will fluctuate so that an investor’s shares, when redeemed, may be worth more or less than their original cost. The returns shown do not reflect the deduction of taxes that a shareholder would pay on Fund distributions or the redemption of Fund shares. Performance figures may reflect compensating balance arrangements, fee waivers and/or expense reimbursements. In the absence of compensating balance arrangements, fee waivers and/or expense reimbursements, the total return would have been lower.
| † | Hypothetical illustration of $10,000 invested in Class C shares of ClearBridge Small Cap Fund on October 31, 2010, assuming the reinvestment of all distributions, including returns of capital, if any, at net asset value through October 31, 2020. The hypothetical illustration also assumes a $10,000 investment in the Russell 2000 Index. The Russell 2000 Index (the “Index”) measures the performance of the small-cap segment of the U.S. equity market. This Index is unmanaged and is not subject to the same management and trading expenses as a mutual fund. Please note that an investor cannot invest directly in an index. The performance of the Fund’s other classes may be greater or less than the Class C shares’ performance indicated on this chart, depending on whether greater or lesser sales charges and fees were incurred by shareholders investing in these other classes. |
| | |
| ClearBridge Small Cap Fund 2020 Annual Report | | 11 |
Schedule of investments
October 31, 2020
ClearBridge Small Cap Fund
| | | | | | | | |
| Security | | Shares | | | Value | |
| Common Stocks — 99.0% | | | | | | | | |
| Communication Services — 3.5% | | | | | | | | |
Interactive Media & Services — 1.3% | | | | | | | | |
QuinStreet Inc. | | | 768,000 | | | $ | 12,291,840 | * |
Media — 2.2% | | | | | | | | |
Gray Television Inc. | | | 1,699,996 | | | | 21,555,949 | * |
Total Communication Services | | | | | | | 33,847,789 | |
| Consumer Discretionary — 9.7% | | | | | | | | |
Auto Components — 1.3% | | | | | | | | |
Visteon Corp. | | | 140,000 | | | | 12,551,000 | * |
Diversified Consumer Services — 2.1% | | | | | | | | |
frontdoor Inc. | | | 257,000 | | | | 10,182,340 | * |
K12 Inc. | | | 414,741 | | | | 9,899,868 | * |
Total Diversified Consumer Services | | | | | | | 20,082,208 | |
Hotels, Restaurants & Leisure — 1.1% | | | | | | | | |
Everi Holdings Inc. | | | 1,215,339 | | | | 10,464,069 | * |
Household Durables — 0.9% | | | | | | | | |
Century Communities Inc. | | | 240,000 | | | | 9,321,600 | * |
Specialty Retail — 4.3% | | | | | | | | |
Aaron’s Holdings Co. Inc. | | | 242,350 | | | | 12,665,211 | |
Lithia Motors Inc., Class A Shares | | | 54,500 | | | | 12,511,565 | |
Murphy USA Inc. | | | 140,677 | | | | 17,203,390 | * |
Total Specialty Retail | | | | | | | 42,380,166 | |
Total Consumer Discretionary | | | | | | | 94,799,043 | |
| Consumer Staples — 4.4% | | | | | | | | |
Food & Staples Retailing — 1.3% | | | | | | | | |
Sprouts Farmers Market Inc. | | | 691,999 | | | | 13,182,581 | * |
Food Products — 3.1% | | | | | | | | |
Sanderson Farms Inc. | | | 97,000 | | | | 12,413,090 | |
Utz Brands Inc. | | | 1,045,000 | | | | 17,723,200 | |
Total Food Products | | | | | | | 30,136,290 | |
Total Consumer Staples | | | | | | | 43,318,871 | |
| Energy — 2.4% | | | | | | | | |
Energy Equipment & Services — 0.5% | | | | | | | | |
Helmerich & Payne Inc. | | | 325,000 | | | | 4,832,750 | |
Oil, Gas & Consumable Fuels — 1.9% | | | | | | | | |
Brigham Minerals Inc., Class A Shares | | | 695,000 | | | | 6,129,900 | |
International Seaways Inc. | | | 882,000 | | | | 11,942,280 | |
Total Oil, Gas & Consumable Fuels | | | | | | | 18,072,180 | |
Total Energy | | | | | | | 22,904,930 | |
See Notes to Financial Statements.
| | |
12 | | ClearBridge Small Cap Fund 2020 Annual Report |
ClearBridge Small Cap Fund
| | | | | | | | |
| Security | | Shares | | | Value | |
| Financials — 19.2% | | | | | | | | |
Banks — 7.0% | | | | | | | | |
Bank OZK | | | 630,470 | | | $ | 15,623,047 | |
CVB Financial Corp. | | | 427,000 | | | | 7,472,500 | |
First Interstate BancSystem Inc., Class A Shares | | | 352,161 | | | | 12,431,283 | |
TriState Capital Holdings Inc. | | | 637,303 | | | | 8,023,645 | * |
WesBanco Inc. | | | 381,460 | | | | 9,265,663 | |
Wintrust Financial Corp. | | | 318,590 | | | | 15,684,186 | |
Total Banks | | | | | | | 68,500,324 | |
Capital Markets — 3.3% | | | | | | | | |
Blucora Inc. | | | 703,000 | | | | 6,994,850 | * |
Conx Corp. | | | 762,110 | | | | 7,560,131 | * |
Conyers Park II Acquisition Corp. | | | 1,279,975 | | | | 10,886,865 | *(a) |
Fortress Value Acquisition Corp., Class A Shares | | | 595,000 | | | | 6,610,450 | * |
Total Capital Markets | | | | | | | 32,052,296 | |
Consumer Finance — 3.0% | | | | | | | | |
Encore Capital Group Inc. | | | 355,000 | | | | 11,335,150 | * |
OneMain Holdings Inc. | | | 289,573 | | | | 10,103,202 | |
Oportun Financial Corp. | | | 552,600 | | | | 7,349,580 | * |
Total Consumer Finance | | | | | | | 28,787,932 | |
Diversified Financial Services — 1.4% | | | | | | | | |
East Resources Acquisition Co. | | | 708,110 | | | | 7,038,613 | * |
Healthcare Merger Corp., Class A Shares | | | 753,270 | | | | 6,369,508 | *(a) |
Total Diversified Financial Services | | | | | | | 13,408,121 | |
Insurance — 2.2% | | | | | | | | |
Assured Guaranty Ltd. | | | 340,003 | | | | 8,680,277 | |
BRP Group Inc., Class A Shares | | | 498,000 | | | | 12,699,000 | * |
Total Insurance | | | | | | | 21,379,277 | |
Thrifts & Mortgage Finance — 2.3% | | | | | | | | |
Essent Group Ltd. | | | 275,000 | | | | 10,958,750 | |
Washington Federal Inc. | | | 560,005 | | | | 11,922,506 | |
Total Thrifts & Mortgage Finance | | | | | | | 22,881,256 | |
Total Financials | | | | | | | 187,009,206 | |
| Health Care — 17.2% | | | | | | | | |
Biotechnology — 2.2% | | | | | | | | |
Amarin Corp. PLC, ADR | | | 2,089,996 | | | | 10,157,380 | * |
Amicus Therapeutics Inc. | | | 615,449 | | | | 10,973,456 | * |
Total Biotechnology | | | | | | | 21,130,836 | |
See Notes to Financial Statements.
| | |
| ClearBridge Small Cap Fund 2020 Annual Report | | 13 |
Schedule of investments (cont’d)
October 31, 2020
ClearBridge Small Cap Fund
| | | | | | | | |
| Security | | Shares | | | Value | |
Health Care Equipment & Supplies — 2.1% | | | | | | | | |
Lantheus Holdings Inc. | | | 650,000 | | | $ | 7,059,000 | * |
Quotient Ltd. | | | 2,914,656 | | | | 13,757,177 | * |
Total Health Care Equipment & Supplies | | | | | | | 20,816,177 | |
Health Care Providers & Services — 7.5% | | | | | | | | |
Acadia Healthcare Co. Inc. | | | 493,200 | | | | 17,582,580 | * |
Covetrus Inc. | | | 520,000 | | | | 12,838,800 | * |
Encompass Health Corp. | | | 120,000 | | | | 7,357,200 | |
HealthEquity Inc. | | | 285,000 | | | | 14,674,650 | * |
R1 RCM Inc. | | | 1,160,000 | | | | 20,787,200 | * |
Total Health Care Providers & Services | | | | | | | 73,240,430 | |
Health Care Technology — 2.6% | | | | | | | | |
Health Catalyst Inc. | | | 355,040 | | | | 12,241,779 | * |
Omnicell Inc. | | | 147,000 | | | | 12,722,850 | * |
Total Health Care Technology | | | | | | | 24,964,629 | |
Life Sciences Tools & Services — 1.1% | | | | | | | | |
Syneos Health Inc. | | | 209,253 | | | | 11,107,149 | * |
Pharmaceuticals — 1.7% | | | | | | | | |
Aerie Pharmaceuticals Inc. | | | 471,590 | | | | 5,003,570 | * |
Intra-Cellular Therapies Inc. | | | 456,000 | | | | 11,249,520 | * |
Total Pharmaceuticals | | | | | | | 16,253,090 | |
Total Health Care | | | | | | | 167,512,311 | |
| Industrials — 12.1% | | | | | | | | |
Aerospace & Defense — 0.9% | | | | | | | | |
Curtiss-Wright Corp. | | | 106,410 | | | | 8,976,748 | |
Airlines — 0.9% | | | | | | | | |
SkyWest Inc. | | | 300,000 | | | | 8,709,000 | |
Electrical Equipment — 1.0% | | | | | | | | |
EnerSys | | | 140,060 | | | | 10,028,296 | |
Machinery — 2.4% | | | | | | | | |
EnPro Industries Inc. | | | 205,000 | | | | 12,099,100 | |
Evoqua Water Technologies Corp. | | | 478,080 | | | | 10,962,374 | * |
Total Machinery | | | | | | | 23,061,474 | |
Professional Services — 1.1% | | | | | | | | |
ICF International Inc. | | | 163,002 | | | | 10,658,701 | |
Road & Rail — 0.9% | | | | | | | | |
Marten Transport Ltd. | | | 583,996 | | | | 8,961,419 | |
Trading Companies & Distributors — 4.9% | | | | | | | | |
Foundation Building Materials Inc. | | | 512,500 | | | | 7,462,000 | * |
GATX Corp. | | | 138,894 | | | | 9,483,682 | |
Rush Enterprises Inc., Class A Shares | | | 273,000 | | | | 9,784,320 | |
See Notes to Financial Statements.
| | |
14 | | ClearBridge Small Cap Fund 2020 Annual Report |
ClearBridge Small Cap Fund
| | | | | | | | |
| Security | | Shares | | | Value | |
Trading Companies & Distributors — continued | | | | | | | | |
Textainer Group Holdings Ltd. | | | 737,003 | | | $ | 10,657,063 | * |
Triton International Ltd. | | | 265,001 | | | | 9,773,237 | |
Total Trading Companies & Distributors | | | | | | | 47,160,302 | |
Total Industrials | | | | | | | 117,555,940 | |
| Information Technology — 18.1% | | | | | | | | |
Electronic Equipment, Instruments & Components — 3.4% | | | | | | | | |
Itron Inc. | | | 250,120 | | | | 16,995,654 | * |
Littelfuse Inc. | | | 43,500 | | | | 8,610,390 | |
nLIGHT Inc. | | | 330,000 | | | | 7,009,200 | * |
Total Electronic Equipment, Instruments & Components | | | | | | | 32,615,244 | |
IT Services — 5.7% | | | | | | | | |
CSG Systems International Inc. | | | 223,000 | | | | 8,447,240 | |
EVERTEC Inc. | | | 304,028 | | | | 10,118,052 | |
NIC Inc. | | | 465,000 | | | | 10,425,300 | |
Switch Inc., Class A Shares | | | 527,000 | | | | 7,409,620 | |
TTEC Holdings Inc. | | | 209,000 | | | | 11,449,020 | |
WNS Holdings Ltd., ADR | | | 133,004 | | | | 7,666,350 | * |
Total IT Services | | | | | | | 55,515,582 | |
Semiconductors & Semiconductor Equipment — 3.2% | | | | | | | | |
Advanced Energy Industries Inc. | | | 182,364 | | | | 12,304,099 | * |
Semtech Corp. | | | 137,002 | | | | 7,520,040 | * |
Tower Semiconductor Ltd. | | | 557,789 | | | | 11,769,348 | * |
Total Semiconductors & Semiconductor Equipment | | | | | | | 31,593,487 | |
Software — 5.8% | | | | | | | | |
2U Inc. | | | 340,919 | | | | 12,562,865 | * |
CommVault Systems Inc. | | | 388,000 | | | | 15,360,920 | * |
Pluralsight Inc., Class A Shares | | | 553,580 | | | | 8,691,206 | * |
Rapid7 Inc. | | | 181,000 | | | | 11,209,330 | * |
Sumo Logic Inc. | | | 119,840 | | | | 2,070,835 | * |
Vertex Inc., Class A Shares | | | 255,870 | | | | 6,202,289 | * |
Total Software | | | | | | | 56,097,445 | |
Total Information Technology | | | | | | | 175,821,758 | |
| Materials — 3.7% | | | | | | | | |
Chemicals — 1.2% | | | | | | | | |
Avient Corp. | | | 367,000 | | | | 11,402,690 | |
Containers & Packaging — 1.1% | | | | | | | | |
Silgan Holdings Inc. | | | 307,120 | | | | 10,580,284 | |
Metals & Mining — 1.4% | | | | | | | | |
Commercial Metals Co. | | | 660,000 | | | | 13,629,000 | |
Total Materials | | | | | | | 35,611,974 | |
See Notes to Financial Statements.
| | |
| ClearBridge Small Cap Fund 2020 Annual Report | | 15 |
Schedule of investments (cont’d)
October 31, 2020
ClearBridge Small Cap Fund
| | | | | | | | | | | | |
| Security | | | | | Shares | | | Value | |
| Real Estate — 5.1% | | | | | | | | | | | | |
Equity Real Estate Investment Trusts (REITs) — 5.1% | | | | | | | | | | | | |
Brandywine Realty Trust | | | | | | | 670,000 | | | | $ 5,869,200 | |
Kite Realty Group Trust | | | | | | | 804,550 | | | | 8,335,138 | |
Lexington Realty Trust | | | | | | | 1,338,433 | | | | 13,290,640 | |
Outfront Media Inc. | | | | | | | 493,970 | | | | 6,475,947 | |
Physicians Realty Trust | | | | | | | 635,000 | | | | 10,706,100 | |
RLJ Lodging Trust | | | | | | | 667,000 | | | | 5,456,060 | |
Total Real Estate | | | | | | | | | | | 50,133,085 | |
| Utilities — 3.6% | | | | | | | | | | | | |
Electric Utilities — 0.8% | | | | | | | | | | | | |
PNM Resources Inc. | | | | | | | 151,418 | | | | 7,570,900 | |
Independent Power and Renewable Electricity Producers — 1.1% | | | | | | | | | | | | |
NextEra Energy Partners LP | | | | | | | 178,910 | | | | 11,235,548 | |
Multi-Utilities — 1.7% | | | | | | | | | | | | |
Black Hills Corp. | | | | | | | 295,000 | | | | 16,714,700 | |
Total Utilities | | | | | | | | | | | 35,521,148 | |
Total Common Stocks (Cost — $877,384,840) | | | | 964,036,055 | |
| Investments in Underlying Funds — 0.3% | | | | | | | | | | | | |
PennantPark Investment Corp. (Cost — $5,480,715) | | | | | | | 824,987 | | | | 2,400,712 | (b) |
Total Investments before Short-Term Investments (Cost — $882,865,555) | | | | 966,436,767 | |
| | | |
| | | Rate | | | | | | | |
| Short-Term Investments — 0.6% | | | | | | | | | | | | |
JPMorgan 100% U.S. Treasury Securities Money Market Fund, Institutional Class | | | 0.006 | % | | | 4,446,712 | | | | 4,446,712 | |
Western Asset Premier Institutional U.S. Treasury Reserves, Premium Shares | | | 0.012 | % | | | 1,111,678 | | | | 1,111,678 | (c) |
Total Short-Term Investments (Cost — $5,558,390) | | | | | | | | | | | 5,558,390 | |
Total Investments — 99.9% (Cost — $888,423,945) | | | | | | | | | | | 971,995,157 | |
Other Assets in Excess of Liabilities — 0.1% | | | | | | | | | | | 1,431,054 | |
Total Net Assets — 100.0% | | | | | | | | | | $ | 973,426,211 | |
| * | Non-income producing security. |
| (a) | Security is valued in good faith in accordance with procedures approved by the Board of Trustees (Note 1). |
| (b) | Security is a business development company (Note 1). |
| (c) | In this instance, as defined in the Investment Company Act of 1940, an “Affiliated Company” represents Fund ownership of at least 5% of the outstanding voting securities of an issuer, or a company which is under common ownership or control with the Fund. At October 31, 2020, the total market value of investments in Affiliated Companies was $1,111,678 and the cost was $1,111,678 (Note 8). |
See Notes to Financial Statements.
| | |
16 | | ClearBridge Small Cap Fund 2020 Annual Report |
ClearBridge Small Cap Fund
| | |
Abbreviation(s) used in this schedule: |
| |
| ADR | | — American Depositary Receipts |
See Notes to Financial Statements.
| | |
| ClearBridge Small Cap Fund 2020 Annual Report | | 17 |
Statement of assets and liabilities
October 31, 2020
| | | | |
| |
| Assets: | | | | |
Investments in unaffiliated securities, at value (Cost — $887,312,267) | | $ | 970,883,479 | |
Investments in affiliated securities, at value (Cost — $1,111,678) | | | 1,111,678 | |
Receivable for securities sold | | | 8,565,624 | |
Receivable for Fund shares sold | | | 1,930,870 | |
Dividends and interest receivable | | | 158,498 | |
Other assets | | | 10,303 | |
Prepaid expenses | | | 47,977 | |
Total Assets | | | 982,708,429 | |
| |
| Liabilities: | | | | |
Payable for securities purchased | | | 7,621,100 | |
Payable for Fund shares repurchased | | | 711,406 | |
Investment management fee payable | | | 607,059 | |
Service and/or distribution fees payable | | | 113,207 | |
Trustees’ fees payable | | | 9,644 | |
Accrued expenses | | | 219,802 | |
Total Liabilities | | | 9,282,218 | |
| Total Net Assets | | $ | 973,426,211 | |
| |
| Net Assets: | | | | |
Par value (Note 7) | | $ | 230 | |
Paid-in capital in excess of par value | | | 980,242,850 | |
Total distributable earnings (loss) | | | (6,816,869) | |
| Total Net Assets | | $ | 973,426,211 | |
See Notes to Financial Statements.
| | |
18 | | ClearBridge Small Cap Fund 2020 Annual Report |
| | | | |
| |
| Net Assets: | | | | |
Class A | | | $293,531,592 | |
Class A2 | | | $52,253,144 | |
Class C | | | $38,124,402 | |
Class FI | | | $2,161,724 | |
Class R | | | $5,034,531 | |
Class I | | | $389,844,244 | |
Class IS | | | $192,476,574 | |
| Shares Outstanding: | | | | |
Class A | | | 8,870,039 | |
Class A2 | | | 1,599,068 | |
Class C | | | 1,246,685 | |
Class FI | | | 43,688 | |
Class R | | | 104,926 | |
Class I | | | 7,435,117 | |
Class IS | | | 3,659,575 | |
| Net Asset Value: | | | | |
Class A (and redemption price) | | | $33.09 | |
Class A2 (and redemption price) | | | $32.68 | |
Class C* | | | $30.58 | |
Class FI (and redemption price) | | | $49.48 | |
Class R (and redemption price) | | | $47.98 | |
Class I (and redemption price) | | | $52.43 | |
Class IS (and redemption price) | | | $52.60 | |
| Maximum Public Offering Price Per Share: | | | | |
Class A (based on maximum initial sales charge of 5.75%) | | | $35.11 | |
Class A2 (based on maximum initial sales charge of 5.75%) | | | $34.67 | |
| * | Redemption price per share is NAV of Class C shares reduced by a 1.00% CDSC if shares are redeemed within one year from purchase payment (Note 2). |
See Notes to Financial Statements.
| | |
| ClearBridge Small Cap Fund 2020 Annual Report | | 19 |
Statement of operations
For the Year Ended October 31, 2020
| | | | |
| |
| Investment Income: | | | | |
Dividends | | $ | 15,718,886 | |
Interest from unaffiliated investments | | | 225,136 | |
Interest from affiliated investments | | | 41,956 | |
Total Investment Income | | | 15,985,978 | |
| |
| Expenses: | | | | |
Investment management fee (Note 2) | | | 7,552,904 | |
Service and/or distribution fees (Notes 2 and 5) | | | 1,502,351 | |
Transfer agent fees (Note 5) | | | 1,066,098 | |
Trustees’ fees | | | 178,155 | |
Registration fees | | | 139,308 | |
Legal fees | | | 102,254 | |
Fund accounting fees | | | 78,256 | |
Audit and tax fees | | | 51,374 | |
Shareholder reports | | | 32,468 | |
Custody fees | | | 11,892 | |
Insurance | | | 11,678 | |
Miscellaneous expenses | | | 12,483 | |
Total Expenses | | | 10,739,221 | |
Less: Fee waivers and/or expense reimbursements (Notes 2 and 5) | | | (224,414) | |
Net Expenses | | | 10,514,807 | |
| Net Investment Income | | | 5,471,171 | |
| |
| Realized and Unrealized Loss on Investments (Notes 1 and 3): | | | | |
Net Realized Loss From Unaffiliated Investment Transactions | | | (87,794,996) | |
Change in Net Unrealized Appreciation (Depreciation) From Unaffiliated Investments | | | (49,598,105) | |
| Net Loss on Investments | | | (137,393,101) | |
| Decrease in Net Assets From Operations | | $ | (131,921,930) | |
See Notes to Financial Statements.
| | |
20 | | ClearBridge Small Cap Fund 2020 Annual Report |
Statements of changes in net assets
| | | | | | | | | | |
| For the Years Ended October 31, | | 2020 | | 2019 |
| | |
| Operations: | | | | | | | | | | |
Net investment income | | | $ | 5,471,171 | | | | $ | 4,461,062 | |
Net realized gain (loss) | | | | (87,794,996) | | | | | 39,447,200 | |
Change in net unrealized appreciation (depreciation) | | | | (49,598,105) | | | | | (983,694) | |
Increase (Decrease) in Net Assets From Operations | | | | (131,921,930) | | | | | 42,924,568 | |
| | |
| Distributions to Shareholders From (Notes 1 and 6): | | | | | | | | | | |
Total distributable earnings | | | | (45,772,332) | | | | | (92,730,059) | |
Decrease in Net Assets From Distributions to Shareholders | | | | (45,772,332) | | | | | (92,730,059) | |
| | |
| Fund Share Transactions (Note 7): | | | | | | | | | | |
Net proceeds from sale of shares | | | | 363,081,546 | | | | | 724,642,299 | |
Reinvestment of distributions | | | | 39,832,148 | | | | | 89,339,047 | |
Cost of shares repurchased | | | | (470,473,465) | | | | | (623,157,479) | |
Increase (Decrease) in Net Assets From Fund Share Transactions | | | | (67,559,771) | | | | | 190,823,867 | |
Increase (Decrease) in Net Assets | | | | (245,254,033) | | | | | 141,018,376 | |
| | |
| Net Assets: | | | | | | | | | | |
Beginning of year | | | | 1,218,680,244 | | | | | 1,077,661,868 | |
End of year | | | $ | 973,426,211 | | | | $ | 1,218,680,244 | |
See Notes to Financial Statements.
| | |
| ClearBridge Small Cap Fund 2020 Annual Report | | 21 |
Financial highlights
| | | | | | | | | | | | | | | | | | | | |
| For a share of each class of beneficial interest outstanding throughout each year ended October 31: | |
| Class A Shares1 | | 2020 | | | 2019 | | | 2018 | | | 2017 | | | 2016 | |
| | | | | |
| Net asset value, beginning of year | | $ | 38.90 | | | $ | 41.95 | | | $ | 42.96 | | | $ | 35.05 | | | $ | 33.68 | |
| | | | | |
| Income (loss) from operations: | | | | | | | | | | | | | | | | | | | | |
Net investment income | | | 0.14 | | | | 0.16 | | | | 0.01 | | | | 0.02 | | | | 0.10 | |
Net realized and unrealized gain (loss) | | | (4.14) | | | | 1.04 | | | | 1.59 | | | | 9.14 | | | | 2.95 | |
Total income (loss) from operations | | | (4.00) | | | | 1.20 | | | | 1.60 | | | | 9.16 | | | | 3.05 | |
| | | | | |
| Less distributions from: | | | | | | | | | | | | | | | | | | | | |
Net investment income | | | (0.20) | | | | — | | | | — | | | | — | | | | — | |
Net realized gains | | | (1.61) | | | | (4.25) | | | | (2.61) | | | | (1.25) | | | | (1.68) | |
Total distributions | | | (1.81) | | | | (4.25) | | | | (2.61) | | | | (1.25) | | | | (1.68) | |
| | | | | |
| Net asset value, end of year | | $ | 33.09 | | | $ | 38.90 | | | $ | 41.95 | | | $ | 42.96 | | | $ | 35.05 | |
Total return2 | | | (11.00) | % | | | 3.52 | % | | | 4.10 | % | | | 26.51 | % | | | 9.60 | % |
| | | | | |
| Net assets, end of year (000s) | | $ | 293,532 | | | $ | 374,614 | | | $ | 125,709 | | | $ | 138,533 | | | $ | 62,783 | |
| | | | | |
| Ratios to average net assets: | | | | | | | | | | | | | | | | | | | | |
Gross expenses | | | 1.09 | % | | | 1.10 | % | | | 1.11 | % | | | 1.09 | % | | | 1.07 | % |
Net expenses3,4 | | | 1.07 | | | | 1.08 | | | | 1.09 | | | | 1.07 | | | | 1.05 | |
Net investment income | | | 0.41 | | | | 0.41 | | | | 0.03 | | | | 0.06 | | | | 0.29 | |
| | | | | |
| Portfolio turnover rate | | | 49 | % | | | 38 | % | | | 48 | % | | | 47 | %5 | | | 35 | % |
| 1 | Per share amounts have been calculated using the average shares method. |
| 2 | Performance figures, exclusive of sales charges, may reflect compensating balance arrangements, fee waivers and/or expense reimbursements. In the absence of compensating balance arrangements, fee waivers and/or expense reimbursements, the total return would have been lower. Past performance is no guarantee of future results. |
| 3 | Reflects fee waivers and/or expense reimbursements. |
| 4 | The manager has agreed to waive the Fund’s management fee to an extent sufficient to offset the net management fee payable in connection with any investment in an affiliated money market fund. |
| 5 | Excludes securities delivered as a result of a redemption in-kind. |
See Notes to Financial Statements.
| | |
22 | | ClearBridge Small Cap Fund 2020 Annual Report |
| | | | | | | | | | | | | | | | | | | | |
| For a share of each class of beneficial interest outstanding throughout each year ended October 31: | |
| Class A2 Shares1 | | 2020 | | | 2019 | | | 2018 | | | 2017 | | | 2016 | |
| | | | | |
| Net asset value, beginning of year | | | $38.45 | | | | $41.58 | | | | $42.68 | | | | $34.90 | | | | $33.61 | |
| | | | | |
| Income (loss) from operations: | | | | | | | | | | | | | | | | | | | | |
Net investment income (loss) | | | 0.06 | | | | 0.08 | | | | (0.09) | | | | (0.10) | | | | 0.01 | |
Net realized and unrealized gain (loss) | | | (4.09) | | | | 1.04 | | | | 1.60 | | | | 9.13 | | | | 2.96 | |
Total income (loss) from operations | | | (4.03) | | | | 1.12 | | | | 1.51 | | | | 9.03 | | | | 2.97 | |
| | | | | |
| Less distributions from: | | | | | | | | | | | | | | | | | | | | |
Net investment income | | | (0.13) | | | | — | | | | — | | | | — | | | | — | |
Net realized gains | | | (1.61) | | | | (4.25) | | | | (2.61) | | | | (1.25) | | | | (1.68) | |
Total distributions | | | (1.74) | | | | (4.25) | | | | (2.61) | | | | (1.25) | | | | (1.68) | |
| | | | | |
| Net asset value, end of year | | | $32.68 | | | | $38.45 | | | | $41.58 | | | | $42.68 | | | | $34.90 | |
Total return2 | | | (11.19) | % | | | 3.34 | % | | | 3.91 | % | | | 26.25 | % | | | 9.37 | % |
| | | | | |
| Net assets, end of year (000s) | | | $52,253 | | | | $43,010 | | | | $26,374 | | | | $10,776 | | | | $1,474 | |
| | | | | |
| Ratios to average net assets: | | | | | | | | | | | | | | | | | | | | |
Gross expenses | | | 1.29 | % | | | 1.29 | %3 | | | 1.31 | %3 | | | 1.41 | %3 | | | 1.68 | % |
Net expenses4,5 | | | 1.27 | | | | 1.27 | 3 | | | 1.29 | 3 | | | 1.29 | 3 | | | 1.29 | |
Net investment income (loss) | | | 0.19 | | | | 0.20 | | | | (0.21) | | | | (0.24) | | | | 0.03 | |
| | | | | |
| Portfolio turnover rate | | | 49 | % | | | 38 | % | | | 48 | % | | | 47 | %6 | | | 35 | % |
| 1 | Per share amounts have been calculated using the average shares method. |
| 2 | Performance figures, exclusive of sales charges, may reflect compensating balance arrangements, fee waivers and/or expense reimbursements. In the absence of compensating balance arrangements, fee waivers and/or expense reimbursements, the total return would have been lower. Past performance is no guarantee of future results. |
| 3 | Reflects recapture of fees waived and/or expenses reimbursed from prior fiscal years. |
| 4 | Reflects fee waivers and/or expense reimbursements. |
| 5 | As a result of a voluntary expense limitation arrangement, the ratio of total annual fund operating expenses, other than interest, brokerage commissions, dividend expense on short sales, taxes, extraordinary expenses and acquired fund fees and expenses, to average net assets of Class A2 shares did not exceed 1.29%. This voluntary expense limitation arrangement is expected to continue until December 31, 2022, but may be terminated at any time by the manager. In addition, the manager has agreed to waive the Fund’s management fee to an extent sufficient to offset the net management fee payable in connection with any investment in an affiliated money market fund. |
| 6 | Excludes securities delivered as a result of a redemption in-kind. |
See Notes to Financial Statements.
| | |
| ClearBridge Small Cap Fund 2020 Annual Report | | 23 |
Financial highlights (cont’d)
| | | | | | | | | | | | | | | | | | | | |
| For a share of each class of beneficial interest outstanding throughout each year ended October 31: | |
| Class C Shares1 | | 2020 | | | 2019 | | | 2018 | | | 2017 | | | 2016 | |
| | | | | |
| Net asset value, beginning of year | | | $36.16 | | | | $39.54 | | | | $40.92 | | | | $33.69 | | | | $32.68 | |
| | | | | |
| Income (loss) from operations: | | | | | | | | | | | | | | | | | | | | |
Net investment loss | | | (0.10) | | | | (0.12) | | | | (0.27) | | | | (0.23) | | | | (0.16) | |
Net realized and unrealized gain (loss) | | | (3.87) | | | | 0.99 | | | | 1.50 | | | | 8.71 | | | | 2.85 | |
Total income (loss) from operations | | | (3.97) | | | | 0.87 | | | | 1.23 | | | | 8.48 | | | | 2.69 | |
| | | | | |
| Less distributions from: | | | | | | | | | | | | | | | | | | | | |
Net realized gains | | | (1.61) | | | | (4.25) | | | | (2.61) | | | | (1.25) | | | | (1.68) | |
Total distributions | | | (1.61) | | | | (4.25) | | | | (2.61) | | | | (1.25) | | | | (1.68) | |
| | | | | |
| Net asset value, end of year | | | $30.58 | | | | $36.16 | | | | $39.54 | | | | $40.92 | | | | $33.69 | |
Total return2 | | | (11.66) | % | | | 2.83 | % | | | 3.36 | % | | | 25.54 | % | | | 8.75 | % |
| | | | | |
| Net assets, end of year (000s) | | | $38,124 | | | | $76,816 | | | | $386,146 | | | | $441,601 | | | | $418,166 | |
| | | | | |
| Ratios to average net assets: | | | | | | | | | | | | | | | | | | | | |
Gross expenses | | | 1.85 | % | | | 1.81 | % | | | 1.82 | % | | | 1.84 | % | | | 1.86 | % |
Net expenses3,4 | | | 1.83 | | | | 1.79 | | | | 1.80 | | | | 1.82 | | | | 1.84 | |
Net investment loss | | | (0.32) | | | | (0.34) | | | | (0.68) | | | | (0.61) | | | | (0.49) | |
| | | | | |
| Portfolio turnover rate | | | 49 | % | | | 38 | % | | | 48 | % | | | 47 | %5 | | | 35 | % |
| 1 | Per share amounts have been calculated using the average shares method. |
| 2 | Performance figures, exclusive of CDSC, may reflect compensating balance arrangements, fee waivers and/or expense reimbursements. In the absence of compensating balance arrangements, fee waivers and/or expense reimbursements, the total return would have been lower. Past performance is no guarantee of future results. |
| 3 | Reflects fee waivers and/or expense reimbursements. |
| 4 | The manager has agreed to waive the Fund’s management fee to an extent sufficient to offset the net management fee payable in connection with any investment in an affiliated money market fund. |
| 5 | Excludes securities delivered as a result of a redemption in-kind. |
See Notes to Financial Statements.
| | |
24 | | ClearBridge Small Cap Fund 2020 Annual Report |
| | | | | | | | | | | | | | | | | | | | |
| For a share of each class of beneficial interest outstanding throughout each year ended October 31: | |
| Class FI Shares1 | | 2020 | | | 2019 | | | 2018 | | | 2017 | | | 2016 | |
| | | | | |
| Net asset value, beginning of year | | | $57.24 | | | | $59.73 | | | | $60.11 | | | | $48.70 | | | | $46.17 | |
| | | | | |
| Income (loss) from operations: | | | | | | | | | | | | | | | | | | | | |
Net investment income (loss) | | | 0.17 | | | | 0.15 | | | | (0.06) | | | | 0.07 | | | | (0.00) | 2 |
Net realized and unrealized gain (loss) | | | (6.27) | | | | 1.61 | | | | 2.29 | | | | 12.59 | | | | 4.21 | |
Total income (loss) from operations | | | (6.10) | | | | 1.76 | | | | 2.23 | | | | 12.66 | | | | 4.21 | |
| | | | | |
| Less distributions from: | | | | | | | | | | | | | | | | | | | | |
Net investment income | | | (0.05) | | | | — | | | | — | | | | — | | | | — | |
Net realized gains | | | (1.61) | | | | (4.25) | | | | (2.61) | | | | (1.25) | | | | (1.68) | |
Total distributions | | | (1.66) | | | | (4.25) | | | | (2.61) | | | | (1.25) | | | | (1.68) | |
| | | | | |
| Net asset value, end of year | | | $49.48 | | | | $57.24 | | | | $59.73 | | | | $60.11 | | | | $48.70 | |
Total return3 | | | (11.10) | % | | | 3.40 | % | | | 3.98 | % | | | 26.29 | % | | | 9.47 | % |
| | | | | |
| Net assets, end of year (000s) | | | $2,162 | | | | $3,707 | | | | $3,649 | | | | $3,756 | | | | $10,014 | |
| | | | | |
| Ratios to average net assets: | | | | | | | | | | | | | | | | | | | | |
Gross expenses | | | 1.19 | % | | | 1.21 | % | | | 1.24 | % | | | 1.19 | % | | | 1.12 | % |
Net expenses4,5 | | | 1.17 | | | | 1.19 | | | | 1.22 | | | | 1.17 | | | | 1.10 | |
Net investment income (loss) | | | 0.33 | | | | 0.27 | | | | (0.11) | | | | 0.13 | | | | (0.01) | |
| | | | | |
| Portfolio turnover rate | | | 49 | % | | | 38 | % | | | 48 | % | | | 47 | %6 | | | 35 | % |
| 1 | Per share amounts have been calculated using the average shares method. |
| 2 | Amount represents less than $0.005 per share. |
| 3 | Performance figures may reflect compensating balance arrangements, fee waivers and/or expense reimbursements. In the absence of compensating balance arrangements, fee waivers and/or expense reimbursements, the total return would have been lower. Past performance is no guarantee of future results. |
| 4 | Reflects fee waivers and/or expense reimbursements. |
| 5 | The manager has agreed to waive the Fund’s management fee to an extent sufficient to offset the net management fee payable in connection with any investment in an affiliated money market fund. |
| 6 | Excludes securities delivered as a result of a redemption in-kind. |
See Notes to Financial Statements.
| | |
| ClearBridge Small Cap Fund 2020 Annual Report | | 25 |
Financial highlights (cont’d)
| | | | | | | | | | | | | | | | | | | | |
| For a share of each class of beneficial interest outstanding throughout each year ended October 31: | |
| Class R Shares1 | | 2020 | | | 2019 | | | 2018 | | | 2017 | | | 2016 | |
| | | | | |
| Net asset value, beginning of year | | | $55.68 | | | | $58.35 | | | | $58.89 | | | | $47.74 | | | | $45.43 | |
| | | | | |
| Income (loss) from operations: | | | | | | | | | | | | | | | | | | | | |
Net investment income (loss) | | | 0.00 | 2 | | | 0.02 | | | | (0.17) | | | | (0.08) | | | | (0.04) | |
Net realized and unrealized gain (loss) | | | (6.09) | | | | 1.56 | | | | 2.24 | | | | 12.48 | | | | 4.03 | |
Total income (loss) from operations | | | (6.09) | | | | 1.58 | | | | 2.07 | | | | 12.40 | | | | 3.99 | |
| | | | | |
| Less distributions from: | | | | | | | | | | | | | | | | | | | | |
Net realized gains | | | (1.61) | | | | (4.25) | | | | (2.61) | | | | (1.25) | | | | (1.68) | |
Total distributions | | | (1.61) | | | | (4.25) | | | | (2.61) | | | | (1.25) | | | | (1.68) | |
| | | | | |
| Net asset value, end of year | | | $47.98 | | | | $55.68 | | | | $58.35 | | | | $58.89 | | | | $47.74 | |
Total return3 | | | (11.38) | % | | | 3.16 | % | | | 3.80 | % | | | 26.23 | % | | | 9.17 | % |
| | | | | |
| Net assets, end of year (000s) | | | $5,035 | | | | $7,200 | | | | $7,745 | | | | $5,920 | | | | $3,388 | |
| | | | | |
| Ratios to average net assets: | | | | | | | | | | | | | | | | | | | | |
Gross expenses | | | 1.50 | % | | | 1.46 | % | | | 1.43 | % | | | 1.46 | % | | | 1.46 | % |
Net expenses4,5 | | | 1.48 | | | | 1.44 | | | | 1.41 | | | | 1.28 | | | | 1.44 | |
Net investment income (loss) | | | 0.01 | | | | 0.04 | | | | (0.30) | | | | (0.14) | | | | (0.10) | |
| | | | | |
| Portfolio turnover rate | | | 49 | % | | | 38 | % | | | 48 | % | | | 47 | %6 | | | 35 | % |
| 1 | Per share amounts have been calculated using the average shares method. |
| 2 | Amount represents less than $0.005 per share. |
| 3 | Performance figures may reflect compensating balance arrangements, fee waivers and/or expense reimbursements. In the absence of compensating balance arrangements, fee waivers and/or expense reimbursements, the total return would have been lower. Past performance is no guarantee of future results. |
| 4 | Reflects fee waivers and/or expense reimbursements. |
| 5 | The manager has agreed to waive the Fund’s management fee to an extent sufficient to offset the net management fee payable in connection with any investment in an affiliated money market fund. |
| 6 | Excludes securities delivered as a result of a redemption in-kind. |
See Notes to Financial Statements.
| | |
26 | | ClearBridge Small Cap Fund 2020 Annual Report |
| | | | | | | | | | | | | | | | | | | | |
| For a share of each class of beneficial interest outstanding throughout each year ended October 31: | |
| Class I Shares1 | | 2020 | | | 2019 | | | 2018 | | | 2017 | | | 2016 | |
| | | | | |
| Net asset value, beginning of year | | $ | 60.56 | | | $ | 62.73 | | | $ | 62.77 | | | $ | 50.60 | | | $ | 47.76 | |
| | | | | |
| Income (loss) from operations: | | | | | | | | | | | | | | | | | | | | |
Net investment income | | | 0.33 | | | | 0.38 | | | | 0.17 | | | | 0.18 | | | | 0.25 | |
Net realized and unrealized gain (loss) | | | (6.61) | | | | 1.70 | | | | 2.40 | | | | 13.24 | | | | 4.27 | |
Total income (loss) from operations | | | (6.28) | | | | 2.08 | | | | 2.57 | | | | 13.42 | | | | 4.52 | |
| | | | | |
| Less distributions from: | | | | | | | | | | | | | | | | | | | | |
Net investment income | | | (0.24) | | | | — | | | | — | | | | — | | | | — | |
Net realized gains | | | (1.61) | | | | (4.25) | | | | (2.61) | | | | (1.25) | | | | (1.68) | |
Total distributions | | | (1.85) | | | | (4.25) | | | | (2.61) | | | | (1.25) | | | | (1.68) | |
| | | | | |
| Net asset value, end of year | | $ | 52.43 | | | $ | 60.56 | | | $ | 62.73 | | | $ | 62.77 | | | $ | 50.60 | |
Total return2 | | | (10.83) | % | | | 3.77 | % | | | 4.36 | % | | | 26.79 | % | | | 9.86 | % |
| | | | | |
| Net assets, end of year (millions) | | $ | 390 | | | $ | 490 | | | $ | 316 | | | $ | 224 | | | $ | 131 | |
| | | | | |
| Ratios to average net assets: | | | | | | | | | | | | | | | | | | | | |
Gross expenses | | | 0.89 | % | | | 0.87 | % | | | 0.86 | % | | | 0.87 | % | | | 0.84 | % |
Net expenses3,4 | | | 0.87 | | | | 0.85 | | | | 0.84 | | | | 0.85 | | | | 0.82 | |
Net investment income | | | 0.62 | | | | 0.63 | | | | 0.26 | | | | 0.31 | | | | 0.52 | |
| | | | | |
| Portfolio turnover rate | | | 49 | % | | | 38 | % | | | 48 | % | | | 47 | %5 | | | 35 | % |
| 1 | Per share amounts have been calculated using the average shares method. |
| 2 | Performance figures may reflect compensating balance arrangements, fee waivers and/or expense reimbursements. In the absence of compensating balance arrangements, fee waivers and/or expense reimbursements, the total return would have been lower. Past performance is no guarantee of future results. |
| 3 | Reflects fee waivers and/or expense reimbursements. |
| 4 | The manager has agreed to waive the Fund’s management fee to an extent sufficient to offset the net management fee payable in connection with any investment in an affiliated money market fund. |
| 5 | Excludes securities delivered as a result of a redemption in-kind. |
See Notes to Financial Statements.
| | |
| ClearBridge Small Cap Fund 2020 Annual Report | | 27 |
Financial highlights (cont’d)
| | | | | | | | | | | | | | | | |
For a share of each class of beneficial interest outstanding throughout each year ended October 31, unless
otherwise noted: | |
| Class IS Shares1 | | 2020 | | | 2019 | | | 2018 | | | 20172 | |
| | | | |
| Net asset value, beginning of year | | | $60.71 | | | | $62.82 | | | | $62.78 | | | | $58.39 | |
| | | | |
| Income (loss) from operations: | | | | | | | | | | | | | | | | |
Net investment income | | | 0.39 | | | | 0.44 | | | | 0.24 | | | | 0.01 | |
Net realized and unrealized gain (loss) | | | (6.59) | | | | 1.70 | | | | 2.41 | | | | 4.38 | |
Total income (loss) from operations | | | (6.20) | | | | 2.14 | | | | 2.65 | | | | 4.39 | |
| | | | |
| Less distributions from: | | | | | | | | | | | | | | | | |
Net investment income | | | (0.30) | | | | — | | | | — | | | | — | |
Net realized gains | | | (1.61) | | | | (4.25) | | | | (2.61) | | | | — | |
Total distributions | | | (1.91) | | | | (4.25) | | | | (2.61) | | | | — | |
| | | | |
| Net asset value, end of year | | | $52.60 | | | | $60.71 | | | | $62.82 | | | | $62.78 | |
Total return3 | | | (10.71) | % | | | 3.86 | % | | | 4.50 | % | | | 7.52 | % |
| | | | |
| Net assets, end of year (millions) | | | $192 | | | | $223 | | | | $212 | | | | $217 | |
| | | | |
| Ratios to average net assets: | | | | | | | | | | | | | | | | |
Gross expenses | | | 0.76 | % | | | 0.75 | % | | | 0.75 | % | | | 0.81 | %4 |
Net expenses5,6 | | | 0.74 | | | | 0.73 | | | | 0.73 | | | | 0.79 | 4 |
Net investment income | | | 0.72 | | | | 0.74 | | | | 0.38 | | | | 0.17 | 4 |
| | | | |
| Portfolio turnover rate | | | 49 | % | | | 38 | % | | | 48 | % | | | 47 | %7,8 |
| 1 | Per share amounts have been calculated using the average shares method. |
| 2 | For the period September 8, 2017 (inception date) to October 31, 2017. |
| 3 | Performance figures may reflect compensating balance arrangements, fee waivers and/or expense reimbursements. In the absence of compensating balance arrangements, fee waivers and/or expense reimbursements, the total return would have been lower. Past performance is no guarantee of future results. Total returns for periods of less than one year are not annualized. |
| 5 | Reflects fee waivers and/or expense reimbursements. |
| 6 | As a result of an expense limitation arrangement, the ratio of total annual fund operating expenses for Class IS shares did not exceed the ratio of total annual fund operating expenses for Class I shares. This expense limitation arrangement cannot be terminated prior to December 31, 2022 without the Board of Trustees’ consent. In addition, the manager has agreed to waive the Fund’s management fee to an extent sufficient to offset the net management fee payable in connection with any investment in an affiliated money market fund. |
| 7 | Excludes securities delivered as a result of a redemption in-kind. |
| 8 | For the year ended October 31, 2017. |
See Notes to Financial Statements.
| | |
28 | | ClearBridge Small Cap Fund 2020 Annual Report |
Notes to financial statements
1. Organization and significant accounting policies
ClearBridge Small Cap Fund (the “Fund”) is a separate diversified investment series of Legg Mason Global Asset Management Trust (the “Trust”). The Trust, a Maryland statutory trust, is registered under the Investment Company Act of 1940, as amended (the “1940 Act”), as an open-end management investment company.
The following are significant accounting policies consistently followed by the Fund and are in conformity with U.S. generally accepted accounting principles (“GAAP”). Estimates and assumptions are required to be made regarding assets, liabilities and changes in net assets resulting from operations when financial statements are prepared. Changes in the economic environment, financial markets and any other parameters used in determining these estimates could cause actual results to differ. Subsequent events have been evaluated through the date the financial statements were issued.
(a) Investment valuation. Equity securities for which market quotations are available are valued at the last reported sales price or official closing price on the primary market or exchange on which they trade. The valuations for fixed income securities (which may include, but are not limited to, corporate, government, municipal, mortgage-backed, collateralized mortgage obligations and asset-backed securities) and certain derivative instruments are typically the prices supplied by independent third party pricing services, which may use market prices or broker/dealer quotations or a variety of valuation techniques and methodologies. The independent third party pricing services use inputs that are observable such as issuer details, interest rates, yield curves, prepayment speeds, credit risks/spreads, default rates and quoted prices for similar securities. Investments in open-end funds are valued at the closing net asset value per share of each fund on the day of valuation. When the Fund holds securities or other assets that are denominated in a foreign currency, the Fund will normally use the currency exchange rates as of 4:00 p.m. (Eastern Time). If independent third party pricing services are unable to supply prices for a portfolio investment, or if the prices supplied are deemed by the manager to be unreliable, the market price may be determined by the manager using quotations from one or more broker/dealers or at the transaction price if the security has recently been purchased and no value has yet been obtained from a pricing service or pricing broker. When reliable prices are not readily available, such as when the value of a security has been significantly affected by events after the close of the exchange or market on which the security is principally traded, but before the Fund calculates its net asset value, the Fund values these securities as determined in accordance with procedures approved by the Fund’s Board of Trustees.
The Board of Trustees is responsible for the valuation process and has delegated the supervision of the daily valuation process to the Legg Mason North Atlantic Fund Valuation Committee (the “Valuation Committee”). The Valuation Committee, pursuant to the policies adopted by the Board of Trustees, is responsible for making fair value determinations, evaluating the effectiveness of the Fund’s pricing policies, and reporting to the Board of
| | |
| ClearBridge Small Cap Fund 2020 Annual Report | | 29 |
Notes to financial statements (cont’d)
Trustees. When determining the reliability of third party pricing information for investments owned by the Fund, the Valuation Committee, among other things, conducts due diligence reviews of pricing vendors, monitors the daily change in prices and reviews transactions among market participants.
The Valuation Committee will consider pricing methodologies it deems relevant and appropriate when making fair value determinations. Examples of possible methodologies include, but are not limited to, multiple of earnings; discount from market of a similar freely traded security; discounted cash-flow analysis; book value or a multiple thereof; risk premium/yield analysis; yield to maturity; and/or fundamental investment analysis. The Valuation Committee will also consider factors it deems relevant and appropriate in light of the facts and circumstances. Examples of possible factors include, but are not limited to, the type of security; the issuer’s financial statements; the purchase price of the security; the discount from market value of unrestricted securities of the same class at the time of purchase; analysts’ research and observations from financial institutions; information regarding any transactions or offers with respect to the security; the existence of merger proposals or tender offers affecting the security; the price and extent of public trading in similar securities of the issuer or comparable companies; and the existence of a shelf registration for restricted securities.
For each portfolio security that has been fair valued pursuant to the policies adopted by the Board of Trustees, the fair value price is compared against the last available and next available market quotations. The Valuation Committee reviews the results of such back testing monthly and fair valuation occurrences are reported to the Board of Trustees quarterly.
The Fund uses valuation techniques to measure fair value that are consistent with the market approach and/or income approach, depending on the type of security and the particular circumstance. The market approach uses prices and other relevant information generated by market transactions involving identical or comparable securities. The income approach uses valuation techniques to discount estimated future cash flows to present value.
GAAP establishes a disclosure hierarchy that categorizes the inputs to valuation techniques used to value assets and liabilities at measurement date. These inputs are summarized in the three broad levels listed below:
| • | | Level 1 — quoted prices in active markets for identical investments |
| • | | Level 2 — other significant observable inputs (including quoted prices for similar investments, interest rates, prepayment speeds, credit risk, etc.) |
| • | | Level 3 — significant unobservable inputs (including the Fund’s own assumptions in determining the fair value of investments) |
| | |
30 | | ClearBridge Small Cap Fund 2020 Annual Report |
The inputs or methodologies used to value securities are not necessarily an indication of the risk associated with investing in those securities.
The following is a summary of the inputs used in valuing the Fund’s assets carried at fair value:
| | | | | | | | | | | | | | | | |
| ASSETS | |
| Description | | Quoted Prices
(Level 1) | | | Other Significant
Observable Inputs
(Level 2) | | | Significant
Unobservable
Inputs
(Level 3) | | | Total | |
| Long-Term Investments†: | | | | | | | | | | | | | | | | |
Common Stocks: | | | | | | | | | | | | | | | | |
Financials | | $ | 169,752,833 | | | $ | 17,256,373 | | | | — | | | $ | 187,009,206 | |
Other Common Stocks | | | 777,026,849 | | | | — | | | | — | | | | 777,026,849 | |
Investments in Underlying Funds | | | 2,400,712 | | | | — | | | | — | | | | 2,400,712 | |
| Total Long-Term Investments | | | 949,180,394 | | | | 17,256,373 | | | | — | | | | 966,436,767 | |
| Short-Term Investments† | | | 5,558,390 | | | | — | | | | — | | | | 5,558,390 | |
| Total Investments | | $ | 954,738,784 | | | $ | 17,256,373 | | | | — | | | $ | 971,995,157 | |
| † | See Schedule of Investments for additional detailed categorizations. |
(b) Business development companies. The Fund may invest in securities of closed-end investment companies that have elected to be treated as a business development company under the 1940 Act. A business development company operates similar to an exchange-traded fund and represents a portfolio of securities. The Fund may purchase a business development company to gain exposure to the securities in the underlying portfolio. The risks of owning a business development company generally reflect the risks of owning the underlying securities. Business development companies have expenses that reduce their value.
(c) Foreign investment risks. The Fund’s investments in foreign securities may involve risks not present in domestic investments. Since securities may be denominated in foreign currencies, may require settlement in foreign currencies or pay interest or dividends in foreign currencies, changes in the relationship of these foreign currencies to the U.S. dollar can significantly affect the value of the investments and earnings of the Fund. Foreign investments may also subject the Fund to foreign government exchange restrictions, expropriation, taxation or other political, social or economic developments, all of which affect the market and/or credit risk of the investments.
(d) Security transactions and investment income. Security transactions are accounted for on a trade date basis. Interest income (including interest income from payment-in-kind securities), adjusted for amortization of premium and accretion of discount, is recorded on the accrual basis. Dividend income is recorded on the ex-dividend date for dividends received in cash and/or securities. Foreign dividend income is recorded on the ex-dividend date or as soon as practicable after the Fund determines the existence of a dividend
| | |
| ClearBridge Small Cap Fund 2020 Annual Report | | 31 |
Notes to financial statements (cont’d)
declaration after exercising reasonable due diligence. The cost of investments sold is determined by use of the specific identification method. To the extent any issuer defaults or a credit event occurs that impacts the issuer, the Fund may halt any additional interest income accruals and consider the realizability of interest accrued up to the date of default or credit event.
(e) REIT distributions. The character of distributions received from Real Estate Investment Trusts (‘‘REITs’’) held by the Fund is generally comprised of net investment income, capital gains, and return of capital. It is the policy of the Fund to estimate the character of distributions received from underlying REITs based on historical data provided by the REITs. After each calendar year end, REITs report the actual tax character of these distributions. Differences between the estimated and actual amounts reported by the REITs are reflected in the Fund’s records in the year in which they are reported by the REITs by adjusting related investment cost basis, capital gains and income, as necessary.
(f) Distributions to shareholders. Distributions from net investment income and distributions of net realized gains, if any, are declared at least annually. Distributions to shareholders of the Fund are recorded on the ex-dividend date and are determined in accordance with income tax regulations, which may differ from GAAP.
(g) Share class accounting. Investment income, common expenses and realized/ unrealized gains (losses) on investments are allocated to the various classes of the Fund on the basis of daily net assets of each class. Fees relating to a specific class are charged directly to that share class.
(h) Compensating balance arrangements. The Fund has an arrangement with its custodian bank whereby a portion of the custodian’s fees is paid indirectly by credits earned on the Fund’s cash on deposit with the bank.
(i) Federal and other taxes. It is the Fund’s policy to comply with the federal income and excise tax requirements of the Internal Revenue Code of 1986 (the “Code”), as amended, applicable to regulated investment companies. Accordingly, the Fund intends to distribute its taxable income and net realized gains, if any, to shareholders in accordance with timing requirements imposed by the Code. Therefore, no federal or state income tax provision is required in the Fund’s financial statements.
Management has analyzed the Fund’s tax positions taken on income tax returns for all open tax years and has concluded that as of October 31, 2020, no provision for income tax is required in the Fund’s financial statements. The Fund’s federal and state income and federal excise tax returns for tax years for which the applicable statutes of limitations have not expired are subject to examination by the Internal Revenue Service and state departments of revenue.
(j) Reclassification. GAAP requires that certain components of net assets be reclassified to reflect permanent differences between financial and tax reporting. These
| | |
32 | | ClearBridge Small Cap Fund 2020 Annual Report |
reclassifications have no effect on net assets or net asset value per share. During the current year, the Fund had no reclassifications.
2. Investment advisory and management agreement and other transactions with affiliates
The Fund has an investment advisory and management agreement with ClearBridge Investments, LLC (“ClearBridge”). Pursuant to the agreement, ClearBridge provides the Fund with investment advisory, management and administrative services for which the Fund pays a fee, computed daily and payable monthly, at annual rates based on the Fund’s average daily net assets. Western Asset Management Company, LLC (“Western Asset”) manages the portion of the Fund’s cash and short-term instruments allocated to it. The following chart shows the annual management fee rates for the Fund:
| | | | |
| Average Daily Net Assets | | Annual Rate | |
| First $1 billion | | | 0.700 | % |
| Next $1 billion | | | 0.680 | |
| Next $3 billion | | | 0.650 | |
| Next $5 billion | | | 0.620 | |
| Over $10 billion | | | 0.590 | |
Legg Mason Partners Fund Advisor, LLC (“LMPFA”) serves as the sub-administrator to the Fund and provides certain administrative services to the Fund pursuant to a separate sub-administration agreement between ClearBridge and LMPFA. For LMPFA’s services to the Fund, ClearBridge (not the Fund) pays LMPFA a fee, calculated daily and payable monthly, at an annual rate of 0.05% of the average daily net assets of the Fund. For Western Asset’s services to the Fund, ClearBridge (not the Fund) pays Western Asset 0.02% of the portion of the Fund’s average daily net assets that are allocated to it by ClearBridge. As of July 31, 2020, LMPFA, ClearBridge and Western Asset are indirect, wholly-owned subsidiaries of Franklin Resources, Inc. (“Franklin Resources”). Prior to July 31, 2020, LMPFA, ClearBridge and Western Asset were wholly-owned subsidiaries of Legg Mason, Inc. (“Legg Mason”). As of July 31, 2020, Legg Mason is a subsidiary of Franklin Resources.
The Fund’s agreement with ClearBridge provides that expense reimbursements be made to the Fund for audit fees and compensation of the Fund’s independent trustees. These expense reimbursements are not subject to recapture.
As a result of a voluntary expense limitation arrangement, the ratio of total annual fund operating expenses, other than interest, brokerage commissions, dividend expense on short sales, taxes, extraordinary expenses and acquired fund fees and expenses, to average net assets of the Fund’s Class A2 shares did not exceed 1.29%. This voluntary expense limitation arrangement is expected to continue until December 31, 2022, but may be terminated at any time by ClearBridge.
As a result of an expense limitation arrangement between the Fund and ClearBridge, the ratio of total annual fund operating expenses for Class IS shares did not exceed the ratio of
| | |
| ClearBridge Small Cap Fund 2020 Annual Report | | 33 |
Notes to financial statements (cont’d)
total annual fund operating expenses for Class I shares. This expense limitation arrangement cannot be terminated prior to December 31, 2022 without the Board of Trustees’ consent. In addition, the manager has agreed to waive the Fund’s management fee to an extent sufficient to offset the net management fee payable in connection with any investment in an affiliated money market fund (the “affiliated money market fund waiver”). The affiliated money market fund waiver is not subject to the recapture provision discussed below.
During the year ended October 31, 2020, fees waived and/or expenses reimbursed amounted to $224,414, which included an affiliated money market fund waiver of $1,963.
ClearBridge is permitted to recapture amounts waived and/or reimbursed to a class within three years after the fiscal year in which ClearBridge earned the fee or incurred the expense if the class’ total annual fund operating expenses have fallen to a level below the expense limitation (“expense cap”) in effect at the time the fees were earned or the expenses incurred. In no case will ClearBridge recapture any amount that would result, on any particular business day of the Fund, in the class’ total annual fund operating expenses exceeding the expense cap or any other lower limit then in effect.
Pursuant to these arrangements, at October 31, 2020, the Fund had no remaining fee waivers and/or expense reimbursements subject to recapture by ClearBridge. For the year ended October 31, 2020, ClearBridge did not recapture any fees.
As of July 31, 2020, Legg Mason Investor Services, LLC (“LMIS”) is an indirect, wholly-owned broker-dealer subsidiary of Franklin Resources and serves as the Fund’s sole and exclusive distributor. Prior to July 31, 2020, LMIS was a wholly-owned broker-dealer subsidiary of Legg Mason.
There is a maximum initial sales charge of 5.75% for Class A and Class A2 shares. There is a contingent deferred sales charge (“CDSC”) of 1.00% on Class C shares, which applies if redemption occurs within 12 months from purchase payment. In certain cases, Class A and Class A2 shares have a 1.00% CDSC, which applies if redemption occurs within 18 months from purchase payment. This CDSC only applies to those purchases of Class A and Class A2 shares, which, when combined with current holdings of other shares of funds sold by LMIS, equal or exceed $1,000,000 in the aggregate. These purchases do not incur an initial sales charge.
For the year ended October 31, 2020, sales charges retained by and CDSCs paid to LMIS and its affiliates, if any, were as follows:
| | | | | | | | | | | | |
| | | Class A | | | Class A2 | | | Class C | |
| Sales charges | | $ | 8,638 | | | $ | 102,950 | | | | — | |
| CDSCs | | | 108 | | | | 52 | | | $ | 2,689 | |
Under a Deferred Compensation Plan (the “Plan”), Trustees may have elected to defer receipt of all or a specified portion of their compensation. A participating Trustee selected
| | |
34 | | ClearBridge Small Cap Fund 2020 Annual Report |
one or more funds managed by affiliates of Legg Mason in which his or her deferred trustee’s fees were deemed to be invested. Deferred amounts remain in the Fund until distributed in accordance with the Plan. In May 2015, the Board of Trustees approved an amendment to the Plan so that effective January 1, 2016, no compensation earned after that date may be deferred under the Plan.
As of July 31, 2020, all officers and one Trustee of the Trust are employees of Franklin Resources or its affiliates and do not receive compensation from the Trust. Prior to July 31, 2020, all officers and one Trustee of the Trust were employees of Legg Mason and did not receive compensation from the Trust.
3. Investments
During the year ended October 31, 2020, the aggregate cost of purchases and proceeds from sales of investments (excluding short-term investments) were as follows:
| | | | |
| Purchases | | $ | 514,568,567 | |
| Sales | | | 594,074,687 | |
At October 31, 2020, the aggregate cost of investments and the aggregate gross unrealized appreciation and depreciation of investments for federal income tax purposes were as follows:
| | | | | | | | | | | | | | | | |
| | | Cost | | | Gross
Unrealized
Appreciation | | | Gross
Unrealized
Depreciation | | | Net
Unrealized
Appreciation | |
| Securities | | $ | 897,294,655 | | | $ | 173,644,826 | | | $ | (98,944,324) | | | $ | 74,700,502 | |
4. Derivative instruments and hedging activities
During the year ended October 31, 2020, the Fund did not invest in derivative instruments.
5. Class specific expenses, waivers and/or expense reimbursements
The Fund has adopted a Rule 12b-1 shareholder services and distribution plan and under that plan the Fund pays service and/or distribution fees with respect to its Class A, Class A2, Class C, Class FI and Class R shares calculated at the annual rate of 0.25%, 0.25%, 1.00%, 0.25% and 0.50% of the average daily net assets of each class, respectively. Service and/or distribution fees are accrued daily and paid monthly.
| | |
| ClearBridge Small Cap Fund 2020 Annual Report | | 35 |
Notes to financial statements (cont’d)
For the year ended October 31, 2020, class specific expenses were as follows:
| | | | | | | | |
| | | Service and/or
Distribution Fees | | | Transfer Agent
Fees | |
| Class A | | $ | 810,716 | † | | $ | 270,343 | |
| Class A2 | | | 116,326 | | | | 131,380 | |
| Class C | | | 537,752 | † | | | 51,400 | |
| Class FI | | | 7,351 | | | | 5,413 | |
| Class R | | | 30,206 | | | | 14,681 | |
| Class I | | | — | | | | 591,956 | |
| Class IS | | | — | | | | 925 | |
| Total | | $ | 1,502,351 | | | $ | 1,066,098 | |
| † | Amounts shown are exclusive of expense reimbursements. For the year ended October 31, 2020, the service and/or distribution fees reimbursed amounted to $240 and $1,344 for Class A and Class C shares, respectively. |
For the year ended October 31, 2020, waivers and/or expense reimbursements by class were as follows:
| | | | |
| | | Waivers/Expense
Reimbursements | |
| Class A | | $ | 66,687 | |
| Class A2 | | | 9,478 | |
| Class C | | | 12,439 | |
| Class FI | | | 608 | |
| Class R | | | 1,247 | |
| Class I | | | 91,930 | |
| Class IS | | | 42,025 | |
| Total | | $ | 224,414 | |
6. Distributions to shareholders by class
| | | | | | | | |
| | | Year Ended
October 31, 2020 | | | Year Ended
October 31, 2019 | |
| Net Investment Income: | | | | | | | | |
| Class A | | $ | 1,966,457 | | | | — | |
| Class A2 | | | 162,372 | | | | — | |
| Class C | | | — | | | | — | |
| Class FI | | | 3,541 | | | | — | |
| Class R | | | — | | | | — | |
| Class I | | | 2,103,900 | | | | — | |
| Class IS | | | 1,063,731 | | | | — | |
| Total | | $ | 5,300,001 | | | | — | |
| | |
36 | | ClearBridge Small Cap Fund 2020 Annual Report |
| | | | | | | | |
| | | Year Ended
October 31, 2020 | | | Year Ended
October 31, 2019 | |
| Net Realized Gains: | | | | | | | | |
| Class A | | $ | 15,455,679 | | | $ | 12,577,542 | |
| Class A2 | | | 1,863,381 | | | | 2,852,972 | |
| Class C | | | 3,316,680 | | | | 40,975,336 | |
| Class FI | | | 104,819 | | | | 261,737 | |
| Class R | | | 208,620 | | | | 565,288 | |
| Class I | | | 13,836,713 | | | | 21,628,987 | |
| Class IS | | | 5,686,439 | | | | 13,868,197 | |
| Total | | $ | 40,472,331 | | | $ | 92,730,059 | |
7. Shares of beneficial interest
At October 31, 2020, the Trust had an unlimited number of shares of beneficial interest authorized with a par value of $0.00001 per share. The Fund has the ability to issue multiple classes of shares. Each class of shares represents an identical interest and has the same rights, except that each class bears certain direct expenses, including those specifically related to the distribution of its shares.
Transactions in shares of each class were as follows:
| | | | | | | | | | | | | | | | |
| | | Year Ended October 31, 2020 | | | Year Ended October 31, 2019 | |
| | | Shares | | | Amount | | | Shares | | | Amount | |
| Class A | | | | | | | | | | | | | | | | |
| Shares sold | | | 916,209 | | | $ | 31,833,425 | | | | 7,738,130 | | | $ | 304,618,704 | |
| Shares issued on reinvestment | | | 423,632 | | | | 16,760,889 | | | | 309,070 | | | | 11,299,598 | |
| Shares repurchased | | | (2,099,432) | | | | (69,888,148) | | | | (1,414,113) | | | | (54,115,569) | |
| Net increase (decrease) | | | (759,591) | | | $ | (21,293,834) | | | | 6,633,087 | | | $ | 261,802,733 | |
| | | | |
| Class A2 | | | | | | | | | | | | | | | | |
| Shares sold | | | 657,806 | | | $ | 21,634,711 | | | | 530,728 | | | $ | 20,136,221 | |
| Shares issued on reinvestment | | | 51,932 | | | | 2,025,753 | | | | 78,811 | | | | 2,852,972 | |
| Shares repurchased | | | (229,244) | | | | (7,499,322) | | | | (125,197) | | | | (4,731,192) | |
| Net increase | | | 480,494 | | | $ | 16,161,142 | | | | 484,342 | | | $ | 18,258,001 | |
| | | | |
| Class C | | | | | | | | | | | | | | | | |
| Shares sold | | | 128,291 | | | $ | 4,192,023 | | | | 292,475 | | | $ | 10,210,822 | |
| Shares issued on reinvestment | | | 86,728 | | | | 3,169,823 | | | | 1,188,127 | | | | 40,622,048 | |
| Shares repurchased | | | (1,092,647) | | | | (34,858,322) | | | | (9,121,844) | | | | (333,226,820) | |
| Net decrease | | | (877,628) | | | $ | (27,496,476) | | | | (7,641,242) | | | $ | (282,393,950) | |
| | | | |
| Class FI | | | | | | | | | | | | | | | | |
| Shares sold | | | 19,987 | | | $ | 1,072,173 | | | | 41,893 | | | $ | 2,285,129 | |
| Shares issued on reinvestment | | | 1,841 | | | | 108,360 | | | | 4,861 | | | | 261,737 | |
| Shares repurchased | | | (42,899) | | | | (2,236,142) | | | | (43,091) | | | | (2,446,753) | |
| Net increase (decrease) | | | (21,071) | | | $ | (1,055,609) | | | | 3,663 | | | $ | 100,113 | |
| | |
| ClearBridge Small Cap Fund 2020 Annual Report | | 37 |
Notes to financial statements (cont’d)
| | | | | | | | | | | | | | | | |
| | | Year Ended October 31, 2020 | | | Year Ended October 31, 2019 | |
| | | Shares | | | Amount | | | Shares | | | Amount | |
| Class R | | | | | | | | | | | | | | | | |
| Shares sold | | | 23,347 | | | $ | 1,163,315 | | | | 28,312 | | | $ | 1,548,580 | |
| Shares issued on reinvestment | | | 3,504 | | | | 200,113 | | | | 10,502 | | | | 551,234 | |
| Shares repurchased | | | (51,238) | | | | (2,423,673) | | | | (42,234) | | | | (2,272,884) | |
| Net decrease | | | (24,387) | | | $ | (1,060,245) | | | | (3,420) | | | $ | (173,070) | |
| | | | |
| Class I | | | | | | | | | | | | | | | | |
| Shares sold | | | 4,676,023 | | | $ | 240,632,145 | | | | 5,879,394 | | | $ | 346,673,970 | |
| Shares issued on reinvestment | | | 173,162 | | | | 10,823,833 | | | | 350,119 | | | | 19,883,262 | |
| Shares repurchased | | | (5,506,583) | | | | (272,923,767) | | | | (3,168,906) | | | | (188,723,789) | |
| Net increase (decrease) | | | (657,398) | | | $ | (21,467,789) | | | | 3,060,607 | | | $ | 177,833,443 | |
| | | | |
| Class IS | | | | | | | | | | | | | | | | |
| Shares sold | | | 1,450,989 | | | $ | 62,553,754 | | | | 672,314 | | | $ | 39,168,873 | |
| Shares issued on reinvestment | | | 107,464 | | | | 6,743,377 | | | | 243,815 | | | | 13,868,196 | |
| Shares repurchased | | | (1,575,616) | | | | (80,644,091) | | | | (620,352) | | | | (37,640,472) | |
| Net increase (decrease) | | | (17,163) | | | $ | (11,346,960) | | | | 295,777 | | | $ | 15,396,597 | |
8. Transactions with affiliated company
As defined by the 1940 Act, an affiliated company is one in which the Fund owns 5% or more of the outstanding voting securities, or a company which is under common ownership or control with the Fund. The following company was considered an affiliated company for all or some portion of the year ended October 31, 2020. The following transactions were effected in such company for the year ended October 31, 2020.
| | | | | | | | | | | | | | | | |
| | | Affiliate
Value at
October 31,
2019 | | | Purchased | | Sold | |
| | | Cost | | Shares | | Cost | | | Shares | |
| Western Asset Premier Institutional U.S. Treasury Reserves, Premium Shares | | | — | | | $73,805,987 | | 73,805,987 | | $ | 72,694,309 | | | | 72,694,309 | |
| | | | | | | | | | | | | | | | |
| (cont’d) | | Realized Gain (Loss) | | | Interest
Income | | | Net Increase
(Decrease) in
Unrealized
Appreciation
(Depreciation) | | | Affiliate
Value at
October 31,
2020 | |
| Western Asset Premier Institutional U.S. Treasury Reserves, Premium Shares | | | — | | | $ | 41,956 | | | | — | | | $ | 1,111,678 | |
| | |
�� 38 | | ClearBridge Small Cap Fund 2020 Annual Report |
9. Income tax information and distributions to shareholders
The tax character of distributions paid during the fiscal years ended October 31, was as follows:
| | | | | | | | |
| | | 2020 | | | 2019 | |
| Distributions paid from: | | | | | | | | |
| Ordinary income | | $ | 10,947,655 | | | $ | 28,716,870 | |
| Net long-term capital gains | | | 34,824,677 | | | | 64,013,189 | |
| Total distributions paid | | $ | 45,772,332 | | | $ | 92,730,059 | |
As of October 31, 2020, the components of distributable earnings (loss) on a tax basis were as follows:
| | | | |
| Undistributed ordinary income — net | | $ | 3,058,873 | |
| Deferred capital losses* | | | (84,558,190) | |
| Other book/tax temporary differences(a) | | | (18,055) | |
| Unrealized appreciation (depreciation)(b) | | | 74,700,503 | |
| Total distributable earnings (loss) — net | | $ | (6,816,869) | |
| * | These capital losses have been deferred in the current year as either short-term or long-term losses. The losses will be deemed to occur on the first day of the next taxable year in the same character as they were originally deferred and will be available to offset future taxable capital gains. |
| (a) | Other book/tax temporary differences are attributable to book/tax differences in the timing of the deductibility of various expenses. |
| (b) | The difference between book-basis and tax-basis unrealized appreciation (depreciation) is attributable to the tax deferral of losses on wash sales. |
10. Other matter
The outbreak of the respiratory illness COVID-19 (commonly referred to as “coronavirus”) has continued to rapidly spread around the world, causing considerable uncertainty for the global economy and financial markets. The ultimate economic fallout from the pandemic, and the long-term impact on economies, markets, industries and individual issuers, are not known. The COVID-19 pandemic could adversely affect the value and liquidity of the Fund’s investments, impair the Fund’s ability to satisfy redemption requests, and negatively impact the Fund’s performance. In addition, the outbreak of COVID-19, and measures taken to mitigate its effects, could result in disruptions to the services provided to the Fund by its service providers.
| | |
| ClearBridge Small Cap Fund 2020 Annual Report | | 39 |
Report of independent registered public accounting firm
To the Board of Trustees of Legg Mason Global Asset Management Trust and Shareholders of ClearBridge Small Cap Fund
Opinion on the Financial Statements
We have audited the accompanying statement of assets and liabilities, including the schedule of investments, of ClearBridge Small Cap Fund (one of the funds constituting Legg Mason Global Asset Management Trust, referred to hereafter as the “Fund”) as of October 31, 2020, the related statement of operations for the year ended October 31, 2020, the statement of changes in net assets for each of the two years in the period ended October 31, 2020, including the related notes, and the financial highlights for each of the periods indicated therein (collectively referred to as the “financial statements”). In our opinion, the financial statements present fairly, in all material respects, the financial position of the Fund as of October 31, 2020, the results of its operations for the year then ended, the changes in its net assets for each of the two years in the period ended October 31, 2020 and the financial highlights for each of the periods indicated therein in conformity with accounting principles generally accepted in the United States of America.
Basis for Opinion
These financial statements are the responsibility of the Fund’s management. Our responsibility is to express an opinion on the Fund’s financial statements based on our audits. We are a public accounting firm registered with the Public Company Accounting Oversight Board (United States) (PCAOB) and are required to be independent with respect to the Fund in accordance with the U.S. federal securities laws and the applicable rules and regulations of the Securities and Exchange Commission and the PCAOB.
We conducted our audits of these financial statements in accordance with the standards of the PCAOB. Those standards require that we plan and perform the audit to obtain reasonable assurance about whether the financial statements are free of material misstatement, whether due to error or fraud.
Our audits included performing procedures to assess the risks of material misstatement of the financial statements, whether due to error or fraud, and performing procedures that respond to those risks. Such procedures included examining, on a test basis, evidence regarding the amounts and disclosures in the financial statements. Our audits also included evaluating the accounting principles used and significant estimates made by management, as well as evaluating the overall presentation of the financial statements. Our procedures included confirmation of securities owned as of October 31, 2020 by correspondence with the custodian and brokers; when replies were not received from brokers, we performed other auditing procedures. We believe that our audits provide a reasonable basis for our opinion.
/s/PricewaterhouseCoopers LLP
Baltimore, Maryland
December 17, 2020
We have served as the auditor of one or more investment companies in the Franklin Templeton Group of Funds since 1948.
| | |
40 | | ClearBridge Small Cap Fund 2020 Annual Report |
Additional shareholder information (unaudited)
Results of special meeting of shareholders
On July 14, 2020 a special meeting of shareholders was held for the following purposes: 1) to approve a new management agreement between the Fund and its investment manager; and 2) to approve a new subadvisory agreement with respect to the Fund’s subadviser. The following table provides the number of votes cast for or against, as well as the number of abstentions and broker non-votes as to each matter voted on at the special meeting of shareholders. Each item voted on was approved.
| | | | | | | | | | | | | | | | |
| Item Voted On | | Voted For | | | Voted
Against | | | Abstentions | | | Broker
Non-Votes | |
| To Approve a New Management Agreement with ClearBridge Investments, LLC | | | 466,351,583.614 | | | | 6,774,390.760 | | | | 20,164,134.406 | | | | 0 | |
| To Approve a New Subadvisory Agreement with Western Asset Management Company, LLC | | | 463,877,014.927 | | | | 7,107,927.477 | | | | 22,305,166.376 | | | | 0 | |
| | |
ClearBridge Small Cap Fund | | 41 |
Statement regarding liquidity risk management program
(unaudited)
As required by law, the fund has adopted and implemented a liquidity risk management program (the “Program”) that is designed to assess and manage liquidity risk. Liquidity risk is the risk that the fund could not meet requests to redeem its shares without significant dilution of remaining investors’ interests in the fund. ClearBridge Investments, LLC (the “Manager”), is the fund’s manager, and Legg Mason Partners Fund Advisor, LLC (the “Sub-Administrator”), the fund’s sub-administrator, is the administrator of the Program. The Sub-Administrator has established a liquidity risk management committee (the “Committee”) to administer the Program on a day-to-day basis.
The Committee, on behalf of the Sub-Administrator, provided the fund’s Board of Trustees with a report that addressed the operation of the Program, assessed its adequacy and effectiveness of implementation, including, if applicable, the operation of any highly liquid investment minimum (“HLIM”), and described any material changes that had been made to the Program or were recommended (the “Report”). The Report covered the period from December 1, 2018 through December 31, 2019 (the “Reporting Period”).
The Report confirmed that there were no material changes to the Program during the Reporting Period and that no changes were recommended.
The Report also confirmed that, throughout the Reporting Period, the Committee had monitored the fund’s portfolio liquidity and liquidity risk on an ongoing basis, as described in the Program and in Board reporting throughout the Reporting Period.
The Report discussed the Committee’s annual review of the Program, which addressed, among other things, the following elements of the Program:
Assessment, Management, and Periodic Review of Liquidity Risk. The Committee reviewed the fund’s investment strategy and liquidity of portfolio investments during both normal and reasonably foreseeable stressed conditions. The Committee noted that the fund’s investment strategy continues to be appropriate for an open-end fund, taking into account, among other things, whether and to what extent the fund held less liquid and illiquid assets and the extent to which any such investments affected the fund’s ability to meet redemption requests. In managing and reviewing the fund’s liquidity risk, the Committee also considered the extent to which the fund’s investment strategy involves a relatively concentrated portfolio or large positions in particular issuers, the extent to which the fund uses borrowing for investment purposes, and the extent to which the fund uses derivatives (including for hedging purposes). The Committee also reviewed the fund’s short-term and long-term cash flow projections during both normal and reasonably foreseeable stressed conditions. In assessing the fund’s cash flow projections, the Committee considered, among other factors, historical net redemption activity, redemption policies, ownership concentration, distribution channels, and the degree of certainty associated with the fund’s short-term and long-term cash flow projections. The Committee also considered the fund’s
| | |
42 | | ClearBridge Small Cap Fund |
holdings of cash and cash equivalents, as well as borrowing arrangements and other funding sources, including, if applicable, the fund’s participation in a credit facility, as components of the fund’s ability to meet redemption requests.
Liquidity Classification. The Committee reviewed the Program’s liquidity classification methodology for categorizing the fund’s investments into one of four liquidity buckets. In reviewing the fund’s investments, the Committee considered, among other factors, whether trading varying portions of a position in a particular portfolio investment or asset class in sizes the fund would reasonably anticipate trading, would be reasonably expected to significantly affect liquidity.
Highly Liquid Investment Minimum. The Committee performed an analysis to determine whether the fund is required to maintain a Highly Liquid Investment Minimum, and determined that no such minimum is required because the fund primarily holds highly liquid investments.
Compliance with Limitation on Illiquid Investments. The Committee confirmed that during the Reporting Period, the fund did not acquire any illiquid investment such that, after the acquisition, the fund would have invested more than 15% of its assets in illiquid investments that are assets, in accordance with the Program and applicable SEC rules.
Redemptions in Kind. The Committee confirmed that no redemptions in-kind were effected by the fund during the Reporting Period.
The Report stated that the Committee concluded that the Program is reasonably designed and operated effectively to assess and manage the fund’s liquidity risk throughout the Reporting Period.
| | |
| ClearBridge Small Cap Fund | | 43 |
Additional information (unaudited)
Information about Trustees and Officers
The business and affairs of ClearBridge Small Cap Fund (the “Fund”) are conducted by management under the supervision and subject to the direction of its Board of Trustees. The business address of each Trustee is c/o Jane Trust, Legg Mason, 100 International Drive, 11th Floor, Baltimore, Maryland 21202. Information pertaining to the Trustees and officers of the Fund is set forth below.
The Statement of Additional Information includes additional information about Trustees and is available, without charge, upon request by calling the Fund at 1-877-721-1926.
| | |
| Independent Trustees† |
|
| Ruby P. Hearn |
| |
| Year of birth | | 1940 |
| Position(s) with Trust | | Trustee |
| Term of office1 and length of time served2 | | Since 2004 |
| Principal occupation(s) during the past five years | | Senior Vice President Emerita of The Robert Wood Johnson Foundation (non-profit) (since 2001); Member of the National Academy of Medicine (formerly known as the Institute of Medicine) (since 1982); formerly, Trustee of the New York Academy of Medicine (2004 to 2011); Director of the Institute for Healthcare Improvement (2002 to 2011); Senior Vice President of The Robert Wood Johnson Foundation (1996 to 2001); Fellow of The Yale Corporation (1992 to 1998) |
| Number of funds in fund complex overseen by Trustee | | 20 |
| Other board memberships held by Trustee during the past five years | | None |
| |
| Arnold L. Lehman | | |
| |
| Year of birth | | 1944 |
| Position(s) with Trust | | Trustee and Chairman |
| Term of office1 and length of time served2 | | Since 1982 and since 2015 |
| Principal occupation(s) during the past five years | | Senior Advisor, Phillips (auction house) (since 2015); formerly, Fellow, Ford Foundation (2015 to 2016); Director of the Brooklyn Museum (1997 to 2015) |
| Number of funds in fund complex overseen by Trustee | | 20 |
| Other board memberships held by Trustee during the past five years | | Trustee of American Federation of Arts (since 2002) |
| | |
44 | | ClearBridge Small Cap Fund |
| | |
| Independent Trustees† (cont’d) |
|
| Robin J.W. Masters |
| |
| Year of birth | | 1955 |
| Position(s) with Trust | | Trustee |
| Term of office1 and length of time served2 | | Since 2002 |
| Principal occupation(s) during the past five years | | Retired; formerly, Chief Investment Officer of ACE Limited (insurance) (1986 to 2000) |
| Number of funds in fund complex overseen by Trustee | | 20 |
| Other board memberships held by Trustee during the past five years | | Director of HSBC Managed Portfolios Limited, HSBC Corporate Money Funds Limited and HSBC Specialist Funds Limited (since 2020); formerly, Director of Cheyne Capital International Limited (investment advisory firm) (2005 to 2020); Director/ Trustee of Legg Mason Institutional Funds plc, Western Asset Fixed Income Funds plc and Western Asset Debt Securities Fund plc. (2007 to 2011) |
|
| Jill E. McGovern |
| |
| Year of birth | | 1944 |
| Position(s) with Trust | | Trustee |
| Term of office1 and length of time served2 | | Since 1989 |
| Principal occupation(s) during the past five years | | Senior Consultant, American Institute for Contemporary German Studies (AICGS) (since 2007); formerly, Chief Executive Officer of The Marrow Foundation (non-profit) (1993 to 2007); Executive Director of the Baltimore International Festival (1991 to 1993); Senior Assistant to the President of The Johns Hopkins University (1986 to 1990) |
| Number of funds in fund complex overseen by Trustee | | 20 |
| Other board memberships held by Trustee during the past five years | | Director of International Biomedical Research Alliance (2002 to 2010); Director of Lois Roth Endowment (2005 to 2012) |
|
| Arthur S. Mehlman |
| |
| Year of birth | | 1942 |
| Position(s) with Trust | | Trustee |
| Term of office1 and length of time served2 | | Since 2002 |
| Principal occupation(s) during the past five years | | Retired. Director, The University of Maryland Foundation (since 1992); formerly, Director, The League for People with Disabilities (2003 to 2017); Director, Municipal Mortgage & Equity LLC (2004 to 2011); Partner (1972 to 2002), Partner-in-Charge of the Audit Practice for Baltimore and Washington offices (1998 to 2001), and Managing Partner of the Baltimore office (1992 to 1995) at KPMG LLP (international accounting firm) |
| Number of funds in fund complex overseen by Trustee | | Trustee of all Legg Mason Funds consisting of 20 portfolios; Director/Trustee of the Royce Family of Funds consisting of 22 portfolios |
| Other board memberships held by Trustee during the past five years | | Director of Municipal Mortgage & Equity, LLC. (2004 to 2011) |
| | |
| ClearBridge Small Cap Fund | | 45 |
Additional information (unaudited) (cont’d)
Information about Trustees and Officers
| | |
| Independent Trustees† (cont’d) |
|
| G. Peter O’Brien |
| |
| Year of birth | | 1945 |
| Position(s) with Trust | | Trustee |
| Term of office1 and length of time served2 | | Since 1999 |
| Principal occupation(s) during the past five years | | Retired. Trustee Emeritus of Colgate University (since 2005); Board Member, Hill House, Inc. (residential home care) (since 1999); formerly, Board Member, Bridges School (pre-school) (2006 to 2017); Managing Director, Equity Capital Markets Group of Merrill Lynch & Co. (1971 to 1999) |
| Number of funds in fund complex overseen by Trustee | | Trustee of all Legg Mason funds consisting of 20 portfolios; Director/Trustee of the Royce Family of Funds consisting of 22 portfolios |
| Other board memberships held by Trustee during the past five years | | Director of TICC Capital Corp. (2003 to 2017) |
|
| S. Ford Rowan |
| |
| Year of birth | | 1943 |
| Position(s) with Trust | | Trustee |
| Term of office1 and length of time served2 | | Since 2002 |
| Principal occupation(s) during the past five years | | Consultant to University of Maryland University College (since 2013); formerly, Chairman, National Center for Critical Incident Analysis (2004 to 2018); Lecturer in Organizational Sciences, George Washington University (2000 to 2014); Trustee, St. John’s College (2006 to 2012); Consultant, Rowan & Blewitt Inc. (management consulting) (1984 to 2007); Lecturer in Journalism, Northwestern University (1980 to 1993); Director, Santa Fe Institute (1999 to 2008) |
| Number of funds in fund complex overseen by Trustee | | 20 |
| Other board memberships held by Trustee during the past five years | | None |
| | |
46 | | ClearBridge Small Cap Fund |
| | |
| Independent Trustees† (cont’d) |
|
| Robert M. Tarola |
| |
| Year of birth | | 1950 |
| Position(s) with Trust | | Trustee |
| Term of office1 and length of time served2 | | Since 2004 |
| Principal occupation(s) during the past five years | | President of Rights Advisory LLC (corporate finance and governance consulting) (since 2008); Member, Investor Advisory Group of the Public Company Accounting Oversight Board (since 2009); formerly, Chief Financial Officer, Little Company of Mary Hospital and Health Care Centers (healthcare provider network) (2018); Executive Vice President and Chief Financial Officer, Southcoast Health System, Inc. (healthcare provider network) (2015 to 2017); Senior Vice President and Chief Financial Officer of The Howard University (higher education and health care) (2009 to 2013); Senior Vice President and Chief Financial Officer of W.R. Grace & Co. (specialty chemicals) (1999 to 2008); Chief Financial Officer of MedStar Health, Inc. (healthcare) (1996 to 1999); Partner, PriceWaterhouse, LLP (accounting and auditing) (1984 to 1996) |
| Number of funds in fund complex overseen by Trustee | | 20 |
| Other board memberships held by Trustee during the past five years | | Director of American Kidney Fund (renal disease assistance) (since 2008); Director and Board Chair of XBRL International, Inc. (global data standard setting) (since 2015); Director of Vista Outdoor, Inc. (consumer recreation products) (since 2015); formerly, Director of TeleTech Holdings, Inc. (business processing outsourcing) (2008 to 2018) |
| | |
| Interested Trustee and Officer |
|
| Jane Trust, CFA3 |
| |
| Year of birth | | 1962 |
| Position(s) with Trust | | Trustee, President and Chief Executive Officer |
| Term of office1 and length of time served2 | | Since 2015 |
| Principal occupation(s) during the past five years | | Senior Vice President, Fund Board Management, Franklin Templeton (since 2020); Officer and/or Trustee/Director of 150 funds associated with Legg Mason Partners Fund Advisor, LLC (“LMPFA”) or its affiliates (since 2015); President and Chief Executive Officer of LMPFA (since 2015); formerly, Senior Managing Director (2018 to 2020) and Managing Director (2016 to 2018) of Legg Mason & Co., LLC (“Legg Mason & Co.”); Senior Vice President of LMPFA (2015) |
| Number of funds in fund complex overseen by Trustee | | 147 |
| Other board memberships held by Trustee during the past five years | | None |
| | |
| ClearBridge Small Cap Fund | | 47 |
Additional information (unaudited) (cont’d)
Information about Trustees and Officers
| | |
| Additional Officers |
|
Christopher Berarducci
Legg Mason 620 Eighth Avenue, 47th Floor, New York, NY 10018 |
| |
| Year of birth | | 1974 |
| Position(s) with Trust | | Treasurer and Principal Financial Officer |
| Term of office1 and length of time served2 | | Since 2010 and 2019 |
| Principal occupation(s) during the past five years | | Vice President, Fund Administration and Reporting, Franklin Templeton (since 2020); Treasurer (since 2010) and Principal Financial Officer (since 2019) of certain funds associated with Legg Mason & Co. or its affiliates; formerly, Managing Director (2020), Director (2015 to 2020), and Vice President (2011 to 2015) of Legg Mason & Co. |
|
Marc A. De Oliveira*
Legg Mason 100 First Stamford Place, 6th Floor, Stamford, CT 06902 |
| |
| Year of birth | | 1971 |
| Position(s) with Trust | | Secretary and Chief Legal Officer |
| Term of office1 and length of time served2 | | Since 2020 |
| Principal occupation(s) during the past five years | | Associate General Counsel of Franklin Templeton (since 2020); Assistant Secretary of certain funds associated with Legg Mason & Co. or its affiliates (since 2006); formerly, Managing Director (2016 to 2020) and Associate General Counsel of Legg Mason & Co. (2005 to 2020) |
|
Thomas C. Mandia
Legg Mason 100 First Stamford Place, 6th Floor, Stamford, CT 06902 |
| |
| Year of birth | | 1962 |
| Position(s) with Trust | | Senior Vice President |
| Term of office1 and length of time served2 | | Since 2020 |
| Principal occupation(s) during the past five years | | Senior Associate General Counsel of Franklin Templeton (since 2020); Secretary of LMPFA (since 2006); Assistant Secretary of certain funds associated with Legg Mason & Co. or its affiliates (since 2006); Secretary of LM Asset Services, LLC (“LMAS”) (since 2002) and Legg Mason Fund Asset Management, Inc. (“LMFAM”) (since 2013) (formerly registered investment advisers); formerly, Managing Director and Deputy General Counsel of Legg Mason & Co. (2005 to 2020) |
| | |
48 | | ClearBridge Small Cap Fund |
| | |
| Additional Officers (cont’d) |
|
Ted P. Becker
Legg Mason 620 Eighth Avenue, 47th Floor, New York, NY 10018 |
| |
| Year of birth | | 1951 |
| Position(s) with Trust | | Chief Compliance Officer |
| Term of office1 and length of time served2 | | Since 2007 |
| Principal occupation(s) during the past five years | | Vice President, Global Compliance of Franklin Templeton (since 2020); Chief Compliance Officer of LMPFA (since 2006); Chief Compliance Officer of certain funds associated with Legg Mason & Co. or its affiliates (since 2006); formerly, Director of Global Compliance at Legg Mason, Inc. (2006 to 2020); Managing Director of Compliance of Legg Mason & Co. (2005 to 2020) |
| |
Susan Kerr
Legg Mason 620 Eighth Avenue, 47th Floor, New York, NY 10018 | | |
| |
| Year of birth | | 1949 |
| Position(s) with Trust | | Chief Anti-Money Laundering Compliance Officer |
| Term of office1 and length of time served2 | | Since 2013 |
| Principal occupation(s) during the past five years | | Senior Compliance Analyst, Franklin Templeton (since 2020); Chief Anti-Money Laundering Compliance Officer of certain funds associated with Legg Mason & Co. or its affiliates (since 2013) and Anti-Money Laundering Compliance Officer (since 2012), Senior Compliance Officer (since 2011) and Assistant Vice President (since 2010) of Legg Mason Investor Services, LLC (“LMIS”); formerly, Assistant Vice President of Legg Mason & Co. (2010 to 2020) |
| |
Jenna Bailey
Legg Mason 100 First Stamford Place, 5th Floor, Stamford, CT 06902 | | |
| |
| Year of birth | | 1978 |
| Position(s) with Trust | | Identity Theft Prevention Officer |
| Term of office1 and length of time served2 | | Since 2015 |
| Principal occupation(s) during the past five years | | Senior Compliance Analyst of Franklin Templeton (since 2020); Identity Theft Prevention Officer of certain funds associated with Legg Mason & Co. or its affiliates (since 2015); formerly, Compliance Officer of Legg Mason & Co. (2013 to 2020); Assistant Vice President of Legg Mason & Co. (2011 to 2020) |
| | |
| ClearBridge Small Cap Fund | | 49 |
Additional information (unaudited) (cont’d)
Information about Trustees and Officers
| | |
| Additional Officers (cont’d) |
|
Jeanne M. Kelly
Legg Mason 620 Eighth Avenue, 47th Floor, New York, NY 10018 |
| |
| Year of birth | | 1951 |
| Position(s) with Trust | | Senior Vice President |
| Term of office1 and length of time served2 | | Since 2007 |
| Principal occupation(s) during the past five years | | U.S. Fund Board Team Manager, Franklin Templeton (since 2020); Senior Vice President of certain funds associated with Legg Mason & Co. or its affiliates (since 2007); Senior Vice President of LMPFA (since 2006); President and Chief Executive Officer of LMAS and LMFAM (since 2015); formerly, Managing Director of Legg Mason & Co. (2005 to 2020); Senior Vice President of LMFAM (2013 to 2015) |
| † | Trustees who are not “interested persons” of the Fund within the meaning of Section 2(a)(19) of the Investment Company Act of 1940, as amended (the “1940 Act”). Each of the Independent Trustees serves on the standing committees of the Board of Trustees, which include the Audit Committee (chair: Arthur S. Mehlman), the Nominating Committee (co-chairs: G. Peter O’Brien and Jill E. McGovern), and the Independent Trustees Committee (chair: Arnold L. Lehman). |
| * | Effective September 10, 2020, Mr. De Oliveira became Secretary and Chief Legal Officer. |
| 1 | Each Trustee and officer serves until his or her respective successor has been duly elected and qualified or until his or her earlier death, resignation, retirement or removal. |
| 2 | Indicates the earliest year in which the Trustee became a board member for a fund in the Legg Mason fund complex or the officer took such office. |
| 3 | Ms. Trust is an “interested person” of the Fund, as defined in the 1940 Act, because of her position with LMPFA and/or certain of its affiliates. |
| | |
50 | | ClearBridge Small Cap Fund |
Important tax information (unaudited)
The following information is provided with respect to the distributions paid during the taxable year ended October 31, 2020:
| | | | | | | | | | | | |
| Record date: | | | 12/4/2019 | | | | 12/17/2019 | | | | 6/17/2020 | |
| Payable date: | | | 12/5/2019 | | | | 12/18/2019 | | | | 6/18/2020 | |
| Ordinary Income: | | | | | | | | | | | | |
Qualified Dividend Income for Individuals | | | 100.00 | % | | | 100.00 | % | | | 100.00 | % |
| Dividends Qualifying for the Dividends | | | | | | | | | | | | |
Received Deduction for Corporations | | | 100.00 | % | | | 100.00 | % | | | 100.00 | % |
| Long-Term Capital Gain Dividend | | $ | 1.368680 | | | | — | | | $ | 0.020100 | |
| Qualified Short-Term Capital Gain Dividend* | | $ | 0.224720 | | | | — | | | $ | 0.000440 | |
| * | Qualified Short-Term Capital Gains eligible for exemption from U.S. withholding tax for nonresident shareholders and foreign corporations. |
| | |
| ClearBridge Small Cap Fund | | 51 |
ClearBridge
Small Cap Fund
Trustees
Ruby P. Hearn
Arnold L. Lehman
Chairman
Robin J.W. Masters
Jill E. McGovern
Arthur S. Mehlman
G. Peter O’Brien
S. Ford Rowan
Robert M. Tarola
Jane Trust
Investment manager/adviser
ClearBridge Investments, LLC
Distributor
Legg Mason Investor Services, LLC
Custodian
The Bank of New York Mellon
Transfer agent
BNY Mellon Investment
Servicing (US) Inc.
4400 Computer Drive
Westborough, MA 01581
Independent registered public accounting firm
PricewaterhouseCoopers LLP
Baltimore, MD
ClearBridge Small Cap Fund
The Fund is a separate investment series of Legg Mason Global Asset Management Trust, a Maryland statutory trust.
ClearBridge Small Cap Fund
Legg Mason Funds
620 Eighth Avenue, 47th Floor
New York, NY 10018
The Fund files its complete schedule of portfolio holdings with the Securities and Exchange Commission (“SEC”) for the first and third quarters of each fiscal year as an exhibit to its reports on Form N-PORT. The Fund’s Forms N-PORT are available on the SEC’s website at www.sec.gov. To obtain information on Form N-PORT, shareholders can call the Fund at 1-877-721-1926.
Information on how the Fund voted proxies relating to portfolio securities during the prior 12-month period ended June 30th of each year and a description of the policies and procedures that the Fund uses to determine how to vote proxies related to portfolio transactions are available (1) without charge, upon request, by calling the Fund at 1-877-721-1926, (2) at www.leggmason.com/mutualfunds and (3) on the SEC’s website at www.sec.gov.
This report is submitted for the general information of the shareholders of ClearBridge Small Cap Fund. This report is not authorized for distribution to prospective investors in the Fund unless preceded or accompanied by a current prospectus.
Investors should consider the Fund’s investment objectives, risks, charges and expenses carefully before investing. The prospectus contains this and other important information about the Fund. Please read the prospectus carefully before investing.
www.leggmason.com
© 2020 Legg Mason Investor Services, LLC
Member FINRA, SIPC
Legg Mason Funds Privacy and Security Notice
Your Privacy and the Security of Your Personal Information is Very Important to the Legg Mason Funds
This Privacy and Security Notice (the “Privacy Notice”) addresses the Legg Mason Funds’ privacy and data protection practices with respect to nonpublic personal information the Funds receive. The Legg Mason Funds include any funds sold by the Funds’ distributor, Legg Mason Investor Services, LLC, as well as Legg Mason-sponsored closed-end funds. The provisions of this Privacy Notice apply to your information both while you are a shareholder and after you are no longer invested with the Funds.
The Type of Nonpublic Personal Information the Funds Collect About You
The Funds collect and maintain nonpublic personal information about you in connection with your shareholder account. Such information may include, but is not limited to:
| • | | Personal information included on applications or other forms; |
| • | | Account balances, transactions, and mutual fund holdings and positions; |
| • | | Bank account information, legal documents, and identity verification documentation; |
| • | | Online account access user IDs, passwords, security challenge question responses; and |
| • | | Information received from consumer reporting agencies regarding credit history and creditworthiness (such as the amount of an individual’s total debt, payment history, etc.). |
How the Funds Use Nonpublic Personal Information About You
The Funds do not sell or share your nonpublic personal information with third parties or with affiliates for their marketing purposes, or with other financial institutions or affiliates for joint marketing purposes, unless you have authorized the Funds to do so. The Funds do not disclose any nonpublic personal information about you except as may be required to perform transactions or services you have authorized or as permitted or required by law.
The Funds may disclose information about you to:
| • | | Employees, agents, and affiliates on a “need to know” basis to enable the Funds to conduct ordinary business, or to comply with obligations to government regulators; |
| • | | Service providers, including the Funds’ affiliates, who assist the Funds as part of the ordinary course of business (such as printing, mailing services, or processing or servicing your account with us) or otherwise perform services on the Funds’ behalf, including companies that may perform statistical analysis, market research and marketing services solely for the Funds; |
| • | | Permit access to transfer, whether in the United States or countries outside of the United States to such Funds’ employees, agents and affiliates and service providers as required to enable the Funds to conduct ordinary business, or to comply with obligations to government regulators; |
| • | | The Funds’ representatives such as legal counsel, accountants and auditors to enable the Funds to conduct ordinary business, or to comply with obligations to government regulators; |
| • | | Fiduciaries or representatives acting on your behalf, such as an IRA custodian or trustee of a grantor trust. |
|
| NOT PART OF THE ANNUAL REPORT |
Legg Mason Funds Privacy and Security Notice (cont’d)
Except as otherwise permitted by applicable law, companies acting on the Funds’ behalf, including those outside the United States, are contractually obligated to keep nonpublic personal information the Funds provide to them confidential and to use the information the Funds share only to provide the services the Funds ask them to perform. The Funds may disclose nonpublic personal information about you when necessary to enforce their rights or protect against fraud, or as permitted or required by applicable law, such as in connection with a law enforcement or regulatory request, subpoena, or similar legal process. In the event of a corporate action or in the event a Fund service provider changes, the Funds may be required to disclose your nonpublic personal information to third parties. While it is the Funds’ practice to obtain protections for disclosed information in these types of transactions, the Funds cannot guarantee their privacy policy will remain unchanged.
Keeping You Informed of the Funds’ Privacy and Security Practices
The Funds will notify you annually of their privacy policy as required by federal law. While the Funds reserve the right to modify this policy at any time they will notify you promptly if this privacy policy changes.
The Funds’ Security Practices
The Funds maintain appropriate physical, electronic and procedural safeguards designed to guard your nonpublic personal information. The Funds’ internal data security policies restrict access to your nonpublic personal information to authorized employees, who may use your nonpublic personal information for Fund business purposes only.
Although the Funds strive to protect your nonpublic personal information, they cannot ensure or warrant the security of any information you provide or transmit to them, and you do so at your own risk. In the event of a breach of the confidentiality or security of your nonpublic personal information, the Funds will attempt to notify you as necessary, so you can take appropriate protective steps. If you have consented to the Funds using electronic communications or electronic delivery of statements, they may notify you under such circumstances using the most current email address you have on record with them.
In order for the Funds to provide effective service to you, keeping your account information accurate is very important. If you believe that your account information is incomplete, not accurate or not current, if you have questions about the Funds’ privacy practices, or our use of your nonpublic personal information, write the Funds using the contact information on your account statements, email the Funds by clicking on the Contact Us section of the Funds’ website at www.leggmason.com, or contact the Fund at 1-877-721-1926.
Revised April 2018
Legg Mason California Consumer Privacy Act Policy
Although much of the personal information we collect is “nonpublic personal information” subject to federal law, residents of California may, in certain circumstances, have additional rights under the California Consumer Privacy Act (“CCPA”). For example, if you are a broker,
|
| NOT PART OF THE ANNUAL REPORT |
Legg Mason Funds Privacy and Security Notice (cont’d)
dealer, agent, fiduciary, or representative acting by or on behalf of, or for, the account of any other person(s) or household, or a financial advisor, or if you have otherwise provided personal information to us separate from the relationship we have with personal investors, the provisions of this Privacy Policy apply to your personal information (as defined by the CCPA).
| • | | In addition to the provisions of the Legg Mason Funds Security and Privacy Notice, you may have the right to know the categories and specific pieces of personal information we have collected about you. |
| • | | You also have the right to request the deletion of the personal information collected or maintained by the Funds. |
If you wish to exercise any of the rights you have in respect of your personal information, you should advise the Funds by contacting them as set forth below. The rights noted above are subject to our other legal and regulatory obligations and any exemptions under the CCPA. You may designate an authorized agent to make a rights request on your behalf, subject to the identification process described below. We do not discriminate based on requests for information related to our use of your personal information, and you have the right not to receive discriminatory treatment related to the exercise of your privacy rights.
We may request information from you in order to verify your identity or authority in making such a request. If you have appointed an authorized agent to make a request on your behalf, or you are an authorized agent making such a request (such as a power of attorney or other written permission), this process may include providing a password/passcode, a copy of government issued identification, affidavit or other applicable documentation, i.e. written permission. We may require you to verify your identity directly even when using an authorized agent, unless a power of attorney has been provided. We reserve the right to deny a request submitted by an agent if suitable and appropriate proof is not provided.
For the 12-month period prior to the date of this Privacy Policy, the Legg Mason Funds have not sold any of your personal information; nor do we have any plans to do so in the future.
Contact Information
Address: Data Privacy Officer, 100 International Dr., Baltimore, MD 21202
Email: DataProtectionOfficer@franklintempleton.com
Phone: 1-800-396-4748
Revised October 2020
|
| NOT PART OF THE ANNUAL REPORT |
www.leggmason.com
© 2020 Legg Mason Investor Services, LLC Member FINRA, SIPC
LMF-285/A 12/20 SR20-4020
The registrant has adopted a code of ethics that applies to the registrant’s principal executive officer, principal financial officer, principal accounting officer or controller.
| ITEM 3. | AUDIT COMMITTEE FINANCIAL EXPERT. |
The Board of Trustees of the registrant has determined that Arthur S. Mehlman the Chairman of the Board’s Audit Committee and Robert M. Tarola, possess the technical attributes identified in Instruction 2(b) of Item 3 to Form N-CSR to qualify as “audit committee financial experts,” and have designated Mr. Mehlman and Mr. Tarola as the Audit Committee’s financial experts. Mr. Mehlman and Mr. Tarola are “independent” Trustees pursuant to paragraph (a) (2) of Item 3 to Form N-CSR.
| ITEM 4. | PRINCIPAL ACCOUNTANT FEES AND SERVICES. |
a) Audit Fees. The aggregate fees billed in the last two fiscal years ending October 31, 2019 and October 31, 2020 (the “Reporting Periods”) for professional services rendered by the Registrant’s principal accountant (the “Auditor”) for the audit of the Registrant’s annual financial statements, or services that are normally provided by the Auditor in connection with the statutory and regulatory filings or engagements for the Reporting Periods, were $208,901 in October 31, 2019 and $200,329 in October 31, 2020.
b) Audit-Related Fees. The aggregate fees billed in the Reporting Period for assurance and related services by the Auditor that are reasonably related to the performance of the Registrant’s financial statements were $0 in October 31, 2019 and $0 in October 31, 2020.
(c) Tax Fees. The aggregate fees billed in the Reporting Periods for professional services rendered by the Auditor for tax compliance, tax advice and tax planning (“Tax Services”) were $0 in October 31, 2019 and $0 in October 31, 2020. These services consisted of (i) review or preparation of U.S. federal, state, local and excise tax returns; (ii) U.S. federal, state and local tax planning, advice and assistance regarding statutory, regulatory or administrative developments, and (iii) tax advice regarding tax qualification matters and/or treatment of various financial instruments held or proposed to be acquired or held.
There were no fees billed for tax services by to the service affiliates during the Reporting Periods that required pre-approval by the Audit Auditors Committee.
d) All Other Fees. The aggregate fees for other fees billed in the Reporting Periods for products and services provided by the Auditor were $0 in October 31, 2019 and $0 in October 31, 2020, other than the services reported in paragraphs (a) through (c) of this item for the Legg Mason Global Asset Management Trust.
All Other Fees. There were no other non-audit services rendered by the Auditor to Legg Mason Partners Fund Advisors, LLC (“LMPFA”), and any entity controlling, controlled by or under common control with LMPFA that provided ongoing services to Legg Mason Global Asset Management Trust requiring pre-approval by the Audit Committee in the Reporting Period.
(e) Audit Committee’s pre–approval policies and procedures described in paragraph (c)
(7) of Rule 2-01 of Regulation S-X.
(1) The Charter for the Audit Committee (the “Committee”) of the Board of each registered investment company (the “Fund”) advised by LMPFA or one of their affiliates (each, an “Adviser”) requires that the Committee shall approve (a) all audit and permissible non-audit services to be provided to the Fund and (b) all permissible non-audit services to be provided by the Fund’s independent auditors to the Adviser and any Covered Service Providers if the engagement relates directly to the operations and financial reporting of the Fund. The Committee may implement policies and procedures by which such services are approved other than by the full Committee.
The Committee shall not approve non-audit services that the Committee believes may impair the independence of the auditors. As of the date of the approval of this Audit Committee Charter, permissible non-audit services include any professional services (including tax services), that are not prohibited services as described below, provided to the Fund by the independent auditors, other than those provided to the Fund in connection with an audit or a review of the financial statements of the Fund. Permissible non-audit services may not include: (i) bookkeeping or other services related to the accounting records or financial statements of the Fund; (ii) financial information systems design and implementation; (iii) appraisal or valuation services, fairness opinions or contribution-in-kind reports; (iv) actuarial services; (v) internal audit outsourcing services; (vi) management functions or human resources; (vii) broker or dealer, investment adviser or investment banking services; (viii) legal services and expert services unrelated to the audit; and (ix) any other service the Public Company Accounting Oversight Board determines, by regulation, is impermissible.
Pre-approval by the Committee of any permissible non-audit services is not required so long as: (i) the aggregate amount of all such permissible non-audit services provided to the Fund, the Adviser and any service providers controlling, controlled by or under common control with the Adviser that provide ongoing services to the Fund (“Covered Service Providers”) constitutes not more than 5% of the total amount of revenues paid to the independent auditors during the fiscal year in which the permissible non-audit services are provided to (a) the Fund, (b) the Adviser and (c) any entity controlling, controlled by or under common control with the Adviser that provides ongoing services to the Fund during the fiscal year in which the services are provided that would have to be approved by the Committee; (ii) the permissible non-audit services were not recognized by the Fund at the time of the engagement to be non-audit services; and (iii) such services are promptly brought to the attention of the Committee and approved by the Committee (or its delegate(s)) prior to the completion of the audit.
(2) For the Legg Mason Global Asset Management Trust, the percentage of fees that were approved by the audit committee, with respect to: Audit-Related Fees were 100% and 100% for October 31, 2019 and October 31, 2020; Tax Fees were 100% and 100% for October 31, 2019 and October 31, 2020; and Other Fees were 100% and 100% for October 31, 2019 and October 31, 2020.
(f) N/A
(g) Non-audit fees billed by the Auditor for services rendered to Legg Mason Global Asset Management Trust, LMPFA and any entity controlling, controlled by, or under common control with LMPFA that provides ongoing services to Legg Mason Global Asset Management Trust during the reporting period were $526,116 in October 31, 2019 and $888,953 in October 31, 2020.
(h) Yes. Legg Mason Global Asset Management Trust’s Audit Committee has considered whether the provision of non-audit services that were rendered to Service Affiliates, which were not pre-approved (not requiring pre-approval), is compatible with maintaining the Accountant’s independence. All services provided by the Auditor to the Legg Mason Global Asset Management Trust or to Service Affiliates, which were required to be pre-approved, were pre-approved as required.
| ITEM 5. | AUDIT COMMITTEE OF LISTED REGISTRANTS. |
| | a) | The independent board members are acting as the registrant’s audit committee as specified in Section 3(a)(58)(B) of the Exchange Act. The Audit Committee consists of the following Board members: |
Ruby P. Hearn
Arnold L. Lehman
Robin J.W. Masters
Jill E. McGovern
Arthur S. Mehlman
G. Peter O’Brien
S. Ford Rowan
Robert M. Tarola
| ITEM 6. | SCHEDULE OF INVESTMENTS. |
Included herein under Item 1.
| ITEM 7. | DISCLOSURE OF PROXY VOTING POLICIES AND PROCEDURES FOR CLOSED-END MANAGEMENT INVESTMENT COMPANIES. |
Not applicable.
| ITEM 8. | PORTFOLIO MANAGERS OF CLOSED-END MANAGEMENT INVESTMENT COMPANIES. |
Not applicable.
| ITEM 9. | PURCHASES OF EQUITY SECURITIES BY CLOSED-END MANAGEMENT INVESTMENT COMPANY AND AFFILIATED PURCHASERS. |
Not applicable.
| ITEM 10. | SUBMISSION OF MATTERS TO A VOTE OF SECURITY HOLDERS. |
Not applicable.
| ITEM 11. | CONTROLS AND PROCEDURES. |
| | (a) | The registrant’s principal executive officer and principal financial officer have concluded that the registrant’s disclosure controls and procedures (as defined in Rule 30a- 3(c) under the Investment Company Act of 1940, as amended (the “1940 Act”)) are effective as of a date within 90 days of the filing date of this report that includes the disclosure required by this paragraph, based on their evaluation of the disclosure controls and procedures required by Rule 30a-3(b) under the 1940 Act and 15d-15(b) under the Securities Exchange Act of 1934. |
| | (b) | There were no changes in the registrant’s internal control over financial reporting (as defined in Rule 30a-3(d) under the 1940 Act) that occurred during the second fiscal quarter of the period covered by this report that have materially affected, or are likely to materially affect the registrant’s internal control over financial reporting. |
| ITEM 12. | DISCLOSURE OF SECURITIES LENDING ACTIVITIES FOR CLOSED-END MANAGEMENT INVESTMENT COMPANIES. |
Not applicable.
(a) (1) Code of Ethics attached hereto.
Exhibit 99.CODE ETH
(a) (2) Certifications pursuant to section 302 of the Sarbanes-Oxley Act of 2002 attached hereto.
Exhibit 99.CERT
(b) Certifications pursuant to Section 906 of the Sarbanes-Oxley Act of 2002 attached hereto.
Exhibit 99.906CERT
SIGNATURES
Pursuant to the requirements of the Securities Exchange Act of 1934 and the Investment Company Act of 1940, the registrant has duly caused this Report to be signed on its behalf by the undersigned, there unto duly authorized.
Legg Mason Global Asset Management Trust
| | |
| By: | | /s/ Jane Trust |
| | Jane Trust |
| | Chief Executive Officer |
Date: December 22, 2020
Pursuant to the requirements of the Securities Exchange Act of 1934 and the Investment Company Act of 1940, this report has been signed below by the following persons on behalf of the registrant and in the capacities and on the dates indicated.
| | |
| By: | | /s/ Jane Trust |
| | Jane Trust |
| | Chief Executive Officer |
Date: December 22, 2020
| | |
| By: | | /s/ Christopher Berarducci |
| | Christopher Berarducci |
| | Principal Financial Officer |
Date: December 22, 2020