UNITED STATES
SECURITIES AND EXCHANGE COMMISSION
Washington, D.C. 20549
FORM N-CSR
Certified Shareholder Report of
Registered Management Investment Companies
Investment Company Act File Number: 811-22349
Capital Group Private Client Services Funds
(Exact Name of Registrant as Specified in Charter)
6455 Irvine Center Drive
Irvine, California 92618
(Address of Principal Executive Offices)
Registrant's telephone number, including area code: (213) 486-9200
Date of fiscal year end: October 31
Date of reporting period: October 31, 2016
Courtney R. Taylor
Capital Group Private Client Services Funds
333 South Hope Street
Los Angeles, California 90071
(Name and Address of Agent for Service)
ITEM 1 – Reports to Stockholders
Private Client Services FundsSM
For the year ended October 31, 2016
|

An active approach
Capital Group Core Municipal FundSM
Capital Group Short-Term Municipal FundSM
Capital Group California Core Municipal FundSM
Capital Group California Short-Term Municipal FundSM
Capital Group Core Bond FundSM
Capital Group Global Equity FundSM
Capital Group International Equity FundSM
Capital Group U.S. Equity FundSM |
capitalgrouppcsfunds.com
Capital Group Private Client Services Funds
Letter to investors
October 31, 2016 (unaudited)
Fellow investors:
Global equities advanced modestly in the 12-month period ended October 31, 2016, as stocks overcame several bruising but short-lived sell-offs driven by economic concerns and political upheaval. The U.S. market moved higher as the economy continued its slow but steady upward trajectory. Employment gains were accompanied by improved consumer spending, higher wages, manageable household debt and low gas prices. The hard-hit energy sector began to stabilize as rising household formation bolstered the housing market. The positive forces were counter-balanced by lackluster business spending, export weakness caused by the strong dollar and the specter of a Federal Reserve interest rate hike. Foreign stocks declined as an uptick in commodities prices and attractive valuations were offset by concerns about China’s slowing economy, Europe’s sputtering growth and the United Kingdom’s unexpected decision to withdraw from the European Union. Central banks in Europe and Japan had only moderate success in deploying monetary policy to jump-start their economies.
Fixed-income markets in the U.S. moved higher as economic uncertainty was aggravated by rising political tension in the U.S. and abroad. Yields declined for much of the period and fell to an all-time low in early July. From there, interest rates began to rise as the Chinese economy appeared to stabilize and European economic data was better than expected in the immediate aftermath of the Brexit vote.
Equity Commentary
Over the past 12 months, the Capital Group U.S. Equity Fund rose 4.58%, topping the 4.51% gain in the S&P 500 index. The Capital Group International Equity Fund fell 1.20%, but outpaced its benchmark, the MSCI EAFE Index, which declined 3.23%. The Capital Group Global Equity Fund climbed 1.04%, trailing the 1.18% advance in its benchmark, the MSCI World Index.
Capital Group U.S. Equity Fund
The fund benefited from ongoing improvement in the U.S. economy, particularly a willingness among investors to take on risk as the period drew to a close. Technology stocks propelled both the market and the fund, as companies with proprietary technologies and promising growth prospects came into favor. Among the contributors to results were Broadcom and Texas Instruments. The latter reported strong results with double-digit improvement in free cash flow. An underweight position in Apple, which declined modestly during the period, also contributed to results compared with the benchmark.
One promising area is sensors, which have become common in products such as automobiles, household appliances and industrial machinery. Sensors can detect whether a car has veered into another lane or gotten too close to the vehicle in front of it. As they become more sophisticated, sensors also have a range of applications in manufacturing.
The fund also benefited from holdings in the financial sector, particularly among companies that are relatively insulated from interest-rate pressures. Iron Mountain was helped by the successful completion of a merger, coupled with a compelling dividend yield. Marsh & McLennan benefited from being a stable and defensive business with an attractive yield in an uncertain market.
There was strong performance in other sectors, driven partially by mergers. Among industrial stocks, Waste Connections was the top contributor to the fund as the company raised its dividend by double digits and agreed to merge with Progressive Waste Solutions. In the energy sector, Columbia Pipeline Group received
| Private Client Services Funds | 1 |
Capital Group Private Client Services Funds
Letter to investors
October 31, 2016 (unaudited) (continued)
a takeover bid from rival TransCanada. Among consumer discretionary companies, Newell Brands finalized its merger with Jarden and released detailed plans for growth.
On the downside, the fund was negatively impacted by weakness in the health care industry. Following a multi-year surge, the sector experienced a broad sell-off partially due to the threat of increased drug price regulation amid heightened political attention. Of the top 10 detractors from results, seven were health care companies. Express Scripts was affected by the debate around pricing in the prescription benefits management business. AmerisourceBergen also felt the impact of the drug pricing controversy. Gilead Sciences grappled with heightened competition and pricing headwinds. Incyte reported disappointing results in one of its drug trials.
Despite the weakness in health care stocks, the sector remains attractive. Over the past year, holdings have been adjusted to focus on companies offering promising research and reasonable valuations. As populations age throughout the world, there will be increased demand for a range of drugs and medical treatments that boost health in a cost-effective manner.
Capital Group International Equity Fund
The slowing of China’s economy, limited efficacy of stimulus efforts in Europe and Japan, and surprise Brexit vote all took a toll on foreign markets. Although economic activity in the eurozone surpassed its pre-financial-crisis level, the region continued to be plagued by tepid growth and chronically low inflation. International shares rallied toward the end of the period as investors were lured by attractive valuations and the thus-far benign impact of Brexit.
Several detractors within the fund were affected by China’s slowing economy — both within the country, such as China Everbright, and elsewhere in the world, such as luxury-goods maker Compagnie Financiére Richemont. In addition to the pressures weighing on all global banks, Lloyds Banking Group felt the impact of the Brexit vote, specifically weakness in the British pound and fears of a possible economic slowdown in the U.K.
Novo Nordisk was hurt by a variety of factors, including reduced earnings guidance, increased spending for a new-product launch and the retirement of its chief executive. Liberty Global suffered from investor disappointment at both the lack of progress in the Vodafone merger and the lack of significant asset sales.
The fund was helped by strong results from information technology, with three of the top five contributors in that sector. The fund also benefited from Danish biotechnology company Genmab, which received earlier-than-expected approval for its drug to treat multiple myeloma. The fund also got a boost from Deutsche Wohnen, which benefited from a strong rental market in Berlin and its successful defense against an unwanted takeover bid.
Capital Group Global Equity Fund
The fund benefited significantly from the global rally in technology, with three top contributors — Keyence, Taiwan Semiconductor Manufacturing and Broadcom — coming from that sector. Financial stocks, particularly those not directly exposed to interest rates, also boosted the fund. Deutsche Wohnen and CME Group were among the top contributors. Energy stocks, including Chevron and Enbridge, also helped returns as oil prices began to stabilize.
| 2 | Private Client Services Funds |
Capital Group Private Client Services Funds
Letter to investors
October 31, 2016 (unaudited) (continued)
On the downside, health care stocks declined sharply as broad weakness in the sector was aggravated by setbacks at specific companies. Novo Nordisk was clipped by reduced earnings guidance, increased spending for a new-product launch and the retirement of its chief executive. Incyte reported disappointing results in one of its drug trials.
Consumer discretionary stocks also weighed on the fund because of the uncertain footing of the global economy. Clothing retailer Marks and Spencer detracted from results, as did Royal Caribbean Cruises. After several years of impressive growth, cruise lines weakened as investors worried about international terrorism and the risk of further slowing in China.
Fixed-Income Commentary
Global economic concerns caused interest rates to decline through much of the period. The Capital Group Core Bond, Core Municipal, Short-Term Municipal, California Core Municipal and California Short-Term Municipal bond funds all surpassed their respective benchmarks.
Bond yields began to rise toward the end of the period, in part because of expectations that the Federal Reserve would soon raise rates. With rock-bottom interest rates throughout the world failing to stoke growth, there were increasing expectations that political leaders might supplement central bank actions with government spending.
Capital Group Core Bond Fund
The Core Bond fund had a total return of 3.03%, outpacing the 2.69% return of its benchmark. The fund had an underweight position in U.S. Treasuries and a slight overweight in investment-grade corporate bonds. It was also overweight asset-backed securities, whose repayment streams are tied to credit cards, auto loans and mortgages. Beyond that, energy-related securities have helped to boost yields without adding undue risk.
Capital Group Core Municipal Fund and Capital Group Short-Term Municipal Fund
The Core Municipal fund had a total return of 1.97%, compared with 2.01% for its benchmark. The fund invests in a range of high-quality revenue bonds, which are issued to finance public-related services such as roads, bridges, airports and schools. Nearly one-quarter of the fund’s assets were in transportation bonds, almost 20% were in government securities, and slightly more than 17% were in health care issues.
The Short-Term Municipal fund rose 1.06%, beating the 0.86% return of its benchmark. More than 22% of the fund’s assets were in transportation-related bonds. Nearly 15% were in housing-related securities, and an additional 16% were in government holdings.
Capital Group California Core Municipal Fund and Capital Group California Short-Term Municipal Fund
The California Core Municipal fund rose 2.68%, exceeding the 1.75% return of its benchmark. Hospitals have been an attractive sector, in part because the financial conditions and investment opportunities differ greatly from one medical center to the next.
The California Short-Term Municipal fund had a total return of 0.63%, trailing the 0.71% return of its benchmark. The fund had more than 42% of its assets in government securities. Almost 16% were in utilities bonds, and nearly 14% were in education-related holdings.
| Private Client Services Funds | 3 |
Capital Group Private Client Services Funds
Letter to investors
October 31, 2016 (unaudited) (continued)
Volatility in fixed income may intensify as the Federal Reserve moves toward an expected rate hike. That may cause turbulence in some areas of the bond market, potentially creating opportunities to enhance yield. Regardless of the direction of rates, bonds are designed to provide stability in periods when equity prices can gyrate. During such times, fixed income can help to smooth out the inevitable fluctuations in the financial markets.
Sincerely yours,

John S. Armour
President

William L. Robbins
Principal Investment Officer and Equity Portfolio Manager

John R. Queen
Senior Vice President and Fixed-Income Portfolio Manager
| 4 | Private Client Services Funds |
Capital Group Core Municipal Fund
October 31, 2016
Growth of $25,000 investment
Here’s how a $25,000 investment in the Capital Group Core Municipal Fund grew between April 13, 2010, when the fund began operations, and October 31, 2016, the end of the fund’s fiscal year.
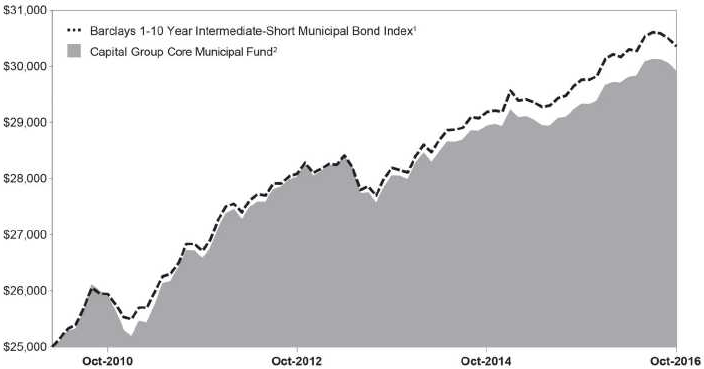
| 1 | The index is unmanaged, and its results include reinvested distributions but do not reflect the effect of sales charges, commissions, or expenses. |
| 2 | Includes reinvested dividends and capital gain distributions. |
Results are for past periods and are not predictive of results for future periods. Current and future results may be lower or higher than those shown. Share price and returns will vary so investors may lose money. The results shown are before taxes on fund distributions and sale of fund shares.
Investment portfolio – quality ratings*
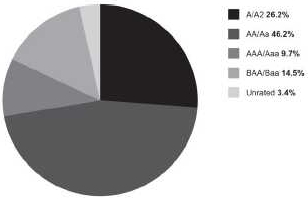
| * | Bond ratings, which typically range from Aaa/AAA (highest to D (lowest), are assigned by credit rating agencies such as Moody’s, Standard & Poors and/or Fitch as an indication of an Issuer’s credit-worthiness. If agency rating differ, securities are put in the highest category consistent with fund investment policies. When securities have not been rated by a rating agency (included in “unrated” at left), the investment advisor performs it’s own credit analysis and assigns comparable ratings that are used for compliance and fund investment policies. The ratings are not covered by the Report of Independent Registered Public Accounting Firm. |
| Private Client Services Funds | 5 |
Capital Group Core Municipal Fund
Schedule of investments
October 31, 2016
| Bonds & notes - 95.0% | Principal amount (000) | Value (000) | ||||||
| Municipals - 94.9% | ||||||||
| Alabama - 2.0% | ||||||||
| Alabama 21st Century Auth., Rev. Ref. Bonds, Series A, 5.00%, 2021 | $ | 2,230 | $ | 2,562 | ||||
| Alabama Federal Aid Highway Fin. Auth., Highway Imps. Misc. Taxes Rev. Bonds, 5.00%, 2023 | 100 | 118 | ||||||
| Alabama Public School & College Auth., Sales Tax Rev. Ref. Bonds, Series A, 5.00%, 2017 | 1,000 | 1,022 | ||||||
| Black Belt Energy Gas Dist., Natural Gas Util. Imps. Rev. Bonds, Series A (Mandatory Put 06/01/21 @ 100), 4.00%, 20461 | 4,000 | 4,406 | ||||||
| Univ. of Alabama, Health Care Facs. Rev. Ref. Bonds, Series A, 5.00%, 2018 | 150 | 161 | ||||||
| 8,269 | ||||||||
| Alaska - 0.4% | ||||||||
| Alaska Housing Fin. Corp., Rev. Bonds, Series A, 4.00%, 2040 | 395 | 406 | ||||||
| Alaska Intl. Airports System, Port, Airport & Marina Rev. Ref. Bonds, Series A, 5.00%, 2024 | 1,000 | 1,239 | ||||||
| 1,645 | ||||||||
| Arizona - 2.7% | ||||||||
| Arizona Health Facs. Auth., Health Care Facs. Rev. Ref. Bonds (Mandatory Put 02/05/20 @ 100), 2.48%, 20481 | 3,100 | 3,155 | ||||||
| Arizona Health Facs. Auth., Health Care Facs. Rev. Ref. Bonds, Series A, 5.00%, 2024 | 300 | 367 | ||||||
| Glendale Ind. Dev. Auth., College & Univ. Rev. Ref. Bonds, 5.25%, 2018 | 1,000 | 1,061 | ||||||
| Maricopa County Ind. Dev. Auth., Health Care Facs. Rev. Ref. Bonds, 5.00%, 2018 | 795 | 816 | ||||||
| Phoenix Civic Imp. Corp., Port, Airport, & Marina Rev. Ref. Bonds, Series A, 5.00%, 2020 | 2,800 | 3,177 | ||||||
| Phoenix Civic Imp. Corp., Sewer Rev. Ref. Bonds, 5.50%, 2024 | 125 | 134 | ||||||
| Phoenix Ind. Dev. Auth., Misc. Purposes Lease Rev. Bonds, 5.00%, 2022 | 1,000 | 1,079 | ||||||
| Salt River Project Agricultural Imp. & Power Dist., Energy Res. Auth. Imps. Rev. Bonds, Series A: | ||||||||
| 5.00%, 2020 | 160 | 174 | ||||||
| 5.00%, 2021 | 1,000 | 1,048 | ||||||
| 11,011 | ||||||||
| Arkansas - 0.2% | ||||||||
| Arkansas Dev. Fin. Auth., Health Care Facs. Rev. Bonds (Mandatory Put 09/01/22 @ 100), 2.18%, 20441 | 600 | 595 | ||||||
| 595 | ||||||||
| California - 13.1% | ||||||||
| Abag Fin. Auth. for Nonprofit Corps., Public Imps. Special Tax Ref. Bonds (CIFG Insured), 5.00%, 2021 | 990 | 1,022 | ||||||
| Anaheim Public Fncg. Auth., Energy Res. Auth. Rev. Ref. Bonds (NATL-RE Insured), 4.00%, 2017 | 100 | 101 | ||||||
| Bay Area Toll Auth., Highway Tolls Rev. Bonds (Mandatory Put 05/01/23 @ 100):1 | ||||||||
| 1.53%, 2045 | 2,200 | 2,198 | ||||||
| 1.53%, 2047 | 1,500 | 1,499 | ||||||
| Bay Area Toll Auth., Highway Tolls Rev. Bonds (Mandatory Put 10/01/19 @ 100), 1.33%, 20471 | 1,000 | 1,000 | ||||||
| California Health Facs. Fncg. Auth., Health Care Facs. Rev. Ref. Bonds (CA Mtg. Ins.): | ||||||||
| 5.00%, 2026 | 300 | 368 | ||||||
| 5.00%, 2028 | 315 | 375 | ||||||
| California Health Facs. Fncg. Auth., Health Care Facs. Rev. Ref. Bonds, Series A: | ||||||||
| 5.00%, 2019 | 750 | 840 | ||||||
| 5.00%, 2020 | 1,000 | 1,130 | ||||||
| California Health Facs. Fncg. Auth., Health Care Facs. Rev. Ref. Bonds, Series D (Mandatory Put 10/15/20 @ 100), 5.00%, 20431 | 1,800 | 2,059 | ||||||
| 6 | Private Client Services Funds |
Capital Group Core Municipal Fund
Schedule of investments
October 31, 2016
| Bonds & notes - continued | Principal amount (000) | Value (000) | ||||||
| Municipals - continued | ||||||||
| California - continued | ||||||||
| California Infrastructure & Econ. Dev. Bank, Misc. Rev. Ref. Bonds (Mandatory Put 04/01/18 @ 100), 0.91%, 20471 | $ | 1,000 | $ | 1,001 | ||||
| California Muni. Fin. Auth., Health Care Facs. Rev. Ref. Bonds, 5.00%, 2024 | 485 | 580 | ||||||
| California Statewide Comms. Dev. Auth., Health Care Facs. Nursing Homes Rev. Bonds, 2.40%, 2020 | 1,250 | 1,251 | ||||||
| California Statewide Comms. Dev. Auth., Health Care Facs. Rev. Ref. Bonds, 5.00%, 2022 | 1,000 | 1,172 | ||||||
| California Statewide Comms. Dev. Auth., Private Schools Rev. Ref. Bonds, Series B (Mandatory Put 06/01/22 @ 100), 1.83%, 20371 | 1,000 | 1,005 | ||||||
| Cathedral City Redev. Agcy. Successor Agcy., Tax Allocation Rev. Ref. Bonds (AGM Insured), 5.00%, 2025 | 620 | 759 | ||||||
| Center Unified School Dist., G.O. Prop. Tax Ref. Bonds (BAM Insured), 0.00%, 20262 | 475 | 373 | ||||||
| Chula Vista Muni. Fncg. Auth., Special Tax Rev. Ref. Bonds, 5.00%, 2020 | 910 | 1,034 | ||||||
| City & County of San Francisco, Health Care Imps. Certs. of Part. Lease Bonds, Series A, 5.00%, 2017 | 100 | 102 | ||||||
| City of Irvine, Special Assessment Ref. Bonds: | ||||||||
| 3.125%, 2021 | 565 | 601 | ||||||
| 4.00%, 2017 | 1,215 | 1,246 | ||||||
| 5.00%, 2023 | 900 | 1,099 | ||||||
| City of Long Beach CA Harbor Rev., Port, Airport & Marina Rev. Ref. Bonds, Series B, 5.00%, 2024 | 685 | 855 | ||||||
| Clovis Unified School Dist., G.O. School Imps. Prop. Tax Bonds, Series A (NATL-RE Insured), 0.00%, 20252 | 500 | 411 | ||||||
| Emeryville Redev. Agcy. Successor Agcy., Tax Increment Allocation Ref. Bonds, Series A, 5.00%, 2020 | 900 | 1,031 | ||||||
| Fillmore Redev. Agcy. Successor Agcy., Tax Increment Allocation Ref. Bonds (BAM Insured), 5.00%, 2022 | 1,000 | 1,193 | ||||||
| Golden State Tobacco Securitization Corp., Approp. Rev. Ref. Bonds, Series A (AGM Insured), 0.00%, 20262 | 1,000 | 812 | ||||||
| Golden State Tobacco Securitization Corp., Misc. Rev. Ref. Bonds, Series A, 5.00%, 2020 | 1,000 | 1,132 | ||||||
| Golden State Tobacco Securitization Corp., Rev. Ref. Bonds, Series A: | ||||||||
| 5.00%, 2019 | 1,170 | 1,287 | ||||||
| 5.00%, 2020 | 750 | 850 | ||||||
| 5.00%, 2021 | 1,000 | 1,167 | ||||||
| Hemet Unified School Dist., G.O. Prop. Tax Ref. Bonds (AGM Insured), 5.00%, 2029 | 500 | 595 | ||||||
| Jurupa Public Fncg. Auth., Special Tax Ref. Bonds, Series A, 5.00%, 2030 | 850 | 1,003 | ||||||
| Kings Canyon Unified School Dist., G.O. Prop. Tax Ref. Bonds (AGM Insured), 5.00%, 2028 | 875 | 1,071 | ||||||
| Lancaster Redev. Agcy. Successor Agcy., Tax Allocation Rev. Ref. Bonds (AGM Insured): | ||||||||
| 5.00%, 2024 | 175 | 214 | ||||||
| 5.00%, 2026 | 825 | 1,031 | ||||||
| Los Angeles County Metropolitan Trans. Auth., Sales Tax Rev. Ref. Bonds, 5.00%, 2021 | 100 | 118 | ||||||
| Los Angeles County Redev. Auth., Tax Allocation Rev. Ref. Bonds, Series D, 5.00%, 2020 | 700 | 792 | ||||||
| Menlo Park Comm. Dev. Agcy. Successor Agcy., Tax Increment Allocation Rev. Ref. Bonds (AGM Insured), 5.00%, 2022 | 800 | 962 | ||||||
| Metropolitan Water Dist. of Southern California, Water Rev. Ref. Bonds, Series B-1 (Mandatory Put 03/27/18 @ 100), 1.01%, 20271 | 1,350 | 1,349 | ||||||
| Monterey Peninsula Comm. College Dist., G.O. Prop. Tax Ref. Bonds:2 | ||||||||
| 0.00%, 2023 | 1,470 | 1,308 | ||||||
| 0.00%, 2024 | 565 | 488 | ||||||
| Northern California Gas Auth. No. 1, Natural Gas Util. Imps. Rev. Bonds, 1.197%, 20191 | 100 | 99 | ||||||
| Perris Union High School Dist., Special Tax Ref. Bonds, 5.00%, 2030 | 1,250 | 1,442 | ||||||
| Rancho Cordova Comm. Facs. Dist., Public Imps. Special Tax Ref. Bonds, 4.00%, 2024 | 500 | 565 | ||||||
| Private Client Services Funds | 7 |
Capital Group Core Municipal Fund
Schedule of investments
October 31, 2016
| Bonds & notes - continued | Principal amount (000) | Value (000) | ||||||
| Municipals - continued | ||||||||
| California - continued | ||||||||
| San Diego County Regional Trans. Commission, Sales Tax Rev. Ref. Bonds, Series A, 5.00%, 2020 | $ | 250 | $ | 285 | ||||
| San Diego Redev. Agcy. Successor Agcy., Tax Increment Allocation Rev. Ref. Bonds, Series A: | ||||||||
| 5.00%, 2024 | 900 | 1,122 | ||||||
| 5.00%, 2025 | 500 | 631 | ||||||
| San Jose Redev. Agcy., Tax Allocation Rev. Ref. Bonds (NATL-RE Insured), 4.54%, 2018 | 200 | 201 | ||||||
| Santa Ana Comm. Redev. Agcy., Tax Allocation Rev. Ref. Bonds, 5.25%, 2019 | 600 | 669 | ||||||
| Santa Cruz County Redev. Agcy., Special Assessment Ref. Bonds, Series A (AGM Insured), 5.00%, 2026 | 1,825 | 2,266 | ||||||
| South San Francisco Unified School Dist., G.O. Series C, 0.00%, 20242 | 750 | 645 | ||||||
| State of California, G.O. General Fund Ref. Bonds: | ||||||||
| 5.00%, 2017 | 500 | 506 | ||||||
| 5.00%, 2020 | 1,500 | 1,691 | ||||||
| State of California, G.O. Sales Tax Rev. Ref. Bonds, Series A (Pre-refunded with U.S. Treasury Obligations 07/01/19 @ 100): | ||||||||
| 5.00%, 2020 | 520 | 576 | ||||||
| 5.25%, 2021 | 100 | 111 | ||||||
| Stockton Public Fin. Auth., Sewer Rev. Ref. Bonds (BAM Insured), 5.00%, 2023 | 375 | 459 | ||||||
| Tracy Comm. Dev. Agcy. Successor Agcy., Tax Allocation Rev. Ref. Bonds (AGM Insured), 5.00%, 2030 | 1,000 | 1,197 | ||||||
| Tuolumne Wind Project Auth., Energy Res. Auth. Imps. Rev. Bonds, Series A, 5.25%, 2024 | 200 | 219 | ||||||
| Ukiah Unified School Dist., G.O. School Imps. Prop. Tax Bonds (NATL-RE Insured), 0.00%, 20232 | 2,260 | 1,990 | ||||||
| 53,158 | ||||||||
| Colorado - 3.5% | ||||||||
| City & County of Denver, Port, Airport & Marina Rev. Ref. Bonds, Series A, 5.25%, 2028 | 200 | 224 | ||||||
| City & County of Denver, Port, Airport & Marina Rev. Ref. Bonds, Series A (NATL-RE FGIC Insured), 5.00%, 2017 | 300 | 301 | ||||||
| City & County of Denver, Port, Airport, & Marina Rev. Ref. Bonds, Series B, 5.00%, 2021 | 500 | 587 | ||||||
| Colorado Health Facs. Auth., Health Care Facs. Rev. Bonds (Mandatory Put 11/15/23 @ 100), 5.00%, 20361 | 1,570 | 1,903 | ||||||
| Colorado Health Facs. Auth., Health Care Facs. Rev. Ref. Bonds: | ||||||||
| 5.00%, 2024 | 1,825 | 2,158 | ||||||
| 5.00%, 2026 | 2,000 | 2,334 | ||||||
| Colorado Health Facs. Auth., Health Care Facs. Rev. Ref. Bonds (Pre-refunded with U.S. Treasury Obligations to 11/15/16 @ 100), 5.125%, 20171 | 115 | 115 | ||||||
| Colorado Health Facs. Auth., Health Care Facs. Rev. Ref. Bonds, Series B, 5.00%, 2017 | 2,000 | 2,014 | ||||||
| Colorado State Board of Governors, College & Univ. Imps. Rev. Ref. Bonds, Series A, 5.00%, 2022 | 645 | 766 | ||||||
| E-470 Public Highway Auth., Highway Tolls Rev. Bonds, Series CD (Mandatory Put 06/01/15 @ 100), 2.38%, 20391 | 475 | 476 | ||||||
| Mountain Shadows Metropolitan Dist., G.O. Prop. Tax Ref. Bonds, 4.00%, 2026 | 735 | 748 | ||||||
| Park Creek Metropolitan Dist., Tax Increment Allocation Ref. Bonds, 5.00%, 2024 | 1,100 | 1,315 | ||||||
| Regional Trans. Dist., Transit Imps. Cert. of Part. Lease Bonds, Series A, 5.00%, 2018 | 1,000 | 1,063 | ||||||
| Univ. of Colorado., College & Univ. Imps. Rev. Bonds, Series A, 5.00%, 2020 | 150 | 171 | ||||||
| 14,175 | ||||||||
| Connecticut - 0.3% | ||||||||
| Connecticut Housing Fin. Auth., Loc. or GTD Housing Rev. Bonds, Series A, 3.50%, 2044 | 340 | 358 | ||||||
| 8 | Private Client Services Funds |
Capital Group Core Municipal Fund
Schedule of investments
October 31, 2016
| Bonds & notes - continued | Principal amount (000) | Value (000) | ||||||
| Municipals - continued | ||||||||
| Connecticut - continued | ||||||||
| Connecticut Housing Fin. Auth., Loc. or GTD Housing Rev. Ref. Bonds, Series A-1, 4.00%, 2045 | $ | 895 | $ | 964 | ||||
| 1,322 | ||||||||
| District of Columbia - 0.2% | ||||||||
| Dist. of Columbia, Income Tax Rev. Ref. Bonds, Series A, 5.00%, 2024 | 700 | 877 | ||||||
| 877 | ||||||||
| Florida - 8.3% | ||||||||
| Brevard County Health Facs. Auth., Health Care Facs. Rev. Ref. Bonds: | ||||||||
| 5.00%, 2021 | 500 | 574 | ||||||
| 5.00%, 2022 | 500 | 587 | ||||||
| Citizens Prop. Insurance Corp., Cash Flow Mgmt. Misc. Rev. Bonds, Series A-1, 5.25%, 2017 | 2,100 | 2,155 | ||||||
| Citizens Prop. Insurance Corp., Misc. Purposes Rev. Bonds, Series A-1: | ||||||||
| 5.00%, 2019 | 1,500 | 1,649 | ||||||
| 5.00%, 2020 | 1,100 | 1,243 | ||||||
| Citizens Prop. Insurance Corp., Misc. Rev. Bonds, Series A-1, 5.00%, 2019 | 150 | 165 | ||||||
| City of Cape Coral, Water Rev. Ref. Bonds, 5.00%, 2018 | 1,000 | 1,073 | ||||||
| City of Clearwater, Water Rev. Ref. Bonds, Series B, 5.00%, 2018 | 100 | 108 | ||||||
| City of Jacksonville, Sales Tax Rev. Ref. Bonds, 5.00%, 2019 | 1,000 | 1,112 | ||||||
| City of Tallahassee, Health Care Facs. Imps. Rev. Bonds, 5.00%, 2025 | 1,000 | 1,222 | ||||||
| City of Tampa, Health Care Facs. Rev. Ref. Bonds, 5.00%, 2017 | 2,000 | 2,086 | ||||||
| County of Lee Trans. Facs. Rev., Highway Tolls Rev. Ref. Bond (AGM Insured): | ||||||||
| 5.00%, 2021 | 500 | 585 | ||||||
| 5.00%, 2022 | 1,300 | 1,554 | ||||||
| County of Miami-Dade, Port, Airport & Marina Imps. Rev. Bonds, Series B, 5.00%, 2018 | 1,100 | 1,184 | ||||||
| Florida Higher Educ. Facs. Financial Auth., College & Univ. Imps. Rev. Ref. Bonds, 5.00%, 2022 | 1,000 | 1,161 | ||||||
| Florida Housing Fin. Corp., Loc. or GTD Housing Rev. Bonds (GNMA/FNMA/FHLMC Insured), 5.00%, 2028 | 310 | 323 | ||||||
| Florida Housing Fin. Corp., Loc. or GTD Housing Rev. Bonds, Series B, 4.50%, 2029 | 475 | 503 | ||||||
| Florida Housing Fin. Corp., Loc. or GTD Housing Rev. Bonds, Series B (GNMA/FNMA/FHLMC Insured), 4.50%, 2029 | 285 | 301 | ||||||
| Florida Muni. Power Agcy., Misc. Rev. Ref. Bonds, Series A, 5.00%, 2020 | 600 | 683 | ||||||
| Florida State Dept. of Environmental Protection, Public Imps. Misc. Taxes Rev. Bonds, Series B, 5.00%, 2019 | 1,450 | 1,562 | ||||||
| Florida Water Pollution Control Fncg. Corp., Pollution Control Misc. Rev. Bonds, Series A: | ||||||||
| 5.00%, 2020 | 300 | 325 | ||||||
| 5.00%, 2022 | 400 | 433 | ||||||
| 5.00%, 2023 | 300 | 325 | ||||||
| Miami-Dade County Expressway Auth., Highway Tolls Rev. Ref. Bonds, Series A, 5.00%, 2021 | 1,750 | 2,037 | ||||||
| Mid-Bay Bridge Auth., Highway Tolls Rev. Ref. Bonds, Series C, 5.00%, 2021 | 575 | 653 | ||||||
| Orlando Utils. Commission Water Rev. Ref. Bonds, Series B, 5.00%, 2023 | 225 | 245 | ||||||
| Orlando Utils. Commission Water Rev. Ref. Bonds, Series B (Pre-refunded with U.S. Treasury Obligations 04/01/19 @ 100), 5.00%, 2023 | 175 | 192 | ||||||
| Orlando Utils. Commission, Multiple Util. Rev. Ref. Bonds, Series C, 5.00%, 2017 | 1,000 | 1,039 | ||||||
| Palm Beach County Health Facs. Auth., Health Care Facs. Rev. Ref. Bonds, 5.00%, 2027 | 300 | 359 | ||||||
| Seminole Tribe of Florida, Inc., Public Imps. Misc. Rev. Bonds, Series A, 5.50%, 20243 | 1,000 | 1,034 | ||||||
| South Florida Water Mgmt. Dist., Cert. of Part. Lease Ref. Bonds, 5.00%, 2025 | 1,500 | 1,870 | ||||||
| Southeast Overtown Park West Comm Redev. Agcy., Tax Increment Allocation Local Housing Rev. Ref. Bonds, Series A-1:3 | ||||||||
| 5.00%, 2019 | 1,000 | 1,067 | ||||||
| Private Client Services Funds | 9 |
Capital Group Core Municipal Fund
Schedule of investments
October 31, 2016
| Bonds & notes - continued | Principal amount (000) | Value (000) | ||||||
| Municipals - continued | ||||||||
| Florida - continued | ||||||||
| 5.00%, 2021 | $ | 785 | $ | 872 | ||||
| Tampa Bay Water Rev. Ref. Bonds, Series B, 5.00%, 2018 | 430 | 464 | ||||||
| Volusia County Educ. Fac. Auth., College & Univ. Imps. Rev. Bonds, Series B: | ||||||||
| 5.00%, 2023 | 400 | 477 | ||||||
| 5.00%, 2028 | 1,000 | 1,178 | ||||||
| Winter Garden Village at Fowler Groves Comm. Dev. Dist., Special Assessment Ref. Bonds, 3.00%, 2024 | 1,350 | 1,348 | ||||||
| 33,748 | ||||||||
| Georgia - 1.9% | ||||||||
| Burke County Dev. Auth., Pollution Control Res. Recovery Rev. Bonds, 7.00%, 2023 | 300 | 320 | ||||||
| DeKalb County Hospital Auth., Health Care Facs. Imps. Rev. Bonds, 5.25%, 2020 | 1,640 | 1,781 | ||||||
| DeKalb Private Hospital Auth., Health Care Facs. Rev. Ref. Bonds, 5.00%, 2024 | 200 | 223 | ||||||
| Georgia Housing & Fin. Auth., Loc. or GTD Housing Rev. Bonds, 4.00%, 2044 | 1,385 | 1,461 | ||||||
| Georgia State Road & Tollway Auth., Highway Imps. Misc. Taxes Rev. Bonds, Series A, 5.00%, 2018 | 400 | 425 | ||||||
| Metropolitan Atlanta Rapid Transit Auth., Sales Tax Rev. Bonds, Series A (Mandatory Put 07/01/17 @ 100), 0.93%, 20251 | 800 | 800 | ||||||
| Muni. Electric Auth. of Georgia, Energy Res. Auth. Rev. Ref. Bonds, Series A, 5.00%, 2019 | 1,000 | 1,116 | ||||||
| Muni. Electric Auth. of Georgia, Energy Res. Auth. Rev. Ref. Bonds, Sub-Series A, 5.00%, 2021 | 500 | 576 | ||||||
| Private Colleges & Universities Auth., College & Univ. Imps. Rev. Bonds, 5.00%, 2020 | 1,000 | 1,113 | ||||||
| 7,815 | ||||||||
| Guam - 0.4% | ||||||||
| Guam Intl. Airport Auth., Port, Airport & Marina Rev. Ref. Bonds, Series B, 5.00%, 2023 | 1,200 | 1,414 | ||||||
| 1,414 | ||||||||
| Hawaii - 0.5% | ||||||||
| State of Hawaii, G.O. Public Imps., Series DZ, 5.00%, 2019 | 1,250 | 1,401 | ||||||
| State of Hawaii, Port, Airport & Marina Rev. Ref. Bonds, Series A, 5.00%, 2022 | 700 | 797 | ||||||
| 2,198 | ||||||||
| Idaho - 0.6% | ||||||||
| Idaho Housing & Fin. Association, Rev. Ref. Bonds: | ||||||||
| 5.00%, 2020 | 1,000 | 1,127 | ||||||
| 5.00%, 2022 | 1,000 | 1,179 | ||||||
| 2,306 | ||||||||
| Illinois - 8.9% | ||||||||
| Chicago O’Hare Intl. Airport, Port, Airport & Marina Rev. Ref. Bonds, Series B, 5.00%, 2021 | 250 | 287 | ||||||
| City of Chicago, Port, Airport & Marina Imps. Rev. Bonds, Series A, 4.00%, 2017 | 1,675 | 1,684 | ||||||
| City of Chicago, Port, Airport & Marina Imps. Rev. Bonds, Series C (Assured GTY Insured), 5.25%, 2022 | 1,000 | 1,120 | ||||||
| City of Chicago, Port, Airport & Marina Rev. Ref. Bonds, Series B, 5.00%, 2021 | 500 | 576 | ||||||
| City of Chicago, Sewer Imps. Rev. Bonds, 4.00%, 2021 | 1,000 | 1,077 | ||||||
| Illinois Fin. Auth., College & Univ. Imps. Rev. Bonds, 5.00%, 2022 | 200 | 213 | ||||||
| Illinois Fin. Auth., College & Univ. Imps. Rev. Ref. Bonds, Series B (Mandatory Put 02/01/19 @ 100), 1.65%, 20251 | 2,000 | 2,017 | ||||||
| 10 | Private Client Services Funds |
Capital Group Core Municipal Fund
Schedule of investments
October 31, 2016
| Bonds & notes - continued | Principal amount (000) | Value (000) | ||||||
| Municipals - continued | ||||||||
| Illinois - continued | ||||||||
| Illinois Fin. Auth., College & Univ. Rev. Ref. Bonds, 5.125%, 2020 | $ | 930 | $ | 996 | ||||
| Illinois Fin. Auth., Health Care Facs. Imps. Rev. Bonds: | ||||||||
| 5.00%, 2022 | 850 | 1,009 | ||||||
| 5.00%, 2027 | 590 | 709 | ||||||
| 5.00%, 2027 | 600 | 706 | ||||||
| Illinois Fin. Auth., Health Care Facs. Imps. Rev. Bonds, Series A: | ||||||||
| 5.00%, 2021 | 500 | 585 | ||||||
| 5.00%, 2027 | 250 | 301 | ||||||
| Illinois Fin. Auth., Health Care Facs. Imps. Rev. Bonds, Series A-3 (Mandatory Put 05/01/19 @ 100), 5.00%, 20301 | 1,000 | 1,095 | ||||||
| Illinois Fin. Auth., Health Care Facs. Imps. Rev. Bonds, Series C, 5.00%, 2026 | 1,665 | 1,918 | ||||||
| Illinois Fin. Auth., Health Care Facs. Rev. Ref. Bonds, Series A-1 (Mandatory Put 01/15/20 @ 100), 5.00%, 20301 | 1,500 | 1,677 | ||||||
| Illinois Fin. Auth., Misc. Rev. Ref. Bonds: | ||||||||
| 5.00%, 2025 | 125 | 152 | ||||||
| 5.00%, 2026 | 120 | 147 | ||||||
| Illinois Housing Dev. Auth., Loc. or GTD Housing Rev. Bonds (Mandatory Put 05/15/25 @ 100) (FNMA Insured), 1.63%, 20501 | 2,000 | 1,977 | ||||||
| Illinois Muni. Electric Agcy., Energy Res. Auth. Imps. Rev. Ref. Bonds, Series A, 5.00%, 2027 | 1,000 | 1,208 | ||||||
| Illinois State Toll Highway Auth., Highway Tolls Rev. Ref. Bonds, Series A, 5.00%, 2020 | 500 | 574 | ||||||
| Illinois State Univ., College & Univ. Rev. Ref. Bonds (AGM Insured), 5.00%, 2022 | 1,465 | 1,690 | ||||||
| Metropolitan Pier & Exposition Auth., Public Imps. Sales Tax Rev. Bonds, Series A (NATL-RE Insured), 0.00%, 20312 | 1,000 | 531 | ||||||
| Metropolitan Pier & Exposition Auth., Sales Tax Rev. Ref. Bonds, Series B (St. Approp Insured), 5.00%, 2028 | 1,000 | 1,096 | ||||||
| Regional Trans. Auth. Rev. Ref. Bonds (NATL-RE Insured), 6.00%, 2020 | 2,000 | 2,265 | ||||||
| Regional Trans. Auth., Sales Tax Rev. Ref. Bonds, Series A (AGM G.O. of Auth. Insured), 5.00%, 2018 | 1,200 | 1,276 | ||||||
| Regional Trans. Auth., Sales Tax Transit Imps. Rev. Bonds, Series A (NATL-RE FGIC Insured), 5.50%, 2020 | 1,610 | 1,856 | ||||||
| State of Illinois, G.O. Misc. Rev. Ref. Bonds, 5.00%, 2026 | 2,500 | 2,763 | ||||||
| State of Illinois, G.O. Misc. Rev. Ref. Bonds, Series B, 5.25%, 2021 | 2,000 | 2,188 | ||||||
| State of Illinois, G.O. Public Imps. Misc. Rev. Bonds: | ||||||||
| 5.00%, 2017 | 300 | 307 | ||||||
| 5.00%, 2021 | 375 | 409 | ||||||
| State of Illinois, Sales Tax Rev. Ref. Bonds, 5.00%, 2020 | 1,500 | 1,697 | ||||||
| Univ. of Illinois, Transit Imps. Cert. of Part. Lease Bonds, Series A, 5.25%, 2024 | 30 | 31 | ||||||
| Univ. of Illinois, Transit Imps. Cert. of Part. Lease Bonds, Series A (Pre-refunded with U.S. Treasury Obligations 10/01/17 @ 100) (AMBAC Insured), 5.25%, 2024 | 70 | 73 | ||||||
| 36,210 | ||||||||
| Indiana - 0.9% | ||||||||
| City of Whiting, Ind. Imps. Rev. Bonds, (Mandatory Put 10/01/19 @ 100), 1.85%, 20441 | 500 | 503 | ||||||
| Indiana Fin. Auth., Health Care Facs. Rev. Ref. Bonds, 4.00%, 2019 | 500 | 540 | ||||||
| Indiana Fin. Auth., Health Care Facs. Rev. Ref. Bonds, Series A, 5.50%, 2024 | 100 | 111 | ||||||
| Indiana Fin. Auth., Health Care Facs. Rev. Ref. Bonds, Series N, 5.00%, 2020 | 1,200 | 1,353 | ||||||
| Purdue Univ., College & Univ. Rev. Ref. Bonds, Series BB-1, 5.00%, 2021 | 1,050 | 1,233 | ||||||
| 3,740 | ||||||||
| Private Client Services Funds | 11 |
Capital Group Core Municipal Fund
Schedule of investments
October 31, 2016
| Bonds & notes - continued | Principal amount (000) | Value (000) | ||||||
| Municipals - continued | ||||||||
| Iowa - 0.2% | ||||||||
| Iowa Fin. Auth., Loc. or GTD Housing Rev. Bonds (GNMA/FNMA Insured), 2.15%, 2043 | $ | 661 | $ | 630 | ||||
| Iowa Fin. Auth., Water Util. Imps. Misc. Rev. Bonds, 5.00%, 2019 | 300 | 333 | ||||||
| 963 | ||||||||
| Kansas - 0.1% | ||||||||
| Kansas Turnpike Auth., Highway Tolls Rev. Ref. Bonds, Series A, 5.00%, 2018 | 500 | 537 | ||||||
| 537 | ||||||||
| Kentucky - 1.6% | ||||||||
| Kentucky Asset Liability Commission, Public Imps. Rev. Bonds, 5.00%, 2024 | 1,500 | 1,828 | ||||||
| Kentucky Econ. Dev. Fin. Auth., Res. Recovery Rev. Ref. Bonds (Mandatory Put 09/01/16 @ 100), 0.70%, 20311 | 500 | 500 | ||||||
| Kentucky Housing Corp., St. Single Family Housing Rev. Bonds, Series B, 5.00%, 2027 | 305 | 321 | ||||||
| Kentucky Public Trans. Infrastructure Auth., Highway Tolls Rev. Bonds, 5.00%, 2017 | 3,575 | 3,669 | ||||||
| 6,318 | ||||||||
| Louisiana - 1.9% | ||||||||
| Louisiana Public Facs. Auth., Health Care Facs. Rev. Ref. Bonds, 5.25%, 2027 | 185 | 189 | ||||||
| Louisiana Public Facs. Auth., Health Care Facs. Rev. Ref. Bonds (Pre-refunded with U.S Treasury Obligations 05/15/2017 @ 100), 5.25%, 2027 | 65 | 67 | ||||||
| Louisiana Stadium & Exposition Dist., Misc. Rev. Ref. Bonds, Series A, 5.00%, 2022 | 1,500 | 1,759 | ||||||
| Louisiana State Citizens Prop. Insurance Corp., Misc. Rev. Ref. Bonds, Series A, 5.00%, 2023 | 1,000 | 1,202 | ||||||
| Parish of St Charles, Ind. Imps. Rev. Bonds (Mandatory Put 06/01/22 @ 100), 4.00%, 20401 | 2,000 | 2,189 | ||||||
| Tobacco Settlement Fncg. Corp., Rev. Ref. Bonds, Series A: | ||||||||
| 5.00%, 2025 | 195 | 195 | ||||||
| 5.50%, 2028 | 1,000 | 1,062 | ||||||
| 5.50%, 2029 | 1,000 | 1,090 | ||||||
| 7,753 | ||||||||
| Maine - 0.2% | ||||||||
| Maine Turnpike Auth., Highway Tolls Rev. Ref. Bonds, 5.00%, 2020 | 600 | 684 | ||||||
| 684 | ||||||||
| Maryland - 0.5% | ||||||||
| County of Baltimore, Health Care Facs. Rev. Ref. Bonds, 5.00%, 2021 | 1,000 | 1,137 | ||||||
| Maryland Comm. Dev. Administration, Loc. or GTD Housing Rev. Ref. Bonds, Series C, 4.00%, 2044 | 620 | 673 | ||||||
| 1,810 | �� | |||||||
| Massachusetts - 1.1% | ||||||||
| Massachusetts Dev. Fin. Agcy., Health Care Facs. Rev. Ref. Bonds, Series M (Mandatory Put 01/30/18 @ 100), 1.18%, 20381 | 1,975 | 1,975 | ||||||
| Massachusetts Health & Edu. Facs. Auth., College & Univ. Imps. Rev. Bonds, Series A, 5.00%, 2025 | 100 | 112 | ||||||
| Massachusetts Housing Fin. Agcy., Loc. or GTD Housing Rev. Bonds, Series 172, 4.00%, 2045 | 1,270 | 1,350 | ||||||
| 12 | Private Client Services Funds |
Capital Group Core Municipal Fund
Schedule of investments
October 31, 2016
| Bonds & notes - continued | Principal amount (000) | Value (000) | ||||||
| Municipals - continued | ||||||||
| Massachusetts - continued | ||||||||
| Massachusetts Housing Fin. Agcy., Loc. or GTD Housing Rev. Ref. Bonds, Series 169, 4.00%, 2044 | $ | 1,025 | $ | 1,080 | ||||
| 4,517 | ||||||||
| Michigan - 4.2% | ||||||||
| City of Detroit Sewage Disposal System Rev., Sewer Rev. Ref. Bonds (AGM Insured), 1.167%, 20321 | 1,500 | 1,356 | ||||||
| City of Detroit, G.O. Public Imps. Prop. Tax Bonds (NATL-RE Insured), 5.375%, 2018 | 17 | 17 | ||||||
| Detroit City School Dist., G.O. Prop. Tax Ref. Bonds, Series A, 5.00%, 2019 | 1,400 | 1,519 | ||||||
| Detroit City School Dist., G.O. Prop. Tax Ref. Bonds, Series A (AGM Insured), 5.25%, 2032 | 1,110 | 1,351 | ||||||
| Michigan Fin. Auth., Health Care Facs. Rev. Ref. Bonds, 5.00%, 2026 | 1,500 | 1,850 | ||||||
| Michigan Fin. Auth., Misc. Rev. Ref. Bonds, 5.00%, 2021 | 700 | 774 | ||||||
| Michigan Fin. Auth., Water Util. Imps. Rev. Bonds, 5.00%, 2024 | 1,000 | 1,215 | ||||||
| Michigan State Housing Dev. Auth., Loc. or GTD Housing Rev. Bonds, 4.00%, 2044 | 1,595 | 1,700 | ||||||
| Michigan Strategic Fund, Energy Res. Auth. Rev. Ref. Bonds, 5.625%, 2020 | 1,160 | 1,326 | ||||||
| State of Michigan, Rev. Ref. Bonds, 5.00%, 2024 | 2,000 | 2,436 | ||||||
| Wayne County Airport Auth., Port, Airport & Marina Imps. Rev. Bonds, Series A, 5.00%, 2022 | 850 | 1,000 | ||||||
| Wayne County Airport Auth., Port, Airport & Marina Rev. Ref. Bonds, Series C, 5.00%, 2017 | 1,500 | 1,565 | ||||||
| Wayne State Univ., College & Univ. Rev. Ref. Bonds (AGM Insured), 5.00%, 2016 | 700 | 701 | ||||||
| 16,810 | ||||||||
| Minnesota - 1.0% | ||||||||
| Minneapolis-Saint Paul Metropolitan Airports Commission, Port, Airport & Marina Rev. Ref. Bonds, 5.00%, 2017 | 350 | 353 | ||||||
| Minnesota Housing Fin. Agcy., Housing Rev. Bonds (GNMA/FNMA/FHLMC COLL Insured), 4.25%, 2028 | 320 | 333 | ||||||
| Minnesota Housing Fin. Agcy., Loc. or GTD Housing Rev. Bonds (GNMA/FNMA Insured), 2.25%, 2042 | 696 | 697 | ||||||
| Minnesota Housing Fin. Agcy., Loc. or GTD Housing Rev. Bonds (GNMA/FNMA/FHLMC Insured), 4.00%, 2040 | 345 | 358 | ||||||
| Minnesota Housing Fin. Agcy., Loc. or GTD Housing Rev. Bonds, Series B, 3.50%, 2046 | 1,980 | 2,108 | ||||||
| 3,849 | ||||||||
| Missouri - 1.4% | ||||||||
| I-470 & 350 Trans. Dev. Dist., Sales Tax Rev. Ref. Bonds (Radian Insured), 4.60%, 2029 | 35 | 35 | ||||||
| Missouri Housing Dev. Commission, Loc. or GTD Housing Rev. Bonds (GNMA/FNMA/FHLMC Insured): | ||||||||
| 3.50%, 2041 | 2,700 | 2,889 | ||||||
| 3.75%, 2038 | 280 | 298 | ||||||
| Missouri State Environmental Imp. & Energy Ress. Auth., Water Rev. Ref. Bonds, 5.00%, 2019 | 100 | 109 | ||||||
| State of Missouri Health & Educ. Facs. Auth., Health Care Facs. Nursing Homes Rev. Bonds, 5.00%, 2026 | 1,435 | 1,783 | ||||||
| State of Missouri Health & Educ. Facs. Auth., Health Care Facs. Nursing Homes Rev. Bonds, Series A: | ||||||||
| 5.00%, 2022 | 440 | 510 | ||||||
| 5.00%, 2025 | 185 | 221 | ||||||
| 5,845 | ||||||||
| Private Client Services Funds | 13 |
Capital Group Core Municipal Fund
Schedule of investments
October 31, 2016
| Bonds & notes - continued | Principal amount (000) | Value (000) | ||||||
| Municipals - continued | ||||||||
| Nebraska - 1.1% | ||||||||
| Central Plains Energy Project, Natural Gas Rev. Ref. Bonds (Mandatory Put 12/01/19 @ 100), 5.00%, 20391 | $ | 1,000 | $ | 1,104 | ||||
| Nebraska Investment Fin. Auth., Loc. or GTD Housing Rev. Bonds, Series A: | ||||||||
| 3.50%, 2046 | 2,335 | 2,489 | ||||||
| 4.00%, 2044 | 410 | 434 | ||||||
| Nebraska Investment Fin. Auth., Loc. or GTD Housing Rev. Bonds, Series A (GNMA/FNMA/FHLMC Insured): | ||||||||
| 2.50%, 2034 | 180 | 181 | ||||||
| 3.00%, 2043 | 280 | 287 | ||||||
| 4,495 | ||||||||
| Nevada - 2.1% | ||||||||
| County of Clark, Ind. Rev. Ref. Bonds, Series A (Mandatory Put 04/01/20 @ 100), 1.875%, 20311 | 2,000 | 2,026 | ||||||
| County of Clark, Port, Airport & Marina Rev. Ref. Bonds, 5.00%, 2024 | 2,705 | 3,309 | ||||||
| County of Clark, Sales Tax Rev. Bonds, Series B, 4.00%, 2018 | 2,000 | 2,102 | ||||||
| Las Vegas Valley Water Dist., G.O. Water Util. Imps. Prop. Tax Bonds, Series B, 5.00%, 2019 | 1,100 | 1,212 | ||||||
| 8,649 | ||||||||
| New Hampshire - 0.2% | ||||||||
| New Hampshire Health & Edu. Facs. Auth., College & Univ. Imps. Rev. Ref. Bonds, 4.00%, 2022 | 575 | 643 | ||||||
| 643 | ||||||||
| New Jersey - 4.6% | ||||||||
| Camden County Imp. Auth., Health Care Facs. Rev. Ref. Bonds, 5.00%, 2034 | 590 | 661 | ||||||
| Garden State Preservation Trust, Sales Tax Rev. Ref. Bonds, Series A: | ||||||||
| 5.00%, 2020 | 1,000 | 1,129 | ||||||
| 5.00%, 2021 | 200 | 231 | ||||||
| New Jersey Econ. Dev. Auth., Misc. Rev. Ref. Bonds, 5.00%, 2017 | 2,000 | 2,093 | ||||||
| New Jersey Econ. Dev. Auth., Rev. Ref. Bonds, Series PP, 5.00%, 2025 | 1,200 | 1,355 | ||||||
| New Jersey Econ. Dev. Auth., School Imps. Rev. Bonds, 1.53%, 20171 | 1,025 | 1,025 | ||||||
| New Jersey Health Care Facs. Fncg. Auth., Health Care Facs. Rev. Ref. Bonds: | ||||||||
| 5.00%, 2025 | 1,340 | 1,649 | ||||||
| 5.00%, 2026 | 1,400 | 1,725 | ||||||
| New Jersey Higher Edu. Assistance Auth., Student Ln. Rev. Ref. Bonds, Series 1A, 5.00%, 2017 | 1,420 | 1,475 | ||||||
| New Jersey State Turnpike Auth., Highway Tolls Rev. Ref. Bonds, Series D (Mandatory Put 01/01/18 @ 100), 1.31%, 20241 | 2,050 | 2,056 | ||||||
| New Jersey State Turnpike Auth., Highway Tolls Rev. Ref. Bonds, Series E (Mandatory Put 01/01/18 @ 100), 1.31%, 20241 | 1,150 | 1,153 | ||||||
| New Jersey Transit Corp., Transit Rev. Ref. Bonds, Series A: | ||||||||
| 5.00%, 2018 | 1,300 | 1,374 | ||||||
| 5.00%, 2021 | 2,000 | 2,227 | ||||||
| Rutgers The State University of New Jersey, College & Univ. Rev. Ref. Bonds, Series J, 5.00%, 2019 | 525 | 576 | ||||||
| 18,729 | ||||||||
| New Mexico - 0.5% | ||||||||
| City of Farmington, Energy Res. Auth. Rev. Ref. Bonds (Mandatory Put 04/01/20 @ 100), 1.875%, 20291 | 2,000 | 2,028 | ||||||
| 14 | Private Client Services Funds |
Capital Group Core Municipal Fund
Schedule of investments
October 31, 2016
| Bonds & notes - continued | Principal amount (000) | Value (000) | ||||||
| Municipals - continued | ||||||||
| New Mexico - continued | ||||||||
| New Mexico Educ. Assistance Foundation, Student Ln, Rev. Ref. Bonds, Series A-2 (GTD St. Lns. Insured), 1.492%, 20281 | $ | 35 | $ | 35 | ||||
| 2,063 | ||||||||
| New York - 5.4% | ||||||||
| Brooklyn Arena Loc. Dev. Corp., Misc. Rev. Ref. Bonds, Series A, 5.00%, 2022 | 210 | 246 | ||||||
| Build NYC Res. Corp., Misc. Rev. Ref. Bonds, 5.00%, 2024 | 395 | 482 | ||||||
| City of New York, G.O. Prop. Tax Ref. Bonds, Series B, 5.00%, 2017 | 2,000 | 2,065 | ||||||
| City of New York, G.O. Prop. Tax Ref. Bonds, Sub-Series J-4, 1.18%, 20251 | 1,000 | 1,000 | ||||||
| City of New York, G.O. Public Imps. Prop. Tax Rev. Bonds, Series H-1, 4.00%, 2017 | 100 | 101 | ||||||
| Metropolitan Trans. Auth., Misc. Rev. Ref. Bonds, Series B, 1.63%, 20201 | 2,000 | 2,024 | ||||||
| Metropolitan Trans. Auth., Transit Imps. Rev. Bonds, Sub-Series A-2 (Mandatory Put 06/01/20 @ 100), 1.21%, 20391 | 2,000 | 1,998 | ||||||
| Metropolitan Trans. Auth., Transit Rev. Ref. Bonds, Series A-2, 5.00%, 2024 | 2,000 | 2,448 | ||||||
| Metropolitan Trans. Auth., Transit Rev. Ref. Bonds, Sub-Series G-3 (Mandatory Put 10/31/16 @ 100), 1.053%, 20311 | 500 | 500 | ||||||
| New York City Health & Hospital Corp., Health Care Facs. Rev. Ref. Bonds, Series A, 5.00%, 2017 | 2,000 | 2,024 | ||||||
| New York City Housing Dev. Corp. Multi-Family Mortgage Rev. Bond (8 Spruce Street), 3.50%, 2048 | 320 | 325 | ||||||
| New York City Transitional Fin. Auth., School Imps. Misc. Rev. Bonds, Series S-5 (St. Aid Withhldg. Insured), 5.00%, 2019 | 100 | 109 | ||||||
| New York State Dormitory Auth., Misc. Rev. Ref. Bonds, Series A, 5.00%, 2017 | 1,000 | 1,038 | ||||||
| New York State Thruway Auth., Highway Tolls Rev. Ref. Bonds, Series A, 5.00%, 2019 | 2,500 | 2,745 | ||||||
| Public Housing Capital Fund Trust I Rev. Bonds (HUD Ln. Insured), 4.50%, 20223 | 439 | 455 | ||||||
| Southold Local Dev. Corp., Health Care Facs. Nursing Homes Rev. Bonds, 3.125%, 2025 | 225 | 233 | ||||||
| State of New York Mortgage Agcy., Loc. or GTD Housing Rev. Bonds, Series 197, 3.50%, 2044 | 2,000 | 2,150 | ||||||
| Tobacco Settlement Fncg. Corp., Rev. Ref. Bonds, Series A, 5.00%, 2017 | 1,850 | 1,896 | ||||||
| 21,839 | ||||||||
| North Carolina - 1.1% | ||||||||
| City of Charlotte, Rev. Ref. Bonds, Series B, 5.00%, 2023 | 400 | 455 | ||||||
| North Carolina Muni. Power Agcy. No. 1, Energy Res. Auth. Rev. Ref. Bonds, Series A (Pre-refunded with U.S Govt. Securities to 01/01/2018 @ 100), 5.25%, 2020 | 175 | 184 | ||||||
| Raleigh Durham Airport Auth., Port, Airport, & Marina Rev. Ref. Bonds, Series A, 5.00%, 2019 | 1,500 | 1,648 | ||||||
| State of North Carolina, Highway Imps. Rev. Bonds, 5.00%, 2025 | 1,900 | 2,348 | ||||||
| 4,635 | ||||||||
| North Dakota - 0.4% | ||||||||
| North Dakota Housing Fin. Agcy., Loc. or GTD Housing Rev. Bonds, 3.75%, 2042 | 350 | 363 | ||||||
| North Dakota Housing Fin. Agcy., Loc. or GTD Housing Rev. Ref. Bonds, Series D, 3.50%, 2046 | 1,000 | 1,067 | ||||||
| 1,430 | ||||||||
| Ohio - 3.6% | ||||||||
| City of Cleveland, Airport System Rev., Port, Airport & Marina Imps. Rev. Bonds, Series C (AGM Insured), 5.00%, 2017 | 1,250 | 1,259 | ||||||
| City of Cleveland, Airport System Rev., Port, Airport & Marina Rev. Ref. Bonds, Series C (AGC Insured), 5.00%, 2017 | 475 | 478 | ||||||
| City of Cleveland, Airport System, Port, Airport, & Marina Rev. Ref. Bonds, Series A, 5.00%, 2025 | 1,000 | 1,154 | ||||||
| Private Client Services Funds | 15 |
Capital Group Core Municipal Fund
Schedule of investments
October 31, 2016
| Bonds & notes - continued | Principal amount (000) | Value (000) | ||||||
| Municipals - continued | ||||||||
| Ohio - continued | ||||||||
| County of Allen, Lease Rev. Ref. Bonds, Series B: | ||||||||
| 5.00%, 2018 | $ | 1,000 | $ | 1,070 | ||||
| 5.00%, 2019 | 2,000 | 2,206 | ||||||
| 5.00%, 2020 | 1,030 | 1,165 | ||||||
| County of Hamilton, Health Care Facs. Rev. Ref. Bonds: | ||||||||
| 5.00%, 2025 | 400 | 475 | ||||||
| 5.00%, 2027 | 1,425 | 1,669 | ||||||
| County of Warren, Health Care Facs. Rev. Ref. Bonds, 5.00%, 2020 | 200 | 225 | ||||||
| County of Warren, Health Care Facs. Rev. Ref. Bonds, Series A: | ||||||||
| 5.00%, 2021 | 1,220 | 1,409 | ||||||
| 5.00%, 2027 | 300 | 362 | ||||||
| 5.00%, 2028 | 585 | 700 | ||||||
| Ohio Air Quality Dev. Auth., Ind. Rev. Ref. Bonds, Series C, 5.625%, 2018 | 1,000 | 1,021 | ||||||
| Ohio State Building Auth., Rev. Ref. Bonds, Series A, 5.00%, 2017 | 1,500 | 1,558 | ||||||
| 14,751 | ||||||||
| Oklahoma - 0.6% | ||||||||
| Oklahoma Dev. Fin. Auth., Health Care Facs. Rev. Ref. Bonds (Pre-refunded with U.S Treasury Obligations to 08/15/2018 @ 100), 5.00%, 2024 | 200 | 215 | ||||||
| Oklahoma Muni. Power Auth., Energy Res. Auth. Rev. Ref. Bonds, Series A (Mandatory Put 08/01/18 @ 100), 1.43%, 20231 | 1,380 | 1,378 | ||||||
| Tulsa Airports Imp. Trust, Port, Airport & Marina Rev. Ref. Bonds, Series D (BAM Insured), 5.00%, 2020 | 815 | 909 | ||||||
| 2,502 | ||||||||
| Oregon - 1.4% | ||||||||
| County of Gilliam, Res. Recovery Imps. Rev. Bonds, 1.50%, 2018 | 1,500 | 1,511 | ||||||
| Oregon State Facs. Auth., College & Univ. Rev. Ref. Bonds, Series A, 5.00%, 2031 | 600 | 703 | ||||||
| Oregon State Lottery, Misc. Rev. Ref. Bonds, Series C (Moral Obligation Insured), 5.00%, 2023 | 725 | 885 | ||||||
| State of Oregon Housing & Comm. Services Dept., Loc. or GTD Housing Rev. Bonds, Series A, 4.00%, 2047 | 975 | 1,059 | ||||||
| State of Oregon, G.O. Unemployment & Welfare Fndg. Prop. Tax Bonds, Series 94-H, 4.00%, 2044 | 1,220 | 1,328 | ||||||
| 5,486 | ||||||||
| Pennsylvania - 3.1% | ||||||||
| Allegheny County Higher Edu. Building Auth., College & Univ. Imps. Rev. Ref. Bonds, Series A, 5.00%, 2022 | 400 | 469 | ||||||
| Butler County Hospital Auth., Health Care Facs. Rev. Ref. Bonds, 4.00%, 2021 | 325 | 359 | ||||||
| Montgomery County Ind. Dev. Auth., Health Care Facs. Nursing Homes Rev. Bonds, 5.00%, 2026 | 400 | 471 | ||||||
| Montgomery County Ind. Dev. Auth., Health Care Facs. Rev. Ref. Bonds, 5.00%, 2025 | 800 | 924 | ||||||
| Pennsylvania Intergovernmental Cooperation Auth., Special Tax Rev. Ref. Bonds, 5.00%, 2017 | 1,500 | 1,540 | ||||||
| Pennsylvania Intergovernmental Cooperation Auth., Special Tax Rev. Ref. Bonds (BAM Insured), 5.00%, 2028 | 855 | 1,029 | ||||||
| Pennsylvania Turnpike Commission, Highway Tolls Rev. Ref. Bonds, Series A, 1.31%, 20181 | 1,500 | 1,498 | ||||||
| Pennsylvania Turnpike Commission, Highway Tolls Rev. Ref. Bonds, Series B-1, 1.61%, 20211 | 950 | 947 | ||||||
| Pennsylvania Turnpike Commission., Misc. Rev. Ref. Bonds, Series A (AGM Insured), 5.25%, 2025 | 1,000 | 1,243 | ||||||
| Philadelphia School Dist., G.O. Prop. Tax Ref. Bonds, Series F (St. Aid Withhldg. Insured), 5.00%, 2023 | 1,500 | 1,730 | ||||||
| Univ. of Pittsburgh, College & Univ. Imps. Rev. Ref. Bonds, Series B, 5.25%, 2024 | 200 | 224 | ||||||
| 16 | Private Client Services Funds |
Capital Group Core Municipal Fund
Schedule of investments
October 31, 2016
| Bonds & notes - continued | Principal amount (000) | Value (000) | ||||||
| Municipals - continued | ||||||||
| Pennsylvania - continued | ||||||||
| York County Ind. Dev. Auth., Ind. Rev. Ref. Bonds, Series A (Mandatory Put 06/01/20 @ 100), 2.55%, 20361 | $ | 2,000 | $ | 2,023 | ||||
| 12,457 | ||||||||
| Puerto Rico - 0.4% | ||||||||
| Puerto Rico Ind. Tourist Educ. Medical & Environmental Control Facs. Fncg. Auth., College & Univ. Rev. Ref. Bonds: | ||||||||
| 3.00%, 2018 | 500 | 453 | ||||||
| 5.00%, 2017 | 500 | 506 | ||||||
| 5.00%, 2019 | 710 | 727 | ||||||
| 1,686 | ||||||||
| Rhode Island - 0.6% | ||||||||
| Rhode Island Commerce Corp., Rev. Ref. Bonds: | ||||||||
| 5.00%, 2020 | 1,000 | 1,127 | ||||||
| 5.00%, 2022 | 500 | 588 | ||||||
| 5.00%, 2023 | 500 | 598 | ||||||
| 2,313 | ||||||||
| South Carolina - 2.1% | ||||||||
| South Carolina Jobs-Econ. Dev. Auth., Health Care Facs. Rev. Ref. Bonds: | ||||||||
| 5.00%, 2018 | 1,025 | 1,090 | ||||||
| 5.00%, 2020 | 500 | 572 | ||||||
| South Carolina Jobs-Econ. Dev. Auth., Health Care Facs. Rev. Ref. Bonds, Series A, 5.00%, 2023 | 2,730 | 3,255 | ||||||
| South Carolina State Housing Fin. & Dev. Auth., Loc. or GTD Housing Rev. Bonds (GNMA/FNMA/FHLMC COLL FHA Insured), 4.00%, 2036 | 1,860 | 2,018 | ||||||
| South Carolina State Housing Fin. & Dev. Auth., Loc. or GTD Housing Rev. Bonds, Series 1 (GNMA COLL Insured), 4.50%, 2030 | 515 | 544 | ||||||
| South Carolina State Public Service Auth., Energy Res. Auth. Rev. Ref. Bonds, Series C, 5.00%, 2021 | 1,000 | 1,176 | ||||||
| 8,655 | ||||||||
| South Dakota - 0.5% | ||||||||
| South Dakota Housing Dev. Auth., Loc. or GTD Housing Rev. Bonds, Series E, 4.00%, 2044 | 1,985 | 2,133 | ||||||
| 2,133 | ||||||||
| Tennessee - 1.2% | ||||||||
| City of Memphis, Energy Res. Auth. Rev. Ref. Bonds, 5.00%, 2018 | 100 | 109 | ||||||
| Metropolitan Govt. Nashville & Davidson County Health & Educ. Facs., College & Univ. Rev. Ref. Bonds (Mandatory Put 10/01/17 @ 100), 1.23%, 20381 | 715 | 714 | ||||||
| Metropolitan Govt. Nashville & Davidson County Health & Educ. Facs., College & Univ. Rev. Ref. Bonds (Pre-refunded with U.S. Treasury Obligations 04/01/17 @ 100), 1.23%, 20381 | 685 | 685 | ||||||
| Tennessee Housing Dev. Agcy., Loc. or GTD Housing Rev. Bonds: | ||||||||
| 4.00%, 2038 | 590 | 623 | ||||||
| 4.00%, 2045 | 935 | 1,004 | ||||||
| 4.50%, 2037 | 540 | 575 | ||||||
| Tennessee Housing Dev. Agcy., Loc. or GTD Housing Rev. Bonds, Series 2B, 4.00%, 2046 | 850 | 918 | ||||||
| Private Client Services Funds | 17 |
Capital Group Core Municipal Fund
Schedule of investments
October 31, 2016
| Bonds & notes - continued | Principal amount (000) | Value (000) | ||||||
| Municipals - continued | ||||||||
| Tennessee - continued | ||||||||
| Tennessee Housing Dev. Agcy., Loc. or GTD Housing Rev. Bonds, Series A-1, 5.00%, 2027 | $ | 275 | $ | 286 | ||||
| 4,914 | ||||||||
| Texas - 5.0% | ||||||||
| Central Texas Turnpike System, Highway Tolls Rev. Bonds, Series A (AMBAC Insured), 0.00%, 20282 | 1,000 | 703 | ||||||
| City of Houston, Port, Airport & Marina Rev. Ref. Bonds, Series B (NATL-RE FGIC Insured), 5.00%, 2025 | 275 | 282 | ||||||
| City of Houston, Util. System, Water Rev. Ref. Bonds (Mandatory Put 06/01/17 @ 100), 1.38%, 20341 | 1,400 | 1,400 | ||||||
| City of Houston, Water Rev. Ref. Bonds, Series C, 5.00%, 2018 | 1,500 | 1,622 | ||||||
| City Public Service Board of San Antonio, Energy Res. Auth. Imps. Rev. Bonds (Mandatory Put 12/01/20 @ 100), 3.00%, 20451 | 1,000 | 1,064 | ||||||
| City Public Service Board of San Antonio, Energy Res. Auth. Imps. Rev. Bonds, Series C (Mandatory Put 12/01/19 @ 100), 3.00%, 20451 | 1,000 | 1,052 | ||||||
| City Public Service Board of San Antonio, Energy Res. Auth. Rev. Ref. Bonds (Mandatory Put 02/01/18 @ 100), 1.01%, 20331 | 3,150 | 3,141 | ||||||
| Dallas-Fort Worth Intl. Airport Facs. Imp. Corp., Port, Airport & Marina Rev. Ref. Bonds, Series A, 5.00%, 2023 | 100 | 100 | ||||||
| Dallas-Fort Worth Intl. Airport Facs. Imp. Corp., Port, Airport & Marina Rev. Ref. Bonds, Series B, 5.00%, 2020 | 900 | 1,030 | ||||||
| Dallas-Fort Worth Intl. Port, Airport & Marina Rev. Ref. Bonds, Series D, 5.00%, 2020 | 1,000 | 1,144 | ||||||
| Grand Parkway Trans. Corp., Highway Tolls Rev. Ref. Bonds, Series A, 3.00%, 2016 | 500 | 501 | ||||||
| Harris County Cultural Edu. Facs. Fin. Corp., Energy Res. Auth. Imps. Rev. Bonds: | ||||||||
| 5.00%, 2017 | 445 | 464 | ||||||
| 5.00%, 2018 | 275 | 297 | ||||||
| Harris County Cultural Edu. Facs. Fin. Corp., Energy Res. Auth. Imps. Rev. Bonds, Series A, 5.00%, 2023 | 125 | 139 | ||||||
| Harris County Health Facs. Dev. Corp., Health Care Facs. Imps. Rev. Ref. Bonds, Series A-4 (AGM Insured), 0.89%, 20311 | 175 | 175 | ||||||
| Harris County, Highway Tolls Rev. Ref. Bonds, 5.00%, 2025 | 800 | 1,004 | ||||||
| Harris County-Houston Sports Auth., Hotel Occupancy Tax Rev. Ref. Bonds, Series A, 5.00%, 2019 | 400 | 446 | ||||||
| Katy Independent School Dist., G.O. Prop. Tax Ref. Bonds, Series C (PSF-GTD Insured), (Mandatory Put 08/15/19 @ 100), 0.908%, 20361 | 750 | 754 | ||||||
| North Texas Tollway Auth., Highway Tolls Rev. Ref. Bonds, Series A, 5.00%, 2030 | 300 | 360 | ||||||
| North Texas Tollway Auth., Highway Tolls Rev. Ref. Bonds, Series C (Mandatory Put 01/01/19 @ 100), 1.95%, 20381 | 1,000 | 1,011 | ||||||
| North Texas Tollway Auth., Misc. Rev. Ref. Bonds, 6.00%, 2021 | 15 | 16 | ||||||
| North Texas Tollway Auth., Misc. Rev. Ref. Bonds (Pre-refunded with FHL Banks/U.S. Treasury Obligations 01/01/18 @ 100), 6.00%, 2021 | 85 | 90 | ||||||
| North Texas Tollway Auth., Misc. Rev. Ref. Bonds, Series A, 6.00%, 2019 | 100 | 106 | ||||||
| Olmos Park Higher Edu. Facs. Corp., College & Univ. Imps. Rev. Ref. Bonds, 5.00%, 2019 | 980 | 1,089 | ||||||
| Sam Rayburn Muni. Power Agcy., Energy Res. Auth. Imps. Rev. Bonds, 5.00%, 2020 | 1,180 | 1,333 | ||||||
| Tarrant County Cultural Educ. Facs. Fin. Corp., Health Care Facs. Rev. Ref. Bonds (Pre-refunded with U.S Treasury Obligations to 08/15/2018 @ 100), 5.00%, 2023 | 170 | 182 | ||||||
| Tarrant County Cultural Educ. Facs. Fin. Corp., Health Care Facs. Rev. Ref. Bonds (Pre-refunded with U.S Treasury Strips to 08/15/2018 @ 100), 5.00%, 2023 | 180 | 193 | ||||||
| Texas Water Dev. Board, Water Util. Imps. Rev. Bonds, Series B, 5.25%, 2022 | 600 | 619 | ||||||
| 20,317 | ||||||||
| 18 | Private Client Services Funds |
Capital Group Core Municipal Fund
Schedule of investments
October 31, 2016
| Bonds & notes - continued | Principal amount (000) | Value (000) | ||||||
| Municipals - continued | ||||||||
| Virginia - 0.3% | ||||||||
| City of Chesapeake, Chesapeake Expressway Toll Road Rev., Highway Tolls Rev. Ref. Bonds, Series A, 4.00%, 2019 | $ | 850 | $ | 904 | ||||
| County of Fairfax, G.O. Prop. Tax Rev. Ref. Bonds, Series C (St. Aid Withhldg. Insured), 5.00%, 2017 | 200 | 208 | ||||||
| 1,112 | ||||||||
| Washington - 1.9% | ||||||||
| Grays Harbor County Public Util. Dist. No. 1, Energy Res. Auth. Imps. Rev. Ref. Bonds (NATL Insured), 5.00%, 2020 | 100 | 101 | ||||||
| Grays Harbor County Public Util. Dist. No. 1, Energy Res. Auth. Imps. Rev. Ref. Bonds (Pre- refunded with U.S. Treasury Obligations 01/01/17 @ 100) (NATL Insured), 5.00%, 2020 | 55 | 55 | ||||||
| Port of Seattle, Port, Airport & Marina Imps. Rev. Bonds, Series A-1, 5.25%, 2027 | 100 | 109 | ||||||
| Skagit County Public Hospital Dist. No. 1, Health Care Facs. Rev. Ref. Bonds, 4.00%, 2026 | 2,000 | 2,155 | ||||||
| State of Washington, Highway Imps. Rev. Bonds, 5.00%, 2020 | 2,000 | 2,276 | ||||||
| Washington Health Care Facs. Auth., Health Care Facs. Rev. Ref. Bonds: | ||||||||
| 5.00%, 2020 | 1,100 | 1,254 | ||||||
| 5.00%, 2026 | 500 | 588 | ||||||
| Washington Health Care Facs. Auth., Health Care Facs. Rev. Ref. Bonds, Series B (Mandatory Put 10/01/21 @ 100), 5.00%, 20421 | 800 | 935 | ||||||
| 7,473 | ||||||||
| West Virginia - 0.9% | ||||||||
| County of Mason, Ind. Imps. Rev. Bonds, Series L (Mandatory Put 10/01/18 @ 100), 1.625%, 20221 | 2,500 | 2,513 | ||||||
| West Virginia Econ. Dev. Auth., Energy Res. Auth. Rev. Ref. Bonds (Mandatory Put 04/01/19 @ 100), 1.90%, 20401 | 1,000 | 1,004 | ||||||
| 3,517 | ||||||||
| Wisconsin - 1.4% | ||||||||
| County of Milwaukee, Port, Airport & Marina Imps. Rev. Bonds, Series A, 5.00%, 2018 | 1,145 | 1,228 | ||||||
| Public Fin. Auth., Health Care Facs. Rev. Ref. Bonds, 5.00%, 2022 | 300 | 354 | ||||||
| Public Fin. Auth., Tax Increment Allocation Econ. Imps. Rev. Bonds, 0.00%, 20272 | 1,500 | 979 | ||||||
| Wisconsin Health & Educ. Facs. Auth., Health Care Facs. Rev. Ref. Bonds: | ||||||||
| 4.20%, 2018 | 100 | 106 | ||||||
| 5.00%, 2024 | 525 | 653 | ||||||
| Wisconsin Health & Educ. Facs. Auth., Health Care Facs. Rev. Ref. Bonds, Series A, 5.00%, 2017 | 1,200 | 1,247 | ||||||
| WPPI Energy, Energy Res. Auth. Imps. Rev. Bonds, Series A, 5.00%, 2020 | 800 | 910 | ||||||
| 5,477 | ||||||||
| Wyoming - 0.4% | ||||||||
| Wyoming Comm. Dev. Auth., Loc. or GTD Housing Rev. Bonds, Series 3, 3.00%, 2044 | 1,720 | 1,781 | ||||||
| 1,781 | ||||||||
| Total municipals | 384,626 | |||||||
| Private Client Services Funds | 19 |
Capital Group Core Municipal Fund
Schedule of investments
October 31, 2016
| Bonds & notes - continued | Principal amount (000) | Value (000) | ||||||
| Corporate bonds & notes - 0.1% | ||||||||
| Electric - 0.1% | ||||||||
| Southern California Edison Co., 1.125%, 2017 | $ | 455 | $ | 456 | ||||
| 456 | ||||||||
| Total corporate bonds & notes | 456 | |||||||
| Total bonds & notes (cost: $376,332,000) | 385,082 | |||||||
| Short-term securities - 5.7% | ||||||||
| California Edu. Facs. Auth. Rev., 0.30%, November 03, 20161 | 5,000 | 5,000 | ||||||
| City of New York, G.O. Public Imps. Prop. Tax Bonds, Sub-Series H-1, 0.52%, January 01, 20361 | 3,000 | 3,000 | ||||||
| Clarksville Public Building Auth., Public Imps. Misc. Rev. Bonds, 0.59%, January 01, 20331 | 620 | 620 | ||||||
| Lower Neches Valley Auth. Ind. Dev. Corp., Ind. Rev. Ref. Bonds, Series A, 0.47%, November 01, 20291 | 2,000 | 2,000 | ||||||
| Massachusetts States of Health & Edu. Facs. Auth. Rev., 0.72%, November 04, 20161 | 2,000 | 2,000 | ||||||
| Mississippi Business Fin. Corp., Ind. Imps. Rev. Bonds, Series G, 0.48%, November 01, 20351 | 3,000 | 3,000 | ||||||
| Montgomery County of Maryland:1 | ||||||||
| 0.85%, December 21, 2016 | 2,000 | 2,000 | ||||||
| 0.86%, December 21, 2016 | 1,000 | 1,000 | ||||||
| New York City, Water Util. Imps. Rev. Bonds, 0.52%, June 15, 20321 | 3,000 | 3,000 | ||||||
| Phoenix Ind. Dev. Auth., Health Care Facs. Imps. Rev. Bonds, Series A, 0.47%, November 15, 20521 | 1,000 | 1,000 | ||||||
| Univ. of Michigan, College & Univ. Rev. Ref. Bonds, Series E (Mandatory Put 04/02/18 @ 100), 1.06%, April 01, 20331 | 600 | 600 | ||||||
| Total short-term securities (cost: $23,220,000) | 23,220 | |||||||
| Total investment securities (cost: $399,552,000) | 408,302 | |||||||
| Other assets less liabilities | (2,912 | ) | ||||||
| Net assets | $ | 405,390 | ||||||
| 1 | Coupon rate may change periodically. For short-term securities, the date of the next scheduled coupon rate change is considered to be the maturity date. |
| 2 | Zero coupon bond; interest rate represents current yield to maturity. |
| 3 | Acquired in a transaction exempt from registration under Rule 144A or section 4(2) of the Securities Act of 1933. May be resold in the U.S. in transactions exempt from registration, normally to qualified institutional buyers. At October 31, 2016, the aggregate market value of these securities amounted to $3,428,000, representing 0.85% of net assets. |
| 20 | Private Client Services Funds |
Capital Group Core Municipal Fund
Schedule of investments
October 31, 2016
| Key to abbreviations | ||
| Agcy. | = | Agency |
| AGM | = | Assured Guaranty Municipal Corporation |
| AMBAC | = | American Municipal Bond Assurance Corporation |
| Auth. | = | Authority |
| BAM | = | Build America Mutual Assurance Company |
| CA Mtg. Ins. | = | California Mortgage Insurance |
| Certs. of Part. | = | Certificates of Participation |
| CIFG | = | CDC IXIS Financial Guaranty |
| COLL | = | Collateral |
| Comm. | = | Community |
| Comms. | = | Communities |
| Corp. | = | Corporation |
| Corps. | = | Corporations |
| Dept. | = | Department |
| Dev. | = | Development |
| Dist. | = | District |
| Econ. | = | Economic |
| Edu. | = | Education |
| Educ. | = | Educational |
| Facs. | = | Facilities |
| FGIC | = | Financial Guaranty Insurance Company |
| FHA | = | Federal Housing Administration |
| FHL | = | Federal Home Loan |
| FHLMC | = | Federal Home Loan Mortgage Corporation |
| Fin. | = | Finance |
| Fncg. | = | Financing |
| Fndg. | = | Funding |
| FNMA | = | Federal National Mortgage Association |
| GNMA | = | Government National Mortgage Association |
| G.O. | = | General Obligation |
| Govt. | = | Government |
| GTD | = | Guaranteed |
| GTY | = | Guaranty |
| HUD | = | Housing and Urban Development |
| Imp. | = | Improvement |
| Imps. | = | Improvements |
| Ind. | = | Industrial |
| Intl. | = | International |
| Ln. | = | Loan |
| Lns. | = | Loans |
| Loc. | = | Local |
| Mgmt. | = | Management |
| Misc. | = | Miscellaneous |
| Muni. | = | Municipal |
| NATL-RE | = | National Reinsurance |
| No. | = | Number |
| Prop. | = | Property |
| PSF | = | Permanent School Fund |
| Redev. | = | Redevelopment |
| Ref. | = | Refunding |
| Res. | = | Resource |
| Ress. | = | Resources |
| Rev. | = | Revenue |
| St. | = | State |
| Trans. | = | Transportation |
| Univ. | = | University |
| Util. | = | Utility |
| Utils. | = | Utilities |
| Withhldg. | = | Withholding |
See Notes to Financial Statements
| Private Client Services Funds | 21 |
Capital Group Short-Term Municipal Fund
October 31, 2016
Growth of $25,000 investment
Here’s how a $25,000 investment in the Capital Group Short-Term Municipal Fund grew between April 13, 2010, when the fund began operations, and October 31, 2016, the end of the fund’s fiscal year.
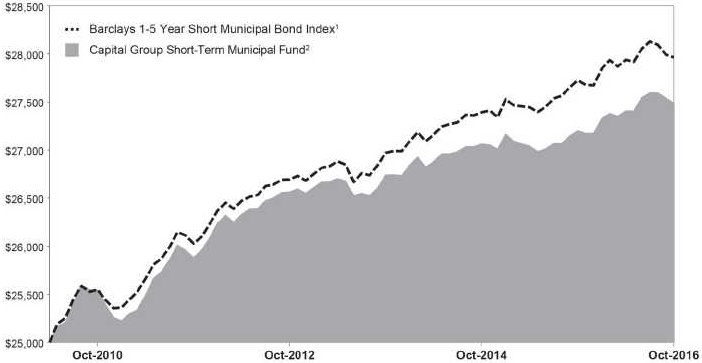
| 1 | The index is unmanaged, and its results include reinvested distributions but do not reflect the effect of sales charges, commissions, or expenses. |
| 2 | Includes reinvested dividends and capital gain distributions. |
Results are for past periods and are not predictive of results for future periods. Current and future results may be lower or higher than those shown. Share price and returns will vary so investors may lose money. The results shown are before taxes on fund distributions and sale of fund shares.
Investment portfolio – quality ratings*
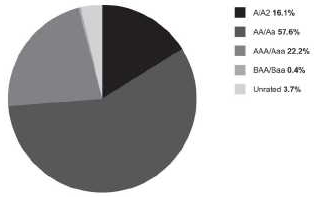
| * | Bond ratings, which typically range from Aaa/AAA (highest to D (lowest), are assigned by credit rating agencies such as Moody’s, Standard & Poors and/or Fitch as an indication of an Issuer’s credit-worthiness. If agency rating differ, securities are put in the highest category consistent with fund investment policies. When securities have not been rated by a rating agency (included in “unrated” at left), the investment advisor performs it’s own credit analysis and assigns comparable ratings that are used for compliance and fund investment policies. The ratings are not covered by the Report of Independent Registered Public Accounting Firm. |
| 22 | Private Client Services Funds |
Capital Group Short-Term Municipal Fund
Schedule of investments
October 31, 2016
| Bonds & notes - 87.2% | Principal amount (000) | Value (000) | ||||||
| Alabama - 1.9% | ||||||||
| Black Belt Energy Gas Dist., Natural Gas Util. Imps. Rev. Bonds, Series A (Mandatory Put 06/01/21 @ 100), 4.00%, 20461 | $ | 3,050 | $ | 3,359 | ||||
| 3,359 | ||||||||
| Arizona - 0.7% | ||||||||
| Arizona Health Facs. Auth., Health Care Facs. Rev. Ref. Bonds, Series A, 5.00%, 2021 | 300 | 346 | ||||||
| Phoenix Civic Imp. Corp., Sewer Rev. Ref. Bonds, 5.00%, 2017 | 250 | 257 | ||||||
| Salt River Project Agricultural Imps. & Power Dist., Energy Res. Auth. Rev. Ref. Bonds, Series A, 4.00%, 2017 | 550 | 569 | ||||||
| 1,172 | ||||||||
| California - 11.6% | ||||||||
| Bay Area Toll Auth., Highway Tolls Rev. Bonds (Mandatory Put 05/01/23 @ 100), 1.53%, 20451 | 1,500 | 1,499 | ||||||
| Bay Area Toll Auth., Highway Tolls Rev. Bonds, Series B (Mandatory Put 04/02/18 @ 100), 1.50%, 20471 | 625 | 628 | ||||||
| Bay Area Toll Auth., Highway Tolls Rev. Ref. Bonds, 4.00%, 2022 | 500 | 572 | ||||||
| Bay Area Toll Auth., Highway Tolls Rev. Ref. Bonds, Series C (Mandatory Put 04/01/19 @ 100), 1.875%, 20471 | 500 | 507 | ||||||
| California Health Facs. Fncg. Auth., Health Care Facs. Imps. Rev. Bonds, Series A, 5.00%, 2021 | 250 | 298 | ||||||
| California Health Facs. Fncg. Auth., Health Care Facs. Rev. Ref. Bonds, 3.00%, 2021 | 640 | 690 | ||||||
| California Health Facs. Fncg. Auth., Health Care Facs. Rev. Ref. Bonds, Series A, 5.00%, 2020 | 1,000 | 1,130 | ||||||
| California Health Facs. Fncg. Auth., Health Care Facs. Rev. Ref. Bonds, Series C (Mandatory Put 10/15/19 @ 100), 5.00%, 20431 | 1,000 | 1,111 | ||||||
| California Infrastructure & Econ. Dev. Bank, Misc. Rev. Ref. Bonds, Series A-2 (Mandatory Put 04/03/17 @ 100), 0.91%, 20381 | 1,150 | 1,149 | ||||||
| California State Public Works Board, College & Univ. Imps. Lease Rev. Bonds, Series G, 4.00%, 2016 | 600 | 602 | ||||||
| Chula Vista Muni. Fncg. Auth., Special Tax Rev. Ref. Bonds, Series B, 5.00%, 2023 | 950 | 1,149 | ||||||
| Fillmore Redev. Agcy. Successor Agcy., Tax Increment Allocation Ref. Bonds, 4.00%, 2018 | 400 | 419 | ||||||
| Glendale Redev. Agcy. Successor Agcy., Tax Increment Allocation Ref. Bonds (AGM Insured), 4.00%, 2019 | 200 | 217 | ||||||
| Golden State Tobacco Securitization Corp., Misc. Rev. Ref. Bonds, Series A, 5.00%, 2019 | 1,000 | 1,100 | ||||||
| Hawthorne Comm. Redev. Agcy. Successor Agcy., Tax Increment Allocation Rev. Ref. Bonds, (AGM Insured), 5.00%, 2022 | 400 | 480 | ||||||
| Kings Canyon Unified School Dist., G.O. Prop. Tax Ref. Bonds, (AGM Insured), 5.00%, 2022 | 720 | 862 | ||||||
| La Quinta Redev. Agcy. Successor Agcy., Tax Allocation, Ref. Bonds, 5.00%, 2020 | 600 | 686 | ||||||
| Los Angeles Unified School Dist., G.O. Prop. Tax Ref. Bonds, Series C, 5.00%, 2020 | 500 | 572 | ||||||
| Menifee Union School Dist. Public Fncg. Auth., Special Tax Ref. Bonds, Series A, 4.00%, 2021 | 400 | 443 | ||||||
| Menlo Park Comm. Dev. Agcy. Successor Agcy., Tax Increment Allocation Ref. Bonds, 5.00%, 2020 | 335 | 383 | ||||||
| Oakland Unified School Dist., G.O. School Imps. Prop. Tax Bonds, Series A, 4.00%, 2022 | 350 | 403 | ||||||
| Regents of the Univ. of California Medical Center Pooled Rev., Health Care Facs. Rev. Ref. Bonds, Series L, 5.00%, 2022 | 750 | 902 | ||||||
| San Diego County Regional Trans. Commission., Sales Tax Rev. Ref. Bonds, Series A, 5.00%, 2018 | 150 | 159 | ||||||
| San Diego Redev. Agcy. Successor Agcy., Tax Increment Allocation Rev. Ref. Bonds, Series A, 5.00%, 2021 | 725 | 854 | ||||||
| State of California Dept. of Water Res., Rev. Ref. Bonds, Series AU (Mandatory Put 09/01/17 @ 100), 1.25%, 20351 | 650 | 651 | ||||||
| State of California Dept. of Water Ress. Power Supply, Energy Res. Auth. Rev. Ref. Bonds, Series N, 5.00%, 2020 | 200 | 227 | ||||||
| State of California, G.O. Public Imps. Misc. Rev. Bonds, 4.00%, 2018 | 1,000 | 1,058 | ||||||
| Private Client Services Funds | 23 |
Capital Group Short-Term Municipal Fund
Schedule of investments
October 31, 2016
| Bonds & notes - continued | Principal amount (000) | Value (000) | ||||||
| California - continued | ||||||||
| Temecula Valley Unified School Dist. Fncg. Auth., Special Tax Rev. Ref. Bonds (BAM Insured), 4.00%, 2017 | $ | 400 | $ | 411 | ||||
| Tracy Comm. Dev. Agcy. Successor Agcy., Tax Increment Allocation Rev. Ref. Bonds: | ||||||||
| 3.00%, 2017 | 275 | 280 | ||||||
| 5.00%, 2021 | 250 | 292 | ||||||
| Union City Comm. Redev. Agcy., Tax Increment Allocation Rev. Ref. Bonds, Series A, 5.00%, 2021 | 250 | 295 | ||||||
| Westminster Redev. Agcy. Successor Agcy., Tax Increment Allocation Ref. Bonds (BAM Insured), 5.00%, 2028 | 375 | 464 | ||||||
| Westminster Redev. Agcy. Successor Agcy., Tax Increment Allocation Rev. Ref. Bonds, 4.00%, 2021 | 150 | 169 | ||||||
| 20,662 | ||||||||
| Colorado - 0.4% | ||||||||
| Colorado State Board of Governors, College & Univ. Rev. Ref. Bonds, Series A, 4.00%, 2018 | 525 | 547 | ||||||
| Univ. of Colorado., College & Univ. Imps. Rev. Bonds, Series A, 5.00%, 2019 | 150 | 166 | ||||||
| 713 | ||||||||
| Connecticut - 2.3% | ||||||||
| Connecticut Housing Fin. Auth., Loc. or GTD Housing Rev. Bonds, Sub-Series B-2 (FHA/INS/GTD Insured), 4.00%, 2032 | 390 | 418 | ||||||
| Connecticut Housing Fin. Auth., Loc. or GTD Housing Rev. Bonds, Sub-Series C-1, 4.00%, 2044 | 625 | 676 | ||||||
| Connecticut Housing Fin. Auth., Loc. or GTD Housing Rev. Ref. Bonds, 4.00%, 2044 | 1,030 | 1,078 | ||||||
| Connecticut Housing Fin. Auth., Loc. or GTD Housing Rev. Ref. Bonds, Series A-1, 4.00%, 2045 | 300 | 323 | ||||||
| Connecticut Housing Fin. Auth., Loc. or GTD Housing Rev. Ref. Bonds, Sub-Series C-1, 3.50%, 2045 | 660 | 698 | ||||||
| Connecticut State Health & Educ. Fac. Auth., College & Univ. Imps. Rev. Bonds, Series U1 (Mandatory Put 02/06/19 @ 100), 1.00%, 20331 | 1,000 | 998 | ||||||
| 4,191 | ||||||||
| Delaware - 0.1% | ||||||||
| Delaware Trans. Auth., Highway Tolls Rev. Bonds, 5.00%, 2021 | 230 | 267 | ||||||
| 267 | ||||||||
| Florida - 3.3% | ||||||||
| Citizens Prop. Insurance Corp., Misc. Purposes Rev. Bonds, Series A-1, 5.00%, 2019 | 2,100 | 2,309 | ||||||
| City of Cape Coral, Water Rev. Ref. Bonds (AGM Insured), 3.00%, 2017 | 600 | 611 | ||||||
| City of Lakeland Dept. of Electric Utils., Energy Res. Auth. Rev. Ref. Bonds, 5.00%, 2021 | 350 | 412 | ||||||
| Florida Housing Fin. Corp., Loc. or GTD Housing Rev. Bonds, Series A (GNMA/FNMA/FHLMC Insured), 4.50%, 2029 | 265 | 278 | ||||||
| Florida Housing Fin. Corp., Loc. or GTD Housing Rev. Bonds, Series B (GNMA/FNMA/FHLMC Insured), 4.50%, 2029 | 155 | 164 | ||||||
| Florida Muni. Power Agcy., Misc. Rev. Ref. Bonds, Series A, 4.00%, 2017 | 300 | 308 | ||||||
| Orange County Health Facs. Auth., Health Care Facs. Nursing Homes Rev. Bonds, 4.00%, 2020 | 710 | 771 | ||||||
| Palm Beach County Health Facs. Auth., Health Care Facs. Nursing Homes Rev. Ref. Bonds, 5.00%, 2021 | 500 | 574 | ||||||
| Tampa Bay Water, Water Rev. Ref. Bonds, Series A, 5.00%, 2017 | 450 | 467 | ||||||
| 5,894 | ||||||||
| 24 | Private Client Services Funds |
Capital Group Short-Term Municipal Fund
Schedule of investments
October 31, 2016
| Bonds & notes - continued | Principal amount (000) | Value (000) | ||||||
| Georgia - 3.5% | ||||||||
| Atlanta Dev. Auth., Loc. or GTD Housing Rev. Ref. Bonds, 5.00%, 2017 | $ | 250 | $ | 259 | ||||
| City of Atlanta Dept., Port, Airport & Marina Imps. Rev. Bonds, Series B, 5.00%, 2019 | 95 | 103 | ||||||
| City of Atlanta, Water Rev. Ref. Bonds, Series B, 5.00%, 2019 | 1,000 | 1,116 | ||||||
| Gainesville & Hall County Hospital Auth., Health Care Facs. Rev. Ref. Bonds, Series B (Mandatory Put 02/18/20 @ 100), 1.58%, 20351 | 400 | 402 | ||||||
| Georgia Housing & Fin. Auth., Loc. or GTD Housing Rev. Bonds, 4.00%, 2044 | 505 | 533 | ||||||
| Georgia Housing & Fin. Auth., Loc. or GTD Housing Rev. Ref. Bonds, Series A-1, 3.50%, 2045 | 195 | 206 | ||||||
| Georgia State Road & Tollway Auth., Govt. Fndg. Grant Highway Imps. Rev. Bonds, Series A, 5.00%, 2019 | 1,155 | 1,269 | ||||||
| Metropolitan Atlanta Rapid Transit Auth., Sales Tax Rev. Bonds, Series A (Mandatory Put 07/01/17 @ 100), 0.93%, 20251 | 1,300 | 1,299 | ||||||
| Metropolitan Atlanta Rapid Transit Auth., Sales Tax Rev. Bonds, Series B (Mandatory Put 07/01/17 @ 100), 0.91%, 20251 | 1,000 | 999 | ||||||
| Muni. Electric Auth. of Georgia, Energy Res. Imps. Rev. Ref. Bonds, Series B, 5.00%, 2018 | 120 | 126 | ||||||
| 6,312 | ||||||||
| Guam - 0.3% | ||||||||
| Territory of Guam, Cash Flow Mgmt., Misc. Rev. Bonds, Series A, 5.00%, 2017 | 600 | 604 | ||||||
| 604 | ||||||||
| Hawaii - 0.0% | ||||||||
| State of Hawaii, G.O. Public Imps. Misc. Rev. Bonds, Series DZ, 5.00%, 2017 | 70 | 73 | ||||||
| 73 | ||||||||
| Illinois - 7.0% | ||||||||
| City of Chicago, Sewer Imps. Rev. Bonds: | ||||||||
| 3.00%, 2017 | 325 | 326 | ||||||
| 5.00%, 2018 | 200 | 208 | ||||||
| 5.00%, 2022 | 1,010 | 1,147 | ||||||
| City of Chicago, Sewer Rev. Ref. Bonds, Series C, 5.00%, 2021 | 500 | 559 | ||||||
| City of Chicago, Water Util. Imps. Rev. Bonds, 3.00%, 2019 | 1,065 | 1,105 | ||||||
| Greater Chicago Metropolitan Water Reclamation Dist., G.O. Sewer Imps. Prop. Tax Bonds, Series B, 5.00%, 2017 | 300 | 314 | ||||||
| Illinois Fin. Auth., Health Care Facs. Rev. Ref. Bonds, Series A, 5.00%, 2021 | 1,100 | 1,283 | ||||||
| Illinois Fin. Auth., Health Care Facs. Rev. Ref. Bonds, Series A-1 (Mandatory Put 01/15/20 @ 100), 5.00%, 20301 | 1,000 | 1,118 | ||||||
| Illinois Fin. Auth., Misc. Rev. Ref. Bonds, 5.00%, 2023 | 100 | 119 | ||||||
| Illinois Fin. Auth., Misc. Rev. Ref. Bonds, 5.00%, 2024 | 130 | 157 | ||||||
| Illinois Housing Dev. Auth., Loc. or GTD Housing Rev. Bonds (Mandatory Put 05/15/25 @ 100) (FNMA Insured), 1.63%, 20501 | 1,000 | 988 | ||||||
| Illinois State Toll Highway Auth., Highway Tolls Rev. Ref. Bonds, Series A, 5.00%, 2020 | 500 | 574 | ||||||
| Illinois State Toll Highway Auth., Highway Tolls Rev. Ref. Bonds, Series B, 5.00%, 2017 | 1,500 | 1,566 | ||||||
| Illinois State Univ., College & Univ. Rev. Ref. Bonds (AGM Insured), 5.00%, 2022 | 600 | 692 | ||||||
| State of Illinois, G.O. Public Imps. Misc. Rev. Bonds, 5.00%, 2017 | 725 | 742 | ||||||
| Univ. of Illinois, College & Univ. Rev. Certs. of Part. Ref. Bonds, Series A, 4.00%, 2019 | 1,000 | 1,072 | ||||||
| Volo Village Special Service Area No. 3 & 6, Special Tax Rev. Ref. Bonds, (AGM Insured), 3.00%, 2021 | 500 | 517 | ||||||
| 12,487 | ||||||||
| Private Client Services Funds | 25 |
Capital Group Short-Term Municipal Fund
Schedule of investments
October 31, 2016
| Bonds & notes - continued | Principal amount (000) | Value (000) | ||||||
| Indiana - 1.9% | ||||||||
| City of Whiting, Ind. Imps. Rev. Bonds, (Mandatory Put 10/01/19 @ 100), 1.85%, 20441 | $ | 200 | $ | 201 | ||||
| Indiana Fin. Auth., Health Care Facs. Rev. Ref. Bonds, Series A, 5.00%, 2021 | 1,250 | 1,473 | ||||||
| Indiana Univ., College & Univ. Rev. Ref. Bonds, Series A: | ||||||||
| 3.00%, 2020 | 210 | 224 | ||||||
| 5.00%, 2018 | 500 | 533 | ||||||
| 5.00%, 2022 | 540 | 648 | ||||||
| Purdue Univ., College & Univ. Rev. Ref. Bonds, Series BB-1, 5.00%, 2020 | 200 | 228 | ||||||
| 3,307 | ||||||||
| Kentucky - 1.4% | ||||||||
| Kentucky Housing Corp., St. Single Family Housing Rev. Bonds, Series B, 5.00%, 2027 | 100 | 105 | ||||||
| Kentucky State Prop. & Building Commission., Lease Rev. Ref. Bonds, Series B, 5.00%, 2022 | 2,000 | 2,372 | ||||||
| 2,477 | ||||||||
| Louisiana - 0.7% | ||||||||
| Louisiana Housing Fin. Agcy., Loc. or GTD Housing Rev. Bonds (GNMA/FNMA/FHLMC Insured), 4.60%, 2028 | 625 | 645 | ||||||
| Louisiana State Citizens Prop. Insurance Corp., Misc. Rev. Ref. Bonds, Series A, 5.00%, 2023 | 500 | 601 | ||||||
| 1,246 | ||||||||
| Maine - 0.4% | ||||||||
| Maine Turnpike Auth., Highway Tolls Rev. Ref. Bonds, 5.00%, 2018 | 625 | 668 | ||||||
| 668 | ||||||||
| Maryland - 0.3% | ||||||||
| County of Baltimore, Health Care Facs. Rev. Ref. Bond, 5.00%, 2022 | 400 | 464 | ||||||
| 464 | ||||||||
| Massachusetts - 2.9% | ||||||||
| Commonwealth of Massachusetts, G.O. Public Imps. Prop. Tax Bonds, Series D-2 (Mandatory Put 08/01/17 @ 100), 0.93%, 20431 | 1,750 | 1,749 | ||||||
| Massachusetts Dev. Fin. Agcy., Health Care Facs. Rev. Ref. Bonds, Series M (Mandatory Put 01/30/18 @ 100), 1.18%, 20381 | 1,290 | 1,290 | ||||||
| Massachusetts Housing Fin. Agcy., Loc. or GTD Housing Rev. Bonds, Series 171, 4.00%, 2044 | 850 | 918 | ||||||
| Massachusetts Housing Fin. Agcy., Loc. or GTD Housing Rev. Bonds, Series 183, 3.50%, 2046 | 1,000 | 1,063 | ||||||
| Massachusetts Housing Fin. Agcy., Loc. or GTD Housing Rev. Ref. Bonds, Series 169, 4.00%, 2044 | 200 | 211 | ||||||
| 5,231 | ||||||||
| Michigan - 3.7% | ||||||||
| Detroit City School Dist, G.O. Prop. Tax Ref. Bonds, Series A, 5.00%, 2018 | 1,000 | 1,053 | ||||||
| Michigan Fin. Auth., Health Care Facs. Rev. Ref. Bonds, 5.00%, 2023 | 925 | 1,114 | ||||||
| Michigan State Hospital Fin. Auth., Health Care Facs. Imps. Rev. Bonds, 0.95%, 20331 | 775 | 774 | ||||||
| Michigan State Hospital Fin. Auth., Health Care Facs. Imps. Rev. Bonds (Pre-refunded with U.S. Govt. Securities to 02/01/18 @ 100), 0.95%, 20331 | 25 | 25 | ||||||
| Michigan State Housing Dev. Auth., Loc. or GTD Housing Rev. Bonds, 4.00%, 2044 | 915 | 975 | ||||||
| Michigan Strategic Fund, Energy Res. Auth. Rev. Ref. Bonds, Series SE (Mandatory Put 09/01/21 @ 100), 1.45%, 20291 | 325 | 321 | ||||||
| State of Michigan, Highway Imps. Rev. Ref. Bonds, 5.00%, 2020 | 1,000 | 1,124 | ||||||
| 26 | Private Client Services Funds |
Capital Group Short-Term Municipal Fund
Schedule of investments
October 31, 2016
| Bonds & notes - continued | Principal amount (000) | Value (000) | ||||||
| Michigan - continued | ||||||||
| Wayne County Airport Auth., Port, Airport & Marina Imps. Rev. Bonds, Series A, 5.00%, 2018 | $ | 300 | $ | 324 | ||||
| Wayne County Airport Auth., Port, Airport & Marina Rev. Ref. Bonds, Series G, 5.00%, 2021 | 300 | 345 | ||||||
| Wayne State Univ., College & Univ. Rev. Ref. Bonds (AGM Insured), 5.00%, 2016 | 550 | 551 | ||||||
| 6,606 | ||||||||
| Minnesota - 0.1% | ||||||||
| Minnesota Housing Fin. Agcy., Loc. or GTD Housing Rev. Bonds (GNMA/FNMA/FHLMC Insured), 4.00%, 2040 | 165 | 171 | ||||||
| 171 | ||||||||
| Missouri - 1.2% | ||||||||
| City of Saint Louis, Port, Airport & Marina Rev. Ref. Bonds, 5.00%, 2017 | 330 | 339 | ||||||
| Missouri Housing Dev. Commission, Loc. or GTD Housing Rev. Bonds (GNMA/FNMA/FHLMC Insured), 3.50%, 2041 | 1,400 | 1,498 | ||||||
| Missouri Housing Dev. Commission, Loc. or GTD Housing Rev. Bonds, (GNMA/FNMA/FHLMC Insured), 4.25%, 2030 | 310 | 324 | ||||||
| 2,161 | ||||||||
| Nebraska - 1.9% | ||||||||
| Central Plains Energy Project, Natural Gas Rev. Ref. Bonds (Mandatory Put 12/01/19 @ 100), 5.00%, 20391 | 1,000 | 1,104 | ||||||
| Nebraska Investment Fin. Auth., Loc. or GTD Housing Rev. Bonds, Series A: | ||||||||
| 3.00%, 2044 | 320 | 328 | ||||||
| 3.50%, 2046 | 400 | 427 | ||||||
| 4.00%, 2044 | 840 | 890 | ||||||
| Nebraska Investment Fin. Auth., Loc. or GTD Housing Rev. Bonds, Series A (GNMA/FNMA/FHLMC Insured), 2.50%, 2034 | 155 | 156 | ||||||
| Nebraska Investment Fin. Auth., Loc. or GTD Housing Rev. Bonds, Series E (GNMA/FNMA/FHLMC Insured), 3.00%, 2043 | 395 | 401 | ||||||
| 3,306 | ||||||||
| Nevada - 0.4% | ||||||||
| County of Clark, Port, Airport & Marina Imps. Rev. Bonds, Series D, 5.00%, 2017 | 750 | 771 | ||||||
| 771 | ||||||||
| New Jersey - 3.6% | ||||||||
| Garden State Preservation Trust, Sales Tax Rev. Ref. Bonds, Series A, 5.00%, 2018 | 550 | 589 | ||||||
| New Jersey Econ. Dev. Auth., Lease Rev. Ref. Bonds, Series PP, 5.00%, 2019 | 750 | 808 | ||||||
| New Jersey Health Care Facs. Fncg. Auth., Health Care Facs. Imps. Rev. Bonds, Series A, 5.00%, 2022 | 200 | 237 | ||||||
| New Jersey Health Care Facs. Fncg. Auth., Health Care Facs. Rev. Ref. Bonds, Series A (AGM Insured), 5.00%, 2021 | 550 | 634 | ||||||
| New Jersey State Turnpike Auth., Highway Tolls Rev. Ref. Bonds, Series D (Mandatory Put 01/01/18 @ 100), 1.31%, 20241 | 500 | 501 | ||||||
| New Jersey State Turnpike Auth., Highway Tolls Rev. Ref. Bonds, Series E (Mandatory Put 01/01/18 @ 100), 1.31%, 20241 | 500 | 501 | ||||||
| New Jersey Trans. Trust Fund Auth., Transit Imps. Misc. Rev. Bonds, Series AA, 5.00%, 2021 | 500 | 552 | ||||||
| New Jersey Transit Corp., Transit Rev. Ref. Bonds, Series A: | ||||||||
| 5.00%, 2018 | 750 | 793 | ||||||
| Private Client Services Funds | 27 |
Capital Group Short-Term Municipal Fund
Schedule of investments
October 31, 2016
| Bonds & notes - continued | Principal amount (000) | Value (000) | ||||||
| New Jersey - continued | ||||||||
| 5.00%, 2019 | $ | 1,500 | $ | 1,619 | ||||
| Rutgers The State University of New Jersey, College & Univ. Rev. Ref. Bonds, Series J, 5.00%, 2019 | 225 | 247 | ||||||
| 6,481 | ||||||||
| New Mexico - 1.2% | ||||||||
| City of Farmington, Energy Res. Auth. Rev. Ref. Bonds (Mandatory Put 04/01/20 @ 100), 1.875%, 20291 | 1,000 | 1,014 | ||||||
| City of Farmington, Energy Res. Auth. Rev. Ref. Bonds, Series A (Mandatory Put 04/01/20 @ 100), 1.875%, 20291 | 1,000 | 1,015 | ||||||
| New Mexico Educ. Assistance Foundation, Student Ln, Rev. Ref. Bonds, Series A-2 (GTD St. Lns. Insured), 1.492%, 20281 | 35 | 35 | ||||||
| 2,064 | ||||||||
| New York - 7.0% | ||||||||
| Build NYC Res. Corp., Misc. Rev. Ref. Bonds, 5.00%, 2021 | 525 | 606 | ||||||
| City of New York, G.O. Prop. Tax Ref. Bonds, Sub-Series J-4, 1.18%, 20251 | 2,000 | 2,000 | ||||||
| City of New York, Transitional Fin. Auth., Income Tax Rev. Ref. Bonds, 5.00%, 2016 | 15 | 15 | ||||||
| City of New York, Transitional Fin. Auth., Public Imps. Rev. Bonds, 5.00%, 2019 | 750 | 839 | ||||||
| Metropolitan Trans. Auth., Misc. Rev. Ref. Bonds, Series B-3B, 1.53%, 20181 | 650 | 653 | ||||||
| Metropolitan Trans. Auth., Transit Imps. Rev. Bonds, Sub-Series A-2 (Mandatory Put 06/01/20 @ 100), 1.21%, 20391 | 2,600 | 2,597 | ||||||
| Metropolitan Trans. Auth., Transit Rev. Ref. Bonds, Sub-Series G-3 (Mandatory Put 10/31/16 @ 100), 1.053%, 20311 | 1,000 | 1,000 | ||||||
| New York City Trust for Cultural Ress. Rev. Bonds (Mandatory Put 08/01/17 @ 100), 1.35%, 20361 | 500 | 502 | ||||||
| New York City, Water Rev. Ref. Bonds, 0.65%, 20381 | 1,525 | 1,525 | ||||||
| New York State Dormitory Auth., Income Tax Econ. Dev. & Housing Rev. Ref. Bonds, Series A, 5.00%, 2016 | 1,000 | 1,006 | ||||||
| New York State Thruway Auth., Highway Tolls Rev. Ref. Bonds, Series A, 5.00%, 2019 | 300 | 329 | ||||||
| Public Housing Capital Fund Trust I Rev. Bonds (HUD Ln. Insured), 4.50%, 20222 | 324 | 337 | ||||||
| State of New York Mortgage Agcy., Loc. or GTD Housing Rev. Bonds, Series 197, 3.50%, 2044 | 1,000 | 1,075 | ||||||
| 12,484 | ||||||||
| North Carolina - 0.3% | ||||||||
| State of North Carolina, Govt. Fndg. Grant Highway Imps. Rev. Bonds, 5.00%, 2020 | 400 | 449 | ||||||
| 449 | ||||||||
| North Dakota - 1.4% | ||||||||
| North Dakota Housing Fin. Agcy., Loc. or GTD Housing Rev. Bonds: | ||||||||
| 3.75%, 2042 | 155 | 161 | ||||||
| 4.00%, 2038 | 1,520 | 1,621 | ||||||
| North Dakota Housing Fin. Agcy., Loc. or GTD Housing Rev. Bonds, Series D, 4.00%, 2046 | 645 | 700 | ||||||
| 2,482 | ||||||||
| Ohio - 2.7% | ||||||||
| City of Cleveland, Airport System Rev., Port, Airport & Marina Rev. Ref. Bonds, Series C (AGC Insured), 5.00%, 2017 | 750 | 755 | ||||||
| County of Warren, Health Care Facs. Rev. Ref. Bonds, 4.00%, 2018 | 220 | 230 | ||||||
| County of Warren, Health Care Facs. Rev. Ref. Bonds, Series A, 5.00%, 2022 | 400 | 469 | ||||||
| 28 | Private Client Services Funds |
Capital Group Short-Term Municipal Fund
Schedule of investments
October 31, 2016
| Bonds & notes - continued | Principal amount (000) | Value (000) | ||||||
| Ohio - continued | ||||||||
| Ohio Housing Fin. Agcy., Loc. or GTD Housing Rev. Bonds, (GNMA/FNMA/FHLMC Insured), 4.50%, 2028 | $ | 315 | $ | 334 | ||||
| State of Ohio, Public Imps. Misc. Rev. Bonds, Series 2016-1, 5.00%, 2022 | 2,500 | 3,015 | ||||||
| 4,803 | ||||||||
| Oklahoma - 0.4% | ||||||||
| Grand River Dam Auth., Electric Util., Energy Res. Auth. Rev. Ref. Bonds, Series A, 5.00%, 2022 | 500 | 595 | ||||||
| Stillwater Utils. Auth., Power Plants (Non Nuclear) Multiple Util. Rev. Ref. Bonds, Series A, 4.00%, 2019 | 150 | 163 | ||||||
| 758 | ||||||||
| Oregon - 3.7% | ||||||||
| County of Gilliam, Res. Recovery Imps. Rev. Bonds, 1.50%, 2018 | 1,000 | 1,007 | ||||||
| Oregon State Facs. Auth., Health Care Facs. Rev. Ref. Bonds (Mandatory Put 09/15/18 @ 100), 1.63%, 20221 | 2,300 | 2,300 | ||||||
| State of Oregon, Cash Flow Mgmt., Misc. Rev. Bonds, Series A, 2.00%, 2017 | 2,000 | 2,018 | ||||||
| State of Oregon, G.O. Unemployment & Welfare Fndg. Prop. Tax Bonds, Series 94-H, 4.00%, 2044 | 1,220 | 1,328 | ||||||
| 6,653 | ||||||||
| Pennsylvania - 1.4% | ||||||||
| Butler County Hospital Auth., Health Care Facs. Rev. Ref. Bonds, 3.00%, 2018 | 250 | 258 | ||||||
| Pennsylvania Turnpike Commission, Highway Tolls Rev. Ref. Bonds, 5.00%, 2021 | 1,500 | 1,725 | ||||||
| School Dist. of Philadelphia, G.O. Prop. Tax Ref. Bonds, Series F (St. Aid Withhldg. Insured), 5.00%, 2019 | 500 | 542 | ||||||
| 2,525 | ||||||||
| Puerto Rico - 0.3% | ||||||||
| Puerto Rico Ind. Tourist Educ. Medical & Environmental Control Facs. Fncg. Auth., College & Univ. Imps. Rev. Ref. Bonds, 5.00%, 2018 | 350 | 356 | ||||||
| Puerto Rico Ind. Tourist Educ. Medical & Environmental Control Facs. Fncg. Auth., College & Univ. Rev. Ref. Bonds, 5.00%, 2017 | 250 | 253 | ||||||
| 609 | ||||||||
| Rhode Island - 1.1% | ||||||||
| Rhode Island Commerce Corp., Govt. Fndg. Grant Rev. Ref. Bonds, 5.00%, 2021 | 920 | 1,061 | ||||||
| Rhode Island Housing & Mortgage Fin. Corp., Loc. or GTD Housing Rev. Ref. Bonds, 4.00%, 2033 | 875 | 927 | ||||||
| 1,988 | ||||||||
| South Carolina - 0.9% | ||||||||
| South Carolina State Housing Fin. & Dev. Auth., Loc. or GTD Housing Rev. Bonds (GNMA/FNMA/FHLMC COLL FHA Insured), 4.00%, 2036 | 735 | 798 | ||||||
| South Carolina State Housing Fin. & Dev. Auth., Loc. or GTD Housing Rev. Bonds, Series 1 (GNMA COLL Insured), 4.50%, 2030 | 310 | 327 | ||||||
| South Carolina State Public Service Auth., Nuclear Rev. Ref. Bonds, Series A, 5.00%, 2022 | 400 | 481 | ||||||
| 1,606 | ||||||||
| South Dakota - 0.4% | ||||||||
| South Dakota Health & Educ. Facs. Auth., Health Care Facs. Rev. Ref. Bonds, 5.00%, 2021 | 250 | 293 | ||||||
| Private Client Services Funds | 29 |
Capital Group Short-Term Municipal Fund
Schedule of investments
October 31, 2016
| Bonds & notes - continued | Principal amount (000) | Value (000) | ||||||
| South Dakota – continued | ||||||||
| South Dakota Housing Dev. Auth., Loc. or GTD Housing Rev. Bonds, Series E, 4.00%, 2044 | $ | 365 | $ | 392 | ||||
| 685 | ||||||||
| Tennessee - 2.3% | ||||||||
| Metropolitan Govt. Nashville & Davidson County Health & Educ. Facs., College & Univ. Rev. Ref. Bonds (Mandatory Put 10/01/17 @ 100), 1.23%, 20381 | 360 | 360 | ||||||
| Metropolitan Govt. Nashville & Davidson County Health & Educ. Facs., College & Univ. Rev. Ref. Bonds (Pre-refunded with U.S. Treasury Obligations 04/01/17 @ 100), 1.23%, 20381 | 340 | 340 | ||||||
| Tennessee Housing Dev. Agcy., Loc. or GTD Housing Rev. Bonds: | ||||||||
| 4.00%, 2038 | 310 | 327 | ||||||
| 4.00%, 2045 | 800 | 852 | ||||||
| 4.00%, 2045 | 1,855 | 1,992 | ||||||
| 4.50%, 2037 | 285 | 304 | ||||||
| 4,175 | ||||||||
| Texas - 6.9% | ||||||||
| City of Austin, Electric Util., Energy Res. Auth. Rev. Ref. Bonds, Series A, 5.00%, 2021 | 525 | 622 | ||||||
| City of Houston, Util. System, Water Rev. Ref. Bonds (Mandatory Put 06/01/17 @ 100), 1.38%, 20341 | 600 | 600 | ||||||
| City Public Service Board of San Antonio, Energy Res. Auth. Imps. Rev. Bonds (Mandatory Put 12/01/20 @ 100), 3.00%, 20451 | 1,000 | 1,064 | ||||||
| City Public Service Board of San Antonio, Energy Res. Auth. Imps. Rev. Bonds, Series C (Mandatory Put 12/01/19 @ 100), 3.00%, 20451 | 1,000 | 1,052 | ||||||
| City Public Service Board of San Antonio, Energy Res. Auth. Rev. Ref. Bonds, 5.00%, 2017 | 500 | 506 | ||||||
| City Public Service Board of San Antonio, Energy Res. Auth. Rev. Ref. Bonds (Mandatory Put 02/01/18 @ 100), 1.01%, 20331 | 1,650 | 1,645 | ||||||
| County of Harris, Highway Tolls Rev. Ref. Bonds, 5.00%, 2021 | 400 | 470 | ||||||
| Dallas Area Rapid Transit, Sales Tax Rev. Ref. Bonds, Series A, 4.00%, 2016 | 100 | 100 | ||||||
| Dallas-Fort Worth Intl. Port, Airport & Marina Rev. Ref. Bonds, Series B, 5.00%, 2018 | 200 | 216 | ||||||
| Dallas-Fort Worth Intl. Port, Airport & Marina Rev. Ref. Bonds, Series D, 5.00%, 2019 | 500 | 556 | ||||||
| Grand Parkway Trans. Corp., Highway Tolls Rev. Ref. Bonds, Series A, 3.00%, 2016 | 350 | 351 | ||||||
| Harris County Health Facs. Dev. Corp., Health Care Facs. Imps. Rev. Ref. Bonds, Series A-4 (AGM Insured), 0.89%, 20311 | 175 | 175 | ||||||
| Houston Higher Edu. Finance Corp., Charter Sch. Aid, Rev. Ref. Bonds, Series A (PSF-GTD Insured), 5.00%, 2018 | 455 | 479 | ||||||
| Katy Independent School Dist., G.O. Prop. Tax Ref. Bonds, Series C (PSF-GTD Insured), (Mandatory Put 08/15/19 @ 100), 0.908%, 20361 | 650 | 653 | ||||||
| North Texas Tollway Auth., Highway Tolls Rev. Ref. Bonds, Series C (Mandatory Put 01/01/19 @ 100), 1.95%, 20381 | 600 | 606 | ||||||
| Olmos Park Higher Edu. Facs. Corp., College & Univ. Imps. Rev. Ref. Bonds, 5.00%, 2019 | 400 | 444 | ||||||
| State of Texas, G.O. Public Imps. Prop. Tax Bonds, (Mandatory Put 10/01/18 @ 100), 1.01%, 20411 | 1,000 | 995 | ||||||
| Texas A&M Univ., College & Univ. Rev. Ref. Bonds, Series B, 5.00%, 2021 | 450 | 525 | ||||||
| Texas Dept. of Housing & Comm. Affairs, Loc. or GTD Housing Rev. Bonds, Series A (GNMA/FNMA/FHLMC Insured), 5.00%, 2029 | 185 | 197 | ||||||
| Texas State Univ. System, College & Univ. Rev. Ref. Bonds, Series A, 5.00%, 2020 | 550 | 621 | ||||||
| Texas Trans. Commission State Highway Fund, Highway Imps. Fuel Sales Tax Rev. Bonds, Series B (Mandatory Put 04/01/17 @ 100), 0.98%, 20321 | 500 | 500 | ||||||
| 12,377 | ||||||||
| 30 | Private Client Services Funds |
Capital Group Short-Term Municipal Fund
Schedule of investments
October 31, 2016
| Bonds & notes - continued | Principal amount (000) | Value (000) | ||||||
| Utah - 0.3% | ||||||||
| Utah Housing Corp., Loc. or GTD Housing Rev. Bonds, Series D2 (FHA/INS Insured), 4.00%, 2045 | $ | 485 | $ | 524 | ||||
| 524 | ||||||||
| Virginia - 1.6% | ||||||||
| Northern Virginia Trans. Auth., Transit Imps. Misc. Taxes Rev. Bonds, 5.00%, 2020 | 250 | 284 | ||||||
| Virginia Commonwealth Trans. Board, Govt. Fndg. Grant Transit Imps. Rev. Bonds: | ||||||||
| 5.00%, 2019 | 600 | 668 | ||||||
| 5.00%, 2020 | 1,000 | 1,130 | ||||||
| Wise County Ind. Dev. Auth., Energy Res. Auth. Res. Recovery Imps. Rev. Bonds, Series A (Mandatory Put 06/01/20 @ 100), 1.875%, 20401 | 750 | 763 | ||||||
| 2,845 | ||||||||
| Washington - 3.5% | ||||||||
| Grant County Public Util. Dist. No. 2, Energy Res. Auth. Rev. Ref. Bonds, Series A, 3.00%, 2017 | 300 | 301 | ||||||
| State of Washington, Highway Imps. Rev. Bonds: | ||||||||
| 5.00%, 2018 | 1,500 | 1,608 | ||||||
| 5.00%, 2019 | 900 | 996 | ||||||
| Washington Health Care Facs. Auth., Health Care Facs. Nursing Homes Rev. Bonds (Mandatory Put 01/01/21 @ 100), 1.63%, 20351 | 2,000 | 1,990 | ||||||
| Washington Health Care Facs. Auth., Health Care Facs. Rev. Ref. Bonds, Series B (Mandatory Put 10/01/21 @ 100), 5.00%, 20421 | 1,000 | 1,168 | ||||||
| Washington St. Housing Fin. Commission, Loc. or GTD Housing Rev. Bonds, Series A (GNMA/FNMA/FHLMC Insured), 4.50%, 2029 | 215 | 225 | ||||||
| 6,288 | ||||||||
| West Virginia - 1.0% | ||||||||
| West Virginia Univ., College & Univ. Rev. Ref. Bonds (Mandatory Put 10/01/19 @ 100), 1.16%, 20411 | 1,750 | 1,747 | ||||||
| 1,747 | ||||||||
| Wisconsin - 0.8% | ||||||||
| Public Fin. Auth., Health Care Facs. Rev. Ref. Bonds, 5.00%, 2022 | 300 | 353 | ||||||
| Wisconsin Health & Educ. Facs. Auth., Health Care Facs. Rev. Ref. Bonds (Mandatory Put 05/30/19 @ 100), 4.00%, 20431 | 1,000 | 1,075 | ||||||
| 1,428 | ||||||||
| Wyoming - 0.4% | ||||||||
| Wyoming Comm. Dev. Auth., Loc. or GTD Housing Rev. Bonds, Series 3, 3.00%, 2044 | 660 | 684 | ||||||
| 684 | ||||||||
| Total bonds & notes (cost: $155,150,000) | 155,797 | |||||||
| Short-term securities - 12.1% | ||||||||
| California Edu. Facs. Auth. Rev., 0.30%, November 03, 20161 | 5,000 | 5,000 | ||||||
| City of New York, G.O. Public Imps. Prop. Tax Bonds, Sub-Series H-1, 0.52%, January 01, 20361 | 2,000 | 2,000 | ||||||
| Lower Neches Valley Auth. Ind. Dev. Corp., Ind. Rev. Ref. Bonds, Series A, 0.47%, November 01, 20291 | 2,000 | 2,000 | ||||||
| Massachusetts States of Health & Edu. Facs. Auth. Rev., 0.72%, November 04, 20161 | 2,000 | 2,000 | ||||||
| Private Client Services Funds | 31 |
Capital Group Short-Term Municipal Fund
Schedule of investments
October 31, 2016
| Short-term securities - continued | Principal amount (000) | Value (000) | ||||||
| Mississippi Business Fin. Corp., Ind. Imps. Rev. Bonds, Series A, 0.50%, December 01, 20301 | $ | 1,000 | $ | 1,000 | ||||
| Mississippi Business Fin. Corp., Ind. Imps. Rev. Bonds, Series E, 0.52%, December 01, 20301 | 1,000 | 1,000 | ||||||
| Mississippi Business Fin. Corp., Ind. Imps. Rev. Bonds, Series G, 0.48%, November 01, 20351 | 2,000 | 2,000 | ||||||
| Montgomery County of Maryland:1 | ||||||||
| 0.86%, December 21, 2016 | 1,000 | 1,000 | ||||||
| 0.85%, December 21, 2016 | 3,000 | 3,000 | ||||||
| New York City, Water Rev. Ref. Bonds, VRDN, 0.48%, June 15, 20501 | 2,500 | 2,500 | ||||||
| Total short-term securities (cost: $21,500,000) | 21,500 | |||||||
| Total investment securities (cost: $176,650,000) | 177,297 | |||||||
| Other assets less liabilities | 1,297 | |||||||
| Net assets | $ | 178,594 | ||||||
| 1 | Coupon rate may change periodically. For short-term securities, the date of the next scheduled coupon rate change is considered to be the maturity date. |
| 2 | Acquired in a transaction exempt from registration under Rule 144A or section 4(2) of the Securities Act of 1933. May be resold in the U.S. in transactions exempt from registration, normally to qualified institutional buyers. At October 31, 2016, the aggregate market value of this security amounted to $337,000, representing 0.19% of net assets. |
Key to abbreviations
| Agcy. | = | Agency |
| AGM | = | Assured Guaranty Municipal Corporation |
| Auth. | = | Authority |
| BAM | = | Build America Mutual Assurance Company |
| Certs. of Part. | = | Certificates of Participation |
| COLL | = | Collateral |
| Comm. | = | Community |
| Corp. | = | Corporation |
| Dept. | = | Department |
| Dev. | = | Development |
| Dist. | = | District |
| Econ. | = | Economic |
| Edu. | = | Education |
| Educ. | = | Educational |
| Fac. | = | Facility |
| Facs. | = | Facilities |
| FHA | = | Federal Housing Administration |
| FHLMC | = | Federal Home Loan Mortgage Corporation |
| Fin. | = | Finance |
| Fncg. | = | Financing |
| Fndg. | = | Funding |
| FNMA | = | Federal National Mortgage Association |
| GNMA | = | Government National Mortgage Association |
| G.O. | = | General Obligation |
| Govt. | = | Government |
| GTD | = | Guaranteed |
| HUD | = | Housing and Urban Development |
| Imp. | = | Improvement |
| Imps. | = | Improvements |
| Ind. | = | Industrial |
| Ln. | = | Loan |
| Lns. | = | Loans |
| Loc. | = | Local |
| Mgmt. | = | Management |
| Misc. | = | Miscellaneous |
| Muni. | = | Municipal |
| No. | = | Number |
| Prop. | = | Property |
| PSF | = | Permanent School Fund |
| Redev. | = | Redevelopment |
| Ref. | = | Refunding |
| Res. | = | Resource |
| Ress. | = | Resources |
| Rev. | = | Revenue |
| Trans. | = | Transportation |
| Univ. | = | University |
| Util. | = | Utility |
| Utils. | = | Utilities |
See Notes to Financial Statements
| 32 | Private Client Services Funds |
Capital Group California Core Municipal Fund
October 31, 2016
Growth of $25,000 investment
Here’s how a $25,000 investment in the Capital Group California Core Municipal Fund grew between April 13, 2010, when the fund began operations, and October 31, 2016, the end of the fund’s fiscal year.
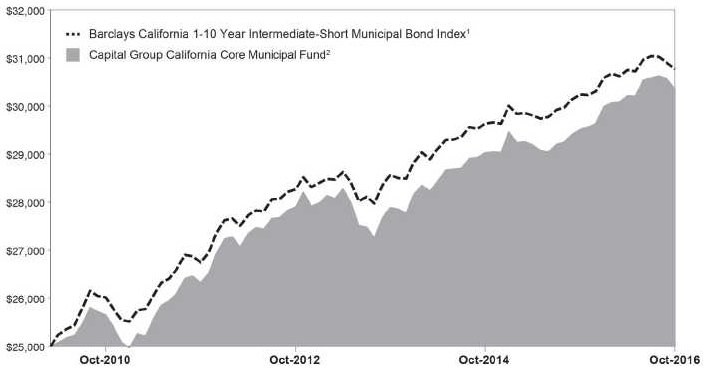
| 1 | The index is unmanaged, and its results include reinvested distributions but do not reflect the effect of charges, commissions, or expenses. |
| 2 | Includes reinvested dividends and capital gain distributions. |
Results are for past periods and are not predictive of results for future periods. Current and future results may be lower or higher than those shown. Share price and returns will vary so investors may lose money. The results shown are before taxes on fund distributions and sale of fund shares.
Investment portfolio – quality ratings*
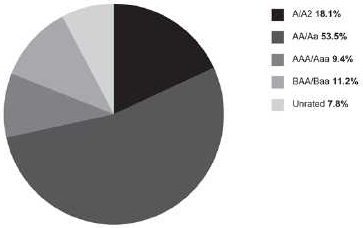
| * | Bond ratings, which typically range from Aaa/AAA (highest to D (lowest), are assigned by credit rating agencies such as Moody’s, Standard & Poors and/or Fitch as an indication of an Issuer’s credit-worthiness. If agency rating differ, securities are put in the highest category consistent with fund investment policies. When securities have not been rated by a rating agency (included in “unrated” at left), the investment advisor performs it’s own credit analysis and assigns comparable ratings that are used for compliance and fund investment policies. The ratings are not covered by the Report of Independent Registered Public Accounting Firm. |
| Private Client Services Funds | 33 |
Capital Group California Core Municipal Fund
Schedule of investments
October 31, 2016
| Bonds & notes - 93.7% | Principal amount (000) | Value (000) | ||||||
| California - 90.7% | ||||||||
| Abag Fin. Auth. for Nonprofit Corps., Health Care Facs. Rev. Ref. Bonds: | ||||||||
| 5.00%, 2020 | $ | 1,000 | $ | 1,116 | ||||
| 5.00%, 2020 | 715 | 805 | ||||||
| 5.00%, 2021 | 495 | 569 | ||||||
| 5.00%, 2022 | 1,000 | 1,171 | ||||||
| 5.00%, 2023 | 500 | 593 | ||||||
| Abag Fin. Auth. for Nonprofit Corps., Health Care Facs. Rev. Ref. Bonds (CA Mtg. Ins.): | ||||||||
| 5.125%, 2020 | 1,230 | 1,328 | ||||||
| 5.25%, 2020 | 765 | 823 | ||||||
| Abag Fin. Auth. for Nonprofit Corps., Health Care Facs. Rev. Ref. Bonds, Series A (CA Mtg. Ins.): | ||||||||
| 5.00%, 2019 | 400 | 438 | ||||||
| 5.00%, 2020 | 550 | 620 | ||||||
| Abag Fin. Auth. for Nonprofit Corps., Public Imps. Special Tax Ref. Bonds (CIFG Insured): | ||||||||
| 5.00%, 2021 | 600 | 620 | ||||||
| 5.00%, 2022 | 225 | 232 | ||||||
| Abag Fin. Auth. for Nonprofit Corps., Special Tax Ref. Bonds: | ||||||||
| 5.00%, 2023 | 375 | 454 | ||||||
| 5.00%, 2024 | 400 | 490 | ||||||
| 5.00%, 2025 | 515 | 625 | ||||||
| Alameda Corridor Trans. Auth., Port, Airport & Marina. Rev. Ref. Bonds, Series A: | ||||||||
| 5.00%, 2021 | 1,000 | 1,179 | ||||||
| 5.00%, 2022 | 975 | 1,175 | ||||||
| Alameda County Trans. Auth., Sales Tax Transit Imps. Rev. Bonds, 4.00%, 2019 | 875 | 939 | ||||||
| Aliso Viejo Comm. Fac. Dist., Special Tax Ref. Bonds: | ||||||||
| 5.00%, 2024 | 455 | 540 | ||||||
| 5.00%, 2025 | 425 | 502 | ||||||
| Anaheim Public Fncg. Auth., Energy Res. Auth. Rev. Ref. Bonds (NATL-RE Insured), 4.00%, 2017 | 575 | 583 | ||||||
| Anaheim Public Fncg. Auth., Lease Rev. Ref. Bonds, Series A, 5.00%, 2017 | 300 | 306 | ||||||
| Bay Area Toll Auth., Highway Tolls Rev. Bonds (Mandatory Put 04/01/24 @ 100), 1.73%, 20451 | 4,200 | 4,241 | ||||||
| Bay Area Toll Auth., Highway Tolls Rev. Bonds (Mandatory Put 05/01/23 @ 100), 1.53%, 20451 | 2,800 | 2,798 | ||||||
| Bay Area Toll Auth., Highway Tolls Rev. Bonds (Mandatory Put 08/01/17 @ 100), 1.45%, 20451 | 1,675 | 1,678 | ||||||
| Bay Area Toll Auth., Highway Tolls Rev. Bonds, Series B (Mandatory Put 04/02/18 @ 100), 1.50%, 20471 | 650 | 653 | ||||||
| Bay Area Toll Auth., Highway Tolls Rev. Ref. Bonds, Series G (Mandatory Put 04/01/20 @ 100), 1.23%, 20341 | 1,000 | 996 | ||||||
| Bay Area Water Supply & Conservation Agcy., Water Util. Imps. Rev. Bonds, Series A, 5.00%, 2023 | 500 | 612 | ||||||
| California Educ. Facs. Auth., College & Univ. Imps. Rev. Bonds: | ||||||||
| 5.00%, 2019 | 1,150 | 1,258 | ||||||
| 5.00%, 2021 | 550 | 622 | ||||||
| 5.00%, 2021 | 700 | 824 | ||||||
| 5.50%, 2029 | 300 | 336 | ||||||
| California Educ. Facs. Auth., College & Univ. Imps. Rev. Bonds, Series A, 5.00%, 2018 | 125 | 131 | ||||||
| California Educ. Facs. Auth., College & Univ. Rev. Ref. Bonds: | ||||||||
| 5.00%, 2020 | 165 | 190 | ||||||
| 5.00%, 2025 | 1,000 | 1,246 | ||||||
| California Educ. Facs. Auth., College & Univ. Rev. Ref. Bonds, Series A: | ||||||||
| 4.00%, 2021 | 560 | 630 | ||||||
| 4.00%, 2022 | 500 | 559 | ||||||
| 4.50%, 2017 | 335 | 347 | ||||||
| 5.00%, 2021 | 535 | 620 | ||||||
| 5.00%, 2024 | 100 | 109 | ||||||
| California Health Facs. Fncg. Auth., Health Care Facs. Imps. Rev. Bonds: | ||||||||
| 34 | Private Client Services Funds |
Capital Group California Core Municipal Fund
Schedule of investments
October 31, 2016
| Bonds & notes - continued | Principal amount (000) | Value (000) | ||||||
| California - continued | ||||||||
| 5.00%, 2018 | $ | 1,100 | $ | 1,180 | ||||
| 5.00%, 2025 | 400 | 494 | ||||||
| California Health Facs. Fncg. Auth., Health Care Facs. Imps. Rev. Bonds, Series A: | ||||||||
| 5.00%, 2018 | 275 | 296 | ||||||
| 5.00%, 2022 | 770 | 831 | ||||||
| 5.00%, 2024 | 150 | 176 | ||||||
| 5.00%, 2025 | 375 | 436 | ||||||
| 5.00%, 2026 | 300 | 377 | ||||||
| California Health Facs. Fncg. Auth., Health Care Facs. Imps. Rev. Bonds, Series D, 5.00%, 2020 | 1,325 | 1,521 | ||||||
| California Health Facs. Fncg. Auth., Health Care Facs. Imps. Rev. Bonds, Series G, 5.50%, 2025 | 100 | 107 | ||||||
| California Health Facs. Fncg. Auth., Health Care Facs. Rev. Ref. Bonds (CA Mtg. Ins.): | ||||||||
| 5.00%, 2020 | 1,005 | 1,131 | ||||||
| 5.00%, 2022 | 175 | 209 | ||||||
| 5.00%, 2023 | 135 | 163 | ||||||
| 5.00%, 2025 | 130 | 161 | ||||||
| California Health Facs. Fncg. Auth., Health Care Facs. Rev. Ref. Bonds, Series A: | ||||||||
| 5.00%, 2019 | 525 | 587 | ||||||
| 5.00%, 2020 | 675 | 760 | ||||||
| 5.00%, 2020 | 500 | 577 | ||||||
| 5.00%, 2021 | 350 | 416 | ||||||
| 5.00%, 2023 | 1,000 | 1,211 | ||||||
| California Health Facs. Fncg. Auth., Health Care Facs. Rev. Ref. Bonds, Series B, 4.00%, 2019 | 400 | 434 | ||||||
| California Health Facs. Fncg. Auth., Health Care Facs. Rev. Ref. Bonds, Series C (Mandatory Put 10/15/19 @ 100), 5.00%, 20431 | 1,750 | 1,943 | ||||||
| California Health Facs. Fncg. Auth., Health Care Facs. Rev. Ref. Bonds, Series D (Mandatory Put 10/15/20 @ 100), 5.00%, 20431 | 250 | 286 | ||||||
| California Infrastructure & Econ. Dev. Bank, Health Care Facs. Nursing Homes Rev. Ref. Bonds, 5.00%, 2029 | 740 | 919 | ||||||
| California Infrastructure & Econ. Dev. Bank, Misc. Rev. Ref. Bonds (Mandatory Put 04/01/18 @ 100), 0.91%, 20471 | 1,000 | 1,001 | ||||||
| California Infrastructure & Econ. Dev. Bank, Misc. Rev. Ref. Bonds, Series A-2 (Mandatory Put 04/03/17 @ 100), 0.91%, 20381 | 1,500 | 1,499 | ||||||
| California Infrastructure & Econ. Dev. Bank, Private Schools Rev. Ref. Bonds, Series B (Mandatory Put 06/01/22 @ 100), 1.83%, 20371 | 1,000 | 1,005 | ||||||
| California Infrastructure & Econ. Dev. Bank, Public Imps. Misc. Rev. Bonds: | ||||||||
| 4.50%, 2025 | 100 | 107 | ||||||
| 4.50%, 2026 | 100 | 107 | ||||||
| California Infrastructure & Econ. Dev. Bank, Rec. Facs. Imps. Rev. Bonds, 5.00%, 2018 | 100 | 105 | ||||||
| California Muni. Fin. Auth., Charter School AID Ref. Rev. Bonds, Series A, 4.00%, 2026 | 320 | 356 | ||||||
| California Muni. Fin. Auth., College & Univ. Imps. Rev. Bonds, 5.00%, 2022 | 470 | 547 | ||||||
| California Muni. Fin. Auth., College & Univ. Rev. Ref. Bonds, 5.625%, 2023 | 465 | 494 | ||||||
| California Muni. Fin. Auth., College & Univ. Rev. Ref. Bonds, Series B, 4.00%, 2017 | 150 | 154 | ||||||
| California Muni. Fin. Auth., Energy Res. Auth. Imps. Rev. Bonds (Mandatory Put 04/02/18 @ 100), 1.13%, 20451 | 1,425 | 1,419 | ||||||
| California Muni. Fin. Auth., Health Care Facs. Rev. Ref. Bonds, 5.00%, 2024 | 500 | 598 | ||||||
| California Muni. Fin. Auth., Misc. Rev. Ref. Bonds: | ||||||||
| 5.00%, 2022 | 885 | 1,056 | ||||||
| 5.00%, 2025 | 500 | 620 | ||||||
| California Muni., Fin., Auth., Loc. or GTD Housing Rev. Bonds, 5.00%, 2030 | 1,000 | 1,163 | ||||||
| California State Dept. of Veterans Affairs, Loc. or GTD Housing Rev. Ref. Bonds, Series A, 2.75%, 2020 | 750 | 797 | ||||||
| California State Dept. of Water Ress., Energy Res. Auth. Rev. Bonds, Sub-Series G-11: | ||||||||
| 4.875%, 2018 | 200 | 212 | ||||||
| Private Client Services Funds | 35 |
Capital Group California Core Municipal Fund
Schedule of investments
October 31, 2016
| Bonds & notes - continued | Principal amount (000) | Value (000) | ||||||
| California - continued | ||||||||
| 5.00%, 2018 | $ | 1,000 | $ | 1,063 | ||||
| California State Dept. of Water Ress., Energy Res. Auth. Rev. Ref. Bonds, 5.00%, 2021 | 100 | 106 | ||||||
| California State Dept. of Water Ress., Energy Res. Auth. Rev. Ref. Bonds, Series H (AGM Insured), 5.00%, 2017 | 100 | 102 | ||||||
| California State Dept. of Water Ress., Energy Res. Auth. Rev. Ref. Bonds, Series K, 5.00%, 2018 | 225 | 239 | ||||||
| California State Dept. of Water Ress., Energy Res. Auth. Rev. Ref. Bonds, Series L, 5.00%, 2021 | 75 | 85 | ||||||
| California State Dept. of Water Ress., Energy Res. Auth. Rev. Ref. Bonds, Series L (Pre-refunded with U.S. Treasury Obligations to 05/01/20 @ 100), 5.00%, 2021 | 125 | 142 | ||||||
| California State Dept. of Water Ress., Energy Res. Auth. Rev. Ref. Bonds, Series N, 5.00%, 2018 | 1,250 | 1,329 | ||||||
| California State Dept. of Water Ress., Water Rev. Ref. Bonds, 4.50%, 2016 | 510 | 512 | ||||||
| California State Dept. of Water Ress., Water Rev. Ref. Bonds (Escrowed to Maturity), 4.50%, 2016 | 15 | 15 | ||||||
| California State Dept. of Water Ress., Water Rev. Ref. Bonds, Series AE, 5.00%, 2022 | 70 | 75 | ||||||
| California State Dept. of Water Ress., Water Rev. Ref. Bonds, Series AE (Pre-refunded with U.S. Treasury Obligations to 06/01/18 @ 100), 5.00%, 2023 | 200 | 213 | ||||||
| California State Public Works Board, College & Univ. Imps. Lease Rev. Bonds, Series B-1, 5.00%, 2018 | 1,350 | 1,424 | ||||||
| California State Public Works Board, Correctional Fac. Imps. Lease Rev. Bonds, Series A, 5.00%, 2023 | 790 | 955 | ||||||
| California State Public Works Board, Lease Rev. Ref. Bonds, Series H, 5.00%, 2023 | 600 | 726 | ||||||
| California State Univ., College & Univ. Rev. Ref. Bonds, Series A: | ||||||||
| 5.00%, 2018 | 750 | 812 | ||||||
| 5.00%, 2023 | 250 | 311 | ||||||
| 5.00%, 2025 | 1,500 | 1,918 | ||||||
| California State Univ., College & Univ. Rev. Ref. Bonds, Series B-3 (Mandatory Put 11/01/23 @ 100), 4.00%, 20511 | 500 | 575 | ||||||
| California Statewide Comms. Dev. Auth., College & Univ. Imps. Rev. Bonds, 5.00%, 2019 | 1,000 | 1,092 | ||||||
| California Statewide Comms. Dev. Auth., Health Care Facs. Imps. Rev. Bonds, 4.625%, 2021 | 100 | 109 | ||||||
| California Statewide Comms. Dev. Auth., Health Care Facs. Imps. Rev. Bonds, Series A, 5.00%, 2019 | 600 | 658 | ||||||
| California Statewide Comms. Dev. Auth., Health Care Facs. Nursing Homes Rev. Bonds, 2.10%, 2019 | 2,000 | 2,001 | ||||||
| California Statewide Comms. Dev. Auth., Health Care Facs. Nursing Homes Rev. Bonds (CA Mtg. Ins.): | ||||||||
| 2.50%, 2020 | 700 | 701 | ||||||
| 3.00%, 2021 | 600 | 601 | ||||||
| 5.00%, 2025 | 300 | 377 | ||||||
| California Statewide Comms. Dev. Auth., Health Care Facs. Rev. Ref. Bonds: | ||||||||
| 5.00%, 2019 | 600 | 657 | ||||||
| 5.00%, 2019 | 1,000 | 1,116 | ||||||
| 5.00%, 2021 | 1,000 | 1,149 | ||||||
| 5.00%, 2023 | 1,100 | 1,306 | ||||||
| 5.00%, 2024 | 300 | 350 | ||||||
| 5.00%, 2025 | 750 | 937 | ||||||
| California Statewide Comms. Dev. Auth., Health Care Facs. Rev. Ref. Bonds, Series A (AGM Insured), 5.00%, 2023 | 500 | 600 | ||||||
| California Statewide Comms. Dev. Auth., Health Care Facs. Rev. Ref. Bonds, Series B: | ||||||||
| 5.00%, 2021 | 1,100 | 1,277 | ||||||
| 5.00%, 2026 | 650 | 824 | ||||||
| California Statewide Comms. Dev. Auth., Misc. Rev. Ref. Bonds (AGM Insured), 5.00%, 2020 | 210 | 242 | ||||||
| Capistrano Unified School Dist. School Facs. Imp. Dist. No. 1, G.O. School Imps. Prop. Tax Bonds, Series B (AGM Insured), 0.00%, 20252 | 1,000 | 782 | ||||||
| Carson Redev. Agcy. Successor Agcy., Tax Increment Allocation Ref. Bonds, 5.00%, 2021 | 1,625 | 1,901 | ||||||
| Cathedral City Redev. Agcy. Successor Agcy., Tax Allocation Rev. Ref. Bonds, 5.00%, 2023 | 745 | 903 | ||||||
| 36 | Private Client Services Funds |
Capital Group California Core Municipal Fund
Schedule of investments
October 31, 2016
| Bonds & notes - continued | Principal amount (000) | Value (000) | ||||||
| California - continued | ||||||||
| Cathedral City Redev. Agcy. Successor Agcy., Tax Allocation Rev. Ref. Bonds (AGM Insured), 5.00%, 2024 | $ | 260 | $ | 322 | ||||
| Center Unified School Dist., G.O. Prop. Tax Ref. Bonds (BAM Insured), 0.00%, 20262 | 350 | 275 | ||||||
| Cerritos Public Fncg. Auth., Tax Allocation Rev. Ref. Bonds, Series A (AMBAC Insured): | ||||||||
| 5.00%, 2019 | 2,000 | 2,120 | ||||||
| 5.00%, 2024 | 600 | 633 | ||||||
| Chino Redev. Agcy. Successor Agcy., Tax Increment Allocation Ref. Bonds, Series A (BAM Insured): | ||||||||
| 5.00%, 2020 | 500 | 572 | ||||||
| 5.00%, 2022 | 450 | 540 | ||||||
| 5.00%, 2025 | 665 | 815 | ||||||
| Chula Vista Muni. Fncg. Auth., Special Tax Ref. Bonds: | ||||||||
| 5.00%, 2021 | 485 | 558 | ||||||
| 5.00%, 2022 | 1,355 | 1,586 | ||||||
| City & County of San Francisco, G.O. Public Imps. Prop. Tax Bonds, 5.00%, 2020 | 1,350 | 1,545 | ||||||
| City of Alhambra, Health Care Facs. Nursing Homes Rev. Ref. Bonds (CA Mtg. Ins.), 5.00%, 2027 | 630 | 785 | ||||||
| City of Carlsbad California, Special Assessment Ref. Bonds: | ||||||||
| 3.00%, 2018 | 325 | 335 | ||||||
| 3.15%, 2021 | 570 | 607 | ||||||
| 3.55%, 2023 | 350 | 377 | ||||||
| City of Chula Vista, Energy Res. Auth. Rev. Ref. Bonds, Series A, 1.65%, 2018 | 1,150 | 1,151 | ||||||
| City of Fontana California, Special Tax Ref. Bonds, 5.00%, 2023 | 535 | 640 | ||||||
| City of Irvine California, Special Assessment Ref. Bonds: | ||||||||
| 2.50%, 2019 | 1,230 | 1,264 | ||||||
| 3.00%, 2020 | 1,250 | 1,322 | ||||||
| 3.25%, 2022 | 700 | 762 | ||||||
| 3.375%, 2023 | 850 | 922 | ||||||
| 4.00%, 2018 | 500 | 526 | ||||||
| 4.00%, 2022 | 400 | 453 | ||||||
| 5.00%, 2021 | 500 | 585 | ||||||
| 5.00%, 2028 | 500 | 586 | ||||||
| City of Irvine, Special Assessment Ref. Bonds, 5.00%, 2023 | 1,455 | 1,776 | ||||||
| City of Long Beach, Port, Airport & Marina Imps. Rev. Bonds: | ||||||||
| 5.00%, 2019 | 275 | 299 | ||||||
| 5.00%, 2020 | 400 | 445 | ||||||
| City of Long Beach, Port, Airport & Marina Imps. Rev. Bonds, Series A, 5.00%, 2021 | 100 | 114 | ||||||
| City of Long Beach, Port, Airport & Marina Rev. Ref. Bonds, Series B, 5.00%, 2024 | 500 | 624 | ||||||
| City of Long Beach, Port, Airport & Marina Rev. Ref. Bonds, Series C, 3.00%, 2018 | 2,250 | 2,348 | ||||||
| City of Sacramento California, Special Tax Ref. Bonds, 5.00%, 2028 | 1,235 | 1,465 | ||||||
| City of San Jose, Port, Airport & Marina Imps. Rev. Bonds, Series A-2, 5.00%, 2018 | 700 | 738 | ||||||
| Clovis Unified School Dist., G.O. School Imps. Prop. Tax Bonds, Series A (NATL-RE Insured), 0.00%, 20252 | 500 | 411 | ||||||
| Compton Comm. College Dist., G.O. Prop. Tax Ref. Bonds (BAM Insured), 5.00%, 2026 | 800 | 972 | ||||||
| Concord Redev. Agcy. Successor Agcy., Tax Increment Allocation Ref. Bonds (BAM Insured): | ||||||||
| 5.00%, 2020 | 500 | 562 | ||||||
| 5.00%, 2023 | 450 | 543 | ||||||
| Contra Costa County Public Fncg. Auth., Public Imps. Lease Rev. Bonds (NATL-RE Insured), 5.00%, 2021 | 180 | 184 | ||||||
| Contra Costa County Public Fncg. Auth., Public Imps. Lease Rev. Bonds (Pre-refunded with U.S. Treasury Obligations to 06/01/17 @ 100) (NATL-RE Insured), 5.00%, 2021 | 95 | 97 | ||||||
| County of El Dorado, Special Tax Rev. Ref. Bonds: | ||||||||
| 5.00%, 2022 | 1,295 | 1,551 | ||||||
| 5.00%, 2024 | 860 | 1,013 | ||||||
| Private Client Services Funds | 37 |
Capital Group California Core Municipal Fund
Schedule of investments
October 31, 2016
| Bonds & notes - continued | Principal amount (000) | Value (000) | ||||||
| California - continued | ||||||||
| County of San Diego, Health Care Facs. Rev. Ref. Bonds: | ||||||||
| 4.00%, 2023 | $ | 625 | $ | 723 | ||||
| 5.00%, 2022 | 200 | 241 | ||||||
| Eastern Municipal Water Dist., Water Rev. Ref. Bonds, Series A, 5.00%, 2023 | 500 | 614 | ||||||
| El Centro Fncg. Auth., Sewer Rev. Ref. Bonds, Series A (AGM Insured): | ||||||||
| 5.00%, 2026 | 530 | 646 | ||||||
| 5.00%, 2027 | 500 | 606 | ||||||
| 5.00%, 2030 | 1,000 | 1,188 | ||||||
| Elk Grove Fin. Auth., Special Tax Ref. Bonds, 5.00%, 2025 | 580 | 719 | ||||||
| Elk Grove Fin. Auth., Special Tax Ref. Bonds (BAM Insured), 5.00%, 2030 | 735 | 882 | ||||||
| Emeryville Redev. Agcy. Successor Agcy., Tax Increment Allocation Ref. Bonds, Series A (AGM Insured): | ||||||||
| 5.00%, 2022 | 1,700 | 2,044 | ||||||
| 5.00%, 2026 | 1,000 | 1,222 | ||||||
| Fillmore Redev. Agcy. Successr Agcy., Tax Increment Allocation Ref. Bonds (BAM Insured): | ||||||||
| 5.00%, 2024 | 1,000 | 1,235 | ||||||
| 5.00%, 2025 | 1,095 | 1,368 | ||||||
| Foothill-Eastern Trans. Corridor Agcy., Highway Tolls Rev. Ref. Bonds, Sub-Series B-1 (Mandatory Put 01/15/18 @ 100), 5.00%, 20531 | 2,100 | 2,152 | ||||||
| Garden Grove Agcy. Comm. Dev. Successor Agcy., Tax Increment Allocation Rev. Ref. Bonds (BAM Insured), 5.00%, 2022 | 400 | 481 | ||||||
| Glendale Redev. Agcy. Successor Agcy., Tax Increment Allocation Rev. Ref. Bonds (BAM Insured), 5.00%, 2024 | 410 | 508 | ||||||
| Golden State Tobacco Securitization Corp., Approp. Rev. Ref. Bonds, Series A (AGM Insured), 0.00%, 20262 | 1,500 | 1,218 | ||||||
| Golden State Tobacco Securitization Corp., Approp. Rev. Ref. Bonds, Series A (AMBAC Insured), 0.00%, 20242 | 2,000 | 1,702 | ||||||
| Golden State Tobacco Securitization Corp., Misc. Rev. Ref. Bonds, Series A: | ||||||||
| 5.00%, 2018 | 400 | 426 | ||||||
| 5.00%, 2020 | 1,200 | 1,358 | ||||||
| 5.00%, 2021 | 1,200 | 1,392 | ||||||
| Hawthorne Comm. Redev. Agcy. Successor Agcy., Tax Increment Allocation Rev. Ref. Bonds (AGM Insured), 5.00%, 2024 | 250 | 311 | ||||||
| Hemet Unified School Dist. Fncg. Auth., Misc. Purposes Special Tax Ref. Bonds: | ||||||||
| 5.00%, 2026 | 600 | 713 | ||||||
| 5.00%, 2028 | 720 | 841 | ||||||
| Hemet Unified School Dist., G.O. Prop. Tax Ref. Bonds (AGM Insured), 5.00%, 2029 | 500 | 595 | ||||||
| Imperial Irrigation Dist., Energy Res. Auth. Rev. Ref. Bonds, 5.00%, 2017 | 100 | 104 | ||||||
| Imperial Irrigation Dist., Energy Res. Auth. Rev. Ref. Bonds, Series A, 5.25%, 2025 | 20 | 22 | ||||||
| Imperial Irrigation Dist., Energy Res. Auth. Rev. Ref. Bonds, Series A (Pre-refunded with U.S. Treasury Obligations to 11/01/18 @ 100), 5.25%, 2025 | 80 | 87 | ||||||
| Imperial Irrigation Dist., Energy Res. Auth. Rev. Ref. Bonds, Series C, 5.00%, 2022 | 700 | 809 | ||||||
| Irvine Ranch Water Dist., Water Rev. Certs. of Part. Ref. Bonds, 5.00%, 2017 | 100 | 102 | ||||||
| Jurupa Public Fncg. Auth., Special Tax Ref. Bonds, Series A: | ||||||||
| 5.00%, 2023 | 500 | 605 | ||||||
| 5.00%, 2029 | 710 | 842 | ||||||
| Kings Canyon Unified School Dist., G.O. Prop. Tax Ref. Bonds (AGM Insured), 5.00%, 2029 | 1,600 | 1,942 | ||||||
| La Quinta Redev. Agcy. Successor Agcy., Tax Allocation Rev. Ref. Bonds: | ||||||||
| 4.00%, 2019 | 500 | 541 | ||||||
| 5.00%, 2019 | 200 | 222 | ||||||
| Lake Elsinore Public Fncg. Auth., Special Tax Ref. Bonds, 5.00%, 2028 | 2,000 | 2,355 | ||||||
| Lancaster Redev. Agcy. Successor Agcy., Tax Allocation Rev. Ref. Bonds (AGM Insured): | ||||||||
| 5.00%, 2024 | 590 | 722 | ||||||
| 38 | Private Client Services Funds |
Capital Group California Core Municipal Fund
Schedule of investments
October 31, 2016
| Bonds & notes - continued | Principal amount (000) | Value (000) | ||||||
| California - continued | ||||||||
| 5.00%, 2025 | $ | 770 | $ | 952 | ||||
| Lincoln Public Fncg. Auth., Public Imps. Special Tax Bonds, Series A (AMBAC Insured), 4.50%, 2021 | 840 | 860 | ||||||
| Long Beach Bond Fin. Auth., Misc. Rev. Ref. Bonds: | ||||||||
| 4.00%, 2020 | 750 | 833 | ||||||
| 5.00%, 2021 | 500 | 589 | ||||||
| Long Beach Comm., College Dist., G.O. Univ. & College Imps. Prop. Tax Bonds (Pre-refunded with U.S. Treasury Obligations to 06/01/18 @ 100), 5.00%, 2022 | 15 | 16 | ||||||
| Long Beach Comm., College Dist., G.O. Univ. & College Imps. Prop. Tax Bonds, Series A, 5.00%, 2022 | 85 | 91 | ||||||
| Los Angeles Comm. Facs. Dist., Special Tax Ref. Bonds: | ||||||||
| 5.00%, 2020 | 600 | 678 | ||||||
| 5.00%, 2023 | 700 | 841 | ||||||
| Los Angeles County Metropolitan Trans. Auth., Sales Tax Rev. Ref. Bonds, Series A, 5.00%, 2020 | 2,685 | 3,073 | ||||||
| Los Angeles County Redev. Auth., Tax Allocation Rev. Ref. Bonds (AGM Insured): | ||||||||
| 5.00%, 2022 | 1,190 | 1,428 | ||||||
| 5.00%, 2024 | 1,000 | 1,239 | ||||||
| Los Angeles County Redev. Auth., Tax Allocation Rev. Ref. Bonds, Series D, 5.00%, 2019 | 1,000 | 1,104 | ||||||
| Los Angeles County Redev. Auth., Tax Increment Allocation Rev. Ref. Bonds, 5.00%, 2020 | 3,000 | 3,447 | ||||||
| Los Angeles County, G.O. General Fund Public Imps. Bonds, 3.00%, 2017 | 3,000 | 3,046 | ||||||
| Los Angeles Dept. of Airports, Port, Airport & Marina Imps. Rev. Bonds, Series A, 5.00%, 2029 | 200 | 219 | ||||||
| Los Angeles Dept. of Airports, Port, Airport & Marina Imps. Rev. Bonds, Series D, 5.00%, 2019 | 850 | 940 | ||||||
| Los Angeles Dept. of Airports, Port, Airport & Marina Rev. Ref. Bonds, 5.00%, 2022 | 700 | 796 | ||||||
| Los Angeles Dept. of Water & Power, Water Util. Imps. Rev. Bonds, Series A, 5.00%, 2021 | 1,000 | 1,178 | ||||||
| Los Angeles Dept. of Water & Power, Water Util. Imps. Rev. Bonds, Series B, 5.00%, 2020 | 1,000 | 1,106 | ||||||
| Los Angeles Unified School Dist., G.O. Prop. Tax Ref. Bonds, Series C, 5.00%, 2019 | 2,175 | 2,409 | ||||||
| Los Angeles Unified School Dist., G.O. Prop. Tax Rev. Ref. Bonds, Series A-1, 5.00%, 2020 | 1,000 | 1,143 | ||||||
| Los Angeles Unified School Dist., G.O. School Imps. Prop. Tax Bonds, Series I, 5.00%, 2024 | 100 | 111 | ||||||
| Los Rios Comm. College Dist., G.O. Prop. Tax Ref. Bonds, 5.00%, 2020 | 900 | 1,031 | ||||||
| Manhattan Beach Unified School Dist., G.O. School Imps. Prop. Tax Bonds, Series C (NATL-RE Insured), 0.00%, 20242 | 1,500 | 1,255 | ||||||
| Menlo Park Comms. Dev. Agcy. Successor Agcy., Tax Allocation Rev. Ref. Bonds, (AGM Insured), 5.00%, 2028 | 1,070 | 1,309 | ||||||
| Merced Irrigation Dist., Energy Res. Auth. Rev. Ref. Bonds, Series A (AGM Insured): | ||||||||
| 5.00%, 2022 | 500 | 600 | ||||||
| 5.00%, 2028 | 250 | 303 | ||||||
| Metropolitan Water Dist. of Southern California, Water Rev. Ref. Bonds, Series B-1 (Mandatory Put 03/27/18 @ 100), 1.01%, 20271 | 500 | 500 | ||||||
| Modesto Irrigation Dist., Energy Res. Auth. Rev. Ref. Bonds, 5.00%, 2022 | 750 | 908 | ||||||
| Modesto Irrigation Dist., Energy Res. Auth. Rev. Ref. Bonds, Series A, 5.00%, 2017 | 400 | 412 | ||||||
| Monterey Peninsula Comm. College Dist., G.O. Prop. Tax Ref. Bonds:2 | ||||||||
| 0.00%, 2024 | 565 | 488 | ||||||
| 0.00%, 2028 | 625 | 452 | ||||||
| Moreno Valley Unified School Dist., G.O. School Imps. Prop. Tax Ref. Bonds (NATL-RE Insured), 5.25%, 2019 | 380 | 424 | ||||||
| Mountain View Shoreline Regional Park Comm., Tax Allocation Rev. Ref. Bonds, Series A: | ||||||||
| 5.00%, 2019 | 420 | 464 | ||||||
| 5.00%, 2020 | 375 | 426 | ||||||
| Murrieta Valley Unified School Dist. Fncg. Auth., Special Tax Ref. Bonds, Series A: | ||||||||
| 4.00%, 2020 | 125 | 136 | ||||||
| 5.00%, 2024 | 2,000 | 2,414 | ||||||
| Natomas Unified School Dist., G.O. Prop. Tax Ref. Bonds (BAM Insured), 5.00%, 2021 | 500 | 587 | ||||||
| North Natomas Comm. Facs. Dist. No. 4, Special Tax Ref. Bonds, Series E, 5.00%, 2021 | 1,050 | 1,209 | ||||||
| Private Client Services Funds | 39 |
Capital Group California Core Municipal Fund
Schedule of investments
October 31, 2016
| Bonds & notes - continued | Principal amount (000) | Value (000) | ||||||
| California – continued | ||||||||
| Northern California Power Agcy., Energy Res. Auth. Imps. Rev. Bonds, Series A, 5.50%, 2021 | $ | 1,000 | $ | 1,120 | ||||
| Northern California Power Agcy., Energy Res. Auth. Rev. Ref. Bonds, Series A: | ||||||||
| 5.00%, 2017 | 200 | 206 | ||||||
| 5.00%, 2019 | 200 | 221 | ||||||
| Oakland Redev. Successor Agcy., Tax Increment Allocation Ref. Bonds, 5.00%, 2018 | 500 | 536 | ||||||
| Oakland Unified School Dist., G.O. Prop. Tax Ref. Bonds, 5.00%, 2022 | 250 | 301 | ||||||
| Oakland Unified School Dist., G.O. School Imps. Prop. Tax Bonds, Series A: | ||||||||
| 5.00%, 2029 | 500 | 609 | ||||||
| 5.00%, 2030 | 500 | 605 | ||||||
| Ohlone Comm. College Dist., G.O. Ref. Bonds: | ||||||||
| 5.00%, 2023 | 550 | 663 | ||||||
| 5.00%, 2024 | 1,000 | 1,205 | ||||||
| Orange Comm. Facs. Dist., Special Tax Ref. Bonds: | ||||||||
| 4.00%, 2020 | 385 | 425 | ||||||
| 4.00%, 2021 | 1,485 | 1,672 | ||||||
| Orange Redev. Agcy. Successor Agcy., Tax Increment Allocation Ref. Bonds: | ||||||||
| 5.00%, 2020 | 770 | 875 | ||||||
| 5.00%, 2021 | 375 | 436 | ||||||
| Oxnard Fncg. Auth., Sewer Rev. Ref. Bonds (AGM Insured), 5.00%, 2021 | 750 | 874 | ||||||
| Palomar Health, G.O. Prop. Tax Ref. Bonds, Series A, 5.00%, 2025 | 1,200 | 1,501 | ||||||
| Palomar Health, G.O. Prop. Tax Ref. Bonds, Series B, 5.00%, 2029 | 500 | 609 | ||||||
| Palomar Health, G.O. Public Imps. Prop. Tax Bonds, Series A ( AGC Insured), 0.00%, 20282 | 1,000 | 691 | ||||||
| Perris Union High School Dist., Special Tax Ref. Bonds, 5.00%, 2024 | 1,000 | 1,203 | ||||||
| Poway Unified School Dist. Public Fncg. Auth., Special Tax Ref. Bonds: | ||||||||
| 3.375%, 2017 | 500 | 511 | ||||||
| 3.75%, 2018 | 770 | 801 | ||||||
| 4.00%, 2022 | 440 | 494 | ||||||
| 5.00%, 2020 | 595 | 670 | ||||||
| Poway Unified School Dist. Public Fncg. Auth., Special Tax Ref. Bonds, Series A, 5.00%, 2022 | 850 | 1,001 | ||||||
| Poway Unified School Dist. Public Fncg. Auth., Special Tax Ref. Bonds, Series B (BAM Insured), 5.00%, 2022 | 500 | 599 | ||||||
| Rancho Cordova Comm. Facs. Dist., Public Imps. Special Tax Bonds, 4.00%, 2025 | 1,000 | 1,128 | ||||||
| Rancho Cucamonga Redev. Agcy. Successor Agcy., Tax Allocation Rev. Ref. Bonds (AGM Insured): | ||||||||
| 5.00%, 2020 | 775 | 888 | ||||||
| 5.00%, 2025 | 750 | 922 | ||||||
| 5.00%, 2026 | 600 | 731 | ||||||
| 5.00%, 2028 | 800 | 960 | ||||||
| Regents of the Univ. of California Medical Center Pooled Rev., Health Care Facs. Rev. Ref. Bonds, Series L, 4.00%, 2025 | 1,815 | 2,153 | ||||||
| Rio Elementary School Dist. Comm. Facs. Dist., School Imps. Special Tax Ref. Bonds (BAM Insured): | ||||||||
| 5.00%, 2030 | 700 | 851 | ||||||
| 5.00%, 2032 | 240 | 287 | ||||||
| Rio Elementary School Dist. Comm. Facs. Dist., Special Tax Ref. Bonds, 5.00%, 2022 | 400 | 470 | ||||||
| Riverside Cnty. Public Fncg. Auth., Tax Increment Allocation Misc. Purposes Rev. Bonds, Series A (AGM Insured), 5.00%, 2023 | 1,075 | 1,317 | ||||||
| Riverside Cnty. Public Fncg. Auth., Tax Increment Allocation Ref. Bonds (BAM Insured), 5.00%, 2023 | 500 | 611 | ||||||
| Riverside Cnty. Redev. Successor Agcy., Tax Allocation Rev. Ref. Bonds: | ||||||||
| 5.00%, 2020 | 405 | 463 | ||||||
| 5.00%, 2021 | 1,040 | 1,217 | ||||||
| Riverside Redev. Agcy. Successor Agcy., Tax Allocation Rev. Ref. Bonds, Series A, 5.00%, 2021 | 1,000 | 1,177 | ||||||
| 40 | Private Client Services Funds |
Capital Group California Core Municipal Fund
Schedule of investments
October 31, 2016
| Bonds & notes - continued | Principal amount (000) | Value (000) | ||||||
| California - continued | ||||||||
| Riverside Unified School Dist. Fncg. Auth., Special Tax Ref. Bonds (BAM Insured): | ||||||||
| 5.00%, 2025 | $ | 350 | $ | 434 | ||||
| 5.00%, 2026 | 400 | 490 | ||||||
| Sacramento City Unified School Dist., G.O. Prop. Tax Ref. Bonds (AGM Insured), 5.00%, 2028 | 500 | 600 | ||||||
| Sacramento County Sanitation Dist. Fncg. Auth., Sewer Rev. Ref. Bonds, Series A, 5.00%, 2025 | 1,190 | 1,477 | ||||||
| Sacramento Muni. Util. Dist., Energy Res. Auth. Rev. Ref. Bonds, Series B, 5.00%, 2017 | 475 | 491 | ||||||
| Sacramento Redev. Agcy. Successor Agcy., Tax Allocation Rev. Ref. Bonds, Series A (BAM Insured): | ||||||||
| 5.00%, 2025 | 585 | 735 | ||||||
| 5.00%, 2028 | 250 | 305 | ||||||
| Sacramento Regional Transit Dist., Transit Rev. Ref. Bonds, 5.00%, 2023 | 615 | 695 | ||||||
| San Bernardino City Unified School Dist., G.O. Prop. Tax Ref. Bonds, Series A (AGM Insured), 5.00%, 2020 | 725 | 828 | ||||||
| San Diego Comm. College Dist., G.O. Prop. Tax Ref. Bonds, 5.00%, 2018 | 1,000 | 1,073 | ||||||
| San Diego County Regional Airport Auth., Port, Airport & Marina Imps. Rev. Bonds, Series A, 5.00%, 2023 | 225 | 274 | ||||||
| San Diego County Regional Airport Auth., Port, Airport & Marina Imps. Rev. Bonds, Sub-Series A: | ||||||||
| 5.00%, 2018 | 850 | 907 | ||||||
| 5.00%, 2020 | 700 | 794 | ||||||
| San Diego County Regional Trans. Commission, Sales Tax Rev. Ref. Bonds, Series A, 5.00%, 2021 | 500 | 587 | ||||||
| San Diego County Water Auth., Water Rev. Certs. of Part. Ref. Bonds, Series A (NATL-RE FGIC Insured), 5.25%, 2018 | 700 | 746 | ||||||
| San Diego Public Facs. Fncg. Auth., Sewer Rev. Ref. Bonds, Series B, 5.00%, 2022 | 100 | 110 | ||||||
| San Diego Public Facs. Fncg. Auth., Water Rev. Ref. Bonds, Series A, 4.00%, 2020 | 100 | 105 | ||||||
| San Diego Redev. Agcy. Successor Agcy., Tax Increment Allocation Rev. Ref. Bonds, Series A: | ||||||||
| 5.00%, 2024 | 500 | 623 | ||||||
| 5.00%, 2025 | 500 | 631 | ||||||
| San Francisco Bay Area Rapid Transit Dist., Sales Tax Rev. Ref. Bonds, 5.00%, 2022 | 800 | 911 | ||||||
| San Francisco City & County Airports Commission, Port, Airport & Marina Imps. Rev. Bonds, Series E, 5.25%, 2024 | 100 | 110 | ||||||
| San Francisco City & County Airports Commission, Port, Airport & Marina Imps. Rev. Ref. Bonds, Series A, 5.00%, 2027 | 1,000 | 1,263 | ||||||
| San Francisco City & County Airports Commission, Port, Airport & Marina Rev. Ref. Bonds, Series B, 5.00%, 2019 | 400 | 440 | ||||||
| San Francisco City & County Airports Commission, Port, Airport & Marina Rev. Ref. Bonds, Series C2, 5.00%, 2021 | 300 | 330 | ||||||
| San Francisco City & County Redev. Agcy., Tax Allocation Rev. Series C: | ||||||||
| 4.75%, 2017 | 265 | 273 | ||||||
| 5.00%, 2018 | 275 | 295 | ||||||
| 5.25%, 2019 | 290 | 324 | ||||||
| San Francisco City & County Redev. Agcy., Tax Increment Allocation Rev. Ref. Bonds, Series C, 5.00%, 2022 | 305 | 365 | ||||||
| San Francisco City & County Redev. Successor Agcy., Public Imps. Special Tax Bonds, 3.25%, 2021 | 500 | 535 | ||||||
| San Francisco City & County Redev. Successor Agcy., Special Tax Ref. Bonds, 5.00%, 2020 | 800 | 901 | ||||||
| San Francisco Unified School Dist., G.O. School Imps. Prop. Tax Bonds, Series A, 5.00%, 2019 | 1,150 | 1,272 | ||||||
| San Jose Redev. Agcy., Tax Allocation Rev. Ref. Bonds, 5.00%, 2022 | 500 | 560 | ||||||
| San Jose Redev. Agcy., Tax Allocation Rev. Ref. Bonds (NATL-RE Insured), 4.54%, 2018 | 400 | 401 | ||||||
| San Jose Redev. Agcy., Tax Allocation Rev. Ref. Bonds, Series D (AMBAC Insured), 5.00%, 2018 | 800 | 824 | ||||||
| San Marcos Redev. Agcy. Successor Agcy., Tax Allocation Rev. Ref. Bonds, Series A, 5.00%, 2029 | 1,000 | 1,221 | ||||||
| San Mateo Joint Powers Fncg. Auth., Lease Rev. Ref. Bonds: | ||||||||
| Private Client Services Funds | 41 |
Capital Group California Core Municipal Fund
Schedule of investments
October 31, 2016
| Bonds & notes - continued | Principal amount (000) | Value (000) | ||||||
| California - continued | ||||||||
| 4.00%, 2022 | $ | 650 | $ | 746 | ||||
| 5.00%, 2020 | 500 | 571 | ||||||
| 5.00%, 2022 | 500 | 601 | ||||||
| San Mateo Joint Powers Fncg. Auth., Lease Rev. Ref. Bonds, Series A, 5.25%, 2023 | 200 | 223 | ||||||
| Santa Ana Community Redev. Agcy., Tax Allocation Rev. Ref. Bonds, 6.00%, 2020 | 750 | 882 | ||||||
| Santa Clara County Fncg. Auth., Lease Rev. Ref. Bonds, 5.00%, 2022 | 285 | 308 | ||||||
| Santa Cruz County Redev. Agcy., Special Assessment Ref. Bonds, Series A, 5.00%, 2025 | 200 | 250 | ||||||
| Santa Cruz County Redev. Agcy., Special Assessment Ref. Bonds, Series A (AGM Insured), 5.00%, 2026 | 1,475 | 1,832 | ||||||
| Santa Margarita Water Dist., Special Tax Ref. Bonds: | ||||||||
| 5.00%, 2022 | 310 | 365 | ||||||
| 5.00%, 2024 | 530 | 640 | ||||||
| 5.00%, 2025 | 375 | 447 | ||||||
| Santaluz Community Facs. Dist. No 2, Special Tax Ref. Bonds, Series A, 5.00%, 2020 | 995 | 1,120 | ||||||
| Saugus/Hart School Facs. Fncg. Auth., Special Tax Ref. Bonds: | ||||||||
| 4.00%, 2028 | 590 | 646 | ||||||
| 5.00%, 2025 | 1,110 | 1,348 | ||||||
| 5.00%, 2027 | 460 | 553 | ||||||
| Seal Beach Community Facs. Dist. No 2005-1, Special Tax Ref. Bonds: | ||||||||
| 3.00%, 2023 | 150 | 157 | ||||||
| 3.00%, 2024 | 145 | 151 | ||||||
| 3.00%, 2025 | 365 | 377 | ||||||
| 3.00%, 2026 | 150 | 153 | ||||||
| Signal Hill Redev. Agcy. Successor Agcy., Tax Increment Allocation Ref. Bonds, Series A (BAM Insured): | ||||||||
| 5.00%, 2021 | 250 | 294 | ||||||
| 5.00%, 2023 | 500 | 612 | ||||||
| Sonoma-Marin Area Rail Transit Dist., Rev. Bonds, Series A, 5.00%, 2021 | 1,000 | 1,165 | ||||||
| South Orange County Public Fncg. Auth., Special Tax Ref. Bonds, Series A (AMBAC Insured), 5.00%, 2020 | 1,000 | 1,003 | ||||||
| South Placer Wastewater Auth., Sewer Rev. Ref. Bonds, 0.96%, 20171 | 1,725 | 1,720 | ||||||
| Southern California Public Power Auth., Energy Res. Auth. Imps. Rev. Bonds: | ||||||||
| 5.00%, 2018 | 200 | 214 | ||||||
| 5.00%, 2020 | 1,550 | 1,772 | ||||||
| 5.00%, 2023 | 800 | 913 | ||||||
| Southern California Public Power Auth., Energy Res. Auth. Imps. Rev. Bonds, Series A, 4.00%, 2021 | 500 | 550 | ||||||
| Southern California Public Power Auth., Energy Res. Auth. Rev. Ref. Bonds: | ||||||||
| 5.00%, 2018 | 350 | 374 | ||||||
| 5.00%, 2021 | 750 | 883 | ||||||
| Southern California Public Power Auth., Energy Res. Auth. Rev. Ref. Bonds, Series A: | ||||||||
| 5.00%, 2019 | 1,000 | 1,108 | ||||||
| 5.00%, 2020 | 245 | 280 | ||||||
| Southern California Public Power Auth., Misc. Rev. Ref. Bonds, 5.00%, 2023 | 100 | 108 | ||||||
| State of California Dept. of Veterans Affairs, Loc. or GTD Housing Rev. Ref. Bonds, Series B, 3.50%, 2045 | 925 | 992 | ||||||
| State of California Dept. of Water Res., Rev. Ref. Bonds, Series AU (Mandatory Put 09/01/17 @ 100), 1.25%, 20351 | 1,475 | 1,476 | ||||||
| State of California, G.O. Correctional Facs. Imps. Prop. Tax Bonds, 5.25%, 2020 | 100 | 112 | ||||||
| State of California, G.O. General Fund Ref. Bonds: | ||||||||
| 5.00%, 2017 | 1,500 | 1,517 | ||||||
| 5.00%, 2017 | 2,165 | 2,197 | ||||||
| 5.00%, 2019 | 2,000 | 2,183 | ||||||
| 42 | Private Client Services Funds |
Capital Group California Core Municipal Fund
Schedule of investments
October 31, 2016
| Bonds & notes - continued | Principal amount (000) | Value (000) | ||||||
| California - continued | ||||||||
| 5.00%, 2019 | $ | 600 | $ | 659 | ||||
| 5.00%, 2020 | 2,700 | 3,044 | ||||||
| 5.00%, 2020 | 1,000 | 1,150 | ||||||
| 5.00%, 2024 | 800 | 983 | ||||||
| 5.25%, 2020 | 650 | 731 | ||||||
| State of California, G.O. Misc. Rev. Ref. Bonds, 1.35%, 2019 | 1,125 | 1,136 | ||||||
| State of California, G.O. Misc. Rev. Ref. Bonds, Series A (Mandatory Put 05/01/18 @ 100), 1.08%, 20331 | 2,900 | 2,892 | ||||||
| State of California, G.O. Public Imps. General Fund Bonds, 5.50%, 2018 | 100 | 107 | ||||||
| State of California, G.O. Public Imps. Misc. Tax Bonds (NATL-RE Insured), 6.00%, 2020 | 5 | 5 | ||||||
| State of California, G.O. Public Imps. Prop. Tax Bonds, Series CN, 3.50%, 2045 | 1,000 | 1,073 | ||||||
| State of California, G.O. Sales Tax Rev. Ref. Bonds, Series A (Pre-refunded with U.S. Treasury Obligations 07/01/19 @ 100), 5.25%, 2021 | 1,060 | 1,181 | ||||||
| Stockton Public Fncg. Auth., Sewer Rev. Ref. Bonds (BAM Insured), 5.00%, 2021 | 750 | 880 | ||||||
| Successor Agcy. to the Richmond County Redev. Agcy., Tax Allocation Rev. Ref. Bonds, Series A (BAM Insured), 5.00%, 2025 | 200 | 245 | ||||||
| Suisun City Redev. Agcy., Tax Increment Allocation Rev. Ref. Bonds, Series B (BAM Insured), 5.00%, 2022 | 400 | 481 | ||||||
| Temecula Valley Unified School Dist. Fncg. Auth., Special Tax Ref. Bonds (BAM Insured), 5.00%, 2027 | 1,720 | 2,091 | ||||||
| Tracy Comm. Dev. Agcy. Successor Agcy., Tax Allocation Rev. Ref. Bonds (AGM Insured): | ||||||||
| 5.00%, 2029 | 555 | 669 | ||||||
| 5.00%, 2030 | 545 | 652 | ||||||
| Tuolumne Wind Project Auth., Energy Res. Auth. Imps. Rev. Bonds, Series A: | ||||||||
| 5.00%, 2022 | 1,500 | 1,631 | ||||||
| 5.25%, 2024 | 100 | 109 | ||||||
| Turlock Irrigation Dist., Energy Res. Auth. Rev. Ref. Bonds: | ||||||||
| 5.00%, 2018 | 500 | 525 | ||||||
| 5.00%, 2020 | 610 | 686 | ||||||
| 5.00%, 2022 | 700 | 810 | ||||||
| Tustin Comm. Facs. Dist., Special Tax Ref. Bonds, 5.00%, 2025 | 500 | 611 | ||||||
| Tustin Unified School Dist., Special Tax Ref. Bonds (BAM Insured), 5.00%, 2022 | 830 | 994 | ||||||
| Ukiah Unified School Dist., G.O. School Imps. Prop. Tax Bonds (NATL-RE Insured), 0.00%, 20232 | 1,830 | 1,611 | ||||||
| Union City Comm. Redev. Agcy., Tax Increment Allocation Rev. Ref. Bonds, Series A: | ||||||||
| 5.00%, 2023 | 375 | 462 | ||||||
| 5.00%, 2025 | 335 | 423 | ||||||
| Univ. of California, College & Univ. Rev. Ref. Bonds, Series E, 5.00%, 2020 | 500 | 570 | ||||||
| Val Verde Unified School Dist., G.O. Prop. Tax Ref. Bonds, Series A (AGM Insured): | ||||||||
| 4.00%, 2021 | 250 | 281 | ||||||
| 4.00%, 2023 | 600 | 692 | ||||||
| Victor Valley Union High School Dist., G.O. Prop. Tax Ref. Bonds, Series B (AGM Insured): | ||||||||
| 4.00%, 2024 | 575 | 670 | ||||||
| 4.00%, 2026 | 270 | 318 | ||||||
| Vista Redev. Agcy. Successor Agcy., Tax Increment Allocation Rev. Ref. Bonds, Series B1 (AGM Insured): | ||||||||
| 4.00%, 2025 | 400 | 469 | ||||||
| 5.00%, 2022 | 340 | 407 | ||||||
| Western Riverside County Regional Wastewater Auth., Water Rev. Ref. Bonds, Series A: | ||||||||
| 5.00%, 2030 | 600 | 720 | ||||||
| 5.00%, 2032 | 1,200 | 1,424 | ||||||
| 304,744 | ||||||||
| Private Client Services Funds | 43 |
Capital Group California Core Municipal Fund
Schedule of investments
October 31, 2016
| Bonds & notes - continued | Principal amount (000) | Value (000) | ||||||
| District of Columbia - 0.0% | ||||||||
| Metropolitan Washington Airports Auth., Port, Airport & Marina Rev. Ref. Bonds, Series C, 5.00%, 2017 | $ | 100 | $ | 104 | ||||
| 104 | ||||||||
| Guam - 0.8% | ||||||||
| Guam Intl. Airport Auth., Port, Airport & Marina Rev. Ref. Bonds, Series A: | ||||||||
| 5.00%, 2021 | 350 | 401 | ||||||
| 5.00%, 2022 | 710 | 828 | ||||||
| Guam Intl. Airport Auth., Port, Airport & Marina Rev. Ref. Bonds, Series B, 5.00%, 2023 | 1,100 | 1,297 | ||||||
| 2,526 | ||||||||
| Iowa - 0.0% | ||||||||
| State of Iowa, General Fund Public Imps. Rev. Bonds, Series A, 5.00%, 2027 | 100 | 110 | ||||||
| 110 | ||||||||
| Michigan - 0.0% | ||||||||
| Michigan State Hospital Fin. Auth., Health Care Facs. Rev. Ref. Bonds, 5.25%, 2024 | 100 | 113 | ||||||
| 113 | ||||||||
| Missouri - 0.1% | ||||||||
| Missouri Housing Dev. Commission, Loc. or GTD Housing Rev. Bonds (GNMA/FNMA Insured), 3.75%, 2038 | 320 | 341 | ||||||
| 341 | ||||||||
| Oregon - 0.3% | ||||||||
| Oregon State Facs. Auth., Health Care Facs. Rev. Ref. Bonds (Mandatory Put 09/15/18 @ 100), 1.63%, 20221 | 1,000 | 1,000 | ||||||
| 1,000 | ||||||||
| Puerto Rico - 1.0% | ||||||||
| Puerto Rico Highways & Trans. Auth., Sales Tax Rev. Ref. Bonds, Series AA-1 (AGM Insured), 4.95%, 2026 | 1,405 | 1,466 | ||||||
| Puerto Rico Ind. Tourist Educ. Medical & Environmental Control Facs. Fncg. Auth., College & Univ. Rev. Ref. Bonds: | ||||||||
| 5.00%, 2017 | 500 | 505 | ||||||
| 5.00%, 2019 | 500 | 512 | ||||||
| 5.00%, 2021 | 1,000 | 1,037 | ||||||
| 3,520 | ||||||||
| Texas - 0.3% | ||||||||
| City of Houston, Util. System, Water Rev. Ref. Bonds (Mandatory Put 06/01/17 @ 100), 1.38%, 20341 | 1,100 | 1,100 | ||||||
| 1,100 | ||||||||
| 44 | Private Client Services Funds |
Capital Group California Core Municipal Fund
Schedule of investments
October 31, 2016
| Bonds & notes - continued | Principal amount (000) | Value (000) | ||||||
| U. S. Virgin Islands - 0.5% | ||||||||
| Virgin Islands Public Fin. Auth., Misc. Rev. Ref. Bonds, Series B (AGM Insured), 5.00%, 2019 | $ | 1,400 | $ | 1,512 | ||||
| 1,512 | ||||||||
| Total bonds & notes (cost: $304,431,000) | 315,070 | |||||||
| Short-term securities - 4.9% | ||||||||
| California Educ. Facs. Auth. Rev., 0.89%, January 05, 20171 | 3,000 | 3,000 | ||||||
| California Statewide Comms. Dev. Auth., Res. Recovery Rev. Ref. Bonds, 0.45%, May 15, 20241 | 2,000 | 2,000 | ||||||
| Los Angeles Dept. of Water & Power Rev. Bonds, 0.90%, January 09, 20171 | 1,000 | 1,000 | ||||||
| Los Angeles Dept. of Water & Power, Energy Res. Auth. Rev. Ref. Bonds, Sub-Series A-2, 0.45%, July 01, 20351 | 1,000 | 1,000 | ||||||
| Manteca Redev. Agcy., Tax Allocation Rev. Ref. Bonds, 0.50%, October 01, 20421 | 2,420 | 2,420 | ||||||
| Metropolitan Water Dist. of Southern California, Water Rev. Ref. Bonds, Series B-2, 0.50%, July 01, 20371 | 1,000 | 1,000 | ||||||
| State of California G.O., 0.84%, January 11, 20171 | 3,000 | 3,000 | ||||||
| Univ. of California, College & Univ. Rev. Ref. Bonds, Series AL-2, 0.62%, May 15, 20481 | 3,000 | 3,000 | ||||||
| Total short-term securities (cost: $16,420,000) | 16,420 | |||||||
| Total investment securities (cost: $320,851,000) | 331,490 | |||||||
| Other assets less liabilities | 4,679 | |||||||
| Net assets | $ | 336,169 | ||||||
| 1 | Coupon rate may change periodically. For short-term securities, the date of the next scheduled coupon rate change is considered to be the maturity date. |
| 2 | Zero coupon bond; interest rate represents current yield to maturity. |
| Private Client Services Funds | 45 |
Capital Group California Core Municipal Fund
Schedule of investments
October 31, 2016
Key to abbreviations
| Agcy. | = | Agency |
| AGM | = | Assured Guaranty Municipal Corporation |
| AMBAC | = | American Municipal Bond Assurance Corporation |
| Approp. | = | Appropriation |
| Auth. | = | Authority |
| BAM | = | Build America Mutual Assurance Company |
| CA Mtg. Ins. | = | California Mortgage Insurance |
| Certs. of Part. | = | Certificates of Participation |
| CIFG | = | CDC IXIS Financial Guaranty |
| Comm. | = | Community |
| Comms. | = | Communities |
| Corp. | = | Corporation |
| Corps. | = | Corporations |
| Dept. | = | Department |
| Dev. | = | Development |
| Dist. | = | District |
| Econ. | = | Economic |
| Educ. | = | Educational |
| Fac. | = | Facility |
| Facs. | = | Facilities |
| FGIC | = | Financial Guaranty Insurance Company |
| Fin. | = | Finance |
| Fncg. | = | Financing |
| FNMA | = | Federal National Mortgage Association |
| GNMA | = | Government National Mortgage Association |
| G.O. | = | General Obligation |
| GTD | = | Guaranteed |
| Imps. | = | Improvements |
| Ind. | = | Industrial |
| Intl. | = | International |
| Loc. | = | Local |
| Misc. | = | Miscellaneous |
| Muni. | = | Municipal |
| NATL-RE | = | National Reinsurance |
| Prop. | = | Property |
| Rec. | = | Recreational |
| Redev. | = | Redevelopment |
| Ref. | = | Refunding |
| Res. | = | Resource |
| Ress. | = | Resources |
| Rev. | = | Revenue |
| Trans. | = | Transportation |
| Univ. | = | University |
| Util. | = | Utility |
See Notes to Financial Statements
| 46 | Private Client Services Funds |
Capital Group California Short-Term Municipal Fund
October 31, 2016
Growth of $25,000 investment
Here’s how a $25,000 investment in the Capital Group California Short-Term Municipal Fund grew between April 13, 2010, when the fund began operations, and October 31, 2016, the end of the fund’s fiscal year.
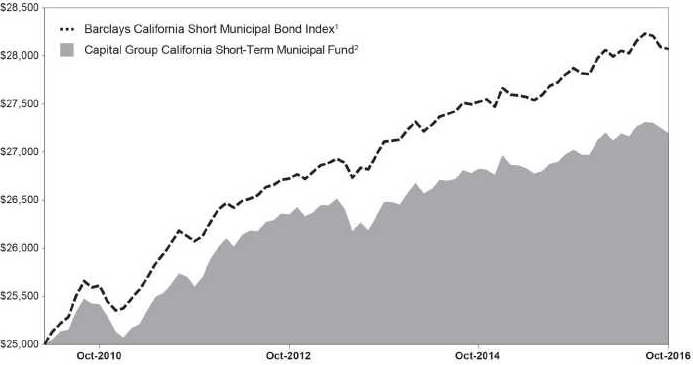
| 1 | The index is unmanaged, and its results include reinvested distributions but do not reflect the effect of sales charges, commissions, or expenses. |
| 2 | Includes reinvested dividends and capital gain distributions. |
Results are for past periods and are not predictive of results for future periods. Current and future results may be lower or higher than those shown. Share price and returns will vary so investors may lose money. The results shown are before taxes on fund distributions and sale of fund shares.
Investment portfolio – quality ratings*
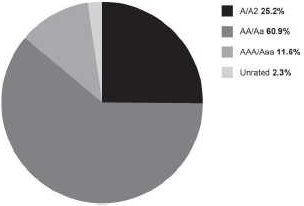
| * | Bond ratings, which typically range from Aaa/AAA (highest to D (lowest), are assigned by credit rating agencies such as Moody’s, Standard & Poors and/or Fitch as an indication of an Issuer’s credit-worthiness. If agency rating differ, securities are put in the highest category consistent with fund investment policies. When securities have not been rated by a rating agency (included in “unrated” at left), the investment advisor performs it’s own credit analysis and assigns comparable ratings that are used for compliance and fund investment policies. The ratings are not covered by the Report of Independent Registered Public Accounting Firm. |
| Private Client Services Funds | 47 |
Capital Group California Short-Term Municipal Fund
Schedule of investments
October 31, 2016
| Bonds & notes - 94.6% | Principal amount (000) | Value (000) | ||||||
| California - 91.8% | ||||||||
| Abag Fin. Auth. for Nonprofit Corps., Health Care Facs. Rev. Ref. Bonds, Series A (CA Mtg. Ins.), 5.00%, 2018 | $ | 250 | $ | 265 | ||||
| Abag Fin. Auth. for Nonprofit Corps., Special Tax Ref. Bonds, 4.00%, 2019 | 525 | 567 | ||||||
| Alameda County Trans. Auth., Transit Imps. Rev. Bonds, 4.00%, 2018 | 500 | 522 | ||||||
| Anaheim Public Fncg. Auth., Recreational Fac. Imps. Lease Rev. Bonds (AGM Insured), 0.00%, 20221 | 1,000 | 893 | ||||||
| Bay Area Toll Auth., Highway Tolls Rev. Bonds (Mandatory Put 05/01/23 @ 100):2 | ||||||||
| 1.53%, 2045 | 500 | 500 | ||||||
| 1.53%, 2047 | 250 | 250 | ||||||
| Bay Area Toll Auth., Highway Tolls Rev. Bonds (Mandatory Put 08/01/17 @ 100), 1.45%, 20452 | 750 | 751 | ||||||
| Bay Area Toll Auth., Highway Tolls Rev. Bonds (Mandatory Put 10/01/19 @ 100), 1.33%, 20472 | 800 | 800 | ||||||
| Bay Area Toll Auth., Highway Tolls Rev. Bonds, Series B (Mandatory Put 04/02/18 @ 100), 1.50%, 20472 | 600 | 603 | ||||||
| Bay Area Toll Auth., Highway Tolls Rev. Ref. Bonds: | ||||||||
| 4.00%, 2018 | 250 | 261 | ||||||
| 5.00%, 2017 | 400 | 407 | ||||||
| Bay Area Toll Auth., Highway Tolls Rev. Ref. Bonds, Series C (Mandatory Put 04/01/19 @ 100), 1.875%, 20472 | 500 | 507 | ||||||
| Bay Area Toll Auth., Highway Tolls Rev. Ref. Bonds, Series G (Mandatory Put 04/01/20 @ 100), 1.23%, 20342 | 250 | 249 | ||||||
| Bay Area Toll Auth., Highway Tolls Rev. Ref. Bonds, Series H (Mandatory Put 04/01/21 @ 100), 1.33%, 20342 | 250 | 249 | ||||||
| Brea Redev. Agcy., Tax Increment Allocation Rev. Ref. Bonds, 5.00%, 2019 | 700 | 775 | ||||||
| Burbank Redev. Agcy. Successor Agcy., Tax Increment Allocation Rev. Ref. Bonds (BAM Insured): | ||||||||
| 4.00%, 2018 | 500 | 531 | ||||||
| 5.00%, 2020 | 750 | 864 | ||||||
| 5.00%, 2022 | 500 | 604 | ||||||
| California Educ. Fac. Auth., College & Univ. Rev. Ref. Bonds, 4.00%, 2017 | 200 | 203 | ||||||
| California Educ. Facs. Auth., College & Univ. Imps. Rev. Ref. Bonds, 4.00%, 2017 | 100 | 101 | ||||||
| California Educ. Facs. Auth., College & Univ. Imps. Rev. Ref. Bonds, Series A, 3.00%, 2016 | 400 | 400 | ||||||
| California Educ. Facs. Auth., College & Univ. Rev. Ref. Bonds, 4.00%, 2018 | 400 | 421 | ||||||
| California Health Facs. Fncg. Auth., Health Care Facs. Imps. Rev. Bonds: | ||||||||
| 5.00%, 2017 | 510 | 527 | ||||||
| 5.00%, 2018 | 500 | 537 | ||||||
| California Health Facs. Fncg. Auth., Health Care Facs. Imps. Rev. Bonds, Series A, 5.00%, 2022 | 200 | 244 | ||||||
| California Health Facs. Fncg. Auth., Health Care Facs. Rev. Ref. Bonds: | ||||||||
| 4.00%, 2022 | 330 | 374 | ||||||
| 5.00%, 2022 | 300 | 366 | ||||||
| California Health Facs. Fncg. Auth., Health Care Facs. Rev. Ref. Bonds (CA Mtg. Ins.): | ||||||||
| 4.00%, 2018 | 425 | 441 | ||||||
| 5.00%, 2019 | 500 | 544 | ||||||
| 5.00%, 2019 | 200 | 223 | ||||||
| 5.00%, 2020 | 150 | 170 | ||||||
| California Health Facs. Fncg. Auth., Health Care Facs. Rev. Ref. Bonds (Mandatory Put 10/18/22 @ 100), 1.70%, 20332 | 510 | 510 | ||||||
| California Health Facs. Fncg. Auth., Health Care Facs. Rev. Ref. Bonds, Series A: | ||||||||
| 4.00%, 2018 | 200 | 208 | ||||||
| 4.00%, 2019 | 500 | 534 | ||||||
| 4.00%, 2020 | 625 | 678 | ||||||
| 5.00%, 2018 | 500 | 540 | ||||||
| 5.00%, 2019 | 525 | 587 | ||||||
| 5.00%, 2019 | 300 | 336 | ||||||
| 48 | Private Client Services Funds |
Capital Group California Short-Term Municipal Fund
Schedule of investments
October 31, 2016
| Bonds & notes - continued | Principal amount (000) | Value (000) | ||||||
| California - continued | ||||||||
| California Health Facs. Fncg. Auth., Health Care Facs. Rev. Ref. Bonds, Series B (Mandatory Put 10/17/17 @ 100), 5.00%, 20432 | $ | 500 | $ | 520 | ||||
| California Health Facs. Fncg. Auth., Health Care Facs. Rev. Ref. Bonds, Series D (Mandatory Put 10/15/20 @ 100), 5.00%, 20432 | 500 | 572 | ||||||
| California Infrastructure & Econ. Dev. Bank, Health Care Facs. Rev. Ref. Bonds: | ||||||||
| 5.00%, 2021 | 235 | 275 | ||||||
| 5.00%, 2022 | 265 | 318 | ||||||
| California Infrastructure & Econ. Dev. Bank, Misc. Rev. Ref. Bonds (Mandatory Put 04/01/18 @ 100), 0.91%, 20472 | 500 | 501 | ||||||
| California Infrastructure & Econ. Dev. Bank, Misc. Rev. Ref. Bonds, Series A-2 (Mandatory Put 04/03/17 @ 100), 0.91%, 20382 | 1,750 | 1,748 | ||||||
| California State Dept. of Water Ress., Energy Res. Auth. Rev. Ref. Bonds, Series H (AGM Insured), 4.50%, 2017 | 200 | 204 | ||||||
| California State Dept. of Water Ress., Energy Res. Auth. Rev. Ref. Bonds, Series N, 5.00%, 2018 | 500 | 531 | ||||||
| California State Dept. of Water Ress., Water Rev. Ref. Bonds, Series AM, 5.00%, 2018 | 160 | 174 | ||||||
| California State Public Works Board, College & Univ. Imps. Lease Rev. Bonds, Series B, 5.00%, 2017 | 275 | 286 | ||||||
| California State Public Works Board, Correctional Fac. Imps. Lease Rev. Bonds, Series A: | ||||||||
| 5.00%, 2018 | 250 | 269 | ||||||
| 5.00%, 2020 | 700 | 795 | ||||||
| California State Public Works Board, Lease Rev. Ref. Bonds, 4.00%, 2018 | 425 | 446 | ||||||
| California State Public Works Board, Public Imps. Lease Rev. Bonds, Series A: | ||||||||
| 4.00%, 2019 | 400 | 428 | ||||||
| 5.00%, 2018 | 400 | 423 | ||||||
| California State Public Works Board, Public Imps. Lease Rev. Bonds, Series I: | ||||||||
| 4.00%, 2017 | 210 | 217 | ||||||
| 4.00%, 2019 | 500 | 543 | ||||||
| California State Univ., College & Univ. Rev. Ref. Bonds, Series A: | ||||||||
| 5.00%, 2017 | 475 | 495 | ||||||
| 5.00%, 2018 | 400 | 433 | ||||||
| California Statewide Comms. Dev. Auth., Health Care Facs. Imps. Rev. Bonds, Series C (Mandatory Put 05/01/17 @ 100), 5.00%, 20292 | 600 | 613 | ||||||
| California Statewide Comms. Dev. Auth., Health Care Facs. Nursing Homes Rev. Bonds (CA Mtg. Ins.), 2.50%, 2020 | 1,100 | 1,101 | ||||||
| California Statewide Comms. Dev. Auth., Health Care Facs. Rev. Ref. Bonds (CA Mtg. Ins.), 4.00%, 2019 | 160 | 174 | ||||||
| California Statewide Comms. Dev. Auth., Health Care Facs. Rev. Ref. Bonds, Series B, 5.00%, 2020 | 1,225 | 1,388 | ||||||
| California Statewide Comms. Dev. Auth., Misc. Rev. Ref. Bonds (AGM Insured), 5.00%, 2019 | 280 | 313 | ||||||
| Carson Redev. Agcy. Successor Agcy., Tax Increment Allocation Ref. Bonds, Series A, 5.00%, 2018 | 700 | 749 | ||||||
| Chino Public Fncg. Auth., Special Tax Ref. Bonds, Series A (AGM Insured), 4.00%, 2021 | 500 | 562 | ||||||
| Chino Redev. Agcy. Successor Agcy., Tax Increment Allocation Ref. Bonds, Series A (BAM Insured): | ||||||||
| 5.00%, 2017 | 500 | 517 | ||||||
| 5.00%, 2018 | 125 | 134 | ||||||
| City & County of San Francisco, G.O. Public Imps. Prop. Tax Bonds: | ||||||||
| 5.00%, 2018 | 1,745 | 1,865 | ||||||
| 5.00%, 2019 | 380 | 421 | ||||||
| City & County of San Francisco, Sewer Rev. Ref Bonds, Series A, 5.00%, 2018 | 500 | 540 | ||||||
| City of Alhambra, Health Care Facs. Rev. Ref. Bonds (CA Mtg. Ins.), 5.00%, 2023 | 450 | 538 | ||||||
| City of Chula Vista, Energy Res. Auth. Rev. Ref. Bonds, Series A, 1.65%, 2018 | 1,100 | 1,101 | ||||||
| City of Irvine California, Special Assessment Ref. Bonds: | ||||||||
| Private Client Services Funds | 49 |
Capital Group California Short-Term Municipal Fund
Schedule of investments
October 31, 2016
| Bonds & notes - continued | Principal amount (000) | Value (000) | ||||||
| California - continued | ||||||||
| 4.00%, 2018 | $ | 500 | $ | 527 | ||||
| 4.00%, 2019 | 300 | 324 | ||||||
| City of Long Beach, Port, Airport & Marina Imps. Rev. Ref. Bonds, Series B, 4.00%, 2018 | 225 | 236 | ||||||
| City of Long Beach, Port, Airport & Marina Rev. Ref. Bonds, Series C, 3.00%, 2018 | 1,425 | 1,487 | ||||||
| City of Los Angeles, Dept. of Airports, Port, Airport & Marina Rev. Ref. Bonds, Series A, 5.00%, 2021 | 250 | 275 | ||||||
| City of Santa Clara, Energy Res. Auth. Rev. Ref. Bonds, Series A, 5.00%, 2018 | 500 | 534 | ||||||
| Concord Redv. Agcy. Successor Agcy., Tax Increment Allocation Rev. Ref. Bonds, 5.00%, 2018 | 600 | 632 | ||||||
| County of El Dorado, Special Tax Ref. Bonds: | ||||||||
| 4.00%, 2018 | 450 | 475 | ||||||
| 5.00%, 2020 | 545 | 621 | ||||||
| Desert Comm. College Dist., G.O. Prop. Tax Ref. Bonds, 4.00%, 2018 | 700 | 738 | ||||||
| Elk Grove Fin. Auth., Special Tax Ref. Bonds, 5.00%, 2021 | 450 | 525 | ||||||
| Emeryville Redev. Agcy. Successor Agcy., Tax Increment Allocation Ref. Bonds, Series A: | ||||||||
| 5.00%, 2018 | 500 | 537 | ||||||
| 5.00%, 2019 | 950 | 1,057 | ||||||
| Fillmore Redev. Agcy. Successor Agcy., Tax Increment Allocation Ref. Bonds: | ||||||||
| 4.00%, 2019 | 400 | 429 | ||||||
| 5.00%, 2020 | 500 | 565 | ||||||
| Glendale Redev. Agcy. Successor Agcy., Tax Increment Allocation Ref. Bonds (AGM Insured): | ||||||||
| 4.00%, 2019 | 600 | 652 | ||||||
| 5.00%, 2020 | 500 | 574 | ||||||
| Golden State Tobacco Securitization Corp., Misc. Rev. Ref. Bonds, Series A: | ||||||||
| 5.00%, 2018 | 500 | 532 | ||||||
| 5.00%, 2019 | 500 | 550 | ||||||
| Golden West Schools Fncg. Auth., Misc. Rev. Ref. Bonds, Series A (NATL-RE Insured), 0.00%, 20201 | 1,100 | 1,047 | ||||||
| Hawthorne Comm. Redev. Agcy. Successor Agcy., Tax Increment Allocation Rev. Ref. Bonds (AGM Insured), 5.00%, 2021 | 300 | 352 | ||||||
| Hemet Unified School Dist, G.O. Prop. Tax Ref. Bonds (AGM Insured), 5.00%, 2018 | 1,000 | 1,071 | ||||||
| Imperial Irrigation Dist., Energy Res. Auth. Rev. Ref. Bonds, Series C, 5.00%, 2018 | 425 | 460 | ||||||
| Kern County Water Agcy. Imp. Dist. No. 4, Water Rev. Ref. Bonds, Series A (AGM Insured): | ||||||||
| 4.00%, 2020 | 700 | 770 | ||||||
| 5.00%, 2021 | 740 | 866 | ||||||
| Kings Canyon Unified School Dist., G.O. Prop. Tax Ref. Bonds (AGM Insured), 5.00%, 2021 | 305 | 357 | ||||||
| La Quinta Redev. Agcy. Successor Agcy., Tax Allocation Ref. Bonds, 4.00%, 2018 | 500 | 528 | ||||||
| Long Beach Bond Fin. Auth., Misc. Rev. Ref. Bonds, 5.00%, 2018 | 700 | 756 | ||||||
| Long Beach Comm., College Dist., G.O. Univ. & College Imps. Prop. Tax Bonds, Series B, 4.00%, 2019 | 300 | 325 | ||||||
| Los Angeles County Redev. Auth., Tax Increment Allocation Ref. Bonds, Series S, 5.00%, 2019 | 1,000 | 1,109 | ||||||
| Los Angeles County Redev. Auth., Tax Increment Allocation Rev. Ref. Bonds: | ||||||||
| 5.00%, 2018 | 175 | 186 | ||||||
| 5.00%, 2018 | 1,100 | 1,190 | ||||||
| 5.00%, 2019 | 700 | 782 | ||||||
| Los Angeles County Sanitation Dists. Fncg. Auth., Sewer Rev. Ref. Bonds, Series A, 5.00%, 2017 | 770 | 801 | ||||||
| Los Angeles County, G.O. General Fund Public Imps. Bonds, 3.00%, 2017 | 1,300 | 1,320 | ||||||
| Los Angeles Dept. of Airports, Port, Airport & Marina Rev. Ref. Bonds, Series C, 5.00%, 2021 | 400 | 467 | ||||||
| Los Angeles Unified School Dist., G.O. Prop. Tax Ref. Bonds, Series C, 5.00%, 2019 | 1,100 | 1,219 | ||||||
| Los Angeles Unified School Dist., G.O. School Imps. Prop. Tax Bonds, Series I, 5.00%, 2018 | 500 | 535 | ||||||
| Menifee Union School Dist. Public Fncg. Auth., Special Tax Ref. Bonds, Series A, 4.00%, 2022 | 250 | 280 | ||||||
| Merced Irrigation Dist., Energy Res. Auth. Rev. Ref. Bonds, Series A (AGM Insured), 4.00%, 2019 | 600 | 650 | ||||||
| Metropolitan Water Dist. of Southern California, Water Rev. Ref. Bonds, Series B-1 (Mandatory Put 03/27/18 @ 100), 1.01%, 20272 | 500 | 500 | ||||||
| 50 | Private Client Services Funds |
Capital Group California Short-Term Municipal Fund
Schedule of investments
October 31, 2016
| Bonds & notes - continued | Principal amount (000) | Value (000) | ||||||
| California - continued | ||||||||
| Modesto Irrigation Dist., Energy Res. Auth. Rev. Ref. Bonds, 5.00%, 2022 | $ | 250 | $ | 303 | ||||
| Oakland Redev. Successor Agcy., Tax Increment Allocation Ref. Bonds, 5.00%, 2018 | 500 | 536 | ||||||
| Oakland Unified School Dist., G.O. Prop. Tax Ref. Bonds, 5.00%, 2022 | 650 | 784 | ||||||
| Orange Comm. Facs. Dist., Special Tax Ref. Bonds: | ||||||||
| 3.00%, 2017 | 360 | 367 | ||||||
| 4.00%, 2018 | 300 | 317 | ||||||
| Orange Redev. Agcy. Successor Agcy., Tax Increment Allocation Ref. Bonds: | ||||||||
| 5.00%, 2018 | 375 | 401 | ||||||
| 5.00%, 2019 | 200 | 221 | ||||||
| 5.00%, 2021 | 200 | 233 | ||||||
| Oxnard Fncg. Auth., Sewer Rev. Ref. Bonds (AGM Insured), 5.00%, 2021 | 350 | 408 | ||||||
| Poway Unified School Dist. Public Fncg. Auth., Special Tax Ref. Bonds, Series A, 4.00%, 2022 | 800 | 914 | ||||||
| Rancho Cucamonga Redev. Agcy. Successor Agcy., Tax Allocation Ref. Bonds, 5.00%, 2019 | 370 | 412 | ||||||
| Rancho Santa Fe Comm. Services Dist., Special Tax Ref. Bonds, Series A: | ||||||||
| 3.00%, 2019 | 505 | 531 | ||||||
| 4.00%, 2020 | 490 | 539 | ||||||
| Regents of the Univ. of California Medical Center Pooled Rev., Health Care Facs. Rev. Ref. Bonds, Series L, 5.00%, 2022 | 650 | 782 | ||||||
| Riverside County Redev. Successor Agcy., Tax Allocation Ref. Bonds, 5.00%, 2019 | 375 | 417 | ||||||
| Riverside County Redev. Successor Agcy., Tax Increment Allocation Rev. Ref. Bonds, Series B (AGM Insured), 4.00%, 2018 | 500 | 529 | ||||||
| Riverside Redev. Successor Agcy., Tax Allocation Ref. Bonds, Series A, 5.00%, 2019 | 850 | 946 | ||||||
| Riverside Unified School Dist. Fncg. Auth., Special Tax Ref. Bonds (BAM Insured), 5.00%, 2021 | 285 | 334 | ||||||
| Roseville Finance Auth., Special Tax Ref. Bonds: | ||||||||
| 4.00%, 2021 | 450 | 506 | ||||||
| 4.00%, 2022 | 620 | 708 | ||||||
| Sacramento County Sanitation Dist. Fncg. Auth., Sewer Rev. Ref. Bonds, Series A, 5.00%, 2018 | 500 | 543 | ||||||
| Sacramento Muni. Util. Dist., Energy Res. Auth. Rev. Ref. Bonds, Series B, 5.00%, 2017 | 225 | 233 | ||||||
| Sacramento Muni. Util. Dist., Energy Res. Auth. Rev. Ref. Bonds, Series X, 5.00%, 2017 | 250 | 259 | ||||||
| Sacramento Regional Transit Dist., Transit Rev. Ref. Bonds, 5.00%, 2018 | 250 | 263 | ||||||
| San Bernardino County Trans. Auth. Rev. Ref. Bonds, Series A, 4.00%, 2018 | 500 | 522 | ||||||
| San Diego Comm. College Dist., G.O. Prop. Tax Ref. Bonds: | ||||||||
| 4.00%, 2017 | 400 | 410 | ||||||
| 5.00%, 2018 | 500 | 537 | ||||||
| San Diego County Regional Airport Auth., Port, Airport & Marina Imps. Rev. Bonds, Sub-Series A: | ||||||||
| 5.00%, 2017 | 650 | 668 | ||||||
| 5.00%, 2018 | 100 | 107 | ||||||
| San Diego County Regional Trans. Commission., Sales Tax Rev. Ref. Bonds, Series A, 5.00%, 2018 | 300 | 318 | ||||||
| San Diego County Water Auth., Water Rev. Certs. of Part. Ref. Bonds, Series A (NATL-RE FGIC Insured), 5.25%, 2018 | 500 | 533 | ||||||
| San Diego County Water Auth., Water Rev. Ref. Bonds, Series A, 5.00%, 2017 | 500 | 511 | ||||||
| San Diego Redev. Agcy. Successor Agcy., Tax Increment Allocation Rev. Ref. Bonds, Series A: | ||||||||
| 5.00%, 2020 | 850 | 975 | ||||||
| 5.00%, 2021 | 365 | 430 | ||||||
| San Francisco City & County Airports Commission, Port, Airport & Marina Rev. Ref. Bonds, Series D, 5.00%, 2018 | 500 | 531 | ||||||
| San Francisco City & County Redev. Agcy., Tax Increment Allocation Rev. Ref. Bonds, Series C: | ||||||||
| 5.00%, 2020 | 500 | 570 | ||||||
| 5.00%, 2022 | 250 | 299 | ||||||
| San Francisco Comm. College Dist., G.O. Prop. Tax Ref. Bonds, 5.00%, 2020 | 1,000 | 1,140 | ||||||
| San Francisco Municipal Trans. Agcy., Transit Rev. Ref. Bonds, 4.00%, 2018 | 245 | 255 | ||||||
| San Francisco Unified School Dist., G.O. School Imps. Prop. Tax Bonds, Series A, 5.00%, 2018 | 500 | 534 | ||||||
| Private Client Services Funds | 51 |
Capital Group California Short-Term Municipal Fund
Schedule of investments
October 31, 2016
| Bonds & notes - continued | Principal amount (000) | Value (000) | ||||||
| California - continued | ||||||||
| San Jose Unified School Dist., G.O. Prop. Tax Ref. Bonds: | ||||||||
| 4.00%, 2018 | $ | 300 | $ | 317 | ||||
| 4.00%, 2019 | 475 | 515 | ||||||
| San Mateo Joint Powers Fncg. Auth., Lease Rev. Ref. Bonds, 4.00%, 2020 | 775 | 857 | ||||||
| San Ramon Redev. Agcy. Successor Agcy., Tax Increment Allocation Rev. Ref. Bonds, Sub-Series A (BAM Insured), 5.00%, 2021 | 340 | 393 | ||||||
| Sonoma-Marin Area Rail Transit Dist. Rev. Bonds, Series A, 5.00%, 2018 | 750 | 792 | ||||||
| South Placer Wastewater Auth., Sewer Rev. Ref. Bonds, 0.96%, 20172 | 1,075 | 1,072 | ||||||
| Southern California Public Power Auth., Energy Res. Auth. Imps. Rev. Bonds: | ||||||||
| 5.00%, 2017 | 750 | 772 | ||||||
| 5.00%, 2018 | 200 | 214 | ||||||
| Southern California Public Power Auth., Energy Res. Auth. Rev. Ref. Bonds, 5.00%, 2018 | 350 | 374 | ||||||
| Southern California Public Power Auth., Energy Res. Auth. Rev. Ref. Bonds, Series A, 5.00%, 2019 | 600 | 665 | ||||||
| Southern California Public Power Auth., Misc. Rev. Ref. Bonds, Series A, 5.00%, 2018 | 300 | 321 | ||||||
| Southwestern Comm. College Dist., G.O. Prop. Tax Ref. Bonds, Series A, 3.00%, 2021 | 200 | 218 | ||||||
| Southwestern Comm. College Dist., G.O. Prop. Tax Ref. Bonds, Series B, 4.00%, 2022 | 310 | 360 | ||||||
| State of California Dept. of Veterans Affairs, Loc. or GTD Housing Rev. Ref. Bonds, Series B, 3.50%, 2045 | 350 | 375 | ||||||
| State of California Dept. of Water Res., Rev. Ref. Bonds, Series AU (Mandatory Put 09/01/17 @ 100), 1.25%, 20352 | 1,050 | 1,051 | ||||||
| State of California, G.O. General Fund Public Imps. Bonds, Series E (Mandatory Put 12/03/18 @ 100), 1.202%, 20292 | 500 | 503 | ||||||
| State of California, G.O. General Fund Ref. Bonds: | ||||||||
| 5.00%, 2018 | 1,000 | 1,053 | ||||||
| 5.00%, 2019 | 650 | 709 | ||||||
| 5.00%, 2021 | 500 | 588 | ||||||
| State of California, G.O. General Fund Ref. Notes, 5.00%, 2019 | 900 | 1,011 | ||||||
| State of California, G.O. Misc. Rev. Ref. Bonds, 1.35%, 2019 | 425 | 429 | ||||||
| State of California, G.O. Misc. Rev. Ref. Bonds, Series A (Mandatory Put 05/01/18 @ 100), 1.08%, 20332 | 1,500 | 1,496 | ||||||
| State of California, G.O. Prop. Tax Ref. Bonds, Series B, 1.38%, 20172 | 500 | 500 | ||||||
| State of California, G.O. Public Imps. Misc. Rev. Bonds: | ||||||||
| 4.00%, 2018 | 570 | 603 | ||||||
| 5.50%, 2019 | 1,000 | 1,110 | ||||||
| State of California, G.O. Public Imps. Prop. Tax Bonds, Series CN, 3.50%, 2045 | 600 | 644 | ||||||
| Stockton Public Fncg. Auth., Sewer Rev. Ref. Bonds (BAM Insured), 5.00%, 2020 | 500 | 572 | ||||||
| Successor Agcy. Rancho Mirage Redev. Agcy., Tax Increment Allocation Ref. Bonds, Series A (BAM Insured), 4.00%, 2017 | 350 | 355 | ||||||
| Successor Agcy. to the Richmond County Redev. Agcy., Tax Increment Allocation Ref. Bonds, Series A (BAM Insured), 5.00%, 2019 | 525 | 582 | ||||||
| Suisun City Redev. Agcy., Tax Allocation Rev. Ref. Bonds, Series B (BAM Insured): | ||||||||
| 5.00%, 2019 | 675 | 751 | ||||||
| 5.00%, 2021 | 500 | 588 | ||||||
| Temecula Valley Unified School Dist. Fncg. Auth., Special Tax Ref. Bonds (BAM Insured), 5.00%, 2021 | 515 | 604 | ||||||
| Tracy Comm. Dev. Agcy. Successor Agcy., Tax Increment Allocation Rev. Ref. Bonds (AGM Insured), 5.00%, 2022 | 450 | 537 | ||||||
| Turlock Irrigation Dist., Energy Res. Auth. Rev. Ref. Bonds: | ||||||||
| 4.00%, 2018 | 250 | 259 | ||||||
| 5.00%, 2017 | 300 | 302 | ||||||
| Tustin Unified School Dist., Special Tax Ref. Bonds (BAM Insured), 5.00%, 2020 | 275 | 314 | ||||||
| Union City Comm. Redev. Agcy., Tax Increment Allocation Rev. Ref. Bonds, Series A, 5.00%, 2021 | 235 | 277 | ||||||
| 52 | Private Client Services Funds |
Capital Group California Short-Term Municipal Fund
Schedule of investments
October 31, 2016
| Bonds & notes - continued | Principal amount (000) | Value (000) | ||||||
| California - continued | ||||||||
| Victor Valley Union High School Dist., G.O. Prop. Tax Ref. Bonds, Series B (AGM Insured), 3.00%, 2021 | $ | 200 | $ | 216 | ||||
| Vista Redev. Agcy. Successor Agcy., Tax Increment Allocation Rev. Ref. Bonds, Series B1 (AGM Insured): | ||||||||
| 5.00%, 2020 | 275 | 313 | ||||||
| 5.00%, 2021 | 265 | 310 | ||||||
| Walnut Energy Center Auth., Energy Res. Auth. Rev. Ref. Bonds, 4.00%, 2018 | 300 | 311 | ||||||
| West Sacramento Redev. Agcy. Successor Agcy., Tax Increment Allocation Ref. Bonds, 4.00%, 2019 | 755 | 816 | ||||||
| Westminster Redev. Agcy. Successor Agcy., Tax Increment Allocation Ref. Bonds: | ||||||||
| 4.00%, 2020 | 180 | 199 | ||||||
| 4.00%, 2022 | 120 | 137 | ||||||
| Westminster Redev. Agcy. Successor Agcy., Tax Increment Allocation Ref. Bonds (BAM Insured), 5.00%, 2028 | 300 | 372 | ||||||
| 108,160 | ||||||||
| Guam - 0.6% | ||||||||
| Guam Government Waterworks Auth., Water Util. Imps. Rev. Bonds, 5.00%, 2024 | 300 | 356 | ||||||
| Territory of Guam, Cash Flow Mgmt., Misc. Rev. Bonds, Series A, 5.00%, 2017 | 300 | 302 | ||||||
| 658 | ||||||||
| Illinois - 0.4% | ||||||||
| Illinois State Toll Highway Auth., Highway Tolls Rev. Ref. Bonds, Series B, 5.00%, 2017 | 500 | 522 | ||||||
| 522 | ||||||||
| Louisiana - 0.1% | ||||||||
| Louisiana Housing Fin. Agcy., Loc. or GTD Housing Rev. Bonds (GNMA/FNMA/FHLMC Insured), 4.60%, 2028 | 85 | 88 | ||||||
| 88 | ||||||||
| Massachusetts - 0.1% | ||||||||
| Commonwealth of Massachusetts, G.O. Misc. Tax Public Imps. Rev. Bonds, Series D, 1.06%, 20182 | 175 | 175 | ||||||
| 175 | ||||||||
| Puerto Rico - 0.9% | ||||||||
| Puerto Rico Ind. Tourist Educ. Medical & Environmental Control Facs. Fncg. Auth., College & Univ. Imps. Rev. Ref. Bonds, 5.00%, 2018 | 800 | 815 | ||||||
| Puerto Rico Ind. Tourist Educ. Medical & Environmental Control Facs. Fncg. Auth., College & Univ. Rev. Ref. Bonds, 5.00%, 2017 | 250 | 253 | ||||||
| 1,068 | ||||||||
| U. S. Virgin Islands - 0.7% | ||||||||
| Virgin Islands Public Fin. Auth., Misc. Rev. Ref. Bonds, Series B (AGM Insured), 5.00%, 2019 | 800 | 864 | ||||||
| 864 | ||||||||
| Total bonds & notes (cost: $110,683,000) | 111,535 | |||||||
| Private Client Services Funds | 53 |
Capital Group California Short-Term Municipal Fund
Schedule of investments
October 31, 2016
| Short-term securities - 2.3% | Principal amount (000) | Value (000) | ||||||
| California Educ. Facs. Auth. Rev., 0.89%, January 05, 20172 | $ | 1,000 | $ | 1,000 | ||||
| Manteca Redev. Agcy., Tax Allocation Rev. Ref. Bonds, 0.50%, October 01, 20422 | 1,405 | 1,405 | ||||||
| State of California G.O., 0.84%, January 11, 20172 | 300 | 300 | ||||||
| Total short-term securities (cost: $2,705,000) | 2,705 | |||||||
| Total investment securities (cost: $113,388,000) | 114,240 | |||||||
| Other assets less liabilities | 3,610 | |||||||
| Net assets | $ | 117,850 | ||||||
| 1 | Zero coupon bond; interest rate represents current yield to maturity. |
| 2 | Coupon rate may change periodically. For short-term securities, the date of the next scheduled coupon rate change is considered to be the maturity date. |
| Key to abbreviations | |||
| Agcy. | = | Agency | |
| AGM | = | Assured Guaranty Municipal Corporation | |
| Auth. | = | Authority | |
| BAM | = | Build America Mutual Assurance Company | |
| CA Mtg. Ins. | = | California Mortgage Insurance | |
| Certs. of Part. | = | Certificates of Participation | |
| Comm. | = | Community | |
| Comms. | = | Communities | |
| Corp. | = | Corporation | |
| Corps. | = | Corporations | |
| Dept. | = | Department | |
| Dev. | = | Development | |
| Dist. | = | District | |
| Econ. | = | Economic | |
| Educ. | = | Educational | |
| Fac. | = | Facility | |
| Facs. | = | Facilities | |
| FGIC | = | Financial Guaranty Insurance Company | |
| FHLMC | = | Federal Home Loan Mortgage Corporation | |
| Fin. | = | Finance | |
| Fncg. | = | Financing | |
| FNMA | = | Federal National Mortgage Association | |
| GNMA | = | Government National Mortgage Association | |
| G.O. | = | General Obligation | |
| GTD | = | Guaranteed | |
| Imps. | = | Improvements | |
| Ind. | = | Industrial | |
| Loc. | = | Local | |
| Mgmt. | = | Management | |
| Misc. | = | Miscellaneous | |
| Muni. | = | Municipal | |
| NATL-RE | = | National Reinsurance | |
| Prop. | = | Property | |
| Redev. | = | Redevelopment | |
| Ref. | = | Refunding | |
| Res. | = | Resource | |
| Ress. | = | Resources | |
| Rev. | = | Revenue | |
| Trans. | = | Transportation | |
| Univ. | = | University | |
| Util. | = | Utility | |
See Notes to Financial Statements
| 54 | Private Client Services Funds |
Capital Group Core Bond Fund
October 31, 2016
Growth of $25,000 investment
Here’s how a $25,000 investment in the Capital Group Core Bond Fund grew between April 13, 2010, when the fund began operations, and October 31, 2016, the end of the fund’s fiscal year.
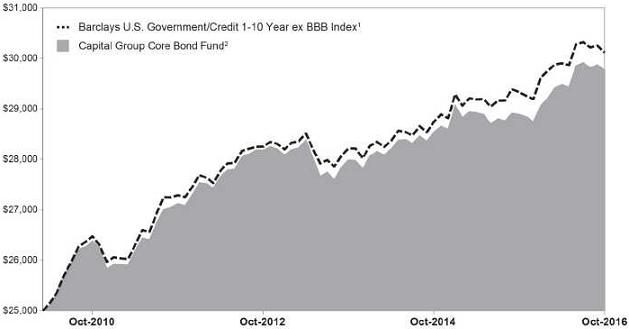
| 1 | The index is unmanaged, and its results include reinvested distributions but do not reflect the effect of sales charges, commissions, or expenses. |
| 2 | Includes reinvested dividends and capital gain distributions. |
Results are for past periods and are not predictive of results for future periods. Current and future results may be lower or higher than those shown. Share price and returns will vary so investors may lose money. The results shown are before taxes on fund distributions and sale of fund shares.
Investment portfolio – quality ratings*
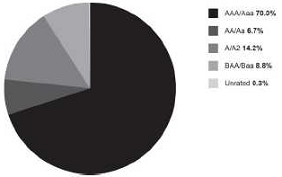
| * | Bond ratings, which typically range from Aaa/AAA (highest to D (lowest), are assigned by credit rating agencies such as Moody’s, Standard & Poors and/or Fitch as an indication of an Issuer’s credit-worthiness. If agency rating differ, securities are put in the highest category consistent with fund investment policies. When securities have not been rated by a rating agency (included in “unrated” at left), the investment advisor performs it’s own credit analysis and assigns comparable ratings that are used for compliance and fund investment policies. The ratings are not covered by the Report of Independent Registered Public Accounting Firm. |
| Private Client Services Funds | 55 |
Capital Group Core Bond Fund
Schedule of investments
October 31, 2016
| Bonds, notes & other debt investments - 93.0% | Principal amount (000) | Value (000) | ||||||
| U.S. government & government agency bonds & notes - 49.4% | ||||||||
| Fannie Mae: | ||||||||
| 1.75%, 2019 | $ | 1,545 | $ | 1,576 | ||||
| 2.125%, 2026 | 400 | 401 | ||||||
| Federal Home Loan Banks, 1.875%, 2020 | 2,910 | 2,978 | ||||||
| Freddie Mac, 1.00%, 2017 | 350 | 351 | ||||||
| U.S. Treasury Bonds: | ||||||||
| 7.625%, 2025 | 750 | 1,096 | ||||||
| 3.00%, 2045 | 500 | 544 | ||||||
| U.S. Treasury Inflation Indexed Bonds: | ||||||||
| 0.125%, 2017 | 1,824 | 1,828 | ||||||
| 0.125%, 2021 | 8,135 | 8,302 | ||||||
| 0.25%, 2025 | 3,401 | 3,449 | ||||||
| 0.625%, 2026 | 3,320 | 3,467 | ||||||
| 2.00%, 2026 | 607 | 708 | ||||||
| 0.75%, 2045 | 205 | 206 | ||||||
| U.S. Treasury Inflation Indexed Notes: | ||||||||
| 2.375%, 2017 | 394 | 397 | ||||||
| 0.125%, 2020 | 1,666 | 1,698 | ||||||
| 0.375%, 2023 | 517 | 535 | ||||||
| 0.375%, 2025 | 3,326 | 3,416 | ||||||
| U.S. Treasury Notes: | ||||||||
| 4.625%, 2017 | 4,000 | 4,050 | ||||||
| 1.00%, 2017 | 1,000 | 1,002 | ||||||
| 0.875%, 2017 | 1,000 | 1,002 | ||||||
| 4.50%, 2017 | 15,825 | 16,160 | ||||||
| 8.75%, 2017 | 490 | 511 | ||||||
| 0.875%, 2017 | 1,000 | 1,002 | ||||||
| 0.625%, 2017 | 2,585 | 2,585 | ||||||
| 0.875%, 2017 | 2,000 | 2,003 | ||||||
| 0.75%, 2018 | 500 | 500 | ||||||
| 3.875%, 2018 | 1,000 | 1,048 | ||||||
| 1.375%, 2018 | 250 | 252 | ||||||
| 0.875%, 2018 | 3,300 | 3,300 | ||||||
| 1.25%, 2018 | 500 | 504 | ||||||
| 1.25%, 2018 | 5,140 | 5,177 | ||||||
| 3.75%, 2018 | 3,800 | 4,020 | ||||||
| 1.50%, 2018 | 1,000 | 1,013 | ||||||
| 0.75%, 2019 | 1,390 | 1,385 | ||||||
| 1.25%, 2019 | 500 | 504 | ||||||
| 1.50%, 2019 | 2,750 | 2,788 | ||||||
| 0.875%, 2019 | 4,720 | 4,710 | ||||||
| 1.625%, 2019 | 1,000 | 1,018 | ||||||
| 1.625%, 2019 | 750 | 763 | ||||||
| 1.00%, 2019 | 500 | 500 | ||||||
| 1.75%, 2019 | 2,000 | 2,043 | ||||||
| 1.50%, 2019 | 1,000 | 1,014 | ||||||
| 1.625%, 2019 | 500 | 509 | ||||||
| 1.375%, 2020 | 1,000 | 1,009 | ||||||
| 1.625%, 2020 | 3,215 | 3,271 | ||||||
| 1.375%, 2020 | 4,850 | 4,885 | ||||||
| 1.625%, 2020 | 2,500 | 2,540 | ||||||
| 2.00%, 2020 | 1,000 | 1,031 | ||||||
| 1.25%, 2021 | 2,360 | 2,358 | ||||||
| 56 | Private Client Services Funds |
Capital Group Core Bond Fund
Schedule of investments
October 31, 2016
| Bonds, notes & other debt investments - continued | Principal amount (000) | Value (000) | ||||||
| U.S. government & government agency bonds & notes - continued | ||||||||
| 1.375%, 2021 | $ | 5,165 | $ | 5,185 | ||||
| 3.125%, 2021 | 2,000 | 2,161 | ||||||
| 1.375%, 2021 | 3,420 | 3,434 | ||||||
| 1.125%, 2021 | 3,010 | 2,986 | ||||||
| 1.125%, 2021 | 3,465 | 3,435 | ||||||
| 1.875%, 2021 | 500 | 512 | ||||||
| 2.125%, 2021 | 1,000 | 1,037 | ||||||
| 1.50%, 2022 | 1,750 | 1,760 | ||||||
| 1.75%, 2022 | 2,000 | 2,034 | ||||||
| 1.875%, 2022 | 2,000 | 2,046 | ||||||
| 2.125%, 2022 | 3,000 | 3,108 | ||||||
| 2.125%, 2022 | 4,700 | 4,865 | ||||||
| 1.75%, 2023 | 1,680 | 1,701 | ||||||
| 2.00%, 2023 | 2,000 | 2,055 | ||||||
| 1.50%, 2023 | 4,750 | 4,733 | ||||||
| 1.625%, 2023 | 2,000 | 2,007 | ||||||
| 1.75%, 2023 | 1,000 | 1,011 | ||||||
| 1.625%, 2023 | 4,000 | 4,012 | ||||||
| 1.375%, 2023 | 1,275 | 1,259 | ||||||
| 1.25%, 2023 | 1,000 | 978 | ||||||
| 2.50%, 2023 | 1,050 | 1,111 | ||||||
| 1.375%, 2023 | 1,000 | 986 | ||||||
| 2.75%, 2023 | 2,250 | 2,421 | ||||||
| 2.75%, 2024 | 5,000 | 5,385 | ||||||
| 2.00%, 2025 | 2,000 | 2,040 | ||||||
| 2.00%, 2025 | 2,000 | 2,036 | ||||||
| 1.625%, 2026 | 3,000 | 2,952 | ||||||
| 1.50%, 2026 | 1,500 | 1,456 | ||||||
| Total U.S. government & government agency bonds & notes | 174,115 | |||||||
| Mortgage-backed obligations - 8.3% | ||||||||
| Federal agency mortgage-backed obligations - 4.8% | ||||||||
| Fannie Mae: | ||||||||
| 4.50%, 2019 | 31 | 32 | ||||||
| 4.50%, 2020 | 193 | 198 | ||||||
| 3.50%, 2025 | 2,630 | 2,773 | ||||||
| 5.50%, 2037 | 10 | 11 | ||||||
| 5.50%, 2038 | 517 | 586 | ||||||
| 5.00%, 2041 | 919 | 1,021 | ||||||
| 5.00%, 2041 | 219 | 244 | ||||||
| FHLMC Multifamily Structured Pass Through Certificates: | ||||||||
| 3.974%, 2021 | 524 | 571 | ||||||
| 2.791%, 2022 | 1,320 | 1,390 | ||||||
| 2.373%, 2022 | 250 | 258 | ||||||
| Freddie Mac: | ||||||||
| 3.50%, 2034 | 2,301 | 2,435 | ||||||
| 3.50%, 2045 | 2,675 | 2,860 | ||||||
| Freddie Mac REMICS, 6.00%, 2037 | 31 | 36 | ||||||
| Ginnie Mae: | ||||||||
| 4.50%, 2040 | 83 | 91 | ||||||
| 4.00%, 2046, TBA | 2,570 | 2,751 | ||||||
| 5.616%, 2059 | 164 | 168 |
| Private Client Services Funds | 57 |
Capital Group Core Bond Fund
Schedule of investments
October 31, 2016
| Bonds, notes & other debt investments - continued | Principal amount (000) | Value (000) | ||||||
| Mortgage-backed obligations - continued | ||||||||
| Federal agency mortgage-backed obligations - continued | ||||||||
| 1.396%, 20621 | $ | 611 | $ | 615 | ||||
| 5.075%, 2064 | 215 | 225 | ||||||
| 6.64%, 2064 | 771 | 815 | ||||||
| 17,080 | ||||||||
| Commercial mortgage-backed securities - 3.5% | ||||||||
| Citigroup Commercial Mortgage Trust, 3.608%, 2048 | 570 | 610 | ||||||
| Core Industrial Trust, Series 144A, 3.04%, 20342 | 890 | 931 | ||||||
| Credit Suisse Commercial Mortgage Trust, 5.695%, 20401 | 490 | 501 | ||||||
| DBUBS Mortgage Trust, Series 144A, 3.742%, 20462 | 18 | 18 | ||||||
| Freddie Mac Structured Agency Credit Risk Debt Notes:1 | ||||||||
| 1.534%, 2024 | 75 | 75 | ||||||
| 1.634%, 2025 | 128 | 128 | ||||||
| Greenwich Capital Commercial Funding Corp., 5.444%, 2039 | 108 | 108 | ||||||
| Hilton USA Trust, Series 144A:2 | ||||||||
| 2.662%, 2030 | 399 | 400 | ||||||
| 3.367%, 2030 | 725 | 726 | ||||||
| JPMorgan Chase Commercial Mortgage Securities Trust:1 | ||||||||
| 5.715%, 2049 | 488 | 494 | ||||||
| 5.85%, 2051 | 267 | 273 | ||||||
| LB-UBS Commercial Mortgage Trust: | ||||||||
| 5.387%, 2040 | 519 | 523 | ||||||
| 5.493%, 20401 | 680 | 690 | ||||||
| 5.871%, 20441 | 296 | 301 | ||||||
| 6.159%, 20451 | 500 | 520 | ||||||
| Merrill Lynch Mortgage Trust, 5.8285%, 20501 | 692 | 702 | ||||||
| ML-CFC Commercial Mortgage Trust, 5.873%, 20491 | 534 | 544 | ||||||
| Morgan Stanley Bank of America Merrill Lynch Trust, 3.383%, 2048 | 675 | 713 | ||||||
| Morgan Stanley Capital I Trust, 5.319%, 2043 | 21 | 21 | ||||||
| Station Place Securitization Trust, 1.534%, 20171,3 | 1,000 | 1,000 | ||||||
| Wachovia Bank Commercial Mortgage Trust: | ||||||||
| 5.342%, 2043 | 1,631 | 1,637 | ||||||
| 5.591%, 20471 | 510 | 516 | ||||||
| 5.703%, 20491 | 725 | 734 | ||||||
| 12,165 | ||||||||
| Total mortgage-backed obligations | 29,245 | |||||||
| Corporate bonds & notes - 26.1% | ||||||||
| Banks - 3.9% | ||||||||
| Bank of America Corp.: | ||||||||
| 2.625%, 2020 | 735 | 748 | ||||||
| 3.875%, 2025 | 865 | 912 | ||||||
| BB&T Corp.: | ||||||||
| 2.05%, 2018 | 500 | 505 | ||||||
| 2.625%, 2020 | 385 | 395 | ||||||
| BNP Paribas SA, 1.3366%, 20171 | 520 | 521 | ||||||
| Citigroup, Inc.: | ||||||||
| 2.35%, 2021 | 1,005 | 1,007 |
| 58 | Private Client Services Funds |
Capital Group Core Bond Fund
Schedule of investments
October 31, 2016
| Bonds, notes & other debt investments - continued | Principal amount (000) | Value (000) | ||||||
| Corporate bonds & notes - continued | ||||||||
| Banks - continued | ||||||||
| 4.45%, 2027 | $ | 390 | $ | 412 | ||||
| Credit Suisse Group Funding Guernsey Ltd., Series 144A, 3.80%, 20232 | 500 | 506 | ||||||
| HSBC Holdings PLC, 2.95%, 2021 | 660 | 671 | ||||||
| JPMorgan Chase & Co.: | ||||||||
| 2.55%, 2021 | 645 | 655 | ||||||
| 3.20%, 2023 | 125 | 129 | ||||||
| Morgan Stanley: | ||||||||
| 2.125%, 2018 | 300 | 302 | ||||||
| 2.50%, 2021 | 500 | 504 | ||||||
| 2.282%, 20231 | 650 | 650 | ||||||
| 3.125%, 2026 | 260 | 260 | ||||||
| PNC Bank NA: | ||||||||
| 1.45%, 2019 | 690 | 688 | ||||||
| 2.15%, 2021 | 1,000 | 1,010 | ||||||
| The Bank of New York Mellon Corp., 2.10%, 2019 | 500 | 507 | ||||||
| The Goldman Sachs Group, Inc.: | ||||||||
| 2.625%, 2021 | 415 | 421 | ||||||
| 3.75%, 2026 | 435 | 454 | ||||||
| 4.75%, 2045 | 175 | 194 | ||||||
| Wells Fargo & Co.: | ||||||||
| 2.50%, 2021 | 820 | 831 | ||||||
| 2.10%, 2021 | 1,360 | 1,354 | ||||||
| 13,636 | ||||||||
| Pharmaceuticals - 2.3% | ||||||||
| Abbvie, Inc.: | ||||||||
| 2.50%, 2020 | 1,060 | 1,074 | ||||||
| 2.30%, 2021 | 340 | 341 | ||||||
| 3.20%, 2022 | 165 | 170 | ||||||
| 2.85%, 2023 | 80 | 81 | ||||||
| 3.60%, 2025 | 150 | 153 | ||||||
| Actavis Funding SCS: | ||||||||
| 3.00%, 2020 | 485 | 501 | ||||||
| 3.45%, 2022 | 490 | 510 | ||||||
| 3.80%, 2025 | 490 | 510 | ||||||
| AstraZeneca PLC, 3.375%, 2025 | 445 | 466 | ||||||
| EMD Finance LLC, Series 144A, 3.25%, 20252 | 580 | 593 | ||||||
| Johnson & Johnson, 2.45%, 2026 | 320 | 323 | ||||||
| Merck & Co., Inc., 1.10%, 2018 | 250 | 250 | ||||||
| Novartis Securities Investment Ltd., 5.125%, 2019 | 300 | 325 | ||||||
| Pfizer, Inc., 1.1503%, 20181 | 500 | 502 | ||||||
| Shire Acquisitions Investments Ireland DAC: | ||||||||
| 1.90%, 2019 | 350 | 349 | ||||||
| 2.40%, 2021 | 195 | 194 | ||||||
| 2.875%, 2023 | 120 | 118 | ||||||
| 3.20%, 2026 | 425 | 419 | ||||||
| Teva Pharmaceutical Finance Netherlands III BV: | ||||||||
| 1.40%, 2018 | 165 | 164 | ||||||
| 1.70%, 2019 | 165 | 164 | ||||||
| 2.20%, 2021 | 600 | 594 | ||||||
| 2.80%, 2023 | 190 | 187 |
| Private Client Services Funds | 59 |
Capital Group Core Bond Fund
Schedule of investments
October 31, 2016
| Bonds, notes & other debt investments - continued | Principal amount (000) | Value (000) | ||||||
| Corporate bonds & notes - continued | ||||||||
| Pharmaceuticals - continued | ||||||||
| 3.15%, 2026 | $ | 200 | $ | 195 | ||||
| 4.10%, 2046 | 30 | 28 | ||||||
| 8,211 | ||||||||
| Electric - 2.2% | ||||||||
| Berkshire Hathaway Energy Co., 5.75%, 2018 | 300 | 319 | ||||||
| CMS Energy Corp., 3.875%, 2024 | 400 | 430 | ||||||
| Duke Energy Corp.: | ||||||||
| 1.80%, 2021 | 605 | 598 | ||||||
| 2.65%, 2026 | 660 | 644 | ||||||
| Exelon Corp., 3.40%, 2026 | 65 | 67 | ||||||
| Pacific Gas & Electric Co., 2.45%, 2022 | 300 | 305 | ||||||
| PacifiCorp, 5.65%, 2018 | 755 | 810 | ||||||
| Progress Energy, Inc., 7.05%, 2019 | 930 | 1,047 | ||||||
| Public Service Electric & Gas Co.: | ||||||||
| 1.90%, 2021 | 270 | 273 | ||||||
| 2.25%, 2026 | 520 | 510 | ||||||
| Southern California Edison Co., 1.125%, 2017 | 430 | 430 | ||||||
| Tampa Electric Co., 2.60%, 2022 | 350 | 358 | ||||||
| Virginia Electric and Power Co.: | ||||||||
| 1.20%, 2018 | 620 | 619 | ||||||
| 3.10%, 2025 | 1,020 | 1,063 | ||||||
| Xcel Energy, Inc., 3.30%, 2025 | 190 | 198 | ||||||
| 7,671 | ||||||||
| Oil & gas - 1.6% | ||||||||
| Anadarko Petroleum Corp.: | ||||||||
| 6.375%, 2017 | 32 | 33 | ||||||
| 4.85%, 2021 | 65 | 71 | ||||||
| 5.55%, 2026 | 145 | 165 | ||||||
| ConocoPhillips Co.: | ||||||||
| 4.20%, 2021 | 155 | 168 | ||||||
| 4.95%, 2026 | 235 | 264 | ||||||
| Ensco PLC, 5.20%, 2025 | 50 | 41 | ||||||
| Exxon Mobil Corp., 1.0003%, 20191 | 1,115 | 1,115 | ||||||
| Husky Energy, Inc., 7.25%, 2019 | 250 | 290 | ||||||
| Petroleos Mexicanos Co., Series 144A:2 | ||||||||
| 6.375%, 2021 | 300 | 329 | ||||||
| 4.625%, 2023 | 1,000 | 999 | ||||||
| Phillips 66, 4.30%, 2022 | 290 | 319 | ||||||
| Shell International Finance BV: | ||||||||
| 1.875%, 2021 | 270 | 268 | ||||||
| 1.75%, 2021 | 435 | 430 | ||||||
| 2.875%, 2026 | 340 | 341 | ||||||
| 2.50%, 2026 | 265 | 258 | ||||||
| Statoil ASA, 3.25%, 2024 | 85 | 90 | ||||||
| Total Capital International SA, 2.875%, 2022 | 230 | 239 | ||||||
| Woodside Finance Ltd., Series 144A, 4.60%, 20212 | 185 | 196 | ||||||
| 5,616 |
| 60 | Private Client Services Funds |
Capital Group Core Bond Fund
Schedule of investments
October 31, 2016
| Bonds, notes & other debt investments - continued | Principal amount (000) | Value (000) | ||||||
| Corporate bonds & notes - continued | ||||||||
| Pipelines - 1.6% | ||||||||
| Boardwalk Pipelines LP, 4.95%, 2024 | $ | 460 | $ | 479 | ||||
| Enbridge Energy Partners LP, 5.875%, 2025 | 230 | 265 | ||||||
| Enbridge, Inc.: | ||||||||
| 5.60%, 2017 | 790 | 805 | ||||||
| 4.00%, 2023 | 505 | 518 | ||||||
| EnLink Midstream Partners LP, 4.40%, 2024 | 220 | 219 | ||||||
| Enterprise Products Operating LLC, 3.70%, 2026 | 80 | 82 | ||||||
| Kinder Morgan Energy Partners LP, 4.25%, 2024 | 430 | 444 | ||||||
| Kinder Morgan, Inc., 4.30%, 2025 | 1,010 | 1,053 | ||||||
| Phillips 66 Partners LP, 3.55%, 2026 | 105 | 105 | ||||||
| Spectra Energy Partners LP, 2.95%, 2018 | 500 | 510 | ||||||
| TC PipeLines LP, 4.375%, 2025 | 415 | 429 | ||||||
| Williams Partners LP, 4.50%, 2023 | 535 | 561 | ||||||
| 5,470 | ||||||||
| Auto Manufacturers - 1.3% | ||||||||
| American Honda Finance Corp., 2.30%, 2026 | 75 | 74 | ||||||
| BMW US Capital LLC, Series 144A, 1.45%, 20192 | 340 | 339 | ||||||
| Daimler Finance North America LLC, Series 144A:2 | ||||||||
| 1.746%, 20181 | 350 | 352 | ||||||
| 3.30%, 2025 | 250 | 259 | ||||||
| Ford Motor Credit Co. LLC: | ||||||||
| 3.157%, 2020 | 550 | 565 | ||||||
| 3.219%, 2022 | 205 | 209 | ||||||
| General Motors Co., 4.00%, 2025 | 145 | 147 | ||||||
| General Motors Financial Co., Inc.: | ||||||||
| 3.10%, 2019 | 975 | 993 | ||||||
| 3.70%, 2020 | 320 | 330 | ||||||
| 4.30%, 2025 | 535 | 547 | ||||||
| 4.00%, 2026 | 175 | 174 | ||||||
| Toyota Motor Credit Corp.: | ||||||||
| 1.45%, 2018 | 350 | 351 | ||||||
| 2.25%, 2023 | 345 | 344 | ||||||
| 4,684 | ||||||||
| Healthcare-services - 1.3% | ||||||||
| Aetna, Inc.: | ||||||||
| 1.50%, 2017 | 350 | 351 | ||||||
| 1.70%, 2018 | 220 | 221 | ||||||
| 1.90%, 2019 | 255 | 257 | ||||||
| 2.40%, 2021 | 685 | 692 | ||||||
| 2.80%, 2023 | 60 | 61 | ||||||
| 3.20%, 2026 | 665 | 670 | ||||||
| 4.25%, 2036 | 120 | 122 | ||||||
| 4.375%, 2046 | 220 | 224 | ||||||
| Anthem, Inc.: | ||||||||
| 2.30%, 2018 | 285 | 287 | ||||||
| 4.35%, 2020 | 300 | 324 | ||||||
| Laboratory Corp. of America Holdings, 4.70%, 2045 | 135 | 143 | ||||||
| UnitedHealth Group, Inc.: |
| Private Client Services Funds | 61 |
Capital Group Core Bond Fund
Schedule of investments
October 31, 2016
| Bonds, notes & other debt investments - continued | Principal amount (000) | Value (000) | ||||||
| Corporate bonds & notes - continued | ||||||||
| Healthcare-services - continued | ||||||||
| 1.40%, 2017 | $ | 250 | $ | 251 | ||||
| 3.35%, 2022 | 380 | 405 | ||||||
| 3.75%, 2025 | 460 | 497 | ||||||
| 4,505 | ||||||||
| Insurance - 1.2% | ||||||||
| American International Group, Inc., 2.30%, 2019 | 495 | 503 | ||||||
| Berkshire Hathaway Finance Corp., 2.00%, 2018 | 750 | 761 | ||||||
| Chubb INA Holdings, Inc.: | ||||||||
| 2.30%, 2020 | 275 | 281 | ||||||
| 2.875%, 2022 | 145 | 151 | ||||||
| 3.35%, 2026 | 45 | 47 | ||||||
| 4.35%, 2045 | 50 | 56 | ||||||
| New York Life Global Funding, Series 144A, 1.70%, 20212 | 750 | 743 | ||||||
| Prudential Financial, Inc., 1.597%, 20181 | 570 | 569 | ||||||
| QBE Insurance Group Ltd., Series 144A, 2.40%, 20182 | 1,125 | 1,130 | ||||||
| 4,241 | ||||||||
| Telecommunications - 1.1% | ||||||||
| AT&T, Inc.: | ||||||||
| 2.80%, 2021 | 405 | 411 | ||||||
| 4.125%, 2026 | 325 | 342 | ||||||
| Cisco Systems, Inc., 2.20%, 2023 | 520 | 518 | ||||||
| Deutsche Telekom International Finance BV, Series 144A, 2.485%, 20232 | 695 | 689 | ||||||
| Verizon Communications, Inc.: | ||||||||
| 1.375%, 2019 | 350 | 347 | ||||||
| 1.75%, 2021 | 180 | 176 | ||||||
| 2.625%, 2026 | 770 | 740 | ||||||
| 4.272%, 2036 | 500 | 503 | ||||||
| 4.125%, 2046 | 175 | 168 | ||||||
| 3,894 | ||||||||
| Beverages - 1.1% | ||||||||
| Anheuser-Busch InBev Worldwide, Inc.: | ||||||||
| 2.65%, 2021 | 340 | 349 | ||||||
| 3.30%, 2023 | 175 | 183 | ||||||
| 3.65%, 2026 | 560 | 591 | ||||||
| Molson Coors Brewing Co.: | ||||||||
| 1.45%, 2019 | 80 | 80 | ||||||
| 2.10%, 2021 | 85 | 85 | ||||||
| 3.00%, 2026 | 245 | 243 | ||||||
| Pepsico, Inc.: | ||||||||
| 1.35%, 2019 | 335 | 335 | ||||||
| 1.70%, 2021 | 420 | 418 | ||||||
| Pernod-Ricard SA, Series 144A, 2.95%, 20172 | 800 | 802 | ||||||
| SABMiller Holdings, Inc., Series 144A, 2.45%, 20172 | 745 | 747 | ||||||
| 3,833 |
| 62 | Private Client Services Funds |
Capital Group Core Bond Fund
Schedule of investments
October 31, 2016
| Bonds, notes & other debt investments - continued | Principal amount (000) | Value (000) | ||||||
| Corporate bonds & notes - continued | ||||||||
| REITS - 1.0% | ||||||||
| Corporate Office Properties LP, 5.25%, 2024 | $ | 225 | $ | 243 | ||||
| DCT Industrial Operating Partnership LP, 4.50%, 2023 | 500 | 524 | ||||||
| DDR Corp., 4.25%, 2026 | 430 | 450 | ||||||
| ERP Operating LP, 4.625%, 2021 | 210 | 234 | ||||||
| Essex Portfolio LP, 3.50%, 2025 | 490 | 504 | ||||||
| Kimco Realty Corp.: | ||||||||
| 3.40%, 2022 | 90 | 94 | ||||||
| 2.80%, 2026 | 475 | 465 | ||||||
| Prologis LP: | ||||||||
| 2.75%, 2019 | 360 | 369 | ||||||
| 3.75%, 2025 | 235 | 252 | ||||||
| Simon Property Group LP, 2.50%, 2021 | 460 | 471 | ||||||
| 3,606 | ||||||||
| Agriculture - 0.9% | ||||||||
| Altria Group, Inc.: | ||||||||
| 2.85%, 2022 | 250 | 258 | ||||||
| 2.95%, 2023 | 200 | 206 | ||||||
| 4.00%, 2024 | 580 | 638 | ||||||
| Philip Morris International, Inc.: | ||||||||
| 1.875%, 2021 | 165 | 165 | ||||||
| 2.125%, 2023 | 415 | 410 | ||||||
| 2.75%, 2026 | 225 | 228 | ||||||
| Reynolds American, Inc.: | ||||||||
| 3.25%, 2020 | 475 | 497 | ||||||
| 4.00%, 2022 | 70 | 75 | ||||||
| 4.45%, 2025 | 430 | 473 | ||||||
| 5.70%, 2035 | 30 | 36 | ||||||
| 5.85%, 2045 | 220 | 276 | ||||||
| 3,262 | ||||||||
| Biotechnology - 0.8% | ||||||||
| Amgen, Inc.: | ||||||||
| 1.85%, 2021 | 190 | 187 | ||||||
| 2.25%, 2023 | 260 | 254 | ||||||
| 2.60%, 2026 | 720 | 696 | ||||||
| Celgene Corp.: | ||||||||
| 2.125%, 2018 | 200 | 202 | ||||||
| 2.875%, 2020 | 120 | 124 | ||||||
| 3.875%, 2025 | 455 | 479 | ||||||
| Gilead Sciences, Inc.: | ||||||||
| 3.05%, 2016 | 80 | 80 | ||||||
| 3.25%, 2022 | 325 | 342 | ||||||
| 3.50%, 2025 | 320 | 333 | ||||||
| 2,697 | ||||||||
| Media - 0.7% | ||||||||
| 21st Century Fox America, Inc., 3.70%, 2025 | 205 | 218 | ||||||
| CBS Corp., 1.95%, 2017 | 200 | 201 |
| Private Client Services Funds | 63 |
Capital Group Core Bond Fund
Schedule of investments
October 31, 2016
| Bonds, notes & other debt investments - continued | Principal amount (000) | Value (000) | ||||||
| Corporate bonds & notes - continued | ||||||||
| Media - continued | ||||||||
| Comcast Corp., 2.35%, 2027 | $ | 435 | $ | 421 | ||||
| NBCUniversal Media LLC, 5.15%, 2020 | 350 | 390 | ||||||
| The Walt Disney Co., 5.50%, 2019 | 300 | 329 | ||||||
| Viacom, Inc.: | ||||||||
| 2.50%, 2018 | 350 | 354 | ||||||
| 3.875%, 2024 | 380 | 393 | ||||||
| 2,306 | ||||||||
| Computers - 0.6% | ||||||||
| Apple, Inc.: | ||||||||
| 2.00%, 2020 | 800 | 813 | ||||||
| 1.55%, 2021 | 565 | 559 | ||||||
| 2.45%, 2026 | 685 | 672 | ||||||
| 2,044 | ||||||||
| Real Estate - 0.6% | ||||||||
| American Campus Communities Operating Partnership LP: | ||||||||
| 3.75%, 2023 | 300 | 312 | ||||||
| 4.125%, 2024 | 400 | 424 | ||||||
| Scentre Group Trust 1 / Scentre Group Trust 2, Series 144A:2 | ||||||||
| 2.375%, 2019 | 100 | 101 | ||||||
| 3.50%, 2025 | 250 | 257 | ||||||
| WEA Finance LLC, Series 144A:2 | ||||||||
| 2.70%, 2019 | 475 | 486 | ||||||
| 3.25%, 2020 | 355 | 368 | ||||||
| 1,948 | ||||||||
| Retail - 0.5% | ||||||||
| Home Depot, Inc., 2.125%, 2026 | 825 | 797 | ||||||
| McDonald’s Corp., 3.70%, 2026 | 135 | 143 | ||||||
| Starbucks Corp.: | ||||||||
| 2.00%, 2018 | 190 | 193 | ||||||
| 2.10%, 2021 | 235 | 238 | ||||||
| The Home Depot, Inc., 4.40%, 2021 | 350 | 389 | ||||||
| Walgreens Boots Alliance, Inc., 3.10%, 2023 | 135 | 137 | ||||||
| 1,897 | ||||||||
| Software - 0.4% | ||||||||
| Microsoft Corp.: | ||||||||
| 1.55%, 2021 | 270 | 268 | ||||||
| 2.40%, 2026 | 350 | 344 | ||||||
| Oracle Corp.: | ||||||||
| 1.20%, 2017 | 250 | 251 | ||||||
| 2.375%, 2019 | 500 | 511 | ||||||
| 1,374 | ||||||||
| Diversified financial services - 0.4% | ||||||||
| American Express Co., 1.401%, 20181 | 500 | 501 |
| 64 | Private Client Services Funds |
Capital Group Core Bond Fund
Schedule of investments
October 31, 2016
| Bonds, notes & other debt investments - continued | Principal amount (000) | Value (000) | ||||||
| Corporate bonds & notes - continued | ||||||||
| Diversified financial services - continued | ||||||||
| Visa, Inc., 2.20%, 2020 | $ | 815 | $ | 832 | ||||
| 1,333 | ||||||||
| Housewares - 0.4% | ||||||||
| Newell Rubbermaid, Inc.: | ||||||||
| 3.15%, 2021 | 355 | 370 | ||||||
| 3.85%, 2023 | 340 | 361 | ||||||
| 4.20%, 2026 | 515 | 557 | ||||||
| 1,288 | ||||||||
| Internet - 0.4% | ||||||||
| Alphabet, Inc., 1.998%, 2026 | 1,300 | 1,254 | ||||||
| 1,254 | ||||||||
| Food - 0.2% | ||||||||
| Kraft Heinz Foods Co., 3.00%, 2026 | 450 | 447 | ||||||
| The Kroger Co., 2.00%, 2019 | 410 | 414 | ||||||
| 861 | ||||||||
| Electronics - 0.2% | ||||||||
| Honeywell International, Inc.: | ||||||||
| 1.40%, 2019 | 440 | 440 | ||||||
| 1.85%, 2021 | 395 | 394 | ||||||
| 834 | ||||||||
| Miscellaneous manufacturing - 0.2% | ||||||||
| 3M Co., 1.625%, 2021 | 520 | 520 | ||||||
| General Electric Co., 2.70%, 2022 | 300 | 310 | ||||||
| 830 | ||||||||
| Aerospace/Defense - 0.2% | ||||||||
| Airbus Finance BV, Series 144A, 2.70%, 20232 | 85 | 87 | ||||||
| Lockheed Martin Corp.: | ||||||||
| 3.10%, 2023 | 90 | 94 | ||||||
| 3.55%, 2026 | 265 | 281 | ||||||
| The Boeing Co., 0.95%, 2018 | 350 | 350 | ||||||
| 812 | ||||||||
| Environmental Control - 0.2% | ||||||||
| Republic Services, Inc., 5.00%, 2020 | 350 | 386 | ||||||
| Waste Management, Inc., 4.60%, 2021 | 300 | 331 | ||||||
| 717 | ||||||||
| Healthcare-products - 0.2% | ||||||||
| Becton Dickinson & Co., 3.734%, 2024 | 130 | 139 |
| Private Client Services Funds | 65 |
Capital Group Core Bond Fund
Schedule of investments
October 31, 2016
| Bonds, notes & other debt investments - continued | Principal amount (000) | Value (000) | ||||||
| Corporate bonds & notes - continued | ||||||||
| Healthcare-products - continued | ||||||||
| Zimmer Biomet Holdings, Inc., 3.15%, 2022 | $ | 470 | $ | 482 | ||||
| 621 | ||||||||
| Apparel - 0.2% | ||||||||
| Nike, Inc., 2.375%, 2026 | 615 | 609 | ||||||
| 609 | ||||||||
| Chemicals - 0.1% | ||||||||
| Ecolab, Inc., 3.00%, 2016 | 180 | 180 | ||||||
| Ei Du Pont De Nemours & Co., 2.80%, 2023 | 350 | 355 | ||||||
| 535 | ||||||||
| Oil & Gas Services - 0.1% | ||||||||
| Halliburton Co., 3.80%, 2025 | 165 | 172 | ||||||
| Schlumberger Holdings Corp., Series 144A:2 | ||||||||
| 3.00%, 2020 | 125 | 130 | ||||||
| 4.00%, 2025 | 165 | 177 | ||||||
| 479 | ||||||||
| Commercial Services - 0.1% | ||||||||
| Catholic Health Initiatives, 1.60%, 2017 | 350 | 350 | ||||||
| 350 | ||||||||
| Office/Business Equip - 0.1% | ||||||||
| Xerox Corp., 2.95%, 2017 | 250 | 252 | ||||||
| 252 | ||||||||
| Gas - 0.0% | ||||||||
| Dominion Gas Holdings LLC, 2.80%, 2020 | 125 | 129 | ||||||
| 129 | ||||||||
| Transportation - 0.0% | ||||||||
| Canadian National Railway Co., 5.55%, 2018 | 50 | 53 | ||||||
| 53 | ||||||||
| Total corporate bonds & notes | 91,852 | |||||||
| Municipals - 1.6% | ||||||||
| City of Detroit, G.O. Public Imps. Prop. Tax Bonds (NATL-RE Insured), 5.375%, 2018 | 17 | 17 | ||||||
| City of Detroit, G.O. Public Imps. Prop. Tax Ref. Bonds (Assured GTY Insured), 5.00%, 2022 | 8 | 8 | ||||||
| Energy Northwest, Energy Res. Auth. Rev. Ref. Bonds, 2.814%, 2024 | 500 | 523 | ||||||
| Hurricane Catastrophe Fund Fin. Corp., Misc. Rev. Bonds, Series A, 2.995%, 2020 | 2,000 | 2,085 | ||||||
| Industry Public Facs. Auth., Tax Increment Allocation Rev. Ref. Bonds (AGM Insured): | ||||||||
| 2.203%, 2018 | 500 | 505 | ||||||
| 3.139%, 2020 | 805 | 835 | ||||||
| Michigan Fin. Auth., Public Imps. Misc. Rev. Bonds, Series G (Assured GTY Insured), 5.00%, 2022 | 42 | 45 |
| 66 | Private Client Services Funds |
Capital Group Core Bond Fund
Schedule of investments
October 31, 2016
| Bonds, notes & other debt investments - continued | Principal amount (000) | Value (000) | ||||||
| Municipals - continued | ||||||||
| New Jersey Econ. Dev. Auth., Appropriations Rev. Ref. Bonds, Series YY, 4.447%, 2020 | $ | 650 | $ | 678 | ||||
| New Jersey Trans. Trust Fund Auth., Appropriations Rev. Ref. Bonds, Series B, 1.758%, 2018 | 350 | 344 | ||||||
| State of Illinois, G.O. Pension Fndg. Prop. Tax Bonds, 5.10%, 2033 | 500 | 479 | ||||||
| Total municipals | 5,519 | |||||||
| Government & government agency bonds & notes outside the U.S. - 0.6% | ||||||||
| Sovereign - 0.6% | ||||||||
| Mexico Government International Bond, 4.00%, 2023 | 450 | 473 | ||||||
| Province of Manitoba Canada, 3.05%, 2024 | 200 | 213 | ||||||
| Province of Ontario Canada, 3.20%, 2024 | 500 | 535 | ||||||
| Ukraine Government AID Bonds, 1.844%, 2019 | 875 | 887 | ||||||
| 2,108 | ||||||||
| Total government & government agency bonds & notes outside the U.S. | 2,108 | |||||||
| Asset-backed obligations - 7.0% | ||||||||
| AmeriCredit Automobile Receivables Trust, 1.15%, 2019 | 241 | 241 | ||||||
| Avis Budget Rental Car Funding AESOP LLC, Series 144A:2 | ||||||||
| 1.92%, 2019 | 1,000 | 999 | ||||||
| 2.97%, 2020 | 1,340 | 1,367 | ||||||
| 2.50%, 2021 | 770 | 776 | ||||||
| California Republic Auto Receivables Trust: | ||||||||
| 1.82%, 2020 | 775 | 781 | ||||||
| 2.51%, 2021 | 270 | 271 | ||||||
| Capital One Multi-Asset Execution Trust, 1.60%, 2021 | 580 | 584 | ||||||
| CarMax Auto Owner Trust, 1.16%, 2019 | 335 | 335 | ||||||
| Chase Issuance Trust: | ||||||||
| 1.10%, 2020 | 690 | 689 | ||||||
| 0.965%, 20201 | 480 | 483 | ||||||
| Chesapeake Funding LLC, Series 144A, 0.9457%, 20261,2 | 102 | 102 | ||||||
| Chrysler Capital Auto Receivables Trust, Series 144A, 1.22%, 20192 | 456 | 456 | ||||||
| Citi Held For Asset Issuance, Series 144A:2 | ||||||||
| 2.56%, 2022 | 319 | 319 | ||||||
| 4.31%, 2022 | 865 | 866 | ||||||
| Citibank Credit Card Issuance Trust, 1.674%, 20201 | 540 | 547 | ||||||
| CPS Auto Receivables Trust, Series 144A:2 | ||||||||
| 2.07%, 2019 | 157 | 158 | ||||||
| 3.34%, 2020 | 800 | 817 | ||||||
| Discover Card Execution Note Trust, 0.8846%, 20201 | 1,165 | 1,167 | ||||||
| Drive Auto Receivables Trust, Series 144A:2 | ||||||||
| 1.67%, 2019 | 260 | 260 | ||||||
| 2.56%, 2020 | 190 | 192 | ||||||
| 2.76%, 2021 | 800 | 806 | ||||||
| 3.19%, 2022 | 430 | 437 | ||||||
| DT Auto Owner Trust, Series 144A:2 | ||||||||
| 1.75%, 2019 | 276 | 277 | ||||||
| 3.15%, 2022 | 425 | 424 | ||||||
| Enterprise Fleet Financing LLC, Series 144A, 1.05%, 20202 | 303 | 303 | ||||||
| Ford Credit Auto Lease Trust, 1.10%, 2017 | 72 | 72 | ||||||
| Ford Credit Auto Owner Trust, Series 144A:2 | ||||||||
| 2.26%, 2025 | 565 | 575 |
| Private Client Services Funds | 67 |
Capital Group Core Bond Fund
Schedule of investments
October 31, 2016
| Bonds, notes & other debt investments - continued | Principal amount (000) | Value (000) | ||||||
| Asset-backed obligations - continued | ||||||||
| 2.12%, 2026 | $ | 315 | $ | 320 | ||||
| 2.03%, 2027 | 525 | 528 | ||||||
| Ford Credit Floorplan Master Owner Trust, 1.55%, 2021 | 210 | 210 | ||||||
| Global SC Finance II SRL, Series 144A, 3.19%, 20292 | 595 | 572 | ||||||
| Hertz Fleet Lease Funding LP, Series 144A:1,2 | ||||||||
| 0.929%, 2028 | 202 | 202 | ||||||
| 1.279%, 2028 | 300 | 299 | ||||||
| Hertz Vehicle Financing LLC, Series 144A:2 | ||||||||
| 3.29%, 2018 | 810 | 813 | ||||||
| 1.83%, 2019 | 1,300 | 1,295 | ||||||
| 2.73%, 2021 | 1,048 | 1,064 | ||||||
| Nationstar HECM Loan Trust, Series 144A, 2.2394%, 20262,3 | 106 | 106 | ||||||
| Octagon Investment Partners XV Ltd., Series 144A, 2.1676%, 20251,2 | 800 | 798 | ||||||
| Santander Drive Auto Receivables Trust: | ||||||||
| 1.27%, 2019 | 374 | 374 | ||||||
| 1.56%, 2020 | 275 | 276 | ||||||
| 2.74%, 2021 | 1,735 | 1,763 | ||||||
| 2.66%, 2021 | 95 | 96 | ||||||
| 3.09%, 2022 | 400 | 410 | ||||||
| TAL Advantage V LLC, Series 144A, 3.55%, 20382 | 372 | 366 | ||||||
| Trade MAPS 1 Ltd., Series 144A:1,2 | ||||||||
| 1.23%, 2018 | 430 | 430 | ||||||
| 1.78%, 2018 | 250 | 250 | ||||||
| Verizon Owner Trust, Series 144A, 1.42%, 20212 | 165 | 165 | ||||||
| Total asset-backed obligations | 24,641 | |||||||
| Total bonds, notes & other debt investments (cost: $323,213,000) | 327,480 | |||||||
| Short-term securities - 7.6% | ||||||||
| Emerson Electric Co., 0.44%, November 09, 20164 | 7,000 | 6,999 | ||||||
| Federal Home Loan Banks:4 | ||||||||
| 0.29%, November 04, 2016 | 3,000 | 3,000 | ||||||
| 0.266%, November 18, 2016 | 9,000 | 8,999 | ||||||
| General Electric Co., 0.01%, November 01, 20164 | 7,750 | 7,750 | ||||||
| Total short-term securities (cost: $26,748,000) | 26,748 | |||||||
| Total investment securities (cost: $349,961,000) | 354,228 | |||||||
| Other assets less liabilities | (1,943 | ) | ||||||
| Net assets | $ | 352,285 |
| 1 | Indicates a variable rate security. The interest rate shown reflects the rate in effect at October 31, 2016. |
| 2 | Acquired in a transaction exempt from registration under Rule 144A or section 4(2) of the Securities Act of 1933. May be resold in the U.S. in transactions exempt from registration, normally to qualified institutional buyers. At October 31, 2016, the aggregate market value of these securities amounted to $27,707,000, representing 7.86% of net assets. |
| 3 | Security was valued in good faith under procedures approved by the Board of Trustees. As of October 31, 2016, these securities represent 0.3% of net assets. |
| 4 | Zero coupon bond; interest rate represents current yield to maturity. |
| 68 | Private Client Services Funds |
Capital Group Core Bond Fund
Schedule of investments
October 31, 2016
| Key to abbreviations | ||
| AGM | = | Assured Guaranty Municipal Corporation |
| Auth. | = | Authority |
| Co. | = | Company |
| Corp. | = | Corporation |
| Econ. | = | Economic |
| Facs. | = | Facilities |
| FHLMC | = | Federal Home Loan Mortgage Corporation |
| Fndg. | = | Funding |
| G.O. | = | General Obligation |
| GTY | = | Guaranty |
| Imps. | = | Improvements |
| Inc. | = | Incorporated |
| Ltd. | = | Limited |
| Misc. | = | Miscellaneous |
| NATL-RE | = | National Reinsurance |
| Prop. | = | Property |
| Ref. | = | Refunding |
| REITS | = | Real Estate Investment Trusts |
| Rev. | = | Revenue |
| TBA | = | To be announced |
See Notes to Financial Statements
| Private Client Services Funds | 69 |
Capital Group Global Equity Fund
October 31, 2016
Growth of $25,000 investment
Here’s how a $25,000 investment in the Capital Group Global Equity Fund grew between April 1, 2011, when the fund began operations, and October 31, 2016, the end of the fund’s fiscal year.
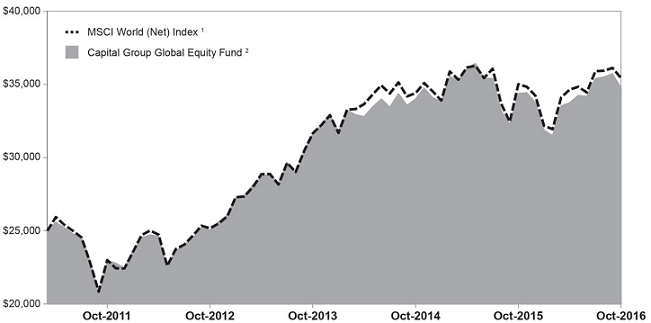
| 1 | The index is unmanaged, and its results include reinvested distributions but do not reflect the effect of sales charges, commissions, or expenses. Index returns are net of foreign withholding dividends. |
| 2 | Includes reinvested dividends and capital gain distributions. |
Results are for past periods and are not predictive of results for future periods. Current and future results may be lower or higher than those shown. Share price and returns will vary so investors may lose money. The results shown are before taxes on fund distributions and sale of fund shares.
Investment portfolio – sector diversification
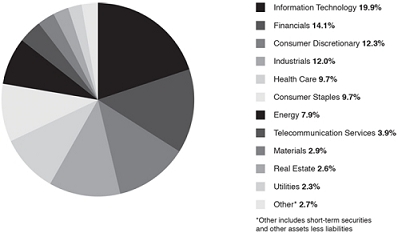
| 70 | Private Client Services Funds |
Capital Group Global Equity Fund
October 31, 2016
Investment portfolio - country diversification
| Country | (percent of net assets) | |||
| United States | 44.6 | % | ||
| Japan | 11.0 | |||
| France | 8.1 | |||
| Britain | 6.7 | |||
| Switzerland | 3.8 | |||
| Hong Kong | 3.7 | |||
| Netherlands | 3.5 | |||
| Singapore | 2.6 | |||
| Taiwan | 2.0 | |||
| Denmark | 2.0 | |||
| Ireland | 1.8 | |||
| Canada | 1.7 | |||
| Germany | 1.2 | |||
| Sweden | 1.0 | |||
| South Africa | 0.9 | |||
| Spain | 0.7 | |||
| India | 0.7 | |||
| Finland | 0.6 | |||
| Luxembourg | 0.3 | |||
| Norway | 0.2 | |||
| Australia | 0.2 | |||
| Short-term securities & other assets less liabilities | 2.7 | |||
| Private Client Services Funds | 71 |
Capital Group Global Equity Fund
Schedule of investments
October 31, 2016
| Common Stocks - 97.3% | Shares | Value (000) | ||||||
| Information Technology - 19.9% | ||||||||
| Keyence Corp. | 13,400 | $ | 9,846 | |||||
| Taiwan Semiconductor Manufacturing Co. Ltd. (ADR) | 313,920 | 9,763 | ||||||
| ASML Holding NV | 77,072 | 8,164 | ||||||
| Visa, Inc., A Shares | 94,620 | 7,807 | ||||||
| Apple, Inc. | 53,794 | 6,108 | ||||||
| Texas Instruments, Inc. | 85,340 | 6,046 | ||||||
| Broadcom Ltd. | 31,773 | 5,410 | ||||||
| Murata Manufacturing Co. Ltd. | 37,300 | 5,218 | ||||||
| Hamamatsu Photonics K.K. | 122,800 | 3,724 | ||||||
| Amadeus IT Group SA | 69,421 | 3,277 | ||||||
| VTech Holdings Ltd. | 264,600 | 3,248 | ||||||
| Xilinx, Inc. | 60,130 | 3,059 | ||||||
| SAP SE | 30,133 | 2,654 | ||||||
| Jack Henry & Associates, Inc. | 30,466 | 2,468 | ||||||
| International Business Machines Corp. | 14,700 | 2,259 | ||||||
| Microsoft Corp. | 34,800 | 2,085 | ||||||
| HP, Inc. | 142,620 | 2,067 | ||||||
| Alphabet, Inc., Class A1 | 2,460 | 1,992 | ||||||
| Activision Blizzard, Inc. | 41,620 | 1,797 | ||||||
| Alphabet, Inc., Class C1 | 2,139 | 1,678 | ||||||
| Jabil Circuit, Inc. | 69,900 | 1,492 | ||||||
| Gemalto NV | 26,349 | 1,433 | ||||||
| Accenture PLC, Class A | 11,800 | 1,372 | ||||||
| Oracle Corp. | 18,400 | 1,004 | ||||||
| Automatic Data Processing, Inc. | 8,622 | 751 | ||||||
| VeriSign, Inc.1 | 8,805 | 740 | ||||||
| Analog Devices, Inc. | 8,580 | 550 | ||||||
| 96,012 | ||||||||
| Financials - 14.1% | ||||||||
| AIA Group Ltd. | 1,660,400 | 10,480 | ||||||
| CME Group, Inc. | 75,200 | 7,528 | ||||||
| BNP Paribas SA | 118,231 | 6,858 | ||||||
| JPMorgan Chase & Co. | 88,940 | 6,160 | ||||||
| The Goldman Sachs Group, Inc. | 25,455 | 4,537 | ||||||
| Moody’s Corp. | 40,900 | 4,111 | ||||||
| HDFC Bank Ltd. (ADR) | 44,800 | 3,171 | ||||||
| Sampo Oyj, A Shares | 68,065 | 3,121 | ||||||
| The Bank of New York Mellon Corp. | 59,785 | 2,587 | ||||||
| Chubb Ltd. | 18,870 | 2,396 | ||||||
| Marsh & McLennan Cos., Inc. | 37,585 | 2,382 | ||||||
| Aon PLC | 18,500 | 2,050 | ||||||
| The PNC Financial Services Group, Inc. | 17,750 | 1,697 | ||||||
| Wells Fargo & Co. | 36,880 | 1,697 | ||||||
| Invesco Ltd. | 58,100 | 1,632 | ||||||
| New York Community Bancorp, Inc. | 93,145 | 1,338 | ||||||
| Lloyds Banking Group PLC | 1,727,700 | 1,211 | ||||||
| DNB ASA | 72,619 | 1,050 | ||||||
| Svenska Handelsbanken AB, A Shares | 73,732 | 1,006 | ||||||
| UBS Group AG | 68,607 | 971 | ||||||
| Prudential PLC | 58,055 | 948 | ||||||
| 72 | Private Client Services Funds |
Capital Group Global Equity Fund
Schedule of investments
October 31, 2016
| Common Stocks - continued | Shares | Value (000) | ||||||
| Financials - continued | ||||||||
| ABN AMRO Group NV2 | 34,060 | $ | 786 | |||||
| 67,717 | ||||||||
| Consumer Discretionary - 12.3% | ||||||||
| Las Vegas Sands Corp. | 121,980 | 7,060 | ||||||
| Amazon.com, Inc.1 | 8,430 | 6,658 | ||||||
| Newell Brands, Inc. | 106,263 | 5,103 | ||||||
| Naspers Ltd. (ADR), N Shares | 258,045 | 4,361 | ||||||
| Royal Caribbean Cruises Ltd. | 54,850 | 4,216 | ||||||
| Yum! Brands, Inc. | 47,465 | 4,095 | ||||||
| Comcast Corp., Class A | 62,150 | 3,842 | ||||||
| Starbucks Corp. | 69,100 | 3,667 | ||||||
| Norwegian Cruise Line Holdings Ltd.1 | 78,735 | 3,060 | ||||||
| LVMH Moet Hennessy Louis Vuitton SE | 13,970 | 2,539 | ||||||
| Charter Communications, Inc. Class A1 | 8,327 | 2,081 | ||||||
| Cie Financiere Richemont SA | 25,002 | 1,608 | ||||||
| SES SA | 64,207 | 1,477 | ||||||
| Liberty Global PLC, Class A1 | 44,340 | 1,446 | ||||||
| Samsonite International SA | 448,800 | 1,409 | ||||||
| Dollar General Corp. | 16,750 | 1,157 | ||||||
| BCA Marketplace PLC | 506,738 | 1,118 | ||||||
| Denso Corp. | 22,400 | 975 | ||||||
| Scripps Networks Interactive, Inc., Class A | 14,970 | 964 | ||||||
| Tempur Sealy International, Inc.1 | 16,130 | 872 | ||||||
| Panera Bread Co., Class A1 | 2,760 | 527 | ||||||
| Modern Times Group MTG AB, B Shares | 18,690 | 503 | ||||||
| Advance Auto Parts, Inc. | 3,135 | 439 | ||||||
| Liberty Global PLC, Series C1 | 5,100 | 162 | ||||||
| 59,339 | ||||||||
| Industrials - 12.0% | ||||||||
| Safran SA | 86,064 | 5,917 | ||||||
| FANUC Corp. | 29,300 | 5,498 | ||||||
| SMC Corp. | 17,500 | 5,088 | ||||||
| Eaton Corp. PLC | 69,715 | 4,446 | ||||||
| Hexcel Corp. | 81,830 | 3,722 | ||||||
| Airbus Group SE | 58,173 | 3,458 | ||||||
| Assa Abloy AB, Class B | 182,842 | 3,326 | ||||||
| The Boeing Co. | 18,775 | 2,674 | ||||||
| Nielsen Holdings PLC | 49,350 | 2,222 | ||||||
| Jardine Matheson Holdings Ltd. | 34,000 | 2,071 | ||||||
| Zodiac Aerospace | 82,230 | 2,001 | ||||||
| IDEX Corp. | 22,000 | 1,902 | ||||||
| General Electric Co. | 61,890 | 1,801 | ||||||
| Norfolk Southern Corp. | 18,980 | 1,765 | ||||||
| Waste Connections, Inc. | 21,970 | 1,652 | ||||||
| China Everbright International Ltd. | 1,101,680 | 1,321 | ||||||
| Canadian National Railway Co. | 19,020 | 1,196 | ||||||
| TransDigm Group, Inc.1 | 4,000 | 1,090 | ||||||
| Hoshizaki Corp. | 11,600 | 1,049 | ||||||
| Sydney Airport | 214,770 | 1,023 | ||||||
| DKSH Holding AG Ltd. | 14,647 | 1,015 | ||||||
| Private Client Services Funds | 73 |
Capital Group Global Equity Fund
Schedule of investments
October 31, 2016
| Common Stocks - continued | Shares | Value (000) | ||||||
| Industrials - continued | ||||||||
| Waste Management, Inc. | 13,990 | $ | 919 | |||||
| AA PLC | 232,284 | 728 | ||||||
| Brenntag AG | 13,100 | 700 | ||||||
| Ryanair Holdings PLC (ADR)1 | 8,995 | 675 | ||||||
| Meggitt PLC | 59,034 | 315 | ||||||
| 57,574 | ||||||||
| Health Care - 9.7% | ||||||||
| Novo Nordisk A/S, Class B | 167,007 | 5,975 | ||||||
| Roche Holding AG | 25,336 | 5,825 | ||||||
| Cerner Corp.1 | 88,595 | 5,190 | ||||||
| Incyte Corp.1 | 51,100 | 4,444 | ||||||
| Astrazeneca PLC | 70,705 | 3,971 | ||||||
| Essilor International SA | 29,940 | 3,365 | ||||||
| Eli Lilly & Co. | 38,045 | 2,809 | ||||||
| Danaher Corp. | 35,200 | 2,765 | ||||||
| Illumina, Inc.1 | 16,660 | 2,268 | ||||||
| Gilead Sciences, Inc. | 30,242 | 2,227 | ||||||
| Medtronic PLC | 26,760 | 2,195 | ||||||
| Sysmex Corp. | 22,600 | 1,571 | ||||||
| Aetna, Inc. | 11,390 | 1,223 | ||||||
| Express Scripts Holding Co.1 | 17,405 | 1,173 | ||||||
| UnitedHealth Group, Inc. | 7,240 | 1,023 | ||||||
| Johnson & Johnson | 6,270 | 727 | ||||||
| 46,751 | ||||||||
| Consumer Staples - 9.7% | ||||||||
| Pernod Ricard SA | 48,055 | 5,716 | ||||||
| Nestle SA | 70,575 | 5,117 | ||||||
| L’Oreal SA | 23,943 | 4,286 | ||||||
| Carlsberg A/S, Class B | 40,266 | 3,631 | ||||||
| Unilever PLC | 82,770 | 3,463 | ||||||
| Imperial Brands PLC | 65,370 | 3,165 | ||||||
| Seven & i Holdings Co. Ltd. | 69,300 | 2,896 | ||||||
| The Procter & Gamble Co. | 29,565 | 2,566 | ||||||
| British American Tobacco PLC | 43,300 | 2,487 | ||||||
| Shiseido Co. Ltd. | 90,600 | 2,340 | ||||||
| Diageo PLC | 81,785 | 2,182 | ||||||
| Danone SA | 29,732 | 2,059 | ||||||
| The Coca-Cola Co. | 45,190 | 1,916 | ||||||
| Philip Morris International, Inc. | 18,820 | 1,815 | ||||||
| Mondelez International, Inc., Class A | 28,800 | 1,294 | ||||||
| Japan Tobacco, Inc. | 30,100 | 1,146 | ||||||
| Nestle SA (ADR) | 4,300 | 312 | ||||||
| Tate & Lyle PLC | 17,201 | 164 | ||||||
| 46,555 | ||||||||
| Energy - 7.9% | ||||||||
| Royal Dutch Shell PLC, Class B (ADR) | 128,195 | 6,706 | ||||||
| Chevron Corp. | 61,394 | 6,431 | ||||||
| Occidental Petroleum Corp. | 85,995 | 6,270 | ||||||
| 74 | Private Client Services Funds |
Capital Group Global Equity Fund
Schedule of investments
October 31, 2016
| Common Stocks - continued | Shares | Value (000) | ||||||
| Energy - continued | ||||||||
| Enbridge, Inc. | 115,635 | $ | 4,993 | |||||
| Exxon Mobil Corp. | 52,125 | 4,343 | ||||||
| Schlumberger Ltd. | 37,986 | 2,972 | ||||||
| EOG Resources, Inc. | 30,145 | 2,726 | ||||||
| Total SA | 38,580 | 1,851 | ||||||
| Helmerich & Payne, Inc. | 22,725 | 1,434 | ||||||
| ConocoPhillips | 11,300 | 491 | ||||||
| 38,217 | ||||||||
| Telecommunication Services - 3.9% | ||||||||
| NTT DOCOMO, Inc. | 52,900 | 1,332 | ||||||
| Singapore Telecommunications Ltd. | 2,454,400 | 6,845 | ||||||
| SoftBank Group Corp. | 122,800 | 7,731 | ||||||
| Verizon Communications, Inc. | 15,465 | 744 | ||||||
| Vodafone Group PLC | 827,135 | 2,276 | ||||||
| 18,928 | ||||||||
| Materials - 2.9% | ||||||||
| Asahi Kasei Corp. | 392,000 | 3,543 | ||||||
| The Dow Chemical Co. | 64,030 | 3,445 | ||||||
| Monsanto Co. | 28,050 | 2,827 | ||||||
| Air Liquide SA | 10,863 | 1,105 | ||||||
| Praxair, Inc. | 9,345 | 1,094 | ||||||
| Givaudan SA | 555 | 1,074 | ||||||
| Rio Tinto PLC | 24,242 | 843 | ||||||
| 13,931 | ||||||||
| Real Estate - 2.6% | ||||||||
| American Tower Corp. | 42,500 | 4,980 | ||||||
| Crown Castle International Corp. | 48,475 | 4,411 | ||||||
| Deutsche Wohnen AG | 73,083 | 2,384 | ||||||
| Link REIT | 98,000 | 699 | ||||||
| 12,474 | ||||||||
| Utilities - 2.3% | ||||||||
| SSE PLC | 208,350 | 4,057 | ||||||
| AES Corp. | 251,550 | 2,961 | ||||||
| Sempra Energy | 22,680 | 2,429 | ||||||
| National Grid PLC | 121,990 | 1,590 | ||||||
| 11,037 | ||||||||
| Total common stocks (cost: $391,825,000) | 468,535 | |||||||
| Short-term securities - 2.5% | Principal amount (000) | |||||||
| General Electric Co., 0.01%, November 01, 20163 | $ | 4,950 | 4,950 | |||||
| Private Client Services Funds | 75 |
Capital Group Global Equity Fund
Schedule of investments
October 31, 2016
| Short-term securities - continued | Principal amount (000) | Value (000) | ||||||
| Paccar Financial Corp., 0.45%, November 21, 20163 | $ | 7,000 | $ | 6,998 | ||||
| Total short-term securities (cost: $11,948,000) | 11,948 | |||||||
| Total investment securities (cost: $403,773,000) | 480,483 | |||||||
| Other assets less liabilities | 1,114 | |||||||
| Net assets | $ | 481,597 | ||||||
| 1 | Non-income producing security. |
| 2 | Acquired in a transaction exempt from registration under Rule 144A or section 4(2) of the Securities Act of 1933. May be resold in the U.S. in transactions exempt from registration, normally to qualified institutional buyers. At October 31, 2016, the aggregate market value of this security amounted to $786,000, representing 0.16% of net assets. |
| 3 | Zero coupon bond; interest rate represents current yield to maturity. |
Key to abbreviation
ADR - American Depositary Receipts
See Notes to Financial Statements
| 76 | Private Client Services Funds |
Capital Group International Equity Fund
October 31, 2016
Growth of $25,000 investment
Here’s how a $25,000 investment in the Capital Group International Equity Fund grew between April 1, 2011, when the fund began operations, and October 31, 2016, the end of the fund’s fiscal year.
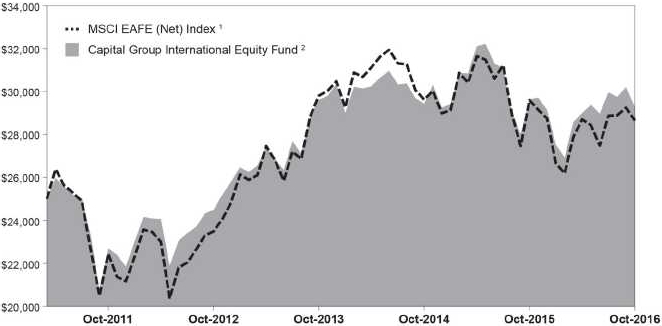
| 1 | The index is unmanaged, and its results include reinvested distributions but do not reflect the effect of sales charges, commissions, or expenses. Index returns are net of foreign withholding dividends. |
| 2 | Includes reinvested dividends and capital gain distributions. |
Results are for past periods and are not predictive of results for future periods. Current and future results may be lower or higher than those shown. Share price and returns will vary so investors may lose money. The results shown are before taxes on fund distributions and sale of fund shares.
Investment portfolio – sector diversification
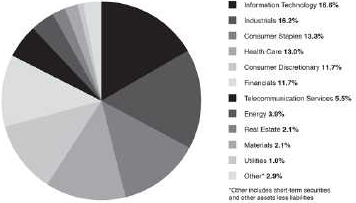
| Private Client Services Funds | 77 |
Capital Group International Equity Fund
October 31, 2016
Investment portfolio - country diversification
| Country | (percent of net assets) | |||
| Japan | 24.1 | % | ||
| Britain | 16.3 | |||
| France | 13.4 | |||
| Switzerland | 7.4 | |||
| Denmark | 5.7 | |||
| Hong Kong | 5.5 | |||
| Germany | 4.3 | |||
| Netherlands | 3.7 | |||
| Sweden | 2.6 | |||
| Taiwan | 1.9 | |||
| Luxembourg | 1.9 | |||
| Canada | 1.7 | |||
| Finland | 1.6 | |||
| Spain | 1.6 | |||
| Australia | 1.2 | |||
| Singapore | 0.9 | |||
| India | 0.8 | |||
| Ireland | 0.8 | |||
| United States | 0.7 | |||
| South Africa | 0.4 | |||
| Norway | 0.4 | |||
| Macau | 0.2 | |||
| Short-term securities & other assets less liabilities | 2.9 | |||
| 78 | Private Client Services Funds |
Capital Group International Equity Fund
Schedule of investments
October 31, 2016
| Common Stocks - 96.8% | Shares | Value (000) | ||||||
| Information Technology - 16.6% | ||||||||
| Keyence Corp. | 70,200 | $ | 51,584 | |||||
| Murata Manufacturing Co. Ltd. | 225,000 | 31,475 | ||||||
| Hamamatsu Photonics K.K. | 964,500 | 29,247 | ||||||
| ASML Holding NV | 243,531 | 25,798 | ||||||
| Taiwan Semiconductor Manufacturing Co. Ltd. (ADR) | 829,500 | 25,797 | ||||||
| SAP SE | 248,937 | 21,927 | ||||||
| Amadeus IT Group SA | 372,921 | 17,603 | ||||||
| Gemalto NV | 162,866 | 8,856 | ||||||
| Oracle Corp. | 116,200 | 6,338 | ||||||
| Trend Micro, Inc. | 121,900 | 4,301 | ||||||
| Yahoo Japan Corp. | 1,003,400 | 3,856 | ||||||
| 226,782 | ||||||||
| Industrials - 16.2% | ||||||||
| SMC Corp. | 105,000 | 30,528 | ||||||
| FANUC Corp. | 144,800 | 27,173 | ||||||
| Safran SA | 357,317 | 24,566 | ||||||
| Assa Abloy AB, Class B | 1,198,516 | 21,802 | ||||||
| Jardine Matheson Holdings Ltd. | 295,000 | 17,968 | ||||||
| Airbus Group SE | 219,463 | 13,046 | ||||||
| Sydney Airport | 2,360,400 | 11,240 | ||||||
| Nidec Corp. | 107,000 | 10,377 | ||||||
| Zodiac Aerospace | 396,278 | 9,644 | ||||||
| DKSH Holding AG Ltd. | 124,581 | 8,637 | ||||||
| Hoshizaki Corp. | 91,600 | 8,280 | ||||||
| China Everbright International Ltd. | 6,484,390 | 7,776 | ||||||
| AA PLC | 2,290,115 | 7,179 | ||||||
| Brenntag AG | 106,443 | 5,690 | ||||||
| Kubota Corp. | 341,900 | 5,524 | ||||||
| Canadian National Railway Co. | 75,200 | 4,728 | ||||||
| Siemens AG | 39,338 | 4,467 | ||||||
| Glory Ltd. | 87,500 | 2,899 | ||||||
| 221,524 | ||||||||
| Consumer Staples - 13.3% | ||||||||
| Pernod Ricard SA | 220,149 | 26,185 | ||||||
| Nestle SA | 289,820 | 21,014 | ||||||
| L’Oreal SA | 116,650 | 20,879 | ||||||
| British American Tobacco PLC | 320,900 | 18,427 | ||||||
| Carlsberg A/S, Class B | 202,653 | 18,274 | ||||||
| Diageo PLC | 650,445 | 17,352 | ||||||
| Imperial Brands PLC | 330,554 | 16,004 | ||||||
| Unilever PLC | 291,500 | 12,195 | ||||||
| Reckitt Benckiser Group PLC | 96,500 | 8,638 | ||||||
| Danone SA | 119,662 | 8,286 | ||||||
| Associated British Foods PLC | 220,050 | 6,631 | ||||||
| Japan Tobacco, Inc. | 101,900 | 3,881 | ||||||
| PZ Cussons PLC | 888,415 | 3,642 | ||||||
| 181,408 | ||||||||
| Private Client Services Funds | 79 |
Capital Group International Equity Fund
Schedule of investments
October 31, 2016
| Common Stocks - continued | Shares | Value (000) | ||||||
| Health Care - 12.7% | ||||||||
| Roche Holding AG | 135,286 | $ | 31,103 | |||||
| Novo Nordisk A/S, Class B | 828,024 | 29,622 | ||||||
| Genmab A/S1 | 178,209 | 29,404 | ||||||
| Astrazeneca PLC | 492,635 | 27,665 | ||||||
| Sysmex Corp. | 284,400 | 19,770 | ||||||
| Essilor International SA | 117,670 | 13,227 | ||||||
| Medtronic PLC | 128,400 | 10,532 | ||||||
| Novartis AG | 118,987 | 8,465 | ||||||
| Sonova Holding AG | 27,198 | 3,647 | ||||||
| 173,435 | ||||||||
| Consumer Discretionary - 11.7% | ||||||||
| SES SA | 1,107,640 | 25,473 | ||||||
| Ryohin Keikaku Co. Ltd. | 108,700 | 23,260 | ||||||
| Liberty Global PLC, Class A1 | 609,575 | 19,872 | ||||||
| Cie Financiere Richemont SA | 229,652 | 14,772 | ||||||
| Kering | 46,353 | 10,281 | ||||||
| BCA Marketplace PLC | 4,584,668 | 10,115 | ||||||
| LVMH Moet Hennessy Louis Vuitton SE | 53,426 | 9,709 | ||||||
| Samsonite International SA | 3,055,200 | 9,592 | ||||||
| Modern Times Group MTG AB, B Shares | 238,889 | 6,432 | ||||||
| Bayerische Motoren Werke AG | 72,819 | 6,345 | ||||||
| WPP PLC | 277,040 | 6,029 | ||||||
| Denso Corp. | 125,700 | 5,472 | ||||||
| Naspers Ltd. (ADR), N Shares | 302,500 | 5,112 | ||||||
| Wynn Macau Ltd. | 2,190,200 | 3,361 | ||||||
| Greene King PLC | 290,350 | 2,600 | ||||||
| Liberty Global PLC, Series C1 | 48,000 | 1,526 | ||||||
| 159,951 | ||||||||
| Financials - 11.7% | ||||||||
| AIA Group Ltd. | 6,341,000 | 40,022 | ||||||
| Sampo Oyj, A Shares | 485,775 | 22,274 | ||||||
| BNP Paribas SA | 298,036 | 17,288 | ||||||
| Prudential PLC | 903,870 | 14,764 | ||||||
| Lloyds Banking Group PLC | 17,113,300 | 11,994 | ||||||
| HDFC Bank Ltd. (ADR) | 156,400 | 11,070 | ||||||
| Svenska Handelsbanken AB, A Shares | 529,357 | 7,221 | ||||||
| ABN AMRO Group NV2 | 269,005 | 6,209 | ||||||
| Sumitomo Mitsui Financial Group, Inc. | 166,700 | 5,807 | ||||||
| ING Groep NV | 408,805 | 5,383 | ||||||
| DBS Group Holdings Ltd. | 473,655 | 5,107 | ||||||
| DNB ASA | 346,768 | 5,015 | ||||||
| UBS Group AG | 325,245 | 4,601 | ||||||
| Henderson Group PLC | 862,110 | 2,445 | ||||||
| 159,200 | ||||||||
| Telecommunication Services - 5.5% | ||||||||
| SoftBank Group Corp. | 383,100 | 24,118 | ||||||
| Vodafone Group PLC | 6,901,290 | 18,989 | ||||||
| NTT DOCOMO, Inc. | 545,200 | 13,728 | ||||||
| 80 | Private Client Services Funds |
Capital Group International Equity Fund
Schedule of investments
October 31, 2016
| Common Stocks - continued | Shares | Value (000) | ||||||
| Telecommunication Services - continued | ||||||||
| KDDI Corp. | 371,200 | $ | 11,298 | |||||
| Singapore Telecommunications Ltd. | 2,740,400 | 7,643 | ||||||
| 75,776 | ||||||||
| Energy - 3.9% | ||||||||
| Total SA | 502,901 | 24,136 | ||||||
| Enbridge, Inc. | 425,700 | 18,382 | ||||||
| Oil Search Ltd. | 1,147,819 | 5,815 | ||||||
| Royal Dutch Shell PLC, Class B | 184,090 | 4,766 | ||||||
| 53,099 | ||||||||
| Real Estate - 2.1% | ||||||||
| Deutsche Wohnen AG | 626,480 | 20,439 | ||||||
| Link REIT | 1,240,500 | 8,845 | ||||||
| 29,284 | ||||||||
| Materials - 2.1% | ||||||||
| Asahi Kasei Corp. | 1,185,000 | 10,710 | ||||||
| Givaudan SA | 4,262 | 8,248 | ||||||
| Air Liquide SA | 52,738 | 5,365 | ||||||
| Rio Tinto PLC | 107,490 | 3,736 | ||||||
| 28,059 | ||||||||
| Utilities - 1.0% | ||||||||
| National Grid PLC | 996,770 | 12,994 | ||||||
| 12,994 | ||||||||
| Total common stocks (cost: $1,181,277,000) | 1,321,512 | |||||||
| Preferred Securities - 0.3% | ||||||||
| Health Care - 0.3% | ||||||||
| Grifols SA, Class B | 272,114 | 3,925 | ||||||
| Total preferred securities (cost: $4,466,000) | 3,925 | |||||||
| Short-term securities - 2.8% | Principal amount (000) | |||||||
| General Electric Co., 0.01%, November 01, 20163 | $ | 38,900 | 38,900 | |||||
| Total short-term securities (cost: $38,900,000) | 38,900 | |||||||
| Private Client Services Funds | 81 |
Capital Group International Equity Fund
Schedule of investments
October 31, 2016
| Short-term securities - continued | Value (000) | |||
| Total investment securities (cost: $1,224,643,000) | 1,364,337 | |||
| Other assets less liabilities | 1,250 | |||
| Net assets | $ | 1,365,587 | ||
| 1 | Non-income producing security. |
| 2 | Acquired in a transaction exempt from registration under Rule 144A or section 4(2) of the Securities Act of 1933. May be resold in the U.S. in transactions exempt from registration, normally to qualified institutional buyers. At October 31, 2016, the aggregate market value of this secuity amounted to $6,209,000, representing 0.45% of net assets. |
| 3 | Zero coupon bond; interest rate represents current yield to maturity. |
Key to abbreviation
ADR - American Depositary Receipts
See Notes to Financial Statements
| 82 | Private Client Services Funds |
Capital Group U.S. Equity Fund
October 31, 2016
Growth of $25,000 investment
Here’s how a $25,000 investment in the Capital Group U.S. Equity Fund grew between April 1, 2011, when the fund began operations, and October 31, 2016, the end of the fund’s fiscal year.
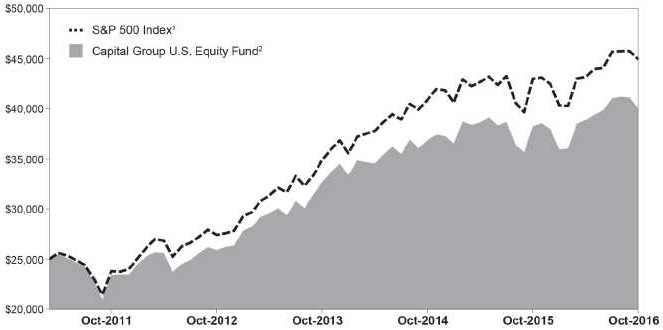
| 1 | The index is unmanaged, and its results include reinvested distributions but do not reflect the effect of sales charges, commissions, or expenses. |
| 2 | Includes reinvested dividends and capital gain distributions. |
Results are for past periods and are not predictive of results for future periods. Current and future results may be lower or higher than those shown. Share price and returns will vary so investors may lose money. The results shown are before taxes on fund distributions and sale of fund shares.
Investment portfolio – sector diversification
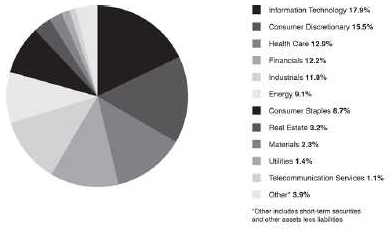
| Private Client Services Funds | 83 |
Capital Group U.S. Equity Fund
Schedule of investments
October 31, 2016
| Common Stocks - 96.1% | Shares | Value (000) | ||||||
| Information Technology - 17.9% | ||||||||
| Visa, Inc., A Shares | 63,880 | $ | 5,271 | |||||
| Microsoft Corp. | 81,095 | 4,859 | ||||||
| Jack Henry & Associates, Inc. | 50,820 | 4,117 | ||||||
| Texas Instruments, Inc. | 50,900 | 3,606 | ||||||
| Automatic Data Processing, Inc. | 37,090 | 3,229 | ||||||
| Apple, Inc. | 27,910 | 3,169 | ||||||
| Broadcom Ltd. | 17,631 | 3,002 | ||||||
| Analog Devices, Inc. | 34,655 | 2,221 | ||||||
| International Business Machines Corp. | 10,145 | 1,559 | ||||||
| HP, Inc. | 102,400 | 1,484 | ||||||
| Alphabet, Inc., Class C1 | 1,857 | 1,457 | ||||||
| Xilinx, Inc. | 15,945 | 811 | ||||||
| Accenture PLC, Class A | 5,700 | 663 | ||||||
| ASML Holding NV | 4,825 | 510 | ||||||
| Trimble, Inc.1 | 17,005 | 470 | ||||||
| Jabil Circuit, Inc. | 18,540 | 396 | ||||||
| Alphabet, Inc., Class A1 | 450 | 365 | ||||||
| VeriSign, Inc.1 | 3,240 | 272 | ||||||
| 37,461 | ||||||||
| Consumer Discretionary - 15.5% | ||||||||
| Newell Brands, Inc. | 107,400 | 5,157 | ||||||
| Comcast Corp., Class A | 67,375 | 4,165 | ||||||
| Starbucks Corp. | 61,415 | 3,259 | ||||||
| Charter Communications, Inc. Class A1 | 12,206 | 3,050 | ||||||
| Amazon.com, Inc.1 | 3,101 | 2,449 | ||||||
| Panera Bread Co., Class A1 | 12,145 | 2,317 | ||||||
| Advance Auto Parts, Inc. | 16,070 | 2,251 | ||||||
| Yum! Brands, Inc. | 22,100 | 1,907 | ||||||
| Dollar General Corp. | 25,610 | 1,769 | ||||||
| NIKE, Inc., Class B | 27,180 | 1,364 | ||||||
| Scripps Networks Interactive, Inc., Class A | 18,694 | 1,203 | ||||||
| Carnival Corp. | 21,650 | 1,063 | ||||||
| Norwegian Cruise Line Holdings Ltd.1 | 27,185 | 1,057 | ||||||
| The Priceline Group, Inc.1 | 685 | 1,010 | ||||||
| The Home Depot, Inc. | 4,276 | 522 | ||||||
| 32,543 | ||||||||
| Health Care - 12.9% | ||||||||
| Medtronic PLC | 45,700 | 3,748 | ||||||
| Cerner Corp.1 | 56,765 | 3,325 | ||||||
| Express Scripts Holding Co.1 | 40,500 | 2,730 | ||||||
| Danaher Corp. | 32,955 | 2,589 | ||||||
| Aetna, Inc. | 23,135 | 2,483 | ||||||
| UnitedHealth Group, Inc. | 15,060 | 2,128 | ||||||
| Gilead Sciences, Inc. | 25,664 | 1,890 | ||||||
| Eli Lilly & Co. | 23,850 | 1,761 | ||||||
| AmerisourceBergen Corp. | 21,700 | 1,526 | ||||||
| Incyte Corp.1 | 16,800 | 1,461 | ||||||
| Johnson & Johnson | 7,280 | 844 | ||||||
| Illumina, Inc.1 | 5,455 | 743 | ||||||
| AstraZeneca PLC (ADR) | 18,600 | 527 | ||||||
| 84 | Private Client Services Funds |
Capital Group U.S. Equity Fund
Schedule of investments
October 31, 2016
| Common Stocks - continued | Shares | Value (000) | ||||||
| Health Care - continued | ||||||||
| Roche Holding AG (ADR) | 14,700 | $ | 421 | |||||
| Novo Nordisk A/S (ADR) | 10,460 | 372 | ||||||
| Ultragenyx Pharmaceutical, Inc.1 | 4,100 | 242 | ||||||
| DaVita, Inc.1 | 3,340 | 196 | ||||||
| 26,986 | ||||||||
| Financials - 12.2% | ||||||||
| Marsh & McLennan Cos., Inc. | 71,400 | 4,526 | ||||||
| Chubb Ltd. | 33,240 | 4,221 | ||||||
| CME Group, Inc. | 30,425 | 3,046 | ||||||
| JPMorgan Chase & Co. | 43,480 | 3,011 | ||||||
| Wells Fargo & Co. | 63,260 | 2,911 | ||||||
| The Goldman Sachs Group, Inc. | 10,480 | 1,868 | ||||||
| Aon PLC | 16,700 | 1,851 | ||||||
| Moody’s Corp. | 14,155 | 1,423 | ||||||
| New York Community Bancorp, Inc. | 82,750 | 1,188 | ||||||
| The Bank of New York Mellon Corp. | 21,880 | 947 | ||||||
| The PNC Financial Services Group, Inc. | 6,490 | 620 | ||||||
| 25,612 | ||||||||
| Industrials - 11.8% | ||||||||
| Waste Connections, Inc. | 57,500 | 4,324 | ||||||
| Norfolk Southern Corp. | 34,382 | 3,197 | ||||||
| Hexcel Corp. | 49,835 | 2,267 | ||||||
| The Boeing Co. | 14,785 | 2,106 | ||||||
| Eaton Corp. PLC | 30,270 | 1,930 | ||||||
| TransDigm Group, Inc.1 | 6,635 | 1,808 | ||||||
| Northrop Grumman Corp. | 7,230 | 1,656 | ||||||
| IDEX Corp. | 16,800 | 1,452 | ||||||
| General Electric Co. | 45,050 | 1,311 | ||||||
| Nielsen Holdings PLC | 28,425 | 1,280 | ||||||
| Waste Management, Inc. | 17,940 | 1,178 | ||||||
| Canadian National Railway Co. | 12,150 | 764 | ||||||
| Lockheed Martin Corp. | 2,075 | 511 | ||||||
| CH Robinson Worldwide, Inc. | 6,785 | 462 | ||||||
| Union Pacific Corp. | 4,600 | 406 | ||||||
| 24,652 | ||||||||
| Energy - 9.1% | ||||||||
| Enbridge, Inc. | 97,590 | 4,213 | ||||||
| Occidental Petroleum Corp. | 43,145 | 3,146 | ||||||
| Schlumberger Ltd. | 40,054 | 3,134 | ||||||
| Chevron Corp. | 27,240 | 2,853 | ||||||
| Exxon Mobil Corp. | 22,500 | 1,875 | ||||||
| EOG Resources, Inc. | 16,665 | 1,507 | ||||||
| ConocoPhillips | 32,665 | 1,419 | ||||||
| Halliburton Co. | 20,400 | 938 | ||||||
| 19,085 | ||||||||
| Private Client Services Funds | 85 |
Capital Group U.S. Equity Fund
Schedule of investments
October 31, 2016
| Common Stocks - continued | Shares | Value (000) | ||||||
| Consumer Staples - 8.7% | ||||||||
| The Procter & Gamble Co. | 52,600 | $ | 4,566 | |||||
| Philip Morris International, Inc. | 36,305 | 3,501 | ||||||
| Diageo PLC (ADR) | 31,780 | 3,417 | ||||||
| Nestle SA (ADR) | 29,205 | 2,122 | ||||||
| Unilever PLC (ADR) | 46,140 | 1,923 | ||||||
| The Coca-Cola Co. | 38,020 | 1,612 | ||||||
| Mondelez International, Inc., Class A | 13,000 | 584 | ||||||
| Reckitt Benckiser Group PLC (ADR) | 26,660 | 486 | ||||||
| 18,211 | ||||||||
| Real Estate - 3.2% | ||||||||
| Crown Castle International Corp. | 29,135 | 2,651 | ||||||
| American Tower Corp. | 19,750 | 2,315 | ||||||
| Iron Mountain, Inc. | 50,969 | 1,719 | ||||||
| 6,685 | ||||||||
| Materials - 2.3% | ||||||||
| Monsanto Co. | 24,400 | 2,459 | ||||||
| Praxair, Inc. | 16,770 | 1,963 | ||||||
| Sherwin-Williams Co. | 1,810 | 443 | ||||||
| 4,865 | ||||||||
| Utilities - 1.4% | ||||||||
| Sempra Energy | 28,255 | 3,026 | ||||||
| 3,026 | ||||||||
| Telecommunication Services - 1.1% | ||||||||
| Verizon Communications, Inc. | 49,600 | 2,386 | ||||||
| 2,386 | ||||||||
| Total common stocks (cost: $157,890,000) | 201,512 | |||||||
| Short-term securities - 3.9% | Principal amount (000) | |||||||
| Deere John Corp., Inc., 0.46%, November 02, 20162 | $ | 3,100 | 3,100 | |||||
| General Electric Co., 0.01%, November 01, 20162 | 4,300 | 4,300 | ||||||
| Private Exp. Funding, 0.48%, November 15, 20162 | 800 | 800 | ||||||
| Total short-term securities (cost: $8,200,000) | 8,200 | |||||||
| 86 | Private Client Services Funds |
Capital Group U.S. Equity Fund
Schedule of investments
October 31, 2016
| Total investment securities (cost: $166,090,000) | 209,712 | |||||||
| Other assets less liabilities | (52 | ) | ||||||
| Net assets | $ | 209,660 |
| 1 | Non-income producing security. |
| 2 | Zero coupon bond; interest rate represents current yield to maturity. |
Key to abbreviation
ADR - American Depositary Receipts
See Notes to Financial Statements
| Private Client Services Funds | 87 |
Capital Group Core Municipal Fund
Statement of assets and liabilities
at October 31, 2016
(dollars and shares in thousands, except per share amounts)
| Assets: | ||||||||
| Investment securities, at value (cost: $376,332) | $ | 385,082 | ||||||
| Short-term investments, at value (cost: $23,220) | 23,220 | |||||||
| Cash | 2,990 | |||||||
| Receivables for: | ||||||||
| Interest | 4,171 | |||||||
| 4,171 | ||||||||
| Total assets | 415,463 | |||||||
| Liabilities: | ||||||||
| Payables for: | ||||||||
| Purchases of investments | 9,500 | |||||||
| Repurchases of fund’s shares | 117 | |||||||
| Investment advisory services | 356 | |||||||
| Other accrued expenses | 100 | |||||||
| Total liabilities | 10,073 | |||||||
| Net assets at October 31, 2016: | $ | 405,390 | ||||||
| Net assets consist of: | ||||||||
| Capital paid in on shares of beneficial interest | $ | 396,496 | ||||||
| Undistributed net investment income | — | |||||||
| Accumulated net realized gain | 144 | |||||||
| Net unrealized appreciation | 8,750 | |||||||
| Net assets at October 31, 2016 | $ | 405,390 | ||||||
| Shares outstanding: | 38,667 | |||||||
| Net asset value per share: | $ | 10.48 |
See Notes to Financial Statements
| 88 | Private Client Services Funds |
Capital Group Core Municipal Fund
Statement of operations
for the year ended October 31, 2016
(dollars in thousands)
| Investment income: | ||||||||
| Income: | ||||||||
| Interest | $ | 9,318 | ||||||
| Fees and expenses: | ||||||||
| Investment advisory services | 1,374 | |||||||
| Administrative and accounting services | 108 | |||||||
| Registration fees | 22 | |||||||
| Audit and tax fees | 37 | |||||||
| Transfer agent services | 21 | |||||||
| Trustees’ compensation | 23 | |||||||
| Other | 12 | |||||||
| Total fees and expenses before reimbursements | 1,597 | |||||||
| Less reimbursements of fees and expenses | 19 | |||||||
| Total fees and expenses after reimbursements | 1,578 | |||||||
| Net investment income | 7,740 | |||||||
| Net realized gain and unrealized depreciation on investments: | ||||||||
| Net realized gain on investments | 178 | |||||||
| Net unrealized depreciation on investments | (306 | ) | ||||||
| Net realized gain and unrealized depreciation on investments | (128 | ) | ||||||
| Net increase in net assets resulting from operations | $ | 7,612 |
See Notes to Financial Statements
| Private Client Services Funds | 89 |
Capital Group Core Municipal Fund
Statements of changes in net assets
(dollars in thousands)
| For the year | For the year | |||||||
| ended 10/31/16 | ended 10/31/15 | |||||||
| Operations: | ||||||||
| Net investment income | $ | 7,740 | $ | 7,171 | ||||
| Net realized gain on investments | 178 | 460 | ||||||
| Net unrealized depreciation on investments | (306 | ) | (2,748 | ) | ||||
| Net increase in net assets resulting from operations | 7,612 | 4,883 | ||||||
| Dividends and distributions to shareholders: | ||||||||
| Dividends from net investment income | (7,721 | ) | (7,173 | ) | ||||
| Distributions from capital gain | (303 | ) | — | |||||
| Total dividends and distributions | (8,024 | ) | (7,173 | ) | ||||
| Net capital share transactions | 26,646 | 40,374 | ||||||
| Total increase in net assets | 26,234 | 38,084 | ||||||
| Net assets: | ||||||||
| Beginning of year | 379,156 | 341,072 | ||||||
| End of year (including undistributed net investment income: $– and $–, respectively.) | $ | 405,390 | $ | 379,156 | ||||
See Notes to Financial Statements
| 90 | Private Client Services Funds |
Capital Group Short-Term Municipal Fund
Statement of assets and liabilities
at October 31, 2016
(dollars and shares in thousands, except per share amounts)
| Assets: | ||||||||
| Investment securities, at value (cost: $155,150) | $ | 155,797 | ||||||
| Short-term investments, at value (cost: $21,500) | 21,500 | |||||||
| Cash | 2,818 | |||||||
| Receivables for: | ||||||||
| Interest | 1,578 | |||||||
| Reimbursement from investment adviser | 10 | |||||||
| 1,588 | ||||||||
| Prepaid expenses | — | * | ||||||
| Total assets | 181,703 | |||||||
| Liabilities: | ||||||||
| Payables for: | ||||||||
| Purchases of investments | 1,836 | |||||||
| Repurchases of fund’s shares | 1,045 | |||||||
| Investment advisory services | 154 | |||||||
| Other accrued expenses | 74 | |||||||
| Total liabilities | 3,109 | |||||||
| Net assets at October 31, 2016: | $ | 178,594 | ||||||
| Net assets consist of: | ||||||||
| Capital paid in on shares of beneficial interest | $ | 177,916 | ||||||
| Undistributed net investment income | — | |||||||
| Accumulated net realized gain | 31 | |||||||
| Net unrealized appreciation | 647 | |||||||
| Net assets at October 31, 2016 | $ | 178,594 | ||||||
| Shares outstanding: | 17,664 | |||||||
| Net asset value per share: | $ | 10.11 | ||||||
| * | Amount less than one thousand. |
See Notes to Financial Statements
| Private Client Services Funds | 91 |
Capital Group Short-Term Municipal Fund
Statement of operations
for the year ended October 31, 2016
(dollars in thousands)
| Investment income: | ||||||||
| Income: | ||||||||
| Interest | $ | 2,505 | ||||||
| Fees and expenses: | ||||||||
| Investment advisory services | 566 | |||||||
| Administrative and accounting services | 45 | |||||||
| Registration fees | 19 | |||||||
| Audit and tax fees | 37 | |||||||
| Transfer agent services | 20 | |||||||
| Trustees’ compensation | 23 | |||||||
| Other | 13 | |||||||
| Total fees and expenses before reimbursements | 723 | |||||||
| Less reimbursements of fees and expenses | 66 | |||||||
| Total fees and expenses after reimbursements | 657 | |||||||
| Net investment income | 1,848 | |||||||
| Net realized gain and unrealized depreciation on investments: | ||||||||
| Net realized gain on investments | 91 | |||||||
| Net unrealized depreciation on investments | (385 | ) | ||||||
| Net realized gain and unrealized depreciation on investments | (294 | ) | ||||||
| Net increase in net assets resulting from operations | $ | 1,554 |
See Notes to Financial Statements
| 92 | Private Client Services Funds |
Capital Group Short-Term Municipal Fund
Statements of changes in net assets
(dollars in thousands)
| For the year | For the year | |||||||
| ended 10/31/16 | ended 10/31/15 | |||||||
| Operations: | ||||||||
| Net investment income | $ | 1,848 | $ | 1,731 | ||||
| Net realized gain on investments | 91 | 45 | ||||||
| Net unrealized depreciation on investments | (385 | ) | (903 | ) | ||||
| Net increase in net assets resulting from operations | 1,554 | 873 | ||||||
| Dividends and distributions to shareholders: | ||||||||
| Dividends from net investment income | (1,846 | ) | (1,733 | ) | ||||
| Distributions from capital gain | (21 | ) | (67 | ) | ||||
| Total dividends and distributions | (1,867 | ) | (1,800 | ) | ||||
| Net capital share transactions | 36,596 | (12,105 | ) | |||||
| Total increase (decrease) in net assets | 36,283 | (13,032 | ) | |||||
| Net assets: | ||||||||
| Beginning of year | 142,311 | 155,343 | ||||||
| End of year (including undistributed net investment income: $– and $–, respectively.) | $ | 178,594 | $ | 142,311 | ||||
See Notes to Financial Statements
| Private Client Services Funds | 93 |
Capital Group California Core Municipal Fund
Statement of assets and liabilities
at October 31, 2016
(dollars and shares in thousands, except per share amounts)
| Assets: | ||||||||
| Investment securities, at value (cost: $304,431) | $ | 315,070 | ||||||
| Short-term investments, at value (cost: $16,420) | 16,420 | |||||||
| Cash | 2,843 | |||||||
| Receivables for: | ||||||||
| Interest | 3,014 | |||||||
| 3,014 | ||||||||
| Prepaid expenses | 1 | |||||||
| Total assets | 337,348 | |||||||
| Liabilities: | ||||||||
| Payables for: | ||||||||
| Purchases of investments | 783 | |||||||
| Repurchases of fund’s shares | 9 | |||||||
| Investment advisory services | 294 | |||||||
| Other accrued expenses | 93 | |||||||
| Total liabilities | 1,179 | |||||||
| Net assets at October 31, 2016: | $ | 336,169 | ||||||
| Net assets consist of: | ||||||||
| Capital paid in on shares of beneficial interest | $ | 325,247 | ||||||
| Undistributed net investment income | — | |||||||
| Accumulated net realized gain | 283 | |||||||
| Net unrealized appreciation | 10,639 | |||||||
| Net assets at October 31, 2016 | $ | 336,169 | ||||||
| Shares outstanding: | 31,442 | |||||||
| Net asset value per share: | $ | 10.69 |
See Notes to Financial Statements
| 94 | Private Client Services Funds |
Capital Group California Core Municipal Fund
Statement of operations
for the year ended October 31, 2016
(dollars in thousands)
| Investment income: | ||||||||
| Income: | ||||||||
| Interest | $ | 7,335 | ||||||
| Fees and expenses: | ||||||||
| Investment advisory services | 1,122 | |||||||
| Administrative and accounting services | 88 | |||||||
| Registration fees | 7 | |||||||
| Audit and tax fees | 37 | |||||||
| Transfer agent services | 20 | |||||||
| Trustees’ compensation | 23 | |||||||
| Other | 13 | |||||||
| Total fees and expenses before reimbursements | 1,310 | |||||||
| Less reimbursements of fees and expenses | 19 | |||||||
| Total fees and expenses after reimbursements | 1,291 | |||||||
| Net investment income | 6,044 | |||||||
| Net realized gain and unrealized appreciation on investments: | ||||||||
| Net realized gain on investments | 378 | |||||||
| Net unrealized appreciation on investments | 2,381 | |||||||
| Net realized gain and unrealized appreciation on investments | 2,759 | |||||||
| Net increase in net assets resulting from operations | $ | 8,803 |
See Notes to Financial Statements
| Private Client Services Funds | 95 |
Capital Group California Core Municipal Fund
Statements of changes in net assets
(dollars in thousands)
| For the year ended 10/31/16 | For the year ended 10/31/15 | |||||||
| Operations: | ||||||||
| Net investment income | $ | 6,044 | $ | 5,753 | ||||
| Net realized gain on investments | 378 | 107 | ||||||
| Net unrealized appreciation (depreciation) on investments | 2,381 | (978 | ) | |||||
| Net increase in net assets resulting from operations | 8,803 | 4,882 | ||||||
| Dividends to shareholders: | ||||||||
| Dividends from net investment income | (6,040 | ) | (5,756 | ) | ||||
| Total dividends | (6,040 | ) | (5,756 | ) | ||||
| Net capital share transactions | 28,412 | 25,954 | ||||||
| Total increase in net assets | 31,175 | 25,080 | ||||||
| Net assets: | ||||||||
| Beginning of year | 304,994 | 279,914 | ||||||
| End of year (including undistributed net investment income: $– and $–,respectively.) | $ | 336,169 | $ | 304,994 | ||||
See Notes to Financial Statements
| 96 | Private Client Services Funds |
Capital Group California Short-Term Municipal Fund
Statement of assets and liabilities
at October 31, 2016
(dollars and shares in thousands, except per share amounts)
| Assets: | ||||||||
| Investment securities, at value (cost: $110,683) | $ | 111,535 | ||||||
| Short-term investments, at value (cost: $2,705) | 2,705 | |||||||
| Cash | 1,542 | |||||||
| Receivables for: | ||||||||
| Sales of investments | 1,490 | |||||||
| Sales of fund’s shares | 213 | |||||||
| Interest | 1,113 | |||||||
| Reimbursement from investment adviser | 11 | |||||||
| 2,827 | ||||||||
| Prepaid expenses | 1 | |||||||
| Total assets | 118,610 | |||||||
| Liabilities: | ||||||||
| Payables for: | ||||||||
| Purchases of investments | 538 | |||||||
| Repurchases of fund’s shares | 46 | |||||||
| Investment advisory services | 105 | |||||||
| Other accrued expenses | 71 | |||||||
| Total liabilities | 760 | |||||||
| Net assets at October 31, 2016: | $ | 117,850 | ||||||
| Net assets consist of: | ||||||||
| Capital paid in on shares of beneficial interest | $ | 116,946 | ||||||
| Undistributed net investment income | — | |||||||
| Accumulated net realized gain | 52 | |||||||
| Net unrealized appreciation | 852 | |||||||
| Net assets at October 31, 2016 | $ | 117,850 | ||||||
| Shares outstanding: | 11,517 | |||||||
| Net asset value per share: | $ | 10.23 |
See Notes to Financial Statements
| Private Client Services Funds | 97 |
Capital Group California Short-Term Municipal Fund
Statement of operations
for the year ended October 31, 2016
(dollars in thousands)
| Investment income: | ||||||||
| Income: | ||||||||
| Interest | $ | 1,607 | ||||||
| Fees and expenses: | ||||||||
| Investment advisory services | 399 | |||||||
| Administrative and accounting services | 31 | |||||||
| Registration fees | 4 | |||||||
| Audit and tax fees | 37 | |||||||
| Transfer agent services | 20 | |||||||
| Trustees’ compensation | 23 | |||||||
| Other | 11 | |||||||
| Total fees and expenses before reimbursements | 525 | |||||||
| Less reimbursements of fees and expenses | 62 | |||||||
| Total fees and expenses after reimbursements | 463 | |||||||
| Net investment income | 1,144 | |||||||
| Net realized gain and unrealized depreciation on investments: | ||||||||
| Net realized gain on investments | 72 | |||||||
| Net unrealized depreciation on investments | (465 | ) | ||||||
| Net realized gain and unrealized depreciation on investments | (393 | ) | ||||||
| Net increase in net assets resulting from operations | $ | 751 |
See Notes to Financial Statements
| 98 | Private Client Services Funds |
Capital Group California Short-Term Municipal Fund
Statements of changes in net assets
(dollars in thousands)
| For the year ended 10/31/16 | For the year ended 10/31/15 | |||||||
| Operations: | ||||||||
| Net investment income | $ | 1,144 | $ | 1,251 | ||||
| Net realized gain on investments | 72 | 162 | ||||||
| Net unrealized depreciation on investments | (465 | ) | (535 | ) | ||||
| Net increase in net assets resulting from operations | 751 | 878 | ||||||
| Dividends and distributions to shareholders: | ||||||||
| Dividends from net investment income | (1,144 | ) | (1,252 | ) | ||||
| Distributions from capital gain | (123 | ) | (48 | ) | ||||
| Total dividends and distributions | (1,267 | ) | (1,300 | ) | ||||
| Net capital share transactions | 6,365 | (25,883 | ) | |||||
| Total increase (decrease) in net assets | 5,849 | (26,305 | ) | |||||
| Net assets: | ||||||||
| Beginning of year | 112,001 | 138,306 | ||||||
| End of year (including undistributed net investment income: $– and $–, respectively.) | $ | 117,850 | $ | 112,001 | ||||
See Notes to Financial Statements
| Private Client Services Funds | 99 |
Capital Group Core Bond Fund
Statement of assets and liabilities
at October 31, 2016
(dollars and shares in thousands, except per share amounts)
| Assets: | ||||||||
| Investment securities, at value (cost: $323,213) | $ | 327,480 | ||||||
| Short-term investments, at value (cost: $26,748) | 26,748 | |||||||
| Cash | 27 | |||||||
| Receivables for: | ||||||||
| Sales of investments | 10,559 | |||||||
| Interest | 1,820 | |||||||
| Reimbursement from investment adviser | 2 | |||||||
| 12,381 | ||||||||
| Prepaid expenses | — | * | ||||||
| Total assets | 366,636 | |||||||
| Liabilities: | ||||||||
| Payables for: | ||||||||
| Purchases of investments | 13,308 | |||||||
| Repurchases of fund’s shares | 639 | |||||||
| Investment advisory services | 309 | |||||||
| Other accrued expenses | 95 | |||||||
| Total liabilities | 14,351 | |||||||
| Net assets at October 31, 2016: | $ | 352,285 | ||||||
| Net assets consist of: | ||||||||
| Capital paid in on shares of beneficial interest | $ | 346,315 | ||||||
| Accumulated undistributed net investment income | 145 | |||||||
| Accumulated net realized gain | 1,558 | |||||||
| Net unrealized appreciation | 4,267 | |||||||
| Net assets at October 31, 2016 | $ | 352,285 | ||||||
| Shares outstanding: | 34,172 | |||||||
| Net asset value per share: | $ | 10.31 | ||||||
| * | Amount less than one thousand. |
See Notes to Financial Statements
| 100 | Private Client Services Funds |
Capital Group Core Bond Fund
Statement of operations
for the year ended October 31, 2016
(dollars in thousands)
| Investment income: | ||||||||
| Income: | ||||||||
| Interest | $ | 6,639 | ||||||
| Fees and expenses: | ||||||||
| Investment advisory services | 1,192 | |||||||
| Administrative and accounting services | 94 | |||||||
| Registration fees | 21 | |||||||
| Audit and tax fees | 37 | |||||||
| Transfer agent services | 21 | |||||||
| Trustees’ compensation | 23 | |||||||
| Other | 4 | |||||||
| Total fees and expenses before reimbursements | 1,392 | |||||||
| Less reimbursements of fees and expenses | 30 | |||||||
| Total fees and expenses after reimbursements | 1,362 | |||||||
| Net investment income | 5,277 | |||||||
| Net realized gain and unrealized appreciation on investments: | ||||||||
| Net realized gain on investments | 1,800 | |||||||
| Net unrealized appreciation on investments | 2,912 | |||||||
| Net realized gain and unrealized appreciation on investments | 4,712 | |||||||
| Net increase in net assets resulting from operations | $ | 9,989 |
See Notes to Financial Statements
| Private Client Services Funds | 101 |
Capital Group Core Bond Fund
Statements of changes in net assets
(dollars in thousands)
| For the year | For the year | |||||||
| ended 10/31/16 | ended 10/31/15 | |||||||
| Operations: | ||||||||
| Net investment income | $ | 5,277 | $ | 5,124 | ||||
| Net realized gain on investments | 1,800 | 1,005 | ||||||
| Net unrealized appreciation (depreciation) on investments | 2,912 | (2,161 | ) | |||||
| Net increase in net assets resulting from operations | 9,989 | 3,968 | ||||||
| Dividends and distributions to shareholders: | ||||||||
| Dividends from net investment income | (5,227 | ) | (5,130 | ) | ||||
| Distributions from capital gain | (922 | ) | (748 | ) | ||||
| Total dividends and distributions | (6,149 | ) | (5,878 | ) | ||||
| Net capital share transactions | 13,891 | 26,219 | ||||||
| Total increase in net assets | 17,731 | 24,309 | ||||||
| Net assets: | ||||||||
| Beginning of year | 334,554 | 310,245 | ||||||
| End of year (including undistributed net investment income: $145 and $62, respectively.) | $ | 352,285 | $ | 334,554 | ||||
See Notes to Financial Statements
| 102 | Private Client Services Funds |
Capital Group Global Equity Fund
Statement of assets and liabilities
at October 31, 2016
(dollars and shares in thousands, except per share amounts)
| Assets: | ||||||||
| Investment securities, at value (cost: $391,825) | $ | 468,535 | ||||||
| Short-term investments, at value (cost: $11,948) | 11,948 | |||||||
| Cash | 32 | |||||||
| Foreign currency, at value (cost: $–)* | — | * | ||||||
| Receivables for: | ||||||||
| Sales of investments | 4,915 | |||||||
| Dividends | 805 | |||||||
| Reimbursement from investment adviser | 2 | |||||||
| 5,722 | ||||||||
| Prepaid expenses | — | * | ||||||
| Total assets | 486,237 | |||||||
| Liabilities: | ||||||||
| Payables for: | ||||||||
| Purchases of investments | 3,484 | |||||||
| Repurchases of fund’s shares | 89 | |||||||
| Unified Management fees | 1,058 | |||||||
| Other accrued expenses | 9 | |||||||
| Total liabilities | 4,640 | |||||||
| Net assets at October 31, 2016: | $ | 481,597 | ||||||
| Net assets consist of: | ||||||||
| Capital paid in on shares of beneficial interest | $ | 399,223 | ||||||
| Accumulated undistributed net investment income | 5,996 | |||||||
| Accumulated net realized loss | (313 | ) | ||||||
| Net unrealized appreciation | 76,691 | |||||||
| Net assets at October 31, 2016 | $ | 481,597 | ||||||
| Shares outstanding: | 38,064 | |||||||
| Net asset value per share: | $ | 12.65 |
| * | Amount less than one thousand. |
See Notes to Financial Statements
| Private Client Services Funds | 103 |
Capital Group Global Equity Fund
Statement of operations
for the year ended October 31, 2016
(dollars in thousands)
| Investment income: | ||||||||
| Income: | ||||||||
| Dividends (net of non-U.S. taxes of $543) | $ | 12,005 | ||||||
| Interest | 86 | 12,091 | ||||||
| Fees and expenses: | ||||||||
| Unified Management fees | 4,123 | |||||||
| Trustees’ compensation | 23 | |||||||
| Legal fees | 2 | |||||||
| Other | — | * | ||||||
| Total fees and expenses before reimbursements | 4,148 | |||||||
| Less reimbursements of fees and expenses | 25 | |||||||
| Total fees and expenses after reimbursements | 4,123 | |||||||
| Net investment income | 7,968 | |||||||
| Net realized gain (loss) and unrealized (depreciation) on investments and currency: | ||||||||
| Net realized gain on investments | 140 | |||||||
| Net realized loss on currency | (47 | ) | ||||||
| Net unrealized depreciation on investments | (2,629 | ) | ||||||
| Net unrealized depreciation on currency translations | (— | )* | ||||||
| Net realized gain and unrealized depreciation on investments and currency | (2,536 | ) | ||||||
| Net increase in net assets resulting from operations | $ | 5,432 |
| * | Amount less than one thousand. |
See Notes to Financial Statements
| 104 | Private Client Services Funds |
Capital Group Global Equity Fund
Statements of changes in net assets
(dollars in thousands)
| For the year ended 10/31/16 | For the year ended 10/31/15 | |||||||
| Operations: | ||||||||
| Net investment income | $ | 7,968 | $ | 6,850 | ||||
| Net realized gain on investments and currency | 93 | 17,601 | ||||||
| Net unrealized depreciation on investments and currency | (2,629 | ) | (18,475 | ) | ||||
| Net increase in net assets resulting from operations | 5,432 | 5,976 | ||||||
| Dividends and distributions to shareholders: | ||||||||
| Dividends from net investment income | (6,944 | ) | (5,230 | ) | ||||
| Distributions from capital gain | (15,930 | ) | (5,575 | ) | ||||
| Total dividends and distributions | (22,874 | ) | (10,805 | ) | ||||
| Net capital share transactions | 1,358 | (7,650 | ) | |||||
| Total decrease in net assets | (16,084 | ) | (12,479 | ) | ||||
| Net assets: | ||||||||
| Beginning of year | 497,681 | 510,160 | ||||||
| End of year (including undistributed net investment income: $5,996 and $5,672, respectively.) | $ | 481,597 | $ | 497,681 | ||||
See Notes to Financial Statements
| Private Client Services Funds | 105 |
Capital Group International Equity Fund
Statement of assets and liabilities
at October 31, 2016
(dollars and shares in thousands, except per share amounts)
| Assets: | ||||||||
| Investment securities, at value (cost: $1,185,743) | $ | 1,325,437 | ||||||
| Short-term investments, at value (cost: $38,900) | 38,900 | |||||||
| Cash | 17 | |||||||
| Foreign currency, at value (cost: $431) | 419 | |||||||
| Receivables for: | ||||||||
| Sales of investments | 4,069 | |||||||
| Sales of fund’s shares | 1,450 | |||||||
| Dividends | 3,613 | |||||||
| Reimbursement from investment adviser | 2 | |||||||
| 9,134 | ||||||||
| Prepaid expenses | — | * | ||||||
| Total assets | 1,373,907 | |||||||
| Liabilities: | ||||||||
| Payables for: | ||||||||
| Purchases of investments | 4,813 | |||||||
| Repurchases of fund’s shares | 501 | |||||||
| Unified Management fees | 2,998 | |||||||
| Other accrued expenses | 8 | |||||||
| Total liabilities | 8,320 | |||||||
| Net assets at October 31, 2016: | $ | 1,365,587 | ||||||
| Net assets consist of: | ||||||||
| Capital paid in on shares of beneficial interest | $ | 1,305,012 | ||||||
| Accumulated undistributed net investment income | 18,624 | |||||||
| Accumulated net realized loss | (97,551 | ) | ||||||
| Net unrealized appreciation | 139,502 | |||||||
| Net assets at October 31, 2016 | $ | 1,365,587 | ||||||
| Shares outstanding: | 121,645 | |||||||
| Net asset value per share: | $ | 11.23 | ||||||
| * | Amount less than one thousand. |
See Notes to Financial Statements
| 106 | Private Client Services Funds |
Capital Group International Equity Fund
Statement of operations
for the year ended October 31, 2016
(dollars in thousands)
| Investment income: | ||||||||
| Income: | ||||||||
| Dividends (net of non-U.S. taxes of $3,004) | $ | 30,661 | ||||||
| Interest | 222 | 30,883 | ||||||
| Fees and expenses: | ||||||||
| Unified Management fees | 11,462 | |||||||
| Trustees’ compensation | 23 | |||||||
| Legal fees | 2 | |||||||
| Other | 1 | |||||||
| Total fees and expenses before reimbursements | 11,488 | |||||||
| Less reimbursements of fees and expenses | 25 | |||||||
| Total fees and expenses after reimbursements | 11,463 | |||||||
| Net investment income | 19,420 | |||||||
| Net realized loss and unrealized appreciation (depreciation) on investments and currency: | ||||||||
| Net realized loss on investments | (40,328 | ) | ||||||
| Net realized loss on currency | (98 | ) | ||||||
| Net unrealized appreciation on investments | 10,860 | |||||||
| Net unrealized depreciation on currency translations | (41 | ) | ||||||
| Net realized loss and unrealized appreciation on investments and currency | (29,607 | ) | ||||||
| Net decrease in net assets resulting from operations | $ | (10,187 | ) | |||||
See Notes to Financial Statements
| Private Client Services Funds | 107 |
Capital Group International Equity Fund
Statements of changes in net assets
(dollars in thousands)
| For the year | For the year | |||||||
| ended 10/31/16 | ended 10/31/15 | |||||||
| Operations: | ||||||||
| Net investment income | $ | 19,420 | $ | 15,610 | ||||
| Net realized loss on investments and currency | (40,426 | ) | (28,939 | ) | ||||
| Net unrealized appreciation on investments and currency | 10,819 | 23,771 | ||||||
| Net (decrease) increase in net assets resulting from operations | (10,187 | ) | 10,442 | |||||
| Dividends to shareholders: | ||||||||
| Dividends from net investment income | (15,606 | ) | (19,733 | ) | ||||
| Total dividends | (15,606 | ) | (19,733 | ) | ||||
| Net capital share transactions | 58,562 | (309,785 | ) | |||||
| Total increase (decrease) in net assets | 32,769 | (319,076 | ) | |||||
| Net assets: | ||||||||
| Beginning of year | 1,332,818 | 1,651,894 | ||||||
| End of year (including undistributed net investment income: $18,624 and $14,909, respectively.) | $ | 1,365,587 | $ | 1,332,818 | ||||
See Notes to Financial Statements
| 108 | Private Client Services Funds |
Capital Group U.S. Equity Fund
Statement of assets and liabilities
at October 31, 2016
(dollars and shares in thousands, except per share amounts)
| Assets: | ||||||||
| Investment securities, at value (cost: $157,890) | $ | 201,512 | ||||||
| Short-term investments, at value (cost: $8,200) | 8,200 | |||||||
| Cash | 26 | |||||||
| Receivables for: | ||||||||
| Dividends | 340 | |||||||
| Reimbursement from investment adviser | 2 | |||||||
| 342 | ||||||||
| Total assets | 210,080 | |||||||
| Liabilities: | ||||||||
| Payables for: | ||||||||
| Purchases of investments | 60 | |||||||
| Repurchases of fund’s shares | 2 | |||||||
| Unified Management fees | 351 | |||||||
| Other accrued expenses | 7 | |||||||
| Total liabilities | 420 | |||||||
| Net assets at October 31, 2016: | $ | 209,660 | ||||||
| Net assets consist of: | ||||||||
| Capital paid in on shares of beneficial interest | $ | 157,226 | ||||||
| Undistributed net investment income | — | |||||||
| Accumulated net realized gain | 8,812 | |||||||
| Net unrealized appreciation | 43,622 | |||||||
| Net assets at October 31, 2016 | $ | 209,660 | ||||||
| Shares outstanding: | 10,599 | |||||||
| Net asset value per share: | $ | 19.78 |
See Notes to Financial Statements
| Private Client Services Funds | 109 |
Capital Group U.S. Equity Fund
Statement of operations
for the year ended October 31, 2016
(dollars in thousands)
| Investment income: | ||||||||
| Income: | ||||||||
| Dividends (net of non-U.S. taxes of $33) | $ | 4,642 | ||||||
| Interest | 27 | 4,669 | ||||||
| Fees and expenses: | ||||||||
| Unified Management fees | 1,302 | |||||||
| Trustees’ compensation | 23 | |||||||
| Legal fees | 2 | |||||||
| Other | — | * | ||||||
| Total fees and expenses before reimbursements | 1,327 | |||||||
| Less reimbursements of fees and expenses | 25 | |||||||
| Total fees and expenses after reimbursements | 1,302 | |||||||
| Net investment income | 3,367 | |||||||
| Net realized gain (loss) and unrealized depreciation on investments and currency: | ||||||||
| Net realized gain on investments | 9,134 | |||||||
| Net realized loss on currency | (— | )* | ||||||
| Net unrealized depreciation on investments | (3,494 | ) | ||||||
| Net realized gain and unrealized depreciation on investments and currency | 5,640 | |||||||
| Net increase in net assets resulting from operations | $ | 9,007 |
| * | Amount less than one thousand. |
See Notes to Financial Statements
| 110 | Private Client Services Funds |
Capital Group U.S. Equity Fund
Statements of changes in net assets
(dollars in thousands)
| For the year ended 10/31/16 | For the year ended 10/31/15 | |||||||
| Operations: | ||||||||
| Net investment income | $ | 3,367 | $ | 2,582 | ||||
| Net realized gain on investments and currency | 9,134 | 6,821 | ||||||
| Net unrealized depreciation on investments | (3,494 | ) | (1,849 | ) | ||||
| Net increase in net assets resulting from operations | 9,007 | 7,554 | ||||||
| Dividends and distributions to shareholders: | ||||||||
| Dividends from net investment income | (3,101 | ) | (2,369 | ) | ||||
| Distributions from capital gain | (6,581 | ) | (6,835 | ) | ||||
| Total dividends and distributions | (9,682 | ) | (9,204 | ) | ||||
| Net capital share transactions | 12,361 | 7,361 | ||||||
| Total increase in net assets | 11,686 | 5,711 | ||||||
| Net assets: | ||||||||
| Beginning of year | 197,974 | 192,263 | ||||||
| End of year (including undistributed net investment income: $– and $–,respectively.) | $ | 209,660 | $ | 197,974 | ||||
See Notes to Financial Statements
| Private Client Services Funds | 111 |
Capital Group Private Client Services Funds
Notes to financial statements
1. Organization
Capital Group Private Client Services Funds (the “Trust”) is registered under the Investment Company Act of 1940 as an open-end, diversified management investment company. The Trust has five fixed income funds (Capital Group Core Municipal Fund, Capital Group Short-Term Municipal Fund, Capital Group California Core Municipal Fund, Capital Group California Short-Term Municipal Fund and Capital Group Core Bond Fund) and three equity funds (Capital Group Global Equity Fund, Capital Group International Equity Fund and Capital Group U.S. Equity Fund) (each a “fund,” collectively the “funds”).
Capital Group Core Municipal Fund seeks to provide current income exempt from federal income tax and to preserve capital. Capital Group Short-Term Municipal Fund seeks to preserve capital and secondarily to provide current income exempt from federal income tax. Capital Group California Core Municipal Fund seeks to provide current income exempt from federal and California income taxes and to preserve capital. Capital Group California Short-Term Municipal Fund seeks to preserve capital and secondarily to provide current income exempt from federal and California income taxes. Capital Group Core Bond Fund seeks to provide current income and to preserve capital. Capital Group Global Equity Fund, Capital Group International Equity Fund and Capital Group U.S. Equity Fund seek to provide prudent growth of capital and conservation of principal.
2. Significant accounting policies
Each fund is an investment company that applies the accounting and reporting guidance issued in Topic 946 by the U.S. Financial Accounting Standards Board. The financial statements have been prepared to comply with U.S generally accepted accounting principles (“U.S. GAAP”). These principles require management to make estimates and assumptions that affect reported amounts and disclosures. Actual results could differ from those estimates. Subsequent events, if any, have been evaluated through the date of issuance in the preparation of the financial statements. The funds follow the significant accounting policies described below, as well as the valuation policies described in the next section on valuation.
Security transactions and related investment income – Security transactions are recorded by the funds as of the date the trades are executed with brokers. Realized gains and losses from security transactions are determined based on the specific identified cost of the securities. In the event a security is purchased with a delayed payment date, the funds will segregate liquid assets sufficient to meet their payment obligations. Dividend income is recognized on the ex-dividend date and interest income is recognized on an accrual basis. Market discounts, premiums and original issue discounts on fixed-income securities are amortized daily over the expected life of the security.
Dividends and distributions to shareholders – Dividend and distributions paid to shareholders are recorded on the ex-dividend date.
Currency translation – Assets and liabilities, including investment securities, denominated in currencies other than U.S. dollars are translated into U.S. dollars at the exchange rates supplied by one or more pricing vendors on the valuation date. Purchases and sales of investment securities and income and expenses are translated into U.S. dollars at the exchange rates on the dates of such transactions. The effects of changes in exchange rates on investment securities are included with the net realized gain or loss and net unrealized appreciation or depreciation on investments in the funds’ statement of operations. The realized gain or loss and unrealized appreciation or depreciation resulting from all other transactions denominated in currencies other than U.S. dollars are disclosed separately.
3. Valuation
Capital Guardian Trust Company (“CGTC”), the funds’ investment adviser, values the funds’ investments at fair value as defined by U.S. GAAP. The net asset value of each fund is generally determined as of approximately 4:00 p.m. New York time each day the New York Stock Exchange is open.
| 112 | Private Client Services Funds |
Capital Group Private Client Services Funds
Notes to financial statements (continued)
Methods and inputs – The funds’ investment adviser uses the following methods and inputs to establish the fair value of their assets and liabilities. Use of particular methods and inputs may vary over time based on availability and relevance as market and economic conditions evolve.
Equity securities are generally valued at the official closing price of, or the last reported sale price on, the exchange or market on which such securities are traded, as of the close of business on the day the securities are being valued or, lacking any sales, at the last available bid price. Prices for each security are taken from the principal exchange or market on which the security trades.
Fixed-income securities, including short-term securities, are generally valued at prices obtained from one or more pricing vendors. Vendors value such securities based on one or more of the inputs described in the following table. The table provides examples of inputs that are commonly relevant for valuing particular classes of fixed-income securities in which the funds are authorized to invest. However, these classifications are not exclusive and any of the inputs may be used to value any other class of fixed-income security.
| Fixed-income class | Examples of standard inputs | |
| All | Benchmark yields, transactions, bids, offers, quotations from dealers and trading systems, new issues, spreads and other relationships observed in the markets among comparable securities; and proprietary pricing models such as yield measures calculated using factors such as cash flows, financial or collateral performance and other reference data (collectively referred to as “standard inputs”) | |
| Corporate bonds & notes; convertible securities | Standard inputs and underlying equity of the issuer | |
| Bonds & notes of governments & government agencies | Standard inputs and interest rate volatilities | |
| Mortgage-backed; asset-backed obligations | Standard inputs and cash flows, prepayment information, default rates, delinquency and loss assumptions, collateral characteristics, credit enhancements and specific deal information | |
| Municipal securities | Standard inputs and, for certain distressed securities, cash flows or liquidation values using a net present value calculation based on inputs that include, but are not limited to, financial statements and debt contracts |
When the funds’ investment adviser deems it appropriate to do so (such as when vendor prices are unavailable or not deemed to be representative), fixed-income securities will be valued in good faith at the mean quoted bid and ask prices that are reasonably and timely available (or bid prices, if asked prices are not available) or at prices for securities of comparable maturity, quality and type. Some securities may be valued based on their effective maturity or average life, which may be shorter than the stated maturity.
Securities with both fixed-income and equity characteristics, or equity securities traded principally among fixed-income dealers, are generally valued in the manner described for either equity or fixed-income securities, depending on which method is deemed most appropriate by the funds’ investment adviser.
Securities and other assets for which representative market quotations are not readily available or are considered unreliable by the funds’ investment adviser are fair valued as determined in good faith under fair valuation guidelines adopted by authority of the funds’ board of trustees as further described. The funds’ investment adviser follows fair valuation guidelines, consistent with U.S. Securities and Exchange Commission rules and guidance, to consider relevant principles and factors when making fair value determinations. The funds’ investment adviser considers relevant indications of value that are reasonably and timely available to it in determining the fair value to be assigned to a particular security, such as, the type and cost of the security; contractual or legal restrictions on resale of the security; relevant financial or business developments of the issuer; actively traded similar or related securities; conversion or exchange rights on the security; related corporate actions; significant events occurring after the close of trading in the security; and changes in overall market conditions. In addition, the closing prices of equity securities that
| Private Client Services Funds | 113 |
Capital Group Private Client Services Funds
Notes to financial statements (continued)
trade in markets outside U.S. time zones may be adjusted to reflect significant events that occur after the close of local trading but before the net asset value of each share class of the fund is determined. Fair valuations and valuations of investments that are not actively trading involve judgment and may differ materially from valuations that would have been used had greater market activity occurred.
Processes and structure – The funds’ board of trustees has delegated authority to the funds’ investment adviser to make fair value determinations, subject to board oversight. The funds’ investment adviser has established a Joint Fair Valuation Committee (the “Fair Valuation Committee”) to administer, implement and oversee the fair value process, and to make fair value decisions. The Fair Valuation Committee regularly reviews its own fair value decisions, as well as decisions made under its standing instructions to the funds’ investment adviser’s valuation teams. The Fair Valuation Committee reviews changes in fair value measurements from period to period and may, as deemed appropriate, update the fair valuation guidelines to better reflect the results of back testing and address new or evolving issues. The Fair Valuation Committee reports any changes to the fair valuation guidelines to the board of trustees with supplemental information to support the changes. The funds’ board and audit committee also regularly review reports that describe fair value determinations and methods.
The funds’ investment adviser has also established a Fixed-Income Pricing Review Group to administer and oversee the fixed-income valuation process, including the use of fixed-income pricing vendors. This group regularly reviews pricing vendor information and market data. Pricing decisions, processes, and controls over security valuation are also subject to additional internal reviews including an annual control self-evaluation program facilitated by the funds’ investment adviser’s compliance group.
Classifications – The funds’ investment adviser classifies the funds’ assets and liabilities into three levels based on the inputs used to value the assets or liabilities. Level 1 values are based on quoted prices in active markets for identical securities. Level 2 values are based on significant observable market inputs, such as quoted prices for similar securities and quoted prices in inactive markets. Certain securities trading outside the U.S. may transfer between Level 1 and Level 2 due to valuation adjustments resulting from significant market movements following the close of local trading. Level 3 values are based on significant unobservable inputs that reflect the funds’ investment adviser’s determination of assumptions that market participants might reasonably use in valuing the securities. The valuation levels are not necessarily an indication of the risk or liquidity associated with the underlying investment. For example, U.S. government securities are reflected as Level 2 because the inputs used to determine fair value may not always be quoted prices in an active market. The following table presents the funds’ valuation levels as of October 31, 2016 (dollars in thousands):
| Investment securities | Level 1 | Level 2 | Level 3 | Total | ||||||||||||
| Capital Group Core Municipal Fund | ||||||||||||||||
| Bonds & notes Municipals | $ | — | $ | 384,626 | $ | — | $ | 384,626 | ||||||||
| Corporate bonds & notes | — | 456 | — | 456 | ||||||||||||
| Short-term securities | — | 23,220 | — | 23,220 | ||||||||||||
| Total | $ | — | $ | 408,302 | $ | — | $ | 408,302 | ||||||||
| Capital Group Short-Term Municipal Fund | ||||||||||||||||
| Bonds & notes | $ | — | $ | 155,797 | $ | — | $ | 155,797 | ||||||||
| Short-term securities | — | 21,500 | — | 21,500 | ||||||||||||
| Total | $ | — | $ | 177,297 | $ | — | $ | 177,297 | ||||||||
| Capital Group California Core Municipal Fund | ||||||||||||||||
| Bonds & notes | $ | — | $ | 315,070 | $ | — | $ | 315,070 | ||||||||
| Short-term securities | — | 16,420 | — | 16,420 | ||||||||||||
| Total | $ | — | $ | 331,490 | $ | — | $ | 331,490 | ||||||||
| 114 | Private Client Services Funds |
Capital Group Private Client Services Funds
Notes to financial statements (continued)
| Investment securities | Level 1 | Level 2 | Level 3 | Total | ||||||||||||
| Capital Group California Short-Term Municipal Fund | ||||||||||||||||
| Bonds & notes | $ | — | $ | 111,535 | $ | — | $ | 111,535 | ||||||||
| Short-term securities | — | 2,705 | — | 2,705 | ||||||||||||
| Total | $ | — | $ | 114,240 | $ | — | $ | 114,240 | ||||||||
| Capital Group Core Bond Fund | ||||||||||||||||
| Bonds, notes & other debt investments U.S. government & government agency bonds & notes | $ | — | $ | 174,115 | $ | — | $ | 174,115 | ||||||||
| Mortgage-backed obligations | — | 29,245 | — | 29,245 | ||||||||||||
| Corporate bonds & notes | — | 91,852 | — | 91,852 | ||||||||||||
| Municipals | — | 5,519 | — | 5,519 | ||||||||||||
| Government & government agency bonds & notes outside the U.S. | — | 2,108 | — | 2,108 | ||||||||||||
| Asset-backed obligations | — | 24,641 | — | 24,641 | ||||||||||||
| Short-term securities | — | 26,748 | — | 26,748 | ||||||||||||
| Total | $ | — | $ | 354,228 | $ | — | $ | 354,228 | ||||||||
| Capital Group Global Equity Fund | ||||||||||||||||
| Common Stocks1,2 | $ | 468,535 | $ | — | $ | — | $ | 468,535 | ||||||||
| Short-term securities | — | 11,948 | — | 11,948 | ||||||||||||
| Total | $ | 468,535 | $ | 11,948 | $ | — | $ | 480,483 | ||||||||
| Capital Group International Equity Fund | ||||||||||||||||
| Common Stocks1,3 | $ | 1,321,512 | $ | — | $ | — | $ | 1,321,512 | ||||||||
| Preferred Securities | 3,925 | — | — | 3,925 | ||||||||||||
| Short-term securities | — | 38,900 | — | 38,900 | ||||||||||||
| Total | $ | 1,325,437 | $ | 38,900 | $ | — | $ | 1,364,337 | ||||||||
| Capital Group U.S. Equity Fund | ||||||||||||||||
| Common Stocks1 | $ | 201,512 | $ | — | $ | — | $ | 201,512 | ||||||||
| Short-term securities | — | 8,200 | — | 8,200 | ||||||||||||
| Total | $ | 201,512 | $ | 8,200 | $ | — | $ | 209,712 | ||||||||
| 1 | The level classification by major category of investments is the same as the category presentation in the Schedule of investments. |
| 2 | Investment securities with a value of $180,340,000, which represented 37.45% of the net assets of the Fund, transferred from Level 2 to Level 1 since the prior fiscal year-end, primarily due to significant market movements following the close of local trading. |
| 3 | Investment securities with a value of $1,115,668,000, which represented 81.70% of the net assets of the Fund, transferred from Level 2 to Level 1 since the prior fiscal year-end, primarily due to significant market movements following the close of local trading. |
| Private Client Services Funds | 115 |
Capital Group Private Client Services Funds
Notes to financial statements (continued)
4. Risk factors
Investing in the funds may involve certain risks including, but not limited to, those described below.
Market conditions – The prices of, and the income generated by, the securities held by the fund may decline –sometimes rapidly or unpredictably – due to various factors, including events or conditions affecting the general economy or particular industries; overall market changes; local, regional or global political, social or economic instability; governmental or governmental agency responses to economic conditions; and currency exchange rate, interest rate and commodity price fluctuations.
Issuer risks – The prices of, and the income generated by, securities held by the fund may decline in response to various factors directly related to the issuers of such securities, including reduced demand for an issuer’s goods or services, poor management performance and strategic initiatives such as mergers, acquisitions or dispositions and the market response to any such initiatives.
Investing in debt instruments – The prices of, and the income generated by, bonds and other debt securities held by the fund may be affected by changing interest rates and by changes in the effective maturities and credit ratings of these securities.
Rising interest rates will generally cause the prices of bonds and other debt securities to fall. Falling interest rates may cause an issuer to redeem, call or refinance a debt security before its stated maturity, which may result in the fund having to reinvest the proceeds in lower yielding securities. Longer maturity debt securities generally have greater sensitivity to changes in interest rates and may be subject to greater price fluctuations than shorter maturity debt securities.
Bonds and other debt securities are also subject to credit risk, which is the possibility that the credit strength of an issuer will weaken and/or an issuer of a debt security will fail to make timely payments of principal or interest and the security will go into default. Credit risk is gauged, in part, by the credit ratings of the debt securities in which the fund invests. However, ratings are only the opinions of the rating agencies issuing them and are not guarantees as to credit quality or an evaluation of market risk. The fund’s investment adviser relies on its own credit analysts to research issuers and issues in seeking to mitigate various credit and default risks.
Investing in growth-oriented stocks — Growth-oriented common stocks and other equity-type securities (such as preferred stocks, convertible preferred stocks and convertible bonds) may involve larger price swings and greater potential for loss than other types of investments.
Investing in income-oriented stocks — Income provided by the fund may be reduced by changes in the dividend policies of, and the capital resources available for dividend payments at, the companies in which the fund invests.
Credit and liquidity support – Changes in the credit quality of banks and financial institutions providing credit and liquidity support features with respect to securities held by the fund could cause the values of these securities to decline.
Investing in lower rated debt instruments – Lower rated bonds and other lower rated debt securities generally have higher rates of interest and involve greater risk of default or price declines due to changes in the issuer’s creditworthiness than those of higher quality debt securities. The market prices of these securities may fluctuate more than the prices of higher quality debt securities and may decline significantly in periods of general economic difficulty.
Liquidity risk — Certain fund holdings may be deemed to be less liquid or illiquid because they cannot be readily sold without significantly impacting the value of the holdings. Liquidity risk may result from the lack of an active market for a holding, legal or contractual restrictions on resale, or the reduced number and capacity of market participants to make a market in such holding. Market prices for less liquid or illiquid holdings may be volatile, and reduced liquidity may have an adverse impact on the market price of such holdings. Additionally, the sale of less liquid or illiquid holdings may involve substantial delays (including delays in settlement) and additional costs and the fund may be unable to sell such holdings when necessary to meet its liquidity needs.
| 116 | Private Client Services Funds |
Capital Group Private Client Services Funds
Notes to financial statements (continued)
Investing in similar municipal bonds — Investing significantly in municipal obligations of issuers in the same state or backed by revenues of similar types of projects or industries may make the fund more susceptible to certain economic, political or regulatory occurrences. As a result, the potential for fluctuations in the fund’s share price may increase.
Investing in municipal bonds of issuers within the state of California — Because the fund invests primarily in securities of issuers within the state of California, the fund is more susceptible to factors adversely affecting issuers of California securities than a comparable municipal bond mutual fund that does not concentrate its investments in a single state. For example, in the past, California voters have passed amendments to the state’s constitution and other measures that limit the taxing and spending authority of California governmental entities, and future voter initiatives may adversely affect California municipal bonds.
Investing in mortgage-related and other asset-backed securities — Mortgage-related securities, such as mortgage-backed securities, and other asset-backed securities, include debt obligations that represent interests in pools of mortgages or other income-bearing assets, such as consumer loans or receivables. Such securities often involve risks that are different from or more acute than the risks associated with investing in other types of debt securities. Mortgage-backed and other asset-backed securities are subject to changes in the payment patterns of borrowers of the underlying debt. When interest rates fall, borrowers are more likely to refinance or prepay their debt before its stated maturity. This may result in the fund having to reinvest the proceeds in lower yielding securities, effectively reducing the fund’s income. Conversely, if interest rates rise and borrowers repay their debt more slowly than expected, the time in which the mortgage-backed and other asset-backed securities are paid off could be extended, reducing the fund’s cash available for reinvestment in higher yielding securities.
Investing in securities backed by the U.S. government — Securities backed by the U.S. Treasury or the full faith and credit of the U.S. government are guaranteed only as to the timely payment of interest and principal when held to maturity. Accordingly, the current market values for these securities will fluctuate with changes in interest rates. Securities issued by government-sponsored entities and federal agencies and instrumentalities that are not backed by the full faith and credit of the U.S. government are neither issued nor guaranteed by the U.S. government.
Investing outside the U.S. — Securities of issuers domiciled outside the U.S, or with significant operations or revenues outside the U.S., may lose value because of adverse political, social, economic or market developments (including social instability, regional conflicts, terrorism and war) in the countries or regions in which the issuers operate or generate revenue. These securities may also lose value due to changes in foreign currency exchange rates against the U.S. dollar and/or currencies of other countries. Issuers of these securities may be more susceptible to actions of foreign governments, such as the imposition of price controls or punitive taxes, that could adversely impact the value of these securities. Securities markets in certain countries may be more volatile and/or less liquid than those in the U.S. Investments outside the U.S. may also be subject to different accounting practices and different regulatory, legal and reporting standards and practices, and may be more difficult to value, than those in the U.S.. In addition, the value of investments outside the U.S. may be reduced by foreign taxes, including foreign withholding taxes on interest and dividends. Further, there may be increased risks of delayed settlement of securities purchased or sold by the fund. The risks of investing outside the U.S. may be heightened in connection with investments in emerging markets.
Management — The investment adviser to the fund actively manages the fund’s investments. Consequently, the fund is subject to the risk that the methods and analyses employed by the investment adviser in this process may not produce the desired results. This could cause the fund to lose value or its investment results to lag relevant benchmarks or other funds with similar objectives.
5. Certain investment techniques
Mortgage dollar rolls – Capital Group Core Bond Fund has entered into mortgage dollar roll transactions in which the fund sells a mortgage-backed security to a counterparty and simultaneously enters into an agreement with the same counterparty to buy back a similar security on a specific future date at a predetermined price. Mortgage dollar rolls are accounted for as purchase and sale transactions, which may increase the fund’s portfolio turnover rate.
| Private Client Services Funds | 117 |
Capital Group Private Client Services Funds
Notes to financial statements (continued)
6. Taxation and distributions
Federal income taxation – The funds comply with the requirements under Subchapter M of the Internal Revenue Code applicable to mutual funds and intend to distribute substantially all of their net taxable income and net capital gains each year. The funds are not subject to income taxes to the extent such distributions are made. Therefore, no federal income tax provision is required. Generally, income earned by Capital Group Core Municipal Fund, Capital Group Short-Term Municipal Fund, Capital Group California Core Municipal Fund and Capital Group California Short-Term Municipal Fund is exempt from federal income taxes; however, these funds may earn taxable income from certain investments.
As of and during the year ended October 31, 2016, the funds did not have a liability for any unrecognized tax benefits. The funds recognized interest and penalties, if any, related to unrecognized tax benefit as income tax expense in the statement of operations. During the year, the funds did not incur any interest or penalties.
The funds are not subject to examination by U.S. federal tax authorities for tax years before 2012 and by state tax authorities for tax years before 2011.
Non-U.S. Taxation – Dividend and interest income are recorded net of non-U.S. taxes paid. The fund may file withholding tax reclaims in certain jurisdictions to recover a portion of amounts previously withheld. As a result of rulings from European courts, the fund filed for additional reclaims related to prior years. These reclaims are recorded when the amount is known and there are no significant uncertainties on collectability. Gains realized by the fund on the sale of securities in certain countries are subject to non-U.S. taxes. The fund records a liability based on unrealized gains to provide for potential non-U.S. taxes payable upon the sale of these securities.
Distributions – Distributions paid to shareholders are based on net investment income and net realized gains determined on a tax basis, which may differ from net investment income and net realized gains for financial reporting purposes. These differences are due primarily to different treatment for items such as currency gains and losses; short-term capital gains and losses; capital losses related to sales of certain securities within 30 days of purchase; net capital losses; cost of investments sold; and amortization of discounts. The fiscal year in which amounts are distributed may differ from the year in which the net investment income and net realized gains are recorded by the funds for financial reporting purposes.
As indicated in the table below, Capital Group International Equity Fund had a capital loss carryforward available at October 31, 2016. The capital loss carryforward will be used to offset any capital gains realized by the fund in future years. The fund will not make distributions from capital gains while a capital loss carryforward remains.
| 118 | Private Client Services Funds |
Capital Group Private Client Services Funds
Notes to financial statements (continued)
The components of distributable earnings on a tax basis are reported as of the funds’ most recent year-end. As of October 31, 2016 the components of distributable earnings on a tax basis were as follows (dollars in thousands):
| Capital Group Core Municipal Fund | Capital Group Short-Term Municipal Fund | Capital Group California Core Municipal Fund | Capital Group California Short- Term Municipal Fund | Capital Group Core Bond Fund | Capital Group Global Equity Fund | Capital Group International Equity Fund | Capital Group U.S. Equity Fund | |||||||||||||||||||||||||
| As of October 31, 2016: | ||||||||||||||||||||||||||||||||
| Undistributed ordinary income | $ | — | $ | 31 | $ | — | $ | — | $ | 1,044 | $ | 5,999 | $ | 18,625 | $ | — | ||||||||||||||||
| Undistributed long- term capital gain | 144 | — | 284 | 52 | 718 | — | — | 8,959 | ||||||||||||||||||||||||
| Capital loss carryforward No expiration | — | — | — | — | — | — | (95,059 | ) | — | |||||||||||||||||||||||
| $ | — | $ | — | $ | — | $ | — | $ | — | $ | — | $ | (95,059 | ) | $ | — | ||||||||||||||||
| Capital loss carryforwards utilized | $ | — | $ | — | $ | 54 | $ | — | $ | — | $ | — | $ | — | $ | — | ||||||||||||||||
| Private Client Services Funds | 119 |
Capital Group Private Client Services Funds
Notes to financial statements (continued)
As of October 31, 2016, the tax-basis unrealized appreciation (depreciation) and cost of investment securities were as follows (dollars in thousands):
| Capital Group Core Municipal Fund | Capital Group Short- Term Municipal Fund | Capital Group California Core Municipal Fund | Capital Group California Short- Term Municipal Fund | Capital Group Core Bond Fund | Capital Group Global Equity Fund | Capital Group International Equity Fund | Capital Group U.S. Equity Fund | |||||||||||||||||||||||||
| Reclassification (from) to distributions in excess of/undistributed net investment income (to) from accumulated net realized loss/undistributed net realized gain | $ | — | $ | — | $ | — | $ | — | * | $ | 33 | $ | (333 | ) | $ | (99 | ) | $ | (179 | ) | ||||||||||||
| Reclassification to (from) distributions in excess of/undistributed net investment income (to) from capital paid in on shares of beneficial interest | (19 | ) | (2 | ) | (4 | ) | — | — | (367 | ) | — | (87 | ) | |||||||||||||||||||
| Reclassification (from) to accumulated net realized loss / undistributed net realized gain (to) from capital paid in on shares of beneficial interest | (34 | ) | (60 | ) | (42 | ) | (20 | ) | (110 | ) | (227 | ) | — | (410 | ) | |||||||||||||||||
| Gross unrealized appreciation on investment securities | $ | 9,465 | $ | 1,015 | $ | 10,963 | $ | 1,004 | $ | 5,543 | $ | 85,036 | $ | 191,069 | $ | 45,445 | ||||||||||||||||
| Gross unrealized depreciation on investment securities | (715 | ) | (368 | ) | (324 | ) | (152 | ) | (1,336 | ) | (8,639 | ) | (53,866 | ) | (1,971 | ) | ||||||||||||||||
| Net unrealized appreciation on investment securities | $ | 8,750 | $ | 647 | $ | 10,639 | $ | 852 | $ | 4,207 | $ | 76,397 | $ | 137,203 | $ | 43,474 | ||||||||||||||||
| Cost of investments securities | $ | 399,552 | $ | 176,650 | $ | 320,851 | $ | 113,388 | $ | 350,021 | $ | 404,086 | $ | 1,227,134 | $ | 166,238 | ||||||||||||||||
| * | Amount less than one thousand. |
| 120 | Private Client Services Funds |
Capital Group Private Client Services Funds
Notes to financial statements (continued)
The tax character of distributions paid during the funds’ year ended October 31, 2016 and the funds’ year ended October 31, 2015, the most recently completed tax year, were as follows (dollars in thousands):
| Year ended October 31, 2016 | Year ended October 31, 2015 | |||||||||||||||||||||||
| Tax-Exempt | Ordinary Income | Long-Term Capital Gains | Tax-Exempt | Ordinary Income | Long-Term Capital Gains | |||||||||||||||||||
| Capital Group Core Municipal Fund | $ | 7,720 | $ | 1 | $ | 303 | $ | 7,158 | $ | 14 | $ | 1 | ||||||||||||
| Capital Group Short-Term Municipal Fund | 1,846 | 1 | 20 | 1,733 | — | * | 67 | |||||||||||||||||
| Capital Group California Core Municipal Fund | 6,040 | — | * | — | 5,748 | 8 | — | |||||||||||||||||
| Capital Group California Short-Term Municipal Fund | 1,144 | — | * | 123 | 1,252 | — | * | 48 | ||||||||||||||||
| Capital Group Core Bond Fund | — | 5,532 | 617 | — | 5,500 | 379 | ||||||||||||||||||
| Capital Group Global Equity Fund | — | 6,944 | 15,930 | — | 5,230 | 5,575 | ||||||||||||||||||
| Capital Group International Equity Fund | — | 15,606 | — | — | 19,733 | — | ||||||||||||||||||
| Capital Group U.S. Equity Fund | — | 3,101 | 6,581 | — | 2,369 | 6,835 | ||||||||||||||||||
| * | Amount less than one thousand. |
7. Fees and transactions with related parties
CGTC serves as investment adviser to the funds and other funds. CGTC is a wholly owned subsidiary of Capital Group International, Inc. Expense limitations have been imposed through January 1, 2017, to limit the funds’ total annual fund operating expenses to the following rates (as a percentage of average daily net assets):
| Fund | Expense Limitation |
| Capital Group Core Municipal Fund | 0.40% |
| Capital Group Short-Term Municipal Fund | 0.40% |
| Capital Group California Core Municipal Fund | 0.40% |
| Capital Group California Short-Term Municipal Fund | 0.40% |
| Capital Group Core Bond Fund | 0.40% |
| Capital Group Global Equity Fund | 0.85% |
| Capital Group International Equity Fund | 0.85% |
| Capital Group U.S. Equity Fund | 0.65% |
CGTC does not intend to recoup any reimbursed expenses from a prior year under expense limitations then in effect for the funds.
Investment advisory services – The funds have an investment advisory and service agreement with CGTC that provides for monthly fees accrued daily. The fee for each fixed income fund is 0.35% of the average daily net assets of the fund. For the services it provides to Capital Group Global Equity Fund, Capital Group International Equity Fund and Capital Group U.S. Equity Fund, CGTC receives a unified management fee based on a percentage of the average daily net assets of the funds. The unified management fee for Capital Group U.S. Equity Fund is 0.65% of the average
| Private Client Services Funds | 121 |
Capital Group Private Client Services Funds
Notes to financial statements (continued)
daily net assets of the fund. The unified management fee for Capital Group Global Equity Fund and Capital Group International Equity Fund is 0.85% of the average daily net assets of each fund.
For the equity funds, all managing and operating expenses are paid by CGTC from the unified management fees except brokerage expenses, taxes, interest, compensation, fees and expenses of the independent trustees (including legal counsel fees) and extraordinary expenses, such as litigation expenses. These expenses which are not paid by CGTC from the unified management fee are paid by the funds, which are currently reimbursed by the advisor. A portion of the funds’ management fee is paid by CGTC to unaffiliated third parties which provide recordkeeping and administrative services.
Distribution services – American funds Distributors, ® Inc. (the “Distributor”) is the principal underwriter of each fund’s shares. The Distributor does not receive any compensation related to the sale of shares of the funds.
Affiliated officers and trustees – Officers and certain trustees of the Trust are or may be considered to be affiliated with CGTC. No affiliated officers or trustees received any compensation directly from the Trust.
Security transactions with related funds — The Trust’s five fixed-income funds (Capital Group Core Municipal Fund, Capital Group Short-Term Municipal Fund, Capital Group California Core Municipal Fund, Capital Group California Short-Term Municipal Fund and Capital Group Core Bond Fund) may purchase from, or sell securities to, other CGTC-managed funds (or accounts managed by certain affiliates of CGTC) under procedures adopted by the funds’ board of trustees. The funds involved in such transactions are considered related by virtue of having a common investment adviser (or affiliated investment advisers), common trustees and/or common officers. When such transactions occur, each transaction is executed at the current market price of the security and no brokerage commissions or fees are paid in accordance with Rule 17a-7 of the 1940 Act. During the year ended October 31, 2016, such purchase and sale transactions occurred between Capital Group Core Municipal Fund, Capital Group Short-Term Municipal Fund, Capital Group California Short-Term Municipal Fund and related funds in the amounts of $1,407,000, $2,519,000 and $1,864,000, respectively, for purchases and $6,152,000, $3,005,000 and $213,000, respectively, for sales.
8. Capital share transactions
Capital share transactions in the funds were as follows (dollars and shares in thousands):
| Sales | Reinvestment of Dividends and Distributions | Repurchases | Net Increase | |||||||||||||||||||||||||||||
| Fund | Amount | Shares | Amount | Shares | Amount | Shares | Amount | Shares | ||||||||||||||||||||||||
| Year ended October 31, 2016 | ||||||||||||||||||||||||||||||||
| Capital Group Core Municipal Fund | $ | 72,380 | 6,853 | $ | 5,421 | 515 | $ | (51,155 | ) | (4,848 | ) | $ | 26,646 | 2,520 | ||||||||||||||||||
| Capital Group Short-Term Municipal Fund | 141,327 | 13,929 | 1,377 | 136 | (106,108 | ) | (10,457 | ) | 36,596 | 3,608 | ||||||||||||||||||||||
| Capital Group California Core Municipal Fund | 61,473 | 5,723 | 3,866 | 361 | (36,927 | ) | (3,441 | ) | 28,412 | 2,643 | ||||||||||||||||||||||
| Capital Group California Short- Term Municipal Fund | 35,087 | 3,413 | 928 | 91 | (29,650 | ) | (2,884 | ) | 6,365 | 620 | ||||||||||||||||||||||
| 122 | Private Client Services Funds |
Capital Group Private Client Services Funds
Notes to financial statements (continued)
| Sales | Reinvestment of Dividends and Distributions | Repurchases | Net Increase | |||||||||||||||||||||||||||||
| Fund | Amount | Shares | Amount | Shares | Amount | Shares | Amount | Shares | ||||||||||||||||||||||||
| Year ended October 31, 2016 | ||||||||||||||||||||||||||||||||
| Capital Group Core Bond Fund | $ | 50,573 | 4,927 | $ | 4,540 | 444 | $ | (41,222 | ) | (4,029 | ) | $ | 13,891 | 1,342 | ||||||||||||||||||
| Capital Group Global Equity Fund | 62,500 | 5,089 | 18,674 | 1,494 | (79,816 | ) | (6,413 | ) | 1,358 | 170 | ||||||||||||||||||||||
| Capital Group International Equity Fund | 475,681 | 43,766 | 2,021 | 178 | (419,140 | ) | (38,212 | ) | 58,562 | 5,732 | ||||||||||||||||||||||
| Capital Group U.S. Equity Fund | 24,876 | 1,297 | 8,642 | 446 | (21,157 | ) | (1,101 | ) | 12,361 | 642 | ||||||||||||||||||||||
| Year ended October 31, 2015 | ||||||||||||||||||||||||||||||||
| Capital Group Core Municipal Fund | $ | 75,222 | 7,157 | $ | 4,593 | 438 | $ | (39,441 | ) | (3,755 | ) | $ | 40,374 | 3,840 | ||||||||||||||||||
| Capital Group Short-Term Municipal Fund | 63,240 | 6,239 | 1,303 | 129 | (76,648 | ) | (7,563 | ) | (12,105 | ) | (1,195 | ) | ||||||||||||||||||||
| Capital Group California Core Municipal Fund | 58,998 | 5,571 | 3,673 | 347 | (36,717 | ) | (3,471 | ) | 25,954 | 2,447 | ||||||||||||||||||||||
| Capital Group California Short-Term Municipal Fund | 38,075 | 3,703 | 1,004 | 98 | (64,962 | ) | (6,323 | ) | (25,883 | ) | (2,522 | ) | ||||||||||||||||||||
| Capital Group Core Bond Fund | 62,706 | 6,117 | 4,272 | 417 | (40,759 | ) | (3,980 | ) | 26,219 | 2,554 | ||||||||||||||||||||||
| Capital Group Global Equity Fund | 73,619 | 5,498 | 8,308 | 632 | (89,577 | ) | (6,692 | ) | (7,650 | ) | (562 | ) | ||||||||||||||||||||
| Capital Group International Equity Fund | 495,615 | 42,405 | 1,930 | 169 | (807,330 | ) | (69,521 | ) | (309,785 | ) | (26,947 | ) | ||||||||||||||||||||
| Capital Group U.S. Equity Fund | 28,864 | 1,453 | 8,247 | 424 | (29,750 | ) | (1,481 | ) | 7,361 | 396 | ||||||||||||||||||||||
| Private Client Services Funds | 123 |
Capital Group Private Client Services Funds
Notes to financial statements (continued)
The fund’s Declaration of Trust permits the Trustees to issue an unlimited number of full and fractional shares of beneficial interest (without par value).
9. Investment transactions
The funds made purchases and sales of investment securities, excluding short-term securities and U.S. government obligations, if any, during the funds’ year ended October 31, 2016, as follows (dollars in thousands):
| Cost of Investments Purchased | Proceeds from Investments Sold | |||||||||||||||
| Fund | U.S. Government Agency Obligations | Other Investments | U.S. Government Agency Obligations | Other Investments | ||||||||||||
| Capital Group Core Municipal Fund | $ | — | $ | 91,426 | $ | — | $ | 67,807 | ||||||||
| Capital Group Short-Term Municipal Fund | — | 61,943 | — | 33,671 | ||||||||||||
| Capital Group California Core Municipal Fund | — | 55,205 | — | 33,798 | ||||||||||||
| Capital Group California Short-Term Municipal Fund | — | 28,657 | — | 19,527 | ||||||||||||
| Capital Group Core Bond Fund | 237,239 | 68,166 | 222,528 | 53,184 | ||||||||||||
| Capital Group Global Equity Fund | — | 166,651 | — | 178,405 | ||||||||||||
| Capital Group International Equity Fund | — | 374,386 | — | 276,599 | ||||||||||||
| Capital Group U.S. Equity Fund | — | 67,360 | — | 58,957 | ||||||||||||
10. Advisory platform concentration
Most of the shares of Capital Group International Equity fund are held through a single advisory platform (more than 87% of the fund as of October 31, 2016). If the platform sponsor decides to move a significant number of its clients out of the fund it could have an adverse impact by causing the fund to have to sell securities in order to meet redemptions. The fund’s investment adviser monitors the fund’s asset allocation and the liquidity of the fund’s portfolio in seeking to mitigate this risk.
| 124 | Private Client Services Funds |
Capital Group Core Municipal Fund
Financial highlights
(for a share outstanding throughout each year)
| For the year ended | ||||||||||||||||||||
| 10/31/16 | 10/31/15 | 10/31/14 | 10/31/13 | 10/31/12 | ||||||||||||||||
| Selected per share data: | ||||||||||||||||||||
| Net asset value, beginning of year | $ | 10.49 | $ | 10.56 | $ | 10.44 | $ | 10.64 | $ | 10.29 | ||||||||||
| Income from investment operations: | ||||||||||||||||||||
| Net investment income1 | 0.21 | 0.21 | 0.21 | 0.21 | 0.21 | |||||||||||||||
| Net realized and unrealized gains (losses) on securities | (— | )2 | (0.07 | ) | 0.12 | (0.20 | ) | 0.35 | ||||||||||||
| Total from investment operations | 0.21 | 0.14 | 0.33 | 0.01 | 0.56 | |||||||||||||||
| Dividends and distributions: | ||||||||||||||||||||
| Dividends from net investment income | (0.21 | ) | (0.21 | ) | (0.21 | ) | (0.21 | ) | (0.21 | ) | ||||||||||
| Distributions from capital gain | (0.01 | ) | — | — | — | — | ||||||||||||||
| Total dividends and distributions | (0.22 | ) | (0.21 | ) | (0.21 | ) | (0.21 | ) | (0.21 | ) | ||||||||||
| Net asset value, end of year | $ | 10.48 | $ | 10.49 | $ | 10.56 | $ | 10.44 | $ | 10.64 | ||||||||||
| Total return3 | 1.97 | % | 1.31 | % | 3.18 | % | 0.10 | % | 5.46 | % | ||||||||||
| Net assets, end of year (in millions) | $ | 405 | $ | 379 | $ | 341 | $ | 299 | $ | 292 | ||||||||||
| Ratios / Supplemental Data: | ||||||||||||||||||||
| Ratio of expenses to average net assets before reimbursement | 0.41 | % | 0.42 | % | 0.41 | % | 0.41 | % | 0.42 | % | ||||||||||
| Ratio of expenses to average net assets after reimbursement3 | 0.40 | % | 0.40 | % | 0.40 | % | 0.40 | % | 0.40 | % | ||||||||||
| Ratio of net investment income to average net assets3 | 1.97 | % | 1.97 | % | 2.00 | % | 2.00 | % | 1.98 | % | ||||||||||
| Portfolio turnover rate | 18 | % | 16 | % | 9 | % | 18 | % | 13 | % | ||||||||||
| 1 | Based on average shares outstanding. |
| 2 | Amount less than $0.01. |
| 3 | Reflects the impact of certain reimbursements by Capital Guardian Trust Company. |
| Private Client Services Funds | 125 |
Capital Group Short-Term Municipal Fund
Financial highlights
(for a share outstanding throughout each year)
| For the year ended | ||||||||||||||||||||
| 10/31/16 | 10/31/15 | 10/31/14 | 10/31/13 | 10/31/12 | ||||||||||||||||
| Selected per share data: | ||||||||||||||||||||
| Net asset value, beginning of year | $ | 10.12 | $ | 10.19 | $ | 10.21 | $ | 10.32 | $ | 10.19 | ||||||||||
| Income from investment operations: | ||||||||||||||||||||
| Net investment income1 | 0.12 | 0.12 | 0.13 | 0.14 | 0.14 | |||||||||||||||
| Net realized and unrealized (losses) gains on securities | (0.01 | ) | (0.07 | ) | (0.01 | ) | (0.07 | ) | 0.13 | |||||||||||
| Total from investment operations | 0.11 | 0.05 | 0.12 | 0.07 | 0.27 | |||||||||||||||
| Dividends and distributions: | ||||||||||||||||||||
| Dividends from net investment income | (0.12 | ) | (0.12 | ) | (0.13 | ) | (0.14 | ) | (0.14 | ) | ||||||||||
| Distributions from capital gain | (— | )2 | (— | )2 | (0.01 | ) | (0.04 | ) | — | |||||||||||
| Total dividends and distributions | (0.12 | ) | (0.12 | ) | (0.14 | ) | (0.18 | ) | (0.14 | ) | ||||||||||
| Net asset value, end of year | $ | 10.11 | $ | 10.12 | $ | 10.19 | $ | 10.21 | $ | 10.32 | ||||||||||
| Total return3 | 1.06 | % | 0.51 | % | 1.20 | % | 0.66 | % | 2.63 | % | ||||||||||
| Net assets, end of year (in millions) | $ | 179 | $ | 142 | $ | 155 | $ | 136 | $ | 124 | ||||||||||
| Ratios / Supplemental Data: | ||||||||||||||||||||
| Ratio of expenses to average net assets before reimbursement | 0.45 | % | 0.46 | % | 0.45 | % | 0.44 | % | 0.46 | % | ||||||||||
| Ratio of expenses to average net assets after reimbursement3 | 0.40 | % | 0.40 | % | 0.40 | % | 0.40 | % | 0.40 | % | ||||||||||
| Ratio of net investment income to average net assets3 | 1.14 | % | 1.15 | % | 1.24 | % | 1.34 | % | 1.32 | % | ||||||||||
| Portfolio turnover rate | 24 | % | 27 | % | 20 | % | 18 | % | 25 | % | ||||||||||
| 1 | Based on average shares outstanding. |
| 2 | Amount less than $0.01. |
| 3 | Reflects the impact of certain reimbursements by Capital Guardian Trust Company. |
| 126 | Private Client Services Funds |
Capital Group California Core Municipal Fund
Financial highlights
(for a share outstanding throughout each year)
| For the year ended | ||||||||||||||||||||
| 10/31/16 | 10/31/15 | 10/31/14 | 10/31/13 | 10/31/12 | ||||||||||||||||
| Selected per share data: | ||||||||||||||||||||
| Net asset value, beginning of year | $ | 10.59 | $ | 10.62 | $ | 10.40 | $ | 10.65 | $ | 10.25 | ||||||||||
| Income from investment operations: | ||||||||||||||||||||
| Net investment income1 | 0.21 | 0.21 | 0.20 | 0.20 | 0.21 | |||||||||||||||
| Net realized and unrealized gains (losses) on securities | 0.09 | (0.03 | ) | 0.22 | (0.20 | ) | 0.40 | |||||||||||||
| Total from investment operations | 0.30 | 0.18 | 0.42 | — | 0.61 | |||||||||||||||
| Dividends and distributions: | ||||||||||||||||||||
| Dividends from net investment income | (0.20 | ) | (0.21 | ) | (0.20 | ) | (0.21 | ) | (0.21 | ) | ||||||||||
| Distributions from capital gain | — | — | — | (0.04 | ) | (— | )2 | |||||||||||||
| Total dividends and distributions | (0.20 | ) | (0.21 | ) | (0.20 | ) | (0.25 | ) | (0.21 | ) | ||||||||||
| Net asset value, end of year | $ | 10.69 | $ | 10.59 | $ | 10.62 | $ | 10.40 | $ | 10.65 | ||||||||||
| Total return3 | 2.86 | % | 1.68 | % | 4.08 | % | (0.04 | )% | 5.99 | % | ||||||||||
| Net assets, end of year (in millions) | $ | 336 | $ | 305 | $ | 280 | $ | 227 | $ | 208 | ||||||||||
| Ratios / Supplemental Data: | ||||||||||||||||||||
| Ratio of expenses to average net assets before reimbursement | 0.41 | % | 0.42 | % | 0.41 | % | 0.41 | % | 0.42 | % | ||||||||||
| Ratio of expenses to average net assets after reimbursement3 | 0.40 | % | 0.40 | % | 0.40 | % | 0.40 | % | 0.40 | % | ||||||||||
| Ratio of net investment income to average net assets3 | 1.89 | % | 1.95 | % | 1.92 | % | 1.93 | % | 1.99 | % | ||||||||||
| Portfolio turnover rate | 11 | % | 13 | % | 18 | % | 17 | % | 21 | % | ||||||||||
| 1 | Based on average shares outstanding. |
| 2 | Amount less than $0.01. |
| 3 | Reflects the impact of certain reimbursements by Capital Guardian Trust Company. |
| Private Client Services Funds | 127 |
Capital Group California Short-Term Municipal Fund
Financial highlights
(for a share outstanding throughout each year)
| For the year ended | ||||||||||||||||||||
| 10/31/16 | 10/31/15 | 10/31/14 | 10/31/13 | 10/31/12 | ||||||||||||||||
| Selected per share data: | ||||||||||||||||||||
| Net asset value, beginning of year | $ | 10.28 | $ | 10.31 | $ | 10.27 | $ | 10.32 | $ | 10.12 | ||||||||||
| Income from investment operations: | ||||||||||||||||||||
| Net investment income1 | 0.10 | 0.10 | 0.09 | 0.09 | 0.09 | |||||||||||||||
| Net realized and unrealized (losses) gains on securities | (0.04 | ) | (0.03 | ) | 0.04 | (0.04 | ) | 0.20 | ||||||||||||
| Total from investment operations | 0.06 | 0.07 | 0.13 | 0.05 | 0.29 | |||||||||||||||
| Dividends and distributions: | ||||||||||||||||||||
| Dividends from net investment income | (0.10 | ) | (0.10 | ) | (0.09 | ) | (0.09 | ) | (0.09 | ) | ||||||||||
| Distributions from capital gain | (0.01 | ) | (— | )2 | (— | )2 | (0.01 | ) | (— | )2 | ||||||||||
| Total dividends and distributions | (0.11 | ) | (0.10 | ) | (0.09 | ) | (0.10 | ) | (0.09 | ) | ||||||||||
| Net asset value, end of year | $ | 10.23 | $ | 10.28 | $ | 10.31 | $ | 10.27 | $ | 10.32 | ||||||||||
| Total return3 | 0.63 | % | 0.74 | % | 1.30 | % | 0.48 | % | 2.96 | % | ||||||||||
| Net assets, end of year (in millions) | $ | 118 | $ | 112 | $ | 138 | $ | 115 | $ | 107 | ||||||||||
| Ratios / Supplemental Data: | ||||||||||||||||||||
| Ratio of expenses to average net assets before reimbursement | 0.46 | % | 0.46 | % | 0.44 | % | 0.44 | % | 0.47 | % | ||||||||||
| Ratio of expenses to average net assets after reimbursement3 | 0.40 | % | 0.40 | % | 0.40 | % | 0.40 | % | 0.40 | % | ||||||||||
| Ratio of net investment income to average net assets3 | 1.00 | % | 0.98 | % | 0.89 | % | 0.91 | % | 0.92 | % | ||||||||||
| Portfolio turnover rate | 19 | % | 23 | % | 19 | % | 9 | % | 14 | % | ||||||||||
| 1 | Based on average shares outstanding. |
| 2 | Amount less than $0.01. |
| 3 | Reflects the impact of certain reimbursements by Capital Guardian Trust Company. |
| 128 | Private Client Services Funds |
Capital Group Core Bond Fund
Financial highlights
(for a share outstanding throughout each year)
| For the year ended | ||||||||||||||||||||
| 10/31/16 | 10/31/15 | 10/31/14 | 10/31/13 | 10/31/12 | ||||||||||||||||
| Selected per share data: | ||||||||||||||||||||
| Net asset value, beginning of year | $ | 10.19 | $ | 10.25 | $ | 10.24 | $ | 10.62 | $ | 10.40 | ||||||||||
| Income from investment operations: | ||||||||||||||||||||
| Net investment income1 | 0.16 | 0.16 | 0.16 | 0.15 | 0.17 | |||||||||||||||
| Net realized and unrealized gains (losses) on securities | 0.15 | (0.04 | ) | 0.04 | (0.22 | ) | 0.23 | |||||||||||||
| Total from investment operations | 0.31 | 0.12 | 0.20 | (0.07 | ) | 0.40 | ||||||||||||||
| Dividends and distributions: | ||||||||||||||||||||
| Dividends from net investment income | (0.16 | ) | (0.16 | ) | (0.16 | ) | (0.15 | ) | (0.17 | ) | ||||||||||
| Distributions from capital gain | (0.03 | ) | (0.02 | ) | (0.03 | ) | (0.16 | ) | (0.01 | ) | ||||||||||
| Total dividends and distributions | (0.19 | ) | (0.18 | ) | (0.19 | ) | (0.31 | ) | (0.18 | ) | ||||||||||
| Net asset value, end of year | $ | 10.31 | $ | 10.19 | $ | 10.25 | $ | 10.24 | $ | 10.62 | ||||||||||
| Total return2 | 3.03 | % | 1.25 | % | 1.95 | % | (0.69 | )% | 3.92 | % | ||||||||||
| Net assets, end of year (in millions) | $ | 352 | $ | 335 | $ | 310 | $ | 296 | $ | 296 | ||||||||||
| Ratios / Supplemental Data: | ||||||||||||||||||||
| Ratio of expenses to average net assets before reimbursement | 0.41 | % | 0.42 | % | 0.41 | % | 0.41 | % | 0.42 | % | ||||||||||
| Ratio of expenses to average net assets after reimbursement2 | 0.40 | % | 0.40 | % | 0.40 | % | 0.40 | % | 0.40 | % | ||||||||||
| Ratio of net investment income to average net assets2 | 1.55 | % | 1.59 | % | 1.57 | % | 1.43 | % | 1.63 | % | ||||||||||
| Portfolio Turnover Rate3: | ||||||||||||||||||||
| Including mortgage dollar roll transactions | 86 | % | 126 | % | 137 | % | 192 | % | 134 | % | ||||||||||
| Excluding mortgage dollar roll transactions | 58 | % | 87 | % | — | 4 | — | 4 | — | 4 | ||||||||||
| 1 | Based on average shares outstanding. |
| 2 | Reflects the impact of certain reimbursements by Capital Guardian Trust Company. |
| 3 | Refer to Note 5 for more information on mortgage dollar rolls. |
| 4 | Not available. |
| Private Client Services Funds | 129 |
Capital Group Global Equity Fund
Financial highlights
(for a share outstanding throughout each year)
| For the year ended | ||||||||||||||||||||
| 10/31/16 | 10/31/15 | 10/31/14 | 10/31/13 | 10/31/12 | ||||||||||||||||
| Selected per share data: | ||||||||||||||||||||
| Net asset value, beginning of year | $ | 13.13 | $ | 13.27 | $ | 12.43 | $ | 9.99 | $ | 9.18 | ||||||||||
| Income from investment operations: | ||||||||||||||||||||
| Net investment income1 | 0.20 | 0.18 | 0.14 | 0.12 | 0.14 | |||||||||||||||
| Net realized and unrealized (losses) gains on securities | (0.08 | ) | (0.03 | ) | 0.80 | 2.45 | 0.71 | |||||||||||||
| Total from investment operations | 0.12 | 0.15 | 0.94 | 2.57 | 0.85 | |||||||||||||||
| Dividends and distributions: | ||||||||||||||||||||
| Dividends from net investment income | (0.18 | ) | (0.14 | ) | (0.10 | ) | (0.13 | ) | (0.04 | ) | ||||||||||
| Distributions from capital gain | (0.42 | ) | (0.15 | ) | — | — | — | |||||||||||||
| Total dividends and distributions | (0.60 | ) | (0.29 | ) | (0.10 | ) | (0.13 | ) | (0.04 | ) | ||||||||||
| Net asset value, end of year | $ | 12.65 | $ | 13.13 | $ | 13.27 | $ | 12.43 | $ | 9.99 | ||||||||||
| Total return2 | 1.04 | % | 1.10 | % | 7.60 | % | 26.10 | % | 9.19 | % | ||||||||||
| Net assets, end of year (in millions) | $ | 482 | $ | 498 | $ | 510 | $ | 412 | $ | 205 | ||||||||||
| Ratios / Supplemental Data: | ||||||||||||||||||||
| Ratio of expenses to average net assets before reimbursement | 0.86 | % | 0.86 | % | 0.85 | % | 0.86 | % | 0.86 | % | ||||||||||
| Ratio of expenses to average net assets after reimbursement2 | 0.85 | % | 0.85 | % | 0.85 | %3 | 0.85 | % | 0.85 | % | ||||||||||
| Ratio of net investment income to average net assets2 | 1.64 | % | 1.34 | % | 1.09 | % | 1.09 | % | 1.47 | % | ||||||||||
| Portfolio turnover rate | 36 | % | 39 | % | 29 | % | 25 | % | 35 | % | ||||||||||
| 1 | Based on average shares outstanding. |
| 2 | Reflects the impact of certain reimbursements by Capital Guardian Trust Company. |
| 3 | Reimbursement was less than 0.005%. |
| 130 | Private Client Services Funds |
Capital Group International Equity Fund
Financial highlights
(for a share outstanding throughout each year)
| For the year ended | ||||||||||||||||||||
| 10/31/16 | 10/31/15 | 10/31/14 | 10/31/13 | 10/31/12 | ||||||||||||||||
| Selected per share data: | ||||||||||||||||||||
| Net asset value, beginning of year | $ | 11.50 | $ | 11.56 | $ | 11.72 | $ | 9.74 | $ | 9.08 | ||||||||||
| Income from investment operations: | ||||||||||||||||||||
| Net investment income1 | 0.16 | 0.13 | 0.16 | 0.15 | 0.13 | |||||||||||||||
| Net realized and unrealized (losses) gains on securities | (0.30 | ) | (0.05 | ) | (0.23 | ) | 1.88 | 0.58 | ||||||||||||
| Total from investment operations | (0.14 | ) | 0.08 | (0.07 | ) | 2.03 | 0.71 | |||||||||||||
| Dividends and distributions: | ||||||||||||||||||||
| Dividends from net investment income | (0.13 | ) | (0.14 | ) | (0.09 | ) | (0.05 | ) | (0.05 | ) | ||||||||||
| Total dividends and distributions | (0.13 | ) | (0.14 | ) | (0.09 | ) | (0.05 | ) | (0.05 | ) | ||||||||||
| Net asset value, end of year | $ | 11.23 | $ | 11.50 | $ | 11.56 | $ | 11.72 | $ | 9.74 | ||||||||||
| Total return2 | (1.20 | )% | 0.69 | % | (0.62 | )% | 20.93 | % | 7.91 | % | ||||||||||
| Net assets, end of year (in millions) | $ | 1,366 | $ | 1,333 | $ | 1,652 | $ | 989 | $ | 256 | ||||||||||
| Ratios / Supplemental Data: | ||||||||||||||||||||
| Ratio of expenses to average net assets before reimbursement | 0.85 | % | 0.85 | % | 0.85 | % | 0.85 | % | 0.86 | % | ||||||||||
| Ratio of expenses to average net assets after reimbursement2 | 0.85 | %3 | 0.85 | %3 | 0.85 | %3 | 0.85 | %3 | 0.85 | % | ||||||||||
| Ratio of net investment income to average net assets2 | 1.44 | % | 1.11 | % | 1.35 | % | 1.44 | % | 1.38 | % | ||||||||||
| Portfolio turnover rate | 21 | % | 34 | % | 33 | % | 25 | % | 17 | % | ||||||||||
| 1 | Based on average shares outstanding. |
| 2 | Reflects the impact of certain reimbursements by Capital Guardian Trust Company. |
| 3 | Reimbursement was less than 0.005%. |
| Private Client Services Funds | 131 |
Capital Group U.S. Equity Fund
Financial highlights
(for a share outstanding throughout each year)
| For the year ended | ||||||||||||||||||||
| 10/31/16 | 10/31/15 | 10/31/14 | 10/31/13 | 10/31/12 | ||||||||||||||||
| Selected per share data: | ||||||||||||||||||||
| Net asset value, beginning of year | $ | 19.88 | $ | 20.11 | $ | 18.33 | $ | 14.75 | $ | 14.32 | ||||||||||
| Income from investment operations: | ||||||||||||||||||||
| Net investment income1 | 0.33 | 0.26 | 0.25 | 0.20 | 0.22 | |||||||||||||||
| Net realized and unrealized gains on securities | 0.55 | 0.46 | 2.05 | 3.61 | 1.20 | |||||||||||||||
| Total from investment operations | 0.88 | 0.72 | 2.30 | 3.81 | 1.42 | |||||||||||||||
| Dividends and distributions: | ||||||||||||||||||||
| Dividends from net investment income | (0.30 | ) | (0.24 | ) | (0.24 | ) | (0.22 | ) | (0.17 | ) | ||||||||||
| Distributions from capital gain | (0.68 | ) | (0.71 | ) | (0.28 | ) | (0.01 | ) | (0.82 | ) | ||||||||||
| Total dividends and distributions | (0.98 | ) | (0.95 | ) | (0.52 | ) | (0.23 | ) | (0.99 | ) | ||||||||||
| Net asset value, end of year | $ | 19.78 | $ | 19.88 | $ | 20.11 | $ | 18.33 | $ | 14.75 | ||||||||||
| Total return2 | 4.58 | % | 3.75 | % | 12.78 | % | 26.06 | % | 10.81 | % | ||||||||||
| Net assets, end of year (in millions) | $ | 210 | $ | 198 | $ | 192 | $ | 167 | $ | 103 | ||||||||||
| Ratios / Supplemental Data: | ||||||||||||||||||||
| Ratio of expenses to average net assets before reimbursement | 0.66 | % | 0.67 | % | 0.66 | % | 0.66 | % | 0.67 | % | ||||||||||
| Ratio of expenses to average net assets after reimbursement2 | 0.65 | % | 0.65 | % | 0.65 | % | 0.65 | % | 0.65 | % | ||||||||||
| Ratio of net investment income to average net assets2 | 1.68 | % | 1.31 | % | 1.30 | % | 1.22 | % | 1.52 | % | ||||||||||
| Portfolio turnover rate | 31 | % | 29 | % | 27 | % | 25 | % | 53 | % | ||||||||||
| 1 | Based on average shares outstanding. |
| 2 | Reflects the impact of certain reimbursements by Capital Guardian Trust Company. |
| 132 | Private Client Services Funds |
Capital Group Private Client Services Funds
REPORT OF INDEPENDENT REGISTERED PUBLIC ACCOUNTING FIRM
To the Board of Trustees and Shareholders of
Capital Group Private Client Services Funds:
We have audited the accompanying statement of assets and liabilities of Capital Group Private Client Services Funds (the “Trust”) comprising the Capital Group Core Municipal Fund, Capital Group Short-Term Municipal Fund, Capital Group California Core Municipal Fund, Capital Group California Short-Term Municipal Fund, Capital Group Core Bond Fund, Capital Group Global Equity Fund, Capital Group International Equity Fund, and Capital Group U.S. Equity Fund, including the schedules of investments, as of October 31, 2016, and the related statements of operations for the year then ended, the statements of changes in net assets for each of the two years in the period then ended, and the financial highlights for each of the periods presented. These financial statements and financial highlights are the responsibility of the Trust’s management. Our responsibility is to express an opinion on these financial statements and financial highlights based on our audits.
We conducted our audits in accordance with the standards of the Public Company Accounting Oversight Board (United States). Those standards require that we plan and perform the audit to obtain reasonable assurance about whether the financial statements and financial highlights are free of material misstatement. The Trust is not required to have, nor were we engaged to perform, an audit of its internal control over financial reporting. Our audits included consideration of internal control over financial reporting as a basis for designing audit procedures that are appropriate in the circumstances, but not for the purpose of expressing an opinion on the effectiveness of the Trust’s internal control over financial reporting. Accordingly, we express no such opinion. An audit also includes examining, on a test basis, evidence supporting the amounts and disclosures in the financial statements, assessing the accounting principles used and significant estimates made by management, as well as evaluating the overall financial statement presentation. Our procedures included confirmation of securities owned as of October 31, 2016, by correspondence with the custodian and brokers. We believe that our audits provide a reasonable basis for our opinion.
In our opinion, such financial statements and financial highlights referred to above present fairly, in all material respects, the financial position of Capital Group Private Client Services Funds as of October 31, 2016, the results of their operations for the year then ended, the changes in their net assets for each of the two years in the period then ended, and the financial highlights for each of the periods presented, in conformity with accounting principles generally accepted in the United States of America.
DELOITTE & TOUCHE LLP
Costa Mesa, California
December 16, 2016
| Private Client Services Funds | 133 |
Capital Group Private Client Services Funds
Tax Information (unaudited)
We are required to advise you of the federal tax status of certain distributions received by shareholders during the fiscal year. The Funds hereby designate the following amounts for the year ended October 31, 2016.
| Capital Group Core Municipal Fund | Capital Group Short-Term Municipal Fund | Capital Group California Core Municipal Fund | Capital Group California Short-Term Municipal Fund | |||||||||||||
| Long-term capital gains | $ | 337,000 | $ | 21,000 | $ | — | $ | 144,000 | ||||||||
| Exempt Interest dividends | 99.99 | % | 99.97 | % | 100 | % | 100 | % | ||||||||
| Capital Group Core Bond Fund | Capital Group Global Equity Fund | Capital Group International Equity Fund | Capital Group U.S. Equity Fund | |||||||||||||
| Long-term capital gains | $ | 618,000 | $ | 16,141,000 | $ | — | $ | 6,992,000 | ||||||||
| Foreign taxes (per share) | — | 0.01 | 0.02 | — | ||||||||||||
| Foreign source income (per share) | — | 0.19 | 0.28 | — | ||||||||||||
| Qualified dividend income | — | 100 | % | 100 | % | 100 | % | |||||||||
| Corporate dividends received deduction | — | $ | 4,934,000 | — | 100 | % | ||||||||||
Individual shareholders should refer to their Form 1099 or other tax information, which will be mailed in January 2017, to determine the calendar year amounts to be included on their 2016 tax returns. Shareholders should consult their tax advisors.
| 134 | Private Client Services Funds |
Capital Group Private Client Services Funds
Expense example (unaudited)
As a shareholder of the funds, you incur ongoing costs, including management fees and other expenses. This example is intended to help you understand your ongoing costs (in dollars) of investing in the funds so you can compare these costs with the ongoing costs of investing in other mutual funds. The example is based on an investment of $1,000 invested at the beginning of the period and held for the entire period (May 1, 2016 through October 31, 2016).
Actual expenses:
The first line of each fund in the table provides information about actual account values and actual expenses. You may use the information in this line, together with the amount you invested, to estimate the expenses that you paid over the period. Simply divide your account value by $1,000 (for example, an $8,600 account value divided by $1,000 = 8.6), then multiply the result by the number in the first line under the heading entitled “Expenses paid during period” to estimate the expenses you paid on your account during this period.
Hypothetical example for comparison purposes:
The second line of each fund in the table provides information about hypothetical account values and hypothetical expenses based on the actual expense ratio for the funds and an assumed rate of return of 5.00% per year before expenses, which is not the actual return of the funds. The hypothetical account values and expenses may not be used to estimate the actual ending account balance or expenses you paid for the period. You may use this information to compare the ongoing costs of investing in the funds and other funds. To do so, compare this 5.00% hypothetical example with the 5.00% hypothetical examples that appear in the shareholder reports of the other funds.
Notes:
Shareholders of the funds may be subject to an additional fee charged by Capital Guardian Trust Company’s Capital Group Private Client Services division for the ongoing services provided to the shareholder. You can estimate the impact of these fees by adding the amount of the fees to the total estimated expenses you paid on your account during the period as calculated above. In addition, your ending account value would be lower by the amount of these fees. Note that the expenses shown in the table are meant to highlight your ongoing costs only. The second line of each fund in the table is useful in comparing ongoing costs only and will not help you determine the relative total costs of owning different funds.
| Beginning account value 5/1/2016 | Ending account value 10/31/2016 | Expenses paid during period* | Annualized expense ratio | |||||||||||||
| Capital Group Core Municipal Fund | ||||||||||||||||
| actual return | $ | 1,000.00 | $ | 1,003.10 | $ | 2.01 | 0.40 | % | ||||||||
| assumed 5% return | 1,000.00 | 1,023.10 | 2.03 | 0.40 | % | |||||||||||
| Capital Group Short-Term Municipal Fund | ||||||||||||||||
| actual return | 1,000.00 | 1,002.90 | 2.01 | 0.40 | % | |||||||||||
| assumed 5% return | 1,000.00 | 1,023.10 | 2.03 | 0.40 | % | |||||||||||
| Capital Group California Core Municipal Fund | ||||||||||||||||
| actual return | 1,000.00 | 1,004.60 | 2.02 | 0.40 | % | |||||||||||
| assumed 5% return | 1,000.00 | 1,023.10 | 2.03 | 0.40 | % | |||||||||||
| Capital Group California Short-Term Municipal Fund | ||||||||||||||||
| actual return | 1,000.00 | 1,000.00 | 2.01 | 0.40 | % | |||||||||||
| assumed 5% return | 1,000.00 | 1,023.10 | 2.03 | 0.40 | % | |||||||||||
| Capital Group Core Bond Fund | ||||||||||||||||
| actual return | 1,000.00 | 1,009.50 | 2.02 | 0.40 | % | |||||||||||
| assumed 5% return | 1,000.00 | 1,023.10 | 2.03 | 0.40 | % | |||||||||||
| Capital Group Global Equity Fund | ||||||||||||||||
| actual return | 1,000.00 | 1,029.30 | 4.34 | 0.85 | % | |||||||||||
| assumed 5% return | 1,000.00 | 1,020.90 | 4.32 | 0.85 | % | |||||||||||
| Private Client Services Funds | 135 |
Capital Group Private Client Services Funds
Expense example (unaudited) (continued)
| Beginning account value | Ending account value | Expenses paid during | Annualized expense | |||||||||||||
| 5/1/2016 | 10/31/2016 | period* | ratio | |||||||||||||
| Capital Group International Equity Fund | ||||||||||||||||
| actual return | 1,000.00 | 1,009.90 | 4.29 | 0.85 | % | |||||||||||
| assumed 5% return | 1,000.00 | 1,020.90 | 4.32 | 0.85 | % | |||||||||||
| Capital Group U.S. Equity Fund | ||||||||||||||||
| actual return | 1,000.00 | 1,028.70 | 3.31 | 0.65 | % | |||||||||||
| assumed 5% return | 1,000.00 | 1,021.90 | 3.30 | 0.65 | % | |||||||||||
| * | Expenses are equal to the fund’s annualized expense ratio as indicated, multiplied by the average account value over the period, multiplied by 184/366 (to reflect the one-half year period). |
| 136 | Private Client Services Funds |
Capital Group Private Client Services Funds
Trustees and other officers
“Independent” Trustees1
| Name, year of birth and position with funds | Year first elected as a trustee2 | Principal occupation(s) during the past five years | Number of portfolios overseen in fund complex by trustee | Other directorships3 held by trustee | ||||
| Joseph C. Berenato, 1946 Trustee | 2015 | Former Chairman and CEO, Ducommun Incorporated (aerospace components manufacturer) | 16 | Ducommun Incorporated | ||||
| Richard G. Capen, Jr., 1934 | 2009 | Corporate director and author | 10 | None | ||||
| Vanessa C. L. Chang, 1952 Trustee | 2015 | Director, EL & EL Investments (real estate) | 17 | Edison International; Sykes Enterprises; Transocean Ltd. | ||||
| H. Frederick Christie, 1933 Trustee | 2009 | Private investor | 10 | None | ||||
| Richard G. Newman, 1934 Chairman of the Board (Independent and Non-Executive) | 2009 | Founder and Chairman Emeritus, AECOM Technology Corporation (global engineering, consulting and professional technical services) | 10 | None |
| Private Client Services Funds | 137 |
Capital Group Private Client Services Funds
Trustees and other officers
“Interested” trustees4
Interested trustees have similar qualifications, skills and attributes as the independent trustees. Interested trustees are senior executive officers of Capital Guardian Trust Company or its affiliates. This management role with the funds’ service providers also permits them to make a significant contribution to the funds’ board.
| Name, year of birth and position with funds | Year first elected as a director/officer2 | Principal occupation(s) during the past five years and positions held with affiliated entities or the Principal Underwriter of the funds | Number of portfolios overseen in fund complex by trustee | Other directorships3 held by trustee | ||||
| Paul F. Roye, 1953 Vice Chairman of the Board | 2009 | Senior Vice President and Senior Counsel – Fund Business Management Group, Capital Research and Management Company6 | 11 | None |
| 138 | Private Client Services Funds |
Capital Group Private Client Services Funds
Trustees and other officers
Other officers5
| Name, year of birth and position with funds | Year first elected an officer2 | Principal occupation(s) during the past five years and positions held with affiliated entities or the Principal Underwriter of the funds | ||
| John S. Armour, 1957 President | 2013 | President – Private Client Services Division, Capital Bank and Trust Company6 | ||
| John R. Queen, 1965 Senior Vice President | 2009 | Senior Vice President – Private Client Services Division, Capital Bank and Trust Company6; Vice President – Capital Fixed Income Investors, Capital Research and Management Company6 | ||
| William L. Robbins, 1968 Senior Vice President | 2014 | Partner– Capital International Investors, Capital Research and Management Company6 | ||
| Mark Marinella, 1958 Vice President | 2016 | Vice President – Capital Fixed Income Investors, Capital Research and Management Company6 | ||
| Timothy W. McHale, 1978 Vice President | 2009 | Vice President and Senior Counsel – Fund Business Management Group, Capital Research and Management Company6; Secretary – American Funds Distributors, Inc.6 | ||
| Courtney R. Taylor, 1975 Secretary | 2009 | Assistant Vice President – Fund Business Management Group, Capital Research and Management Company6 | ||
| Gregory F. Niland, 1971 Treasurer | 2014 | Vice President – Investment Operations, Capital Research and Management Company6 | ||
| Susan K. Countess, 1966 Assistant Secretary | 2012 | Associate – Fund Business Management Group, Capital Research and Management Company6 | ||
| Brian Janssen, 1972 Assistant Treasurer | 2014 | Vice President – Investment Operations, Capital Research and Management Company6 |
| 1 | The term “independent” trustee refers to a trustee who is not an “interested person” of the funds within the meaning of the Investment Company Act of 1940. |
| 2 | Trustees and officers of the funds serve until their resignation, removal or retirement. |
| 3 | This includes all directorships (other than the funds) that are held by each trustee as a director of a public company or a registered investment company. Unless otherwise noted, all directorships are current. |
| 4 | The term “interested” trustee refers to a trustee who is an “interested person” of the funds within the meaning of the 1940 Act, on the basis of his or her affiliation with the funds’ investment adviser, Capital Guardian Trust Company, or affiliated entities (including the funds’ principal underwriter). |
| 5 | All of the officers listed, except Mark Marinella and William L. Robbins, are officers of one or more of the other funds for which Capital Guardian Trust Company serves as Investment Adviser. |
| 6 | Company affiliated with Capital Guardian Trust Company. |
The funds’ statement of additional information includes further details about fund trustees and is available without charge upon request by calling Capital Group Private Client Services at 800-421-4996 or by visiting the funds website at capitalpcsfunds.com. The address for all trustees and officers of the funds is 333 South Hope Street, 55th Floor, Los Angeles, California 90071, Attention: Secretary.
| Private Client Services Funds | 139 |
Capital Group Private Client Services Funds
Offices of the funds
Capital Guardian Trust Company
6455 Irvine Center Drive
Irvine, CA 92618
Offices of the investment adviser
Capital Guardian Trust Company
333 South Hope Street
Los Angeles, CA 90071-1406
Custodian of assets
State Street Bank and Trust Company
One Lincoln Street
Boston, MA 02111
Fund accounting and administration
State Street Bank and Trust Company
One Lincoln Street
Boston, MA 02111
Independent registered public accounting firm
Deloitte & Touche LLP
695 Town Center Drive
Costa Mesa, CA 92626
Transfer agent
State Street Bank and Trust
Company One Lincoln Street
Boston, MA 02111
Counsel
Morgan, Lewis & Bockius LLP
300 South Grand Avenue, Twenty-Second Floor
Los Angeles, CA 90071-3132
Principal underwriter
American Funds Distributors, Inc.
333 South Hope Street
Los Angeles, CA 90071-1406
Investors should carefully consider the investment objectives, risks, charges and expenses of Capital Group Private Client Services Funds. This and other important information is contained in the funds’ prospectus, which can be obtained from your Capital Group Private Client Services representative and should be read carefully before investing. You may also call Capital Group Private Client Services at 800-421-4996 to obtain a copy of the prospectus.
The proxy voting procedures and principles of Capital Group Private Client Services Funds, which describe how we vote proxies relating to portfolio securities, is available upon request by calling Capital Group Private Client Services at 800-421-4996. The funds file their proxy voting records with the SEC for the 12 months ended June 30 by August 31. The report also is available on the SEC website at http://www.sec.gov or by calling Capital Group Private Client Services at 800-421-4996.
Capital Group Private Client Services Funds files a complete list of its portfolio holdings with the SEC for the first and third quarters of each fiscal year on Form N-Q. The funds’ forms N-Q are available on the SEC’s website at http://www.sec.gov. You may also review or, for a fee, copy this filing at the SEC’s Public Reference Room in Washington, D.C. Additional information regarding the operation of the Public Reference Room may be obtained by calling the SEC’s Office of Investor Education and Advocacy at 800-SEC-0330. Additionally, the list of portfolio holdings is available by calling Capital Group Private Client Services at 800-421-4996.
| 140 | Private Client Services Funds |
ITEM 2 – Code of Ethics
The Registrant has adopted a Code of Ethics that applies to its Principal Executive Officer and Principal Financial Officer. The Registrant undertakes to provide to any person without charge, upon request, a copy of the Code of Ethics. Such request can be made to American Funds Service Company at 800/421-9225 or to the Secretary of the Registrant, 6455 Irvine Center Drive, Irvine, California 92618.
ITEM 3 – Audit Committee Financial Expert
The Registrant’s board has determined that Vanessa C. L. Chang, a member of the Registrant’s audit committee, is an “audit committee financial expert” and "independent," as such terms are defined in this Item. This designation will not increase the designee’s duties, obligations or liability as compared to his or her duties, obligations and liability as a member of the audit committee and of the board, nor will it reduce the responsibility of the other audit committee members. There may be other individuals who, through education or experience, would qualify as "audit committee financial experts" if the board had designated them as such. Most importantly, the board believes each member of the audit committee contributes significantly to the effective oversight of the Registrant’s financial statements and condition.
ITEM 4 – Principal Accountant Fees and Services
| Registrant: | |||
| a) Audit Fees: | |||
| 2015 | $252,000 | ||
| 2016 | $260,000 | ||
| b) Audit-Related Fees: | |||
| 2015 | None | ||
| 2016 | None | ||
| c) Tax Fees: | |||
| 2015 | $56,000 | ||
| 2016 | $58,000 | ||
| The tax fees consist of professional services relating to the preparation of the Registrant’s tax returns. | |||
| d) All Other Fees: | |||
| 2015 | None | ||
| 2016 | None | ||
| Adviser and affiliates (includes only fees for non-audit services billed to the adviser and affiliates for engagements that relate directly to the operations and financial reporting of the Registrant and were subject to the pre-approval policies described below): | |||
| a) Audit Fees: | |||
| Not Applicable | |||
| b) Audit-Related Fees: | |||
| 2015 | $323,000 | ||
| 2016 | $78,000 | ||
| The audit-related fees consist of assurance and related services relating to the examination of the Registrant’s transfer agent, principal underwriter and investment adviser conducted in accordance with Statement on Standards for Attestation Engagements Number 16 issued by the American Institute of Certified Public Accountants. | |||
| c) Tax Fees: | |||
| Not Applicable | |||
| d) All Other Fees: | |||
| Not Applicable | |||
| All audit and permissible non-audit services that the Registrant’s audit committee considers compatible with maintaining the independent registered public accounting firm’s independence are required to be pre-approved by the committee. The pre-approval requirement will extend to all non-audit services provided to the Registrant, the investment adviser, and any entity controlling, controlled by, or under common control with the investment adviser that provides ongoing services to the Registrant, if the engagement relates directly to the operations and financial reporting of the Registrant. The committee will not delegate its responsibility to pre-approve these services to the investment adviser. The committee may delegate to one or more committee members the authority to review and pre-approve audit and permissible non-audit services. Actions taken under any such delegation will be reported to the full committee at its next meeting. The pre-approval requirement is waived with respect to non-audit services if certain conditions are met. The pre-approval requirement was not waived for any of the non-audit services listed above provided to the Registrant, adviser and affiliates. | |||
| Aggregate non-audit fees paid to the Registrant’s auditors, including fees for all services billed to the Registrant, adviser and affiliates that provide ongoing services to the Registrant, were $461,000 for fiscal year 2015 and $209,000 for fiscal year 2016. The non-audit services represented by these amounts were brought to the attention of the committee and considered to be compatible with maintaining the auditors’ independence. | |||
ITEM 5 – Audit Committee of Listed Registrants
Not applicable to this Registrant, insofar as the Registrant is not a listed issuer as defined in Rule 10A-3 under the Securities Exchange Act of 1934.
ITEM 6 – Schedule of Investments
Not applicable, insofar as the schedule is included as part of the report to shareholders filed under Item 1 of this Form.
ITEM 7 – Disclosure of Proxy Voting Policies and Procedures for Closed-End Management Investment Companies
Not applicable to this Registrant, insofar as the Registrant is not a closed-end management investment company.
ITEM 8 – Portfolio Managers of Closed-End Management Investment Companies
Not applicable to this Registrant, insofar as the Registrant is not a closed-end management investment company.
ITEM 9 – Purchases of Equity Securities by Closed-End Management Investment Company and Affiliated Purchasers
Not applicable to this Registrant, insofar as the Registrant is not a closed-end management investment company.
ITEM 10 – Submission of Matters to a Vote of Security Holders
There have been no material changes to the procedures by which shareholders may recommend nominees to the Registrant’s board of trustees since the Registrant last submitted a proxy statement to its shareholders. The procedures are as follows. The Registrant has a nominating committee comprised solely of persons who are not considered ‘‘interested persons’’ of the Registrant within the meaning of the Investment Company Act of 1940, as amended. The committee periodically reviews such issues as the board’s composition, responsibilities, committees, compensation and other relevant issues, and recommends any appropriate changes to the full board of trustees. While the committee normally is able to identify from its own resources an ample number of qualified candidates, it will consider shareholder suggestions of persons to be considered as nominees to fill future vacancies on the board. Such suggestions must be sent in writing to the nominating committee of the Registrant, c/o the Registrant’s Secretary, and must be accompanied by complete biographical and occupational data on the prospective nominee, along with a written consent of the prospective nominee for consideration of his or her name by the nominating committee.
ITEM 11 – Controls and Procedures
| (a) | The Registrant’s Principal Executive Officer and Principal Financial Officer have concluded, based on their evaluation of the Registrant’s disclosure controls and procedures (as such term is defined in Rule 30a-3 under the Investment Company Act of 1940), that such controls and procedures are adequate and reasonably designed to achieve the purposes described in paragraph (c) of such rule. |
| (b) | There were no changes in the Registrant’s internal controls over financial reporting (as defined in Rule 30a-3(d) under the Investment Company Act of 1940) that occurred during the Registrant’s second fiscal quarter of the period covered by this report that has materially affected, or is reasonably likely to materially affect, the Registrant’s internal control over financial reporting. |
ITEM 12 – Exhibits
| (a)(1) | The Code of Ethics that is the subject of the disclosure required by Item 2 is attached as an exhibit hereto. |
| (a)(2) | The certifications required by Rule 30a-2 of the Investment Company Act of 1940 and Sections 302 and 906 of the Sarbanes-Oxley Act of 2002 are attached as exhibits hereto. |
SIGNATURES
Pursuant to the requirements of the Securities Exchange Act of 1934 and the Investment Company Act of 1940, the Registrant has duly caused this report to be signed on its behalf by the undersigned, thereunto duly authorized.
CAPITAL GROUP PRIVATE CLIENT SERVICES FUNDS | |
| By _/s/_John S. Armour_____________________ | |
John S. Armour, President and Principal Executive Officer | |
| Date: December 27, 2016 |
Pursuant to the requirements of the Securities Exchange Act of 1934 and the Investment Company Act of 1940, this report has been signed below by the following persons on behalf of the Registrant and in the capacities and on the dates indicated.
| By _/s/_John S. Armour_____________________ |
John S. Armour, President and Principal Executive Officer |
| Date: December 27, 2016 |
| By _/s/_Gregory F. Niland_____________________ |
Gregory F. Niland, Treasurer and Principal Financial Officer |
| Date: December 27, 2016 |