UNITED STATES
SECURITIES AND EXCHANGE COMMISSION
Washington, D.C. 20549
FORM N-CSR
Certified Shareholder Report of
Registered Management Investment Companies
Investment Company Act File Number: 811-22349
Capital Group Private Client Services Funds
(Exact Name of Registrant as Specified in Charter)
6455 Irvine Center Drive
Irvine, California 92618
(Address of Principal Executive Offices)
Registrant's telephone number, including area code: (213) 486-9200
Date of fiscal year end: October 31
Date of reporting period: October 31, 2017
Courtney R. Taylor
Capital Group Private Client Services Funds
333 South Hope Street
Los Angeles, California 90071
(Name and Address of Agent for Service)
ITEM 1 – Reports to Stockholders
 | Private Client Services FundsSM
For the year ended October 31, 2017
|

Annual Report to
Capital Group Core Municipal FundSM
Capital Group Short-Term Municipal FundSM
Capital Group California Core Municipal FundSM
Capital Group California Short-Term Municipal FundSM
Capital Group Core Bond FundSM
Capital Group Global Equity FundSM
Capital Group International Equity FundSM
Capital Group U.S. Equity FundSM |
capitalgrouppcsfunds.com
Capital Group Private Client Services Funds
Letter to investors
October 31, 2017 (unaudited)
Fellow investors:
Global equities advanced powerfully in the 12-month period ended October 31, 2017, as ongoing expansion in the U.S. was accompanied by a strong pickup in European growth and notable economic improvement throughout the emerging world. The U.S. market was paced by steady gains in employment, continued low interest rates and vibrant consumer confidence. Economic improvement has been especially pronounced overseas as sturdier economies in Europe, Japan and the emerging markets have raised hope that sustainable recoveries are finally underway in these regions. The world’s major economies expanded simultaneously for the first time in a decade, with manufacturing activity, earnings growth and retail sales all showing clear improvement. As global equities climbed throughout the period, we adjusted the funds’ holdings to take advantage of opportunities. For example, exposure to some large technology companies was trimmed amid the surge in that sector, with the proceeds directed toward companies in other industries with promising long-term potential.
Fixed-income markets fell sharply at the beginning of the period following the U.S. presidential election, but stabilized afterward when an expected surge in economic growth did not immediately materialize. After peaking in March, bond yields eased back in the ensuing months before spiking moderately late in the period as global economic activity picked up.
Equity Commentary
Over the past 12 months, the Capital Group U.S. Equity Fund rose 23.37%, on par with the 23.63% gain in the S&P 500 index. The Capital Group International Equity Fund advanced 25.23%, outpacing its benchmark, the MSCI EAFE Index, which gained 23.44%. The Capital Group Global Equity Fund climbed 26.47%, beating the 22.77% advance in its benchmark, the MSCI World Index.
Capital Group U.S. Equity Fund
The fund benefited from robust gains in major technology and Internet companies, which were marked by impressive earnings, dominant market share and buoyant predictions about their future prospects. The weighting of tech stocks in the S&P 500 reached its highest level since the tech-stock boom of 2000. Among the contributors to results were Microsoft, which reported strong earnings driven by demand for cloud-based services. Chipmaker Broadcom reported better-than-expected revenue and earnings backed by a strong product pipeline. Financial payments giant Visa saw a rise in transaction volumes and growth in mobile payments. Though exposure to some dominant tech companies was lightened during the period, our managers believe the long-term prospects for this sector remain favorable.
The fund was also helped by aircraft manufacturer Boeing, which reported vibrant growth in new orders. As economic growth lifts more people into the middle class in Asia and other emerging markets, an increasing portion of consumer discretionary income is being earmarked for air travel. Beyond aerospace, the fund also got a boost from Waste Connections. The trash hauler guided profit estimates higher and hinted at a large dividend increase, making it one of the fund’s top five contributors.
The fund has taken profits in some companies that have been successful in corporate turnaround efforts, as well as those whose shares have jumped in response to acquisition offers from competitors. The fund redeployed some of that capital into selected stocks within various industries, including utilities and telecommunications.
On the downside, the fund was negatively impacted by significant weakness in Advance Auto Parts, which suffered disappointing earnings and warned that same-store sales would fall more than expected. Elsewhere in the consumer discretionary sector, Newell Brands lowered its earnings guidance after Hurricane Harvey disrupted its supply chain.
The fund also was affected by ongoing weakness in the energy sector, as the price of crude oil fell during the first half of the period before rebounding later. The share prices of oil services giant Schlumberger, pipeline operator Enbridge and oil company Occidental Petroleum all slid during the period. The selling pressure created opportunities to increase exposure to select energy companies that continue to have promising long-term outlooks. The fund also added to positions within biotechnology as that industry makes progress in developing innovative drugs to address numerous medical conditions.
| Private Client Services Funds | 1 |
Capital Group Private Client Services Funds
Letter to investors
October 31, 2017 (unaudited) (continued)
Capital Group International Equity Fund
International stocks jumped as Europe, recovering from an extended period of lackluster growth, flashed its brightest economic signs in years. A number of indicators, including a notable increase in the number of companies issuing positive earnings surprises, suggested that the eurozone may finally be turning a decisive corner. Though many countries remain burdened by high joblessness and government debt, the Continent’s slow pace of recovery from the 2008 financial crisis leaves room for substantial improvement in coming years.
Information technology businesses, particularly those specializing in automation and other niche areas, posted strong returns. The top contributor to results was Keyence, a factory automation sensor manufacturer, which reported higher revenue and earnings as customers seek ways to streamline traditional manufacturing operations. ASML Holding, which supplies photolithography systems to the semiconductor industry, issued upbeat guidance after better-than-expected earnings.
Aerospace also boosted this fund: two of the top five contributors came from that sector. European aircraft giant Airbus and components manufacturer Safran both benefited from the trend toward increasing global air travel.
On the downside, detractors were spread across a variety of sectors, with many of the share price declines due more to company-specific factors than to macroeconomic trends. Shares of SES declined as a delay in the launch of new satellites resulted in short-term earnings pressure. At Sysmex, which specializes in hematology diagnostics, an oversupply of inventory in China was among the factors that caused growth to slow. AA, a roadside car service operator in the U.K., suffered as a slower-than-expected turnaround in the business was compounded by concerns that Brexit could dampen consumer spending. Tobacco company Imperial Brands was weighed down by concerns about soft volume growth and increasing leverage.
Capital Group Global Equity Fund
The fund benefited from optimism about the prospects for the global economy and strong results from technology-oriented businesses, with half of the top 10 contributors coming from the tech sector. Shares of Taiwan Semiconductor rose as the chip maker’s competitive position improved and its business became less cyclical. ASML Holding, Keyence, Broadcom and Apple also added to results.
Beyond technology, two of the fund’s top performers were in the financial industry, which benefited from global economic stability and expectations of lighter regulation in the U.S. Banking giant JP Morgan Chase was helped by well-regarded management and expectations of dividend growth.
On the downside, ongoing softness in the energy sector weighed on companies including Occidental Petroleum, which suffered from soft crude oil prices. Oil services giant Schlumberger confronted reduced exploration and development spending by big energy companies, while pipeline operator Enbridge guided expectations lower amid fear of delays in customer spending.
In other areas, Nielsen Holdings saw a slower-than-expected turnaround in one of its business segments. Shares of tobacco company Imperial Brands were dragged lower by concerns about soft volume growth.
Fixed-Income Commentary
After spiking early on, bond yields receded for much of the period before rising a bit toward the end. Overall, yields remained low and fluctuated within a relatively narrow range. The yield on the benchmark 10-year Treasury note generally ranged between 2% and 2.5% for much of the period. The Capital Group Core Bond, Core Municipal, Short-Term Municipal and California Short-Term Municipal bond funds all outpaced the performance of their respective benchmarks.
| 2 | Private Client Services Funds |
Capital Group Private Client Services Funds
Letter to investors
October 31, 2017 (unaudited) (continued)
Capital Group Core Bond Fund
The Core Bond fund had a total return of 0.81%, topping the 0.14% return of its benchmark. The fund had an underweight position in U.S. Treasuries and a slight overweight in investment-grade corporate bonds. It was also overweight asset-backed securities, whose repayment streams are tied to credit cards, auto loans and mortgages. Managers feel there are attractive values in these securities.
Capital Group Core Municipal Fund and Capital Group Short-Term Municipal Fund
The Core Municipal fund had a total return of 1.56%, exceeding the 1.48% of its benchmark. The fund invests in a range of high-quality revenue bonds, which are issued to finance public-related services such as roads, bridges, airports and schools. Slightly more than 17% of the fund’s assets were in transportation bonds, and nearly 15% each in health care and housing-related securities.
The Short-Term Municipal fund rose 1.58%, beating the 1.35% return of its benchmark. Nearly one-fifth of the fund’s assets were in housing-related securities, with a further 17% in transportation-related ventures. Nearly 14% were in health care issues, and an additional 11% in utility holdings.
Capital Group California Core Municipal Fund and Capital Group California Short-Term Municipal Fund
The California Core Municipal fund had a total return of 1.15%. This compares with a total return of 1.37% for its benchmark.
The California Short-Term Municipal fund had a total return of 1.29%, topping the 1.10% return of its benchmark. The fund had nearly one-third of its assets in tax-related holdings, the bulk of those in tax allocation securities, which are often issued to finance redevelopment projects. An additional 23% of assets were in general obligation bonds, and more than 11% in utilities-related securities.
The fixed-income market may experience heightened volatility in the coming year if the Federal Reserve continues to raise short-term interest rates. But though that may cause fluctuations in portions of the bond market, it could also create opportunities to acquire securities with attractive yields. Bonds remain a central component of portfolios, as they typically provide stability in periods when equity prices can fluctuate. During such times, fixed income can help to smooth out the normal gyrations in the financial markets.
Sincerely yours,
John S. Armour
President
William L. Robbins
Senior Vice President and Equity Portfolio Manager
John R. Queen
Senior Vice President and Fixed-Income Portfolio Manager
| Private Client Services Funds | 3 |
Capital Group Core Municipal Fund
October 31, 2017
Growth of $25,000 investment
Here’s how a $25,000 investment in the Capital Group Core Municipal Fund grew between April 13, 2010, when the fund began operations, and October 31, 2017, the end of the fund’s fiscal year.
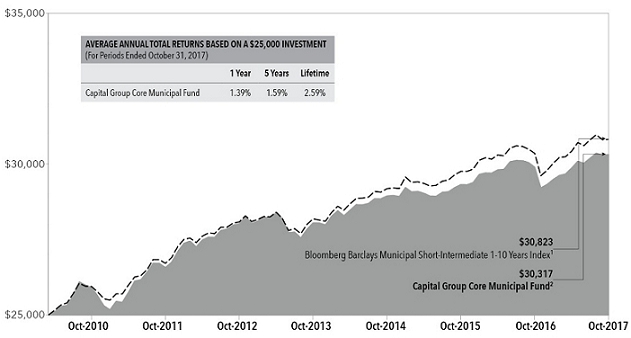
| 1 | The index is unmanaged, and its results include reinvested distributions but do not reflect the effect of sales charges, commissions, or expenses. |
| 2 | Includes reinvested dividends and capital gain distributions. |
Results are for past periods and are not predictive of results for future periods. Current and future results may be lower or higher than those shown. Share price and returns will vary so investors may lose money. The results shown are before taxes on fund distributions and sale of fund shares.
Investment portfolio – quality ratings*
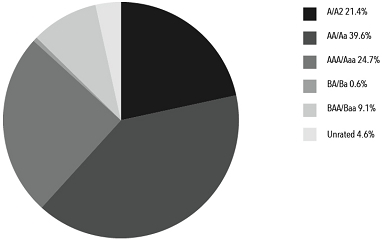
| * | Bond ratings, which typically range from Aaa/AAA (highest to D (lowest), are assigned by credit rating agencies such as Moody’s, Standard & Poors and/or Fitch as an indication of an Issuer’s credit-worthiness. If agency rating differ, securities are put in the highest category consistent with fund investment policies. When securities have not been rated by a rating agency (included in “unrated” at left), the investment advisor performs its own credit analysis and assigns comparable ratings that are used for compliance and fund investment policies. The ratings are not covered by the Report of Independent Registered Public Accounting Firm. |
| 4 | Private Client Services Funds |
Capital Group Core Municipal Fund
Schedule of investments
October 31, 2017
| Bonds & notes - 89.8% | Principal amount (000) | Value (000) | ||||||
| Alabama - 1.6% | ||||||||
| Alabama 21st Century Auth., Rev. Ref. Bonds, Series A, 5.00%, 2021 | $ | 2,230 | $ | 2,469 | ||||
| Alabama Federal Aid Highway Fin. Auth., Highway Imps. Misc. Taxes Rev. Bonds, 5.00%, 2023 | 100 | 116 | ||||||
| Alabama Federal Aid Highway Fin. Auth., Highway Imps. Misc. Taxes Rev. Bonds, Series A, 5.00%, 2020 | 1,200 | 1,327 | ||||||
| Black Belt Energy Gas Dist., Natural Gas Util. Imps. Rev. Bonds, Series A (Mandatory Put 06/01/21 @ 100), 4.00%, 20461 | 1,000 | 1,080 | ||||||
| City of Huntsville, Energy Res. Auth. Imps. Rev. Bonds, Series A: | ||||||||
| 5.00%, 2021 | 250 | 286 | ||||||
| 5.00%, 2022 | 450 | 526 | ||||||
| City of Huntsville, Energy Res. Auth. Rev. Ref. Bonds, Series B: | ||||||||
| 5.00%, 2021 | 225 | 257 | ||||||
| 5.00%, 2022 | 400 | 468 | ||||||
| County of Jefferson, Sales Tax Rev. Ref. Bonds, 5.00%, 2020 | 500 | 549 | ||||||
| Univ. of Alabama, Health Care Facs. Rev. Ref. Bonds, Series A, 5.00%, 2018 | 150 | 155 | ||||||
| 7,233 | ||||||||
| Alaska - 0.1% | ||||||||
| Alaska Housing Fin. Corp., Loc. or GTD Housing Rev. Bonds, Series A, 3.50%, 2046 | 300 | 318 | ||||||
| Alaska Housing Fin. Corp., Rev. Bonds, Series A, 4.00%, 2040 | 215 | 218 | ||||||
| 536 | ||||||||
| Arizona - 2.6% | ||||||||
| Arizona Health Facs. Auth., Health Care Facs. Rev. Ref. Bonds (Mandatory Put 02/05/20 @ 100), 2.77%, 20481 | 3,100 | 3,155 | ||||||
| City of Tucson, Water Rev. Ref. Bonds, 5.00%, 2020 | 750 | 824 | ||||||
| Glendale Ind. Dev. Auth., College & Univ. Rev. Ref. Bonds, 5.25%, 2018 | 1,000 | 1,021 | ||||||
| Maricopa County Ind. Dev. Auth., Charter School AID Rev. Ref. Bonds, Series A, 5.00%, 2027 | 745 | 905 | ||||||
| Phoenix Civic Imp. Corp., Port, Airport, & Marina Rev. Ref. Bonds, Series A, 5.00%, 2020 | 2,800 | 3,066 | ||||||
| Phoenix Civic Imp. Corp., Sewer Rev. Ref. Bonds, 5.50%, 2024 | 125 | 129 | ||||||
| Phoenix Ind. Dev. Auth., Misc. Purposes Lease Rev. Bonds, 5.00%, 2022 | 1,000 | 1,058 | ||||||
| Salt River Project Agricultural Imp. & Power Dist., Energy Res. Auth. Imps. Rev. Bonds, Series A: | ||||||||
| 5.00%, 2020 | 160 | 167 | ||||||
| 5.00%, 2021 | 1,000 | 1,007 | ||||||
| 11,332 | ||||||||
| Arkansas - 0.1% | ||||||||
| Arkansas Dev. Fin. Auth., Health Care Facs. Rev. Bonds (Mandatory Put 09/01/22 @ 100), 2.47%, 20441 | 600 | 606 | ||||||
| 606 | ||||||||
| California - 6.2% | ||||||||
| Bay Area Toll Auth., Highway Tolls Rev. Bonds (Mandatory Put 05/01/23 @ 100):1 | ||||||||
| 1.82%, 2045 | 2,200 | 2,239 | ||||||
| 1.82%, 2047 | 1,500 | 1,527 | ||||||
| Bay Area Toll Auth., Highway Tolls Rev. Bonds (Mandatory Put 10/01/19 @ 100), 1.62%, 20471 | 1,000 | 1,006 | ||||||
| California Health Facs. Fncg. Auth., Health Care Facs. Rev. Ref. Bonds (CA Mtg. Ins.), 5.00%, 2028 | 315 | 371 | ||||||
| Private Client Services Funds | 5 |
Capital Group Core Municipal Fund
Schedule of investments
October 31, 2017
| Bonds & notes - continued | Principal amount (000) | Value (000) | ||||||
| California - continued | ||||||||
| California Muni. Fin. Auth., Res. Recovery Imps. Rev. Bonds (Mandatory Put 01/02/18 @ 100), 1.10%, 20211 | $ | 500 | $ | 500 | ||||
| California Pollution Control Fncg. Auth., Res. Recovery Rev. Ref. Bonds, Series B (Mandatory Put 05/01/17 @ 100), 0.95%, 20241,2 | 1,500 | 1,500 | ||||||
| California Statewide Comms. Dev. Auth., Health Care Facs. Rev. Ref. Bonds, 5.00%, 2022 | 1,065 | 1,216 | ||||||
| California Statewide Comms. Dev. Auth., Private Schools Rev. Ref. Bonds, Series B (Mandatory Put 06/01/22 @ 100), 2.12%, 20371 | 1,000 | 1,009 | ||||||
| Cathedral City Redev. Agcy. Successor Agcy., Tax Allocation Rev. Ref. Bonds (AGM Insured), 5.00%, 2025 | 620 | 735 | ||||||
| Chula Vista Muni. Fncg. Auth., Special Tax Rev. Ref. Bonds, 5.00%, 2020 | 910 | 992 | ||||||
| City of Irvine California, Special Assessment Ref. Bonds, 5.00%, 2023 | 900 | 1,052 | ||||||
| City of Irvine, Special Assessment Ref. Bonds, 3.125%, 2021 | 565 | 593 | ||||||
| Hemet Unified School Dist., G.O. Prop. Tax Ref. Bonds (AGM Insured), 5.00%, 2029 | 500 | 584 | ||||||
| Irvine Unified School Dist., Prop. Acquisition Special Tax Bonds, Series A, 5.00%, 2025 | 250 | 298 | ||||||
| Lancaster Redev. Agcy. Successor Agcy., Tax Allocation Rev. Ref. Bonds (AGM Insured): | ||||||||
| 5.00%, 2024 | 175 | 209 | ||||||
| 5.00%, 2026 | 825 | 1,011 | ||||||
| Metropolitan Water Dist. of Southern California, Water Rev. Ref. Bonds, Series B-1 (Mandatory Put 03/27/18 @ 100), 1.30%, 20271 | 1,350 | 1,350 | ||||||
| Murrieta Valley Unified School Dist. Public Fncg. Auth., Special Tax Rev. Ref. Bonds, Series A, 5.00%, 2022 | 1,250 | 1,423 | ||||||
| Palm Desert Redev. Agcy. Successor Agcy., Tax Increment Allocation Rev. Ref. Bonds, Series A, 5.00%, 2020 | 1,200 | 1,328 | ||||||
| Poway Unified School Dist. Public Fncg. Auth., Special Tax Ref. Bonds, Series A, 5.00%, 2026 | 1,200 | 1,441 | ||||||
| Rancho Cordova Comm. Facs. Dist., Public Imps. Special Tax Ref. Bonds, 4.00%, 2024 | 500 | 548 | ||||||
| RNR School Fncg. Auth., School Imps. Special Tax Bonds, Series A (BAM Insured), 5.00%, 2028 | 1,000 | 1,202 | ||||||
| San Francisco City & County Redev. Agcy., Special Tax Rev. Ref. Bonds, 5.00%, 2021 | 800 | 897 | ||||||
| Santa Ana Comm. Redev. Agcy., Tax Allocation Rev. Ref. Bonds, 5.25%, 2019 | 600 | 644 | ||||||
| State of California, G.O. General Fund Ref. Bonds, 5.00%, 2030 | 2,000 | 2,415 | ||||||
| State of California, G.O. Sales Tax Rev. Ref. Bonds, Series A (Pre-refunded with U.S. Treasury Obligations 07/01/19 @ 100), 5.25%, 2021 | 100 | 107 | ||||||
| Tracy Comm. Dev. Agcy. Successor Agcy., Tax Allocation Rev. Ref. Bonds (AGM Insured), 5.00%, 2030 | 1,000 | 1,181 | ||||||
| 27,378 | ||||||||
| Colorado - 2.7% | ||||||||
| Centerra Metropolitan Dist. No. 1, Tax Allocation Repayment of Bank Ln. Rev. Bonds: | ||||||||
| 2.70%, 2019 | 705 | 710 | ||||||
| 5.00%, 2020 | 1,250 | 1,347 | ||||||
| City & County of Denver, Port, Airport & Marina Rev. Ref. Bonds, Series A, 5.25%, 2028 | 200 | 216 | ||||||
| City & County of Denver, Port, Airport & Marina Rev. Ref. Bonds, Series B, 5.00%, 2021 | 500 | 567 | ||||||
| Colorado Health Facs. Auth., Health Care Facs. Rev. Bonds (Mandatory Put 11/15/23 @ 100), 5.00%, 20361 | 1,570 | 1,837 | ||||||
| Colorado Health Facs. Auth., Health Care Facs. Rev. Ref. Bonds, 5.00%, 2024 | 1,825 | 2,128 | ||||||
| Colorado Health Facs. Auth., Health Care Facs. Rev. Ref. Bonds, Series A, 5.00%, 2018 | 1,485 | 1,498 | ||||||
| E-470 Public Highway Auth., Misc. Rev. Ref. Bonds (Mandatory Put 09/01/19 @ 100), 1.725%, 20391 | 200 | 201 | ||||||
| E-470 Public Highway Auth., Misc. Rev. Ref. Bonds (Mandatory Put 09/01/21 @ 100), 1.88%, 20391 | 200 | 203 | ||||||
| 6 | Private Client Services Funds |
Capital Group Core Municipal Fund
Schedule of investments
October 31, 2017
.
| Bonds & notes - continued | Principal amount (000) | Value (000) | ||||||
| Colorado - continued | ||||||||
| Mountain Shadows Metropolitan Dist., G.O. Prop. Tax Ref. Bonds, 4.00%, 2026 | $ | 735 | $ | 750 | ||||
| Park Creek Metropolitan Dist., Tax Increment Allocation Ref. Bonds, 5.00%, 2024 | 1,100 | 1,275 | ||||||
| Regional Trans. Dist., Transit Imps. Cert. of Part. Lease Bonds, Series A, 5.00%, 2018 | 1,000 | 1,023 | ||||||
| Univ. of Colorado., College & Univ. Imps. Rev. Bonds, Series A, 5.00%, 2020 | 150 | 165 | ||||||
| 11,920 | ||||||||
| Connecticut - 1.7% | ||||||||
| Connecticut Housing Fin. Auth., Loc. or GTD Housing Rev. Bonds, Series A, 3.50%, 2044 | 295 | 312 | ||||||
| Connecticut Housing Fin. Auth., Loc. or GTD Housing Rev. Ref. Bonds, Series A-1, 4.00%, 2045 | 805 | 870 | ||||||
| Connecticut Housing Fin. Auth., Loc. or GTD Housing Rev. Ref. Bonds, Sub-Series A-1, 4.00%, 2047 | 3,980 | 4,302 | ||||||
| Connecticut Housing Fin. Auth., Loc. or GTD Housing Rev. Ref. Bonds, Sub-Series C-1: | ||||||||
| 4.00%, 2044 | 270 | 288 | ||||||
| 4.00%, 2047 | 1,475 | 1,599 | ||||||
| Connecticut Housing Fin. Auth., Loc. or GTD Housing Rev. Ref. Bonds, Sub-Series D-1 (GNMA/FNMA/FHLMC COLL Insured), 4.00%, 2047 | 300 | 326 | ||||||
| 7,697 | ||||||||
| Florida - 5.3% | ||||||||
| Brevard County Health Facs. Auth., Health Care Facs. Rev. Ref. Bonds: | ||||||||
| 5.00%, 2021 | 500 | 554 | ||||||
| 5.00%, 2022 | 500 | 566 | ||||||
| Citizens Prop. Insurance Corp., Misc. Purposes Rev. Bonds, Series A-1: | ||||||||
| 5.00%, 2019 | 1,500 | 1,587 | ||||||
| 5.00%, 2020 | 1,100 | 1,205 | ||||||
| Citizens Prop. Insurance Corp., Misc. Rev. Bonds, Series A-1, 5.00%, 2019 | 150 | 159 | ||||||
| City of Cape Coral, Special Assessment Ref. Bonds (AGM Insured), 1.90%, 2020 | 995 | 1,009 | ||||||
| City of Clearwater, Water Rev. Ref. Bonds, Series B, 5.00%, 2018 | 100 | 104 | ||||||
| City of Jacksonville, Sales Tax Rev. Ref. Bonds, 5.00%, 2019 | 1,000 | 1,073 | ||||||
| City of Pompano Beach, Health Care Facs. Nursing Homes Rev. Bonds, 5.00%, 2023 | 620 | 715 | ||||||
| County of Lee Trans. Facs. Rev., Highway Tolls Rev. Ref. Bond (AGM Insured), 5.00%, 2021 | 500 | 569 | ||||||
| County of Miami-Dade, Port, Airport & Marina Imps. Rev. Bonds, Series B, 5.00%, 2018 | 1,100 | 1,138 | ||||||
| Florida Higher Educ. Facs. Financial Auth., College & Univ. Imps. Rev. Ref. Bonds: | ||||||||
| 5.00%, 2022 | 1,000 | 1,130 | ||||||
| 5.00%, 2026 | 655 | 780 | ||||||
| Florida Housing Fin. Corp., Loc. or GTD Housing Rev. Bonds (GNMA/FNMA/FHLMC Insured), 5.00%, 2028 | 195 | 200 | ||||||
| Florida Housing Fin. Corp., Loc. or GTD Housing Rev. Bonds, Series B, 4.50%, 2029 | 305 | 312 | ||||||
| Florida Housing Fin. Corp., Loc. or GTD Housing Rev. Bonds, Series B (GNMA/FNMA/FHLMC Insured), 4.50%, 2029 | 200 | 207 | ||||||
| Florida Muni. Power Agcy., Misc. Rev. Ref. Bonds, Series A, 5.00%, 2020 | 600 | 662 | ||||||
| Florida State Dept. of Environmental Protection, Public Imps. Misc. Taxes Rev. Bonds, Series B, 5.00%, 2019 | 1,450 | 1,502 | ||||||
| Florida Water Pollution Control Fncg. Corp., Pollution Control Misc. Rev. Bonds, Series A: | ||||||||
| 5.00%, 2020 | 300 | 314 | ||||||
| 5.00%, 2022 | 400 | 419 | ||||||
| 5.00%, 2023 | 300 | 314 | ||||||
| Mid-Bay Bridge Auth., Highway Tolls Rev. Ref. Bonds, Series C, 5.00%, 2021 | 575 | 642 | ||||||
| Orlando Utils. Commission Water Rev. Ref. Bonds, Series B, 5.00%, 2023 | 225 | 237 | ||||||
| Orlando Utils. Commission Water Rev. Ref. Bonds, Series B (Pre-refunded with U.S. Treasury Obligations 04/01/19 @ 100), 5.00%, 2023 | 175 | 184 | ||||||
| Private Client Services Funds | 7 |
Capital Group Core Municipal Fund
Schedule of investments
October 31, 2017
.
| Bonds & notes - continued | Principal amount (000) | Value (000) | ||||||
| Florida - continued | ||||||||
| Palm Beach County Health Facs. Auth., Health Care Facs. Rev. Ref. Bonds, 5.00%, 2027 | $ | 300 | $ | 347 | ||||
| South Florida Water Mgmt. Dist., Cert. of Part. Lease Ref. Bonds, 5.00%, 2025 | 1,500 | 1,805 | ||||||
| Southeast Overtown Park West Comm Redev. Agcy., Tax Increment Allocation Loc. Housing Rev. Ref. Bonds, Series A-1:2 | ||||||||
| 5.00%, 2019 | 1,000 | 1,042 | ||||||
| 5.00%, 2021 | 785 | 856 | ||||||
| Tampa Bay Water Rev. Ref. Bonds, Series B, 5.00%, 2018 | 430 | 445 | ||||||
| Village Comm. Dev. Dist. No. 6, Special Assessment Ref. Bonds, 4.00%, 2020 | 355 | 373 | ||||||
| Volusia County Educ. Fac. Auth., College & Univ. Imps. Rev. Bonds, Series B: | ||||||||
| 5.00%, 2023 | 400 | 469 | ||||||
| 5.00%, 2028 | 1,000 | 1,162 | ||||||
| Winter Garden Village at Fowler Groves Comm. Dev. Dist., Special Assessment Ref. Bonds, 3.00%, 2024 | 1,185 | 1,181 | ||||||
| 23,262 | ||||||||
| Georgia - 2.6% | ||||||||
| Burke County Dev. Auth., Pollution Control Res. Recovery Rev. Bonds, 7.00%, 2023 | 965 | 974 | ||||||
| DeKalb County Hospital Auth., Health Care Facs. Imps. Rev. Bonds, 5.25%, 2020 | 1,260 | 1,351 | ||||||
| DeKalb Private Hospital Auth., Health Care Facs. Rev. Ref. Bonds, 5.00%, 2024 | 200 | 216 | ||||||
| Georgia Housing & Fin. Auth., Loc. or GTD Housing Rev. Bonds, 4.00%, 2044 | 2,430 | 2,562 | ||||||
| Georgia Housing & Fin. Auth., Loc. or GTD Housing Rev. Bonds, Series A, 4.00%, 2047 | 850 | 921 | ||||||
| Georgia Housing & Fin. Auth., Loc. or GTD Housing Rev. Bonds, Series B-1, 3.50%, 2045 | 430 | 452 | ||||||
| Georgia Housing & Fin. Auth., Loc. or GTD Housing Rev. Ref. Bonds, Series A-1, 3.50%, 2045 | 965 | 1,022 | ||||||
| Georgia State Road & Tollway Auth., Highway Imps. Misc. Taxes Rev. Bonds, Series A, 5.00%, 2018 | 400 | 409 | ||||||
| Georgia State Road & Tollway Auth., Rev. Ref. Bonds, Series B, 5.00%, 2021 | 1,000 | 1,125 | ||||||
| Muni. Electric Auth. of Georgia, Energy Res. Auth. Rev. Ref. Bonds, Sub-Series A, 4.00%, 2021 | 1,000 | 1,072 | ||||||
| Private Colleges & Universities Auth., College & Univ. Imps. Rev. Bonds, 5.00%, 2020 | 1,250 | 1,349 | ||||||
| 11,453 | ||||||||
| Guam - 0.4% | ||||||||
| Guam Govt. Waterworks Auth., Water Rev. Ref. Bonds, Series A, 5.00%, 2019 | 440 | 464 | ||||||
| Guam Intl. Airport Auth., Port, Airport & Marina Rev. Ref. Bonds, Series B, 5.00%, 2023 | 1,200 | 1,313 | ||||||
| 1,777 | ||||||||
| Hawaii - 0.3% | ||||||||
| State of Hawaii, G.O. Public Imps., Series DZ, 5.00%, 2019 | 645 | 695 | ||||||
| State of Hawaii, Port, Airport & Marina Rev. Ref. Bonds, Series A, 5.00%, 2022 | 400 | 439 | ||||||
| 1,134 | ||||||||
| Idaho - 0.5% | ||||||||
| Idaho Housing & Fin. Association, Rev. Ref. Bonds: | ||||||||
| 5.00%, 2020 | 1,000 | 1,098 | ||||||
| 5.00%, 2022 | 1,000 | 1,154 | ||||||
| 2,252 | ||||||||
| 8 | Private Client Services Funds |
Capital Group Core Municipal Fund
Schedule of investments
October 31, 2017
.
| Bonds & notes - continued | Principal amount (000) | Value (000) | ||||||
| Illinois – 9.7% | ||||||||
| Chicago O’Hare Intl. Airport, Port, Airport & Marina Imps. Rev. Bonds, Series E, 5.00%, 2026 | $ | 1,135 | $ | 1,370 | ||||
| Chicago O’Hare Intl. Airport, Port, Airport & Marina Rev. Ref. Bonds, Series B, 5.00%, 2021 | 250 | 277 | ||||||
| City of Chicago, Port, Airport & Marina Imps. Rev. Bonds, Series C (Assured GTY Insured), 5.25%, 2022 | 1,000 | 1,082 | ||||||
| City of Chicago, Port, Airport & Marina Rev. Ref. Bonds, Series B, 5.00%, 2021 | 500 | 555 | ||||||
| City of Chicago, Sewer Imps. Rev. Bonds: | ||||||||
| 5.00%, 2020 | 1,065 | 1,142 | ||||||
| 4.00%, 2021 | 1,000 | 1,068 | ||||||
| City of Chicago, Water Rev. Ref. Bonds, 5.00%, 2021 | 1,025 | 1,146 | ||||||
| Illinois Fin. Auth., College & Univ. Imps. Rev. Bonds, 5.00%, 2022 | 200 | 207 | ||||||
| Illinois Fin. Auth., College & Univ. Imps. Rev. Ref. Bonds, Series B (Mandatory Put 02/01/19 @ 100), 1.65%, 20251 | 2,000 | 2,011 | ||||||
| Illinois Fin. Auth., College & Univ. Rev. Ref. Bonds, 5.125%, 2020 | 750 | 785 | ||||||
| Illinois Fin. Auth., Health Care Facs. Imps. Rev. Bonds: | ||||||||
| 5.00%, 2022 | 850 | 976 | ||||||
| 5.00%, 2027 | 590 | 679 | ||||||
| Illinois Fin. Auth., Health Care Facs. Imps. Rev. Bonds, Series A: | ||||||||
| 5.00%, 2021 | 500 | 564 | ||||||
| 5.00%, 2027 | 250 | 291 | ||||||
| Illinois Fin. Auth., Health Care Facs. Imps. Rev. Bonds, Series A-3 (Mandatory Put 05/01/19 @ 100), 5.00%, 20301 | 1,000 | 1,053 | ||||||
| Illinois Fin. Auth., Health Care Facs. Imps. Rev. Bonds, Series C, 5.00%, 2026 | 600 | 696 | ||||||
| Illinois Fin. Auth., Health Care Facs. Rev. Ref. Bonds, 5.00%, 2027 | 930 | 1,105 | ||||||
| Illinois Fin. Auth., Health Care Facs. Rev. Ref. Bonds, Series A-1 (Mandatory Put 01/15/20 @ 100), 5.00%, 20301 | 1,500 | 1,620 | ||||||
| Illinois Fin. Auth., Misc. Rev. Ref. Bonds: | ||||||||
| 5.00%, 2025 | 125 | 149 | ||||||
| 5.00%, 2026 | 120 | 144 | ||||||
| Illinois Fin. Auth., Sewer Imps. Misc. Rev. Bonds: | ||||||||
| 5.00%, 2020 | 1,000 | 1,080 | ||||||
| 5.00%, 2020 | 700 | 768 | ||||||
| Illinois Fin. Auth., Water Util. Imps. Rev. Bonds: | ||||||||
| 5.00%, 2021 | 150 | 167 | ||||||
| 4.00%, 2026 | 1,000 | 1,134 | ||||||
| Illinois Housing Dev. Auth., Loc. or GTD Housing Rev. Bonds (Mandatory Put 05/15/25 @ 100) (FNMA Insured), 1.92%, 20501 | 2,000 | 1,984 | ||||||
| Illinois Muni. Electric Agcy., Energy Res. Auth. Imps. Rev. Ref. Bonds, Series A, 5.00%, 2027 | 1,000 | 1,184 | ||||||
| Illinois State Toll Highway Auth., Highway Tolls Rev. Bonds ,Series A: | ||||||||
| 5.00%, 2027 | 1,250 | 1,489 | ||||||
| 5.00%, 2028 | 1,110 | 1,313 | ||||||
| Illinois State Toll Highway Auth., Highway Tolls Rev. Ref. Bonds, Series A, 5.00%, 2020 | 500 | 555 | ||||||
| Illinois State Univ., College & Univ. Rev. Ref. Bonds (AGM Insured), 5.00%, 2022 | 1,465 | 1,636 | ||||||
| Regional Trans. Auth., Rev. Ref. Bonds (NATL-RE Insured), 6.00%, 2020 | 2,000 | 2,182 | ||||||
| Regional Trans. Auth., Sales Tax Rev. Ref. Bonds, Series A (AGM G.O. of Auth. Insured), 5.00%, 2018 | 1,200 | 1,227 | ||||||
| Regional Trans. Auth., Transit Rev. Rev. Ref. Bonds, Series A, 5.00%, 2028 | 2,000 | 2,406 | ||||||
| State of Illinois, G.O. Misc. Purposes, Series D, 5.00%, 2020 | 2,000 | 2,131 | ||||||
| State of Illinois, G.O. Misc. Rev. Ref. Bonds, 5.00%, 2026 | 1,000 | 1,092 | ||||||
| State of Illinois, Sales Tax Rev. Ref. Bonds, 5.00%, 2020 | 3,325 | 3,605 | ||||||
| State of Illinois, Sales Tax Rev. Ref. Bonds, Series C, 4.00%, 2026 | 1,000 | 1,089 | ||||||
| State of Illinois, Sales Tax Rev. Ref. Bonds, Sub-Series D, 4.00%, 2021 | 250 | 269 | ||||||
| Univ. of Illinois, College & Univ. Rev. Ref. Bonds, Series A (NATL-RE Insured), 5.50%, 2023 | 500 | 582 | ||||||
| Private Client Services Funds | 9 |
Capital Group Core Municipal Fund
Schedule of investments
October 31, 2017
.
| Bonds & notes - continued | Principal amount (000) | Value (000) | ||||||
| Illinois - continued | ||||||||
| Univ. of Illinois, Transit Imps. Cert. of Part. Lease Bonds, Series A, 5.25%, 2024 | $ | 30 | $ | 31 | ||||
| 42,844 | ||||||||
| Indiana - 0.6% | ||||||||
| City of Whiting, Ind. Imps. Rev. Bonds, (Mandatory Put 10/01/19 @ 100), 1.85%, 20441 | 500 | 503 | ||||||
| Indiana Fin. Auth., Health Care Facs. Rev. Ref. Bonds: | ||||||||
| 4.00%, 2019 | 500 | 525 | ||||||
| 5.50%, 2024 | 20 | 21 | ||||||
| Indiana Fin. Auth., Health Care Facs. Rev. Ref. Bonds (Pre-refunded with U.S Treasury Obligations to 05/01/2019 @ 100), 5.50%, 2024 | 80 | 85 | ||||||
| Indiana Fin. Auth., Health Care Facs. Rev. Ref. Bonds, Series N, 5.00%, 2020 | 1,200 | 1,300 | ||||||
| 2,434 | ||||||||
| Iowa - 0.7% | ||||||||
| Iowa Fin. Auth., Loc. or GTD Housing Rev. Bonds (GNMA/FNMA Insured), 2.15%, 2043 | 546 | 530 | ||||||
| Iowa Fin. Auth., Loc. or GTD Housing Rev. Bonds, Series A (GNMA/FHLMC COLL Insured), 4.00%, 2047 | 2,200 | 2,388 | ||||||
| Iowa Fin. Auth., Water Util. Imps. Misc. Rev. Bonds, 5.00%, 2019 | 300 | 320 | ||||||
| 3,238 | ||||||||
| Kansas - 0.1% | ||||||||
| Kansas Turnpike Auth., Highway Tolls Rev. Ref. Bonds, Series A, 5.00%, 2018 | 500 | 516 | ||||||
| 516 | ||||||||
| Kentucky - 0.4% | ||||||||
| Kentucky Asset Liability Commission, Public Imps. Rev. Bonds, 5.00%, 2024 | 1,500 | 1,790 | ||||||
| Kentucky Housing Corp., State Single Family Housing Rev. Bonds, Series B, 5.00%, 2027 | 180 | 188 | ||||||
| 1,978 | ||||||||
| Louisiana - 1.6% | ||||||||
| Louisiana Stadium & Exposition Dist., Misc. Rev. Ref. Bonds, Series A, 5.00%, 2022 | 1,500 | 1,726 | ||||||
| Louisiana State Citizens Prop. Insurance Corp., Misc. Rev. Ref. Bonds, Series A, 5.00%, 2023 | 1,000 | 1,166 | ||||||
| Parish of St Charles, Ind. Imps. Rev. Bonds (Mandatory Put 06/01/22 @ 100), 4.00%, 20401 | 2,000 | 2,124 | ||||||
| Tobacco Settlement Fncg. Corp., Rev. Ref. Bonds, Series A: | ||||||||
| 5.50%, 2028 | 1,000 | 1,022 | ||||||
| 5.50%, 2029 | 1,000 | 1,054 | ||||||
| 7,092 | ||||||||
| Maine - 0.3% | ||||||||
| Maine State Housing Auth., Loc. or GTD Housing Rev. Bonds, Series A, 4.00%, 2047 | 700 | 756 | ||||||
| Maine Turnpike Auth., Highway Tolls Rev. Ref. Bonds, 5.00%, 2020 | 600 | 660 | ||||||
| 1,416 | ||||||||
| Maryland - 2.8% | ||||||||
| County of Baltimore, Health Care Facs. Rev. Ref. Bonds, 5.00%, 2021 | 1,000 | 1,114 | ||||||
| 10 | Private Client Services Funds |
Capital Group Core Municipal Fund
Schedule of investments
October 31, 2017
.
| Bonds & notes - continued | Principal amount (000) | Value (000) | ||||||
| Maryland - continued | ||||||||
| Maryland Comm. Dev. Administration, Loc. or GTD Housing Rev. Ref. Bonds, Series C, 4.00%, 2044 | $ | 705 | $ | 744 | ||||
| Montgomery County Housing Opportunities Commission, Loc. or GTD Housing Rev. Bonds, Series A, 4.00%, 2048 | 1,000 | 1,080 | ||||||
| State of Maryland, G.O. Misc. Rev. Ref. Bonds, Series B, 5.00%, 2026 | 6,000 | 7,487 | ||||||
| Washington Suburban Sanitary Commission., G.O. Water Util. Imps. (County GTD), 5.00%, 2022 | 1,750 | 2,031 | ||||||
| 12,456 | ||||||||
| Massachusetts - 1.3% | ||||||||
| Massachusetts Dev. Fin. Agcy., College & Univ. Rev. Ref. Bonds: | ||||||||
| 5.00%, 2021 | 750 | 838 | ||||||
| 5.00%, 2022 | 875 | 999 | ||||||
| Massachusetts Dev. Fin. Agcy., Health Care Facs. Rev. Ref. Bonds, Series M (Mandatory Put 01/30/18 @ 100), 1.47%, 20381 | 1,960 | 1,961 | ||||||
| Massachusetts Health & Edu. Facs. Auth., College & Univ. Imps. Rev. Bonds, Series A, 5.00%, 2025 | 100 | 108 | ||||||
| Massachusetts Housing Fin. Agcy., Loc. or GTD Housing Rev. Bonds, Series 172, 4.00%, 2045 | 1,060 | 1,123 | ||||||
| Massachusetts Housing Fin. Agcy., Loc. or GTD Housing Rev. Ref. Bonds, Series 169, 4.00%, 2044 | 805 | 842 | ||||||
| 5,871 | ||||||||
| Michigan - 3.2% | ||||||||
| City of Detroit Sewage Disposal System Rev., Sewer Rev. Ref. Bonds (AGM Insured), 1.495%, 20321 | 1,500 | 1,369 | ||||||
| Detroit City School Dist., G.O. Prop. Tax Ref. Bonds, Series A, 5.00%, 2019 | 1,400 | 1,478 | ||||||
| Michigan Fin. Auth., Health Care Facs. Rev. Ref. Bonds, 5.00%, 2026 | 1,500 | 1,812 | ||||||
| Michigan Fin. Auth., Misc. Rev. Ref. Bonds, 5.00%, 2021 | 700 | 744 | ||||||
| Michigan Fin. Auth., Water Util. Imps. Rev. Bonds, 5.00%, 2024 | 1,000 | 1,173 | ||||||
| Michigan Fin. Auth., Water Util. Imps. Rev. Bonds (NATL-RE Insured), 5.00%, 2020 | 750 | 820 | ||||||
| Michigan State Housing Dev. Auth., Loc. or GTD Housing Rev. Bonds, 4.00%, 2044 | 1,395 | 1,493 | ||||||
| Michigan State Housing Dev. Auth., Loc. or GTD Housing Rev. Bonds, Series B, 3.50%, 2048 | 420 | 448 | ||||||
| Michigan Strategic Fund, Energy Res. Auth. Rev. Ref. Bonds, 5.625%, 2020 | 1,160 | 1,281 | ||||||
| Michigan Strategic Fund, Energy Res. Auth. Rev. Ref. Bonds (Mandatory Put 09/01/21 @ 100), 1.45%, 20301 | 1,000 | 988 | ||||||
| Wayne County Airport Auth., Port, Airport & Marina Imps. Rev. Bonds, Series A, 5.00%, 2022 | 850 | 990 | ||||||
| Wayne County Airport Auth., Port, Airport & Marina Rev. Ref. Bonds, Series C, 5.00%, 2017 | 1,500 | 1,505 | ||||||
| 14,101 | ||||||||
| Minnesota - 1.1% | ||||||||
| Minnesota Housing Fin. Agcy., Housing Rev. Bonds (GNMA/FNMA/FHLMC COLL Insured), 4.25%, 2028 | 205 | 210 | ||||||
| Minnesota Housing Fin. Agcy., Loc. or GTD Housing Rev. Bonds, 4.00%, 2038 | 700 | 739 | ||||||
| Minnesota Housing Fin. Agcy., Loc. or GTD Housing Rev. Bonds (GNMA/FNMA/FHLMC Insured): | ||||||||
| 4.00%, 2040 | 250 | 257 | ||||||
| 2.25%, 2042 | 591 | 572 | ||||||
| Minnesota Housing Fin. Agcy., Loc. or GTD Housing Rev. Bonds, (GNMA/FNMA/FHLMC COLL Insured), 4.00%, 2047 | 1,200 | 1,296 | ||||||
| Private Client Services Funds | 11 |
Capital Group Core Municipal Fund
Schedule of investments
October 31, 2017
.
| Bonds & notes - continued | Principal amount (000) | Value (000) | ||||||
| Minnesota - continued | ||||||||
| Minnesota Housing Fin. Agcy., Loc. or GTD Housing Rev. Bonds, Series B (GNMA/FNMA/FHLMC Insured), 3.50%, 2046 | $ | 1,685 | $ | 1,773 | ||||
| 4,847 | ||||||||
| Mississippi - 0.2% | ||||||||
| Mississippi Hospital Equipment & Facs. Auth., Health Care Facs. Rev. Ref. Bonds (Mandatory Put 01/09/18 @ 100), 1.55%, 20221,2 | 210 | 210 | ||||||
| State of Mississippi, Public Imps. Misc. Taxes Rev. Bonds, Series E, 5.00%, 2026 | 500 | 602 | ||||||
| 812 | ||||||||
| Missouri - 2.5% | ||||||||
| City of Saint Louis Airport Rev., Port, Airport & Marina Rev. Ref. Bonds, Series A (AGM Insured), 5.00%, 2021 | 1,000 | 1,127 | ||||||
| Deutsche Bank Spears/Lifers Trust, Health Care Facs. Rev. Ref. Bonds, 1.51%, 20451,2 | 1,000 | 1,000 | ||||||
| I-470 & 350 Trans. Dev. Dist., Sales Tax Rev. Ref. Bonds (Radian Insured), 4.60%, 2029 | 25 | 25 | ||||||
| Missouri Housing Dev. Commission, Loc. or GTD Housing Rev. Bonds (GNMA/FNMA/FHLMC Insured): | ||||||||
| 3.75%, 2038 | 240 | 254 | ||||||
| 3.50%, 2041 | 3,990 | 4,235 | ||||||
| 4.00%, 2041 | 1,070 | 1,123 | ||||||
| 3.25%, 2047 | 599 | 609 | ||||||
| Missouri State Environmental Imp. & Energy Ress. Auth., Water Rev. Ref. Bonds, 5.00%, 2019 | 100 | 105 | ||||||
| State of Missouri Health & Educ. Facs. Auth., Health Care Facs. Nursing Homes Rev. Bonds, 5.00%, 2026 | 1,435 | 1,728 | ||||||
| State of Missouri Health & Educ. Facs. Auth., Health Care Facs. Nursing Homes Rev. Bonds, Series A: | ||||||||
| 5.00%, 2022 | 440 | 495 | ||||||
| 5.00%, 2025 | 185 | 214 | ||||||
| 10,915 | ||||||||
| Montana - 0.1% | ||||||||
| Montana Board of Housing, Loc. or GTD Housing Rev. Bonds, Series A-2, 3.50%, 2044 | 245 | 261 | ||||||
| 261 | ||||||||
| Nebraska - 1.4% | ||||||||
| Central Plains Energy Project, Natural Gas Rev. Ref. Bonds (Mandatory Put 12/01/19 @ 100), 5.00%, 20391 | 1,250 | 1,343 | ||||||
| Nebraska Investment Fin. Auth., Loc. or GTD Housing Rev. Bonds, Series A: | ||||||||
| 4.00%, 2044 | 350 | 369 | ||||||
| 3.50%, 2046 | 2,615 | 2,766 | ||||||
| Nebraska Investment Fin. Auth., Loc. or GTD Housing Rev. Bonds, Series A (GNMA/FNMA/FHLMC Insured): | ||||||||
| 2.50%, 2034 | 40 | 40 | ||||||
| 3.00%, 2043 | 200 | 204 | ||||||
| Nebraska Investment Fin. Auth., Loc. or GTD Housing Rev. Bonds, Series C, 3.50%, 2045 | 1,040 | 1,099 | ||||||
| 12 | Private Client Services Funds |
Capital Group Core Municipal Fund
Schedule of investments
October 31, 2017
.
| Bonds & notes - continued | Principal amount (000) | Value (000) | ||||||
| Nebraska - continued | ||||||||
| Nebraska Investment Fin. Auth., Loc. or GTD Housing Rev. Bonds, Series C (GNMA/FNMA/FHLMC COLL Insured), 3.50%, 2046 | $ | 330 | $ | 346 | ||||
| 6,167 | ||||||||
| Nevada - 2.1% | ||||||||
| County of Clark, Ind. Rev. Ref. Bonds, Series A (Mandatory Put 04/01/20 @ 100), 1.875%, 20311 | 2,000 | 2,019 | ||||||
| County of Clark, Port, Airport & Marina Rev. Ref. Bonds, 5.00%, 2024 | 2,705 | 3,220 | ||||||
| County of Clark, Sales Tax Rev. Bonds, Series B, 4.00%, 2018 | 2,000 | 2,039 | ||||||
| Henderson Loc. Imps. Dist., Special Assessment Ref. Bonds: | ||||||||
| 2.50%, 2018 | 370 | 371 | ||||||
| 2.00%, 2023 | 500 | 493 | ||||||
| Las Vegas Valley Water Dist., G.O. Water Util. Imps. Prop. Tax Bonds, Series B, 5.00%, 2019 | 1,100 | 1,166 | ||||||
| 9,308 | ||||||||
| New Hampshire - 0.4% | ||||||||
| New Hampshire Health & Edu. Facs. Auth., College & Univ. Imps. Rev. Bonds: | ||||||||
| 5.00%, 2020 | 300 | 323 | ||||||
| 5.00%, 2021 | 600 | 665 | ||||||
| 5.00%, 2022 | 320 | 363 | ||||||
| New Hampshire Health & Edu. Facs. Auth., College & Univ. Imps. Rev. Ref. Bonds, 4.00%, 2022 | 575 | 627 | ||||||
| 1,978 | ||||||||
| New Jersey - 2.3% | ||||||||
| City of Atlantic, G.O. Prop. Tax Ref. Bonds, Series A (BAM, St. Aid Withhldg. Insured): | ||||||||
| 5.00%, 2020 | 100 | 107 | ||||||
| 5.00%, 2022 | 200 | 224 | ||||||
| Garden State Preservation Trust, Sales Tax Rev. Ref. Bonds, Series A: | ||||||||
| 5.00%, 2020 | 1,000 | 1,082 | ||||||
| 5.00%, 2021 | 200 | 220 | ||||||
| New Jersey Econ. Dev. Auth., Misc. Rev. Ref. Bonds, 5.00%, 2017 | 2,000 | 2,009 | ||||||
| New Jersey Econ. Dev. Auth., Rev. Ref. Bonds, Series PP, 5.00%, 2025 | 1,200 | 1,340 | ||||||
| New Jersey Higher Edu. Assistance Auth., Student Ln. Rev. Ref. Bonds, Series 1A, 5.00%, 2017 | 1,420 | 1,425 | ||||||
| New Jersey Transit Corp., Transit Rev. Ref. Bonds, Series A: | ||||||||
| 5.00%, 2018 | 1,300 | 1,337 | ||||||
| 5.00%, 2021 | 1,000 | 1,098 | ||||||
| Rutgers The State Univ. of New Jersey, College & Univ. Rev. Ref. Bonds, Series J, 5.00%, 2019 | 525 | 555 | ||||||
| South Jersey Trans. Auth. LLC, Highway Tolls Rev. Ref. Bonds, 5.00%, 2020 | 500 | 545 | ||||||
| 9,942 | ||||||||
| New Mexico - 0.5% | ||||||||
| City of Farmington, Energy Res. Auth. Rev. Ref. Bonds (Mandatory Put 04/01/20 @ 100), 1.875%, 20291 | 2,000 | 2,021 | ||||||
| New Mexico Educ. Assistance Foundation, Student Ln, Rev. Ref. Bonds, Series A-2 (GTD St. Lns. Insured), 1.966%, 20281 | 20 | 20 | ||||||
| 2,041 | ||||||||
| New York - 6.1% | ||||||||
| Brooklyn Arena Loc. Dev. Corp., Misc. Rev. Ref. Bonds, Series A, 5.00%, 2022 | 210 | 240 | ||||||
| Private Client Services Funds | 13 |
Capital Group Core Municipal Fund
Schedule of investments
October 31, 2017
.
| Bonds & notes - continued | Principal amount (000) | Value (000) | ||||||
| New York - continued | ||||||||
| Build NYC Res. Corp., Misc. Rev. Ref. Bonds, 5.00%, 2024 | $ | 395 | $ | 470 | ||||
| City of New York, G.O. Prop. Tax Ref. Bonds, Series C, 5.00%, 2027 | 2,000 | 2,470 | ||||||
| City of New York, G.O. Prop. Tax Ref. Bonds, Sub-Series J-4, 1.47%, 20251 | 1,000 | 1,000 | ||||||
| Metropolitan Trans. Auth., Misc. Rev. Ref. Bonds, Series B, 1.92%, 20201 | 2,000 | 2,038 | ||||||
| Metropolitan Trans. Auth., Transit Imps. Rev. Bonds, Sub-Series A-2 (Mandatory Put 06/01/20 @ 100), 1.50%, 20391 | 2,000 | 2,007 | ||||||
| Metropolitan Trans. Auth., Transit Imps. Rev. Bonds, Sub-Series D-2 (Mandatory Put 11/15/22 @ 100), 0.00%, 20441,3 | 750 | 750 | ||||||
| New York City Housing Dev. Corp. Multi-Family Mortgage Rev. Bond (8 Spruce Street), 3.50%, 2048 | 320 | 325 | ||||||
| New York City Transitional Fin. Auth., School Imps. Misc. Rev. Bonds, Series S-5 (St. Aid Withhldg. Insured), 5.00%, 2019 | 100 | 105 | ||||||
| New York State Dormitory Auth., Income Tax Rev. Ref. Bonds, Series A: | ||||||||
| 5.00%, 2021 | 1,500 | 1,681 | ||||||
| 5.00%, 2029 | 2,550 | 3,113 | ||||||
| New York State Dormitory Auth., Public Imps. Income Tax Rev. Bonds, Series B, 5.00%, 2023 | 2,000 | 2,349 | ||||||
| New York State Dormitory Auth., School Imps. Sales Tax Rev. Bonds, Series A, 5.00%, 2021 | 1,000 | 1,122 | ||||||
| New York State Thruway Auth., Highway Tolls Rev. Ref. Bonds, Series A, 5.00%, 2019 | 2,500 | 2,641 | ||||||
| Public Housing Capital Fund Trust I Rev. Bonds (HUD Ln. Insured), 4.50%, 20222 | 371 | 374 | ||||||
| Southold Loc. Dev. Corp., Health Care Facs. Nursing Homes Rev. Bonds, 3.125%, 2025 | 225 | 223 | ||||||
| State of New York Mortgage Agcy., Loc. or GTD Housing Rev. Bonds, 4.00%, 2047 | 1,495 | 1,619 | ||||||
| State of New York Mortgage Agcy., Loc. or GTD Housing Rev. Bonds, Series 197, 3.50%, 2044 | 2,430 | 2,567 | ||||||
| State of New York Mortgage Agcy., Loc. or GTD Housing Rev. Bonds, Series 203, 3.50%, 2047 | 1,825 | 1,939 | ||||||
| 27,033 | ||||||||
| North Carolina - 0.9% | ||||||||
| North Carolina Housing Fin. Agcy., Loc. or GTD Housing Rev. Bonds, Series 38-B, 4.00%, 2047 | 2,000 | 2,156 | ||||||
| North Carolina Muni. Power Agcy. No. 1, Energy Res. Auth. Rev. Ref. Bonds, Series A (Pre-refunded with U.S Govt. Securities to 01/01/2018 @ 100), 5.25%, 2020 | 175 | 176 | ||||||
| Raleigh Durham Airport Auth., Port, Airport, & Marina Rev. Ref. Bonds, Series A, 5.00%, 2019 | 1,500 | 1,587 | ||||||
| 3,919 | ||||||||
| North Dakota - 0.6% | ||||||||
| North Dakota Housing Fin. Agcy., Loc. or GTD Housing Rev. Bonds, 3.75%, 2042 | 275 | 285 | ||||||
| North Dakota Housing Fin. Agcy., Loc. or GTD Housing Rev. Bonds (FHA/INS Insured), 4.00%, 2048 | 500 | 545 | ||||||
| North Dakota Housing Fin. Agcy., Loc. or GTD Housing Rev. Bonds, Series B, 4.00%, 2036 | 615 | 658 | ||||||
| North Dakota Housing Fin. Agcy., Loc. or GTD Housing Rev. Ref. Bonds, Series D, 3.50%, 2046 | 930 | 988 | ||||||
| 2,476 | ||||||||
| Ohio - 3.2% | ||||||||
| City of Cleveland, Airport System, Port, Airport, & Marina Rev. Ref. Bonds, Series A, 5.00%, 2025 | 1,000 | 1,121 | ||||||
| County of Allen, Lease Rev. Ref. Bonds, Series B: | ||||||||
| 5.00%, 2018 | 1,000 | 1,032 | ||||||
| 5.00%, 2019 | 2,000 | 2,135 | ||||||
| 5.00%, 2020 | 1,030 | 1,133 | ||||||
| County of Hamilton, Health Care Facs. Rev. Ref. Bonds: | ||||||||
| 5.00%, 2025 | 400 | 464 | ||||||
| 5.00%, 2027 | 1,425 | 1,633 | ||||||
| 14 | Private Client Services Funds |
Capital Group Core Municipal Fund
Schedule of investments
October 31, 2017
.
| Bonds & notes - continued | Principal amount (000) | Value (000) | ||||||
| Ohio - continued | ||||||||
| County of Warren, Health Care Facs. Rev. Ref. Bonds, 5.00%, 2020 | $ | 200 | $ | 219 | ||||
| County of Warren, Health Care Facs. Rev. Ref. Bonds, Series A: | ||||||||
| 5.00%, 2027 | 300 | 354 | ||||||
| 5.00%, 2028 | 585 | 684 | ||||||
| Ohio Housing Fin. Agcy., Loc. or GTD Housing Rev. Bonds, Series A (GNMA/FNMA/FHLMC COLL Insured), 4.50%, 2047 | 980 | 1,076 | ||||||
| State of Ohio, Health Care Facs. Rev. Ref. Bonds: | ||||||||
| 5.00%, 2021 | 590 | 659 | ||||||
| 5.00%, 2022 | 1,375 | 1,577 | ||||||
| 5.00%, 2024 | 1,650 | 1,970 | ||||||
| 14,057 | ||||||||
| Oklahoma - 0.5% | ||||||||
| Oklahoma Dev. Fin. Auth., Health Care Facs. Rev. Ref. Bonds (Pre-refunded with U.S Treasury Obligations to 08/15/2018 @ 100), 5.00%, 2024 | 200 | 206 | ||||||
| Oklahoma Muni. Power Auth., Energy Res. Auth. Rev. Ref. Bonds, Series A (Mandatory Put 08/01/18 @ 100), 1.72%, 20231 | 1,215 | 1,216 | ||||||
| Tulsa Airports Imp. Trust, Port, Airport & Marina Rev. Ref. Bonds, Series D (BAM Insured), 5.00%, 2020 | 815 | 882 | ||||||
| 2,304 | ||||||||
| Oregon - 2.0% | ||||||||
| County of Gilliam, Res. Recovery Imps. Rev. Bonds, 1.50%, 2018 | 1,500 | 1,503 | ||||||
| Oregon State Facs. Auth., College & Univ. Rev. Ref. Bonds, Series A, 5.00%, 2031 | 600 | 691 | ||||||
| State of Oregon Dept. of Trans., Fuel Sales Tax Rev. Ref. Bonds, Series C, 5.00%, 2026 | 1,000 | 1,246 | ||||||
| State of Oregon Housing & Comm. Services Dept., Loc. or GTD Housing Rev. Bonds, 4.00%, 2047 | 3,195 | 3,470 | ||||||
| State of Oregon Housing & Comm. Services Dept., Loc. or GTD Housing Rev. Bonds, Series A, 4.00%, 2047 | 965 | 1,038 | ||||||
| State of Oregon, G.O. Unemployment & Welfare Fndg. Prop. Tax Bonds, Series 94-H, 4.00%, 2044 | 980 | 1,035 | ||||||
| 8,983 | ||||||||
| Pennsylvania - 3.6% | ||||||||
| Allegheny County Higher Edu. Building Auth., College & Univ. Imps. Rev. Ref. Bonds, Series A, 5.00%, 2022 | 400 | 453 | ||||||
| Butler County Hospital Auth., Health Care Facs. Rev. Ref. Bonds, 4.00%, 2021 | 325 | 349 | ||||||
| Geisinger Auth., Health Care Facs. Rev. Ref. Bonds (Mandatory Put 06/01/24 @ 100), 1.902%, 20281 | 1,500 | 1,516 | ||||||
| Montgomery County Ind. Dev. Auth., Health Care Facs. Nursing Homes Rev. Bonds, 5.00%, 2026 | 400 | 457 | ||||||
| Pennsylvania Housing Fin. Agcy., Loc. or GTD Housing Rev. Bonds Series 122, 4.00%, 2046 | 2,070 | 2,221 | ||||||
| Pennsylvania Housing Fin. Agcy., Loc. or GTD Housing Rev. Ref. Bonds, Series 120, 3.50%, 2046 | 1,035 | 1,091 | ||||||
| Pennsylvania Intergovernmental Cooperation Auth., Special Tax Rev. Ref. Bonds (BAM Insured), 5.00%, 2028 | 855 | 1,012 | ||||||
| Pennsylvania Turnpike Commission, Highway Tolls Rev. Bonds, Series A, 1.60%, 20181 | 1,500 | 1,504 | ||||||
| Pennsylvania Turnpike Commission, Highway Tolls Rev. Bonds, Series A-1, 5.00%, 2019 | 900 | 970 | ||||||
| Pennsylvania Turnpike Commission, Highway Tolls Rev. Ref. Bonds, Series B-1, 1.90%, 20211 | 950 | 965 | ||||||
| Pennsylvania Turnpike Commission, Misc. Rev. Ref. Bonds, Series A (AGM Insured), 5.25%, 2025 | 1,000 | 1,224 | ||||||
| Philadelphia School Dist., G.O. Prop. Tax Ref. Bonds, Series F (St. Aid Withhldg. Insured), 5.00%, 2023 | 1,500 | 1,711 | ||||||
| Univ. of Pittsburgh, College & Univ. Imps. Rev. Ref. Bonds, Series B, 5.25%, 2024 | 200 | 215 | ||||||
| Private Client Services Funds | 15 |
Capital Group Core Municipal Fund
Schedule of investments
October 31, 2017
.
| Bonds & notes - continued | Principal amount (000) | Value (000) | ||||||
| Pennsylvania - continued | ||||||||
| York County Ind. Dev. Auth., Ind. Rev. Ref. Bonds, Series A (Mandatory Put 06/01/20 @ 100), 2.55%, 20361 | $ | 2,000 | $ | 2,025 | ||||
| 15,713 | ||||||||
| Puerto Rico - 0.5% | ||||||||
| Puerto Rico Ind. Tourist Educ. Medical & Environmental Control Facs. Fncg. Auth., College & Univ. Rev. Ref. Bonds: | ||||||||
| 3.00%, 2018 | 500 | 469 | ||||||
| 5.00%, 2019 | 710 | 733 | ||||||
| Puerto Rico Infrastructure Fncg. Auth., Tobacco & Liquor Taxes Rev. Ref. Bonds, Series C (BHAC-CR FGIC Insured), 5.50%, 2020 | 1,000 | 1,096 | ||||||
| 2,298 | ||||||||
| Rhode Island - 0.5% | ||||||||
| Rhode Island Commerce Corp., Rev. Ref. Bonds: | ||||||||
| 5.00%, 2020 | 1,000 | 1,095 | ||||||
| 5.00%, 2022 | 500 | 575 | ||||||
| 5.00%, 2023 | 500 | 586 | ||||||
| 2,256 | ||||||||
| South Carolina - 1.9% | ||||||||
| South Carolina Jobs-Econ. Dev. Auth., Health Care Facs. Rev. Ref. Bonds, 5.00%, 2020 | 500 | 553 | ||||||
| South Carolina Jobs-Econ. Dev. Auth., Health Care Facs. Rev. Ref. Bonds, Series A, 5.00%, 2023 | 2,730 | 3,101 | ||||||
| South Carolina Public Service Auth., Misc. Rev. Ref. Bonds, Series C, 5.00%, 2022 | 350 | 402 | ||||||
| South Carolina Public Service Auth., Water Rev. Ref. Bonds, Series D, 5.00%, 2028 | 1,000 | 1,101 | ||||||
| South Carolina State Housing Fin. & Dev. Auth., Loc. or GTD Housing Rev. Bonds (GNMA/FNMA/FHLMC COLL FHA Insured), 4.00%, 2036 | 2,175 | 2,333 | ||||||
| South Carolina State Housing Fin. & Dev. Auth., Loc. or GTD Housing Rev. Bonds, Series 1 (GNMA COLL Insured), 4.50%, 2030 | 360 | 371 | ||||||
| South Carolina State Housing Fin. & Dev. Auth., Loc. or GTD Housing Rev. Bonds, Series A, 4.00%, 2047 | 490 | 528 | ||||||
| South Carolina State Housing Fin. & Dev. Auth., Loc. or GTD Housing Rev. Bonds, Series B (FHA/INS/GNMA/FNMA/FHLMC COLL Insured), 4.00%, 2047 | 180 | 196 | ||||||
| 8,585 | ||||||||
| South Dakota - 1.1% | ||||||||
| South Dakota Housing Dev. Auth., Loc. or GTD Housing Rev. Bonds, Series B (GNMA/FNMA/FHLMC COLL Insured), 4.00%, 2047 | 2,000 | 2,174 | ||||||
| South Dakota Housing Dev. Auth., Loc. or GTD Housing Rev. Bonds, Series D, 3.50%, 2046 | 960 | 1,017 | ||||||
| South Dakota Housing Dev. Auth., Loc. or GTD Housing Rev. Bonds, Series E, 4.00%, 2044 | 1,770 | 1,874 | ||||||
| 5,065 | ||||||||
| Tennessee - 1.3% | ||||||||
| City of Memphis, Energy Res. Auth. Rev. Ref. Bonds, 5.00%, 2018 | 100 | 104 | ||||||
| Knox County Health Educ. & Housing Fac. Board, Health Care Facs. Nursing Homes Rev. Ref. Bonds, 3.00%, 2018 | 400 | 403 | ||||||
| 16 | Private Client Services Funds |
Capital Group Core Municipal Fund
Schedule of investments
October 31, 2017
.
| Bonds & notes - continued | Principal amount (000) | Value (000) | ||||||
| Tennessee - continued | ||||||||
| Tennessee Housing Dev. Agcy., Loc. or GTD Housing Rev. Bonds: | ||||||||
| 4.50%, 2037 | $ | 420 | $ | 441 | ||||
| 4.00%, 2038 | 460 | 478 | ||||||
| 4.00%, 2042 | 885 | 958 | ||||||
| 4.00%, 2045 | 825 | 888 | ||||||
| Tennessee Housing Dev. Agcy., Loc. or GTD Housing Rev. Bonds, Series 2-B, 4.00%, 2046 | 1,215 | 1,315 | ||||||
| Tennessee Housing Dev. Agcy., Loc. or GTD Housing Rev. Bonds, Series A-1, 5.00%, 2027 | 145 | 148 | ||||||
| Tennessee Housing Dev. Agcy., Loc. or GTD Housing Rev. Bonds, Series B-2, 4.00%, 2042 | 890 | 964 | ||||||
| 5,699 | ||||||||
| Texas - 8.7% | ||||||||
| Arlington Higher Edu. Fin. Corp., Charter School AID Rev. Ref. Bonds, Series A (PSF-GTD Insured): | ||||||||
| 5.00%, 2023 | 885 | 1,042 | ||||||
| 5.00%, 2024 | 400 | 478 | ||||||
| Arlington Higher Edu. Fin. Corp., Charter School AID Rev. Ref. Bonds, Series B (PSF-GTD Insured): | ||||||||
| 5.00%, 2026 | 450 | 547 | ||||||
| 5.00%, 2027 | 250 | 304 | ||||||
| Austin Convention Enterprises, Inc., Econ. Dev. Rev. Ref. Bonds: | ||||||||
| 5.00%, 2019 | 350 | 364 | ||||||
| 5.00%, 2020 | 850 | 912 | ||||||
| Beaumont Independent School Dist., G.O. Prop. Tax Ref. Bonds (PSF-GTD Insured), 5.00%, 2026 | 1,500 | 1,837 | ||||||
| City of Austin, Energy Res. Auth. Rev. Ref. Bonds, 5.00%, 2022 | 1,500 | 1,753 | ||||||
| City of Dallas, Water Rev. Ref. Bonds, 5.00%, 2020 | 1,000 | 1,107 | ||||||
| City of Denton, Util. System, Energy Res. Auth. Imps. Water Rev. Ref. Bonds, 5.00%, 2028 | 2,000 | 2,409 | ||||||
| City of Houston, Port, Airport & Marina Rev. Ref. Bonds, Series B (NATL-RE FGIC Insured), 5.00%, 2025 | 275 | 276 | ||||||
| City of Houston, Water Rev. Ref. Bonds, Series C, 5.00%, 2018 | 1,500 | 1,560 | ||||||
| City Public Service Board of San Antonio, Energy Res. Auth. Imps. Rev. Bonds (Mandatory Put 12/01/20 @ 100), 3.00%, 20451 | 1,000 | 1,045 | ||||||
| City Public Service Board of San Antonio, Energy Res. Auth. Imps. Rev. Bonds, Series C (Mandatory Put 12/01/19 @ 100), 3.00%, 20451 | 1,000 | 1,032 | ||||||
| City Public Service Board of San Antonio, Energy Res. Auth. Rev. Ref. Bonds, 5.00%, 2028 | 1,000 | 1,226 | ||||||
| City Public Service Board of San Antonio, Energy Res. Auth. Rev. Ref. Bonds (Mandatory Put 12/01/19 @ 100), 2.25%, 20331 | 1,000 | 1,019 | ||||||
| Clifton Higher Edu. Fin. Corp., Charter School AID Rev. Ref. Bonds (PSF-GTD Insured), 5.00%, 2027 | 650 | 801 | ||||||
| Dallas-Fort Worth Intl. Airport Facs. Imp. Corp., Port, Airport & Marina Rev. Ref. Bonds, Series B, 5.00%, 2020 | 900 | 997 | ||||||
| Dickinson Independent School Dist., G.O. Prop. Tax Ref. Bonds (PSF-GTD Insured), (Mandatory Put 08/01/19 @ 100), 1.35%, 20371 | 500 | 500 | ||||||
| Harris County Cultural Edu. Facs. Fin. Corp., Energy Res. Auth. Imps. Rev. Bonds: | ||||||||
| 5.00%, 2017 | 445 | 446 | ||||||
| 5.00%, 2018 | 275 | 286 | ||||||
| Harris County Cultural Edu. Facs. Fin. Corp., Energy Res. Auth. Imps. Rev. Bonds, Series A, 5.00%, 2023 | 125 | 134 | ||||||
| Harris County Cultural Edu. Facs. Fin. Corp., Health Care Facs. Rev. Ref. Bonds, 1.82%, 20221 | 250 | 250 | ||||||
| Harris County Health Facs. Dev. Corp., Health Care Facs. Imps. Rev. Ref. Bonds, Series A-4 (AGM Insured), 1.10%, 20311 | 175 | 175 | ||||||
| Harris County-Houston Sports Auth., Hotel Occupancy Tax Rev. Ref. Bonds, Series A, 5.00%, 2019 | 400 | 429 | ||||||
| Private Client Services Funds | 17 |
Capital Group Core Municipal Fund
Schedule of investments
October 31, 2017
.
| Bonds & notes - continued | Principal amount (000) | Value (000) | ||||||
| Texas - continued | ||||||||
| Houston Independent School Dist., G.O. School Imps. Prop. Tax Bonds (PSF-GTD Insured), 5.00%, 2021 | $ | 1,500 | $ | 1,680 | ||||
| Katy Independent School Dist., G.O. Prop. Tax Ref. Bonds, Series C (PSF-GTD Insured), (Mandatory Put 08/15/19 @ 100), 1.38%, 20361 | 750 | 753 | ||||||
| Lamar Consolidated Independent School Dist., G.O. Prop. Tax Ref. Bonds, Series B (PSF-GTD Insured), 5.00%, 2022 | 1,000 | 1,149 | ||||||
| Longview Independent School Dist., G.O. Prop. Tax Ref. Bonds (PSF-GTD Insured), 5.00%, 2022 | 1,150 | 1,317 | ||||||
| North Texas Tollway Auth., Highway Tolls Rev. Ref. Bonds, Series A: | ||||||||
| 5.00%, 2019 | 3,000 | 3,134 | ||||||
| 5.00%, 2021 | 1,000 | 1,113 | ||||||
| 5.00%, 2030 | 300 | 353 | ||||||
| North Texas Tollway Auth., Highway Tolls Rev. Ref. Bonds, Series C (Mandatory Put 01/01/19 @ 100), 1.95%, 20381 | 1,000 | 1,005 | ||||||
| North Texas Tollway Auth., Misc. Rev. Ref. Bonds, 6.00%, 2021 | 15 | 15 | ||||||
| North Texas Tollway Auth., Misc. Rev. Ref. Bonds (Pre-refunded with FHL Banks/U.S. Treasury Obligations 01/01/18 @ 100), 6.00%, 2021 | 85 | 86 | ||||||
| North Texas Tollway Auth., Misc. Rev. Ref. Bonds, Series A, 6.00%, 2019 | 100 | 101 | ||||||
| Olmos Park Higher Edu. Facs. Corp., College & Univ. Imps. Rev. Ref. Bonds, 5.00%, 2019 | 980 | 1,051 | ||||||
| Red River Edu. Fin. Corp., College & Univ. Rev. Ref. Bonds, 5.00%, 2019 | 750 | 793 | ||||||
| Sam Rayburn Muni. Power Agcy., Energy Res. Auth. Imps. Rev. Bonds, 5.00%, 2020 | 1,180 | 1,291 | ||||||
| State of Texas, Cash Flow Mgmt. Rev. Notes, 4.00%, 2018 | 2,000 | 2,048 | ||||||
| Tarrant County Cultural Educ. Facs. Fin. Corp., Health Care Facs. Rev. Ref. Bonds (Pre-refunded with U.S Treasury Obligations to 08/15/2018 @ 100), 5.00%, 2023 | 170 | 175 | ||||||
| Tarrant County Cultural Educ. Facs. Fin. Corp., Health Care Facs. Rev. Ref. Bonds (Pre-refunded with U.S Treasury Strips to 08/15/2018 @ 100), 5.00%, 2023 | 180 | 186 | ||||||
| Texas Tech Univ., College & Univ. Imps. Rev. Bonds, Series A, 5.00%, 2026 | 1,000 | 1,220 | ||||||
| 38,399 | ||||||||
| Utah - 0.1% | ||||||||
| Utah Housing Corp., Loc. or GTD Housing Rev. Bonds, Series D2 (FHA/INS Insured), 4.00%, 2045 | 545 | 587 | ||||||
| 587 | ||||||||
| Virginia - 0.2% | ||||||||
| City of Chesapeake, Chesapeake Expressway Toll Road Rev., Highway Tolls Rev. Ref. Bonds, Series A, 4.00%, 2019 | 850 | 886 | ||||||
| 886 | ||||||||
| Washington - 1.0% | ||||||||
| Port of Seattle, Port, Airport & Marina Imps. Rev. Bonds, Series A-1, 5.25%, 2027 | 100 | 106 | ||||||
| State of Washington, G.O. Public Imps., Series D, 5.00%, 2028 | 1,000 | 1,232 | ||||||
| Washington Health Care Facs. Auth., Health Care Facs. Nursing Homes Rev. Bonds (Mandatory Put 01/01/21 @ 100), 1.92%, 20351 | 500 | 498 | ||||||
| Washington Health Care Facs. Auth., Health Care Facs. Rev. Ref. Bonds, 5.00%, 2026 | 500 | 581 | ||||||
| Washington Health Care Facs. Auth., Health Care Facs. Rev. Ref. Bonds, Series B (Mandatory Put 10/01/21 @ 100), 5.00%, 20421 | 800 | 905 | ||||||
| Washington State Housing Fin. Commission, Loc. or GTD Housing Rev. Ref. Bonds, 4.00%, 2047 | 1,000 | 1,076 | ||||||
| 4,398 | ||||||||
| 18 | Private Client Services Funds |
Capital Group Core Municipal Fund
Schedule of investments
October 31, 2017
.
| Bonds & notes - continued | Principal amount (000) | Value (000) | ||||||
| West Virginia - 0.8% | ||||||||
| County of Mason, Ind. Imps. Rev. Bonds, Series L (Mandatory Put 10/01/18 @ 100), 1.625%, 20221 | $ | 2,500 | $ | 2,508 | ||||
| West Virginia Econ. Dev. Auth., Energy Res. Auth. Rev. Ref. Bonds (Mandatory Put 04/01/19 @ 100), 1.90%, 20401 | 1,000 | 1,005 | ||||||
| 3,513 | ||||||||
| Wisconsin - 1.1% | ||||||||
| County of Milwaukee, Port, Airport & Marina Imps. Rev. Bonds, Series A, 5.00%, 2018 | 1,145 | 1,192 | ||||||
| Public Fin. Auth., Health Care Facs. Rev. Ref. Bonds, 5.00%, 2022 | 300 | 341 | ||||||
| Public Fin. Auth., Tax Increment Allocation Econ. Imps. Rev. Bonds, 0.00%, 20273 | 1,500 | 948 | ||||||
| Wisconsin Housing & Econ. Dev. Auth., Loc. or GTD Housing Rev. Bonds, Series C (FHA Insured HUD Ln. Insured GTD), 4.00%, 2048 | 620 | 673 | ||||||
| WPPI Energy, Energy Res. Auth. Imps. Rev. Bonds, Series A, 5.00%, 2020 | 800 | 876 | ||||||
| WPPI Energy, Energy Res. Auth. Imps. Rev. Ref. Bonds, Series A, 5.00%, 2026 | 500 | 610 | ||||||
| 4,640 | ||||||||
| Wyoming - 0.3% | ||||||||
| Wyoming Comm. Dev. Auth., Loc. or GTD Housing Rev. Bonds, Series 3, 3.00%, 2044 | 1,440 | 1,495 | ||||||
| 1,495 | ||||||||
| Total bonds & notes (cost: $392,229,000) | 397,103 | |||||||
| Short-term securities - 11.3% | ||||||||
| California Pollution Control Fncg. Auth., Energy Res. Auth. Rev. Ref. Bonds, Series C, 0.84%, November 01, 20261 | 4,300 | 4,300 | ||||||
| California State Dept. of Water Ress., Water Rev. Ref. Bonds, 0.84%, December 05, 20171 | 2,038 | 2,038 | ||||||
| California Statewide Comms. Dev. Auth., 0.91%, April 04, 20181 | 1,000 | 999 | ||||||
| City of Baton Rouge & Parish of East Baton Rouge, Ind. Rev. Ref. Bonds, 0.92%, November 01, 20191 | 1,900 | 1,900 | ||||||
| City of New York, G.O. Prop. Tax Ref. Bonds, Sub-Series J-5, 0.91%, August 01, 20281 | 4,440 | 4,440 | ||||||
| City of New York, G.O. Public Imps. Prop. Tax Bonds, Sub-Series H-1, 0.90%, January 01, 20361 | 400 | 400 | ||||||
| City of New York, G.O. Public Imps. Prop. Tax Bonds, Sub-Series L-5, 0.91%, April 01, 20351 | 2,300 | 2,300 | ||||||
| City of Phoenix Ind. Dev. Auth., Health Care Facs. Imps. Rev. Bonds, Series A, 0.90%, November 15, 20521 | 4,350 | 4,350 | ||||||
| Clarksville Public Building Auth., Public Imps. Misc. Rev. Bonds, 0.98%, January 01, 20331 | 565 | 565 | ||||||
| Connecticut Health & Edu. Facs. Auth., Rev. Bonds, 0.85%, November 13, 20171 | 3,000 | 3,000 | ||||||
| Deutsche Bank Spears/Lifers Trust, Health Care Facs. Rev. Ref. Bonds, 1.51%, March 01, 20451,2 | 2,000 | 2,000 | ||||||
| East Baton Rouge Parish Ind. Dev. Board Inc., Ind. Imps. Rev. Bonds, Series A, 0.90%, August 01, 20351 | 4,800 | 4,800 | ||||||
| East Baton Rouge Parish Ind. Dev. Board Inc., Ind. Imps. Rev. Bonds, Series B, 0.90%, December 01, 20401 | 2,300 | 2,300 | ||||||
| Illinois Fin. Auth., College & Univ. Imps. Rev. Bonds, Series A, 0.88%, August 01, 20441 | 2,700 | 2,700 | ||||||
| Los Angeles, California, Dept. of Water & Power Rev. Bonds, 0.87%, January 04, 20181 | 3,000 | 3,000 | ||||||
| New York City Transitional Fin. Auth., Public Imps. Sales Tax Rev. Bonds, 0.91%, August 01, 20411 | 2,100 | 2,100 | ||||||
| New York City, Water Rev. Ref. Bonds, 0.91%, June 15, 20481 | 6,950 | 6,950 | ||||||
| Private Client Services Funds | 19 |
Capital Group Core Municipal Fund
Schedule of investments
October 31, 2017
.
| Short-term securities - continued | Principal amount (000) | Value (000) | ||||||
| State of Ohio, Res. Recovery Rev. Ref. Bonds, (Mandatory Put 09/01/17 @ 100), 1.00%, November 01, 20351 | $ | 1,500 | $ | 1,500 | ||||
| Univ. of Michigan, College & Univ. Rev. Ref. Bonds, Series E (Mandatory Put 04/02/18 @ 100), 1.35%, April 01, 20331 | 600 | 600 | ||||||
| Total short-term securities (cost: $50,243,000) | 50,242 | |||||||
| Total investment securities (cost: $442,472,000) | 447,345 | |||||||
| Other assets less liabilities | (5,015 | ) | ||||||
| Net assets | $ | 442,330 | ||||||
| 1 | Coupon rate may change periodically. For short-term securities, the date of the next scheduled coupon rate change is considered to be the maturity date. |
| 2 | Acquired in a transaction exempt from registration under Rule 144A or section 4(2) of the Securities Act of 1933. May be resold in the U.S. in transactions exempt from registration, normally to qualified institutional buyers. At October 31, 2017, the aggregate market value of these securities amounted to $6,982,000, representing 1.58% of net assets. |
| 3 | Zero coupon bond; interest rate represents current yield to maturity. |
Key to abbreviations
| Agcy. | = | Agency |
| AGM | = | Assured Guaranty Municipal Corporation |
| Auth. | = | Authority |
| BAM | = | Build America Mutual Assurance Company |
| BHAC-CR | = | Berkshire Hathaway Assuranty Corp. |
| CA Mtg. Ins. | = | California Mortgage Insurance |
| COLL | = | Collateral |
| Comm. | = | Community |
| Comms. | = | Communities |
| Corp. | = | Corporation |
| Dept. | = | Department |
| Dev. | = | Development |
| Dist. | = | District |
| Econ. | = | Economic |
| Edu. | = | Education |
| Educ. | = | Educational |
| Fac. | = | Facility |
| Facs. | = | Facilities |
| FGIC | = | Financial Guaranty Insurance Company |
| FHA | = | Federal Housing Administration |
| FHL | = | Federal Home Loan |
| FHLMC | = | Federal Home Loan Mortgage Corporation |
| Fin. | = | Finance |
| Fncg. | = | Financing |
| Fndg. | = | Funding |
| FNMA | = | Federal National Mortgage Association |
| GNMA | = | Government National Mortgage Association |
| G.O. | = | General Obligation |
| Govt. | = | Government |
| GTD | = | Guaranteed |
| GTY | = | Guaranty |
| HUD | = | Housing and Urban Development |
| Imp. | = | Improvement |
| Imps. | = | Improvements |
| Ind. | = | Industrial |
| Intl. | = | International |
| Ln. | = | Loan |
| Lns. | = | Loans |
| Loc. | = | Local |
| Mgmt. | = | Management |
| Misc. | = | Miscellaneous |
| Muni. | = | Municipal |
| NATL-RE | = | National Reinsurance |
| No. | = | Number |
| Prop. | = | Property |
| PSF | = | Permanent School Fund |
| Redev. | = | Redevelopment |
| Ref. | = | Refunding |
| Res. | = | Resource |
| Ress. | = | Resources |
| Rev. | = | Revenue |
| Trans. | = | Transportation |
| Univ. | = | University |
| Util. | = | Utility |
| Utils. | = | Utilities |
| Withhldg. | = | Withholding |
See Notes to Financial Statements
| 20 | Private Client Services Funds |
Capital Group Short-Term Municipal Fund
Schedule of investments
October 31, 2017
Growth of $25,000 investment
Here’s how a $25,000 investment in the Capital Group Short-Term Municipal Fund grew between April 13, 2010, when the fund began operations, and October 31, 2017, the end of the fund’s fiscal year.
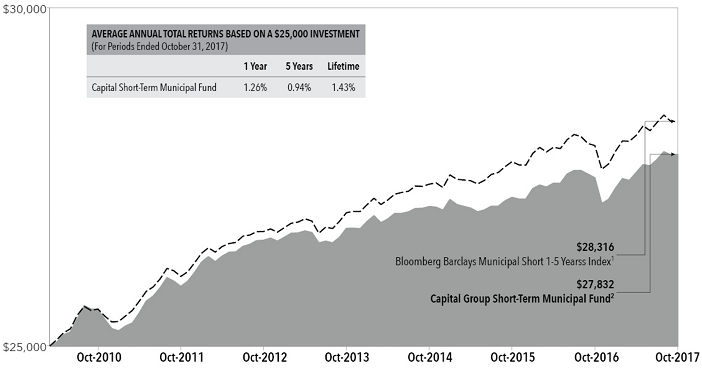
| 1 | The index is unmanaged, and its results include reinvested distributions but do not reflect the effect of sales charges, commissions, or expenses. |
| 2 | Includes reinvested dividends and capital gain distributions. |
Results are for past periods and are not predictive of results for future periods. Current and future results may be lower or higher than those shown. Share price and returns will vary so investors may lose money. The results shown are before taxes on fund distributions and sale of fund shares.
Investment portfolio – quality ratings*
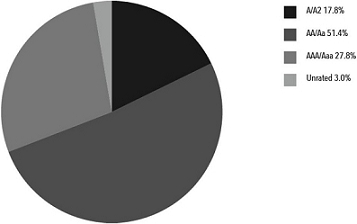
| * | Bond ratings, which typically range from Aaa/AAA (highest to D (lowest), are assigned by credit rating agencies such as Moody’s, Standard & Poors and/or Fitch as an indication of an Issuer’s credit-worthiness. If agency rating differ, securities are put in the highest category consistent with fund investment policies. When securities have not been rated by a rating agency (included in “unrated” at left), the investment advisor performs its own credit analysis and assigns comparable ratings that are used for compliance and fund investment policies. The ratings are not covered by the Report of Independent Registered Public Accounting Firm. |
| Private Client Services Funds | 21 |
Capital Group Short-Term Municipal Fund
Schedule of investments
October 31, 2017
| Bonds & notes - 87.9% | Principal amount (000) | Value (000) | ||||||
| Alabama - 1.1% | ||||||||
| Black Belt Energy Gas Dist., Natural Gas Util. Imps. Rev. Bonds, Series A (Mandatory Put 06/01/21 @ 100), 4.00%, 20461 | $ | 1,550 | $ | 1,673 | ||||
| 1,673 | ||||||||
| Arizona - 1.0% | ||||||||
| Arizona Health Facs. Auth., Health Care Facs. Rev. Ref. Bonds, Series A, 5.00%, 2021 | 300 | 334 | ||||||
| Maricopa County Ind. Dev. Auth., Charter School Aid, Rev. Ref. Bonds, Series A, 4.00%, 2021 | 565 | 608 | ||||||
| Salt River Project Agricultural Imps. & Power Dist., Energy Res. Auth. Rev. Ref. Bonds, Series A, 4.00%, 2017 | 550 | 551 | ||||||
| 1,493 | ||||||||
| California - 5.2% | ||||||||
| Bay Area Toll Auth., Highway Tolls Rev. Bonds (Mandatory Put 05/01/23 @ 100), 1.82%, 20451 | 1,500 | 1,527 | ||||||
| Bay Area Toll Auth., Highway Tolls Rev. Ref. Bonds, Series C (Mandatory Put 04/01/19 @ 100), 1.875%, 20471 | 500 | 503 | ||||||
| California Health Facs. Fncg. Auth., Health Care Facs. Imps. Rev. Bonds, Series A, 5.00%, 2021 | 250 | 287 | ||||||
| California Health Facs. Fncg. Auth., Health Care Facs. Rev. Ref. Bonds, Series C (Mandatory Put 10/15/19 @ 100), 5.00%, 20431 | 1,000 | 1,074 | ||||||
| California Infrastructure & Econ. Dev. Bank, Misc. Rev. Ref. Bonds (Mandatory Put 04/01/20 @ 100), 1.305%, 20381 | 1,000 | 1,005 | ||||||
| California State Dept. of Water Ress., Energy Res. Auth. Rev. Ref. Bonds, Series N, 5.00%, 2020 | 200 | 219 | ||||||
| Glendale Redev. Agcy. Successor Agcy., Tax Increment Allocation Ref. Bonds (AGM Insured), 4.00%, 2019 | 200 | 212 | ||||||
| Inglewood Redev. Agcy. Successor Agcy., Tax Increment Allocation Ref. Bonds (BAM Insured), 5.00%, 2023 | 200 | 235 | ||||||
| La Quinta Redev. Agcy. Successor Agcy., Tax Allocation, Ref. Bonds, 5.00%, 2020 | 600 | 665 | ||||||
| Menifee Union School Dist. Public Fncg. Auth., Special Tax Ref. Bonds, Series A, 4.00%, 2021 | 400 | 432 | ||||||
| San Diego County Regional Trans. Commission., Sales Tax Rev. Ref. Bonds, Series A, 5.00%, 2018 | 150 | 152 | ||||||
| San Diego Redev. Agcy. Successor Agcy., Tax Increment Allocation Rev. Ref. Bonds, Series A, 2.00%, 2018 | 1,000 | 1,009 | ||||||
| Westminster Redev. Agcy. Successor Agcy., Tax Increment Allocation Ref. Bonds (BAM Insured), 5.00%, 2028 | 375 | 451 | ||||||
| 7,771 | ||||||||
| Colorado - 0.4% | ||||||||
| E-470 Public Highway Auth., Misc. Rev. Ref. Bonds (Mandatory Put 09/01/19 @ 100), 1.725%, 20391 | 500 | 504 | ||||||
| Univ. of Colorado., College & Univ. Imps. Rev. Bonds, Series A, 5.00%, 2019 | 150 | 159 | ||||||
| 663 | ||||||||
| Connecticut - 3.7% | ||||||||
| Connecticut Housing Fin. Auth., Loc. or GTD Housing Rev. Bonds, Sub-Series B-2 (FHA/INS/GTD Insured), 4.00%, 2032 | 530 | 558 | ||||||
| Connecticut Housing Fin. Auth., Loc. or GTD Housing Rev. Ref. Bonds, 4.00%, 2044 | 820 | 860 | ||||||
| Connecticut Housing Fin. Auth., Loc. or GTD Housing Rev. Ref. Bonds, Series A-1, 4.00%, 2045 | 270 | 292 | ||||||
| Connecticut Housing Fin. Auth., Loc. or GTD Housing Rev. Ref. Bonds, Sub-Series A-1, 4.00%, 2047 | 995 | 1,075 | ||||||
| Connecticut Housing Fin. Auth., Loc. or GTD Housing Rev. Ref. Bonds, Sub-Series C-1: | ||||||||
| 4.00%, 2044 | 545 | 583 | ||||||
| 3.50%, 2045 | 595 | 631 | ||||||
| 22 | Private Client Services Funds |
Capital Group Short-Term Municipal Fund
Schedule of investments
October 31, 2017
| Bonds & notes - continued | Principal amount (000) | Value (000) | ||||||
| Connecticut - continued | ||||||||
| Connecticut State Health & Educ. Fac. Auth., College & Univ. Imps. Rev. Bonds, Series U1 (Mandatory Put 02/06/19 @ 100), 1.00%, 20331 | $ | 1,000 | $ | 997 | ||||
| Connecticut State Health & Educ. Fac. Auth., Health Care Facs. Rev Bonds (Mandatory Put 03/01/19 @ 100), 1.65%, 20291 | 500 | 503 | ||||||
| 5,499 | ||||||||
| Delaware - 0.2% | ||||||||
| Delaware Trans. Auth., Highway Tolls Rev. Bonds, 5.00%, 2021 | 230 | 258 | ||||||
| 258 | ||||||||
| Florida - 3.2% | ||||||||
| Citizens Prop. Insurance Corp., Misc. Purposes Rev. Bonds, Series A-1, 5.00%, 2019 | 600 | 635 | ||||||
| City of Cape Coral, Water Rev. Special Assessment Ref. Bonds (AGM Insured), 1.40%, 2018 | 250 | 250 | ||||||
| Florida Housing Fin. Corp., Loc. or GTD Housing Rev. Bonds, Series A (GNMA/FNMA/FHLMC Insured), 4.50%, 2029 | 190 | 196 | ||||||
| Florida Housing Fin. Corp., Loc. or GTD Housing Rev. Bonds, Series B (GNMA/FNMA/FHLMC Insured), 4.50%, 2029 | 110 | 114 | ||||||
| Orange County Health Facs. Auth., Health Care Facs. Nursing Homes Rev. Bonds, 4.00%, 2020 | 710 | 757 | ||||||
| Orlando Utils. Commission, Energy Res. Auth. Rev. Ref. Bonds, Series A (Mandatory Put 10/01/20 @ 100), 5.00%, 20271 | 2,000 | 2,209 | ||||||
| Palm Beach County Health Facs. Auth., Health Care Facs. Nursing Homes Rev. Ref. Bonds, 5.00%, 2021 | 500 | 556 | ||||||
| 4,717 | ||||||||
| Georgia - 3.5% | ||||||||
| City of Atlanta Dept., Port, Airport & Marina Imps. Rev. Bonds, Series B, 5.00%, 2019 | 95 | 99 | ||||||
| City of Atlanta, Water Rev. Ref. Bonds, Series A, 5.00%, 2020 | 1,000 | 1,111 | ||||||
| City of Atlanta, Water Rev. Ref. Bonds, Series B, 5.00%, 2019 | 1,000 | 1,076 | ||||||
| Georgia Housing & Fin. Auth., Loc. or GTD Housing Rev. Bonds, 4.00%, 2044 | 450 | 474 | ||||||
| Georgia Housing & Fin. Auth., Loc. or GTD Housing Rev. Bonds, Series A, 4.00%, 2047 | 850 | 921 | ||||||
| Georgia Housing & Fin. Auth., Loc. or GTD Housing Rev. Ref. Bonds, Series A-1, 3.50%, 2045 | 180 | 191 | ||||||
| Georgia State Road & Tollway Auth., Govt. Fndg. Grant Highway Imps. Rev. Bonds, Series A, 5.00%, 2019 | 1,155 | 1,224 | ||||||
| Muni. Electric Auth. of Georgia, Energy Res. Imps. Rev. Ref. Bonds, Series B, 5.00%, 2018 | 120 | 121 | ||||||
| 5,217 | ||||||||
| Hawaii - 0.0% | ||||||||
| State of Hawaii, G.O. Public Imps. Misc. Rev. Bonds, Series DZ, 5.00%, 2017 | 70 | 70 | ||||||
| 70 | ||||||||
| Illinois - 11.8% | ||||||||
| Chicago Midway Intl. Airport, Port, Airport & Marina Imps. Rev. Bonds, Series B, 5.00%, 2021 | 500 | 555 | ||||||
| Chicago O’hare Intl. Airport, Port, Airport & Marina Rev. Ref. Bonds, Series C: | ||||||||
| 5.00%, 2020 | 1,000 | 1,078 | ||||||
| 5.00%, 2021 | 650 | 721 | ||||||
| City of Chicago, Sewer Imps. Rev. Bonds: | ||||||||
| 5.00%, 2018 | 200 | 201 | ||||||
| 5.00%, 2022 | 1,010 | 1,133 | ||||||
| Private Client Services Funds | 23 |
Capital Group Short-Term Municipal Fund
Schedule of investments
October 31, 2017
| Bonds & notes - continued | Principal amount (000) | Value (000) | ||||||
| Illinois - continued | ||||||||
| City of Chicago, Sewer Rev. Ref. Bonds, Series C, 5.00%, 2021 | $ | 500 | $ | 549 | ||||
| City of Chicago, Water Util. Imps. Rev. Bonds, 3.00%, 2019 | 1,065 | 1,095 | ||||||
| Greater Chicago Metropolitan Water Reclamation Dist., G.O. Sewer Imps. Prop. Tax Bonds, Series B, 5.00%, 2017 | 300 | 301 | ||||||
| Illinois Fin. Auth., Health Care Facs. Rev. Ref. Bonds, 5.00%, 2027 | 500 | 594 | ||||||
| Illinois Fin. Auth., Health Care Facs. Rev. Ref. Bonds, Series A, 5.00%, 2021 | 1,100 | 1,240 | ||||||
| Illinois Fin. Auth., Health Care Facs. Rev. Ref. Bonds, Series A-1 (Mandatory Put 01/15/20 @ 100), 5.00%, 20301 | 1,000 | 1,080 | ||||||
| Illinois Fin. Auth., Misc. Rev. Ref. Bonds, 5.00%, 2023 | 100 | 116 | ||||||
| Illinois Fin. Auth., Misc. Rev. Ref. Bonds, 5.00%, 2024 | 130 | 153 | ||||||
| Illinois Fin. Auth., Res. Recovery Imps. Rev. Bonds (Mandatory Put 05/06/20 @ 100), 1.75%, 20421 | 500 | 502 | ||||||
| Illinois Fin. Auth., Sewer Imps. Misc. Rev. Bonds: | ||||||||
| 5.00%, 2021 | 1,000 | 1,128 | ||||||
| 5.00%, 2029 | 750 | 905 | ||||||
| Illinois Housing Dev. Auth., Loc. or GTD Housing Rev. Bonds (Mandatory Put 05/15/25 @ 100) (FNMA Insured), 1.92%, 20501 | 1,000 | 992 | ||||||
| Illinois State Toll Highway Auth., Highway Tolls Rev. Ref. Bonds, Series A, 5.00%, 2020 | 500 | 555 | ||||||
| Illinois State Toll Highway Auth., Highway Tolls Rev. Ref. Bonds, Series B, 5.00%, 2017 | 1,500 | 1,505 | ||||||
| Illinois State Univ., College & Univ. Rev. Ref. Bonds (AGM Insured), 5.00%, 2022 | 600 | 670 | ||||||
| State of Illinois, Sales Tax Rev. Ref. Bonds, 5.00%, 2020 | 1,000 | 1,084 | ||||||
| Univ. of Illinois, College & Univ. Rev. Certs. of Part. Ref. Bonds, Series A, 4.00%, 2019 | 1,000 | 1,037 | ||||||
| Volo Village Special Service Area No. 3 & 6, Special Tax Rev. Ref. Bonds, (AGM Insured), 3.00%, 2021 | 500 | 514 | ||||||
| 17,708 | ||||||||
| Indiana - 1.1% | ||||||||
| City of Whiting, Ind. Imps. Rev. Bonds, (Mandatory Put 10/01/19 @ 100), 1.85%, 20441 | 200 | 201 | ||||||
| Indiana Health Fac. Fncg. Auth., Health Care Facs. Imps. Rev. Bonds (Mandatory Put 03/01/19 @ 100), 4.00%, 20361 | 1,000 | 1,036 | ||||||
| Indiana Univ., College & Univ. Rev. Ref. Bonds, Series A, 3.00%, 2020 | 210 | 220 | ||||||
| Purdue Univ., College & Univ. Rev. Ref. Bonds, Series BB-1, 5.00%, 2020 | 200 | 220 | ||||||
| 1,677 | ||||||||
| Kentucky - 0.0% | ||||||||
| Kentucky Housing Corp., State Single Family Housing Rev. Bonds, Series B, 5.00%, 2027 | 60 | 63 | ||||||
| 63 | ||||||||
| Louisiana - 1.0% | ||||||||
| Louisiana Housing Fin. Agcy., Loc. or GTD Housing Rev. Bonds (GNMA/FNMA/FHLMC Insured), 4.60%, 2028 | 315 | 320 | ||||||
| Louisiana State Citizens Prop. Insurance Corp., Misc. Rev. Ref. Bonds, Series A, 5.00%, 2023 | 500 | 583 | ||||||
| Tobacco Settlement Fncg. Corp., Rev. Ref. Bonds, Series A: | ||||||||
| 5.00%, 2020 | 280 | 302 | ||||||
| 5.00%, 2021 | 250 | 275 | ||||||
| 1,480 | ||||||||
| Maine - 0.4% | ||||||||
| Maine State Housing Auth., Loc. or GTD Housing Rev. Bonds, Series A, 4.00%, 2047 | 500 | 540 | ||||||
| 540 | ||||||||
| 24 | Private Client Services Funds |
Capital Group Short-Term Municipal Fund
Schedule of investments
October 31, 2017
| Bonds & notes - continued | Principal amount (000) | Value (000) | ||||||
| Maryland - 0.7% | ||||||||
| County of Baltimore, Health Care Facs. Rev. Ref. Bond, 5.00%, 2022 | $ | 400 | $ | 457 | ||||
| Montgomery County Housing Opportunities Commission, Loc. or GTD Housing Rev. Bonds, Series A, 4.00%, 2048 | 500 | 540 | ||||||
| 997 | ||||||||
| Massachusetts - 2.1% | ||||||||
| Massachusetts Dev. Fin. Agcy., Health Care Facs. Rev. Ref. Bonds, Series M (Mandatory Put 01/30/18 @ 100), 1.47%, 20381 | 1,280 | 1,280 | ||||||
| Massachusetts Housing Fin. Agcy., Loc. or GTD Housing Rev. Bonds, Series 171, 4.00%, 2044 | 690 | 734 | ||||||
| Massachusetts Housing Fin. Agcy., Loc. or GTD Housing Rev. Bonds, Series 183, 3.50%, 2046 | 895 | 951 | ||||||
| Massachusetts Housing Fin. Agcy., Loc. or GTD Housing Rev. Ref. Bonds, Series 169, 4.00%, 2044 | 155 | 162 | ||||||
| 3,127 | ||||||||
| Michigan - 4.4% | ||||||||
| City of Detroit, Sewer Rev. Ref. Bonds, 5.50%, 2025 | 375 | 376 | ||||||
| City of Detroit, Sewer Rev. Ref. Bonds, Series A, 5.00%, 2023 | 700 | 789 | ||||||
| Detroit City School Dist, G.O. Prop. Tax Ref. Bonds, Series A, 5.00%, 2018 | 1,000 | 1,019 | ||||||
| Michigan Fin. Auth., Water Util. Imps. Rev. Bonds (NATL-RE Insured), 5.00%, 2020 | 500 | 546 | ||||||
| Michigan State Hospital Fin. Auth., Health Care Facs. Imps. Rev. Bonds, 0.95%, 20331 | 775 | 775 | ||||||
| Michigan State Hospital Fin. Auth., Health Care Facs. Imps. Rev. Bonds (Pre-refunded with U.S. | ||||||||
| Govt. Securities to 02/01/18 @ 100), 0.95%, 20331 | 25 | 25 | ||||||
| Michigan State Housing Dev. Auth., Loc. or GTD Housing Rev. Bonds, 4.00%, 2044 | 795 | 851 | ||||||
| Michigan State Housing Dev. Auth., Loc. or GTD Housing Rev. Bonds, Series B, 3.50%, 2048 | 140 | 149 | ||||||
| Michigan Strategic Fund, Energy Res. Auth. Rev. Ref. Bonds, Series SE (Mandatory Put 09/01/21 @ 100), 1.45%, 20291 | 325 | 321 | ||||||
| State of Michigan, Highway Imps. Rev. Ref. Bonds, 5.00%, 2020 | 1,000 | 1,087 | ||||||
| Wayne County Airport Auth., Port, Airport & Marina Imps. Rev. Bonds, Series A, 5.00%, 2018 | 300 | 313 | ||||||
| Wayne County Airport Auth., Port, Airport & Marina Rev. Ref. Bonds, Series G, 5.00%, 2021 | 300 | 342 | ||||||
| 6,593 | ||||||||
| Minnesota - 0.1% | ||||||||
| Minnesota Housing Fin. Agcy., Loc. or GTD Housing Rev. Bonds (GNMA/FNMA/FHLMC Insured), 4.00%, 2040 | 105 | 108 | ||||||
| 108 | ||||||||
| Missouri - 2.2% | ||||||||
| City of Saint Louis Airport Rev., Port, Airport & Marina Rev. Ref. Bonds, Series A (AGM Insured), 5.00%, 2021 | 1,500 | 1,691 | ||||||
| Missouri Housing Dev. Commission, Loc. or GTD Housing Rev. Bonds (GNMA/FNMA/FHLMC Insured), 3.50%, 2041 | 1,350 | 1,433 | ||||||
| Missouri Housing Dev. Commission, Loc. or GTD Housing Rev. Bonds, (GNMA/FNMA/FHLMC Insured), 4.25%, 2030 | 235 | 243 | ||||||
| 3,367 | ||||||||
| Montana - 0.2% | ||||||||
| Montana Board of Housing, Loc. or GTD Housing Rev. Bonds, Series A-2, 3.50%, 2044 | 240 | 256 | ||||||
| 256 | ||||||||
| Private Client Services Funds | 25 |
Capital Group Short-Term Municipal Fund
Schedule of investments
October 31, 2017
| Bonds & notes - continued | Principal amount (000) | Value (000) | ||||||
| Nebraska - 2.0% | ||||||||
| Central Plains Energy Project, Natural Gas Rev. Ref. Bonds (Mandatory Put 12/01/19 @ 100), 5.00%, 20391 | $ | 1,000 | $ | 1,074 | ||||
| Nebraska Investment Fin. Auth., Loc. or GTD Housing Rev. Bonds, Series A: | ||||||||
| 3.00%, 2044 | 225 | 229 | ||||||
| 4.00%, 2044 | 685 | 722 | ||||||
| 3.50%, 2046 | 370 | 392 | ||||||
| Nebraska Investment Fin. Auth., Loc. or GTD Housing Rev. Bonds, Series A (GNMA/FNMA/FHLMC Insured), 2.50%, 2034 | 35 | 35 | ||||||
| Nebraska Investment Fin. Auth., Loc. or GTD Housing Rev. Bonds, Series C (GNMA/FNMA/FHLMC COLL Insured), 3.50%, 2046 | 300 | 315 | ||||||
| Nebraska Investment Fin. Auth., Loc. or GTD Housing Rev. Bonds, Series E (GNMA/FNMA/FHLMC Insured), 3.00%, 2043 | 275 | 280 | ||||||
| 3,047 | ||||||||
| New Jersey - 2.1% | ||||||||
| Garden State Preservation Trust, Sales Tax Rev. Ref. Bonds, Series A, 5.00%, 2018 | 550 | 570 | ||||||
| New Jersey Econ. Dev. Auth., Lease Rev. Ref. Bonds, Series PP, 5.00%, 2019 | 750 | 786 | ||||||
| New Jersey Health Care Facs. Fncg. Auth., Health Care Facs. Imps. Rev. Bonds, Series A, 5.00%, 2022 | 200 | 229 | ||||||
| New Jersey Trans. Trust Fund Auth., Transit Imps. Misc. Rev. Bonds, Series AA, 5.00%, 2021 | 500 | 547 | ||||||
| New Jersey Transit Corp., Transit Rev. Ref. Bonds, Series A, 5.00%, 2018 | 750 | 771 | ||||||
| Rutgers The State Univ. of New Jersey, College & Univ. Rev. Ref. Bonds, Series J, 5.00%, 2019 | 225 | 238 | ||||||
| 3,141 | ||||||||
| New Mexico - 1.4% | ||||||||
| City of Farmington, Energy Res. Auth. Rev. Ref. Bonds (Mandatory Put 04/01/20 @ 100), 1.875%, 20291 | 1,000 | 1,011 | ||||||
| City of Farmington, Energy Res. Auth. Rev. Ref. Bonds, Series A (Mandatory Put 04/01/20 @ 100), 1.875%, 20291 | 1,000 | 1,009 | ||||||
| New Mexico Educ. Assistance Foundation, Student Ln, Rev. Ref. Bonds, Series A-2 (GTD St. Lns. Insured), 1.966%, 20281 | 20 | 20 | ||||||
| 2,040 | ||||||||
| New York - 7.0% | ||||||||
| City of New York, G.O. Prop. Tax Ref. Bonds, Series C, 5.00%, 2028 | 300 | 367 | ||||||
| City of New York, G.O. Prop. Tax Ref. Bonds, Sub-Series J-4, 1.47%, 20251 | 2,000 | 1,999 | ||||||
| Housing Dev. Corp., Loc. or GTD Housing Rev. Bonds, Series C-2, 1.70%, 2021 | 350 | 352 | ||||||
| Metropolitan Trans. Auth., Misc. Rev. Ref. Bonds, Series B-3B, 1.82%, 20181 | 650 | 654 | ||||||
| Metropolitan Trans. Auth., Transit Imps. Rev. Bonds, Sub-Series A-2 (Mandatory Put 06/01/20 @ 100), 1.50%, 20391 | 2,600 | 2,609 | ||||||
| New York City Transitional Fin. Auth., Public Imps. Income Tax Rev. Bonds, 5.00%, 2019 | 750 | 807 | ||||||
| New York State Dormitory Auth., Income Tax Rev. Ref. Bonds, Series A, 5.00%, 2029 | 450 | 549 | ||||||
| New York State Housing Fin. Agcy., Green Rev. Bonds, Series H (SONYMA, GNMA/FNMA/FHLMC COLL Insured), 1.65%, 2021 | 350 | 349 | ||||||
| Public Housing Capital Fund Trust I Rev. Bonds (HUD Ln. Insured), 4.50%, 20222 | 274 | 276 | ||||||
| State of New York Mortgage Agcy., Loc. or GTD Housing Rev. Bonds, 4.00%, 2047 | 1,375 | 1,490 | ||||||
| State of New York Mortgage Agcy., Loc. or GTD Housing Rev. Bonds, Series 197, 3.50%, 2044 | 975 | 1,030 | ||||||
| 10,482 | ||||||||
| 26 | Private Client Services Funds |
Capital Group Short-Term Municipal Fund
Schedule of investments
October 31, 2017
| Bonds & notes - continued | Principal amount (000) | Value (000) | ||||||
| North Carolina - 1.2% | ||||||||
| City of Charlotte, Port, Airport & Marina Imps. Rev. Bonds, Series A, 5.00%, 2021 | $ | 810 | $ | 889 | ||||
| North Carolina Housing Fin. Agcy., Loc. or GTD Housing Rev. Bonds, Series 38-B, 4.00%, 2047 | 400 | 431 | ||||||
| State of North Carolina, Govt. Fndg. Grant Highway Imps. Rev. Bonds, 5.00%, 2020 | 400 | 435 | ||||||
| 1,755 | ||||||||
| North Dakota - 1.5% | ||||||||
| North Dakota Housing Fin. Agcy., Loc. or GTD Housing Rev. Bonds: | ||||||||
| 4.00%, 2038 | 1,330 | 1,426 | ||||||
| 3.75%, 2042 | 125 | 129 | ||||||
| North Dakota Housing Fin. Agcy., Loc. or GTD Housing Rev. Bonds, Series D, 4.00%, 2046 | 610 | 658 | ||||||
| 2,213 | ||||||||
| Ohio - 1.8% | ||||||||
| County of Warren, Health Care Facs. Rev. Ref. Bonds, 4.00%, 2018 | 220 | 224 | ||||||
| County of Warren, Health Care Facs. Rev. Ref. Bonds, Series A, 5.00%, 2022 | 400 | 459 | ||||||
| Ohio Housing Fin. Agcy., Loc. or GTD Housing Rev. Bonds, (GNMA/FNMA/FHLMC Insured), 4.50%, 2028 | 225 | 233 | ||||||
| Ohio Housing Fin. Agcy., Loc. or GTD Housing Rev. Bonds, Series A (GNMA/FNMA/FHLMC COLL Insured), 4.50%, 2047 | 660 | 724 | ||||||
| State of Ohio, Health Care Facs. Rev. Ref. Bonds, 5.00%, 2021 | 1,000 | 1,116 | ||||||
| 2,756 | ||||||||
| Oklahoma - 0.5% | ||||||||
| Oklahoma Housing Fin. Agcy., Loc. or GTD Housing Rev. Bonds (GNMA COLL Insured), 5.00%, 2043 | 545 | 579 | ||||||
| Stillwater Utils. Auth., Power Plants (Non Nuclear) Multiple Util. Rev. Ref. Bonds, Series A, 4.00%, 2019 | 150 | 158 | ||||||
| 737 | ||||||||
| Oregon - 3.6% | ||||||||
| County of Gilliam, Res. Recovery Imps. Rev. Bonds, 1.50%, 2018 | 1,000 | 1,002 | ||||||
| Oregon State Facs. Auth., Health Care Facs. Rev. Ref. Bonds (Mandatory Put 09/15/18 @ 100), 1.92%, 20221 | 2,300 | 2,307 | ||||||
| State of Oregon Housing & Comm. Services Dept., Loc. or GTD Housing Rev. Bonds, 4.00%, 2047 | 965 | 1,048 | ||||||
| State of Oregon, G.O. Unemployment & Welfare Fndg. Prop. Tax Bonds, Series 94-H, 4.00%, 2044 | 980 | 1,036 | ||||||
| 5,393 | ||||||||
| Pennsylvania - 2.5% | ||||||||
| Butler County Hospital Auth., Health Care Facs. Rev. Ref. Bonds, 3.00%, 2018 | 250 | 252 | ||||||
| Pennsylvania Econ. Dev. Fncg. Auth., Health Care Facs. Imps. Rev. Bonds, Series A, 4.00%, 2018 | 750 | 772 | ||||||
| Pennsylvania Housing Fin. Agcy., Loc. or GTD Housing Rev. Bonds Series 122, 4.00%, 2046 | 515 | 552 | ||||||
| Pennsylvania Turnpike Commission, Highway Tolls Rev. Ref. Bonds, 5.00%, 2021 | 1,500 | 1,681 | ||||||
| School Dist. of Philadelphia, G.O. Prop. Tax Ref. Bonds, Series F (St. Aid Withhldg. Insured), 5.00%, 2019 | 500 | 529 | ||||||
| 3,786 | ||||||||
| Private Client Services Funds | 27 |
Capital Group Short-Term Municipal Fund
Schedule of investments
October 31, 2017
| Bonds & notes - continued | Principal amount (000) | Value (000) | ||||||
| Puerto Rico - 0.2% | ||||||||
| Puerto Rico Ind. Tourist Educ. Medical & Environmental Control Facs. Fncg. Auth., College & Univ. Imps. Rev. Ref. Bonds, 5.00%, 2018 | $ | 350 | $ | 356 | ||||
| 356 | ||||||||
| Rhode Island - 1.2% | ||||||||
| Rhode Island Commerce Corp., Govt. Fndg. Grant Rev. Ref. Bonds, 5.00%, 2021 | 920 | 1,035 | ||||||
| Rhode Island Housing & Mortgage Fin. Corp., Loc. or GTD Housing Rev. Ref. Bonds, 4.00%, 2033 | 715 | 752 | ||||||
| 1,787 | ||||||||
| South Carolina - 0.9% | ||||||||
| South Carolina State Housing Fin. & Dev. Auth., Loc. or GTD Housing Rev. Bonds (GNMA/FNMA/FHLMC COLL FHA Insured), 4.00%, 2036 | 655 | 703 | ||||||
| South Carolina State Housing Fin. & Dev. Auth., Loc. or GTD Housing Rev. Bonds, Series 1 (GNMA COLL Insured), 4.50%, 2030 | 215 | 222 | ||||||
| South Carolina State Public Service Auth., Nuclear Rev. Ref. Bonds, Series A, 5.00%, 2022 | 400 | 459 | ||||||
| 1,384 | ||||||||
| South Dakota - 0.9% | ||||||||
| South Dakota Housing Dev. Auth., Loc. or GTD Housing Rev. Bonds, Series D, 3.50%, 2046 | 1,010 | 1,070 | ||||||
| South Dakota Housing Dev. Auth., Loc. or GTD Housing Rev. Bonds, Series E, 4.00%, 2044 | 310 | 328 | ||||||
| 1,398 | ||||||||
| Tennessee - 2.3% | ||||||||
| Tennessee Housing Dev. Agcy., Loc. or GTD Housing Rev. Bonds: | ||||||||
| 4.50%, 2037 | 230 | 241 | ||||||
| 4.00%, 2038 | 245 | 255 | ||||||
| 4.00%, 2042 | 390 | 422 | ||||||
| 4.00%, 2045 | 1,635 | 1,759 | ||||||
| 4.00%, 2045 | 675 | 712 | ||||||
| 3,389 | ||||||||
| Texas - 10.1% | ||||||||
| Alamo Comm. College Dist., G.O. College & Univ. Imps. Prop. Tax Bonds, 5.00%, 2028 | 350 | 433 | ||||||
| Arlington Higher Edu. Fin. Corp., Charter School Aid, Rev. Ref. Bonds, Series A (PSF-GTD Insured), 5.00%, 2022 | 635 | 735 | ||||||
| City of Austin, Electric Util., Energy Res. Auth. Rev. Ref. Bonds, Series A, 5.00%, 2021 | 525 | 598 | ||||||
| City Public Service Board of San Antonio, Energy Res. Auth. Imps. Rev. Bonds (Mandatory Put 12/01/20 @ 100), 3.00%, 20451 | 1,000 | 1,045 | ||||||
| City Public Service Board of San Antonio, Energy Res. Auth. Imps. Rev. Bonds, Series C (Mandatory Put 12/01/19 @ 100), 3.00%, 20451 | 1,000 | 1,032 | ||||||
| City Public Service Board of San Antonio, Energy Res. Auth. Rev. Ref. Bonds (Mandatory Put 12/01/18 @ 100), 2.00%, 20271 | 350 | 351 | ||||||
| Harris County Health Facs. Dev. Corp., Health Care Facs. Imps. Rev. Ref. Bonds, Series A-4 (AGM Insured), 1.10%, 20311 | 150 | 150 | ||||||
| Houston Higher Edu. Fin. Corp., Charter School Aid, Rev. Ref. Bonds, Series A (PSF-GTD Insured), 5.00%, 2018 | 455 | 460 | ||||||
| Katy Independent School Dist., G.O. Prop. Tax Ref. Bonds, Series C (PSF-GTD Insured), (Mandatory Put 08/15/19 @ 100), 1.38%, 20361 | 650 | 653 | ||||||
| North Texas Tollway Auth., Highway Tolls Rev. Ref. Bonds, Series A, 5.00%, 2019 | 2,000 | 2,089 | ||||||
| 28 | Private Client Services Funds |
Capital Group Short-Term Municipal Fund
Schedule of investments
October 31, 2017
| Bonds & notes - continued | Principal amount (000) | Value (000) | ||||||
| Texas - continued | ||||||||
| North Texas Tollway Auth., Highway Tolls Rev. Ref. Bonds, Series C (Mandatory Put 01/01/19 @ 100), 1.95%, 20381 | $ | 600 | $ | 603 | ||||
| Northside Independent School Dist., G.O. School Imps. Prop. Tax Bonds (PSF-GTD Insured), (Mandatory Put 06/01/20 @ 100), 1.45%, 20471 | 200 | 200 | ||||||
| Olmos Park Higher Edu. Facs. Corp., College & Univ. Imps. Rev. Ref. Bonds, 5.00%, 2019 | 400 | 429 | ||||||
| Rockwall Independent School Dist., G.O. Prop. Tax Ref. Bonds (PSF-GTD Insured), 5.00%, 2022 | 800 | 917 | ||||||
| State of Texas, Cash Flow Mgmt. Rev. Notes, 4.00%, 2018 | 2,000 | 2,048 | ||||||
| State of Texas, G.O. Public Imps. Prop. Tax Bonds, (Mandatory Put 10/01/18 @ 100), 1.30%, 20411 | 1,000 | 1,001 | ||||||
| Texas A&M Univ., College & Univ. Rev. Ref. Bonds, Series B, 5.00%, 2021 | 450 | 508 | ||||||
| Texas A&M Univ., College & Univ. Rev. Ref. Bonds, Series C, 5.00%, 2021 | 600 | 678 | ||||||
| Texas Dept. of Housing & Comm. Affairs, Loc. or GTD Housing Rev. Bonds, Series A (GNMA/FNMA/FHLMC Insured), 5.00%, 2029 | 135 | 141 | ||||||
| Texas State Univ. System, College & Univ. Rev. Ref. Bonds, Series A, 5.00%, 2020 | 550 | 598 | ||||||
| Texas Tech Univ., College & Univ. Imps. Rev. Bonds, Series A, 5.00%, 2019 | 500 | 525 | ||||||
| 15,194 | ||||||||
| Utah - 0.3% | ||||||||
| Utah Housing Corp., Loc. or GTD Housing Rev. Bonds, Series D2 (FHA/INS Insured), 4.00%, 2045 | 440 | 474 | ||||||
| 474 | ||||||||
| Virginia - 1.1% | ||||||||
| Northern Virginia Trans. Auth., Transit Imps. Misc. Taxes Rev. Bonds, 5.00%, 2020 | 250 | 274 | ||||||
| Virginia Commonwealth Trans. Board, Govt. Fndg. Grant Transit Imps. Rev. Bonds, 5.00%, 2019 | 600 | 643 | ||||||
| Wise County Ind. Dev. Auth., Energy Res. Auth. Res. Recovery Imps. Rev. Bonds, Series A (Mandatory Put 06/01/20 @ 100), 1.875%, 20401 | 750 | 758 | ||||||
| 1,675 | ||||||||
| Washington - 2.2% | ||||||||
| State of Washington, Highway Imps. Rev. Bonds: | ||||||||
| 5.00%, 2018 | 1,500 | 1,548 | ||||||
| 5.00%, 2019 | 900 | 961 | ||||||
| Washington State Housing Fin. Commission, Loc. or GTD Housing Rev. Bonds, Series A (GNMA/FNMA/FHLMC Insured), 4.50%, 2029 | 145 | 150 | ||||||
| Washington State Housing Fin. Commission, Loc. or GTD Housing Rev. Ref. Bonds, 4.00%, 2047 | 640 | 689 | ||||||
| 3,348 | ||||||||
| West Virginia - 1.2% | ||||||||
| West Virginia Univ., College & Univ. Rev. Ref. Bonds (Mandatory Put 10/01/19 @ 100), 1.45%, 20411 | 1,750 | 1,750 | ||||||
| 1,750 | ||||||||
| Wisconsin - 1.2% | ||||||||
| Public Fin. Auth., Health Care Facs. Rev. Ref. Bonds, 5.00%, 2022 | 300 | 341 | ||||||
| Wisconsin Health & Educ. Facs. Auth., Health Care Facs. Rev. Ref. Bonds (Mandatory Put 05/30/19 @ 100), 4.00%, 20431 | 1,000 | 1,043 | ||||||
| Private Client Services Funds | 29 |
Capital Group Short-Term Municipal Fund
Schedule of investments
October 31, 2017
| Bonds & notes - continued | Principal amount (000) | Value (000) | ||||||
| Wisconsin - continued | ||||||||
| Wisconsin Housing & Econ. Dev. Auth., Loc. or GTD Housing Rev. Bonds, Series C (FHA Insured HUD Ln. Insured GTD), 4.00%, 2048 | $ | 380 | $ | 413 | ||||
| 1,797 | ||||||||
| Wyoming - 0.4% | ||||||||
| Wyoming Comm. Dev. Auth., Loc. or GTD Housing Rev. Bonds, Series 3, 3.00%, 2044 | 550 | 571 | ||||||
| 571 | ||||||||
| Total bonds & notes (cost: $131,376,000) | 131,750 | |||||||
| Short-term securities - 13.2% | ||||||||
| California Pollution Control Fncg. Auth., Energy Res. Auth. Rev. Ref. Bonds, Series C, 0.84%, November 01, 20261 | 1,100 | 1,100 | ||||||
| California Statewide Comms. Dev. Auth., 0.91%, April 04, 20181 | 1,000 | 999 | ||||||
| City of Baton Rouge & Parish of East Baton Rouge, Ind. Rev. Ref. Bonds, 0.90%, March 01, 20221 | 650 | 650 | ||||||
| City of New York, G.O. Prop. Tax Ref. Bonds, Sub-Series J-5, 0.91%, August 01, 20281 | 4,200 | 4,200 | ||||||
| City of Phoenix Ind. Dev. Auth., Health Care Facs. Imps. Rev. Bonds, Series A, 0.90%, November 15, 20521 | 1,400 | 1,400 | ||||||
| Connecticut Health & Edu. Facs. Auth., Rev. Bonds, 0.85%, November 13, 20171 | 3,000 | 3,000 | ||||||
| East Baton Rouge Parish Ind. Dev. Board Inc., Ind. Imps. Rev. Bonds, Series A, 0.90%, August 01, 20351 | 1,250 | 1,250 | ||||||
| East Baton Rouge Parish Ind. Dev. Board Inc., Ind. Imps. Rev. Bonds, Series B, 0.90%, December 01, 20401 | 1,640 | 1,640 | ||||||
| Illinois Fin. Auth., College & Univ. Imps. Rev. Bonds, Series A, 0.88%, August 01, 20441 | 250 | 250 | ||||||
| Mississippi Business Fin. Corp., Ind. Imps. Rev. Bonds, Series A, 0.91%, December 01, 20301 | 2,400 | 2,400 | ||||||
| New York City Transitional Fin. Auth., Public Imps. Income Tax Rev. Bonds, 0.91%, February 01, 20451 | 1,200 | 1,200 | ||||||
| New York City, Water Rev. Ref. Bonds, 0.91%, June 15, 20481 | 1,650 | 1,650 | ||||||
| Total short-term securities (cost: $19,740,000) | 19,739 | |||||||
| Total investment securities (cost: $151,116,000) | 151,489 | |||||||
| Other assets less liabilities | (1,672 | ) | ||||||
| Net assets | $ | 149,817 | ||||||
| 1 | Coupon rate may change periodically. For short-term securities, the date of the next scheduled coupon rate change is considered to be the maturity date. |
| 2 | Acquired in a transaction exempt from registration under Rule 144A or section 4(2) of the Securities Act of 1933. May be resold in the U.S. in transactions exempt from registration, normally to qualified institutional buyers. At October 31, 2017, the aggregate market value of these securities amounted to $276,000, representing 0.18% of net assets. |
| 30 | Private Client Services Funds |
Capital Group Short-Term Municipal Fund
Schedule of investments
October 31, 2017
Key to abbreviations
| Agcy. | = | Agency |
| AGM | = | Assured Guaranty Municipal Corporation |
| Auth. | = | Authority |
| BAM | = | Build America Mutual Assurance Company |
| Certs. of Part. | = | Certificates of Participation |
| COLL | = | Collateral |
| Comm. | = | Community |
| Comms. | = | Communities |
| Corp. | = | Corporation |
| Dept. | = | Department |
| Dev. | = | Development |
| Dist. | = | District |
| Econ. | = | Economic |
| Edu. | = | Education |
| Educ. | = | Educational |
| Fac. | = | Facility |
| Facs. | = | Facilities |
| FHA | = | Federal Housing Administration |
| FHLMC | = | Federal Home Loan Mortgage Corporation |
| Fin. | = | Finance |
| Fncg. | = | Financing |
| Fndg. | = | Funding |
| FNMA | = | Federal National Mortgage Association |
| GNMA | = | Government National Mortgage Association |
| G.O. | = | General Obligation |
| Govt. | = | Government |
| GTD | = | Guaranteed |
| HUD | = | Housing and Urban Development |
| Imps. | = | Improvements |
| Ind. | = | Industrial |
| Intl. | = | International |
| Ln. | = | Loan |
| Lns. | = | Loans |
| Loc. | = | Local |
| Mgmt. | = | Management |
| Misc. | = | Miscellaneous |
| Muni. | = | Municipal |
| NATL-RE | = | National Reinsurance |
| No. | = | Number |
| Prop. | = | Property |
| PSF | = | Permanent School Fund |
| Redev. | = | Redevelopment |
| Ref. | = | Refunding |
| Res. | = | Resource |
| Ress. | = | Resources |
| Rev. | = | Revenue |
| Trans. | = | Transportation |
| Univ. | = | University |
| Util. | = | Utility |
| Utils. | = | Utilities |
| Withhldg. | = | Withholding |
See Notes to Financial Statements
| Private Client Services Funds | 31 |
Capital Group California Core Municipal Fund
October 31, 2017
Growth of $25,000 investment
Here’s how a $25,000 investment in the Capital Group California Core Municipal Fund grew between April 13, 2010, when the fund began operations, and October 31, 2017, the end of the fund’s fiscal year.
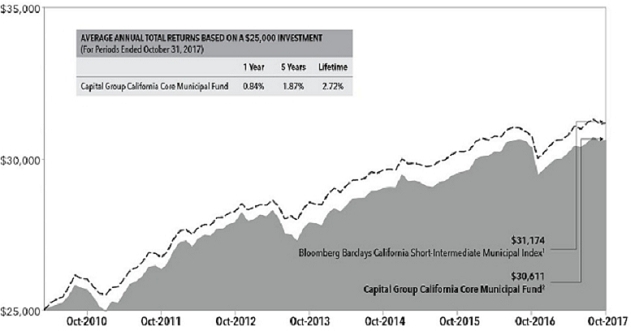
| 1 | The index is unmanaged, and its results include reinvested distributions but do not reflect the effect of charges, commissions, or expenses. |
| 2 | Includes reinvested dividends and capital gain distributions. |
Results are for past periods and are not predictive of results for future periods. Current and future results may be lower or higher than those shown. Share price and returns will vary so investors may lose money. The results shown are before taxes on fund distributions and sale of fund shares.
Investment portfolio – quality ratings*
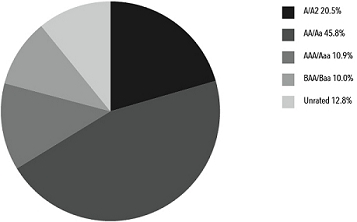
| * | Bond ratings, which typically range from Aaa/AAA (highest to D (lowest), are assigned by credit rating agencies such as Moody’s, Standard & Poors and/or Fitch as an indication of an Issuer’s credit-worthiness. If agency rating differ, securities are put in the highest category consistent with fund investment policies. When securities have not been rated by a rating agency (included in “unrated” at left), the investment advisor performs its own credit analysis and assigns comparable ratings that are used for compliance and fund investment policies. The ratings are not covered by the Report of Independent Registered Public Accounting Firm. |
| 32 | Private Client Services Funds |
Capital Group California Core Municipal Fund
Schedule of investments
October 31, 2017
| Bonds & notes - 91.8% | Principal amount (000) | Value (000) | ||||||
| California - 88.8% | ||||||||
| Abag Fin. Auth. for Nonprofit Corps., Health Care Facs. Rev. Ref. Bonds: | ||||||||
| 5.00%, 2020 | $ | 1,430 | $ | 1,570 | ||||
| 5.00%, 2020 | 1,000 | 1,096 | ||||||
| 5.00%, 2021 | 495 | 556 | ||||||
| 5.00%, 2022 | 1,000 | 1,145 | ||||||
| 5.00%, 2023 | 500 | 580 | ||||||
| Abag Fin. Auth. for Nonprofit Corps., Health Care Facs. Rev. Ref. Bonds (CA Mtg. Ins.): | ||||||||
| 5.125%, 2020 | 945 | 1,003 | ||||||
| 5.25%, 2020 | 585 | 618 | ||||||
| Abag Fin. Auth. for Nonprofit Corps., Health Care Facs. Rev. Ref. Bonds, Series A (CA Mtg. Ins.): | ||||||||
| 5.00%, 2019 | 400 | 422 | ||||||
| 5.00%, 2020 | 550 | 601 | ||||||
| Abag Fin. Auth. for Nonprofit Corps., Special Tax Ref. Bonds: | ||||||||
| 5.00%, 2023 | 370 | 438 | ||||||
| 5.00%, 2024 | 395 | 474 | ||||||
| 5.00%, 2025 | 510 | 605 | ||||||
| Alameda Corridor Trans. Auth., Port, Airport & Marina. Rev. Ref. Bonds, Series A: | ||||||||
| 5.00%, 2021 | 1,000 | 1,143 | ||||||
| 5.00%, 2022 | 975 | 1,141 | ||||||
| Alameda County Trans. Auth., Sales Tax Transit Imps. Rev. Bonds, 4.00%, 2019 | 950 | 988 | ||||||
| Aliso Viejo Comm. Fac. Dist., Special Tax Ref. Bonds: | ||||||||
| 5.00%, 2024 | 455 | 521 | ||||||
| 5.00%, 2025 | 425 | 485 | ||||||
| Bay Area Toll Auth., Health Care Facs. Imps. Rev. Ref. Bonds (Mandatory Put 04/01/21 @ 100), 1.485%, 20451 | 1,000 | 1,006 | ||||||
| Bay Area Toll Auth., Highway Tolls Rev. Bonds (Mandatory Put 05/01/23 @ 100), 1.82%, 20451 | 2,800 | 2,850 | ||||||
| Bay Area Toll Auth., Highway Tolls Rev. Bonds (Mandatory Put 04/01/24 @ 100), 2.02%, 20451 | 4,200 | 4,311 | ||||||
| Bay Area Toll Auth., Highway Tolls Rev. Ref. Bonds, 5.00%, 2024 | 1,200 | 1,452 | ||||||
| Bay Area Toll Auth., Highway Tolls Rev. Ref. Bonds, Series C (Mandatory Put 04/01/19 @ 100), 1.875%, 20471 | 1,505 | 1,514 | ||||||
| Bay Area Toll Auth., Highway Tolls Rev. Ref. Bonds, Series G (Mandatory Put 04/01/20 @ 100), 1.52%, 20341 | 1,000 | 1,006 | ||||||
| Bay Area Water Supply & Conservation Agcy., Water Util. Imps. Rev. Bonds, Series A, 5.00%, 2023 | 500 | 594 | ||||||
| California Educ. Facs. Auth., College & Univ. Imps. Rev. Bonds: | ||||||||
| 5.00%, 2019 | 1,150 | 1,213 | ||||||
| 5.00%, 2021 | 700 | 797 | ||||||
| 5.00%, 2021 | 550 | 598 | ||||||
| 5.50%, 2029 | 400 | 436 | ||||||
| California Educ. Facs. Auth., College & Univ. Imps. Rev. Bonds, Series A, 5.00%, 2018 | 125 | 126 | ||||||
| California Educ. Facs. Auth., College & Univ. Rev. Ref. Bonds, 5.00%, 2020 | 165 | 183 | ||||||
| California Educ. Facs. Auth., College & Univ. Rev. Ref. Bonds, Series A: | ||||||||
| 4.50%, 2017 | 335 | 335 | ||||||
| 4.00%, 2021 | 560 | 617 | ||||||
| 5.00%, 2021 | 535 | 609 | ||||||
| 4.00%, 2022 | 500 | 547 | ||||||
| 5.00%, 2024 | 100 | 105 | ||||||
| California Health Facs. Fncg. Auth., Health Care Facs. Imps. Rev. Bonds, 5.00%, 2025 | 400 | 479 | ||||||
| California Health Facs. Fncg. Auth., Health Care Facs. Imps. Rev. Bonds, Series A: | ||||||||
| 5.00%, 2018 | 275 | 285 | ||||||
| 5.00%, 2024 | 150 | 173 | ||||||
| 5.00%, 2025 | 375 | 430 | ||||||
| 5.00%, 2026 | 300 | 366 | ||||||
| Private Client Services Funds | 33 |
Capital Group California Core Municipal Fund
Schedule of investments
October 31, 2017
| Bonds & notes - continued | Principal amount (000) | Value (000) | ||||||
| California - continued | ||||||||
| California Health Facs. Fncg. Auth., Health Care Facs. Imps. Rev. Bonds, Series D, 5.00%, 2020 | $ | 1,325 | $ | 1,467 | ||||
| California Health Facs. Fncg. Auth., Health Care Facs. Imps. Rev. Bonds, Series G, 5.50%, 2025 | 100 | 103 | ||||||
| California Health Facs. Fncg. Auth., Health Care Facs. Rev. Ref. Bonds (CA Mtg. Ins.): | ||||||||
| 5.00%, 2020 | 1,005 | 1,088 | ||||||
| 5.00%, 2022 | 175 | 202 | ||||||
| 5.00%, 2023 | 135 | 159 | ||||||
| California Health Facs. Fncg. Auth., Health Care Facs. Rev. Ref. Bonds, Series A: | ||||||||
| 5.00%, 2019 | 525 | 563 | ||||||
| 5.00%, 2020 | 675 | 731 | ||||||
| 5.00%, 2020 | 500 | 556 | ||||||
| 5.00%, 2021 | 2,675 | 2,985 | ||||||
| 5.00%, 2021 | 350 | 399 | ||||||
| 5.00%, 2023 | 1,000 | 1,164 | ||||||
| California Health Facs. Fncg. Auth., Health Care Facs. Rev. Ref. Bonds, Series B, 4.00%, 2019 | 400 | 421 | ||||||
| California Health Facs. Fncg. Auth., Health Care Facs. Rev. Ref. Bonds, Series C (Mandatory Put 10/15/19 @ 100), 5.00%, 20431 | 1,750 | 1,879 | ||||||
| California Health Facs. Fncg. Auth., Health Care Facs. Rev. Ref. Bonds, Series D (Mandatory Put 10/15/20 @ 100), 5.00%, 20431 | 250 | 276 | ||||||
| California Infrastructure & Econ. Dev. Bank, Misc. Rev. Ref. Bonds (Mandatory Put 04/01/18 @ 100), 1.20%, 20471 | 2,650 | 2,651 | ||||||
| California Infrastructure & Econ. Dev. Bank, Misc. Rev. Ref. Bonds (Mandatory Put 04/01/20 @ 100), 1.305%, 20381 | 3,000 | 3,014 | ||||||
| California Infrastructure & Econ. Dev. Bank, Private Schools Rev. Ref. Bonds, Series B (Mandatory Put 06/01/22 @ 100), 2.12%, 20371 | 1,000 | 1,009 | ||||||
| California Infrastructure & Econ. Dev. Bank, Public Imps. Misc. Rev. Bonds: | ||||||||
| 4.50%, 2025 | 100 | 103 | ||||||
| 4.50%, 2026 | 100 | 103 | ||||||
| California Infrastructure & Econ. Dev. Bank, Rec. Facs. Imps. Rev. Bonds, 5.00%, 2018 | 100 | 101 | ||||||
| California Muni. Fin. Auth., Charter School AID Ref. Rev. Bonds, Series A, 4.00%, 2026 | 320 | 351 | ||||||
| California Muni. Fin. Auth., College & Univ. Imps. Rev. Bonds, 5.00%, 2022 | 470 | 541 | ||||||
| California Muni. Fin. Auth., College & Univ. Rev. Ref. Bonds: | ||||||||
| 5.00%, 2023 | 750 | 882 | ||||||
| 5.625%, 2023 | 465 | 485 | ||||||
| California Muni. Fin. Auth., College & Univ. Rev. Ref. Bonds, Series B: | ||||||||
| 5.00%, 2026 | 1,000 | 1,211 | ||||||
| 5.00%, 2027 | 600 | 713 | ||||||
| California Muni. Fin. Auth., Energy Res. Auth. Imps. Rev. Bonds (Mandatory Put 04/02/18 @ 100), 1.42%, 20451 | 1,425 | 1,425 | ||||||
| California Muni. Fin. Auth., Loc. or GTD Housing Rev. Bonds, 5.00%, 2030 | 1,000 | 1,113 | ||||||
| California Muni. Fin. Auth., Misc. Rev. Ref. Bonds: | ||||||||
| 5.00%, 2022 | 885 | 1,035 | ||||||
| 5.00%, 2025 | 500 | 602 | ||||||
| California School Fin. Auth., School Imps. Charter School AID Rev. Bonds, Series A:2 | ||||||||
| 5.00%, 2024 | 270 | 316 | ||||||
| 3.625%, 2025 | 1,125 | 1,217 | ||||||
| California State Dept. of Veterans Affairs, Loc. or GTD Housing Rev. Ref. Bonds, Series A, 2.75%, 2020 | 750 | 785 | ||||||
| California State Dept. of Water Ress., Energy Res. Auth. Rev. Bonds, Sub-Series G-11: | ||||||||
| 4.875%, 2018 | 200 | 204 | ||||||
| 5.00%, 2018 | 1,000 | 1,020 | ||||||
| California State Dept. of Water Ress., Energy Res. Auth. Rev. Ref. Bonds, 5.00%, 2021 | 100 | 102 | ||||||
| California State Dept. of Water Ress., Energy Res. Auth. Rev. Ref. Bonds, Series K, 5.00%, 2018 | 225 | 230 | ||||||
| California State Dept. of Water Ress., Energy Res. Auth. Rev. Ref. Bonds, Series L, 5.00%, 2021 | 75 | 82 | ||||||
| 34 | Private Client Services Funds |
Capital Group California Core Municipal Fund
Schedule of investments
October 31, 2017
| Bonds & notes - continued | Principal amount (000) | Value (000) | ||||||
| California - continued | ||||||||
| California State Dept. of Water Ress., Energy Res. Auth. Rev. Ref. Bonds, Series L (Pre-refunded with U.S. Treasury Obligations to 05/01/20 @ 100), 5.00%, 2021 | $ | 125 | $ | 137 | ||||
| California State Dept. of Water Ress., Energy Res. Auth. Rev. Ref. Bonds, Series N: | ||||||||
| 5.00%, 2018 | 1,250 | 1,275 | ||||||
| 5.00%, 2020 | 2,000 | 2,194 | ||||||
| California State Dept. of Water Ress., Water Rev. Ref. Bonds, Series AE, 5.00%, 2022 | 70 | 72 | ||||||
| California State Dept. of Water Ress., Water Rev. Ref. Bonds, Series AE (Pre-refunded with U.S. Treasury Obligations to 06/01/18 @ 100), 5.00%, 2023 | 200 | 205 | ||||||
| California State Public Works Board, College & Univ. Imps. Lease Rev. Bonds, Series B-1, 5.00%, 2018 | 1,350 | 1,368 | ||||||
| California State Public Works Board, Correctional Fac. Imps. Lease Rev. Bonds, 5.00%, 2020 | 3,000 | 3,316 | ||||||
| California State Public Works Board, Correctional Fac. Imps. Lease Rev. Bonds, Series A, 5.00%, 2023 | 790 | 931 | ||||||
| California State Public Works Board, Lease Rev. Ref. Bonds, 5.00%, 2024 | 1,725 | 2,083 | ||||||
| California State Public Works Board, Lease Rev. Ref. Bonds, Series B: | ||||||||
| 5.00%, 2021 | 3,000 | 3,417 | ||||||
| 5.00%, 2022 | 2,000 | 2,330 | ||||||
| California State Public Works Board, Lease Rev. Ref. Bonds, Series F, 5.00%, 2020 | 1,260 | 1,378 | ||||||
| California State Public Works Board, Lease Rev. Ref. Bonds, Series G, 5.00%, 2021 | 1,000 | 1,116 | ||||||
| California State Public Works Board, Lease Rev. Ref. Bonds, Series H, 5.00%, 2023 | 725 | 854 | ||||||
| California State Univ., College & Univ. Rev. Ref. Bonds, Series B-2 (Mandatory Put 11/01/21 @ 100), 4.00%, 20491 | 2,000 | 2,188 | ||||||
| California State Univ., College & Univ. Rev. Ref. Bonds, Series B-3 (Mandatory Put 11/01/23 @ 100), 4.00%, 20511 | 2,500 | 2,812 | ||||||
| California Statewide Comms. Dev. Auth., College & Univ. Imps. Rev. Bonds, 5.00%, 2019 | 1,000 | 1,056 | ||||||
| California Statewide Comms. Dev. Auth., Health Care Facs. Imps. Rev. Bonds, 4.625%, 2021 | 100 | 105 | ||||||
| California Statewide Comms. Dev. Auth., Health Care Facs. Imps. Rev. Bonds, Series A, 5.00%, 2019 | 600 | 633 | ||||||
| California Statewide Comms. Dev. Auth., Health Care Facs. Nursing Homes Rev. Bonds (CA Mtg. Ins.), 3.00%, 2021 | 385 | 386 | ||||||
| California Statewide Comms. Dev. Auth., Health Care Facs. Rev. Ref. Bonds: | ||||||||
| 5.00%, 2019 | 1,000 | 1,074 | ||||||
| 5.00%, 2019 | 600 | 636 | ||||||
| 5.00%, 2021 | 1,100 | 1,232 | ||||||
| 5.00%, 2023 | 1,100 | 1,267 | ||||||
| 5.00%, 2024 | 300 | 343 | ||||||
| 5.00%, 2025 | 750 | 902 | ||||||
| California Statewide Comms. Dev. Auth., Health Care Facs. Rev. Ref. Bonds, Series A (AGM Insured), 5.00%, 2023 | 500 | 582 | ||||||
| California Statewide Comms. Dev. Auth., Health Care Facs. Rev. Ref. Bonds, Series B, 5.00%, 2021 | 1,100 | 1,235 | ||||||
| California Statewide Comms. Dev. Auth., Ind. Rev. Ref. Bonds (Mandatory Put 04/01/20 @ 100), 1.90%, 20281 | 2,000 | 2,023 | ||||||
| California Statewide Comms. Dev. Auth., Misc. Rev. Ref. Bonds (AGM Insured), 5.00%, 2020 | 210 | 234 | ||||||
| Carson Redev. Agcy. Successor Agcy., Tax Increment Allocation Ref. Bonds, 5.00%, 2021 | 1,625 | 1,858 | ||||||
| Cathedral City Redev. Agcy. Successor Agcy., Tax Allocation Rev. Ref. Bonds, 5.00%, 2023 | 745 | 879 | ||||||
| Cathedral City Redev. Agcy. Successor Agcy., Tax Allocation Rev. Ref. Bonds (AGM Insured), 5.00%, 2024 | 260 | 311 | ||||||
| Cerritos Public Fncg. Auth., Tax Allocation Rev. Ref. Bonds, Series A (AMBAC Insured): | ||||||||
| 5.00%, 2019 | 2,000 | 2,046 | ||||||
| 5.00%, 2024 | 600 | 613 | ||||||
| Private Client Services Funds | 35 |
Capital Group California Core Municipal Fund
Schedule of investments
October 31, 2017
| Bonds & notes - continued | Principal amount (000) | Value (000) | ||||||
| California - continued | ||||||||
| Chino Redev. Agcy. Successor Agcy., Tax Increment Allocation Ref. Bonds, Series A (BAM Insured): | ||||||||
| 5.00%, 2020 | $ | 500 | $ | 552 | ||||
| 5.00%, 2022 | 450 | 522 | ||||||
| 5.00%, 2025 | 665 | 789 | ||||||
| Chino Valley Unified School Dist., G.O. School Imps. Prop. Tax Bonds, Series A, 5.00%, 2021 | 1,000 | 1,142 | ||||||
| Chula Vista Muni. Fncg. Auth., Special Tax Ref. Bonds: | ||||||||
| 5.00%, 2021 | 535 | 595 | ||||||
| 5.00%, 2022 | 1,355 | 1,529 | ||||||
| City & County of San Francisco, G.O. Public Imps. Prop. Tax Bonds, 5.00%, 2020 | 1,350 | 1,488 | ||||||
| City of Alhambra, Health Care Facs. Nursing Homes Rev. Ref. Bonds (CA Mtg. Ins.), 5.00%, 2027 | 630 | 755 | ||||||
| City of Carlsbad California, Special Assessment Ref. Bonds: | ||||||||
| 3.00%, 2018 | 325 | 330 | ||||||
| 3.55%, 2023 | 350 | 369 | ||||||
| City of Chula Vista, Energy Res. Auth. Rev. Ref. Bonds, Series A, 1.65%, 2018 | 1,150 | 1,151 | ||||||
| City of Fontana California, Special Tax Ref. Bonds, 5.00%, 2023 | 535 | 617 | ||||||
| City of Irvine California, Special Assessment Ref. Bonds: | ||||||||
| 4.00%, 2018 | 500 | 512 | ||||||
| 2.50%, 2019 | 1,230 | 1,249 | ||||||
| 3.00%, 2020 | 1,250 | 1,297 | ||||||
| 3.25%, 2022 | 700 | 741 | ||||||
| 4.00%, 2022 | 400 | 437 | ||||||
| 3.375%, 2023 | 850 | 910 | ||||||
| 5.00%, 2023 | 1,455 | 1,700 | ||||||
| 5.00%, 2028 | 500 | 578 | ||||||
| City of Irvine, Special Assessment Ref. Bonds: | ||||||||
| 4.00%, 2020 | 940 | 1,006 | ||||||
| 5.00%, 2021 | 500 | 561 | ||||||
| City of Long Beach, Port, Airport & Marina Imps. Rev. Bonds: | ||||||||
| 5.00%, 2019 | 275 | 290 | ||||||
| 5.00%, 2020 | 400 | 435 | ||||||
| City of Long Beach, Port, Airport & Marina Imps. Rev. Bonds, Series A, 5.00%, 2021 | 100 | 110 | ||||||
| City of Long Beach, Port, Airport & Marina Rev. Ref. Bonds, Series C, 3.00%, 2018 | 2,250 | 2,296 | ||||||
| City of Roseville California, Special Tax Ref. Bonds, 5.00%, 2024 | 1,000 | 1,151 | ||||||
| City of Sacramento California, Special Tax Ref. Bonds, 5.00%, 2028 | 1,235 | 1,386 | ||||||
| City of San Jose, Port, Airport & Marina Imps. Rev. Bonds, Series A-2, 5.00%, 2018 | 700 | 709 | ||||||
| City of Santa Rosa California., Sewer Rev. Ref. Bonds, Series B (AMBAC Insured), 0.00%, 20213 | 2,000 | 1,879 | ||||||
| Clovis Unified School Dist., G.O. School Imps. Prop. Tax Bonds, Series A (NATL-RE Insured), 0.00%, 20253 | 500 | 420 | ||||||
| Compton Comm. College Dist., G.O. Prop. Tax Ref. Bonds (BAM Insured), 5.00%, 2026 | 800 | 951 | ||||||
| Concord Redev. Agcy. Successor Agcy., Tax Increment Allocation Ref. Bonds (BAM Insured): | ||||||||
| 5.00%, 2020 | 500 | 544 | ||||||
| 5.00%, 2023 | 825 | 970 | ||||||
| County of El Dorado, Special Tax Rev. Ref. Bonds, 5.00%, 2024 | 860 | 982 | ||||||
| County of Los Angeles, G.O. Cash Flow Mgmt. Misc. Rev. Notes, 5.00%, 2018 | 7,035 | 7,219 | ||||||
| County of San Diego, Health Care Facs. Rev. Ref. Bonds, 5.00%, 2022 | 200 | 232 | ||||||
| Desert Hot Springs Redev. Agcy. Successor Agcy., Tax Allocation Rev. Ref. Bonds (BAM Insured): | ||||||||
| 4.00%, 2020 | 390 | 420 | ||||||
| 5.00%, 2021 | 800 | 907 | ||||||
| Eastern Muni. Water Dist., Water Rev. Ref. Bonds, Series A, 5.00%, 2023 | 500 | 595 | ||||||
| El Centro Fncg. Auth., Sewer Rev. Ref. Bonds, Series A (AGM Insured): | ||||||||
| 5.00%, 2026 | 530 | 632 | ||||||
| 5.00%, 2027 | 500 | 592 | ||||||
| 5.00%, 2030 | 1,000 | 1,167 | ||||||
| Elk Grove Fin. Auth., Special Tax Ref. Bonds, 5.00%, 2025 | 580 | 700 | ||||||
| 36 | Private Client Services Funds |
Capital Group California Core Municipal Fund
Schedule of investments
October 31, 2017
| Bonds & notes - continued | Principal amount (000) | Value (000) | ||||||
| California - continued | ||||||||
| Elk Grove Fin. Auth., Special Tax Ref. Bonds (BAM Insured), 5.00%, 2030 | $ | 735 | $ | 853 | ||||
| Emeryville Redev. Agcy. Successor Agcy., Tax Increment Allocation Ref. Bonds, Series A (AGM Insured), 5.00%, 2026 | 1,000 | 1,199 | ||||||
| Eureka Successor Agcy., Tax Increment Allocation Rev. Ref. Bonds, Series B, 5.00%, 2022 | 835 | 972 | ||||||
| Fillmore Redev. Agcy. Successor Agcy., Tax Increment Allocation Ref. Bonds (BAM Insured), 5.00%, 2024 | 1,000 | 1,194 | ||||||
| Fresno Joint Powers Fncg. Auth., Lease Rev. Ref. Bonds, Series A (AGM Insured), 5.00%, 2022 | 1,350 | 1,553 | ||||||
| Garden Grove Agcy. Comm. Dev. Successor Agcy., Tax Increment Allocation Rev. Ref. Bonds (BAM Insured), 5.00%, 2022 | 400 | 465 | ||||||
| Glendale Redev. Agcy. Successor Agcy., Tax Increment Allocation Rev. Ref. Bonds (BAM Insured), 5.00%, 2024 | 410 | 493 | ||||||
| Golden State Tobacco Securitization Corp., Approp. Rev. Ref. Bonds, Series A (AGM Insured), 0.00%, 20263 | 1,000 | 816 | ||||||
| Golden State Tobacco Securitization Corp., Approp. Rev. Ref. Bonds, Series A (AMBAC Insured), 0.00%, 20243 | 2,000 | 1,734 | ||||||
| Golden State Tobacco Securitization Corp., Misc. Rev. Ref. Bonds, Series A: | ||||||||
| 5.00%, 2018 | 400 | 409 | ||||||
| 5.00%, 2020 | 1,300 | 1,431 | ||||||
| 5.00%, 2021 | 2,000 | 2,265 | ||||||
| Hawthorne Comm. Redev. Agcy. Successor Agcy., Tax Increment Allocation Rev. Ref. Bonds (AGM Insured), 5.00%, 2024 | 250 | 302 | ||||||
| Hayward Unified School Dist., G.O. School Imps. Prop. Tax Bonds (AGM Insured), 5.00%, 2021 | 1,000 | 1,142 | ||||||
| Hemet Unified School Dist. Fncg. Auth., Misc. Purposes Special Tax Ref. Bonds: | ||||||||
| 5.00%, 2026 | 600 | 695 | ||||||
| 5.00%, 2028 | 720 | 821 | ||||||
| Hemet Unified School Dist., G.O. Prop. Tax Ref. Bonds (AGM Insured), 5.00%, 2029 | 500 | 584 | ||||||
| Imperial Irrigation Dist., Energy Res. Auth. Rev. Ref. Bonds, 5.00%, 2017 | 100 | 100 | ||||||
| Imperial Irrigation Dist., Energy Res. Auth. Rev. Ref. Bonds, Series A, 5.25%, 2025 | 20 | 21 | ||||||
| Imperial Irrigation Dist., Energy Res. Auth. Rev. Ref. Bonds, Series A (Pre-refunded with U.S. Treasury Obligations to 11/01/18 @ 100), 5.25%, 2025 | 80 | 83 | ||||||
| Imperial Irrigation Dist., Energy Res. Auth. Rev. Ref. Bonds, Series C, 5.00%, 2022 | 700 | 780 | ||||||
| Irvine Unified School Dist., Prop. Acquisition Special Tax Bonds, Series A: | ||||||||
| 5.00%, 2021 | 1,280 | 1,441 | ||||||
| 5.00%, 2025 | 1,000 | 1,192 | ||||||
| 5.00%, 2026 | 350 | 419 | ||||||
| Jurupa Public Fncg. Auth., Special Tax Ref. Bonds, Series A: | ||||||||
| 5.00%, 2023 | 500 | 592 | ||||||
| 5.00%, 2029 | 710 | 824 | ||||||
| Kings Canyon Unified School Dist., G.O. Prop. Tax Ref. Bonds (AGM Insured), 5.00%, 2029 | 1,600 | 1,900 | ||||||
| La Quinta Redev. Agcy. Successor Agcy., Tax Allocation Rev. Ref. Bonds: | ||||||||
| 4.00%, 2019 | 500 | 527 | ||||||
| 5.00%, 2019 | 200 | 214 | ||||||
| Lake Elsinore Public Fncg. Auth., Special Tax Ref. Bonds, 5.00%, 2028 | 2,000 | 2,303 | ||||||
| Lammersville Joint Unified School Dist., Special Tax Ref. Bonds, 4.00%, 2022 | 680 | 744 | ||||||
| Lancaster Redev. Agcy. Successor Agcy., Tax Allocation Rev. Ref. Bonds (AGM Insured): | ||||||||
| 5.00%, 2024 | 590 | 705 | ||||||
| 5.00%, 2025 | 770 | 933 | ||||||
| Lincoln Public Fncg. Auth., Public Imps. Special Tax Bonds, Series A (AMBAC Insured), 4.50%, 2021 | 840 | 848 | ||||||
| Long Beach Bond Fin. Auth., Misc. Rev. Ref. Bonds: | ||||||||
| 4.00%, 2020 | 750 | 810 | ||||||
| 5.00%, 2021 | 520 | 593 | ||||||
| Private Client Services Funds | 37 |
Capital Group California Core Municipal Fund
Schedule of investments
October 31, 2017
| Bonds & notes - continued | Principal amount (000) | Value (000) | ||||||
| California - continued | ||||||||
| Long Beach Comm., College Dist., G.O. Univ. & College Imps. Prop. Tax Bonds (Pre-refunded with U.S. Treasury Obligations to 06/01/18 @ 100), 5.00%, 2022 | $ | 15 | $ | 15 | ||||
| Long Beach Comm., College Dist., G.O. Univ. & College Imps. Prop. Tax Bonds, Series A, 5.00%, 2022 | 85 | 87 | ||||||
| Los Angeles Comm. Facs. Dist., Special Tax Ref. Bonds: | ||||||||
| 5.00%, 2020 | 600 | 658 | ||||||
| 5.00%, 2023 | 700 | 822 | ||||||
| Los Angeles County Redev. Auth., Tax Allocation Rev. Ref. Bonds (AGM Insured): | ||||||||
| 5.00%, 2022 | 1,190 | 1,381 | ||||||
| 5.00%, 2024 | 1,000 | 1,199 | ||||||
| Los Angeles County Redev. Auth., Tax Allocation Rev. Ref. Bonds, Series D, 5.00%, 2019 | 1,000 | 1,068 | ||||||
| Los Angeles County Redev. Auth., Tax Increment Allocation Rev. Ref. Bonds, 5.00%, 2020 | 3,000 | 3,336 | ||||||
| Los Angeles Dept. of Airports, Port, Airport & Marina Imps. Rev. Bonds, Series A, 5.00%, 2029 | 200 | 212 | ||||||
| Los Angeles Dept. of Airports, Port, Airport & Marina Imps. Rev. Bonds, Series D, 5.00%, 2019 | 850 | 902 | ||||||
| Los Angeles Dept. of Water & Power, Water Util. Imps. Rev. Bonds, Series A, 5.00%, 2021 | 1,000 | 1,138 | ||||||
| Los Angeles Dept. of Water & Power, Water Util. Imps. Rev. Bonds, Series B, 5.00%, 2020 | 1,000 | 1,068 | ||||||
| Los Angeles Unified School Dist., G.O. Prop. Tax Ref. Bonds, Series A, 5.00%, 2021 | 1,200 | 1,367 | ||||||
| Los Angeles Unified School Dist., G.O. Prop. Tax Ref. Bonds, Series C, 5.00%, 2019 | 2,175 | 2,317 | ||||||
| Los Angeles Unified School Dist., G.O. Prop. Tax Rev. Ref. Bonds, Series A-1, 5.00%, 2020 | 1,000 | 1,104 | ||||||
| Los Angeles Unified School Dist., G.O. School Imps. Prop. Tax Bonds, Series I, 5.00%, 2024 | 100 | 107 | ||||||
| Los Rios Comm. College Dist., G.O. Prop. Tax Ref. Bonds, 5.00%, 2020 | 900 | 996 | ||||||
| Manhattan Beach Unified School Dist., G.O. School Imps. Prop. Tax Bonds, Series C (NATL-RE Insured), 0.00%, 20243 | 1,500 | 1,291 | ||||||
| Menifee Union School Dist. Public Fncg. Auth., Special Tax Ref. Bonds, Series A, 5.00%, 2022 | 250 | 290 | ||||||
| Menlo Park Comms. Dev. Agcy. Successor Agcy., Tax Allocation Rev. Ref. Bonds, (AGM Insured), 5.00%, 2028 | 1,070 | 1,279 | ||||||
| Merced Irrigation Dist., Energy Res. Auth. Rev. Ref. Bonds, Series A (AGM Insured): | ||||||||
| 5.00%, 2022 | 500 | 583 | ||||||
| 5.00%, 2028 | 250 | 298 | ||||||
| Metropolitan Water Dist. of Southern California, Water Rev. Ref. Bonds, Series B-1 (Mandatory Put 03/27/18 @ 100), 1.30%, 20271 | 500 | 500 | ||||||
| Metropolitan Water Dist. of Southern California, Water Rev. Ref. Bonds, Sub-Series B: | ||||||||
| 5.00%, 2020 | 3,000 | 3,310 | ||||||
| 5.00%, 2021 | 1,000 | 1,139 | ||||||
| Modesto Irrigation Dist., Energy Res. Auth. Rev. Ref. Bonds, 5.00%, 2022 | 750 | 875 | ||||||
| Montebello Unified School Dist., G.O. Prop. Tax Ref. Bonds, Series A, 5.00%, 2020 | 925 | 1,024 | ||||||
| Montebello Unified School Dist., G.O. School Imps. Prop. Tax Bonds, Series A, 4.00%, 2019 | 1,250 | 1,313 | ||||||
| Monterey Peninsula Comm. College Dist., G.O. Prop. Tax Ref. Bonds, 0.00%, 20243 | 815 | 711 | ||||||
| Moreno Valley Unified School Dist., G.O. School Imps. Prop. Tax Ref. Bonds (NATL-RE Insured), 5.25%, 2019 | 380 | 407 | ||||||
| Mountain View Shoreline Regional Park Comm., Tax Allocation Rev. Ref. Bonds, Series A: | ||||||||
| 5.00%, 2019 | 420 | 448 | ||||||
| 5.00%, 2020 | 375 | 413 | ||||||
| Murrieta Valley Unified School Dist. Fncg. Auth., Special Tax Ref. Bonds, Series A: | ||||||||
| 4.00%, 2020 | 125 | 133 | ||||||
| 5.00%, 2025 | 2,000 | 2,360 | ||||||
| 5.00%, 2028 | 395 | 460 | ||||||
| Natomas Unified School Dist., G.O. Prop. Tax Ref. Bonds (BAM Insured), 5.00%, 2021 | 500 | 568 | ||||||
| North Natomas Comm. Facs. Dist. No. 4, Special Tax Ref. Bonds, Series E, 5.00%, 2021 | 1,050 | 1,183 | ||||||
| Northern California Power Agcy., Energy Res. Auth. Imps. Rev. Bonds, Series A, 5.50%, 2021 | 1,000 | 1,071 | ||||||
| Northern California Power Agcy., Energy Res. Auth. Rev. Ref. Bonds, Series A, 5.00%, 2019 | 200 | 213 | ||||||
| Oakland Redev. Successor Agcy., Tax Increment Allocation Ref. Bonds, 5.00%, 2018 | 500 | 516 | ||||||
| Oakland Unified School Dist., G.O. Prop. Tax Ref. Bonds, Series A, 5.00%, 2021 | 2,000 | 2,278 | ||||||
| 38 | Private Client Services Funds |
Capital Group California Core Municipal Fund
Schedule of investments
October 31, 2017
| Bonds & notes - continued | Principal amount (000) | Value (000) | ||||||
| California - continued | ||||||||
| Oakland Unified School Dist., G.O. School Imps. Prop. Tax Bonds, Series A, 5.00%, 2029 | $ | 500 | $ | 598 | ||||
| Ohlone Comm. College Dist., G.O. Ref. Bonds: | ||||||||
| 5.00%, 2023 | 550 | 639 | ||||||
| 5.00%, 2024 | 1,000 | 1,160 | ||||||
| Orange Comm. Facs. Dist., Special Tax Ref. Bonds: | ||||||||
| 4.00%, 2020 | 385 | 415 | ||||||
| 4.00%, 2021 | 1,485 | 1,633 | ||||||
| Orange Redev. Agcy. Successor Agcy., Tax Increment Allocation Ref. Bonds: | ||||||||
| 5.00%, 2020 | 770 | 850 | ||||||
| 5.00%, 2021 | 375 | 426 | ||||||
| Oxnard Fncg. Auth., Sewer Rev. Ref. Bonds (AGM Insured), 5.00%, 2021 | 750 | 848 | ||||||
| Palm Desert Redev. Agcy. Successor Agcy., Tax Increment Allocation Rev. Ref. Bonds, Series A (BAM Insured), 5.00%, 2027 | 600 | 736 | ||||||
| Palmdale Comm. Redev. Agcy. Successor Agcy., Tax Increment Allocation Rev. Ref. Bonds, Sub- Series A, 5.00%, 2020 | 1,000 | 1,103 | ||||||
| Palomar Health, G.O. Public Imps. Prop. Tax Bonds, Series A (AGC Insured), 0.00%, 20283 | 1,000 | 728 | ||||||
| Perris Joint Powers Auth., Special Tax Ref. Bonds, Series B: | ||||||||
| 3.00%, 2021 | 895 | 930 | ||||||
| 4.00%, 2022 | 915 | 993 | ||||||
| Perris Union High School Dist., Special Tax Ref. Bonds, 5.00%, 2024 | 1,000 | 1,168 | ||||||
| Pomona Unified School Dist., G.O. School Imps. Prop. Tax Bonds, Series B, 5.00%, 2020 | 2,000 | 2,211 | ||||||
| Port of Oakland, Port, Airport & Marina Rev. Ref. Bonds, Series E, 5.00%, 2020 | 1,000 | 1,111 | ||||||
| Poway Unified School Dist. Public Fncg. Auth., Special Tax Ref. Bonds: | ||||||||
| 5.00%, 2020 | 595 | 652 | ||||||
| 4.00%, 2022 | 440 | 476 | ||||||
| 5.00%, 2026 | 720 | 863 | ||||||
| Poway Unified School Dist. Public Fncg. Auth., Special Tax Ref. Bonds, Series A, 5.00%, 2022 | 850 | 966 | ||||||
| Poway Unified School Dist. Public Fncg. Auth., Special Tax Ref. Bonds, Series B (BAM Insured), 5.00%, 2022 | 500 | 579 | ||||||
| Rancho Cordova Comm. Facs. Dist., Public Imps. Special Tax Bonds, 4.00%, 2025 | 1,000 | 1,096 | ||||||
| Rancho Cucamonga Redev. Agcy. Successor Agcy., Tax Allocation Rev. Ref. Bonds (AGM Insured): | ||||||||
| 5.00%, 2020 | 775 | 856 | ||||||
| 5.00%, 2025 | 750 | 899 | ||||||
| 5.00%, 2026 | 600 | 715 | ||||||
| 5.00%, 2028 | 300 | 353 | ||||||
| Rio Elementary School Dist. Comm. Facs. Dist., School Imps. Special Tax Ref. Bonds (BAM Insured): | ||||||||
| 5.00%, 2030 | 700 | 825 | ||||||
| 5.00%, 2032 | 240 | 281 | ||||||
| Rio Elementary School Dist. Comm. Facs. Dist., Special Tax Ref. Bonds, 5.00%, 2022 | 400 | 453 | ||||||
| Riverside Cnty. Public Fncg. Auth., Tax Increment Allocation Misc. Purposes Rev. Bonds, Series A (AGM Insured), 5.00%, 2023 | 1,075 | 1,274 | ||||||
| Riverside Cnty. Public Fncg. Auth., Tax Increment Allocation Ref. Bonds (BAM Insured), 5.00%, 2023 | 500 | 592 | ||||||
| Riverside Cnty. Redev. Successor Agcy., Tax Allocation Rev. Ref. Bonds: | ||||||||
| 5.00%, 2020 | 405 | 448 | ||||||
| 5.00%, 2021 | 1,040 | 1,183 | ||||||
| Riverside Redev. Agcy. Successor Agcy., Tax Allocation Rev. Ref. Bonds, Series A, 5.00%, 2021 | 1,000 | 1,140 | ||||||
| Riverside Unified School Dist. Fncg. Auth., Misc. Rev. Ref. Bonds, Series A, 5.00%, 2021 | 1,280 | 1,453 | ||||||
| Riverside Unified School Dist. Fncg. Auth., Special Tax Ref. Bonds (BAM Insured): | ||||||||
| 5.00%, 2025 | 350 | 420 | ||||||
| 5.00%, 2026 | 400 | 479 | ||||||
| Private Client Services Funds | 39 |
Capital Group California Core Municipal Fund
Schedule of investments
October 31, 2017
| Bonds & notes - continued | Principal amount (000) | Value (000) | ||||||
| California - continued | ||||||||
| Roseville Fin. Auth., Special Tax Ref. Bonds, Series A: | ||||||||
| 4.00%, 2020 | $ | 550 | $ | 586 | ||||
| 4.00%, 2021 | 700 | 757 | ||||||
| Sacramento Redev. Agcy. Successor Agcy., Tax Allocation Rev. Ref. Bonds, Series A (BAM Insured), 5.00%, 2028 | 250 | 300 | ||||||
| Sacramento Regional Transit Dist., Transit Rev. Ref. Bonds, 5.00%, 2023 | 385 | 424 | ||||||
| Sacramento Regional Transit Dist., Transit Rev. Ref. Bonds (Pre-refunded with U.S. Treasury Securities to 09/01/20 @ 100), 5.00%, 2023 | 230 | 255 | ||||||
| San Bernardino City Unified School Dist., G.O. Prop. Tax Ref. Bonds, Series A (AGM Insured), 5.00%, 2020 | 725 | 799 | ||||||
| San Bernardino City Unified School Dist., G.O. School Imps. Prop. Tax, Series D (AGM Insured): | ||||||||
| 4.00%, 2020 | 480 | 516 | ||||||
| 4.00%, 2021 | 330 | 363 | ||||||
| San Diego Comm. College Dist., G.O. Prop. Tax Ref. Bonds, 5.00%, 2018 | 1,000 | 1,030 | ||||||
| San Diego County Regional Airport Auth., Port, Airport & Marina Imps. Rev. Bonds, Series A, 5.00%, 2023 | 225 | 269 | ||||||
| San Diego County Regional Airport Auth., Port, Airport & Marina Imps. Rev. Bonds, Sub-Series A: | ||||||||
| 5.00%, 2018 | 850 | 873 | ||||||
| 5.00%, 2020 | 700 | 772 | ||||||
| San Diego County Regional Trans. Commission, Sales Tax Rev. Ref. Bonds, Series A, 5.00%, 2021 | 500 | 565 | ||||||
| San Diego County Water Auth., Water Rev. Certs. of Part. Ref. Bonds, Series A (NATL-RE FGIC Insured), 5.25%, 2018 | 700 | 715 | ||||||
| San Diego Public Facs. Fncg. Auth., Sewer Rev. Ref. Bonds, Series B, 5.00%, 2022 | 100 | 106 | ||||||
| San Diego Public Facs. Fncg. Auth., Water Rev. Ref. Bonds, Series A, 4.00%, 2020 | 100 | 102 | ||||||
| San Diego Unified School Dist., G.O. School Imps. Prop. Tax, Series H-2, 5.00%, 2020 | 3,000 | 3,315 | ||||||
| San Francisco City & County Airports Commission, Port, Airport & Marina Imps. Rev. Bonds, Series E, 5.25%, 2024 | 100 | 106 | ||||||
| San Francisco City & County Airports Commission, Port, Airport & Marina Rev. Ref. Bonds, Series B, 5.00%, 2019 | 400 | 424 | ||||||
| San Francisco City & County Airports Commission, Port, Airport & Marina Rev. Ref. Bonds, Series C2, 5.00%, 2021 | 300 | 317 | ||||||
| San Francisco City & County Redev. Agcy., Tax Allocation Rev. Series C: | ||||||||
| 5.00%, 2018 | 275 | 283 | ||||||
| 5.25%, 2019 | 290 | 311 | ||||||
| San Francisco City & County Redev. Agcy., Tax Increment Allocation Rev. Ref. Bonds, Series C, 5.00%, 2022 | 305 | 354 | ||||||
| San Francisco City & County Redev. Successor Agcy., Public Imps. Special Tax Bonds, 3.25%, 2021 | 500 | 529 | ||||||
| San Francisco City & County Redev. Successor Agcy., Special Tax Ref. Bonds, 5.00%, 2020 | 800 | 874 | ||||||
| San Francisco Unified School Dist., G.O. School Imps. Prop. Tax Bonds, Series A, 5.00%, 2019 | 1,150 | 1,224 | ||||||
| San Jose Redev. Agcy., Tax Allocation Rev. Ref. Bonds, 5.00%, 2022 | 500 | 549 | ||||||
| San Jose Redev. Agcy., Tax Allocation Rev. Ref. Bonds, Series D (AMBAC Insured), 5.00%, 2018 | 745 | 747 | ||||||
| San Marcos Redev. Agcy. Successor Agcy., Tax Allocation Rev. Ref. Bonds, Series A, 5.00%, 2029 | 1,000 | 1,210 | ||||||
| San Mateo Joint Powers Fncg. Auth., Lease Rev. Ref. Bonds, 5.00%, 2020 | 500 | 551 | ||||||
| San Mateo Joint Powers Fncg. Auth., Lease Rev. Ref. Bonds, Series A, 5.25%, 2023 | 300 | 327 | ||||||
| Santa Ana Comm. Redev. Agcy., Tax Allocation Rev. Ref. Bonds, 6.00%, 2020 | 750 | 849 | ||||||
| Santa Clara County Fncg. Auth., Lease Rev. Ref. Bonds, 5.00%, 2022 | 285 | 297 | ||||||
| Santa Cruz County Redev. Agcy., Special Assessment Ref. Bonds, Series A (AGM Insured), 5.00%, 2026 | 1,475 | 1,781 | ||||||
| Santa Margarita Water Dist., Special Tax Ref. Bonds: | ||||||||
| 5.00%, 2022 | 310 | 356 | ||||||
| 40 | Private Client Services Funds |
Capital Group California Core Municipal Fund
Schedule of investments
October 31, 2017
| Bonds & notes - continued | Principal amount (000) | Value (000) | ||||||
| California - continued | ||||||||
| 5.00%, 2024 | $ | 530 | $ | 625 | ||||
| 5.00%, 2025 | 375 | 437 | ||||||
| Santa Monica-Malibu Unified School Dist., G.O. School Imps. Prop. Tax Bonds, Series C, 4.00%, 2019 | 3,360 | 3,526 | ||||||
| Santaluz Comm. Facs. Dist. No 2, Special Tax Ref. Bonds, Series A, 5.00%, 2020 | 995 | 1,091 | ||||||
| Saugus/Hart School Facs. Fncg. Auth., Special Tax Ref. Bonds: | ||||||||
| 5.00%, 2025 | 1,110 | 1,284 | ||||||
| 5.00%, 2027 | 460 | 528 | ||||||
| 4.00%, 2028 | 590 | 630 | ||||||
| Seal Beach Comm. Facs. Dist. No 2005-1, Special Tax Ref. Bonds: | ||||||||
| 3.00%, 2023 | 150 | 153 | ||||||
| 3.00%, 2024 | 145 | 148 | ||||||
| 3.00%, 2025 | 365 | 370 | ||||||
| 3.00%, 2026 | 150 | 151 | ||||||
| Signal Hill Redev. Agcy. Successor Agcy., Tax Increment Allocation Ref. Bonds, Series A (BAM Insured): | ||||||||
| 5.00%, 2021 | 250 | 284 | ||||||
| 5.00%, 2023 | 500 | 592 | ||||||
| Solano County Comm. College Dist., G.O. Prop. Tax Ref. Bonds (NATL-RE Insured), 0.00%, 20213 | 2,680 | 2,527 | ||||||
| Sonoma-Marin Area Rail Transit Dist., Rev. Bonds, Series A, 5.00%, 2021 | 1,000 | 1,127 | ||||||
| South Orange County Public Fncg. Auth., Special Tax Ref. Bonds, Series A (AMBAC Insured), 5.00%, 2020 | 1,000 | 1,003 | ||||||
| Southern California Public Power Auth., Energy Res. Auth. Imps. Rev. Bonds: | ||||||||
| 5.00%, 2018 | 200 | 205 | ||||||
| 5.00%, 2020 | 1,550 | 1,710 | ||||||
| 5.00%, 2023 | 800 | 881 | ||||||
| Southern California Public Power Auth., Energy Res. Auth. Imps. Rev. Bonds, Series A, 4.00%, 2021 | 500 | 537 | ||||||
| Southern California Public Power Auth., Energy Res. Auth. Rev. Ref. Bonds: | ||||||||
| 5.00%, 2018 | 350 | 359 | ||||||
| 5.00%, 2021 | 750 | 854 | ||||||
| Southern California Public Power Auth., Energy Res. Auth. Rev. Ref. Bonds, Series A: | ||||||||
| 5.00%, 2019 | 1,000 | 1,066 | ||||||
| 5.00%, 2020 | 245 | 270 | ||||||
| Southern California Public Power Auth., Misc. Rev. Ref. Bonds, 5.00%, 2023 | 10 | 10 | ||||||
| Southern California Public Power Auth., Misc. Rev. Ref. Bonds (Pre-refunded with U.S. Treasury Obligations to 01/01/19 @ 100), 5.00%, 2023 | 90 | 94 | ||||||
| State of California Dept. of Veterans Affairs, Loc. or GTD Housing Rev. Ref. Bonds, Series B, 3.50%, 2045 | 1,885 | 1,992 | ||||||
| State of California, G.O. Correctional Facs. Imps. Prop. Tax Bonds, 5.25%, 2020 | 100 | 108 | ||||||
| State of California, G.O. General Fund Ref. Bonds: | ||||||||
| 5.00%, 2019 | 2,000 | 2,098 | ||||||
| 5.00%, 2019 | 600 | 633 | ||||||
| 5.00%, 2020 | 4,440 | 4,825 | ||||||
| 5.00%, 2020 | 1,265 | 1,397 | ||||||
| 5.25%, 2020 | 650 | 701 | ||||||
| 5.00%, 2026 | 1,750 | 2,174 | ||||||
| 5.00%, 2027 | 2,000 | 2,506 | ||||||
| State of California, G.O. Misc. Rev. Ref. Bonds: | ||||||||
| 1.35%, 2019 | 1,125 | 1,130 | ||||||
| 4.00%, 2019 | 2,000 | 2,116 | ||||||
| State of California, G.O. Misc. Rev. Ref. Bonds, Series A (Mandatory Put 05/01/18 @ 100), 1.37%, 20331 | 5,575 | 5,576 | ||||||
| Private Client Services Funds | 41 |
Capital Group California Core Municipal Fund
Schedule of investments
October 31, 2017
| Bonds & notes - continued | Principal amount (000) | Value (000) | ||||||
| California - continued | ||||||||
| State of California, G.O. Public Imps. General Fund Bonds, 5.50%, 2018 | $ | 100 | $ | 102 | ||||
| State of California, G.O. Public Imps. Misc. Tax Bonds (NATL-RE Insured), 6.00%, 2020 | 5 | 5 | ||||||
| State of California, G.O. Public Imps. Prop. Tax Bonds, Series CN, 3.50%, 2045 | 1,115 | 1,180 | ||||||
| State of California, G.O. Sales Tax Rev. Ref. Bonds, Series A (Pre-refunded with U.S. Treasury Obligations 07/01/19 @ 100), 5.25%, 2021 | 1,060 | 1,134 | ||||||
| Stockton Public Fncg. Auth., Sewer Rev. Ref. Bonds (BAM Insured), 5.00%, 2021 | 750 | 854 | ||||||
| Successor Agcy. to the Richmond County Redev. Agcy., Tax Allocation Rev. Ref. Bonds, Series A (BAM Insured), 5.00%, 2025 | 200 | 236 | ||||||
| Suisun City Redev. Agcy., Tax Increment Allocation Rev. Ref. Bonds, Series B (BAM Insured), 5.00%, 2022 | 400 | 465 | ||||||
| Temecula Valley Unified School Dist. Fncg. Auth., Special Tax Ref. Bonds (BAM Insured), 5.00%, 2027 | 1,720 | 2,051 | ||||||
| Tracy Comm. Dev. Agcy. Successor Agcy., Tax Allocation Rev. Ref. Bonds (AGM Insured): | ||||||||
| 5.00%, 2029 | 555 | 659 | ||||||
| 5.00%, 2030 | 545 | 644 | ||||||
| Tuolumne Wind Project Auth., Energy Res. Auth. Imps. Rev. Bonds, Series A: | ||||||||
| 5.00%, 2022 | 1,500 | 1,569 | ||||||
| 5.25%, 2024 | 100 | 105 | ||||||
| Turlock Irrigation Dist., Energy Res. Auth. Rev. Ref. Bonds: | ||||||||
| 5.00%, 2018 | 500 | 503 | ||||||
| 5.00%, 2020 | 610 | 662 | ||||||
| 5.00%, 2022 | 1,705 | 1,904 | ||||||
| Tustin Comm. Facs. Dist., Special Tax Ref. Bonds, 5.00%, 2024 | 860 | 1,021 | ||||||
| Tustin Unified School Dist., Special Tax Ref. Bonds (BAM Insured), 5.00%, 2022 | 830 | 966 | ||||||
| Union City Comm. Redev. Agcy.,Tax Increment Allocation Rev. Ref. Bonds, Series A, 5.00%, 2023 | 375 | 446 | ||||||
| Univ. of California, College & Univ. Rev. Ref. Bonds, Series E, 5.00%, 2020 | 500 | 549 | ||||||
| Val Verde Unified School Dist., G.O. Prop. Tax Ref. Bonds, Series A (AGM Insured): | ||||||||
| 4.00%, 2021 | 250 | 274 | ||||||
| 4.00%, 2023 | 600 | 676 | ||||||
| Victor Valley Union High School Dist., G.O. Prop. Tax Ref. Bonds, Series B (AGM Insured): | ||||||||
| 4.00%, 2024 | 575 | 652 | ||||||
| 4.00%, 2026 | 270 | 309 | ||||||
| Vista Redev. Agcy. Successor Agcy., Tax Increment Allocation Rev. Ref. Bonds, Series B1 (AGM Insured): | ||||||||
| 5.00%, 2022 | 340 | 396 | ||||||
| 4.00%, 2025 | 400 | 457 | ||||||
| Washington Township Health Care Dist., Health Care Facs. Imps. Rev. Bonds, Series A, 4.00%, 2021 | 490 | 526 | ||||||
| Western Placer Unified School Dist., G.O. School Imps. Prop. Tax Bonds, Series B, 5.00%, 2021 | 490 | 555 | ||||||
| Western Riverside County Regional Wastewater Auth., Water Rev. Ref. Bonds, Series A: | ||||||||
| 5.00%, 2030 | 600 | 701 | ||||||
| 5.00%, 2032 | 1,195 | 1,377 | ||||||
| 344,695 | ||||||||
| Guam - 0.6% | ||||||||
| Guam Intl. Airport Auth., Port, Airport & Marina Rev. Ref. Bonds, Series A: | ||||||||
| 5.00%, 2021 | 350 | 387 | ||||||
| 5.00%, 2022 | 710 | 800 | ||||||
| Guam Intl. Airport Auth., Port, Airport & Marina Rev. Ref. Bonds, Series B, 5.00%, 2023 | 1,100 | 1,204 | ||||||
| 2,391 | ||||||||
| 42 | Private Client Services Funds |
Capital Group California Core Municipal Fund
Schedule of investments
October 31, 2017
| Bonds & notes - continued | Principal amount (000) | Value (000) | ||||||
| Iowa - 0.0% | ||||||||
| State of Iowa, General Fund Public Imps. Rev. Bonds, Series A, 5.00%, 2027 | $ | 100 | $ | 106 | ||||
| 106 | ||||||||
| Michigan - 0.0% | ||||||||
| Michigan State Hospital Fin. Auth., Health Care Facs. Rev. Ref. Bonds, 5.25%, 2024 | 100 | 108 | ||||||
| 108 | ||||||||
| Minnesota - 0.8% | ||||||||
| Minnesota Housing Fin. Agcy., Loc. or GTD Housing Rev. Bonds, Series G (GNMA/FNMA/FHLMC Insured), 2.65%, 2047 | 3,000 | 2,952 | ||||||
| 2,952 | ||||||||
| Missouri - 0.1% | ||||||||
| Missouri Housing Dev. Commission, Loc. or GTD Housing Rev. Bonds (GNMA/FNMA Insured), 3.75%, 2038 | 265 | 281 | ||||||
| 281 | ||||||||
| Oregon - 0.3% | ||||||||
| Oregon State Facs. Auth., Health Care Facs. Rev. Ref. Bonds (Mandatory Put 09/15/18 @ 100), 1.92%, 20221 | 1,000 | 1,003 | ||||||
| 1,003 | ||||||||
| Puerto Rico - 1.2% | ||||||||
| Puerto Rico Ind. Tourist Educ. Medical & Environmental Control Facs. Fncg. Auth., College & Univ. Rev. Ref. Bonds: | ||||||||
| 5.00%, 2019 | 500 | 516 | ||||||
| 5.00%, 2021 | 1,000 | 1,052 | ||||||
| Puerto Rico Infrastructure Fncg. Auth., Tobacco & Liquor Taxes Rev. Ref. Bonds, Series C (BHAC-CR FGIC Insured), 5.50%, 2020 | 2,860 | 3,135 | ||||||
| 4,703 | ||||||||
| Total bonds & notes (cost: $349,523,000) | 356,239 | |||||||
| Short-term securities - 8.1% | ||||||||
| California EDL Facs. Auth., Rev., 0.90%, December 11, 20171 | $ | 3,300 | 3,300 | |||||
| California Muni. Fin. Auth., Ind. Imps. Rev. Bonds, 0.80%, November 01, 20351 | 2,400 | 2,400 | ||||||
| California Muni. Fin. Auth., Res. Recovery Rev. Ref. Bonds, 0.80%, June 01, 20251 | 200 | 200 | ||||||
| California Pollution Control Fncg. Auth., Energy Res. Auth. Rev. Ref. Bonds, Series C, 0.84%, November 01, 20261 | 7,500 | 7,500 | ||||||
| California State Dept. of Water Ress., Water Rev. Ref. Bonds:1 | ||||||||
| 0.83%, November 02, 2017 | 2,900 | 2,900 | ||||||
| 0.92%, November 02, 2017 | 6,500 | 6,500 | ||||||
| 0.84%, December 05, 2017 | 1,000 | 1,000 | ||||||
| California Statewide Comms. Dev. Auth.:1 | ||||||||
| 0.93%, November 16, 2017 | 1,000 | 1,000 | ||||||
| 0.91%, April 04, 2018 | 2,000 | 1,999 | ||||||
| California Statewide Comms. Dev. Auth., Health Care Facs. Imps. Rev. Bonds, Series C-2, 0.86%, April 01, 20461 | 1,000 | 1,000 | ||||||
| Private Client Services Funds | 43 |
Capital Group California Core Municipal Fund
Schedule of investments
October 31, 2017
| Short-term securities - continued | Principal amount (000) | Value (000) | ||||||
| Manteca Redev. Agcy., Tax Increment Allocation Rev. Ref. Bonds, 0.88%, October 01, 20421 | $ | 1,530 | $ | 1,530 | ||||
| State of California, G.O. General Fund Ref. Bonds, Series B (Mandatory Put 12/01/21 @ 100), 1.625%, December 01, 20311 | 2,175 | 2,209 | ||||||
| Total short-term securities (cost: $31,530,000) | 31,538 | |||||||
| Total investment securities (cost: $381,053,000) | 387,777 | |||||||
| Other assets less liabilities | 223 | |||||||
| Net assets | $ | 388,000 | ||||||
| 1 | Coupon rate may change periodically. For short-term securities, the date of the next scheduled coupon rate change is considered to be the maturity date. |
| 2 | Acquired in a transaction exempt from registration under Rule 144A or section 4(2) of the Securities Act of 1933. May be resold in the U.S. in transactions exempt from registration, normally to qualified institutional buyers. At October 31, 2017, the aggregate market value of these securities amounted to $1,533,000, representing 0.40% of net assets. |
| 3 | Zero coupon bond; interest rate represents current yield to maturity. |
Key to abbreviations
| Agcy. | = | Agency |
| AGM | = | Assured Guaranty Municipal Corporation |
| AMBAC | = | American Municipal Bond Assurance Corporation |
| Approp. | = | Appropriation |
| Auth. | = | Authority |
| BAM | = | Build America Mutual Assurance Company |
| BHAC-CR | = | Berkshire Hathaway Assuranty Corp. |
| CA Mtg. Ins. | = | California Mortgage Insurance |
| Certs. of Part. | = | Certificates of Participation |
| Comm. | = | Community |
| Comms. | = | Communities |
| Corp. | = | Corporation |
| Corps. | = | Corporations |
| Dept. | = | Department |
| Dev. | = | Development |
| Dist. | = | District |
| Econ. | = | Economic |
| Educ. | = | Educational |
| Fac. | = | Facility |
| Facs. | = | Facilities |
| FGIC | = | Financial Guaranty Insurance Company |
| FHLMC | = | Federal Home Loan Mortgage Corporation |
| Fin. | = | Finance |
| Fncg. | = | Financing |
| FNMA | = | Federal National Mortgage Association |
| GNMA | = | Government National Mortgage Association |
| G.O. | = | General Obligation |
| GTD | = | Guaranteed |
| Imps. | = | Improvements |
| Ind. | = | Industrial |
| Intl. | = | International |
| Loc. | = | Local |
| Mgmt. | = | Management |
| Misc. | = | Miscellaneous |
| Muni. | = | Municipal |
| NATL-RE | = | National Reinsurance |
| Prop. | = | Property |
| Rec. | = | Recreational |
| Redev. | = | Redevelopment |
| Ref. | = | Refunding |
| Res. | = | Resource |
| Ress. | = | Resources |
| Rev. | = | Revenue |
| Trans. | = | Transportation |
| Univ. | = | University |
| Util. | = | Utility |
See Notes to Financial Statements
| 44 | Private Client Services Funds |
Capital Group California Short-Term Municipal Fund
October 31, 2017
Growth of $25,000 investment
Here’s how a $25,000 investment in the Capital Group California Short-Term Municipal Fund grew between April 13, 2010, when the fund began operations, and October 31, 2017, the end of the fund’s fiscal year.
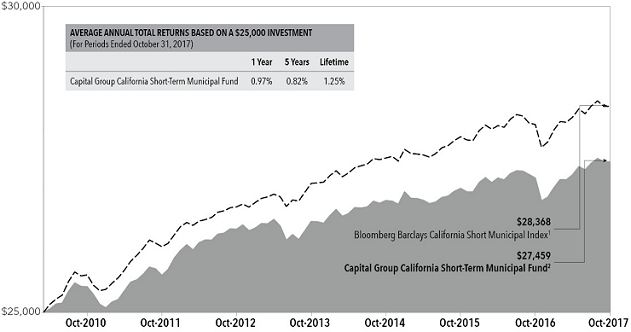
| 1 | The index is unmanaged, and its results include reinvested distributions but do not reflect the effect of sales charges, commissions, or expenses. |
| 2 | Includes reinvested dividends and capital gain distributions. |
Results are for past periods and are not predictive of results for future periods. Current and future results may be lower or higher than those shown. Share price and returns will vary so investors may lose money. The results shown are before taxes on fund distributions and sale of fund shares.
Investment portfolio – quality ratings*
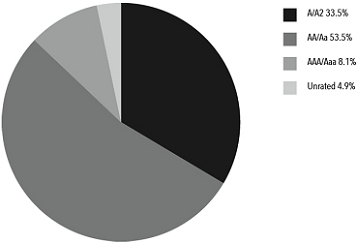
| * | Bond ratings, which typically range from Aaa/AAA (highest to D (lowest), are assigned by credit rating agencies such as Moody’s, Standard & Poors and/or Fitch as an indication of an Issuer’s credit-worthiness. If agency rating differ, securities are put in the highest category consistent with fund investment policies. When securities have not been rated by a rating agency (included in “unrated” at left), the investment advisor performs its own credit analysis and assigns comparable ratings that are used for compliance and fund investment policies. The ratings are not covered by the Report of Independent Registered Public Accounting Firm. |
| Private Client Services Funds | 45 |
Capital Group California Short-Term Municipal Fund
Schedule of investments
October 31, 2017
| Bonds & notes - 96.1% | Principal amount (000) | Value (000) | ||||||
| California - 94.6% | ||||||||
| Abag Fin. Auth. for Nonprofit Corps., Health Care Facs. Rev. Ref. Bonds, Series A (CA Mtg. Ins.), 5.00%, 2018 | $ | 250 | $ | 254 | ||||
| Abag Fin. Auth. for Nonprofit Corps., Special Tax Ref. Bonds, 4.00%, 2019 | 515 | 541 | ||||||
| Alameda Corridor Trans. Auth., Port, Airport & Marina. Rev. Ref. Bonds, Series A, 5.00%, 2020 | 500 | 555 | ||||||
| Bay Area Toll Auth., Highway Tolls Rev. Bonds (Mandatory Put 05/01/23 @ 100):1 | ||||||||
| 1.82%, 2045 | 500 | 509 | ||||||
| 1.82%, 2047 | 250 | 254 | ||||||
| Bay Area Toll Auth., Highway Tolls Rev. Bonds (Mandatory Put 10/01/19 @ 100), 1.62%, 20471 | 1,000 | 1,006 | ||||||
| Bay Area Toll Auth., Highway Tolls Rev. Ref. Bonds, Series C (Mandatory Put 04/01/19 @ 100), 1.875%, 20471 | 500 | 503 | ||||||
| Bay Area Toll Auth., Highway Tolls Rev. Ref. Bonds, Series G (Mandatory Put 04/01/20 @ 100), 1.52%, 20341 | 250 | 251 | ||||||
| Bay Area Toll Auth., Highway Tolls Rev. Ref. Bonds, Series H (Mandatory Put 04/01/21 @ 100), 1.62%, 20341 | 250 | 253 | ||||||
| Brea Redev. Agcy., Tax Increment Allocation Rev. Ref. Bonds, 5.00%, 2019 | 700 | 747 | ||||||
| Burbank Redev. Agcy. Successor Agcy., Tax Increment Allocation Rev. Ref. Bonds (BAM Insured): | ||||||||
| 4.00%, 2018 | 500 | 516 | ||||||
| 5.00%, 2020 | 750 | 839 | ||||||
| 5.00%, 2022 | 500 | 590 | ||||||
| California Educ. Facs. Auth., College & Univ. Rev. Ref. Bonds, 4.00%, 2018 | 400 | 410 | ||||||
| California Health Facs. Fncg. Auth., Health Care Facs. Imps. Rev. Bonds, Series A, 5.00%, 2022 | 200 | 235 | ||||||
| California Health Facs. Fncg. Auth., Health Care Facs. Rev. Ref. Bonds: | ||||||||
| 4.00%, 2022 | 330 | 362 | ||||||
| 5.00%, 2022 | 300 | 351 | ||||||
| California Health Facs. Fncg. Auth., Health Care Facs. Rev. Ref. Bonds (CA Mtg. Ins.): | ||||||||
| 4.00%, 2018 | 425 | 427 | ||||||
| 5.00%, 2019 | 500 | 523 | ||||||
| 5.00%, 2019 | 200 | 215 | ||||||
| 5.00%, 2020 | 150 | 165 | ||||||
| California Health Facs. Fncg. Auth., Health Care Facs. Rev. Ref. Bonds (Mandatory Put 10/18/22 @ 100), 1.70%, 20331 | 510 | 508 | ||||||
| California Health Facs. Fncg. Auth., Health Care Facs. Rev. Ref. Bonds, Series A: | ||||||||
| 4.00%, 2018 | 200 | 202 | ||||||
| 5.00%, 2018 | 500 | 518 | ||||||
| 4.00%, 2019 | 500 | 519 | ||||||
| 5.00%, 2019 | 525 | 563 | ||||||
| 5.00%, 2019 | 300 | 323 | ||||||
| 4.00%, 2020 | 625 | 662 | ||||||
| 5.00%, 2020 | 695 | 754 | ||||||
| California Health Facs. Fncg. Auth., Health Care Facs. Rev. Ref. Bonds, Series D (Mandatory Put 10/15/20 @ 100), 5.00%, 20431 | 500 | 552 | ||||||
| California Infrastructure & Econ. Dev. Bank, Energy Res. Auth. Rev. Ref. Bonds, Series E (Mandatory Put 06/01/22 @ 100), 1.75%, 20261 | 500 | 501 | ||||||
| California Infrastructure & Econ. Dev. Bank, Health Care Facs. Rev. Ref. Bonds: | ||||||||
| 5.00%, 2021 | 235 | 266 | ||||||
| 5.00%, 2022 | 265 | 308 | ||||||
| California Infrastructure & Econ. Dev. Bank, Misc. Rev. Ref. Bonds (Mandatory Put 04/01/18 @ 100), 1.20%, 20471 | 900 | 900 | ||||||
| California Infrastructure & Econ. Dev. Bank, Misc. Rev. Ref. Bonds (Mandatory Put 04/01/20 @ 100), 1.305%, 20381 | 1,500 | 1,507 | ||||||
| California State Dept. of Water Ress., Energy Res. Auth. Rev. Ref. Bonds, Series N, 5.00%, 2020 | 500 | 548 | ||||||
| California State Dept. of Water Ress., Water Rev. Ref. Bonds, Series AM, 5.00%, 2018 | 160 | 167 | ||||||
| California State Public Works Board, Capital Project Lease Rev. Ref. Bonds, 5.00%, 2021 | 1,000 | 1,141 | ||||||
| 46 | Private Client Services Funds |
Capital Group California Short-Term Municipal Fund
Schedule of investments
October 31, 2017
| Bonds & notes - continued | Principal amount (000) | Value (000) | ||||||
| California - continued | ||||||||
| California State Public Works Board, Correctional Fac. Imps. Lease Rev. Bonds, 5.00%, 2020 | $ | 1,000 | $ | 1,105 | ||||
| California State Public Works Board, Correctional Fac. Imps. Lease Rev. Bonds, Series A: | ||||||||
| 5.00%, 2018 | 250 | 258 | ||||||
| 5.00%, 2020 | 700 | 768 | ||||||
| California State Public Works Board, Correctional Fac. Imps. Lease Rev. Bonds, Series C, 5.00%, 2021 | 720 | 820 | ||||||
| California State Public Works Board, Lease Rev. Ref. Bonds, 4.00%, 2018 | 425 | 432 | ||||||
| California State Public Works Board, Lease Rev. Ref. Bonds, Series B, 5.00%, 2022 | 500 | 583 | ||||||
| California State Public Works Board, Lease Rev. Ref. Bonds, Series G, 5.00%, 2021 | 1,000 | 1,116 | ||||||
| California State Public Works Board, Lease Rev. Ref. Bonds, Series H, 5.00%, 2020 | 1,000 | 1,114 | ||||||
| California State Public Works Board, Public Imps. Lease Rev. Bonds, Series A, 4.00%, 2019 | 500 | 520 | ||||||
| California State Public Works Board, Public Imps. Lease Rev. Bonds, Series I, 4.00%, 2019 | 500 | 528 | ||||||
| California State Univ., College & Univ. Rev. Ref. Bonds, Series A, 5.00%, 2018 | 400 | 416 | ||||||
| California State Univ., College & Univ. Rev. Ref. Bonds, Series B-3 (Mandatory Put 11/01/23 @ 100), 4.00%, 20511 | 1,550 | 1,743 | ||||||
| California Statewide Comms. Dev. Auth., Health Care Facs. Nursing Homes Rev. Bonds (CA Mtg. Ins.), 3.50%, 2021 | 250 | 261 | ||||||
| California Statewide Comms. Dev. Auth., Health Care Facs. Rev. Ref. Bonds (CA Mtg. Ins.), 4.00%, 2019 | 160 | 170 | ||||||
| California Statewide Comms. Dev. Auth., Health Care Facs. Rev. Ref. Bonds, Series B, 5.00%, 2020 | 1,225 | 1,339 | ||||||
| California Statewide Comms. Dev. Auth., Ind. Rev. Ref. Bonds (Mandatory Put 04/01/20 @ 100), 1.90%, 20281 | 500 | 506 | ||||||
| California Statewide Comms. Dev. Auth., Ind. Rev. Ref. Bonds (Mandatory Put 12/01/23 @ 100), 2.625%, 20331 | 1,100 | 1,130 | ||||||
| California Statewide Comms. Dev. Auth., Misc. Rev. Ref. Bonds (AGM Insured), 5.00%, 2019 | 380 | 410 | ||||||
| Carson Redev. Agcy. Successor Agcy., Tax Increment Allocation Ref. Bonds, Series A, 5.00%, 2018 | 700 | 725 | ||||||
| Chino Public Fncg. Auth., Special Tax Ref. Bonds, Series A (AGM Insured), 4.00%, 2021 | 655 | 719 | ||||||
| Chino Redev. Agcy. Successor Agcy., Tax Increment Allocation Ref. Bonds, Series A (BAM Insured), 5.00%, 2018 | 125 | 129 | ||||||
| Chino Valley Unified School Dist., G.O. School Imps. Prop. Tax Bonds, Series A, 5.00%, 2021 | 750 | 856 | ||||||
| City of Alhambra, Health Care Facs. Rev. Ref. Bonds (CA Mtg. Ins.), 5.00%, 2023 | 450 | 516 | ||||||
| City of Chula Vista, Energy Res. Auth. Rev. Ref. Bonds, Series A, 1.65%, 2018 | 1,100 | 1,101 | ||||||
| City of Irvine, Special Assessment Ref. Bonds: | ||||||||
| 4.00%, 2018 | 500 | 512 | ||||||
| 4.00%, 2019 | 300 | 315 | ||||||
| 5.00%, 2021 | 500 | 561 | ||||||
| City of Long Beach, Port, Airport & Marina Imps. Rev. Ref. Bonds, Series B, 4.00%, 2018 | 225 | 229 | ||||||
| City of Long Beach, Port, Airport & Marina Rev. Ref. Bonds, Series C, 3.00%, 2018 | 1,425 | 1,454 | ||||||
| City of Los Angeles, Dept. of Airports, Port, Airport & Marina Rev. Ref. Bonds, Series A, 5.00%, 2021 | 400 | 424 | ||||||
| City of Los Angeles, Dept. of Airports, Port, Airport & Marina Rev. Ref. Bonds, Series C, 5.00%, 2021 | 400 | 453 | ||||||
| City of Redding Electric System Rev., Energy Res. Auth. Rev. Ref. Bonds, 5.00%, 2021 | 800 | 903 | ||||||
| City of Santa Clara, Energy Res. Auth. Rev. Ref. Bonds, Series A, 5.00%, 2018 | 500 | 513 | ||||||
| Concord Redev. Agcy. Successor Agcy., Tax Increment Allocation Rev. Ref. Bonds, 5.00%, 2018 | 600 | 608 | ||||||
| County of El Dorado, Special Tax Ref. Bonds: | ||||||||
| 4.00%, 2018 | 450 | 461 | ||||||
| 5.00%, 2020 | 545 | 602 | ||||||
| County of Los Angeles, G.O. Cash Flow Mgmt. Misc. Rev. Notes, 5.00%, 2018 | 1,000 | 1,026 | ||||||
| Desert Comm. College Dist., G.O. Prop. Tax Ref. Bonds, 4.00%, 2018 | 700 | 716 | ||||||
| Elk Grove Fin. Auth., Special Tax Ref. Bonds, 5.00%, 2021 | 900 | 1,021 | ||||||
| Private Client Services Funds | 47 |
Capital Group California Short-Term Municipal Fund
Schedule of investments
October 31, 2017
| Bonds & notes - continued | Principal amount (000) | Value (000) | ||||||
| California - continued | ||||||||
| Emeryville Redev. Agcy. Successor Agcy., Tax Increment Allocation Ref. Bonds, Series A: | ||||||||
| 5.00%, 2018 | $ | 500 | $ | 516 | ||||
| 5.00%, 2019 | 950 | 1,015 | ||||||
| Fillmore Redev. Agcy. Successor Agcy., Tax Increment Allocation Ref. Bonds: | ||||||||
| 4.00%, 2019 | 400 | 418 | ||||||
| 5.00%, 2020 | 500 | 547 | ||||||
| Fresno Joint Powers Fncg. Auth., Lease Rev. Ref. Bonds, Series A, 5.00%, 2020 | 1,000 | 1,087 | ||||||
| Glendale Redev. Agcy. Successor Agcy., Tax Increment Allocation Ref. Bonds (AGM Insured): | ||||||||
| 4.00%, 2019 | 600 | 636 | ||||||
| 5.00%, 2020 | 500 | 556 | ||||||
| Glendale Redev. Agcy. Successor Agcy., Tax Increment Allocation Ref. Bonds (BAM Insured), 4.00%, 2023 | 500 | 565 | ||||||
| Golden State Tobacco Securitization Corp., Misc. Rev. Ref. Bonds, Series A: | ||||||||
| 5.00%, 2018 | 500 | 512 | ||||||
| 5.00%, 2019 | 500 | 532 | ||||||
| Golden State Tobacco Securitization Corp., Tobacco Settlement Fncg. Rev. Ref. Bonds, Series A (St. Approp Insured), 5.00%, 2020 | 700 | 770 | ||||||
| Golden State Tobacco Securitization Corp., Tobacco Settlement Fncg. Rev. Ref. Bonds, Series A-1, 5.00%, 2020 | 1,360 | 1,490 | ||||||
| Golden West Schools Fncg. Auth., Misc. Rev. Ref. Bonds, Series A (NATL-RE Insured), 0.00%, 20202 | 1,100 | 1,065 | ||||||
| Hawthorne Comm. Redev. Agcy. Successor Agcy., Tax Increment Allocation Rev. Ref. Bonds (AGM Insured), 5.00%, 2021 | 300 | 342 | ||||||
| Hemet Unified School Dist., G.O. Prop. Tax Ref. Bonds (AGM Insured), 5.00%, 2018 | 1,000 | 1,029 | ||||||
| Imperial Irrigation Dist., Energy Res. Auth. Rev. Ref. Bonds, Series C, 5.00%, 2018 | 425 | 442 | ||||||
| Kern County Water Agcy. Imp. Dist. No. 4, Water Rev. Ref. Bonds, Series A (AGM Insured): | ||||||||
| 4.00%, 2020 | 700 | 749 | ||||||
| 5.00%, 2021 | 740 | 836 | ||||||
| Kern High School Dist., G.O. School Imps. Prop. Tax Bonds, Series A, 4.00%, 2021 | 1,500 | 1,655 | ||||||
| Kings Canyon Unified School Dist., G.O. Prop. Tax Ref. Bonds (AGM Insured), 5.00%, 2022 | 470 | 546 | ||||||
| La Quinta Redev. Agcy. Successor Agcy., Tax Allocation Ref. Bonds, 4.00%, 2018 | 500 | 513 | ||||||
| Lammersville Joint Unified School Dist., Special Tax Ref. Bonds, 4.00%, 2021 | 525 | 567 | ||||||
| Long Beach Bond Fin. Auth., Misc. Rev. Ref. Bonds, 5.00%, 2018 | 700 | 728 | ||||||
| Long Beach Comm., College Dist., G.O. Univ. & College Imps. Prop. Tax Bonds, Series B, 4.00%, 2019 | 300 | 316 | ||||||
| Los Angeles County Redev. Auth., Tax Increment Allocation Ref. Bonds, Series S, 5.00%, 2019 | 1,000 | 1,069 | ||||||
| Los Angeles County Redev. Auth., Tax Increment Allocation Rev. Ref. Bonds: | ||||||||
| 5.00%, 2018 | 1,100 | 1,146 | ||||||
| 5.00%, 2018 | 175 | 179 | ||||||
| 5.00%, 2019 | 700 | 755 | ||||||
| Los Angeles Unified School Dist., G.O. Prop. Tax Ref. Bonds, Series A, 5.00%, 2020 | 1,500 | 1,656 | ||||||
| Los Angeles Unified School Dist., G.O. Prop. Tax Ref. Bonds, Series C, 5.00%, 2019 | 1,100 | 1,172 | ||||||
| Los Angeles Unified School Dist., G.O. School Imps. Prop. Tax Bonds, Series I, 5.00%, 2018 | 500 | 514 | ||||||
| Menifee Union School Dist. Public Fncg. Auth., Special Tax Ref. Bonds, Series A: | ||||||||
| 4.00%, 2022 | 250 | 274 | ||||||
| 5.00%, 2022 | 250 | 290 | ||||||
| Merced Irrigation Dist., Energy Res. Auth. Rev. Ref. Bonds, Series A (AGM Insured), 4.00%, 2019 | 600 | 634 | ||||||
| Metropolitan Water Dist. of Southern California, Water Rev. Ref. Bonds, Series B-1 (Mandatory Put 03/27/18 @ 100), 1.30%, 20271 | 500 | 500 | ||||||
| Metropolitan Water Dist. of Southern California, Water Rev. Ref. Bonds, Sub-Series B, 5.00%, 2021 | 1,000 | 1,139 | ||||||
| Modesto Irrigation Dist., Energy Res. Auth. Rev. Ref. Bonds, 5.00%, 2022 | 250 | 292 | ||||||
| Montebello Unified School Dist., G.O. School Imps. Prop. Tax Bonds, Series A, 4.00%, 2019 | 250 | 263 | ||||||
| 48 | Private Client Services Funds |
Capital Group California Short-Term Municipal Fund
Schedule of investments
October 31, 2017
| Bonds & notes - continued | Principal amount (000) | Value (000) | ||||||
| California - continued | ||||||||
| Oakland Redev. Successor Agcy., Tax Increment Allocation Ref. Bonds, 5.00%, 2018 | $ | 500 | $ | 516 | ||||
| Oakland Unified School Dist., G.O. Prop. Tax Ref. Bonds (AGM Insured), 5.00%, 2021 | 385 | 439 | ||||||
| Oakland Unified School Dist., G.O. Prop. Tax Ref. Bonds, Series A, 5.00%, 2020 | 1,500 | 1,658 | ||||||
| Orange Comm. Facs. Dist., Special Tax Ref. Bonds, 4.00%, 2018 | 300 | 308 | ||||||
| Orange Redev. Agcy. Successor Agcy., Tax Increment Allocation Ref. Bonds: | ||||||||
| 5.00%, 2018 | 375 | 387 | ||||||
| 5.00%, 2019 | 200 | 214 | ||||||
| 5.00%, 2021 | 200 | 227 | ||||||
| Oxnard Fncg. Auth., Sewer Rev. Ref. Bonds (AGM Insured), 5.00%, 2021 | 350 | 396 | ||||||
| Palomar Health, G.O. Prop. Tax Ref. Bonds, Series A, 4.00%, 2020 | 1,235 | 1,325 | ||||||
| Port of Oakland, Port, Airport & Marina Rev. Ref. Bonds, Series E, 5.00%, 2020 | 1,000 | 1,111 | ||||||
| Poway Unified School Dist. Public Fncg. Auth., Special Tax Ref. Bonds, Series A, 4.00%, 2022 | 800 | 890 | ||||||
| Rancho Cucamonga Redev. Agcy. Successor Agcy., Tax Allocation Ref. Bonds, 5.00%, 2019 | 630 | 674 | ||||||
| Rancho Mirage Redev. Agcy. Successor Agcy., Tax Increment Allocation Ref. Bonds, Series A (BAM Insured), 5.00%, 2021 | 1,000 | 1,126 | ||||||
| Rancho Santa Fe Comm. Services Dist., Special Tax Ref. Bonds, Series A: | ||||||||
| 3.00%, 2019 | 505 | 521 | ||||||
| 4.00%, 2020 | 490 | 527 | ||||||
| Riverside County Redev. Successor Agcy., Tax Allocation Ref. Bonds, 5.00%, 2019 | 375 | 402 | ||||||
| Riverside County Redev. Successor Agcy., Tax Increment Allocation Rev. Ref. Bonds, Series B (AGM Insured), 4.00%, 2018 | 500 | 513 | ||||||
| Riverside Redev. Successor Agcy., Tax Allocation Ref. Bonds, Series A, 5.00%, 2019 | 850 | 908 | ||||||
| Riverside Unified School Dist. Fncg. Auth., Special Tax Ref. Bonds (BAM Insured), 5.00%, 2021 | 285 | 324 | ||||||
| Roseville Fin. Auth., Special Tax Ref. Bonds: | ||||||||
| 4.00%, 2021 | 450 | 494 | ||||||
| 4.00%, 2022 | 620 | 690 | ||||||
| San Bernardino County Trans. Auth. Rev. Ref. Bonds, Series A, 4.00%, 2018 | 500 | 505 | ||||||
| San Diego County Regional Airport Auth., Port, Airport & Marina Imps. Rev. Bonds, Sub-Series A, 5.00%, 2018 | 100 | 103 | ||||||
| San Diego Redev. Agcy. Successor Agcy., Tax Increment Allocation Rev. Ref. Bonds, Series A: | ||||||||
| 5.00%, 2020 | 850 | 942 | ||||||
| 5.00%, 2021 | 365 | 417 | ||||||
| San Diego Unified School Dist., G.O. School Imps. Prop. Tax, Series H-2, 5.00%, 2020 | 1,000 | 1,105 | ||||||
| San Francisco City & County Airports Commission, Port, Airport & Marina Rev. Ref. Bonds, Series D, 5.00%, 2018 | 500 | 510 | ||||||
| San Francisco City & County Redev. Agcy., Tax Increment Allocation Rev. Ref. Bonds, Series C: | ||||||||
| 5.00%, 2020 | 500 | 551 | ||||||
| 5.00%, 2022 | 250 | 290 | ||||||
| San Francisco Comm. College Dist., G.O. Prop. Tax Ref. Bonds, 5.00%, 2020 | 1,000 | 1,102 | ||||||
| San Jose Unified School Dist., G.O. Prop. Tax Ref. Bonds: | ||||||||
| 4.00%, 2018 | 300 | 307 | ||||||
| 4.00%, 2019 | 475 | 500 | ||||||
| San Leandro Unified School Dist., G.O. School Imps. Prop. Tax Bonds, Series A, 5.00%, 2020 | 700 | 774 | ||||||
| San Mateo Joint Powers Fncg. Auth., Lease Rev. Ref. Bonds, 4.00%, 2020 | 775 | 834 | ||||||
| San Ramon Redev. Agcy. Successor Agcy., Tax Increment Allocation Rev. Ref. Bonds, Sub-Series A (BAM Insured), 5.00%, 2021 | 340 | 380 | ||||||
| Sonoma-Marin Area Rail Transit Dist. Rev. Bonds, Series A, 5.00%, 2018 | 750 | 760 | ||||||
| Southern California Public Power Auth., Energy Res. Auth. Imps. Rev. Bonds, 5.00%, 2018 | 200 | 205 | ||||||
| Southern California Public Power Auth., Energy Res. Auth. Rev. Ref. Bonds, 5.00%, 2018 | 350 | 359 | ||||||
| Southern California Public Power Auth., Energy Res. Auth. Rev. Ref. Bonds, Series A, 5.00%, 2019 | 600 | 639 | ||||||
| Southern California Public Power Auth., Misc. Rev. Ref. Bonds, Series A, 5.00%, 2018 | 300 | 308 | ||||||
| Southwestern Comm. College Dist., G.O. Prop. Tax Ref. Bonds, Series A, 3.00%, 2021 | 200 | 214 | ||||||
| Private Client Services Funds | 49 |
Capital Group California Short-Term Municipal Fund
Schedule of investments
October 31, 2017
| Bonds & notes - continued | Principal amount (000) | Value (000) | ||||||
| California - continued | ||||||||
| Southwestern Comm. College Dist., G.O. Prop. Tax Ref. Bonds, Series B, 4.00%, 2022 | $ | 310 | $ | 349 | ||||
| State of California Dept. of Veterans Affairs, Loc. or GTD Housing Rev. Ref. Bonds, Series B, 3.50%, 2045 | 345 | 365 | ||||||
| State of California, G.O. General Fund Public Imps. Bonds, Series E (Mandatory Put 12/03/18 @ 100), 1.692%, 20291 | 500 | 502 | ||||||
| State of California, G.O. General Fund Ref. Bonds, 5.00%, 2021 | 500 | 568 | ||||||
| State of California, G.O. General Fund Ref. Notes, 5.00%, 2019 | 900 | 973 | ||||||
| State of California, G.O. Misc. Rev. Ref. Bonds, 1.35%, 2019 | 775 | 778 | ||||||
| State of California, G.O. Misc. Rev. Ref. Bonds, Series A (Mandatory Put 05/01/18 @ 100), 1.37%, 20331 | 1,500 | 1,500 | ||||||
| State of California, G.O. Prop. Tax Ref. Bonds, 5.00%, 2021 | 2,000 | 2,292 | ||||||
| State of California, G.O. Public Imps. Prop. Tax Bonds, Series CN, 3.50%, 2045 | 870 | 920 | ||||||
| Stockton Public Fncg. Auth., Sewer Rev. Ref. Bonds (BAM Insured), 5.00%, 2020 | 500 | 553 | ||||||
| Successor Agcy. to the Richmond County Redev. Agcy., Tax Increment Allocation Ref. Bonds, Series A (BAM Insured), 5.00%, 2019 | 525 | 560 | ||||||
| Suisun City Redev. Agcy., Tax Allocation Rev. Ref. Bonds, Series B (BAM Insured): | ||||||||
| 5.00%, 2019 | 675 | 726 | ||||||
| 5.00%, 2021 | 500 | 569 | ||||||
| Sweetwater Union High School Dist., G.O. Prop. Tax Ref. Bonds, 5.00%, 2021 | 380 | 432 | ||||||
| Temecula Valley Unified School Dist. Fncg. Auth., Special Tax Ref. Bonds (BAM Insured), 5.00%, 2021 | 515 | 585 | ||||||
| Tracy Comm. Dev. Agcy. Successor Agcy., Tax Increment Allocation Rev. Ref. Bonds (AGM Insured), 5.00%, 2022 | 450 | 521 | ||||||
| Tustin Unified School Dist., Special Tax Ref. Bonds (BAM Insured), 5.00%, 2020 | 275 | 304 | ||||||
| Union City Comm. Redev. Agcy., Tax Increment Allocation Rev. Ref. Bonds, Series A, 5.00%, 2021 | 235 | 268 | ||||||
| Victor Valley Union High School Dist., G.O. Prop. Tax Ref. Bonds, Series B (AGM Insured), 3.00%, 2021 | 200 | 212 | ||||||
| Vista Redev. Agcy. Successor Agcy., Tax Increment Allocation Rev. Ref. Bonds, Series B1 (AGM Insured): | ||||||||
| 5.00%, 2020 | 275 | 304 | ||||||
| 5.00%, 2021 | 265 | 301 | ||||||
| West Sacramento Redev. Agcy. Successor Agcy., Tax Increment Allocation Ref. Bonds, 4.00%, 2019 | 755 | 793 | ||||||
| Westminster Redev. Agcy. Successor Agcy., Tax Increment Allocation Ref. Bonds: | ||||||||
| 4.00%, 2020 | 180 | 194 | ||||||
| 4.00%, 2022 | 120 | 134 | ||||||
| Westminster Redev. Agcy. Successor Agcy., Tax Increment Allocation Ref. Bonds (BAM Insured), 5.00%, 2028 | 300 | 361 | ||||||
| 113,342 | ||||||||
| Guam - 0.3% | ||||||||
| Guam Government Waterworks Auth., Water Util. Imps. Rev. Bonds, 5.00%, 2024 | 300 | 343 | ||||||
| 343 | ||||||||
| Illinois - 0.4% | ||||||||
| Illinois State Toll Highway Auth., Highway Tolls Rev. Ref. Bonds, Series B, 5.00%, 2017 | 500 | 502 | ||||||
| 502 | ||||||||
| 50 | Private Client Services Funds |
Capital Group California Short-Term Municipal Fund
Schedule of investments
October 31, 2017
| Bonds & notes - continued | Principal amount (000) | Value (000) | ||||||
| Louisiana - 0.0% | ||||||||
| Louisiana Housing Fin. Agcy., Loc. or GTD Housing Rev. Bonds (GNMA/FNMA/FHLMC Insured), 4.60%, 2028 | $ | 30 | $ | 30 | ||||
| 30 | ||||||||
| Massachusetts - 0.1% | ||||||||
| Commonwealth of Massachusetts, G.O. Misc. Tax Public Imps. Rev. Bonds, Series D, 1.35%, 20181 | 175 | 175 | ||||||
| 175 | ||||||||
| Puerto Rico - 0.7% | ||||||||
| Puerto Rico Ind. Tourist Educ. Medical & Environmental Control Facs. Fncg. Auth., College & Univ. Imps. Rev. Ref. Bonds, 5.00%, 2018 | 800 | 814 | ||||||
| 814 | ||||||||
| Total bonds & notes (cost: $114,650,000) | 115,206 | |||||||
| Short-term securities - 2.6% | ||||||||
| California Pollution Control Fncg. Auth., Energy Res. Auth. Rev. Ref. Bonds, 0.82%, November 01, 20261 | 200 | 200 | ||||||
| California Pollution Control Fncg. Auth., Energy Res. Auth. Rev. Ref. Bonds, Series C, 0.84%, November 01, 20261 | 2,850 | 2,850 | ||||||
| Total short-term securities (cost: $3,050,000) | 3,050 | |||||||
| Total investment securities (cost: $117,700,000) | 118,256 | |||||||
| Other assets less liabilities | 1,570 | |||||||
| Net assets | $ | 119,826 | ||||||
| 1 | Coupon rate may change periodically. For short-term securities, the date of the next scheduled coupon rate change is considered to be the maturity date. |
| 2 | Zero coupon bond; interest rate represents current yield to maturity. |
| Private Client Services Funds | 51 |
Capital Group California Short-Term Municipal Fund
Schedule of investments
October 31, 2017
Key to abbreviations
| Agcy. | = | Agency |
| AGM | = | Assured Guaranty Municipal Corporation |
| Approp. | = | Appropriation |
| Auth. | = | Authority |
| BAM | = | Build America Mutual Assurance Company |
| CA Mtg. Ins. | = | California Mortgage Insurance |
| Comm. | = | Community |
| Comms. | = | Communities |
| Corp. | = | Corporation |
| Corps. | = | Corporations |
| Dept. | = | Department |
| Dev. | = | Development |
| Dist. | = | District |
| Econ. | = | Economic |
| Educ. | = | Educational |
| Fac. | = | Facility |
| Facs. | = | Facilities |
| FHLMC | = | Federal Home Loan Mortgage Corporation |
| Fin. | = | Finance |
| Fncg. | = | Financing |
| FNMA | = | Federal National Mortgage Association |
| GNMA | = | Government National Mortgage Association |
| G.O. | = | General Obligation |
| GTD | = | Guaranteed |
| Imp. | = | Improvement |
| Imps. | = | Improvements |
| Ind. | = | Industrial |
| Loc. | = | Local |
| Mgmt. | = | Management |
| Misc. | = | Miscellaneous |
| NATL-RE | = | National Reinsurance |
| Prop. | = | Property |
| Redev. | = | Redevelopment |
| Ref. | = | Refunding |
| Res. | = | Resource |
| Ress. | = | Resources |
| Rev. | = | Revenue |
| Trans. | = | Transportation |
| Univ. | = | University |
| Util. | = | Utility |
See Notes to Financial Statements
| 52 | Private Client Services Funds |
Capital Group Core Bond Fund
Schedule of investments
October 31, 2017
Growth of $25,000 investment
Here’s how a $25,000 investment in the Capital Group Core Bond Fund grew between April 13, 2010, when the fund began operations, and October 31, 2017, the end of the fund’s fiscal year.
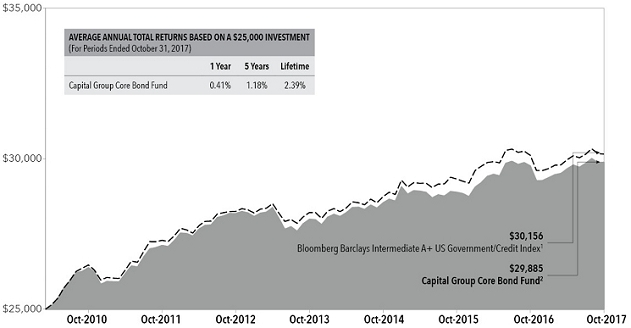
| 1 | The index is unmanaged, and its results include reinvested distributions but do not reflect the effect of sales charges, commissions, or expenses. |
| 2 | Includes reinvested dividends and capital gain distributions. |
Results are for past periods and are not predictive of results for future periods. Current and future results may be lower or higher than those shown. Share price and returns will vary so investors may lose money. The results shown are before taxes on fund distributions and sale of fund shares.
Investment portfolio – quality ratings1
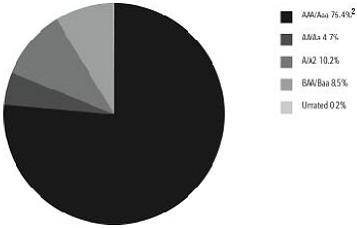
| 1 | Bond ratings, which typically range from Aaa/AAA (highest to D (lowest), are assigned by credit rating agencies such as Moody’s, Standard & Poors and/or Fitch as an indication of an Issuer’s credit-worthiness. If agency rating differ, securities are put in the highest category consistent with fund investment policies. When securities have not been rated by a rating agency (included in “unrated” at left), the investment advisor performs its own credit analysis and assigns comparable ratings that are used for compliance and fund investment policies. The ratings are not covered by the Report of Independent Registered Public Accounting Firm. |
| 2 | AAA rating includes “other assets and liabilities” not rated. |
| Private Client Services Funds | 53 |
Capital Group Core Bond Fund
Schedule of investments
October 31, 2017
| Bonds, notes & other debt investments - 90.1% | Principal amount (000) | Value (000) | ||||||
| U.S. government & government agency bonds & notes - 54.4% | ||||||||
| Fannie Mae: | ||||||||
| 1.75%, 2019 | $ | 1,710 | $ | 1,713 | ||||
| 2.125%, 2026 | 400 | 389 | ||||||
| Federal Home Loan Banks, 1.875%, 2020 | 3,015 | 3,027 | ||||||
| U.S. Treasury Bonds, 7.625%, 2025 | 750 | 1,023 | ||||||
| U.S. Treasury Inflation Indexed Bonds: | ||||||||
| 0.125%, 2021 | 6,448 | 6,460 | ||||||
| 0.25%, 2025 | 3,467 | 3,430 | ||||||
| 2.00%, 2026 | 619 | 694 | ||||||
| 0.75%, 2045 | 209 | 200 | ||||||
| U.S. Treasury Inflation Indexed Notes: | ||||||||
| 0.125%, 2020 | 1,698 | 1,705 | ||||||
| 0.375%, 2023 | 528 | 533 | ||||||
| 0.375%, 2025 | 3,390 | 3,388 | ||||||
| U.S. Treasury Notes: | ||||||||
| 0.75%, 2018 | 2,375 | 2,370 | ||||||
| 0.875%, 2018 | 1,715 | 1,705 | ||||||
| 1.25%, 2018 | 500 | 499 | ||||||
| 1.25%, 2018 | 3,540 | 3,530 | ||||||
| 1.50%, 2018 | 1,000 | 1,000 | ||||||
| 3.75%, 2018 | 3,800 | 3,887 | ||||||
| 3.875%, 2018 | 1,000 | 1,014 | ||||||
| 0.75%, 2019 | 1,390 | 1,377 | ||||||
| 0.875%, 2019 | 4,720 | 4,668 | ||||||
| 1.00%, 2019 | 500 | 494 | ||||||
| 1.125%, 2019 | 1,860 | 1,851 | ||||||
| 1.25%, 2019 | 1,900 | 1,893 | ||||||
| 1.25%, 2019 | 500 | 498 | ||||||
| 1.50%, 2019 | 2,750 | 2,748 | ||||||
| 1.50%, 2019 | 1,000 | 998 | ||||||
| 1.625%, 2019 | 1,000 | 1,001 | ||||||
| 1.625%, 2019 | 500 | 500 | ||||||
| 1.75%, 2019 | 2,000 | 2,006 | ||||||
| 1.375%, 2020 | 10,000 | 9,943 | ||||||
| 1.375%, 2020 | 4,850 | 4,804 | ||||||
| 1.375%, 2020 | 1,000 | 992 | ||||||
| 1.50%, 2020 | 1,809 | 1,801 | ||||||
| 1.625%, 2020 | 3,215 | 3,208 | ||||||
| 1.625%, 2020 | 2,500 | 2,490 | ||||||
| 2.00%, 2020 | 1,000 | 1,007 | ||||||
| 1.125%, 2021 | 3,010 | 2,933 | ||||||
| 1.25%, 2021 | 2,500 | 2,438 | ||||||
| 1.25%, 2021 | 2,360 | 2,316 | ||||||
| 1.375%, 2021 | 3,420 | 3,365 | ||||||
| 1.375%, 2021 | 3,215 | 3,166 | ||||||
| 1.75%, 2021 | 9,635 | 9,574 | ||||||
| 1.875%, 2021 | 500 | 500 | ||||||
| 2.125%, 2021 | 1,000 | 1,008 | ||||||
| 3.125%, 2021 | 2,000 | 2,089 | ||||||
| 1.50%, 2022 | 1,750 | 1,719 | ||||||
| 1.75%, 2022 | 3,890 | 3,855 | ||||||
| 1.75%, 2022 | 2,000 | 1,982 | ||||||
| 54 | Private Client Services Funds |
Capital Group Core Bond Fund
Schedule of investments
October 31, 2017
| Bonds, notes & other debt investments - continued | Principal amount (000) | Value (000) | ||||||
| U.S. government & government agency bonds & notes - continued | ||||||||
| 1.75%, 2022 | $ | 13,290 | $ | 13,148 | ||||
| 1.875%, 2022 | 5,336 | 5,316 | ||||||
| 1.875%, 2022 | 3,745 | 3,729 | ||||||
| 1.875%, 2022 | 2,005 | 1,993 | ||||||
| 2.125%, 2022 | 3,000 | 3,018 | ||||||
| 1.25%, 2023 | 1,000 | 953 | ||||||
| 1.375%, 2023 | 1,275 | 1,225 | ||||||
| 1.375%, 2023 | 1,000 | 959 | ||||||
| 1.625%, 2023 | 4,000 | 3,901 | ||||||
| 1.75%, 2023 | 1,000 | 982 | ||||||
| 2.00%, 2023 | 2,000 | 1,994 | ||||||
| 2.125%, 2023 | 3,415 | 3,412 | ||||||
| 2.25%, 2023 | 500 | 503 | ||||||
| 2.50%, 2023 | 1,050 | 1,072 | ||||||
| 2.75%, 2023 | 2,250 | 2,328 | ||||||
| 2.00%, 2024 | 7,750 | 7,651 | ||||||
| 2.00%, 2024 | 2,480 | 2,451 | ||||||
| 2.125%, 2024 | 15,000 | 14,904 | ||||||
| 2.125%, 2024 | 11,000 | 10,967 | ||||||
| 2.125%, 2024 | 4,200 | 4,184 | ||||||
| 2.25%, 2024 | 3,000 | 3,004 | ||||||
| 2.25%, 2024 | 1,820 | 1,829 | ||||||
| 2.75%, 2024 | 5,000 | 5,170 | ||||||
| 2.00%, 2025 | 2,000 | 1,965 | ||||||
| 2.00%, 2025 | 2,000 | 1,959 | ||||||
| 1.625%, 2026 | 3,000 | 2,843 | ||||||
| 2.25%, 2027 | 8,420 | 8,339 | ||||||
| 2.25%, 2027 | 3,030 | 2,997 | ||||||
| Total U.S. government & government agency bonds & notes | 226,587 | |||||||
| Mortgage-backed obligations - 7.4% | ||||||||
| Commercial mortgage-backed securities - 1.1% | ||||||||
| Citigroup Commercial Mortgage Trust, 3.608%, 2048 | 570 | 595 | ||||||
| Core Industrial Trust, Series 144A, 3.04%, 20341 | 890 | 911 | ||||||
| Fannie Mae Connecticut Avenue Securities, 2.1879%, 1 mo. USD LIBOR + 0.950%, 20242 | 25 | 25 | ||||||
| Freddie Mac Structured Agency Credit Risk Debt Notes:2 | ||||||||
| 2.338%, 1 mo. USD LIBOR + 1.100%, 2025 | 6 | 6 | ||||||
| 3.638%, 1 mo. USD LIBOR + 2.400%, 2025 | 17 | 17 | ||||||
| LB-UBS Commercial Mortgage Trust, Series 2007-C7, 6.334%, 20452 | 221 | 221 | ||||||
| Morgan Stanley Bank of America Merrill Lynch Trust, 3.383%, 2048 | 675 | 700 | ||||||
| Seasoned Credit Risk Transfer Trust: | ||||||||
| 2.00%, 2056 | 752 | 755 | ||||||
| 2.00%, 2056 | 528 | 529 | ||||||
| 3.00%, 2056 | 482 | 486 | ||||||
| Station Place Securitization Trust, Series 144A, 2.1379%, 1 mo. USD LIBOR + 0.900%, 20491,2 | 325 | 325 | ||||||
| 4,570 | ||||||||
| Federal agency mortgage-backed obligations - 6.3% | ||||||||
| Fannie Mae: | ||||||||
| 4.50%, 2019 | 14 | 15 | ||||||
| 3.00%, 2032, TBA | 3,870 | 3,965 | ||||||
| Private Client Services Funds | 55 |
Capital Group Core Bond Fund
Schedule of investments
October 31, 2017
| Bonds, notes & other debt investments - continued | Principal amount (000) | Value (000) | ||||||
| Mortgage-backed obligations - continued | ||||||||
| Federal agency mortgage-backed obligations - continued | ||||||||
| 4.50%, 2020 | $ | 112 | $ | 114 | ||||
| 3.50%, 2025 | 2,035 | 2,115 | ||||||
| 2.961%, 2027 2 | 445 | 450 | ||||||
| 5.50%, 2037 | 8 | 9 | ||||||
| 5.50%, 2038 | 392 | 435 | ||||||
| 5.00%, 2041 | 741 | 806 | ||||||
| 5.00%, 2041 | 161 | 175 | ||||||
| FHLMC Multifamily Structured Pass Through Certificates: | ||||||||
| 3.974%, 2021 2 | 544 | 574 | ||||||
| 2.373%, 2022 | 250 | 252 | ||||||
| 2.791%, 2022 | 1,320 | 1,349 | ||||||
| 2.57%, 2026 | 1,010 | 998 | ||||||
| 3.413%, 2026 | 1,310 | 1,374 | ||||||
| Freddie Mac: | ||||||||
| 3.50%, 2034 | 1,875 | 1,950 | ||||||
| 3.50%, 2045 | 2,365 | 2,453 | ||||||
| Freddie Mac REMICS, 6.00%, 2037 | 24 | 27 | ||||||
| Ginnie Mae: | ||||||||
| 4.50%, 2040 | 65 | 69 | ||||||
| 4.00%, 2047, TBA | 7,570 | 7,944 | ||||||
| 5.69%, 2059 2 | 13 | 13 | ||||||
| 2.094%, 2062 2 | 534 | 540 | ||||||
| 4.999%, 2064 2 | 131 | 135 | ||||||
| 6.64%, 2064 2 | 390 | 406 | ||||||
| 26,168 | ||||||||
| Total mortgage-backed obligations | 30,738 | |||||||
| Corporate bonds & notes - 21.3% | ||||||||
| Aerospace/Defense - 0.5% | ||||||||
| Airbus Finance BV, Series 144A, 2.70%, 20231 | 85 | 86 | ||||||
| Lockheed Martin Corp.: | ||||||||
| 3.10%, 2023 | 95 | 98 | ||||||
| 3.55%, 2026 | 270 | 281 | ||||||
| Northrop Grumman Corp., 2.55%, 2022 | 425 | 426 | ||||||
| Rockwell Collins, Inc.: | ||||||||
| 2.80%, 2022 | 375 | 379 | ||||||
| 3.20%, 2024 | 275 | 281 | ||||||
| The Boeing Co., 0.95%, 2018 | 350 | 349 | ||||||
| 1,900 | ||||||||
| Agriculture - 0.6% | ||||||||
| Altria Group, Inc.: | ||||||||
| 2.85%, 2022 | 250 | 254 | ||||||
| 2.95%, 2023 | 200 | 203 | ||||||
| 4.00%, 2024 | 430 | 460 | ||||||
| Philip Morris International, Inc.: | ||||||||
| 1.875%, 2021 | 165 | 163 | ||||||
| 2.125%, 2023 | 415 | 403 | ||||||
| 56 | Private Client Services Funds |
Capital Group Core Bond Fund
Schedule of investments
October 31, 2017
| Bonds, notes & other debt investments - continued | Principal amount (000) | Value (000) | ||||||
| Corporate bonds & notes - continued | ||||||||
| Agriculture - continued | ||||||||
| 2.75%, 2026 | $ | 225 | $ | 221 | ||||
| Reynolds American, Inc.: | ||||||||
| 4.00%, 2022 | 70 | 74 | ||||||
| 4.45%, 2025 | 430 | 463 | ||||||
| 5.70%, 2035 | 30 | 36 | ||||||
| 5.85%, 2045 | 220 | 271 | ||||||
| 2,548 | ||||||||
| Apparel - 0.1% | ||||||||
| NIKE, Inc., 2.375%, 2026 | 615 | 587 | ||||||
| 587 | ||||||||
| Auto Manufacturers - 0.9% | ||||||||
| American Honda Finance Corp., 2.30%, 2026 | 80 | 76 | ||||||
| BMW US Capital LLC, Series 144A, 1.45%, 20191 | 340 | 338 | ||||||
| Daimler Finance North America LLC, Series 144A:1 | ||||||||
| 2.237%, 3 mo. USD LIBOR + 0.860%, 2018 2 | 350 | 352 | ||||||
| 3.30%, 2025 | 250 | 253 | ||||||
| Ford Motor Credit Co. LLC: | ||||||||
| 3.157%, 2020 | 550 | 562 | ||||||
| 3.219%, 2022 | 205 | 208 | ||||||
| General Motors Co., 4.00%, 2025 | 145 | 148 | ||||||
| General Motors Financial Co., Inc.: | ||||||||
| 3.10%, 2019 | 975 | 987 | ||||||
| 3.70%, 2020 | 320 | 332 | ||||||
| 4.00%, 2026 | 175 | 177 | ||||||
| Toyota Motor Credit Corp., 1.45%, 2018 | 350 | 350 | ||||||
| 3,783 | ||||||||
| Banks - 2.8% | ||||||||
| Bank of America Corp.: | ||||||||
| 2.625%, 2020 | 735 | 742 | ||||||
| 3.875%, 2025 | 435 | 457 | ||||||
| BB&T Corp.: | ||||||||
| 2.05%, 2018 | 500 | 501 | ||||||
| 2.625%, 2020 | 385 | 391 | ||||||
| Citigroup, Inc.: | ||||||||
| 2.35%, 2021 | 1,005 | 1,001 | ||||||
| 4.45%, 2027 | 400 | 423 | ||||||
| Cooperatieve Rabobank UA, 2.75%, 2022 | 400 | 406 | ||||||
| Credit Suisse Group Funding Guernsey Ltd., 3.80%, 2023 | 500 | 520 | ||||||
| HSBC Holdings PLC, 2.65%, 2022 | 660 | 661 | ||||||
| JPMorgan Chase & Co.: | ||||||||
| 2.55%, 2021 | 645 | 649 | ||||||
| 3.20%, 2023 | 125 | 128 | ||||||
| Morgan Stanley: | ||||||||
| 2.125%, 2018 | 300 | 301 | ||||||
| 2.50%, 2021 | 500 | 501 | ||||||
| Private Client Services Funds | 57 |
Capital Group Core Bond Fund
Schedule of investments
October 31, 2017
| Bonds, notes & other debt investments - continued | Principal amount (000) | Value (000) | ||||||
| Corporate bonds & notes - continued | ||||||||
| Banks - continued | ||||||||
| PNC Bank NA: | ||||||||
| 1.45%, 2019 | $ | 690 | $ | 685 | ||||
| 2.55%, 2021 | 350 | 352 | ||||||
| The Bank of New York Mellon Corp., 2.10%, 2019 | 500 | 502 | ||||||
| The Goldman Sachs Group, Inc.: | ||||||||
| 1.95%, 2019 | 500 | 499 | ||||||
| 3.00%, 2022 | 365 | 369 | ||||||
| 2.905%, 3 mo. USD LIBOR + 0.990%, 2023 2 | 490 | 488 | ||||||
| 4.75%, 2045 | 175 | 195 | ||||||
| UniCredit SpA, Series 144A, 3.75%, 20221 | 500 | 512 | ||||||
| Wells Fargo & Co.: | ||||||||
| 2.10%, 2021 | 500 | 494 | ||||||
| 2.625%, 2022 | 805 | 804 | ||||||
| 11,581 | ||||||||
| Beverages - 0.6% | ||||||||
| Anheuser-Busch InBev Finance, Inc.: | ||||||||
| 2.65%, 2021 | 340 | 345 | ||||||
| 3.65%, 2026 | 735 | 760 | ||||||
| Molson Coors Brewing Co.: | ||||||||
| 1.45%, 2019 | 80 | 79 | ||||||
| 2.10%, 2021 | 90 | 89 | ||||||
| 3.00%, 2026 | 245 | 239 | ||||||
| PepsiCo, Inc.: | ||||||||
| 1.70%, 2021 | 420 | 413 | ||||||
| 2.00%, 2021 | 710 | 708 | ||||||
| 2,633 | ||||||||
| Biotechnology - 0.2% | ||||||||
| Amgen, Inc.: | ||||||||
| 1.85%, 2021 | 195 | 191 | ||||||
| 2.25%, 2023 | 260 | 253 | ||||||
| 2.60%, 2026 | 335 | 321 | ||||||
| 765 | ||||||||
| Chemicals - 0.1% | ||||||||
| The Sherwin-Williams Co.: | ||||||||
| 2.75%, 2022 | 165 | 166 | ||||||
| 3.125%, 2024 | 70 | 71 | ||||||
| 3.45%, 2027 | 175 | 178 | ||||||
| 415 | ||||||||
| Computers - 0.3% | ||||||||
| Apple, Inc.: | ||||||||
| 1.80%, 2020 | 475 | 474 | ||||||
| 1.55%, 2021 | 575 | 563 | ||||||
| 2.50%, 2022 | 190 | 192 | ||||||
| 1,229 | ||||||||
| 58 | Private Client Services Funds |
Capital Group Core Bond Fund
Schedule of investments
October 31, 2017
| Bonds, notes & other debt investments - continued | Principal amount (000) | Value (000) | ||||||
| Corporate bonds & notes - continued | ||||||||
| Diversified financial services - 0.3% | ||||||||
| American Express Co.: | ||||||||
| 1.905%, 3 mo. USD LIBOR + 0.590%, 2018 2 | $ | 500 | $ | 501 | ||||
| 2.20%, 2020 | 750 | 749 | ||||||
| 1,250 | ||||||||
| Electric - 2.4% | ||||||||
| Berkshire Hathaway Energy Co., 5.75%, 2018 | 300 | 305 | ||||||
| Dominion Energy, Inc., Series 144A, 1.875%, 20181 | 685 | 685 | ||||||
| Duke Energy Corp., 2.65%, 2026 | 660 | 635 | ||||||
| Eversource Energy, 2.75%, 2022 | 750 | 757 | ||||||
| Exelon Corp., 3.40%, 2026 | 65 | 65 | ||||||
| FirstEnergy Corp., 4.25%, 2023 | 1,930 | 2,045 | ||||||
| Pacific Gas & Electric Co., 2.45%, 2022 | 300 | 297 | ||||||
| PacifiCorp, 5.65%, 2018 | 795 | 817 | ||||||
| Progress Energy, Inc., 7.05%, 2019 | 955 | 1,020 | ||||||
| Public Service Electric & Gas Co.: | ||||||||
| 1.90%, 2021 | 270 | 267 | ||||||
| 2.25%, 2026 | 520 | 491 | ||||||
| Tampa Electric Co., 2.60%, 2022 | 350 | 351 | ||||||
| Virginia Electric and Power Co.: | ||||||||
| 1.20%, 2018 | 620 | 620 | ||||||
| 3.10%, 2025 | 1,040 | 1,051 | ||||||
| 3.50%, 2027 | 555 | 577 | ||||||
| Xcel Energy, Inc., 3.30%, 2025 | 190 | 193 | ||||||
| 10,176 | ||||||||
| Environmental Control - 0.2% | ||||||||
| Republic Services, Inc., 5.00%, 2020 | 350 | 373 | ||||||
| Waste Management, Inc., 4.60%, 2021 | 300 | 321 | ||||||
| 694 | ||||||||
| Food - 0.1% | ||||||||
| The Kroger Co., 2.00%, 2019 | 410 | 411 | ||||||
| 411 | ||||||||
| Gas - 0.0% | ||||||||
| Dominion Energy Gas Holdings LLC, 2.80%, 2020 | 125 | 127 | ||||||
| 127 | ||||||||
| Healthcare-products - 0.6% | ||||||||
| Abbott Laboratories: | ||||||||
| 2.35%, 2019 | 430 | 433 | ||||||
| 2.90%, 2021 | 190 | 193 | ||||||
| 3.40%, 2023 | 140 | 143 | ||||||
| 3.75%, 2026 | 515 | 532 | ||||||
| Becton Dickinson & Co., 3.734%, 2024 | 61 | 63 | ||||||
| Private Client Services Funds | 59 |
Capital Group Core Bond Fund
Schedule of investments
October 31, 2017
| Bonds, notes & other debt investments - continued | Principal amount (000) | Value (000) | ||||||
| Corporate bonds & notes - continued | ||||||||
| Healthcare-products - continued | ||||||||
| Medtronic Global Holdings SCA, 3.35%, 2027 | $ | 555 | $ | 569 | ||||
| Zimmer Biomet Holdings, Inc., 3.15%, 2022 | 485 | 491 | ||||||
| 2,424 | ||||||||
| Healthcare-services - 0.6% | ||||||||
| Aetna, Inc.: | ||||||||
| 1.50%, 2017 | 350 | 350 | ||||||
| 1.70%, 2018 | 220 | 220 | ||||||
| 2.80%, 2023 | 55 | 55 | ||||||
| Anthem, Inc.: | ||||||||
| 2.30%, 2018 | 295 | 296 | ||||||
| 4.35%, 2020 | 300 | 317 | ||||||
| Catholic Health Initiatives, 1.60%, 2017 | 350 | 350 | ||||||
| Laboratory Corp. of America Holdings, 4.70%, 2045 | 135 | 141 | ||||||
| UnitedHealth Group, Inc.: | ||||||||
| 3.35%, 2022 | 380 | 395 | ||||||
| 3.75%, 2025 | 460 | 487 | ||||||
| 2,611 | ||||||||
| Housewares - 0.3% | ||||||||
| Newell Brands, Inc.: | ||||||||
| 3.15%, 2021 | 355 | 363 | ||||||
| 3.85%, 2023 | 340 | 357 | ||||||
| 4.20%, 2026 | 515 | 543 | ||||||
| 1,263 | ||||||||
| Insurance - 0.9% | ||||||||
| American International Group, Inc., 2.30%, 2019 | 190 | 191 | ||||||
| Berkshire Hathaway Finance Corp., 2.00%, 2018 | 750 | 753 | ||||||
| Chubb INA Holdings, Inc.: | ||||||||
| 2.30%, 2020 | 285 | 287 | ||||||
| 2.875%, 2022 | 150 | 153 | ||||||
| 3.35%, 2026 | 45 | 46 | ||||||
| 4.35%, 2045 | 50 | 56 | ||||||
| New York Life Global Funding, Series 144A, 1.70%, 20211 | 750 | 733 | ||||||
| Prudential Financial, Inc., 2.095%, 3 mo. USD LIBOR + 0.780%, 20182 | 595 | 598 | ||||||
| QBE Insurance Group Ltd., Series 144A, 2.40%, 20181 | 755 | 756 | ||||||
| The Allstate Corp., 3.28%, 2026 | 175 | 179 | ||||||
| 3,752 | ||||||||
| Internet - 0.3% | ||||||||
| Alphabet, Inc., 1.998%, 2026 | 465 | 438 | ||||||
| Amazon.com, Inc., Series 144A:1 | ||||||||
| 2.40%, 2023 | 500 | 497 | ||||||
| 2.80%, 2024 | 500 | 501 | ||||||
| 1,436 | ||||||||
| 60 | Private Client Services Funds |
Capital Group Core Bond Fund
Schedule of investments
October 31, 2017
| Bonds, notes & other debt investments - continued | Principal amount (000) | Value (000) | ||||||
| Corporate bonds & notes - continued | ||||||||
| Iron/Steel - 0.1% | ||||||||
| Vale Overseas Ltd., 6.25%, 2026 | $ | 225 | $ | 260 | ||||
| 260 | ||||||||
| Media - 0.6% | ||||||||
| 21st Century Fox America, Inc., 3.70%, 2025 | 205 | 212 | ||||||
| Charter Communications Operating LLC / Charter Communications Operating Capital: | ||||||||
| 4.464%, 2022 | 325 | 343 | ||||||
| 4.908%, 2025 | 165 | 176 | ||||||
| Comcast Corp., 2.35%, 2027 | 435 | 408 | ||||||
| NBCUniversal Media LLC, 5.15%, 2020 | 350 | 377 | ||||||
| The Walt Disney Co., 5.50%, 2019 | 300 | 315 | ||||||
| Time Warner, Inc., 3.80%, 2027 | 150 | 150 | ||||||
| Viacom, Inc., 3.875%, 2024 | 380 | 382 | ||||||
| 2,363 | ||||||||
| Miscellaneous manufacturing - 0.1% | ||||||||
| General Electric Co., 2.70%, 2022 | 300 | 304 | ||||||
| 304 | ||||||||
| Multi-National - 0.2% | ||||||||
| European Investment Bank, 2.25%, 2022 | 751 | 756 | ||||||
| 756 | ||||||||
| Oil & gas - 1.3% | ||||||||
| Anadarko Petroleum Corp.: | ||||||||
| 4.85%, 2021 | 70 | 74 | ||||||
| 5.55%, 2026 | 145 | 164 | ||||||
| Cenovus Energy, Inc., Series 144A, 4.25%, 20271 | 170 | 171 | ||||||
| ConocoPhillips Co.: | ||||||||
| 4.20%, 2021 | 155 | 165 | ||||||
| 4.95%, 2026 | 235 | 267 | ||||||
| Exxon Mobil Corp., 1.47%, 3 mo. USD LIBOR + 0.150%, 20192 | 1,115 | 1,117 | ||||||
| Husky Energy, Inc., 7.25%, 2019 | 250 | 275 | ||||||
| Petroleos Mexicanos: | ||||||||
| 6.375%, 2021 | 300 | 327 | ||||||
| 4.625%, 2023 | 1,000 | 1,025 | ||||||
| Petroleos Mexicanos, Series 144A:1 | ||||||||
| 5.375%, 2022 | 175 | 186 | ||||||
| 6.50%, 2027 | 200 | 219 | ||||||
| Phillips 66, 4.30%, 2022 | 290 | 311 | ||||||
| Shell International Finance BV, 1.75%, 2021 | 435 | 428 | ||||||
| Statoil ASA, 3.25%, 2024 | 85 | 87 | ||||||
| Total Capital International SA, 2.875%, 2022 | 230 | 235 | ||||||
| Woodside Finance Ltd., Series 144A, 4.60%, 20211 | 185 | 195 | ||||||
| 5,246 | ||||||||
| Oil&Gas Services - 0.1% | ||||||||
| Halliburton Co., 3.80%, 2025 | 170 | 177 | ||||||
| Private Client Services Funds | 61 |
Capital Group Core Bond Fund
Schedule of investments
October 31, 2017
| Bonds, notes & other debt investments - continued | Principal amount (000) | Value (000) | ||||||
| Corporate bonds & notes - continued | ||||||||
| Oil&Gas Services - continued | ||||||||
| Schlumberger Holdings Corp., Series 144A:1 | ||||||||
| 3.00%, 2020 | $ | 125 | $ | 128 | ||||
| 4.00%, 2025 | 165 | 174 | ||||||
| 479 | ||||||||
| Pharmaceuticals - 2.1% | ||||||||
| AbbVie, Inc.: | ||||||||
| 2.50%, 2020 | 1,060 | 1,069 | ||||||
| 2.30%, 2021 | 340 | 340 | ||||||
| 3.20%, 2022 | 415 | 426 | ||||||
| 2.85%, 2023 | 85 | 85 | ||||||
| 3.60%, 2025 | 150 | 154 | ||||||
| Allergan Funding SCS: | ||||||||
| 3.00%, 2020 | 485 | 493 | ||||||
| 3.45%, 2022 | 490 | 504 | ||||||
| 3.80%, 2025 | 330 | 338 | ||||||
| AstraZeneca PLC, 3.375%, 2025 | 445 | 454 | ||||||
| Johnson & Johnson: | ||||||||
| 2.25%, 2022 | 455 | 457 | ||||||
| 2.45%, 2026 | 320 | 314 | ||||||
| 2.95%, 2027 | 455 | 463 | ||||||
| Merck & Co., Inc., 1.10%, 2018 | 250 | 250 | ||||||
| Novartis Securities Investment Ltd., 5.125%, 2019 | 300 | 312 | ||||||
| Pfizer, Inc., 1.62%, 3 mo. USD LIBOR + 0.300%, 20182 | 500 | 501 | ||||||
| Shire Acquisitions Investments Ireland DAC: | ||||||||
| 1.90%, 2019 | 350 | 349 | ||||||
| 2.40%, 2021 | 195 | 194 | ||||||
| 2.875%, 2023 | 120 | 119 | ||||||
| 3.20%, 2026 | 615 | 601 | ||||||
| Teva Pharmaceutical Finance Netherlands III BV: | ||||||||
| 1.40%, 2018 | 165 | 164 | ||||||
| 1.70%, 2019 | 165 | 161 | ||||||
| 2.20%, 2021 | 600 | 565 | ||||||
| 2.80%, 2023 | 190 | 175 | ||||||
| 3.15%, 2026 | 450 | 399 | ||||||
| 4.10%, 2046 | 30 | 24 | ||||||
| 8,911 | ||||||||
| Pipelines - 1.1% | ||||||||
| Boardwalk Pipelines LP, 4.95%, 2024 | 460 | 491 | ||||||
| Enbridge Energy Partners LP, 5.875%, 2025 | 230 | 264 | ||||||
| Enbridge, Inc., 4.00%, 2023 | 525 | 549 | ||||||
| Energy Transfer LP, 4.20%, 2027 | 185 | 188 | ||||||
| EnLink Midstream Partners LP, 4.40%, 2024 | 230 | 239 | ||||||
| Kinder Morgan, Inc.: | ||||||||
| 3.15%, 2023 | 495 | 498 | ||||||
| 4.30%, 2025 | 1,010 | 1,062 | ||||||
| Phillips 66 Partners LP, 3.55%, 2026 | 105 | 104 | ||||||
| Spectra Energy Partners LP, 2.95%, 2018 | 505 | 510 | ||||||
| 62 | Private Client Services Funds |
Capital Group Core Bond Fund
Schedule of investments
October 31, 2017
| Bonds, notes & other debt investments - continued | Principal amount (000) | Value (000) | ||||||
| Corporate bonds & notes - continued | ||||||||
| Pipelines - continued | ||||||||
| TC PipeLines LP, 4.375%, 2025 | $ | 430 | $ | 452 | ||||
| 4,357 | ||||||||
| Real Estate - 0.5% | ||||||||
| American Campus Communities Operating Partnership LP: | ||||||||
| 3.75%, 2023 | 300 | 312 | ||||||
| 4.125%, 2024 | 415 | 435 | ||||||
| Scentre Group Trust 1 / Scentre Group Trust 2, Series 144A:1 | ||||||||
| 2.375%, 2019 | 100 | 100 | ||||||
| 3.50%, 2025 | 250 | 252 | ||||||
| WEA Finance LLC / Westfield UK & Europe Finance PLC, Series 144A:1 | ||||||||
| 2.70%, 2019 | 475 | 479 | ||||||
| 3.25%, 2020 | 355 | 362 | ||||||
| 1,940 | ||||||||
| REITS - 0.7% | ||||||||
| Alexandria Real Estate Equities, Inc., 3.95%, 2028 | 60 | 62 | ||||||
| Corporate Office Properties LP, 5.25%, 2024 | 235 | 255 | ||||||
| DCT Industrial Operating Partnership LP, 4.50%, 2023 | 500 | 529 | ||||||
| DDR Corp., 4.25%, 2026 | 430 | 435 | ||||||
| ERP Operating LP, 4.625%, 2021 | 215 | 232 | ||||||
| Essex Portfolio LP, 3.50%, 2025 | 490 | 496 | ||||||
| Kimco Realty Corp.: | ||||||||
| 3.40%, 2022 | 90 | 92 | ||||||
| 2.80%, 2026 | 475 | 448 | ||||||
| Simon Property Group LP, 2.50%, 2021 | 460 | 463 | ||||||
| 3,012 | ||||||||
| Retail - 0.9% | ||||||||
| Costco Wholesale Corp.: | ||||||||
| 2.30%, 2022 | 285 | 285 | ||||||
| 2.75%, 2024 | 285 | 287 | ||||||
| McDonald’s Corp.: | ||||||||
| 3.70%, 2026 | 135 | 141 | ||||||
| 3.50%, 2027 | 275 | 283 | ||||||
| Starbucks Corp.: | ||||||||
| 2.00%, 2018 | 200 | 201 | ||||||
| 2.10%, 2021 | 235 | 236 | ||||||
| The Home Depot, Inc.: | ||||||||
| 1.80%, 2020 | 480 | 480 | ||||||
| 4.40%, 2021 | 350 | 376 | ||||||
| Wal-Mart Stores, Inc.: | ||||||||
| 2.35%, 2022 | 715 | 714 | ||||||
| 2.65%, 2024 | 715 | 715 | ||||||
| 3,718 | ||||||||
| Private Client Services Funds | 63 |
Capital Group Core Bond Fund
Schedule of investments
October 31, 2017
| Bonds, notes & other debt investments - continued | Principal amount (000) | Value (000) | ||||||
| Corporate bonds & notes - continued | ||||||||
| Semiconductors - 0.7% | ||||||||
| Analog Devices, Inc.: | ||||||||
| 2.50%, 2021 | $ | 185 | $ | 185 | ||||
| 3.50%, 2026 | 170 | 173 | ||||||
| Broadcom Corp. / Broadcom Cayman Finance Ltd., Series 144A:1 | ||||||||
| 2.375%, 2020 | 270 | 272 | ||||||
| 3.00%, 2022 | 730 | 740 | ||||||
| 3.625%, 2024 | 270 | 279 | ||||||
| 3.875%, 2027 | 1,125 | 1,159 | ||||||
| 2,808 | ||||||||
| Software - 0.2% | ||||||||
| Microsoft Corp., 2.875%, 2024 | 445 | �� | 453 | |||||
| Oracle Corp., 2.375%, 2019 | 500 | 504 | ||||||
| 957 | ||||||||
| Telecommunications - 0.9% | ||||||||
| AT&T, Inc.: | ||||||||
| 2.85%, 2023 | 665 | 661 | ||||||
| 3.40%, 2024 | 205 | 205 | ||||||
| 3.90%, 2027 | 205 | 204 | ||||||
| Cisco Systems, Inc., 2.20%, 2023 | 520 | 512 | ||||||
| Deutsche Telekom International Finance BV, Series 144A, 2.82%, 20221 | 405 | 408 | ||||||
| Verizon Communications, Inc.: | ||||||||
| 1.75%, 2021 | 45 | 44 | ||||||
| 3.125%, 2022 | 275 | 281 | ||||||
| 4.125%, 2027 | 188 | 197 | ||||||
| 4.50%, 2033 | 1,000 | 1,033 | ||||||
| 4.272%, 2036 | 250 | 247 | ||||||
| 3,792 | ||||||||
| Transportation - 0.0% | ||||||||
| Canadian National Railway Co., 5.55%, 2018 | 50 | 51 | ||||||
| 51 | ||||||||
| Total corporate bonds & notes | 88,539 | |||||||
| Municipals - 1.5% | ||||||||
| City of Detroit, G.O. Public Imps. Prop. Tax Ref. Bonds (Assured GTY Insured), 5.00%, 2022 | 8 | 8 | ||||||
| Energy Northwest, Energy Res. Auth. Rev. Ref. Bonds, 2.814%, 2024 | 500 | 504 | ||||||
| Hurricane Catastrophe Fund Fin. Corp., Misc. Rev. Bonds, Series A, 2.995%, 2020 | 2,060 | 2,097 | ||||||
| Industry Public Facs. Auth., Tax Increment Allocation Rev. Ref. Bonds (AGM Insured): | ||||||||
| 2.203%, 2018 | 500 | 500 | ||||||
| 3.139%, 2020 | 805 | 816 | ||||||
| Michigan Fin. Auth., Public Imps. Misc. Rev. Bonds, Series G (Assured GTY Insured), 5.00%, 2022 | 42 | 43 | ||||||
| New Jersey Econ. Dev. Auth., Appropriations Rev. Ref. Bonds, Series YY, 4.447%, 2020 | 650 | 670 | ||||||
| New Jersey Trans. Trust Fund Auth., Appropriations Rev. Ref. Bonds, Series B, 1.758%, 2018 | 350 | 349 | ||||||
| State of California, G.O. Public Imps. Misc. Rev. Bonds (Mandatory Put 04/01/20 @ 100), 2.193%, 20472 | 320 | 322 | ||||||
| State of California, G.O. Transit Imps. Misc. Rev. Bonds, 2.367%, 2022 | 250 | 252 | ||||||
| 64 | Private Client Services Funds |
Capital Group Core Bond Fund
Schedule of investments
October 31, 2017
| Bonds, notes & other debt investments - continued | Principal amount (000) | Value (000) | ||||||
| Municipals - continued | ||||||||
| State of Illinois, G.O. Pension Fndg. Prop. Tax Bonds, 5.10%, 2033 | $ | 830 | $ | 838 | ||||
| Total municipals | 6,399 | |||||||
| Government & government agency bonds & notes outside the U.S. - 0.5% | ||||||||
| Sovereign - 0.5% | ||||||||
| Mexico Government International Bond, 4.15%, 2027 | 460 | 479 | ||||||
| Province of Manitoba Canada, 3.05%, 2024 | 200 | 205 | ||||||
| Province of Ontario Canada, 3.20%, 2024 | 500 | 520 | ||||||
| Ukraine Government AID Bonds, 1.844%, 2019 | 875 | 882 | ||||||
| 2,086 | ||||||||
| Total government & government agency bonds & notes outside the U.S. | 2,086 | |||||||
| Asset-backed obligations - 5.0% | ||||||||
| Avis Budget Rental Car Funding AESOP LLC, Series 144A:1 | ||||||||
| 1.92%, 2019 | 1,000 | 998 | ||||||
| 2.97%, 2020 | 1,340 | 1,351 | ||||||
| 2.50%, 2021 | 770 | 773 | ||||||
| California Republic Auto Receivables Trust: | ||||||||
| 1.82%, 2020 | 649 | 649 | ||||||
| 2.51%, 2021 | 270 | 271 | ||||||
| Capital One Multi-Asset Execution Trust, 1.60%, 2021 | 580 | 580 | ||||||
| CarMax Auto Owner Trust, 1.16%, 2019 | 73 | 73 | ||||||
| Chase Issuance Trust: | ||||||||
| 1.10%, 2020 | 690 | 689 | ||||||
| 1.669%, 1 mo. LIBOR + 0.430%, 2020 2 | 480 | 482 | ||||||
| Citi Held For Asset Issuance, Series 144A, 4.31%, 20221 | 540 | 543 | ||||||
| Citibank Credit Card Issuance Trust, 2.3889%, 1 mo. LIBOR + 1.150%, 20202 | 540 | 541 | ||||||
| CLI Funding V LLC, Series 144A, 3.38%, 20291 | 69 | 69 | ||||||
| CPS Auto Receivables Trust, Series 144A:1 | ||||||||
| 2.07%, 2019 | 54 | 54 | ||||||
| 3.34%, 2020 | 800 | 807 | ||||||
| Discover Card Execution Note Trust, 1.5889%, 1 mo. LIBOR + 0.350%, 20202 | 1,165 | 1,166 | ||||||
| Drive Auto Receivables Trust, Series 144A:1 | ||||||||
| 1.77%, 2020 | 970 | 970 | ||||||
| 2.56%, 2020 | 137 | 137 | ||||||
| 2.76%, 2021 | 416 | 418 | ||||||
| 3.19%, 2022 | 430 | 434 | ||||||
| DT Auto Owner Trust, Series 144A:1 | ||||||||
| 1.75%, 2019 | 5 | 5 | ||||||
| 3.15%, 2022 | 425 | 427 | ||||||
| Enterprise Fleet Financing LLC, Series 144A, 2.13%, 20221 | 835 | 837 | ||||||
| Ford Credit Auto Owner Trust, Series 144A:1 | ||||||||
| 2.26%, 2025 | 565 | 569 | ||||||
| 2.03%, 2027 | 525 | 520 | ||||||
| Ford Credit Floorplan Master Owner Trust, 1.55%, 2021 | 210 | 209 | ||||||
| Global SC Finance II SRL, Series 144A, 3.19%, 20291 | 518 | 514 | ||||||
| Global SC Finance IV Ltd., Series 144A, 3.85%, 20371 | 478 | 486 | ||||||
| Hertz Vehicle Financing LLC, Series 144A, 1.83%, 20191 | 1,300 | 1,299 | ||||||
| Madison Park Funding XIII Ltd., Series 144A, 2.4673%, 3 mo. USD LIBOR + 1.110%, 20251,2 | 400 | 402 | ||||||
| Nationstar HECM Loan Trust, Series 144A, 2.2394%, 20261,2,3 | 41 | 41 | ||||||
| Private Client Services Funds | 65 |
Capital Group Core Bond Fund
Schedule of investments
October 31, 2017
| Bonds, notes & other debt investments - continued | Principal amount (000) | Value (000) | ||||||
| Asset-backed obligations - continued | ||||||||
| Santander Drive Auto Receivables Trust: | ||||||||
| 1.56%, 2020 | $ | 247 | $ | 247 | ||||
| 2.66%, 2021 | 95 | 96 | ||||||
| 2.74%, 2021 | 1,735 | 1,748 | ||||||
| 3.09%, 2022 | 400 | 405 | ||||||
| TAL Advantage V LLC, Series 144A, 3.55%, 20381 | 319 | 320 | ||||||
| TAL Advantage VI LLC, Series 144A, 4.50%, 20421 | 486 | 504 | ||||||
| Towd Point Mortgage Trust, Series 144A, 2.75%, 20561,2 | 436 | 438 | ||||||
| Verizon Owner Trust, Series 144A, 2.06%, 20211 | 610 | 611 | ||||||
| Total asset-backed obligations | 20,683 | |||||||
| Total bonds, notes & other debt investments (cost: $374,124,000) | 375,032 | |||||||
| Short-term securities - 13.1% | ||||||||
| Federal Home Loan Banks:4 | ||||||||
| 1.061%, December 20, 2017 | $ | 12,600 | 12,582 | |||||
| 1.154%, January 26, 2018 | 5,300 | 5,286 | ||||||
| General Electric Co., 0.01%, November 01, 20174 | 12,000 | 11,999 | ||||||
| Hershey Foods Corp., 1.136%, November 06, 20174 | 6,600 | 6,599 | ||||||
| Kimberly Clark Corp., 1.0952%, November 06, 20174 | 400 | 400 | ||||||
| Merck & Co., Inc., 1.1267%, November 15, 20174 | 4,900 | 4,898 | ||||||
| Pfizer, Inc., 1.1361%, November 13, 20174 | 8,000 | 7,997 | ||||||
| The Proctor Gamble and Co., 1.221%, January 02, 20184 | 5,000 | 4,990 | ||||||
| Total short-term securities (cost: $54,751,000) | 54,751 | |||||||
| Total investment securities (cost: $428,875,000) | 429,783 | |||||||
| Other assets less liabilities | (13,312 | ) | ||||||
| Net assets | $ | 416,471 | ||||||
| 1 | Acquired in a transaction exempt from registration under Rule 144A or section 4(2) of the Securities Act of 1933. May be resold in the U.S. in transactions exempt from registration, normally to qualified institutional buyers. At October 31, 2017, the aggregate market value of these securities amounted to $24,600,000, representing 5.91% of net assets. |
| 2 | Coupon rate may change periodically. |
| 3 | Security was valued in good faith under procedures approved by the Board of Trustees. As of October 31, 2017, these securities represent 0.01% of net assets. |
| 4 | Zero coupon bond; interest rate represents current yield to maturity. |
| 66 | Private Client Services Funds |
Capital Group Core Bond Fund
Schedule of investments
October 31, 2017
Key to abbreviations
| AGM | = | Assured Guaranty Municipal Corporation |
| Auth. | = | Authority |
| Co. | = | Company |
| Corp. | = | Corporation |
| Econ. | = | Economic |
| Facs. | = | Facilities |
| FHLMC | = | Federal Home Loan Mortgage Corporation |
| Fndg. | = | Funding |
| G.O. | = | General Obligation |
| GTY | = | Guaranty |
| Imps. | = | Improvements |
| Inc. | = | Incorporated |
| Ltd. | = | Limited |
| Misc. | = | Miscellaneous |
| Prop. | = | Property |
| Ref. | = | Refunding |
| REITS | = | Real Estate Investment Trusts |
| Rev. | = | Revenue |
| TBA | = | To be announced |
See Notes to Financial Statements
| Private Client Services Funds | 67 |
Capital Group Global Equity Fund
October 31, 2017
Growth of $25,000 investment
Here’s how a $25,000 investment in the Capital Group Global Equity Fund grew between April 1, 2011, when the fund began operations, and October 31, 2017, the end of the fund’s fiscal year.
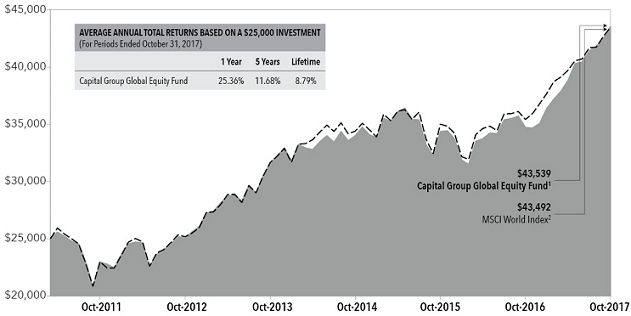
| 1 | Includes reinvested dividends and capital gain distributions. |
| 2 | The index is unmanaged, and its results include reinvested distributions but do not reflect the effect of sales charges, commissions, or expenses. Index returns are net of foreign withholding dividends. |
Results are for past periods and are not predictive of results for future periods. Current and future results may be lower or higher than those shown. Share price and returns will vary so investors may lose money. The results shown are before taxes on fund distributions and sale of fund shares.
Investment portfolio - sector diversification
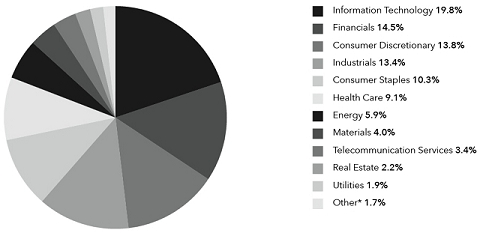
| * | Other includes short-term securities and other assets less liabilities |
| 68 | Private Client Services Funds |
Capital Group Global Equity Fund
Schedule of investments
October 31, 2017
Investment portfolio - country diversification
| Country | (percent of net assets) | |||
| United States | 44.1 | % | ||
| Japan | 10.7 | |||
| France | 9.5 | |||
| Britain | 5.8 | |||
| Netherlands | 3.9 | |||
| Switzerland | 3.7 | |||
| Hong Kong | 3.6 | |||
| Taiwan | 2.4 | |||
| Denmark | 2.1 | |||
| Canada | 1.9 | |||
| Singapore | 1.9 | |||
| South Africa | 1.4 | |||
| Ireland | 1.2 | |||
| Spain | 1.1 | |||
| Sweden | 1.0 | |||
| Germany | 0.9 | |||
| Belgium | 0.8 | |||
| India | 0.8 | |||
| Finland | 0.5 | |||
| Italy | 0.4 | |||
| Norway | 0.2 | |||
| Australia | 0.2 | |||
| Luxembourg | 0.2 | |||
| Short-term securities & other assets less liabilities | 1.7 | |||
| Private Client Services Funds | 69 |
Capital Group Global Equity Fund
Schedule of investments
October 31, 2017
| Common Stocks - 98.3% | Shares | Value (000) | ||||||
| Information Technology - 19.8% | ||||||||
| Taiwan Semiconductor Manufacturing Co. Ltd. (ADR) | 328,820 | $ | 13,919 | |||||
| ASML Holding NV | 67,090 | 12,098 | ||||||
| Visa, Inc., A Shares | 90,170 | 9,917 | ||||||
| Keyence Corp. | 15,250 | 8,427 | ||||||
| Broadcom Ltd. | 24,173 | 6,379 | ||||||
| Apple, Inc. | 36,394 | 6,152 | ||||||
| VTech Holdings Ltd. | 373,900 | 5,315 | ||||||
| Murata Manufacturing Co. Ltd. | 33,700 | 5,243 | ||||||
| QUALCOMM, Inc. | 101,445 | 5,175 | ||||||
| Amadeus IT Group SA | 66,775 | 4,531 | ||||||
| Hamamatsu Photonics K.K. | 122,800 | 3,947 | ||||||
| SAP SE | 30,133 | 3,428 | ||||||
| Alphabet, Inc., Class A1 | 3,295 | 3,404 | ||||||
| Jack Henry & Associates, Inc. | 29,466 | 3,245 | ||||||
| Microsoft Corp. | 34,800 | 2,895 | ||||||
| Activision Blizzard, Inc. | 41,620 | 2,726 | ||||||
| Texas Instruments, Inc. | 27,265 | 2,636 | ||||||
| Intel Corp. | 49,600 | 2,256 | ||||||
| Alphabet, Inc., Class C1 | 2,139 | 2,175 | ||||||
| Global Payments, Inc. | 16,670 | 1,733 | ||||||
| Accenture PLC, Class A | 10,900 | 1,552 | ||||||
| Oracle Corp. | 18,400 | 1,545 | ||||||
| Micro Focus International PLC1 | 30,290 | 1,064 | ||||||
| GoDaddy, Inc., Class A1 | 22,700 | 1,060 | ||||||
| VeriSign, Inc.1 | 8,805 | 947 | ||||||
| Analog Devices, Inc. | 8,580 | 783 | ||||||
| Xilinx, Inc. | 9,965 | 734 | ||||||
| 113,286 | ||||||||
| Financials - 14.5% | ||||||||
| AIA Group Ltd. | 1,651,400 | 12,426 | ||||||
| JPMorgan Chase & Co. | 108,280 | 10,894 | ||||||
| CME Group, Inc. | 65,100 | 8,930 | ||||||
| Moody’s Corp. | 39,300 | 5,597 | ||||||
| BNP Paribas SA | 68,498 | 5,349 | ||||||
| The Bank of New York Mellon Corp. | 92,730 | 4,771 | ||||||
| KBC Group NV | 52,865 | 4,391 | ||||||
| HDFC Bank Ltd. (ADR) | 46,830 | 4,322 | ||||||
| Sampo Oyj, A Shares | 57,398 | 3,007 | ||||||
| Chubb Ltd. | 18,870 | 2,846 | ||||||
| Wells Fargo & Co. | 49,355 | 2,771 | ||||||
| Intercontinental Exchange, Inc. | 41,235 | 2,726 | ||||||
| Marsh & McLennan Cos., Inc. | 32,885 | 2,661 | ||||||
| Aon PLC | 16,200 | 2,323 | ||||||
| Lloyds Banking Group PLC | 1,991,900 | 1,807 | ||||||
| Prudential PLC | 58,055 | 1,428 | ||||||
| DNB ASA | 72,619 | 1,400 | ||||||
| Huntington Bancshares, Inc. | 94,250 | 1,301 | ||||||
| UBS Group AG | 68,607 | 1,168 | ||||||
| Svenska Handelsbanken AB, A Shares | 73,732 | 1,057 | ||||||
| ABN AMRO Group NV2 | 34,060 | 1,052 | ||||||
| 70 | Private Client Services Funds |
Capital Group Global Equity Fund
Schedule of investments
October 31, 2017
| Common Stocks - continued | Shares | Value (000) | ||||||
| Financials - continued | ||||||||
| The Toronto-Dominion Bank | 10,270 | $ | 584 | |||||
| 82,811 | ||||||||
| Consumer Discretionary - 13.8% | ||||||||
| Las Vegas Sands Corp. | 149,480 | 9,474 | ||||||
| Naspers Ltd. Class N, (ADR) | 166,805 | 8,232 | ||||||
| Amazon.com, Inc.1 | 5,370 | 5,935 | ||||||
| Royal Caribbean Cruises Ltd. | 46,230 | 5,722 | ||||||
| Norwegian Cruise Line Holdings Ltd.1 | 78,735 | 4,390 | ||||||
| Hilton Worldwide Holdings, Inc. | 60,600 | 4,380 | ||||||
| Comcast Corp., Class A | 109,300 | 3,938 | ||||||
| LVMH Moet Hennessy Louis Vuitton SE | 12,867 | 3,839 | ||||||
| Starbucks Corp. | 67,300 | 3,691 | ||||||
| Dollar General Corp. | 40,880 | 3,305 | ||||||
| Charter Communications, Inc., Class A1 | 8,027 | 2,682 | ||||||
| Yum! Brands, Inc. | 34,600 | 2,576 | ||||||
| Newell Brands, Inc. | 61,408 | 2,504 | ||||||
| Cie Financiere Richemont SA | 25,002 | 2,306 | ||||||
| Yum China Holdings, Inc.1 | 55,610 | 2,244 | ||||||
| Samsonite International SA | 448,800 | 1,875 | ||||||
| O’Reilly Automotive, Inc.1 | 7,045 | 1,486 | ||||||
| BCA Marketplace PLC | 506,738 | 1,402 | ||||||
| JCDecaux SA | 32,167 | 1,231 | ||||||
| Denso Corp. | 22,400 | 1,220 | ||||||
| Hermes International | 2,203 | 1,143 | ||||||
| Viacom, Inc., Class B | 47,500 | 1,141 | ||||||
| Tempur Sealy International, Inc.1 | 16,130 | 1,054 | ||||||
| NIKE, Inc., Class B | 19,000 | 1,045 | ||||||
| SES SA | 64,207 | 1,044 | ||||||
| Modern Times Group MTG AB, B Shares | 24,325 | 928 | ||||||
| 78,787 | ||||||||
| Industrials - 13.4% | ||||||||
| Airbus SE | 91,702 | 9,373 | ||||||
| Safran SA | 88,004 | 9,270 | ||||||
| SMC Corp. | 18,500 | 7,035 | ||||||
| FANUC Corp. | 28,300 | 6,563 | ||||||
| Deere & Co. | 46,260 | 6,147 | ||||||
| Hexcel Corp. | 68,830 | 4,177 | ||||||
| Assa Abloy AB, Class B | 182,842 | 3,859 | ||||||
| The Boeing Co. | 12,790 | 3,300 | ||||||
| Eaton Corp. PLC | 34,600 | 2,769 | ||||||
| Waste Connections, Inc. | 32,955 | 2,329 | ||||||
| Ryanair Holdings PLC (ADR)1 | 20,195 | 2,264 | ||||||
| Equifax, Inc. | 20,800 | 2,258 | ||||||
| TransDigm Group, Inc. | 8,030 | 2,228 | ||||||
| Jardine Matheson Holdings Ltd. | 34,000 | 2,178 | ||||||
| IDEX Corp. | 16,900 | 2,167 | ||||||
| Nielsen Holdings PLC | 49,350 | 1,829 | ||||||
| CSX Corp. | 31,300 | 1,579 | ||||||
| DKSH Holding AG Ltd. | 14,647 | 1,228 | ||||||
| Private Client Services Funds | 71 |
Capital Group Global Equity Fund
Schedule of investments
October 31, 2017
| Common Stocks - continued | Shares | Value (000) | ||||||
| Industrials - continued | ||||||||
| Hoshizaki Corp. | 11,600 | $ | 1,093 | |||||
| Sydney Airport | 200,130 | 1,089 | ||||||
| CH Robinson Worldwide, Inc. | 13,270 | 1,042 | ||||||
| Waste Management, Inc. | 10,750 | 883 | ||||||
| Brenntag AG | 15,364 | 870 | ||||||
| Norfolk Southern Corp. | 4,775 | 628 | ||||||
| 76,158 | ||||||||
| Consumer Staples - 10.3% | ||||||||
| Pernod Ricard SA | 49,820 | 7,472 | ||||||
| Carlsberg A/S, Class B | 54,718 | 6,249 | ||||||
| Nestle SA | 70,575 | 5,935 | ||||||
| L’Oreal SA | 23,943 | 5,328 | ||||||
| Danone SA | 63,305 | 5,172 | ||||||
| Shiseido Co. Ltd. | 120,400 | 4,948 | ||||||
| British American Tobacco PLC | 64,320 | 4,161 | ||||||
| Reckitt Benckiser Group PLC | 44,845 | 4,011 | ||||||
| Diageo PLC | 81,785 | 2,794 | ||||||
| Seven & i Holdings Co. Ltd. | 69,300 | 2,787 | ||||||
| Imperial Brands PLC | 65,370 | 2,666 | ||||||
| The Coca-Cola Co. | 45,190 | 2,078 | ||||||
| Philip Morris International, Inc. | 16,040 | 1,678 | ||||||
| Mondelez International, Inc., Class A | 28,800 | 1,193 | ||||||
| The Procter & Gamble Co. | 12,055 | 1,041 | ||||||
| Japan Tobacco, Inc. | 30,100 | 992 | ||||||
| Nestle SA (ADR) | 4,300 | 362 | ||||||
| 58,867 | ||||||||
| Health Care - 9.1% | ||||||||
| Astrazeneca PLC | 93,485 | 6,248 | ||||||
| Cerner Corp.1 | 88,595 | 5,982 | ||||||
| Novo Nordisk A/S, Class B | 119,431 | 5,941 | ||||||
| Roche Holding AG | 25,336 | 5,854 | ||||||
| Gilead Sciences, Inc. | 76,607 | 5,742 | ||||||
| Incyte Corp.1 | 47,300 | 5,357 | ||||||
| Essilor International SA | 28,047 | 3,551 | ||||||
| Danaher Corp. | 35,200 | 3,248 | ||||||
| Seattle Genetics, Inc.1 | 52,780 | 3,236 | ||||||
| UnitedHealth Group, Inc. | 15,190 | 3,193 | ||||||
| Express Scripts Holding Co.1 | 17,405 | 1,067 | ||||||
| Johnson & Johnson | 6,270 | 874 | ||||||
| Merck & Co., Inc. | 12,100 | 667 | ||||||
| Humana, Inc. | 2,410 | 615 | ||||||
| Eli Lilly & Co. | 6,075 | 498 | ||||||
| 52,073 | ||||||||
| Energy - 5.9% | ||||||||
| Royal Dutch Shell PLC, Class B (ADR) | 119,995 | 7,843 | ||||||
| Chevron Corp. | 56,994 | 6,605 | ||||||
| Schlumberger Ltd. | 73,786 | 4,722 | ||||||
| 72 | Private Client Services Funds |
Capital Group Global Equity Fund
Schedule of investments
October 31, 2017
| Common Stocks - continued | Shares | Value (000) | ||||||
| Energy - continued | ||||||||
| Enbridge, Inc. | 112,035 | $ | 4,306 | |||||
| EOG Resources, Inc. | 30,145 | 3,010 | ||||||
| Occidental Petroleum Corp. | 38,500 | 2,486 | ||||||
| Exxon Mobil Corp. | 27,150 | 2,263 | ||||||
| Total SA | 19,945 | 1,112 | ||||||
| ConocoPhillips | 19,800 | 1,013 | ||||||
| 33,360 | ||||||||
| Materials - 4.0% | ||||||||
| Asahi Kasei Corp. | 506,000 | 6,092 | ||||||
| DowDuPont, Inc. | 60,830 | 4,399 | ||||||
| Potash Corp. of Saskatchewan, Inc. | 191,500 | 3,727 | ||||||
| Monsanto Co. | 29,645 | 3,590 | ||||||
| Air Liquide SA | 11,949 | 1,521 | ||||||
| Praxair, Inc. | 8,545 | 1,249 | ||||||
| Givaudan SA | 555 | 1,240 | ||||||
| Rio Tinto PLC | 22,242 | 1,048 | ||||||
| 22,866 | ||||||||
| Telecommunication Services - 3.4% | ||||||||
| SoftBank Group Corp. | 110,100 | 9,632 | ||||||
| Singapore Telecommunications Ltd. | 1,631,200 | 4,488 | ||||||
| Vodafone Group PLC | 905,690 | 2,593 | ||||||
| NTT DOCOMO, Inc. | 52,900 | 1,275 | ||||||
| Koninklijke KPN NV | 305,033 | 1,053 | ||||||
| Verizon Communications, Inc. | 10,245 | 490 | ||||||
| 19,531 | ||||||||
| Real Estate - 2.2% | ||||||||
| American Tower Corp. REIT | 42,500 | 6,106 | ||||||
| Crown Castle International Corp. REIT | 48,475 | 5,191 | ||||||
| Link REIT | 98,000 | 823 | ||||||
| Deutsche Wohnen SE | 13,288 | 566 | ||||||
| 12,686 | ||||||||
| Utilities - 1.9% | ||||||||
| AES Corp. | 251,550 | 2,674 | ||||||
| Sempra Energy | 22,680 | 2,665 | ||||||
| Enel SpA | 338,531 | 2,100 | ||||||
| National Grid PLC | 143,085 | 1,721 | ||||||
| Iberdrola SA | 207,139 | 1,674 | ||||||
| 10,834 | ||||||||
| Total common stocks (cost: $396,213,000) | 561,259 | |||||||
| Private Client Services Funds | 73 |
Capital Group Global Equity Fund
Schedule of investments
October 31, 2017
| Short-term securities - 1.7% | Principal amount (000) | Value (000) | ||||||
| General Electric Co., 0.01%, November 01, 20173 | $ | 4,000 | $ | 4,000 | ||||
| Victory Receivables, 1.2895%, November 07, 20173 | 5,900 | 5,899 | ||||||
| Total short-term securities (cost: $9,899,000) | 9,899 | |||||||
| Total investment securities (cost: $406,112,000) | 571,158 | |||||||
| Other assets less liabilities | 81 | |||||||
| Net assets | $ | 571,239 | ||||||
| 1 | Non-income producing security. |
| 2 | Acquired in a transaction exempt from registration under Rule 144A or section 4(2) of the Securities Act of 1933. May be resold in the U.S. in transactions exempt from registration, normally to qualified institutional buyers. At October 31, 2017, the aggregate market value of these securities amounted to $1,052,000, representing 0.18% of net assets. |
| 3 | Zero coupon bond; interest rate represents current yield to maturity. |
Key to abbreviations
ADR - American Depositary Receipts
REIT - Real Estate Investment Trust
See Notes to Financial Statements
| 74 | Private Client Services Funds |
Capital Group International Equity Fund
October 31, 2017
Growth of $25,000 investment
Here’s how a $25,000 investment in the Capital Group International Equity Fund grew between April 1, 2011, when the fund began operations, and October 31, 2017, the end of the fund’s fiscal year.
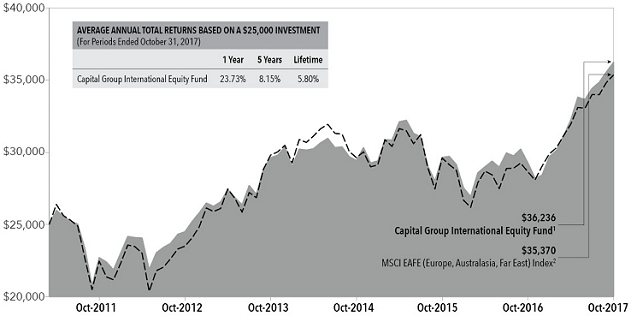
| 1 | Includes reinvested dividends and capital gain distributions. |
| 2 | The index is unmanaged, and its results include reinvested distributions but do not reflect the effect of sales charges, commissions, or expenses. Index returns are net of foreign withholding dividends. |
Results are for past periods and are not predictive of results for future periods. Current and future results may be lower or higher than those shown. Share price and returns will vary so investors may lose money. The results shown are before taxes on fund distributions and sale of fund shares.
Investment portfolio - sector diversification

| * | Other includes short-term securities and other assets less liabilities |
| Private Client Services Funds | 75 |
Capital Group International Equity Fund
Schedule of investments
October 31, 2017
Investment portfolio - country diversification
| Country | (percent of net assets) | |||
| Japan | 20.9 | % | ||
| France | 16.3 | |||
| Britain | 14.7 | |||
| Denmark | 6.5 | |||
| Switzerland | 6.5 | |||
| Hong Kong | 4.2 | |||
| Netherlands | 3.8 | |||
| Germany | 2.9 | |||
| Sweden | 2.6 | |||
| Spain | 2.4 | |||
| Taiwan | 2.1 | |||
| Finland | 1.5 | |||
| Canada | 1.4 | |||
| Belgium | 1.3 | |||
| Australia | 1.1 | |||
| Luxembourg | 1.1 | |||
| United States | 1.0 | |||
| India | 0.9 | |||
| Italy | 0.8 | |||
| Ireland | 0.6 | |||
| South Africa | 0.4 | |||
| Argentina | 0.4 | |||
| Mexico | 0.4 | |||
| Norway | 0.4 | |||
| Macau | 0.4 | |||
| South Korea | 0.3 | |||
| Singapore | 0.2 | |||
| Short-term securities & other assets less liabilities | 4.9 | |||
| 76 | Private Client Services Funds |
Capital Group International Equity Fund
Schedule of investments
October 31, 2017
| Common Stocks - 94.7% | Shares | Value (000) | ||||||
| Industrials - 16.3% | ||||||||
| SMC Corp. | 107,200 | $ | 40,766 | |||||
| Safran SA | 374,425 | 39,441 | ||||||
| Airbus SE | 268,980 | 27,494 | ||||||
| FANUC Corp. | 117,700 | 27,297 | ||||||
| Assa Abloy AB, Class B | 1,055,326 | 22,275 | ||||||
| Jardine Matheson Holdings Ltd. | 281,500 | 18,033 | ||||||
| Sydney Airport | 2,768,593 | 15,066 | ||||||
| Nidec Corp. | 97,000 | 12,792 | ||||||
| DKSH Holding AG Ltd. | 115,345 | 9,671 | ||||||
| DSV A/S | 101,950 | 7,884 | ||||||
| Brenntag AG | 135,395 | 7,667 | ||||||
| Hoshizaki Corp. | 78,500 | 7,394 | ||||||
| Kubota Corp. | 292,600 | 5,459 | ||||||
| Canadian National Railway Co. | 63,300 | 5,095 | ||||||
| Siemens AG | 34,457 | 4,917 | ||||||
| Ryanair Holdings PLC (ADR)1 | 35,670 | 3,999 | ||||||
| Glory Ltd. | 87,500 | 3,247 | ||||||
| 258,497 | ||||||||
| Information Technology - 16.3% | ||||||||
| Keyence Corp. | 87,000 | 48,074 | ||||||
| ASML Holding NV | 187,647 | 33,836 | ||||||
| Taiwan Semiconductor Manufacturing Co. Ltd. (ADR) | 783,600 | 33,170 | ||||||
| Murata Manufacturing Co. Ltd. | 194,500 | 30,260 | ||||||
| Hamamatsu Photonics K.K. | 856,400 | 27,529 | ||||||
| SAP SE | 203,037 | 23,097 | ||||||
| Amadeus IT Group SA | 313,618 | 21,280 | ||||||
| Micro Focus International PLC1 | 569,259 | 19,998 | ||||||
| Oracle Corp. | 106,400 | 8,936 | ||||||
| MercadoLibre, Inc. | 27,350 | 6,572 | ||||||
| Samsung Electronics Co. Ltd. (GDR) | 5,057 | 5,082 | ||||||
| 257,834 | ||||||||
| Consumer Staples - 13.3% | ||||||||
| Pernod Ricard SA | 200,747 | 30,107 | ||||||
| Carlsberg A/S, Class B | 261,610 | 29,874 | ||||||
| Nestle SA | 289,820 | 24,373 | ||||||
| British American Tobacco PLC | 372,400 | 24,092 | ||||||
| L’Oreal SA | 103,258 | 22,980 | ||||||
| Diageo PLC | 605,145 | 20,672 | ||||||
| Danone SA | 173,219 | 14,152 | ||||||
| Imperial Brands PLC | 251,278 | 10,247 | ||||||
| Associated British Foods PLC | 220,050 | 9,738 | ||||||
| Reckitt Benckiser Group PLC | 104,700 | 9,366 | ||||||
| Meiji Holdings Co. Ltd. | 87,000 | 7,085 | ||||||
| PZ Cussons PLC | 1,087,793 | 4,775 | ||||||
| Japan Tobacco, Inc. | 101,900 | 3,358 | ||||||
| 210,819 | ||||||||
| Financials - 12.7% | ||||||||
| AIA Group Ltd. | 5,165,000 | 38,863 | ||||||
| Private Client Services Funds | 77 |
Capital Group International Equity Fund
Schedule of investments
October 31, 2017
| Common Stocks - continued | Shares | Value (000) | ||||||
| Financials - continued | ||||||||
| Sampo Oyj, A Shares | 451,173 | $ | 23,639 | |||||
| BNP Paribas SA | 290,637 | 22,696 | ||||||
| Prudential PLC | 879,070 | 21,623 | ||||||
| Lloyds Banking Group PLC | 23,714,100 | 21,508 | ||||||
| KBC Group NV | 247,825 | 20,586 | ||||||
| ABN AMRO Group NV2 | 471,423 | 14,560 | ||||||
| HDFC Bank Ltd. (ADR) | 156,900 | 14,482 | ||||||
| Svenska Handelsbanken AB, A Shares | 529,357 | 7,588 | ||||||
| DNB ASA | 294,036 | 5,670 | ||||||
| UBS Group AG | 325,245 | 5,536 | ||||||
| Sumitomo Mitsui Financial Group, Inc. | 129,200 | 5,132 | ||||||
| 201,883 | ||||||||
| Health Care - 11.7% | ||||||||
| Novo Nordisk A/S, Class B | 904,524 | 44,998 | ||||||
| Astrazeneca PLC | 556,250 | 37,176 | ||||||
| Roche Holding AG | 144,878 | 33,473 | ||||||
| Essilor International SA | 195,185 | 24,714 | ||||||
| Genmab A/S1 | 101,922 | 20,581 | ||||||
| Sonova Holding AG | 40,370 | 7,288 | ||||||
| Sysmex Corp. | 98,600 | 6,703 | ||||||
| Medtronic PLC | 72,000 | 5,797 | ||||||
| Novartis AG | 65,608 | 5,406 | ||||||
| 186,136 | ||||||||
| Consumer Discretionary - 10.5% | ||||||||
| Ryohin Keikaku Co. Ltd. | 83,600 | 24,557 | ||||||
| LVMH Moet Hennessy Louis Vuitton SE | 79,334 | 23,667 | ||||||
| SES SA | 1,089,867 | 17,723 | ||||||
| Kering | 36,831 | 16,882 | ||||||
| Samsonite International SA | 3,701,400 | 15,467 | ||||||
| BCA Marketplace PLC | 4,442,168 | 12,286 | ||||||
| Modern Times Group MTG AB, B Shares | 285,581 | 10,896 | ||||||
| JCDecaux SA | 246,350 | 9,427 | ||||||
| Cie Financiere Richemont SA | 100,341 | 9,253 | ||||||
| Naspers Ltd. Class N, (ADR) | 133,750 | 6,601 | ||||||
| Wynn Macau Ltd. | 2,190,200 | 5,615 | ||||||
| InterContinental Hotels Group PLC | 94,800 | 5,253 | ||||||
| Denso Corp. | 88,500 | 4,819 | ||||||
| Hermes International | 7,186 | 3,729 | ||||||
| 166,175 | ||||||||
| Telecommunication Services - 5.2% | ||||||||
| Vodafone Group PLC | 8,861,130 | 25,374 | ||||||
| SoftBank Group Corp. | 284,500 | 24,888 | ||||||
| NTT DOCOMO, Inc. | 483,700 | 11,660 | ||||||
| Koninklijke KPN NV | 2,178,273 | 7,521 | ||||||
| America Movil SAB de CV Class L, (ADR) | 364,400 | 6,238 | ||||||
| Singapore Telecommunications Ltd. | 1,253,900 | 3,450 | ||||||
| 78 | Private Client Services Funds |
Capital Group International Equity Fund
Schedule of investments
October 31, 2017
| Common Stocks - continued | Shares | Value (000) | ||||||
| Telecommunication Services - continued | ||||||||
| KDDI Corp. | 114,900 | $ | 3,056 | |||||
| 82,187 | ||||||||
| Materials - 3.2% | ||||||||
| Asahi Kasei Corp. | 1,037,000 | 12,485 | ||||||
| Shin-Etsu Chemical Co. Ltd. | 109,100 | 11,428 | ||||||
| Givaudan SA | 3,644 | 8,138 | ||||||
| Air Liquide SA | 54,962 | 6,998 | ||||||
| Kansai Paint Co. Ltd. | 163,700 | 4,185 | ||||||
| Rio Tinto PLC | 81,490 | 3,841 | ||||||
| Amcor Ltd. | 258,547 | 3,134 | ||||||
| 50,209 | ||||||||
| Energy - 2.5% | ||||||||
| Enbridge, Inc. | 444,190 | 17,071 | ||||||
| Total SA | 279,868 | 15,606 | ||||||
| Royal Dutch Shell PLC, Class B | 152,990 | 4,920 | ||||||
| Ensco PLC, Class A | 377,700 | 2,036 | ||||||
| 39,633 | ||||||||
| Utilities - 1.7% | ||||||||
| Enel SpA | 2,036,369 | 12,631 | ||||||
| Iberdrola SA | 1,198,638 | 9,687 | ||||||
| SSE PLC | 250,754 | 4,603 | ||||||
| 26,921 | ||||||||
| Real Estate - 1.3% | ||||||||
| Deutsche Wohnen SE | 240,171 | 10,230 | ||||||
| Link REIT | 1,176,500 | 9,885 | ||||||
| 20,115 | ||||||||
| Total common stocks (cost: $1,102,396,000) | 1,500,409 | |||||||
| Preferred Securities - 0.4% | ||||||||
| Health Care - 0.4% | ||||||||
| Grifols SA, Class B | 272,114 | 6,289 | ||||||
| Total preferred securities (cost: $4,466,000) | 6,289 | |||||||
| Private Client Services Funds | 79 |
Capital Group International Equity Fund
Schedule of investments
October 31, 2017
| Short-term securities - 4.7% | Principal amount (000) | Value (000) | ||||||
| Apple, Inc., 1.1671%, November 29, 20173 | $ | 34,300 | $ | 34,269 | ||||
| General Electric Co., 0.01%, November 01, 20173 | 39,800 | 39,799 | ||||||
| Total short-term securities (cost: $74,069,000) | 74,068 | |||||||
| Total investment securities (cost: $1,180,931,000) | 1,580,766 | |||||||
| Other assets less liabilities | 3,477 | |||||||
| Net assets | $ | 1,584,243 | ||||||
| 1 | Non-income producing security. |
| 2 | Acquired in a transaction exempt from registration under Rule 144A or section 4(2) of the Securities Act of 1933. May be resold in the U.S. in transactions exempt from registration, normally to qualified institutional buyers. At October 31, 2017, the aggregate market value of these securities amounted to $14,560,000, representing 0.92% of net assets. |
| 3 | Zero coupon bond; interest rate represents current yield to maturity. |
Key to abbreviations
ADR - American Depositary Receipts
GDR - Global Depositary Receipts
REIT - Real Estate Investment Trust
See Notes to Financial Statements
| 80 | Private Client Services Funds |
Capital Group U.S. Equity Fund
October 31, 2017
Growth of $25,000 investment
Here’s how a $25,000 investment in the Capital Group U.S. Equity Fund grew between April 1, 2011, when the fund began operations, and October 31, 2017, the end of the fund’s fiscal year.
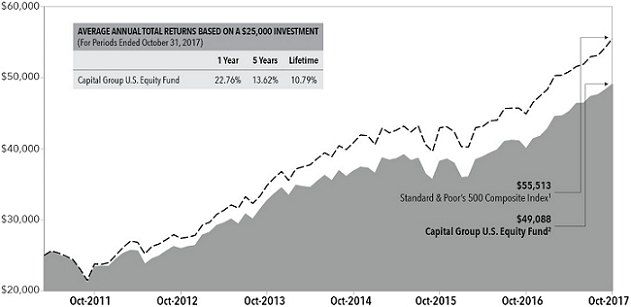
| 1 | The index is unmanaged, and its results include reinvested distributions but do not reflect the effect of sales charges, commissions, or expenses. |
| 2 | Includes reinvested dividends and capital gain distributions. |
Results are for past periods and are not predictive of results for future periods. Current and future results may be lower or higher than those shown. Share price and returns will vary so investors may lose money. The results shown are before taxes on fund distributions and sale of fund shares.
Investment portfolio - sector diversification
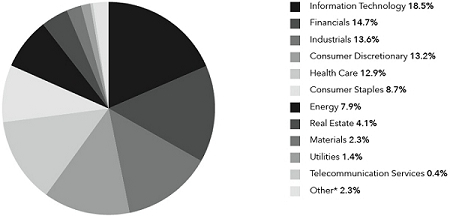
| * | Other includes short-term securities and other assets less liabilities |
| Private Client Services Funds | 81 |
Capital Group U.S. Equity Fund
Schedule of investments
October 31, 2017
| Common Stocks - 97.7% | Shares | Value (000) | ||||||
| Information Technology - 18.5% | ||||||||
| Visa, Inc., A Shares | 59,880 | $ | 6,586 | |||||
| Microsoft Corp. | 74,745 | 6,217 | ||||||
| Jack Henry & Associates, Inc. | 47,270 | 5,206 | ||||||
| Texas Instruments, Inc. | 45,400 | 4,390 | ||||||
| Apple, Inc. | 21,020 | 3,553 | ||||||
| Broadcom Ltd. | 12,861 | 3,394 | ||||||
| Analog Devices, Inc. | 32,155 | 2,936 | ||||||
| ASML Holding NV | 10,590 | 1,914 | ||||||
| Alphabet, Inc., Class C1 | 1,857 | 1,888 | ||||||
| Global Payments, Inc. | 16,705 | 1,737 | ||||||
| Xilinx, Inc. | 15,945 | 1,175 | ||||||
| HP, Inc. | 53,720 | 1,158 | ||||||
| QUALCOMM, Inc. | 21,665 | 1,105 | ||||||
| Accenture PLC, Class A | 5,700 | 811 | ||||||
| Trimble, Inc.1 | 17,005 | 695 | ||||||
| Alphabet, Inc., Class A1 | 450 | 465 | ||||||
| VeriSign, Inc.1 | 3,240 | 348 | ||||||
| 43,578 | ||||||||
| Financials - 14.7% | ||||||||
| Marsh & McLennan Cos., Inc. | 67,740 | 5,482 | ||||||
| Chubb Ltd. | 33,240 | 5,013 | ||||||
| CME Group, Inc. | 30,425 | 4,173 | ||||||
| JPMorgan Chase & Co. | 40,180 | 4,043 | ||||||
| Wells Fargo & Co. | 69,415 | 3,897 | ||||||
| The Bank of New York Mellon Corp. | 57,940 | 2,981 | ||||||
| Aon PLC | 16,700 | 2,395 | ||||||
| Intercontinental Exchange, Inc. | 32,050 | 2,119 | ||||||
| Moody’s Corp. | 13,825 | 1,969 | ||||||
| Huntington Bancshares, Inc. | 141,930 | 1,959 | ||||||
| The Toronto-Dominion Bank | 12,245 | 696 | ||||||
| 34,727 | ||||||||
| Industrials - 13.6% | ||||||||
| Waste Connections, Inc. | 83,200 | 5,880 | ||||||
| Northrop Grumman Corp. | 10,720 | 3,168 | ||||||
| The Boeing Co. | 10,770 | 2,778 | ||||||
| Hexcel Corp. | 41,835 | 2,539 | ||||||
| Eaton Corp. PLC | 26,070 | 2,086 | ||||||
| TransDigm Group, Inc. | 6,635 | 1,841 | ||||||
| Norfolk Southern Corp. | 12,892 | 1,694 | ||||||
| Canadian National Railway Co. | 20,080 | 1,616 | ||||||
| IDEX Corp. | 12,200 | 1,564 | ||||||
| Deere & Co. | 11,420 | 1,518 | ||||||
| Airbus SE (ADR) | 53,700 | 1,378 | ||||||
| CH Robinson Worldwide, Inc. | 15,240 | 1,197 | ||||||
| Waste Management, Inc. | 13,820 | 1,136 | ||||||
| Nielsen Holdings PLC | 28,425 | 1,054 | ||||||
| CSX Corp. | 16,600 | 837 | ||||||
| Lockheed Martin Corp. | 2,075 | 639 | ||||||
| Equifax, Inc. | 5,700 | 619 | ||||||
| 82 | Private Client Services Funds |
Capital Group U.S. Equity Fund
Schedule of investments
October 31, 2017
| Common Stocks - continued | Shares | Value (000) | ||||||
| Industrials - continued | ||||||||
| Union Pacific Corp. | 4,600 | $ | 533 | |||||
| 32,077 | ||||||||
| Consumer Discretionary - 13.2% | ||||||||
| Comcast Corp., Class A | 120,250 | 4,332 | ||||||
| Charter Communications, Inc., Class A1 | 11,416 | 3,815 | ||||||
| Newell Brands, Inc. | 93,500 | 3,813 | ||||||
| Amazon.com, Inc.1 | 3,353 | 3,706 | ||||||
| Starbucks Corp. | 61,415 | 3,368 | ||||||
| Dollar General Corp. | 33,595 | 2,716 | ||||||
| NIKE, Inc., Class B | 33,605 | 1,848 | ||||||
| Hilton Worldwide Holdings, Inc. | 22,900 | 1,655 | ||||||
| Norwegian Cruise Line Holdings Ltd.1 | 27,185 | 1,515 | ||||||
| The Priceline Group, Inc.1 | 685 | 1,310 | ||||||
| Carnival Corp. | 17,850 | 1,185 | ||||||
| Yum China Holdings, Inc.1 | 22,100 | 892 | ||||||
| O’Reilly Automotive, Inc.1 | 2,138 | 451 | ||||||
| Yum! Brands, Inc. | 5,530 | 412 | ||||||
| 31,018 | ||||||||
| Health Care - 12.9% | ||||||||
| UnitedHealth Group, Inc. | 23,805 | 5,004 | ||||||
| Cerner Corp.1 | 55,965 | 3,779 | ||||||
| Humana, Inc. | 12,715 | 3,247 | ||||||
| Incyte Corp.1 | 24,100 | 2,729 | ||||||
| Gilead Sciences, Inc. | 25,324 | 1,898 | ||||||
| Danaher Corp. | 20,243 | 1,868 | ||||||
| Seattle Genetics, Inc.1 | 28,380 | 1,740 | ||||||
| Express Scripts Holding Co.1 | 26,575 | 1,629 | ||||||
| AstraZeneca PLC (ADR) | 41,750 | 1,440 | ||||||
| Medtronic PLC | 14,365 | 1,157 | ||||||
| Johnson & Johnson | 7,280 | 1,015 | ||||||
| Roche Holding AG (ADR) | 33,675 | 974 | ||||||
| Juno Therapeutics, Inc.1 | 18,200 | 817 | ||||||
| Merck & Co., Inc. | 14,385 | 793 | ||||||
| Eli Lilly & Co. | 9,500 | 779 | ||||||
| Agios Pharmaceuticals, Inc.1 | 10,270 | 660 | ||||||
| Essilor International SA (ADR) | 8,080 | 512 | ||||||
| Ultragenyx Pharmaceutical, Inc.1 | 10,445 | 481 | ||||||
| 30,522 | ||||||||
| Consumer Staples - 8.7% | ||||||||
| The Procter & Gamble Co. | 52,600 | 4,541 | ||||||
| Diageo PLC (ADR) | 29,980 | 4,108 | ||||||
| Philip Morris International, Inc. | 30,580 | 3,200 | ||||||
| Nestle SA (ADR) | 29,205 | 2,460 | ||||||
| The Coca-Cola Co. | 38,020 | 1,748 | ||||||
| Unilever PLC (ADR) | 14,180 | 803 | ||||||
| Carlsberg A/S, Class B (ADR) | 31,725 | 726 | ||||||
| Danone SA (ADR) | 43,170 | 710 | ||||||
| British American Tobacco PLC (ADR) | 9,790 | 630 | ||||||
| Private Client Services Funds | 83 |
Capital Group U.S. Equity Fund
Schedule of investments
October 31, 2017
| Common Stocks - continued | Shares | Value (000) | ||||||
| Consumer Staples - continued | ||||||||
| Mondelez International, Inc., Class A | 13,000 | $ | 539 | |||||
| Hormel Foods Corp. | 17,200 | 534 | ||||||
| Reckitt Benckiser Group PLC (ADR) | 26,660 | 484 | ||||||
| 20,483 | ||||||||
| Energy - 7.9% | ||||||||
| Enbridge, Inc. | 107,290 | 4,126 | ||||||
| Schlumberger Ltd. | 52,244 | 3,344 | ||||||
| Chevron Corp. | 27,240 | 3,157 | ||||||
| Exxon Mobil Corp. | 22,500 | 1,876 | ||||||
| ConocoPhillips | 35,685 | 1,825 | ||||||
| EOG Resources, Inc. | 16,665 | 1,664 | ||||||
| Occidental Petroleum Corp. | 17,410 | 1,124 | ||||||
| Halliburton Co. | 20,400 | 872 | ||||||
| Helmerich & Payne, Inc. | 9,600 | 516 | ||||||
| 18,504 | ||||||||
| Real Estate - 4.1% | ||||||||
| Crown Castle International Corp. REIT | 37,270 | 3,991 | ||||||
| American Tower Corp. REIT | 19,750 | 2,837 | ||||||
| Iron Mountain, Inc. REIT | 49,869 | 1,995 | ||||||
| Digital Realty Trust, Inc. REIT | 7,350 | 870 | ||||||
| 9,693 | ||||||||
| Materials - 2.3% | ||||||||
| Monsanto Co. | 23,950 | 2,901 | ||||||
| Praxair, Inc. | 11,636 | 1,700 | ||||||
| Sherwin-Williams Co. | 1,810 | 715 | ||||||
| 5,316 | ||||||||
| Utilities - 1.4% | ||||||||
| Sempra Energy | 28,255 | 3,320 | ||||||
| 3,320 | ||||||||
| Telecommunication Services - 0.4% | ||||||||
| Verizon Communications, Inc. | 19,635 | 940 | ||||||
| 940 | ||||||||
| Total common stocks (cost: $154,990,000) | 230,178 | |||||||
| 84 | Private Client Services Funds |
Capital Group U.S. Equity Fund
Schedule of investments
October 31, 2017
| Short-term securities - 2.8% | Principal amount (000) | Value (000) | ||||||
| Exxon Mobil Corp., 1.1172%, November 21, 20172 | $ | 4,300 | $ | 4,297 | ||||
| General Electric Co., 0.01%, November 01, 20172 | 2,400 | 2,400 | ||||||
| Total short-term securities (cost: $6,698,000) | 6,697 | |||||||
| Total investment securities (cost: $161,688,000) | 236,875 | |||||||
| Other assets less liabilities | (1,155 | ) | ||||||
| Net assets | $ | 235,720 |
| 1 | Non-income producing security. | |
| 2 | Zero coupon bond; interest rate represents current yield to maturity. |
Key to abbreviations
ADR - American Depositary Receipts
REIT - Real Estate Investment Trust
See Notes to Financial Statements
| Private Client Services Funds | 85 |
Capital Group Core Municipal Fund
Statement of assets and liabilities
at October 31, 2017
(dollars and shares in thousands, except per share amounts)
| Assets: | ||||||||
| Investment securities, at value (cost: $392,229) | $ | 397,103 | ||||||
| Short-term investments, at value (cost: $50,243) | 50,242 | |||||||
| Cash | 161 | |||||||
| Receivables for: | ||||||||
| Sales of fund’s shares | 205 | |||||||
| Interest | 4,434 | |||||||
| Reimbursement from investment adviser | 8 | |||||||
| 4,647 | ||||||||
| Total assets | 452,153 | |||||||
| Liabilities: | ||||||||
| Payables for: | ||||||||
| Purchases of investments | 9,618 | |||||||
| Repurchases of fund’s shares | 1 | |||||||
| Investment advisory services | 93 | |||||||
| Other accrued expenses | 111 | |||||||
| Total liabilities | 9,823 | |||||||
| Net assets at October 31, 2017: | $ | 442,330 | ||||||
| Net assets consist of: | ||||||||
| Capital paid in on shares of beneficial interest | $ | 436,593 | ||||||
| Undistributed net investment income | 2 | |||||||
| Accumulated net realized gain | 862 | |||||||
| Net unrealized appreciation | 4,873 | |||||||
| Net assets at October 31, 2017 | $ | 442,330 | ||||||
| Shares outstanding: | 42,508 | |||||||
| Net asset value per share: | $ | 10.41 |
See Notes to Financial Statements
| 86 | Private Client Services Funds |
Capital Group Core Municipal Fund
Statement of operations
for the year ended October 31, 2017
(dollars in thousands)
| Investment income: | ||||||||
| Income: | ||||||||
| Interest | $ | 9,705 | ||||||
| Fees and expenses: | ||||||||
| Investment advisory services | 1,188 | |||||||
| Administrative and accounting services | 111 | |||||||
| Registration fees | 28 | |||||||
| Audit and tax fees | 45 | |||||||
| Transfer agent services | 22 | |||||||
| Trustees’ compensation | 32 | |||||||
| Other | 22 | |||||||
| Total fees and expenses before reimbursements | 1,448 | |||||||
| Less reimbursements of fees and expenses | 42 | |||||||
| Total fees and expenses after reimbursements | 1,406 | |||||||
| Net investment income | 8,299 | |||||||
| Net realized gain and unrealized depreciation on investments: | ||||||||
| Net realized gain on investments | 940 | |||||||
| Net unrealized depreciation on investments | (3,877 | ) | ||||||
| Net realized gain and unrealized depreciation on investments | (2,937 | ) | ||||||
| Net increase in net assets resulting from operations | $ | 5,362 |
See Notes to Financial Statements
| Private Client Services Funds | 87 |
Capital Group Core Municipal Fund
Statements of changes in net assets
(dollars in thousands)
| For the year ended 10/31/17 | For the year ended 10/31/16 | |||||||
| Operations: | ||||||||
| Net investment income | $ | 8,299 | $ | 7,740 | ||||
| Net realized gain on investments | 940 | 178 | ||||||
| Net unrealized depreciation on investments | (3,877 | ) | (306 | ) | ||||
| Net increase in net assets resulting from operations | 5,362 | 7,612 | ||||||
| Dividends and distributions to shareholders: | ||||||||
| Dividends from net investment income | (8,282 | ) | (7,721 | ) | ||||
| Distributions from capital gain | (144 | ) | (303 | ) | ||||
| Total dividends and distributions | (8,426 | ) | (8,024 | ) | ||||
| Net capital share transactions | 40,004 | 26,646 | ||||||
| Total increase in net assets | 36,940 | 26,234 | ||||||
| Net assets: | ||||||||
| Beginning of year | 405,390 | 379,156 | ||||||
| End of year (including undistributed net investment income: $2 and $–, respectively.) | $ | 442,330 | $ | 405,390 | ||||
See Notes to Financial Statements
| 88 | Private Client Services Funds |
Capital Group Short-Term Municipal Fund
Statement of assets and liabilities
at October 31, 2017
(dollars and shares in thousands, except per share amounts)
| Assets: | ||||||||
| Investment securities, at value (cost: $131,376) | $ | 131,750 | ||||||
| Short-term investments, at value (cost: $19,740) | 19,739 | |||||||
| Cash | 111 | |||||||
| Receivables for: | ||||||||
| Interest | 1,471 | |||||||
| Reimbursement from investment adviser | 13 | |||||||
| 1,484 | ||||||||
| Prepaid expenses | — | * | ||||||
| Total assets | 153,084 | |||||||
| Liabilities: | ||||||||
| Payables for: | ||||||||
| Purchases of investments | 3,159 | |||||||
| Investment advisory services | 31 | |||||||
| Other accrued expenses | 77 | |||||||
| Total liabilities | 3,267 | |||||||
| Net assets at October 31, 2017: | $ | 149,817 | ||||||
| Net assets consist of: | ||||||||
| Capital paid in on shares of beneficial interest | $ | 149,685 | ||||||
| Undistributed net investment income | — | |||||||
| Accumulated net realized loss | (241) | |||||||
| Net unrealized appreciation | 373 | |||||||
| Net assets at October 31, 2017 | $ | 149,817 | ||||||
| Shares outstanding: | 14,850 | |||||||
| Net asset value per share: | $ | 10.09 |
| * | Amount less than one thousand. |
See Notes to Financial Statements
| Private Client Services Funds | 89 |
Capital Group Short-Term Municipal Fund
Statement of operations
for the year ended October 31, 2017
(dollars in thousands)
| Investment income: | ||||||||
| Income: | ||||||||
| Interest | $ | 2,796 | ||||||
| Fees and expenses: | ||||||||
| Investment advisory services | 464 | |||||||
| Administrative and accounting services | 43 | |||||||
| Registration fees | 28 | |||||||
| Audit and tax fees | 45 | |||||||
| Transfer agent services | 21 | |||||||
| Trustees’ compensation | 32 | |||||||
| Other | 18 | |||||||
| Total fees and expenses before reimbursements | 651 | |||||||
| Less reimbursements of fees and expenses | 97 | |||||||
| Total fees and expenses after reimbursements | 554 | |||||||
| Net investment income | 2,242 | |||||||
| Net realized loss and unrealized depreciation on investments: | ||||||||
| Net realized loss on investments | (240) | |||||||
| Net unrealized depreciation on investments | (274) | |||||||
| Net realized loss and unrealized depreciation on investments | (514) | |||||||
| Net increase in net assets resulting from operations | $ | 1,728 |
See Notes to Financial Statements
| 90 | Private Client Services Funds |
Capital Group Short-Term Municipal Fund
Statements of changes in net assets
(dollars in thousands)
| For the year ended 10/31/17 | �� | For the year ended 10/31/16 | ||||||
| Operations: | ||||||||
| Net investment income | $ | 2,242 | $ | 1,848 | ||||
| Net realized (loss) gain on investments | (240 | ) | 91 | |||||
| Net unrealized depreciation on investments | (274 | ) | (385 | ) | ||||
| Net increase in net assets resulting from operations | 1,728 | 1,554 | ||||||
| Dividends and distributions to shareholders: | ||||||||
| Dividends from net investment income | (2,242 | ) | (1,846 | ) | ||||
| Distributions from capital gain | (32 | ) | (21 | ) | ||||
| Total dividends and distributions | (2,274 | ) | (1,867 | ) | ||||
| Net capital share transactions | (28,231 | ) | 36,596 | |||||
| Total (decrease) increase in net assets | (28,777 | ) | 36,283 | |||||
| Net assets: | ||||||||
| Beginning of year | 178,594 | 142,311 | ||||||
| End of year (including undistributed net investment income: $– and $–, respectively.) | $ | 149,817 | $ | 178,594 | ||||
See Notes to Financial Statements
| Private Client Services Funds | 91 |
Capital Group California Core Municipal Fund
Statement of assets and liabilities
at October 31, 2017
(dollars and shares in thousands, except per share amounts)
| Assets: | ||||||||
| Investment securities, at value (cost: $349,523) | $ | 356,239 | ||||||
| Short-term investments, at value (cost: $31,530) | 31,538 | |||||||
| Cash | 171 | |||||||
| Receivables for: | ||||||||
| Sales of fund’s shares | 50 | |||||||
| Interest | 3,492 | |||||||
| 3,542 | ||||||||
| Prepaid expenses | — | * | ||||||
| Total assets | 391,490 | |||||||
| Liabilities: | ||||||||
| Payables for: | ||||||||
| Purchases of investments | 3,309 | |||||||
| Repurchases of fund’s shares | 2 | |||||||
| Investment advisory services | 74 | |||||||
| Other accrued expenses | 105 | |||||||
| Total liabilities | 3,490 | |||||||
| Net assets at October 31, 2017: | $ | 388,000 | ||||||
| Net assets consist of: | ||||||||
| Capital paid in on shares of beneficial interest | $ | 380,922 | ||||||
| Undistributed net investment income | — | |||||||
| Accumulated net realized gain | 354 | |||||||
| Net unrealized appreciation | 6,724 | |||||||
| Net assets at October 31, 2017 | $ | 388,000 | ||||||
| Shares outstanding: | 36,704 | |||||||
| Net asset value per share: | $ | 10.57 |
| * | Amount less than one thousand. |
See Notes to Financial Statements
| 92 | Private Client Services Funds |
Capital Group California Core Municipal Fund
Statement of operations
for the year ended October 31, 2017
(dollars in thousands)
| Investment income: | ||||||||
| Income: | ||||||||
| Interest | $ | 7,735 | ||||||
| Fees and expenses: | ||||||||
| Investment advisory services | 1,003 | |||||||
| Administrative and accounting services | 94 | |||||||
| Registration fees | 10 | |||||||
| Audit and tax fees | 45 | |||||||
| Transfer agent services | 22 | |||||||
| Trustees’ compensation | 32 | |||||||
| Other | 23 | |||||||
| Total fees and expenses before reimbursements | 1,229 | |||||||
| Less reimbursements of fees and expenses | 38 | |||||||
| Total fees and expenses after reimbursements | 1,191 | |||||||
| Net investment income | 6,544 | |||||||
| Net realized gain and unrealized depreciation on investments: | ||||||||
| Net realized gain on investments | 396 | |||||||
| Net unrealized depreciation on investments | (3,915) | |||||||
| Net realized gain and unrealized depreciation on investments | (3,519) | |||||||
| Net increase in net assets resulting from operations | $ | 3,025 |
See Notes to Financial Statements
| Private Client Services Funds | 93 |
Capital Group California Core Municipal Fund
Statements of changes in net assets
(dollars in thousands)
| For the year ended 10/31/17 | For the year ended 10/31/16 | |||||||
| Operations: | ||||||||
| Net investment income | $ | 6,544 | $ | 6,044 | ||||
| Net realized gain on investments | 396 | 378 | ||||||
| Net unrealized (depreciation) appreciation on investments | (3,915 | ) | 2,381 | |||||
| Net increase in net assets resulting from operations | 3,025 | 8,803 | ||||||
| Dividends and distributions to shareholders: | ||||||||
| Dividends from net investment income | (6,542 | ) | (6,040 | ) | ||||
| Distributions from capital gain | (284 | ) | — | |||||
| Total dividends and distributions | (6,826 | ) | (6,040 | ) | ||||
| Net capital share transactions | 55,632 | 28,412 | ||||||
| Total increase in net assets | 51,831 | 31,175 | ||||||
| Net assets: | ||||||||
| Beginning of year | 336,169 | 304,994 | ||||||
| End of year (including undistributed net investment income: $– and $–, respectively.) | $ | 388,000 | $ | 336,169 | ||||
See Notes to Financial Statements
| 94 | Private Client Services Funds |
Capital Group California Short-Term Municipal Fund
Statement of assets and liabilities
at October 31, 2017
(dollars and shares in thousands, except per share amounts)
| Assets: | ||||||||
| Investment securities, at value (cost: $114,650) | $ | 115,206 | ||||||
| Short-term investments, at value (cost: $3,050) | 3,050 | |||||||
| Cash | 686 | |||||||
| Receivables for: | ||||||||
| Sales of fund’s shares | 785 | |||||||
| Interest | 1,290 | |||||||
| Reimbursement from investment adviser | 11 | |||||||
| 2,086 | ||||||||
| Prepaid expenses | — | * | ||||||
| Total assets | 121,028 | |||||||
| Liabilities: | ||||||||
| Payables for: | ||||||||
| Purchases of investments | 1,103 | |||||||
| Repurchases of fund’s shares | 1 | |||||||
| Investment advisory services | 26 | |||||||
| Other accrued expenses | 72 | |||||||
| Total liabilities | 1,202 | |||||||
| Net assets at October 31, 2017: | $ | 119,826 | ||||||
| Net assets consist of: | ||||||||
| Capital paid in on shares of beneficial interest | $ | 119,187 | ||||||
| Undistributed net investment income | — | |||||||
| Accumulated net realized gain | 83 | |||||||
| Net unrealized appreciation | 556 | |||||||
| Net assets at October 31, 2017 | $ | 119,826 | ||||||
| Shares outstanding: | 11,733 | |||||||
| Net asset value per share: | $ | 10.21 |
| * | Amount less than one thousand. |
See Notes to Financial Statements
| Private Client Services Funds | 95 |
Capital Group California Short-Term Municipal Fund
Statement of operations
for the year ended October 31, 2017
(dollars in thousands)
| Investment income: | ||||||||
| Income: | ||||||||
| Interest | $ | 1,694 | ||||||
| Fees and expenses: | ||||||||
| Investment advisory services | 337 | |||||||
| Administrative and accounting services | 31 | |||||||
| Registration fees | 6 | |||||||
| Audit and tax fees | 45 | |||||||
| Transfer agent services | 21 | |||||||
| Trustees’ compensation | 32 | |||||||
| Other | 14 | |||||||
| Total fees and expenses before reimbursements | 486 | |||||||
| Less reimbursements of fees and expenses | 84 | |||||||
| Total fees and expenses after reimbursements | 402 | |||||||
| Net investment income | 1,292 | |||||||
| Net realized gain and unrealized depreciation on investments: | ||||||||
| Net realized gain on investments | 113 | |||||||
| Net unrealized depreciation on investments | (296 | ) | ||||||
| Net realized gain and unrealized depreciation on investments | (183 | ) | ||||||
| Net increase in net assets resulting from operations | $ | 1,109 | ||||||
See Notes to Financial Statements
| 96 | Private Client Services Funds |
Capital Group California Short-Term Municipal Fund
Statements of changes in net assets
(dollars in thousands)
| For the year | For the year | |||||||
| ended 10/31/17 | ended 10/31/16 | |||||||
| Operations: | ||||||||
| Net investment income | $ | 1,292 | $ | 1,144 | ||||
| Net realized gain on investments | 113 | 72 | ||||||
| Net unrealized depreciation on investments | (296 | ) | (465 | ) | ||||
| Net increase in net assets resulting from operations | 1,109 | 751 | ||||||
| Dividends and distributions to shareholders: | ||||||||
| Dividends from net investment income | (1,292 | ) | (1,144 | ) | ||||
| Distributions from capital gain | (52 | ) | (123 | ) | ||||
| Total dividends and distributions | (1,344 | ) | (1,267 | ) | ||||
| Net capital share transactions | 2,211 | 6,365 | ||||||
| Total increase in net assets | 1,976 | 5,849 | ||||||
| Net assets: | ||||||||
| Beginning of year | 117,850 | 112,001 | ||||||
| End of year (including undistributed net investment income: $– and $–, respectively.) | $ | 119,826 | $ | 117,850 | ||||
See Notes to Financial Statements
| Private Client Services Funds | 97 |
Capital Group Core Bond Fund
Statement of assets and liabilities
at October 31, 2017
(dollars and shares in thousands, except per share amounts)
| Assets: | ||||||||
| Investment securities, at value (cost: $374,124) | $ | 375,032 | ||||||
| Short-term investments, at value (cost: $54,751) | 54,751 | |||||||
| Cash | 56 | |||||||
| Receivables for: | ||||||||
| Sales of investments | 7,964 | |||||||
| Interest | 1,787 | |||||||
| Reimbursement from investment adviser | 9 | |||||||
| 9,760 | ||||||||
| Prepaid expenses | — | * | ||||||
| Total assets | 439,599 | |||||||
| Liabilities: | ||||||||
| Payables for: | ||||||||
| Purchases of investments | 22,909 | |||||||
| Repurchases of fund’s shares | 23 | |||||||
| Investment advisory services | 88 | |||||||
| Other accrued expenses | 108 | |||||||
| Total liabilities | 23,128 | |||||||
| Net assets at October 31, 2017: | $ | 416,471 | ||||||
| Net assets consist of: | ||||||||
| Capital paid in on shares of beneficial interest | $ | 416,300 | ||||||
| Undistributed net investment income | — | |||||||
| Accumulated net realized loss | (737 | ) | ||||||
| Net unrealized appreciation | 908 | |||||||
| Net assets at October 31, 2017 | $ | 416,471 | ||||||
| Shares outstanding: | 41,091 | |||||||
| Net asset value per share: | $ | 10.14 | ||||||
| * | Amount less than one thousand. |
See Notes to Financial Statements
| 98 | Private Client Services Funds |
Capital Group Core Bond Fund
Statement of operations
for the year ended October 31, 2017
(dollars in thousands)
| Investment income: | ||||||||
| Income: | ||||||||
| Interest | $ | 7,294 | ||||||
| Fees and expenses: | ||||||||
| Investment advisory services | 1,100 | |||||||
| Administrative and accounting services | 103 | |||||||
| Registration fees | 31 | |||||||
| Audit and tax fees | 45 | |||||||
| Transfer agent services | 21 | |||||||
| Trustees’ compensation | 32 | |||||||
| Other | 14 | |||||||
| Total fees and expenses before reimbursements | 1,346 | |||||||
| Less reimbursements of fees and expenses | 54 | |||||||
| Total fees and expenses after reimbursements | 1,292 | |||||||
| Net investment income | 6,002 | |||||||
| Net realized loss and unrealized depreciation on investments: | ||||||||
| Net realized loss on investments | (677 | ) | ||||||
| Net unrealized depreciation on investments | (3,359 | ) | ||||||
| Net realized loss and unrealized depreciation on investments | (4,036 | ) | ||||||
| Net increase in net assets resulting from operations | $ | 1,966 | ||||||
See Notes to Financial Statements
| Private Client Services Funds | 99 |
Capital Group Core Bond Fund
Statements of changes in net assets
(dollars in thousands)
| For the year | For the year | |||||||
| ended 10/31/17 | ended 10/31/16 | |||||||
| Operations: | ||||||||
| Net investment income | $ | 6,002 | $ | 5,277 | ||||
| Net realized (loss) gain on investments | (677 | ) | 1,800 | |||||
| Net unrealized (depreciation) appreciation on investments | (3,359 | ) | 2,912 | |||||
| Net increase in net assets resulting from operations | 1,966 | 9,989 | ||||||
| Dividends and distributions to shareholders: | ||||||||
| Dividends from net investment income | (6,147 | ) | (5,227 | ) | ||||
| Distributions from capital gain | (1,618 | ) | (922 | ) | ||||
| Total dividends and distributions | (7,765 | ) | (6,149 | ) | ||||
| Net capital share transactions | 69,985 | 13,891 | ||||||
| Total increase in net assets | 64,186 | 17,731 | ||||||
| Net assets: | ||||||||
| Beginning of year | 352,285 | 334,554 | ||||||
| End of year (including undistributed net investment income: $– and $145, respectively.) | $ | 416,471 | $ | 352,285 | ||||
See Notes to Financial Statements
| 100 | Private Client Services Funds |
Capital Group Global Equity Fund
Statement of assets and liabilities
at October 31, 2017
(dollars and shares in thousands, except per share amounts)
| Assets: | ||||||||
| Investment securities, at value (cost: $396,213) | $ | 561,259 | ||||||
| Short-term investments, at value (cost: $9,899) | 9,899 | |||||||
| Cash | 59 | |||||||
| Foreign currency, at value (cost: $–*) | — | * | ||||||
| Receivables for: | ||||||||
| Sales of investments | 57 | |||||||
| Dividends | 791 | |||||||
| Reimbursement from investment adviser | 3 | |||||||
| 851 | ||||||||
| Prepaid expenses | 7 | |||||||
| Total assets | 572,075 | |||||||
| Liabilities: | ||||||||
| Payables for: | ||||||||
| Purchases of investments | 453 | |||||||
| Repurchases of fund’s shares | 66 | |||||||
| Unified Management fees | 314 | |||||||
| Other accrued expenses | 3 | |||||||
| Total liabilities | 836 | |||||||
| Net assets at October 31, 2017: | $ | 571,239 | ||||||
| Net assets consist of: | ||||||||
| Capital paid in on shares of beneficial interest | $ | 379,697 | ||||||
| Accumulated undistributed net investment income | 6,334 | |||||||
| Accumulated net realized gain | 20,166 | |||||||
| Net unrealized appreciation | 165,042 | |||||||
| Net assets at October 31, 2017 | $ | 571,239 | ||||||
| Shares outstanding: | 36,561 | |||||||
| Net asset value per share: | $ | 15.62 | ||||||
| * | Amount less than one thousand. |
See Notes to Financial Statements
| Private Client Services Funds | 101 |
Capital Group Global Equity Fund
Statement of operations
for the year ended October 31, 2017
(dollars in thousands)
| Investment income: | ||||||||
| Income: | ||||||||
| Dividends (net of non-U.S. taxes of $577) | $ | 11,549 | ||||||
| Interest | 161 | 11,710 | ||||||
| Fees and expenses: | ||||||||
| Unified Management fees | 3,793 | |||||||
| Trustees’ compensation | 32 | |||||||
| Legal fees | 2 | |||||||
| Total fees and expenses before reimbursements | 3,827 | |||||||
| Less reimbursements of fees and expenses | 34 | |||||||
| Total fees and expenses after reimbursements | 3,793 | |||||||
| Net investment income | 7,917 | |||||||
| Net realized gain (loss) and unrealized appreciation on investments and currency: | ||||||||
| Net realized gain on investments | 21,834 | |||||||
| Net realized loss on currency | (17 | ) | ||||||
| Net unrealized appreciation on investments | 88,336 | |||||||
| Net unrealized appreciation on currency translations | 15 | |||||||
| Net realized gain and unrealized appreciation on investments and currency | 110,168 | |||||||
| Net increase in net assets resulting from operations | $ | 118,085 | ||||||
See Notes to Financial Statements
| 102 | Private Client Services Funds |
Capital Group Global Equity Fund
Statements of changes in net assets
(dollars in thousands)
| For the year | For the year | |||||||
| ended 10/31/17 | ended 10/31/16 | |||||||
| Operations: | ||||||||
| Net investment income | $ | 7,917 | $ | 7,968 | ||||
| Net realized gain on investments and currency | 21,817 | 93 | ||||||
| Net unrealized appreciation (depreciation) on investments and currency | 88,351 | (2,629 | ) | |||||
| Net increase in net assets resulting from operations | 118,085 | 5,432 | ||||||
| Dividends and distributions to shareholders: | ||||||||
| Dividends from net investment income | (7,255 | ) | (6,944 | ) | ||||
| Distributions from capital gain | — | (15,930 | ) | |||||
| Total dividends and distributions | (7,255 | ) | (22,874 | ) | ||||
| Net capital share transactions | (21,188 | ) | 1,358 | |||||
| Total increase (decrease) in net assets | 89,642 | (16,084 | ) | |||||
| Net assets: | ||||||||
| Beginning of year | 481,597 | 497,681 | ||||||
| End of year (including undistributed net investment income: $6,334 and $5,996, respectively.) | $ | 571,239 | $ | 481,597 | ||||
See Notes to Financial Statements
| Private Client Services Funds | 103 |
Capital Group International Equity Fund
Statement of assets and liabilities
at October 31, 2017
(dollars and shares in thousands, except per share amounts)
| Assets: | ||||||||
| Investment securities, at value (cost: $1,106,862) | $ | 1,506,698 | ||||||
| Short-term investments, at value (cost: $74,069) | 74,068 | |||||||
| Cash | 54 | |||||||
| Foreign currency, at value (cost: $449) | 454 | |||||||
| Receivables for: | ||||||||
| Sales of investments | 651 | |||||||
| Sales of fund’s shares | 353 | |||||||
| Dividends | 3,657 | |||||||
| Reimbursement from investment adviser | 3 | |||||||
| 4,664 | ||||||||
| Prepaid expenses | 7 | |||||||
| Total assets | 1,585,945 | |||||||
| Liabilities: | ||||||||
| Payables for: | ||||||||
| Purchases of investments | 45 | |||||||
| Repurchases of fund’s shares | 788 | |||||||
| Unified Management fees | 866 | |||||||
| Other accrued expenses | 3 | |||||||
| Total liabilities | 1,702 | |||||||
| Net assets at October 31, 2017: | $ | 1,584,243 | ||||||
| Net assets consist of: | ||||||||
| Capital paid in on shares of beneficial interest | $ | 1,244,228 | ||||||
| Accumulated undistributed net investment income | 21,573 | |||||||
| Accumulated net realized loss | (81,379 | ) | ||||||
| Net unrealized appreciation | 399,821 | |||||||
| Net assets at October 31, 2017 | $ | 1,584,243 | ||||||
| Shares outstanding: | 115,906 | |||||||
| Net asset value per share: | $ | 13.67 | ||||||
See Notes to Financial Statements
| 104 | Private Client Services Funds |
Capital Group International Equity Fund
Statement of operations
for the year ended October 31, 2017
(dollars in thousands)
| Investment income: | ||||||||
| Income: | ||||||||
| Dividends (net of non-U.S. taxes of $3,155) | $ | 32,725 | ||||||
| Interest | 500 | 33,225 | ||||||
| Fees and expenses: | ||||||||
| Unified Management fees | 10,209 | |||||||
| Trustees’ compensation | 32 | |||||||
| Legal fees | 2 | |||||||
| Total fees and expenses before reimbursements | 10,243 | |||||||
| Less reimbursements of fees and expenses | 34 | |||||||
| Total fees and expenses after reimbursements | 10,209 | |||||||
| Net investment income | 23,016 | |||||||
| Net realized gain (loss) and unrealized appreciation on investments and currency: | ||||||||
| Net realized gain on investments | 16,172 | |||||||
| Net realized loss on currency | (313 | ) | ||||||
| Net unrealized appreciation on investments | 260,141 | |||||||
| Net unrealized appreciation on currency translations | 178 | |||||||
| Net realized gain and unrealized appreciation on investments and currency | 276,178 | |||||||
| Net increase in net assets resulting from operations | $ | 299,194 | ||||||
See Notes to Financial Statements
| Private Client Services Funds | 105 |
Capital Group International Equity Fund
Statements of changes in net assets
(dollars in thousands)
| For the year | For the year | |||||||
| ended 10/31/17 | ended 10/31/16 | |||||||
| Operations: | ||||||||
| Net investment income | $ | 23,016 | $ | 19,420 | ||||
| Net realized gain (loss) on investments and currency | 15,859 | (40,426 | ) | |||||
| Net unrealized appreciation on investments and currency | 260,319 | 10,819 | ||||||
| Net increase (decrease) in net assets resulting from operations | 299,194 | (10,187 | ) | |||||
| Dividends to shareholders: | ||||||||
| Dividends from net investment income | (19,754 | ) | (15,606 | ) | ||||
| Total dividends | (19,754 | ) | (15,606 | ) | ||||
| Net capital share transactions | (60,784 | ) | 58,562 | |||||
| Total increase in net assets | 218,656 | 32,769 | ||||||
| Net assets: | ||||||||
| Beginning of year | 1,365,587 | 1,332,818 | ||||||
| End of year (including undistributed net investment income: $21,573 and $18,624, respectively.) | $ | 1,584,243 | $ | 1,365,587 | ||||
See Notes to Financial Statements
| 106 | Private Client Services Funds |
Capital Group U.S. Equity Fund
Statement of assets and liabilities
at October 31, 2017
(dollars and shares in thousands, except per share amounts)
| Assets: | ||||||||
| Investment securities, at value (cost: $154,990) | $ | 230,178 | ||||||
| Short-term investments, at value (cost: $6,698) | 6,697 | |||||||
| Cash | 339 | |||||||
| Receivables for: | ||||||||
| Sales of investments | 28 | |||||||
| Dividends | 175 | |||||||
| Reimbursement from investment adviser | 3 | |||||||
| 206 | ||||||||
| Total assets | 237,420 | |||||||
| Liabilities: | ||||||||
| Payables for: | ||||||||
| Purchases of investments | 1,604 | |||||||
| Repurchases of fund’s shares | 6 | |||||||
| Unified Management fees | 86 | |||||||
| Other accrued expenses | 4 | |||||||
| Total liabilities | 1,700 | |||||||
| Net assets at October 31, 2017: | $ | 235,720 | ||||||
| Net assets consist of: | ||||||||
| Capital paid in on shares of beneficial interest | $ | 149,792 | ||||||
| Undistributed net investment income | — | |||||||
| Accumulated net realized gain | 10,741 | |||||||
| Net unrealized appreciation | 75,187 | |||||||
| Net assets at October 31, 2017 | $ | 235,720 | ||||||
| Shares outstanding: | 10,269 | |||||||
| Net asset value per share: | $ | 22.95 | ||||||
See Notes to Financial Statements
| Private Client Services Funds | 107 |
Capital Group U.S. Equity Fund
Statement of operations
for the year ended October 31, 2017
(dollars in thousands)
| Investment income: | ||||||||
| Income: | ||||||||
| Dividends (net of non-U.S. taxes of $57) | $ | 4,563 | ||||||
| Interest | 62 | 4,625 | ||||||
| Fees and expenses: | ||||||||
| Unified Management fees | 1,174 | |||||||
| Trustees’ compensation | 32 | |||||||
| Legal fees | 2 | |||||||
| Other | — | * | ||||||
| Total fees and expenses before reimbursements | 1,208 | |||||||
| Less reimbursements of fees and expenses | 34 | |||||||
| Total fees and expenses after reimbursements | 1,174 | |||||||
| Net investment income | 3,451 | |||||||
| Net realized gain and unrealized appreciation on investments and currency: | ||||||||
| Net realized gain on investments | 11,281 | |||||||
| Net realized gain on currency | 1 | |||||||
| Net unrealized appreciation on investments | 31,565 | |||||||
| Net realized gain and unrealized appreciation on investments and currency | 42,847 | |||||||
| Net increase in net assets resulting from operations | $ | 46,298 | ||||||
| * | Amount less than one thousand. |
See Notes to Financial Statements
| 108 | Private Client Services Funds |
Capital Group U.S. Equity Fund
Statements of changes in net assets
(dollars in thousands)
| For the year | For the year | |||||||
| ended 10/31/17 | ended 10/31/16 | |||||||
| Operations: | ||||||||
| Net investment income | $ | 3,451 | $ | 3,367 | ||||
| Net realized gain on investments and currency | 11,282 | 9,134 | ||||||
| Net unrealized appreciation (depreciation) on investments | 31,565 | (3,494 | ) | |||||
| Net increase in net assets resulting from operations | 46,298 | 9,007 | ||||||
| Dividends and distributions to shareholders: | ||||||||
| Dividends from net investment income | (3,244 | ) | (3,101 | ) | ||||
| Distributions from capital gain | (8,959 | ) | (6,581 | ) | ||||
| Total dividends and distributions | (12,203 | ) | (9,682 | ) | ||||
| Net capital share transactions | (8,035 | ) | 12,361 | |||||
| Total increase in net assets | 26,060 | 11,686 | ||||||
| Net assets: | ||||||||
| Beginning of year | 209,660 | 197,974 | ||||||
| End of year (including undistributed net investment income: $– and $–, respectively.) | $ | 235,720 | $ | 209,660 | ||||
See Notes to Financial Statements
| Private Client Services Funds | 109 |
Capital Group Private Client Services Funds
Notes to financial statements
1. Organization
Capital Group Private Client Services Funds (the “Trust”) is registered under the Investment Company Act of 1940 as an open-end, diversified management investment company. The Trust has five fixed income funds (Capital Group Core Municipal Fund, Capital Group Short-Term Municipal Fund, Capital Group California Core Municipal Fund, Capital Group California Short-Term Municipal Fund and Capital Group Core Bond Fund) and three equity funds (Capital Group Global Equity Fund, Capital Group International Equity Fund and Capital Group U.S. Equity Fund) (each a “fund,” collectively the “funds”).
Capital Group Core Municipal Fund seeks to provide current income exempt from federal income tax and to preserve capital. Capital Group Short-Term Municipal Fund seeks to preserve capital and secondarily to provide current income exempt from federal income tax. Capital Group California Core Municipal Fund seeks to provide current income exempt from federal and California income taxes and to preserve capital. Capital Group California Short-Term Municipal Fund seeks to preserve capital and secondarily to provide current income exempt from federal and California income taxes. Capital Group Core Bond Fund seeks to provide current income and to preserve capital. Capital Group Global Equity Fund, Capital Group International Equity Fund and Capital Group U.S. Equity Fund seek to provide prudent growth of capital and conservation of principal.
2. Significant accounting policies
Each fund is an investment company that applies the accounting and reporting guidance issued in Topic 946 by the U.S. Financial Accounting Standards Board. The financial statements have been prepared to comply with U.S generally accepted accounting principles (“U.S. GAAP”). These principles require management to make estimates and assumptions that affect reported amounts and disclosures. Actual results could differ from those estimates. Subsequent events, if any, have been evaluated through the date of issuance in the preparation of the financial statements. The funds follow the significant accounting policies described below, as well as the valuation policies described in the next section on valuation.
Security transactions and related investment income – Security transactions are recorded by the funds as of the date the trades are executed with brokers. Realized gains and losses from security transactions are determined based on the specific identified cost of the securities. In the event a security is purchased with a delayed payment date, the funds will segregate liquid assets sufficient to meet their payment obligations. Dividend income is recognized on the ex-dividend date and interest income is recognized on an accrual basis. Market discounts, premiums and original issue discounts on fixed-income securities are amortized daily over the expected life of the security.
Dividends and distributions to shareholders – Dividend and distributions paid to shareholders are recorded on the ex-dividend date.
Currency translation – Assets and liabilities, including investment securities, denominated in currencies other than U.S. dollars are translated into U.S. dollars at the exchange rates supplied by one or more pricing vendors on the valuation date. Purchases and sales of investment securities and income and expenses are translated into U.S. dollars at the exchange rates on the dates of such transactions. The effects of changes in exchange rates on investment securities are included with the net realized gain or loss and net unrealized appreciation or depreciation on investments in the funds’ statement of operations. The realized gain or loss and unrealized appreciation or depreciation resulting from all other transactions denominated in currencies other than U.S. dollars are disclosed separately.
3. Valuation Capital Guardian Trust Company (“CGTC”), the funds’ investment adviser, values the funds’ investments at fair value as defined by U.S. GAAP. The net asset value of each fund is generally determined as of approximately 4:00 p.m. New York time each day the New York Stock Exchange is open.
| 110 | Private Client Services Funds |
Capital Group Private Client Services Funds
Notes to financial statements (continued)
Methods and inputs – The funds’ investment adviser uses the following methods and inputs to establish the fair value of their assets and liabilities. Use of particular methods and inputs may vary over time based on availability and relevance as market and economic conditions evolve.
Equity securities are generally valued at the official closing price of, or the last reported sale price on, the exchange or market on which such securities are traded, as of the close of business on the day the securities are being valued or, lacking any sales, at the last available bid price. Prices for each security are taken from the principal exchange or market on which the security trades.
Fixed-income securities, including short-term securities, are generally valued at prices obtained from one or more pricing vendors. Vendors value such securities based on one or more of the inputs described in the following table. The table provides examples of inputs that are commonly relevant for valuing particular classes of fixed-income securities in which the funds are authorized to invest. However, these classifications are not exclusive and any of the inputs may be used to value any other class of fixed-income security.
| Fixed-income class | Examples of standard inputs | |
| All | Benchmark yields, transactions, bids, offers, quotations from dealers and trading systems, new issues, spreads and other relationships observed in the markets among comparable securities; and proprietary pricing models such as yield measures calculated using factors such as cash flows, financial or collateral performance and other reference data (collectively referred to as “standard inputs”) | |
| Corporate bonds & notes; convertible securities | Standard inputs and underlying equity of the issuer | |
| Bonds & notes of governments & government agencies | Standard inputs and interest rate volatilities | |
| Mortgage-backed; asset-backed obligations | Standard inputs and cash flows, prepayment information, default rates, delinquency and loss assumptions, collateral characteristics, credit enhancements and specific deal information | |
| Municipal securities | Standard inputs and, for certain distressed securities, cash flows or liquidation values using a net present value calculation based on inputs that include, but are not limited to, financial statements and debt contracts |
When the funds’ investment adviser deems it appropriate to do so (such as when vendor prices are unavailable or not deemed to be representative), fixed-income securities will be valued in good faith at the mean quoted bid and ask prices that are reasonably and timely available (or bid prices, if asked prices are not available) or at prices for securities of comparable maturity, quality and type. Some securities may be valued based on their effective maturity or average life, which may be shorter than the stated maturity.
Securities with both fixed-income and equity characteristics, or equity securities traded principally among fixed-income dealers, are generally valued in the manner described for either equity or fixed-income securities, depending on which method is deemed most appropriate by the funds’ investment adviser.
Securities and other assets for which representative market quotations are not readily available or are considered unreliable by the funds’ investment adviser are fair valued as determined in good faith under fair valuation guidelines adopted by authority of the funds’ board of trustees as further described. The funds’ investment adviser follows fair valuation guidelines, consistent with U.S. Securities and Exchange Commission rules and guidance, to consider
| Private Client Services Funds | 111 |
Capital Group Private Client Services Funds
Notes to financial statements (continued)
relevant principles and factors when making fair value determinations. The funds’ investment adviser considers relevant indications of value that are reasonably and timely available to it in determining the fair value to be assigned to a particular security, such as, the type and cost of the security; contractual or legal restrictions on resale of the security; relevant financial or business developments of the issuer; actively traded similar or related securities; conversion or exchange rights on the security; related corporate actions; significant events occurring after the close of trading in the security; and changes in overall market conditions. In addition, the closing prices of equity securities that trade in markets outside U.S. time zones may be adjusted to reflect significant events that occur after the close of local trading but before the net asset value of each share class of the fund is determined. Fair valuations and valuations of investments that are not actively trading involve judgment and may differ materially from valuations that would have been used had greater market activity occurred.
Processes and structure – The funds’ board of trustees has delegated authority to the funds’ investment adviser to make fair value determinations, subject to board oversight. The funds’ investment adviser has established a Joint Fair Valuation Committee (the “Fair Valuation Committee”) to administer, implement and oversee the fair value process, and to make fair value decisions. The Fair Valuation Committee regularly reviews its own fair value decisions, as well as decisions made under its standing instructions to the funds’ investment adviser’s valuation teams. The Fair Valuation Committee reviews changes in fair value measurements from period to period and may, as deemed appropriate, update the fair valuation guidelines to better reflect the results of back testing and address new or evolving issues. The Fair Valuation Committee reports any changes to the fair valuation guidelines to the board of trustees with supplemental information to support the changes. The funds’ board and audit committee also regularly review reports that describe fair value determinations and methods.
The funds’ investment adviser has also established a Fixed-Income Pricing Review Group to administer and oversee the fixed-income valuation process, including the use of fixed-income pricing vendors. This group regularly reviews pricing vendor information and market data. Pricing decisions, processes, and controls over security valuation are also subject to additional internal reviews including an annual control self-evaluation program facilitated by the funds’ investment adviser’s compliance group.
Classifications – The funds’ investment adviser classifies the funds’ assets and liabilities into three levels based on the inputs used to value the assets or liabilities. Level 1 values are based on quoted prices in active markets for identical securities. Level 2 values are based on significant observable market inputs, such as quoted prices for similar securities and quoted prices in inactive markets. Certain securities trading outside the U.S. may transfer between Level 1 and Level 2 due to valuation adjustments resulting from significant market movements following the close of local trading. Level 3 values are based on significant unobservable inputs that reflect the funds’ investment adviser’s determination of assumptions that market participants might reasonably use in valuing the securities. The valuation levels are not necessarily an indication of the risk or liquidity associated with the underlying investment. For example, U.S. government securities are reflected as Level 2 because the inputs used to determine fair value may not always be quoted prices in an active market. The following tables present the funds’ valuation levels as of October 31, 2017 (dollars in thousands):
| Investment securities | Level 1 | Level 2 | Level 3 | Total | ||||||||||||
| Capital Group Core Municipal Fund | ||||||||||||||||
| Bonds & notes | $ | — | $ | 397,103 | $ | — | $ | 397,103 | ||||||||
| Short-term securities | — | 50,242 | — | 50,242 | ||||||||||||
| Total | $ | — | $ | 447,345 | $ | — | $ | 447,345 | ||||||||
| 112 | Private Client Services Funds |
Capital Group Private Client Services Funds
Notes to financial statements (continued)
| Investment securities | Level 1 | Level 2 | Level 3 | Total | ||||||||||||
| Capital Group Short-Term Municipal Fund | ||||||||||||||||
| Bonds & notes | $ | — | $ | 131,750 | $ | — | $ | 131,750 | ||||||||
| Short-term securities | — | 19,739 | — | 19,739 | ||||||||||||
| Total | $ | — | $ | 151,489 | $ | — | $ | 151,489 | ||||||||
| Capital Group California Core Municipal Fund | ||||||||||||||||
| Bonds & notes | $ | — | $ | 356,239 | $ | — | $ | 356,239 | ||||||||
| Short-term securities | — | 31,538 | — | 31,538 | ||||||||||||
| Total | $ | — | $ | 387,777 | $ | — | $ | 387,777 | ||||||||
| Capital Group California Short-Term Municipal Fund | ||||||||||||||||
| Bonds & notes | $ | — | $ | 115,206 | $ | — | $ | 115,206 | ||||||||
| Short-term securities | — | 3,050 | — | 3,050 | ||||||||||||
| Total | $ | — | $ | 118,256 | $ | — | $ | 118,256 | ||||||||
| Capital Group Core Bond Fund | ||||||||||||||||
| Bonds, notes & other debt investments | ||||||||||||||||
| U.S. government & government agency bonds & notes | $ | — | $ | 226,587 | $ | — | $ | 226,587 | ||||||||
| Mortgage-backed obligations | — | 30,738 | — | 30,738 | ||||||||||||
| Corporate bonds & notes | — | 88,539 | — | 88,539 | ||||||||||||
| Municipals | — | 6,399 | — | 6,399 | ||||||||||||
| Government & government agency bonds & notes outside the U.S. | — | 2,086 | — | 2,086 | ||||||||||||
| Asset-backed obligations | — | 20,683 | — | 20,683 | ||||||||||||
| Short-term securities | — | 54,751 | — | 54,751 | ||||||||||||
| Total | $ | — | $ | 429,783 | $ | — | $ | 429,783 | ||||||||
| Capital Group Global Equity Fund | ||||||||||||||||
| Common Stocks1 | $ | 561,259 | $ | — | $ | — | $ | 561,259 | ||||||||
| Short-term securities | — | 9,899 | — | 9,899 | ||||||||||||
| Total | $ | 561,259 | $ | 9,899 | $ | — | $ | 571,158 | ||||||||
| Capital Group International Equity Fund | ||||||||||||||||
| Common Stocks1 | $ | 1,500,409 | $ | — | $ | — | $ | 1,500,409 | ||||||||
| Preferred Securities | 6,289 | — | — | 6,289 | ||||||||||||
| Short-term securities | — | 74,068 | — | 74,068 | ||||||||||||
| Total | $ | 1,506,698 | $ | 74,068 | $ | — | $ | 1,580,766 | ||||||||
| Private Client Services Funds | 113 |
Capital Group Private Client Services Funds
Notes to financial statements (continued)
| Investment securities | Level 1 | Level 2 | Level 3 | Total | ||||||||||||
| Capital Group U.S. Equity Fund | ||||||||||||||||
| Common Stocks1 | $ | 230,178 | $ | — | $ | — | $ | 230,178 | ||||||||
| Short-term securities | — | 6,697 | — | 6,697 | ||||||||||||
| Total | $ | 230,178 | $ | 6,697 | $ | — | $ | 236,875 | ||||||||
| 1 | The level classification by major category of investments is the same as the category presentation in the Schedule of investments. |
4. Risk factors
Investing in the funds may involve certain risks including, but not limited to, those described below.
Market conditions – The prices of, and the income generated by, the securities held by the fund may decline – sometimes rapidly or unpredictably – due to various factors, including events or conditions affecting the general economy or particular industries; overall market changes; local, regional or global political, social or economic instability; governmental or governmental agency responses to economic conditions; and currency exchange rate, interest rate and commodity price fluctuations.
Issuer risks – The prices of, and the income generated by, securities held by the fund may decline in response to various factors directly related to the issuers of such securities, including reduced demand for an issuer’s goods or services, poor management performance and strategic initiatives such as mergers, acquisitions or dispositions and the market response to any such initiatives.
Investing in debt instruments – The prices of, and the income generated by, bonds and other debt securities held by the fund may be affected by changing interest rates and by changes in the effective maturities and credit ratings of these securities.
Rising interest rates will generally cause the prices of bonds and other debt securities to fall. Falling interest rates may cause an issuer to redeem, call or refinance a debt security before its stated maturity, which may result in the fund having to reinvest the proceeds in lower yielding securities. Longer maturity debt securities generally have greater sensitivity to changes in interest rates and may be subject to greater price fluctuations than shorter maturity debt securities.
Bonds and other debt securities are also subject to credit risk, which is the possibility that the credit strength of an issuer will weaken and/or an issuer of a debt security will fail to make timely payments of principal or interest and the security will go into default. Credit risk is gauged, in part, by the credit ratings of the debt securities in which the fund invests. However, ratings are only the opinions of the rating agencies issuing them and are not guarantees as to credit quality or an evaluation of market risk. The fund’s investment adviser relies on its own credit analysts to research issuers and issues in seeking to mitigate various credit and default risks.
Investing in growth-oriented stocks — Growth-oriented common stocks and other equity-type securities (such as preferred stocks, convertible preferred stocks and convertible bonds) may involve larger price swings and greater potential for loss than other types of investments.
Investing in income-oriented stocks — Income provided by the fund may be reduced by changes in the dividend policies of, and the capital resources available for dividend payments at, the companies in which the fund invests.
Credit and liquidity support – Changes in the credit quality of banks and financial institutions providing credit and liquidity support features with respect to securities held by the fund could cause the values of these securities to decline.
| 114 | Private Client Services Funds |
Capital Group Private Client Services Funds
Notes to financial statements (continued)
Investing in lower rated debt instruments – Lower rated bonds and other lower rated debt securities generally have higher rates of interest and involve greater risk of default or price declines due to changes in the issuer’s creditworthiness than those of higher quality debt securities. The market prices of these securities may fluctuate more than the prices of higher quality debt securities and may decline significantly in periods of general economic difficulty.
Liquidity risk — Certain fund holdings may be deemed to be less liquid or illiquid because they cannot be readily sold without significantly impacting the value of the holdings. Liquidity risk may result from the lack of an active market for a holding, legal or contractual restrictions on resale, or the reduced number and capacity of market participants to make a market in such holding. Market prices for less liquid or illiquid holdings may be volatile, and reduced liquidity may have an adverse impact on the market price of such holdings. Additionally, the sale of less liquid or illiquid holdings may involve substantial delays (including delays in settlement) and additional costs and the fund may be unable to sell such holdings when necessary to meet its liquidity needs.
Investing in similar municipal bonds — Investing significantly in municipal obligations of multiple issuers in the same state or backed by revenues of similar types of projects or industries may make the fund more susceptible to certain economic, political or regulatory occurrences. As a result, the potential for fluctuations in the fund’s share price may increase.
Investing in municipal bonds of issuers within the state of California — Because Capital Group California Core Municipal Fund and Capital Group California Short-Term Municipal Fund invest primarily in securities of issuers within the state of California, these funds are more susceptible to factors adversely affecting issuers of California securities than a comparable municipal bond mutual fund that does not concentrate its investments in a single state. For example, in the past, California voters have passed amendments to the state’s constitution and other measures that limit the taxing and spending authority of California governmental entities, and future voter initiatives may adversely affect California municipal bonds.
��
Investing in mortgage-related and other asset-backed securities — Mortgage-related securities, such as mortgage-backed securities, and other asset-backed securities, include debt obligations that represent interests in pools of mortgages or other income-bearing assets, such as consumer loans or receivables. Such securities often involve risks that are different from or more acute than the risks associated with investing in other types of debt securities. Mortgage-backed and other asset-backed securities are subject to changes in the payment patterns of borrowers of the underlying debt. When interest rates fall, borrowers are more likely to refinance or prepay their debt before its stated maturity. This may result in the fund having to reinvest the proceeds in lower yielding securities, effectively reducing the fund’s income. Conversely, if interest rates rise and borrowers repay their debt more slowly than expected, the time in which the mortgage-backed and other asset-backed securities are paid off could be extended, reducing the fund’s cash available for reinvestment in higher yielding securities.
Investing in securities backed by the U.S. government — Securities backed by the U.S. Treasury or the full faith and credit of the U.S. government are guaranteed only as to the timely payment of interest and principal when held to maturity. Accordingly, the current market values for these securities will fluctuate with changes in interest rates. Securities issued by government-sponsored entities and federal agencies and instrumentalities that are not backed by the full faith and credit of the U.S. government are neither issued nor guaranteed by the U.S. government.
Investing outside the U.S. — Securities of issuers domiciled outside the U.S, or with significant operations or revenues outside the U.S., may lose value because of adverse political, social, economic or market developments (including social instability, regional conflicts, terrorism and war) in the countries or regions in which the issuers operate or generate revenue. These securities may also lose value due to changes in foreign currency exchange rates against the U.S. dollar and/or currencies of other countries. Issuers of these securities may be more susceptible to actions of foreign governments, such as the imposition of price controls or punitive taxes, that could adversely impact the value of these securities. Securities markets in certain countries may be more volatile and/or less liquid than those in the U.S. Investments outside the U.S. may also be subject to different accounting practices and different regulatory, legal and reporting standards and practices, and may be more difficult to value, than those in the U.S. In addition, the value of investments outside the U.S. may be reduced by foreign taxes, including foreign withholding taxes on interest
| Private Client Services Funds | 115 |
Capital Group Private Client Services Funds
Notes to financial statements (continued)
and dividends. Further, there may be increased risks of delayed settlement of securities purchased or sold by the fund. The risks of investing outside the U.S. may be heightened in connection with investments in emerging markets.
Investing in derivatives — The use of derivatives involves a variety of risks, which may be different from, or greater than, the risks associated with investing in traditional cash securities, such as stocks and bonds. Changes in the value of a derivative may not correlate perfectly with, and may be more sensitive to market events than, the underlying asset, rate or index, and a derivative instrument may expose the fund to losses in excess of its initial investment. Derivatives may be difficult for the fund to buy or sell at an opportune time or price and may be difficult to terminate or otherwise offset. The fund’s use of derivatives may result in losses to the fund, and investing in derivatives may reduce the fund’s returns and increase the fund’s price volatility. The fund’s counterparty to a derivative transaction (including, if applicable, the fund’s clearing broker, the derivatives exchange or the clearinghouse) may be unable or unwilling to honor its financial obligations in respect of the transaction.
Management — The investment adviser to the fund actively manages the fund’s investments. Consequently, the fund is subject to the risk that the methods and analyses employed by the investment adviser in this process may not produce the desired results. This could cause the fund to lose value or its investment results to lag relevant benchmarks or other funds with similar objectives.
5. Certain investment techniques
Mortgage dollar rolls – Capital Group Core Bond Fund has entered into mortgage dollar roll transactions in which the fund sells a mortgage-backed security to a counterparty and simultaneously enters into an agreement with the same counterparty to buy back a similar security on a specific future date at a predetermined price. Mortgage dollar rolls are accounted for as purchase and sale transactions, which may increase the fund’s portfolio turnover rate.
6. Taxation and distributions
Federal income taxation – The funds comply with the requirements under Subchapter M of the Internal Revenue Code applicable to mutual funds and intend to distribute substantially all of their net taxable income and net capital gains each year. The funds are not subject to income taxes to the extent such distributions are made. Therefore, no federal income tax provision is required. Generally, income earned by Capital Group Core Municipal Fund, Capital Group Short-Term Municipal Fund, Capital Group California Core Municipal Fund and Capital Group California Short-Term Municipal Fund is exempt from federal income taxes; however, these funds may earn taxable income from certain investments.
As of and during the year ended October 31, 2017, the funds did not have a liability for any unrecognized tax benefits. The funds recognized interest and penalties, if any, related to unrecognized tax benefit as income tax expense in the statement of operations. During the year, the funds did not incur any interest or penalties.
The funds are not subject to examination by U.S. federal tax authorities for tax years before 2013 and by state tax authorities for tax years before 2012.
Non-U.S. Taxation – Dividend and interest income are recorded net of non-U.S. taxes paid. The funds may file withholding tax reclaims in certain jurisdictions to recover a portion of amounts previously withheld. As a result of rulings from European courts, Capital Group International Equity Fund filed for additional reclaims related to prior years. These reclaims are recorded when the amount is known and there are no significant uncertainties on collectability. Gains realized by the funds on the sale of securities in certain countries are subject to non-U.S. taxes. The funds record a liability based on unrealized gains to provide for potential non-U.S. taxes payable upon the sale of these securities.
Distributions – Distributions paid to shareholders are based on net investment income and net realized gains determined on a tax basis, which may differ from net investment income and net realized gains for financial reporting purposes. These differences are due primarily to different treatment for items such as currency gains and losses; short-term capital gains and losses; capital losses related to sales of certain securities within 30 days of purchase; net
| 116 | Private Client Services Funds |
Capital Group Private Client Services Funds
Notes to financial statements (continued)
capital losses; cost of investments sold; and amortization of discounts. The fiscal year in which amounts are distributed may differ from the year in which the net investment income and net realized gains are recorded by the funds for financial reporting purposes.
As indicated in the table below, some of the funds had capital loss carryforwards available at October 31, 2017. These will be used to offset any capital gains realized by the funds in future years. Funds with capital loss carryforwards will not make distributions from capital gains while capital loss carryforwards remain.
The components of distributable earnings on a tax basis are reported as of the funds’ most recent year-end. As of October 31, 2017 the components of distributable earnings on a tax basis were as follows (dollars in thousands):
| Capital | ||||||||||||||||||||||||||||||||
| Capital | Capital | Group | ||||||||||||||||||||||||||||||
| Capital | Group | Group | California | Capital | Capital | Capital | ||||||||||||||||||||||||||
| Group | Short- | California | Short- | Group | Group | Capital | Group | |||||||||||||||||||||||||
| Core | Term | Core | Term | Core | Global | Group | U.S. | |||||||||||||||||||||||||
| Municipal | Municipal | Municipal | Municipal | Bond | Equity | International | Equity | |||||||||||||||||||||||||
| Fund | Fund | Fund | Fund | Fund | Fund | Equity Fund | Fund | |||||||||||||||||||||||||
| As of October 31, 2017: | ||||||||||||||||||||||||||||||||
| Undistributed tax-exempt income | $ | 2 | $ | — | $ | — | $ | — | $ | — | $ | — | $ | — | $ | — | ||||||||||||||||
| Undistributed ordinary income | — | — | — | 31 | — | 6,334 | 21,574 | — | ||||||||||||||||||||||||
| Undistributed long-term capital gain | 868 | — | 355 | 54 | — | 20,170 | — | 10,650 | ||||||||||||||||||||||||
| Capital loss carryforward No expiration | — | (241 | ) | — | — | (698 | ) | — | (79,865 | ) | — | |||||||||||||||||||||
| Capital loss carryforwards utilized | $ | — | $ | — | $ | — | $ | — | $ | — | $ | — | $ | 15,194 | $ | — | ||||||||||||||||
| Private Client Services Funds | 117 |
Capital Group Private Client Services Funds
Notes to financial statements (continued)
As of October 31, 2017, the tax-basis unrealized appreciation (depreciation) and cost of investment securities were as follows (dollars in thousands):
| Capital | ||||||||||||||||||||||||||||||||
| Capital | Capital | Group | ||||||||||||||||||||||||||||||
| Capital | Group | Group | California | Capital | Capital | Capital | ||||||||||||||||||||||||||
| Group | Short- | California | Short- | Group | Group | Capital | Group | |||||||||||||||||||||||||
| Core | Term | Core | Term | Core | Global | Group | U.S. | |||||||||||||||||||||||||
| Municipal | Municipal | Municipal | Municipal | Bond | Equity | International | Equity | |||||||||||||||||||||||||
| Fund | Fund | Fund | Fund | Fund | Fund | Equity Fund | Fund | |||||||||||||||||||||||||
| Reclassification (from) to distributions in excess of/undistributed net investment income (to) from accumulated net realized loss/undistributed net realized gain | $ | — | $ | — | * | $ | — | $ | — | * | $ | — | $ | (325 | ) | $ | (313 | ) | $ | (207 | ) | |||||||||||
| Reclassification to (from) distributions in excess of/undistributed net investment income (to) from capital paid in on shares of beneficial interest | (14 | ) | — | * | (2 | ) | — | — | * | — | — | — | ||||||||||||||||||||
| Reclassification (from) to accumulated net realized loss (to) from capital paid in on shares of beneficial interest | (78 | ) | — | (40 | ) | (30 | ) | — | * | (1,663 | ) | — | (601 | ) | ||||||||||||||||||
| Gross unrealized appreciation on investment securities | $ | 5,738 | $ | 650 | $ | 7,290 | $ | 735 | $ | 2,771 | $ | 169,425 | $ | 415,886 | $ | 76,435 | ||||||||||||||||
| Gross unrealized depreciation on investment securities | (871 | ) | (277 | ) | (566 | ) | (180 | ) | (1,902 | ) | (4,383 | ) | (17,566 | ) | (1,156 | ) | ||||||||||||||||
| Net unrealized appreciation on investment securities | $ | 4,867 | $ | 373 | $ | 6,724 | $ | 555 | $ | 869 | $ | 165,042 | $ | 398,320 | $ | 75,279 | ||||||||||||||||
| Cost of investments securities | $ | 442,478 | $ | 151,116 | $ | 381,053 | $ | 117,701 | $ | 428,914 | $ | 406,116 | $ | 1,182,446 | $ | 161,596 | ||||||||||||||||
| * | Amount less than one thousand |
| 118 | Private Client Services Funds |
Capital Group Private Client Services Funds
Notes to financial statements (continued)
The tax character of distributions paid during the funds’ year ended October 31, 2017 and the funds’ year ended October 31, 2016, the most recently completed tax year, were as follows (dollars in thousands):
| Year ended October 31, 2017 | Year ended October 31, 2016 | |||||||||||||||||||||||
| Tax-Exempt | Ordinary Income | Long-Term Capital Gains | Tax-Exempt | Ordinary Income | Long-Term Capital Gains | |||||||||||||||||||
| Capital Group Core Municipal Fund | $ | 8,282 | $ | — | $ | 144 | $ | 7,720 | $ | 1 | $ | 303 | ||||||||||||
| Capital Group Short-Term Municipal Fund | 2,242 | 32 | — | 1,846 | 1 | 20 | ||||||||||||||||||
| Capital Group California Core Municipal Fund | 6,542 | — | 284 | 6,040 | — | * | — | |||||||||||||||||
| Capital Group California Short-Term Municipal Fund | 1,292 | — | 52 | 1,144 | — | * | 123 | |||||||||||||||||
| Capital Group Core Bond Fund | — | 7,046 | 719 | — | 5,532 | 617 | ||||||||||||||||||
| Capital Group Global Equity Fund | — | 7,255 | — | — | 6,944 | 15,930 | ||||||||||||||||||
| Capital Group International Equity Fund | — | 19,754 | — | — | 15,606 | — | ||||||||||||||||||
| Capital Group U.S. Equity Fund | — | 3,244 | 8,959 | — | 3,101 | 6,581 | ||||||||||||||||||
| * | Amount less than one thousand. |
7. Fees and transactions with related parties
CGTC serves as investment adviser to the funds and other funds. CGTC is a wholly owned subsidiary of Capital Group International, Inc. Expense limitations have been imposed through January 1, 2019, to limit the funds’ total annual fund operating expenses to the following rates (as a percentage of average daily net assets):
| Expense Limitation* | ||||||||
| Fund | Period from 11/1/2016 to 3/31/2017 | Period from 4/1/2017 to 10/31/2017 | ||||||
| Capital Group Core Municipal Fund | 0.40 | % | 0.30 | % | ||||
| Capital Group Short-Term Municipal Fund | 0.40 | % | 0.30 | % | ||||
| Capital Group California Core Municipal Fund | 0.40 | % | 0.30 | % | ||||
| Capital Group California Short-Term Municipal Fund | 0.40 | % | 0.30 | % | ||||
| Capital Group Core Bond Fund | 0.40 | % | 0.30 | % | ||||
| Capital Group Global Equity Fund | 0.85 | % | 0.65 | % | ||||
| Capital Group International Equity Fund | 0.85 | % | 0.65 | % | ||||
| Capital Group U.S. Equity Fund | 0.65 | % | 0.425 | % | ||||
| * | The investment advisory services fees were amended effective April 1, 2017. |
CGTC does not intend to recoup any reimbursed expenses from a prior year under expense limitations then in effect for the funds.
Investment advisory services – The funds have an investment advisory and service agreement with CGTC that provides for monthly fees accrued daily. From November 1, 2016 to March 31, 2017, the fee for each fixed income fund was 0.35% of the average daily net assets of the fund. For the services it provides to Capital Group Global Equity Fund, Capital Group International Equity Fund and Capital Group U.S. Equity Fund, CGTC receives a unified management fee based on a percentage of the average daily net assets of the funds. From November 1, 2016 to March 31, 2017, the unified management fee for Capital Group Global Equity Fund and Capital Group International Equity Fund was 0.85% of the average daily net assets of each fund. The unified management fee for Capital Group U.S. Equity Fund was 0.65% of the average daily net assets of the fund. Effective, April 1, 2017, the monthly fees were
| Private Client Services Funds | 119 |
Capital Group Private Client Services Funds
Notes to financial statements (continued)
amended for all funds. The fee for each fixed income fund was amended to 0.25% of the average daily net assets of the fund. The unified management fee for Capital Group Global Equity Fund and Capital Group International Equity Fund was amended to 0.65% of the average daily net assets of each fund. The unified management fee for Capital Group U.S. Equity Fund was amended to 0.425% of the average daily net assets of the fund.
For the equity funds, all managing and operating expenses are paid by CGTC from the unified management fees except brokerage expenses, taxes, interest, compensation, fees and expenses of the independent trustees (including legal counsel fees) and extraordinary expenses, such as litigation expenses. These expenses which are not paid by CGTC from the unified management fee are paid by the funds, which are currently reimbursed by the advisor. A portion of the funds’ management fee is paid by CGTC to unaffiliated third parties which provide recordkeeping and administrative services.
Distribution services – American funds Distributors, ® Inc. (the “Distributor”) is the principal underwriter of each fund’s shares. The Distributor does not receive any compensation related to the sale of shares of the funds.
Affiliated officers and trustees – Officers and certain trustees of the Trust are or may be considered to be affiliated with CGTC. No affiliated officers or trustees received any compensation directly from the Trust.
Security transactions with related funds — The Trust’s five fixed-income funds (Capital Group Core Municipal Fund, Capital Group Short-Term Municipal Fund, Capital Group California Core Municipal Fund, Capital Group California Short-Term Municipal Fund and Capital Group Core Bond Fund) may purchase from, or sell securities to, other CGTC-managed funds (or accounts managed by certain affiliates of CGTC) under procedures adopted by the funds’ board of trustees. The funds involved in such transactions are considered related by virtue of having a common investment adviser (or affiliated investment advisers), common trustees and/or common officers. When such transactions occur, each transaction is executed at the current market price of the security and no brokerage commissions or fees are paid in accordance with Rule 17a-7 of the 1940 Act. During the year ended October 31, 2017, such purchase and sale transactions occurred between Capital Group Core Municipal Fund, Capital Group Short-Term Municipal Fund, Capital Group California Core Municipal Fund, Capital Group California Short-Term Municipal Fund and related funds in the amounts of $10,701,000, $2,459,000, $13,938,000 and $5,787,000, respectively, for purchases and $11,829,000, $6,851,000, $5,240,000 and $3,496,000, respectively, for sales.
Interfund lending — Pursuant to an exemptive order issued by the SEC, the fund, along with other CGTC-managed funds (or funds managed by certain affiliates of CGTC), may participate in an interfund lending program. The program provides an alternate credit facility that permits the funds to lend or borrow cash for temporary purposes directly to or from one another, subject to the conditions of the exemptive order. The fund did not lend or borrow cash through the interfund lending program at any time during the year ended October 31, 2017.
| 120 | Private Client Services Funds |
Capital Group Private Client Services Funds
Notes to financial statements (continued)
8. Capital share transactions
Capital share transactions in the funds were as follows (dollars and shares in thousands):
| Sales | Reinvestment of Dividends and Distributions | Repurchases | Net Increase/(Decrease) | |||||||||||||||||||||||||||||
| Fund | Amount | Shares | Amount | Shares | Amount | Shares | Amount | Shares | ||||||||||||||||||||||||
| Year ended October 31, 2017 | ||||||||||||||||||||||||||||||||
| Capital Group Core Municipal Fund | $ | 101,192 | 9,764 | $ | 5,846 | 565 | $ | (67,034 | ) | (6,488 | ) | $ | 40,004 | 3,841 | ||||||||||||||||||
| Capital Group Short-Term Municipal Fund | 79,828 | 7,946 | 1,681 | 167 | (109,740 | ) | (10,927 | ) | (28,231 | ) | (2,814 | ) | ||||||||||||||||||||
| Capital Group California Core Municipal Fund | 91,608 | 8,697 | 4,558 | 434 | (40,534 | ) | (3,869 | ) | 55,632 | 5,262 | ||||||||||||||||||||||
| Capital Group California Short-Term Municipal Fund | 46,705 | 4,587 | 872 | 86 | (45,366 | ) | (4,457 | ) | 2,211 | 216 | ||||||||||||||||||||||
| Capital Group Core Bond Fund | 101,119 | 9,984 | 5,963 | 589 | (37,097 | ) | (3,654 | ) | 69,985 | 6,919 | ||||||||||||||||||||||
| Capital Group Global Equity Fund | 53,952 | 3,836 | 5,365 | 425 | (80,505 | ) | (5,764 | ) | (21,188 | ) | (1,503 | ) | ||||||||||||||||||||
| Capital Group International Equity Fund | 293,846 | 25,080 | 2,587 | 241 | (357,217 | ) | (31,060 | ) | (60,784 | ) | (5,739 | ) | ||||||||||||||||||||
| Capital Group U.S. Equity Fund | 12,512 | 604 | 10,740 | 532 | (31,287 | ) | (1,466 | ) | (8,035 | ) | (330 | ) | ||||||||||||||||||||
| Private Client Services Funds | 121 |
Capital Group Private Client Services Funds
Notes to financial statements (continued)
| Sales | Reinvestment of Dividends and Distributions | Repurchases | Net Increase | |||||||||||||||||||||||||||||
| Fund | Amount | Shares | Amount | Shares | Amount | Shares | Amount | Shares | ||||||||||||||||||||||||
| Year ended October 31, 2016 | ||||||||||||||||||||||||||||||||
| Capital Group Core Municipal Fund | $ | 72,380 | 6,853 | $ | 5,421 | 515 | $ | (51,155 | ) | (4,848 | ) | $ | 26,646 | 2,520 | ||||||||||||||||||
| Capital Group Short-Term Municipal Fund | 141,327 | 13,929 | 1,377 | 136 | (106,108 | ) | (10,457 | ) | 36,596 | 3,608 | ||||||||||||||||||||||
| Capital Group California Core Municipal Fund | 61,473 | 5,723 | 3,866 | 361 | (36,927 | ) | (3,441 | ) | 28,412 | 2,643 | ||||||||||||||||||||||
| Capital Group California Short-Term Municipal Fund | 35,087 | 3,413 | 928 | 91 | (29,650 | ) | (2,884 | ) | 6,365 | 620 | ||||||||||||||||||||||
| Capital Group Core Bond Fund | 50,573 | 4,927 | 4,540 | 444 | (41,222 | ) | (4,029 | ) | 13,891 | 1,342 | ||||||||||||||||||||||
| Capital Group Global Equity Fund | 62,500 | 5,089 | 18,674 | 1,494 | (79,816 | ) | (6,413 | ) | 1,358 | 170 | ||||||||||||||||||||||
| Capital Group International Equity Fund | 475,681 | 43,766 | 2,021 | 178 | (419,140 | ) | (38,212 | ) | 58,562 | 5,732 | ||||||||||||||||||||||
| Capital Group U.S. Equity Fund | 24,876 | 1,297 | 8,642 | 446 | (21,157 | ) | (1,101 | ) | 12,361 | 642 | ||||||||||||||||||||||
The fund’s Declaration of Trust permits the Trustees to issue an unlimited number of full and fractional shares of beneficial interest (without par value).
| 122 | Private Client Services Funds |
Capital Group Private Client Services Funds
Notes to financial statements (continued)
9. Investment transactions
The funds made purchases and sales of investment securities, excluding short-term securities and U.S. government obligations, if any, during the funds’ year ended October 31, 2017, as follows (dollars in thousands):
| Cost of Investments Purchased | Proceeds from Investments Sold | |||||||||||||||
| Fund | U.S. Government Agency Obligations | Other Investments | U.S. Government Agency Obligations | Other Investments | ||||||||||||
| Capital Group Core Municipal Fund | $ | — | $ | 198,832 | $ | — | $ | 179,836 | ||||||||
| Capital Group Short-Term Municipal Fund | — | 60,142 | — | 78,384 | ||||||||||||
| Capital Group California Core Municipal Fund | — | 135,758 | — | 85,222 | ||||||||||||
| Capital Group California Short-Term Municipal Fund | — | 45,462 | — | 38,741 | ||||||||||||
| Capital Group Core Bond Fund | 330,322 | 52,926 | 268,255 | 63,059 | ||||||||||||
| Capital Group Global Equity Fund | — | 100,051 | — | 117,498 | ||||||||||||
| Capital Group International Equity Fund | — | 233,050 | — | 328,103 | ||||||||||||
| Capital Group U.S. Equity Fund | — | 42,605 | — | 56,785 | ||||||||||||
10. Advisory platform concentration
Most of the shares of Capital Group International Equity fund are held through a single advisory platform (more than 89% of the fund as of October 31, 2017). If the platform sponsor decides to move a significant number of its clients out of the fund it could have an adverse impact by causing the fund to have to sell securities in order to meet redemptions. The fund’s investment adviser monitors the fund’s asset allocation and the liquidity of the fund’s portfolio in seeking to mitigate this risk.
| Private Client Services Funds | 123 |
Capital Group Core Municipal Fund
Financial highlights
(for a share outstanding throughout each year)
| For the year ended | ||||||||||||||||||||
| 10/31/17 | 10/31/16 | 10/31/15 | 10/31/14 | 10/31/13 | ||||||||||||||||
| Selected per share data: | ||||||||||||||||||||
| Net asset value, beginning of year | $ | 10.48 | $ | 10.49 | $ | 10.56 | $ | 10.44 | $ | 10.64 | ||||||||||
| Income from investment operations:1 | ||||||||||||||||||||
| Net investment income | 0.21 | 0.21 | 0.21 | 0.21 | 0.21 | |||||||||||||||
| Net realized and unrealized (losses) gains on securities | (0.07 | ) | (— | )2 | (0.07 | ) | 0.12 | (0.20 | ) | |||||||||||
| Total from investment operations | 0.14 | 0.21 | 0.14 | 0.33 | 0.01 | |||||||||||||||
| Dividends and distributions: | ||||||||||||||||||||
| Dividends from net investment income | (0.21 | ) | (0.21 | ) | (0.21 | ) | (0.21 | ) | (0.21 | ) | ||||||||||
| Distributions from capital gain | (— | )2 | (0.01 | ) | — | — | — | |||||||||||||
| Total dividends and distributions | (0.21 | ) | (0.22 | ) | (0.21 | ) | (0.21 | ) | (0.21 | ) | ||||||||||
| Net asset value, end of year | $ | 10.41 | $ | 10.48 | $ | 10.49 | $ | 10.56 | $ | 10.44 | ||||||||||
| Total return3 | 1.39 | % | 1.97 | % | 1.31 | % | 3.18 | % | 0.10 | % | ||||||||||
| Net assets, end of year (in millions) | $ | 442 | $ | 405 | $ | 379 | $ | 341 | $ | 299 | ||||||||||
| Ratios / Supplemental Data: | ||||||||||||||||||||
| Ratio of expenses to average net assets before reimbursement | 0.35 | % | 0.41 | % | 0.42 | % | 0.41 | % | 0.41 | % | ||||||||||
| Ratio of expenses to average net assets after reimbursement3 | 0.34 | % | 0.40 | % | 0.40 | % | 0.40 | % | 0.40 | % | ||||||||||
| Ratio of net investment income to average net assets3 | 2.02 | % | 1.97 | % | 1.97 | % | 2.00 | % | 2.00 | % | ||||||||||
| Portfolio turnover rate | 47 | % | 18 | % | 16 | % | 9 | % | 18 | % | ||||||||||
| 1 | Based on average shares outstanding. |
| 2 | Amount less than $0.01. |
| 3 | Reflects the impact, if any, of certain reimbursements from Capital Guardian Trust Company. |
| 124 | Private Client Services Funds |
Capital Group Short-Term Municipal Fund
Financial highlights
(for a share outstanding throughout each year)
| For the year ended | ||||||||||||||||||||
| 10/31/17 | 10/31/16 | 10/31/15 | 10/31/14 | 10/31/13 | ||||||||||||||||
| Selected per share data: | ||||||||||||||||||||
| Net asset value, beginning of year | $ | 10.11 | $ | 10.12 | $ | 10.19 | $ | 10.21 | $ | 10.32 | ||||||||||
| Income from investment operations:1 | ||||||||||||||||||||
| Net investment income | 0.14 | 0.12 | 0.12 | 0.13 | 0.14 | |||||||||||||||
| Net realized and unrealized losses on securities | (0.02 | ) | (0.01 | ) | (0.07 | ) | (0.01 | ) | (0.07 | ) | ||||||||||
| Total from investment operations | 0.12 | 0.11 | 0.05 | 0.12 | 0.07 | |||||||||||||||
| Dividends and distributions: | ||||||||||||||||||||
| Dividends from net investment income | (0.14 | ) | (0.12 | ) | (0.12 | ) | (0.13 | ) | (0.14 | ) | ||||||||||
| Distributions from capital gain | (— | )2 | (— | )2 | (— | )2 | (0.01 | ) | (0.04 | ) | ||||||||||
| Total dividends and distributions | (0.14 | ) | (0.12 | ) | (0.12 | ) | (0.14 | ) | (0.18 | ) | ||||||||||
| Net asset value, end of year | $ | 10.09 | $ | 10.11 | $ | 10.12 | $ | 10.19 | $ | 10.21 | ||||||||||
| Total return3 | 1.26 | % | 1.06 | % | 0.51 | % | 1.20 | % | 0.66 | % | ||||||||||
| Net assets, end of year (in millions) | $ | 150 | $ | 179 | $ | 142 | $ | 155 | $ | 136 | ||||||||||
| Ratios / Supplemental Data: | ||||||||||||||||||||
| Ratio of expenses to average net assets before reimbursement | 0.41 | % | 0.45 | % | 0.46 | % | 0.45 | % | 0.44 | % | ||||||||||
| Ratio of expenses to average net assets after reimbursement3 | 0.35 | % | 0.40 | % | 0.40 | % | 0.40 | % | 0.40 | % | ||||||||||
| Ratio of net investment income to average net assets3 | 1.42 | % | 1.14 | % | 1.15 | % | 1.24 | % | 1.34 | % | ||||||||||
| Portfolio turnover rate | 42 | % | 24 | % | 27 | % | 20 | % | 18 | % | ||||||||||
| 1 | Based on average shares outstanding. |
| 2 | Amount less than $0.01. |
| 3 | Reflects the impact, if any, of certain reimbursements from Capital Guardian Trust Company. |
| Private Client Services Funds | 125 |
Capital Group California Core Municipal Fund
Financial highlights
(for a share outstanding throughout each year)
| For the year ended | ||||||||||||||||||||
| 10/31/17 | 10/31/16 | 10/31/15 | 10/31/14 | 10/31/13 | ||||||||||||||||
| Selected per share data: | ||||||||||||||||||||
| Net asset value, beginning of year | $ | 10.69 | $ | 10.59 | $ | 10.62 | $ | 10.40 | $ | 10.65 | ||||||||||
| Income from investment operations:1 | ||||||||||||||||||||
| Net investment income | 0.20 | 0.21 | 0.21 | 0.20 | 0.20 | |||||||||||||||
| Net realized and unrealized (losses) gains on securities | (0.11 | ) | 0.09 | (0.03 | ) | 0.22 | (0.20 | ) | ||||||||||||
| Total from investment operations | 0.09 | 0.30 | 0.18 | 0.42 | — | |||||||||||||||
| Dividends and distributions: | ||||||||||||||||||||
| Dividends from net investment income | (0.20 | ) | (0.20 | ) | (0.21 | ) | (0.20 | ) | (0.21 | ) | ||||||||||
| Distributions from capital gain | (0.01 | ) | — | — | — | (0.04 | ) | |||||||||||||
| Total dividends and distributions | (0.21 | ) | (0.20 | ) | (0.21 | ) | (0.20 | ) | (0.25 | ) | ||||||||||
| Net asset value, end of year | $ | 10.57 | $ | 10.69 | $ | 10.59 | $ | 10.62 | $ | 10.40 | ||||||||||
| Total return2 | 0.84 | % | 2.86 | % | 1.68 | % | 4.08 | % | (0.04 | )% | ||||||||||
| Net assets, end of year (in millions) | $ | 388 | $ | 336 | $ | 305 | $ | 280 | $ | 227 | ||||||||||
| Ratios / Supplemental Data: | ||||||||||||||||||||
| Ratio of expenses to average net assets before reimbursement | 0.35 | % | 0.41 | % | 0.42 | % | 0.41 | % | 0.41 | % | ||||||||||
| Ratio of expenses to average net assets after reimbursement2 | 0.34 | % | 0.40 | % | 0.40 | % | 0.40 | % | 0.40 | % | ||||||||||
| Ratio of net investment income to average net assets2 | 1.88 | % | 1.89 | % | 1.95 | % | 1.92 | % | 1.93 | % | ||||||||||
| Portfolio turnover rate | 27 | % | 11 | % | 13 | % | 18 | % | 17 | % | ||||||||||
| 1 | Based on average shares outstanding. |
| 2 | Reflects the impact, if any, of certain reimbursements from Capital Guardian Trust Company. |
| 126 | Private Client Services Funds |
Capital Group California Short-Term Municipal Fund
Financial highlights
(for a share outstanding throughout each year)
| For the year ended | ||||||||||||||||||||
| 10/31/17 | 10/31/16 | 10/31/15 | 10/31/14 | 10/31/13 | ||||||||||||||||
| Selected per share data: | ||||||||||||||||||||
| Net asset value, beginning of year | $ | 10.23 | $ | 10.28 | $ | 10.31 | $ | 10.27 | $ | 10.32 | ||||||||||
| Income from investment operations:1 | ||||||||||||||||||||
| Net investment income | 0.11 | 0.10 | 0.10 | 0.09 | 0.09 | |||||||||||||||
| Net realized and unrealized (losses) gains on securities | (0.02 | ) | (0.04 | ) | (0.03 | ) | 0.04 | (0.04 | ) | |||||||||||
| Total from investment operations | 0.09 | 0.06 | 0.07 | 0.13 | 0.05 | |||||||||||||||
| Dividends and distributions: | ||||||||||||||||||||
| Dividends from net investment income | (0.11 | ) | (0.10 | ) | (0.10 | ) | (0.09 | ) | (0.09 | ) | ||||||||||
| Distributions from capital gain | (— | )2 | (0.01 | ) | (— | )2 | (— | )2 | (0.01 | ) | ||||||||||
| Total dividends and distributions | (0.11 | ) | (0.11 | ) | (0.10 | ) | (0.09 | ) | (0.10 | ) | ||||||||||
| Net asset value, end of year | $ | 10.21 | $ | 10.23 | $ | 10.28 | $ | 10.31 | $ | 10.27 | ||||||||||
| Total return3 | 0.97 | % | 0.63 | % | 0.74 | % | 1.30 | % | 0.48 | % | ||||||||||
| Net assets, end of year (in millions) | $ | 120 | $ | 118 | $ | 112 | $ | 138 | $ | 115 | ||||||||||
| Ratios / Supplemental Data: | ||||||||||||||||||||
| Ratio of expenses to average net assets before reimbursement | 0.42 | % | 0.46 | % | 0.46 | % | 0.44 | % | 0.44 | % | ||||||||||
| Ratio of expenses to average net assets after reimbursement3 | 0.35 | % | 0.40 | % | 0.40 | % | 0.40 | % | 0.40 | % | ||||||||||
| Ratio of net investment income to average net assets3 | 1.11 | % | 1.00 | % | 0.98 | % | 0.89 | % | 0.91 | % | ||||||||||
| Portfolio turnover rate | 36 | % | 19 | % | 23 | % | 19 | % | 9 | % | ||||||||||
| 1 | Based on average shares outstanding. |
| 2 | Amount less than $0.01. |
| 3 | Reflects the impact, if any, of certain reimbursements from Capital Guardian Trust Company. |
| Private Client Services Funds | 127 |
Capital Group Core Bond Fund
Financial highlights
(for a share outstanding throughout each year)
| For the year ended | ||||||||||||||||||||
| 10/31/17 | 10/31/16 | 10/31/15 | 10/31/14 | 10/31/13 | ||||||||||||||||
| Selected per share data: | ||||||||||||||||||||
| Net asset value, beginning of year | $ | 10.31 | $ | 10.19 | $ | 10.25 | $ | 10.24 | $ | 10.62 | ||||||||||
| Income from investment operations:1 | ||||||||||||||||||||
| Net investment income | 0.16 | 0.16 | 0.16 | 0.16 | 0.15 | |||||||||||||||
| Net realized and unrealized (losses) gains on securities | (0.12 | ) | 0.15 | (0.04 | ) | 0.04 | (0.22 | ) | ||||||||||||
| Total from investment operations | 0.04 | 0.31 | 0.12 | 0.20 | (0.07 | ) | ||||||||||||||
| Dividends and distributions: | ||||||||||||||||||||
| Dividends from net investment income | (0.16 | ) | (0.16 | ) | (0.16 | ) | (0.16 | ) | (0.15 | ) | ||||||||||
| Distributions from capital gain | (0.05 | ) | (0.03 | ) | (0.02 | ) | (0.03 | ) | (0.16 | ) | ||||||||||
| Total dividends and distributions | (0.21 | ) | (0.19 | ) | (0.18 | ) | (0.19 | ) | (0.31 | ) | ||||||||||
| Net asset value, end of year | $ | 10.14 | $ | 10.31 | $ | 10.19 | $ | 10.25 | $ | 10.24 | ||||||||||
| Total return2 | 0.41 | % | 3.03 | % | 1.25 | % | 1.95 | % | (0.69 | )% | ||||||||||
| Net assets, end of year (in millions) | $ | 416 | $ | 352 | $ | 335 | $ | 310 | $ | 296 | ||||||||||
| Ratios / Supplemental Data: | ||||||||||||||||||||
| Ratio of expenses to average net assets before reimbursement | 0.35 | % | 0.41 | % | 0.42 | % | 0.41 | % | 0.41 | % | ||||||||||
| Ratio of expenses to average net assets after reimbursement2 | 0.34 | % | 0.40 | % | 0.40 | % | 0.40 | % | 0.40 | % | ||||||||||
| Ratio of net investment income to average net assets2 | 1.58 | % | 1.55 | % | 1.59 | % | 1.57 | % | 1.43 | % | ||||||||||
| Portfolio Turnover Rate3: | ||||||||||||||||||||
| Excluding mortgage dollar roll transactions | 52 | % | 58 | % | 87 | % | — | 4 | — | 4 | ||||||||||
| Including mortgage dollar roll transactions | 95 | % | 86 | % | 126 | % | 137 | % | 192 | % | ||||||||||
| 1 | Based on average shares outstanding. |
| 2 | Reflects the impact, if any, of certain reimbursements from Capital Guardian Trust Company. |
| 3 | Refer to Note 5 for more information on mortgage dollar rolls. |
| 4 | Not available. |
| 128 | Private Client Services Funds |
Capital Group Global Equity Fund
Financial highlights
(for a share outstanding throughout each year)
| For the year ended | ||||||||||||||||||||
| 10/31/17 | 10/31/16 | 10/31/15 | 10/31/14 | 10/31/13 | ||||||||||||||||
| Selected per share data: | ||||||||||||||||||||
| Net asset value, beginning of year | $ | 12.65 | $ | 13.13 | $ | 13.27 | $ | 12.43 | $ | 9.99 | ||||||||||
| Income from investment operations:1 | ||||||||||||||||||||
| Net investment income | 0.21 | 0.20 | 0.18 | 0.14 | 0.12 | |||||||||||||||
| Net realized and unrealized gains (losses) on securities | 2.95 | (0.08 | ) | (0.03 | ) | 0.80 | 2.45 | |||||||||||||
| Total from investment operations | 3.16 | 0.12 | 0.15 | 0.94 | 2.57 | |||||||||||||||
| Dividends and distributions: | ||||||||||||||||||||
| Dividends from net investment income | (0.19 | ) | (0.18 | ) | (0.14 | ) | (0.10 | ) | (0.13 | ) | ||||||||||
| Distributions from capital gain | — | (0.42 | ) | (0.15 | ) | — | — | |||||||||||||
| Total dividends and distributions | (0.19 | ) | (0.60 | ) | (0.29 | ) | (0.10 | ) | (0.13 | ) | ||||||||||
| Net asset value, end of year | $ | 15.62 | $ | 12.65 | $ | 13.13 | $ | 13.27 | $ | 12.43 | ||||||||||
| Total return2 | 25.36 | % | 1.04 | % | 1.10 | % | 7.60 | % | 26.10 | % | ||||||||||
| Net assets, end of year (in millions) | $ | 571 | $ | 482 | $ | 498 | $ | 510 | $ | 412 | ||||||||||
| Ratios / Supplemental Data: | ||||||||||||||||||||
| Ratio of expenses to average net assets before reimbursement | 0.73 | % | 0.86 | % | 0.86 | % | 0.85 | % | 0.86 | % | ||||||||||
| Ratio of expenses to average net assets after reimbursement2 | 0.73 | %3 | 0.85 | % | 0.85 | % | 0.85 | %3 | 0.85 | % | ||||||||||
| Ratio of net investment income to average net assets2 | 1.52 | % | 1.64 | % | 1.34 | % | 1.09 | % | 1.09 | % | ||||||||||
| Portfolio turnover rate | 20 | % | 36 | % | 39 | % | 29 | % | 25 | % | ||||||||||
| 1 | Based on average shares outstanding. |
| 2 | Reflects the impact, if any, of certain reimbursements from Capital Guardian Trust Company. |
| 3 | Reimbursement was less than 0.005%. |
| Private Client Services Funds | 129 |
Capital Group International Equity Fund
Financial highlights
(for a share outstanding throughout each year)
| For the year ended | ||||||||||||||||||||
| 10/31/17 | 10/31/16 | 10/31/15 | 10/31/14 | 10/31/13 | ||||||||||||||||
| Selected per share data: | ||||||||||||||||||||
| Net asset value, beginning of year | $ | 11.23 | $ | 11.50 | $ | 11.56 | $ | 11.72 | $ | 9.74 | ||||||||||
| Income from investment operations:1 | ||||||||||||||||||||
| Net investment income | 0.20 | 0.16 | 0.13 | 0.16 | 0.15 | |||||||||||||||
| Net realized and unrealized gains (losses) on securities | 2.42 | (0.30 | ) | (0.05 | ) | (0.23 | ) | 1.88 | ||||||||||||
| Total from investment operations | 2.62 | (0.14 | ) | 0.08 | (0.07 | ) | 2.03 | |||||||||||||
| Dividends and distributions: | ||||||||||||||||||||
| Dividends from net investment income | (0.18 | ) | (0.13 | ) | (0.14 | ) | (0.09 | ) | (0.05 | ) | ||||||||||
| Total dividends and distributions | (0.18 | ) | (0.13 | ) | (0.14 | ) | (0.09 | ) | (0.05 | ) | ||||||||||
| Net asset value, end of year | $ | 13.67 | $ | 11.23 | $ | 11.50 | $ | 11.56 | $ | 11.72 | ||||||||||
| Total return2 | 23.73 | % | (1.20 | )% | 0.69 | % | (0.62 | )% | 20.93 | % | ||||||||||
| Net assets, end of year (in millions) | $ | 1,584 | $ | 1,366 | $ | 1,333 | $ | 1,652 | $ | 989 | ||||||||||
| Ratios / Supplemental Data: | ||||||||||||||||||||
| Ratio of expenses to average net assets before reimbursement | 0.73 | % | 0.85 | % | 0.85 | % | 0.85 | % | 0.85 | % | ||||||||||
| Ratio of expenses to average net assets after reimbursement2 | 0.73 | %3 | 0.85 | %3 | 0.85 | %3 | 0.85 | %3 | 0.85 | %3 | ||||||||||
| Ratio of net investment income to average net assets2 | 1.64 | % | 1.44 | % | 1.11 | % | 1.35 | % | 1.44 | % | ||||||||||
| Portfolio turnover rate | 17 | % | 21 | % | 34 | % | 33 | % | 25 | % | ||||||||||
| 1 | Based on average shares outstanding. |
| 2 | Reflects the impact, if any, of certain reimbursements from Capital Guardian Trust Company. |
| 3 | Reimbursement was less than 0.005%. |
| 130 | Private Client Services Funds |
Capital Group U.S. Equity Fund
Financial highlights
(for a share outstanding throughout each year)
| For the year ended | ||||||||||||||||||||
| 10/31/17 | 10/31/16 | 10/31/15 | 10/31/14 | 10/31/13 | ||||||||||||||||
| Selected per share data: | ||||||||||||||||||||
| Net asset value, beginning of year | $ | 19.78 | $ | 19.88 | $ | 20.11 | $ | 18.33 | $ | 14.75 | ||||||||||
| Income from investment operations:1 | ||||||||||||||||||||
| Net investment income | 0.32 | 0.33 | 0.26 | 0.25 | 0.20 | |||||||||||||||
| Net realized and unrealized gains on securities | 4.02 | 0.55 | 0.46 | 2.05 | 3.61 | |||||||||||||||
| Total from investment operations | 4.34 | 0.88 | 0.72 | 2.30 | 3.81 | |||||||||||||||
| Dividends and distributions: | ||||||||||||||||||||
| Dividends from net investment income | (0.31 | ) | (0.30 | ) | (0.24 | ) | (0.24 | ) | (0.22 | ) | ||||||||||
| Distributions from capital gain | (0.86 | ) | (0.68 | ) | (0.71 | ) | (0.28 | ) | (0.01 | ) | ||||||||||
| Total dividends and distributions | (1.17 | ) | (0.98 | ) | (0.95 | ) | (0.52 | ) | (0.23 | ) | ||||||||||
| Net asset value, end of year | $ | 22.95 | $ | 19.78 | $ | 19.88 | $ | 20.11 | $ | 18.33 | ||||||||||
| Total return2 | 22.76 | % | 4.58 | % | 3.75 | % | 12.78 | % | 26.06 | % | ||||||||||
| Net assets, end of year (in millions) | $ | 236 | $ | 210 | $ | 198 | $ | 192 | $ | 167 | ||||||||||
| Ratios / Supplemental Data: | ||||||||||||||||||||
| Ratio of expenses to average net assets before reimbursement | 0.53 | % | 0.66 | % | 0.67 | % | 0.66 | % | 0.66 | % | ||||||||||
| Ratio of expenses to average net assets after reimbursement2 | 0.52 | % | 0.65 | % | 0.65 | % | 0.65 | % | 0.65 | % | ||||||||||
| Ratio of net investment income to average net assets2 | 1.52 | % | 1.68 | % | 1.31 | % | 1.30 | % | 1.22 | % | ||||||||||
| Portfolio turnover rate | 19 | % | 31 | % | 29 | % | 27 | % | 25 | % | ||||||||||
| 1 | Based on average shares outstanding. |
| 2 | Reflects the impact, if any, of certain reimbursements from Capital Guardian Trust Company. |
| Private Client Services Funds | 131 |
Capital Group Private Client Services Funds
REPORT OF INDEPENDENT REGISTERED PUBLIC ACCOUNTING FIRM
To the Board of Trustees and Shareholders of Capital Group Private Client Services Funds:
We have audited the accompanying statements of assets and liabilities of Capital Group Private Client Services Funds (the “Trust”) comprising the Capital Group Core Municipal Fund, Capital Group Short-Term Municipal Fund, Capital Group California Core Municipal Fund, Capital Group California Short-Term Municipal Fund, Capital Group Core Bond Fund, Capital Group Global Equity Fund, Capital Group International Equity Fund, and Capital Group U.S. Equity Fund, including the schedules of investments, as of October 31, 2017, and the related statements of operations for the year then ended, the statements of changes in net assets for each of the two years in the period then ended, and the financial highlights for each of the five years in the period then ended. These financial statements and financial highlights are the responsibility of the Trust’s management. Our responsibility is to express an opinion on these financial statements and financial highlights based on our audits.
We conducted our audits in accordance with the standards of the Public Company Accounting Oversight Board (United States). Those standards require that we plan and perform the audit to obtain reasonable assurance about whether the financial statements and financial highlights are free of material misstatement. The Trust is not required to have, nor were we engaged to perform, an audit of its internal control over financial reporting. Our audits included consideration of internal control over financial reporting as a basis for designing audit procedures that are appropriate in the circumstances, but not for the purpose of expressing an opinion on the effectiveness of the Trust’s internal control over financial reporting. Accordingly, we express no such opinion. An audit also includes examining, on a test basis, evidence supporting the amounts and disclosures in the financial statements, assessing the accounting principles used and significant estimates made by management, as well as evaluating the overall financial statement presentation. Our procedures included confirmation of securities owned as of October 31, 2017, by correspondence with the custodian and brokers; when replies were not received from brokers, we performed other auditing procedures. We believe that our audits provide a reasonable basis for our opinion.
In our opinion, the financial statements and financial highlights referred to above present fairly, in all material respects, the financial position of Capital Group Private Client Services Funds as of October 31, 2017, the results of their operations for the year then ended, the changes in their net assets for each of the two years in the period then ended, and the financial highlights for each of the five years in the period then ended, in conformity with accounting principles generally accepted in the United States of America.
DELOITTE & TOUCHE LLP
Costa Mesa, California
December 19, 2017
| 132 | Private Client Services Funds |
Capital Group Private Client Services Funds
Tax Information (unaudited)
We are required to advise you of the federal tax status of certain distributions received by shareholders during the fiscal year. The Funds hereby designate the following amounts for the year ended October 31, 2017.
| Capital | ||||||||||||||||
| Group | ||||||||||||||||
| Capital | California | |||||||||||||||
| Group Core | Capital Group | Capital Group | Short-Term | |||||||||||||
| Municipal | Short-Term | California Core | Municipal | |||||||||||||
| Fund | Municipal Fund | Municipal Fund | Fund | |||||||||||||
| Long-term capital gains | $ | 223,000 | $ | — | $ | 324,000 | $ | 52,000 | ||||||||
| Exempt Interest dividends | 100 | % | 99.96 | % | 99.99 | % | 100 | % | ||||||||
| Capital | Capital Group | Capital Group | Capital Group | |||||||||||||
| Group Core | Global Equity | International | U.S. Equity | |||||||||||||
| Bond Fund | Fund | Equity Fund | Fund | |||||||||||||
| Long-term capital gains | $ | 719,000 | $ | 1,663,000 | $ | — | $ | 9,568,000 | ||||||||
| Foreign taxes (per share) | — | 0.02 | 0.03 | — | ||||||||||||
| Foreign source income (per share) | — | 0.21 | 0.31 | — | ||||||||||||
| Qualified dividend income | — | 100 | % | 100 | % | 100 | % | |||||||||
| Corporate dividends received deduction | — | $ | 4,979,000 | — | $ | 3,548,000 | ||||||||||
Individual shareholders should refer to their Form 1099 or other tax information, which will be mailed in January 2018, to determine the calendar year amounts to be included on their 2017 tax returns. Shareholders should consult their tax advisors.
| Private Client Services Funds | 133 |
Capital Group Private Client Services Funds
Expense example (unaudited)
As a shareholder of the funds, you incur ongoing costs, including management fees and other expenses. This example is intended to help you understand your ongoing costs (in dollars) of investing in the funds so you can compare these costs with the ongoing costs of investing in other mutual funds. The example is based on an investment of $1,000 invested at the beginning of the period and held for the entire period (May 1, 2017 through October 31, 2017).
Actual expenses:
The first line of each fund in the table provides information about actual account values and actual expenses. You may use the information in this line, together with the amount you invested, to estimate the expenses that you paid over the period. Simply divide your account value by $1,000 (for example, an $8,600 account value divided by $1,000 = 8.6), then multiply the result by the number in the first line under the heading entitled “Expenses paid during period” to estimate the expenses you paid on your account during this period.
Hypothetical example for comparison purposes:
The second line of each fund in the table provides information about hypothetical account values and hypothetical expenses based on the actual expense ratio for the funds and an assumed rate of return of 5.00% per year before expenses, which is not the actual return of the funds. The hypothetical account values and expenses may not be used to estimate the actual ending account balance or expenses you paid for the period. You may use this information to compare the ongoing costs of investing in the funds and other funds. To do so, compare this 5.00% hypothetical example with the 5.00% hypothetical examples that appear in the shareholder reports of the other funds.
Notes:
Shareholders of the funds may be subject to an additional fee charged by Capital Guardian Trust Company’s Capital Group Private Client Services division for the ongoing services provided to the shareholder. You can estimate the impact of these fees by adding the amount of the fees to the total estimated expenses you paid on your account during the period as calculated above. In addition, your ending account value would be lower by the amount of these fees. Note that the expenses shown in the table are meant to highlight your ongoing costs only. The second line of each fund in the table is useful in comparing ongoing costs only and will not help you determine the relative total costs of owning different funds.
| Beginning | Ending | Expenses | ||||||||||||||
| account | account | paid | Annualized | |||||||||||||
| value | value | during | expense | |||||||||||||
| 5/1/2017 | 10/31/2017 | period* | ratio | |||||||||||||
| Capital Group Core Municipal Fund | ||||||||||||||||
| actual return | $ | 1,000.00 | $ | 1,015.00 | $ | 1.52 | 0.30 | % | ||||||||
| assumed 5% return | 1,000.00 | 1,023.70 | 1.53 | 0.30 | % | |||||||||||
| Capital Group Short-Term Municipal Fund | ||||||||||||||||
| actual return | 1,000.00 | 1,009.70 | 1.57 | 0.31 | % | |||||||||||
| assumed 5% return | 1,000.00 | 1,023.60 | 1.58 | 0.31 | % | |||||||||||
| Capital Group California Core Municipal Fund | ||||||||||||||||
| actual return | 1,000.00 | 1,013.90 | 1.52 | 0.30 | % | |||||||||||
| assumed 5% return | 1,000.00 | 1,023.70 | 1.53 | 0.30 | % | |||||||||||
| Capital Group California Short-Term Municipal Fund | ||||||||||||||||
| actual return | 1,000.00 | 1,007.80 | 1.52 | 0.30 | % | |||||||||||
| assumed 5% return | 1,000.00 | 1,023.70 | 1.53 | 0.30 | % | |||||||||||
| Capital Group Core Bond Fund | ||||||||||||||||
| actual return | 1,000.00 | 1,007.40 | 1.52 | 0.30 | % | |||||||||||
| assumed 5% return | 1,000.00 | 1,023.70 | 1.53 | 0.30 | % | |||||||||||
| 134 | Private Client Services Funds |
Capital Group Private Client Services Funds
Expense example (unaudited) (continued)
| Beginning | Ending | Expenses | ||||||||||||||
| account | account | paid | Annualized | |||||||||||||
| value | value | during | expense | |||||||||||||
| 5/1/2017 | 10/31/2017 | period* | ratio | |||||||||||||
| Capital Group Global Equity Fund | ||||||||||||||||
| actual return | 1,000.00 | 1,121.30 | 3.48 | 0.65 | % | |||||||||||
| assumed 5% return | 1,000.00 | 1,021.90 | 3.31 | 0.65 | % | |||||||||||
| Capital Group International Equity Fund | ||||||||||||||||
| actual return | 1,000.00 | 1,124.20 | 3.48 | 0.65 | % | |||||||||||
| assumed 5% return | 1,000.00 | 1,021.90 | 3.31 | 0.65 | % | |||||||||||
| Capital Group U.S. Equity Fund | ||||||||||||||||
| actual return | 1,000.00 | 1,085.20 | 2.26 | 0.43 | % | |||||||||||
| assumed 5% return | 1,000.00 | 1,023.00 | 2.19 | 0.43 | % | |||||||||||
| * | Expenses are equal to the fund’s annualized expense ratio as indicated, multiplied by the average account value over the period, multiplied by 184/365 (to reflect the one-half year period). |
| Private Client Services Funds | 135 |
Capital Group Private Client Services Funds
Trustees and other officers
“Independent” Trustees1
| Name, year of birth and position with funds | Year first elected as a trustee2 | Principal occupation(s) during the past five years | Number of portfolios overseen in fund complex by trustee | Other directorships3 held by trustee | ||||
| Joseph C. Berenato, 1946 | 2015 | Former Chairman and CEO, Ducommun Incorporated (aerospace components manufacturer) | 16 | None | ||||
| Richard G. Capen, Jr., 1934 | 2009 | Corporate director and author | 10 | None | ||||
| Vanessa C. L. Chang, 1952 | 2015 | Director, EL & EL Investments (real estate) | 17 | Edison International; Sykes Enterprises; Transocean Ltd. | ||||
| H. Frederick Christie, 1933 | 2009 | Private investor | 10 | None | ||||
| Richard G. Newman, 1934 Chairman of the Board (Independent and Non- Executive) | 2009 | Founder and Chairman Emeritus, AECOM Technology Corporation (global engineering, consulting and professional technical services) | 10 | None |
| 136 | Private Client Services Funds |
Capital Group Private Client Services Funds
Trustees and other officers
“Interested” trustees4
Interested trustees have similar qualifications, skills and attributes as the independent trustees. Interested trustees are senior executive officers of Capital Guardian Trust Company or its affiliates. This management role with the funds’ service providers also permits them to make a significant contribution to the funds’ board.
| Name, year of birth and position with funds | Year first elected as a director/officer2 | Principal occupation(s) during the past five years and positions held with affiliated entities or the Principal Underwriter of the funds | Number of portfolios overseen in fund complex by trustee | Other directorships3 held by trustee | ||||
| Paul F. Roye, 1953 Vice Chairman of the Board | 2009 | Senior Vice President and Senior Counsel – Fund Business Management Group, Capital Research and Management Company6 Director – Capital Research and Management Company6 | 11 | None |
| Private Client Services Funds | 137 |
Capital Group Private Client Services Funds
Trustees and other officers
Other officers5
| Name, year of birth and position with funds | Year first elected an officer2 | Principal occupation(s) during the past five years and positions held with affiliated entities or the Principal Underwriter of the funds | ||
| John S. Armour, 1957 President | 2013 | President – Private Client Services Division, Capital Bank and Trust Company6 | ||
Aaron Applebaum, 1961 Senior Vice President | 2017 | Partner - Capital Fixed Income Investors, Capital Research and Management Company6 | ||
| Mark Marinella, 1958 Senior Vice President | 2016 | Vice President – Capital Fixed Income Investors, Capital Research and Management Company6 | ||
| John R. Queen, 1965 Senior Vice President | 2009 | Senior Vice President – Private Client Services Division, Capital Bank and Trust Company6; Vice President – Capital Fixed Income Investors, Capital Research and Management Company6 | ||
| William L. Robbins, 1968 Senior Vice President | 2014 | Partner– Capital International Investors, Capital Research and Management Company6 | ||
| Timothy W. McHale, 1978 Vice President | 2009 | Vice President and Senior Counsel – Fund Business Management Group, Capital Research and Management Company6; Secretary – American Funds Distributors, Inc.6 | ||
| Courtney R. Taylor, 1975 Secretary | 2009 | Assistant Vice President – Fund Business Management Group, Capital Research and Management Company6 | ||
| Gregory F. Niland, 1971 Treasurer | 2014 | Vice President – Investment Operations, Capital Research and Management Company6 | ||
| Susan K. Countess, 1966 Assistant Secretary | 2012 | Associate – Fund Business Management Group, Capital Research and Management Company6 | ||
| Brian Janssen, 1972 Assistant Treasurer | 2014 | Vice President – Investment Operations, Capital Research and Management Company6 |
| 1 | The term “independent” trustee refers to a trustee who is not an “interested person” of the funds within the meaning of the Investment Company Act of 1940. |
| 2 | Trustees and officers of the funds serve until their resignation, removal or retirement. |
| 3 | This includes all directorships (other than the funds) that are held by each trustee as a director of a public company or a registered investment company. Unless otherwise noted, all directorships are current. |
| 4 | The term “interested” trustee refers to a trustee who is an “interested person” of the funds within the meaning of the 1940 Act, on the basis of his or her affiliation with the funds’ investment adviser, Capital Guardian Trust Company, or affiliated entities (including the funds’ principal underwriter). |
| 5 | All of the officers listed, except Mark Marinella and William L. Robbins, are officers of one or more of the other funds for which Capital Guardian Trust Company serves as Investment Adviser. |
| 6 | Company affiliated with Capital Guardian Trust Company. |
The funds’ statement of additional information includes further details about fund trustees and is available without charge upon request by calling Capital Group Private Client Services at 800-421-4996 or by visiting the funds website at capitalpcsfunds.com. The address for all trustees and officers of the funds is 333 South Hope Street, 55th Floor, Los Angeles, California 90071, Attention: Secretary.
| 138 | Private Client Services Funds |
Capital Group Private Client Services Funds
| Offices of the funds |
| Capital Guardian Trust Company |
| 6455 Irvine Center Drive |
| Irvine, CA 92618 |
| Offices of the investment adviser |
| Capital Guardian Trust Company |
| 333 South Hope Street |
| Los Angeles, CA 90071-1406 |
| Custodian of assets |
| State Street Bank and Trust Company |
| One Lincoln Street |
| Boston, MA 02111 |
| Independent registered public accounting firm |
| Deloitte & Touche LLP |
| 695 Town Center Drive |
| Costa Mesa, CA 92626 |
| Transfer agent |
| State Street Bank and Trust Company |
| One Lincoln Street |
| Boston, MA 02111 |
| Counsel |
| Morgan, Lewis & Bockius LLP |
| 300 South Grand Avenue, Twenty-Second Floor |
| Los Angeles, CA 90071-3132 |
| Principal underwriter |
| American Funds Distributors, Inc. |
| 333 South Hope Street |
| Los Angeles, CA 90071-1406 |
Investors should carefully consider the investment objectives, risks, charges and expenses of Capital Group Private Client Services Funds. This and other important information is contained in the funds’ prospectus, which can be obtained from your Capital Group Private Client Services representative and should be read carefully before investing. You may also call Capital Group Private Client Services at 800-421-4996 to obtain a copy of the prospectus.
The proxy voting procedures and principles of Capital Group Private Client Services Funds, which describe how we vote proxies relating to portfolio securities, is available upon request by calling Capital Group Private Client Services at 800-421-4996. The funds file their proxy voting records with the SEC for the 12 months ended June 30 by August 31. The report also is available on the SEC website at http://www.sec.gov or by calling Capital Group Private Client Services at 800-421-4996.
Capital Group Private Client Services Funds files a complete list of its portfolio holdings with the SEC for the first and third quarters of each fiscal year on Form N-Q. The funds’ forms N-Q are available on the SEC’s website at http://www.sec.gov. You may also review or, for a fee, copy this filing at the SEC’s Public Reference Room in Washington, D.C. Additional information regarding the operation of the Public Reference Room may be obtained by calling the SEC’s Office of Investor Education and Advocacy at 800-SEC-0330. Additionally, the list of portfolio holdings is available by calling Capital Group Private Client Services at 800-421-4996.
| Private Client Services Funds | 139 |
ITEM 2 – Code of Ethics
The Registrant has adopted a Code of Ethics that applies to its Principal Executive Officer and Principal Financial Officer. The Registrant undertakes to provide to any person without charge, upon request, a copy of the Code of Ethics. Such request can be made to American Funds Service Company at 800/421-9225 or to the Secretary of the Registrant, 6455 Irvine Center Drive, Irvine, California 92618.
ITEM 3 – Audit Committee Financial Expert
The Registrant’s board has determined that Vanessa C. L. Chang, a member of the Registrant’s audit committee, is an “audit committee financial expert” and "independent," as such terms are defined in this Item. This designation will not increase the designee’s duties, obligations or liability as compared to his or her duties, obligations and liability as a member of the audit committee and of the board, nor will it reduce the responsibility of the other audit committee members. There may be other individuals who, through education or experience, would qualify as "audit committee financial experts" if the board had designated them as such. Most importantly, the board believes each member of the audit committee contributes significantly to the effective oversight of the Registrant’s financial statements and condition.
ITEM 4 – Principal Accountant Fees and Services
| Registrant: | |||
| a) Audit Fees: | |||
| 2016 | $260,000 | ||
| 2017 | $267,000 | ||
| b) Audit-Related Fees: | |||
| 2016 | None | ||
| 2017 | None | ||
| c) Tax Fees: | |||
| 2016 | $58,000 | ||
| 2017 | $65,000 | ||
| The tax fees consist of professional services relating to the preparation of the Registrant’s tax returns. | |||
| d) All Other Fees: | |||
| 2016 | None | ||
| 2017 | None | ||
| Adviser and affiliates (includes only fees for non-audit services billed to the adviser and affiliates for engagements that relate directly to the operations and financial reporting of the Registrant and were subject to the pre-approval policies described below): | |||
| a) Audit Fees: | |||
| Not Applicable | |||
| b) Audit-Related Fees: | |||
| 2016 | $78,000 | ||
| 2017 | $8,000 | ||
| The audit-related fees consist of assurance and related services relating to the examination of the Registrant’s transfer agent, principal underwriter and investment adviser conducted in accordance with Statement on Standards for Attestation Engagements Number 16 issued by the American Institute of Certified Public Accountants. | |||
| c) Tax Fees: | |||
| Not Applicable | |||
| d) All Other Fees: | |||
| Not Applicable | |||
| All audit and permissible non-audit services that the Registrant’s audit committee considers compatible with maintaining the independent registered public accounting firm’s independence are required to be pre-approved by the committee. The pre-approval requirement will extend to all non-audit services provided to the Registrant, the investment adviser, and any entity controlling, controlled by, or under common control with the investment adviser that provides ongoing services to the Registrant, if the engagement relates directly to the operations and financial reporting of the Registrant. The committee will not delegate its responsibility to pre-approve these services to the investment adviser. The committee may delegate to one or more committee members the authority to review and pre-approve audit and permissible non-audit services. Actions taken under any such delegation will be reported to the full committee at its next meeting. The pre-approval requirement is waived with respect to non-audit services if certain conditions are met. The pre-approval requirement was not waived for any of the non-audit services listed above provided to the Registrant, adviser and affiliates. | |||
| Aggregate non-audit fees paid to the Registrant’s auditors, including fees for all services billed to the Registrant, adviser and affiliates that provide ongoing services to the Registrant, were $209,000 for fiscal year 2016 and $118,000 for fiscal year 2017. The non-audit services represented by these amounts were brought to the attention of the committee and considered to be compatible with maintaining the auditors’ independence. | |||
ITEM 5 – Audit Committee of Listed Registrants
Not applicable to this Registrant, insofar as the Registrant is not a listed issuer as defined in Rule 10A-3 under the Securities Exchange Act of 1934.
ITEM 6 – Schedule of Investments
Not applicable, insofar as the schedule is included as part of the report to shareholders filed under Item 1 of this Form.
ITEM 7 – Disclosure of Proxy Voting Policies and Procedures for Closed-End Management Investment Companies
Not applicable to this Registrant, insofar as the Registrant is not a closed-end management investment company.
ITEM 8 – Portfolio Managers of Closed-End Management Investment Companies
Not applicable to this Registrant, insofar as the Registrant is not a closed-end management investment company.
ITEM 9 – Purchases of Equity Securities by Closed-End Management Investment Company and Affiliated Purchasers
Not applicable to this Registrant, insofar as the Registrant is not a closed-end management investment company.
ITEM 10 – Submission of Matters to a Vote of Security Holders
There have been no material changes to the procedures by which shareholders may recommend nominees to the Registrant’s board of trustees since the Registrant last submitted a proxy statement to its shareholders. The procedures are as follows. The Registrant has a nominating committee comprised solely of persons who are not considered ‘‘interested persons’’ of the Registrant within the meaning of the Investment Company Act of 1940, as amended. The committee periodically reviews such issues as the board’s composition, responsibilities, committees, compensation and other relevant issues, and recommends any appropriate changes to the full board of trustees. While the committee normally is able to identify from its own resources an ample number of qualified candidates, it will consider shareholder suggestions of persons to be considered as nominees to fill future vacancies on the board. Such suggestions must be sent in writing to the nominating committee of the Registrant, c/o the Registrant’s Secretary, and must be accompanied by complete biographical and occupational data on the prospective nominee, along with a written consent of the prospective nominee for consideration of his or her name by the nominating committee.
ITEM 11 – Controls and Procedures
| (a) | The Registrant’s Principal Executive Officer and Principal Financial Officer have concluded, based on their evaluation of the Registrant’s disclosure controls and procedures (as such term is defined in Rule 30a-3 under the Investment Company Act of 1940), that such controls and procedures are adequate and reasonably designed to achieve the purposes described in paragraph (c) of such rule. |
| (b) | There were no changes in the Registrant’s internal controls over financial reporting (as defined in Rule 30a-3(d) under the Investment Company Act of 1940) that occurred during the Registrant’s second fiscal quarter of the period covered by this report that has materially affected, or is reasonably likely to materially affect, the Registrant’s internal control over financial reporting. |
ITEM 12 – Exhibits
| (a)(1) | The Code of Ethics that is the subject of the disclosure required by Item 2 is attached as an exhibit hereto. |
| (a)(2) | The certifications required by Rule 30a-2 of the Investment Company Act of 1940 and Sections 302 and 906 of the Sarbanes-Oxley Act of 2002 are attached as exhibits hereto. |
SIGNATURES
Pursuant to the requirements of the Securities Exchange Act of 1934 and the Investment Company Act of 1940, the Registrant has duly caused this report to be signed on its behalf by the undersigned, thereunto duly authorized.
| CAPITAL GROUP PRIVATE CLIENT SERVICES FUNDS | |
| By /s/ John S. Armour | |
John S. Armour, President and Principal Executive Officer | |
| Date: December 29, 2017 |
Pursuant to the requirements of the Securities Exchange Act of 1934 and the Investment Company Act of 1940, this report has been signed below by the following persons on behalf of the Registrant and in the capacities and on the dates indicated.
| By /s/ John S. Armour |
John S. Armour, President and Principal Executive Officer |
| Date: December 29, 2017 |
| By /s/ Gregory F. Niland |
Gregory F. Niland, Treasurer and Principal Financial Officer |
| Date: December 29, 2017 |