UNITED STATES
SECURITIES AND EXCHANGE COMMISSION
Washington, D.C. 20549
FORM N-CSR
Certified Shareholder Report of
Registered Management Investment Companies
Investment Company Act File Number: 811-22349
Capital Group Private Client Services Funds
(Exact Name of Registrant as Specified in Charter)
6455 Irvine Center Drive
Irvine, California 92618
(Address of Principal Executive Offices)
Registrant's telephone number, including area code: (213) 486-9200
Date of fiscal year end: October 31
Date of reporting period: October 31, 2018
Courtney R. Taylor
Capital Group Private Client Services Funds
333 South Hope Street
Los Angeles, California 90071
(Name and Address of Agent for Service)
ITEM 1 – Reports to Stockholders
Capital Group Core Municipal FundSM Capital Group Short-Term Municipal FundSM Capital Group California Core Municipal FundSM Capital Group California Short-Term Municipal FundSM Capital Group Core Bond FundSM
Capital Group Global Equity FundSM Capital Group International Equity FundSM Capital Group U.S. Equity FundSM |
Annual report for the year ended October 31, 2018

In-depth research
and a global
investment
perspective can
lead to strong
long-term outcomes.
Beginning January 1, 2021, as permitted by regulations adopted by the Securities and Exchange Commission, we intend to no longer mail paper copies of the fund’s shareholder reports, unless specifically requested from the funds or your financial intermediary, such as a broker-dealer or bank. Instead, the reports will be made available on the fund’s website (capitalgrouppcsfunds.com); you will be notified by mail and provided with a website link to access the report each time a report is posted.
You may elect to receive paper copies of all future reports free of charge. If you invest through a financial intermediary, you may contact your financial intermediary to request that you continue to receive paper copies of your shareholder reports. If you invest directly with the fund, you may inform the funds that you wish to continue receiving paper copies of your shareholder reports by contacting us at (800) 421-4225. Your election to receive reports in paper will apply to all funds held with the fund’s transfer agent or through your financial intermediary.
Capital Group Core Municipal Fund seeks to provide current income exempt from federal income tax while preserving your investment.
Capital Group Short-Term Municipal Fund seeks to preserve your investment and secondarily to provide current income exempt from federal income tax.
Capital Group California Core Municipal Fund seeks to provide current income exempt from federal and California income taxes while preserving your investment.
Capital Group California Short-Term Municipal Fund seeks to preserve your investment and secondarily to provide current income exempt from federal and California income taxes.
Capital Group Core Bond Fund seeks to provide you with current income while preserving your investment.
Capital Group Global Equity Fund seeks to provide prudent growth of capital and conservation of principal.
Capital Group International Equity Fund seeks to provide prudent growth of capital and conservation of principal.
Capital Group U.S. Equity Fund seeks to provide prudent growth of capital and conservation of principal.
Each fund is one of more than 40 offered by Capital Group, home of American Funds, one of the nation’s largest mutual fund families. For more than 85 years, Capital Group has invested with a long-term focus based on thorough research and attention to risk.
Fund results shown in this report are at net asset value. Results are for past periods and are not predictive of results for future periods. Current and future results may be lower or higher than those shown. Share prices and returns will vary, so investors may lose money. Investing for short periods makes losses more likely.
Here are the total returns on a $1,000 investment with all distributions reinvested for periods ended September 30, 2018 (the most recent calendar quarter-end), and the total annual fund operating expense ratios as of the prospectus dated January 1, 2019 (unaudited):
| Cumulative total returns | Average annual total returns | Gross | Net | |||||||||||||||||
| 1 year | 5 years | Lifetime* | expense ratios | expense ratios | ||||||||||||||||
| Capital Group Core Municipal Fund | –0.03 | % | 1.70 | % | 2.29 | % | 0.27 | % | 0.27 | % | ||||||||||
| Capital Group Short-Term Municipal Fund | 0.16 | 0.93 | 1.29 | 0.32 | 0.30 | |||||||||||||||
| Capital Group California Core Municipal Fund | 0.20 | 2.05 | 2.43 | 0.27 | 0.27 | |||||||||||||||
| Capital Group California Short-Term Municipal Fund | –0.05 | 0.83 | 1.11 | 0.31 | 0.30 | |||||||||||||||
| Capital Group Core Bond Fund | –0.85 | 1.24 | 2.02 | 0.28 | 0.28 | |||||||||||||||
| Capital Group Global Equity Fund | 11.43 | 9.22 | 8.90 | 0.67 | 0.65 | |||||||||||||||
| Capital Group International Equity Fund | 4.12 | 5.13 | 5.38 | 0.67 | 0.65 | |||||||||||||||
| Capital Group U.S. Equity Fund | 14.07 | 11.87 | 11.11 | 0.45 | 0.43 | |||||||||||||||
| * | Since 4/13/10, except since 4/1/11 for Capital Group Global Equity Fund, Capital Group International Equity Fund and Capital Group U.S. Equity Fund. |
When applicable, investment results reflect fee waivers and/or expense reimbursements, without which results would have been lower. The investment adviser is currently reimbursing a portion of other expenses for the funds. Investment results and the net expense ratio reflect the reimbursement, without which the results would have been lower and the expense ratio would have been higher. This reimbursement will be in effect through at least January 1, 2020, unless modified or terminated by the fund’s board. The adviser may elect at its discretion to extend, modify or terminate the reimbursement at that time.
Investments are not FDIC-insured, nor are they deposits of or guaranteed by a bank or any other entity, so they may lose value.
Global equities inched narrowly higher in the 12 months ended October 31, 2018, as a rally throughout much of the period was counterbalanced by intermittent bouts of selling, including a notable downdraft in the final month. In the U.S., equities gained ground as low unemployment, rising wages and vibrant consumer confidence were buoyed by tax cuts and increased federal spending. However, rising bond yields and concerns about the valuations of prominent technology stocks contributed to the late-period selloff.
Equity weakness was most pronounced overseas as hopes for a synchronized global expansion gave way to renewed jitters about growth in Europe and China. European stocks were hamstrung by currency trends, economic sluggishness and political flare-ups. China fell into a bear market amid softening economic growth and the specter of a prolonged showdown with the U.S. over international trade.
Fixed income markets were affected by rising interest rates, with the Federal Reserve tightening credit in response to robust economic conditions. Bond yields rose early in the year as signs of synchronized global growth emerged, and again toward the end of the period as the U.S. economy raced ahead. The Fed is expected to continue tightening, though at a gradual pace with rates remaining low by historical standards.
Fixed income commentary
The Capital Group Core Municipal, Short-Term Municipal and California Core Municipal funds outpaced their respective benchmarks. The Capital Group Core Bond and California Short-Term Municipal funds trailed their benchmarks.
Capital Group Core Municipal Fund and Capital Group Short-Term Municipal Fund
The Core Municipal Fund declined 0.32%, slightly exceeding its benchmark, which declined 0.46%. The fund invests in a range of high-quality revenue bonds, which are issued to finance public-related services such as roads, bridges, airports and schools. Roughly 19% of the fund’s assets were in housing-related securities, with 11% in health care.
The Short-Term Municipal Fund rose 0.05% compared to the 0.02% decline of its benchmark. Nearly 30% of the fund’s assets were in housing-related securities, with a further 8% in health care. Compared to its benchmark, the fund was slightly overweight tobacco, transportation and utilities.
Capital Group California Core Municipal Fund and Capital Group California Short-Term Municipal Fund
The California Core Municipal Fund fell 0.27%, compared to a decline of 0.42% in its benchmark. The fund had overweight positions in education and health care securities. It was underweight transportation and utilities.
The California Short-Term Municipal Fund dropped 0.07%, compared to a decline of 0.03% in its benchmark. The fund had nearly one-quarter of its assets in tax-related holdings, including tax allocation securities, which are often issued to finance redevelopment projects. An additional 19% of assets were in general obligation bonds, and nearly 10% in health-related securities.
Capital Group Core Bond Fund
On a total return basis, the Core Bond Fund dropped 1.14%, compared to the decline of 1.02% in its benchmark. The fund had an underweight position in U.S. Treasuries and a slight underweight in investment-grade corporate bonds. It was overweight asset-backed securities, whose repayment streams are tied to mortgages, credit cards and auto loans.
Managers have emphasized caution and avoided taking undue credit or market risks. They have been drawn to high-quality securities and shorter durations to
| Private Client Services Funds | 1 |
help minimize the potential impact of adverse market shifts.
The fixed income market may undergo volatility in the coming year if the Federal Reserve continues to raise short-term interest rates in response to U.S. economic conditions. However, bonds remain a fundamental element of well-balanced portfolios regardless of market conditions. Bonds can generate income and offer diversification from equities, which are especially important at a time of uncertainty in the global economy.
Equity commentary
Over the past 12 months, the Capital Group Global Equity Fund advanced 0.25%, slightly behind the 1.15% gain in its benchmark, the MSCI World Index. The Capital Group International Equity Fund declined 6.09%, outpacing its benchmark, the MSCI EAFE Index, which fell 6.85%. The Capital Group U.S. Equity Fund rose 5.30%, shy of the 7.35% gain in the S&P 500 Index.
Capital Group Global Equity Fund
The fund was boosted partially by technology and Internet-related companies with vibrant earnings and global footprints. GoDaddy, an Internet domain registrar and web hosting company, reported positive earnings thanks to heavy demand for web design and management services. Financial exchange operator CME Group was helped by increased volatility in the financial markets as well as a secular expansion in the demand for data and analytical services.
Financial payments giant Visa reported strong results as the global surge in travel and consumer spending spurred credit and debit card activity. The growth in air travel also propelled Safran, a French aircraft engineering company, as carriers increased capacity during an aerospace upgrade cycle. Online juggernaut Amazon registered strong results in its traditional online retail business and its cloud computing division.
On the flip side, results were weighed down by declines at a variety of companies, some due to industry dynamics and others because of business-specific ailments. Two energy-related companies depressed results as capital spending by major oil companies remained subdued despite the rebound in oil prices. That affected equipment and services providers. Shares of Enbridge fell as the pipeline company endured a series of delays in a planned transmission expansion. Oilfield services giant Schlumberger was squeezed by the reluctance of large oil companies to step up infrastructure spending.
Incyte, a biopharmaceutical company specializing in oncology-related research, wrestled with poor results of a cancer therapy that halted clinical trials. Shares of Micro Focus International, a software and information technology company, were trampled by an earnings warning and the unexpected resignation of its chief executive. Cigarette maker British American Tobacco endured falling cigarette demand and concerns about increased regulation by the U.S. Food and Drug Administration.
Capital Group International Equity Fund
International stocks were knocked off stride by disappointing economic data as growth in the eurozone throttled back from its late-2017 pace. Stocks were also dragged down by renewed political turmoil across much of the continent, including economic powerhouse Germany, which revived fears of populist movements hobbling regulatory reforms and economic progress. There were some positive signs as the eurozone labor market tightened and wage growth picked up. But the near-term outlook was clouded by slack global demand, the chronic troubles of countries such as Italy, and the scuffle with the U.S. over trade.
Companies across a variety of industries contributed to results. Safran rode an aerospace upgrade cycle as carriers increased capacity in response to the global travel boom. Shares of AstraZeneca moved higher as the U.K.-based pharmaceutical company’s Imfinzi oncological compound gained regulatory approval in Japan. Satellite operator SES outlined plans to expand its network
| 2 | Private Client Services Funds |
business to complement its traditional broadcast operations.
MercadoLibre, an Argentinian company that operates e-commerce websites and electronic auctions, benefited from the steady expansion of Latin America’s e-commerce market to grow at a notably faster rate than its competitors. The fund was also positively impacted by a modest cash position, which can act as a counterbalance during a declining market.
On the downside, shares of Micro Focus International plummeted as the company lowered earnings guidance, triggering the unexpected resignation of its chief executive. British American Tobacco was affected by falling cigarette demand and increased regulations by the U.S. Food and Drug Administration.
Genmab, a Danish biotechnology company, was weighed down by disappointing progress in its non-Hodgkin lymphoma drug. SMC, which makes compressed-air components used in manufacturing, was set back by currency effects and global trade tensions that cast a shadow over its manufacturing facilities in China. Vodafone, an international telecommunications company, was hurt by intensifying competition across a number of markets.
Capital Group U.S. Equity Fund
The fund was paced by gains in technology and Internet-related companies, as investors were drawn to businesses with strong earnings growth and promising long-term prospects in areas such as data analysis, cloud computing and artificial intelligence. The top contributor to results was Jack Henry & Associates, a provider of information technology to the financial services industry that benefited from strong earnings and lower corporate tax rates. Profits also rose at Visa thanks to a global surge in travel and consumer spending.
Other contributors included Microsoft, which advanced as revenue at the company’s cloud computing division surpassed that of its traditional software licensing operation. CME Group benefited from increased volatility in the financial markets as well as a secular expansion in the demand for data and analytical services. Amazon registered strong growth in both its online retail business and its cloud computing unit. Though the long-term outlook for the technology sector remained encouraging, the fund took profits in some holdings and lightened exposure overall as share prices and valuations swelled.
On the downside, the fund was negatively impacted by Newell Brands. The consumer goods conglomerate struggled with a bungled acquisition, a bitter clash with activist investors and sharply decreased sales brought on partly by shifting consumer spending habits. Incyte was stung by poor results of a cancer therapy that halted clinical trials. Insurance provider Chubb was affected by reports that Amazon is considering a plan to enter the home insurance business.
A pair of energy-related companies detracted from results as oil prices rebounded from their extended lows, but spending plans and budgets continued to fluctuate due to ongoing uncertainty about the recovery’s durability. Shares of Enbridge were hurt by a series of delays in a planned pipeline expansion. Schlumberger was burdened by the reluctance of large energy companies to step up infrastructure spending.
We thank you for the trust you have placed in us and for your continued investment in the fund, and look forward to reporting to you again in six months.
Sincerely,

John S. Armour
President
December 17, 2018
| Private Client Services Funds | 3 |
Capital Group Core Municipal Fund October 31, 2018
How a $25,000 investment has grown
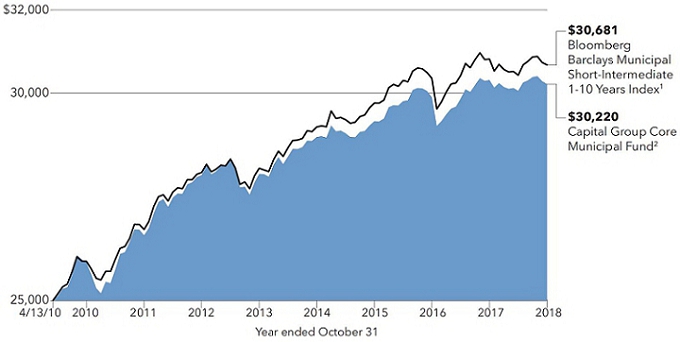
| 1 | Bloomberg Barclays Municipal Short-Intermediate 1-10 Years Index is a market value-weighted index that includes investment-grade tax-exempt bonds with maturities of one to 10 years. This index is unmanaged, and its results include reinvested distributions but do not reflect the effect of sales charges, commissions, account fees, expenses or U.S. federal income taxes. Investors cannot invest directly in an index. Source: Bloomberg Index Services Ltd. |
| 2 | Includes reinvested dividends and capital gain distributions. |
Results are for past periods and are not predictive of results for future periods. Current and future results may be lower or higher than those shown. Share price and returns will vary so investors may lose money. The results shown are before taxes on fund distributions and sale of fund shares.
Average annual total returns based on a $25,000 investment
For periods ended October 31, 2018
| 1 year | 5 years | Lifetime | ||||
| Capital Group Core Municipal Fund | –0.32% | 1.50% | 2.24% |
| Portfolio quality summary* | Percent of net assets |
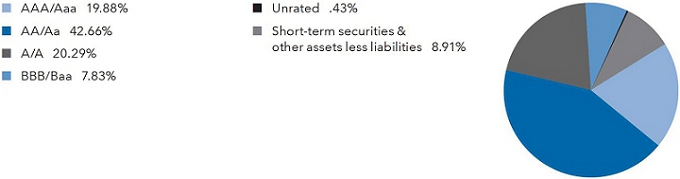
| * | Bond ratings, which typically range from AAA/Aaa (highest) to D (lowest), are assigned by credit rating agencies such as Standard & Poor’s, Moody’s and/or Fitch as an indication of an issuer’s creditworthiness. In assigning a credit rating to a security, the fund looks specifically to the ratings assigned to the issuer of the security by Standard & Poor’s, Moody’s and/or Fitch. If agency ratings differ, the security will be considered to have received the highest of those ratings, consistent with the fund’s investment policies. Securities in the “unrated” category (above) have not been rated by a rating agency; however, the investment adviser performs its own credit analysis and assigns comparable ratings that are used for compliance with the fund’s investment policies. The ratings are not covered by the Report of Independent Registered Public Accounting Firm. |
| 4 | Private Client Services Funds |
Capital Group Short-Term Municipal Fund October 31, 2018
How a $25,000 investment has grown
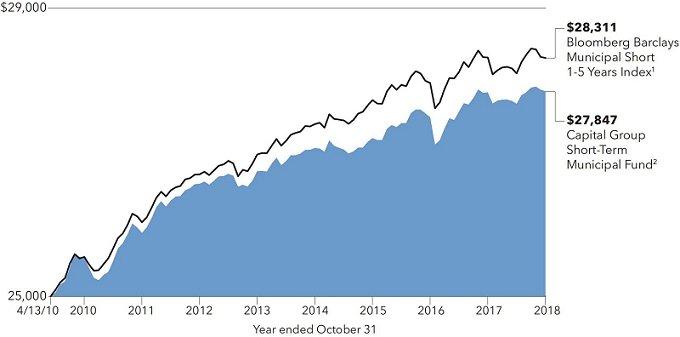
| 1 | Bloomberg Barclays Municipal Short 1-5 Years Index is a market value-weighted index that includes investment-grade tax-exempt bonds with maturities of one to five years. This index is unmanaged, and its results include reinvested distributions but do not reflect the effect of sales charges, commissions, account fees, expenses or U.S. federal income taxes. Investors cannot invest directly in an index. Source: Bloomberg Index Services Ltd. |
| 2 | Includes reinvested dividends and capital gain distributions. |
Results are for past periods and are not predictive of results for future periods. Current and future results may be lower or higher than those shown. Share price and returns will vary so investors may lose money. The results shown are before taxes on fund distributions and sale of fund shares.
Average annual total returns based on a $25,000 investment
For periods ended October 31, 2018
| 1 year | 5 years | Lifetime | ||||
| Capital Group Short-Term Municipal Fund | 0.05% | 0.82% | 1.27% |
| Portfolio quality summary* | Percent of net assets |
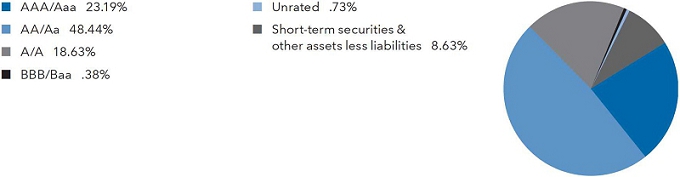
| * | Bond ratings, which typically range from AAA/Aaa (highest) to D (lowest), are assigned by credit rating agencies such as Standard & Poor’s, Moody’s and/or Fitch as an indication of an issuer’s creditworthiness. In assigning a credit rating to a security, the fund looks specifically to the ratings assigned to the issuer of the security by Standard & Poor’s, Moody’s and/or Fitch. If agency ratings differ, the security will be considered to have received the highest of those ratings, consistent with the fund’s investment policies. Securities in the “unrated” category (above) have not been rated by a rating agency; however, the investment adviser performs its own credit analysis and assigns comparable ratings that are used for compliance with the fund’s investment policies. The ratings are not covered by the Report of Independent Registered Public Accounting Firm. |
| Private Client Services Funds | 5 |
Capital Group California Core Municipal Fund October 31, 2018
How a $25,000 investment has grown
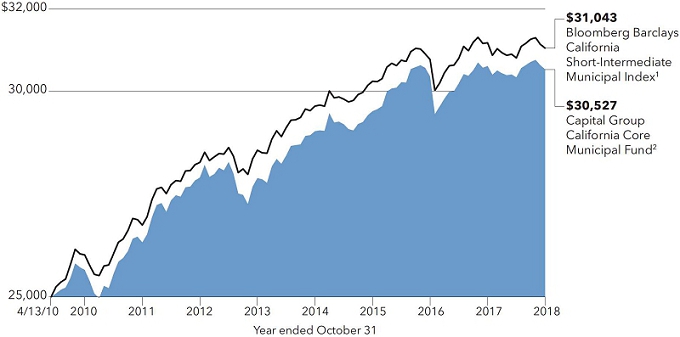
| 1 | Bloomberg Barclays California Short-Intermediate Municipal Index is a market value-weighted index that includes only investment grade tax-exempt bonds that are issued from California with maturities of one to 10 years. This index is unmanaged, and its results include reinvested distributions but do not reflect the effect of commissions, account fees, expenses or U.S. federal income taxes. Investors cannot invest directly in an index. Source: Bloomberg Index Services Ltd. |
| 2 | Includes reinvested dividends and capital gain distributions. |
Results are for past periods and are not predictive of results for future periods. Current and future results may be lower or higher than those shown. Share price and returns will vary so investors may lose money. The results shown are before taxes on fund distributions and sale of fund shares.
Average annual total returns based on a $25,000 investment
For periods ended October 31, 2018
| 1 year | 5 years | Lifetime | ||||
| Capital Group California Core Municipal Fund | –0.27% | 1.83% | 2.36% |
| Portfolio quality summary* | Percent of net assets |
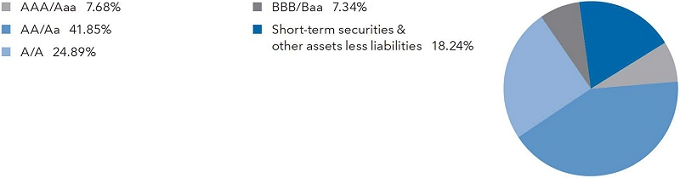
| * | Bond ratings, which typically range from AAA/Aaa (highest) to D (lowest), are assigned by credit rating agencies such as Standard & Poor’s, Moody’s and/or Fitch as an indication of an issuer’s creditworthiness. In assigning a credit rating to a security, the fund looks specifically to the ratings assigned to the issuer of the security by Standard & Poor’s, Moody’s and/or Fitch. If agency ratings differ, the security will be considered to have received the highest of those ratings, consistent with the fund’s investment policies. Securities in the “unrated” category (above) have not been rated by a rating agency; however, the investment adviser performs its own credit analysis and assigns comparable ratings that are used for compliance with the fund’s investment policies. The ratings are not covered by the Report of Independent Registered Public Accounting Firm. |
| 6 | Private Client Services Funds |
Capital Group California Short-Term Municipal Fund October 31, 2018
How a $25,000 investment has grown
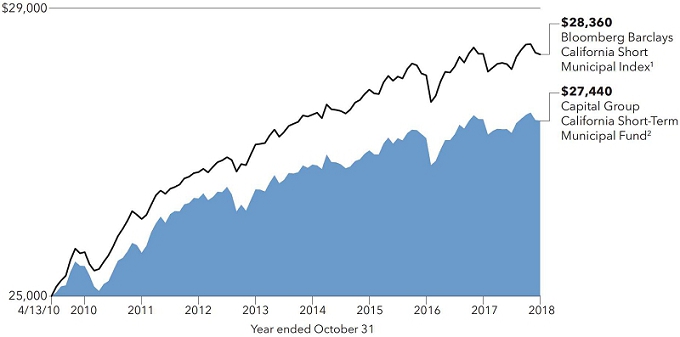
| 1 | Bloomberg Barclays California Short Municipal Index is a market value-weighted index that includes only investment-grade tax-exempt bonds that are issued from California and with maturities of one to five years. This index is unmanaged, and its results include reinvested distributions but do not reflect the effect of commissions, account fees, expenses or U.S. federal income taxes. Investors cannot invest directly in an index. Source: Bloomberg Index Services Ltd. |
| 2 | Includes reinvested dividends and capital gain distributions. |
Results are for past periods and are not predictive of results for future periods. Current and future results may be lower or higher than those shown. Share price and returns will vary so investors may lose money. The results shown are before taxes on fund distributions and sale of fund shares.
Average annual total returns based on a $25,000 investment
For periods ended October 31, 2018
| 1 year | 5 years | Lifetime | ||||
| Capital Group California Short-Term Municipal Fund | –0.07% | 0.71% | 1.10% |
| Portfolio quality summary* | Percent of net assets |
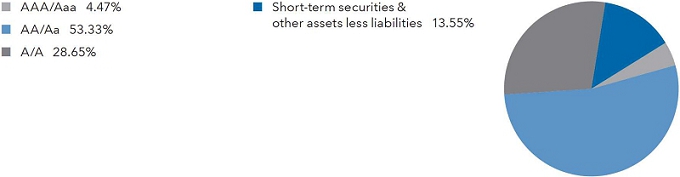
| * | Bond ratings, which typically range from AAA/Aaa (highest) to D (lowest), are assigned by credit rating agencies such as Standard & Poor’s, Moody’s and/or Fitch as an indication of an issuer’s creditworthiness. In assigning a credit rating to a security, the fund looks specifically to the ratings assigned to the issuer of the security by Standard & Poor’s, Moody’s and/or Fitch. If agency ratings differ, the security will be considered to have received the highest of those ratings, consistent with the fund’s investment policies. Securities in the “unrated” category (above) have not been rated by a rating agency; however, the investment adviser performs its own credit analysis and assigns comparable ratings that are used for compliance with the fund’s investment policies. The ratings are not covered by the Report of Independent Registered Public Accounting Firm. |
| Private Client Services Funds | 7 |
Capital Group Core Bond Fund October 31, 2018
How a $25,000 investment has grown
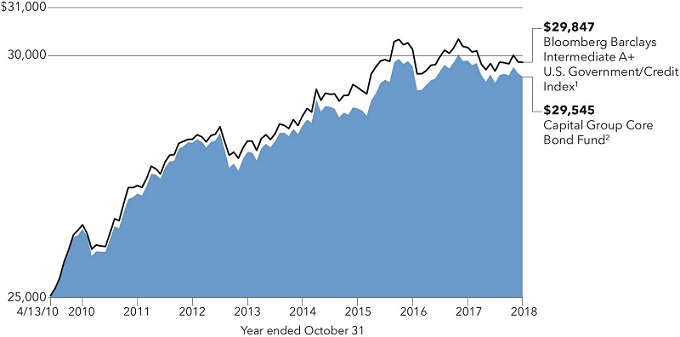
| 1 | The Bloomberg Barclays Intermediate A+ U.S. Government/Credit Index is a market value-weighted index that tracks the total return of fixed-rate, publicly placed, dollar denominated obligations issued by the U.S. Treasury, U.S. government agencies and quasi-federal corporations, corporate or foreign debt guaranteed by the U.S. government, and U.S. corporate and foreign debentures and secured notes that meet specified maturity, liquidity and quality requirements, with maturities of one to 10 years, excluding BBB-rated securities. This index is unmanaged, and its results include reinvested distributions but do not reflect the effect of account fees, expenses or U.S. federal income taxes. Investors cannot invest directly in an index. Source: Bloomberg Index Services Ltd. |
| 2 | Includes reinvested dividends and capital gain distributions. |
Results are for past periods and are not predictive of results for future periods. Current and future results may be lower or higher than those shown. Share price and returns will vary so investors may lose money. The results shown are before taxes on fund distributions and sale of fund shares.
Average annual total returns based on a $25,000 investment
For periods ended October 31, 2018
| 1 year | 5 years | Lifetime | ||||
| Capital Group Core Bond Fund | –1.14% | 1.09% | 1.97% |
| Portfolio quality summary* | Percent of net assets |
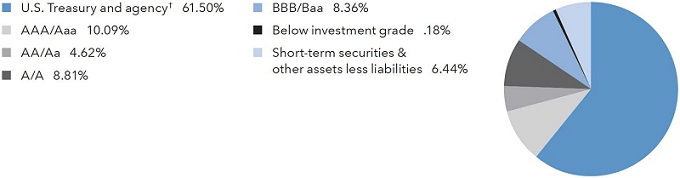
| * | Bond ratings, which typically range from AAA/Aaa (highest) to D (lowest), are assigned by credit rating agencies such as Standard & Poor’s, Moody’s and/or Fitch as an indication of an issuer’s creditworthiness. In assigning a credit rating to a security, the fund looks specifically to the ratings assigned to the issuer of the security by Standard & Poor’s, Moody’s and/or Fitch. If agency ratings differ, the security will be considered to have received the highest of those ratings, consistent with the fund’s investment policies. Securities in the “unrated” category (above) have not been rated by a rating agency; however, the investment adviser performs its own credit analysis and assigns comparable ratings that are used for compliance with the fund’s investment policies. The ratings are not covered by the Report of Independent Registered Public Accounting Firm. |
| † | These securities are guaranteed by the full faith and credit of the U.S. government. |
| 8 | Private Client Services Funds |
Capital Group Global Equity Fund October 31, 2018
How a $25,000 investment has grown
![]()
| 1 | MSCI World Index is a free float-adjusted market capitalization-weighted index that is designed to measure equity market results of developed markets. The index consists of more than 20 developed market country indexes, including the United States. Results reflect dividends net of withholding taxes. This index is unmanaged, and its results include reinvested dividends and/ or distributions but do not reflect the effect of sales charges, commissions, account fees, expenses or U.S. federal income taxes. Investors cannot invest directly in an index. Source: MSCI. |
Results are for past periods and are not predictive of results for future periods. Current and future results may be lower or higher than those shown. Share price and returns will vary so investors may lose money. The results shown are before taxes on fund distributions and sale of fund shares.
Average annual total returns based on a $25,000 investment
For periods ended October 31, 2018
| 1 year | 5 years | Lifetime | ||||
| Capital Group Global Equity Fund | 0.25% | 6.68% | 7.63% |
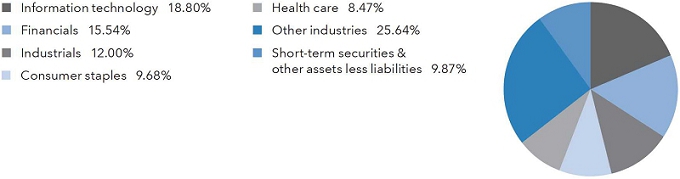
| Industry sector diversification | Percent of net assets |
| Private Client Services Funds | 9 |
Capital Group Global Equity Fund October 31, 2018
| Country diversification by domicile | Percent of net assets | |||
| United States | 50.34 | % | ||
| France | 9.53 | |||
| Japan | 5.97 | |||
| United Kingdom | 5.71 | |||
| Hong Kong | 3.54 | |||
| Taiwan | 2.10 | |||
| Denmark | 2.00 | |||
| Canada | 1.64 | |||
| Switzerland | 1.64 | |||
| Netherlands | 1.56 | |||
| Sweden | 1.14 | |||
| Other countries | 4.96 | |||
| Short-term securities & other assets less liabilities | 9.87 | |||
| 10 | Private Client Services Funds |
Capital Group International Equity Fund October 31, 2018
How a $25,000 investment has grown
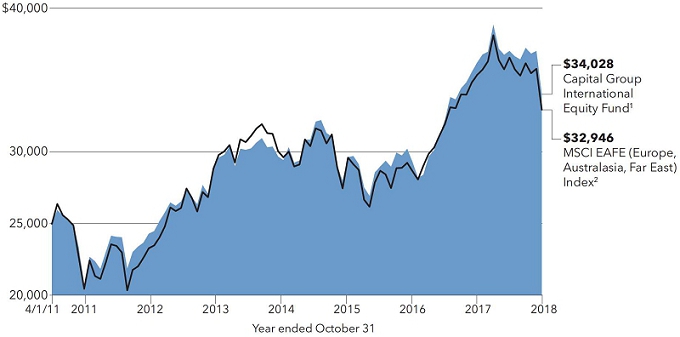
| 1 | Includes reinvested dividends and capital gain distributions. |
| 2 | MSCI EAFE (Europe, Australasia, Far East) Index is a free float-adjusted market capitalization-weighted index that is designed to measure developed equity market results, excluding the United States and Canada. Results reflect dividends net of withholding taxes. This index is unmanaged, and its results include reinvested dividends and/or distributions but do not reflect the effect of sales charges, commissions, account fees, expenses or U.S. federal income taxes. Investors cannot invest directly in an index. Source: MSCI. |
Results are for past periods and are not predictive of results for future periods. Current and future results may be lower or higher than those shown. Share price and returns will vary so investors may lose money. The results shown are before taxes on fund distributions and sale of fund shares.
Average annual total returns based on a $25,000 investment
For periods ended October 31, 2018
| 1 year | 5 years | Lifetime | ||||
| Capital Group International Equity Fund | –6.09% | 2.81% | 4.15% |
| Industry sector diversification | Percent of net assets |
| Private Client Services Funds | 11 |
Capital Group International Equity Fund October 31, 2018
| Country diversification by domicile | Percent of net assets | |||
| France | 17.12 | % | ||
| Japan | 14.02 | |||
| United Kingdom | 13.54 | |||
| Denmark | 5.24 | |||
| Hong Kong | 4.43 | |||
| Switzerland | 3.72 | |||
| Germany | 2.83 | |||
| Sweden | 2.24 | |||
| Netherlands | 2.05 | |||
| United States | 2.02 | |||
| Taiwan | 1.84 | |||
| Finland | 1.25 | |||
| Other countries | 6.08 | |||
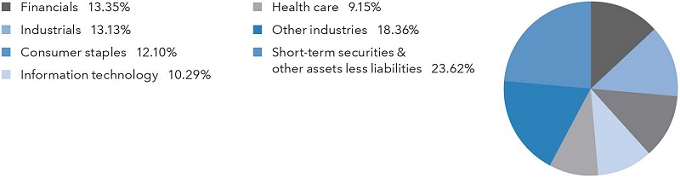
| Short-term securities & other assets less liabilities | 23.62 | |||
| 12 | Private Client Services Funds |
Capital Group U.S. Equity Fund October 31, 2018
How a $25,000 investment has grown
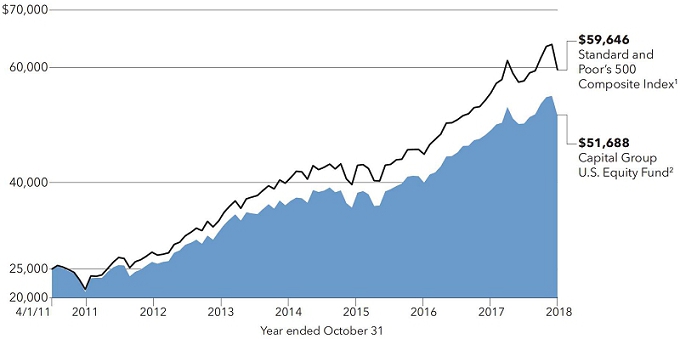
| 1 | Standard & Poor’s 500 Composite Index is a market capitalization-weighted index based on the results of approximately 500 widely held common stocks. This index is unmanaged, and its results include reinvested dividends and/or distributions but do not reflect the effect of sales charges, commissions, account fees, expenses or U.S. federal income taxes. Investors cannot invest directly in an index. Source: S&P Dow Jones Indices LLC. |
| 2 | Includes reinvested dividends and capital gain distributions. |
Results are for past periods and are not predictive of results for future periods. Current and future results may be lower or higher than those shown. Share price and returns will vary so investors may lose money. The results shown are before taxes on fund distributions and sale of fund shares.
Average annual total returns based on a $25,000 investment
For periods ended October 31, 2018
| 1 year | 5 years | Lifetime | ||||
| Capital Group U.S. Equity Fund | 5.30% | 9.60% | 10.05% |
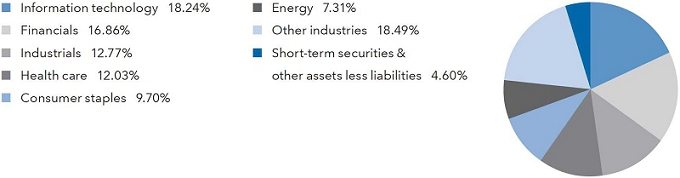
| Industry sector diversification | Percent of net assets |
| Private Client Services Funds | 13 |
Capital Group Core Municipal Fund
Investment portfolio October 31, 2018
| Bonds, notes & other debt instruments 91.09% | Principal amount (000) | Value (000) | ||||||
| Alabama 1.39% | ||||||||
| 21st Century Auth., Tobacco Settlement Rev. Ref. Bonds, Series 2012-A, 5.00% 2021 | $ | 2,230 | $ | 2,367 | ||||
| Black Belt Energy Gas Dist., Gas Supply Rev. Bonds, Series 2017-A, 4.00% 2047 (put 2022) | 2,050 | 2,129 | ||||||
| Federal Aid Highway Fin. Auth., Federal Highway Grant Anticipation Bonds, Series 2012, 5.00% 2023 (preref. 2022) | 100 | 110 | ||||||
| City of Huntsville, Electric Rev. Bonds, Series 2017-A, 5.00% 2021 | 250 | 271 | ||||||
| City of Huntsville, Electric Rev. Bonds, Series 2017-A, 5.00% 2022 | 450 | 497 | ||||||
| City of Huntsville, Electric Rev. Bonds, Series 2017-B, 5.00% 2021 | 225 | 243 | ||||||
| City of Huntsville, Electric Rev. Bonds, Series 2017-B, 5.00% 2022 | 400 | 442 | ||||||
| County of Jefferson, Limited Obligation Rev. Ref. Bonds, Series 2017, 5.00% 2020 | 500 | 525 | ||||||
| 6,584 | ||||||||
| Alaska 0.07% | ||||||||
| Housing Fin. Corp., General Mortgage Rev. Bonds, Series 2016-A, 3.50% 2046 | 270 | 275 | ||||||
| Housing Fin. Corp., Home Mortgage Rev. Ref. Bonds, Series 2012-A, 4.00% 2040 | 55 | 55 | ||||||
| 330 | ||||||||
| Arizona 1.21% | ||||||||
| Agricultural Improvement and Power Dist., Electric System Rev. Bonds (Salt River Project), Series 2009-A, 5.00% 2020 (preref. 2019) | 5 | 5 | ||||||
| Board of Regents of the Arizona State University System, Rev. Bonds, Series 2017-A, 5.00% 2024 | 400 | 454 | ||||||
| Board of Regents of the Arizona State University System, Rev. Ref. Bonds, Series 2017-B, 5.00% 2024 | 400 | 454 | ||||||
| Health Facs. Auth., Rev. Ref. Bonds (Phoenix Children’s Hospital), Series 2013-A-1, (SIFMA Municipal Swap Index + 1.85%) 3.45% 2048 (put 2020)1 | 3,100 | 3,131 | ||||||
| County of Maricopa, Industrial Dev. Auth., Education Rev. Bonds (GreatHearts Arizona Projects), Series 2017-A, 5.00% 2027 | 745 | 849 | ||||||
| City of Phoenix, Industrial Dev. Auth., Lease Rev. Bonds (Rowan University Project), Series 2012, 5.00% 2022 | 800 | 835 | ||||||
| 5,728 | ||||||||
| Arkansas 0.13% | ||||||||
| Dev. Fin. Auth., Health Care Rev. Bonds (Baptist Memorial Health Care), Series 2015-B-3, (SIFMA Municipal Swap Index + 1.55%) 3.15% 2044 (put 2022)1 | 600 | 612 | ||||||
| California 2.28% | ||||||||
| Bay Area Toll Auth., San Francisco Bay Area Toll Bridge Rev. Bonds, Series 2006-C-1, (SIFMA Municipal Swap Index + 0.90%) 2.50% 2045 (put 2023)1 | 2,200 | 2,248 | ||||||
| Bay Area Toll Auth., San Francisco Bay Area Toll Bridge Rev. Bonds, Series 2007-E-3, (SIFMA Municipal Swap Index + 0.70%) 2.30% 2047 (put 2019)1 | 1,150 | 1,153 | ||||||
| City of Cathedral City, Successor Agcy. to the Redev. Agcy., Tax Allocation Housing Rev. Ref. Bonds (Merged Redev. Project Area), Series 2014-A, Assured Guaranty Municipal insured, 5.00% 2025 | 620 | 695 | ||||||
| Econ. Recovery Rev. Ref. Bonds, Series 2009-A, 5.25% 2021 (preref. 2019) | 65 | 67 | ||||||
| Econ. Recovery Rev. Ref. Bonds, Series 2009-A, 5.25% 2021 (preref. 2019) | 35 | 36 | ||||||
| Various Purpose G.O. Rev. Ref. Bonds, Series 2017, 5.00% 2026 | 1,125 | 1,314 | ||||||
| Health Facs. Fncg. Auth., Insured Rev. Ref. Bonds (Marshall Medical Center), Series 2015, 5.00% 2028 | 315 | 357 | ||||||
| Infrastructure and Econ. Dev. Bank, Rev. Bonds (The Colburn School), Series 2015-B, (SIFMA Municipal Swap Index + 1.20%) 2.80% 2037 (put 2022)1 | 1,000 | 1,024 | ||||||
| City of Irvine, Reassessment Dist. No. 13-1, Limited Obligation Improvement Bonds, Series 2013, 3.125% 2021 | 65 | 67 | ||||||
| Irvine Unified School Dist., Community Facs. Dist. No. 09-1, Special Tax Bonds, Series 2017-A, BAM insured, 5.00% 2025 | 250 | 279 | ||||||
| City of Los Angeles, Multi Family Housing Rev. Bonds (Jordan Downs Phase 1B Apartments), Series 2018-A-2, 2.08% 2022 (put 2021) | 150 | 149 | ||||||
| 14 | Private Client Services Funds |
Capital Group Core Municipal Fund
| Bonds, notes & other debt instruments | Principal amount (000) | Value (000) | ||||||
| Murrieta Valley Unified School Dist., Public Fncg. Auth., Special Tax Rev. Bonds, Series 2016-A, 5.00% 2022 | $ | 1,250 | $ | 1,369 | ||||
| RNR School Fncg. Auth., Community Facs. Dist. No. 92-1, Special Tax Bonds, Series 2017-A, BAM insured, 5.00% 2028 | 1,000 | 1,145 | ||||||
| Statewide Communities Dev. Auth., Insured Rev. Bonds (Viamonte Senior Living 1 Project), Series 2018-B, 3.00% 2025 | 200 | 202 | ||||||
| Statewide Communities Dev. Auth., Insured Rev. Bonds (Viamonte Senior Living 1 Project), Series 2018-B, 3.00% 2026 | 500 | 503 | ||||||
| Statewide Communities Dev. Auth., Rev. Bonds (American Baptist Homes of the West), Series 2013-A, 5.00% 2023 | 200 | 216 | ||||||
| 10,824 | ||||||||
| Colorado 2.35% | ||||||||
| City of Colorado Springs, Utilities System Rev. Ref. Bonds, Series 2018-A-1, 5.00% 2025 | 1,000 | 1,158 | ||||||
| City and County of Denver, Airport System Rev. Ref. Bonds, Series 2009-A, 5.25% 2028 | 200 | 206 | ||||||
| E-470 Public Highway Auth., Rev. Bonds, Series 2017-A, (1-month USD-LIBOR x 0.67 + 0.90%) 2.442% 2039 (put 2019)1 | 200 | 200 | ||||||
| E-470 Public Highway Auth., Rev. Bonds, Series 2017-B, (1-month USD-LIBOR x 0.67 + 1.05%) 2.578% 2039 (put 2021)1 | 200 | 202 | ||||||
| Educational and Cultural Facs. Auth., Rev. Ref. Bonds (Johnson & Wales Univ. Project), Series 2013-B, 5.00% 2023 | 1,590 | 1,745 | ||||||
| Health Facs. Auth., Health Facs. Rev. and Rev. Ref. Bonds (Evangelical Lutheran Good Samaritan Society Project), Series 2015-A, 5.00% 2024 | 1,825 | 2,009 | ||||||
| Health Facs. Auth., Health Facs. Rev. and Rev. Ref. Bonds (Evangelical Lutheran Good Samaritan Society Project), Series 2017, 5.00% 2019 | 500 | 507 | ||||||
| Health Facs. Auth., Hospital Rev. Bonds (Adventist Health System/Sunbelt Obligated Group), Series 2016-C, 5.00% 2036 (put 2023) | 1,570 | 1,745 | ||||||
| Housing and Fin. Auth., Single Family Mortgage Bonds, Series 2018-C, Class I, 4.25% 2048 | 800 | 844 | ||||||
| City of Loveland, Centerra Metropolitan Dist. No. 1, Rev. Ref. Bonds, Series 2017, 2.70% 2019 | 492 | 493 | ||||||
| City of Loveland, Centerra Metropolitan Dist. No. 1, Rev. Ref. Bonds, Series 2017, 5.00% 20202 | 1,250 | 1,306 | ||||||
| Mountain Shadows Metropolitan Dist., Limited Tax G.O. Ref. and Improvement Bonds, Series 2016, 4.00% 2026 | 735 | 733 | ||||||
| 11,148 | ||||||||
| Connecticut 1.89% | ||||||||
| Health and Educational Facs. Auth., Rev. Bonds (Yale University Issue), Series 1999-U-1, 1.00% 2033 (put 2019) | 750 | 748 | ||||||
| Health and Educational Facs. Auth., Rev. Bonds (Yale University Issue), Series 2017-C-2, 5.00% 2057 (put 2023) | 1,500 | 1,659 | ||||||
| Housing Fin. Auth., Housing Mortgage Fin. Program Bonds, Series 2014-C-1, 4.00% 2044 | 220 | 226 | ||||||
| Housing Fin. Auth., Housing Mortgage Fin. Program Bonds, Series 2016-A-1, 4.00% 2045 | 680 | 702 | ||||||
| Housing Fin. Auth., Housing Mortgage Fin. Program Bonds, Series 2017-A-1, 4.00% 2047 | 3,555 | 3,689 | ||||||
| Housing Fin. Auth., Housing Mortgage Fin. Program Bonds, Series 2017-C-1, 4.00% 2047 | 1,365 | 1,417 | ||||||
| Housing Fin. Auth., Housing Mortgage Fin. Program Bonds, Series 2017-D, 4.00% 2047 | 285 | 296 | ||||||
| Housing Fin. Auth., Housing Mortgage Fin. Program Rev. Ref. Bonds, Series 2015-A, 3.50% 2044 | 230 | 234 | ||||||
| 8,971 | ||||||||
| District of Columbia 0.27% | ||||||||
| G.O. Bonds, Series 2018-B, 5.00% 2026 | 500 | 581 | ||||||
| Washington Convention and Sports Auth., Dedicated Tax Rev. Ref. Bonds, Series 2018-A, 5.00% 2027 | 600 | 696 | ||||||
| 1,277 | ||||||||
| Private Client Services Funds | 15 |
Capital Group Core Municipal Fund
| Bonds, notes & other debt instruments (continued) | Principal amount (000) | Value (000) | ||||||
| Florida 6.11% | ||||||||
| County of Brevard, Health Facs. Auth., Rev. Ref. Bonds (Health First, Inc. Project), | ||||||||
| Series 2014, 5.00% 2021 | $ | 500 | $ | 529 | ||||
| County of Brevard, Health Facs. Auth., Rev. Ref. Bonds (Health First, Inc. Project), Series 2014, 5.00% 2022 | 500 | 539 | ||||||
| City of Cape Coral, Utility Improvement Rev. Ref. Assessment Bonds (Various Areas), Series 2017, Assured Guaranty Municipal insured, 1.90% 2020 | 960 | 943 | ||||||
| Citizens Property Insurance Corp., Personal Lines Account/Commercial Lines Account Senior Secured Bonds, Series 2012-A-1, 5.00% 2019 | 1,500 | 1,525 | ||||||
| City of Clearwater, Water and Sewer Rev. Ref. Bonds, Series 2009-B, 5.00% 2018 | 100 | 100 | ||||||
| Connerton West Community Dev. Dist., Improvement Rev. Ref. Bonds, Series 2018-A-1, Assured Guaranty Municipal insured, 3.00% 2026 | 345 | 337 | ||||||
| Connerton West Community Dev. Dist., Improvement Rev. Ref. Bonds, Series 2018-A-1, Assured Guaranty Municipal insured, 3.20% 2027 | 355 | 348 | ||||||
| Connerton West Community Dev. Dist., Improvement Rev. Ref. Bonds, Series 2018-A-1, Assured Guaranty Municipal insured, 3.25% 2028 | 370 | 361 | ||||||
| Board of Education, Public Education Capital Outlay Rev. Ref. Bonds, Series 2017-C, 5.00% 2027 | 1,000 | 1,173 | ||||||
| Higher Educational Facs. Fncg. Auth., Educational Facs. Rev. Ref. Bonds (Nova Southeastern University Project), Series 2012-A, 5.00% 2022 | 1,000 | 1,074 | ||||||
| Higher Educational Facs. Fncg. Auth., Educational Facs. Rev. Ref. Bonds (Nova Southeastern University Project), Series 2016, 5.00% 2026 | 655 | 737 | ||||||
| Housing Fin. Corp., Multi Familiy Housing Rev. Bonds (Logan Heights Apartments), Series 2018-F, 1.90% 2020 | 2,000 | 1,983 | ||||||
| Housing Fin. Corp., Homeowner Mortgage Rev. Bonds (Special Program), Series 2010-A, 5.00% 2028 | 90 | 91 | ||||||
| Housing Fin. Corp., Homeowner Mortgage Rev. Bonds (Special Program), Series 2010-B, 4.50% 2029 | 150 | 152 | ||||||
| Housing Fin. Corp., Homeowner Mortgage Rev. Bonds (Special Program), Series 2011-B, 4.50% 2029 | 125 | 127 | ||||||
| Housing Fin. Corp., Homeowner Mortgage Rev. Bonds, Series 2017-1, 4.00% 2048 | 1,470 | 1,531 | ||||||
| Housing Fin. Corp., Homeowner Mortgage Rev. Bonds, Series 2018-1, 4.00% 2049 | 1,375 | 1,435 | ||||||
| City of Jacksonville, Better Jacksonville Sales Tax Rev. Ref. Bonds, Series 2011, 5.00% 2019 | 1,000 | 1,026 | ||||||
| JEA Electric System Rev. Bonds, Series Three 2014-A, 5.00% 2022 | 600 | 647 | ||||||
| JEA, Water and Sewer System Rev. Bonds, Series 2017-A, 5.00% 2023 | 750 | 828 | ||||||
| County of Martin, Health Facs. Auth., Hospital Rev. Bonds (Martin Memorial Medical Center), Series 2012, 3.50% 2019 | 100 | 101 | ||||||
| City of Miami Beach, Health Facs. Auth., Hospital Rev. and Rev. Ref. Bonds (Mount Sinai Medical Center of Florida), Series 2014, 5.00% 2027 | 145 | 157 | ||||||
| Mid-Bay Bridge Auth., Rev. Ref. Bonds, Series 2015-C, Assured Guaranty Municipal insured, 5.00% 2021 | 575 | 615 | ||||||
| Orlando Utilities Commission, Utility System Rev. Bonds, Series 2009-B, 5.00% 2023 | 225 | 228 | ||||||
| County of Palm Beach, Health Facs. Auth., Rev. Bonds (Lifespace Communities, Inc.), Series 2015-C, 5.00% 2027 | 300 | 316 | ||||||
| City of Pompano Beach, Rev. Bonds (John Knox Village Project), Series 2015, 5.00% 2023 | 620 | 677 | ||||||
| South Florida Water Management Dist., Certs. of Part., Series 2015, 5.00% 2025 | 1,500 | 1,713 | ||||||
| City of South Miami, Health Facs. Auth., Hospital Rev. Ref. Bonds (Baptist Health South Florida Obligated Group), Series 2017, 5.00% 2021 | 500 | 536 | ||||||
| City of South Miami, Health Facs. Auth., Hospital Rev. Ref. Bonds (Baptist Health South Florida Obligated Group), Series 2017, 5.00% 2024 | 500 | 562 | ||||||
| Southeast Overtown/Park West Community Redev. Agcy., Tax Increment Rev. Bonds, Series 2014-A-1, 5.00% 20192 | 1,000 | 1,010 | ||||||
| Southeast Overtown/Park West Community Redev. Agcy., Tax Increment Rev. Bonds, Series 2014-A-1, 5.00% 20212 | 785 | 830 | ||||||
| Tolomato Community Dev. Dist., Rev. Ref. Bonds, Series 2018-A-1, Assured Guaranty Municipal insured, 2.625% 2024 | 1,075 | 1,050 | ||||||
| Dept. of Transportation, Bridge Construction Bonds, Series 2018-B, 5.00% 2025 | 2,000 | 2,304 | ||||||
| Village Community Dev. Dist. No. 6, Rev. Ref. Bonds, Series 2017, 4.00% 2020 | 350 | 359 | ||||||
| County of Volusia, Educational Facs. Auth., Educational Facs. Rev. Ref. Bonds (Embry-Riddle Aeronautical University, Inc. Project), Series 2015-B, 5.00% 2028 | 1,000 | 1,115 | ||||||
| 16 | Private Client Services Funds |
Capital Group Core Municipal Fund
| Bonds, notes & other debt instruments | Principal amount (000) | Value (000) | ||||||
| Water Pollution Control Fncg. Corp., Water Pollution Control Rev. Bonds, Series 2008-A, 5.00% 2020 | $ | 186 | $ | 187 | ||||
| Water Pollution Control Fncg. Corp., Water Pollution Control Rev. Bonds, Series 2008-A, 5.00% 2022 | 400 | 403 | ||||||
| Water Pollution Control Fncg. Corp., Water Pollution Control Rev. Bonds, Series 2008-A, 5.00% 2023 | 300 | 302 | ||||||
| City of Winter Garden, Winter Garden Village at Fowler Groves Community Dev. Dist., Special Assessment Rev. Ref. Bonds, Series 2016, 3.00% 2024 | 1,010 | 993 | ||||||
| 28,944 | ||||||||
| Georgia 1.29% | ||||||||
| County of DeKalb, Hospital Auth., Rev. Ref. Anticipation Certificates (DeKalb Medical Center, Inc. Project), Series 2009, 5.00% 2024 | 200 | 206 | ||||||
| Municipal Electric Auth., Project One Bonds, Series 2009-B, 5.00% 2020 | 755 | 778 | ||||||
| Housing and Fin. Auth., Single Family Mortgage Bonds, Series 2014-A-1, 4.00% 2044 | 885 | 908 | ||||||
| Housing and Fin. Auth., Single Family Mortgage Bonds, Series 2015-A-1, 3.50% 2045 | 720 | 733 | ||||||
| Housing and Fin. Auth., Single Family Mortgage Bonds, Series 2015-B-1, 3.50% 2045 | 330 | 336 | ||||||
| Housing and Fin. Auth., Single Family Mortgage Bonds, Series 2017-A, 4.00% 2047 | 795 | 826 | ||||||
| Municipal Electric Auth., Project One Bonds, Series 2016-A, 4.00% 2021 | 1,000 | 1,030 | ||||||
| Private Colleges and Universities Auth., Rev. Bonds (The Savannah College of Art and Design Projects), Series 2014, 5.00% 2020 | 1,250 | 1,297 | ||||||
| 6,114 | ||||||||
| Guam 0.36% | ||||||||
| A.B. Won Pat International Airport Auth., General Rev. Bonds, Series 2013-B, 5.00% 2023 | 1,200 | 1,260 | ||||||
| Waterworks Auth., Water and Wastewater System Rev. Ref. Bonds, Series 2014-A, 5.00% 2019 | 440 | 446 | ||||||
| 1,706 | ||||||||
| Hawaii 0.23% | ||||||||
| G.O. Bonds, Series 2011-DZ, 5.00% 2019 (escrowed to maturity) | 645 | 665 | ||||||
| Dept. of Transportation, Airports Division, Lease Rev. Certs. of Part., Series 2010-A, 5.00% 2022 | 400 | 418 | ||||||
| 1,083 | ||||||||
| Idaho 0.23% | ||||||||
| Housing and Fin. Assn., Grant and Rev. Anticipation Bonds (Federal Highway Trust Fund), Series 2015-A, 5.00% 2022 | 1,000 | 1,092 | ||||||
| Illinois 10.85% | ||||||||
| Build Illinois Bonds, Sales Tax Rev. Bonds, Series 2013, 5.00% 2020 | 3,325 | 3,447 | ||||||
| Build Illinois Bonds, Sales Tax Rev. Ref. Bonds, Series 2010, 5.00% 2019 | 250 | 254 | ||||||
| Build Illinois Bonds, Sales Tax Rev. Ref. Bonds, Series 2016-C, 4.00% 2026 | 1,000 | 1,039 | ||||||
| Build Illinois Bonds, Sales Tax Rev. Ref. Bonds, Series 2016-D, 4.00% 2021 | 250 | 258 | ||||||
| County of Champaign, Community Unit School Dist. No. 4, G.O. School Building Bonds, Series 2017, 5.00% 2021 | 1,000 | 1,054 | ||||||
| City of Chicago, Board of Education, Unlimited Tax G.O. Bonds (Dedicated Rev.), | ||||||||
| Assured Guaranty Municipal insured, Series 2018-A, 5.00% 2023 | 1,100 | 1,192 | ||||||
| City of Chicago, Chicago Midway Airport, Rev. Ref. Bonds, Series 2013-B, 5.00% 2021 | 500 | 527 | ||||||
| City of Chicago, O’Hare International Airport, General Airport Rev. Bonds, Series 2017-D, 5.00% 2026 | 1,135 | 1,287 | ||||||
| City of Chicago, Wastewater Transmission Rev. Bonds, Series 2012, 5.00% 2020 | 650 | 669 | ||||||
| City of Chicago, Wastewater Transmission Rev. Bonds, Series 2012, Assured Guaranty Municipal insured, 4.00% 2021 | 1,000 | 1,029 | ||||||
| City of Chicago, Wastewater Transmission Rev. Bonds, Series 2012, Assured Guaranty Municipal insured, 5.00% 2023 | 500 | 532 | ||||||
| City of Chicago, Wastewater Transmission Rev. Bonds, Series 2014, 5.00% 2020 | 515 | 530 | ||||||
| City of Chicago, Wastewater Transmission Rev. Ref. Bonds, Series 2017-B, 5.00% 2022 | 250 | 267 | ||||||
| Private Client Services Funds | 17 |
Capital Group Core Municipal Fund
| Bonds, notes & other debt instruments (continued) | Principal amount (000) | Value (000) | ||||||
| Illinois (continued) | ||||||||
| City of Chicago, Water Rev. Ref. Bonds, Series 2004, 5.00% 2019 | $ | 950 | $ | 975 | ||||
| City of Chicago, Water Rev. Ref. Bonds, Series 2004, 5.00% 2021 | 1,895 | 2,020 | ||||||
| Counties of Cook, DuPage, Kane, Lake, McHenry and Will, Regional Transportation Auth., G.O. Rev. Ref. Bonds, Series 1997, FGIC-National insured, 6.00% 2020 | 2,000 | 2,074 | ||||||
| County of Cook, Community College Dist. No. 508 (City Colleges of Chicago), Unlimited Tax G.O. Bonds, Series 2013, 5.00% 2023 | 200 | 214 | ||||||
| Counties of Cook, DuPage, Kane, Lake, McHenry and Will, Regional Transportation Auth., G.O. Bonds, Series 2000, MBIA insured, 6.25% 2021 | 1,000 | 1,098 | ||||||
| Educational Facs. Auth., Rev. Bonds (University of Chicago), Series 1998-B, 1.65% 2025 (put 2019) | 2,000 | 1,998 | ||||||
| Fin. Auth., Rev. Bonds (Art Institute of Chicago), Series 2016, 5.00% 2025 | 125 | 140 | ||||||
| Fin. Auth., Rev. Bonds (Art Institute of Chicago), Series 2016, 5.00% 2026 | 120 | 136 | ||||||
| Fin. Auth., Rev. Bonds (Clean Water Initiative Revolving Fund), Series 2016, 4.00% 2025 | 1,310 | 1,414 | ||||||
| Fin. Auth., Rev. Bonds (Clean Water Initiative Revolving Fund), Series 2016, 4.00% 2026 | 1,000 | 1,081 | ||||||
| Fin. Auth., Rev. Bonds (Clean Water Initiative Revolving Fund), Series 2016, 5.00% 2021 | 150 | 159 | ||||||
| Fin. Auth., Rev. Bonds (Clean Water Initiative Revolving Fund), Series 2017, 5.00% 2020 | 700 | 733 | ||||||
| Fin. Auth., Rev. Bonds (Lifespace Communities), Series 2015-A, 5.00% 2027 | 590 | 631 | ||||||
| Fin. Auth., Rev. Bonds (Northwestern Memorial Healthcare), Series 2017-B, 5.00% 2057 (put 2022) | 275 | 302 | ||||||
| Fin. Auth., Rev. Bonds (OSF Healthcare System), Series 2015-A, 5.00% 2027 | 250 | 279 | ||||||
| Fin. Auth., Rev. Bonds (Presbyterian Homes Obligated Group), Series 2016-A, 5.00% 2024 | 310 | 339 | ||||||
| Fin. Auth., Rev. Bonds (Presence Health Network Obligated Group), Series 2016-C, 5.00% 2026 | 600 | 687 | ||||||
| Fin. Auth., Rev. Bonds (Rush University Medical Center Obligated Group), Series 2015-A, 5.00% 2021 | 500 | 537 | ||||||
| Fin. Auth., Rev. Ref. Bonds (Advocate Health Care Network), Series 2008-A-1, 5.00% 2030 (put 2020) | 1,500 | 1,549 | ||||||
| Fin. Auth., Rev. Ref. Bonds (Advocate Health Care Network), Series 2008-A-3, 5.00% 2030 (put 2019) | 1,000 | 1,014 | ||||||
| G.O. Bonds, Series 2012, 5.00% 2019 | 285 | 287 | ||||||
| G.O. Bonds, Series 2017-B, 5.00% 2019 | 1,000 | 1,022 | ||||||
| G.O. Bonds, Series 2017-D, BMA insured, 5.00% 2020 | 4,105 | 4,251 | ||||||
| G.O. Rev. Ref. Bonds, Series 2012, 5.00% 2020 | 325 | 335 | ||||||
| G.O. Rev. Ref. Bonds, Series 2016, 5.00% 2026 | 1,000 | 1,040 | ||||||
| G.O. Rev. Ref. Bonds, Series 2012, 5.00% 2021 | 970 | 1,004 | ||||||
| Housing Dev. Auth., Multi Family Housing Rev. Notes (Marshall Field Garden Apartment Homes), Series 2015, (SIFMA Municipal Swap Index + 1.00%) 2.60% 2050 (put 2025)1 | 2,000 | 1,983 | ||||||
| Board of Trustees of the Illinois State University, Auxiliary Facs. System Rev. Bonds, Series 2016, Assured Guaranty Municipal insured, 5.00% 2022 | 1,465 | 1,555 | ||||||
| Municipal Electric Agcy., Power Supply System Rev. Ref. Bonds, Series 2015-A, 5.00% 2027 | 1,000 | 1,122 | ||||||
| Railsplitter Tobacco Settlement Auth., Tobacco Settlement Rev. Bonds, Series 2017, 5.00% 2023 | 500 | 548 | ||||||
| Regional Transportation Auth., G.O. Rev. Ref. Bonds, Series 2017-A, 5.00% 2028 | 2,000 | 2,272 | ||||||
| Sales Tax Securitization Corp., Sales Tax Rev. Ref. Bonds, Series 2017-A, 5.00% 2023 | 2,000 | 2,179 | ||||||
| Sales Tax Securitization Corp., Sales Tax Rev. Ref. Bonds, Series 2017-A, 5.00% 2024 | 1,000 | 1,101 | ||||||
| Toll Highway Auth., Toll Highway Rev. Bonds, Series 2015-A, 5.00% 2027 | 1,250 | 1,410 | ||||||
| Toll Highway Auth., Toll Highway Rev. Bonds, Series 2015-A, 5.00% 2028 | 1,110 | 1,248 | ||||||
| Board of Trustees of the University of Illinois, Auxiliary Facs. System Rev. Ref. Bonds, Series 2005-A, National insured, 5.50% 2023 | 500 | 560 | ||||||
| Board of Trustees of the University of Illinois, Rev. Ref. Certs. of Part., Series 2008-A, Assured Guaranty Municipal insured, 5.25% 2024 | 30 | 30 | ||||||
| 51,412 | ||||||||
| 18 | Private Client Services Funds |
Capital Group Core Municipal Fund
| Bonds, notes & other debt instruments | Principal amount (000) | Value (000) | ||||||
| Indiana 0.70% | ||||||||
| Fin. Auth., Hospital Rev. Ref. Bonds (Beacon Health Obligated Group), Series 2013-A, 4.00% 2019 | $ | 500 | $ | 507 | ||||
| Fin. Auth., Econ. Dev. Rev. Ref. Bonds (Republic Services, Inc. Project), Series 2010-B, 1.85% 2028 (put 2018) | 2,000 | 2,000 | ||||||
| Fin. Auth., Hospital Rev. Bonds (Parkview Health), Series 2009, 5.50% 2024 | 20 | 20 | ||||||
| Fin. Auth., Hospital Rev. Bonds (Parkview Health), Series 2009, 5.50% 2024 (preref. 2019) | 80 | 81 | ||||||
| City of Whiting, Environmental Facs. Rev. Bonds (BP Products North America Inc. Project), Series 2008, 1.85% 2044 (put 2019) | 700 | 697 | ||||||
| 3,305 | ||||||||
| Iowa 0.45% | ||||||||
| Fin. Auth., Single Family Mortgage Bonds, Series 2017-A, 4.00% 2047 | 2,070 | 2,148 | ||||||
| Kentucky 0.23% | ||||||||
| Housing Corp., Housing Rev. Bonds, Series 2010-B, 5.00% 2027 | 60 | 60 | ||||||
| Property and Buildings Commission, Rev. Ref. Bonds (Project No. 119), Series 2018, 5.00% 2020 | 1,000 | 1,039 | ||||||
| 1,099 | ||||||||
| Louisiana 1.58% | ||||||||
| Citizens Property Insurance Corp., Assessment Rev. Ref. Bonds, Assured Guaranty | ||||||||
| Municipal insured, Series 2015, 5.00% 2021 | 775 | 828 | ||||||
| Louisiana Stadium and Exposition Dist., Rev. Ref. Bonds, Series 2013-A, 5.00% 2022 | 1,500 | 1,633 | ||||||
| New Orleans Aviation Board, Gulf Opportunity Zone CFC Rev. Bonds (Consolidated Rental Car Project), Series 2009-A, 6.25% 2030 | 1,000 | 1,007 | ||||||
| Parish of St. Charles, Gulf Opportunity Zone Rev. Bonds (Valero Project), Series 2010, 4.00% 2040 (put 2022) | 2,000 | 2,085 | ||||||
| Tobacco Settlement Fncg. Corp., Tobacco Settlement Asset-Backed Rev. Ref. Bonds, Series 2013-A, 5.50% 2028 | 930 | 931 | ||||||
| Tobacco Settlement Fncg. Corp., Tobacco Settlement Asset-Backed Rev. Ref. Bonds, Series 2013-A, 5.50% 2029 | 1,000 | 1,016 | ||||||
| 7,500 | ||||||||
| Maine 0.27% | ||||||||
| Housing Auth., Mortgage Purchase Bonds, Series 2017-A, 4.00% 2047 | 660 | 685 | ||||||
| Dept. of Transportation, Grant Anticipation Bonds, Series 2018-A, 5.00% 2026 | 500 | 578 | ||||||
| 1,263 | ||||||||
| Maryland 1.75% | ||||||||
| County of Baltimore, Consolidated Public Improvement Bonds, Series 2018, 4.00% 2019 | 2,000 | 2,016 | ||||||
| Community Dev. Administration, Dept. of Housing and Community Dev., Residential Rev. Bonds, Series 2014-C, 4.00% 2044 | 645 | 666 | ||||||
| Community Dev. Administration, Dept. of Housing and Community Dev., Residential Rev. Bonds, Series 2018-A, 4.50% 2048 | 220 | 234 | ||||||
| G.O. Rev. Ref. Bonds, State and Local Facs. Loan of 2017, Second Series B, 5.00% 2026 | 2,000 | 2,335 | ||||||
| County of Montgomery, Housing Opportunities Commission, Single Family Housing Rev. Bonds, Series 2017-A, 4.00% 2048 | 940 | 975 | ||||||
| County of Montgomery, Housing Opportunities Commission, Single Family Housing Rev. Bonds, Series 2018-A, 4.00% 2049 | 2,000 | 2,083 | ||||||
| 8,309 | ||||||||
| Private Client Services Funds | 19 |
Capital Group Core Municipal Fund
| Bonds, notes & other debt instruments (continued) | Principal amount (000) | Value (000) | ||||||
| Massachusetts 0.92% | ||||||||
| Dev. Fin. Agcy., Rev. Bonds (Partners HealthCare System Issue), Series 2017-S, 5.00% 2024 | $ | 1,000 | $ | 1,129 | ||||
| Dev. Fin. Agcy., Rev. Ref. Bonds (Suffolk University Issue), Series 2017, 5.00% 2021 | 750 | 794 | ||||||
| Dev. Fin. Agcy., Rev. Ref. Bonds (Suffolk University Issue), Series 2017, 5.00% 2022 | 875 | 941 | ||||||
| Housing Fin. Agcy., Single Family Housing Rev. Bonds, Series 169, 4.00% 2044 | 620 | 635 | ||||||
| Housing Fin. Agcy., Single Family Housing Rev. Bonds, Series 172, 4.00% 2045 | 845 | 869 | ||||||
| 4,368 | ||||||||
| Michigan 3.69% | ||||||||
| Detroit School Dist., Unlimited Tax G.O. School Building and Site Improvement Rev. Ref. Bonds, Series 2012-A, 5.00% 2019 | 1,400 | 1,419 | ||||||
| Fin. Auth., Local Government Loan Program Rev. Bonds (Detroit Water and Sewerage Dept., Sewage Disposal System Rev. and Rev. Ref. Local Project Bonds), Series 2014-C-3, Assured Guaranty Municipal insured, 5.00% 2024 | 1,000 | 1,125 | ||||||
| Fin. Auth., Local Government Loan Program Rev. Bonds (Detroit Water and Sewerage Dept., Sewage Disposal System Rev. and Rev. Ref. Local Project Bonds), Series 2014-C-5, National insured, 5.00% 2020 | 750 | 782 | ||||||
| Fin. Auth., Local Government Loan Program Rev. Bonds (Detroit Water and Sewerage Dept., Sewage Disposal System Rev. Ref. Local Project Bonds), Series 2015-C, 5.00% 2027 | 250 | 277 | ||||||
| Hospital Fin. Auth., Hospital Rev. Ref. Bonds (Henry Ford Health System), Series 2016, 5.00% 2026 | 1,500 | 1,708 | ||||||
| Hospital Fin. Auth., Hospital Rev. Ref. Bonds (Trinity Health Credit Group), Series 2008-C, 5.00% 2021 | 650 | 701 | ||||||
| Hospital Fin. Auth., Hospital Rev. Ref. Bonds (Trinity Health Credit Group), Series 2008-C, 5.00% 2022 | 475 | 522 | ||||||
| Housing Dev. Auth., Single Family Mortgage Rev. Bonds, Series 2014, 4.00% 2044 | 1,155 | 1,187 | ||||||
| Housing Dev. Auth., Single Family Mortgage Rev. Bonds, Series 2016-B, 3.50% 2047 | 500 | 509 | ||||||
| Housing Dev. Auth., Single Family Mortgage Rev. Bonds, Series 2017-B, 3.50% 2048 | 415 | 424 | ||||||
| Housing Dev. Auth., Single Family Mortgage Rev. Bonds, Series 2018-A, 4.00% 2048 | 900 | 938 | ||||||
| Housing Dev. Auth., Single Family Mortgage Rev. Bonds, Series 2018-C, 4.25% 2049 | 3,430 | 3,618 | ||||||
| Strategic Fund, Limited Obligation Rev. Ref. Bonds (Detroit Edison Co. Exempt Facs. Project), Series 1995-CC, 1.45% 2030 (put 2021) | 1,000 | 958 | ||||||
| Strategic Fund, Limited Obligation Rev. Ref. Bonds (Detroit Edison Co. Exempt Facs. Project), Series 2008-KT, 5.625% 2020 | 1,160 | 1,219 | ||||||
| County of Wayne, Airport Auth., Airport Rev. Bonds (Detroit Metropolitan Wayne County Airport), Series 2018-A, 5.00% 2029 | 990 | 1,143 | ||||||
| Wayne County, Airport Auth., Airport Rev. Bonds (Detroit Metropolitan Wayne County Airport), Series 2012-A, 5.00% 2022 | 850 | 935 | ||||||
| 17,465 | ||||||||
| Minnesota 1.91% | ||||||||
| City of Coon Rapids, Multi Family Housing Rev. Ref. Bonds (Drake Apartments Project), Series 2018-A, 2.20% 2021 (put 2020) | 300 | 299 | ||||||
| Various Purpose G.O. Bonds, Series 2018-A, 5.00% 2027 | 990 | 1,168 | ||||||
| Various Purpose G.O. Ref. Bonds, Series 2017-D, 5.00% 2024 | 1,500 | 1,709 | ||||||
| Housing Fin. Agcy., Homeownership Fin. Bonds (Mortgage-Backed Securities Program), Series 2010-A, 4.25% 2028 | 90 | 91 | ||||||
| Housing Fin. Agcy., Residential Housing Fin. Bonds, Series 2012-D, 4.00% 2040 | 175 | 178 | ||||||
| Housing Fin. Agcy., Residential Housing Fin. Bonds, Series 2014-B, 4.00% 2038 | 575 | 592 | ||||||
| Housing Fin. Agcy., Residential Housing Fin. Bonds, Series 2015-B, 3.50% 2046 | 1,400 | 1,426 | ||||||
| Housing Fin. Agcy., Residential Housing Fin. Bonds, Series 2017-B, 4.00% 2047 | 1,090 | 1,128 | ||||||
| Housing Fin. Agcy., Residential Housing Fin. Bonds, Series 2017-E, 4.00% 2048 | 480 | 499 | ||||||
| Housing Fin. Agcy., Residential Housing Fin. Bonds, Series 2018-B, 4.00% 2048 | 495 | 517 | ||||||
| 20 | Private Client Services Funds |
Capital Group Core Municipal Fund
| Bonds, notes & other debt instruments | Principal amount (000) | Value (000) | ||||||
| City of Maplewood, Multi Family Housing Rev. Ref. Bonds (Maple Pond Apartments Project), Series 2018-A, 2.20% 2021 (Put 2020)3 | $ | 600 | $ | 599 | ||||
| City of St. Paul, Housing and Redev. Auth., Multi Family Housing Rev. Bonds (Millberry Apartments Project), Series 2018-A, 2.15% 2021 (put 2020) | 250 | 249 | ||||||
| City of St. Paul, Housing and Redev. Auth., Multi Family Housing Rev. Bonds (Millberry Apartments Project), Series 2018-A, 2.20% 2021 (put 2020) | 600 | 598 | ||||||
| 9,053 | ||||||||
| Mississippi 0.45% | ||||||||
| Gaming Tax Rev. Ref. Bonds, Series 2015-E, 5.00% 2026 | 500 | 562 | ||||||
| Hospital Equipment and Facs. Auth., Rev. Bonds (Baptist Memorial Health Care), Series 2015-A, 5.00% 2021 | 1,490 | 1,573 | ||||||
| 2,135 | ||||||||
| Missouri 1.26% | ||||||||
| Health and Educational Facs. Auth., Health Facs. Rev. Bonds (Saint Luke’s Health System, Inc.), Series 2016, 5.00% 2026 | 1,435 | 1,626 | ||||||
| Housing Dev. Commission, Single Family Mortgage Rev. Bonds (First Place Homeownership Loan Program), Series 2016-B, 3.50% 2041 | 2,675 | 2,732 | ||||||
| Housing Dev. Commission, Single Family Mortgage Rev. Bonds (First Place Homeownership Loan Program), Series 2017-B, 3.25% 20474 | 544 | 531 | ||||||
| Housing Dev. Commission, Single Family Mortgage Rev. Bonds (Special Homeownership Loan Program), Series 2014-A, 4.00% 2041 | 830 | 856 | ||||||
| Housing Dev. Commission, Single Family Mortgage Rev. Bonds (Special Homeownership Loan Program), Series 2015-A, 3.75% 2038 | 195 | 201 | ||||||
| City of Lee’s Summit, I-470 and 350 Transportation Dev. Dist., Transportation Sales Tax Rev. Ref. and Improvement Bonds, Series 2007, RADIAN insured, 4.60% 2029 | 15 | 15 | ||||||
| 5,961 | ||||||||
| Montana 0.05% | ||||||||
| Board of Housing, Single Family Mortgage Bonds, Series 2016-A-2, 3.50% 2044 | 220 | 224 | ||||||
| Nebraska 1.81% | ||||||||
| Central Plains Energy Project, Gas Supply Rev. Ref. Bonds, Series 2014, 5.00% 2039 (put 2019) | 1,250 | 1,284 | ||||||
| Investment Fin. Auth., Single Family Housing Rev. Bonds, Series 2013-A, 3.00% 2043 | 135 | 136 | ||||||
| Investment Fin. Auth., Single Family Housing Rev. Bonds, Series 2014-A, 4.00% 2044 | 290 | 299 | ||||||
| Investment Fin. Auth., Single Family Housing Rev. Bonds, Series 2015-C, 3.50% 2045 | 825 | 840 | ||||||
| Investment Fin. Auth., Single Family Housing Rev. Bonds, Series 2016-A, 3.50% 2046 | 2,235 | 2,280 | ||||||
| Investment Fin. Auth., Single Family Housing Rev. Bonds, Series 2016-C, 3.50% 2046 | 290 | 295 | ||||||
| Investment Fin. Auth., Single Family Housing Rev. Bonds, Series 2018-A, 4.00% 2048 | 980 | 1,022 | ||||||
| Investment Fin. Auth., Single Family Housing Rev. Bonds, Series 2018-C, 4.00% 2048 | 2,310 | 2,411 | ||||||
| 8,567 | ||||||||
| Nevada 2.33% | ||||||||
| Clark County School Dist., Limited Tax G.O. Building and Rev. Ref. Bonds, Series 2017-A, 5.00% 2026 | 620 | 699 | ||||||
| Clark County School Dist., Limited Tax G.O. Building and Rev. Ref. Bonds, Series 2017-C, 5.00% 2020 | 600 | 626 | ||||||
| Clark County School Dist., Limited Tax G.O. Building and Rev. Ref. Bonds, Series 2017-C, 5.00% 2027 | 750 | 850 | ||||||
| Clark County School Dist., Limited Tax G.O. Building Bonds, Series 2018-A, 5.00% 2029 | 1,000 | 1,133 | ||||||
| Clark County School Dist., Limited Tax G.O. Rev. Ref. Bonds, Series 2016-D, 5.00% 2023 | 1,000 | 1,098 | ||||||
| County of Clark, Las Vegas-McCarran International Airport, Passenger Fac. Charge Rev. Ref. Bonds, Series 2015-C, 5.00% 2024 | 2,705 | 3,049 | ||||||
| Private Client Services Funds | 21 |
Capital Group Core Municipal Fund
| Bonds, notes & other debt instruments (continued) | Principal amount (000) | Value (000) | ||||||
| Nevada (continued) | ||||||||
| County of Clark, Limited Tax G.O. Stadium Improvement Bonds, Series 2018-A, 5.00% 2025 | $ | 1,000 | $ | 1,147 | ||||
| County of Clark, Pollution Control Rev. Ref. Bonds (Southern California Edison Company), Series 2010, 1.875% 2031 (put 2020) | 2,000 | 1,979 | ||||||
| City of Henderson, Local Improvement Dist. No. T-17 (Madeira Canyon), Limited Obligation Ref. Bonds, Series 2017, 2.00% 2023 | 490 | 460 | ||||||
| 11,041 | ||||||||
| New Hampshire 0.65% | ||||||||
| Health and Education Facs. Auth., Rev. Bonds (Southern New Hampshire University), Series 2017, 5.00% 2020 | 300 | 309 | ||||||
| Health and Education Facs. Auth., Rev. Bonds (Southern New Hampshire University), Series 2017, 5.00% 2021 | 600 | 633 | ||||||
| Health and Education Facs. Auth., Rev. Bonds (Southern New Hampshire University), Series 2017, 5.00% 2022 | 320 | 344 | ||||||
| Health and Education Facs. Auth., Rev. Bonds (University System of New Hampshire Issue), Series 2017-A, 5.00% 2022 | 500 | 547 | ||||||
| Health and Education Facs. Auth., Rev. Bonds (University System of New Hampshire Issue), Series 2017-A, 5.00% 2023 | 600 | 667 | ||||||
| Health and Education Facs. Auth., Rev. Bonds (Southern New Hampshire University), Series 2012, 4.00% 2022 | 575 | 600 | ||||||
| 3,100 | ||||||||
| New Jersey 2.61% | ||||||||
| Atlantic City, Tax Appeal Rev. Ref. Bonds, Series 2017-A, BAM insured, 5.00% 2020 | 100 | 103 | ||||||
| Atlantic City, Tax Appeal Rev. Ref. Bonds, Series 2017-A, BAM insured, 5.00% 2022 | 200 | 214 | ||||||
| Econ. Dev. Auth., Cigarette Tax Rev. Ref. Bonds, Series 2012, 5.00% 2019 | 1,200 | 1,219 | ||||||
| Econ. Dev. Auth., School Facs. Construction Bonds, Series 2005-K, 5.50% 2019 | 550 | 568 | ||||||
| Econ. Dev. Auth., School Facs. Construction Rev. Ref. Bonds, Series 2014-PP, 5.00% 2019 | 1,000 | 1,016 | ||||||
| Econ. Dev. Auth., School Facs. Contruction Rev. Bonds, Series 2013-NN, 5.00% 2020 | 480 | 495 | ||||||
| Garden State Preservation Trust, Open Space and Farmland Preservation Rev. Ref. Bonds, Series 2012-A, 5.00% 2020 | 1,000 | 1,045 | ||||||
| Garden State Preservation Trust, Open Space and Farmland Preservation Rev. Ref. Bonds, Series 2012-A, 5.00% 2021 | 200 | 213 | ||||||
| Housing and Mortgage Fin. Agcy., Multi Family Conduit Rev. Bonds (Georgia King Village Project), Series 2018-E, 2.45% 2021 (put 2020) | 525 | 525 | ||||||
| Housing and Mortgage Fin. Agcy., Single Family Housing Rev. Bonds, Series 2018-A, 4.50% 2048 | 515 | 548 | ||||||
| South Jersey Transportation Auth., Transportation System Rev. Bonds, Series 2012, 5.00% 2020 | 500 | 524 | ||||||
| Tobacco Settlement Fncg. Corp., Tobacco Settlement Bonds, Series 2018-A, 5.00% 2021 | 2,250 | 2,383 | ||||||
| Tobacco Settlement Fncg. Corp., Tobacco Settlement Bonds, Series 2018-A, 5.00% 2029 | 700 | 777 | ||||||
| Transit Corp., Grant Anticipation Notes (Federal Transit Administration Section 5307 Urbanized Area Formula Funds), Series 2014-A, 5.00% 2021 | 1,000 | 1,059 | ||||||
| Transportation Trust Fund Auth., Transportation System Bonds, Series 2008-A, 6.00% 2038 | 1,085 | 1,090 | ||||||
| Transportation Trust Fund Auth., Transportation System Bonds, Series 2016, 5.00% 2019 | 585 | 595 | ||||||
| 12,374 | ||||||||
| New Mexico 0.67% | ||||||||
| City of Farmington, Pollution Control Rev. Ref. Bonds (Southern California Edison Company Four Corners Project), Series 2005-B, 1.875% 2029 (put 2020) | 2,000 | 1,979 | ||||||
| Mortgage Fin. Auth., Tax-Exempt Single Family Mortgage Program Bonds, Series 2018-B-1, Class I, 4.00% 2049 | 1,150 | 1,200 | ||||||
| New Mexico Educational Assistance Foundation, Educational Loan Bonds, Series 2010-1, Class A2, (3-month USD-LIBOR + 0.65%) 2.971% 20281 | 20 | 20 | ||||||
| 3,199 | ||||||||
| 22 | Private Client Services Funds |
Capital Group Core Municipal Fund
| Bonds, notes & other debt instruments | Principal amount (000) | Value (000) | ||||||
| New York 5.06% | ||||||||
| Brooklyn Arena Local Dev. Corp., Pilot Rev. Ref. Bonds (Brooklyn Events Center LLC), Series 2016-A, Assured Guaranty Municipal insured, 5.00% 2022 | $ | 210 | $ | 228 | ||||
| Build NYC Resource Corp., Rev. Ref. Bonds (Ethical Culture Fieldston School Project), Series 2015, 5.00% 2024 | 395 | 443 | ||||||
| Dormitory Auth., State Sales Tax Rev. Bonds, Series 2018-E, 5.00% 2022 | 1,000 | 1,091 | ||||||
| Housing Fin. Agcy., Affordable Housing Rev. Green Bonds, Series 2018-D, 2.35% 2021 | 2,000 | 1,990 | ||||||
| Housing Fin. Agcy., Affordable Housing Rev. Green Bonds, Series 2018-H, 2.75% 2022 | 600 | 600 | ||||||
| Long Island Power Auth., Electric System General Rev. Bonds, Series 2014-C, (1-month USD-LIBOR x 0.70 + 0.75%) 2.329% 2033 (put 2023)1 | 1,000 | 1,000 | ||||||
| Metropolitan Transportation Auth., Transportation Rev. Bonds, Series 2014-D-2, (SIFMA Municipal Swap Index + 0.45%) 2.05% 2044 (put 2022)1 | 750 | 749 | ||||||
| Metropolitan Transportation Auth., Transportation Rev. Bonds, Series 2015-A-2, (SIFMA Municipal Swap Index + 0.58%) 2.18% 2039 (put 2020)1 | 2,000 | 2,003 | ||||||
| Metropolitan Transportation Auth., Transportation Rev. Bonds, Series 2017-C-2A, 4.00% 2019 | 2,000 | 2,022 | ||||||
| Mortgage Agcy., Homeowner Mortgage Rev. Bonds, Series 197, 3.50% 2044 | 2,100 | 2,146 | ||||||
| Mortgage Agcy., Homeowner Mortgage Rev. Bonds, Series 203, 3.50% 2047 | 1,785 | 1,823 | ||||||
| New York City G.O. Bonds, Series 2017-C, 5.00% 2027 | 2,000 | 2,319 | ||||||
| New York City G.O. Bonds, Fiscal 2018, Series 2017-C, 5.00% 2025 | 1,960 | 2,248 | ||||||
| New York City Housing Dev. Corp., Multi Family Housing Rev. Bonds (Sustainable Neighborhood Bonds), Series 2017-G-2-A, 2.00% 2057 (put 2021) | 2,500 | 2,467 | ||||||
| New York City Housing Dev. Corp., Multi Family Rev. Bonds (8 Spruce Street), Series 2014-E, 3.50% 2048 | 320 | 313 | ||||||
| New York City Transitional Fin. Auth., Building Aid Rev. Bonds, Fiscal 2009 Series S-5, 5.00% 2019 (escrowed to maturity) | 100 | 101 | ||||||
| New York City Transitional Fin. Auth., Future Tax Secured Bonds, Fiscal 2019, Series 2018-A-1, 5.00% 2023 | 1,250 | 1,396 | ||||||
| Public Housing Capital Fund Rev. Trust I, Trust Certificates, Series 2012, 4.50% 20222,4 | 300 | 299 | ||||||
| County of Suffolk, Econ. Dev. Corp., Rev. Ref. Bonds (Peconic Landing at Southold, Inc. Project), Series 2010, 3.125% 2030 | 225 | 216 | ||||||
| Thruway Auth., General Rev. Junior Indebtedness Obligations, Series 2013-A, 5.00% 2019 | 500 | 507 | ||||||
| 23,961 | ||||||||
| North Carolina 0.92% | ||||||||
| Housing Fin. Agcy., Home Ownership Rev. Ref. Bonds, Series 38-B, 4.00% 2047 | 1,915 | 1,990 | ||||||
| University of North Carolina at Charlotte, General Rev. Ref. Bonds, Series 2017-A, 5.00% 2023 | 1,000 | 1,117 | ||||||
| University of North Carolina at Greensboro, General Rev. Ref. Bonds, Series 2017, 5.00% 2023 | 1,125 | 1,250 | ||||||
| 4,357 | ||||||||
| North Dakota 0.52% | ||||||||
| Housing Fin. Agcy., Homeownership Rev. Bonds (Home Mortgage Fin. Program), Series 2016-D, 3.50% 2046 | 825 | 841 | ||||||
| Housing Fin. Agcy., Housing Fin. Program Bonds (Home Mortgage Fin. Program), Series 2012-A, 3.75% 2042 | 205 | 209 | ||||||
| Housing Fin. Agcy., Housing Fin. Program Bonds (Home Mortgage Fin. Program), Series 2015-B, 4.00% 2036 | 510 | 525 | ||||||
| Housing Fin. Agcy., Housing Fin. Program Bonds (Home Mortgage Fin. Program), Series 2017-D, 4.00% 2048 | 495 | 515 | ||||||
| Housing Fin. Agcy., Housing Fin. Program Bonds (Home Mortgage Fin. Program), Series 2017-F, 4.00% 2048 | 345 | 359 | ||||||
| 2,449 | ||||||||
| Private Client Services Funds | 23 |
Capital Group Core Municipal Fund
| Bonds, notes & other debt instruments (continued) | Principal amount (000) | Value (000) | ||||||
| Ohio 3.10% | ||||||||
| County of Allen, Hospital Facs. Rev. Bonds (Mercy Health), Series 2017-A, 5.00% 2022 | $ | 700 | $ | 757 | ||||
| County of Allen, Hospital Facs. Rev. Bonds (Mercy Health), Series 2017-B, 5.00% 2047 (put 2022) | 575 | 625 | ||||||
| County of Allen, Hospital Facs. Rev. Ref. Bonds (Catholic Healthcare Partners), Series 2010-B, 5.00% 2019 | 2,000 | 2,046 | ||||||
| County of Allen, Hospital Facs. Rev. Ref. Bonds (Catholic Healthcare Partners), Series 2010-B, 5.00% 2020 | 1,030 | 1,076 | ||||||
| City of Cleveland, Airport System Rev. Ref. Bonds, Series 2009-C, Assured Guaranty insured, 5.00% 2027 | 235 | 236 | ||||||
| City of Cleveland, Airport System Rev. Ref. Bonds, Series 2012-A, 5.00% 2025 | 1,000 | 1,067 | ||||||
| G.O. Bonds, Common Schools Bonds, Series 2018-A, 5.00% 2024 | 1,000 | 1,135 | ||||||
| County of Hamilton, Hospital Facs. Rev. Bonds (UC Health), Series 2014, 5.00% 2025 | 400 | 443 | ||||||
| Higher Education G.O. Rev. Ref. Bonds, Series 2017-C, 5.00% 2026 | 2,000 | 2,330 | ||||||
| Hospital Rev. Ref. Bonds (Cleveland Clinic Health System Obligated Group), Series 2017-A, 5.00% 2024 | 1,650 | 1,854 | ||||||
| Housing Fin. Agcy., Residential Mortgage Rev. Bonds (Mortgage-Backed Securities Program), Series 2017-A, 4.50% 2047 | 1,640 | 1,729 | ||||||
| G.O. Rev. Ref. Bonds, Common Schools Bonds, Series 2017-B, 5.00% 2027 | 990 | 1,166 | ||||||
| County of Warren, Healthcare Facs., Rev. Ref. Bonds (Otterbein Homes Obligated Group), Series 2014, 5.00% 2020 | 200 | 208 | ||||||
| 14,672 | ||||||||
| Oklahoma 0.18% | ||||||||
| Trustees of the Tulsa Airports Improvement Trust, General Airport Rev. Ref. Bonds, Series 2015-D, BAM insured, 5.00% 2020 | 815 | 848 | ||||||
| Oregon 0.79% | ||||||||
| Facs. Auth., Rev. Bonds (University of Portland Projects), Series 2015-A, 5.00% 2031 | 600 | 669 | ||||||
| G.O. Bonds (Veteran’s Welfare Bonds Series 94), Series 2014-H, 4.00% 2044 | 740 | 755 | ||||||
| Housing and Community Services Dept., Mortgage Rev. Bonds (Single Family Mortgage Program), Series 2016-A, 4.00% 2047 | 855 | 884 | ||||||
| Housing and Community Services Dept., Mortgage Rev. Bonds (Single Family Mortgage Program), Series 2017-A, 4.00% 2047 | 1,160 | 1,205 | ||||||
| Housing and Community Services Dept., Mortgage Rev. Bonds (Single Family Mortgage Program), Series 2018-A, 4.50% 2049 | 200 | 213 | ||||||
| 3,726 | ||||||||
| Pennsylvania 3.91% | ||||||||
| County of Allegheny, Airport Auth., Airport Rev. Bonds, Series 2013-A, 5.00% 2022 | 400 | 431 | ||||||
| County of Allegheny, Hospital Dev. Auth. Rev. Bonds (Allegheny Health Network Obligated Group Issue), Series 2018-A, 5.00% 2026 | 385 | 430 | ||||||
| County of Butler, Hospital Facs. Rev. Bonds (Butler Health System Project), Series 2015-A, 4.00% 2021 | 325 | 336 | ||||||
| East Hempfield Township, Industrial Dev. Auth., Rev. and Rev. Ref. Bonds (Willow Valley Communities Project), Series 2016, 5.00% 2023 | 300 | 329 | ||||||
| Fncg. Auth., Rev. Bonds (Tobacco Master Settlement Payment), Series 2018, 5.00% 2020 | 750 | 779 | ||||||
| Fncg. Auth., Rev. Bonds (Tobacco Master Settlement Payment), Series 2018, 5.00% 2021 | 375 | 397 | ||||||
| Higher Educational Facs. Auth., Rev. Ref. Bonds (Drexel University), Series 2017, 5.00% 2021 | 1,250 | 1,329 | ||||||
| Housing Fin. Agcy., Single Family Mortgage Rev. Bonds, Series 2017-122, 4.00% 2046 | 1,795 | 1,864 | ||||||
| County of Montgomery, Higher Education and Health Auth., Hospital Rev. Bonds (Abington Memorial Hospital Obligated Group), Series 2012-A, 5.00% 2031 (preref. 2022) | 325 | 355 | ||||||
| County of Montgomery, Higher Education and Health Auth., Rev. Bonds, Series 2018-A, 2.32% 2051 (put 2023)1 | 400 | 400 | ||||||
| County of Montgomery, Industrial Dev. Auth., Rev. Bonds (Foulkeways at Gwynedd Project), Series 2016, 5.00% 2026 | 400 | 440 | ||||||
| 24 | Private Client Services Funds |
Capital Group Core Municipal Fund
| Bonds, notes & other debt instruments | Principal amount (000) | Value (000) | ||||||
| County of Montour, Geisinger Auth. Health System Rev. Bonds (Geisinger Health System), Series 2014-B, (1-month USD-LIBOR x 0.67 + 1.07%) 2.607% 2028 (put 2024)1 | $ | 1,500 | $ | 1,531 | ||||
| County of Northampton, General Purpose Auth., Hospital Rev. Bonds (St. Luke’s University Health Network Project), Series 2018-B, (1-month USD-LIBOR x 0.70 + 1.04%) 2.619% 2048 (put 2022)1 | 175 | 175 | ||||||
| Philadelphia School Dist., G.O. Bonds, Series 2018-A, 5.00% 2020 | 750 | 785 | ||||||
| Philadelphia School Dist., Rev. Ref. G.O. Bonds, Series 2016-F, 5.00% 2023 | 1,500 | 1,641 | ||||||
| City of Pittsburgh, Urban Redev. Auth., Rev. Bonds (Crawford Square Apartments Project), Series 2018, 2.25% 2020 (put 2020) | 660 | 658 | ||||||
| Scranton School Dist., G.O. Bonds, Series 2017-E, BAM insured, 5.00% 2026 | 1,000 | 1,110 | ||||||
| Turnpike Commission, Turnpike Rev. Bonds, Series 2005-A, Assured Guaranty Municipal insured, 5.25% 2025 | 1,000 | 1,159 | ||||||
| Turnpike Commission, Turnpike Rev. Bonds, Series 2014-B-1, (SIFMA Municipal Swap Index + 0.98%) 2.58% 20211 | 950 | 961 | ||||||
| University of Pittsburgh - Of the Commonwealth System of Higher Education Panthers, Series 2018, (SIFMA Municipal Swap Index + 0.24%) 1.84% 20211 | 1,000 | 1,000 | ||||||
| County of York, Industrial Dev. Auth., Pollution Control Rev. Ref. Bonds (Philadelphia Electric Co. Project), Series 1993-A, 2.55% 2036 (put 2020) | 2,440 | 2,425 | ||||||
| 18,535 | ||||||||
| Puerto Rico 0.66% | ||||||||
| Industrial, Tourist, Educational, Medical and Environmental Control Facs. Fncg. Auth., Higher Education Rev. and Rev. Ref. Bonds (Inter American University of Puerto Rico Project), Series 2012, 5.00% 2019 | 710 | 718 | ||||||
| Industrial, Tourist, Educational, Medical and Environmental Control Facs. Fncg. Auth., Hospital Rev. and Rev. Ref. Bonds (Hospital Auxilio Mutuo Obligated Group Project), Series 2011-A, 5.00% 2019 | 1,340 | 1,356 | ||||||
| Infrastructure Fncg. Auth., Special Tax Rev. Ref. Bonds, Series 2005-C, 5.50% 2020 | 1,000 | 1,049 | ||||||
| 3,123 | ||||||||
| Rhode Island 0.30% | ||||||||
| Commerce Corp., Grant Anticipation Rev. Ref. Bonds (Dept. of Transportation), Series 2016-A, 5.00% 2022 | 500 | 545 | ||||||
| Commerce Corp., Grant Anticipation Rev. Ref. Bonds (Dept. of Transportation), Series 2016-A, 5.00% 2023 | 500 | 555 | ||||||
| Health and Educational Building Corp., Hospital Fncg. Rev. Ref. Bonds (Lifespan Obligated Group Issue), Series 2016, 5.00% 2023 | 300 | 328 | ||||||
| 1,428 | ||||||||
| South Carolina 1.67% | ||||||||
| Housing Fin. and Dev. Auth., Mortgage Rev. Bonds, Series 2017-A, 4.00% 2047 | 705 | 729 | ||||||
| Housing Fin. and Dev. Auth., Mortgage Rev. Bonds, Series 2017-B, 4.00% 2047 | 175 | 182 | ||||||
| Housing Fin. and Dev. Auth., Mortgage Rev. Ref. Bonds, Series 2016-A, 4.00% 2036 | 1,035 | 1,069 | ||||||
| Jobs-Econ. Dev. Auth., Hospital Rev. Ref. Bonds (Palmetto Health), Series 2013-A, 5.00% 2023 (escrowed to maturity) | 2,730 | 3,044 | ||||||
| County of Lexington, Health Services Dist., Inc., Hospital Rev. Ref. Bonds, Series 2017, 5.00% 2022 | 600 | 652 | ||||||
| County of Lexington, Health Services Dist., Inc., Hospital Rev. Ref. Bonds, Series 2017, 5.00% 2024 | 500 | 556 | ||||||
| Public Service Auth., Rev. Obligations (Santee Cooper), Series 2012-D, 5.00% 2028 | 1,000 | 1,052 | ||||||
| Public Service Auth., Rev. Obligations (Santee Cooper), Series 2014-C, 5.00% 2022 | 350 | 379 | ||||||
| Housing Fin. and Dev. Auth., Mortgage Rev. Bonds, Series 2011-1, 4.50% 2030 | 225 | 229 | ||||||
| 7,892 | ||||||||
| Private Client Services Funds | 25 |
Capital Group Core Municipal Fund
| Bonds, notes & other debt instruments (continued) | Principal amount (000) | Value (000) | ||||||
| South Dakota 0.81% | ||||||||
| Housing Dev. Auth., Homeownership Mortgage Bonds, Series 2014-E, 4.00% 2044 | $ | 1,430 | $ | 1,476 | ||||
| Housing Dev. Auth., Homeownership Mortgage Bonds, Series 2016-D, 3.50% 2046 | 435 | 444 | ||||||
| Housing Dev. Auth., Homeownership Mortgage Bonds, Series 2017-B, 4.00% 2047 | 1,840 | 1,914 | ||||||
| 3,834 | ||||||||
| Tennessee 1.58% | ||||||||
| Housing Dev. Agcy., Homeownership Program Bonds, Series 2012-1-C, 4.50% 2037 | 315 | 324 | ||||||
| Housing Dev. Agcy., Homeownership Program Bonds, Series 2012-2-C, 4.00% 2038 | 350 | 357 | ||||||
| Housing Dev. Agcy., Housing Fin. Program Bonds, Series 2010-A-1, 5.00% 2027 | 45 | 45 | ||||||
| Housing Dev. Agcy., Residential Fin. Program Bonds, Series 2014-2-A, 4.00% 2045 | 675 | 696 | ||||||
| Housing Dev. Agcy., Residential Fin. Program Bonds, Series 2015-2-A, 4.00% 2046 | 1,025 | 1,059 | ||||||
| Housing Dev. Agcy., Residential Fin. Program Bonds, Series 2017-1, 4.00% 2042 | 830 | 862 | ||||||
| Housing Dev. Agcy., Residential Fin. Program Bonds, Series 2017-B-2, 4.00% 2042 | 845 | 877 | ||||||
| City of Memphis, Electric System Rev. Ref. Bonds, Series 2008, 5.00% 2018 | 100 | 100 | ||||||
| Metropolitan Government of Nashville and Davidson County, G.O. Improvement Bonds, Series 2013-A, 5.00% 2026 (preref. 2023) | 1,020 | 1,130 | ||||||
| Metropolitan Government of Nashville and Davidson County, Health and Educational Facs. Board, Collateralized Multi Family Housing Rev. Bonds (Trevecca Towers II Project), Series 2018, 2.00% 2022 (put 2021) | 2,075 | 2,061 | ||||||
| 7,511 | ||||||||
| Texas 14.27% | ||||||||
| Arlington Higher Education Fin. Corp., Education Rev. and Rev. Ref. Bonds (Uplift Education), Series 2017-A, 5.00% 2023 | 885 | 982 | ||||||
| Arlington Higher Education Fin. Corp., Education Rev. and Rev. Ref. Bonds (Uplift Education), Series 2017-A, 5.00% 2024 | 400 | 449 | ||||||
| Arlington Higher Education Fin. Corp., Education Rev. Bonds (Uplift Education), Series 2017-B, 5.00% 2026 | 450 | 515 | ||||||
| Arlington Higher Education Fin. Corp., Education Rev. Bonds (Uplift Education), Series 2017-B, 5.00% 2027 | 250 | 288 | ||||||
| City of Arlington, Permanent Improvement Rev. Ref. Bonds, Series 2018, 5.00% 2024 | 1,535 | 1,740 | ||||||
| Austin Convention Enterprises, Convention Center Hotel Rev. Ref. Bonds, Series 2017-A, 5.00% 2019 | 350 | 351 | ||||||
| Austin Convention Enterprises, Convention Center Hotel Rev. Ref. Bonds, Series 2017-A, 5.00% 2020 | 850 | 877 | ||||||
| City of Austin, Water and Wastewater System Rev. Ref. Bonds (Travis, Williamson and Hays Counties), Series 2015-A, 5.00% 2022 | 900 | 992 | ||||||
| Beaumont Independent School Dist., Unlimited Tax Rev. Ref. Bonds, Series 2017, 5.00% 2026 | 1,500 | 1,732 | ||||||
| County of Bexar, Combination Tax and Rev. Certificates of Obligation, Series 2013-B, 5.00% 2025 | 500 | 558 | ||||||
| Clear Creek Independent School Dist., Unlimited Tax School Building Bonds, Series 2018, 5.00% 2028 | 1,100 | 1,274 | ||||||
| Clifton Higher Education Fin. Corp., Education Rev. and Ref. Bonds (Idea Public Schools), Series 2017, 5.00% 2027 | 650 | 747 | ||||||
| Clifton Higher Education Fin. Corp., Education Rev. Bonds (Idea Public Schools), Series 2018, 5.00% 2025 | 500 | 565 | ||||||
| Comal Independent School Dist., Unlimited Tax School Building Bonds, Series 2017, 5.00% 2026 | 1,000 | 1,154 | ||||||
| Port of Corpus Christi, Senior Lien Rev. Bonds, Series 2018-A, 5.00% 2027 | 490 | 570 | ||||||
| Cypress-Fairbanks Independent School Dist., Unlimited Tax School Building Bonds, Series 2017-A-3, 3.00% 2043 (put 2020) | 1,000 | 1,012 | ||||||
| City of Dallas, Waterworks and Sewer System Rev. Ref. Bonds, Series 2016-A, 5.00% 2028 | 955 | 1,096 | ||||||
| City of Denton, Utility System Rev. Bonds, Series 2017, 5.00% 2028 | 2,000 | 2,290 | ||||||
| Denton Independent School Dist., Unlimited Tax Rev. Ref. Bonds, Series 2015, 5.00% 2026 | 1,000 | 1,132 | ||||||
| Dickinson Independent School Dist., Unlimited Tax Rev. Ref. Bonds, Series 2013, 1.35% 2037 (put 2017) | 500 | 497 | ||||||
| 26 | Private Client Services Funds |
Capital Group Core Municipal Fund
| Bonds, notes & other debt instruments | Principal amount (000) | Value (000) | ||||||
| Fort Bend Independent School Dist., Unlimited Tax School Building Bonds, Series 2017-E, 5.00% 2025 | $ | 1,230 | $ | 1,406 | ||||
| Frisco Independent School Dist., Unlimited Tax Rev. Ref. Bonds, Series 2016, 5.00% 2026 | 500 | 575 | ||||||
| County of Harris, Cultural Education Facs. Fin. Corp., Thermal Utility Rev. Bonds (Teco Project), Series 2009-A, 5.00% 2023 (preref. 2019) | 125 | 129 | ||||||
| County of Harris, Cultural Education Facs. Fin. Corp., Thermal Utility Rev. Bonds (Teco Project), Series 2010, 5.00% 2018 | 275 | 275 | ||||||
| County of Harris, Health Facs. Dev. Corp., Hospital Rev. Ref. Bonds (Memorial Hermann Healthcare System), Series 2013-B, (SIFMA Municipal Swap Index + 0.90%) 2.50% 20221 | 250 | 254 | ||||||
| County of Harris, Health Facs. Dev. Corp., Rev. Ref. Bonds (CHRISTUS Health), Series 2005-A-4, Assured Guaranty Municipal insured, 1.99% 20311 | 150 | 150 | ||||||
| County of Harris, Sports Auth., Rev. Ref. Bonds, Series 2014-A, Assured Guaranty Municipal insured, 5.00% 2019 | 400 | 412 | ||||||
| Harris County, Toll Road Rev. Ref. Bonds, Series 2012-B, (SIFMA Municipa Swap index + 0.45%) 2.05% 20211 | 2,850 | 2,850 | ||||||
| Dept. of Housing and Community Affairs, Multi Family Housing Rev. Bonds (Springs Apartments), Series 2018, 2.23% 2021 (put 2020)3 | 1,500 | 1,496 | ||||||
| City of Houston, Airport System Rev. and Rev. Ref. Bonds, Series 2018-B, 5.00% 2025 | 1,500 | 1,712 | ||||||
| City of Houston, Airport System Rev. and Rev. Ref. Bonds, Series 2018-B, 5.00% 2028 | 1,000 | 1,164 | ||||||
| City of Houston, Combined Utility System, Rev. and Rev. Ref. Bonds, Series 2016-B, 5.00% 2027 | 500 | 576 | ||||||
| City of Houston, Higher Education Fin. Corp., Higher Education Rev. bonds (Rice University Project), Series 2010-A, 5.00% 2040 (preref. 2020) | 1,410 | 1,470 | ||||||
| City of Houston, Public Improvement Rev. Ref. Bonds, Series 2017-A, 5.00% 2022 | 250 | 272 | ||||||
| Houston Independent School Dist., Limited Tax Schoolhouse Bonds, Series 2014-A-1B, 2.20% 2039 (put 2020)3 | 1,870 | 1,868 | ||||||
| Houston Independent School Dist., Limited Tax Schoolhouse Bonds, Series 2017, 3.00% 2021 | 1,300 | 1,323 | ||||||
| Katy Independent School Dist., Rev. Ref. Bonds, Series 2015-C, (1-month USD-LIBOR x 0.67 + 0.55%) 2.077% 2036 (put 2019)1 | 750 | 751 | ||||||
| Keller Independent School Dist., Unlimited Tax Rev. Ref. Bonds., Series 2014-A, 5.00% 2024 | 1,500 | 1,699 | ||||||
| Klein Independent School Dist., Unlimited Tax Schoolhouse Bonds, Series 2018, 5.00% 2024 | 1,000 | 1,123 | ||||||
| Lamar Consolidated Independent School Dist., Rev. Ref. Bonds, Series 2012-B, 5.00% 2022 | 1,000 | 1,087 | ||||||
| Lewisville Independent School Dist., Unlimited Tax Rev. Ref. Bonds, Series 2017, 5.00% 2027 | 1,115 | 1,283 | ||||||
| Lower Colorado River Auth., Transmission Contract Rev. Ref. and Improvement Bonds (LCRA Transmission Services Corp. Project), Series 2018, 5.00% 2021 | 1,000 | 1,067 | ||||||
| Lower Colorado River Auth., Transmission Contract Rev. Ref. Bonds (LCRA Transmission Services Corp. Project), Series 2018, 5.00% 2024 | 250 | 281 | ||||||
| Board of Regents of the Texas A&M University System, Rev. Fncg. System Bonds, Series 2017-E, 5.00% 2022 | 1,425 | 1,558 | ||||||
| New Hope Cultural Education Facs. Fin. Corp., Retirement Fac. Rev. Bonds (Westminster Project), Series 2016, 5.00% 2028 | 200 | 217 | ||||||
| North East Independent School Dist., Unlimited Tax Rev. Ref. Bonds, Series 2017, 2.375% 2047 (put 2022) | 500 | 497 | ||||||
| North Texas Tollway Auth., System Rev. Ref. Bonds, Series 2012-C, 1.95% 2038 (put 2019) | 1,700 | 1,700 | ||||||
| North Texas Tollway Auth., System Rev. Ref. Bonds, Series 2015-A, 5.00% 2030 | 300 | 331 | ||||||
| City of Olmos Park, Higher Education Facs. Corp., Higher Education Rev. Improvement and Ref. Bonds (University of the Incarnate Word Project), Series 2012, 5.00% 2019 | 980 | 1,009 | ||||||
| Pasadena Independent School Dist., Unlimited Tax School Building Bonds, Series 2018, 5.00% 2020 | 1,450 | 1,504 | ||||||
| Public Fin. Auth., G.O. Rev. Ref. Bonds, Series 2018-A, 5.00% 2022 | 555 | 611 | ||||||
| Red River Education Fin. Corp., Higher Education Rev. Ref. Bonds (St. Edward’s University Project), Series 2017, 5.00% 2019 | 750 | 762 | ||||||
| Sam Rayburn Municipal Power Agcy., Power Supply System Rev. Ref. Bonds, Series 2012, 5.00% 2020 | 1,180 | 1,235 | ||||||
| City of San Antonio, Electric and Gas Systems Rev. Ref. Bonds, Series 2012, 5.25% 2024 | 930 | 1,058 | ||||||
| Private Client Services Funds | 27 |
Capital Group Core Municipal Fund
| Bonds, notes & other debt instruments (continued) | Principal amount (000) | Value (000) | ||||||
| Texas (continued) | ||||||||
| City of San Antonio, Electric and Gas Systems Rev. Ref. Bonds, Series 2015-A, 2.25% 2033 (put 2019) | $ | 1,000 | $ | 1,001 | ||||
| City of San Antonio, Electric and Gas Systems Rev. Ref. Bonds, Series 2015-C, 3.00% 2045 (put 2019) | 1,000 | 1,009 | ||||||
| City of San Antonio, Electric and Gas Systems Rev. Ref. Bonds, Series 2015-D, 3.00% 2045 (put 2020) | 1,000 | 1,012 | ||||||
| City of San Antonio, Electric and Gas Systems Rev. Ref. Bonds, Series 2016, 5.00% 2028 | 1,000 | 1,145 | ||||||
| Sherman Independent School Dist., Unlimited Tax School Building Bonds, Series 2018-A, 5.00% 2027 | 1,000 | 1,158 | ||||||
| Board of Regents of the Texas Tech University System, Rev. Fncg. System Rev. Ref. and Improvement Bonds, Series 2017-A, 5.00% 2026 | 1,000 | 1,145 | ||||||
| Transportation Commission, G.O. Mobility Fund and Rev. Ref. Bonds, Series 2014-A, 5.00% 2023 | 1,165 | 1,305 | ||||||
| Board of Regents of the University of North Texas System, Rev. Fncg. System Rev. Ref. and Improvement Bonds, Series 2018-A, 5.00% 2025 | 240 | 274 | ||||||
| Board of Regents of the University of North Texas System, Rev. Fncg. System Rev. Ref. and Improvement Bonds, Series 2018-A, 5.00% 2026 | 760 | 875 | ||||||
| Water Dev. Board, State Water Implementation Rev. Fund, Rev. Bonds (Master Trust), Series 2015-A, 5.00% 2024 | 1,100 | 1,242 | ||||||
| Water Dev. Board, State Water Implementation Rev. Fund, Rev. Bonds (Master Trust), Series 2018-A, 5.00% 2023 | 1,310 | 1,466 | ||||||
| Water Dev. Board, State Water Implementation Rev. Fund, Rev. Bonds (Master Trust), Series 2018-A, 5.00% 2029 | 2,990 | 3,484 | ||||||
| 67,642 | ||||||||
| Utah 0.24% | ||||||||
| Housing Corp., Single Family Mortgage Bonds, Class III, Series 2015-D-2, 4.00% 2045 | 470 | 486 | ||||||
| School Fin. Auth., Charter School Rev. Bonds (Utah Charter Academies Project), Series 2018, 4.00% 2021 | 310 | 321 | ||||||
| School Fin. Auth., Charter School Rev. Bonds (Utah Charter Academies Project), Series 2018, 4.00% 2022 | 335 | 350 | ||||||
| 1,157 | ||||||||
| Vermont 0.07% | ||||||||
| Housing Fin. Agcy., Multiple Purpose Bonds, Series 2018-A, 4.00% 2048 | 340 | 354 | ||||||
| Virginia 0.64% | ||||||||
| City of Chesapeake, Chesapeake Transportation System Toll Road Rev. Ref. Bonds, Series 2012-A, 4.00% 2019 | 850 | 860 | ||||||
| Commonwealth Transportation Board, Federal Transportation Grant Anticipation Rev. and Rev. Ref. Notes, Series 2017, 5.00% 2022 | 2,000 | 2,179 | ||||||
| 3,039 | ||||||||
| Washington 3.53% | ||||||||
| Various Purpose G.O. Bonds, Series 2012-A, 5.00% 2025 (preref. 2021) | 1,390 | 1,495 | ||||||
| Various Purpose G.O. Bonds, Series 2017-D, 5.00% 2028 | 1,000 | 1,159 | ||||||
| Various Purpose G.O. Bonds, Series 2018-C, 5.00% 2026 | 1,500 | 1,734 | ||||||
| Various Purpose G.O. Bonds, Series 2018-C, 5.00% 2027 | 1,445 | 1,685 | ||||||
| Various Purpose G.O. Rev. Ref. Bonds, Series 2013-R-C, 5.00% 2021 | 530 | 569 | ||||||
| Various Purpose G.O. Rev. Ref. Bonds, Series 2018-R-D, 5.00% 2026 | 990 | 1,152 | ||||||
| County of Grant, Public Utility Dist. No. 2, Electric System Rev. Ref. Bonds, Series 2017-N, 2.00% 2044 (put 2020) | 1,000 | 991 | ||||||
| County of Grant, Public Utility Dist. No. 2, Electric System Rev. Ref. Bonds, Series 2017-O, 5.00% 2022 | 670 | 725 | ||||||
| County of Grant, Public Utility Dist. No. 2, Electric System Rev. Ref. Bonds, Series 2017-O, 5.00% 2023 | 555 | 611 | ||||||
| 28 | Private Client Services Funds |
Capital Group Core Municipal Fund
| Bonds, notes & other debt instruments | Principal amount (000) | Value (000) | ||||||
| County of Grant, Public Utility Dist. No. 2, Electric System Rev. Ref. Bonds, Series 2017-O, 5.00% 2024 | $ | 275 | $ | 307 | ||||
| Health Care Facs. Auth., Rev. Bonds (Catholic Health Initiatives), Series 2013-B-1, (SIFMA Municipal Swap Index + 1.00%) 2.60% 2035 (put 2021)1 | 500 | 502 | ||||||
| Health Care Facs. Auth., Rev. Ref. Bonds (Providence Health & Services), Series 2012-B, 5.00% 2042 (put 2021) | 800 | 860 | ||||||
| Health Care Facs. Auth., Rev. Ref. Bonds (Providence St. Joseph Health), Series 2018-B, 5.00% 2027 | 500 | 580 | ||||||
| Housing Fin. Commission, Nonprofit Housing Rev. Ref. Bonds (Horizon House Project), Series 2017, 5.00% 2020 | 480 | 491 | ||||||
| Housing Fin. Commission, Nonprofit Housing Rev. Ref. Bonds (Horizon House Project), Series 2017, 5.00% 2023 | 550 | 587 | ||||||
| Housing Fin. Commission, Single Family Program Bonds, Series 2017-1-N, 4.00% 2047 | 915 | 944 | ||||||
| City of Seattle, Municipal Light and Power Improvement and Rev. Ref. Bonds, Series 2018-C-2, (SIFMA Municipal Swap Index + 0.49%) 2.09% 2046 (put 2023)1 | 2,225 | 2,226 | ||||||
| Port of Seattle, Rev. Bonds, Series 2009-A, 5.25% 2027 (preref. 2019) | 100 | 102 | ||||||
| 16,720 | ||||||||
| West Virginia 0.41% | ||||||||
| Econ. Dev. Auth., Solid Waste Disposal Facs. Rev. Bonds (Appalachian Power Co. - AMOS Project), Series 2009-B, 2.625% 2042 (Put 2022) | 750 | 743 | ||||||
| Econ. Dev. Auth., Solid Waste Disposal Facs. Rev. Ref. Bonds (Appalachian Power Co. - Amos Project), Series 2015-A, 1.90% 2040 (put 2019) | 1,000 | 998 | ||||||
| West Virginia Hospital Fin. Auth., Hospital Rev. Ref. and Improvement Rev. Bonds (Cabell Huntington Hospital Obligated Group), Series 2018-A, 5.00% 2029 | 165 | 185 | ||||||
| 1,926 | ||||||||
| Wisconsin 2.44% | ||||||||
| G.O. Bonds, Series 2015-A, 5.00% 2031 (preref. 2023) | 2,000 | 2,227 | ||||||
| Health and Educational Facs. Auth., Health Facs. Rev. Bonds (SSM Health Care), Series 2018-B, 5.00% 2038 (put 2023) | 1,300 | 1,405 | ||||||
| Health and Educational Facs. Auth., Rev. Bonds (Advocate Aurora Health Care Credit | ||||||||
| Group), Series 2018-C-2, (SIFMA Municipal Swap Index + 0 .45%) 2.05% 2054 (put 2022)1 | 2,000 | 2,001 | ||||||
| Health and Educational Facs. Auth., Rev. Bonds (Advocate Aurora Health Care Credit Group), Series 2018-C-3, (SIFMA Municipal Swap Index + 0 .55%) 2.15% 2054 (put 2023)1 | 1,130 | 1,130 | ||||||
| Housing and Econ. Dev. Auth., Home Ownership Rev. Bonds, Series 2017-C, 4.00% 2048 | 590 | 614 | ||||||
| Housing and Econ. Dev. Auth., Home Ownership Rev. Bonds, Series 2018-B, 4.00% 2048 | 1,180 | 1,228 | ||||||
| Public Fin. Auth., Hospital Rev. Ref. Bonds (Renown Regional Medical Center Project), Series 2016-A, 5.00% 2022 | 300 | 326 | ||||||
| Public Fin. Auth., Tax Increment Fin. Grant Rev. Bonds (Statler Hilton & Dallas Central Library), Series 2016, 0% 2027 | 1,500 | 957 | ||||||
| Transportation Rev. Ref. Bonds, Series 2017-2, 5.00% 2022 | 1,000 | 1,097 | ||||||
| WPPI Energy, Power Supply System Rev. Bonds, Series 2016-A, 5.00% 2026 | 500 | 575 | ||||||
| 11,560 | ||||||||
| Total bonds, notes & other debt instruments (cost: $436,610,000) | 431,670 | |||||||
| Short-term securities 9.31% | ||||||||
| State of Connecticut, Health and Educational Facs. Auth., IAM Commercial Paper, | ||||||||
| Series 2018-S-1, 1.67% 11/6/2018 | 3,000 | 3,000 | ||||||
| State of Illinois, Fin. Auth., Demand Rev. Bonds (University of Chicago Medical Center), Series 2011-A, 1.68% 20441 | 1,500 | 1,500 | ||||||
| State of Maryland, Health and Higher Educational Facs. Auth., IAM Commercial Paper, Series 2018-B, 1.72% 11/1/2018 | 1,000 | 1,000 | ||||||
| State of Maryland, County of Montgomery, IAM Commercial Paper, Series 2009-B, 1.70% 11/7/2018 | 2,000 | 2,000 | ||||||
| Private Client Services Funds | 29 |
Capital Group Core Municipal Fund
| Short-term securities (continued) | Principal amount (000) | Value (000) | ||||||
| State of Massachusetts, G.O. Rev. Anticipation Notes, Series 2018-A, 4.00% 4/25/2019 | $ | 3,000 | $ | 3,030 | ||||
| State of Massachusetts, G.O. Rev. Anticipation Notes, Series 2018-C, 4.00% 6/20/2019 | 3,000 | 3,040 | ||||||
| State of Michigan, Strategic Fund, Demand Limited Obligation Rev. Bonds (Air Products and Chemicals, Inc. Project), Series 2007, 1.67% 20421 | 5,000 | 5,000 | ||||||
| State of Mississippi, Hospital Equipment and Facs. Auth., Rev. Bonds (Baptist Memorial Health Care), Series 2004-B-2, 2.125% 2022 (put 2019)5 | 200 | 200 | ||||||
| State of Missouri, Health and Educational Facs. Auth., Demand Educational Facs. Rev. Bonds (Washington University), Series 1996-A, 1.65% 20301 | 2,800 | 2,800 | ||||||
| State of New York, Metropolitan Transportation Auth., Transportation Rev. Bond Anticipation Notes, Series 2018-A-1, 4.00% 8/15/2019 | 1,500 | 1,522 | ||||||
| State of New York, New York City G.O. Bonds, Fiscal 2014, Series 2013-D-3, 1.68% 20381 | 5,000 | 5,000 | ||||||
| State of New York, New York City Transitional Fin. Auth., Future Tax Secured Bonds, Fiscal 2016, Series 2015-A-4, 1.70% 20411 | 6,385 | 6,385 | ||||||
| State of New York, Triborough Bridge and Tunnel Auth., General Rev. Bonds (MTA Bridges and Tunnels), Series 2003-B-1, 1.69% 20331 | 1,000 | 1,000 | ||||||
| State of Tennessee, City of Clarksville, Public Building Auth., Pooled Fncg. Rev. Bonds, Series 2003, Bank of America LOC, 1.62% 20331 | 565 | 565 | ||||||
| State of Texas, Gulf Coast Industrial Dev. Auth., Rev. Bonds (ExxonMobil Project), Series 2012, 1.68% 20411 | 2,000 | 2,000 | ||||||
| State of Texas, Mission Econ. Dev. Corp., Solid Waste Disposal Rev. Bonds (Allied Waste North America, Inc. Project), Series 2008-A, 1.97% 2020 (put 2019)5 | 575 | 575 | ||||||
| State of Texas, Tax and Rev. Anticipation Notes, Series 2018, 4.00% 8/29/2019 | 500 | 508 | ||||||
| State of Texas, University of Texas, IAM Commercial Paper, Series 2018-A, 1.68% 11/7/2018 | 5,000 | 5,000 | ||||||
| Total short-term securities (cost: $44,133,000) | 44,125 | |||||||
| Total investment securities 100.40% (cost: $480,743,000) | 475,795 | |||||||
| Other assets less liabilities (0.40%) | (1,872 | ) | ||||||
| Net assets 100.00% | $ | 473,923 | ||||||
Futures contracts
| Unrealized | ||||||||||||||||||||
| (depreciation) | ||||||||||||||||||||
| Notional | Value at | appreciation | ||||||||||||||||||
| Number of | amount | 6 | 10/31/2018 | 7 | at 10/31/2018 | |||||||||||||||
| Contracts | Type | contracts | Expiration | (000) | (000) | (000) | ||||||||||||||
| 2 Year U.S. Treasury Note Futures | Long | 45 | January 2019 | $ 9,000 | $ 9,479 | $ (29 | ) | |||||||||||||
| 5 Year U.S. Treasury Note Futures | Long | 130 | January 2019 | 13,000 | 14,610 | 18 | ||||||||||||||
| $ (11 | ) | |||||||||||||||||||
| 1 | Coupon rate may change periodically. For short-term securities, the date of the next scheduled coupon rate change is considered to be the maturity date. |
| 2 | Acquired in a transaction exempt from registration under Rule 144A of the Securities Act of 1933. May be resold in the U.S. in transactions exempt from registration, normally to qualified institutional buyers. The total value of all such securities was $3,445,000, which represented .73% of the net assets of the fund. |
| 3 | Step bond; coupon rate may change at a later date. |
| 4 | Principal payments may be made periodically. Therefore, the effective maturity date may be earlier than the stated maturity date. |
| 5 | For short-term securities, the mandatory put date is considered to be the maturity date. |
| 6 | Notional amount is calculated based on the number of contracts and notional contract size. |
| 7 | Value is calculated based on the notional amount and current market price. |
| 30 | Private Client Services Funds |
Capital Group Core Municipal Fund
Key to abbreviations and symbol
Agcy. = Agency
AMT = Alternative Minimum Tax
Auth. = Authority
Certs. of Part. = Certificates of Participation
Dept. = Department
Dev. = Development
Dist. = District
Econ. = Economic
Fac. = Facility
Facs. = Facilities
Fin. = Finance
Fncg. = Financing
G.O. = General Obligation
LIBOR = London Interbank Offered Rate
LOC = Letter of Credit
Preref. = Prerefunded
Redev. = Redevelopment
Ref. = Refunding
Rev. = Revenue
SIFMA = Securities Industry and Financial Markets Association
TECP = Tax-Exempt Commercial Paper
| Private Client Services Funds | 31 |
Capital Group Short-Term Municipal Fund
Investment portfolio October 31, 2018
| Bonds, notes & other debt instruments 91.37% | Principal amount (000) | Value (000) | ||||||
| Alabama 0.56% | ||||||||
| 21st Century Auth., Tobacco Settlement Rev. Ref. Bonds, Series 2012-A, 5.00% 2019 | $ | 250 | $ | 254 | ||||
| Black Belt Energy Gas Dist., Gas Supply Rev. Bonds, Series 2016-A, 4.00% 2046 (put 2021) | 500 | 516 | ||||||
| 770 | ||||||||
| Arizona 0.42% | ||||||||
| County of Maricopa, Industrial Dev. Auth., Rev. Bonds (GreatHearts Arizona Projects), Series 2017-A, 4.00% 2021 | 565 | 585 | ||||||
| California 3.25% | ||||||||
| Bay Area Toll Auth., San Francisco Bay Area Toll Bridge Rev. Bonds, Series 2006-C-1, (SIFMA Municipal Swap Index + 0.90%) 2.50% 2045 (put 2023)1 | 1,500 | 1,533 | ||||||
| Bay Area Toll Auth., San Francisco Bay Area Toll Bridge Rev. Ref. Bonds, Series 2014-C, 1.875% 2047 (put 2019) | 500 | 500 | ||||||
| Health Facs. Fncg. Auth., Rev. Ref. Bonds (St. Joseph Health System), Series 2013-C, 5.00% 2043 (put 2019) | 1,000 | 1,026 | ||||||
| Infrastructure and Econ. Dev. Bank, Rev. Ref. Bonds (J. Paul Getty Trust), Series 2011-A-4, (3-month USD-LIBOR x 0.70 + 0.37%) 2.047% 2038 (put 2020)1 | 1,000 | 1,003 | ||||||
| Menifee Union School Dist., Public Fncg. Auth., Special Tax Rev. Bonds, Series 2016-A, BAM insured, 4.00% 2021 | 400 | 416 | ||||||
| 4,478 | ||||||||
| Colorado 0.97% | ||||||||
| City of Colorado Springs, Utilities System Rev. Ref. Bonds, Series 2018-A-1, 5.00% 2023 | 500 | 562 | ||||||
| E-470 Public Highway Auth., Rev. Bonds, Series 2017-A, (1-month USD-LIBOR x 0.67 + 0.90%) 2.442% 2039 (put 2019)1 | 500 | 500 | ||||||
| Park Creek Metropolitan Dist., Limited Property Tax Supported Rev. Ref. Bonds, Series 2015-A, 5.00% 2021 | 260 | 279 | ||||||
| 1,341 | ||||||||
| Connecticut 4.09% | ||||||||
| Health and Educational Facs. Auth., Rev. Bonds (Ascension Health Senior Credit Group), Series 1999-B, 1.65% 2029 (put 2019) | 470 | 469 | ||||||
| Health and Educational Facs. Auth., Rev. Bonds (Sacred Heart University Issue), Series 2017-I-1, 5.00% 2022 | 500 | 545 | ||||||
| Health and Educational Facs. Auth., Rev. Bonds (Yale University Issue), Series 1999-U-1, 1.00% 2033 (put 2019) | 1,470 | 1,466 | ||||||
| Housing Fin. Auth., Housing Mortgage Fin. Program Bonds, Series 2014-C-1, 4.00% 2044 | 430 | 442 | ||||||
| Housing Fin. Auth., Housing Mortgage Fin. Program Bonds, Series 2016-A-1, 4.00% 2045 | 225 | 232 | ||||||
| Housing Fin. Auth., Housing Mortgage Fin. Program Bonds, Series 2017-A-1, 4.00% 2047 | 890 | 924 | ||||||
| Housing Fin. Auth., Housing Mortgage Fin. Program Rev. Ref. Bonds, Series 2013-B-2, 4.00% 2032 | 430 | 440 | ||||||
| Housing Fin. Auth., Housing Mortgage Fin. Program Rev. Ref. Bonds, Series 2014-D-1, 4.00% 2044 | 590 | 604 | ||||||
| Housing Fin. Auth., Housing Mortgage Fin. Program Rev. Ref. Bonds, Series 2015-C-1, 3.50% 2045 | 495 | 504 | ||||||
| 5,626 | ||||||||
| Florida 4.49% | ||||||||
| County of Collier, Heritage Bay Community Dev. Dist., Capital Improvement Rev. Bonds, Series 2018-A-2, 2.25% 2021 | 355 | 351 | ||||||
| County of Collier, Heritage Bay Community Dev. Dist., Capital Improvement Rev. Bonds, Series 2018-A-2, 2.50% 2022 | 500 | 494 | ||||||
| Housing Fin. Corp., Homeowner Mortgage Rev. Bonds, Series 2011-A, 4.50% 2029 | 120 | 122 | ||||||
| Housing Fin. Corp., Multi Familiy Housing Rev. Bonds (Logan Heights Apartments), Series 2018-F, 1.90% 2020 | 1,000 | 991 | ||||||
| 32 | Private Client Services Funds |
Capital Group Short-Term Municipal Fund
| Bonds, notes & other debt instruments | Principal amount (000) | Value (000) | ||||||
| Housing Fin. Corp., Homeowner Mortgage Rev. Bonds (Special Program), Series 2011-B, 4.50% 2029 | $ | 70 | $ | 71 | ||||
| Housing Fin. Corp., Multi Familiy Mortgage Rev. Bonds (Lake Mangonia Apartments), Series 2018-B, 1.75% 2019 | 150 | 150 | ||||||
| JEA, Electric System Rev. Bonds, Series 2012-B, 5.00% 2023 | 1,095 | 1,179 | ||||||
| County of Orange, Health Facs. Auth., Health Care Facs. Rev. Bonds (Presbyterian Retirement Communities Project), Series 2015, 4.00% 2020 | 710 | 728 | ||||||
| City of Orlando, Utilities Commission, Utility System Rev. Ref. Bonds, Series 2017-A, 5.00% 2027 (put 2020) | 1,500 | 1,578 | ||||||
| County of Palm Beach, Health Facs. Auth., Rev. Bonds (Lifespace Communities, Inc.), Series 2015-C, 5.00% 2021 | 500 | 520 | ||||||
| 6,184 | ||||||||
| Georgia 1.41% | ||||||||
| City of Atlanta, Airport Passenger Fac. Charge and General Rev. Bonds, Series 2010-B, Assured Guaranty Municipal insured, 5.00% 2019 | 95 | 96 | ||||||
| Municipal Electric Auth., Project One Bonds, Series 2009-B, 5.00% 2020 | 860 | 887 | ||||||
| Housing and Fin. Auth., Single Family Mortgage Bonds, Series 2015-A-1, 3.50% 2045 | 135 | 137 | ||||||
| Housing and Fin. Auth., Single Family Mortgage Bonds, Series 2017-A, 4.00% 2047 | 790 | 820 | ||||||
| 1,940 | ||||||||
| Illinois 10.65% | ||||||||
| Build Illinois Bonds, Sales Tax Rev. Bonds, Series 2013, 5.00% 2020 | 1,000 | 1,037 | ||||||
| City of Chicago, O’Hare International Airport, General Airport Rev. Bonds, Series 2011-C, 6.50% 2041 (preref. 2021) | 450 | 491 | ||||||
| City of Chicago, O’Hare International Airport, General Airport Rev. Ref. Bonds, Series 2016-C, 5.00% 2020 | 1,000 | 1,032 | ||||||
| City of Chicago, Second Lien Water Rev. Bonds, Series 2004, 5.00% 2020 | 100 | 105 | ||||||
| City of Chicago, Wastewater Transmission Rev. Bonds, Series 2014, 5.00% 2024 | 475 | 521 | ||||||
| City of Chicago, Wastewater Transmission Rev. Ref. Bonds, Series 2008-C, 5.00% 2021 | 500 | 525 | ||||||
| City of Chicago, Wastewater Transmission Rev. Ref. Bonds, Series 2017-B, 5.00% 2022 | 1,010 | 1,080 | ||||||
| City of Chicago, Water Rev. Ref. Bonds, Series 2014, 3.00% 2019 | 1,065 | 1,072 | ||||||
| City of Chicago, Water Rev. Ref. Bonds, Series 2017-2, 5.00% 2021 | 180 | 192 | ||||||
| Counties of Cook, DuPage, Kane, Lake, McHenry and Will, Regional Transportation Auth., G.O. Bonds, Series 2000, MBIA insured, 6.25% 2021 | 460 | 505 | ||||||
| Fin. Auth., National Rural Utilities Cooperative Fin. Corp., Guaranteed Solid Waste Disposal Rev. Bonds (Prairie Power, Inc. Project), Series 2008-A, 1.75% 2042 (put 2020) | 490 | 484 | ||||||
| Fin. Auth., Rev. Bonds (Art Institute of Chicago), Series 2016, 5.00% 2023 | 100 | 110 | ||||||
| Fin. Auth., Rev. Bonds (Art Institute of Chicago), Series 2016, 5.00% 2024 | 130 | 144 | ||||||
| Fin. Auth., Rev. Bonds (OSF Healthcare System), Series 2015-A, 5.00% 2021 | 1,100 | 1,182 | ||||||
| Fin. Auth., Rev. Ref. Bonds (Advocate Health Care Network), Series 2008-A-1, 5.00% 2030 (put 2020) | 1,000 | 1,032 | ||||||
| Fin. Auth., Rev. Bonds (Presbyterian Homes Obligated Group), Series 2016-A, 5.00% 2023 | 225 | 244 | ||||||
| Housing Dev. Auth., Multi Family Housing Rev. Notes (Marshall Field Garden Apartment Homes), Series 2015, (SIFMA Municipal Swap Index + 1.00%) 2.60% 2050 (put 2025)1 | 1,000 | 992 | ||||||
| Board of Trustees of the Illinois State University, Auxiliary Facs. System Rev. Bonds, Series 2016, Assured Guaranty Municipal insured, 5.00% 2022 | 600 | 637 | ||||||
| Board of Trustees of the Illinois State University, Auxiliary Facs. System Rev. Bonds, Series 2018-A, Assured Guaranty Municipal insured, 5.00% 2023 | 500 | 538 | ||||||
| Board of Trustees of the Illinois State University, Auxiliary Facs. System Rev. Bonds, Series 2018-B, Assured Guaranty Municipal insured, 5.00% 2022 | 500 | 531 | ||||||
| Railsplitter Tobacco Settlement Auth., Tobacco Settlement Rev. Bonds, Series 2010, 5.50% 2023 (preref. 2021) | 160 | 173 | ||||||
| Private Client Services Funds | 33 |
Capital Group Short-Term Municipal Fund
| Bonds, notes & other debt instruments (continued) | Principal amount (000) | Value (000) | ||||||
| Illinois (continued) | ||||||||
| Sales Tax Securitization Corp., Sales Tax Rev. Ref. Bonds, Series 2017-A, 5.00% 2021 | $ | 500 | $ | 527 | ||||
| Board of Trustees of the University of Illinois, Rev. Ref. Certs. of Part., Series 2016-A, 4.00% 2019 | 1,000 | 1,014 | ||||||
| Village of Volo, Special Service Areas Nos. 3 and 6 (Symphony Meadows/Lancaster Falls Projects), Special Tax Rev. Ref. Bonds, Series 2016, Assured Guaranty Municipal insured, 3.00% 2021 | 500 | 500 | ||||||
| 14,668 | ||||||||
| Indiana 1.48% | ||||||||
| Fin. Auth., State Revolving Fund Program Bonds, Series 2010-B, 5.00% 2029 (preref. 2020) | 1,000 | 1,036 | ||||||
| Health and Educational Facs. Fncg. Auth., Rev. Bonds (Ascension Health Senior Credit Group), Series 2001-A-2, 4.00% 2036 (put 2019) | 1,000 | 1,007 | ||||||
| 2,043 | ||||||||
| Iowa 0.39% | ||||||||
| Fin. Auth., State Revolving Fund Rev. Bonds, Series 2011, 5.00% 2026 (preref. 2021) | 495 | 532 | ||||||
| Kentucky 0.51% | ||||||||
| Housing Corp., Housing Rev. Bonds (Jefferson Green Apartments Project), Series 2018, 2.20% 2022 (put 2021) | 685 | 681 | ||||||
| Housing Corp., Housing Rev. Bonds, Series 2010-B, 5.00% 2027 | 20 | 20 | ||||||
| 701 | ||||||||
| Louisiana 0.64% | ||||||||
| Citizens Property Insurance Corp., Assessment Rev. Ref. Bonds, Assured Guaranty Municipal insured, Series 2015, 5.00% 2021 | 300 | 321 | ||||||
| Housing Fin. Agcy., Single Family Mortgage Rev. Bonds (Mortgage-Backed Securities Program), Series 2011-A, GNMA-FNMA insured, 4.60% 2028 | 5 | 5 | ||||||
| Tobacco Settlement Fncg. Corp., Tobacco Settlement Asset-Backed Rev. Ref. Bonds, Series 2013-A, 5.00% 2020 | 280 | 291 | ||||||
| Tobacco Settlement Fncg. Corp., Tobacco Settlement Asset-Backed Rev. Ref. Bonds, Series 2013-A, 5.00% 2021 | 250 | 265 | ||||||
| 882 | ||||||||
| Maine 0.60% | ||||||||
| Housing Auth., Mortgage Purchase Bonds, Series 2017-A, 4.00% 2047 | 470 | 488 | ||||||
| Maine Municipal Bond Bank (Dept. of Transportation), Grant Anticipation Bonds, Series 2018-A, 5.00% 2023 | 300 | 335 | ||||||
| 823 | ||||||||
| Maryland 2.49% | ||||||||
| County of Baltimore, Consolidated Public Improvement Bonds, Series 2018, 4.00% 2019 | 1,000 | 1,008 | ||||||
| County of Baltimore, Rev. Bonds (Oak Crest Village, Inc. Fac.), Series 2016, 5.00% 2022 | 400 | 429 | ||||||
| Community Dev. Administration, Dept. of Housing and Community Dev., Residential Rev. Bonds, Series 2018-A, 4.50% 2048 | 435 | 463 | ||||||
| County of Montgomery, Housing Opportunities Commission, Single Family Housing Rev. Bonds, Series 2017-A, 4.00% 2048 | 465 | 483 | ||||||
| County of Montgomery, Housing Opportunities Commission, Single Family Housing Rev. Bonds, Series 2018-A, 4.00% 2049 | 1,000 | 1,041 | ||||||
| 3,424 | ||||||||
| 34 | Private Client Services Funds |
Capital Group Short-Term Municipal Fund
| Bonds, notes & other debt instruments | Principal amount (000) | Value (000) | ||||||
| Massachusetts 1.04% | ||||||||
| Housing Fin. Agcy., Single Family Housing Rev. Bonds, Series 169, 4.00% 2044 | $ | 120 | $ | 123 | ||||
| Housing Fin. Agcy., Single Family Housing Rev. Bonds, Series 183, 3.50% 2046 | 750 | 763 | ||||||
| Housing Fin. Agcy., Single Family Housing Rev. Ref. Bonds, Series 171, 4.00% 2044 | 540 | 554 | ||||||
| 1,440 | ||||||||
| Michigan 4.29% | ||||||||
| City of Detroit, Water and Sewerage Dept., Sewage Disposal System Rev. and Rev. Ref. Bonds, Series 2012-A, 5.00% 2023 | 700 | 756 | ||||||
| Fin. Auth., Local Government Loan Program Rev. Bonds (Detroit Water and Sewerage Dept., Sewage Disposal System Rev. and Rev. Ref. Local Project Bonds), Series 2014-C-5, National insured, 5.00% 2020 | 500 | 521 | ||||||
| Grant Anticipation Rev. Ref. Bonds, Series 2016, 5.00% 2020 | 1,000 | 1,038 | ||||||
| Hospital Fin. Auth., Hospital Rev. Ref. Bonds (Ascension Health Senior Credit Group), Series 2010-B, 5.00% 2019 | 300 | 309 | ||||||
| Housing Dev. Auth., Single Family Mortgage Rev. Bonds, Series 2014, 4.00% 2044 | 655 | 673 | ||||||
| Housing Dev. Auth., Single Family Mortgage Rev. Bonds, Series 2017-B, 3.50% 2048 | 140 | 143 | ||||||
| Housing Dev. Auth., Single Family Mortgage Rev. Bonds, Series 2018-C, 4.25% 2049 | 1,435 | 1,514 | ||||||
| Strategic Fund, Limited Obligation Rev. Ref. Bonds (Detroit Edison Co. Exempt Facs. Project), Series 2008-ET-2, 1.45% 2029 (put 2021) | 325 | 311 | ||||||
| County of Wayne, Airport Auth., Airport Rev. Bonds (Detroit Metropolitan Wayne County Airport), Series 2015-G, 5.00% 2021 | 300 | 324 | ||||||
| County of Wayne, Airport Auth., Airport Rev. Bonds (Detroit Metropolitan Wayne County Airport), Series 2018-C, 5.00% 2023 | 290 | 324 | ||||||
| 5,913 | ||||||||
| Minnesota 1.30% | ||||||||
| City of Coon Rapids, Multi Family Housing Rev. Ref. Bonds (Drake Apartments Project), Series 2018-A, 2.20% 2021 (put 2020) | 700 | 699 | ||||||
| Housing Fin. Agcy., Residential Housing Fin. Bonds, Series 2012-D, 4.00% 2040 | 60 | 61 | ||||||
| City of Maplewood, Multi Family Housing Rev. Ref. Bonds (Maple Pond Apartments Project), Series 2018-A, 2.20% 2021 (Put 2020)2 | 280 | 279 | ||||||
| City of Minneapolis, Multi Family Rev. Bonds (Albright Townhomes Project), Series 2018, 2.00% 2021 (put 2019) | 750 | 749 | ||||||
| 1,788 | ||||||||
| Missouri 1.03% | ||||||||
| Housing Dev. Commission, Single Family Mortgage Rev. Bonds (First Place Homeownership Loan Program), Series 2016-B, 3.50% 2041 | 1,220 | 1,246 | ||||||
| Housing Dev. Commission, Single Family Mortgage Rev. Bonds (Special Homeownership Loan Program), Series 2009-E-4, 4.25% 2030 | 165 | 169 | ||||||
| 1,415 | ||||||||
| Montana 0.16% | ||||||||
| Board of Housing, Single Family Mortgage Bonds, Series 2016-A-2, 3.50% 2044 | 220 | 224 | ||||||
| Nebraska 2.39% | ||||||||
| Central Plains Energy Project, Gas Supply Rev. Ref. Bonds, Series 2014, 5.00% 2039 (put 2019) | 1,000 | 1,027 | ||||||
| Investment Fin. Auth., Single Family Housing Rev. Bonds, Series 2013-E, 3.00% 2043 | 185 | 186 | ||||||
| Investment Fin. Auth., Single Family Housing Rev. Bonds, Series 2014-A, 3.00% 2044 | 120 | 120 | ||||||
| Investment Fin. Auth., Single Family Housing Rev. Bonds, Series 2014-A, 4.00% 2044 | 535 | 552 | ||||||
| Investment Fin. Auth., Single Family Housing Rev. Bonds, Series 2016-A, 3.50% 2046 | 415 | 423 | ||||||
| Investment Fin. Auth., Single Family Housing Rev. Bonds, Series 2016-C, 3.50% 2046 | 290 | 295 | ||||||
| Investment Fin. Auth., Single Family Housing Rev. Bonds, Series 2018-C, 4.00% 2048 | 660 | 689 | ||||||
| 3,292 | ||||||||
| Private Client Services Funds | 35 |
Capital Group Short-Term Municipal Fund
| Bonds, notes & other debt instruments (continued) | Principal amount (000) | Value (000) | ||||||
| New Jersey 4.09% | ||||||||
| Econ. Dev. Auth., School Facs. Construction Rev. Ref. Bonds, Series 2014-PP, 5.00% 2019 | $ | 750 | $ | 762 | ||||
| Garden State Preservation Trust, Open Space and Farmland Preservation Rev. Ref. Bonds, Series 2012-A, 5.00% 2018 | 550 | 550 | ||||||
| Housing and Mortgage Fin. Agcy., Multi Family Housing Conduit Rev. Bonds (Garden Spires Project), Series 2018-A, 2.02% 2021 | 1,000 | 991 | ||||||
| Housing and Mortgage Fin. Agcy., Multi Family Conduit Rev. Bonds (Georgia King Village Project), Series 2018-E, 2.45% 2021 (put 2020) | 215 | 215 | ||||||
| Housing and Mortgage Fin. Agcy., Single Family Housing Rev. Bonds, Series 2018-A, 4.50% 2048 | 715 | 760 | ||||||
| Tobacco Settlement Fncg. Corp., Tobacco Settlement Bonds, Series 2018-A, 5.00% 2021 | 1,250 | 1,324 | ||||||
| Transportation Trust Fund Auth., Federal Highway Reimbursement Rev. Ref. Bonds, Series 2018-A, 4.00% 2020 | 495 | 507 | ||||||
| Transportation Trust Fund Auth., Transportation System Bonds, Series 2015-AA, 5.00% 2021 | 500 | 527 | ||||||
| 5,636 | ||||||||
| New Mexico 1.45% | ||||||||
| City of Farmington, Pollution Control Rev. Ref. Bonds (Southern California Edison Company Four Corners Project), Series 2005-A, 1.875% 2029 (put 2020) | 1,000 | 990 | ||||||
| City of Farmington, Pollution Control Rev. Ref. Bonds (Southern California Edison Company Four Corners Project), Series 2005-B, 1.875% 2029 (put 2020) | 1,000 | 989 | ||||||
| New Mexico Educational Assistance Foundation, Educational Loan Bonds, Series 2010-1, Class A2, (3-month USD-LIBOR + 0.65%) 2.971% 20281 | 20 | 20 | ||||||
| 1,999 | ||||||||
| New York 7.93% | ||||||||
| Build NYC Resource Corp., Rev. Ref. Bonds (Ethical Culture Fieldston School Project), Series 2015, 5.00% 2024 | 360 | 404 | ||||||
| Dormitory Auth., State Sales Tax Rev. Bonds, Series 2018-E, 5.00% 2022 | 500 | 545 | ||||||
| Housing Fin. Agcy., Affordable Housing Rev. Green Bonds, Series 2017-H, 1.65% 2021 | 350 | 342 | ||||||
| Housing Fin. Agcy., Affordable Housing Rev. Green Bonds, Series 2018-D, 2.35% 2021 | 1,000 | 995 | ||||||
| Long Island Power Auth., Electric System General Rev. Bonds, Series 2014-C, (1-month USD-LIBOR x 0.70 + 0.75%) 2.329% 2033 (put 2023)1 | 300 | 300 | ||||||
| Long Island Power Auth., Electric System General Rev. Bonds, Series 2015-C, (1-month USD-LIBOR x 0.70 + 0.75%) 2.329% 2033 (put 2023)1 | 750 | 749 | ||||||
| Metropolitan Transportation Auth., Dedicated Tax Fund Bonds, Series 2002-B-3-B, (SIFMA Municipal Swap Index + 0.90%) 2.50% 20181 | 650 | 650 | ||||||
| Metropolitan Transportation Auth., Transportation Rev. Bonds, Series 2015-A-2, (SIFMA Municipal Swap Index + 0.58%) 2.18% 2039 (put 2020)1 | 2,600 | 2,604 | ||||||
| Mortgage Agcy., Homeowner Mortgage Rev. Bonds, Series 197, 3.50% 2044 | 845 | 864 | ||||||
| New York City G.O. Bonds, Fiscal 2018, Series 2017-C, 5.00% 2023 | 1,000 | 1,116 | ||||||
| New York City Housing Dev. Corp., Multi Family Housing Rev. Bonds (Sustainable Neighborhood Bonds), Series 2017-C-2, 1.70% 2021 | 350 | 344 | ||||||
| New York City Housing Dev. Corp., Multi Family Housing Rev. Bonds (Sustainable Neighborhood Bonds), Series 2017-G-2-A, 2.00% 2057 (put 2021) | 500 | 493 | ||||||
| New York City Transitional Fin. Auth., Future Tax Secured Bonds, Fiscal 2019, Series 2018-A-1, 5.00% 2023 | 750 | 838 | ||||||
| New York City Transitional Fin. Auth., Future Tax Secured Bonds, Fiscal 2019, Series 2018-B-1, 5.00% 2024 | 395 | 448 | ||||||
| Public Housing Capital Fund Rev. Trust I, Trust Certificates, Series 2012, 4.50% 20223,4 | 222 | 221 | ||||||
| 10,913 | ||||||||
| North Carolina 0.29% | ||||||||
| Housing Fin. Agcy., Home Ownership Rev. Ref. Bonds, Series 38-B, 4.00% 2047 | 385 | 400 | ||||||
| 36 | Private Client Services Funds |
Capital Group Short-Term Municipal Fund
| Bonds, notes & other debt instruments | Principal amount (000) | Value (000) | ||||||
| North Dakota 1.26% | ||||||||
| Housing Fin. Agcy., Housing Fin. Program Bonds (Home Mortgage Fin. Program), Series 2012-A, 3.75% 2042 | $ | 95 | $ | 97 | ||||
| Housing Fin. Agcy., Housing Fin. Program Bonds (Home Mortgage Fin. Program), Series 2015-A, 4.00% 2038 | 1,070 | 1,099 | ||||||
| Housing Fin. Agcy., Housing Fin. Program Bonds (Home Mortgage Fin. Program), Series 2015-D, 4.00% 2046 | 520 | 536 | ||||||
| 1,732 | ||||||||
| Ohio 1.28% | ||||||||
| Higher Education G.O. Rev. Ref. Bonds, Series 2017-C, 5.00% 2026 | 500 | 582 | ||||||
| Housing Fin. Agcy., Residential Mortgage Rev. Bonds (Mortgage-Backed Securities Program), Series 2017-A, 4.50% 2047 | 970 | 1,023 | ||||||
| Housing Fin. Agcy., Single Family Mortgage Rev. Bonds, Series 2011-2, 4.50% 2028 | 150 | 154 | ||||||
| 1,759 | ||||||||
| Oklahoma 0.77% | ||||||||
| Housing Fin. Agcy., Collateralized Rev. Bonds (Windsong Apartments), Series 2018, 2.05% 2021 (put 2020)2 | 500 | 498 | ||||||
| Housing Fin. Agcy., Single Family Mortgage Rev. Bonds (Homeownership Loan Program), Series 2012-A, 5.00% 2043 | 395 | 410 | ||||||
| City of Stillwater, Utility System and Sales Tax Rev. Bonds, Series 2014-A, 4.00% 2019 | 150 | 153 | ||||||
| 1,061 | ||||||||
| Oregon 0.55% | ||||||||
| G.O. Bonds (Veteran’s Welfare Bonds Series 94), Series 2014-H, 4.00% 2044 | 740 | 756 | ||||||
| Pennsylvania 3.91% | ||||||||
| Fncg. Auth., Rev. Bonds (Tobacco Master Settlement Payment), Series 2018, 5.00% 2020 | 500 | 519 | ||||||
| Housing Fin. Agcy., Single Family Mortgage Rev. Bonds, Series 2017-122, 4.00% 2046 | 445 | 462 | ||||||
| County of Montgomery, Higher Education and Health Auth., Hospital Rev. Bonds (Abington Memorial Hospital Obligated Group), Series 2012-A, 5.00% 2031 (preref. 2022) | 750 | 819 | ||||||
| County of Montgomery, Higher Education and Health Auth., Rev. Bonds, Series 2018-A, 2.32% 2051 (put 2023)1 | 500 | 500 | ||||||
| Philadelphia School Dist., Rev. Ref. G.O. Bonds, Series 2016-F, 5.00% 2019 | 500 | 511 | ||||||
| City of Pittsburgh, Urban Redev. Auth., Rev. Bonds (Crawford Square Apartments Project), Series 2018, 2.25% 2020 (put 2020) | 275 | 274 | ||||||
| Turnpike Commission, Turnpike Rev. Bonds, Series 2016, 5.00% 2021 | 750 | 798 | ||||||
| Turnpike Commission, Turnpike Rev. Bonds, Series 2018-B, (SIFMA Municipal Swap Index + 0.50%) 2.11% 20211 | 1,000 | 1,000 | ||||||
| University of Pittsburgh - Of the Commonwealth System of Higher Education Panthers, Series 2018, (SIFMA Municipal Swap Index + 0.24%) 1.84% 20211 | 500 | 500 | ||||||
| 5,383 | ||||||||
| Rhode Island 1.13% | ||||||||
| Commerce Corp., Grant Anticipation Rev. Ref. Bonds (Dept. of Transportation), Series 2016-A, 5.00% 2021 | 920 | 983 | ||||||
| Housing and Mortgage Fin. Corp., Homeownership Opportunity Bonds, Series 66-A-1, 4.00% 2033 | 560 | 576 | ||||||
| 1,559 | ||||||||
| Private Client Services Funds | 37 |
Capital Group Short-Term Municipal Fund
| Bonds, notes & other debt instruments (continued) | Principal amount (000) | Value (000) | ||||||
| South Carolina 1.20% | ||||||||
| Housing Fin. and Dev. Auth., Mortgage Rev. Bonds, Series 2018-A, 4.50% 2048 | $ | 320 | $ | 341 | ||||
| Housing Fin. and Dev. Auth., Mortgage Rev. Ref. Bonds, Series 2016-A, 4.00% 2036 | 455 | 470 | ||||||
| County of Lexington, Health Services Dist., Inc., Hospital Rev. Ref. Bonds, Series 2017, 5.00% 2021 | 250 | 267 | ||||||
| Housing Fin. and Dev. Auth., Mortgage Rev. Bonds, Series 2011-1, 4.50% 2030 | 135 | 138 | ||||||
| Town of Southold, Local Dev. Corp., Rev. Bonds (Peconic Landing at Southold, Inc. Project), Series 2015, 5.00% 2022 | 400 | 433 | ||||||
| 1,649 | ||||||||
| South Dakota 0.19% | ||||||||
| Housing Dev. Auth., Homeownership Mortgage Bonds, Series 2014-E, 4.00% 2044 | 250 | 258 | ||||||
| Tennessee 2.71% | ||||||||
| Housing Dev. Agcy., Homeownership Program Bonds, Series 2012-1-C, 4.50% 2037 | 170 | 175 | ||||||
| Housing Dev. Agcy., Homeownership Program Bonds, Series 2012-2-C, 4.00% 2038 | 190 | 194 | ||||||
| Housing Dev. Agcy., Residential Fin. Program Bonds, Series 2014-2-A, 4.00% 2045 | 1,335 | 1,376 | ||||||
| Housing Dev. Agcy., Residential Fin. Program Bonds, Series 2014-2-C, 4.00% 2045 | 560 | 577 | ||||||
| Housing Dev. Agcy., Residential Fin. Program Bonds, Series 2017-1, 4.00% 2042 | 360 | 374 | ||||||
| Metropolitan Government of Nashville and Davidson County, G.O. Improvement Bonds, Series 2013-A, 5.00% 2026 (preref. 2023) | 310 | 343 | ||||||
| Metropolitan Government of Nashville and Davidson County, Health and Educational Facs. Board, Collateralized Multi Family Housing Rev. Bonds (Trevecca Towers II Project), Series 2018, 2.00% 2022 (put 2021) | 700 | 695 | ||||||
| 3,734 | ||||||||
| Texas 13.93% | ||||||||
| Arlington Higher Education Fin. Corp., Education Rev. and Rev. Ref. Bonds (Uplift Education), Series 2017-A, 5.00% 2022 | 635 | 695 | ||||||
| City of Austin, Electric Utility System Rev. Ref. Bonds, Series 2015-A, 5.00% 2021 | 525 | 567 | ||||||
| City of Austin, Water and Wastewater System Rev. Ref. Bonds (Travis, Williamson and Hays Counties), Series 2015-A, 5.00% 2022 | 500 | 551 | ||||||
| Cypress-Fairbanks Independent School Dist., Unlimited Tax School Building Bonds, Series 2017-A-3, 3.00% 2043 (put 2020) | 1,500 | 1,518 | ||||||
| City of Dallas, Waterworks and Sewer System Rev. Ref. Bonds, Series 2016-A, 5.00% 2028 | 190 | 218 | ||||||
| Denton Independent School Dist., Unlimited Tax Rev. Ref. Bonds, Series 2015, 5.00% 2026 | 350 | 396 | ||||||
| County of Harris, Health Facs. Dev. Corp., Rev. Ref. Bonds (CHRISTUS Health), Series 2005-A-4, Assured Guaranty Municipal insured, 1.99% 20311 | 150 | 150 | ||||||
| Harris County, Toll Road Rev. Ref. Bonds, Series 2012-B, (SIFMA Municipa Swap index + 0.45%) 2.05% 20211 | 1,115 | 1,115 | ||||||
| Dept. of Housing and Community Affairs, Multi Family Housing Rev. Bonds (Springs Apartments), Series 2018, 2.23% 2021 (put 2020)2 | 1,350 | 1,346 | ||||||
| Dept. of Housing and Community Affairs, Residential Mortgage Rev. Bonds, Series 2011-A, 5.00% 2029 | 90 | 93 | ||||||
| Dept. of Housing and Community Affairs, Single Family Mortgage Rev. Bonds, Series 2018-A, 4.75% 2049 | 500 | 539 | ||||||
| City of Houston, Airport System Rev. and Rev. Ref. Bonds, Series 2018-B, 5.00% 2022 | 250 | 273 | ||||||
| City of Houston, Higher Education Fin. Corp., Higher Education Rev. bonds (Rice University Project), Series 2010-A, 5.00% 2040 (preref. 2020) | 1,500 | 1,564 | ||||||
| City of Houston, Public Improvement Rev. Ref. Bonds, Series 2017-A, 5.00% 2020 | 400 | 415 | ||||||
| Houston Independent School Dist., Limited Tax Schoolhouse Bonds, Series 2014-A-1B, 2.20% 2039 (put 2020)2 | 715 | 714 | ||||||
| Houston Independent School Dist., Limited Tax Schoolhouse Bonds, Series 2017, 3.00% 2021 | 600 | 611 | ||||||
| Katy Independent School Dist., Rev. Ref. Bonds, Series 2015-C, (1-month USD-LIBOR x 0.67 + 0.55%) 2.077% 2036 (put 2019)1 | 650 | 651 | ||||||
| Lower Colorado River Auth., Transmission Contract Rev. Ref. and Improvement Bonds (LCRA Transmission Services Corp. Project), Series 2018, 5.00% 2021 | 300 | 320 | ||||||
| 38 | Private Client Services Funds |
Capital Group Short-Term Municipal Fund
| Bonds, notes & other debt instruments | Principal amount (000) | Value (000) | ||||||
| Northside Independent School Dist., Unlimited Tax School Building Bonds, Series 2017, 1.45% 2047 (put 2020) | $ | 200 | $ | 198 | ||||
| City of Olmos Park, Higher Education Facs. Corp., Higher Education Rev. Improvement and Ref. Bonds (University of the Incarnate Word Project), Series 2012, 5.00% 2019 | 400 | 412 | ||||||
| Panhandle Regional Housing Fin. Corp., Multi Family Housing Rev. Bonds (Canyons at 45 West Apartments), Series 2018, 2.00% 2021 (put 2020)2 | 500 | 498 | ||||||
| Public Fin. Auth., G.O. Rev. Ref. Bonds, Series 2018-A, 5.00% 2021 | 645 | 696 | ||||||
| City of San Antonio, Electric and Gas Systems Rev. Ref. Bonds, Series 2012-C, 2.00% 2027 (put 2018) | 350 | 350 | ||||||
| City of San Antonio, Electric and Gas Systems Rev. Ref. Bonds, Series 2015-C, 3.00% 2045 (put 2019) | 1,000 | 1,009 | ||||||
| City of San Antonio, Electric and Gas Systems Rev. Ref. Bonds, Series 2015-D, 3.00% 2045 (put 2020) | 1,000 | 1,012 | ||||||
| City of Temple, Limited Tax Rev. Bonds (Pass-Through Agreement), Series 2012, 5.00% 2023 (preref. 2021) | 680 | 729 | ||||||
| Board of Regents of the Texas A&M University System, Rev. Fncg. System Bonds, Series 2015-B, 5.00% 2021 (escrowed to maturity) | 145 | 155 | ||||||
| Board of Regents of the Texas Tech University System, Rev. Fncg. System Rev. Ref. and Improvement Bonds, Series 2017-A, 5.00% 2019 | 500 | 504 | ||||||
| Tomball Independent School Dist., Unlimited Tax School Building Bonds, Series 2018, 5.00% 2022 | 355 | 385 | ||||||
| County of Travis, Housing Fin. Corp., Multi Family Housing Rev. Bonds (McKinney Falls Apartments), Series 2018, AMT, 2.00% 20212 | 1,000 | 995 | ||||||
| Water Dev. Board, State Water Implementation Rev. Fund, Rev. Bonds (Master Trust), Series 2018-B, 5.00% 2022 | 455 | 496 | ||||||
| 19,175 | ||||||||
| Utah 0.59% | ||||||||
| Housing Corp., Single Family Mortgage Bonds, Class III, Series 2015-D-2, 4.00% 2045 | 375 | 388 | ||||||
| School Fin. Auth., Charter School Rev. Bonds (Utah Charter Academies Project), Series 2018, 3.00% 2019 | 200 | 201 | ||||||
| School Fin. Auth., Charter School Rev. Bonds (Utah Charter Academies Project), Series 2018, 3.00% 2020 | 220 | 222 | ||||||
| 811 | ||||||||
| Virginia 0.54% | ||||||||
| County of Wise, Industrial Dev. Auth., Solid Waste and Sewage Disposal Rev. Bonds (Virginia Electric and Power Co. Project), Series 2010-A, 1.875% 2040 (put 2020) | 750 | 743 | ||||||
| Washington 3.03% | ||||||||
| Various Purpose G.O. Bonds, Series 2018-C, 5.00% 2023 | 1,000 | 1,108 | ||||||
| Various Purpose G.O. Rev. Ref. Bonds, Series 2013-R-C, 5.00% 2021 | 330 | 354 | ||||||
| Various Purpose G.O. Rev. Ref. Bonds, Series 2018-R-C, 5.00% 2021 | 500 | 537 | ||||||
| Housing Fin. Commission, Homeownership Program Bonds, Series 2011-A, 4.50% 2029 | 90 | 92 | ||||||
| Housing Fin. Commission, Single Family Program Bonds, Series 2017-1-N, 4.00% 2047 | 585 | 604 | ||||||
| County of King, Housing Auth., Pooled Housing Rev. Ref. Bonds, Series 2018, 2.15% 2020 | 400 | 398 | ||||||
| City of Seattle, Municipal Light and Power Improvement and Rev. Ref. Bonds, Series 2018-C-2, (SIFMA Municipal Swap Index + 0.49%) 2.09% 2046 (put 2023)1 | 1,075 | 1,075 | ||||||
| 4,168 | ||||||||
| West Virginia 0.54% | ||||||||
| West Virginia University, Improvement Rev. Bonds (West Virginia University Projects), Series 2014-C, (SIFMA Municipal Swap Index + 0.53%) 2.13% 2041 (put 2019)1 | 750 | 750 | ||||||
| Private Client Services Funds | 39 |
Capital Group Short-Term Municipal Fund
| Bonds, notes & other debt instruments (continued) | Principal amount (000) | Value (000) | ||||||
| Wisconsin 3.82% | ||||||||
| G.O. Bonds, Series 2013-A, 5.00% 2025 (preref. 2022) | $ | 1,000 | $ | 1,092 | ||||
| G.O. Bonds, Series 2015-A, 5.00% 2031 (preref. 2023) | 1,000 | 1,113 | ||||||
| Health and Educational Facs. Auth., Rev. Bonds (Advocate Aurora Health Care Credit Group), Series 2018-C-2, (SIFMA Municipal Swap Index + 0 .45%) 2.05% 2054 (put 2022)1 | 1,000 | 1,000 | ||||||
| Health and Educational Facs. Auth., Rev. Bonds (Advocate Aurora Health Care Credit Group), Series 2018-C-3, (SIFMA Municipal Swap Index + 0 .55%) 2.15% 2054 (put 2023)1 | 340 | 340 | ||||||
| Health and Educational Facs. Auth., Rev. Bonds (Ascension Health Senior Credit Group), Series 2013-B-2, 4.00% 2043 (put 2019) | 1,000 | 1,011 | ||||||
| Housing and Econ. Dev. Auth., Home Ownership Rev. Bonds, Series 2017-C, 4.00% 2048 | 360 | 375 | ||||||
| Public Fin. Auth., Hospital Rev. Ref. Bonds (Renown Regional Medical Center Project), Series 2016-A, 5.00% 2022 | 300 | 326 | ||||||
| 5,257 | ||||||||
| Total bonds, notes & other debt instruments (cost: $127,132,000) | 125,812 | |||||||
| Short-term securities 9.92% | ||||||||
| State of Connecticut, Health and Educational Facs. Auth., IAM Commercial Paper, Series 2018-S-1, 1.67% 11/6/2018 | 1,000 | 1,000 | ||||||
| State of Illinois, Fin. Auth., Demand Rev. Bonds (University of Chicago Medical Center), Series 2011-A, 1.68% 20441 | 1,000 | 1,000 | ||||||
| State of Maryland, County of Montgomery, IAM Commercial Paper, Series 2009-B, 1.70% 11/7/2018 | 2,000 | 2,000 | ||||||
| State of Massachusetts, G.O. Rev. Anticipation Notes, Series 2018-A, 4.00% 4/25/2019 | 3,000 | 3,031 | ||||||
| State of Massachusetts, G.O. Rev. Anticipation Notes, Series 2018-C, 4.00% 6/20/2019 | 1,000 | 1,013 | ||||||
| State of New York, New York City G.O. Bonds, Series 2008-J-5, 1.70% 20281 | 1,500 | 1,500 | ||||||
| State of New York, New York City Municipal Water Fin. Auth., Water and Sewer System Second General Resolution Rev. Bonds, Fiscal 2008, Series 2007-BB-2, 1.30% 20351 | 1,500 | 1,500 | ||||||
| State of Texas, Gulf Coast Industrial Dev. Auth., Rev. Bonds (ExxonMobil Project), Series 2012, 1.68% 20411 | 1,000 | 1,000 | ||||||
| State of Texas, Tax and Rev. Anticipation Notes, Series 2018, 4.00% 8/29/2019 | 500 | 508 | ||||||
| State of Virginia, Freddie Mac Multi Family Certificates, Class A, Series 2018-M-046, (SIFMA Municipal Swap Index + 0.25%) 1.85% 20351 | 605 | 606 | ||||||
| State of Virginia, Small Business Fncg. Auth., Demand Rev. Ref. Bonds (Virginia State University Real Estate Foundation), Series 2008, Bank of America LOC, 1.70% 20301 | 500 | 500 | ||||||
| Total short-term securities (cost: $13,659,000) | 13,658 | |||||||
| Total investment securities 101.29% (cost: $140,791,000) | 139,470 | |||||||
| Other assets less liabilities (1.29%) | (1,783 | ) | ||||||
| Net assets 100.00% | $ | 137,687 | ||||||
Futures contracts
| Number of | Notional amount | 5 | Value at 10/31/2018 | 6 | Unrealized (depreciation) appreciation at 10/31/2018 | |||||||||||||
| Contracts | Type | contracts | Expiration | (000) | (000) | (000) | ||||||||||||
| 2 Year U.S. Treasury Note Futures | Long | 32 | January 2019 | $6,400 | $6,741 | $(19 | ) | |||||||||||
| 5 Year U.S. Treasury Note Futures | Long | 25 | January 2019 | 2,500 | 2,809 | 3 | ||||||||||||
| $(16 | ) | |||||||||||||||||
| 40 | Private Client Services Funds |
Capital Group Short-Term Municipal Fund
| 1 | Coupon rate may change periodically. For short-term securities, the date of the next scheduled coupon rate change is considered to be the maturity date. |
| 2 | Step bond; coupon rate may change at a later date. |
| 3 | Principal payments may be made periodically. Therefore, the effective maturity date may be earlier than the stated maturity date. |
| 4 | Acquired in a transaction exempt from registration under Rule 144A of the Securities Act of 1933. May be resold in the U.S. in transactions exempt from registration, normally to qualified institutional buyers. The total value of all such securities was $221,000, which represented .16% of the net assets of the fund. |
| 5 | Notional amount is calculated based on the number of contracts and notional contract size. |
| 6 | Value is calculated based on the notional amount and current market price. |
Key to abbreviations and symbol
Agcy. = Agency
AMT = Alternative Minimum Tax
Auth. = Authority
Certs. of Part. = Certificates of Participation
Dept. = Department
Dev. = Development
Dist. = District
Econ. = Economic
Fac. = Facility
Facs. = Facilities
Fin. = Finance
Fncg. = Financing
G.O. = General Obligation
LIBOR = London Interbank Offered Rate
LOC = Letter of Credit
Preref. = Prerefunded
Redev. = Redevelopment
Ref. = Refunding
Rev. = Revenue
SIFMA = Securities Industry and Financial Markets Association
TECP = Tax-Exempt Commercial Paper
| Private Client Services Funds | 41 |
Capital Group California Core Municipal Fund
Investment portfolio October 31, 2018
| Bonds, notes & other debt instruments 81.76% | Principal amount (000) | Value (000) | ||||||
| California 78.57% | ||||||||
| Alameda Corridor Transportation Auth., Rev. Ref. Bonds, Series 2013-A, 5.00% 2022 | $ | 975 | $ | 1,080 | ||||
| Alameda Corridor Transportation Auth., Rev. Ref. Bonds, Series 2016-A, 5.00% 2024 | 600 | 666 | ||||||
| Alameda Corridor Transportation Auth., Rev. Ref. Bonds, Series 2016-A, 5.00% 2025 | 500 | 560 | ||||||
| Alameda Corridor Transportation Auth., Rev. Ref. Bonds, Series 2016-A, Assured Guaranty Municipal insured, 4.00% 2021 | 500 | 519 | ||||||
| Alameda Unified School Dist., Capital Appreciation Bonds, Series 2004, Assured Guaranty Municipal insured, 0.00% 2024 | 3,500 | 3,009 | ||||||
| County of Alameda, Transportation Commission, Sales Tax Rev. Bonds, Series 2014, 4.00% 2019 | 950 | 957 | ||||||
| City of Alhambra, Insured Rev. Ref. Bonds (Atherton Baptist Homes Project), Series 2016, 5.00% 2027 | 630 | 701 | ||||||
| Alvord Unified School Dist., G.O. Rev. Ref. Bonds, Series 2018, Assured Guaranty Municipal insured, 5.00% 2025 | 800 | 929 | ||||||
| Assn. of Bay Area Governments, Fin. Auth. for Nonprofit Corps., Insured Rev. Bonds (Casa de las Campanas, Inc.), Series 2010, 5.125% 2020 | 645 | 667 | ||||||
| Assn. of Bay Area Governments, Fin. Auth. for Nonprofit Corps., Insured Rev. Bonds (Channing House), Series 2010, 5.25% 2020 (escrowed to maturity) | 585 | 604 | ||||||
| Assn. of Bay Area Governments, Fin. Auth. for Nonprofit Corps., Rev. Ref. Bonds (Episcopal Senior Communities), Series 2012-B, 5.00% 2020 | 1,000 | 1,050 | ||||||
| Assn. of Bay Area Governments, Fin. Auth. for Nonprofit Corps., Rev. Ref. Bonds (Eskaton Properties Inc. Obligated Group), Series 2013, 5.00% 2020 | 1,430 | 1,506 | ||||||
| Assn. of Bay Area Governments, Fin. Auth. for Nonprofit Corps., Rev. Ref. Bonds (Eskaton Properties Inc. Obligated Group), Series 2013, 5.00% 2021 | 495 | 531 | ||||||
| Assn. of Bay Area Governments, Fin. Auth. for Nonprofit Corps., Rev. Ref. Bonds (Eskaton Properties Inc. Obligated Group), Series 2013, 5.00% 2022 | 1,000 | 1,088 | ||||||
| Assn. of Bay Area Governments, Fin. Auth. for Nonprofit Corps., Rev. Ref. Bonds (Eskaton Properties Inc. Obligated Group), Series 2013, 5.00% 2023 | 500 | 549 | ||||||
| Assn. of Bay Area Governments, Fin. Auth. for Nonprofit Corps., Rev. Ref. Bonds (Windemere Ranch Infrastructure Fncg. Program), Series 2014-A, 5.00% 2023 | 370 | 412 | ||||||
| Assn. of Bay Area Governments, Fin. Auth. for Nonprofit Corps., Rev. Ref. Bonds (Windemere Ranch Infrastructure Fncg. Program), Series 2014-A, 5.00% 2024 | 395 | 446 | ||||||
| Assn. of Bay Area Governments, Fin. Auth. for Nonprofit Corps., Rev. Ref. Bonds (Windemere Ranch Infrastructure Fncg. Program), Series 2014-A, 5.00% 2025 | 510 | 571 | ||||||
| Bay Area Toll Auth., San Francisco Bay Area Toll Bridge Rev. Bonds, Series 2001-A, (SIFMA Municipal Swap Index + 1.25%) 2.85% 2036 (put 2027)1 | 1,000 | 1,039 | ||||||
| Bay Area Toll Auth., San Francisco Bay Area Toll Bridge Rev. Bonds, Series 2006-C-1, (SIFMA Municipal Swap Index + 0.90%) 2.50% 2045 (put 2023)1 | 2,800 | 2,862 | ||||||
| Bay Area Toll Auth., San Francisco Bay Area Toll Bridge Rev. Bonds, Series 2007-C-1, (SIFMA Municipal Swap Index + 0.90%) 2.50% 2047 (put 2023)1 | 1,500 | 1,533 | ||||||
| Bay Area Toll Auth., San Francisco Bay Area Toll Bridge Rev. Bonds, Series 2008-B-1, (SIFMA Municipal Swap Index + 1.10%) 2.70% 2045 (put 2024)1 | 4,275 | 4,411 | ||||||
| Bay Area Toll Auth., San Francisco Bay Area Toll Bridge Rev. Bonds, Series 2014-G, (SIFMA Municipal Swap Index + 0.60%) 2.20% 2034 (put 2020)1 | 1,000 | 1,004 | ||||||
| Bay Area Toll Auth., San Francisco Bay Area Toll Bridge Rev. Bonds, Series 2017-D, (3-month USD-LIBOR x 0.70 + 0.55%) 2.23% 2045 (put 2021)1 | 1,000 | 1,005 | ||||||
| Bay Area Toll Auth., San Francisco Bay Area Toll Bridge Rev. Bonds, Series 2017-G, 2.00% 2053 (put 2024) | 4,525 | 4,389 | ||||||
| Bay Area Toll Auth., San Francisco Bay Area Toll Bridge Rev. Ref. Bonds, Series 2014-C, 1.875% 2047 (put 2019) | 1,000 | 1,000 | ||||||
| Bay Area Toll Auth., San Francisco Bay Area Toll Bridge Rev. Ref. Bonds, Series 2017-S-7, 5.00% 2024 | 1,200 | 1,377 | ||||||
| Bay Area Water Supply and Conservation Agcy., Rev. Bonds, Series 2013-A, 5.00% 2023 | 500 | 561 | ||||||
| City of Beaumont, Wastewater Rev. Bonds, Series 2018-A, Assured Guaranty Municipal insured, 5.00% 2026 | 500 | 591 | ||||||
| Trustees of the California State University, Systemwide Rev. Bonds, Series 2016-B-2, 4.00% 2049 (put 2021) | 2,000 | 2,078 | ||||||
| Trustees of the California State University, Systemwide Rev. Bonds, Series 2016-B-3, 4.00% 2051 (put 2023) | 2,500 | 2,674 | ||||||
| City of Carlsbad, Reassessment Dist. No. 2012-1, Limited Obligation Rev. Ref. Bonds, Series 2013, 3.55% 2023 | 350 | 359 | ||||||
| 42 | Private Client Services Funds |
Capital Group California Core Municipal Fund
| Bonds, notes & other debt instruments | Principal amount (000) | Value (000) | ||||||
| City of Cathedral City, Successor Agcy. to the Redev. Agcy., Tax Allocation Housing Rev. Ref. Bonds (Merged Redev. Project Area), Series 2014-B, Assured Guaranty Municipal insured, 5.00% 2024 | $ | 260 | $ | 297 | ||||
| City of Cerritos, Public Fncg. Auth., Tax Allocation Rev. Bonds (Cerritos Redev. Projects), Series 2002-A, AMBAC insured, 5.00% 2019 | 2,000 | 2,025 | ||||||
| City of Cerritos, Public Fncg. Auth., Tax Allocation Rev. Bonds (Cerritos Redev. Projects), Series 2002-A, AMBAC insured, 5.00% 2024 | 600 | 607 | ||||||
| City of Chino, Successor Agcy. to the Redev. Agcy., Tax Allocation Rev. Ref. Bonds, Series 2014-A, BAM insured, 5.00% 2022 | 450 | 495 | ||||||
| City of Chino, Successor Agcy. to the Redev. Agcy., Tax Allocation Rev. Ref. Bonds, Series 2014-A, BAM insured, 5.00% 2025 | 665 | 744 | ||||||
| City of Chula Vista, Municipal Fncg. Auth., Special Tax Rev. Ref. Bonds, Series 2013, 5.00% 2020 | 910 | 957 | ||||||
| City of Chula Vista, Municipal Fncg. Auth., Special Tax Rev. Ref. Bonds, Series 2013, 5.00% 2021 | 535 | 574 | ||||||
| City of Chula Vista, Municipal Fncg. Auth., Special Tax Rev. Ref. Bonds, Series 2013, 5.00% 2022 | 1,355 | 1,482 | ||||||
| Compton Community College Dist., G.O. Rev. Ref. Bonds, Series 2014, BAM insured, 5.00% 2026 | 1,290 | 1,454 | ||||||
| Compton Unified School Dist., G.O. Rev. Ref. Bonds, 2002 Election, Series 2006-D, AMBAC insured, 0% 2021 | 3,000 | 2,830 | ||||||
| City of Concord, Successor Agcy. of the Redev. Agcy., Rev. Ref. Bonds, Series 2014, BAM insured, 5.00% 2023 | 825 | 915 | ||||||
| Contra Costa Transportation Auth., Sales Tax Rev. Ref. Bonds, Series 2018-A, (1-month USD-LIBOR x 0.70 + 0.25%) 1.829% 2034 (put 2021)1 | 5,525 | 5,521 | ||||||
| City of Desert Hot Springs, Successor Agcy. to the Redev. Agcy., Tax Allocation Ref. Bonds, Series 2017, BAM insured, 5.00% 2021 | 800 | 858 | ||||||
| Eastern Municipal Water Dist., Rev. Ref. Water and Wastewater Rev. Bonds, Series 2018-B, (1-month USD-LIBOR x 0.70 + 0.30%) 1.879% 2030 (put 2021)1 | 5,000 | 4,994 | ||||||
| Econ. Recovery Rev. Ref. Bonds, Series 2009-A, 5.25% 2021 (preref. 2019) | 675 | 691 | ||||||
| Econ. Recovery Rev. Ref. Bonds, Series 2009-A, 5.25% 2021 (preref. 2019) | 385 | 394 | ||||||
| Educational Facs. Auth., Rev. Bonds (California Institute of Technology), Series 2009, 5.00% 2039 (preref. 2019) | 3,000 | 3,098 | ||||||
| Educational Facs. Auth., Rev. Bonds (Chapman University), Series 2011, 5.00% 2019 | 1,150 | 1,165 | ||||||
| Educational Facs. Auth., Rev. Bonds (Pitzer College), Series 2009, 5.50% 2029 (preref. 2020) | 400 | 420 | ||||||
| Educational Facs. Auth., Rev. Bonds (Santa Clara University), Series 2010, 5.00% 2021 (preref. 2020) | 550 | 572 | ||||||
| Educational Facs. Auth., Rev. Bonds (University of San Francisco), Series 2011, 5.00% 2021 | 355 | 385 | ||||||
| Educational Facs. Auth., Rev. Bonds (University of San Francisco), Series 2011, 5.00% 2021 (escrowed to maturity) | 345 | 374 | ||||||
| Educational Facs. Auth., Rev. Bonds (University of the Pacific), Series 2012-A, 4.00% 2021 | 560 | 592 | ||||||
| Educational Facs. Auth., Rev. Bonds (University of the Pacific), Series 2012-A, 4.00% 2022 | 500 | 528 | ||||||
| Educational Facs. Auth., Rev. Ref. Bonds (Pomona College), Series 2009-A, 5.00% 2024 (preref. 2019) | 100 | 101 | ||||||
| Educational Facs. Auth., Rev. Ref. Bonds (University of Redlands), Series 2015-A, 5.00% 2021 | 535 | 577 | ||||||
| City of El Centro, Fncg. Auth., Wastewater Rev. Ref. Bonds, Series 2014-A, Assured Guaranty Municipal insured, 5.00% 2026 | 530 | 597 | ||||||
| City of El Centro, Fncg. Auth., Wastewater Rev. Ref. Bonds, Series 2014-A, Assured Guaranty Municipal insured, 5.00% 2027 | 500 | 561 | ||||||
| City of El Centro, Fncg. Auth., Wastewater Rev. Ref. Bonds, Series 2014-A, Assured Guaranty Municipal insured, 5.00% 2030 | 1,000 | 1,108 | ||||||
| County of El Dorado, Community Facs. Dist. No. 1992-1 (El Dorado Hills Dev.), Special Tax Rev. Ref. Bonds, Series 2012, 5.00% 2024 | 860 | 935 | ||||||
| City of Elk Grove, Fin. Auth., Special Tax Rev. Bonds, Series 2015, BAM insured, 5.00% 2025 | 580 | 665 | ||||||
| City of Eureka, Successor Agcy. to the Redev. Agcy., Tax Allocation Rev. Ref. Bonds, Series 2017-B, 5.00% 2022 | 835 | 922 | ||||||
| City of Fillmore, Successor Agcy. to the Redev. Agcy., Tax Allocation Rev. Ref. Bonds, Series 2015, BAM insured, 5.00% 2024 | 1,000 | 1,132 | ||||||
| Private Client Services Funds | 43 |
Capital Group California Core Municipal Fund
| Bonds, notes & other debt instruments (continued) | Principal amount (000) | Value (000) | ||||||
| California (continued) | ||||||||
| City of Fontana, Community Facs. Dist. No. 22 (Sierra Hills South), Special Tax Bonds, Series 2014, 5.00% 2023 | $ | 535 | $ | 591 | ||||
| Various Purpose G.O. Bonds, National insured, Series 1994, 6.00% 2020 | 5 | 5 | ||||||
| Various Purpose G.O. Bonds, Series 2017, 5.00% 2024 | 530 | 604 | ||||||
| Various Purpose G.O. Bonds, Series 2018, 5.00% 2026 | 2,000 | 2,316 | ||||||
| Various Purpose G.O. Rev. Ref. Bonds, Series 2015, 5.00% 2022 | 2,000 | 2,203 | ||||||
| Various Purpose G.O. Rev. Ref. Bonds, Series 2017, 5.00% 2024 | 4,505 | 5,147 | ||||||
| Various Purpose G.O. Rev. Ref. Bonds, Series 2017, 5.00% 2024 | 605 | 689 | ||||||
| Various Purpose G.O. Rev. Ref. Bonds, Series 2017, 5.00% 2026 | 7,785 | 9,070 | ||||||
| Various Purpose G.O. Rev. Ref. Bonds, Series 2017, 5.00% 2026 | 1,750 | 2,045 | ||||||
| Various Purpose G.O. Rev. Ref. Bonds, Series 2017, 5.00% 2027 | 4,000 | 4,689 | ||||||
| Various Purpose G.O. Rev. Ref. Bonds, Series 2017, 5.00% 2029 | 4,000 | 4,654 | ||||||
| City of Garden Grove, Successor Agcy. to the Dev. Agcy., Tax Allocation Bonds, Series 2016, BAM insured, 5.00% 2022 | 400 | 441 | ||||||
| City of Glendale, Successor Agcy. to the Redev. Agcy., Tax Allocation Rev. Ref. Bonds (Central Glendale Redev. Project), Series 2016, BAM insured, 5.00% 2024 | 410 | 469 | ||||||
| Golden Empire Schools Fncg. Auth., Lease Rev. Ref. Bonds (Kern High School Dist. Projects), Series 2018, 4.00% 2020 | 1,500 | 1,546 | ||||||
| Golden State Tobacco Securitization Corp., Enhanced Tobacco Settlement Asset-Backed Bonds, Series 2005-A, AMBAC insured, 0% 2024 | 2,000 | 1,718 | ||||||
| Golden State Tobacco Securitization Corp., Enhanced Tobacco Settlement Asset-Backed Bonds, Series 2005-A, Assured Guaranty Municipal insured, 0% 2026 | 2,785 | 2,237 | ||||||
| Golden State Tobacco Securitization Corp., Enhanced Tobacco Settlement Asset-Backed Bonds, Series 2013-A, 5.00% 2021 | 2,000 | 2,146 | ||||||
| Golden State Tobacco Securitization Corp., Enhanced Tobacco Settlement Asset-Backed Bonds, Series 2017A-1, 5.00% 2022 | 1,730 | 1,880 | ||||||
| Golden State Tobacco Securitization Corp., Enhanced Tobacco Settlement Asset-Backed Bonds, Series 2018-A, 5.00% 2022 | 3,000 | 3,289 | ||||||
| Golden State Tobacco Securitization Corp., Tobacco Settlement Asset-Backed Bonds, Series 2017-A, 5.00% 2021 | 295 | 315 | ||||||
| Golden West Schools Fncg. Auth., G.O. Rev. Ref. Bonds, Series 1999-A, MBIA insured, 0% 2020 | 1,100 | 1,070 | ||||||
| City of Hawthorne, Successor Agcy. to the Redev. Agcy., Tax Allocation Rev. Ref. Bonds, Series 2016, Assured Guaranty Municipal insured, 5.00% 2024 | 250 | 287 | ||||||
| Health Facs. Fncg. Auth., Insured Rev. Ref. Bonds (Marshall Medical Center), Series 2015, 5.00% 2022 | 175 | 195 | ||||||
| Health Facs. Fncg. Auth., Insured Rev. Ref. Bonds (Marshall Medical Center), Series 2015, 5.00% 2023 | 135 | 153 | ||||||
| Health Facs. Fncg. Auth., Rev. Bonds (Adventist Health System/West), Series 2013-A, 5.00% 2020 | 675 | 702 | ||||||
| Health Facs. Fncg. Auth., Rev. Bonds (Adventist Health System/West), Series 2013-A, 5.00% 2023 | 1,000 | 1,104 | ||||||
| Health Facs. Fncg. Auth., Rev. Bonds (Adventist Health System/West), Series 2013-A, 5.00% 2024 | 1,210 | 1,333 | ||||||
| Health Facs. Fncg. Auth., Rev. Bonds (Catholic Healthcare West), Series 2008-G, 5.50% 2025 | 95 | 95 | ||||||
| Health Facs. Fncg. Auth., Rev. Bonds (City of Hope), Series 2012-A, 5.00% 2021 | 350 | 379 | ||||||
| Health Facs. Fncg. Auth., Rev. Bonds (Lucile Salter Packard Children’s Hospital at Stanford), Series 2014-A, 5.00% 2025 | 400 | 452 | ||||||
| Health Facs. Fncg. Auth., Rev. Bonds (Providence St. Joseph Health), Series 2014-A, 5.00% 2019 | 525 | 540 | ||||||
| Health Facs. Fncg. Auth., Rev. Bonds (Scripps Health), Series 2012-A, 5.00% 2024 | 150 | 163 | ||||||
| Health Facs. Fncg. Auth., Rev. Bonds (Scripps Health), Series 2012-A, 5.00% 2025 | 375 | 407 | ||||||
| Health Facs. Fncg. Auth., Rev. Bonds (Sutter Health), Series 2016-A, 5.00% 2026 | 300 | 349 | ||||||
| Health Facs. Fncg. Auth., Rev. Bonds (Sutter Health), Series 2018A, 5.00% 2024 | 3,000 | 3,456 | ||||||
| Health Facs. Fncg. Auth., Rev. Bonds (Sutter Health), Series 2018-A, 5.00% 2025 | 3,105 | 3,627 | ||||||
| Health Facs. Fncg. Auth., Rev. Green Bonds (Kaiser Permanente), Series 2017-C, 5.00% 2031 (put 2022) | 2,605 | 2,885 | ||||||
| Health Facs. Fncg. Auth., Rev. Ref. Bonds (Adventist Health), Series 2016-A, 4.00% 2025 | 1,255 | 1,355 | ||||||
| Health Facs. Fncg. Auth., Rev. Ref. Bonds (Catholic Healthcare West), Series 2011-A, 5.00% 2021 | 2,675 | 2,842 | ||||||
| 44 | Private Client Services Funds |
Capital Group California Core Municipal Fund
| Bonds, notes & other debt instruments | Principal amount (000) | Value (000) | ||||||
| Health Facs. Fncg. Auth., Rev. Ref. Bonds (Lucile Salter Packard Children’s Hospital at Stanford), Series 2012-B, 4.00% 2019 | $ | 400 | $ | 407 | ||||
| Health Facs. Fncg. Auth., Rev. Ref. Bonds (St. Joseph Health System), Series 2013-C, 5.00% 2043 (put 2019) | 1,750 | 1,796 | ||||||
| Health Facs. Fncg. Auth., Rev. Ref. Bonds (St. Joseph Health System), Series 2013-D, 5.00% 2043 (put 2020) | 250 | 264 | ||||||
| Health Facs. Fncg. Auth., Rev. Ref. Bonds (Stanford Health Care), Series 2017-A, 5.00% 2023 | 1,000 | 1,137 | ||||||
| Health Facs. Fncg. Auth., Rev. Ref. Bonds (Stanford Health Care), Series 2017-A, 5.00% 2024 | 1,000 | 1,156 | ||||||
| Hemet Unified School Dist., Fncg. Auth. Special Tax Rev. Bonds, Series 2015, 5.00% 2026 | 600 | 662 | ||||||
| Hemet Unified School Dist., G.O. Rev. Ref. Bonds, Series 2014, Assured Guaranty Municipal insured, 5.00% 2023 | 885 | 992 | ||||||
| Hemet Unified School Dist., G.O. Rev. Ref. Bonds, Series 2014, Assured Guaranty Municipal insured, 5.00% 2029 | 500 | 563 | ||||||
| Imperial Irrigation Dist., Electric System Rev. Ref. Bonds, Series 2008-A, 5.25% 2025 (preref. 2018) | 80 | 80 | ||||||
| Imperial Irrigation Dist., Electric System Rev. Ref. Bonds, Series 2008-A, 5.25% 2025 (preref. 2018) | 20 | 20 | ||||||
| Infrastructure and Econ. Dev. Bank, Rev. Bonds (The Colburn School), Series 2015-B, (SIFMA Municipal Swap Index + 1.20%) 2.80% 2037 (put 2022)1 | 1,000 | 1,023 | ||||||
| Infrastructure and Econ. Dev. Bank, Rev. Ref. Bonds (Academy of Sciences, San Francisco), Series 2018-C, (3-month USD-LIBOR x 0.70 + 0.38%) 1.976% 2047 (put 2021)1 | 4,000 | 3,999 | ||||||
| Infrastructure and Econ. Dev. Bank, Rev. Ref. Bonds (J. Paul Getty Trust), Series 2011-A-4, (3-month USD-LIBOR x 0.70 + 0.37%) 2.047% 2038 (put 2020)1 | 3,000 | 3,008 | ||||||
| Infrastructure and Econ. Dev. Bank, Rev. Ref. Bonds (Segerstrom Center for the Arts), Series 2017, 5.00% 2028 | 3,000 | 3,498 | ||||||
| City of Irvine, Reassessment Dist. No. 12-1, Limited Obligation Improvement Bonds, Series 2012, 3.00% 2020 | 1,250 | 1,270 | ||||||
| City of Irvine, Reassessment Dist. No. 12-1, Limited Obligation Improvement Bonds, Series 2012, 3.25% 2022 | 700 | 725 | ||||||
| City of Irvine, Reassessment Dist. No. 12-1, Limited Obligation Improvement Bonds, Series 2012, 4.00% 2022 | 400 | 426 | ||||||
| City of Irvine, Reassessment Dist. No. 13-1, Limited Obligation Improvement Bonds, Series 2013, 2.50% 2019 | 1,230 | 1,237 | ||||||
| City of Irvine, Reassessment Dist. No. 13-1, Limited Obligation Improvement Bonds, Series 2013, 3.375% 2023 | 850 | 887 | ||||||
| City of Irvine, Reassessment Dist. No. 15-1, Limited Obligation Improvement Bonds, Series 2015, 5.00% 2021 | 500 | 540 | ||||||
| Irvine Unified School Dist., Community Facs. Dist. No. 09-1, Special Tax Bonds, Series 2017-A, BAM insured, 5.00% 2021 | 1,280 | 1,368 | ||||||
| City of Jurupa, Public Fncg. Auth., Special Tax Rev. Bonds, Series 2014-A, 5.00% 2023 | 500 | 559 | ||||||
| City of Jurupa, Public Fncg. Auth., Special Tax Rev. Bonds, Series 2014-A, 5.00% 2029 | 710 | 787 | ||||||
| County of Kern, Water Agcy., Water Rev. Ref. Bonds (Improvement Dist. No. 4), Series 2016-A, Assured Guaranty Municipal insured, 5.00% 2022 | 2,810 | 3,089 | ||||||
| Kern Community College Dist., Capital Appreciation Bonds, 2002 Election, Series 2006, FSA insured, 0% 2022 | 1,500 | 1,361 | ||||||
| Kings Canyon Joint Unified School Dist., G.O. Rev. Ref. Bonds, Series 2016, Assured Guaranty Municipal insured, 5.00% 2029 | 1,600 | 1,817 | ||||||
| City of La Quinta, Successor Agcy. to the Redev. Agcy., Tax Allocation Rev. Ref. Bonds (Redev. Project Area Nos. 1 and 2), Series 2013-A, 5.00% 2019 | 200 | 205 | ||||||
| City of La Quinta, Successor Agcy. to the Redev. Agcy., Tax Allocation Rev. Ref. Bonds (Redev. Project Area Nos. 1 and 2), Series 2014-A, 4.00% 2019 | 500 | 509 | ||||||
| Lammersville Joint Unified School Dist., Special Tax Bonds, Community Facs. Dist. No. 2002, Series 2017, 4.00% 2022 | 680 | 710 | ||||||
| City of Lodi, Public Fin. Auth., Rev. Ref. Bonds, Series 2018, Assured Guaranty Muncipal insured, 5.00% 2024 | 260 | 297 | ||||||
| City of Long Beach, Bond Fin. Auth., Rev. Ref. Bonds (Aquarium of the Pacific Project), Series 2012, 4.00% 2020 | 750 | 780 | ||||||
| City of Long Beach, Bond Fin. Auth., Rev. Ref. Bonds (Aquarium of the Pacific Project), Series 2012, 5.00% 2021 | 520 | 563 | ||||||
| Private Client Services Funds | 45 |
Capital Group California Core Municipal Fund
| Bonds, notes & other debt instruments (continued) | Principal amount (000) | Value (000) | ||||||
| California (continued) | ||||||||
| City of Long Beach, Harbor Rev. Bonds, Series 2010-A, AMT, 5.00% 2021 | $ | 100 | $ | 105 | ||||
| City of Long Beach, Marina Rev. Bonds (Alamitos Bay Marina Project), Series 2015, 5.00% 2019 | 275 | 279 | ||||||
| City of Long Beach, Marina Rev. Bonds (Alamitos Bay Marina Project), Series 2015, 5.00% 2020 | 400 | 416 | ||||||
| City of Los Angeles, Community Facs. Dist. No. 4 (Playa Vista - Phase 1), Special Tax Rev. Ref. Bonds, Series 2014, 5.00% 2020 | 600 | 631 | ||||||
| City of Los Angeles, Community Facs. Dist. No. 4 (Playa Vista - Phase 1), Special Tax Rev. Ref. Bonds, Series 2014, 5.00% 2023 | 700 | 783 | ||||||
| City of Los Angeles, Dept. of Airports, Los Angeles International Airport, Rev. Bonds, Series 2009-A, 5.00% 2029 | 200 | 203 | ||||||
| County of Los Angeles, Cerritos Community College Dist., G.O. Bonds, 2004 Election, Series 2012-D, 0% 2027 | 830 | 632 | ||||||
| County of Los Angeles, Redev. Ref. Auth., Tax Allocation Rev. Ref. Bonds (South Gate Project No. 1), Series 2014-A, Assured Guaranty Municipal insured, 5.00% 2022 | 1,190 | 1,308 | ||||||
| Los Angeles Unified School Dist. (County of Los Angeles), G.O. Rev. Ref. Bonds, Series 2017-A, 5.00% 2026 | 2,500 | 2,931 | ||||||
| Los Angeles Unified School Dist., G.O. Bonds (Dedicated Unlimited Ad Valorem Property Tax Bonds), 2005 Election, Series 2018-B-1, 5.00% 2027 | 1,500 | 1,775 | ||||||
| Los Angeles Unified School Dist., G.O. Bonds (Dedicated Unlimited Ad Valorem Property Tax Bonds), Series 2016-B, 5.00% 2027 | 4,000 | 4,666 | ||||||
| Los Angeles Unified School Dist., G.O. Bonds, 2004 Election, Series 2009-I, 5.00% 2024 | 100 | 102 | ||||||
| Los Angeles Unified School Dist., G.O. Rev. Ref. Bonds (Dedicated Unlimited Ad Valorem Property Tax Bonds), Series 2016-A, 5.00% 2024 | 4,000 | 4,589 | ||||||
| Los Angeles Unified School Dist., G.O. Rev. Ref. Bonds, Series 2017-A, 5.00% 2024 | 2,500 | 2,868 | ||||||
| Los Angeles Unified School Dist., G.O. Rev. Ref. Bonds, Series 2017-A, 5.00% 2025 | 1,000 | 1,163 | ||||||
| M-S-R Public Power Agcy., Rev. Bonds (San Juan Project), Series 2018-R, 5.00% 2021 | 2,000 | 2,156 | ||||||
| Manhattan Beach Unified School Dist., G.O. Bonds, Series 1999-C, FGIC-National insured, 0% 2024 | 1,500 | 1,264 | ||||||
| Manteca Unified School Dist., Capital Appreciation Bonds, 2004 Election, Series 2006, MBIA insured, 0% 2027 | 560 | 433 | ||||||
| City of Merced, Irrigation Dist., Electric System Rev. Ref. Bonds, Series 2015-A, Assured Guaranty Municipal insured, 5.00% 2022 | 500 | 551 | ||||||
| City of Merced, Irrigation Dist., Electric System Rev. Ref. Bonds, Series 2015-A, Assured Guaranty Municipal insured, 5.00% 2028 | 250 | 285 | ||||||
| City of Modesto, Irrigation Dist., Electric System Rev. Ref. Bonds, Series 2016, 5.00% 2022 | 750 | 831 | ||||||
| Montebello Unified School Dist., G.O. Rev. Ref. Bonds, Election 2004, Series 2013-A, 5.00% 2024 | 520 | 579 | ||||||
| Montebello Unified School Dist., G.O. Rev. Ref. Bonds, Series 2015, 5.00% 2028 | 1,545 | 1,738 | ||||||
| Montebello Unified School Dist., Rev. Bonds, Series 2016-A, 4.00% 2019 | 1,250 | 1,270 | ||||||
| Mountain View Shoreline Regional Park Community, Rev. Bonds, Series 2011-A, 5.00% 2019 | 420 | 430 | ||||||
| Municipal Fin. Auth. Rev. Bonds (Retirement Housing Foundation), Series 2017-A, 5.00% 2024 | 300 | 334 | ||||||
| Municipal Fin. Auth., Educational Rev. Bonds (American Heritage Education Foundation Project), Series 2016-A, 4.00% 2026 | 305 | 314 | ||||||
| Municipal Fin. Auth., Rev. Bonds (California Lutheran University), Series 2018, 5.00% 2026 | 300 | 342 | ||||||
| Municipal Fin. Auth., Rev. Bonds (University of La Verne), Series 2017-A, 5.00% 2023 | 750 | 833 | ||||||
| Municipal Fin. Auth., Rev. Ref. Bonds (Biola University), Series 2013, 5.00% 2022 | 470 | 516 | ||||||
| Municipal Fin. Auth., Rev. Ref. Bonds (Harbor Regional Center Project), Series 2015, 5.00% 2022 | 885 | 973 | ||||||
| Municipal Fin. Auth., Rev. Ref. Bonds (Harbor Regional Center Project), Series 2015, 5.00% 2025 | 500 | 573 | ||||||
| Murrieta Valley Unified School Dist., Public Fncg. Auth., Special Tax Rev. Bonds, Series 2016-A, 4.00% 2020 | 125 | 129 | ||||||
| Natomas Unified School Dist., G.O. Bonds, Series 2014, BAM insured, 5.00% 2021 | 500 | 539 | ||||||
| Northern California Power Agcy., Geothermal Project No. 3 Rev. Bonds, Series 2009-A, 5.50% 2021 (preref. 2019) | 1,000 | 1,024 | ||||||
| Northern California Power Agcy., Hydroelectric Project No. 1 Rev. Ref. Bonds, Series 2010-A, 5.00% 2019 | 200 | 204 | ||||||
| Oakland Unified School Dist., G.O. Rev. Ref. Bonds, Series 2017, 5.00% 2022 | 4,000 | 4,402 | ||||||
| 46 | Private Client Services Funds |
Capital Group California Core Municipal Fund
| Bonds, notes & other debt instruments | Principal amount (000) | Value (000) | ||||||
| Oakland Unified School Dist., G.O. Rev. Ref. Bonds, Series 2017-A, 5.00% 2023 | $ | 1,500 | $ | 1,683 | ||||
| Ohlone Community College Dist., G.O. Ref. Bonds, Series 2012, 5.00% 2023 | 550 | 608 | ||||||
| Ohlone Community College Dist., G.O. Rev. Ref. Bonds, Series 2012, 5.00% 2024 | 1,000 | 1,104 | ||||||
| City of Orange, Community Facs. Dist. No. 91-2 (Serrano Heights Public Improvements), Special Tax Rev. Ref. Bonds, Series 2013, 4.00% 2020 | 385 | 399 | ||||||
| City of Orange, Community Facs. Dist. No. 91-2 (Serrano Heights Public Improvements), Special Tax Rev. Ref. Bonds, Series 2013, 4.00% 2021 | 1,485 | 1,558 | ||||||
| City of Oxnard, Bond Fin. Auth., Wastewater Rev. Ref. Bonds, Series 2014, Assured Guaranty Municipal insured, 5.00% 2024 | 250 | 287 | ||||||
| City of Oxnard, Fncg. Auth., Wastewater Rev. Ref. Bonds, Series 2014, Assured Guaranty Municipal insured, 5.00% 2021 | 750 | 809 | ||||||
| Palomar Health, G.O. Rev. Ref. Bonds, Series 2016-A, 5.00% 2026 | 630 | 721 | ||||||
| Paramount Unified School Dist., G.O. Bonds, 1998 Election, Series 2001-B, Assured Guaranty Municipal insured, 0% 2025 | 3,000 | 2,453 | ||||||
| City of Perris, Joint Powers Auth., Local Agcy. Rev. Ref. Bonds (CFD No. 2001-1 IA Nos. 4 and 5; CFD 2005-1 IA4), Series 2017-B, 3.00% 2021 | 895 | 904 | ||||||
| City of Perris, Joint Powers Auth., Local Agcy. Rev. Ref. Bonds (CFD No. 2001-1 IA Nos. 4 and 5; CFD 2005-1 IA4), Series 2017-B, 4.00% 2022 | 915 | 956 | ||||||
| Perris Union High School Dist., Fncg. Auth., Rev. Bonds, Series 2015, 5.00% 2024 | 1,000 | 1,113 | ||||||
| Poway Unified School Dist., Community Facs. Dist. No. 6 (4S Ranch), Special Tax Bonds, Series 2012, 5.00% 2020 | 595 | 625 | ||||||
| Poway Unified School Dist., Public Fncg. Auth., Special Tax Rev. Bonds, Series 2013, 4.00% 2022 | 440 | 468 | ||||||
| Poway Unified School Dist., Public Fncg. Auth., Special Tax Rev. Ref. Bonds, Series 2015-A, 5.00% 2022 | 850 | 924 | ||||||
| Poway Unified School Dist., Public Fncg. Auth., Special Tax Rev. Ref. Bonds, Series 2015-B, BAM insured, 5.00% 2022 | 500 | 548 | ||||||
| Public Fin. Auth., Electric System Rev. Ref. Bonds, Series 2018, Assured Guaranty Municipal insured, 5.00% 2023 | 730 | 819 | ||||||
| Public Fin. Auth., Rev. Bonds (Henry Mayo Newhall Memorial Hospital), Series 2017, Assured Guaranty Municipal insured, 5.00% 2023 | 500 | 556 | ||||||
| Public Works Board, Lease Rev. Bonds (Judicial Council of California, Various Judicial Council Projects), Series 2011-D, 5.00% 2022 | 1,225 | 1,335 | ||||||
| Public Works Board, Lease Rev. Ref. Bonds (Coalinga State Hospital Project), Series 2013-E, 5.00% 2023 | 3,575 | 3,997 | ||||||
| Public Works Board, Lease Rev. Ref. Bonds (Dept. of Corrections, Various State Prisons), Series 2015-A, 5.00% 2023 | 790 | 883 | ||||||
| Public Works Board, Lease Rev. Ref. Bonds (Dept. of Corrections, Various State Prisons), Series 2018-C, 5.00% 2026 | 1,000 | 1,168 | ||||||
| Public Works Board, Lease Rev. Ref. Bonds (Dept. of Education - Riverside Campus Projects), Series 2017-H, 5.00% 2026 | 1,780 | 2,065 | ||||||
| Public Works Board, Lease Rev. Ref. Bonds (Various Capital Projects), Series 2016-C, 5.00% 2024 | 1,725 | 1,971 | ||||||
| Public Works Board, Lease Rev. Ref. Bonds (Various Capital Projects), Series 2016-D, 5.00% 2028 | 5,000 | 5,780 | ||||||
| Public Works Board, Lease Rev. Ref. Bonds (Various Capital Projects), Series 2017-B, 5.00% 2028 | 1,175 | 1,371 | ||||||
| Public Works Board, Lease Rev. Ref. Bonds (Various Capital Projects), Series 2017-C, 5.00% 2026 | 4,060 | 4,706 | ||||||
| City of Rancho Cucamonga, Successor Agcy. to the Redev. Agcy., Rancho Redev. Project Area, Tax Allocation Ref. Bonds, Series 2014, Assured Guaranty Municipal insured, 5.00% 2028 | 300 | 339 | ||||||
| City of Rancho Cucamonga, Successor Agcy. to the Redev. Agcy., Rancho Redev. Project Area, Tax Allocation Rev. Ref. Bonds, Series 2014, Assured Guaranty Municipal insured, 5.00% 2026 | 600 | 684 | ||||||
| City of Richmond, Successor Agcy. to the Redev. Agcy., Rev. Ref. Bonds, Series 2014-A, BAM insured, 5.00% 2025 | 200 | 223 | ||||||
| Rio Elementary School Dist., Community Facs. Dist. No. 1, Special Tax Bonds, Series 2016, BAM insured, 5.00% 2032 | 240 | 267 | ||||||
| Rio Elementary School Dist., Community Facs. Dist. No. 1, Special Tax Ref. Bonds, Series 2014, 5.00% 2022 | 400 | 438 | ||||||
| Private Client Services Funds | 47 |
Capital Group California Core Municipal Fund
| Bonds, notes & other debt instruments (continued) | Principal amount (000) | Value (000) | ||||||
| California (continued) | ||||||||
| City of Riverside, Successor Agcy. to the Redev. Agcy., Tax Allocation Rev. Ref. Bonds, Series 2014-A, 5.00% 2021 | $ | 1,000 | $ | 1,085 | ||||
| County of Riverside, Public Fncg. Auth., Tax Allocation Rev. Bonds (Project Area No. 1, Desert Communities and Interstate 215 Corridor Projects), Series 2015-A, Assured Guaranty Municipal insured, 5.00% 2023 | 1,075 | 1,204 | ||||||
| County of Riverside, Public Fncg. Auth., Tax Allocation Rev. Ref. Bonds (Desert Communities and Interstate 215 Corridor Projects), Series 2014-D, Assured Guaranty Municipal insured, 5.00% 2020 | 405 | 426 | ||||||
| County of Riverside, Public Fncg. Auth., Tax Allocation Rev. Ref. Bonds (Desert Communities and Interstate 215 Corridor Projects), Series 2014-D, Assured Guaranty Municipal insured, 5.00% 2021 | 575 | 620 | ||||||
| County of Riverside, Public Fncg. Auth., Tax Allocation Rev. Ref. Bonds (Hemet Project), Series 2014, BAM insured, 5.00% 2023 | 500 | 560 | ||||||
| County of Riverside, Public Fncg. Auth., Tax Allocation Rev. Ref. Bonds (Interstate 215 Corridor Project), Series 2014-E, Assured Guaranty Municipal insured, 5.00% 2021 | 465 | 501 | ||||||
| Riverside Unified School Dist., Fncg. Auth., Rev. Bonds, Series 2012-A, 5.00% 2021 | 1,280 | 1,377 | ||||||
| Riverside Unified School Dist., Fncg. Auth., Special Tax Rev. Ref. Bonds, Series 2015, BAM insured, 5.00% 2025 | 350 | 396 | ||||||
| Riverside Unified School Dist., Fncg. Auth., Special Tax Rev. Ref. Bonds, Series 2015, BAM insured, 5.00% 2026 | 400 | 452 | ||||||
| City of Roseville, Westpark Community Facs. Dist. No. 1 (Public Facs.), Special Tax Rev. Ref. Bonds, Series 2015, 5.00% 2024 | 1,000 | 1,114 | ||||||
| City of Sacramento, Municipal Utility Dist., Electric Rev. Bonds, Series 1997-K, AMBAC insured, 5.25% 2024 | 1,000 | 1,123 | ||||||
| City of Sacramento, Regional Transit Dist., Farebox Rev. Bonds, Series 2012, 5.00% 2023 | 385 | 404 | ||||||
| San Bernardino Unified School Dist., G.O. Ref. Bonds, Series 2017-D, Assured Guaranty Municipal insured, 4.00% 2020 | 480 | 496 | ||||||
| San Bernardino Unified School Dist., G.O. Ref. Bonds, Series 2017-D, Assured Guaranty Municipal insured, 4.00% 2021 | 330 | 347 | ||||||
| City of San Diego, Limited Obligation Rev. Bonds (Sanford Burnham Prebys Medical Discovery Institute Project), Series 2015-A, 5.00% 2022 | 200 | 219 | ||||||
| City of San Diego, Public Facs. Fncg. Auth., Sewer Rev. Ref. Bonds, Series 2009-B, 5.00% 2022 (preref. 2019) | 100 | 102 | ||||||
| County of San Diego, Regional Airport Auth., Airport Rev. Bonds, Series 2013-A, 5.00% 2023 | 225 | 255 | ||||||
| County of San Diego, Regional Transportation Commission, Limited Sales Tax Rev. Bonds, Series 2014-A, 5.00% 2021 | 500 | 537 | ||||||
| San Diego Community College Dist., G.O. Rev. Ref. Bonds, Series 2012, 5.00% 2024 | 1,000 | 1,107 | ||||||
| City and County of San Francisco, Redev. Agcy., Community Facs. Dist. No. 6, Special Tax Ref. Bonds (Mission Bay South Public Improvements), Series 2013-A, 5.00% 2020 | 800 | 840 | ||||||
| City and County of San Francisco, Redev. Agcy., Community Facs. Dist. No. 6, Special Tax Ref. Bonds (Mission Bay South Public Improvements), Series 2013-B, 3.25% 2021 | 500 | 510 | ||||||
| City and County of San Francisco, Redev. Fin. Auth., Tax Allocation Rev. Bonds (Mission Bay South Redev. Project), Series 2011-C, 5.25% 2019 (escrowed to maturity) | 290 | 298 | ||||||
| City and County of San Francisco, Successor Agcy. to the Redev. Agcy., Special Tax Rev. Ref. Bonds (San Francisco Redev. Projects), Series 2014-C, 5.00% 2022 | 305 | 338 | ||||||
| City of San Jacinto, Community Facs. Dist. No. 2002-1 (Rancho San Jacinto, Phase 2), Special Tax Rev. Ref. Bonds, Series 2016, 4.00% 2021 | 1,310 | 1,364 | ||||||
| San Joaquin Delta Community College Dist., G.O Bonds, 2004 Election, Series 2018-D, 4.00% 2023 | 1,000 | 1,084 | ||||||
| San Joaquin Hills Transportation Corridor Agcy., Toll Road Rev. Ref. Bonds, Series 1997-A, National insured, 0% 2025 | 285 | 232 | ||||||
| City of San Jose, Redev. Agcy., Housing Set-Aside Tax Allocation Rev. Ref. Bonds (Merged Area Redev. Project), Series 2010-A-1, 5.00% 2022 (preref. 2020) | 500 | 527 | ||||||
| San Jose Unified School Dist., G.O. Bonds, 2002 Election, Series 2006-C, National insured, 0% 2025 | 795 | 663 | ||||||
| San Jose Unified School Dist., G.O. Rev. Ref. Bonds, Series 2017, 5.00% 2022 | 500 | 554 | ||||||
| San Jose Unified School Dist., G.O. Rev. Ref. Bonds, Series 2017, 5.00% 2023 | 375 | 424 | ||||||
| San Jose Unified School Dist., G.O. Rev. Ref. Bonds, Series 2017, 5.00% 2024 | 500 | 575 | ||||||
| San Jose Unified School Dist., G.O. Rev. Ref. Bonds, Series 2017, 5.00% 2025 | 400 | 468 | ||||||
| 48 | Private Client Services Funds |
Capital Group California Core Municipal Fund
| Bonds, notes & other debt instruments | Principal amount (000) | Value (000) | ||||||
| San Mateo Joint Powers Fncg. Auth., Lease Rev. Ref. Bonds (Capital Projects), Series 2009-A, 5.25% 2023 | $ | 300 | $ | 311 | ||||
| County of Santa Clara, Fncg. Auth., Lease Rev. Ref. Bonds (Valley Medical Center), Series 2008-A, 5.00% 2022 | 285 | 285 | ||||||
| Santa Margarita Water Dist., Community Facs. Dist. No. 99-1 (Talega), Special Tax Ref. Bonds, Series 2014-B, 5.00% 2022 | 310 | 338 | ||||||
| Santa Margarita Water Dist., Community Facs. Dist. No. 99-1 (Talega), Special Tax Ref. Bonds, Series 2014-B, 5.00% 2024 | 530 | 592 | ||||||
| Santa Margarita Water Dist., Community Facs. Dist. No. 99-1 (Talega), Special Tax Ref. Bonds, Series 2014-B, 5.00% 2025 | 375 | 416 | ||||||
| City of Santa Rosa, Wastewater Rev. Bonds, Series 2002-B, AMBAC insured, 0% 2021 | 2,000 | 1,877 | ||||||
| Community of Santaluz, Community Facs. Dist. No. 2, Improvement Area No. 1, Special Tax Ref. Bonds, Series 2011-A, 5.00% 2020 | 985 | 1,031 | ||||||
| Saugus Union School Dist., G.O. Rev. Ref. Bonds, Capital Appreciation Bonds, Series 2006, National insured, 0% 2024 | 1,210 | 1,040 | ||||||
| Saugus Union School Dist., Saugus/Hart School Facs. Fin. Auth., Community Facs. Dist. No. 2006-1, Special Tax Rev. Bonds, Series 2016, 5.00% 2025 | 1,110 | 1,236 | ||||||
| School Fin. Auth., School Fac. Rev. Bonds (KIPP LA Projects), Series 2014-A, 4.125% 2024 | 1,540 | 1,590 | ||||||
| School Fin. Auth., School Fac. Rev. Bonds (KIPP LA Projects), Series 2015-A, 3.625% 20252 | 1,000 | 1,014 | ||||||
| School Fin. Auth., School Fac. Rev. Bonds (KIPP LA Projects), Series 2017-A, 4.00% 20192 | 225 | 228 | ||||||
| School Fin. Auth., School Fac. Rev. Bonds (KIPP LA Projects), Series 2017-A, 5.00% 20242 | 435 | 484 | ||||||
| School Fin. Auth., School Fac. Rev. Bonds (KIPP LA Projects), Series 2017-A, 5.00% 20262 | 180 | 203 | ||||||
| City of Seal Beach, Community Facs. Dist. No. 2005-1 (Pacific Gateway Business Center), Special Tax Rev. Ref. Bonds, Series 2016, 3.00% 2023 | 150 | 152 | ||||||
| City of Seal Beach, Community Facs. Dist. No. 2005-1 (Pacific Gateway Business Center), Special Tax Rev. Ref. Bonds, Series 2016, 3.00% 2024 | 145 | 146 | ||||||
| City of Seal Beach, Community Facs. Dist. No. 2005-1 (Pacific Gateway Business Center), Special Tax Rev. Ref. Bonds, Series 2016, 3.00% 2025 | 365 | 362 | ||||||
| City of Seal Beach, Community Facs. Dist. No. 2005-1 (Pacific Gateway Business Center), Special Tax Rev. Ref. Bonds, Series 2016, 3.00% 2026 | 150 | 146 | ||||||
| City of Signal Hill, Successor Agcy. to the Redev. Agcy., Tax Allocation Rev. Ref. Bonds, Series 2015-A, BAM insured, 5.00% 2021 | 250 | 270 | ||||||
| City of Signal Hill, Successor Agcy. to the Redev. Agcy., Tax Allocation Rev. Ref. Bonds, Series 2015-A, BAM insured, 5.00% 2023 | 500 | 560 | ||||||
| Solano Community College Dist., G.O. Ref. Bonds, National insured, Series 2005, 0% 2021 | 2,680 | 2,521 | ||||||
| Solano Community College Dist., G.O. Rev. Ref. Bonds, Series 2015, 0% 2025 (5.00% on 8/1/2023)3 | 700 | 639 | ||||||
| Southern California Public Power Auth., Rev. Ref. Bonds (Canyon Power Project), Series 2018-B, (SIFMA Municipal Swap Index + 0.25%) 1.85% 2040 (put 2021)1 | 2,625 | 2,622 | ||||||
| Southern California Public Power Auth., Rev. Bonds (Mead-Adelanto Project), Series 2012-A, 5.00% 2019 | 1,000 | 1,022 | ||||||
| Southern California Public Power Auth., Rev. Bonds (Southern Transmission Project), Series 2009-A, 5.00% 2023 | 10 | 10 | ||||||
| Southern California Public Power Auth., Rev. Bonds (Southern Transmission Project), Series 2009-A, 5.00% 2023 (preref. 2019) | 90 | 90 | ||||||
| Southern California Public Power Auth., Rev. Ref. Bonds (Magnolia Power Project A), Series 2017-1, 2.00% 2036 (put 2020) | 1,000 | 996 | ||||||
| Statewide Communities Dev. Auth., Insured Rev. Bonds (Viamonte Senior Living 1 Project), Series 2018-B, 3.00% 2025 | 1,000 | 1,009 | ||||||
| Statewide Communities Dev. Auth., Pollution Control Rev. Ref. Bonds (Southern California Edison Company), Series 2006-A, 1.90% 2028 | 2,000 | 1,979 | ||||||
| Statewide Communities Dev. Auth., Pollution Control Rev. Ref. Bonds (Southern California Edison Company), Series 2006-C, 2.63% 2033 (put 2023) | 3,250 | 3,199 | ||||||
| Statewide Communities Dev. Auth., Rev. Bonds (Adventist Health System/West), Series 2015-A, 5.00% 2025 | 750 | 862 | ||||||
| Statewide Communities Dev. Auth., Rev. Bonds (Adventist Health System/West), Series 2015-A, 5.00% 2028 | 2,085 | 2,384 | ||||||
| Statewide Communities Dev. Auth., Rev. Bonds (Adventist Health System/West), Series 2018-A, 5.00% 2034 | 975 | 1,106 | ||||||
| Private Client Services Funds | 49 |
Capital Group California Core Municipal Fund
| Bonds, notes & other debt instruments (continued) | Principal amount (000) | Value (000) | ||||||
| California (continued) | ||||||||
| Statewide Communities Dev. Auth., Rev. Bonds (American Baptist Homes of the West), Series 2015, 5.00% 2021 | $ | 1,100 | $ | 1,174 | ||||
| Statewide Communities Dev. Auth., Rev. Bonds (American Baptist Homes of the West), Series 2015, 5.00% 2023 | 1,100 | 1,207 | ||||||
| Statewide Communities Dev. Auth., Rev. Bonds (Cottage Health System Obligated Group), Series 2010, 5.00% 2019 | 1,000 | 1,029 | ||||||
| Statewide Communities Dev. Auth., Rev. Bonds (Henry Mayo Newhall Memorial Hospital), Series 2014, Assured Guaranty Municipal insured, 5.00% 2022 | 750 | 821 | ||||||
| Statewide Communities Dev. Auth., Rev. Bonds (Jewish Home of San Francisco), Series 2016, 5.00% 2026 | 575 | 677 | ||||||
| Statewide Communities Dev. Auth., Rev. Bonds (John Muir Health), Series 2009-A, 4.625% 07-01-21 (preref. 2019) | 100 | 102 | ||||||
| Statewide Communities Dev. Auth., Rev. Bonds (Kaiser Permanente), Series 2009-A, 5.00% 2019 | 600 | 608 | ||||||
| Statewide Communities Dev. Auth., Rev. Ref. Bonds (Episcopal Communities and Services), Series 2012, 5.00% 2019 | 600 | 610 | ||||||
| Statewide Communities Dev. Auth., Rev. Ref. Bonds (Episcopal Communities and Services), Series 2012, 5.00% 2024 | 300 | 325 | ||||||
| Statewide Communities Dev. Auth., Rev. Ref. Bonds (Huntington Memorial Hospital), Series 2014-B, 5.00% 2021 | 1,650 | 1,767 | ||||||
| Statewide Communities Dev. Auth., Student Housing Rev. Ref. Bonds (University of California, Irvine East Campus Apartments, CHF-Irvine, LLC, Phase I), Series 2011, 5.00% 2019 | 1,000 | 1,016 | ||||||
| City of Stockton, Public Fncg. Auth., Wastewater Rev. Ref. Bonds (1998 Wastewater Project and 2003 Wastewater Project), Series 2014, BAM insured, 5.00% 2021 | 750 | 811 | ||||||
| City of Suisun, Successor Agcy. to the Redev. Agcy., Tax Allocation Rev. Ref. Bonds, Series 2014-B, BAM insured, 5.00% 2022 | 400 | 441 | ||||||
| City of Tracy, Successor Agcy. to the Community Dev. Agcy., Tax Allocation Rev. Ref. Bonds, Series 2016, Assured Guaranty Municipal insured, 5.00% 2030 | 545 | 616 | ||||||
| Tuolumne Wind Project Auth., Rev. Bonds (Tuolumne Co. Project), Series 2009-A, 5.00% 2022 (preref. 2019) | 1,500 | 1,508 | ||||||
| Tuolumne Wind Project Auth., Rev. Bonds (Tuolumne Co. Project), Series 2009-A, 5.25% 2024 (preref. 2019) | 100 | 101 | ||||||
| City of Tustin, Community Facs. Dist. No. 06-1, Special Tax Rev. Ref. Bonds (Tustin Legacy/Columbus Villages), Series 2015-A, 5.00% 2024 | 860 | 980 | ||||||
| Tustin Unified School Dist., Community Facs. Dist. No. 88-1, Special Tax Rev. Ref. Bonds, Series 2015, BAM insured, 5.00% 2022 | 830 | 912 | ||||||
| Twin Rivers Unified School Dist., G.O. Rev. Ref. Bonds, Series 2016-B, Assured Guaranty Municipal insured, 5.00% 2024 | 400 | 456 | ||||||
| Ukiah Unified School Dist., G.O. Bonds, Capital Appreciation Bonds, 2005 Election, Series 2006, National insured, 0% 2022 | 175 | 160 | ||||||
| City of Union City, Successor Agcy. to the Redev. Agcy., Tax Allocation Rev. Ref. Redev. Bonds, Series 2015-A, 5.00% 2023 | 375 | 424 | ||||||
| Regents of the University of California, General Rev. Bonds, Series 2016-AT, 1.40% 2046 (put 2021) | 2,505 | 2,439 | ||||||
| Regents of the University of California, Limited Project Rev. Bonds, Series 2010-E, 5.00% 2020 | 500 | 524 | ||||||
| Val Verde Unified School Dist., G.O. Rev. Ref. Bonds, Series 2016-A, Assured Guaranty Municipal insured, 4.00% 2021 | 250 | 262 | ||||||
| Val Verde Unified School Dist., G.O. Rev. Ref. Bonds, Series 2016-A, Assured Guaranty Municipal insured, 4.00% 2023 | 600 | 644 | ||||||
| Dept. of Veterans Affairs, Home Purchase Rev. Bonds, Series 2016-B, 3.50% 2045 | 1,900 | 1,942 | ||||||
| Dept. of Veterans Affairs, Home Purchase Rev. Ref. Bonds, Series 2012-A, 2.75% 2020 | 750 | 759 | ||||||
| Dept. of Veterans Affairs, Veterans G.O. Bonds, Series 2018-CR, 4.00% 2048 | 6,000 | 6,337 | ||||||
| Dept. of Veterans Affairs, Veterans G.O. Rev. Ref. Bonds, Series 2015-CM, 1.35% 2019 | 1,125 | 1,117 | ||||||
| Dept. of Veterans Affairs, Veterans G.O. Rev. Ref. Bonds, Series 2016-CN, 3.50% 2045 | 1,110 | 1,132 | ||||||
| Victor Valley Union High School Dist., G.O. Rev. Ref. Bonds, Series 2016-B, Assured Guaranty Municipal insured, 4.00% 2024 | 575 | 624 | ||||||
| Victor Valley Union High School Dist., G.O. Rev. Ref. Bonds, Series 2016-B, Assured Guaranty Municipal insured, 4.00% 2026 | 270 | 297 | ||||||
| 50 | Private Client Services Funds |
Capital Group California Core Municipal Fund
| Bonds, notes & other debt instruments | Principal amount (000) | Value (000) | ||||||
| City of Vista, Successor Agcy. to the Redev. Agcy., Tax Allocation Rev. Ref. Redev. Bonds, Series 2015-B-1, Assured Guaranty Municipal insured, 4.00% 2025 | $ | 400 | $ | 435 | ||||
| City of Vista, Successor Agcy. to the Redev. Agcy., Tax Allocation Rev. Ref. Redev. Bonds, Series 2015-B-1, Assured Guaranty Municipal insured, 5.00% 2022 | 340 | 374 | ||||||
| Washington Township Health Care Dist., Rev. Bonds, Series 2017-A, 4.00% 2021 | 490 | 507 | ||||||
| Dept. of Water Resources, Power Supply Rev. Ref. Bonds, Series 2010-L, 5.00% 2021 | 75 | 78 | ||||||
| Dept. of Water Resources, Power Supply Rev. Ref. Bonds, Series 2010-L, 5.00% 2021 (preref. 2020) | 125 | 131 | ||||||
| West Contra Costa Unified School Dist., G.O. Rev. Ref. Bonds, 2005 Election, Series 2008-B, 6.00% 2027 | 3,000 | 3,812 | ||||||
| Western Placer Unified School Dist., G.O. Bonds, 2014 Election, Series 2017-B, BAM insured, 5.00% 2021 | 490 | 530 | ||||||
| 355,025 | ||||||||
| Guam 1.21% | ||||||||
| A.B. Won Pat International Airport Auth., General Rev. Bonds, Series 2013-A, 5.00% 2021 | 350 | 367 | ||||||
| A.B. Won Pat International Airport Auth., General Rev. Bonds, Series 2013-A, 5.00% 2022 | 710 | 753 | ||||||
| A.B. Won Pat International Airport Auth., General Rev. Bonds, Series 2013-B, 5.00% 2023 | 1,100 | 1,155 | ||||||
| Business Privilege Tax Bonds, Series 2011-A, 5.00% 2026 | 1,430 | 1,498 | ||||||
| Business Privilege Tax Rev. Ref. Bonds, Series 2015-D, 5.00% 2025 | 1,525 | 1,686 | ||||||
| 5,459 | ||||||||
| Iowa 0.02% | ||||||||
| IJOBS Program Special Obligation Bonds, Series 2009-A, 5.00% 2027 (preref. 2019) | 100 | 102 | ||||||
| Michigan 0.02% | ||||||||
| Hospital Fin. Auth., Hospital Rev. and Rev. Ref. Bonds (Henry Ford Health System), Series 2009, 5.25% 2024 (preref. 2019) | 100 | 103 | ||||||
| Missouri 0.05% | ||||||||
| Housing Dev. Commission, Single Family Mortgage Rev. Bonds (Special Homeownership Loan Program), Series 2015-A, 3.75% 2038 | 215 | 221 | ||||||
| Nevada 0.89% | ||||||||
| Clark County School Dist., Limited Tax G.O. Building Bonds, Series 2018-A, 5.00% 2029 | 3,540 | 4,011 | ||||||
| Puerto Rico 1.00% | ||||||||
| Industrial, Tourist, Educational, Medical and Environmental Control Facs. Fncg. Auth., Higher Education Rev. and Rev. Ref. Bonds (Inter American University of Puerto Rico Project), Series 2012, 5.00% 2019 | 500 | 506 | ||||||
| Industrial, Tourist, Educational, Medical and Environmental Control Facs. Fncg. Auth., Higher Education Rev. and Rev. Ref. Bonds (Inter American University of Puerto Rico Project), Series 2012, 5.00% 2021 | 1,000 | 1,030 | ||||||
| Infrastructure Fncg. Auth., Special Tax Rev. Ref. Bonds, Series 2005-C, 5.50% 2020 | 2,860 | 2,999 | ||||||
| 4,535 | ||||||||
| Total bonds, notes & other debt instruments (cost: $372,014,000) | 369,456 | |||||||
| Short-term securities 17.71% | ||||||||
| State of California, IAM Commercial Paper, Series 2018-A-1, 1.68% 11/26/2018 | 2,000 | 2,000 | ||||||
| State of California, Fin. Auth., Recovery Zone Fac. Bonds (Chevron U.S.A. Inc. Project), Series 2010-A, 1.43% 20351 | 7,500 | 7,500 | ||||||
| State of California, County of Los Angeles, Capital Asset Leasing Corp., IAM Commercial Paper, Series 2018-B, 1.74% 1/8/2019 | 4,900 | 4,900 | ||||||
| State of California, County of Los Angeles, Tax and Rev. Anticipation Notes, Series 2018, 4.00% 6/28/2019 | 3,000 | 3,042 | ||||||
| Private Client Services Funds | 51 |
Capital Group California Core Municipal Fund
| Short-term securities (continued) | Principal amount (000) | Value (000) | ||||||
| State of California, Metropolitan Water Dist. of Southern California, Water Rev. Ref. Bonds, Series 2016-B-1, 1.34% 20371 | $ | 1,500 | $ | 1,500 | ||||
| State of California, Metropolitan Water Dist. of Southern California, Water Rev. Ref. Bonds, Series 2016-B-2, 1.36% 20371 | 1,000 | 1,000 | ||||||
| State of California, Municipal Fin. Auth., Pollution Control Rev. Ref. Bonds (Chevron U.S.A. Inc. Project), Series 2005, 1.43% 20251 | 3,000 | 3,000 | ||||||
| State of California, Pollution Control Fncg. Auth., Environmental Impact Rev. Bonds (Air Products and Chemicals, Inc. Project), Series 1997-B, 1.49% 20421 | 10,000 | 10,000 | ||||||
| State of California, Pollution Control Fncg. Auth., Solid Waste Disposal Rev. Ref. Bonds (Republic Services, Inc. Project), Series 2010-B, 2.00% 2024 (put 2019)2,4 | 5,155 | 5,155 | ||||||
| State of California, County of Riverside, Tax and Rev. Anticipation Notes, Series 2018, 4.00% 6/28/2019 | 3,000 | 3,044 | ||||||
| State of California, San Diego Public Water Facs. Fin. Auth., IAM Commercial Paper, Series 2018-B, 1.65% 11/1/2018 | 1,300 | 1,300 | ||||||
| State of California, Statewide Communities Dev. Auth., IAM Commercial Paper, Series 2008-B, 1.75% 1/4/2019 | 6,000 | 6,000 | ||||||
| State of California, Statewide Communities Dev. Auth., Pollution Control Rev. Ref. Bonds (Chevron U.S.A. Inc. Project), Series 2002, 1.43% 20241 | 4,000 | 4,000 | ||||||
| State of California, Regents of the University of California, General Rev. Bonds, Series 2013-AL-1, 1.35% 20481 | 4,550 | 4,550 | ||||||
| State of California, Regents of the University of California, IAM Commercial Paper, Series 2018-A, 1.69% 11/6/2018 | 2,000 | 2,000 | ||||||
| State of California, County of Ventura, Tax and Rev. Anticipation Notes, Series 2018, 2.50% 7/1/2019 | 5,000 | 5,024 | ||||||
| State of California, Dept. of Water Resources, IAM Commercial Paper, Series 2018, 1.68% 11/5/2018 | 3,890 | 3,890 | ||||||
| State of California, Dept. of Water Resources, IAM Commercial Paper, Series 2018, 1.70% 11/2/2018 | 12,104 | 12,104 | ||||||
| Total short-term securities (cost: $80,028,000) | 80,009 | |||||||
| Total investment securities 99.47% (cost: $452,042,000) | 449,465 | |||||||
| Other assets less liabilities 0.53% | 2,400 | |||||||
| Net assets 100.00% | $ | 451,865 | ||||||
Futures contracts
| Number of | Notional amount | 5 | Value at 10/31/2018 | 6 | Unrealized appreciation at 10/31/2018 | |||||||
| Contracts | Type | contracts | Expiration | (000) | (000) | (000) | ||||||
| 5 Year U.S. Treasury Note Futures | Long | 100 | January 2019 | $10,000 | $11,238 | $14 |
| 1 | Coupon rate may change periodically. For short-term securities, the date of the next scheduled coupon rate change is considered to be the maturity date. |
| 2 | Acquired in a transaction exempt from registration under Rule 144A of the Securities Act of 1933. May be resold in the U.S. in transactions exempt from registration, normally to qualified institutional buyers. The total value of all such securities was $7,084,000, which represented 1.57% of the net assets of the fund. |
| 3 | Step bond; coupon rate may change at a later date. |
| 4 | For short-term securities, the mandatory put date is considered to be the maturity date. |
| 5 | Notional amount is calculated based on the number of contracts and notional contract size. |
| 6 | Value is calculated based on the notional amount and current market price. |
| 52 | Private Client Services Funds |
Capital Group California Core Municipal Fund
Key to abbreviations and symbol
Agcy. = Agency
AMT = Alternative Minimum Tax
Auth. = Authority
Certs. of Part. = Certificates of Participation
Dept. = Department
Dev. = Development
Dist. = District
Econ. = Economic
Fac. = Facility
Facs. = Facilities
Fin. = Finance
Fncg. = Financing
G.O. = General Obligation
LIBOR = London Interbank Offered Rate
LOC = Letter of Credit
Preref. = Prerefunded
Redev. = Redevelopment
Ref. = Refunding
Rev. = Revenue
SIFMA = Securities Industry and Financial Markets Association
TECP = Tax-Exempt Commercial Paper
| Private Client Services Funds | 53 |
Capital Group California Short-Term Municipal Fund
Investment portfolio October 31, 2018
| Bonds, notes & other debt instruments 86.45% | Principal amount (000) | Value (000) | ||||||
| California 85.95% | ||||||||
| City of Alhambra, Insured Rev. Ref. Bonds (Atherton Baptist Homes Project), Series 2016, 5.00% 2023 | $ | 450 | $ | 489 | ||||
| Alvord Unified School Dist., G.O. Rev. Ref. Bonds, Series 2018, Assured Guaranty Municipal insured, 5.00% 2022 | 500 | 551 | ||||||
| Assn. of Bay Area Governments, Fin. Auth. for Nonprofit Corps., Rev. Ref. Bonds (Windemere Ranch Infrastructure Fncg. Program), Series 2014-A, 4.00% 2019 | 515 | 524 | ||||||
| Bay Area Toll Auth., San Francisco Bay Area Toll Bridge Rev. Bonds, Series 2001-A, (SIFMA Municipal Swap Index + 1.25%) 2.85% 2036 (put 2027)1 | 1,000 | 1,039 | ||||||
| Bay Area Toll Auth., San Francisco Bay Area Toll Bridge Rev. Bonds, Series 2006-C-1, (SIFMA Municipal Swap Index + 0.90%) 2.50% 2045 (put 2023)1 | 575 | 588 | ||||||
| Bay Area Toll Auth., San Francisco Bay Area Toll Bridge Rev. Bonds, Series 2007-C-1, (SIFMA Municipal Swap Index + 0.90%) 2.50% 2047 (put 2023)1 | 250 | 256 | ||||||
| Bay Area Toll Auth., San Francisco Bay Area Toll Bridge Rev. Bonds, Series 2007-E-3, (SIFMA Municipal Swap Index + 0.70%) 2.30% 2047 (put 2019)1 | 1,230 | 1,233 | ||||||
| Bay Area Toll Auth., San Francisco Bay Area Toll Bridge Rev. Bonds, Series 2014-G, (SIFMA Municipal Swap Index + 0.60%) 2.20% 2034 (put 2020)1 | 250 | 251 | ||||||
| Bay Area Toll Auth., San Francisco Bay Area Toll Bridge Rev. Bonds, Series 2014-H, (SIFMA Municipal Swap Index + 0.70%) 2.30% 2034 (put 2021)1 | 250 | 253 | ||||||
| Bay Area Toll Auth., San Francisco Bay Area Toll Bridge Rev. Ref. Bonds, Series 2014-C, 1.875% 2047 (put 2019) | 500 | 500 | ||||||
| City of Beaumont, Wastewater Rev. Bonds, Series 2018-A, Assured Guaranty Municipal insured, 5.00% 2022 | 225 | 249 | ||||||
| City of Brea, Successor Agcy. to the Redev. Agcy. (Redev. Project AB), Tax Allocation Rev. Ref. Bonds, Series 2013, 5.00% 2019 | 700 | 717 | ||||||
| City of Burbank, Successor Agcy. to the Redev. Agcy., Tax Allocation Rev. Ref. Redev. Bonds, Series 2015, BAM insured, 4.00% 2018 | 500 | 501 | ||||||
| City of Burbank, Successor Agcy. to the Redev. Agcy., Tax Allocation Rev. Ref. Redev. Bonds, Series 2015, BAM insured, 5.00% 2022 | 500 | 556 | ||||||
| Trustees of the California State University, Systemwide Rev. Bonds, Series 2016-B-3, 4.00% 2051 (put 2023) | 1,550 | 1,658 | ||||||
| Trustees of the California State University, Systemwide Rev. Ref. Bonds, Series 2013-A, 5.00% 2018 | 275 | 275 | ||||||
| City of Chino, Public Fncg. Auth., Local Agcy. Rev. Ref. Bonds, Series 2015-A, Assured Guaranty Municipal insured, 4.00% 2021 | 655 | 684 | ||||||
| Compton Unified School Dist., G.O. Rev. Ref. Bonds, 2002 Election, Series 2006-D, AMBAC insured, 0% 2021 | 1,000 | 943 | ||||||
| Contra Costa Transportation Auth., Sales Tax Rev. Ref. Bonds, Series 2018-A, (1-month USD-LIBOR x 0.70 + 0.25%) 1.829% 2034 (put 2021)1 | 2,000 | 1,998 | ||||||
| Eastern Municipal Water Dist., Rev. Ref. Water and Wastewater Rev. Bonds, Series 2018-B, (1-month USD-LIBOR x 0.70 + 0.30%) 1.879% 2030 (put 2021)1 | 1,500 | 1,498 | ||||||
| City of Emeryville, Successor Agcy. to the Redev. Agcy., Tax Allocation Rev. Ref. Bonds, Series 2014-A, Assured Guaranty Municipal insured, 5.00% 2019 | 950 | 974 | ||||||
| City of Fillmore, Successor Agcy. to the Redev. Agcy., Tax Allocation Rev. Ref. Bonds, Series 2015, BAM insured, 4.00% 2019 | 400 | 405 | ||||||
| Fresno Joint Powers Fin. Auth., Rev. Ref. Bonds (Master Lease Projects), Series 2017-A, 5.00% 2020 | 1,000 | 1,038 | ||||||
| Fresno Joint Powers Fin. Auth., Rev. Ref. Bonds (Master Lease Projects), Series 2017-A, Assured Guaranty Municipal insured, 5.00% 2022 | 1,350 | 1,469 | ||||||
| Various Purpose G.O. Bonds, Series 2013, (SIFMA Municipal Swap Index + 0.38%) 1.98% 2027 (put 2027)1 | 1,600 | 1,604 | ||||||
| Various Purpose G.O. Bonds, Series 2013-E, (1-month USD-LIBOR + 0.83%) 2.412% 20291 | 500 | 500 | ||||||
| Various Purpose G.O. Bonds, Series 2017, 4.00% 2021 | 490 | 518 | ||||||
| Various Purpose G.O. Rev. Ref. Bonds, Series 2015, 5.00% 2021 | 500 | 540 | ||||||
| Various Purpose G.O. Rev. Ref. Bonds, Series 2015, 5.00% 2022 | 805 | 887 | ||||||
| Various Purpose G.O. Rev. Ref. Bonds, Series 2017, 5.00% 2029 | 1,000 | 1,164 | ||||||
| City of Glendale, Successor Agcy. to the Redev. Agcy., Tax Allocation Rev. Ref. Bonds (Central Glendale Redev. Project), Series 2013, Assured Guaranty Municipal insured, 4.00% 2019 | 600 | 614 | ||||||
| Golden Empire Schools Fncg. Auth., Lease Rev. Ref. Bonds (Kern High School Dist. Projects), Series 2018, 3.00% 2019 | 1,000 | 1,006 | ||||||
| 54 | Private Client Services Funds |
Capital Group California Short-Term Municipal Fund
| Bonds, notes & other debt instruments | Principal amount (000) | Value (000) | ||||||
| Golden State Tobacco Securitization Corp., Enhanced Tobacco Settlement Asset-Backed Bonds, Series 2005-A, 5.00% 2019 | $ | 1,000 | $ | 1,018 | ||||
| Golden State Tobacco Securitization Corp., Enhanced Tobacco Settlement Asset-Backed Bonds, Series 2013-A, 5.00% 2019 | 500 | 509 | ||||||
| Golden State Tobacco Securitization Corp., Enhanced Tobacco Settlement Asset-Backed Bonds, Series 2015-A, 5.00% 2020 | 1,735 | 1,816 | ||||||
| Golden State Tobacco Securitization Corp., Enhanced Tobacco Settlement Asset-Backed Bonds, Series 2015-A, 5.00% 2021 | 500 | 537 | ||||||
| Golden State Tobacco Securitization Corp., Enhanced Tobacco Settlement Asset-Backed Bonds, Series 2017A-1, 5.00% 2022 | 1,500 | 1,630 | ||||||
| Golden State Tobacco Securitization Corp., Enhanced Tobacco Settlement Asset-Backed Bonds, Series 2017-A-1, 5.00% 2020 | 1,360 | 1,420 | ||||||
| Golden State Tobacco Securitization Corp., Enhanced Tobacco Settlement Asset-Backed Bonds, Series 2018-A, 5.00% 2022 | 1,000 | 1,096 | ||||||
| Hacienda La Puente Unified School Dist., Facs. Fncg. Auth., G.O. Rev. Bonds, Series 2007, Assured Guaranty Municipal insured, 5.00% 2021 | 590 | 638 | ||||||
| City of Hawthorne, Successor Agcy. to the Redev. Agcy., Tax Allocation Rev. Ref. Bonds, Series 2016, Assured Guaranty Municipal insured, 5.00% 2021 | 300 | 325 | ||||||
| Health Facs. Fncg. Auth., Insured Rev. Ref. Bonds (Marshall Medical Center), Series 2015, 5.00% 2019 | 200 | 206 | ||||||
| Health Facs. Fncg. Auth., Insured Rev. Ref. Bonds (Marshall Medical Center), Series 2015, 5.00% 2020 | 150 | 158 | ||||||
| Health Facs. Fncg. Auth., Rev. Bonds (Adventist Health System/West), Series 2013-A, 4.00% 2019 | 500 | 504 | ||||||
| Health Facs. Fncg. Auth., Rev. Bonds (Catholic Healthcare West), Series 2009-A, 6.00% 2029 (preref. 2019) | 1,000 | 1,028 | ||||||
| Health Facs. Fncg. Auth., Rev. Bonds (City of Hope), Series 2012-A, 5.00% 2019 | 300 | 309 | ||||||
| Health Facs. Fncg. Auth., Rev. Bonds (Providence St. Joseph Health), Series 2014-A, 5.00% 2019 | 525 | 540 | ||||||
| Health Facs. Fncg. Auth., Rev. Bonds (Providence St. Joseph Health), Series 2016-A, 5.00% 2022 | 300 | 333 | ||||||
| Health Facs. Fncg. Auth., Rev. Bonds (Providence St. Joseph Health), Series 2016-B-1, 1.25% 2036 (put 2020) | 1,210 | 1,191 | ||||||
| Health Facs. Fncg. Auth., Rev. Bonds (Sutter Health), Series 2016-A, 5.00% 2022 | 200 | 222 | ||||||
| Health Facs. Fncg. Auth., Rev. Bonds (Sutter Health), Series 2016-C, 1.00% 2053 (put 2019) | 110 | 109 | ||||||
| Health Facs. Fncg. Auth., Rev. Bonds (Sutter Health), Series 2018-A, 5.00% 2023 | 1,000 | 1,134 | ||||||
| Health Facs. Fncg. Auth., Rev. Ref. Bonds (Adventist Health System/West), Series 2016-A, 4.00% 2022 | 330 | 347 | ||||||
| Health Facs. Fncg. Auth., Rev. Ref. Bonds (Catholic Healthcare West), Series 2011-A, 5.00% 2020 | 695 | 721 | ||||||
| Health Facs. Fncg. Auth., Rev. Ref. Bonds (Paradise Valley Estates Project), Series 2013, 5.00% 2019 | 500 | 503 | ||||||
| Health Facs. Fncg. Auth., Rev. Ref. Bonds (St. Joseph Health System), Series 2009-D, 1.70% 2033 (put 2022) | 650 | 638 | ||||||
| Health Facs. Fncg. Auth., Rev. Ref. Bonds (St. Joseph Health System), Series 2013-D, 5.00% 2043 (put 2020) | 600 | 633 | ||||||
| Health Facs. Fncg. Auth., Rev. Ref. Bonds (Stanford Health Care), Series 2017-A, 5.00% 2021 | 500 | 545 | ||||||
| Health Facs. Fncg. Auth., Rev. Ref. Bonds (Stanford Health Care), Series 2017-A, 5.00% 2022 | 500 | 557 | ||||||
| Imperial Irrigation Dist., Electric System Rev. Ref. Bonds, Series 2011-C, 5.00% 2018 (escrowed to maturity) | 425 | 425 | ||||||
| Infrastructure and Econ. Dev. Bank, Rev. Bonds (Academy of Sciences), Series 2018-B, 1.976% 20471 | 1,000 | 1,000 | ||||||
| Infrastructure and Econ. Dev. Bank, Rev. Bonds (Stanford Consortium Project), Series 2016-A, 5.00% 2021 | 235 | 253 | ||||||
| Infrastructure and Econ. Dev. Bank, Rev. Bonds (Stanford Consortium Project), Series 2016-A, 5.00% 2022 | 265 | 292 | ||||||
| Infrastructure and Econ. Dev. Bank, Rev. Ref. Bonds (J. Paul Getty Trust), Series 2011-A-4, (3-month USD-LIBOR x 0.70 + 0.37%) 2.047% 2038 (put 2020)1 | 1,500 | 1,504 | ||||||
| Private Client Services Funds | 55 |
Capital Group California Short-Term Municipal Fund
| Bonds, notes & other debt instruments (continued) | Principal amount (000) | Value (000) | ||||||
| California (continued) | ||||||||
| City of Irvine, Reassessment Dist. No. 15-1, Limited Obligation Improvement Bonds, Series 2015, 4.00% 2019 | $ | 300 | $ | 305 | ||||
| City of Irvine, Reassessment Dist. No. 15-1, Limited Obligation Improvement Bonds, Series 2015, 5.00% 2021 | 500 | 540 | ||||||
| County of Kern, Water Agcy., Improvement Dist. No. 4, Water Rev. Ref. Bonds, Series 2016-A, Assured Guaranty Municipal insured, 4.00% 2020 | 700 | 723 | ||||||
| Kern High School Dist., G.O. Bonds, 2016 Election, Series 2017-A, 4.00% 2021 | 1,500 | 1,584 | ||||||
| Kings Canyon Joint Unified School Dist., G.O. Rev. Ref. Bonds, Series 2016, Assured Guaranty Municipal insured, 5.00% 2022 | 470 | 517 | ||||||
| Lammersville Joint Unified School Dist., Special Tax Bonds, Community Facs. Dist. No. 2002, Series 2017, 4.00% 2021 | 525 | 544 | ||||||
| City of Long Beach, Harbor Rev. Bonds, Series 2014-C, 3.00% 2018 (escrowed to maturity) | 1,425 | 1,426 | ||||||
| Long Beach Community College Dist., G.O. Bonds, 2016 Election, Series 2016-B, 4.00% 2019 | 300 | 305 | ||||||
| City of Los Angeles, Dept. of Airports, Los Angeles International Airport, Rev. Bonds, Series 2009-A, 5.00% 2021 | 400 | 406 | ||||||
| City of Los Angeles, Dept. of Airports, Los Angeles International Airport, Rev. Bonds, Series 2015-C, 5.00% 2021 | 400 | 431 | ||||||
| City of Los Angeles, Dept. of Water and Power, Power System Rev. Bonds, Series 2018-B, 5.00% 2022 | 1,000 | 1,095 | ||||||
| City of Los Angeles, Multi Family Housing Rev. Bonds (Jordan Downs Phase 1B Apartments), Series 2018-A-2, 2.08% 2022 (put 2021) | 1,000 | 994 | ||||||
| County of Los Angeles, Redev. Ref. Auth., Tax Allocation Rev. Ref. Bonds (Bunker Hill Project), Series 2014-C, Assured Guaranty Municipal insured, 5.00% 2018 | 1,100 | 1,103 | ||||||
| County of Los Angeles, Redev. Ref. Auth., Tax Allocation Rev. Ref. Bonds (Bunker Hill Project), Series 2014-C, Assured Guaranty Municipal insured, 5.00% 2019 | 700 | 722 | ||||||
| M-S-R Public Power Agcy., Rev. Bonds (San Juan Project), Series 2018-R, 4.00% 2020 | 1,000 | 1,034 | ||||||
| Mammoth Unified School Dist., G.O. Bonds, Capital Appreciation Bonds, 1998 Election, Series 2000, AMBAC insured, 0% 2023 | 1,000 | 887 | ||||||
| Menifee Union School Dist., Public Fncg. Auth., Special Tax Rev. Bonds, Series 2016-A, BAM insured, 4.00% 2022 | 250 | 262 | ||||||
| City of Merced, Irrigation Dist., Electric System Rev. Ref. Bonds, Series 2015-A, Assured Guaranty Municipal insured, 4.00% 2019 | 600 | 612 | ||||||
| City of Modesto, Irrigation Dist., Electric System Rev. Ref. Bonds, Series 2016, 5.00% 2022 | 250 | 277 | ||||||
| Montebello Unified School Dist., Rev. Bonds, Series 2016-A, 4.00% 2019 | 250 | 254 | ||||||
| Murrieta Valley Unified School Dist., G.O. Bonds, Series 1998-A, FGIC-National insured, 0% 2020 | 1,080 | 1,037 | ||||||
| Oakland Unified School Dist., G.O. Rev. Ref. Bonds, Series 2015, Assured Guaranty Municipal insured, 5.00% 2021 | 385 | 415 | ||||||
| Oakland Unified School Dist., G.O. Rev. Ref. Bonds, Series 2017, 5.00% 2022 | 1,500 | 1,651 | ||||||
| Oakland Unified School Dist., G.O. Rev. Ref. Bonds, Series 2017-A, 5.00% 2023 | 500 | 561 | ||||||
| City of Orange, Successor Agcy. to the Redev. Agcy., Rev. Ref. Bonds (Orange Merged and Amended Redev. Project Area), Series 2014-A, Assured Guaranty Municipal insured, 5.00% 2019 | 200 | 205 | ||||||
| City of Oxnard, Fncg. Auth., Wastewater Rev. Ref. Bonds, Series 2014, Assured Guaranty Municipal insured, 5.00% 2021 | 350 | 378 | ||||||
| Palomar Health, G.O. Rev. Ref. Bonds, Series 2016-A, 4.00% 2020 | 1,235 | 1,279 | ||||||
| Public Works Board, Lease Rev. Bonds (Dept. of Corrections and Rehabilitation), Series 2011-C, 5.00% 2021 | 720 | 779 | ||||||
| Public Works Board, Lease Rev. Bonds (Judicial Council of California, Various Judicial Council Projects), Series 2013-A, 4.00% 2019 | 500 | 504 | ||||||
| Public Works Board, Lease Rev. Bonds (Various Capital Projects), Series 2014-E, 5.00% 2022 | 500 | 551 | ||||||
| Public Works Board, Lease Rev. Ref. Bonds (Dept. of Corrections, Various State Prisons), Series 2015-A, 5.00% 2023 | 1,860 | 2,080 | ||||||
| Public Works Board, Lease Rev. Ref. Bonds (Dept. of Corrections, Various State Prisons), Series 2018-C, 5.00% 2025 | 500 | 578 | ||||||
| Public Works Board, Lease Rev. Ref. Bonds (Various Capital Projects), Series 2014-H, 5.00% 2020 | 1,000 | 1,060 | ||||||
| 56 | Private Client Services Funds |
Capital Group California Short-Term Municipal Fund
| Bonds, notes & other debt instruments | Principal amount (000) | Value (000) | ||||||
| Public Works Board, Lease Rev. Ref. Bonds (Various Capital Projects), Series 2016-C, 5.00% 2021 | $ | 1,000 | $ | 1,083 | ||||
| City of Rancho Cucamonga, Successor Agcy. to the Redev. Agcy., Tax Allocation Rev. Ref. Bonds (Rancho Redev. Project Area), Series 2014, Assured Guaranty Municipal insured, 5.00% 2019 | 630 | 646 | ||||||
| City of Rancho Mirage, Successor Agcy. to the Redev. Agcy., Tax Allocation Housing Ref. Bonds, Series 2013-A, 5.00% 2021 | 1,000 | 1,071 | ||||||
| City of Rancho Santa Fe, Community Services Dist., Rev. Bonds, Series 2016-A, BAM insured, 3.00% 2019 | 505 | 509 | ||||||
| City of Redding, Electric System Rev. Ref. Bonds, Series 2017, 5.00% 2021 | 800 | 862 | ||||||
| City of Riverside, Successor Agcy. to the Redev. Agcy., Tax Allocation Rev. Ref. Bonds, Series 2014-A, 5.00% 2019 | 850 | 873 | ||||||
| County of Riverside, Public Fncg. Auth., Tax Allocation Rev. Bonds (Project Area No. 1, Desert Communities and Interstate 215 Corridor Projects), Series 2014-D, Assured Guaranty Municipal insured, 5.00% 2019 | 275 | 283 | ||||||
| County of Riverside, Public Fncg. Auth., Tax Allocation Rev. Bonds (Project Area No. 1, Desert Communities and Interstate 215 Corridor Projects), Series 2015-A, 5.00% 2019 | 110 | 113 | ||||||
| County of Riverside, Public Fncg. Auth., Tax Allocation Rev. Ref. Bonds (Interstate 215 Corridor Project), Series 2014-E, Assured Guaranty Municipal insured, 5.00% 2019 | 100 | 103 | ||||||
| Riverside Unified School Dist., Fncg. Auth., Special Tax Rev. Ref. Bonds, Series 2015, BAM insured, 5.00% 2021 | 285 | 307 | ||||||
| City of Roseville, Fin. Auth., Special Tax Rev. Ref. Bonds, Series 2016, 4.00% 2021 | 450 | 471 | ||||||
| City of Roseville, Fin. Auth., Special Tax Rev. Ref. Bonds, Series 2016, 4.00% 2022 | 620 | 658 | ||||||
| City of Sacramento, Municipal Utility Dist., Electric Rev. Bonds, Series 1997-K, AMBAC insured, 5.25% 2024 | 150 | 168 | ||||||
| County of Sacramento, Airport System Rev. Ref. Bonds, Series 2018-B, 5.00% 2021 | 1,000 | 1,078 | ||||||
| City of San Diego, Successor Agcy. to the Redev. Agcy., Tax Allocation Rev. Ref. Bonds, Series 2016-A, 5.00% 2021 | 365 | 396 | ||||||
| San Diego Unified School Dist., G.O. Bonds, 2008 Election, Series 2017-K-1, 5.00% 2019 | 500 | 511 | ||||||
| City and County of San Francisco, Airport Commission, San Francisco International Airport, Second Series Rev. Ref. Bonds, Series 2009-D, 4.00% 2023 | 400 | 433 | ||||||
| City and County of San Francisco, Public Utilities Commission, Wastewater Rev. Green Bonds, Series 2018-C, 2.125% 2048 (put 2023) | 1,000 | 991 | ||||||
| City and County of San Francisco, Successor Agcy. to the Redev. Agcy., Special Tax Rev. Ref. Bonds (San Francisco Redev. Projects), Series 2014-C, 5.00% 2020 | 500 | 527 | ||||||
| City and County of San Francisco, Successor Agcy. to the Redev. Agcy., Special Tax Rev. Ref. Bonds (San Francisco Redev. Projects), Series 2014-C, 5.00% 2022 | 250 | 277 | ||||||
| San Jose Unified School Dist., G.O. Rev. Ref. Bonds, Series 2013, 4.00% 2019 | 475 | 483 | ||||||
| San Leandro Unified School Dist., G.O. Bonds, Series 2017-A, BAM insured, 5.00% 2020 | 700 | 736 | ||||||
| City of San Ramon, Successor Agcy. to the Redev. Agcy., Tax Allocation Rev. Ref. Bonds, Series 2015-A, BAM insured, 5.00% 2021 | 340 | 361 | ||||||
| City of Santa Rosa, High School Dist., G.O. Bonds, 2014 Election, Series 2018-C, Assured Guaranty Municipal insured, 4.00% 2020 | 750 | 777 | ||||||
| Southern California Public Power Auth., Rev. Ref. Bonds (Canyon Power Project), Series 2018-B, (SIFMA Municipal Swap Index + 0.25%) 1.85% 2040 (put 2021)1 | 1,750 | 1,748 | ||||||
| Southern California Public Power Auth., Rev. Bonds (Mead-Adelanto Project), Series 2012-A, 5.00% 2019 | 600 | 613 | ||||||
| Southern California Public Power Auth., Rev. Ref. Bonds (Magnolia Power Project A), Series 2017-1, 2.00% 2036 (put 2020) | 925 | 921 | ||||||
| Southwestern Community College Dist., G.O. Rev. Ref. Bonds (2019 Crossover), Series 2016-A, 3.00% 2021 | 200 | 205 | ||||||
| Southwestern Community College Dist., G.O. Rev. Ref. Bonds (2019 Crossover), Series 2016-B, 4.00% 2022 | 310 | 331 | ||||||
| Statewide Communities Dev. Auth., Insured Rev. Bonds (Redwoods, a Community of Seniors), Series 2013, 4.00% 2019 | 160 | 164 | ||||||
| Statewide Communities Dev. Auth., Insured Rev. Bonds (Viamonte Senior Living 1 Project), Series 2018-B, 3.00% 2025 | 500 | 504 | ||||||
| Statewide Communities Dev. Auth., Pollution Control Rev. Ref. Bonds (Southern California Edison Company), Series 2006-A, 1.90% 2028 | 500 | 495 | ||||||
| Statewide Communities Dev. Auth., Pollution Control Rev. Ref. Bonds (Southern California Edison Company), Series 2006-C, 2.63% 2033 (put 2023) | 1,000 | 984 | ||||||
| Private Client Services Funds | 57 |
Capital Group California Short-Term Municipal Fund
| Bonds, notes & other debt instruments (continued) | Principal amount (000) | Value (000) | ||||||
| California (continued) | ||||||||
| Statewide Communities Dev. Auth., Pollution Control Rev. Ref. Bonds (Southern California Edison Company), Series 2006-D, 2.625% 2033 (put 2023) | $ | 1,100 | $ | 1,083 | ||||
| Statewide Communities Dev. Auth., Rev. Bonds (Adventist Health System), Series 2018, 5.00% 2022 | 150 | 164 | ||||||
| Statewide Communities Dev. Auth., Rev. Bonds (Adventist Health System), Series 2018-A, 5.00% 2024 | 200 | 227 | ||||||
| Statewide Communities Dev. Auth., Rev. Bonds (Adventist Health System), Series 2018-A, 5.00% 2025 | 415 | 477 | ||||||
| Statewide Communities Dev. Auth., Rev. Bonds (Adventist Health System/West), Series 2018-A, 5.00% 2023 | 135 | 150 | ||||||
| Statewide Communities Dev. Auth., Rev. Bonds (Buck Institute for Research on Aging), Series 2014, Assured Guaranty Municipal insured, 5.00% 2019 | 380 | 393 | ||||||
| Statewide Communities Dev. Auth., Rev. Bonds (Hebrew Home for Aged Disabled), Series 2016, 3.50% 2021 | 250 | 253 | ||||||
| Statewide Communities Dev. Auth., Rev. Bonds (Huntington Memorial Hospital), Series 2018, 5.00% 2022 | 700 | 764 | ||||||
| Statewide Communities Dev. Auth., Rev. Ref. Bonds (Huntington Memorial Hospital), Series 2014-B, 5.00% 2020 | 1,225 | 1,282 | ||||||
| City of Richmond, Successor Agcy. to the Redev. Agcy., Rev. Ref. Bonds, Series 2014-A, BAM insured, 5.00% 2019 | 525 | 538 | ||||||
| City of Suisun, Successor Agcy. to the Redev. Agcy., Tax Allocation Rev. Ref. Bonds, Series 2014-B, BAM insured, 5.00% 2019 | 675 | 695 | ||||||
| City of Suisun, Successor Agcy. to the Redev. Agcy., Tax Allocation Rev. Ref. Bonds, Series 2014-B, BAM insured, 5.00% 2021 | 500 | 540 | ||||||
| Sweetwater Union High School Dist., G.O. Rev. Ref. Bonds, Series 2014, BAM insured, 5.00% 2021 | 380 | 410 | ||||||
| Temecula Valley Unified School Dist., Fncg. Auth., Special Tax Rev. Bonds, Series 2015, BAM insured, 5.00% 2021 | 515 | 555 | ||||||
| City of Tracy, Successor Agcy. to the Community Dev. Agcy., Tax Allocation Rev. Ref. Bonds, Series 2016, Assured Guaranty Municipal insured, 5.00% 2022 | 450 | 494 | ||||||
| City of Union City, Successor Agcy. to the Redev. Agcy., Tax Allocation Rev. Ref. Redev. Bonds, Series 2015-A, 5.00% 2021 | 235 | 255 | ||||||
| Regents of the University of California, G.O. Rev. Bonds, Series 2018-AZ, 5.00% 2020 | 200 | 210 | ||||||
| Regents of the University of California, General Rev. Bonds, Series 2016-AT, 1.40% 2046 (put 2021) | 2,925 | 2,850 | ||||||
| Regents of the University of California, General Rev. Bonds, Series 2018-AZ, 5.00% 2021 | 300 | 324 | ||||||
| Dept. of Veterans Affairs, Home Purchase Rev. Bonds, Series 2016-B, 3.50% 2045 | 825 | 843 | ||||||
| Dept. of Veterans Affairs, Veterans G.O. Bonds, Series 2017-CQ, 4.00% 2047 | 1,000 | 1,050 | ||||||
| Dept. of Veterans Affairs, Veterans G.O. Bonds, Series 2018-CR, 4.00% 2048 | 1,500 | 1,584 | ||||||
| Dept. of Veterans Affairs, Veterans G.O. Rev. Ref. Bonds, Series 2015-CM, 1.35% 2019 | 775 | 769 | ||||||
| Dept. of Veterans Affairs, Veterans G.O. Rev. Ref. Bonds, Series 2016-CN, 3.50% 2045 | 785 | 800 | ||||||
| Victor Valley Union High School Dist., G.O. Rev. Ref. Bonds, Series 2016-B, Assured Guaranty Municipal insured, 3.00% 2021 | 200 | 205 | ||||||
| City of Vista, Successor Agcy. to the Redev. Agcy., Tax Allocation Rev. Ref. Redev. Bonds, Series 2015-B-1, Assured Guaranty Municipal insured, 5.00% 2021 | 265 | 285 | ||||||
| City of West Sacramento, Successor Agcy. to the Redev. Agcy., Tax Allocation Rev. Ref. Bonds (West Sacramento Redev. Project), Series 2016, 4.00% 2019 | 755 | 768 | ||||||
| City of Westminster, Successor Agcy. to the Redev. Agcy., Commercial Redev. Project No. 1, Tax Allocation Rev. Ref. Bonds, Series 2016-B, BAM insured, 4.00% 2020 | 180 | 187 | ||||||
| City of Westminster, Successor Agcy. to the Redev. Agcy., Commercial Redev. Project No. 1, Tax Allocation Rev. Ref. Bonds, Series 2016-B, BAM insured, 4.00% 2022 | 120 | 127 | ||||||
| 110,686 | ||||||||
| 58 | Private Client Services Funds |
Capital Group California Short-Term Municipal Fund
| Bonds, notes & other debt instruments | Principal amount (000) | Value (000) | ||||||
| Guam 0.50% | ||||||||
| Waterworks Auth., Water and Wastewater System Rev. Bonds, Series 2016, 5.00% 2021 | $ | 300 | $ | 316 | ||||
| Waterworks Auth., Water and Wastewater System Rev. Bonds, Series 2016, 5.00% 2024 | 300 | 326 | ||||||
| 642 | ||||||||
| Total bonds, notes & other debt instruments (cost: $112,272,000) | 111,328 | |||||||
| Short-term securities 12.76% | ||||||||
| State of California, Fin. Auth., Recovery Zone Fac. Bonds (Chevron U.S.A. Inc. Project), Series 2010-A, 1.43% 20351 | 4,500 | 4,500 | ||||||
| State of California, Metropolitan Water Dist. of Southern California, Water Rev. Bonds, Series 2017-A, 1.32% 20471 | 1,000 | 1,000 | ||||||
| State of California, Metropolitan Water Dist. of Southern California, Water Rev. Ref. Bonds, Series 2016-B-2, 1.36% 20371 | 610 | 610 | ||||||
| State of California, Municipal Fin. Auth., Pollution Control Rev. Ref. Bonds (Chevron U.S.A. Inc. Project), Series 2005, 1.43% 20251 | 1,100 | 1,100 | ||||||
| State of California, County of Riverside, Tax and Rev. Anticipation Notes, Series 2018, 4.00% 6/28/2019 | 1,000 | 1,014 | ||||||
| State of California, San Diego Public Water Facs. Fin. Auth., IAM Commercial Paper, Series 2018-B, 1.65% 11/1/2018 | 200 | 200 | ||||||
| State of California, Statewide Communities Dev. Auth., IAM Commercial Paper, Series 2008-B, 1.75% 1/4/2019 | 1,000 | 1,000 | ||||||
| State of California, Statewide Communities Dev. Auth., Pollution Control Rev. Ref. Bonds (Chevron U.S.A. Inc. Project), Series 2002, 1.43% 20241 | 1,000 | 1,000 | ||||||
| State of California, Regents of the University of California, General Rev. Bonds, Series 2013-AL-1, 1.35% 20481 | 3,000 | 3,000 | ||||||
| State of California, Dept. of Water Resources, IAM Commercial Paper, Series 2018, 1.68% 11/5/2018 | 3,000 | 3,000 | ||||||
| Total short-term securities (cost: $16,426,000) | 16,424 | |||||||
| Total investment securities 99.21% (cost: $128,698,000) | 127,752 | |||||||
| Other assets less liabilities 0.79% | 1,019 | |||||||
| Net assets 100.00% | $ | 128,771 | ||||||
Futures contracts
| Number of | Notional amount | 2 | Value at 10/31/2018 | 3 | Unrealized appreciation at 10/31/2018 | |||||||
| Contracts | Type | contracts | Expiration | (000) | (000) | (000) | ||||||
| 5 Year U.S. Treasury Note Futures | Long | 25 | January 2019 | $2,500 | $2,809 | $3 |
| Private Client Services Funds | 59 |
Capital Group California Short-Term Municipal Fund
| 1 | Coupon rate may change periodically. For short-term securities, the date of the next scheduled coupon rate change is considered to be the maturity date. |
| 2 | Notional amount is calculated based on the number of contracts and notional contract size. |
| 3 | Value is calculated based on the notional amount and current market price. |
Key to abbreviations and symbol
Agcy. = Agency
AMT = Alternative Minimum Tax
Auth. = Authority
Certs. of Part. = Certificates of Participation
Dept. = Department
Dev. = Development
Dist. = District
Econ. = Economic
Fac. = Facility
Facs. = Facilities
Fin. = Finance
Fncg. = Financing
G.O. = General Obligation
LIBOR = London Interbank Offered Rate
LOC = Letter of Credit
Preref. = Prerefunded
Redev. = Redevelopment
Ref. = Refunding
Rev. = Revenue
SIFMA = Securities Industry and Financial Markets Association
USD/$ = U.S. dollars
| 60 | Private Client Services Funds |
Investment portfolio October 31, 2018
| Bonds, notes & other debt instruments 93.56% | Principal amount (000) | Value (000) | ||||||
| U.S. Treasury bonds & notes 59.64% | ||||||||
| U.S. Treasury 47.91% | ||||||||
| U.S. Treasury 1.50% 2018 | $ | 1,000 | $ | 999 | ||||
| U.S. Treasury 3.75% 2018 | 3,800 | 3,802 | ||||||
| U.S. Treasury 0.875% 2019 | 3,000 | 2,969 | ||||||
| U.S. Treasury 1.00% 2019 | 500 | 492 | ||||||
| U.S. Treasury 1.25% 2019 | 1,900 | 1,891 | ||||||
| U.S. Treasury 1.25% 2019 | 500 | 497 | ||||||
| U.S. Treasury 1.50% 2019 | 2,750 | 2,734 | ||||||
| U.S. Treasury 1.50% 2019 | 1,000 | 988 | ||||||
| U.S. Treasury 1.625% 2019 | 1,000 | 993 | ||||||
| U.S. Treasury 1.625% 2019 | 500 | 494 | ||||||
| U.S. Treasury 1.75% 2019 | 2,000 | 1,983 | ||||||
| U.S. Treasury 1.375% 20201 | 10,000 | 9,836 | ||||||
| U.S. Treasury 1.375% 2020 | 1,250 | 1,217 | ||||||
| U.S. Treasury 1.375% 2020 | 1,000 | 977 | ||||||
| U.S. Treasury 1.50% 2020 | 1,809 | 1,775 | ||||||
| U.S. Treasury 1.625% 2020 | 2,500 | 2,437 | ||||||
| U.S. Treasury 2.00% 2020 | 4,185 | 4,111 | ||||||
| U.S. Treasury 1.125% 2021 | 3,010 | 2,873 | ||||||
| U.S. Treasury 1.25% 2021 | 2,500 | 2,380 | ||||||
| U.S. Treasury 1.25% 2021 | 1,500 | 1,443 | ||||||
| U.S. Treasury 1.375% 2021 | 3,420 | 3,290 | ||||||
| U.S. Treasury 1.375% 2021 | 3,215 | 3,097 | ||||||
| U.S. Treasury 1.75% 2021 | 7,000 | 6,756 | ||||||
| U.S. Treasury 1.875% 2021 | 500 | 485 | ||||||
| U.S. Treasury 2.00% 2021 | 3,770 | 3,699 | ||||||
| U.S. Treasury 2.125% 2021 | 1,000 | 976 | ||||||
| U.S. Treasury 3.125% 2021 | 2,000 | 2,011 | ||||||
| U.S. Treasury 1.50% 2022 | 1,750 | 1,672 | ||||||
| U.S. Treasury 1.75% 2022 | 9,500 | 9,104 | ||||||
| U.S. Treasury 1.75% 2022 | 3,890 | 3,733 | ||||||
| U.S. Treasury 1.75% 2022 | 2,000 | 1,923 | ||||||
| U.S. Treasury 1.875% 2022 | 5,336 | 5,151 | ||||||
| U.S. Treasury 1.875% 2022 | 4,170 | 3,999 | ||||||
| U.S. Treasury 1.875% 2022 | 3,745 | 3,609 | ||||||
| U.S. Treasury 1.875% 2022 | 2,005 | 1,928 | ||||||
| U.S. Treasury 2.125% 2022 | 3,000 | 2,914 | ||||||
| U.S. Treasury 1.25% 2023 | 1,000 | 924 | ||||||
| U.S. Treasury 1.375% 2023 | 1,275 | 1,186 | ||||||
| U.S. Treasury 1.375% 2023 | 1,000 | 928 | ||||||
| U.S. Treasury 1.625% 2023 | 4,000 | 3,769 | ||||||
| U.S. Treasury 1.75% 2023 | 1,000 | 948 | ||||||
| U.S. Treasury 2.00% 2023 | 2,000 | 1,922 | ||||||
| U.S. Treasury 2.125% 2023 | 3,415 | 3,276 | ||||||
| U.S. Treasury 2.25% 2023 | 500 | 482 | ||||||
| U.S. Treasury 2.50% 2023 | 1,050 | 1,027 | ||||||
| U.S. Treasury 2.75% 2023 | 13,542 | 13,415 | ||||||
| U.S. Treasury 2.75% 2023 | 2,250 | 2,225 | ||||||
| U.S. Treasury 2.875% 2023 | 6,600 | 6,567 | ||||||
| U.S. Treasury 2.00% 2024 | 5,650 | 5,350 | ||||||
| U.S. Treasury 2.00% 2024 | 2,480 | 2,353 | ||||||
| U.S. Treasury 2.125% 20241 | 11,000 | 10,525 | ||||||
| U.S. Treasury 2.125% 2024 | 8,000 | 7,606 | ||||||
| U.S. Treasury 2.125% 2024 | 4,200 | 4,015 | ||||||
| U.S. Treasury 2.25% 2024 | 6,015 | 5,755 | ||||||
| U.S. Treasury 2.25% 2024 | 1,820 | 1,754 | ||||||
| U.S. Treasury 2.75% 2024 | 5,000 | 4,938 | ||||||
| U.S. Treasury 2.00% 2025 | 2,000 | 1,879 | ||||||
| U.S. Treasury 2.00% 2025 | 2,000 | 1,868 | ||||||
| U.S. Treasury 2.75% 2025 | 10,000 | 9,826 | ||||||
| U.S. Treasury 3.00% 2025 | 6,674 | 6,643 | ||||||
| U.S. Treasury 7.625% 2025 | 750 | 946 | ||||||
| Private Client Services Funds | 61 |
Capital Group Core Bond Fund
| Bonds, notes & other debt instruments (continued) | Principal amount (000) | Value (000) | ||||||
| U.S. Treasury bonds & notes (continued) | ||||||||
| U.S. Treasury (continued) | ||||||||
| U.S. Treasury 1.625% 2026 | $ | 3,000 | $ | 2,714 | ||||
| U.S. Treasury 2.25% 2027 | 8,420 | 7,883 | ||||||
| U.S. Treasury 2.25% 2027 | 2,200 | 2,050 | ||||||
| U.S. Treasury 2.875% 2028 | 1,752 | 1,712 | ||||||
| U.S. Treasury 2.875% 2028 | 15 | 14 | ||||||
| 213,738 | ||||||||
| U.S. Treasury inflation-protected securities 11.73% | ||||||||
| U.S. Treasury Inflation-Protected Security 0.125% 20202 | 1,744 | 1,714 | ||||||
| U.S. Treasury Inflation-Protected Security 0.125% 20212 | 6,623 | 6,455 | ||||||
| U.S. Treasury Inflation-Protected Security 0.125% 20222 | 5,443 | 5,261 | ||||||
| U.S. Treasury Inflation-Protected Security 0.375% 20232 | 542 | 528 | ||||||
| U.S. Treasury Inflation-Protected Security 0.625% 20232 | 15,227 | 14,935 | ||||||
| U.S. Treasury Inflation-Protected Security 0.25% 20252 | 3,561 | 3,386 | ||||||
| U.S. Treasury Inflation-Protected Security 2.00% 20262 | 635 | 674 | ||||||
| U.S. Treasury Inflation-Protected Security 0.50% 20282 | 10,222 | 9,665 | ||||||
| U.S. Treasury Inflation-Protected Security 0.75% 20282 | 10,045 | 9,734 | ||||||
| 52,352 | ||||||||
| Total U.S. Treasury bonds & notes | 266,090 | |||||||
| Corporate bonds & notes 20.59% | ||||||||
| Financials 4.45% | ||||||||
| ACE INA Holdings Inc. 2.30% 2020 | 285 | 280 | ||||||
| ACE INA Holdings Inc. 2.875% 2022 | 150 | 147 | ||||||
| ACE INA Holdings Inc. 3.35% 2026 | 45 | 43 | ||||||
| ACE INA Holdings Inc. 4.35% 2045 | 50 | 50 | ||||||
| Allstate Corp. 3.28% 2026 | 175 | 167 | ||||||
| American Express Co. 2.20% 2020 | 750 | 733 | ||||||
| American International Group, Inc. 2.30% 2019 | 190 | 189 | ||||||
| American International Group, Inc. 4.20% 2028 | 740 | 712 | ||||||
| Bank of America Corp. 2.625% 2020 | 735 | 725 | ||||||
| Bank of America Corp. 3.419% 2028 (3-month USD-LIBOR + 1.04% on 12/20/2027)3 | 458 | 423 | ||||||
| Bank of America Corp. 3.97% 2029 (3-month USD-LIBOR + 1.07% on 3/5/2028)3 | 750 | 723 | ||||||
| Bank of America Corp. 4.271% 2029 (3-month USD-LIBOR +1.31% on 7/23/2028)3 | 945 | 933 | ||||||
| Bank of New York Mellon Corp. 2.10% 2019 | 500 | 499 | ||||||
| BB&T Corp. 2.625% 2020 | 385 | 381 | ||||||
| Citigroup Inc. 2.35% 2021 | 1,005 | 971 | ||||||
| Citigroup Inc. 4.45% 2027 | 400 | 390 | ||||||
| Credit Suisse Group AG 3.80% 2023 | 500 | 492 | ||||||
| General Motors Financial Co. 4.15% 2023 | 710 | 698 | ||||||
| General Motors Financial Co. 4.00% 2026 | 175 | 161 | ||||||
| Goldman Sachs Group, Inc. 2.55% 2019 | 561 | 558 | ||||||
| Goldman Sachs Group, Inc. 3.00% 2022 | 365 | 356 | ||||||
| Goldman Sachs Group, Inc. 3.814% 2029 (3-month USD-LIBOR + 1.158% on 4/23/2028)3 | 500 | 470 | ||||||
| Goldman Sachs Group, Inc. 4.223% 2029 (3-month USD-LIBOR + 1.301% on 5/1/2028)3 | 445 | 432 | ||||||
| Goldman Sachs Group, Inc. 4.75% 2045 | 175 | 171 | ||||||
| HSBC Holdings PLC 2.65% 2022 | 660 | 639 | ||||||
| JPMorgan Chase & Co. 3.20% 2023 | 125 | 122 | ||||||
| JPMorgan Chase & Co. 3.559% 2024 (3-month USD-LIBOR + 0.73% on 4/23/2023)3 | 325 | 320 | ||||||
| JPMorgan Chase & Co. 3.509% 2029 (3-month USD-LIBOR + 0.945% on 1/23/2028)3 | 500 | 467 | ||||||
| JPMorgan Chase & Co. 4.203% 2029 (3-month USD-LIBOR + 1.26% on 7/23/2028)3 | 679 | 670 | ||||||
| Lloyds Banking Group PLC 4.375% 2028 | 200 | 192 | ||||||
| Morgan Stanley 2.50% 2021 | 500 | 487 | ||||||
| New York Life Global Funding 1.70% 20214 | 750 | 716 | ||||||
| PNC Bank 1.45% 2019 | 690 | 682 | ||||||
| PNC Bank 2.55% 2021 | 350 | 341 | ||||||
| Rabobank Nederland 2.75% 2022 | 400 | 389 | ||||||
| UniCredit SpA 3.75% 20224 | 500 | 473 | ||||||
| US Bancorp 3.05% 2020 | 900 | 897 | ||||||
| 62 | Private Client Services Funds |
Capital Group Core Bond Fund
| Bonds, notes & other debt instruments | Principal amount (000) | Value (000) | ||||||
| US Bancorp 3.104% 2021 (3-month USD-LIBOR + 0.29% on 5/21/2020)3 | $ | 1,000 | $ | 996 | ||||
| US Bancorp 3.40% 2023 | 500 | 496 | ||||||
| Wells Fargo & Co. 2.10% 2021 | 500 | 480 | ||||||
| Wells Fargo & Co. 2.625% 2022 | 805 | 773 | ||||||
| 19,844 | ||||||||
| Health care 3.33% | ||||||||
| Abbott Laboratories 2.90% 2021 | 190 | 187 | ||||||
| Abbott Laboratories 3.40% 2023 | 98 | 97 | ||||||
| Abbott Laboratories 3.75% 2026 | 292 | 288 | ||||||
| AbbVie Inc. 2.50% 2020 | 1,060 | 1,047 | ||||||
| AbbVie Inc. 2.30% 2021 | 340 | 330 | ||||||
| AbbVie Inc. 3.20% 2022 | 415 | 406 | ||||||
| Aetna Inc. 2.80% 2023 | 55 | 53 | ||||||
| Allergan PLC 3.00% 2020 | 485 | 483 | ||||||
| Allergan PLC 3.45% 2022 | 490 | 482 | ||||||
| Amgen Inc. 1.85% 2021 | 140 | 134 | ||||||
| AstraZeneca PLC 3.50% 2023 | 785 | 773 | ||||||
| AstraZeneca PLC 3.375% 2025 | 445 | 423 | ||||||
| AstraZeneca PLC 4.00% 2029 | 296 | 285 | ||||||
| Bayer US Finance II LLC 3.875% 20234 | 400 | 394 | ||||||
| Bayer US Finance II LLC 4.375% 20284 | 500 | 485 | ||||||
| Becton, Dickinson and Co. 3.734% 2024 | 61 | 59 | ||||||
| Cigna Corp. 3.40% 20214 | 255 | 253 | ||||||
| Cigna Corp. 3.75% 20234 | 275 | 273 | ||||||
| Cigna Corp. 4.375% 20284 | 660 | 646 | ||||||
| CVS Health Corp. 4.30% 2028 | 995 | 972 | ||||||
| GlaxoSmithKline PLC 3.375% 2023 | 750 | 743 | ||||||
| Johnson & Johnson 2.45% 2026 | 532 | 492 | ||||||
| Johnson & Johnson 2.95% 2027 | 455 | 432 | ||||||
| Johnson & Johnson 2.90% 2028 | 314 | 294 | ||||||
| Novartis AG 5.125% 2019 | 300 | 302 | ||||||
| Pfizer Inc. 3.20% 2023 | 899 | 891 | ||||||
| Shire PLC 1.90% 2019 | 350 | 346 | ||||||
| Shire PLC 2.40% 2021 | 195 | 188 | ||||||
| Shire PLC 2.875% 2023 | 120 | 113 | ||||||
| Shire PLC 3.20% 2026 | 615 | 558 | ||||||
| Teva Pharmaceutical Finance Co. BV 1.70% 2019 | 165 | 162 | ||||||
| Teva Pharmaceutical Finance Co. BV 2.20% 2021 | 580 | 542 | ||||||
| Teva Pharmaceutical Finance Co. BV 2.80% 2023 | 60 | 53 | ||||||
| Teva Pharmaceutical Finance Co. BV 3.15% 2026 | 60 | 49 | ||||||
| UnitedHealth Group Inc. 3.35% 2022 | 380 | 377 | ||||||
| UnitedHealth Group Inc. 3.75% 2025 | 460 | 456 | ||||||
| WellPoint, Inc. 4.35% 2020 | 300 | 305 | ||||||
| Zimmer Holdings, Inc. 3.15% 2022 | 485 | 474 | ||||||
| 14,847 | ||||||||
| Utilities 2.64% | ||||||||
| Consumers Energy Co. 4.05% 2048 | 285 | 273 | ||||||
| Dominion Resources, Inc. 1.875% 20184 | 685 | 684 | ||||||
| Duke Energy Corp. 2.65% 2026 | 660 | 592 | ||||||
| Duke Energy Progress, LLC 3.375% 2023 | 786 | 783 | ||||||
| Duke Energy Progress, LLC 3.70% 2028 | 200 | 197 | ||||||
| Enel Finance International SA 4.25% 20234 | 448 | 437 | ||||||
| Enel Finance International SA 4.625% 20254 | 672 | 636 | ||||||
| Enel Finance International SA 4.875% 20294 | 448 | 420 | ||||||
| Eversource Energy 2.75% 2022 | 750 | 734 | ||||||
| Exelon Corp. 3.40% 2026 | 65 | 61 | ||||||
| FirstEnergy Corp., Series B, 4.25% 2023 | 1,930 | 1,950 | ||||||
| National Rural Utilities Cooperative Finance Corp. 2.90% 2021 | 870 | 861 | ||||||
| Pacific Gas and Electric Co. 2.45% 2022 | 300 | 283 | ||||||
| Pacific Gas and Electric Co. 3.30% 2027 | 505 | 454 | ||||||
| Private Client Services Funds | 63 |
Capital Group Core Bond Fund
| Bonds, notes & other debt instruments (continued) | Principal amount (000) | Value (000) | ||||||
| Corporate bonds & notes (continued) | ||||||||
| Utilities (continued) | ||||||||
| Pacific Gas and Electric Co. 3.30% 2027 | $ | 225 | $ | 201 | ||||
| Progress Energy, Inc. 7.05% 2019 | 955 | 969 | ||||||
| Public Service Enterprise Group Inc. 1.90% 2021 | 270 | 262 | ||||||
| Public Service Enterprise Group Inc. 2.25% 2026 | 520 | 466 | ||||||
| Tampa Electric Co. 2.60% 2022 | 350 | 336 | ||||||
| Virginia Electric and Power Co. 3.10% 2025 | 1,040 | 998 | ||||||
| Xcel Energy Inc. 3.30% 2025 | 190 | 183 | ||||||
| 11,780 | ||||||||
| Energy 2.27% | ||||||||
| Anadarko Petroleum Corp. 4.85% 2021 | 70 | 72 | ||||||
| Anadarko Petroleum Corp. 5.55% 2026 | 145 | 151 | ||||||
| Boardwalk Pipeline Partners, LP 4.95% 2024 | 460 | 465 | ||||||
| Cenovus Energy Inc. 4.25% 2027 | 170 | 161 | ||||||
| Concho Resources Inc. 4.30% 2028 | 80 | 78 | ||||||
| ConocoPhillips 4.95% 2026 | 95 | 101 | ||||||
| Enbridge Energy Partners, LP 5.875% 2025 | 230 | 251 | ||||||
| Energy Transfer Partners, LP 4.20% 2023 | 155 | 154 | ||||||
| Energy Transfer Partners, LP 4.20% 2027 | 185 | 175 | ||||||
| Energy Transfer Partners, LP 4.95% 2028 | 542 | 537 | ||||||
| EnLink Midstream Partners, LP 4.40% 2024 | 230 | 220 | ||||||
| Equinor ASA 3.625% 2028 | 265 | 258 | ||||||
| Exxon Mobil Corp. (3-month USD-LIBOR + 0.15%) 2.484% 20195 | 1,115 | 1,116 | ||||||
| Husky Energy Inc. 7.25% 2019 | 250 | 260 | ||||||
| Kinder Morgan, Inc. 3.15% 2023 | 495 | 478 | ||||||
| Kinder Morgan, Inc. 4.30% 2028 | 1,010 | 978 | ||||||
| MPLX LP 3.375% 2023 | 75 | 73 | ||||||
| MPLX LP 4.00% 2028 | 350 | 329 | ||||||
| Petróleos Mexicanos 6.375% 2021 | 300 | 308 | ||||||
| Petróleos Mexicanos 5.375% 2022 | 175 | 175 | ||||||
| Petróleos Mexicanos 4.625% 2023 | 1,000 | 956 | ||||||
| Petróleos Mexicanos 6.50% 2027 | 200 | 194 | ||||||
| Phillips 66 4.30% 2022 | 290 | 296 | ||||||
| Phillips 66 Partners LP 3.55% 2026 | 105 | 98 | ||||||
| Royal Dutch Shell PLC 1.75% 2021 | 435 | 417 | ||||||
| Schlumberger BV 3.00% 20204 | 125 | 124 | ||||||
| Schlumberger BV 4.00% 20254 | 165 | 163 | ||||||
| Statoil ASA 3.25% 2024 | 85 | 83 | ||||||
| TC PipeLines, LP 4.375% 2025 | 430 | 422 | ||||||
| Total Capital International 2.875% 2022 | 230 | 226 | ||||||
| TransCanada PipeLines Ltd. 4.25% 2028 | 615 | 603 | ||||||
| Woodside Finance Ltd. 4.60% 20214 | 185 | 188 | ||||||
| 10,110 | ||||||||
| Consumer staples 2.23% | ||||||||
| Altria Group, Inc. 2.85% 2022 | 250 | 243 | ||||||
| Altria Group, Inc. 2.95% 2023 | 200 | 194 | ||||||
| Anheuser-Busch InBev NV 2.65% 2021 | 340 | 333 | ||||||
| Anheuser-Busch InBev NV 3.65% 2026 | 735 | 698 | ||||||
| Constellation Brands, Inc. 3.20% 2023 | 386 | 375 | ||||||
| Costco Wholesale Corp. 2.30% 2022 | 285 | 275 | ||||||
| Costco Wholesale Corp. 2.75% 2024 | 285 | 275 | ||||||
| General Mills, Inc. (3-month USD-LIBOR + 0.54%) 2.976% 20215 | 960 | 960 | ||||||
| General Mills, Inc. 3.20% 2021 | 285 | 283 | ||||||
| Keurig Dr. Pepper Inc. 4.057% 20234 | 900 | 896 | ||||||
| Kroger Co. 2.00% 2019 | 410 | 409 | ||||||
| Molson Coors Brewing Co. 1.45% 2019 | 80 | 79 | ||||||
| Molson Coors Brewing Co. 2.10% 2021 | 90 | 86 | ||||||
| Molson Coors Brewing Co. 3.00% 2026 | 245 | 219 | ||||||
| PepsiCo, Inc. 1.70% 2021 | 420 | 403 | ||||||
| 64 | Private Client Services Funds |
Capital Group Core Bond Fund
| Bonds, notes & other debt instruments | Principal amount (000) | Value (000) | ||||||
| PepsiCo, Inc. 2.00% 2021 | $ | 710 | $ | 689 | ||||
| Philip Morris International Inc. 1.875% 2021 | 165 | 160 | ||||||
| Reynolds American Inc. 4.00% 2022 | 70 | 70 | ||||||
| Reynolds American Inc. 4.45% 2025 | 945 | 942 | ||||||
| Reynolds American Inc. 5.70% 2035 | 310 | 319 | ||||||
| Reynolds American Inc. 5.85% 2045 | 220 | 226 | ||||||
| Wal-Mart Stores, Inc. 3.125% 2021 | 449 | 449 | ||||||
| Wal-Mart Stores, Inc. 2.35% 2022 | 715 | 687 | ||||||
| Wal-Mart Stores, Inc. 3.40% 2023 | 335 | 334 | ||||||
| Wal-Mart Stores, Inc. 3.70% 2028 | 339 | 334 | ||||||
| 9,938 | ||||||||
| Consumer discretionary 1.58% | ||||||||
| Amazon.com, Inc. 2.40% 2023 | 500 | 478 | ||||||
| Amazon.com, Inc. 2.80% 2024 | 500 | 477 | ||||||
| American Honda Finance Corp. 2.65% 2021 | 645 | 636 | ||||||
| American Honda Finance Corp. 2.30% 2026 | 80 | 71 | ||||||
| American Honda Finance Corp. 3.50% 2028 | 325 | 313 | ||||||
| Bayerische Motoren Werke AG 1.45% 20194 | 340 | 335 | ||||||
| DaimlerChrysler North America Holding Corp. 3.30% 20254 | 250 | 237 | ||||||
| Ford Motor Credit Co. 3.157% 2020 | 550 | 541 | ||||||
| Ford Motor Credit Co. 3.219% 2022 | 205 | 196 | ||||||
| General Motors Co. 4.00% 2025 | 145 | 137 | ||||||
| General Motors Co. 4.35% 2025 | 200 | 193 | ||||||
| General Motors Financial Co. 3.70% 2020 | 320 | 320 | ||||||
| Home Depot, Inc. 1.80% 2020 | 480 | 471 | ||||||
| Home Depot, Inc. 4.40% 2021 | 350 | 359 | ||||||
| McDonald’s Corp. 3.70% 2026 | 135 | 132 | ||||||
| McDonald’s Corp. 3.50% 2027 | 460 | 440 | ||||||
| Newell Rubbermaid Inc. 3.15% 2021 | 42 | 41 | ||||||
| NIKE, Inc. 2.375% 2026 | 615 | 553 | ||||||
| Starbucks Corp. 2.00% 2018 | 200 | 200 | ||||||
| Starbucks Corp. 3.80% 2025 | 782 | 760 | ||||||
| Starbucks Corp. 4.00% 2028 | 185 | 180 | ||||||
| 7,070 | ||||||||
| Communication services 1.45% | ||||||||
| 21st Century Fox America, Inc. 3.70% 2025 | 205 | 202 | ||||||
| AT&T Inc. (3-month USD-LIBOR + 1.18%) 3.514% 20245 | 226 | 227 | ||||||
| CCO Holdings LLC and CCO Holdings Capital Corp. 4.908% 2025 | 165 | 166 | ||||||
| Comcast Corp. 3.45% 2021 | 672 | 672 | ||||||
| Comcast Corp. 3.95% 2025 | 539 | 538 | ||||||
| Comcast Corp. 2.35% 2027 | 435 | 381 | ||||||
| Deutsche Telekom International Finance BV 2.82% 20224 | 405 | 394 | ||||||
| NBCUniversal Media, LLC 5.15% 2020 | 350 | 360 | ||||||
| Time Warner Inc. 3.80% 2027 | 150 | 141 | ||||||
| Verizon Communications Inc. 4.125% 2027 | 188 | 186 | ||||||
| Verizon Communications Inc. 4.329% 2028 | 316 | 314 | ||||||
| Verizon Communications Inc. 4.50% 2033 | 1,000 | 974 | ||||||
| Verizon Communications Inc. 4.40% 2034 | 250 | 237 | ||||||
| Vodafone Group PLC 3.75% 2024 | 555 | 543 | ||||||
| Vodafone Group PLC 4.125% 2025 | 445 | 437 | ||||||
| Vodafone Group PLC 4.375% 2028 | 425 | 411 | ||||||
| Walt Disney Co. 5.50% 2019 | 300 | 303 | ||||||
| 6,486 | ||||||||
| Real estate 0.89% | ||||||||
| Alexandria Real Estate Equities, Inc. 3.95% 2028 | 60 | 57 | ||||||
| American Campus Communities, Inc. 3.75% 2023 | 300 | 296 | ||||||
| American Campus Communities, Inc. 4.125% 2024 | 415 | 411 | ||||||
| Corporate Office Properties LP 5.25% 2024 | 235 | 242 | ||||||
| ERP Operating LP 4.625% 2021 | 215 | 222 | ||||||
| Private Client Services Funds | 65 |
Capital Group Core Bond Fund
| Bonds, notes & other debt instruments (continued) | Principal amount (000) | Value (000) | ||||||
| Corporate bonds & notes (continued) | ||||||||
| Real estate (continued) | ||||||||
| Essex Portfolio LP 3.50% 2025 | $ | 490 | $ | 471 | ||||
| Kimco Realty Corp. 3.40% 2022 | 35 | 34 | ||||||
| Scentre Group 2.375% 20194 | 100 | 99 | ||||||
| Scentre Group 3.50% 20254 | 250 | 239 | ||||||
| Simon Property Group, LP 2.50% 2021 | 460 | 449 | ||||||
| WEA Finance LLC 2.70% 20194 | 475 | 473 | ||||||
| WEA Finance LLC 3.25% 20204 | 355 | 353 | ||||||
| Welltower Inc. 3.95% 2023 | 645 | 644 | ||||||
| 3,990 | ||||||||
| Industrials 0.86% | ||||||||
| 3M Co. 3.625% 2028 | 230 | 228 | ||||||
| Airbus Group SE 2.70% 20234 | 85 | 82 | ||||||
| General Electric Co. 2.70% 2022 | 300 | 283 | ||||||
| Lockheed Martin Corp. 3.10% 2023 | 95 | 93 | ||||||
| Lockheed Martin Corp. 3.55% 2026 | 95 | 93 | ||||||
| Northrop Grumman Corp. 2.55% 2022 | 425 | 409 | ||||||
| Republic Services, Inc. 5.00% 2020 | 350 | 358 | ||||||
| Rockwell Collins, Inc. 2.80% 2022 | 375 | 364 | ||||||
| Rockwell Collins, Inc. 3.20% 2024 | 275 | 264 | ||||||
| Union Pacific Corp. 3.50% 2023 | 360 | 359 | ||||||
| Union Pacific Corp. 3.75% 2025 | 230 | 228 | ||||||
| United Technologies Corp. 3.65% 2023 | 785 | 777 | ||||||
| Waste Management, Inc. 4.60% 2021 | 300 | 307 | ||||||
| 3,845 | ||||||||
| Information technology 0.80% | ||||||||
| Apple Inc. 1.80% 2020 | 475 | 466 | ||||||
| Apple Inc. 1.55% 2021 | 575 | 550 | ||||||
| Apple Inc. 2.50% 2022 | 190 | 185 | ||||||
| Broadcom Ltd. 2.375% 2020 | 270 | 267 | ||||||
| Broadcom Ltd. 3.00% 2022 | 730 | 707 | ||||||
| Broadcom Ltd. 3.625% 2024 | 270 | 259 | ||||||
| Broadcom Ltd. 3.875% 2027 | 185 | 170 | ||||||
| Cisco Systems, Inc. 2.20% 2023 | 520 | 491 | ||||||
| Oracle Corp. 2.375% 2019 | 500 | 500 | ||||||
| 3,595 | ||||||||
| Materials 0.09% | ||||||||
| Sherwin-Williams Co. 2.75% 2022 | 165 | 159 | ||||||
| Sherwin-Williams Co. 3.125% 2024 | 70 | 67 | ||||||
| Sherwin-Williams Co. 3.45% 2027 | 175 | 162 | ||||||
| 388 | ||||||||
| Total corporate bonds & notes | 91,893 | |||||||
| Mortgage-backed obligations 6.65% | ||||||||
| Federal agency mortgage-backed obligations 6.53% | ||||||||
| Fannie Mae 4.50% 20196 | 4 | 4 | ||||||
| Fannie Mae 4.50% 20206 | 43 | 43 | ||||||
| Fannie Mae 3.50% 20256 | 1,597 | 1,597 | ||||||
| Fannie Mae 5.50% 20386 | 310 | 332 | ||||||
| Fannie Mae 5.00% 20416 | 597 | 631 | ||||||
| Fannie Mae 5.00% 20416 | 134 | 142 | ||||||
| Fannie Mae 3.50% 20476 | 3,942 | 3,842 | ||||||
| Fannie Mae, Series 2007-33, Class HE, 5.50% 20376 | 7 | 7 | ||||||
| Fannie Mae, Series 2017-M7, Class A2, Multi Family, 2.961% 20275,6 | 445 | 421 | ||||||
| Freddie Mac 3.50% 20456 | 2,073 | 2,034 | ||||||
| Freddie Mac 3.50% 20486,7 | 1,490 | 1,451 | ||||||
| Freddie Mac, Series 3272, Class PA, 6.00% 20376 | 20 | 22 | ||||||
| Freddie Mac, Series K013, Class A2, Multi Family, 3.974% 20216 | 544 | 552 | ||||||
| 66 | Private Client Services Funds |
Capital Group Core Bond Fund
| Bonds, notes & other debt instruments | Principal amount (000) | Value (000) | ||||||
| Freddie Mac, Series K020, Class A2, Multi Family, 2.373% 20226 | $ | 250 | $ | 244 | ||||
| Freddie Mac, Series K718, Class A2, Multi Family, 2.791% 20226 | 1,320 | 1,301 | ||||||
| Freddie Mac, Series K057, Class A2, Multi Family, 2.57% 20266 | 1,010 | 946 | ||||||
| Freddie Mac, Series K070, Class A2, Multi Family, 3.303% 20275,6 | 255 | 247 | ||||||
| Freddie Mac Seasoned Credit Risk Transfer Trust, Series 2017-1, Class HA, 2.50% 20565,6 | 690 | 666 | ||||||
| Freddie Mac Seasoned Credit Risk Transfer Trust, Series 2017-2, Class HA, 2.50% 20566 | 480 | 462 | ||||||
| Freddie Mac Seasoned Credit Risk Transfer Trust, Series 2017-2, Class MA, 3.00% 20566 | 452 | 436 | ||||||
| Freddie Mac Seasoned Credit Risk Transfer Trust, Series 2017-4, Class HT, 2.50% 20575,6 | 268 | 255 | ||||||
| Freddie Mac Seasoned Credit Risk Transfer Trust, Series 2018-2, Class MT, 3.50% 20576 | 552 | 538 | ||||||
| Freddie Mac Seasoned Credit Risk Transfer Trust, Series 2017-4, Class MT, 3.50% 20576 | 274 | 264 | ||||||
| Government National Mortgage Assn. 4.50% 20406 | 52 | 55 | ||||||
| Government National Mortgage Assn. 4.00% 20486,7 | 7,570 | 7,619 | ||||||
| Government National Mortgage Assn. 4.50% 20486,7 | 4,270 | 4,374 | ||||||
| Government National Mortgage Assn. 5.647% 20596 | 3 | 3 | ||||||
| Government National Mortgage Assn. 5.064% 20646 | 57 | 58 | ||||||
| Government National Mortgage Assn. 6.64% 20646 | 155 | 160 | ||||||
| Government National Mortgage Assn., Series 2012-H20, Class PT, 3.286% 20625,6 | 446 | 450 | ||||||
| 29,156 | ||||||||
| Collateralized mortgage-backed obligations (privately originated) 0.12% | ||||||||
| Connecticut Avenue Securities, Series 2014-C02, Class 1M1, (1-month USD-LIBOR + 0.95%) 3.166% 20245,6 | 9 | 9 | ||||||
| Finance of America Structured Securities Trust, Series 2017-HB1, Class A, 2.3207% 20274,5,6,8 | 180 | 180 | ||||||
| Towd Point Mortgage Trust, Series 2017-1, Class A1, 2.75% 20564,5,6 | 344 | 336 | ||||||
| 525 | ||||||||
| Total mortgage-backed obligations | 29,681 | |||||||
| Asset-backed obligations 3.00% | ||||||||
| Aesop Funding LLC, Series 2013-2A, Class A, 2.97% 20204,6 | 893 | 893 | ||||||
| Aesop Funding LLC, Series 2014-2A, Class A, 2.50% 20214,6 | 770 | 763 | ||||||
| California Republic Auto Receivables Trust, Series 2015-1, Class A4, 1.82% 20206 | 198 | 198 | ||||||
| California Republic Auto Receivables Trust, Series 2015-1, Class B, 2.51% 20216 | 270 | 269 | ||||||
| CPS Auto Receivables Trust, Series 2016-A, Class B, 3.34% 20204,6 | 181 | 181 | ||||||
| Drive Auto Receivables Trust, Series 2018-3, Class A2, 2.75% 20206 | 995 | 994 | ||||||
| Drive Auto Receivables Trust, Series 2016-BA, Class C, 3.19% 20224,6 | 224 | 224 | ||||||
| Drivetime Auto Owner Trust, Series 2016-3A, Class C, 3.15% 20224,6 | 191 | 192 | ||||||
| Enterprise Fleet Financing LLC, Series 2017-1, Class A2, 2.13% 20224,6 | 502 | 499 | ||||||
| Ford Credit Auto Owner Trust, Series 2018-2, Class A, 3.47% 20304,6 | 460 | 457 | ||||||
| Ford Credit Auto Owner Trust, Series 2018-1, Class A, 3.19% 20314,6 | 2,365 | 2,290 | ||||||
| Ford Credit Floorplan Master Owner Trust, Series 2016-3, Class A1, 1.55% 20216 | 210 | 208 | ||||||
| Global SC Finance II SRL, Series 2014-1A, Class A1, 3.19% 20294,6 | 442 | 432 | ||||||
| Global SC Finance II SRL, Series 2017-1A, Class A, 3.85% 20374,6 | 428 | 420 | ||||||
| Santander Drive Auto Receivables Trust, Series 2016-2, Class C, 2.66% 20216 | 95 | 95 | ||||||
| Santander Drive Auto Receivables Trust, Series 2015-3, Class C, 2.74% 20216 | 754 | 753 | ||||||
| Santander Drive Auto Receivables Trust, Series 2016-1, Class C, 3.09% 20226 | 400 | 400 | ||||||
| Synchrony Credfit Card Master Note Trust, Series 2018-A1, Class A1, 3.38% 20246 | 1,390 | 1,388 | ||||||
| TAL Advantage V LLC, Series 2013-2A, Class A, 3.55% 20384,6 | 267 | 263 | ||||||
| TAL Advantage V LLC, Series 2017-1A, Class A, 4.50% 20424,6 | 435 | 438 | ||||||
| Verizon Owner Trust, Series 2017-1A, Class A, 2.06% 20214,6 | 610 | 605 | ||||||
| World Financial Network Credit Card Master Note Trust, Series 2018-B, Class A, 3.46% 20256 | 1,425 | 1,423 | ||||||
| 13,385 | ||||||||
| Private Client Services Funds | 67 |
Capital Group Core Bond Fund
| Bonds, notes & other debt instruments (continued) | Principal amount (000) | Value (000) | ||||||
| Federal agency bonds & notes 1.86% | ||||||||
| Fannie Mae 1.75% 2019 | $ | 1,710 | $ | 1,696 | ||||
| Fannie Mae 2.375% 2023 | 2,442 | 2,378 | ||||||
| Fannie Mae 2.125% 2026 | 400 | 371 | ||||||
| Federal Home Loan Bank 1.875% 2020 | 3,015 | 2,976 | ||||||
| United States Agency for International Development, Ukraine, 1.844% 2019 | 875 | 871 | ||||||
| 8,292 | ||||||||
| Municipals 1.21% | ||||||||
| Florida 0.46% | ||||||||
| Hurricane Catastrophe Fund Fin. Corp., Rev. Bonds, Series 2013-A, 2.995% 2020 | 2,060 | 2,054 | ||||||
| California 0.31% | ||||||||
| City of Industry, Public Facs. Auth., Tax Allocation Rev. Ref. Bonds (Civic - Recreational Project), Series 2015-A, Assured Guaranty Municipal insured, 3.139% 2020 | 805 | 804 | ||||||
| High-Speed Passenger Train G.O. Rev. Ref. Bonds, Series 2017-A, 2.367% 2022 | 250 | 244 | ||||||
| High-Speed Passenger Train G.O. Rev. Ref. Bonds, Series 2017-B, 2.193% 2047 (put 2020) | 320 | 316 | ||||||
| 1,364 | ||||||||
| New Jersey 0.23% | ||||||||
| Econ. Dev. Auth., School Facs. Construction Rev. Ref. Bonds, Series 2015-YY, 4.447% 2020 | 650 | 659 | ||||||
| Transportation Trust Fund Auth., Transportation System Rev. Ref. Bonds, Series 2013-B, 1.758% 2018 | 350 | 350 | ||||||
| 1,009 | ||||||||
| Illinois 0.21% | ||||||||
| G.O. Bonds, Pension Funding Series 2003, 5.10% 20336 | 1,000 | 945 | ||||||
| Washington 0.00% | ||||||||
| Energy Northwest, Columbia Generating Station Electric Rev. Bonds, Series 2015-B, 2.814% 2024 | 25 | 24 | ||||||
| Total municipals | 5,396 | |||||||
| Bonds & notes of governments & government agencies outside the U.S. 0.61% | ||||||||
| European Investment Bank 2.25% 2022 | 751 | 730 | ||||||
| Manitoba (Province of) 3.05% 2024 | 200 | 196 | ||||||
| Ontario (Province of) 3.20% 2024 | 500 | 495 | ||||||
| Saudi Arabia (Kingdom of) 4.00% 20254 | 430 | 423 | ||||||
| Saudi Arabia (Kingdom of) 4.50% 20304 | 445 | 439 | ||||||
| United Mexican States 4.15% 2027 | 460 | 439 | ||||||
| 2,722 | ||||||||
| Total bonds, notes & other debt instruments (cost: $428,825,000) | 417,459 | |||||||
| 68 | Private Client Services Funds |
Capital Group Core Bond Fund
| Short-term securities 9.17% | Principal amount (000) | Value (000) | ||||||
| Colgate-Palmolive Co. 2.17% due 11/6/20184 | $ | 2,600 | $ | 2,599 | ||||
| Emerson Electric Co. 2.21% due 11/13/20184 | 12,000 | 11,990 | ||||||
| Federal Home Loan Bank 2.07% due 11/2/2018 | 10,500 | 10,500 | ||||||
| Kimberly-Clark Corp. 2.17% due 11/1/20184 | 11,700 | 11,699 | ||||||
| Swedbank AB 2.17% due 11/1/2018 | 4,100 | 4,100 | ||||||
| Total short-term securities (cost: $40,890,000) | 40,888 | |||||||
| Total investment securities 102.73% (cost: $469,715,000) | 458,347 | |||||||
| Other assets less liabilities (2.73%) | (12,166 | ) | ||||||
| Net assets 100.00% | $ | 446,181 | ||||||
| Swap contracts | ||||||||||||||||||||
| Interest rate swaps | ||||||||||||||||||||
| Unrealized | ||||||||||||||||||||
| Upfront | (depreciation) | |||||||||||||||||||
| Value at | payments/ | appreciation | ||||||||||||||||||
| Expiration | Notional | 10/31/2018 | receipts | at 10/31/2018 | ||||||||||||||||
| Receive | Pay | date | (000) | (000) | (000) | (000) | ||||||||||||||
| 2.55% | 3-month USD-LIBOR | 4/3/2020 | $ | 14,700 | $ | (91 | ) | $ | — | $ | (91 | ) | ||||||||
| 2.5725% | 3-month USD-LIBOR | 4/4/2020 | 18,720 | (111 | ) | — | (111 | ) | ||||||||||||
| 2.599% | 3-month USD-LIBOR | 4/6/2020 | 12,400 | (69 | ) | — | (69 | ) | ||||||||||||
| 3-month USD-LIBOR | 2.761% | 4/27/2020 | 15,000 | 56 | — | 56 | ||||||||||||||
| 3-month USD-LIBOR | 2.75% | 4/30/2020 | 8,000 | 32 | — | 32 | ||||||||||||||
| 3-month USD-LIBOR | 2.746% | 5/1/2020 | 11,400 | 46 | — | 46 | ||||||||||||||
| 3-month USD-LIBOR | 2.7515% | 5/3/2020 | 11,420 | 46 | — | 46 | ||||||||||||||
| $ | — | $ | (91 | ) | ||||||||||||||||
| 1 | All or a portion of this security was pledged as collateral. The total value of pledged collateral was $21,000, which represented less than .01% of the net assets of the fund. |
| 2 | Index-linked bond whose principal amount moves with a government price index. |
| 3 | Step bond; coupon rate may change at a later date. |
| 4 | Acquired in a transaction exempt from registration under Rule 144A or Section 4(2) of the Securities Act of 1933. May be resold in the U.S. in transactions exempt from registration, normally to qualified institutional buyers. The total value of all such securities was $44,323,000, which represented 9.93% of the net assets of the fund. |
| 5 | Coupon rate may change periodically. |
| 6 | Principal payments may be made periodically. Therefore, the effective maturity date may be earlier than the stated maturity date. |
| 7 | Purchased on a TBA basis. |
| 8 | Valued under fair value procedures adopted by authority of the board of trustees. The total value of the security was $180,000, which represented .04% of the net assets of the fund. |
Key to abbreviations and symbol
Auth. = Authority
Dev. = Development
Econ. = Economic
Facs. = Facilities
Fin. = Finance
G.O. = General Obligation
LIBOR = London Interbank Offered Rate
Ref. = Refunding
Rev. = Revenue
TBA = To-be-announced
USD/$ = U.S. dollars
| Private Client Services Funds | 69 |
Capital Group Global Equity Fund
Investment portfolio October 31, 2018
| Common stocks 90.13% | Shares | Value (000) | ||||||
| Information technology 18.80% | ||||||||
| Taiwan Semiconductor Manufacturing Co., Ltd. (ADR) | 312,620 | $ | 11,911 | |||||
| Visa Inc., Class A | 84,870 | 11,699 | ||||||
| GoDaddy Inc., Class A1 | 145,200 | 10,624 | ||||||
| Broadcom Inc. | 45,023 | 10,062 | ||||||
| ASML Holding NV | 51,618 | 8,824 | ||||||
| Apple Inc. | 32,394 | 7,090 | ||||||
| Keyence Corp. | 10,730 | 5,259 | ||||||
| Murata Manufacturing Co., Ltd. | 34,000 | 5,172 | ||||||
| SAP SE | 44,115 | 4,730 | ||||||
| VTech Holdings Ltd. | 393,900 | 4,621 | ||||||
| Microsoft Corp. | 37,300 | 3,984 | ||||||
| Jack Henry & Associates, Inc. | 25,916 | 3,883 | ||||||
| Telefonaktiebolaget LM Ericsson, Class B | 421,825 | 3,678 | ||||||
| Hamamatsu Photonics KK | 106,600 | 3,571 | ||||||
| Intel Corp. | 74,900 | 3,511 | ||||||
| Accenture PLC, Class A | 21,200 | 3,342 | ||||||
| Global Payments Inc. | 16,670 | 1,904 | ||||||
| QUALCOMM Inc. | 29,645 | 1,864 | ||||||
| Texas Instruments Inc. | 9,315 | 865 | ||||||
| 106,594 | ||||||||
| Financials 15.54% | ||||||||
| CME Group Inc., Class A | 72,100 | 13,212 | ||||||
| AIA Group Ltd. | 1,478,600 | 11,191 | ||||||
| JPMorgan Chase & Co. | 99,180 | 10,813 | ||||||
| Intercontinental Exchange, Inc. | 79,635 | 6,135 | ||||||
| Moody’s Corp. | 36,200 | 5,266 | ||||||
| Aon PLC, Class A | 27,600 | 4,311 | ||||||
| DNB ASA | 227,282 | 4,113 | ||||||
| HDFC Bank Ltd. (ADR) | 39,830 | 3,541 | ||||||
| Bank of New York Mellon Corp. | 68,230 | 3,229 | ||||||
| Marsh & McLennan Companies, Inc. | 32,885 | 2,787 | ||||||
| Sampo Oyj, Class A | 57,398 | 2,643 | ||||||
| Wells Fargo & Co. | 49,355 | 2,627 | ||||||
| Huntington Bancshares Inc. | 168,550 | 2,415 | ||||||
| Chubb Ltd. | 16,270 | 2,032 | ||||||
| Svenska Handelsbanken AB, Class A | 173,358 | 1,886 | ||||||
| KBC Groep NV | 25,596 | 1,766 | ||||||
| RenaissanceRe Holdings Ltd. | 13,900 | 1,698 | ||||||
| Lloyds Banking Group PLC | 2,266,700 | 1,658 | ||||||
| State Street Corp. | 17,664 | 1,214 | ||||||
| Prudential PLC | 58,055 | 1,165 | ||||||
| London Stock Exchange Group PLC | 20,400 | 1,125 | ||||||
| Toronto-Dominion Bank | 19,670 | 1,091 | ||||||
| BNP Paribas SA | 16,948 | 886 | ||||||
| First Republic Bank | 8,200 | 746 | ||||||
| Nasdaq, Inc. | 6,300 | 546 | ||||||
| 88,096 | ||||||||
| Industrials 12.00% | ||||||||
| Safran SA | 103,393 | 13,356 | ||||||
| Airbus SE, non-registered shares | 86,492 | 9,572 | ||||||
| Deere & Co. | 50,260 | 6,807 | ||||||
| CSX Corp. | 87,300 | 6,012 | ||||||
| Northrop Grumman Corp. | 16,500 | 4,322 | ||||||
| SMC Corp. | 12,800 | 4,101 | ||||||
| Boeing Co. | 10,590 | 3,758 | ||||||
| Westinghouse Air Brake Technologies Corp. (dba Wabtec Corp.) | 36,700 | 3,010 | ||||||
| TransDigm Group Inc.1 | 8,030 | 2,652 | ||||||
| 70 | Private Client Services Funds |
Capital Group Global Equity Fund
| Common stocks | Shares | Value (000) | ||||||
| Equifax Inc. | 25,600 | $ | 2,597 | |||||
| Waste Connections, Inc. | 28,555 | 2,183 | ||||||
| Jardine Matheson Holdings Ltd. | 37,500 | 2,164 | ||||||
| Hexcel Corp. | 30,630 | 1,792 | ||||||
| IDEX Corp. | 13,350 | 1,693 | ||||||
| DSV A/S | 14,863 | 1,195 | ||||||
| DKSH Holding AG | 14,647 | 988 | ||||||
| Hoshizaki Corp. | 11,600 | 937 | ||||||
| Brenntag AG | 17,259 | 903 | ||||||
| 68,042 | ||||||||
| Consumer staples 9.68% | ||||||||
| Nestlé SA | 82,135 | 6,942 | ||||||
| Pernod Ricard SA | 44,586 | 6,807 | ||||||
| Carlsberg A/S, Class B | 57,775 | 6,373 | ||||||
| L’Oréal SA, non-registered shares | 23,043 | 5,191 | ||||||
| Costco Wholesale Corp. | 21,650 | 4,950 | ||||||
| Danone SA | 60,668 | 4,300 | ||||||
| Mondelez International, Inc. | 102,000 | 4,282 | ||||||
| Reckitt Benckiser Group PLC | 50,945 | 4,124 | ||||||
| Philip Morris International Inc. | 43,040 | 3,791 | ||||||
| Walgreens Boots Alliance, Inc. | 34,000 | 2,712 | ||||||
| Diageo PLC | 71,785 | 2,485 | ||||||
| Coca-Cola Co. | 35,290 | 1,690 | ||||||
| Imperial Brands PLC | 35,300 | 1,197 | ||||||
| 54,844 | ||||||||
| Health care 8.47% | ||||||||
| AstraZeneca PLC | 101,485 | 7,770 | ||||||
| Gilead Sciences, Inc. | 91,207 | 6,218 | ||||||
| UnitedHealth Group Inc. | 20,590 | 5,381 | ||||||
| EssilorLuxottica | 37,835 | 5,175 | ||||||
| Seattle Genetics, Inc.1 | 74,080 | 4,158 | ||||||
| Novo Nordisk A/S, Class B | 87,302 | 3,776 | ||||||
| Danaher Corp. | 35,200 | 3,499 | ||||||
| Abbott Laboratories | 43,600 | 3,006 | ||||||
| Eli Lilly and Co. | 20,375 | 2,209 | ||||||
| Johnson & Johnson | 15,170 | 2,124 | ||||||
| Express Scripts Holding Co.1 | 17,405 | 1,688 | ||||||
| Integra LifeSciences Holdings Corp.1 | 21,900 | 1,173 | ||||||
| Merck & Co., Inc. | 13,800 | 1,016 | ||||||
| Agios Pharmaceuticals, Inc.1 | 13,100 | 826 | ||||||
| 48,019 | ||||||||
| Communication services 6.68% | ||||||||
| SoftBank Group Corp. | 93,300 | 7,482 | ||||||
| Alphabet Inc., Class A1 | 3,295 | 3,594 | ||||||
| Alphabet Inc., Class C1 | 1,839 | 1,980 | ||||||
| Naspers Ltd., Class N (ADR) | 155,405 | 5,436 | ||||||
| Comcast Corp., Class A | 102,500 | 3,909 | ||||||
| Activision Blizzard, Inc. | 49,920 | 3,447 | ||||||
| Facebook, Inc., Class A1 | 21,300 | 3,233 | ||||||
| Charter Communications, Inc., Class A1 | 7,027 | 2,251 | ||||||
| SES SA, Class A (FDR) | 69,377 | 1,491 | ||||||
| NTT DoCoMo, Inc. | 50,900 | 1,283 | ||||||
| JCDecaux SA | 32,167 | 1,059 | ||||||
| Private Client Services Funds | 71 |
Capital Group Global Equity Fund
| Common stocks (continued) | Shares | Value (000) | ||||||
| Communication services (continued) | ||||||||
| Electronic Arts Inc.1 | 11,300 | $ | 1,028 | |||||
| Modern Times Group MTG AB, Class B | 24,325 | 899 | ||||||
| América Móvil, SAB de CV, Series L (ADR) | 54,400 | 783 | ||||||
| 37,875 | ||||||||
| Consumer discretionary 6.66% | ||||||||
| Las Vegas Sands Corp. | 149,880 | 7,648 | ||||||
| Amazon.com, Inc.1 | 4,645 | 7,423 | ||||||
| Hilton Worldwide Holdings Inc. | 101,300 | 7,209 | ||||||
| LVMH Moët Hennessy-Louis Vuitton SE | 11,501 | 3,502 | ||||||
| YUM! Brands, Inc. | 34,600 | 3,128 | ||||||
| NIKE, Inc., Class B | 19,000 | 1,426 | ||||||
| Starbucks Corp. | 22,500 | 1,311 | ||||||
| BCA Marketplace PLC | 506,738 | 1,305 | ||||||
| Samsonite International SA | 448,800 | 1,288 | ||||||
| Hermès International | 2,203 | 1,260 | ||||||
| DENSO Corp. | 18,200 | 815 | ||||||
| Wynn Macau, Ltd. | 389,200 | 803 | ||||||
| Hyundai Motor Co., Series 2 (GDR)2,3 | 20,606 | 640 | ||||||
| 37,758 | ||||||||
| Energy 5.11% | ||||||||
| Royal Dutch Shell PLC, Class B (ADR) | 135,795 | 8,923 | ||||||
| Schlumberger Ltd. | 112,986 | 5,797 | ||||||
| Chevron Corp. | 48,844 | 5,454 | ||||||
| Enbridge Inc. (CAD denominated) | 133,100 | 4,147 | ||||||
| EOG Resources, Inc. | 39,145 | 4,124 | ||||||
| Helmerich & Payne, Inc. | 8,300 | 517 | ||||||
| 28,962 | ||||||||
| Materials 2.61% | ||||||||
| Asahi Kasei Corp. | 432,600 | 5,203 | ||||||
| Nutrien Ltd. (CAD denominated) | 76,600 | 4,055 | ||||||
| Air Liquide SA, non-registered shares | 11,949 | 1,448 | ||||||
| Givaudan SA | 555 | 1,347 | ||||||
| Linde PLC | 7,145 | 1,182 | ||||||
| Rio Tinto PLC | 22,242 | 1,081 | ||||||
| Steel Dynamics, Inc. | 12,100 | 479 | ||||||
| 14,795 | ||||||||
| Real estate 2.33% | ||||||||
| American Tower Corp. REIT | 37,900 | 5,905 | ||||||
| Crown Castle International Corp. REIT | 45,675 | 4,967 | ||||||
| Link Real Estate Investment Trust REIT | 148,500 | 1,316 | ||||||
| Equinix, Inc. REIT | 2,700 | 1,023 | ||||||
| 13,211 | ||||||||
| Utilities 2.25% | ||||||||
| AES Corp. | 339,350 | 4,948 | ||||||
| Sempra Energy | 24,530 | 2,701 | ||||||
| Enel SPA | 381,894 | 1,875 | ||||||
| Iberdrola, SA, non-registered shares | 242,224 | 1,716 | ||||||
| National Grid PLC | 143,085 | 1,516 | ||||||
| 12,756 | ||||||||
| Total common stocks (cost: $380,331,000) | 510,952 | |||||||
| 72 | Private Client Services Funds |
Capital Group Global Equity Fund
| Short-term securities 9.75% | Principal amount (000) | Value (000) | ||||||
| Québec (Province of) 2.15% due 11/26/20183 | $ | 12,000 | $ | 11,980 | ||||
| Société Générale 2.30% due 11/23/2018–11/26/20183 | 14,800 | 14,777 | ||||||
| Swedbank AB 2.32% due 12/17/2018 | 15,000 | 14,957 | ||||||
| Toronto-Dominion Bank 2.29%–2.36% due 11/21/2018–12/21/20183 | 13,600 | 13,564 | ||||||
| Total short-term securities (cost: $55,279,000) | 55,278 | |||||||
| Total investment securities 99.88% (cost: $435,610,000) | 566,230 | |||||||
| Other assets less liabilities 0.12% | 690 | |||||||
| Net assets 100.00% | $ | 566,920 | ||||||
| 1 | Security did not produce income during the last 12 months. |
| 2 | Valued under fair value procedures adopted by authority of the board of trustees. The total value of the security was $640,000, which represented .11% of the net assets of the fund. |
| 3 | Acquired in a transaction exempt from registration under Rule 144A or Section 4(2) of the Securities Act of 1933. May be resold in the U.S. in transactions exempt from registration, normally to qualified institutional buyers. The total value of all such securities was $40,961,000, which represented 7.23% of the net assets of the fund. |
Key to abbreviations
ADR = American Depositary Receipts
CAD = Canadian dollars
dba = doing business as
FDR = Fiduciary Depositary Receipts
GDR = Global Depositary Receipts
| Private Client Services Funds | 73 |
Capital Group International Equity Fund
Investment portfolio October 31, 2018
| Common stocks 76.38% | Shares | Value (000) | ||||||
| Financials 13.35% | ||||||||
| AIA Group Ltd. | 3,580,400 | $ | 27,097 | |||||
| London Stock Exchange Group PLC | 345,100 | 19,034 | ||||||
| Sampo Oyj, Class A | 315,101 | 14,512 | ||||||
| Prudential PLC | 636,470 | 12,777 | ||||||
| Lloyds Banking Group PLC | 16,821,900 | 12,303 | ||||||
| HDFC Bank Ltd. (ADR) | 127,000 | 11,292 | ||||||
| DBS Group Holdings Ltd | 479,100 | 8,114 | ||||||
| Svenska Handelsbanken AB, Class A | 668,749 | 7,274 | ||||||
| Deutsche Boerse AG | 55,720 | 7,059 | ||||||
| BNP Paribas SA | 129,245 | 6,753 | ||||||
| Société Générale | 153,746 | 5,656 | ||||||
| KBC Groep NV | 73,796 | 5,090 | ||||||
| Euronext NV | 68,573 | 4,229 | ||||||
| Aon PLC, Class A | 25,000 | 3,905 | ||||||
| ABN AMRO Group NV, depository receipts | 157,776 | 3,878 | ||||||
| DNB ASA | 206,070 | 3,729 | ||||||
| AIB Group PLC | 494,541 | 2,393 | ||||||
| 155,095 | ||||||||
| Industrials 13.13% | ||||||||
| Safran SA | 259,052 | 33,464 | ||||||
| Airbus SE, non-registered shares | 236,435 | 26,167 | ||||||
| SMC Corp. | 68,500 | 21,946 | ||||||
| Jardine Matheson Holdings Ltd. | 217,400 | 12,546 | ||||||
| ASSA ABLOY AB, Class B | 573,966 | 11,446 | ||||||
| Nidec Corp. | 67,100 | 8,617 | ||||||
| DSV A/S | 95,532 | 7,681 | ||||||
| DKSH Holding AG | 90,438 | 6,102 | ||||||
| Brenntag AG | 106,331 | 5,561 | ||||||
| RELX PLC | 265,700 | 5,264 | ||||||
| Hoshizaki Corp. | 54,600 | 4,408 | ||||||
| Canadian National Railway Co. | 43,600 | 3,727 | ||||||
| Kubota Corp. | 204,200 | 3,225 | ||||||
| Ryanair Holdings PLC (ADR)1 | 29,980 | 2,482 | ||||||
| 152,636 | ||||||||
| Consumer staples 12.10% | ||||||||
| Nestlé SA | 266,027 | 22,483 | ||||||
| Carlsberg A/S, Class B | 194,189 | 21,421 | ||||||
| Pernod Ricard SA | 139,205 | 21,254 | ||||||
| L’Oréal SA, non-registered shares | 71,644 | 16,140 | ||||||
| Diageo PLC | 448,345 | 15,522 | ||||||
| Danone SA | 157,773 | 11,183 | ||||||
| Imperial Brands PLC | 193,678 | 6,568 | ||||||
| British American Tobacco PLC | 145,200 | 6,298 | ||||||
| Associated British Foods PLC | 166,950 | 5,092 | ||||||
| TSURUHA Holdings, Inc. | 36,600 | 3,815 | ||||||
| Reckitt Benckiser Group PLC | 39,900 | 3,230 | ||||||
| KOSÉ Corp. | 18,300 | 2,736 | ||||||
| Uni-Charm Corp. | 95,100 | 2,589 | ||||||
| Meiji Holdings Co., Ltd. | 35,000 | 2,326 | ||||||
| 140,657 | ||||||||
| Information technology 10.29% | ||||||||
| Keyence Corp. | 44,400 | 21,760 | ||||||
| Taiwan Semiconductor Manufacturing Co., Ltd. (ADR) | 560,000 | 21,336 | ||||||
| SAP SE | 189,514 | 20,319 | ||||||
| ASML Holding NV | 116,639 | 19,938 | ||||||
| 74 | Private Client Services Funds |
Capital Group International Equity Fund
| Common stocks | Shares | Value (000) | ||||||
| Hamamatsu Photonics KK | 550,400 | $ | 18,439 | |||||
| Murata Manufacturing Co., Ltd. | 99,200 | 15,091 | ||||||
| Samsung Electronics Co., Ltd., preferred (GDR) | 3,509 | 2,744 | ||||||
| 119,627 | ||||||||
| Health care 9.15% | ||||||||
| AstraZeneca PLC | 395,050 | 30,247 | ||||||
| Novo Nordisk A/S, Class B | 510,839 | 22,095 | ||||||
| EssilorLuxottica | 157,440 | 21,532 | ||||||
| Genmab A/S1 | 70,795 | 9,699 | ||||||
| HOYA Corp. | 115,200 | 6,548 | ||||||
| Sonova Holding AG | 27,951 | 4,567 | ||||||
| Novartis AG | 45,130 | 3,954 | ||||||
| Grifols, SA, Class B, nonvoting preferred, non-registered shares | 188,751 | 3,878 | ||||||
| Hutchison China MediTech Ltd. (ADR)1 | 116,044 | 3,803 | ||||||
| 106,323 | ||||||||
| Consumer discretionary 6.18% | ||||||||
| LVMH Moët Hennessy-Louis Vuitton SE | 54,973 | 16,737 | ||||||
| Kering SA | 22,080 | 9,843 | ||||||
| BCA Marketplace PLC | 3,681,468 | 9,482 | ||||||
| MercadoLibre, Inc. | 28,150 | 9,135 | ||||||
| InterContinental Hotels Group PLC | 118,900 | 6,246 | ||||||
| Samsonite International SA | 1,935,000 | 5,552 | ||||||
| Ryohin Keikaku Co., Ltd. | 15,500 | 4,095 | ||||||
| Wynn Macau, Ltd. | 1,533,000 | 3,163 | ||||||
| Hermès International | 4,983 | 2,850 | ||||||
| DENSO Corp. | 61,800 | 2,766 | ||||||
| Huazhu Group Ltd. (ADR) | 73,200 | 1,915 | ||||||
| 71,784 | ||||||||
| Communication services 4.57% | ||||||||
| SoftBank Group Corp. | 218,600 | 17,529 | ||||||
| NTT DoCoMo, Inc. | 334,900 | 8,443 | ||||||
| Modern Times Group MTG AB, Class B | 198,349 | 7,330 | ||||||
| SES SA, Class A (FDR) | 335,412 | 7,209 | ||||||
| JCDecaux SA | 176,649 | 5,814 | ||||||
| Vodafone Group PLC | 1,895,870 | 3,582 | ||||||
| Naspers Ltd., Class N (ADR) | 92,250 | 3,227 | ||||||
| 53,134 | ||||||||
| Materials 2.95% | ||||||||
| Asahi Kasei Corp. | 721,500 | 8,677 | ||||||
| Shin-Etsu Chemical Co., Ltd. | 75,400 | 6,327 | ||||||
| Givaudan SA | 2,517 | 6,108 | ||||||
| Air Liquide SA, non-registered shares | 39,736 | 4,816 | ||||||
| Kansai Paint Co., Ltd. | 245,420 | 3,634 | ||||||
| Rio Tinto PLC | 56,190 | 2,732 | ||||||
| Amcor Ltd. | 213,815 | 2,014 | ||||||
| 34,308 | ||||||||
| Energy 2.30% | ||||||||
| Royal Dutch Shell PLC, Class B | 501,490 | 16,442 | ||||||
| TOTAL SA | 90,624 | 5,333 | ||||||
| Ensco PLC, Class A | 689,900 | 4,926 | ||||||
| 26,701 |
| Private Client Services Funds | 75 |
Capital Group International Equity Fund
| Common stocks (continued) | Shares | Value (000) | ||||||
| Utilities 1.62% | ||||||||
| Enel SPA | 1,737,850 | $ | 8,531 | |||||
| Iberdrola, SA, non-registered shares | 1,103,497 | 7,819 | ||||||
| SSE PLC | 171,954 | 2,509 | ||||||
| 18,859 | ||||||||
| Real estate 0.74% | ||||||||
| Link Real Estate Investment Trust REIT | 973,500 | 8,628 | ||||||
| Total common stocks (cost: $677,330,000) | 887,752 | |||||||
| Short-term securities 23.79% | Principal amount (000) | |||||||
| Apple Inc. 2.20% due 11/2/20182 | $ | 10,000 | 9,999 | |||||
| BNP Paribas, New York Branch 2.16% due 11/1/2018 | 10,500 | 10,499 | ||||||
| Federal Home Loan Bank 2.07%–2.22% due 11/5/2018–1/2/2019 | 81,700 | 81,599 | ||||||
| John Deere Capital Corp. 2.25% due 11/14/20182 | 20,000 | 19,982 | ||||||
| MUFG Bank, Ltd., New York Branch 2.19% due 11/6/2018 | 10,000 | 9,996 | ||||||
| Novartis Finance Corp. 2.21% due 11/2/20182 | 19,600 | 19,598 | ||||||
| Sanofi 2.24% due 12/14/20182 | 10,000 | 9,972 | ||||||
| U.S. Treasury Bills 2.16%–2.18% due 11/15/2018–12/11/2018 | 90,000 | 89,831 | ||||||
| Victory Receivables Corp. 2.20% due 11/16/20182 | 25,000 | 24,975 | ||||||
| Total short-term securities (cost: $276,457,000) | 276,451 | |||||||
| Total investment securities 100.17% (cost: $953,787,000) | 1,164,203 | |||||||
| Other assets less liabilities (0.17)% | (2,025 | ) | ||||||
| Net assets 100.00% | $ | 1,162,178 | ||||||
| 1 | Security did not produce income during the last 12 months. |
| 2 | Acquired in a transaction exempt from registration under Rule 144A or Section 4(2) of the Securities Act of 1933. May be resold in the U.S. in transactions exempt from registration, normally to qualified institutional buyers. The total value of all such securities was $84,526,000, which represented 7.27% of the net assets of the fund. |
Key to abbreviations
ADR = American Depositary Receipts
FDR = Fiduciary Depositary Receipts
GDR = Global Depositary Receipts
| 76 | Private Client Services Funds |
Capital Group U.S. Equity Fund
Investment portfolio October 31, 2018
| Common stocks 95.40% | Shares | Value (000) | ||||||
| Information technology 18.24% | ||||||||
| Visa Inc., Class A | 53,330 | $ | 7,352 | |||||
| Microsoft Corp. | 67,095 | 7,167 | ||||||
| Jack Henry & Associates, Inc. | 43,020 | 6,446 | ||||||
| Apple Inc. | 16,565 | 3,625 | ||||||
| Broadcom Inc. | 10,381 | 2,320 | ||||||
| Texas Instruments Inc. | 22,540 | 2,092 | ||||||
| Global Payments Inc. | 16,705 | 1,908 | ||||||
| GoDaddy Inc., Class A1 | 21,500 | 1,573 | ||||||
| ASML Holding NV (New York registered) | 8,840 | 1,524 | ||||||
| Accenture PLC, Class A | 9,200 | 1,450 | ||||||
| QUALCOMM Inc. | 21,345 | 1,342 | ||||||
| Analog Devices, Inc. | 14,156 | 1,185 | ||||||
| HP Inc. | 40,520 | 978 | ||||||
| Intel Corp. | 14,300 | 670 | ||||||
| Micro Focus International PLC, depository receipt | 36,100 | 554 | ||||||
| Trimble Inc.1 | 14,705 | 550 | ||||||
| 40,736 | ||||||||
| Financials 16.86% | ||||||||
| CME Group Inc., Class A | 29,025 | 5,318 | ||||||
| Marsh & McLennan Companies, Inc. | 62,490 | 5,296 | ||||||
| Chubb Ltd. | 31,040 | 3,877 | ||||||
| JPMorgan Chase & Co. | 33,730 | 3,677 | ||||||
| Wells Fargo & Co. | 68,415 | 3,642 | ||||||
| Aon PLC, Class A | 16,300 | 2,546 | ||||||
| Bank of New York Mellon Corp. | 53,390 | 2,527 | ||||||
| Intercontinental Exchange, Inc. | 29,350 | 2,261 | ||||||
| SVB Financial Group1 | 9,500 | 2,254 | ||||||
| Huntington Bancshares Inc. | 141,930 | 2,034 | ||||||
| Moody’s Corp. | 12,575 | 1,829 | ||||||
| Nasdaq, Inc. | 12,600 | 1,093 | ||||||
| Toronto-Dominion Bank | 12,245 | 679 | ||||||
| State Street Corp. | 5,600 | 385 | ||||||
| MSCI Inc. | 1,600 | 241 | ||||||
| 37,659 | ||||||||
| Industrials 12.77% | ||||||||
| Waste Connections, Inc. | 72,800 | 5,565 | ||||||
| CSX Corp. | 52,800 | 3,636 | ||||||
| Northrop Grumman Corp. | 11,000 | 2,881 | ||||||
| Boeing Co. | 6,170 | 2,189 | ||||||
| Deere & Co. | 14,620 | 1,980 | ||||||
| TransDigm Group Inc.1 | 5,205 | 1,719 | ||||||
| Hexcel Corp. | 26,315 | 1,540 | ||||||
| Airbus Group SE (ADR) | 50,200 | 1,384 | ||||||
| Equifax Inc. | 13,350 | 1,354 | ||||||
| IDEX Corp. | 9,800 | 1,243 | ||||||
| Westinghouse Air Brake Technologies Corp. (dba Wabtec Corp.) | 13,100 | 1,074 | ||||||
| Norfolk Southern Corp. | 6,285 | 1,055 | ||||||
| Eaton Corp. PLC | 14,700 | 1,054 | ||||||
| Waste Management, Inc. | 11,120 | 995 | ||||||
| Lockheed Martin Corp. | 2,075 | 610 | ||||||
| C.H. Robinson Worldwide, Inc. | 2,685 | 239 | ||||||
| 28,518 |
| Private Client Services Funds | 77 |
Capital Group U.S. Equity Fund
| Common stocks (continued) | Shares | Value (000) | ||||||
| Health care 12.03% | ||||||||
| UnitedHealth Group Inc. | 22,005 | $ | 5,751 | |||||
| Humana Inc. | 7,665 | 2,456 | ||||||
| Merck & Co., Inc. | 27,585 | 2,030 | ||||||
| Danaher Corp. | 19,973 | 1,985 | ||||||
| Seattle Genetics, Inc.1 | 33,530 | 1,882 | ||||||
| Express Scripts Holding Co.1 | 19,085 | 1,851 | ||||||
| Gilead Sciences, Inc. | 26,924 | 1,836 | ||||||
| Eli Lilly and Co. | 16,900 | 1,833 | ||||||
| Johnson & Johnson | 10,380 | 1,453 | ||||||
| AstraZeneca PLC (ADR) | 35,150 | 1,363 | ||||||
| Medtronic PLC | 14,015 | 1,259 | ||||||
| EssilorLuxottica (ADR) | 14,080 | 961 | ||||||
| Abbott Laboratories | 13,380 | 922 | ||||||
| Agios Pharmaceuticals, Inc.1 | 10,270 | 648 | ||||||
| Ultragenyx Pharmaceutical Inc.1 | 13,345 | 647 | ||||||
| 26,877 | ||||||||
| Consumer staples 9.70% | ||||||||
| Philip Morris International Inc. | 45,230 | 3,983 | ||||||
| Diageo PLC (ADR) | 26,700 | 3,689 | ||||||
| Costco Wholesale Corp. | 13,200 | 3,018 | ||||||
| Procter & Gamble Co. | 29,751 | 2,638 | ||||||
| Nestlé SA (ADR) | 30,305 | 2,554 | ||||||
| Coca-Cola Co. | 42,120 | 2,017 | ||||||
| Mondelez International, Inc. | 29,500 | 1,239 | ||||||
| Hormel Foods Corp. | 17,200 | 751 | ||||||
| Carlsberg A/S, Class B (ADR) | 31,725 | 700 | ||||||
| Danone (ADR) | 44,389 | 628 | ||||||
| Reckitt Benckiser Group PLC (ADR) | 28,160 | 456 | ||||||
| 21,673 | ||||||||
| Energy 7.31% | ||||||||
| Schlumberger Ltd. | 59,344 | 3,045 | ||||||
| Chevron Corp. | 24,340 | 2,718 | ||||||
| Enbridge Inc. | 81,400 | 2,532 | ||||||
| EOG Resources, Inc. | 22,765 | 2,398 | ||||||
| ConocoPhillips | 22,985 | 1,607 | ||||||
| Helmerich & Payne, Inc. | 19,200 | 1,196 | ||||||
| Royal Dutch Shell PLC, Class B (ADR) | 18,100 | 1,189 | ||||||
| Halliburton Co. | 20,400 | 707 | ||||||
| Cimarex Energy Co. | 6,500 | 517 | ||||||
| Occidental Petroleum Corp. | 6,150 | 412 | ||||||
| 16,321 | ||||||||
| Communication services 6.21% | ||||||||
| Comcast Corp., Class A | 119,150 | 4,545 | ||||||
| Charter Communications, Inc., Class A1 | 10,236 | 3,279 | ||||||
| Alphabet Inc., Class C1 | 1,742 | 1,876 | ||||||
| Alphabet Inc., Class A1 | 360 | 392 | ||||||
| Activision Blizzard, Inc. | 21,200 | 1,464 | ||||||
| Facebook, Inc., Class A1 | 7,100 | 1,078 | ||||||
| Verizon Communications Inc. | 16,835 | 961 | ||||||
| Electronic Arts Inc.1 | 3,100 | 282 | ||||||
| 13,877 |
| 78 | Private Client Services Funds |
Capital Group U.S. Equity Fund
| Common stocks | Shares | Value (000) | ||||||
| Consumer discretionary 5.24% | ||||||||
| Amazon.com, Inc.1 | 2,328 | $ | 3,720 | |||||
| NIKE, Inc., Class B | 33,605 | 2,522 | ||||||
| Hilton Worldwide Holdings Inc. | 22,900 | 1,630 | ||||||
| Chipotle Mexican Grill, Inc.1 | 2,480 | 1,142 | ||||||
| Booking Holdings Inc.1 | 520 | 975 | ||||||
| Starbucks Corp. | 12,400 | 722 | ||||||
| YUM! Brands, Inc. | 6,580 | 595 | ||||||
| Wynn Resorts, Ltd. | 4,000 | 402 | ||||||
| 11,708 | ||||||||
| Real estate 4.05% | ||||||||
| Crown Castle International Corp. REIT | 35,800 | 3,893 | ||||||
| American Tower Corp. REIT | 18,300 | 2,851 | ||||||
| Equinix, Inc. REIT | 3,800 | 1,439 | ||||||
| Iron Mountain Inc. REIT | 27,950 | 856 | ||||||
| 9,039 | ||||||||
| Utilities 1.75% | ||||||||
| Sempra Energy | 25,005 | 2,754 | ||||||
| Edison International | 10,100 | 701 | ||||||
| NextEra Energy, Inc. | 2,600 | 448 | ||||||
| 3,903 | ||||||||
| Materials 1.24% | ||||||||
| Linde PLC | 9,806 | 1,622 | ||||||
| Sherwin-Williams Co. | 1,570 | 618 | ||||||
| Steel Dynamics, Inc. | 13,400 | 531 | ||||||
| 2,771 | ||||||||
| Total common stocks (cost: $144,229,000) | 213,082 | |||||||
| Short-term securities 4.43% | Principal amount (000) | |||||||
| Federal Home Loan Bank 2.17% due 11/2/2018 | $ | 1,200 | 1,200 | |||||
| Intel Corp. 2.21% due 11/6/20182 | 2,000 | 1,999 | ||||||
| Swedbank AB 2.17% due 11/1/2018 | 2,700 | 2,700 | ||||||
| Tennessee Valley Authority 2.20% due 11/6/2018 | 2,000 | 1,999 | ||||||
| Wal-Mart Stores, Inc. 2.26% due 11/20/20182 | 2,000 | 1,998 | ||||||
| Total short-term securities (cost: $9,896,000) | 9,896 | |||||||
| Total investment securities 99.83% (cost: $154,125,000) | 222,978 | |||||||
| Other assets less liabilities 0.17% | 380 | |||||||
| Net assets 100.00% | $ | 223,358 | ||||||
| 1 | Security did not produce income during the last 12 months. |
| 2 | Acquired in a transaction exempt from registration under Rule 144A or Section 4(2) of the Securities Act of 1933. May be resold in the U.S. in transactions exempt from registration, normally to qualified institutional buyers. The total value of all such securities was $3,997,000, which represented 1.79% of the net assets of the fund. |
Key to abbreviations
ADR = American Depositary Receipts
dba = doing business as
| Private Client Services Funds | 79 |
Statements of assets and liabilities
at October 31, 2018
| Capital Group | ||||||||||||
| Capital Group | Capital Group | California | ||||||||||
| Core Municipal | Short-Term | Core Municipal | ||||||||||
| Fund | Municipal Fund | Fund | ||||||||||
| Assets: | ||||||||||||
| Investment securities, at value: | ||||||||||||
| Unaffiliated issuers | $ | 475,795 | $ | 139,470 | $ | 449,465 | ||||||
| Cash | 537 | 162 | 43 | |||||||||
| Cash pledged for futures contracts | 171 | 35 | 148 | |||||||||
| Cash denominated in currencies other than U.S. dollars | — | — | — | |||||||||
| Receivables for: | ||||||||||||
| Sales of investments | 1,000 | 1,301 | — | |||||||||
| Sales of fund’s shares | 1,439 | — | 3,423 | |||||||||
| Dividends and interest | 5,282 | 1,390 | 4,046 | |||||||||
| Variation margin on swap contracts | — | — | — | |||||||||
| Other | 18 | 4 | 16 | |||||||||
| Total assets | 484,242 | 142,362 | 457,141 | |||||||||
| Liabilities: | ||||||||||||
| Payables for: | ||||||||||||
| Purchases of investments | 9,108 | 4,541 | 5,130 | |||||||||
| Repurchases of fund’s shares | 1,067 | 95 | 12 | |||||||||
| Dividends on fund’s shares | — | — | — | |||||||||
| Investment advisory services | 101 | 30 | 95 | |||||||||
| Variation margin on futures contracts | 43 | 9 | 39 | |||||||||
| Variation margin on swap contracts | — | — | — | |||||||||
| Other | — | * | — | * | — | * | ||||||
| Total liabilities | 10,319 | 4,675 | 5,276 | |||||||||
| Net assets at October 31, 2018 | $ | 473,923 | $ | 137,687 | $ | 451,865 | ||||||
| Net assets consist of: | ||||||||||||
| Capital paid in on shares of beneficial interest | $ | 479,674 | $ | 139,836 | $ | 453,996 | ||||||
| Total (accumulated loss) distributable earnings | (5,751 | ) | (2,149 | ) | (2,131 | ) | ||||||
| Net assets at October 31, 2018 | $ | 473,923 | $ | 137,687 | $ | 451,865 | ||||||
| Investment securities in unaffiliated issuers, at cost | $ | 480,743 | $ | 140,791 | $ | 452,042 | ||||||
| Cash denominated in currencies other than U.S. dollars, at cost | — | — | — | |||||||||
| Shares outstanding | 46,670 | 13,864 | 43,704 | |||||||||
| Net asset value per share | $ | 10.15 | $ | 9.93 | $ | 10.34 | ||||||
| * | Amount less than one thousand. |
See notes to financial statements
| 80 | Private Client Services Funds |
(dollars and shares in thousands, except per-share amounts)
| Capital Group | ||||||||||||||||||
| California | Capital Group | |||||||||||||||||
| Short-Term | Capital Group | Capital Group | International | Capital Group | ||||||||||||||
| Municipal Fund | Core Bond Fund | Global Equity Fund | Equity Fund | U.S. Equity Fund | ||||||||||||||
| $ | 127,752 | $ | 458,347 | $ | 566,230 | $ | 1,164,203 | $ | 222,978 | |||||||||
| 925 | 29 | 58 | 26 | 48 | ||||||||||||||
| 28 | — | — | — | — | ||||||||||||||
| — | — | 58 | 705 | 5 | ||||||||||||||
| — | 4,388 | — | — | 332 | ||||||||||||||
| — | — | 52 | 705 | — | ||||||||||||||
| 1,235 | 1,937 | 896 | 4,216 | 170 | ||||||||||||||
| — | 20 | — | — | — | ||||||||||||||
| 4 | 7 | — | — | — | ||||||||||||||
| 129,944 | 464,728 | 567,294 | 1,169,855 | 223,533 | ||||||||||||||
| 1,089 | 18,227 | — | — | — | ||||||||||||||
| 52 | 39 | 15 | 6,690 | 92 | ||||||||||||||
| — | 168 | — | — | — | ||||||||||||||
| 26 | 95 | 323 | 772 | 83 | ||||||||||||||
| 6 | — | — | — | — | ||||||||||||||
| — | 18 | — | — | — | ||||||||||||||
| — | * | — | * | 36 | 215 | — | ||||||||||||
| 1,173 | 18,547 | 374 | 7,677 | 175 | ||||||||||||||
| $ | 128,771 | $ | 446,181 | $ | 566,920 | $ | 1,162,178 | $ | 223,358 | |||||||||
| $ | 129,882 | $ | 459,853 | $ | 404,361 | $ | 939,196 | $ | 139,849 | |||||||||
| (1,111 | ) | (13,672 | ) | 162,559 | 222,982 | 83,509 | ||||||||||||
| $ | 128,771 | $ | 446,181 | $ | 566,920 | $ | 1,162,178 | $ | 223,358 | |||||||||
| $ | 128,698 | $ | 469,715 | $ | 435,610 | $ | 953,787 | $ | 154,125 | |||||||||
| — | — | 58 | 715 | 5 | ||||||||||||||
| 12,794 | 45,438 | 37,996 | 91,763 | 9,803 | ||||||||||||||
| $ | 10.06 | $ | 9.82 | $ | 14.92 | $ | 12.67 | $ | 22.78 | |||||||||
| Private Client Services Funds | 81 |
Statements of operations
for the year ended October 31, 2018
| Capital Group | ||||||||||||
| Capital Group | Capital Group | California | ||||||||||
| Core Municipal | Short-Term | Core Municipal | ||||||||||
| Fund | Municipal Fund | Fund | ||||||||||
| Investment income: | ||||||||||||
| Income (net of non-U.S. taxes*): | ||||||||||||
| Dividends | $ | — | $ | — | $ | — | ||||||
| Interest | 10,879 | 2,810 | 8,626 | |||||||||
| 10,879 | 2,810 | 8,626 | ||||||||||
| Fees and expenses*: | ||||||||||||
| Investment advisory services | 1,177 | 357 | 1,019 | |||||||||
| Reports to shareholders | 3 | 3 | 3 | |||||||||
| Registration statement and prospectus | 33 | 27 | 14 | |||||||||
| Trustees’ compensation | 29 | 29 | 29 | |||||||||
| Auditing and legal | 34 | 32 | 34 | |||||||||
| Custodian | 1 | 1 | 1 | |||||||||
| Other | 9 | 1 | 5 | |||||||||
| Total fees and expenses before reimbursements | 1,286 | 450 | 1,105 | |||||||||
| Less reimbursements of fees and expenses: | ||||||||||||
| Miscellaneous fee reimbursements | — | 22 | — | † | ||||||||
| Total reimbursements of fees and expenses | — | 22 | — | † | ||||||||
| Total fees and expenses after reimbursements | 1,286 | 428 | 1,105 | |||||||||
| Net investment income | 9,593 | 2,382 | 7,521 | |||||||||
| Net realized (loss) gain and unrealized (depreciation) appreciation: | ||||||||||||
| Net realized (loss) gain on: | ||||||||||||
| Investments | ||||||||||||
| Unaffiliated issuers | (777 | ) | (603 | ) | 511 | |||||||
| Futures contracts | (54 | ) | (6 | ) | (24 | ) | ||||||
| Swap contracts | — | — | — | |||||||||
| Currency transactions | — | — | — | |||||||||
| (831 | ) | (609 | ) | 487 | ||||||||
| Net unrealized (depreciation) appreciation | ||||||||||||
| Investments | ||||||||||||
| Unaffiliated issuers | (9,822 | ) | (1,694 | ) | (9,301 | ) | ||||||
| Futures contracts | (11 | ) | (16 | ) | 14 | |||||||
| Swap contracts | — | — | — | |||||||||
| Currency translations | — | — | — | |||||||||
| (9,833 | ) | (1,710 | ) | (9,287 | ) | |||||||
| Net realized (loss) gain and unrealized (depreciation) appreciation | (10,664 | ) | (2,319 | ) | (8,800 | ) | ||||||
| Net (decrease) increase in net assets resulting from operations | $ | (1,071 | ) | $ | 63 | $ | (1,279 | ) | ||||
| * | Additional information related to non-U.S. taxes and fees and expenses is included in the notes to financial statements. |
| † | Amount less than one thousand. |
See notes to financial statements
| 82 | Private Client Services Funds |
(dollars in thousands)
| Capital Group | ||||||||||||||||||
| California | Capital Group | |||||||||||||||||
| Short-Term | Capital Group | Capital Group | International | Capital Group | ||||||||||||||
| Municipal Fund | Core Bond Fund | Global Equity Fund | Equity Fund | U.S. Equity Fund | ||||||||||||||
| $ | — | $ | — | $ | 11,519 | $ | 35,534 | $ | 4,250 | |||||||||
| 1,883 | 10,444 | 529 | 2,657 | 157 | ||||||||||||||
| 1,883 | 10,444 | 12,048 | 38,191 | 4,407 | ||||||||||||||
| 298 | 1,105 | 3,855 | 10,509 | 1,001 | ||||||||||||||
| 3 | 3 | — | — | — | ||||||||||||||
| 7 | 37 | — | — | — | ||||||||||||||
| 29 | 29 | 29 | 28 | 23 | ||||||||||||||
| 32 | 34 | 11 | 11 | 6 | ||||||||||||||
| 1 | 11 | — | — | — | ||||||||||||||
| — | 14 | 4 | 5 | 3 | ||||||||||||||
| 370 | 1,233 | 3,899 | 10,553 | 1,033 | ||||||||||||||
| 12 | — | 44 | 44 | 32 | ||||||||||||||
| 12 | — | 44 | 44 | 32 | ||||||||||||||
| 358 | 1,233 | 3,855 | 10,509 | 1,001 | ||||||||||||||
| 1,525 | 9,211 | 8,193 | 27,682 | 3,406 | ||||||||||||||
| (196 | ) | (1,639 | ) | 27,531 | 66,629 | 15,415 | ||||||||||||
| (16 | ) | (45 | ) | — | — | — | ||||||||||||
| — | 141 | — | — | — | ||||||||||||||
| — | — | (24 | ) | 527 | (1 | ) | ||||||||||||
| (212 | ) | (1,543 | ) | 27,507 | 67,156 | 15,414 | ||||||||||||
| (1,502 | ) | (12,276 | ) | (34,426 | ) | (189,418 | ) | (6,334 | ) | |||||||||
| 3 | — | — | — | — | ||||||||||||||
| — | (91 | ) | — | — | — | |||||||||||||
| — | — | (6 | ) | (56 | ) | — | ||||||||||||
| (1,499 | ) | (12,367 | ) | (34,432 | ) | (189,474 | ) | (6,334 | ) | |||||||||
| (1,711 | ) | (13,910 | ) | (6,925 | ) | (122,318 | ) | 9,080 | ||||||||||
| $ | (186 | ) | $ | (4,699 | ) | $ | 1,268 | $ | (94,636 | ) | $ | 12,486 | ||||||
| Private Client Services Funds | 83 |
Statements of changes in net assets
| Capital Group | ||||||||||||||||||||||||
| Capital Group | Capital Group | California | ||||||||||||||||||||||
| Core Municipal | Short-Term | Core Municipal | ||||||||||||||||||||||
| Fund | Municipal Fund | Fund | ||||||||||||||||||||||
| Year ended October 31 | Year ended October 31 | Year ended October 31 | ||||||||||||||||||||||
| 2018 | 2017 | 2018 | 2017 | 2018 | 2017 | |||||||||||||||||||
| Operations: | ||||||||||||||||||||||||
| Net investment income | $ | 9,593 | $ | 8,299 | $ | 2,382 | $ | 2,242 | $ | 7,521 | $ | 6,544 | ||||||||||||
| Net realized (loss) gain | (831 | ) | 940 | (609 | ) | (240 | ) | 487 | 396 | |||||||||||||||
| Net unrealized (depreciation) appreciation | (9,833 | ) | (3,877 | ) | (1,710 | ) | (274 | ) | (9,287 | ) | (3,915 | ) | ||||||||||||
| Net (decrease) increase in net assets resulting from operations | (1,071 | ) | 5,362 | 63 | 1,728 | (1,279 | ) | 3,025 | ||||||||||||||||
| Distributions paid to shareholders* | (10,407 | ) | (2,344 | ) | (7,873 | ) | ||||||||||||||||||
| Dividends from net investment income | (8,282 | ) | (2,242 | ) | (6,542 | ) | ||||||||||||||||||
| Distributions from net realized gain on investments | (144 | ) | (32 | ) | (284 | ) | ||||||||||||||||||
| Total dividends and distributions paid to shareholders | (8,426 | ) | (2,274 | ) | (6,826 | ) | ||||||||||||||||||
| Net capital share transactions | 43,071 | 40,004 | (9,849 | ) | (28,231 | ) | 73,017 | 55,632 | ||||||||||||||||
| Total increase (decrease) in net assets | 31,593 | 36,940 | (12,130 | ) | (28,777 | ) | 63,865 | 51,831 | ||||||||||||||||
| Net assets: | ||||||||||||||||||||||||
| Beginning of year | 442,330 | 405,390 | 149,817 | 178,594 | 388,000 | 336,169 | ||||||||||||||||||
| End of year | $ | 473,923 | $ | 442,330 | $ | 137,687 | $ | 149,817 | $ | 451,865 | $ | 388,000 | ||||||||||||
| * | Current year amounts reflect current presentation under new accounting standards. |
See notes to financial statements
| 84 | Private Client Services Funds |
(dollars in thousands)
| Capital Group | ||||||||||||||||||||||||||||||||||||||
| California | Capital Group | |||||||||||||||||||||||||||||||||||||
| Short-Term | Capital Group | Capital Group | International | Capital Group | ||||||||||||||||||||||||||||||||||
| Municipal Fund | Core Bond Fund | Global Equity Fund | Equity Fund | U.S. Equity Fund | ||||||||||||||||||||||||||||||||||
| Year ended October 31 | Year ended October 31 | Year ended October 31 | Year ended October 31 | Year ended October 31 | ||||||||||||||||||||||||||||||||||
| 2018 | 2017 | 2018 | 2017 | 2018 | 2017 | 2018 | 2017 | 2018 | 2017 | |||||||||||||||||||||||||||||
| $ | 1,525 | $ | 1,292 | $ | 9,211 | $ | 6,002 | $ | 8,193 | $ | 7,917 | $ | 27,682 | $ | 23,016 | $ | 3,406 | $ | 3,451 | |||||||||||||||||||
| (212 | ) | 113 | (1,543 | ) | (677 | ) | 27,507 | 21,817 | 67,156 | 15,859 | 15,414 | 11,282 | ||||||||||||||||||||||||||
| (1,499 | ) | (296 | ) | (12,367 | ) | (3,359 | ) | (34,432 | ) | 88,351 | (189,474 | ) | 260,319 | (6,334 | ) | 31,565 | ||||||||||||||||||||||
| (186 | ) | 1,109 | (4,699 | ) | 1,966 | 1,268 | 118,085 | (94,636 | ) | 299,194 | 12,486 | 46,298 | ||||||||||||||||||||||||||
| (1,566 | ) | (9,145 | ) | (27,810 | ) | (22,396 | ) | (13,578 | ) | |||||||||||||||||||||||||||||
| (1,292 | ) | (6,147 | ) | (7,255 | ) | (19,754 | ) | (3,244 | ) | |||||||||||||||||||||||||||||
| (52 | ) | (1,618 | ) | — | — | (8,959 | ) | |||||||||||||||||||||||||||||||
| (1,344 | ) | (7,765 | ) | (7,255 | ) | (19,754 | ) | (12,203 | ) | |||||||||||||||||||||||||||||
| 10,697 | 2,211 | 43,554 | 69,985 | 22,223 | (21,188 | ) | (305,033 | ) | (60,784 | ) | (11,270 | ) | (8,035 | ) | ||||||||||||||||||||||||
| 8,945 | 1,976 | 29,710 | 64,186 | (4,319 | ) | 89,642 | (422,065 | ) | 218,656 | (12,362 | ) | 26,060 | ||||||||||||||||||||||||||
| 119,826 | 117,850 | 416,471 | 352,285 | 571,239 | 481,597 | 1,584,243 | 1,365,587 | 235,720 | 209,660 | |||||||||||||||||||||||||||||
| $ | 128,771 | $ | 119,826 | $ | 446,181 | $ | 416,471 | $ | 566,920 | $ | 571,239 | $ | 1,162,178 | $ | 1,584,243 | $ | 223,358 | $ | 235,720 | |||||||||||||||||||
| Private Client Services Funds | 85 |
Notes to financial statements
1. Organization
Capital Group Private Client Services Funds (the “Trust”) is registered under the Investment Company Act of 1940 as an open-end, diversified management investment company. The Trust has five fixed income funds (Capital Group Core Municipal Fund, Capital Group Short-Term Municipal Fund, Capital Group California Core Municipal Fund, Capital Group California Short-Term Municipal Fund and Capital Group Core Bond Fund) and three equity funds (Capital Group Global Equity Fund, Capital Group International Equity Fund and Capital Group U.S. Equity Fund) (each a “fund,” collectively the “funds”).
Capital Group Core Municipal Fund seeks to provide current income exempt from federal income tax and to preserve capital. Capital Group Short-Term Municipal Fund seeks to preserve capital and secondarily to provide current income exempt from federal income tax. Capital Group California Core Municipal Fund seeks to provide current income exempt from federal and California income taxes and to preserve capital. Capital Group California Short-Term Municipal Fund seeks to preserve capital and secondarily to provide current income exempt from federal and California income taxes. Capital Group Core Bond Fund seeks to provide current income and to preserve capital. Capital Group Global Equity Fund, Capital Group International Equity Fund and Capital Group U.S. Equity Fund seek to provide prudent growth of capital and conservation of principal.
2. Significant accounting policies
Each fund is an investment company that applies the accounting and reporting guidance issued in Topic 946 by the U.S. Financial Accounting Standards Board. Each fund’s financial statements have been prepared to comply with U.S. generally accepted accounting principles (“U.S. GAAP”). These principles require management to make estimates and assumptions that affect reported amounts and disclosures. Subsequent events, if any, have been evaluated through the date of issuance in the preparation of the financial statements. The funds follow the significant accounting policies described in this section, as well as the valuation policies described in the next section on valuation.
Security transactions and related investment income — Security transactions are recorded by the funds as of the date the trades are executed with brokers. Realized gains and losses from security transactions are determined based on the specific identified cost of the securities. In the event a security is purchased with a delayed payment date, the funds will segregate liquid assets sufficient to meet their payment obligations. Dividend income is recognized on the ex-dividend date and interest income is recognized on an accrual basis. Market discounts, premiums and original issue discounts on fixed-income securities are amortized daily over the expected life of the security.
Dividends and distributions to shareholders — Dividend and distributions paid to shareholders are recorded on the ex-dividend date.
Currency translation — Assets and liabilities, including investment securities, denominated in currencies other than U.S. dollars are translated into U.S. dollars at the exchange rates supplied by one or more pricing vendors on the valuation date. Purchases and sales of investment securities and income and expenses are translated into U.S. dollars at the exchange rates on the dates of such transactions. The effects of changes in exchange rates on investment securities are included with the net realized gain or loss and net unrealized appreciation or depreciation on investments in the funds’ statements of operations. The realized gain or loss and unrealized appreciation or depreciation resulting from all other transactions denominated in currencies other than U.S. dollars are disclosed separately.
3. Valuation disclosures
Capital Guardian Trust Company (“CGTC”), the funds’ investment adviser, values each fund’s investments at fair value as defined by accounting principles generally accepted in the United States of America. The net asset value each fund is generally determined as of approximately 4:00 p.m. New York time each day the New York Stock Exchange is open.
Methods and inputs — The funds’ investment adviser uses the following methods and inputs to establish the fair value of each fund’s assets and liabilities. Use of particular methods and inputs may vary over time based on availability and relevance as market and economic conditions evolve.
| 86 | Private Client Services Funds |
Equity securities are generally valued at the official closing price of, or the last reported sale price on, the exchange or market on which such securities are traded, as of the close of business on the day the securities are being valued or, lacking any sales, at the last available bid price. Prices for each security are taken from the principal exchange or market on which the security trades.
Fixed-income securities, including short-term securities, are generally valued at prices obtained from one or more pricing vendors. Vendors value such securities based on one or more of the inputs described in the following table. The table provides examples of inputs that are commonly relevant for valuing particular classes of fixed-income securities in which the funds are authorized to invest. However, these classifications are not exclusive, and any of the inputs may be used to value any other class of fixed-income security.
| Fixed-income class | Examples of standard inputs | |
| All | Benchmark yields, transactions, bids, offers, quotations from dealers and trading systems, new issues, spreads and other relationships observed in the markets among comparable securities; and proprietary pricing models such as yield measures calculated using factors such as cash flows, financial or collateral performance and other reference data (collectively referred to as “standard inputs”) | |
| Corporate bonds & notes; convertible securities | Standard inputs and underlying equity of the issuer | |
| Bonds & notes of governments & government agencies | Standard inputs and interest rate volatilities | |
| Mortgage-backed; asset-backed obligations | Standard inputs and cash flows, prepayment information, default rates, delinquency and loss assumptions, collateral characteristics, credit enhancements and specific deal information | |
| Municipal securities | Standard inputs and, for certain distressed securities, cash flows or liquidation values using a net present value calculation based on inputs that include, but are not limited to, financial statements and debt contracts |
When the funds’ investment adviser deems it appropriate to do so (such as when vendor prices are unavailable or deemed to be not representative), fixed-income securities will be valued in good faith at the mean quoted bid and ask prices that are reasonably and timely available (or bid prices, if ask prices are not available) or at prices for securities of comparable maturity, quality and type. Some securities may be valued based on their effective maturity or average life, which may be shorter than the stated maturity.
Securities with both fixed-income and equity characteristics, or equity securities traded principally among fixed-income dealers, are generally valued in the manner described for either equity or fixed-income securities, depending on which method is deemed most appropriate by the funds’ investment adviser. Exchange-traded futures are generally valued at the official settlement price of, or the last reported sale price on, the exchange or market on which such instruments are traded, as of the close of business on the day the futures are being valued or, lacking any sales, at the last available bid price. Prices for each future are taken from the exchange or market on which the security trades. Interest rate swaps are generally valued by pricing vendors based on market inputs that include the index and term of index, reset frequency, payer/receiver, currency and pay frequency.
Securities and other assets for which representative market quotations are not readily available or are considered unreliable by the funds’ investment adviser are fair valued as determined in good faith under fair valuation guidelines adopted by authority of the funds’ board of trustees as further described. The investment adviser follows fair valuation guidelines, consistent with U.S. Securities and Exchange Commission rules and guidance, to consider relevant principles and factors when making fair value determinations. The investment adviser considers relevant indications of value that are reasonably and timely available to it in determining the fair value to be assigned to a particular security, such as the type and cost of the security; contractual or legal restrictions on resale of the security; relevant financial or business developments of the issuer; actively traded similar or related securities; conversion or exchange rights on the security; related corporate actions; significant events occurring after the close of trading in the security; and changes in overall market conditions. In addition, the closing prices of equity securities that trade in markets outside U.S. time zones may be adjusted to reflect significant events that occur after the close of local trading but before the net asset value of each of the fund is determined. Fair valuations and valuations of investments that are not actively trading involve judgment and may differ materially from valuations that would have been used had greater market activity occurred.
Processes and structure — The funds’ board of trustees has delegated authority to the funds’ investment adviser to make fair value determinations, subject to board oversight. The investment adviser has established a Joint Fair Valuation Committee (the “Fair Valuation Committee”) to administer, implement and oversee the fair valuation process, and to make fair value decisions. The Fair Valuation Committee regularly reviews its own fair value decisions, as well as decisions made under its standing instructions to the investment
| Private Client Services Funds | 87 |
adviser’s valuation teams. The Fair Valuation Committee reviews changes in fair value measurements from period to period and may, as deemed appropriate, update the fair valuation guidelines to better reflect the results of back testing and address new or evolving issues. The Fair Valuation Committee reports any changes to the fair valuation guidelines to the board of trustees. The funds’ board and audit committee also regularly review reports that describe fair value determinations and methods.
The funds’ investment adviser has also established a Fixed-Income Pricing Review Group to administer and oversee the fixed-income valuation process, including the use of fixed-income pricing vendors. This group regularly reviews pricing vendor information and market data. Pricing decisions, processes and controls over security valuation are also subject to additional internal reviews, including an annual control self-evaluation program facilitated by the investment adviser’s compliance group.
Classifications — The funds’ investment adviser classifies each fund’s assets and liabilities into three levels based on the inputs used to value the assets or liabilities. Level 1 values are based on quoted prices in active markets for identical securities. Level 2 values are based on significant observable market inputs, such as quoted prices for similar securities and quoted prices in inactive markets. Certain securities trading outside the U.S. may transfer between Level 1 and Level 2 due to valuation adjustments resulting from significant market movements following the close of local trading. Level 3 values are based on significant unobservable inputs that reflect the investment adviser’s determination of assumptions that market participants might reasonably use in valuing the securities. The valuation levels are not necessarily an indication of the risk or liquidity associated with the underlying investment. For example, U.S. government securities are reflected as Level 2 because the inputs used to determine fair value may not always be quoted prices in an active market. The following tables present the funds’ valuation levels as of October 31, 2018 (dollars in thousands):
Capital Group Core Municipal Fund
| Investment securities | ||||||||||||||||
| Level 1 | Level 2 | Level 3 | Total | |||||||||||||
| Assets: | ||||||||||||||||
| Bonds, notes & other debt instruments: | ||||||||||||||||
| Municipals | $ | — | $ | 431,670 | $ | — | $ | 431,670 | ||||||||
| Short-term securities | — | 44,125 | — | 44,125 | ||||||||||||
| Total | $ | — | $ | 475,795 | $ | — | $ | 475,795 | ||||||||
| Other investments* | ||||||||||||||||
| Level 1 | Level 2 | Level 3 | Total | |||||||||||||
| Assets: | ||||||||||||||||
| Unrealized appreciation on futures contracts | $ | 18 | $ | — | $ | — | $ | 18 | ||||||||
| Liabilities: | ||||||||||||||||
| Unrealized depreciation on futures contracts | (29 | ) | — | — | (29 | ) | ||||||||||
| Total | $ | (11 | ) | $ | — | $ | — | $ | (11 | ) | ||||||
| * | Futures contracts are not included in the investment portfolio. |
Capital Group Short-Term Municipal Fund
| Investment securities | ||||||||||||||||
| Level 1 | Level 2 | Level 3 | Total | |||||||||||||
| Assets: | ||||||||||||||||
| Bonds, notes & other debt instruments: | ||||||||||||||||
| Municipals | $ | — | $ | 125,812 | $ | — | $ | 125,812 | ||||||||
| Short-term securities | — | 13,658 | — | 13,658 | ||||||||||||
| Total | $ | — | $ | 139,470 | $ | — | $ | 139,470 | ||||||||
| 88 | Private Client Services Funds |
| Other investments* | ||||||||||||||||
| Level 1 | Level 2 | Level 3 | Total | |||||||||||||
| Assets: | ||||||||||||||||
| Unrealized appreciation on futures contracts | $ | 3 | $ | — | $ | — | $ | 3 | ||||||||
| Liabilities: | ||||||||||||||||
| Unrealized depreciation on futures contracts | (19 | ) | — | — | (19 | ) | ||||||||||
| Total | $ | (16 | ) | $ | — | $ | — | $ | (16 | ) | ||||||
| * | Futures contracts are not included in the investment portfolio. |
Capital Group California Core Municipal Fund
| Investment securities | ||||||||||||||||
| Level 1 | Level 2 | Level 3 | Total | |||||||||||||
| Assets: | ||||||||||||||||
| Bonds, notes & other debt instruments: | ||||||||||||||||
| Municipals | $ | — | $ | 369,456 | $ | — | $ | 369,456 | ||||||||
| Short-term securities | — | 80,009 | — | 80,009 | ||||||||||||
| Total | $ | — | $ | 449,465 | $ | — | $ | 449,465 | ||||||||
| Other investments* | ||||||||||||||||
| Level 1 | Level 2 | Level 3 | Total | |||||||||||||
| Assets: | ||||||||||||||||
| Unrealized appreciation on futures contracts | $ | 14 | $ | — | $ | — | $ | 14 | ||||||||
| * | Futures contracts are not included in the investment portfolio. |
Capital Group California Short-Term Municipal Fund
| Investment securities | ||||||||||||||||
| Level 1 | Level 2 | Level 3 | Total | |||||||||||||
| Assets: | ||||||||||||||||
| Bonds, notes & other debt instruments: | ||||||||||||||||
| Municipals | $ | — | $ | 111,328 | $ | — | $ | 111,328 | ||||||||
| Short-term securities | — | 16,424 | — | 16,424 | ||||||||||||
| Total | $ | — | $ | 127,752 | $ | — | $ | 127,752 | ||||||||
| Other investments* | ||||||||||||||||
| Level 1 | Level 2 | Level 3 | Total | |||||||||||||
| Assets: | ||||||||||||||||
| Unrealized appreciation on futures contracts | $ | 3 | $ | — | $ | — | $ | 3 | ||||||||
| * | Futures contracts are not included in the investment portfolio. |
Capital Group Core Bond Fund
At October 31, 2018, all of the fund’s investment securities were classified as Level 2.
| Private Client Services Funds | 89 |
Capital Group Global Equity Fund
| Investment securities | ||||||||||||||||
| Level 1 | Level 2 | Level 3 | Total | |||||||||||||
| Assets: | ||||||||||||||||
| Common stocks: | ||||||||||||||||
| Information technology | $ | 106,594 | $ | — | $ | — | $ | 106,594 | ||||||||
| Financials | 88,096 | — | — | 88,096 | ||||||||||||
| Industrials | 68,042 | — | — | 68,042 | ||||||||||||
| Consumer staples | 54,844 | — | — | 54,844 | ||||||||||||
| Health care | 48,019 | — | — | 48,019 | ||||||||||||
| Communication services | 37,875 | — | — | 37,875 | ||||||||||||
| Consumer discretionary | 37,118 | 640 | — | 37,758 | ||||||||||||
| Energy | 28,962 | — | — | 28,962 | ||||||||||||
| Materials | 14,795 | — | — | 14,795 | ||||||||||||
| Real estate | 13,211 | — | — | 13,211 | ||||||||||||
| Utilities | 12,756 | — | — | 12,756 | ||||||||||||
| Short-term securities | — | 55,278 | — | 55,278 | ||||||||||||
| Total | $ | 510,312 | $ | 55,918 | $ | — | $ | 566,230 | ||||||||
Capital Group International Equity Fund
| Investment securities | ||||||||||||||||
| Level 1 | Level 2 | Level 3 | Total | |||||||||||||
| Assets: | ||||||||||||||||
| Common stocks: | ||||||||||||||||
| Financials | $ | 155,095 | $ | — | $ | — | $ | 155,095 | ||||||||
| Industrials | 152,636 | — | — | 152,636 | ||||||||||||
| Consumer staples | 140,657 | — | — | 140,657 | ||||||||||||
| Information technology | 119,627 | — | — | 119,627 | ||||||||||||
| Health care | 106,323 | — | — | 106,323 | ||||||||||||
| Consumer discretionary | 71,784 | — | — | 71,784 | ||||||||||||
| Communication services | 53,134 | — | — | 53,134 | ||||||||||||
| Materials | 34,308 | — | — | 34,308 | ||||||||||||
| Energy | 26,701 | — | — | 26,701 | ||||||||||||
| Utilities | 18,859 | — | — | 18,859 | ||||||||||||
| Real estate | 8,628 | — | — | 8,628 | ||||||||||||
| Short-term securities | — | 276,451 | — | 276,451 | ||||||||||||
| Total | $ | 887,752 | $ | 276,451 | $ | — | $ | 1,164,203 | ||||||||
Capital Group U.S. Equity Fund
| Investment securities | ||||||||||||||||
| Level 1 | Level 2 | Level 3 | Total | |||||||||||||
| Assets: | ||||||||||||||||
| Common stocks: | ||||||||||||||||
| Information technology | $ | 40,736 | $ | — | $ | — | $ | 40,736 | ||||||||
| Financials | 37,659 | — | — | 37,659 | ||||||||||||
| Industrials | 28,518 | — | — | 28,518 | ||||||||||||
| Health care | 26,877 | — | — | 26,877 | ||||||||||||
| Consumer staples | 21,673 | — | — | 21,673 | ||||||||||||
| Energy | 16,321 | — | — | 16,321 | ||||||||||||
| Communication services | 13,877 | — | — | 13,877 | ||||||||||||
| Consumer discretionary | 11,708 | — | — | 11,708 | ||||||||||||
| Real estate | 9,039 | — | — | 9,039 | ||||||||||||
| Utilities | 3,903 | — | — | 3,903 | ||||||||||||
| Materials | 2,771 | — | — | 2,771 | ||||||||||||
| Short-term securities | — | 9,896 | — | 9,896 | ||||||||||||
| Total | $ | 213,082 | $ | 9,896 | $ | — | $ | 222,978 | ||||||||
| 90 | Private Client Services Funds |
4. Risk factors
Investing in the funds may involve certain risks including, but not limited to, those described below.
Market conditions — The prices of, and the income generated by, the securities held by the fund may decline — sometimes rapidly or unpredictably – due to various factors, including events or conditions affecting the general economy or particular industries; overall market changes; local, regional or global political, social or economic instability; governmental, governmental agency or central bank responses to economic conditions; and currency exchange rate, interest rate and commodity price fluctuations.
Issuer risks — The prices of, and the income generated by, securities held by the fund may decline in response to various factors directly related to the issuers of such securities, including reduced demand for an issuer’s goods or services, poor management performance, major litigation against the issuer, changes in government regulations affecting the issuer or its competitive environment and strategic initiatives such as mergers, acquisitions or dispositions and the market response to any such initiatives.
Investing in debt instruments — The prices of, and the income generated by, bonds and other debt securities held by the fund may be affected by changing interest rates and by changes in the effective maturities and credit ratings of these securities.
Rising interest rates will generally cause the prices of bonds and other debt securities to fall. A general rise in interest rates may cause investors to sell debt securities on a large scale, which could also adversely affect the price and liquidity of debt securities and could also result in increased redemptions from the fund. Falling interest rates may cause an issuer to redeem, call or refinance a debt security before its stated maturity, which may result in the fund failing to recoup the full amount of its initial investment and having to reinvest the proceeds in lower yielding securities. Longer maturity debt securities generally have greater sensitivity to changes in interest rates and may be subject to greater price fluctuations than shorter maturity debt securities.
Bonds and other debt securities are also subject to credit risk, which is the possibility that the credit strength of an issuer or guarantor will weaken or be perceived to be weaker, and/or an issuer of a debt security will fail to make timely payments of principal or interest and the security will go into default. A downgrade or default affecting any of the fund’s securities could cause the value of the fund’s shares to decrease. Credit risk is gauged, in part, by the credit ratings of the debt securities in which the fund invests. However, ratings are only the opinions of the rating agencies issuing them and are not guarantees as to credit quality or an evaluation of market risk. The fund’s investment adviser relies on its own credit analysts to research issuers and issues in seeking to assess credit and default risks.
Investing in growth-oriented stocks — Growth-oriented common stocks and other equity-type securities (such as preferred stocks, convertible preferred stocks and convertible bonds) may involve larger price swings and greater potential for loss than other types of investments.
Investing in income-oriented stocks — The value of the fund’s securities and income provided by the fund may be reduced by changes in the dividend policies of, and the capital resources available for dividend payments at, the companies in which the fund invests.
Credit and liquidity support — Changes in the credit quality of banks and financial institutions providing credit and liquidity support features with respect to securities held by the fund could cause the values of these securities to decline.
Investing in lower rated debt instruments — Lower rated bonds and other lower rated debt securities generally have higher rates of interest and involve greater risk of default or price declines due to changes in the issuer’s creditworthiness than those of higher quality debt securities. The market prices of these securities may fluctuate more than the prices of higher quality debt securities and may decline significantly in periods of general economic difficulty.
Liquidity risk — Certain fund holdings may be or become difficult or impossible to sell, particularly during times of market turmoil. Illiquidity may result from the lack of an active market for a holding, legal or contractual restrictions on resale, or the reduced number and capacity of market participants to make a market in such holding. Market prices for less liquid or illiquid holdings may be volatile, and reduced liquidity may have an adverse impact on the market price of such holdings. Additionally, the sale of less liquid or illiquid holdings may involve substantial delays (including delays in settlement) and additional costs and the fund may be unable to sell such holdings when necessary to meet its liquidity needs or may be forced to sell at a loss.
Investing in similar municipal bonds — Investing significantly in municipal obligations of multiple issuers in the same state or backed by revenues of similar types of projects or industries may make the fund more susceptible to certain economic, political or regulatory occurrences. As a result, the potential for fluctuations in the fund’s share price may increase.
| Private Client Services Funds | 91 |
Investing in municipal bonds of issuers within the state of California — Because Capital Group California Core Municipal Fund and Capital Group California Short-Term Municipal Fund invest primarily in securities of issuers within the state of California, these funds are more susceptible to factors adversely affecting issuers of California securities than a comparable municipal bond mutual fund that does not concentrate its investments in a single state. For example, in the past, California voters have passed amendments to the state’s constitution and other measures that limit the taxing and spending authority of California governmental entities, and future voter initiatives may adversely affect California municipal bonds.
Investing in mortgage-related and other asset-backed securities — Mortgage-related securities, such as mortgage-backed securities, and other asset-backed securities, include debt obligations that represent interests in pools of mortgages or other income-bearing assets, such as consumer loans or receivables. Such securities often involve risks that are different from or more acute than the risks associated with investing in other types of debt securities. Mortgage-backed and other asset-backed securities are subject to changes in the payment patterns of borrowers of the underlying debt, potentially increasing the volatility of the securities and the fund’s net asset value. When interest rates fall, borrowers are more likely to refinance or prepay their debt before its stated maturity. This may result in the fund having to reinvest the proceeds in lower yielding securities, effectively reducing the fund’s income. Conversely, if interest rates rise and borrowers repay their debt more slowly than expected, the time in which the mortgage-backed and other asset-backed securities are paid off could be extended, reducing the fund’s cash available for reinvestment in higher yielding securities. Mortgage-backed securities are also subject to the risk that underlying borrowers will be unable to meet their obligations and the value of property that secures the mortgages may decline in value and be insufficient, upon foreclosure, to repay the associated loans. Investments in asset-backed securities are subject to similar risks.
Investing in securities backed by the U.S. government — Securities backed by the U.S. Treasury or the full faith and credit of the U.S. government are guaranteed only as to the timely payment of interest and principal when held to maturity. Accordingly, the current market values for these securities will fluctuate with changes in interest rates and the credit rating of the U.S. government. Securities issued by government-sponsored entities and federal agencies and instrumentalities that are not backed by the full faith and credit of the U.S. government are neither issued nor guaranteed by the U.S. government.
Investing outside the U.S. — Securities of issuers domiciled outside the U.S, or with significant operations or revenues outside the U.S., may lose value because of adverse political, social, economic or market developments (including social instability, regional conflicts, terrorism and war) in the countries or regions in which the issuers operate or generate revenue. These securities may also lose value due to changes in foreign currency exchange rates against the U.S. dollar and/or currencies of other countries. Issuers of these securities may be more susceptible to actions of foreign governments, such as nationalization, currency blockage or the imposition of price controls or punitive taxes, each of which could adversely impact the value of these securities. Securities markets in certain countries may be more volatile and/or less liquid than those in the U.S. Investments outside the U.S. may also be subject to different accounting practices and different regulatory, legal and reporting standards and practices, and may be more difficult to value, than those in the U.S. In addition, the value of investments outside the U.S. may be reduced by foreign taxes, including foreign withholding taxes on interest and dividends. Further, there may be increased risks of delayed settlement of securities purchased or sold by the fund. The risks of investing outside the U.S. may be heightened in connection with investments in emerging markets.
Investing in derivatives — The use of derivatives involves a variety of risks, which may be different from, or greater than, the risks associated with investing in traditional securities, such as stocks and bonds. Changes in the value of a derivative may not correlate perfectly with, and may be more sensitive to market events than, the underlying asset, rate or index, and a derivative instrument may expose the fund to losses in excess of its initial investment. Derivatives may be difficult to value, difficult for the fund to buy or sell at an opportune time or price and difficult to terminate or otherwise offset. The fund’s use of derivatives may result in losses to the fund, and investing in derivatives may reduce the fund’s returns and increase the fund’s price volatility. The fund’s counterparty to a derivative transaction (including, if applicable, the fund’s clearing broker, the derivatives exchange or the clearinghouse) may be unable or unwilling to honor its financial obligations in respect of the transaction.
Management — The investment adviser to the fund actively manages the fund’s investments. Consequently, the fund is subject to the risk that the methods and analyses, including models, tools and data, employed by the investment adviser in this process may be flawed or incorrect and may not produce the desired results. This could cause the fund to lose value or its investment results to lag relevant benchmarks or other funds with similar objectives.
| 92 | Private Client Services Funds |
5. Certain investment techniques
Mortgage dollar rolls — Some of the funds have entered into mortgage dollar roll transactions in which the fund sells a mortgage-backed security to a counterparty and simultaneously enters into an agreement with the same counterparty to buy back a similar security on a specific future date at a predetermined price. Mortgage dollar rolls are accounted for as purchase and sale transactions, which may increase the funds’ portfolio turnover rates.
Futures contracts — Capital Group Core Municipal Fund, Capital Group Short-Term Municipal Fund, Capital Group California Core Municipal Fund, Capital Group California Short-Term Municipal Fund and Capital Group Core Bond Fund have entered into futures contracts, which provide for the future sale by one party and purchase by another party of a specified amount of a specific financial instrument for a specified price, date, time and place designated at the time the contract is made. Futures contracts are used to strategically manage portfolio volatility and downside equity risk.
Upon entering into futures contracts, and to maintain the fund’s open positions in futures contracts, the fund is required to deposit with a futures broker, or FCM, in a segregated account in the name of the FCM an amount of cash, U.S. government securities or other liquid securities, known as initial margin. The margin required for a particular futures contract is set by the exchange on which the contract is traded to serve as collateral, and may be significantly modified from time to time by the exchange during the term of the contract. Securities deposited as initial margin, if any, are disclosed in the investment portfolio and cash deposited as initial margin, if any, is reflected as restricted cash pledged for futures contracts in the fund’s statement of assets and liabilities.
On a daily basis, each fund pays or receives variation margin based on the increase or decrease in the value of the futures contracts and records variation margin on futures contracts in each fund’s statement of assets and liabilities. In addition, each fund segregates liquid assets equivalent to the fund’s outstanding obligations under the contract in excess of the initial margin and variation margin, if any. Futures contracts may involve a risk of loss in excess of the variation margin shown on each fund’s statement of assets and liabilities. Each fund records realized gains or losses at the time the futures contract is closed or expires. Net realized gains or losses and net unrealized appreciation or depreciation from futures contracts are recorded in each fund’s statement of operations.
Interest rate swaps — Capital Group Core Bond Fund has entered into interest rate swaps, which are agreements to exchange one stream of future interest payments for another based on a specified notional amount. Typically, interest rate swaps exchange a fixed interest rate for a payment that floats relative to a benchmark or vice versa. The series’ investment adviser uses interest rate swaps to manage the interest rate sensitivity of the fund by increasing or decreasing the duration of the fund or a portion of the fund’s portfolio. Risks may arise as a result of the series’ investment adviser incorrectly anticipating changes in interest rates, increased volatility, reduced liquidity and the potential inability of counterparties to meet the terms of their agreements.
Upon entering into an interest rate swap contract, the fund is required to deposit cash, U.S. government securities or other liquid securities, which is known as initial margin. Generally, the initial margin required for a particular interest rate swap is set and held as collateral by the clearinghouse on which the contract is cleared. The amount of initial margin required may be significantly modified from time to time by the clearinghouse during the term of the contract.
On a daily basis, the series’ investment adviser records daily interest accruals related to the exchange of future payments as a receivable and payable in each fund’s statement of assets and liabilities. Each fund also pays or receives a variation margin based on the increase or decrease in the value of the interest rate swaps, including accrued interest, and records variation margin on interest rate swaps in each fund’s statement of assets and liabilities. Each fund records realized gains and losses on both the net accrued interest and any gain or loss recognized at the time the interest rate swap is closed or expires. Net realized gains or losses, as well as any net unrealized appreciation or depreciation, from interest rate swaps are recorded in each fund’s statement of operations.
| Private Client Services Funds | 93 |
The following table presents the average month-end notional amounts of futures contracts and interest rate swaps while held for each fund (dollars in thousands):
| Futures | Interest Rate Swaps | |||||
| Capital Group Core Municipal Fund | $29,833 | Not applicable | ||||
| Capital Group Short-Term Municipal Fund | 14,900 | Not applicable | ||||
| Capital Group California Core Municipal Fund | 21,667 | Not applicable | ||||
| Capital Group California Short-Term Municipal | 3,750 | Not applicable | ||||
| Capital Group Core Bond Fund | 38,400 | $110,023 | ||||
The following tables present the financial statement impacts resulting from the funds’ use of futures contracts and/or interest rate swaps as of, or for the year ended, October 31, 2018 (dollars in thousands):
Capital Group Core Municipal Fund
| Assets | Liabilities | |||||||||||||
| Contracts | Risk type | Location on statement of assets and liabilities | Value | Location on statement of assets and liabilities | Value | |||||||||
| Futures | Interest | Unrealized appreciation* | $ | 18 | Unrealized depreciation* | $ | 29 | |||||||
| Net realized loss | Net unrealized depreciation | |||||||||||||
| Contracts | Risk type | Location on statement of operations | Value | Location on statement of operations | Value | |||||||||
| Futures | Interest | Net realized loss on futures contracts | $ | (54 | ) | Net unrealized depreciation on futures contracts | $ | (11 | ) | |||||
| * | Includes cumulative appreciation/depreciation on futures contracts as reported in the applicable table following the fund’s investment portfolio. Only current day’s variation margin is reported within the statement of assets and liabilities. |
Capital Group Short-Term Municipal Fund
| Assets | Liabilities | |||||||||||||
| Contracts | Risk type | Location on statement of assets and liabilities | Value | Location on statement of assets and liabilities | Value | |||||||||
| Futures | Interest | Unrealized appreciation* | $ | 3 | Unrealized depreciation* | $ | 19 | |||||||
| Net realized loss | Net unrealized depreciation | |||||||||||||
| Contracts | Risk type | Location on statement of operations | Value | Location on statement of operations | Value | |||||||||
| Futures | Interest | Net realized loss on futures contracts | $ | (6 | ) | Net unrealized depreciation on futures contracts | $ | (16 | ) | |||||
| * | Includes cumulative appreciation/depreciation on futures contracts as reported in the applicable table following the fund’s investment portfolio. Only current day’s variation margin is reported within the statement of assets and liabilities. |
Capital Group California Core Municipal Fund
| Assets | Liabilities | |||||||||||||
| Contracts | Risk type | Location on statement of assets and liabilities | Value | Location on statement of assets and liabilities | Value | |||||||||
| Futures | Interest | Unrealized appreciation* | $ | 14 | Unrealized depreciation* | $ | — | |||||||
| 94 | Private Client Services Funds |
| Net realized loss | Net unrealized appreciation | |||||||||||||
| Contracts | Risk type | Location on statement of operations | Value | Location on statement of operations | Value | |||||||||
| Futures | Interest | Net realized loss on futures contracts | $ | (24 | ) | Net unrealized appreciation on futures contracts | $ | 14 | ||||||
| * | Includes cumulative appreciation/depreciation on futures contracts as reported in the applicable table following the fund’s investment portfolio. Only current day’s variation margin is reported within the statement of assets and liabilities. |
Capital Group California Short-Term Municipal Fund
| Assets | Liabilities | |||||||||||||
| Contracts | Risk type | Location on statement of assets and liabilities | Value | Location on statement of assets and liabilities | Value | |||||||||
| Futures | Interest | Unrealized appreciation* | $ | 3 | Unrealized depreciation* | $ | — | |||||||
| Net realized loss | Net unrealized appreciation | |||||||||||||
| Contracts | Risk type | Location on statement of operations | Value | Location on statement of operations | Value | |||||||||
| Futures | Interest | Net realized loss on futures contracts | $ | (16 | ) | Net unrealized appreciation on futures contracts | $ | 3 | ||||||
| * | Includes cumulative appreciation/depreciation on futures contracts as reported in the applicable table following the fund’s investment portfolio. Only current day’s variation margin is reported within the statement of assets and liabilities. |
Capital Group Core Bond Fund
| Assets | Liabilities | |||||||||||||
| Contracts | Risk type | Location on statement of assets and liabilities | Value | Location on statement of assets and liabilities | Value | |||||||||
| Swaps | Interest | Unrealized appreciation* | $ | 180 | Unrealized depreciation* | $ | 271 | |||||||
| Net realized (loss) gain | Net unrealized depreciation | |||||||||||||
| Contracts | Risk type | Location on statement of operations | Value | Location on statement of operations | Value | |||||||||
| Futures | Interest | Net realized loss on futures contracts | $ | (45 | ) | Net unrealized appreciation on futures contracts | $ | — | ||||||
| Swaps | Interest | Net realized gain on swap contracts | 141 | Net unrealized depreciation on swap contracts | (91 | ) | ||||||||
| $ | 96 | $ | (91 | ) | ||||||||||
| * | Includes cumulative appreciation/depreciation on interest rate swaps as reported in the applicable table following the fund’s investment portfolio. Only current day’s variation margin is reported within the statement of assets and liabilities. |
Collateral — The funds participate in a collateral program that call for the funds to either receive or pledge highly liquid assets, such as cash or U.S. government securities, as collateral due to their use of futures contracts, interest rate swaps and future delivery contracts. For futures contracts and interest rate swaps, the program calls for the fund to pledge collateral for initial and variation margin by contract. For future delivery contracts, the program calls for the fund to either receive or pledge collateral based on the net gain or loss on unsettled contracts by certain counterparties. The purpose of the collateral is to cover potential losses that could occur in the event that either party cannot meet its contractual obligations. Non-cash collateral pledged by the fund, if any, is disclosed in the fund’s investment portfolio, and cash collateral pledged by the fund, if any, is held in a segregated account with the fund’s custodian, which is reflected as pledged cash in the fund’s statement of assets and liabilities.
| Private Client Services Funds | 95 |
6. Taxation and distributions
Federal income taxation — Each fund complies with the requirements under Subchapter M of the Internal Revenue Code applicable to mutual funds and each intends to distribute substantially all of its net income and net capital gains each year. The funds are not subject to income taxes to the extent taxable income and net capital gains are distributed. Therefore, no federal income tax provision is required.
As of and during the period ended October 31, 2018, none of the funds had a liability for any unrecognized tax benefits. Each fund recognizes interest and penalties, if any, related to unrecognized tax benefits as income tax expense in their respective statements of operations. During the period, none of the funds incurred any significant interest or penalties.
Each fund’s tax returns are not subject to examination by federal, state and, if applicable, non-U.S. tax authorities after the expiration of each jurisdiction’s statute of limitations, which is generally three years after the date of filing but can be extended in certain jurisdictions.
Non-U.S. taxation — Dividend and interest income, if any, are recorded net of non-U.S. taxes paid. The funds may file withholding tax reclaims in certain jurisdictions to recover a portion of amounts previously withheld. As a result of rulings from European courts, the funds filed for additional reclaims related to prior years. These reclaims are recorded when the amount is known and there are no significant uncertainties on collectability. Gains realized by the funds on the sale of securities in certain countries, if any, may be subject to non-U.S. taxes. If applicable, the funds record an estimated deferred tax liability based on unrealized gains to provide for potential non-U.S. taxes payable upon the sale of these securities.
Distributions — Distributions paid to shareholders are based on each fund’s net investment income and net realized gains determined on a tax basis, which may differ from net investment income and net realized gains for financial reporting purposes. These differences are due primarily to different treatment for items such as currency gains and losses; short-term capital gains and losses; capital losses related to sales of certain securities within 30 days of purchase; net capital losses; income on certain investments; amortization of premiums and discounts and cost of investments sold. The fiscal year in which amounts are distributed may differ from the year in which the net investment income and net realized gains are recorded by the funds for financial reporting purposes. The funds may also designate a portion of the amount paid to redeeming shareholders as a distribution for tax purposes.
Additional tax basis disclosures for each fund as of October 31, 2018, are as follows (dollars in thousands):
| Capital | Capital | |||||||||||||||
| Capital | Capital | Group | Group | |||||||||||||
| Group | Group | California | California | |||||||||||||
| Core | Short-Term | Core | Short-Term | |||||||||||||
| Municipal | Municipal | Municipal | Municipal | |||||||||||||
| Fund | Fund | Fund | Fund | |||||||||||||
| Undistributed tax-exempt income | 25 | 29 | 11 | 28 | ||||||||||||
| Undistributed long-term capital gains | — | — | 449 | — | ||||||||||||
| Capital loss carryforward* | (841 | ) | (861 | ) | — | (207 | ) | |||||||||
| Gross unrealized appreciation on investments | 979 | 90 | 1,590 | 47 | ||||||||||||
| Gross unrealized depreciation on investments | (5,912 | ) | (1,406 | ) | (4,181 | ) | (980 | ) | ||||||||
| Net unrealized (depreciation) appreciation on investments | (4,933 | ) | (1,316 | ) | (2,591 | ) | (933 | ) | ||||||||
| Cost of investments | 480,717 | 140,771 | 452,070 | 128,688 | ||||||||||||
| Reclassification from (to) total distributable earnings/accumulated loss to (from) capital paid in on shares of beneficial interest | 10 | — | 57 | (2 | ) | |||||||||||
| 96 | Private Client Services Funds |
| Capital | Capital | Capital | Capital | |||||||||||||
| Group | Group | Group | Group | |||||||||||||
| Core Bond | Global Equity | International | U.S. Equity | |||||||||||||
| Fund | Fund | Equity Fund | Fund | |||||||||||||
| Undistributed ordinary income | $ | 39 | $ | 5,578 | $ | 29,311 | $ | 282 | ||||||||
| Undistributed long-term capital gains | — | 26,584 | — | 14,424 | ||||||||||||
| Capital loss carryforward* | (2,200 | ) | — | (16,445 | ) | — | ||||||||||
| Capital loss carryforward utilized | — | — | 63,420 | — | ||||||||||||
| Gross unrealized appreciation on investments | 285 | 142,259 | 231,513 | 71,718 | ||||||||||||
| Gross unrealized depreciation on investments | (11,796 | ) | (11,852 | ) | (21,328 | ) | (2,916 | ) | ||||||||
| Net unrealized (depreciation) appreciation on investments | (11,511 | ) | 130,407 | 210,185 | 68,802 | |||||||||||
| Cost of investments | 469,767 | 435,823 | 954,018 | 154,176 | ||||||||||||
| Reclassification from (to) total distributable earnings/accumulated loss to (from) capital paid in on shares of beneficial interest | (1 | ) | 2,442 | 1 | 1,327 | |||||||||||
| * | Capital loss carryforwards will be used to offset any capital gains realized by the fund in future years. The fund will not make distributions from capital gains while a capital loss carryforward remains. |
Distributions paid by each fund were characterized for tax purposes as follows (dollars in thousands):
| Year ended October 31, 2018 | ||||||||||||||||
| Long-Term | Total | |||||||||||||||
| Tax-Exempt | Ordinary | Capital | Distributions | |||||||||||||
| Income | Income | Gains | Paid | |||||||||||||
| Capital Group Core Municipal Fund | 9,535 | — | 872 | 10,407 | ||||||||||||
| Capital Group Short-Term Municipal Fund | 2,344 | — | — | 2,344 | ||||||||||||
| Capital Group California Core Municipal Fund | 7,517 | — | 356 | 7,873 | ||||||||||||
| Capital Group California Short-Term Municipal Fund | 1,479 | 32 | 55 | 1,566 | ||||||||||||
| Capital Group Core Bond Fund | — | 9,145 | — | 9,145 | ||||||||||||
| Capital Group Global Equity Fund | — | 7,638 | 20,172 | 27,810 | ||||||||||||
| Capital Group International Equity Fund | — | 22,396 | — | 22,396 | ||||||||||||
| Capital Group U.S. Equity Fund | — | 2,928 | 10,650 | 13,578 | ||||||||||||
| Year ended October 31, 2017 | ||||||||||||||||
| Long-Term | Total | |||||||||||||||
| Tax-Exempt | Ordinary | Capital | Distributions | |||||||||||||
| Income | Income | Gains | Paid | |||||||||||||
| Capital Group Core Municipal Fund | 8,282 | — | 144 | 8,426 | ||||||||||||
| Capital Group Short-Term Municipal Fund | 2,242 | 32 | — | 2,274 | ||||||||||||
| Capital Group California Core Municipal Fund | 6,542 | — | 284 | 6,826 | ||||||||||||
| Capital Group California Short-Term Municipal Fund | 1,292 | — | 52 | 1,344 | ||||||||||||
| Capital Group Core Bond Fund | — | 7,046 | 719 | 7,765 | ||||||||||||
| Capital Group Global Equity Fund | — | 7,255 | — | 7,255 | ||||||||||||
| Capital Group International Equity Fund | — | 19,754 | — | 19,754 | ||||||||||||
| Capital Group U.S. Equity Fund | — | 3,244 | 8,959 | 12,203 | ||||||||||||
| Private Client Services Funds | 97 |
7. Fees and transactions
CGTC serves as investment adviser to the funds and other funds. CGTC is a wholly owned subsidiary of Capital Group International, Inc. Expense limitations have been imposed through January 1, 2019, to limit the funds’ total annual fund operating expenses to the following rates (as a percentage of average daily net assets):
| Fund | Expense Limitation | |||
| Capital Group Core Municipal Fund | 0.30 | % | ||
| Capital Group Short-Term Municipal Fund | 0.30 | |||
| Capital Group California Core Municipal Fund | 0.30 | |||
| Capital Group California Short-Term Municipal Fund | 0.30 | |||
| Capital Group Core Bond Fund | 0.30 | |||
| Capital Group Global Equity Fund | 0.65 | |||
| Capital Group International Equity Fund | 0.65 | |||
| Capital Group U.S. Equity Fund | 0.425 | |||
CGTC does not intend to recoup any reimbursed expenses from a prior year under expense limitations then in effect for the funds.
Investment advisory services — The funds have an investment advisory and service agreement with CGTC that provides for monthly fees accrued daily. The fee for each fixed income fund was 0.25% of the average daily net assets of the fund. For the services it provides to Capital Group Global Equity Fund, Capital Group International Equity Fund and Capital Group U.S. Equity Fund, CGTC receives a unified management fee based on a percentage of the average daily net assets of the funds. The unified management fee for Capital Group Global Equity Fund and Capital Group International Equity Fund was 0.65% of the average daily net assets of each fund. The unified management fee for Capital Group U.S. Equity Fund was 0.425% of the average daily net assets of the fund.
For the equity funds, all managing and operating expenses are paid by CGTC from the unified management fees except brokerage expenses, taxes, interest, fees and expenses of the independent trustees (including legal counsel fees) and extraordinary expenses, such as litigation expenses. These expenses which are not paid by CGTC from the unified management fee are paid by the funds, which are currently reimbursed by the advisor.
Distribution services — American Funds Distributors,® Inc. (the “Distributor”) is the principal underwriter of each fund’s shares. The Distributor does not receive any compensation related to the sale of shares of the funds.
Affiliated officers and trustees — Officers and certain trustees of the Trust are or may be considered to be affiliated with CGTC. No affiliated officers or trustees received any compensation directly from the Trust.
Security transactions with related funds — The funds may purchase from, or sell securities to, other CGTC-managed funds (or accounts managed by certain affiliates of CGTC) under procedures adopted by the funds’ board of trustees. The funds involved in such transactions are considered related by virtue of having a common investment adviser (or affiliated investment advisers), common trustees and/or common officers. When such transactions occur, each transaction is executed at the current market price of the security and no brokerage commissions or fees are paid in accordance with Rule 17a-7 of the 1940 Act.
The following table presents purchase and sales transactions between each fund and related funds as of October 31, 2018 (dollars in thousands):
| Fund | Purchases | Sales | ||||||
| Capital Group Core Municipal Fund | $ | 3,809 | $ | 11,864 | ||||
| Capital Group Short-Term Municipal Fund | 583 | 14,396 | ||||||
| Capital Group California Core Municipal Fund | 4,616 | 8,886 | ||||||
| Capital Group California Short-Term Municipal Fund | 3,928 | 3,214 | ||||||
| Capital Group Core Bond Fund | — | — | ||||||
| Capital Group Global Equity Fund | 3,277 | 13,208 | ||||||
| Capital Group International Equity Fund | 13,032 | 28,865 | ||||||
| Capital Group U.S. Equity Fund | 1,925 | 1,786 | ||||||
| 98 | Private Client Services Funds |
Interfund lending — Pursuant to an exemptive order issued by the SEC, the fund, along with other CGTC-managed funds (or funds managed by certain affiliates of CGTC), may participate in an interfund lending program. The program provides an alternate credit facility that permits the funds to lend or borrow cash for temporary purposes directly to or from one another, subject to the conditions of the exemptive order. The fund did not lend or borrow cash through the interfund lending program at any time during during the year ended October 31, 2018.
| Private Client Services Funds | 99 |
8. Capital share transactions
Capital share transactions in the funds were as follows (dollars and shares in thousands):
| Sales | Reinvestment of distributions | Repurchases | Net increase (decrease) | |||||||||||||||||||||||||||||
| Fund | Amount | Shares | Amount | Shares | Amount | Shares | Amount | Shares | ||||||||||||||||||||||||
| Year ended October 31, 2018 | ||||||||||||||||||||||||||||||||
| Capital Group Core Municipal Fund | $ | 97,527 | 9,471 | $ | 7,627 | 744 | $ | (62,083 | ) | (6,053 | ) | $ | 43,071 | 4,162 | ||||||||||||||||||
| Capital Group Short-Term Municipal Fund | 71,336 | 7,134 | 1,767 | 177 | (82,952 | ) | (8,297 | ) | (9,849 | ) | (986 | ) | ||||||||||||||||||||
| Capital Group California Core Municipal Fund | 125,385 | 12,006 | 5,305 | 508 | (57,673 | ) | (5,514 | ) | 73,017 | 7,000 | ||||||||||||||||||||||
| Capital Group California Short-Term Municipal Fund | 42,212 | 4,174 | 978 | 97 | (32,493 | ) | (3,210 | ) | 10,697 | 1,061 | ||||||||||||||||||||||
| Capital Group Core Bond Fund | 77,015 | 7,723 | 6,963 | 701 | (40,424 | ) | (4,077 | ) | 43,554 | 4,347 | ||||||||||||||||||||||
| Capital Group Global Equity Fund | 67,752 | 4,301 | 22,616 | 1,474 | (68,145 | ) | (4,340 | ) | 22,223 | 1,435 | ||||||||||||||||||||||
| Capital Group International Equity Fund | 1,657,055 | 119,264 | 22,056 | 1,605 | (1,984,144 | ) | (145,012 | ) | (305,033 | ) | (24,143 | ) | ||||||||||||||||||||
| Capital Group U.S. Equity Fund | 18,287 | 799 | 12,222 | 542 | (41,779 | ) | (1,807 | ) | (11,270 | ) | (466 | ) | ||||||||||||||||||||
| Year ended October 31, 2017 | ||||||||||||||||||||||||||||||||
| Capital Group Core Municipal Fund | $ | 101,192 | 9,764 | $ | 5,846 | 565 | $ | (67,034 | ) | (6,488 | ) | $ | 40,004 | 3,841 | ||||||||||||||||||
| Capital Group Short-Term Municipal Fund | 79,828 | 7,946 | 1,681 | 167 | (109,740 | ) | (10,927 | ) | (28,231 | ) | (2,814 | ) | ||||||||||||||||||||
| Capital Group California Core Municipal Fund | 91,608 | 8,697 | 4,558 | 434 | (40,534 | ) | (3,869 | ) | 55,632 | 5,262 | ||||||||||||||||||||||
| Capital Group California Short-Term Municipal Fund | 46,705 | 4,587 | 872 | 86 | (45,366 | ) | (4,457 | ) | 2,211 | 216 | ||||||||||||||||||||||
| Capital Group Core Bond Fund | 101,119 | 9,984 | 5,963 | 589 | (37,097 | ) | (3,654 | ) | 69,985 | 6,919 | ||||||||||||||||||||||
| Capital Group Global Equity Fund | 53,952 | 3,836 | 5,365 | 425 | (80,505 | ) | (5,764 | ) | (21,188 | ) | (1,503 | ) | ||||||||||||||||||||
| Capital Group International Equity Fund | 293,846 | 25,080 | 2,587 | 241 | (357,217 | ) | (31,060 | ) | (60,784 | ) | (5,739 | ) | ||||||||||||||||||||
| Capital Group U.S. Equity Fund | 12,512 | 604 | 10,740 | 532 | (31,287 | ) | (1,466 | ) | (8,035 | ) | (330 | ) | ||||||||||||||||||||
| 100 | Private Client Services Funds |
9. Investment transactions and other disclosures
The following tables present additional information for each of the funds for the year ended October 31, 2018 (dollars in thousands):
| Capital Group | Capital Group | |||||||||||||||
| Capital Group | Capital Group | California | California | |||||||||||||
| Core Municipal | Short-Term | Core Municipal | Short-Term | |||||||||||||
| Fund | Municipal Fund | Fund | Municipal Fund | |||||||||||||
| Purchases of investment securities* | $ | 288,717 | $ | 90,493 | $ | 283,981 | $ | 71,045 | ||||||||
| Sales of investment securities* | 232,963 | 87,977 | 247,066 | 70,313 | ||||||||||||
| Capital Group | Capital Group | |||||||||||||||
| Capital Group | Global Equity | International | Capital Group | |||||||||||||
| Core Bond Fund | Fund | Equity Fund | U.S. Equity Fund | |||||||||||||
| Purchases of investment securities* | $ | 229,549 | $ | 154,463 | $ | 312,407 | $ | 48,999 | ||||||||
| Sales of investment securities* | 166,066 | 196,163 | 809,649 | 74,609 | ||||||||||||
| * | Excludes short-term securities and U.S. government obligations, if any. |
10. Advisory platform concentration
Most of the shares of Capital Group International Equity fund are held through a single advisory platform (more than 86% of the fund as of October 31, 2018). If the platform sponsor decides to move a significant number of its clients out of the fund it could have an adverse impact by causing the fund to have to sell securities in order to meet redemptions. The fund’s investment adviser monitors the fund’s asset allocation and the liquidity of the fund’s portfolio in seeking to mitigate this risk.
| Private Client Services Funds | 101 |
Financial highlights
| (Loss) income from investment operations1 | Dividends and distributions | |||||||||||||||||||||||||||||||||||||||||||||||||||
| Year ended | Net asset value, beginning of year | Net investment income | Net (losses) gains on securities (both realized and unrealized) | Total from investment operations | Dividends (from net investment income) | Distributions (from capital gains) | Total dividends and distributions | Net asset value, end of year | Total return2 | Net assets, end of year (in millions) | Ratio of expenses to average net assets before reimbursements | Ratio of expenses to average net assets after reimbursements2 | Ratio of net income to average net assets2 | |||||||||||||||||||||||||||||||||||||||
| Capital Group Core Municipal Fund | ||||||||||||||||||||||||||||||||||||||||||||||||||||
| 10/31/2018 | $ | 10.41 | $ | .21 | $ | (.26 | ) | $ | (.05 | ) | $ | (.19 | ) | $ | (.02 | ) | $ | (.21 | ) | $ | 10.15 | (.32 | )% | $ | 474 | .27 | % | .27 | % | 2.04 | % | |||||||||||||||||||||
| 10/31/2017 | 10.48 | .21 | (.07 | ) | .14 | (.21 | ) | — | 3 | (.21 | ) | 10.41 | 1.39 | 442 | .35 | .34 | 2.02 | |||||||||||||||||||||||||||||||||||
| 10/31/2016 | 10.49 | .21 | — | 3 | .21 | (.21 | ) | (.01 | ) | (.22 | ) | 10.48 | 1.97 | 405 | .41 | .40 | 1.97 | |||||||||||||||||||||||||||||||||||
| 10/31/2015 | 10.56 | .21 | (.07 | ) | .14 | (.21 | ) | — | (.21 | ) | 10.49 | 1.31 | 379 | .42 | .40 | 1.97 | ||||||||||||||||||||||||||||||||||||
| 10/31/2014 | 10.44 | .21 | .12 | .33 | (.21 | ) | — | (.21 | ) | 10.56 | 3.18 | 341 | .41 | .40 | 2.00 | |||||||||||||||||||||||||||||||||||||
| Capital Group Short-Term Municipal Fund | ||||||||||||||||||||||||||||||||||||||||||||||||||||
| 10/31/2018 | $ | 10.09 | $ | .17 | $ | (.18 | ) | $ | (.01 | ) | $ | (.15 | ) | $ | — | $ | (.15 | ) | $ | 9.93 | .05 | % | $ | 138 | .32 | % | .30 | % | 1.67 | % | ||||||||||||||||||||||
| 10/31/2017 | 10.11 | .14 | (.02 | ) | .12 | (.14 | ) | — | 3 | (.14 | ) | 10.09 | 1.26 | 150 | .41 | .35 | 1.42 | |||||||||||||||||||||||||||||||||||
| 10/31/2016 | 10.12 | .12 | (.01 | ) | .11 | (.12 | ) | — | 3 | (.12 | ) | 10.11 | 1.06 | 179 | .45 | .40 | 1.14 | |||||||||||||||||||||||||||||||||||
| 10/31/2015 | 10.19 | .12 | (.07 | ) | .05 | (.12 | ) | — | 3 | (.12 | ) | 10.12 | .51 | 142 | .46 | .40 | 1.15 | |||||||||||||||||||||||||||||||||||
| 10/31/2014 | 10.21 | .13 | (.01 | ) | .12 | (.13 | ) | (.01 | ) | (.14 | ) | 10.19 | 1.20 | 155 | .45 | .40 | 1.24 | |||||||||||||||||||||||||||||||||||
| Capital Group California Core Municipal Fund | ||||||||||||||||||||||||||||||||||||||||||||||||||||
| 10/31/2018 | $ | 10.57 | $ | .19 | $ | (.23 | ) | $ | (.04 | ) | $ | (.18 | ) | $ | (.01 | ) | $ | (.19 | ) | $ | 10.34 | (.27 | )% | $ | 452 | .27 | % | .27 | % | 1.85 | % | |||||||||||||||||||||
| 10/31/2017 | 10.69 | .20 | (.11 | ) | .09 | (.20 | ) | (.01 | ) | (.21 | ) | 10.57 | .84 | 388 | .35 | .34 | 1.88 | |||||||||||||||||||||||||||||||||||
| 10/31/2016 | 10.59 | .21 | .09 | .30 | (.20 | ) | — | (.20 | ) | 10.69 | 2.86 | 336 | .41 | .40 | 1.89 | |||||||||||||||||||||||||||||||||||||
| 10/31/2015 | 10.62 | .21 | (.03 | ) | .18 | (.21 | ) | — | (.21 | ) | 10.59 | 1.68 | 305 | .42 | .40 | 1.95 | ||||||||||||||||||||||||||||||||||||
| 10/31/2014 | 10.40 | .20 | .22 | .42 | (.20 | ) | — | (.20 | ) | 10.62 | 4.08 | 280 | .41 | .40 | 1.92 | |||||||||||||||||||||||||||||||||||||
| Capital Group California Short-Term Municipal Fund | ||||||||||||||||||||||||||||||||||||||||||||||||||||
| 10/31/2018 | $ | 10.21 | $ | .13 | $ | (.15 | ) | $ | (.02 | ) | $ | (.12 | ) | $ | (.01 | ) | $ | (.13 | ) | $ | 10.06 | (.07 | )% | $ | 129 | .31 | % | .30 | % | 1.28 | % | |||||||||||||||||||||
| 10/31/2017 | 10.23 | .11 | (.02 | ) | .09 | (.11 | ) | — | 3 | (.11 | ) | 10.21 | .97 | 120 | .42 | .35 | 1.11 | |||||||||||||||||||||||||||||||||||
| 10/31/2016 | 10.28 | .10 | (.04 | ) | .06 | (.10 | ) | (.01 | ) | (.11 | ) | 10.23 | .63 | 118 | .46 | .40 | 1.00 | |||||||||||||||||||||||||||||||||||
| 10/31/2015 | 10.31 | .10 | (.03 | ) | .07 | (.10 | ) | — | 3 | (.10 | ) | 10.28 | .74 | 112 | .46 | .40 | .98 | |||||||||||||||||||||||||||||||||||
| 10/31/2014 | 10.27 | .09 | .04 | .13 | (.09 | ) | — | 3 | (.09 | ) | 10.31 | 1.30 | 138 | .44 | .40 | .89 | ||||||||||||||||||||||||||||||||||||
| Capital Group Core Bond Fund | ||||||||||||||||||||||||||||||||||||||||||||||||||||
| 10/31/2018 | $ | 10.14 | $ | .21 | $ | (.34 | ) | $ | (.13 | ) | $ | (.19 | ) | $ | — | $ | (.19 | ) | $ | 9.82 | (1.14 | )% | $ | 446 | .28 | % | .28 | % | 2.08 | % | ||||||||||||||||||||||
| 10/31/2017 | 10.31 | .16 | (.12 | ) | .04 | (.16 | ) | (.05 | ) | (.21 | ) | 10.14 | .41 | 416 | .35 | .34 | 1.58 | |||||||||||||||||||||||||||||||||||
| 10/31/2016 | 10.19 | .16 | .15 | .31 | (.16 | ) | (.03 | ) | (.19 | ) | 10.31 | 3.03 | 352 | .41 | .40 | 1.55 | ||||||||||||||||||||||||||||||||||||
| 10/31/2015 | 10.25 | .16 | (.04 | ) | .12 | (.16 | ) | (.02 | ) | (.18 | ) | 10.19 | 1.25 | 335 | .42 | .40 | 1.59 | |||||||||||||||||||||||||||||||||||
| 10/31/2014 | 10.24 | .16 | .04 | .20 | (.16 | ) | (.03 | ) | (.19 | ) | 10.25 | 1.95 | 310 | .41 | .40 | 1.57 | ||||||||||||||||||||||||||||||||||||
| Capital Group Global Equity Fund | ||||||||||||||||||||||||||||||||||||||||||||||||||||
| 10/31/2018 | $ | 15.62 | $ | .22 | $ | (.16 | ) | $ | .06 | $ | (.21 | ) | $ | (.55 | ) | $ | (.76 | ) | $ | 14.92 | .25 | % | $ | 567 | .66 | % | .65 | % | 1.38 | % | ||||||||||||||||||||||
| 10/31/2017 | 12.65 | .21 | 2.95 | 3.16 | (.19 | ) | — | (.19 | ) | 15.62 | 25.36 | 571 | .73 | .73 | 4 | 1.52 | ||||||||||||||||||||||||||||||||||||
| 10/31/2016 | 13.13 | .20 | (.08 | ) | .12 | (.18 | ) | (.42 | ) | (.60 | ) | 12.65 | 1.04 | 482 | .86 | .85 | 1.64 | |||||||||||||||||||||||||||||||||||
| 10/31/2015 | 13.27 | .18 | (.03 | ) | .15 | (.14 | ) | (.15 | ) | (.29 | ) | 13.13 | 1.10 | 498 | .86 | .85 | 1.34 | |||||||||||||||||||||||||||||||||||
| 10/31/2014 | 12.43 | .14 | .80 | .94 | (.10 | ) | — | (.10 | ) | 13.27 | 7.60 | 510 | .85 | .85 | 4 | 1.09 | ||||||||||||||||||||||||||||||||||||
| Capital Group International Equity Fund | ||||||||||||||||||||||||||||||||||||||||||||||||||||
| 10/31/2018 | $ | 13.67 | $ | .24 | $ | (1.05 | ) | $ | (.81 | ) | $ | (.19 | ) | $ | — | $ | (.19 | ) | $ | 12.67 | (6.09) | % | $ | 1,162 | .65 | % | .65 | %4 | 1.71 | % | ||||||||||||||||||||||
| 10/31/2017 | 11.23 | .20 | 2.42 | 2.62 | (.18 | ) | — | (.18 | ) | 13.67 | 23.73 | 1,584 | .73 | .73 | 4 | 1.64 | ||||||||||||||||||||||||||||||||||||
| 10/31/2016 | 11.50 | .16 | (.30 | ) | (.14 | ) | (.13 | ) | — | (.13 | ) | 11.23 | (1.20 | ) | 1,366 | .85 | .85 | 4 | 1.44 | |||||||||||||||||||||||||||||||||
| 10/31/2015 | 11.56 | .13 | (.05 | ) | .08 | (.14 | ) | — | (.14 | ) | 11.50 | .69 | 1,333 | .85 | .85 | 4 | 1.11 | |||||||||||||||||||||||||||||||||||
| 10/31/2014 | 11.72 | .16 | (.23 | ) | (.07 | ) | (.09 | ) | — | (.09 | ) | 11.56 | (.62 | ) | 1,652 | .85 | .85 | 4 | 1.35 | |||||||||||||||||||||||||||||||||
| Capital Group U.S. Equity Fund | ||||||||||||||||||||||||||||||||||||||||||||||||||||
| 10/31/2018 | $ | 22.95 | $ | .34 | $ | .85 | $ | 1.19 | $ | (.29 | ) | $ | (1.07 | ) | $ | (1.36 | ) | $ | 22.78 | 5.30 | % | $ | 223 | .44 | % | .43 | % | 1.45 | % | |||||||||||||||||||||||
| 10/31/2017 | 19.78 | .32 | 4.02 | 4.34 | (.31 | ) | (.86 | ) | (1.17 | ) | 22.95 | 22.76 | 236 | .53 | .52 | 1.52 | ||||||||||||||||||||||||||||||||||||
| 10/31/2016 | 19.88 | .33 | .55 | .88 | (.30 | ) | (.68 | ) | (.98 | ) | 19.78 | 4.58 | 210 | .66 | .65 | 1.68 | ||||||||||||||||||||||||||||||||||||
| 10/31/2015 | 20.11 | .26 | .46 | .72 | (.24 | ) | (.71 | ) | (.95 | ) | 19.88 | 3.75 | 198 | .67 | .65 | 1.31 | ||||||||||||||||||||||||||||||||||||
| 10/31/2014 | 18.33 | .25 | 2.05 | 2.30 | (.24 | ) | (.28 | ) | (.52 | ) | 20.11 | 12.78 | 192 | .66 | .65 | 1.30 | ||||||||||||||||||||||||||||||||||||
| 102 | Private Client Services Funds |
| Portfolio turnover rate for all share classes | Year ended October 31 | |||||||||||||||||||
| excluding mortgage dollar roll transactions5 | 2018 | 2017 | 2016 | 2015 | 2014 | |||||||||||||||
| Capital Group Core Bond Fund | 41 | % | 52 | % | 58 | % | 87 | % | Not available | |||||||||||
| Portfolio turnover rate for all share classes, | Year ended October 31 | |||||||||||||||||||
| including mortgage dollar roll transactions | 2018 | 2017 | 2016 | 2015 | 2014 | |||||||||||||||
| Capital Group Core Municipal Fund | 55 | % | 47 | % | 18 | % | 16 | % | 9 | % | ||||||||||
| Capital Group Short-Term Municipal Fund | 70 | 42 | 24 | 27 | 20 | |||||||||||||||
| Capital Group California Core Municipal Fund | 69 | 27 | 11 | 13 | 18 | |||||||||||||||
| Capital Group California Short-Term Municipal Fund | 65 | 36 | 19 | 23 | 19 | |||||||||||||||
| Capital Group Core Bond Fund | 110 | 95 | 86 | 126 | 137 | |||||||||||||||
| Capital Group Global Equity Fund | 28 | 20 | 36 | 39 | 29 | |||||||||||||||
| Capital Group International Equity Fund | 22 | 17 | 21 | 34 | 33 | |||||||||||||||
| Capital Group U.S. Equity Fund | 22 | 19 | 31 | 29 | 27 | |||||||||||||||
| 1 | Based on average shares outstanding. |
| 2 | This column reflects the impact, if any, of certain reimbursements by Capital Guardian Trust Company. |
| 3 | Amount less than $.01. |
| 4 | Reimbursement was less than 0.005%. |
| 5 | Refer to Note 5 for further information on mortgage dollar rolls. |
See notes to financial statements
| Private Client Services Funds | 103 |
Report of Independent Registered Public Accounting Firm
To the Board of Trustees and Shareholders of Capital Group Core Municipal Fund, Capital Group Short-Term Municipal Fund, Capital Group California Core Municipal Fund, Capital Group California Short- Term Municipal Fund, Capital Group Core Bond Fund, Capital Group Global Equity Fund, Capital Group International Equity Fund, and Capital Group U.S. Equity Fund
Opinion on the Financial Statements
We have audited the accompanying statements of assets and liabilities, including the investment portfolios, of Capital Group Core Municipal Fund, Capital Group Short-Term Municipal Fund, Capital Group California Core Municipal Fund, Capital Group California Short- Term Municipal Fund, Capital Group Core Bond Fund, Capital Group Global Equity Fund, Capital Group International Equity Fund, and Capital Group U.S. Equity Fund (eight of the funds constituting Capital Group Private Client Services Funds, hereafter collectively referred to as the “Funds”), as of October 31, 2018, and the related statements of operations, changes in net assets, including the related notes, and the financial highlights for the year ended October 31, 2018 (collectively referred to as the “financial statements”). In our opinion, the financial statements present fairly, in all material respects, the financial position of each of the Funds as of October 31, 2018, the results of each of their operations, changes in each of their net assets, and each of the financial highlights for the year ended October 31, 2018 in conformity with accounting principles generally accepted in the United States of America.
The financial statements of the Funds as of and for the year ended October 31, 2017 and the financial highlights for each of the five years in the period then ended (not presented herein, other than the statement of changes in net assets for the year ended October 31, 2017 and the financial highlights for each of the four years in the period ended October 31, 2017), were audited by other auditors whose report dated December 19, 2017 expressed an unqualified opinion on those financial statements and financial highlights.
Basis for Opinion
These financial statements are the responsibility of the Funds’ management. Our responsibility is to express an opinion on the Funds’ financial statements based on our audits. We are a public accounting firm registered with the Public Company Accounting Oversight Board (United States) (“PCAOB”) and are required to be independent with respect to the Funds in accordance with the U.S. federal securities laws and the applicable rules and regulations of the Securities and Exchange Commission and the PCAOB.
We conducted our audits of these financial statements in accordance with the standards of the PCAOB. Those standards require that we plan and perform the audit to obtain reasonable assurance about whether the financial statements are free of material misstatement, whether due to error or fraud.
Our audits included performing procedures to assess the risks of material misstatement of the financial statements, whether due to error or fraud, and performing procedures that respond to those risks. Such procedures included examining, on a test basis, evidence regarding the amounts and disclosures in the financial statements. Our audits also included evaluating the accounting principles used and significant estimates made by management, as well as evaluating the overall presentation of the financial statements. Our procedures included confirmation of securities owned as of October 31, 2018 by correspondence with the custodian and brokers; when replies were not received from brokers, we performed other auditing procedures. We believe that our audits provide a reasonable basis for our opinion.
/s/ PricewaterhouseCoopers LLP
Los Angeles, California
December 17, 2018
We have served as the auditor of one or more investment companies in The Capital Group Companies Investment Company Complex since 1934.
| 104 | Private Client Services Funds |
| Expense example | unaudited |
As a shareholder of the funds, you incur ongoing costs, including management fees and other expenses. This example is intended to help you understand your ongoing costs (in dollars) of investing in the funds so you can compare these costs with the ongoing costs of investing in other mutual funds. The example is based on an investment of $1,000 invested at the beginning of the period and held for the entire six-month period (May 1, 2018, through October 31, 2018).
Actual expenses:
The first line of each share class in the table on the following pages provides information about actual account values and actual expenses. You may use the information in this line, together with the amount you invested, to estimate the expenses that you paid over the period. Simply divide your account value by $1,000 (for example, an $8,600 account value divided by $1,000 = 8.6), then multiply the result by the number in the first line under the heading titled “Expenses paid during period” to estimate the expenses you paid on your account during this period.
Hypothetical example for comparison purposes:
The second line of each share class in the table on the following pages provides information about hypothetical account values and hypothetical expenses based on the actual expense ratio for the share class and an assumed rate of return of 5.00% per year before expenses, which is not the actual return of the share class. The hypothetical account values and expenses may not be used to estimate the actual ending account balance or expenses you paid for the period. You may use this information to compare the ongoing costs of investing in the fund and other funds. To do so, compare this 5.00% hypothetical example with the 5.00% hypothetical examples that appear in the shareholder reports of the other funds.
Notes:
Shareholders of the funds may be subject to an additional fee charged by Capital Guardian Trust Company’s Capital Group Private Client Services division for the ongoing services provided to the shareholder. You can estimate the impact of these fees by adding the amount of the fees to the total estimated expenses you paid on your account during the period as calculated above. In addition, your ending account value would be lower by the amount of these fees. Note that the expenses shown in the table are meant to highlight your ongoing costs only. The second line of each fund in the table is useful in comparing ongoing costs only and will not help you determine the relative total costs of owning different funds.
| Private Client Services Funds | 105 |
| Beginning account value 5/1/2018 | Ending account value 10/31/2018 | Expenses paid during period* | Annualized expense ratio | |||||||||||||
| Capital Group Core Municipal Fund | ||||||||||||||||
| Actual return | $ | 1,000.00 | $ | 1,005.40 | $ | 1.42 | .28 | % | ||||||||
| Assumed 5% return | 1,000.00 | 1,023.79 | 1.43 | .28 | ||||||||||||
| Capital Group Short-Term Municipal Fund | ||||||||||||||||
| Actual return | $ | 1,000.00 | $ | 1,006.34 | $ | 1.57 | .31 | % | ||||||||
| Assumed 5% return | 1,000.00 | 1,023.64 | 1.58 | .31 | ||||||||||||
| Capital Group California Core Municipal Fund | ||||||||||||||||
| Actual return | $ | 1,000.00 | $ | 1,006.37 | $ | 1.42 | .28 | % | ||||||||
| Assumed 5% return | 1,000.00 | 1,023.79 | 1.43 | .28 | ||||||||||||
| Capital Group California Short-Term Municipal Fund | ||||||||||||||||
| Actual return | $ | 1,000.00 | $ | 1,006.31 | $ | 1.67 | .33 | % | ||||||||
| Assumed 5% return | 1,000.00 | 1,023.54 | 1.68 | .33 | ||||||||||||
| Capital Group Core Bond Fund | ||||||||||||||||
| Actual return | $ | 1,000.00 | $ | 1,004.35 | $ | 1.47 | .29 | % | ||||||||
| Assumed 5% return | 1,000.00 | 1,023.74 | 1.48 | .29 | ||||||||||||
| Capital Group Global Equity Fund | ||||||||||||||||
| Actual return | $ | 1,000.00 | $ | 973.89 | $ | 3.23 | .65 | % | ||||||||
| Assumed 5% return | 1,000.00 | 1,021.93 | 3.31 | .65 | ||||||||||||
| Capital Group International Equity Fund | ||||||||||||||||
| Actual return | $ | 1,000.00 | $ | 918.72 | $ | 3.14 | .65 | % | ||||||||
| Assumed 5% return | 1,000.00 | 1,021.93 | 3.31 | .65 | ||||||||||||
| Capital Group U.S. Equity Fund | ||||||||||||||||
| Actual return | $ | 1,000.00 | $ | 1,028.31 | $ | 2.20 | .43 | % | ||||||||
| Assumed 5% return | 1,000.00 | 1,023.04 | 2.19 | .43 | ||||||||||||
| * | The “expenses paid during period” are equal to the “annualized expense ratio,” multiplied by the average account value over the period, multiplied by the number of days in the period, and divided by 365 (to reflect the one-half year period). |
| 106 | Private Client Services Funds |
| Tax information | unaudited |
We are required to advise you of the federal tax status of certain distributions received by shareholders during the fiscal year. The funds hereby designate the following amounts for the funds’ fiscal year ended October 31, 2018:
| Capital Group Core Municipal Fund | Capital Group Short-Term Municipal Fund | Capital Group California Core Municipal Fund | Capital Group California Short-Term Municipal Fund | |||||||||||||
| Long-term capital gains | $ | 868,000 | — | $ | 407,000 | $ | 54,000 | |||||||||
| Exempt interest dividends | 100 | % | 100 | % | 100 | % | 100 | % | ||||||||
| Capital Group Core Bond Fund | Capital Group Global Equity Fund | Capital Group International Equity Fund | Capital Group U.S. Equity Fund | |||||||||||||
| Long-term capital gains | — | $ | 22,613,000 | — | $ | 11,978,000 | ||||||||||
| Foreign taxes (per share) | — | $ | 0.020 | $ | 0.030 | — | ||||||||||
| Foreign source income (per share) | — | $ | 0.20 | $ | 0.43 | — | ||||||||||
| Qualified dividend income | — | 100 | % | 100 | % | 100 | % | |||||||||
| Corporate dividends received deduction | — | $ | 4,849,000 | — | 100 | % | ||||||||||
Individual shareholders should refer to their Form 1099 or other tax information, which will be mailed in January 2019, to determine the calendar year amounts to be included on their 2018 tax returns. Shareholders should consult their tax advisors.
| Private Client Services Funds | 107 |
Approval of Investment Advisory and Service Agreement
Capital Group Private Client Services Funds’ board approved an amendment of the funds’ Investment Advisory and Service Agreement (the “agreement”) with Capital Guardian Trust Company (“CGTC”) on August 27, 2018, with respect to Capital Group Global Equity Fund and Capital International Equity Fund (each a “fund”). Under the current agreement, Capital Group Global Equity Fund and Capital Group International Equity Fund have been subject to a single, all inclusive “unified” management fee, which covers, with some exceptions, all services necessary for the management and operation of the funds. Under the agreement as amended, management fees and other fund expenses will be charged separately.
The board approved the amended agreement, subject to shareholder approval. Shareholders approved the amendment at a meeting held November 28, 2018. The board took into account the same information it considered when it approved the current agreement on June 4, 2018, as described in the funds’ semi-annual report to shareholders for the period ended April 30, 2018. The board noted that the materials provided to it remain reflective of the adviser’s services, there had been no reduction in any services provided to Capital Group Private Client Services Funds since June, 2018, and no reduction in services is contemplated by the amended agreement.
In addition, the board reviewed current information comparing the proposed advisory fees and total expense levels (each as a percentage of average net assets) of Capital Group Global Equity Fund and Capital Group International Equity Fund to those of other comparable funds. The board observed that the proposed advisory fees and expenses of the Capital Group Global Equity Fund and Capital Group International Equity Fund were below those of most of the comparable funds in their respective Lipper categories. The board also considered the adviser’s proposal to cap fund expenses of the Capital Group Global Equity Fund and Capital Group International Equity Fund at their current levels for a five-year period. The board also considered current investment results of Capital Group Global Equity Fund and Capital Group International Equity Fund, updated information on brokerage research costs, and updated information on the profitability of CGTC and its affiliates.
In considering the modified fee structure, the board considered the potential for the modified fee to facilitate expanded distribution of the funds, which can, in turn, reduce fees through economies of scale. The board also weighed the benefits of the unified fee structure described above as compared to the modified fee structure. While the board took into account that, among other benefits, the unified fee structure of the Capital Group Global Equity Fund and Capital Group International Equity Fund shifts to CGTC the risk of future increases in the Funds’ operating costs, and allows shareholders to more easily compare the total expenses of the Funds with the total expenses of other mutual funds, the board concluded that the modified fee structure would benefit shareholders by positioning the Capital Group Global Equity Fund and Capital Group International Equity Fund for growth opportunities, which would, in turn, help reduce fund expenses.
Please refer to the funds’ semi-annual report to shareholders for the period ended April 30, 2018, for additional discussion regarding the basis for approval of the Capital Group Private Client Services Funds’ Investment Advisory and Service Agreement.
Approval of Capital Research and Management Company as investment adviser
The board also approved changing the investment adviser of the Capital Group Private Client Services Funds to Capital Research and Management Company (“CRMC”). Accordingly, we anticipate that CGTC’s responsibilities as investment adviser will transition to CRMC. CRMC is an affiliate of CGTC, and the individuals managing the fund will not change. Importantly, when the change in adviser is effected, there will be no changes to the investment objectives or strategies of any fund. While we anticipate the change will take place in the second or third quarter of 2019, the investment adviser reserves the right to delay implementation until operationally ready.
| 108 | Private Client Services Funds |
Board of trustees and other officers
Independent trustees1
| Name and year of birth | Year first elected a trustee of the fund2 | Principal occupation(s) during past five years | Number of portfolios overseen by trustee3 | Other directorships held by trustee4 | ||||
| Joseph C. Berenato, 1946 Trustee | 2015 | Former Chairman and CEO, Ducommun Incorporated (aerospace components manufacturer) | 16 | None | ||||
| Vanessa C. L. Chang, 1952 Chairman of the Board (Independent and Non-Executive) | 2015 | Former Director, EL & EL Investments (real estate) | 17 | Edison International; Sykes Enterprises; Transocean Ltd. | ||||
| James G. Ellis, 1947 Trustee | 2019 | Dean and Professor of Marketing, Marshall School of Business, University of Southern California | 91 | Mercury General Corporation; Former director of Quiksilver, Inc. | ||||
| Jennifer Feikin, 1968 Trustee | 2019 | Business Advisor; previously held positions at Google, AOL, 20th Century Fox and McKinsey & Company; Trustee, The Nature Conservancy of California; Former Director, First Descents | 10 | |||||
| Pablo R. González Guajardo, 1967 Trustee | 2019 | CEO, Kimberly-Clark de México, S.A.B. de C.V. | 17 | América Móvil, S.A.B. de C.V.; Grupo Lala, S.A.B. de C.V.; Grupo Sanborns, S.A.B. de C.V.; Kimberly-Clark de México, S.A.B. de C.V. | ||||
| Leslie Stone Heisz, 1961 Trustee | 2019 | Former Managing Director, Lazard (retired, 2010); Director, Edwards Lifesciences; Trustee, Public Storage; Director, Kaiser Permanente (California public benefit corporation); Lecturer, UCLA Anderson School of Management | 10 | Former director, Ingram Micro (technology director); Former director, Towers Watson (actuary/benefits consultancy); Former director, HCC Insurance (P&C insurer) | ||||
| William D. Jones, 1955 Trustee | 2019 | Real estate developer/owner, President and CEO, CityLink Investment Corporation (acquires, develops and manages real estate ventures in urban communities) and for the former City Scene Management Company (provides commercial asset management services) | 18 | Sempra Energy |
Richard G. Capen, Jr., H. Frederick Christie and Richard G. Newman, founding trustees of the fund, have retired from the board. The trustees thank Ambassador Capen, Mr. Christie and Mr. Newman for their dedication and service to the fund and its shareholders.
Interested trustee5
| Name, year of birth and position with fund | Year first elected a trustee or officer of the fund2 | Principal occupation(s) during past five years and positions held with affiliated entities or the principal underwriter of the fund | Number of portfolios overseen by trustee3 | Other directorships held by trustee4 | ||||
| John S. Armour, 1957 President and Trustee | 2013 | President — Private Client Services Division, Capital Bank and Trust Company6 | 10 | None |
The fund’s statement of additional information includes further details about fund trustees and is available without charge upon request by calling your relationship manager at (800) 421-4225, ext. 90. The address for all trustees and officers of the fund is 333 South Hope Street, Los Angeles, CA 90071, Attention: Secretary.
See page 110 for footnotes.
| Private Client Services Funds | 109 |
Other officers7
| Name, year of birth and position with fund | Year first elected an officer of the fund2 | Principal occupation(s) during past five years and positions held with affiliated entities or the principal underwriter of the fund | ||
| Aaron Applebaum, 1979 Senior Vice President | 2018 | Partner — Capital Fixed Income Investors, Capital Research and Management Company6 | ||
| Mark A. Marinella, 1958 Senior Vice President | 2018 | Partner — Capital Fixed Income Investors, Capital Research and Management Company6 | ||
| John R. Queen, 1965 Senior Vice President | 2018 | Senior Vice President — Private Client Services Division, Capital Bank and Trust Company;6 Partner — Capital Fixed Income Investors, Capital Research and Management Company6 | ||
| William L. Robbins, 1968 Senior Vice President | 2018 | Partner — Capital International Investors, Capital Research and Management Company6 | ||
| Timothy W. McHale, 1978 Vice President | 2011 | Senior Vice President and Senior Counsel — Fund Business Management Group, Capital Research and Management Company;6 Secretary, American Funds Distributors, Inc.6 | ||
| Courtney R. Taylor, 1975 Secretary | 2011 | Assistant Vice President — Fund Business Management Group, Capital Research and Management Company;6 Secretary, Capital Guardian Trust Company | ||
| Gregory F. Niland, 1971 Treasurer | 2014 | Vice President — Investment Operations, Capital Research and Management Company6 | ||
| Susan K. Countess, 1966 Assistant Secretary | 2012 | Associate — Fund Business Management Group, Capital Research and Management Company6 | ||
| Brian C. Janssen, 1972 Assistant Treasurer | 2015 | Vice President — Investment Operations, Capital Research and Management Company6 |
| 1 | The term independent trustee refers to a trustee who is not an “interested person” of the fund within the meaning of the Investment Company Act of 1940. |
| 2 | Trustees and officers of the fund serve until their resignation, removal or retirement. |
| 3 | Funds managed by Capital Guardian Trust Company or its affiliates. |
| 4 | This includes all directorships (other than the fund or other funds managed by Capital Guardian Trust Company or its affiliates) that are held by each trustee as a trustee or director of a public company or a registered investment company. Unless otherwise noted, all directorships are current. |
| 5 | The term interested trustee refers to a trustee who is an “interested person” of the fund within the meaning of the Investment Company Act of 1940, on the basis of his or her affiliation with the fund’s investment adviser, Capital Guardian Trust Company, or affiliated entities (including the fund’s principal underwriter). |
| 6 | Company affiliated with Capital Guardian Trust Company. |
| 7 | All of the officers listed are officers of one or more of the other funds for which Capital Guardian Trust Company or an affiliate serves as investment adviser. |
| 110 | Private Client Services Funds |
Board of trustees and other officers (continued)
Results of special meeting of shareholders
held November 28, 2018
Shares outstanding (all classes) on August 31, 2018 (record date)
326,651,103
Total shares voting on November 28, 2018
321,707,293 (98.5% of shares outstanding)
| Votes for | Percent of shares voting for | Votes withheld | Percent of shares withheld | |||||||||||||
| Proposal 1: To elect board members: | ||||||||||||||||
| John S. Armour | 321,702,118 | 100.0 | % | 5,175 | 0.0 | % | ||||||||||
| Joseph C. Berenato | 321,702,118 | 100.0 | 5,175 | 0.0 | ||||||||||||
| Vanessa C. L. Chang | 321,702,118 | 100.0 | 5,175 | 0.0 | ||||||||||||
| James G. Ellis | 321,702,118 | 100.0 | 5,175 | 0.0 | ||||||||||||
| Jennifer Feikin | 321,702,118 | 100.0 | 5,175 | 0.0 | ||||||||||||
| Pablo R. González Guajardo | 637,230 | 0.2 | 321,070,063 | 99.8 | ||||||||||||
| Leslie Stone Heisz | 321,702,118 | 100.0 | 5,175 | 0.0 | ||||||||||||
| William D. Jones | 321,702,118 | 100.0 | 5,175 | 0.0 | ||||||||||||
Proposal 2: To amend the investment advisory and service agreement between Capital Group Private Client Services Funds and Capital Guardian Trust Company for Capital Group Global Equity Fund and Capital Group International Equity Fund:
Shares outstanding (all classes) on August 31, 2018 (record date)
37,990,326
Total shares voting on November 28, 2018
37,959,787 (99.9% of shares outstanding)
| Votes for | Percent of shares voting for | Votes against | Percent of shares voting against | Votes abstained | Percent of shares abstained | |||||||
| Capital Group Global Equity Fund | 37,959,787 | 100.0% | 0 | 0.0% | 0 | 0.0% |
Shares outstanding (all classes) on August 31, 2018 (record date)
118,640,611
Total shares voting on November 28, 2018
115,050,619 (97.0% of shares outstanding)
| Votes for | Percent of shares voting for | Votes against | Percent of shares voting against | Votes abstained | Percent of shares abstained | |||||||
| Capital Group International Equity Fund | 114,808,247 | 99.8% | 19,893 | 0.0% | 30,927 | 0.2% |
| Private Client Services Funds | 111 |
Office of the fund and of the investment adviser
Capital Guardian Trust Company
6455 Irvine Center Drive
Irvine, CA 92618-4518
Transfer agent for shareholder accounts
American Funds Service Company
(Write to the address near you.)
P.O. Box 6007
Indianapolis, IN 46206-6007
P.O. Box 2280
Norfolk, VA 23501-2280
Custodian of assets
JPMorgan Chase Bank
270 Park Avenue
New York, NY 10017-2070
Counsel
Morgan, Lewis & Bockius LLP
One Federal Street
Boston, MA 02110-1726
Independent registered public accounting firm
PricewaterhouseCoopers LLP
601 South Figueroa Street
Los Angeles, CA 90017-3874
Principal underwriter
American Funds Distributors, Inc.
333 South Hope Street
Los Angeles, CA 90071-1406
Investors should carefully consider investment objectives, risks, charges and expenses. This and other important information is contained in the fund prospectus, which can be obtained from Capital Guardian Trust Company by calling (800) 266-9532 and should be read carefully before investing. Fund shares offered through American Fund Distributors, Inc.
Capital Group Private Client Services Fund files a complete list of its portfolio holdings with the U.S. Securities and Exchange Commission (SEC) for the first and third quarters of each fiscal year on Form N-Q. This filing is available free of charge on the SEC website (www.sec.gov). Additionally, the list of portfolio holdings is available by calling your relationship manager at (800) 266-9532.
The proxy voting procedures and policies of Capital Group Private Client Services Fund — which describe how we vote proxies relating to portfolio securities — are available upon request by calling your relationship manager at (800) 266-9532. The fund files its proxy voting record with the SEC for the 12 months endedJune 30 by August 31. The report also is available on the SEC website or by calling your relationship manager.
The Standard & Poor’s 500 Composite Index (“Index”) is a product of S&P Dow Jones Indices LLC and/or its affiliates and has been licensed for use by Capital Group. Copyright© 2018 S&P Dow Jones Indices LLC, a division of S&P Global, and/or its affiliates. All rights reserved. Redistribution or reproduction in whole or in part are prohibited without written permission of S&P Dow Jones Indices LLC.
Bloomberg® is a trademark of Bloomberg Finance L.P. (collectively with its affiliates, “Bloomberg”). Barclays® is a trademark of Barclays Bank Plc (collectively with its affiliates, “Barclays”), used under license. Neither Bloomberg nor Barclays approves or endorses this material, guarantees the accuracy or completeness of any information herein and, to the maximum extent allowed by law, neither shall have any liability or responsibility for injury or damages arising in connection therewith.
MSCI has not approved, reviewed or produced this report, makes no express or implied warranties or representations and is not liable whatsoever for any data in the report. You may not redistribute the MSCI data or use it as a basis for other indices or investment products.

ITEM 2 – Code of Ethics
The Registrant has adopted a Code of Ethics that applies to its Principal Executive Officer and Principal Financial Officer. The Registrant undertakes to provide to any person without charge, upon request, a copy of the Code of Ethics. Such request can be made by calling 800/421-4225 or to the Secretary of the Registrant, 6455 Irvine Center Drive, Irvine, California 92618.
ITEM 3 – Audit Committee Financial Expert
The Registrant’s board has determined that Vanessa C. L. Chang, a member of the Registrant’s audit committee, is an “audit committee financial expert” and "independent," as such terms are defined in this Item. This designation will not increase the designee’s duties, obligations or liability as compared to his or her duties, obligations and liability as a member of the audit committee and of the board, nor will it reduce the responsibility of the other audit committee members. There may be other individuals who, through education or experience, would qualify as "audit committee financial experts" if the board had designated them as such. Most importantly, the board believes each member of the audit committee contributes significantly to the effective oversight of the Registrant’s financial statements and condition.
ITEM 4 – Principal Accountant Fees and Services
| Registrant: | |
| a) Audit Fees: | |
| 2017 | N/A | ||
| 2018 | $242,000 | ||
| b) Audit-Related Fees: | |||
| 2017 | N/A | ||
| 2018 | $10,000 | ||
| c) Tax Fees: | |||
| 2017 | N/A | ||
| 2018 | None | ||
| The tax fees consist of professional services relating to the preparation of the Registrant’s tax returns. | |||
| d) All Other Fees: | |||
| 2017 | N/A | ||
| 2018 | None | ||
| Adviser and affiliates (includes only fees for non-audit services billed to the adviser and affiliates for engagements that relate directly to the operations and financial reporting of the Registrant and were subject to the pre-approval policies described below): | |||
| a) Audit Fees: | |||
| Not Applicable | |||
| b) Audit-Related Fees: | |||
| 2017 | N/A | ||
| 2018 | None | ||
| The audit-related fees consist of assurance and related services relating to the examination of the Registrant’s transfer agent, principal underwriter and investment adviser conducted in accordance with Statement on Standards for Attestation Engagements Number 16 issued by the American Institute of Certified Public Accountants. | |||
| c) Tax Fees: | |||
| Not Applicable | |||
| d) All Other Fees: | |||
| Not Applicable | |||
| All audit and permissible non-audit services that the Registrant’s audit committee considers compatible with maintaining the independent registered public accounting firm’s independence are required to be pre-approved by the committee. The pre-approval requirement will extend to all non-audit services provided to the Registrant, the investment adviser, and any entity controlling, controlled by, or under common control with the investment adviser that provides ongoing services to the Registrant, if the engagement relates directly to the operations and financial reporting of the Registrant. The committee will not delegate its responsibility to pre-approve these services to the investment adviser. The committee may delegate to one or more committee members the authority to review and pre-approve audit and permissible non-audit services. Actions taken under any such delegation will be reported to the full committee at its next meeting. The pre-approval requirement is waived with respect to non-audit services if certain conditions are met. The pre-approval requirement was not waived for any of the non-audit services listed above provided to the Registrant, adviser and affiliates. | |||
| Aggregate non-audit fees paid to the Registrant’s auditors, including fees for all services billed to the Registrant, adviser and affiliates that provide ongoing services to the Registrant, were N/A for fiscal year 2017 and $0 for fiscal year 2018. The non-audit services represented by these amounts were brought to the attention of the committee and considered to be compatible with maintaining the auditors’ independence. | |||
ITEM 5 – Audit Committee of Listed Registrants
Not applicable to this Registrant, insofar as the Registrant is not a listed issuer as defined in Rule 10A-3 under the Securities Exchange Act of 1934.
ITEM 6 – Schedule of Investments
Not applicable, insofar as the schedule is included as part of the report to shareholders filed under Item 1 of this Form.
ITEM 7 – Disclosure of Proxy Voting Policies and Procedures for Closed-End Management Investment Companies
Not applicable to this Registrant, insofar as the Registrant is not a closed-end management investment company.
ITEM 8 – Portfolio Managers of Closed-End Management Investment Companies
Not applicable to this Registrant, insofar as the Registrant is not a closed-end management investment company.
ITEM 9 – Purchases of Equity Securities by Closed-End Management Investment Company and Affiliated Purchasers
Not applicable to this Registrant, insofar as the Registrant is not a closed-end management investment company.
ITEM 10 – Submission of Matters to a Vote of Security Holders
There have been no material changes to the procedures by which shareholders may recommend nominees to the Registrant’s board of trustees since the Registrant last submitted a proxy statement to its shareholders. The procedures are as follows. The Registrant has a nominating committee comprised solely of persons who are not considered ‘‘interested persons’’ of the Registrant within the meaning of the Investment Company Act of 1940, as amended. The committee periodically reviews such issues as the board’s composition, responsibilities, committees, compensation and other relevant issues, and recommends any appropriate changes to the full board of trustees. While the committee normally is able to identify from its own resources an ample number of qualified candidates, it will consider shareholder suggestions of persons to be considered as nominees to fill future vacancies on the board. Such suggestions must be sent in writing to the nominating committee of the Registrant, c/o the Registrant’s Secretary, and must be accompanied by complete biographical and occupational data on the prospective nominee, along with a written consent of the prospective nominee for consideration of his or her name by the nominating committee.
ITEM 11 – Controls and Procedures
| (a) | The Registrant’s Principal Executive Officer and Principal Financial Officer have concluded, based on their evaluation of the Registrant’s disclosure controls and procedures (as such term is defined in Rule 30a-3 under the Investment Company Act of 1940), that such controls and procedures are adequate and reasonably designed to achieve the purposes described in paragraph (c) of such rule. |
| (b) | Effective May 28, 2018, the Capital Group Private Client Services Funds’s investment adviser implemented a new fixed income order management, trading, and compliance system. In connection with introducing this new system, additional automated and manual controls were implemented and some existing controls were modified. None of these changes were in response to any identified deficiency or weakness in the Capital Group Private Client Services Funds’s internal control over financial reporting. |
ITEM 12 – Exhibits
| (a)(1) | The Code of Ethics that is the subject of the disclosure required by Item 2 is attached as an exhibit hereto. |
| (a)(2) | The certifications required by Rule 30a-2 of the Investment Company Act of 1940 and Sections 302 and 906 of the Sarbanes-Oxley Act of 2002 are attached as exhibits hereto. |
SIGNATURES
Pursuant to the requirements of the Securities Exchange Act of 1934 and the Investment Company Act of 1940, the Registrant has duly caused this report to be signed on its behalf by the undersigned, thereunto duly authorized.
| CAPITAL GROUP PRIVATE CLIENT SERVICES FUNDS | |
| By /s/ John S. Armour | |
John S. Armour, President and Principal Executive Officer | |
| Date: December 31, 2018 |
Pursuant to the requirements of the Securities Exchange Act of 1934 and the Investment Company Act of 1940, this report has been signed below by the following persons on behalf of the Registrant and in the capacities and on the dates indicated.
| By /s/ John S. Armour |
John S. Armour, President and Principal Executive Officer |
| Date: December 31, 2018 |
| By /s/ Gregory F. Niland |
Gregory F. Niland, Treasurer and Principal Financial Officer |
| Date: December 31, 2018 |