Exhibit (c)(4)

C O N F I D E N T I A L
2 7 A U G U S T 2 0 1 2
M A N A G E M E N T P R O J E C T I O N S
Project Promise
DRAFT
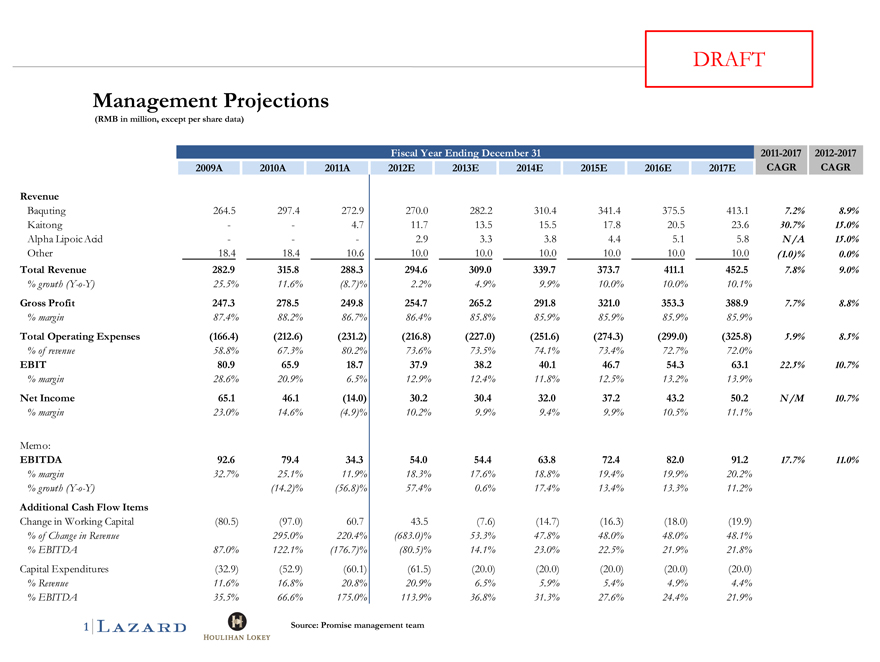
Management Projections
(RMB in million, except per share data)
Fiscal Year Ending December 31
2011-2017 2012-2017
2009A 2010A 2011A 2012E 2013E 2014E 2015E 2016E 2017E CAGR CAGR
Revenue
Baquting 264.5 297.4 272.9 270.0 282.2 310.4 341.4 375.5 413.1 7.2% 8.9%
Kaitong 4.7 11.7 13.5 15.5 17.8 20.5 23.6 30.7% 15.0%
Alpha Lipoic Acid 2.9 3.3 3.8 4.4 5.1 5.8 N/A 15.0%
Other 18.4 18.4 10.6 10.0 10.0 10.0 10.0 10.0 10.0(1.0)% 0.0%
Total Revenue 282.9 315.8 288.3 294.6 309.0 339.7 373.7 411.1 452.5 7.8% 9.0%
% growth (Y-o-Y) 25.5% 11.6%(8.7)% 2.2% 4.9% 9.9% 10.0% 10.0% 10.1%
Gross Profit 247.3 278.5 249.8 254.7 265.2 291.8 321.0 353.3 388.9 7.7% 8.8%
% margin 87.4% 88.2% 86.7% 86.4% 85.8% 85.9% 85.9% 85.9% 85.9%
Total Operating Expenses(166.4)(212.6)(231.2)(216.8)(227.0)(251.6)(274.3)(299.0)(325.8) 5.9% 8.5%
% of revenue 58.8% 67.3% 80.2% 73.6% 73.5% 74.1% 73.4% 72.7% 72.0%
EBIT 80.9 65.9 18.7 37.9 38.2 40.1 46.7 54.3 63.1 22.5% 10.7%
% margin 28.6% 20.9% 6.5% 12.9% 12.4% 11.8% 12.5% 13.2% 13.9%
Net Income 65.1 46.1(14.0) 30.2 30.4 32.0 37.2 43.2 50.2 N/M 10.7%
%margin 23.0% 14.6%(4.9)% 10.2% 99%. 94%. 99%. 10.5% 11.1%
Memo:
EBITDA 92.6 79.4 34.3 54.0 54.4 63.8 72.4 82.0 91.2 17.7% 11.0%
% margin 32.7% 25.1% 11.9% 18.3% 17.6% 18.8% 19.4% 19.9% 20.2%
% growth (Y-o-Y)(14.2)%(56.8)% 57.4% 0.6% 17.4% 13.4% 13.3% 11.2%
Additional Cash Flow Items
Change in Working Capital(80.5)(97.0) 60.7 43.5(7.6)(14.7)(16.3)(18.0) (19.9)
% of Change in Revenue 295.0% 220.4%(683.0)% 53.3% 47.8% 48.0% 48.0% 48.1%
% EBITDA 87.0% 122.1%(176.7)%(80.5)% 14.1% 23.0% 22.5% 21.9% 21.8%
Capital Expenditures(32.9)(52.9)(60.1)(61.5)(20.0)(20.0)(20.0)(20.0)(20.0)
% Revenue 11.6% 16.8% 20.8% 20.9% 6.5% 5.9% 5.4% 4.9% 4.4%
% EBITDA 35.5% 66.6% 175.0% 113.9% 36.8% 31.3% 27.6% 24.4% 21.9%
Source: Promise management team
1
DRAFT
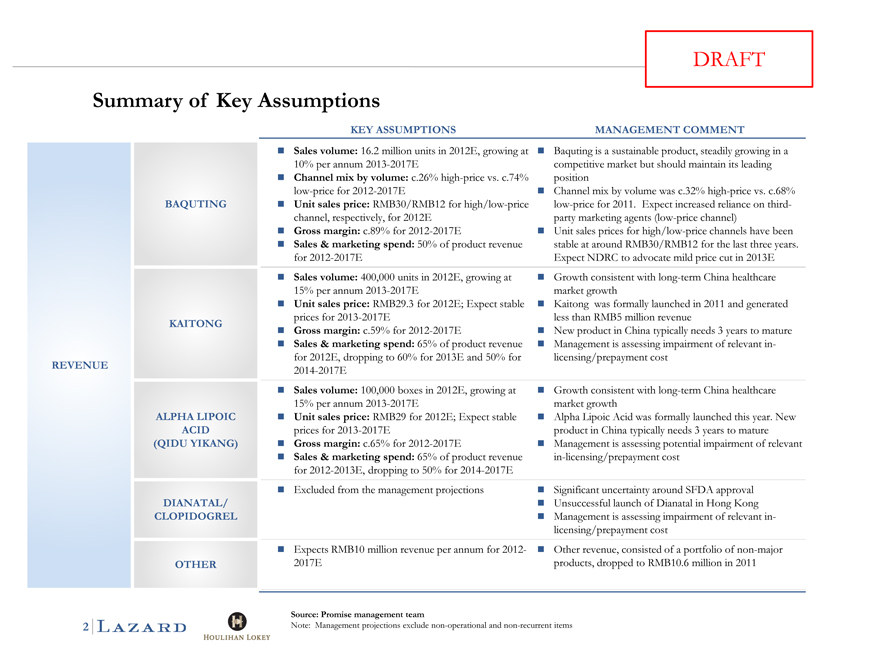
Summary of Key Assumptions
KEY ASSUMPTIONS MANAGEMENT COMMENT
„ Sales volume: 16.2 million units in 2012E, growing at „ Baquting is a sustainable product, steadily growing in a
10% per annum 2013-2017E competitive market but should maintain its leading
„ Channel mix by volume: c.26% high-price vs. c.74% position
low-price for 2012-2017E „ Channel mix by volume was c.32% high-price vs. c.68%
BAQUTING „ Unit sales price: RMB30/RMB12 for high/low-price low-price for 2011. Expect increased reliance on third-
channel, respectively, for 2012E party marketing agents (low-price channel)
„ Gross margin: c.89% for 2012-2017E „ Unit sales prices for high/low-price channels have been
„ Sales & marketing spend: 50% of product revenue stable at around RMB30/RMB12 for the last three years.
for 2012-2017E Expect NDRC to advocate mild price cut in 2013E
„ Sales volume: 400,000 units in 2012E, growing at „ Growth consistent with long-term China healthcare
15% per annum 2013-2017E market growth
„ Unit sales price: RMB29.3 for 2012E; Expect stable „ Kaitong was formally launched in 2011 and generated
prices for 2013-2017E less than RMB5 million revenue
KAITONG „ Gross margin: c.59% for 2012-20017E „ New product in China typically needs 3 years to mature
„ Sales & marketing spend: 65% of product revenue „ Management is assessing impairment of relevant in-
for 2012E, dropping to 60% for 2013E and 50% for licensing/prepayment cost
REVENUE 2014-2017E
„ Sales volume: 100,000 boxes in 2012E, growing at „ Growth consistent with long-term China healthcare
15% per annum 2013-2017E market growth
ALPHA LIPOIC „ Unit sales price: RMB29 for 2012E; Expect stable „ Alpha Lipoic Acid was formally launched this year. New
ACID prices for 2013-2017E product in China typically needs 3 years to mature
(QIDU YIKANG) „ Gross margin: c.65% for 2012-2017E „ Management is assessing potential impairment of relevant
„ Sales & marketing spend: 65% of product revenue in-licensing/prepayment cost
for 2012-2013E, dropping to 50% for 2014-2017E
„ Excluded from the management projections „ Significant uncertainty around SFDA approval
DIANATAL/ „ Unsuccessful launch of Dianatal in Hong Kong
CLOPIDOGREL „ Management is assessing impairment of relevant in-
licensing/prepayment cost
„ Expects RMB10 million revenue per annum for 2012- „ Other revenue, consisted of a portfolio of non-major
OTHER 2017E products, dropped to RMB10.6 million in 2011
Source: Promise management team
Note: Management projections exclude non-operational and non-recurrent items
2
DRAFT
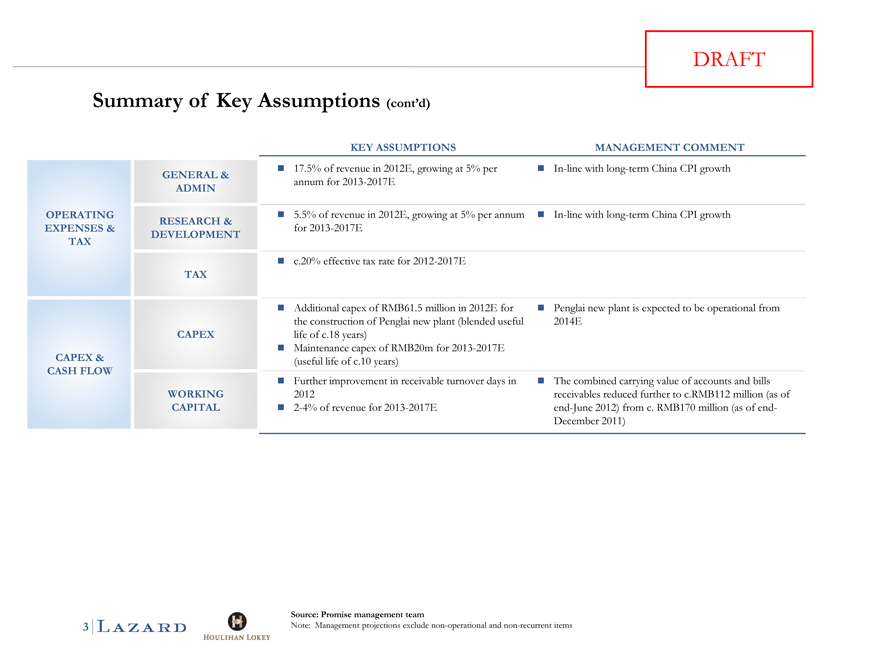
Summary of Key Assumptions (cont’d)
KEY ASSUMPTIONS MANAGEMENT COMMENT
GENERAL & „ 17.5% of revenue in 2012E, growing at 5% per „ In-line with long-term China CPI growth
ADMIN annum for 2013-2017E
OPERATING „ 5.5% of revenue in 2012E, growing at 5% per annum „ In-line with long-term China CPI growth
RESEARCH &
EXPENSES & for 2013-2017E
TAX DEVELOPMENT
„ c.20% effective tax rate for 2012-2017E
TAX
„ Additional capex of RMB61.5 million in 2012E for „ Penglai new plant is expected to be operational from
the construction of Penglai new plant (blended useful 2014E
CAPEX life of c.18 years)
„ Maintenance capex of RMB20m for 2013-2017E
CAPEX &(useful life of c.10 years)
CASH FLOW
„ Further improvement in receivable turnover days in „ The combined carrying value of accounts and bills
WORKING 2012 receivables reduced further to c.RMB112 million (as of
CAPITAL „ 2-4% of revenue for 2013-2017E end-June 2012) from c. RMB170 million (as of end-
December 2011)
Source: Promise management team
Note: Management projections exclude non-operational and non-recurrent items
3
DRAFT
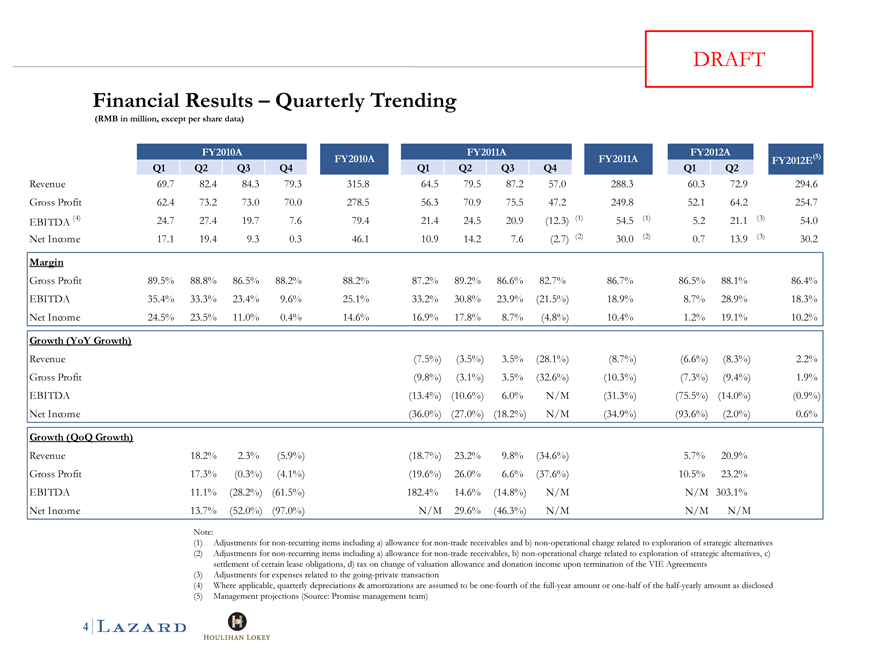
Financial Results – Quarterly Trending
(RMB in million, except per share data)
FY2010A FY2011A FY2012A
FY2010A FY2011A FY2012E(5)
Q1 Q2 Q3 Q4 Q1 Q2 Q3 Q4 Q1 Q2
Revenue 69.7 82.4 84.3 79.3 315.8 64.5 79.5 87.2 57.0 288.3 60.3 72.9 294.6
Gross Profit 62.4 73.2 73.0 70.0 278.5 56.3 70.9 75.5 47.2 249.8 52.1 64.2 254.7
EBITDA (4) 24.7 27.4 19.7 7.6 79.4 21.4 24.5 20.9(12.3)(1) 54.5(1) 5.2 21.1(3) 54.0
Net Income 17.1 19.4 9.3 0.3 46.1 10.9 14.2 7.6(2.7)(2) 30.0(2) 0.7 13.9(3) 30.2
Margin
Gross Profit 89.5% 88.8% 86.5% 88.2% 88.2% 87.2% 89.2% 86.6% 82.7% 86.7% 86.5% 88.1% 86.4%
EBITDA 35.4% 33.3% 23.4% 9.6% 25.1% 33.2% 30.8% 23.9%(21.5%) 18.9% 8.7% 28.9% 18.3%
Net Income 24.5% 23.5% 11.0% 0.4% 14.6% 16.9% 17.8% 8.7%(4.8%) 10.4% 1.2% 19.1% 10.2%
Growth (YoY Growth)
Revenue(7.5%)(3.5%) 3.5%(28.1%)(8.7%)(6.6%)(8.3%) 2.2%
Gross Profit(9.8%)(3.1%) 3.5%(32.6%)(10.3%)(7.3%)(9.4%) 1.9%
EBITDA(13.4%)(10.6%) 6.0% N/M(31.3%)(75.5%)(14.0%)(0.9%)
Net Income(36.0%)(27.0%)(18.2%) N/M(34.9%)(93.6%)(2.0%) 0.6%
Growth (QoQ Growth)
Revenue 18.2% 2.3%(5.9%)(18.7%) 23.2% 9.8%(34.6%) 5.7% 20.9%
Gross Profit 17.3%(0.3%)(4.1%)(19.6%) 26.0% 6.6%(37.6%) 10.5% 23.2%
EBITDA 11.1%(28.2%)(61.5%) 182.4% 14.6%(14.8%) N/M N/M 303.1%
Net Income 13.7%(52.0%)(97.0%) N/M 29.6%(46.3%) N/M N/M N/M
Note:
(1) Adjustments for non-recurring items including a) allowance for non-trade receivables and b) non-operational charge related to exploration of strategic alternatives (2) Adjustments for non-recurring items including a) allowance for non-trade receivables, b) non-operational charge related to exploration of strategic alternatives, c) settlement of certain lease obligations, d) tax on change of valuation allowance and donation income upon termination of the VIE Agreements (3) Adjustments for expenses related to the going-private transaction (4) Where applicable, quarterly depreciations & amortizations are assumed to be one-fourth of the full-year amount or one-half of the half-yearly amount as disclosed (5) Management projections (Source: Promise management team)
4

Appendix
DRAFT
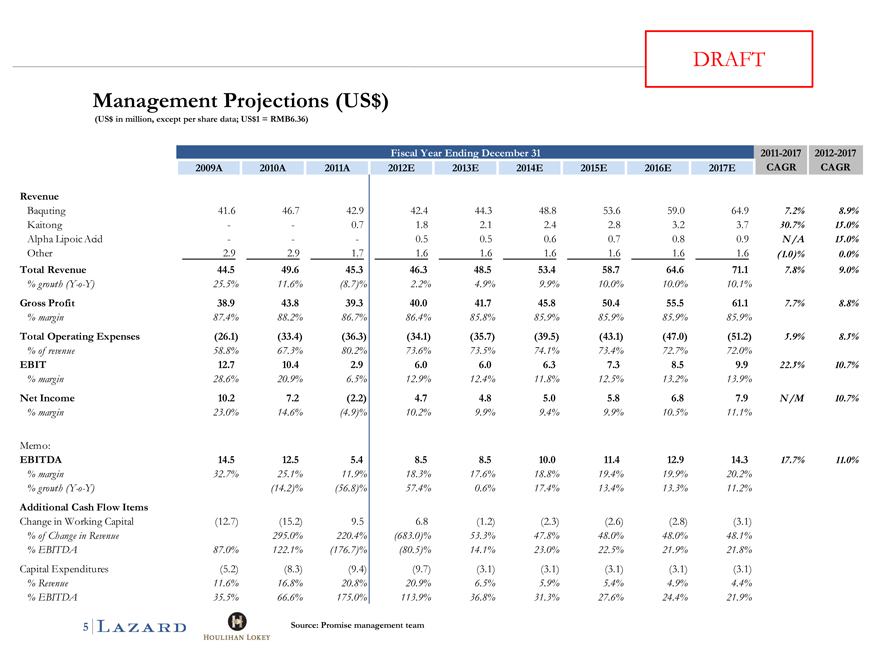
Management Projections $ (US)
$ (US in million, except per share data; $ US1 = RMB6.36)
Fiscal Year Ending December 31 2011-2017 2012-2017
2009A 2010A 2011A 2012E 2013E 2014E 2015E 2016E 2017E CAGR CAGR
Revenue
Baquting 41.6 46.7 42.9 42.4 44.3 48.8 53.6 59.0 64.9 7.2% 8.9%
Kaitong 0.7 1.8 2.1 2.4 2.8 3.2 3.7 30.7% 15.0%
Alpha Lipoic Acid 0.5 0.5 0.6 0.7 0.8 0.9 N/A 15.0%
Other 2.9 2.9 1.7 1.6 1.6 1.6 1.6 1.6 1.6(1.0)% 0.0%
Total Revenue 44.5 49.6 45.3 46.3 48.5 53.4 58.7 64.6 71.1 7.8% 9.0%
% growth (Y-o-Y) 25.5% 11.6%(8.7)% 2.2% 4.9% 9.9% 10.0% 10.0% 10.1%
Gross Profit 38.9 43.8 39.3 40.0 41.7 45.8 50.4 55.5 61.1 7.7% 8.8%
% margin 87.4% 88.2% 86.7% 86.4% 85.8% 85.9% 85.9% 85.9% 85.9%
Total Operating Expenses(26.1)(33.4)(36.3)(34.1)(35.7)(39.5)(43.1)(47.0)(51.2) 5.9% 8.5%
% of revenue 58.8% 67.3% 80.2% 73.6% 73.5% 74.1% 73.4% 72.7% 72.0%
EBIT 12.7 10.4 2.9 6.0 6.0 6.3 7.3 8.5 9.9 22.5% 10.7%
% margin 28.6% 20.9% 6.5% 12.9% 12.4% 11.8% 12.5% 13.2% 13.9%
Net Income 10.2 7.2(2.2) 4.7 4.8 5.0 5.8 6.8 7.9 N/M 10.7%
%margin 23.0% 14.6%(4.9)% 10.2% 99%. 94%. 99%. 10.5% 11.1%
Memo:
EBITDA 14.5 12.5 5.4 8.5 8.5 10.0 11.4 12.9 14.3 17.7% 11.0%
% margin 32.7% 25.1% 11.9% 18.3% 17.6% 18.8% 19.4% 19.9% 20.2%
% growth (Y-o-Y)(14.2)%(56.8)% 57.4% 0.6% 17.4% 13.4% 13.3% 11.2%
Additional Cash Flow Items
Change in Working Capital(12.7)(15.2) 9.5 6.8(1.2)(2.3)(2.6)(2.8)(3.1)
% of Change in Revenue 295.0% 220.4%(683.0)% 53.3% 47.8% 48.0% 48.0% 48.1%
% EBITDA 87.0% 122.1%(176.7)%(80.5)% 14.1% 23.0% 22.5% 21.9% 21.8%
Capital Expenditures(5.2)(8.3)(9.4)(9.7)(3.1)(3.1)(3.1)(3.1)(3.1)
% Revenue 11.6% 16.8% 20.8% 20.9% 6.5% 5.9% 5.4% 4.9% 4.4%
% EBITDA 35.5% 66.6% 175.0% 113.9% 36.8% 31.3% 27.6% 24.4% 21.9%
Source: Promise management team
5
CONFIDENTIA L
PROJECT P R O M I S E
Disclaimer
This document has been prepared by Lazard & Houlihan Lokey primarily based upon internal projections prepared by Promise management, as well as on other information provided to it and/or r publicly available information, and portions of the information herein may be based upon certain statements, estimates and forecasts with respect to anticipated future performance. The information contained herein should be considered as preliminary and indicative and does not purport to contain all the information that the recipient may desire. We have relied upon the accuracy and completeness of the foregoing information, and have not assumed any responsibility for any independent verification of such information or any independent valuation or appraisal of any of the assets or liabilities (contingent or otherwise) of any entity, or concerning solvency or fair value of any entity. To the fullest extent permitted by law, Lazard & Houlihan Lokey disclaim any responsibility for the information herein and for any omissions from such information or for any reliance that the recipient or any third party may seek to place upon such information. No representation, warranty or guarantee, express or implied, is made as to the accuracy, completeness, currency or reliability of the information herein, or any associated written or oral statement. In particular, with respect to financial projections, wehaveassumed that they have been reasonably prepared on bases reflecting the best currently available estimates and judgments of management as to future financial performance. We assume no responsibility for and express no view as to such projections or the assumptions on which they are based. The information set forth herein is based upon economic, monetary, market and other conditions as in effect on, and the information made available to us as of, the date hereof, unless indicated otherwise. While any subsequent changes in the circumstances may affect the information herein, we assume no responsibility to update or supplement the information set forth herein. These mate erials and the information contained herein are confidential and may not be disclosed publicly or made available to third parties without the prior written consent of Lazard & Houlihan Lokey. These materials shall not be used for any purpose other than that for which they were provided.
These materials are summary in nature and do not include all of the information that the recipient should evaluate in considering a possible transaction. Nothing herein shall constitute a commitment t or undertaking on the part of Lazard & Houlihan Lokey or any related party to provide any service. These materials do not constitute tax, accounting, actuarial, legal or other specialist advice, and Lazard & Houlihan Lokey shall have no duties or obligations to you in respect of these materials or other advice provided to you, except to the extent specifically set forth in an engagement or other written agreement, if any, that is entered into by Lazard & Houlihan Lokey and you. Lazard & Houlihan Lokey only act for those entities and persons whom it has identified as its client and no-one else and will not be responsible to anyone other than such clients for providing the protections afforded to clients of Lazard & Houlihan Lokey nor for providing advice.