Exhibit(c)(6)
HOULIHAN LOKEY
China Nuokang Bio-Pharmaceutical Inc.
Presentation to the Independent Committee of the Board of Directors
September 27, 2012
MERGERS & ACQUISITIONS
CAPITAL MARKETS
FINANCIAL RESTRUCTURING
FINANCIAL ADVISORY SERVICES
HL.com
Confidential
China Nuokang Bio-Pharmaceutical Inc.
Disclaimer
This presentation, and any supplemental information (written or oral) or other documents provided in connection therewith (collectively, the “materials”), are provided solely for the information of the Independent Committee of the Board of Directors (the “Committee”) of China Nuokang Bio-Pharmaceutical Inc. (the “Company”) by Houlihan Lokey in connection with the Committee’s consideration of a potential transaction (the “Transaction”) involving the Company. This presentation is incomplete without reference to, and should be considered in conjunction with, any supplemental information provided by and discussions with Houlihan Lokey in connection therewith. Any defined terms used herein shall have the meanings set forth herein, even if such defined terms have been given different meanings elsewhere in the materials. The materials are for discussion purposes only and may not be relied upon by any person or entity for any purpose except as expressly permitted by Houlihan Lokey’s engagement letter. The materials were prepared for specific persons familiar with the business and affairs of the Company for use in a specific context and were not prepared with a view to public disclosure or to conform with any disclosure standards under any state, federal or international securities laws or other laws, rules or regulations, and neither the Committee, the Company nor Houlihan Lokey takes any responsibility for the use of the materials by persons other than the Committee. The materials are provided on a confidential basis solely for the information of the Committee and may not be disclosed, summarized, reproduced, disseminated or quoted or otherwise referred to, in whole or in part, without Houlihan Lokey’s express prior written consent. Notwithstanding any other provision herein, the Company (and each employee, representative or other agent of the Company) may disclose to any and all persons without limitation of any kind, the tax treatment and tax structure of any transaction and all materials of any kind (including opinions or other tax analyses, if any) that are provided to the Company relating to such tax treatment and structure. However, any information relating to the tax treatment and tax structure shall remain confidential (and the foregoing sentence shall not apply) to the extent necessary to enable any person to comply with securities laws. For this purpose, the tax treatment of a transaction is the purported or claimed U.S. income or franchise tax treatment of the transaction and the tax structure of a transaction is any fact that may be relevant to understanding the purported or claimed U.S. income or franchise tax treatment of the transaction. If the Company plans to disclose information pursuant to the first sentence of this paragraph, the Company shall inform those to whom it discloses any such information that they may not rely upon such information for any purpose without Houlihan Lokey’s prior written consent. Houlihan Lokey is not an expert on, and nothing contained in the materials should be construed as advice with regard to, legal, accounting, regulatory, insurance, tax or other specialist matters. Houlihan Lokey’s role in reviewing any information is limited solely to performing such a review as it shall deem necessary to support its own advice and analysis and shall not be on behalf of the Committee. Any statement contained in the materials as to tax matters was neither written nor intended by Houlihan Lokey or any of its affiliates to be used, and cannot be used by any taxpayer, for the purpose of avoiding tax penalties that may be imposed on such taxpayer. If any person uses or refers to any such tax statement in promoting, marketing or recommending a partnership or other entity, investment plan or arrangement to any taxpayer, then such statement is being delivered to support the promotion or marketing of the transaction or matter addressed and such person should seek advice based on its particular circumstances from an independent tax advisor. The materials necessarily are based on financial, economic, market and other conditions as in effect on, and the information available to Houlihan Lokey as of, the date of the materials. Although subsequent developments may affect the contents of the materials, Houlihan Lokey has not undertaken, and is under no obligation, to update, revise or reaffirm the materials, except as expressly contemplated by Houlihan Lokey’s engagement letter. The materials are not intended to provide the sole basis for evaluation of the Transaction and do not purport to contain all information that may be required. The materials do not address the underlying business decision of the Company or any other party to proceed with or effect the Transaction. The materials do not constitute any opinion, nor do the materials constitute a recommendation to the Committee, any security holder of the Company or any other party as to how to vote or act with respect to any matter relating to the Transaction or otherwise or whether to buy or sell any assets or securities of any company. Houlihan Lokey’s only opinion is the opinion, if any, that is actually delivered to the Committee. The materials may not reflect information known to other professionals in other business areas of Houlihan Lokey and its affiliates. The analyses contained in the materials must be considered as a whole. Selecting portions of the analyses, analytic methods and factors without considering all analyses and factors could create a misleading or incomplete view. The materials reflect judgments and assumptions with regard to industry performance, general business, economic, regulatory, market and financial conditions and other matters, many of which are beyond the control of the participants in the Transaction. Any estimates of value contained in the materials are not necessarily indicative of actual value or predictive of future results or values, which may be significantly more or less favorable. Any analyses relating to the value of assets, businesses or securities do not purport to be appraisals or to reflect the prices at which any assets, businesses or securities may actually be sold. The materials do not constitute a valuation opinion or credit rating. In preparing the materials, Houlihan Lokey has not conducted any physical inspection or independent appraisal or evaluation of any of the assets, properties or liabilities (contingent or otherwise) of the Company or any other party and has no obligation to evaluate the solvency of the Company or any other party under any law. All budgets, projections, estimates, financial analyses, reports and other information with respect to operations (including estimates of potential cost savings and expenses) reflected in the materials have been prepared by management of the relevant party or are derived from such budgets, projections, estimates, financial analyses, reports and other information or from other sources, which involve numerous and significant subjective determinations made by management of the relevant party and/or which such management has reviewed and found reasonable. The budgets, projections and estimates contained in the materials may or may not be achieved and differences between projected results and those actually achieved may be material. Houlihan Lokey has relied upon representations made by management of Company that such budgets, projections and estimates have been reasonably prepared in good faith on bases reflecting the best currently available estimates and judgments of such management (or, with respect to information obtained from public sources, represent reasonable estimates), and Houlihan Lokey expresses no opinion with respect to such budgets, projections or estimates or the assumptions on which they are based. The scope of the financial analysis contained herein is based on discussions with the Company (including, without limitation, regarding the methodologies to be utilized), and Houlihan Lokey does not make any representation, express or implied, as to the sufficiency or adequacy of such financial analysis or the scope thereof for any particular purpose. Houlihan Lokey has assumed and relied upon the accuracy and completeness of the financial and other information provided to, discussed with or reviewed by it without (and without assuming responsibility for) independent verification of such information, makes no representation or warranty (express or implied) in respect of the accuracy or completeness of such information and has further relied upon the assurances of the Company that it is not aware of any facts or circumstances that would make such information inaccurate or misleading. In addition, Houlihan Lokey has relied upon and assumed, without independent verification, that there has been no change in the business, assets, liabilities, financial condition, results of operations, cash flows or prospects of the Company since the respective dates of the most recent financial statements and other information, financial or otherwise, provided to Houlihan Lokey that would be material to its analyses. Furthermore, and without prejudice to liability for fraud, Houlihan Lokey, its affiliates, and their respective directors, officers, employees and agents, to the extent allowed under applicable law disclaim any liability, responsibility or obligation (whether in contract, tort or otherwise) in relation to the foregoing matters. The materials are not an offer to sell or a solicitation of an indication of interest to purchase any security, option, commodity, future, loan or currency. The materials do not constitute a commitment by Houlihan Lokey or any of its affiliates to underwrite, subscribe for or place any securities, to extend or arrange credit, or to provide any other services. In the ordinary course of business, certain of Houlihan Lokey’s affiliates, as well as investment funds in which they may have financial interests, may acquire, hold or sell, long or short positions, or trade or otherwise effect transactions, in debt, equity, and other securities and financial instruments (including loans and other obligations) of, or investments in, one or more parties that may be involved in the Transaction and their respective affiliates or any currency or commodity that may be involved in the Transaction. Houlihan Lokey provides mergers and acquisitions, restructuring and other advisory services to clients. Houlihan Lokey’s personnel may make statements or provide advice that is contrary to information contained in the materials. Houlihan Lokey’s or its affiliates’ proprietary interests may conflict with the Company’s interests. Houlihan Lokey may have advised, may seek to advise and may in the future advise companies mentioned in the materials.
DRAFT
HOULIHAN LOKEY 1
China Nuokang Bio-Pharmaceutical Inc.
Table of Contents
Page
Transaction Overview 3
Financial Analysis 8
Appendix 18
Additional Financial Data 19
DRAFT
HOULIHAN LOKEY 2
Transaction Overview
Transaction Overview
Summary of Selected Transaction Terms1
Parties to the Transaction
• China Nuokang Bio-Pharmaceutical Inc. (“Nuokang” or the “Company”), a Cayman Islands company
• Kingbird Investment Inc. (“Parent”)
• Kingbird Mergerco. Inc., a wholly-owned subsidiary of Parent (“Merger Sub”)
• Mr. Baizhong Xue and his wife, Yuhan Zhu (collectively known as “Mr. Xue” or the “Chairman”)
• Anglo China Bio-technology Investment Holdings Limited and Britain Ukan Technology Investment Holdings (Group) Limited, both British Virgin Islands companies (collectively the “Founder Vehicles”)
• China Grand Enterprises (HK) Limited (“China Grand”), a company incorporated in Hong Kong and the provider of financing to Parent (“Lender”)
Form of Transaction
• Merger: Merger Sub to be merged with and into the Company, with the Company surviving the Merger as a wholly owned subsidiary of Parent
Form of Consideration
• Cash Only: each Company share (a “Company Share” or, collectively, the “Company Shares”) excluding Excluded Shares and Founder Shares will be converted into the right to receive $0.725 in cash without interest (the “Per Share Merger Consideration”) and each American Depository Share representing eight Company Shares (an “ADS” or , collectively the “ADSs”) excluding Excluded Shares and Founder Shares will be converted into the right to receive $5.80 in cash without interest (the “Per ADS Merger Consideration”)
• “Excluded Shares” shall mean (i) Company Shares owned by Parent, Merger Sub or the Company (as treasury shares, if any), or by any direct or indirect wholly owned Subsidiary of Parent, Merger Sub or the Company, in each case immediately prior to the Effective Time, and (ii) “Dissenting Shares” which are held by a shareholder of Company Shares who has validly exercised and not withdrawn or lost its right to dissent from the Merger
• “Founder Shares” shall mean Company Shares owned by Founder Vehicles
Certain Closing Conditions
• Vote requirements: Subject to the approval by two-thirds or more of shareholders voting in person or by proxy as a single class in accordance with Cayman Companies Law
• The aggregate amount of Dissenting Shares shall be less than 15% of the total outstanding Company Shares
• The Committee shall have received separate fairness opinions from Houlihan Lokey (China) Limited and Lazard Asia (Hong Kong) Limited
Company Termination Fee
• US$1.0 million
Parent Termination Fee
• US$3.0 million
Treatment of Restricted Share Units
• Shall be fully vested
Financing
• Parent has delivered to the Company a true, complete and correct copy of a loan agreement, dated as of the date hereof (the “Loan Agreement”), between Parent and China Grand, pursuant to which the Lender has agreed, subject to the terms and conditions thereof, to provide the loan described therein
Source: Draft dated September 27, 2012 of the Agreement and Plan of Merger among Kingbird Investment Inc., Kingbird Mergerco. Inc., and China Nuokang Bio-Pharmaceutical Inc. (the “Agreement”)
Note:
1. This summary is intended only as an overview of selected terms and is not intended to cover all terms or details of the Transaction; this summary is qualified by the terms and conditions of the Agreement.
DRAFT
HOULIHAN LOKEY 4
Transaction Overview
Transaction Value Overview
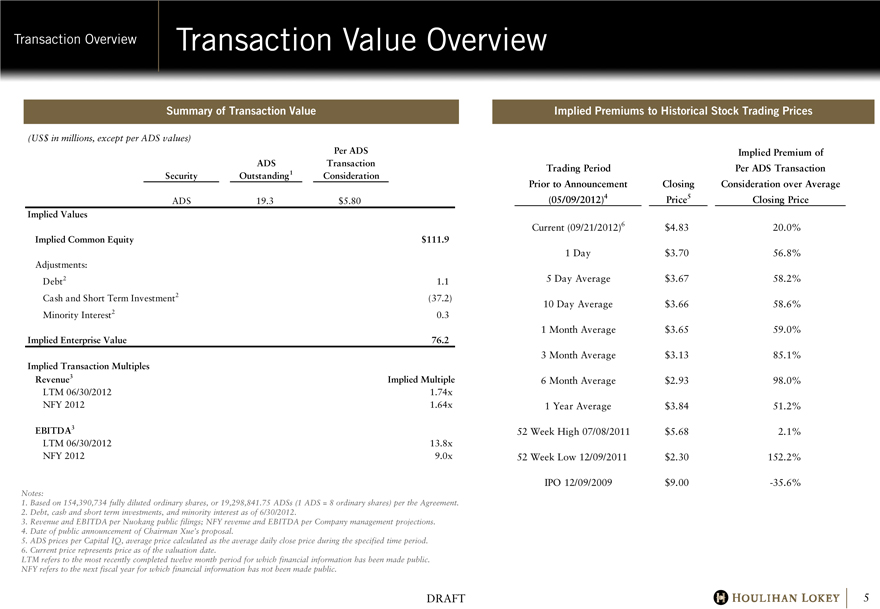
Summary of Transaction Value
(US$ in millions, except per ADS values)
Per ADS
ADS
Transaction
Security
Outstanding1
Consideration
ADS 19.3 $5.80
Implied Values
Implied Common Equity $111.9
Adjustments:
Debt2 1.1
Cash and Short Term Investment2 (37.2)
Minority Interest2 0.3
Implied Enterprise Value 76.2
Implied Transaction Multiples
Revenue3
Implied Multiple
LTM 06/30/2012 1.74x
NFY 2012 1.64x
EBITDA3
LTM 06/30/2012 13.8x
NFY 2012 9.0x
Implied Premiums to Historical Stock Trading Prices
Implied Premium of
Trading Period
Per ADS Transaction
Prior to Announcement
Closing
Consideration over Average
(05/09/2012)4
Price5
Closing Price
Current (09/21/2012)6 $4.83 20.0%
1 Day $3.70 56.8%
5 Day Average $3.67 58.2%
10 Day Average $3.66 58.6%
1 Month Average $3.65 59.0%
3 Month Average $3.13 85.1%
6 Month Average $2.93 98.0%
1 Year Average $3.84 51.2%
52 Week High 07/08/2011 $5.68 2.1%
52 Week Low 12/09/2011 $2.30 152.2%
IPO 12/09/2009 $9.00 -35.6%
Notes:
1. Based on 154,390,734 fully diluted ordinary shares, or 19,298,841.75 ADSs (1 ADS = 8 ordinary shares) per the Agreement.
2. Debt, cash and short term investments, and minority interest as of 6/30/2012.
3. Revenue and EBITDA per Nuokang public filings; NFY revenue and EBITDA per Company management projections.
4. Date of public announcement of Chairman Xue’s proposal.
5. ADS prices per Capital IQ, average price calculated as the average daily close price during the specified time period.
6. Current price represents price as of the valuation date.
LTM refers to the most recently completed twelve month period for which financial information has been made public. NFY refers to the next fiscal year for which financial information has not been made public.
DRAFT
HOULIHAN LOKEY 5
Transaction Overview
Stock Trading History
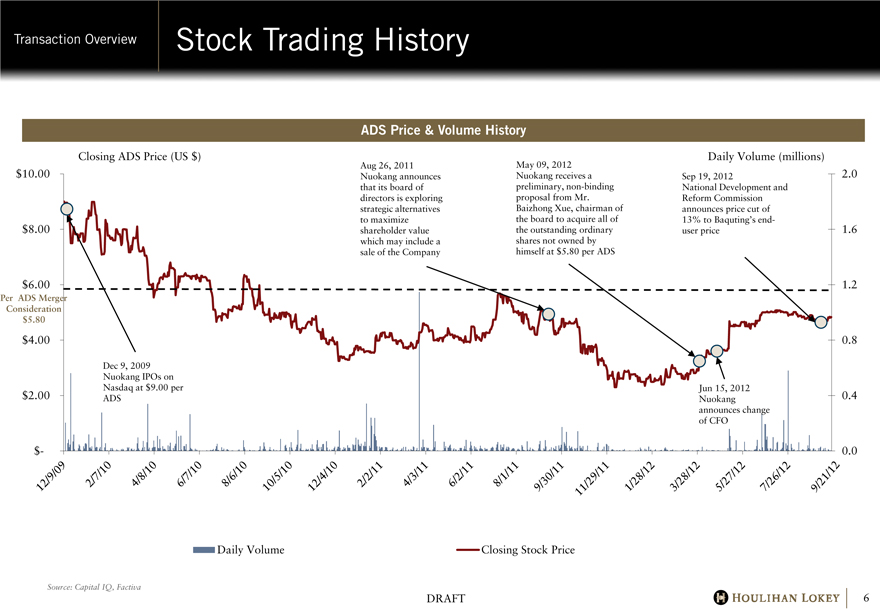
ADS Price & Volume History
Closing ADS Price (US $)
Aug 26, 2011 Nuokang announces that its board of directors is exploring strategic alternatives to maximize shareholder value which may include a sale of the Company
May 09, 2012 Nuokang receives a preliminary, non-binding proposal from Mr. Baizhong Xue, chairman of the board to acquire all of the outstanding ordinary shares not owned by himself at $5.80 per ADS
Daily Volume (millions)
Sep 19, 2012
National Development and Reform Commission announces price cut of 13% to Baquting’s end-user price
$10.00 $8.00 $6.00
Per ADS Merger Consideration $5.80
$4.00
$2.00
$-
Dec 9, 2009 Nuokang IPOs on Nasdaq at $9.00 per ADS
Jun 15, 2012 Nuokang announces change of CFO
12/9/09 2/7/10 4/8/10 6/7/10 8/6/10 10/5/10 12/4/10 2/2/11 4/3/11 6/2/11 8/1/11 9/30/11 11/29/11 1/28/12 3/28/12 5/27/12 7/26/12 9/21/12 2.0
1.6
1.2
0.8
0.4
0.0
Daily Volume
Closing Stock Price
Source: Capital IQ, Factiva
DRAFT
HOULIHAN LOKEY 6
Transaction Overview
Relative Stock Performance
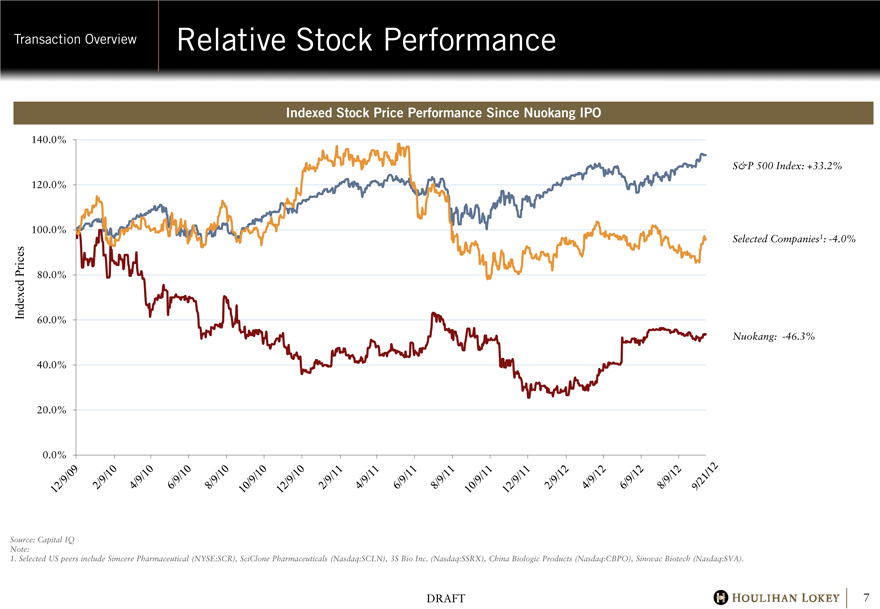
Indexed Stock Price Performance Since Nuokang IPO
Indexed Prices
140.0% 120.0% 100.0%
80.0% 60.0% 40.0% 20.0% 0.0%
12/9/09 2/9/10 4/9/10 6/9/10 8/9/10 10/9/10 12/9/10 2/9/11 4/9/11 6/9/11 8/9/11 10/9/11 12/9/11 2/9/12 4/9/12 6/9/12 8/9/12 9/21/12
S&P 500 Index: +33.2%
Selected Companies1: -4.0%
Nuokang: -46.3%
Source: Capital IQ Note:
1. Selected US peers include Simcere Pharmaceutical (NYSE:SCR), SciClone Pharmaceuticals (Nasdaq:SCLN), 3S Bio Inc. (Nasdaq:SSRX), China Biologic Products (Nasdaq:CBPO), Sinovac Biotech (Nasdaq:SVA).
DRAFT
HOULIHAN LOKEY 7
Financial Analysis
Financial Analysis
Financial Analysis Summary (Per ADS Consideration)
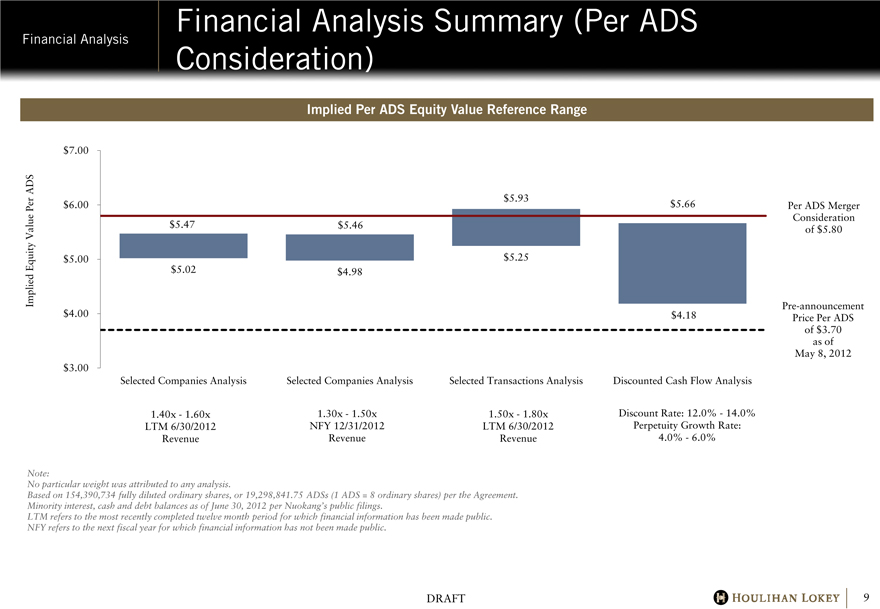
Implied Per ADS Equity Value Reference Range
Implied Equity Value Per ADS
$7.00
$6.00
$5.00
$4.00
$3.00
$5.47
$5.02
$5.46
$4.98
$5.93
$5.25
$5.66
$4.18
Per ADS Merger Consideration of $5.80
Pre-announcement Price Per ADS of $3.70 as of May 8, 2012
Selected Companies Analysis
1.40x - 1.60x LTM 6/30/2012 Revenue
Selected Companies Analysis
1.30x - 1.50x NFY 12/31/2012 Revenue
Selected Transactions Analysis
1.50x - 1.80x LTM 6/30/2012 Revenue
Discounted Cash Flow Analysis
Discount Rate: 12.0% - 14.0% Perpetuity Growth Rate: 4.0% - 6.0%
Note:
No particular weight was attributed to any analysis.
Based on 154,390,734 fully diluted ordinary shares, or 19,298,841.75 ADSs (1 ADS = 8 ordinary shares) per the Agreement. Minority interest, cash and debt balances as of June 30, 2012 per Nuokang’s public filings.
LTM refers to the most recently completed twelve month period for which financial information has been made public. NFY refers to the next fiscal year for which financial information has not been made public.
DRAFT
HOULIHAN LOKEY 9
Financial Analysis
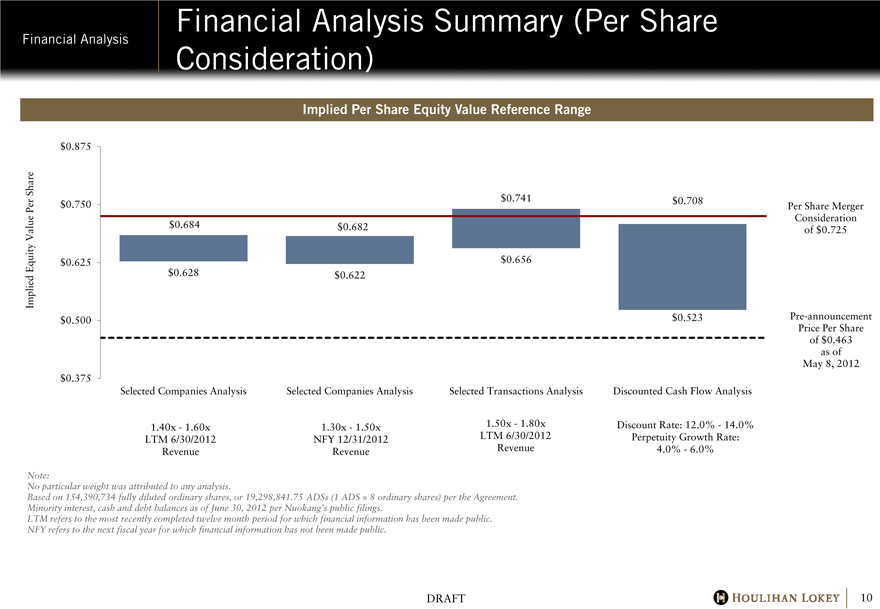
Financial Analysis Summary (Per Share Consideration)
Implied Per Share Equity Value Reference Range
Implied Equity Value Per Share
$0.875 $0.750 $0.625 $0.500 $0.375
$0.684
$0.628
$0.682
$0.622
$0.741
$0.656
$0.708
$0.523
Per Share Merger Consideration of $0.725
Pre-announcement Price Per Share of $0.463 as of May 8, 2012
Selected Companies Analysis
1.40x - 1.60x LTM 6/30/2012 Revenue
Selected Companies Analysis
1.30x - 1.50x NFY 12/31/2012 Revenue
Selected Transactions Analysis
1.50x - 1.80x LTM 6/30/2012 Revenue
Discounted Cash Flow Analysis
Discount Rate: 12.0% - 14.0% Perpetuity Growth Rate: 4.0% - 6.0%
Note:
No particular weight was attributed to any analysis.
Based on 154,390,734 fully diluted ordinary shares, or 19,298,841.75 ADSs (1 ADS = 8 ordinary shares) per the Agreement. Minority interest, cash and debt balances as of June 30, 2012 per Nuokang’s public filings.
LTM refers to the most recently completed twelve month period for which financial information has been made public. NFY refers to the next fiscal year for which financial information has not been made public.
DRAFT
HOULIHAN LOKEY 10
Financial Analysis
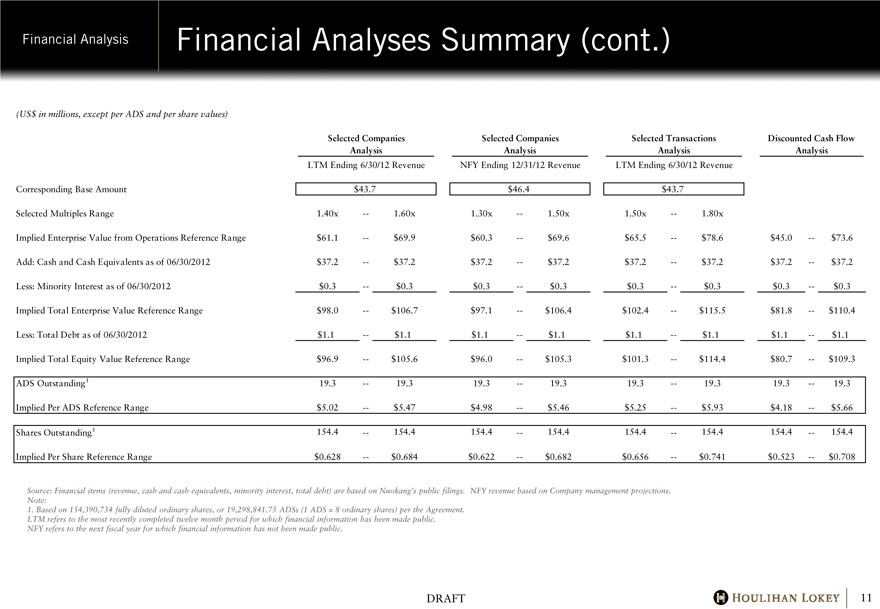
Financial Analyses Summary (cont.)
(US$ in millions, except per ADS and per share values)
Selected Companies
Selected Companies
Selected Transactions
Discounted Cash Flow
Analysis
Analysis
Analysis
Analysis
LTM Ending 6/30/12 Revenue
NFY Ending 12/31/12 Revenue
LTM Ending 6/30/12 Revenue
Corresponding Base Amount $43.7 $46.4 $43.7
Selected Multiples Range 1.40x — 1.60x 1.30x — 1.50x 1.50x — 1.80x
Implied Enterprise Value from Operations Reference Range $61.1 — $69.9 $60.3 — $69.6 $65.5 — $78.6 $45.0 — $73.6
Add: Cash and Cash Equivalents as of 06/30/2012 $37.2 — $37.2 $37.2 — $37.2 $37.2 — $37.2 $37.2 — $37.2
Less: Minority Interest as of 06/30/2012 $0.3 — $0.3 $0.3 — $0.3 $0.3 — $0.3 $0.3 — $0.3
Implied Total Enterprise Value Reference Range $98.0 — $106.7 $97.1 — $106.4 $102.4 — $115.5 $81.8 — $110.4
Less: Total Debt as of 06/30/2012 $1.1 — $1.1 $1.1 — $1.1 $1.1 — $1.1 $1.1 — $1.1
Implied Total Equity Value Reference Range $96.9 — $105.6 $96.0 — $105.3 $101.3 — $114.4 $80.7 — $109.3
ADS Outstanding1 19.3 — 19.3 19.3 — 19.3 19.3 — 19.3 19.3 — 19.3
Implied Per ADS Reference Range $5.02 — $5.47 $4.98 — $5.46 $5.25 — $5.93 $4.18 — $5.66
Shares Outstanding1 154.4 — 154.4 154.4 — 154.4 154.4 — 154.4 154.4 — 154.4
Implied Per Share Reference Range $0.628 — $0.684 $0.622 — $0.682 $0.656 — $0.741 $0.523 — $0.708
Source: Financial items (revenue, cash and cash equivalents, minority interest, total debt) are based on Nuokang’s public filings. NFY revenue based on Company management projections. Note:
1. Based on 154,390,734 fully diluted ordinary shares, or 19,298,841.75 ADSs (1 ADS = 8 ordinary shares) per the Agreement.
LTM refers to the most recently completed twelve month period for which financial information has been made public. NFY refers to the next fiscal year for which financial information has not been made public.
DRAFT
HOULIHAN LOKEY 11
Financial Analysis
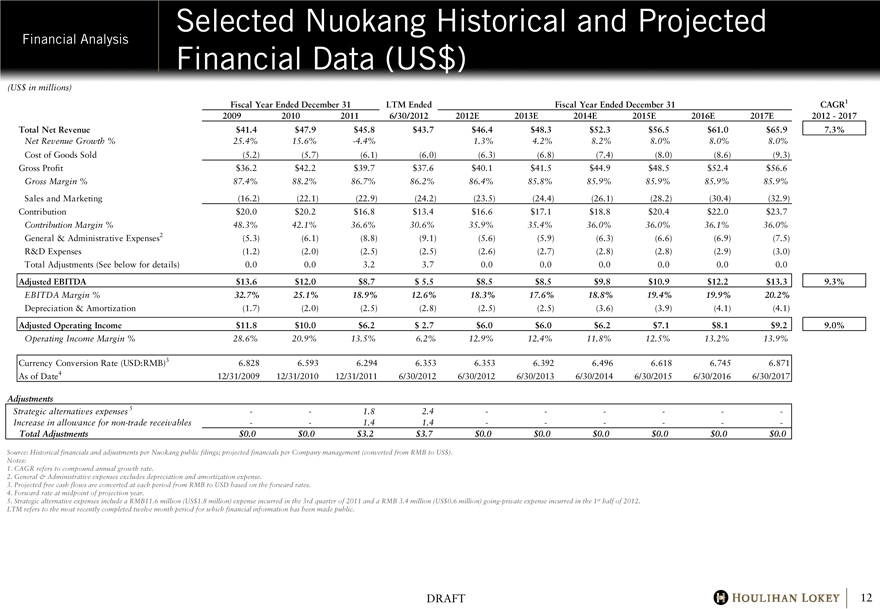
Selected Nuokang Historical and Projected Financial Data (US$)
(US$ in millions)
Fiscal Year Ended December 31
LTM Ended
Fiscal Year Ended December 31
CAGR1 2009 2010 2011 6/30/2012 2012E 2013E 2014E 2015E 2016E 2017E 2012 - 2017
Total Net Revenue $41.4 $47.9 $45.8 $43.7 $46.4 $48.3 $52.3 $56.5 $61.0 $65.9 7.3%
Net Revenue Growth % 25.4% 15.6% -4.4% 1.3% 4.2% 8.2% 8.0% 8.0% 8.0%
Cost of Goods Sold (5.2) (5.7) (6.1) (6.0) (6.3) (6.8) (7.4) (8.0) (8.6) (9.3)
Gross Profit $36.2 $42.2 $39.7 $37.6 $40.1 $41.5 $44.9 $48.5 $52.4 $56.6
Gross Margin % 87.4% 88.2% 86.7% 86.2% 86.4% 85.8% 85.9% 85.9% 85.9% 85.9%
Sales and Marketing (16.2) (22.1) (22.9) (24.2) (23.5) (24.4) (26.1) (28.2) (30.4) (32.9)
Contribution $20.0 $20.2 $16.8 $13.4 $16.6 $17.1 $18.8 $20.4 $22.0 $23.7
Contribution Margin % 48.3% 42.1% 36.6% 30.6% 35.9% 35.4% 36.0% 36.0% 36.1% 36.0%
General & Administrative Expenses2 (5.3) (6.1) (8.8) (9.1) (5.6) (5.9) (6.3) (6.6) (6.9) (7.5)
R&D Expenses (1.2) (2.0) (2.5) (2.5) (2.6) (2.7) (2.8) (2.8) (2.9) (3.0)
Total Adjustments (See below for details) 0.0 0.0 3.2 3.7 0.0 0.0 0.0 0.0 0.0 0.0
Adjusted EBITDA $13.6 $12.0 $8.7 $5.5 $8.5 $8.5 $9.8 $10.9 $12.2 $13.3 9.3%
EBITDA Margin % 32.7% 25.1% 18.9% 12.6% 18.3% 17.6% 18.8% 19.4% 19.9% 20.2%
Depreciation & Amortization (1.7) (2.0) (2.5) (2.8) (2.5) (2.5) (3.6) (3.9) (4.1) (4.1)
Adjusted Operating Income $11.8 $10.0 $6.2 $2.7 $6.0 $6.0 $6.2 $7.1 $8.1 $9.2 9.0%
Operating Income Margin % 28.6% 20.9% 13.5% 6.2% 12.9% 12.4% 11.8% 12.5% 13.2% 13.9%
Currency Conversion Rate (USD:RMB)3 6.828 6.593 6.294 6.353 6.353 6.392 6.496 6.618 6.745 6.871
As of Date4 12/31/2009 12/31/2010 12/31/2011 6/30/2012 6/30/2012 6/30/2013 6/30/2014 6/30/2015 6/30/2016 6/30/2017
Adjustments
Strategic alternatives expenses 5 — — 1.8 2.4 — — — — — —
Increase in allowance for non-trade receivables — — 1.4 1.4 — — — — — —
Total Adjustments $0.0 $0.0 $3.2 $3.7 $0.0 $0.0 $0.0 $0.0 $0.0 $0.0
Source: Historical financials and adjustments per Nuokang public filings; projected financials per Company management (converted from RMB to US$). Notes:
1. CAGR refers to compound annual growth rate.
2. General & Administrative expenses excludes depreciation and amortization expense.
3. Projected free cash flows are converted at each period from RMB to USD based on the forward rates.
4. Forward rate at midpoint of projection year.
5. Strategic alternative expenses include a RMB11.6 million (US$1.8 million) expense incurred in the 3rd quarter of 2011 and a RMB 3.4 million (US$0.6 million) going-private expense incurred in the 1st half of 2012.
LTM refers to the most recently completed twelve month period for which financial information has been made public.
DRAFT
HOULIHAN LOKEY 12
Financial Analysis
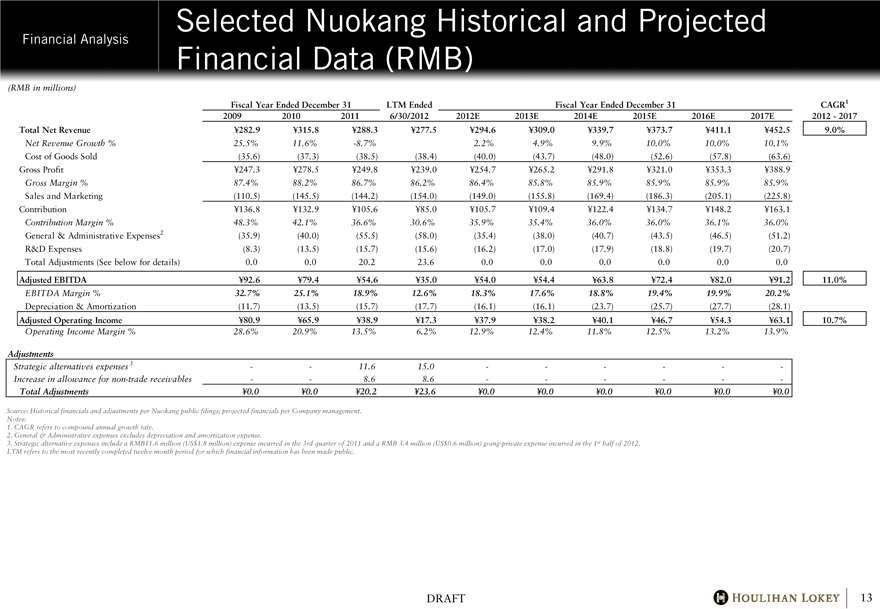
Selected Nuokang Historical and Projected Financial Data (RMB)
(RMB in millions)
Fiscal Year Ended December 31
LTM Ended
Fiscal Year Ended December 31
CAGR1
2009 2010 2011 6/30/2012 2012E 2013E 2014E 2015E 2016E 2017E 2012 - 2017
Total Net Revenue Y282.9 Y315.8 Y288.3 Y277.5 Y294.6 Y309.0 Y339.7 Y373.7 Y411.1 Y452.5 9.0%
Net Revenue Growth % 25.5% 11.6% -8.7% 2.2% 4.9% 9.9% 10.0% 10.0% 10.1%
Cost of Goods Sold (35.6) (37.3) (38.5) (38.4) (40.0) (43.7) (48.0) (52.6) (57.8) (63.6)
Gross Profit Y247.3 Y278.5 Y249.8 Y239.0 Y254.7 Y265.2 Y291.8 Y321.0 Y353.3 Y388.9
Gross Margin % 87.4% 88.2% 86.7% 86.2% 86.4% 85.8% 85.9% 85.9% 85.9% 85.9%
Sales and Marketing (110.5) (145.5) (144.2) (154.0) (149.0) (155.8) (169.4) (186.3) (205.1) (225.8)
Contribution Y136.8 Y132.9 Y105.6 Y85.0 Y105.7 Y109.4 Y122.4 Y134.7 Y148.2 Y163.1
Contribution Margin % 48.3% 42.1% 36.6% 30.6% 35.9% 35.4% 36.0% 36.0% 36.1% 36.0%
General & Administrative Expenses2 (35.9) (40.0) (55.5) (58.0) (35.4) (38.0) (40.7) (43.5) (46.5) (51.2)
R&D Expenses (8.3) (13.5) (15.7) (15.6) (16.2) (17.0) (17.9) (18.8) (19.7) (20.7)
Total Adjustments (See below for details) 0.0 0.0 20.2 23.6 0.0 0.0 0.0 0.0 0.0 0.0
Adjusted EBITDA Y92.6 Y79.4 Y54.6 Y35.0 Y54.0 Y54.4 Y63.8 Y72.4 Y82.0 Y91.2 11.0%
EBITDA Margin % 32.7% 25.1% 18.9% 12.6% 18.3% 17.6% 18.8% 19.4% 19.9% 20.2%
Depreciation & Amortization (11.7) (13.5) (15.7) (17.7) (16.1) (16.1) (23.7) (25.7) (27.7) (28.1)
Adjusted Operating Income Y80.9 Y65.9 Y38.9 Y17.3 Y37.9 Y38.2 Y40.1 Y46.7 Y54.3 Y63.1 10.7%
Operating Income Margin % 28.6% 20.9% 13.5% 6.2% 12.9% 12.4% 11.8% 12.5% 13.2% 13.9%
Adjustments
Strategic alternatives expenses 3 — — 11.6 15.0 — — — — — —
Increase in allowance for non-trade receivables — — 8.6 8.6 — — — — — —
Total Adjustments Y0.0 Y0.0 Y20.2 Y23.6 Y0.0 Y0.0 Y0.0 Y0.0 Y0.0 Y0.0
Source: Historical financials and adjustments per Nuokang public filings; projected financials per Company management. Notes:
1. CAGR refers to compound annual growth rate.
2. General & Administrative expenses excludes depreciation and amortization expense.
3. Strategic alternative expenses include a RMB11.6 million (US$1.8 million) expense incurred in the 3rd quarter of 2011 and a RMB 3.4 million (US$0.6 million) going-private expense incurred in the 1st half of 2012.
LTM refers to the most recently completed twelve month period for which financial information has been made public.
DRAFT
HOULIHAN LOKEY 13
Financial Analysis
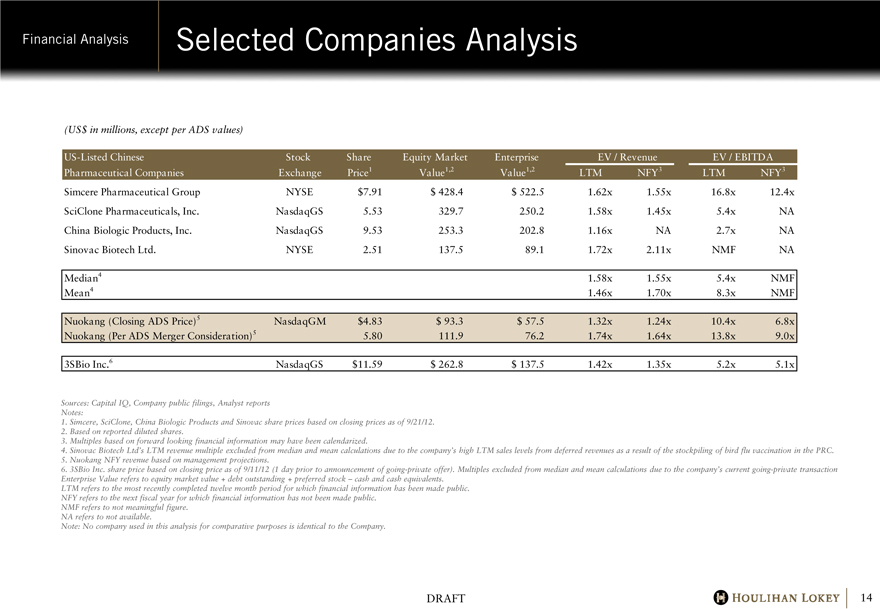
Selected Companies Analysis
(US$ in millions, except per ADS values)
US-Listed Chinese
Stock
Share
Equity Market
Enterprise
EV / Revenue
EV / EBITDA
Pharmaceutical Companies
Exchange
Price1
Value1,2
Value1,2
LTM
NFY3
LTM
NFY3
Simcere Pharmaceutical Group NYSE $7.91 $428.4 $522.5 1.62x 1.55x 16.8x 12.4x
SciClone Pharmaceuticals, Inc. NasdaqGS 5.53 329.7 250.2 1.58x 1.45x 5.4x NA
China Biologic Products, Inc. NasdaqGS 9.53 253.3 202.8 1.16x NA 2.7x NA
Sinovac Biotech Ltd. NYSE 2.51 137.5 89.1 1.72x 2.11x NMF NA
Median4 1.58x 1.55x 5.4x NMF
Mean4 1.46x 1.70x 8.3x NMF
Nuokang (Closing ADS Price)5 NasdaqGM $4.83 $93.3 $57.5 1.32x 1.24x 10.4x 6.8x
Nuokang (Per ADS Merger Consideration)5 5.80 111.9 76.2 1.74x 1.64x 13.8x 9.0x
3SBio Inc.6 NasdaqGS $11.59 $262.8 $137.5 1.42x 1.35x 5.2x 5.1x
Sources: Capital IQ, Company public filings, Analyst reports Notes:
1. Simcere, SciClone, China Biologic Products and Sinovac share prices based on closing prices as of 9/21/12.
2. Based on reported diluted shares.
3. Multiples based on forward looking financial information may have been calendarized.
4. Sinovac Biotech Ltd’s LTM revenue multiple excluded from median and mean calculations due to the company’s high LTM sales levels from deferred revenues as a result of the stockpiling of bird flu vaccination in the PRC.
5. Nuokang NFY revenue based on management projections.
6. 3SBio Inc. share price based on closing price as of 9/11/12 (1 day prior to announcement of going-private offer). Multiples excluded from median and mean calculations due to the company’s current going-private transaction Enterprise Value refers to equity market value + debt outstanding + preferred stock – cash and cash equivalents.
LTM refers to the most recently completed twelve month period for which financial information has been made public. NFY refers to the next fiscal year for which financial information has not been made public.
NMF refers to not meaningful figure. NA refers to not available.
Note: No company used in this analysis for comparative purposes is identical to the Company.
DRAFT
HOULIHAN LOKEY 14
Financial Analysis
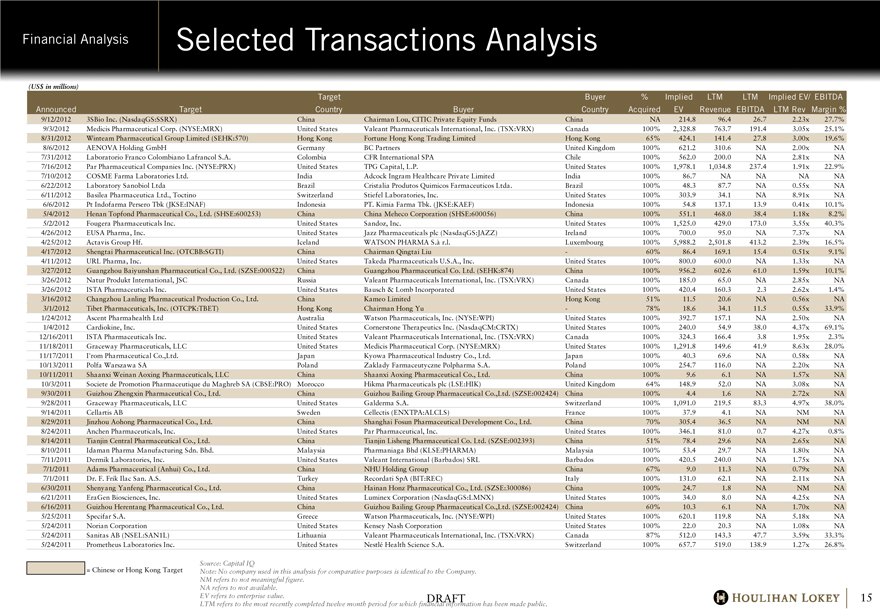
Selected Transactions Analysis
(US$ in millions)
Target Buyer % Implied LTM LTM Implied EV/ EBITDA
Announced Target Country Buyer Country Acquired EV Revenue EBITDA LTM Rev Margin %
9/12/2012 3SBio Inc. (NasdaqGS:SSRX) China Chairman Lou, CITIC Private Equity Funds China NA 214.8 96.4 26.7 2.23x 27.7%
9/3/2012 Medicis Pharmaceutical Corp. (NYSE:MRX) United States Valeant Pharmaceuticals International, Inc. (TSX:VRX) Canada 100% 2,328.8 763.7 191.4 3.05x 25.1%
8/31/2012 Winteam Pharmaceutical Group Limited (SEHK:570) Hong Kong Fortune Hong Kong Trading Limited Hong Kong 65% 424.1 141.4 27.8 3.00x 19.6%
8/6/2012 AENOVA Holding GmbH Germany BC Partners United Kingdom 100% 621.2 310.6 NA 2.00x NA
7/31/2012 Laboratorio Franco Colombiano Lafrancol S.A. Colombia CFR International SPA Chile 100% 562.0 200.0 NA 2.81x NA
7/16/2012 Par Pharmaceutical Companies Inc. (NYSE:PRX) United States TPG Capital, L.P. United States 100% 1,978.1 1,034.8 237.4 1.91x 22.9%
7/10/2012 COSME Farma Laboratories Ltd. India Adcock Ingram Healthcare Private Limited India 100% 86.7 NA NA NA NA
6/22/2012 Laboratory Sanobiol Ltda Brazil Cristalia Produtos Quimicos Farmaceuticos Ltda. Brazil 100% 48.3 87.7 NA 0.55x NA
6/11/2012 Basilea Pharmaceutica Ltd., Toctino Switzerland Stiefel Laboratories, Inc. United States 100% 303.9 34.1 NA 8.91x NA
6/6/2012 Pt Indofarma Persero Tbk (JKSE:INAF) Indonesia PT. Kimia Farma Tbk. (JKSE:KAEF) Indonesia 100% 54.8 137.1 13.9 0.41x 10.1%
5/4/2012 Henan Topfond Pharmaceutical Co., Ltd. (SHSE:600253) China China Meheco Corporation (SHSE:600056) China 100% 551.1 468.0 38.4 1.18x 8.2%
5/2/2012 Fougera Pharmaceuticals Inc. United States Sandoz, Inc. United States 100% 1,525.0 429.0 173.0 3.55x 40.3%
4/26/2012 EUSA Pharma, Inc. United States Jazz Pharmaceuticals plc (NasdaqGS:JAZZ) Ireland 100% 700.0 95.0 NA 7.37x NA
4/25/2012 Actavis Group Hf. Iceland WATSON PHARMA S.à r.l. Luxembourg 100% 5,988.2 2,501.8 413.2 2.39x 16.5%
4/17/2012 Shengtai Pharmaceutical Inc. (OTCBB:SGTI) China Chairman Qingtai Liu — 60% 86.4 169.1 15.4 0.51x 9.1%
4/11/2012 URL Pharma, Inc. United States Takeda Pharmaceuticals U.S.A., Inc. United States 100% 800.0 600.0 NA 1.33x NA
3/27/2012 Guangzhou Baiyunshan Pharmaceutical Co., Ltd. (SZSE:000522) China Guangzhou Pharmaceutical Co. Ltd. (SEHK:874) China 100% 956.2 602.6 61.0 1.59x 10.1%
3/26/2012 Natur Produkt International, JSC Russia Valeant Pharmaceuticals International, Inc. (TSX:VRX) Canada 100% 185.0 65.0 NA 2.85x NA
3/26/2012 ISTA Pharmaceuticals Inc. United States Bausch & Lomb Incorporated United States 100% 420.4 160.3 2.3 2.62x 1.4%
3/16/2012 Changzhou Lanling Pharmaceutical Production Co., Ltd. China Kameo Limited Hong Kong 51% 11.5 20.6 NA 0.56x NA
3/1/2012 Tibet Pharmaceuticals, Inc. (OTCPK:TBET) Hong Kong Chairman Hong Yu — 78% 18.6 34.1 11.5 0.55x 33.9%
1/24/2012 Ascent Pharmahealth Ltd Australia Watson Pharmaceuticals, Inc. (NYSE:WPI) United States 100% 392.7 157.1 NA 2.50x NA
1/4/2012 Cardiokine, Inc. United States Cornerstone Therapeutics Inc. (NasdaqCM:CRTX) United States 100% 240.0 54.9 38.0 4.37x 69.1%
12/16/2011 ISTA Pharmaceuticals Inc. United States Valeant Pharmaceuticals International, Inc. (TSX:VRX) Canada 100% 324.3 166.4 3.8 1.95x 2.3%
11/18/2011 Graceway Pharmaceuticals, LLC United States Medicis Pharmaceutical Corp. (NYSE:MRX) United States 100% 1,291.8 149.6 41.9 8.63x 28.0%
11/17/2011 I’rom Pharmaceutical Co.,Ltd. Japan Kyowa Pharmaceutical Industry Co., Ltd. Japan 100% 40.3 69.6 NA 0.58x NA
10/13/2011 Polfa Warszawa SA Poland Zaklady Farmaceutyczne Polpharma S.A. Poland 100% 254.7 116.0 NA 2.20x NA
10/11/2011 Shaanxi Weinan Aoxing Pharmaceuticals, LLC China Shaanxi Aoxing Pharmaceutical Co., Ltd. China 100% 9.6 6.1 NA 1.57x NA
10/3/2011 Societe de Promotion Pharmaceutique du Maghreb SA (CBSE:PRO) Morocco Hikma Pharmaceuticals plc (LSE:HIK) United Kingdom 64% 148.9 52.0 NA 3.08x NA
9/30/2011 Guizhou Zhengxin Pharmaceutical Co., Ltd. China Guizhou Bailing Group Pharmaceutical Co.,Ltd. (SZSE:002424) China 100% 4.4 1.6 NA 2.72x NA
9/28/2011 Graceway Pharmaceuticals, LLC United States Galderma S.A. Switzerland 100% 1,091.0 219.5 83.3 4.97x 38.0%
9/14/2011 Cellartis AB Sweden Cellectis (ENXTPA:ALCLS) France 100% 37.9 4.1 NA NM NA
8/29/2011 Jinzhou Aohong Pharmaceutical Co., Ltd. China Shanghai Fosun Pharmaceutical Development Co., Ltd. China 70% 305.4 36.5 NA NM NA
8/24/2011 Anchen Pharmaceuticals, Inc. United States Par Pharmaceutical, Inc. United States 100% 346.1 81.0 0.7 4.27x 0.8%
8/14/2011 Tianjin Central Pharmaceutical Co., Ltd. China Tianjin Lisheng Pharmaceutical Co. Ltd. (SZSE:002393) China 51% 78.4 29.6 NA 2.65x NA
8/10/2011 Idaman Pharma Manufacturing Sdn. Bhd. Malaysia Pharmaniaga Bhd (KLSE:PHARMA) Malaysia 100% 53.4 29.7 NA 1.80x NA
7/11/2011 Dermik Laboratories, Inc. United States Valeant International (Barbados) SRL Barbados 100% 420.5 240.0 NA 1.75x NA
7/1/2011 Adams Pharmaceutical (Anhui) Co., Ltd. China NHU Holding Group China 67% 9.0 11.3 NA 0.79x NA
7/1/2011 Dr. F. Frik Ilac San. A.S. Turkey Recordati SpA (BIT:REC) Italy 100% 131.0 62.1 NA 2.11x NA
6/30/2011 Shenyang Yanfeng Pharmaceutical Co., Ltd. China Hainan Honz Pharmaceutical Co., Ltd. (SZSE:300086) China 100% 24.7 1.8 NA NM NA
6/21/2011 EraGen Biosciences, Inc. United States Luminex Corporation (NasdaqGS:LMNX) United States 100% 34.0 8.0 NA 4.25x NA
6/16/2011 Guizhou Herentang Pharmaceutical Co., Ltd. China Guizhou Bailing Group Pharmaceutical Co.,Ltd. (SZSE:002424) China 60% 10.3 6.1 NA 1.70x NA
5/25/2011 Specifar S.A. Greece Watson Pharmaceuticals, Inc. (NYSE:WPI) United States 100% 620.1 119.8 NA 5.18x NA
5/24/2011 Norian Corporation United States Kensey Nash Corporation United States 100% 22.0 20.3 NA 1.08x NA
5/24/2011 Sanitas AB (NSEL:SAN1L) Lithuania Valeant Pharmaceuticals International, Inc. (TSX:VRX) Canada 87% 512.0 143.3 47.7 3.59x 33.3%
5/24/2011 Prometheus Laboratories Inc. United States Nestlé Health Science S.A. Switzerland 100% 657.7 519.0 138.9 1.27x 26.8%
= Chinese or Hong Kong Target
Source: Capital IQ
Note: No company used in this analysis for comparative purposes is identical to the Company. NM refers to not meaningful figure.
NA refers to not available.
EV refers to enterprise value.
LTM refers to the most recently completed twelve month period for which financial information has been made public.
DRAFT
HOULIHAN LOKEY 15
Financial Analysis
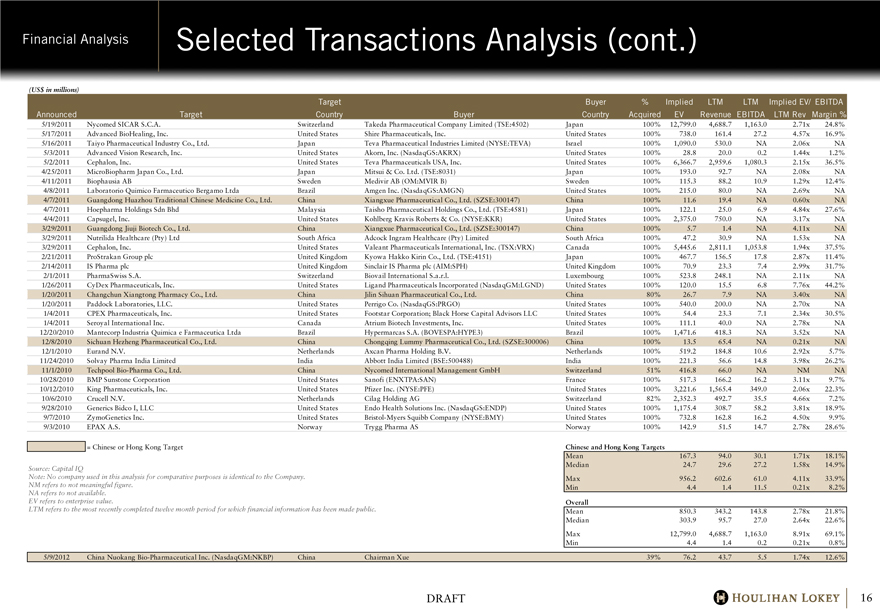
Selected Transactions Analysis (cont.)
(US$ in millions)
Announced Target Target Country Buyer Buyer Country % Acquired Implied EV LTM Revenue LTM EBITDA Implied EV/ LTM Rev EBITDA Margin %
5/19/2011 Nycomed SICAR S.C.A. Switzerland Takeda Pharmaceutical Company Limited (TSE:4502) Japan 100% 12,799.0 4,688.7 1,163.0 2.71x 24.8%
5/17/2011 Advanced BioHealing, Inc. United States Shire Pharmaceuticals, Inc. United States 100% 738.0 161.4 27.2 4.57x 16.9%
5/16/2011 Taiyo Pharmaceutical Industry Co., Ltd. Japan Teva Pharmaceutical Industries Limited (NYSE:TEVA) Israel 100% 1,090.0 530.0 NA 2.06x NA
5/3/2011 Advanced Vision Research, Inc. United States Akorn, Inc. (NasdaqGS:AKRX) United States 100% 28.8 20.0 0.2 1.44x 1.2%
5/2/2011 Cephalon, Inc. United States Teva Pharmaceuticals USA, Inc. United States 100% 6,366.7 2,959.6 1,080.3 2.15x 36.5%
4/25/2011 MicroBiopharm Japan Co., Ltd. Japan Mitsui & Co. Ltd. (TSE:8031) Japan 100% 193.0 92.7 NA 2.08x NA
4/11/2011 Biophausia AB Sweden Medivir AB (OM:MVIR B) Sweden 100% 115.3 88.2 10.9 1.29x 12.4%
4/8/2011 Laboratorio Quimico Farmaceutico Bergamo Ltda Brazil Amgen Inc. (NasdaqGS:AMGN) United States 100% 215.0 80.0 NA 2.69x NA
4/7/2011 Guangdong Huazhou Traditional Chinese Medicine Co., Ltd. China Xiangxue Pharmaceutical Co., Ltd. (SZSE:300147) China 100% 11.6 19.4 NA 0.60x NA
4/7/2011 Hoepharma Holdings Sdn Bhd Malaysia Taisho Pharmaceutical Holdings Co., Ltd. (TSE:4581) Japan 100% 122.1 25.0 6.9 4.84x 27.6%
4/4/2011 Capsugel, Inc. United States Kohlberg Kravis Roberts & Co. (NYSE:KKR) United States 100% 2,375.0 750.0 NA 3.17x NA
3/29/2011 Guangdong Jiuji Biotech Co., Ltd. China Xiangxue Pharmaceutical Co., Ltd. (SZSE:300147) China 100% 5.7 1.4 NA 4.11x NA
3/29/2011 Nutrilida Healthcare (Pty) Ltd South Africa Adcock Ingram Healthcare (Pty) Limited South Africa 100% 47.2 30.9 NA 1.53x NA
3/29/2011 Cephalon, Inc. United States Valeant Pharmaceuticals International, Inc. (TSX:VRX) Canada 100% 5,445.6 2,811.1 1,053.8 1.94x 37.5%
2/21/2011 ProStrakan Group plc United Kingdom Kyowa Hakko Kirin Co., Ltd. (TSE:4151) Japan 100% 467.7 156.5 17.8 2.87x 11.4%
2/14/2011 IS Pharma plc United Kingdom Sinclair IS Pharma plc (AIM:SPH) United Kingdom 100% 70.9 23.3 7.4 2.99x 31.7%
2/1/2011 PharmaSwiss S.A. Switzerland Biovail International S.a.r.l. Luxembourg 100% 523.8 248.1 NA 2.11x NA
1/26/2011 CyDex Pharmaceuticals, Inc. United States Ligand Pharmaceuticals Incorporated (NasdaqGM:LGND) United States 100% 120.0 15.5 6.8 7.76x 44.2%
1/20/2011 Changchun Xiangtong Pharmacy Co., Ltd. China Jilin Sihuan Pharmaceutical Co., Ltd. China 80% 26.7 7.9 NA 3.40x NA
1/20/2011 Paddock Laboratories, LLC. United States Perrigo Co. (NasdaqGS:PRGO) United States 100% 540.0 200.0 NA 2.70x NA
1/4/2011 CPEX Pharmaceuticals, Inc. United States Footstar Corporation; Black Horse Capital Advisors LLC United States 100% 54.4 23.3 7.1 2.34x 30.5%
1/4/2011 Seroyal International Inc. Canada Atrium Biotech Investments, Inc. United States 100% 111.1 40.0 NA 2.78x NA
12/20/2010 Mantecorp Industria Quimica e Farmaceutica Ltda Brazil Hypermarcas S.A. (BOVESPA:HYPE3) Brazil 100% 1,471.6 418.3 NA 3.52x NA
12/8/2010 Sichuan Hezheng Pharmaceutical Co., Ltd. China Chongqing Lummy Pharmaceutical Co., Ltd. (SZSE:300006) China 100% 13.5 65.4 NA 0.21x NA
12/1/2010 Eurand N.V. Netherlands Axcan Pharma Holding B.V. Netherlands 100% 519.2 184.8 10.6 2.92x 5.7%
11/24/2010 Solvay Pharma India Limited India Abbott India Limited (BSE:500488) India 100% 221.3 56.6 14.8 3.98x 26.2%
11/1/2010 Techpool Bio-Pharma Co., Ltd. China Nycomed International Management GmbH Switzerland 51% 416.8 66.0 NA NM NA
10/28/2010 BMP Sunstone Corporation United States Sanofi (ENXTPA:SAN) France 100% 517.3 166.2 16.2 3.11x 9.7%
10/12/2010 King Pharmaceuticals, Inc. United States Pfizer Inc. (NYSE:PFE) United States 100% 3,221.6 1,565.4 349.0 2.06x 22.3%
10/6/2010 Crucell N.V. Netherlands Cilag Holding AG Switzerland 82% 2,352.3 492.7 35.5 4.66x 7.2%
9/28/2010 Generics Bidco I, LLC United States Endo Health Solutions Inc. (NasdaqGS:ENDP) United States 100% 1,175.4 308.7 58.2 3.81x 18.9%
9/7/2010 ZymoGenetics Inc. United States Bristol-Myers Squibb Company (NYSE:BMY) United States 100% 732.8 162.8 16.2 4.50x 9.9%
9/3/2010 EPAX A.S. Norway Trygg Pharma AS Norway 100% 142.9 51.5 14.7 2.78x 28.6%
Chinese and Hong Kong Targets
Mean 167.3 94.0 30.1 1.71x 18.1%
Median 24.7 29.6 27.2 1.58x 14.9%
Max 956.2 602.6 61.0 4.11x 33.9%
Min 4.4 1.4 11.5 0.21x 8.2%
Overall
Mean 850.3 343.2 143.8 2.78x 21.8%
Median 303.9 95.7 27.0 2.64x 22.6%
Max 12,799.0 4,688.7 1,163.0 8.91x 69.1%
Min 4.4 1.4 0.2 0.21x 0.8%
5/9/2012 China Nuokang Bio-Pharmaceutical Inc. (NasdaqGM:NKBP) China Chairman Xue 39% 76.2 43.7 5.5 1.74x 12.6%
= Chinese or Hong Kong Target
Source: Capital IQ
Note: No company used in this analysis for comparative purposes is identical to the Company. NM refers to not meaningful figure.
NA refers to not available. EV refers to enterprise value.
LTM refers to the most recently completed twelve month period for which financial information has been made public.
DRAFT
HOULIHAN LOKEY 16
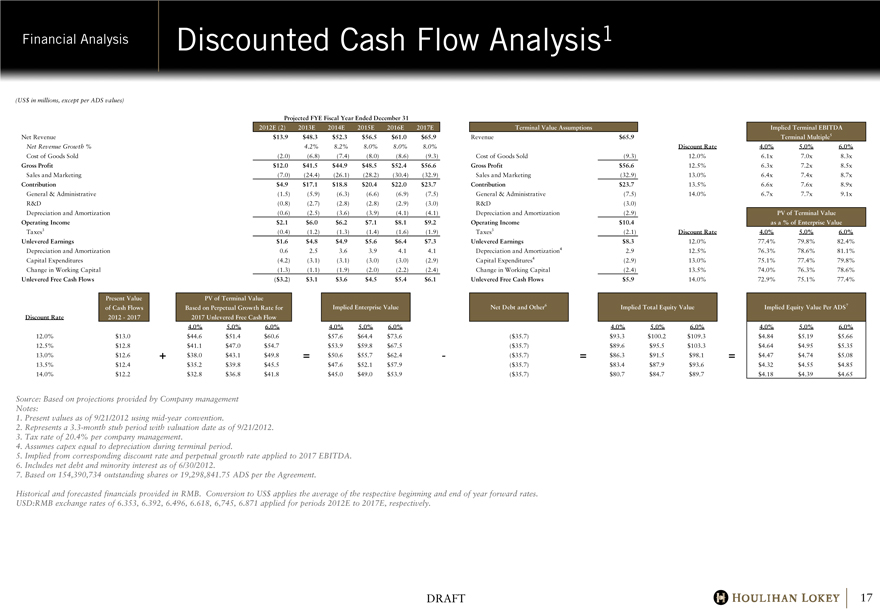
Financial Analysis Discounted Cash Flow Analysis1 (US$ in millions, except per ADS values) Projected FYE Fiscal Year Ended December 31 2012E (2) 2013E 2014E 2015E 2016E 2017E Terminal Value Assumptions Implied Terminal EBITDA Net Revenue
$13.9 $48.3 $52.3 $56.5 $61.0 $65.9 Revenue $65.9 Terminal Multiple5 Net Revenue Growth % 4.2% 8.2% 8.0% 8.0% 8.0%
Discount Rate 4.0% 5.0% 6.0% Cost of Goods Sold (2.0) (6.8) (7.4) (8.0) (8.6) (9.3) Cost of Goods Sold (9.3) 12.0% 6.1x 7.0x 8.3x Gross Profit $12.0 $41.5 $44.9 $48.5 $52.4 $56.6 Gross Profit $56.6 12.5% 6.3x 7.2x 8.5x Sales and Marketing (7.0) (24.4) (26.1) (28.2) (30.4) (32.9) Sales and Marketing (32.9) 13.0% 6.4x 7.4x 8.7x Contribution $4.9 $17.1 $18.8 $20.4 $22.0 $23.7
Contribution $23.7 13.5% 6.6x 7.6x 8.9x General & Administrative (1.5) (5.9) (6.3) (6.6) (6.9) (7.5) General & Administrative (7.5) 14.0% 6.7x 7.7x 9.1x R&D (0.8) (2.7) (2.8) (2.8) (2.9) (3.0) R&D (3.0) Depreciation and Amortization (0.6) (2.5) (3.6) (3.9) (4.1) (4.1) Depreciation and Amortization (2.9) PV of Terminal Value Operating Income $2.1 $6.0 $6.2 $7.1 $8.1 $9.2
Operating Income $10.4 as a % of Enterprise Value Taxes3 (0.4) (1.2) (1.3) (1.4) (1.6) (1.9) Taxes3 (2.1) Discount Rate 4.0% 5.0% 6.0% Unlevered Earnings $1.6 $4.8 $4.9 $5.6 $6.4 $7.3 Unlevered Earnings $8.3 12.0% 77.4% 79.8% 82.4%
Depreciation and Amortization 0.6 2.5 3.6 3.9 4.1 4.1 Depreciation and Amortization4 2.9 12.5% 76.3% 78.6% 81.1%
Capital Expenditures (4.2) (3.1) (3.1) (3.0) (3.0) (2.9) Capital Expenditures4 (2.9) 13.0% 75.1% 77.4% 79.8%
Change in Working Capital (1.3) (1.1) (1.9) (2.0) (2.2) (2.4) Change in Working Capital (2.4) 13.5% 74.0% 76.3% 78.6%
Unlevered Free Cash Flows ($3.2) $3.1 $3.6 $4.5 $5.4 $6.1 Unlevered Free Cash Flows $5.9 14.0% 72.9% 75.1% 77.4%
Present Value PV of Terminal Value of Cash Flows Based on Perpetual Growth Rate for Implied Enterprise Value Net Debt and Other6 Implied Total Equity Value Implied Equity Value Per ADS7 Discount Rate 2012 - 2017 2017 Unlevered Free Cash Flow
12.6 4.0% 5.0% 6.0% 4.0% 5.0% 6.0% 4.0% 5.0% 6.0% 4.0% 5.0% 6.0% 12.0% 12.0% $13.0 $44.6 $51.4 $60.6 $57.6
$64.4 $73.6 ($ 35.7) $93.3 $100.2 $109.3 $4.84 $5.19 $5.66 12.5% 12.5% $12.8 $41.1 $47.0 $54.7 $53.9 $59.8 $67.5
($ 35.7) $89.6 $95.5 $103.3 $4.64 $4.95 $5.35 13.0% 13.0% $12.6 +$38.0 $43.1 $49.8 =$50.6 $55.7 $62.4
— ($ 35.7) =$86.3 $91.5 $98.1 =$4.47 $4.74 $5.08 13.5% 13.5% $12.4 $35.2 $39.8 $45.5 $47.6 $52.1 $57.9 ($ 35.7)
$83.4 $87.9 $93.6 $4.32 $4.55 $4.85 14.0% 14.0% $12.2 $32.8 $36.8 $41.8 $45.0 $49.0 $53.9 ($ 35.7)
$80.7 $84.7 $89.7 $4.18 $4.39 $4.65
Source: Based on projections provided by Company management Notes:
1. Present values as of 9/21/2012 using mid-year convention.
2. Represents a 3.3-month stub period with valuation date as of 9/21/2012.
3. Tax rate of 20.4% per company management.
4. Assumes capex equal to depreciation during terminal period.
5. Implied from corresponding discount rate and perpetual growth rate applied to 2017 EBITDA.
6. Includes net debt and minority interest as of 6/30/2012.
7. Based on 154,390,734 outstanding shares or 19,298,841.75 ADS per the Agreement.
Historical and forecasted financials provided in RMB. Conversion to US$ applies the average of the respective beginning and end of year forward rates. USD:RMB exchange rates of 6.353, 6.392, 6.496, 6.618, 6,745, 6.871 applied for periods 2012E to 2017E, respectively.
DRAFT
HOULIHAN LOKEY 17
Appendix
Appendix
Additional Financial Data
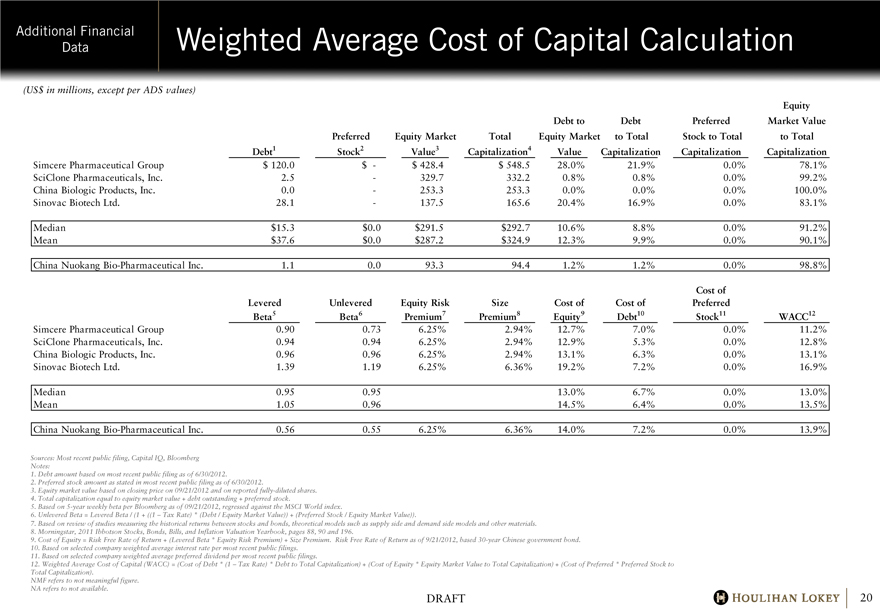
Additional Financial Data Weighted Average Cost of Capital Calculation (US$ in millions, except per ADS values)
Equity Debt Preferred Market Value Preferred Equity Market Total Equity Market to Total Stock to Total to Total Debt1
Stock2 Value3 Capitalization4 Value Capitalization Capitalization Capitalization Simcere Pharmaceutical Group
$120.0 $— $428.4 $548.5 28.0% 21.9% 0.0% 78.1%
SciClone Pharmaceuticals, Inc. 2.5 — 329.7 332.2 0.8% 0.8% 0.0% 99.2%
China Biologic Products, Inc. 0.0 — 253.3 253.3 0.0% 0.0% 0.0% 100.0% Sinovac Biotech Ltd. 28.1 — 137.5 165.6 20.4% 16.9% 0.0% 83.1% Median $15.3 $0.0 $291.5 $292.7 10.6% 8.8% 0.0% 91.2% Mean $37.6 $0.0 $287.2 $324.9 12.3% 9.9% 0.0% 90.1% China Nuokang Bio-Pharmaceutical Inc. 1.1 0.0 93.3 94.4
1.2% 1.2% 0.0% 98.8% Cost of Levered Unlevered Equity Risk Size Cost of Cost of Preferred
Beta5 Beta6 Premium7 Premium8 Equity9 Debt10 Stock11 WACC12 Simcere Pharmaceutical Group
0.90 0.73 6.25% 2.94% 12.7% 7.0% 0.0% 11.2%
SciClone Pharmaceuticals, Inc. 0.94 0.94 6.25% 2.94% 12.9% 5.3% 0.0% 12.8%
China Biologic Products, Inc. 0.96 0.96 6.25% 2.94% 13.1% 6.3% 0.0% 13.1%
Sinovac Biotech Ltd. 1.39 1.19 6.25% 6.36% 19.2% 7.2% 0.0% 16.9% Median 0.95
0.95 13.0% 6.7% 0.0% 13.0% Mean 1.05 0.96 14.5% 6.4% 0.0% 13.5%
China Nuokang Bio-Pharmaceutical Inc. 0.56 0.55 6.25% 6.36% 14.0% 7.2% 0.0% 13.9%
Sources: Most recent public filing, Capital IQ, Bloomberg Notes:
1. Debt amount based on most recent public filing as of 6/30/2012.
2. Preferred stock amount as stated in most recent public filing as of 6/30/2012.
3. Equity market value based on closing price on 09/21/2012 and on reported fully-diluted shares.
4. Total capitalization equal to equity market value + debt outstanding + preferred stock.
5. Based on 5-year weekly beta per Bloomberg as of 09/21/2012, regressed against the MSCI World index.
6. Unlevered Beta = Levered Beta / (1 + ((1 – Tax Rate) * (Debt / Equity Market Value)) + (Preferred Stock / Equity Market Value)).
7. Based on review of studies measuring the historical returns between stocks and bonds, theoretical models such as supply side and demand side models and other materials.
8. Morningstar, 2011 Ibbotson Stocks, Bonds, Bills, and Inflation Valuation Yearbook, pages 88, 90 and 196.
9. Cost of Equity = Risk Free Rate of Return + (Levered Beta * Equity Risk Premium) + Size Premium. Risk Free Rate of Return as of 9/21/2012, based 30-year Chinese government bond.
10. Based on selected company weighted average interest rate per most recent public filings. 11. Based on selected company weighted average preferred dividend per most recent public filings.
12. Weighted Average Cost of Capital (WACC) = (Cost of Debt * (1 – Tax Rate) * Debt to Total Capitalization) + (Cost of Equity * Equity Market Value to Total Capitalization) + (Cost of Preferred * Preferred Stock to Total Capitalization).
NMF refers to not meaningful figure. NA refers to not available.
DRAFT
HOULIHAN LOKEY 20
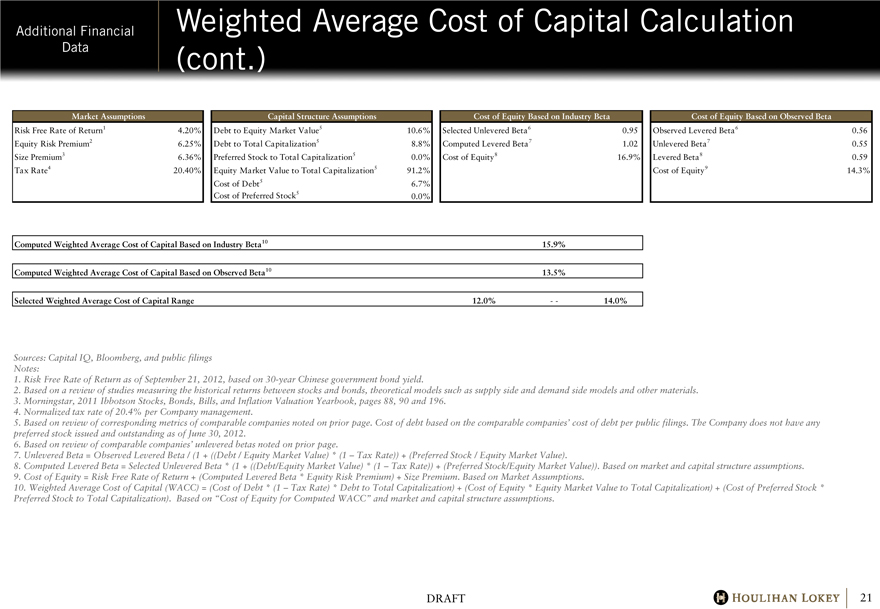
Additional Financial Data Weighted Average Cost of Capital Calculation (cont.) Market Assumptions
Capital Structure Assumptions Cost of Equity Based on Industry Beta Cost of Equity Based on Observed Beta Risk Free Rate of Return1 4.20% Debt to Equity Market Value5
10.6% Selected Unlevered Beta6 0.95 Observed Levered Beta6 0.56 Equity Risk Premium2
6.25% Debt to Total Capitalization5 8.8% Computed Levered Beta7 1.02 Unlevered Beta7 0.55
Size Premium3 6.36% Preferred Stock to Total Capitalization5 0.0%
Cost of Equity8 16.9% Levered Beta8 0.59 Tax Rate4 20.40%
Equity Market Value to Total Capitalization5 91.2% Cost of Equity9 14.3%
Cost of Debt5 6.7% Cost of Preferred Stock5 0.0%
Computed Weighted Average Cost of Capital Based on Industry Beta10 15.9%
Computed Weighted Average Cost of Capital Based on Observed Beta10 13.5%
Selected Weighted Average Cost of Capital Range 12.0% — 14.0%
Sources: Capital IQ, Bloomberg, and public filings Notes:
1. Risk Free Rate of Return as of September 21, 2012, based on 30-year Chinese government bond yield.
2. Based on a review of studies measuring the historical returns between stocks and bonds, theoretical models such as supply side and demand side models and other materials.
3. Morningstar, 2011 Ibbotson Stocks, Bonds, Bills, and Inflation Valuation Yearbook, pages 88, 90 and 196.
4. Normalized tax rate of 20.4% per Company management.
5. Based on review of corresponding metrics of comparable companies noted on prior page. Cost of debt based on the comparable companies’ cost of debt per public filings. The Company does not have any preferred stock issued and outstanding as of June 30, 2012.
6. Based on review of comparable companies’ unlevered betas noted on prior page.
7. Unlevered Beta = Observed Levered Beta / (1 + ((Debt / Equity Market Value) * (1 – Tax Rate)) + (Preferred Stock / Equity Market Value).
8. Computed Levered Beta = Selected Unlevered Beta * (1 + ((Debt/Equity Market Value) * (1 – Tax Rate)) + (Preferred Stock/Equity Market Value)). Based on market and capital structure assumptions.
9. Cost of Equity = Risk Free Rate of Return + (Computed Levered Beta * Equity Risk Premium) + Size Premium. Based on Market Assumptions.
10. Weighted Average Cost of Capital (WACC) = (Cost of Debt * (1 – Tax Rate) * Debt to Total Capitalization) + (Cost of Equity * Equity Market Value to Total Capitalization) + (Cost of Preferred Stock * Preferred Stock to Total Capitalization). Based on “Cost of Equity for Computed WACC” and market and capital structure assumptions.
DRAFT
HOULIHAN LOKEY 21
Additional Financial Data
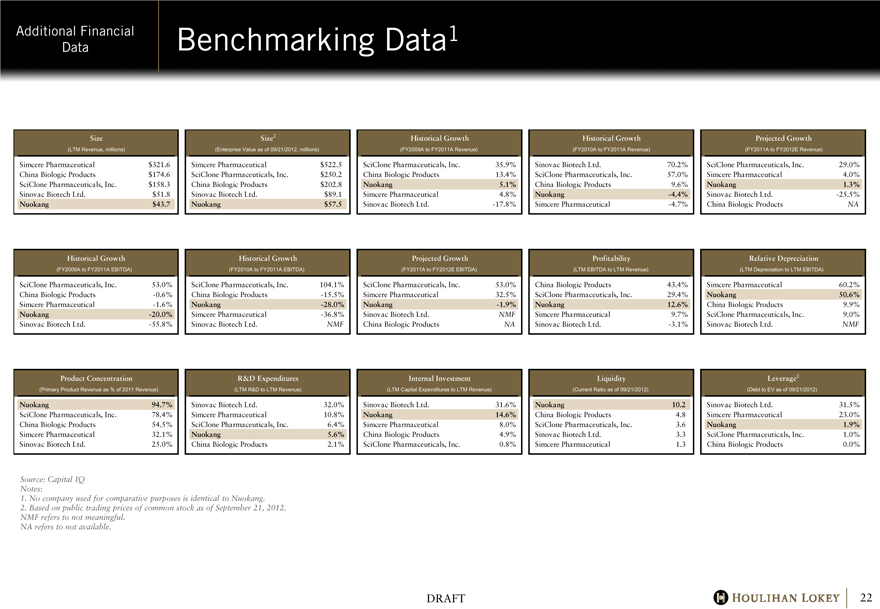
Benchmarking Data1
Size Size2 Historical Growth Historical Growth Projected Growth
(LTM Revenue, millions) (Enterprise Value as of 09/21/2012, millions) (FY2009A to FY2011A Revenue) (FY2010A to FY2011A Revenue) (FY2011A to FY2012E Revenue)
Simcere Pharmaceutical $321.6 Simcere Pharmaceutical $522.5 SciClone Pharmaceuticals, Inc. 35.9% Sinovac Biotech Ltd. 70.2% SciClone Pharmaceuticals, Inc. 29.0%
China Biologic Products $174.6 SciClone Pharmaceuticals, Inc. $250.2 China Biologic Products 13.4% SciClone Pharmaceuticals, Inc. 57.0% Simcere Pharmaceutical 4.0%
SciClone Pharmaceuticals, Inc. $158.3 China Biologic Products $202.8 Nuokang 5.1% China Biologic Products 9.6% Nuokang 1.3%
Sinovac Biotech Ltd. $51.8 Sinovac Biotech Ltd. $89.1 Simcere Pharmaceutical 4.8% Nuokang -4.4% Sinovac Biotech Ltd. -25.5%
Nuokang $43.7 Nuokang $57.5 Sinovac Biotech Ltd. -17.8% Simcere Pharmaceutical -4.7% China Biologic Products NA
Historical Growth Historical Growth Projected Growth Profitability Relative Depreciation
(FY2009A to FY2011A EBITDA) (FY2010A to FY2011A EBITDA) (FY2011A to FY2012E EBITDA) (LTM EBITDA to LTM Revenue) (LTM Depreciation to LTM EBITDA)
SciClone Pharmaceuticals, Inc. 53.0% SciClone Pharmaceuticals, Inc. 104.1% SciClone Pharmaceuticals, Inc. 53.0% China Biologic Products 43.4% Simcere Pharmaceutical 60.2%
China Biologic Products -0.6% China Biologic Products -15.5% Simcere Pharmaceutical 32.5% SciClone Pharmaceuticals, Inc. 29.4% Nuokang 50.6%
Simcere Pharmaceutical -1.6% Nuokang -28.0% Nuokang -1.9% Nuokang 12.6% China Biologic Products 9.9%
Nuokang -20.0% Simcere Pharmaceutical -36.8% Sinovac Biotech Ltd. NMF Simcere Pharmaceutical 9.7% SciClone Pharmaceuticals, Inc. 9.0%
Sinovac Biotech Ltd. -55.8% Sinovac Biotech Ltd. NMF China Biologic Products NA Sinovac Biotech Ltd. -3.1% Sinovac Biotech Ltd. NMF
Product Concentration R&D Expenditures Internal Investment Liquidity Leverage2
(Primary Product Revenue as % of 2011 Revenue) (LTM R&D to LTM Revenue) (LTM Capital Expenditures to LTM Revenue) (Current Ratio as of 09/21/2012) (Debt to EV as of 09/21/2012)
Nuokang 94.7% Sinovac Biotech Ltd. 32.0% Sinovac Biotech Ltd. 31.6% Nuokang 10.2 Sinovac Biotech Ltd. 31.5%
SciClone Pharmaceuticals, Inc. 78.4% Simcere Pharmaceutical 10.8% Nuokang 14.6% China Biologic Products 4.8 Simcere Pharmaceutical 23.0%
China Biologic Products 54.5% SciClone Pharmaceuticals, Inc. 6.4% Simcere Pharmaceutical 8.0% SciClone Pharmaceuticals, Inc. 3.6 Nuokang 1.9%
Simcere Pharmaceutical 32.1% Nuokang 5.6% China Biologic Products 4.9% Sinovac Biotech Ltd. 3.3 SciClone Pharmaceuticals, Inc. 1.0%
Sinovac Biotech Ltd. 25.0% China Biologic Products 2.1% SciClone Pharmaceuticals, Inc. 0.8% Simcere Pharmaceutical 1.3 China Biologic Products 0.0%
Source: Capital IQ Notes:
1. No company used for comparative purposes is identical to Nuokang.
2. Based on public trading prices of common stock as of September 21, 2012.
NMF refers to not meaningful. NA refers to not available.
DRAFT
HOULIHAN LOKEY 22
Additional Financial Data
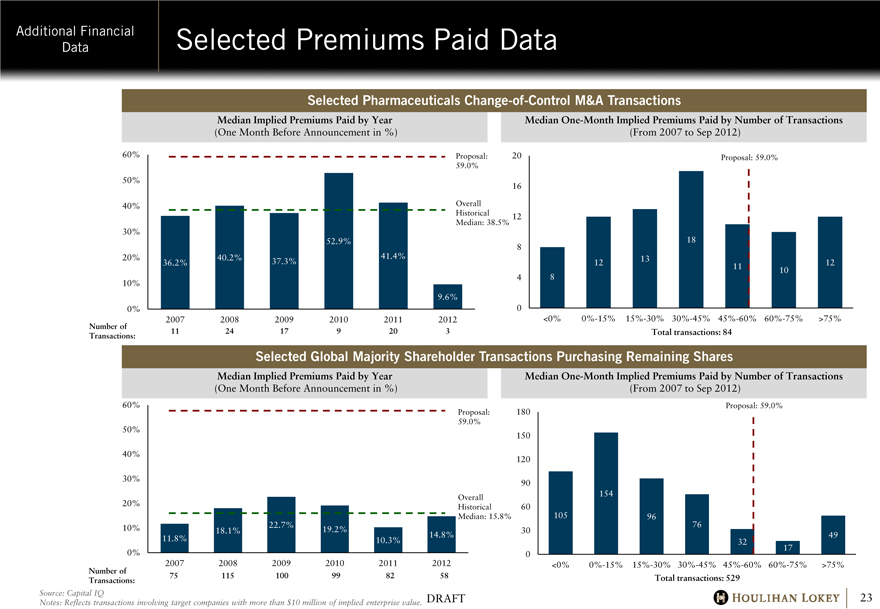
Selected Premiums Paid Data
Selected Pharmaceuticals Change-of-Control M&A Transactions
Median Implied Premiums Paid by Year
(One Month Before Announcement in %)
60% 50% 40% 30% 20% 10% 0%
Number of Transactions:
2007
11
2008
24
2009
17
2010
9
2011
20
2012
3
36.2%
40.2%
37.3%
52.9%
41.4%
9.6%
Proposal: 59.0%
Overall Historical Median: 38.5%
Median One-Month Implied Premiums Paid by Number of Transactions
(From 2007 to Sep 2012)
20 16 12 8
4
0
8
12
13
18
11
10
12
Proposal: 59.0%
<0% 0%-15% 15%-30% 30%-45% 45%-60% 60%-75% >75%
Total transactions: 84
Selected Global Majority Shareholder Transactions Purchasing Remaining Shares
Median Implied Premiums Paid by Year
(One Month Before Announcement in %)
60% 50% 40% 30% 20% 10% 0%
11.8%
18.1%
22.7%
19.2%
10.3%
14.8%
Proposal: 59.0%
Overall Historical Median: 15.8%
Number of Transactions:
2007
75
2008
115
2009
100
2010
99
2011
82
2012
58
Median One-Month Implied Premiums Paid by Number of Transactions
(From 2007 to Sep 2012)
180 150 120 90 60 30
0
105
154
96
76
32
17
49
Proposal: 59.0%
<0% 0%-15% 15%-30% 30%-45% 45%-60% 60%-75% >75%
Total transactions: 529
Source: Capital IQ
Notes: Reflects transactions involving target companies with more than $10 million of implied enterprise value.
DRAFT
HOULIHAN LOKEY 23
Additional Financial Data
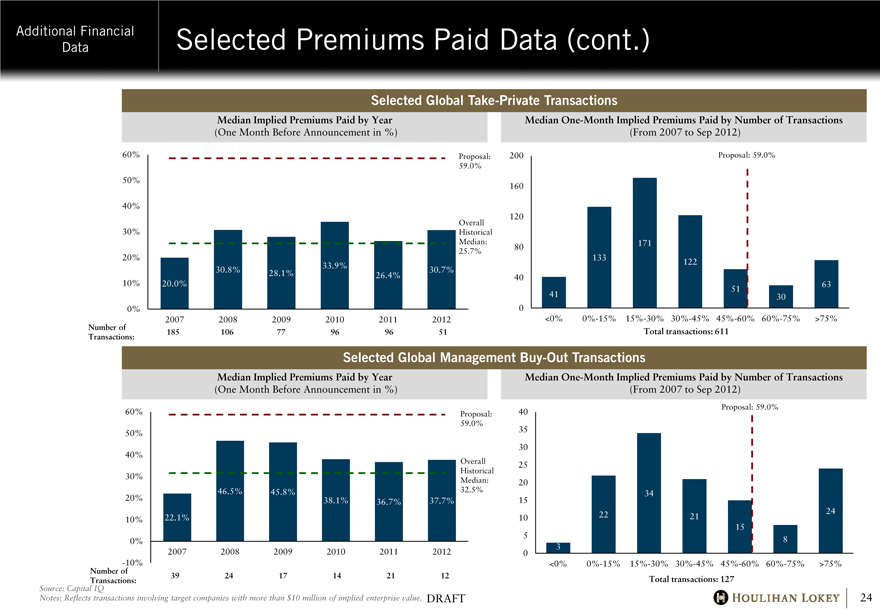
Selected Premiums Paid Data (cont.)
Selected Global Take-Private Transactions
Median Implied Premiums Paid by Year
(One Month Before Announcement in %)
60% 50% 40% 30% 20% 10% 0%
20.0%
30.8%
28.1%
33.9%
26.4%
30.7%
Proposal: 59.0%
Overall Historical Median: 25.7%
Number of Transactions:
2007
185
2008
106
2009
77
2010
96
2011
96
2012
51
Median One-Month Implied Premiums Paid by Number of Transactions
(From 2007 to Sep 2012)
200 160 120 80 40
0
41
133
171
122
51
30
63
Proposal: 59.0%
<0% 0%-15% 15%-30% 30%-45% 45%-60% 60%-75% >75%
Total transactions: 611
Selected Global Management Buy-Out Transactions
Median Implied Premiums Paid by Year
(One Month Before Announcement in %)
60% 50% 40% 30% 20% 10% 0% -10%
22.1%
46.5%
45.8%
38.1%
36.7%
37.7%
Proposal: 59.0%
Overall Historical Median: 32.5%
Number of Transactions:
2007
39
2008
24
2009
17
2010
14
2011
21
2012
12
Median One-Month Implied Premiums Paid by Number of Transactions
(From 2007 to Sep 2012)
40 35 30 25 20 15 10 5 0
3
22
34
21
15
8
24
Proposal: 59.0%
<0% 0%-15% 15%-30% 30%-45% 45%-60% 60%-75% >75%
Total transactions: 127
Source: Capital IQ
Notes: Reflects transactions involving target companies with more than $10 million of implied enterprise value.
DRAFT
HOULIHAN LOKEY 24
Additional Financial Data
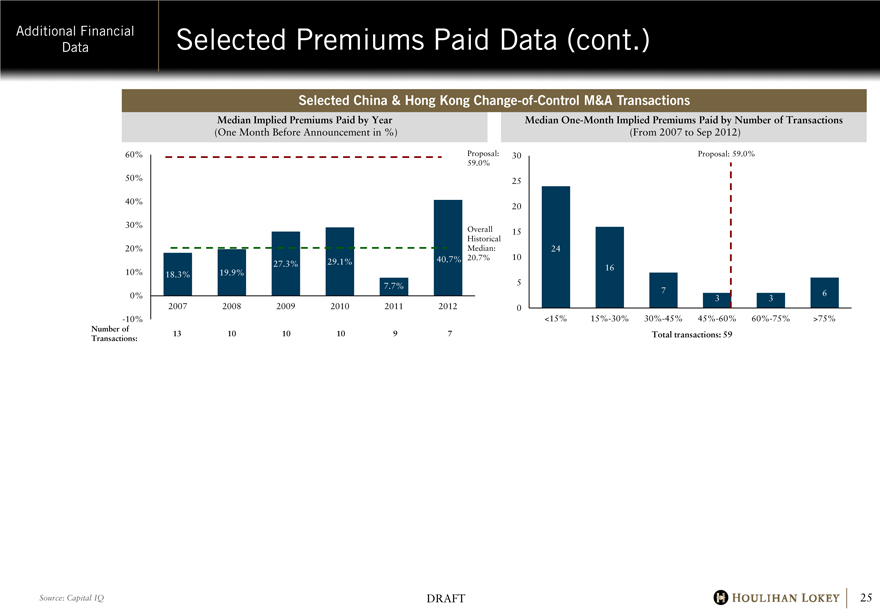
Selected Premiums Paid Data (cont.)
Selected China & Hong Kong Change-of-Control M&A Transactions
Median Implied Premiums Paid by Year
(One Month Before Announcement in %)
60% 50% 40% 30% 20% 10% 0% -10%
18.3%
19.9%
27.3%
29.1%
7.7%
40.7%
Proposal: 59.0%
Overall Historical Median: 20.7%
Number of Transactions:
2007
13
2008
10
2009
10
2010
10
2011
9
2012
7
Median One-Month Implied Premiums Paid by Number of Transactions
(From 2007 to Sep 2012)
30 25 20 15 10 5 0
24
16
7
3
3
6
Proposal: 59.0%
<15% 15%-30% 30%-45% 45%-60% 60%-75% >75%
Total transactions: 59
Source: Capital IQ
DRAFT
HOULIHAN LOKEY 25