Exhibit (c)(5)
C O N F I D E N T I A L 2 7 S E P T E M B E R 2 0 1 2
I N D E P E N D E N T C O M M I T T E E D I S C U S S I O N M A T E R I A L S
Project Promise
LAZARD
C O N F I D E N T I A L P R O J E C T P R O M I S E
Disclaimer
This document, together with any oral or other supplemental information (collectively, the “materials”), have been prepared by Lazard Frčres & Co. LLC and Lazard Asia (Hong Kong) Limited (collectively, “Lazard”), and are provided for the information of the Independent Committee (the “Client”) of the Board of Directors of China Nuokang Bio-Pharmaceutical Inc. (the “Company”) only on a confidential basis, in connection with the Company’s consideration of a proposed sale or similar transaction involving all or substantially all of its share capital, business or assets (the “Transaction”). The materials must be held by the Client in strict confidence and must not be photocopied or reproduced in any other electronic or physical form and must not be communicated, disclosed, summarized, referred to, quoted or distributed to any other person in whole or in part at any time except with Lazard’s prior written consent.
Notwithstanding the foregoing, each recipient hereof (and their employees, representatives, and other agents) may disclose to any and all persons, without limitation of any kind from the commencement of discussions, the U.S. federal and state income tax treatment and tax structure of the proposed Transaction and all materials of any kind (including opinions or other tax analyses) that are provided relating to the tax treatment and tax structure. For this purpose, “tax structure” is limited to facts relevant to the U.S. federal and state income tax treatment of the proposed transaction and does not include information relating to theidentity of the parties, their affiliates, agents radvisors.
The materials have been based upon information provided to Lazard by the Client, the Company and/or publicly available information, and portions of the information herein may be based upon certain statements, estimates and forecasts with respect to anticipated future performance. We have relied upon the accuracy and completeness of the foregoing information, and have not assumed any responsibility for any independent verification of such information or any independent valuation or appraisal of any of the assetsor liabilities (contingent or otherwise) of any entity, or concerning solvency or fair value of any entity, and we have not been provided with any such information. To the fullest extent permitted by law, Lazard, its affiliates and their respective directors, officers, employees and agents disclaim any responsibility for the information herein and for any omissions from such information or for any reliance that the recipient or any third party may seek to place upon such information, and give no representation, warranty or guarantee, express or implied, as to the accuracy, completeness, currency or reliability of the information herein, or any other materials, or as to the reasonableness of any financial forecasts. In particular, with respect to such financial forecasts, we have assumed that they have been reasonably prepared on bases reflecting the best currently available estimates and judgments of management as to future financial performance. We assume no responsibility for and express no view as to such forecasts or the assumptions on which they are based. The information set forth herein is based upon economic, monetary, market and other conditions as in effect on, and the information made available to us as of, the date hereof, unless indicated otherwise. While any subsequent changes in the circumstances may affect the information herein, we assume no responsibility to update or sup pplement the information set forth herein. These materials and the information contained herein are confidential and may not be disclosed publicly or made available to third parties without the prior written consent of Lazard. These materials shall not be used for any purpose other than that for which they were provided.
LAZARD
C O N F I D E N T I A L P R O J E C T P R O M I S E
Disclaimer (Cont’d)
The materials are for discussion purposes only and may not be relied upon by anypersonorentityfor anypurposeexceptasexpresslypermittedby Lazard’s letter of engagement. The materials were prepared for specific persons familiar with the business and affairs of the Client for use in a specific context and were not prepared with a view to public disclosure or to conform with disclosure standardsunder any applicable laws, rules or regulations, and Lazard takes no responsibility for use of the materials by persons other than the Client. Lazard only acts for those entities and persons whom it has identified as its client and no-one else and will not be responsible to anyone other than such clients for providing the protections afforded to clients of Lazard nor for providing advice. This document should be read in conjunction with and is subject to any other materials provided in connection herewith and the terms of the financial opinion letter delivered by Lazard to the Client in relation to the Transaction. This document is not a financial opinion or recommendation by Lazard. These materials are summary in nature and do not include all of the information that the recipient should evaluate in considering a possible Transaction. These materials do not constitute tax, accounting, actuarial, legal or other specialist advice.
This document and the information contained herein do not constitute an offer to sell or the solicitation of an offer to buy any security, commodity or instrument or related derivative, nor do they constitute an offer or commitment to lend, syndicate or arrange a financing, underwrite or purchase or act as an agent or advisororinany other capacity with respect to any transaction, or commit capital, or to participate inany trading strategies, and do not constitute legal, regulatory, accounting or tax advice to the recipient. We recommend that the recipient seek independent third party legal, regulatory, accounting and tax advice regarding the contents of this document. This document is not a research report and was not prepared by the research department of Lazard.
LAZARD
C O N F I D E N T I A L P R O J E C T P R O M I S E
Table of Contents
I TRANSACTION OVERVIEW 1
II PROMISE SITUATION OVERVIEW 8
III REVIEW OF MANAGEMENT PROJECTIONS 11
IV FINANCIAL ANALYSIS 16
APPENDIX
A Additional Promise Information 21
B WACC Analysis 23
C Premiums Paid Analysis 24
D Chinese Market Developments 25
LAZARD
P R O J E C T P R O M I S E
I Transaction Overview
LAZARD
P R O J E C T P R O M I S E I T R A N S A C T I O N O V E R V I E W
Transaction Summary
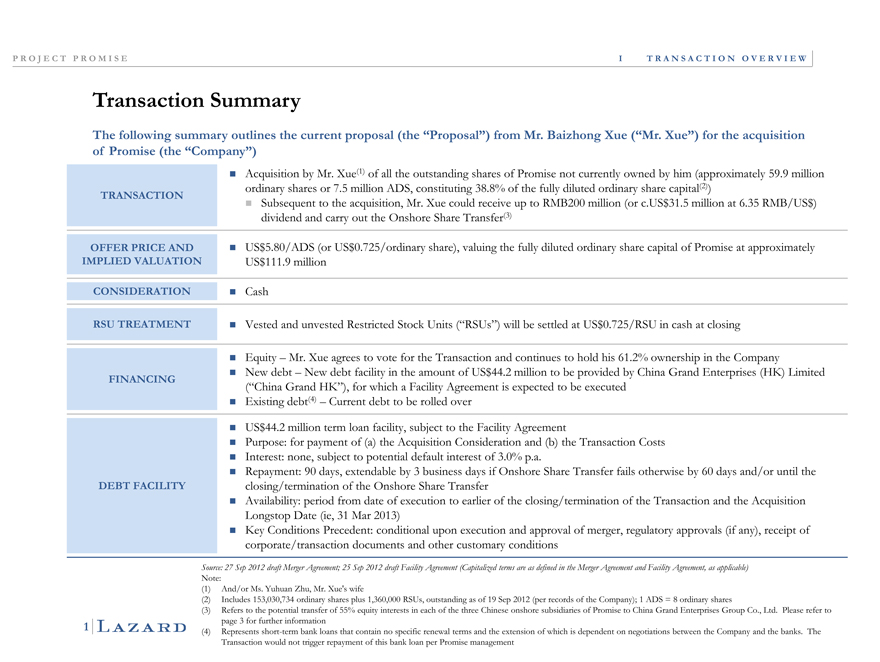
The following summary outlines the current proposal (the “Proposal”) from Mr. Baizhong Xue (“Mr. Xue”) for the acquisition of Promise (the “Company”)
Acquisition by Mr. Xue(1) of all the outstanding shares of Promise not currently owned by him (approximately 59.9 million ordinary shares or 7.5 million ADS, constituting 38.8% of the fully diluted ordinary share capital(2))
TRANSACTION
Subsequent to the acquisition, Mr. Xue could receive up to RMB200 million (or c.US$31.5 million at 6.35 RMB/US$) dividend and carry out the Onshore Share Transfer(3)
OFFER PRICE AND US$5.80/ADS (or US$0.725/ordinary sha are), valuing the fully diluted ordinary share capital of Promise at approximately
IMPLIED VALUATION US$111.9 million
CONSIDERATION Cash
RSU TREATMENT Vested and unvested Restricted Stock Units (“RSUs”) will be settled at US$0.725/RSU in cash at closing
Equity – Mr. Xue agrees to vote for the Transaction and continues to hold his 61.2% ownership in the Company
New debt – New debt facility in the amount of US$44.2 million to be provided by China Grand Enterprises (HK) Limited
FINANCING
(“China Grand HK”), for which a Facility Agreement is expected to be executed
Existing debt(4) – Current debt to be rolled over
US$44.2 million term loan facility, subject to the Facility Agreement
Purpose: for payment of (a) the Acquisition Consideration and (b) the Transaction Costs
Interest: none, subject to potential default interest of 3.0% p.a.
Repayment: 90 days, extendable by 3 business days if Onshore Share Transfer fails otherwise by 60 days and/or until the DEBT FACILITY closing/termination of the Onshore Share Transfer
Availability: period from date of execution to earlier of the closing/termination of the Transaction and the Acquisition Longstop Date (ie, 31 Mar 2013)
Key Conditions Precedent: conditional upon execution and approval of merger, regulatory approvals (if any), receipt of corporate/transaction documents and other customary conditions
Source: 27 Sep 2012 draft Merger Agreement; 25 Sep 2012 draft Facility Agreement (Capitalized terms are as defined in the Merger Agreement and Facility Agreement, as applicable)
Note:
(1) | | And/or Ms. Yuhuan Zhu, Mr. Xue’s wife |
(2) Includes 153,030,734 ordinary shares plus 1,360,000 RSUs, outstanding as of 19 Sep 2012 (per records of the Company); 1 ADS = 8 ordinary shares
(3) Refers to the potential transfer of 55% equity interests in each of the three Chinese onshore subsidiaries of Promise to China Grand Enterprises Group Co., Ltd. Please refer to page 3 for further information (4) Represents short-term bank loans that contain no specific renewal terms and the extension of which is dependent on negotiations between the Company and the banks. The Transaction would not trigger repayment of this bank loan per Promise management
P R O J E C T P R O M I S E I T R A N S A C T I O N O V E R V I E W
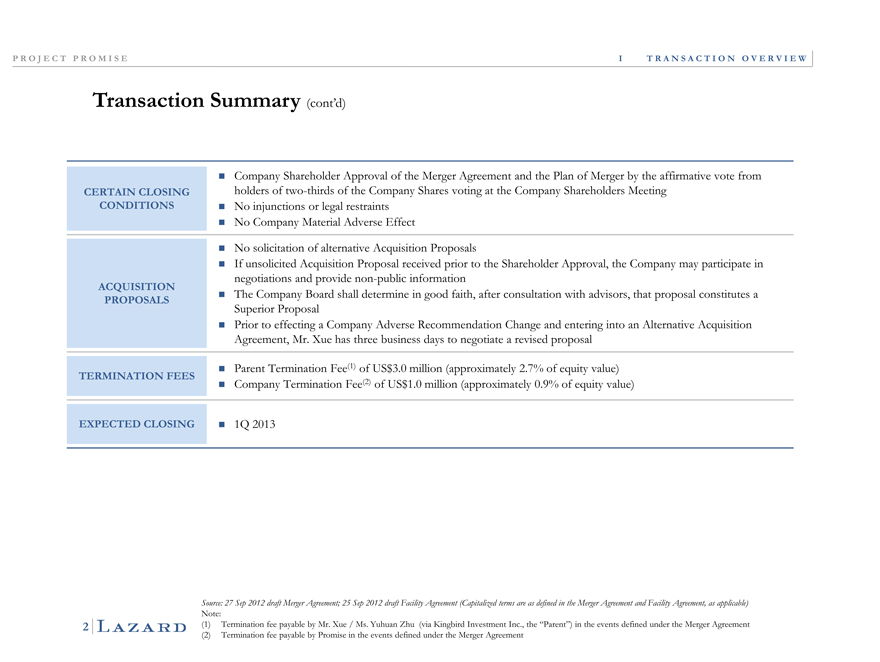
Transaction Summary (cont’d)
Company Shareholder Approval of the Merger Agreement and the Plan of Merger by the affirmative vote from
CERTAIN CLOSING holders of two-thirds of the Company Shares voting at the Company Shareholders Meeting
CONDITIONS No injunctions or legal restraints
No Company Material Adverse Effect
No solicitation of alternative Acquisition Prroposals
If unsolicited Acquisition Proposal received prior to the Shareholder Approval, the Company may participate in
negotiations and provide non-public information
ACQUISITION The Company Board shall determine in good faith, after consultation with advisors, that proposal constitutes a
PROPOSALS
Superior Proposal
Prior to effecting a Company Adverse Recommendation Change and entering into an Alternative Acquisition
Agreement, Mr. Xue has three business days to negotiate a revised proposal
Parent Termination Fee(1) of $US 3.0 million (approximately 2.7% of equity value)
TERMINATION FEES Company Termination Fee(2) of $US 1.0 million (approximately 0.9% of equity value)
EXPECTED CLOSING 1Q 2013
Source: 27 Sep 2012 draft Merger Agreement; 25 Sep 2012 draft Facility Agreement (Capitalized terms are as defined in the Merger Agreement and Facility Agreement, as applicable)
Note:
(1) Termination fee payable by Mr. Xue / Ms. Yuhuan Zhu (via Kingbird Investment Inc., the “Parent”) in the events defined under the Merger Agreement (2) Termination fee payable by Promise in the events defined under the Merger Agreement
LAZARD
P R O J E C T P R O M I S E I T R A N S A C T I O N O V E R V I E W
Potential Subsequent Arrangement between Mr. Xue and China
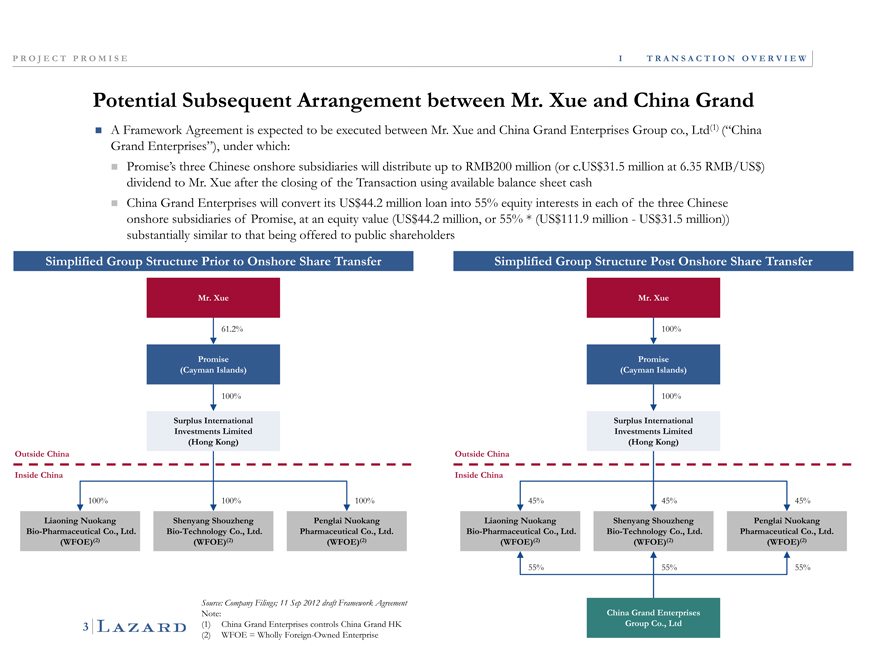
Grand A Framework Agreement is expected to be executed between Mr. Xue and China Grand Enterprises Group co., Ltd(1) (“China Grand Enterprises”), under which:
Promise’s three Chinese onshore subsidiaries will distribute u to RMB200 million (or c.US$31.5 million at 6.35 RMB/US$) dividend to Mr. Xue after the closing of the Transaction using available balance sheet cash
China Grand Enterprises will convert its US$44.2 million loan into 55% equity interests in each of the three Chinese onshore subsidiaries of Promise, at an equity value (US$44.2 million, or 55% * (US$111.9 million—US$31.5 million)) substantially similar to that being offered to public shareholders
Simplified Group Structure Prior to Onshore Share Transfer Simplified Group Structure Post Onshore Share Transfer
Mr. Xue Mr. Xue
61.2% 100%
Promise Promise (Cayman Islands) (Cayman Islands)
100% 100%
Surplus International Surplus International Investments Limited Investments Limited (Hong Kong) (Hong Kong) Outside China Outside China
Inside China Inside China
100% 100% 100% 45% 45% 45%
Liaoning Nuokang Liaoning Nuokang
Shenyang Shouzheng Penglai Nuokang Shenyang Shouzheng Penglai Nuokang Bio-Pharmaceutical Co., Bio-Pharmaceutical Co., Bio-Technology Co., Ltd. Pharmaceutical Co., Ltd. Bio-Technology Co., Ltd. Pharmaceutical Co., Ltd.
Ltd. Ltd.
(WFOE)(2) (WFOE)(2) (WFOE)(2) (WFOE)(2) (WFOE)(2) (WFOE)(2)
55% 55% 55%
Source: Company Filings; 11 Sep 2012 draft Framework Agreement
Note: China Grand Enterprises
3 | | (1) China Grand Enterprises controls China Grand HK Group Co., Ltd (2) WFOE = Wholly Foreign-Owned Enterprise |
LAZARD
P R O J E C T P R O M I S E I T R A N S A C T I O N O V E R V I E W
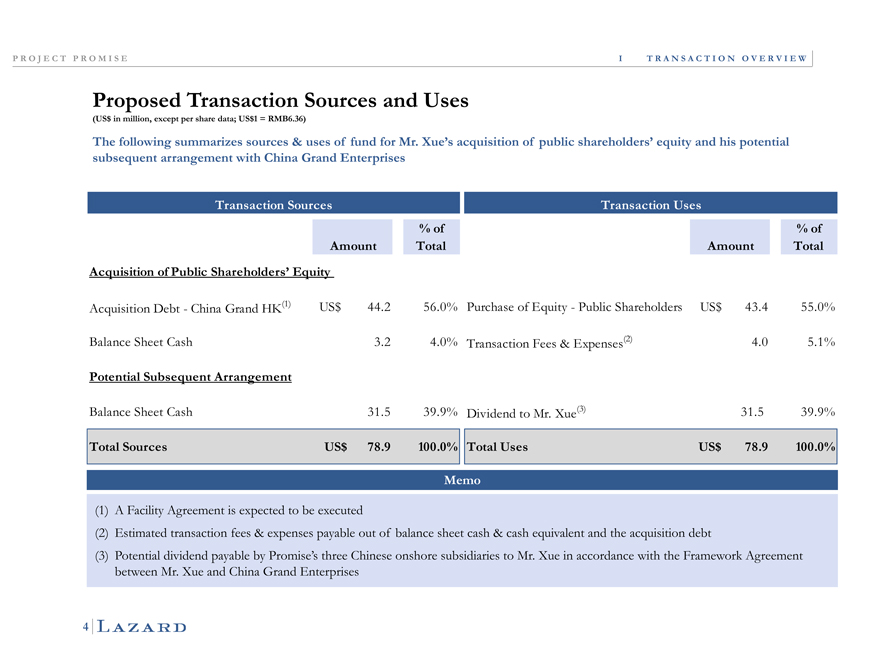
Proposed Transaction Sources and Uses
(US$ in million, except per share data; US$1 = RMB6.36)
The following summarizes sources & uses of fund for Mr. Xue’s acquisition of public shareholders’ equity and his potential subsequent arrangement with China Grand Enterprises
Transaction Sources Transaction Uses
% of % of
Amount Total Amount Total
Acquisition of Public Shareholders’ Equity
Acquisition Debt—China Grand HK(1) $$USUS44.2 56.0% Purchase of Equity—Public Shareholders 43.4 55.0%
Balance Sheet Cash 3.2 4.0% Transaction Fees & Expenses(2) 4.0 5.1%
Potential Subsequent Arrangement
Balance Sheet Cash 31.5 39.9% Dividend to Mr. Xue(3) 31.5 39.9%
Total Sources US$78.9 100.0%$USTotal Uses 78.9 100.0%
Memo
(1) | | A Facility Agreement is expected to be executed |
(2) Estimated transaction fees & expenses payable out of balance sheet cash & cash equivalent and the acquisition debt
(3) Potential dividend payable by Promise’s three Chinese onshore subsidiaries to Mr. Xue in accordance with the Framework Agreement
between Mr. Xue and China Grand Enterprises
LAZARD
P R O J E C T P R O M I S E I T R A N S A C T I O N O V E R V I E W
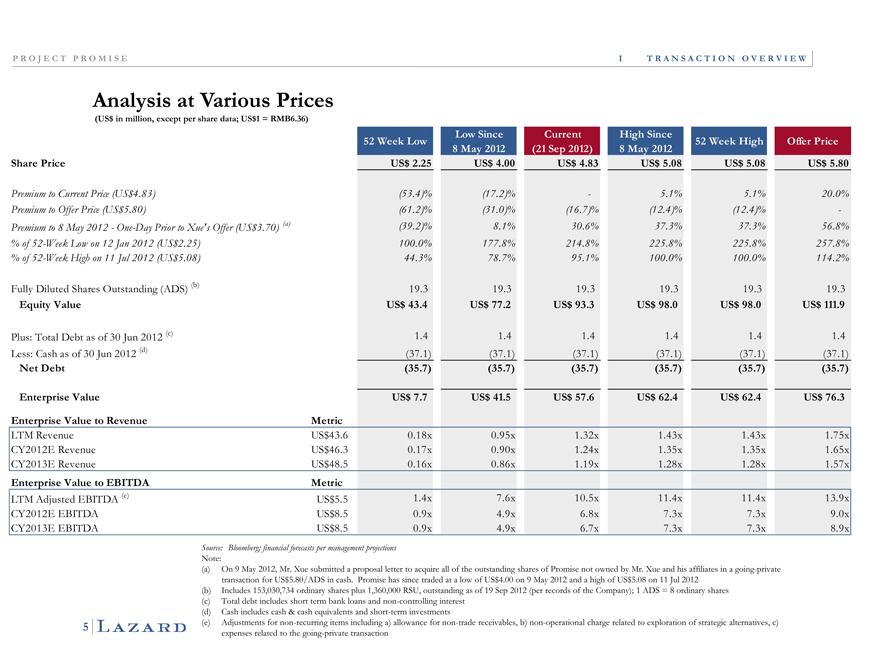
Analysis at Various Prices
(USin$$million,USexcept per share data; 1 = RMB6.36)
Low Since Current High Since
52 Week Low 52 Week High Offer Price
8 | | May 2012 (21 Sep 2012) 8 May 2012 |
Share Price $$$$$$USUSUSUSUSUS2.25 4.00 4.83 5.08 5.08 5.80
Premium to Current Price (US4.83)$ 4.83 (53.4)% (17.2)% — 5.1% 5.1% 20.0%
Premium to Offer Price (US$5.80) 5.80 (61.2)% (31.0)% (16.7)% (12.4)% (12.4)% -
Premium to 8 May 2012—One-Day Prior to Xue’s Offer$(US 3.70) (a) 3.70 (39.2)% 8.1% 30.6% 37.3% 37.3% 56.8%
% of 52-Week Low on 12 Jan 2012 (US2.25)$ 2.25 100.0% 177.8% 214.8% 225.8% 225.8% 257.8%
% of 52-Week High on 11 Jul 2012 (US5.08)$ 5.08 44.3% 78.7% 95.1% 100.0% 100.0% 114.2%
Fully Diluted Shares Outstanding (ADS) (b) 19.30 19.3 19.3 19.3 19.3 19.3 19.3
Equity Value $$$$$$USUSUSUSUSUS 43.4 77.2 93.3 98.0 98.0 111.9
Plus: Total Debt as of 30 Jun 2012 (c) 1.41 1.4 1.4 1.4 1.4 1.4 1.4
Less: Cash as of 30 Jun 2012 (d) (37.09) (37.1) (37.1) (37.1) (37.1) (37.1) (37.1)
Net Debt (35.7) (35.7) (35.7) (35.7) (35.7) (35.7)
Enterprise Value US$$$$$$USUSUSUSUS7.7 41.5 57.6 62.4 62.4 76.3
Enterprise Value to Revenue Metric
LTM Revenue US43.6 0.18x$ 0.95x 1.32x 1.43x 1.43x 1.75x
CY2012E Revenue US46.3 0.17x$ 0.90x 1.24x 1.35x 1.35x 1.65x
CY2013E Revenue US48.5 0.16x$ 0.86x 1.19x 1.28x 1.28x 1.57x
Enterprise Value to EBITDA Metric
LTM Adjusted EBITDA (e) US5.5$1.4x 7.6x 10.5x 11.4x 11.4x 13.9x
CY2012E EBITDA US8.5 0.9x 4.9x$ 6.8x 7.3x 7.3x 9.0x
CY2013E EBITDA US8.5 0.9x 4.9x$ 6.7x 7.3x 7.3x 8.9x
Source: Bloomberg; financial forecasts per management projections
Note:
(a) On 9 May 2012, Mr. Xue submitted a proposal letter to acquire all of the outstanding shares of Promise not owned by Mr. Xue and his affiliates in a going-private transaction for US$5.80/ADS in cash. Promise has since traded at a low of US$4.00 on 9 May 2012 and a high of US$5.08 on 11 Jul 2012 (b) Includes 153,030,734 ordinary shares plus 1,360,000 RSU, outstanding as of 19 Sep 2012 (per records of the Company); 1 ADS = 8 ordinary shares (c) Total debt includes short term bank loans and non-controlling interest (d) Cash includes cash & cash equivalents and short-term investments (e) Adjustments for non-recurring items including a) allowance for non-trade receivables, b) non-operational charge related to exploration of strategic alternatives, c) expenses related to the going-private transaction
LAZARD
P R O J E C T P R O M I S E I T R A N S A C T I O N O V E R V I E W
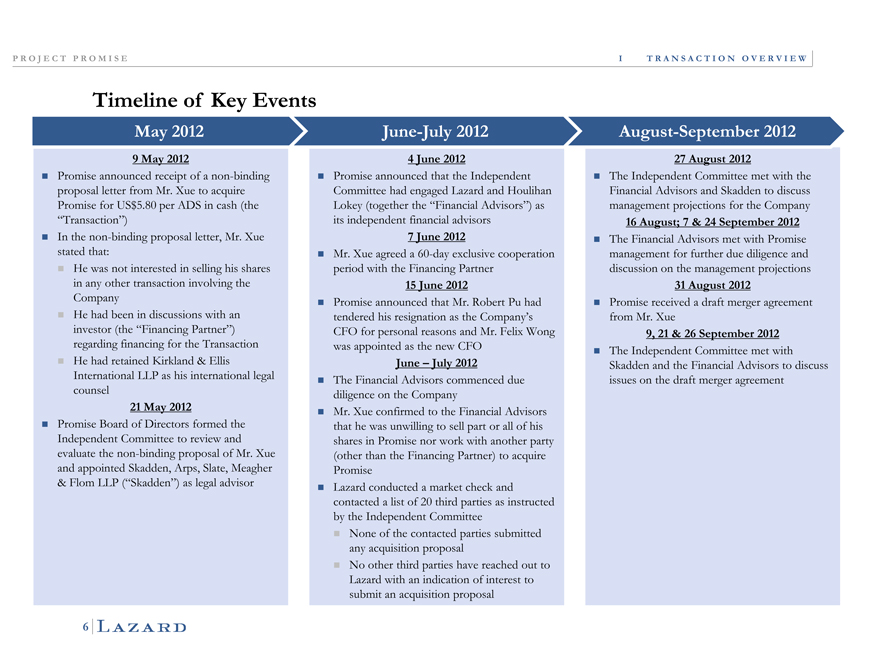
Timeline of Key Events
May 2012 June-July 2012 August-September 2012
9 May 2012 4 June 2012 27 August 2012
Promise announced receipt of a non-binding Promise announced that the Independent ?The Independent Committee met with the
proposal letter from Mr. Xue to acquire Committee had engaged Lazard and Houlihan Financial Advisors and Skadden to discuss
Promise for US5.80 per ADS in$ cash (the Lokey (together the “Financial Advisors”) as management projections for the Company
“Transaction”) its independent financial advisors 16 August; 7 & 24 September 2012
?In the non-binding proposal letter, Mr. Xue 7 June 2012 The Financial Advisors met with Promise
stated that: Mr. Xue agreed a 60-day exclusive cooperation management for further due diligence and
He was not interested in selling his shares period with the Financing Partner discussion on the management projections
in any other transaction involving the 15 June 2012 31 August 2012
Company Promise announced that Mr. Robert Pu had ?Promise received a draft merger agreement
He had been in discussions with an tendered his resignation as the Company’s from Mr. Xue
investor (the “Financing Partner”) CFO for personal r ons and Mr. Felix Wong 9, 21 & 26 September 2012
regarding financing for the Transaction was appointed as the new CFO The Independent Committee met with
He had retained Kirkland & Ellis June – July 2012 Skadden and the Financial Advisors to discuss
International LLP as his international legal The Financial Advisors commenced due issues on the draft merger agreement
counsel diligence on the Company
21 May 2012 Mr. Xue confirmed to the Financial Advisors
Promise Board of Directors formed the that he was unwilling to sell part or all of his
Independent Committee to review and shares in Promise nor work with another party
evaluate the non-binding proposal of Mr. Xue (other than the Financing Partner) to acquire
and appointed Skadden, Arps, Slate, Meagher Promise
& Flom LLP (“Skadden”) as legal advisor Lazard conducted a market check and
contacted a list of 20 third parties as instructed
by the Independent Committee
None of the contacted parties submitted
any acquisition proposal
No other third parties have reached out to
Lazard with an indiication of interest to
submit an acquisition proposal
LAZARD
P R O J E C T P R O M I S E I T R A N S A C T I O N O V E R V I E W
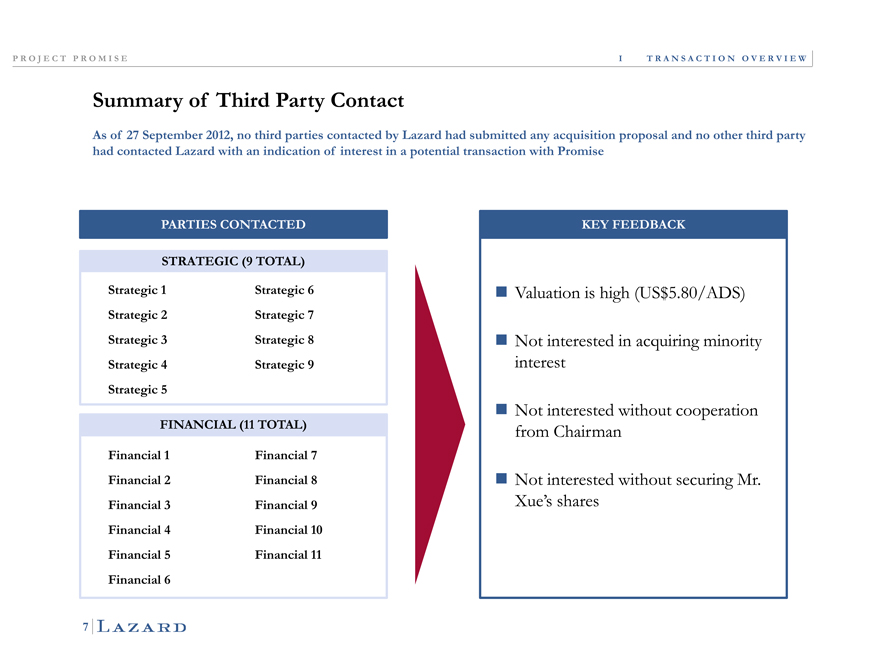
Summary of Third Party Contact
As of 27 September 2012, no third parties contacted by Lazard had submitted any acquisition proposal and no other third party had contacted Lazard with an indication of interest in a potential transaction with Promise
PARTIES CONTACTED KEY FEEDBACK
STRATEGIC (9 TOTAL)
Strategic 1 Strategic 6
Strategic 2 Strategic 7
Strategic 3 Strategic 8
Strategic 4 Strategic 9
Strategic 5
FINANCIAL (11 TOTAL)
Financial 1 Financial 7
Financial 2 Financial 8
Financial 3 Financial 9
Financial 4 Financial 10
Financial 5 Financial 11
Financial 6
Valuation is high (US$5.80/ADS)
Not interested in acquiring minority interest
Not interested without cooperation from Chairman
Not interested without securing Mr. Xue’s shares
LAZARD
P R O J E C T P R O M I S E
II Promise Situation Overview
LAZARD
P R O J E C T P R O M I S E I I P R O M I S E S I T U A T I O N O V E R V I E W
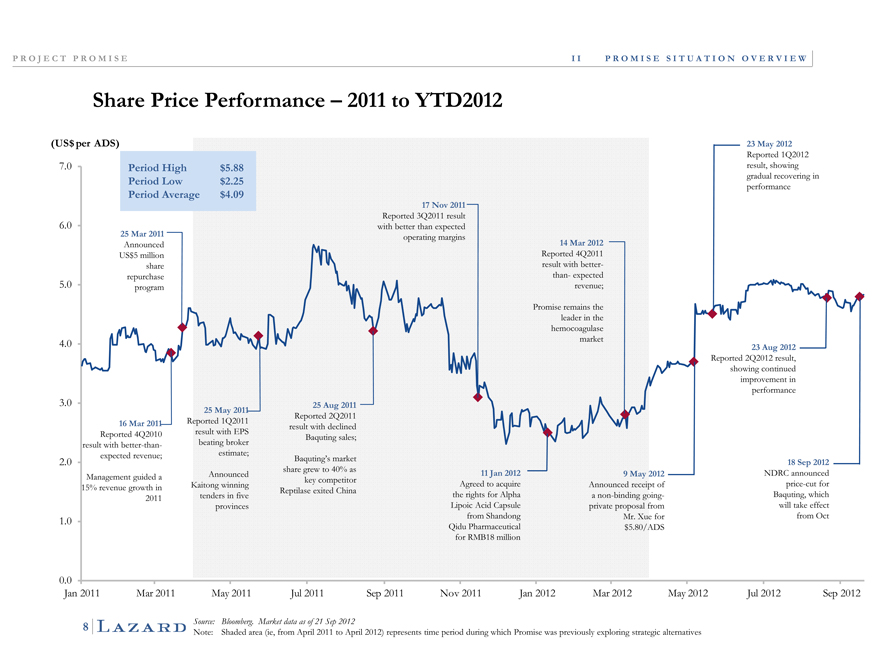
Share Price Performance – 2011 to YTD2012
(US$ per ADS) 23 May 2012
Period High
$5.88 Reported 1Q2012
70 . result, showing
Period Low gradual recovering in
$2.25 performance
Period Average
17 Nov 2011
$4.09 Reported 3Q2011 result
6.0 with better than expected
25 Mar 2011 operating margins
Announced 14 Mar 2012
US$5 million Reported 4Q2011
share result with better-
repurchase than- expected
5.0 program revenue;
Promise remains the
leader in the
hemocoagulase
4.0 market
23 Aug 2012
Reported 2Q2012 result,
showing continued
improvement in
performance
3.0 25 Aug 2011
25 May 2011
Reported 2Q2011
16 Mar 2011 Reported 1Q2011
result with declined
Reported 4Q2010 result with EPS
Baquting sales;
result with better-than- beating broker
expected revenue; estimate;
2.0 Baquting’s market
18 Sep 2012
share grew to 40% as NDRC announced
Management guided a Announced 11 Jan 2012 9 May 2012
key competitor price-cut for
15% revenue growth in Kaitong winning Agreed to acquire Announced receipt of
Reptilase exited China Baquting, which
2011 tenders in five the rights for Alpha a non-binding going-
provinces Lipoic Acid Capsule private proposal from will take effect
from Shandong Mr. Xue for from Oct
1.0
Qidu Pharmaceutical $5.80/ADS
for RMB18 million
0 00 .0
Jan 2011 Mar 2011 May 2011 Jul 2011 Sep 2011 Nov 2011 Jan 2012 Mar 2012 May 2012 Jul 2012 Sep 2012
Source: Bloomberg. Market data as of 21 Sep 2012
Note: Shaded area (ie, from April 2011 to April 2012) represents time period during which Promise was previously exploring strategic alternatives
LAZARD
P R O J E C T P R O M I S E I I P R O M I S E S I T U A T I O N O V E R V I E W
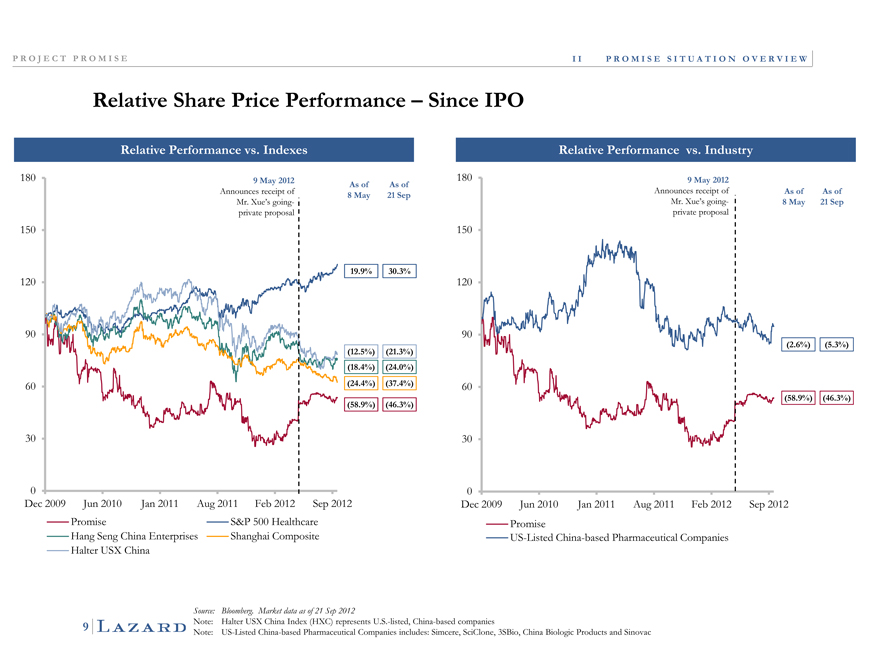
Relative Share Price Performance – Since IPO
Relative Performance vs. Indexes
Relative Performance vs. Industry
180 9 May 2012 As of As of
Announces receipt of
Mr. Xue’s going-private proposal
150
19.9% 30.3%
120
90
(12.5%) (21.3%)
(18.4%) (24.0%)
60 (24.4%) (37.4%) (58.9%) (46.3%)
30
0
Dec 2009 Jun 2010 Jan 2011 Aug 2011 Feb 2012 Sep 2012 Promise S&P 500 Healthcare Hang Seng China Enterprises Shanghai Composite Halter USX China
180 9 May 2012
Announces receipt of As of As of Mr. Xue’s going- 8 May 21 Sep private proposal
150
120
90
(2.6%) (5.3%)
60
(58.9%) (46.3%)
30
0
Dec 2009 Jun 2010 Jan 2011 Aug 2011 Feb 2012 Sep 2012 Promise US-Listed China-based Pharmaceutical Companies
Source: Bloomberg. Market data as of 21 Sep 2012
Note: Halter USX China Index (HXC) represents U.S.-listed, China-based companies
Note: US-Listed China-based Pharmaceutical Companies includes: Simcere, SciClone, 3SBio, China Biologic Products and Sinovac
9
LAZARD
P R O J E C T P R O M I S E I I P R O M I S E S I T U A T I O N O V E R V I E W
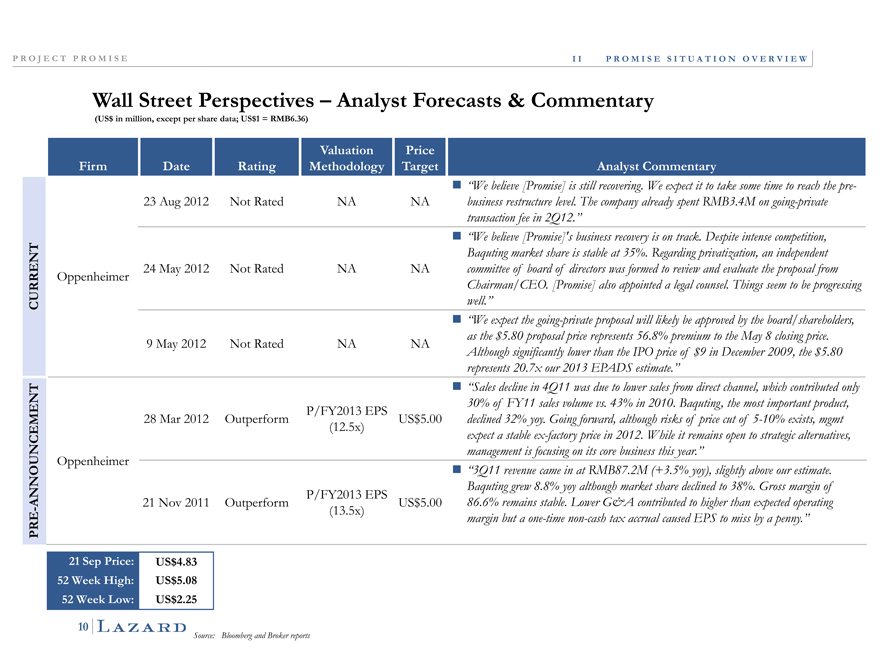
Wall Street Perspectives – Analyst Forecasts & Commentary
(US$ in million, except per share data; US$1 = RMB6.36)
(USin$$million,USexcept per share data; 1 = RMB6.36)
Valuation Price
Firm Date Rating Methodology Target Analyst Commentary
“We believe [Promise] is still recovering. We expect it to take some time to reach the pre-
23 Aug 2012 Not Rated NA NA business restructure level. The company already spent RMB3.4M on going-private
transaction fee in 2Q12.”
“We believe [Promise]’s business recovery is on track. Despite intense competition,
Baquting market share is stable at 35%. Regarding privatization, an independent
24 May 2012 Not Rated NA NA committee of board of directors was formed to review and evaluate the proposal from
Oppenheimer Chairman/CEO. [Promise] also appointed a legal counsel. Things seem to be progressing
CURRENT well.”
“We expect the going-private proposal will likely be approved by the board/shareholders,
9 May 2012 Not Rated NA NA as the $5.80 proposal price represents 56.8% premium to the May 8 closing price.
Although significantly lower than the IPO price of $9 in December 2009, the $5.80
represents 20.7x our 2013 EPADS estimate.”
“Sales decline in 4Q11 was due to lower sales from direct channel, which contributed only
ENT P/FY2013 EPS 30% of FY11 sales volume vs. 43% in 2010. Baquting, the most important product,
28 Mar 2012 Outperform US5.00$ declined 32% yoy. Going forward, although risks of price cut of 5-10% exists, mgmt
(12.5x) expect a stable ex-factory price in 2012. While it remains open to strategic alternatives,
management is focusing on its core business this year.”
Oppenheimer
“3Q11 revenue came in at RMB87.2M (+3.5% yoy), slightly above our estimate.
NNOUNCEM Baquting grew 8.8% yoy although market share declined to 38%. Gross margin of
P/FY2013 EPS
-A 21 Nov 2011 Outperform US5.00$86.6% remains stable. Lower G&A contributed to higher than expected operating
PRE (13.5x) margin but a one-time non-cash tax accrual caused EPS to miss by a penny.”
21 Sep Price: US$4.83
52 Week US$5.08 High:
52 Week Low: US$2.25
Source: Bloomberg and Broker reports
10
LAZARD
P R O J E C T P R O M I S E
III Review of Management Projections
LAZARD
P R O J E C T P R O M I S E I I I R E V I E W O F M A N A G E M E N T P R O J E C T I O N S
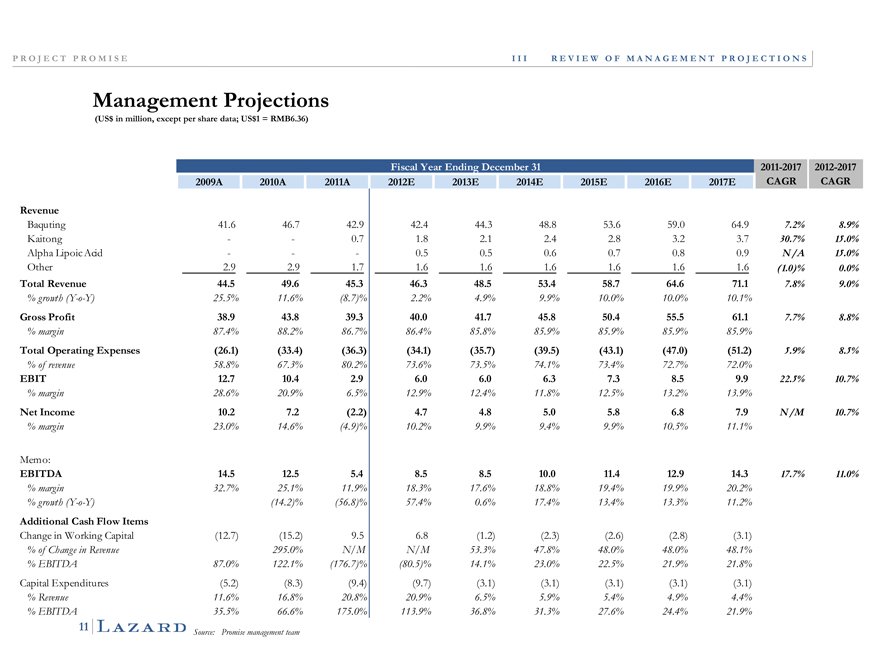
Management Projections
(US$ in million, except per share data; US$1 = RMB6.36)
Fiscal Year Ending December 31 2011-2017 2012-2017
2009A 2010A 2011A 2012E 2013E 2014E 2015E 2016E 2017E CAGR CAGR
Revenue
Baquting 41.6 46.7 42.9 42.4 44.3 48.8 53.6 59.0 64.9 7.2% 8.9%
Kaitong —— 0.7 1.8 2.1 2.4 2.8 3.2 3.7 30.7% 15.0%
Alpha Lipoic Acid ——— 0.5 0.5 0.6 0.7 0.8 0.9 N/A 15.0%
Other 2.9 2.9 1.7 1.6 1.6 1.6 1.6 1.6 1.6 (1.0)% 0.0%
Total Revenue 44.5 49.6 45.3 46.3 48.5 53.4 58.7 64.6 71.1 7.8% 9.0%
% growth (Y-o-Y) 25.5% 11.6% (8.7)% 2.2% 4.9% 9.9% 10.0% 10.0% 10.1%
Gross Profit 38.9 43.8 39.3 40.0 41.7 45.8 50.4 55.5 61.1 7.7% 8.8%
%margin 87.4% 88.2% 86.7% 86.4% 85.8% 85.9% 85.9% 85.9% 85.9%
Total Operating Expenses (26.1) (33.4) (36.3) (34.1) (35.7) (39.5) (43.1) (47.0) (51.2) 5.9% 8.5%
% of revenue 58.8% 67.3% 80.2% 73.6% 73.5% 74.1% 73.4% 72.7% 72.0%
EBIT 12.7 10.4 2.9 6.0 6.0 6.3 7.3 8.5 9.9 22.5% 10.7%
% margin 28.6% 20.9% 6.5% 12.9% 12.4% 11.8% 12.5% 13.2% 13.9%
Net Income 102. 72. (22). 47. 48. 50. 58. 68. 79. N/M 107%.
% margin 23.0% 14.6% (4.9)% 10.2% 9.9% 9.4% 9.9% 10.5% 11.1%
Memo:
EBITDA 14.5 12.5 5.4 8.5 8.5 10.0 11.4 12.9 14.3 17.7% 11.0%
% margin 32.7% 25.1% 11.9% 18.3% 17.6% 18.8% 19.4% 19.9% 20.2%
% growth (Y-o-Y) (14.2)% (56.8)% 57.4% 0.6% 17.4% 13.4% 13.3% 11.2%
Additional Cash Flow Items
Change in Working Capital (12.7) (15.2) 9.5 6.8 (1.2) (2.3) (2.6) (2.8) (3.1)
% of Change in Revenue 295.0% N/M N/M 53.3% 47.8% 48.0% 48.0% 48.1%
% EBITDA 87.0% 122.1% (176.7)% (80.5)% 14.1% 23.0% 22.5% 21.9% 21.8%
Capital Expenditures (5.2) (8.3) (9.4) (9.7) (3.1) (3.1) (3.1) (3.1) (3.1)
% Revenue 11.6% 16.8% 20.8% 20.9% 6.5% 5.9% 5.4% 4.9% 4.4%
% EBITDA 35.5% 66.6% 175.0% 113.9% 36.8% 31.3% 27.6% 24.4% 21.9%
Source: Promise management team
11
LAZARD
P R O J E C T P R O M I S E I I I R E V I E W O F M A N A G E M E N T P R O J E C T I O N
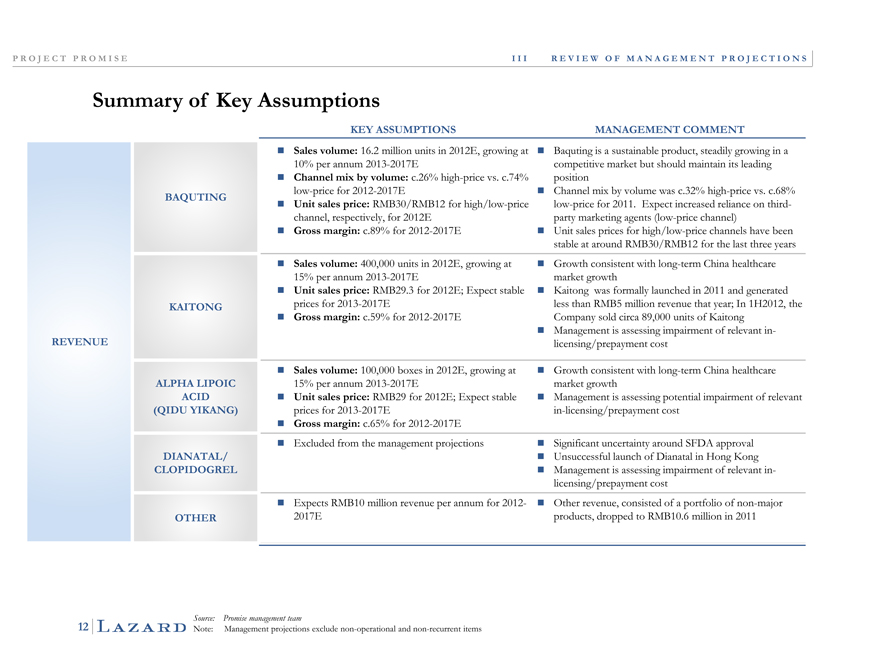
Summary of Key Assumptions
KEY ASSUMPTIONS MANAGEMENT COMMENT
Sales volume: 16.2 million units in 2012E, growing Baquting is a sustainable product, steadily growing in a
at 10% per annum 2013-2017E competitive market but should maintain its leading
Channel mix by volume: c.26% high-price vs. position
c.74% low-price for 2012-2017E Channel mix by volume was c.32% high-price vs. c.68%
BAQUTING Unit sales price: RMB30/RMB12 for high/low- low-price for 2011. Expect increased reliance on third-
price channel, respectively, for 2012E party marketing agents (low-price channel)
Gross margin: c.89% for 2012-2017E Unit sales prices for high/low-price channels have been
stable at around RMB30/RMB12 for the last three years
Sales volume: 400,000 units in 2012E, growing at Growth consistent with long-term China healthcare
15% per annum 2013-2017E market growth
Unit sales price: RMB29.3 for 2012E; Expect Kaitong was formally launched in 2011 and generated
KAITONG stable prices for 2013-2017E less than RMB5 million revenue that year; In 1H2012, the
Gross margin: c.59% for 2012-2017E Company sold circa 89,000 units of Kaitong
Management is assessing impairment of relevant in-
REVENUE licensing/prepayment cost
Sales volume: 100,000 boxes in 2012E, growing at Growth consistent with long-term China healthcare
ALPHA LIPOIC 15% per annum 2013-2017E market growth
ACID Unit sales price: RMB29 for 2012E; Expect stable Management is assessing potential impairment of relevant
(QIDU YIKANG) prices for 2013-2017E in-licensing/prepayment cost
Gross margin: c.65% for 2012-2017E
Excluded from the management projections Significant uncertainty around SFDA approval
DIANATAL/ Unsuccessful launch of Dianatal in Hong Kong
CLOPIDOGREL Management is assessing impairment of relevant in-
licensing/prepayment cost
Expects RMB10 million revenue per annum for 2012- Other revenue, consisted of a portfolio of non-major
OTHER 2017E products, dropped to RMB10.6 million in 2011
Source: Promise management team
Note: Management projections exclude non-operational and non-recurrent items
12
LAZARD
P R O J E C T P R O M I S E I I I R E V I E W O F M A N A G E M E N T P R O J E C T I O N S
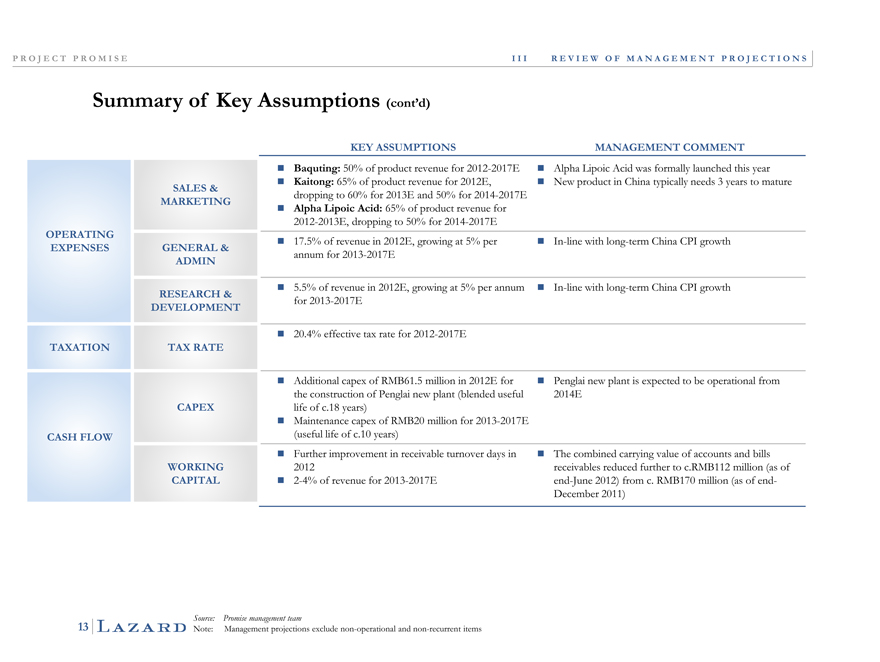
Summary of Key Assumptions (cont’d)
KEY ASSUMPTIONS MANAGEMENT COMMENT
Baquting: 50% of product reve ue for 2012-2017E Alpha Lipoic Acid was formally launched this year
Kaitong: 65% of product revenue for 2012E, New product in China typically needs 3 years to mature
SALES & dropping to 60% for 2013E and 50% for 2014-2017E
MARKETING Alpha Lipoic Acid: 65% of product revenue for
2012-2013E, dropping to 50% for 2014-2017E
OPERATING 17.5% of revenue in 2012E, growing at 5% per In-line with long-term China CPI growth
GENERAL & ADMIN annum for 2013-2017E
5.5% of revenue in 2012E, growing at 5% per annum In-line with long-term China CPI growth
RESEARCH & for 2013-2017E
DEVELOPMENT
20.4% effective tax rate for 2012-2017E
TAXATION TAX RATE
Additional capex of RMB61.5 million in 2012E for Penglai new plant is expected to be operational from
the construction of Penglai new plant (blended useful 2014E
CAPEX life of c.18 years)
Maintenance capex of RMB20 million for 2013-2017E
CASH FLOW (useful life of c.10 years)
Further improvement in receivable turnover days in The combined carrying value of accounts and bills
WORKING 2012 receivables reduced further to c.RMB112 million (as of
CAPITAL 2-4% of revenue for 2013-2017E end-June 2012) from c. RMB170 million (as of end-
December 2011)
Source: Promise management team
Note: Management projections exclude non-operational and non-recurrent items
13
LAZARD
P R O J E C T P R O M I S E I I I R E V I E W O F M A N A G E M E N T P R O J E C T I O N S
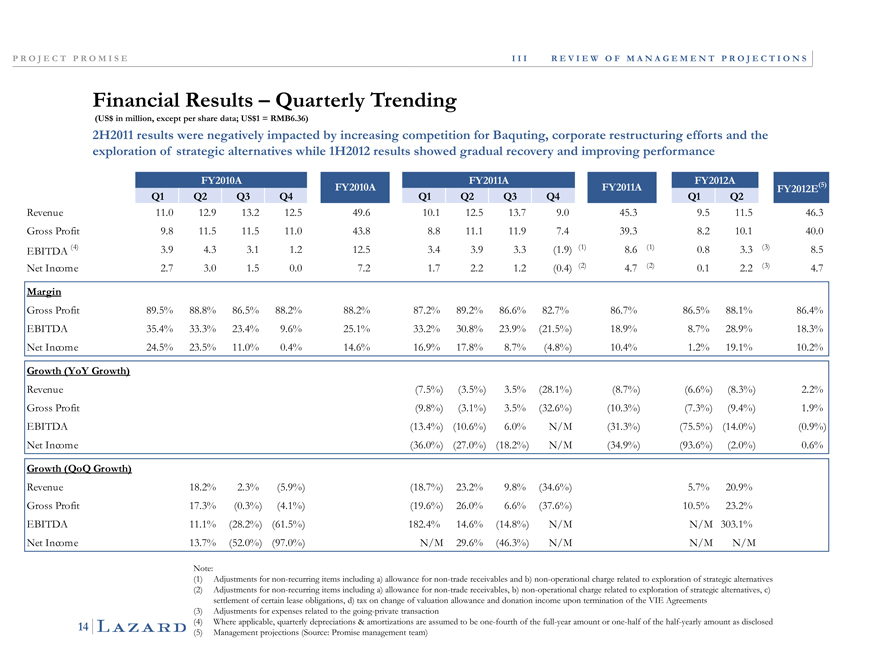
Financial Results – Quarterly Trending
(US$ in million, except per share data; US$1 = RMB6.36)
2H2011 results were negatively impacted by increasing competition for Baquting, corporate restructuring efforts and the exploration of strategic alternatives while 1H2012 results showed gradual recovery and improving performance
performance
FY2010A FY2011A FY2012A
FY2010A FY2011A FY2012E (5)
Q1 Q2 Q3 Q4 Q1 Q2 Q3 Q4 Q1 Q2
Revenue 11.0 12.9 13.2 12.5 49.6 10.1 12.5 13.7 9.0 45.3 9.5 11.5 46.3
Gross Profit 9.8 11.5 11.5 11.0 43.8 8.8 11.1 11.9 7.4 39.3 8.2 10.1 40.0
EBITDA (4) 3.9 4.3 3.1 1.2 12.5 3.4 3.9 3.3 (1.9) (1) 8.6 (1) 0.8 3.3 (3) 8.5
Net Income 2.7 3.0 1.5 0.0 7.2 1.7 2.2 1.2 (0.4) (2) 4.7 (2) 0.1 2.2 (3) 4.7
Margin
Gross Profit 89.5% 88.8% 86.5% 88.2% 88.2% 87.2% 89.2% 86.6% 82.7% 86.7% 86.5% 88.1% 86.4%
EBITDA 35.4% 33.3% 23.4% 9.6% 25.1% 33.2% 30.8% 23.9% (21.5%) 18.9% 8.7% 28.9% 18.3%
Net Income 24.5% 23.5% 11.0% 0.4% 14.6% 16.9% 17.8% 8.7% (4.8%) 10.4% 1.2% 19.1% 10.2%
Growth (YoY Growth)
Revenue (7.5%) (3.5%) 3.5% (28.1%) (8.7%) (6.6%) (8.3%) 2.2%
Gross Profit (9.8%) (3.1%) 3.5% (32.6%) (10.3%) (7.3%) (9.4%) 1.9%
EBITDA (13.4%) (10.6%) 6.0% N/M (31.3%) (75.5%) (14.0%) (0.9%)
Net Income (36.0%) (27.0%) (18.2%) N/M (34.9%) (93.6%) (2.0%) 0.6%
Growth (QoQ Growth)
Revenue 18.2% 2.3% (5.9%) (18.7%) 23.2% 9.8% (34.6%) 5.7% 20.9%
Gross Profit 17.3% (0.3%) (4.1%) (19.6%) 26.0% 6.6% (37.6%) 10.5% 23.2%
EBITDA 11.1% (28.2%) (61.5%) 182.4% 14.6% (14.8%) N/M N/M 303.1%
Net Income 13.7% (52.0%) (97.0%) N/M 29.6% (46.3%) N/M N/M N/M
Note:
(1) Adjustments for non-recurring items including a) allowance for on-trade receivables and b) non-operational charge related to exploration of strategic alternatives (2) Adjustments for non-recurring items including a) allowance for non-trade receivables, b) non-operational charge related to exploration of strategic alternatives, c) settlement of certain lease obligations, d) tax on change of valuation allowance and donation income upon termination of the VIE Agreements (3) Adjustments for expenses related to the
going-private transaction (4) Where applicable, quarterly depreciations & amortizations are assumed to be one-fourth of the full-year amount or one-half of the half-yearly amount as disclosed (5) Management projections (Source: Promise management team)
14
LAZARD
P R O J E C T P R O M I S E I I I R E V I E W O F M A N A G E M E N T P R O J E C T I O N S
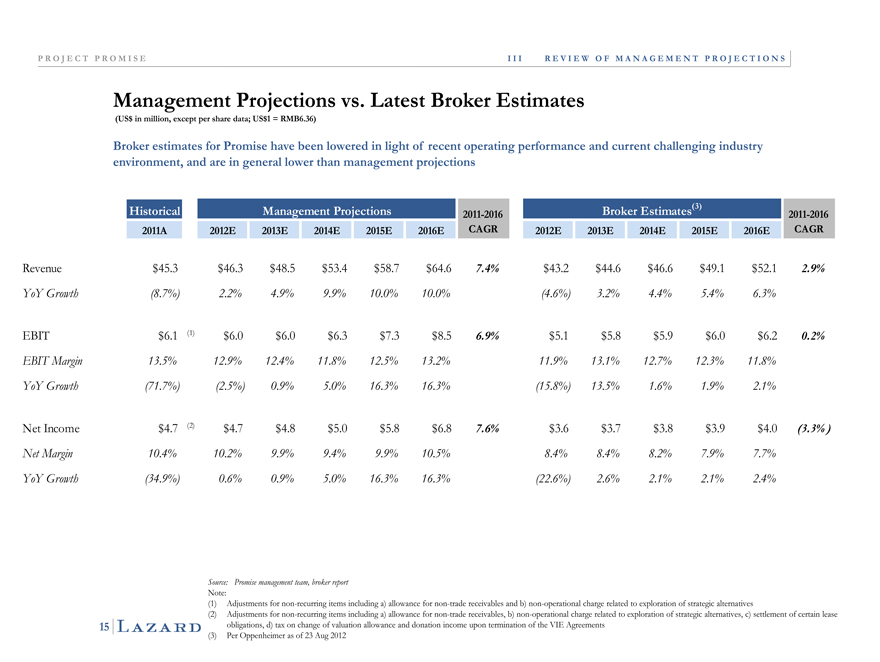
Management Projections vs. Latest Broker Estimates
(US$ in million, except per share data; US$1 = RMB6.36)
Broker estimates for Promise have been lowered in light of recent operating performance and current challenging industry environment, and are in general lower than management projections
Historical Management Projections 2011-2016 Broker Estimates 2011-2016 2011A 2012E 2013E 2014E 2015E 2016E CAGR 2012E 2013E 2014E 2015E 2016E CAGR
Revenue $45.3 $46.3 $48.5 $53.4 $58.7 $64.6 7.4% $43.2 $44.6 $46.6 $49.1 $52.1 2.9%
YoY Growth (8.7%) 2.2% 4.9% 9.9% 10.0% 10.0% (4.6%) 3.2% 4.4% 5.4% 6.3%
BIT $6.1 (1) $6.0 $6.0 $6.3 $7.3 $8.5 6.9% $5.1 $5.8 $5.9 $6.0 $6.2 0.2%
EBIT Margin 13.5% 12.9% 12.4% 11.8% 12.5% 13.2% 11.9% 13.1% 12.7% 12.3% 11.8% YoY Growth (71.7%) (2.5%) 0.9% 5.0% 16.3% 16.3% (15.8%) 13.5% 1.6% 1.9% 2.1%
Net Income $4.7 (2) $4.7 $4.8 $5.0 $5.8 $6.8 7.6% $3.6 $3.7 $3.8 $3.9 $4.0 (3.3%)
Net Margin 10.4% 10.2% 9.9% 9.4% 9.9% 10.5% 8.4% 8.4% 8.2% 7.9% 7.7% YoY Growth (34.9%) 0.6% 0.9% 5.0% 16.3% 16.3% (22.6%) 2.6%2.1%2.1%2.4%
Source: Promise management team, broker report
Note:
(1) Adjustments for non-recurring items including a) allowance for non-trade receivables and b) non-operational charge related to exploration of strategic alternatives
(2) Adjustments for non-recurring items including a) allowance for non-trade receivables, b) non-operational charge related to exploration of strategic alternatives, c) settlement of certain lease obligations, d) tax on change of valuation allowance and donation income upon termination of the VIE Agreements (3) Per Oppenheimer as of 23 Aug 2012
15
LAZARD
P R O J E C T P R O M I S E
IV Financial Analysis
LAZARD
P R O J E C T P R O M I S E I V F I N A N C I A L A N A L Y S I S
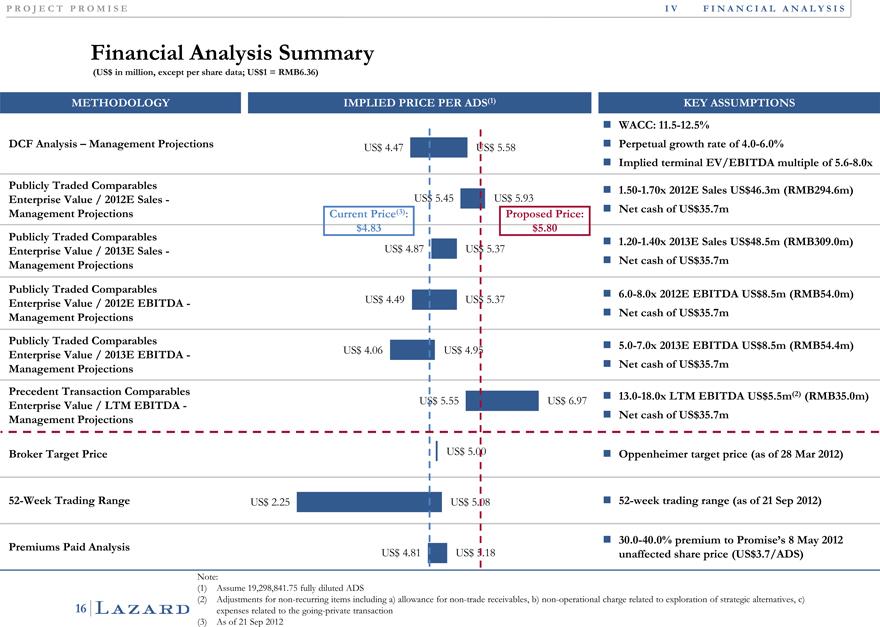
Financial Analysis Summary
(US$ in million, except per share data; US$1 = RMB6.36)
METHODOLOGY IMPLIED PRICE PER ADS(1) KEY ASSUMPTIONS
WACC: 11.5-12.5%
$$USUS4.47 5.58 Perpetual growth rate of 4.0-6.0%
DCF Analysis – Management Projections
Implied terminal EV/EBITDA multiple of 5.6-
8.0x
Publicly Traded Comparables $$$USUSUS5.45 5.93 ?1.50-1.70x 2012E Sales 46.3m
Enterprise Value / 2012E Sales— Current Price(3): Proposed Price: (RMB294.6m)
Management Projections $US $4.83 $5.80 ?Net cash of 35.7m
$$USUS4.87 5.37
Publicly Traded Comparables $US??1.20-1.40x 2013E Sales 48.5m (RMB309.0m)
Enterprise Value / 2013E Sales—
Management Projections $US??Net cash of 35.7m
$$USUS4.49 5.37
Publicly Traded Comparables $US?6.0-8.0x 2012E EBITDA 8.5m (RMB54.0m)
Enterprise Value / 2012E EBITDA—
Management Projections $US??Net cash of 35.7m
US4.06$$US 4.95
Publicly Traded Comparables $US?5.0-7.0x 2013E EBITDA 8.5m (RMB54.4m)
Enterprise Value / 2013E EBITDA—
Management Projections $US?Net cash of 35.7m
US5.55$$US 6.97
Precedent Transaction Comparables $US??13.0-18.0x LTM EBITDA 5.5m(2)
Enterprise Value / LTM EBITDA— (RMB35.0m)
Management Projections $US??Net cash of 35.7m
US5.00$
Broker Target Price Oppenheimer target price (as of 28 Mar 2012)
US2.25 US$5.08$
52-Week Trading Range 52-week trading range (as of 21 Sep 2012)
US4.81 US$5.18$
30.0-40.0% premium to Promise’s 8 May 2012
Premiums Paid Analysis
Note: unaffected$share price(US 3.7/ADS)
(1) | | Assume 19,298,841.75 fully diluted ADS |
(2) Adjustments for non-recurring items including a) allowance for non-trade receivables, b) non-operational charge related to exploration of strategic alternatives, c)
16 expenses related to the going-private transaction
LAZARD
P R O J E C T P R O M I S E I V F I N A N C I A L A N A L Y S I S
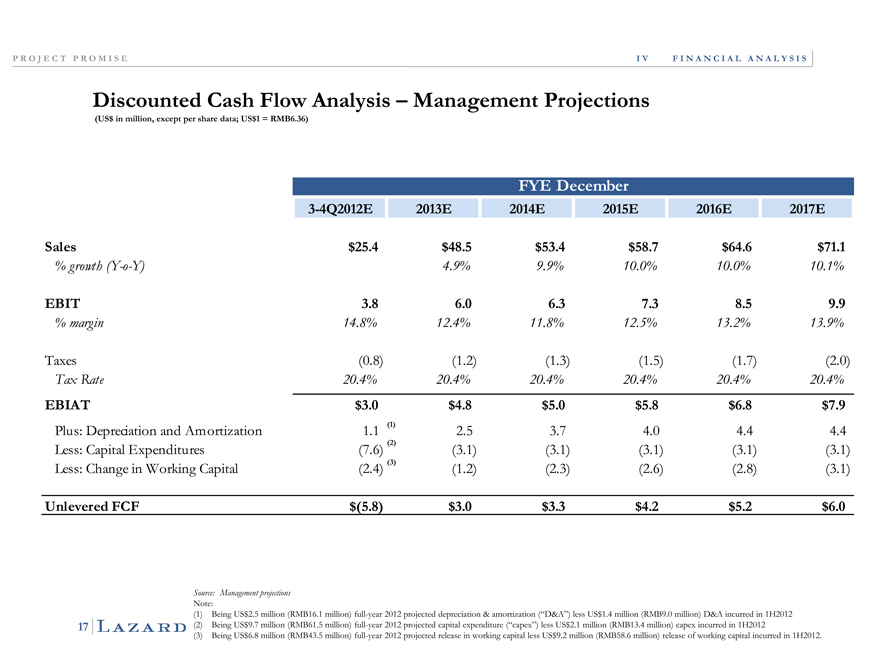
Discounted Cash Flow Analysis – Management Projections
(US$ in million, except per share data; US$1 = RMB6.36)
FYE December
3-4Q2012E 2013E 2014E 2015E 2016E 2017E
Sales $254. $485. $534. $587. $646. $711.
% growth (Y-o-Y) 4.9% 9.9% 10.0% 10.0% 10.1%
EBIT 3.8 6.0 6.3 7.3 8.5 9.9
% margin 14.8% 12.4% 11.8% 12.5% 13.2% 13.9%
Taxes (0.8) (1.2) (1.3) (1.5) (1.7) (2.0)
Tax Rate 20.4% 20.4% 20.4% 20.4% 20.4% 20.4%
EBIAT $3.0 $4.8 $5.0 $5.8 $6.8 $7.9
Plus: Depreciation and Amortization 1.1 (1) 2.5 3.7 4.0 4.4 4.4
Less: Capital Expenditures (7.6) (2) (3.1) (3.1) (3.1) (3.1) (3.1)
Less: Change in Working Capital (2.4) (3) (1.2) (2.3) (2.6) (2.8) (3.1)
Unlevered FCF $(5.8) $3.0 $3.3 $4.2 $5.2 $6.0
Source: Management projections
Note:
(1) Being US$2.5 million (RMB16.1 million) full-year 2012 projected depreciation & amortization (“D&A”) less US$1.4 million (RMB9.0 million) D&A incurred in 1H2012 (2) Being US$9.7 million (RMB61.5 million) full-year 2012 projected capital expenditure (“capex”) less US$2.1 million (RMB13.4 million) capex incurred in 1H2012 (3) Being US$6.8 million (RMB43.5 million) full-year 2012 projected release in working capital less US$9.2 million (RMB58.6 million) release of working capital incurred in 1H2012.
17
LAZARD
P R O J E C T P R O M I S E I V F I N A N C I A L A N A L Y S I S
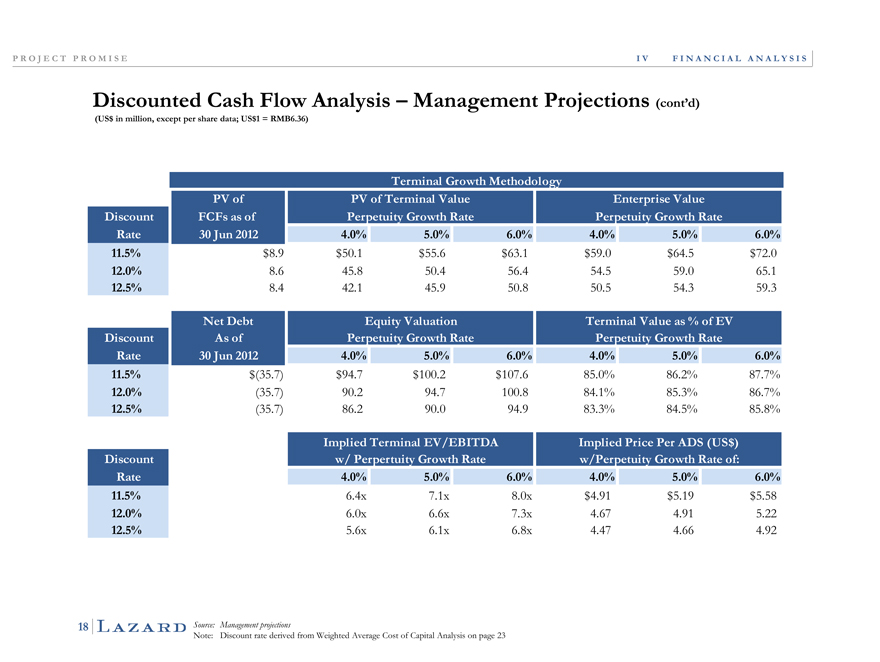
Discounted Cash Flow Analysis – Management Projections (cont’d)
(US$ in million, except per share data; US$1 = RMB6.36)
Terminal Growth Methodology
PV of PV of Terminal Value Enterprise Value
Discount FCFs as of Perpetuity Growth Rate Perpetuity Growth Rate
Rate 30 Jun 2012 4.0% 5.0% 6.0% 4.0% 5.0% 6.0%
11.5% $63.1$72.0$664.58.9 $50.1 $55. $59.0 $
12.0% 8.6 45.8 50.4 56.4 54.5 59.0 65.1
12.5% 8.4 42.1 45.9 50.8 50.5 54.3 59.3
Net Debt Equity Valuation Terminal Value as % of EV
Discount As of Perpetuity Growth Rate Perpetuity Growth Rate
Rate 30 Jun 2012 4.0% 5.0% 6.0% 4.0% 5.0% 6.0%
11.5% $(35.7) $94.7 $100.2 $107.6 85.0% 86.2% 87.7%
12.0% (35.7) 90.2 94.7 100.8 84.1% 85.3% 86.7%
12.5% (35.7) 86.2 90.0 94.9 83.3% 84.5% 85.8%
Implied Terminal EV /EBITDA$Implied Price Per ADS(US )
Discount w/ Perpertuity Growth Rate w/Perpetuity Growth Rate of:
Rate 4.0% 5.0% 6.0% 4.0% 5.0% 6.0%
115%. 64x. 71.1x 80x. $4.91 $5.19 $5.58
12.0% 6.0x 6.6x 7.3x 4.67 4.91 5.22
12.5% 5.6x 6.1x 6.8x 4.47 4.66 4.92
Source: Management projections
Note: Discount rate derived from Weighted Average Cost of Capital Analysis on page 23
18
LAZARD
P R O J E C T P R O M I S E I V F I N A N C I A L A N A L Y S I S
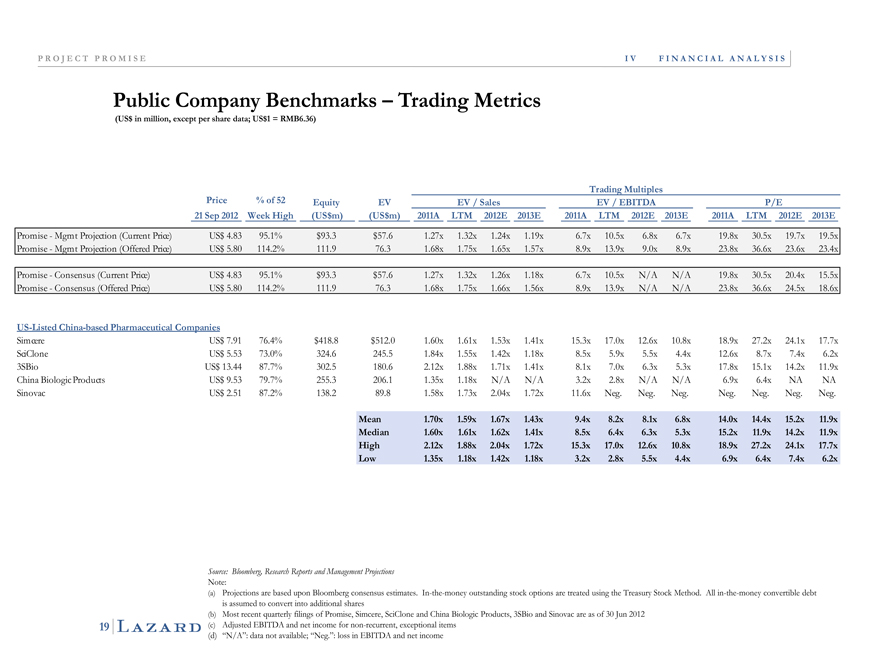
Public Company Benchmarks – Trading Metrics
(US$ in million, except per share data; US$1 = RMB6.36)
Trading Multiples
Price % of 52 Equity EV EV / Sales EV / EBITDA P/E
21 Sep 2012$$(US(USWeek High m) m) 2011A LTM 2012E 2013E 2011A LTM 2012E 2013E 2011A LTM 2012E 2013E
omise—Mgmt Projection (Current Price) US4.83$ 95.1% $93.3 $57.6 1.27x 1.32x 1.24x 1.19x 6.7x 10.5x 6.8x 6.7x 19.8x 30.5x 19.7x 19.5x
mise—Mgmt Projection (Offered Price) US$5.80 114.2% 111.9 76.3 1.68x 175x. 165x. 157x. 89x. 13.9x 90x. 89x. 23.8x 36.6x 23.6x 23.4x
omise—Consensus (Current Price) US$4.83 95.1% $93.3 $57.6 1.27x 1.32x 1.26x 1.18x 6.7x 10.5x N/A N/A 19.8x 30.5x 20.4x 15.5x
omise—Consensus (Offered Price) US$5.80 114.2% 111.9 76.3 1.68x 1.75x 1.66x 1.56x 8.9x 13.9x N/A N/A 23.8x 36.6x 24.5x 18.6x
Listed China-based Pharmaceutical Companies
US7.91 76.4% $418.8$ $512.0 1.60x 1.61x 1.53x 1.41x 15.3x 17.0x 12.6x 10.8x 18.9x 27.2x 24.1x 17.7x
Clone US5.53 73.0% 324.6$ 245.5 1.84x 1.55x 1.42x 1.18x 8.5x 5.9x 5.5x 4.4x 12.6x 8.7x 7.4x 6.2x
US13.44 87.7% 302.5 180.6$ 2.12x 1.88x 1.71x 1.41x 8.1x 7.0x 6.3x 5.3x 17.8x 15.1x 14.2x 11.9x
Biologic Products US9.53 79.7% 255.3 206.1$ 1.35x 1.18x N/A N/A 3.2x 2.8x N/A N/A 6.9x 6.4x NA NA
ovac US2.51 87.2% 138.2 89.8$ 1.58x 1.73x 2.04x 1.72x 11.6x Neg. Neg. Neg. Neg. Neg. Neg. Neg.
Mean 1.70x 1.59x 1.67x 1.43x 9.4x 8.2x 8.1x 6.8x 14.0x 14.4x 15.2x 11.9x
Median 1.60x 1.61x 1.62x 1.41x 8.5x 6.4x 6.3x 5.3x 15.2x 11.9x 14.2x 11.9x
High 2.12x 1.88x 2.04x 1.72x 15.3x 17.0x 12.6x 10.8x 18.9x 27.2x 24.1x 17.7x
Low 1.35x 1.18x 1.42x 1.18x 3.2x 2.8x 5.5x 4.4x 6.9x 6.4x 7.4x 6.2x
Source: Bloomberg, Research Reports and Management Projections
Note:
(a) Projections are based upon Bloomberg consensus estimates. In-the-money outstanding stock options are treated using the Treasury Stock Method. All in-the-money convertible debt is assumed to convert into additional shares (b) Most recent quarterly filings of Promise, Simcere, SciClone and China Biologic Products, 3SBio and Sinovac are as of 30 Jun 2012 (c) Adjusted EBITDA and net income for non-recurrent, exceptional items (d) “N/A”: data not available; “Neg.”: loss in EBITDA and net income
19
LAZARD
P R O J E C T P R O M I S E I V F I N A N C I A L A N A L Y S I S
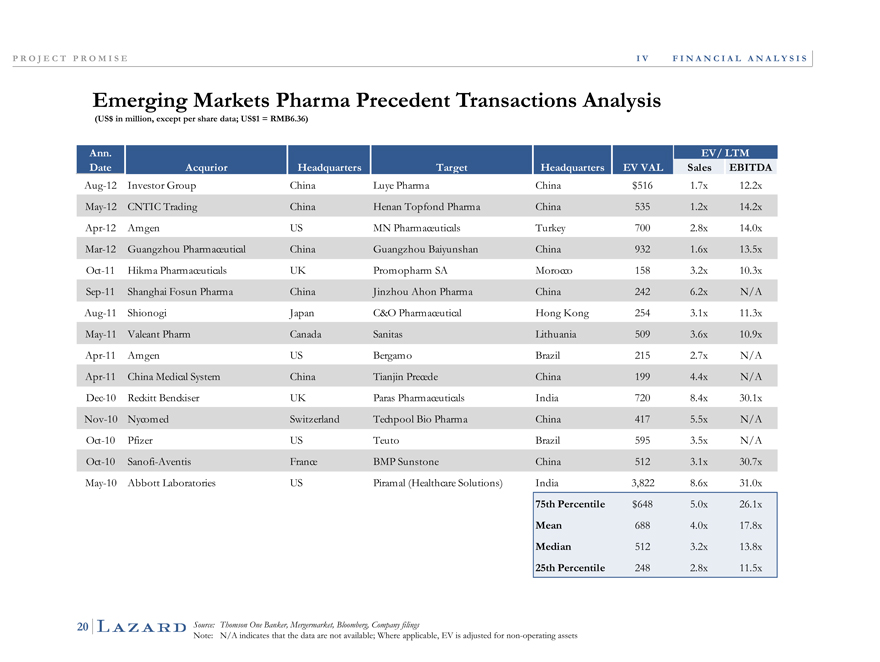
Emerging Markets Pharma Precedent Transactions Analysis
(US$ in million, except per share data; US$1 = RMB6.36)
Ann. EV/ LTM Date Acqurior Headquarters arget Headquarters EV VAL Sales EBITDA
Aug-12 Investor Group China Luye Pharma China $516 1.7x 12.2x May-12 CNTIC Trading China Henan Topfond Pharma China 535 1.2x 14.2x Apr-12 Amgen US MN Pharmaceuticals Turkey 700 2.8x 14.0x Mar-12 Guangzhou Pharmaceutical China Guangzhou Baiyunshan China 932 1.6x 13.5x Oct-11 Hikma Pharmaceuticals UK Promopharm SA Morocco 158 3.2x 10.3x Sep-11 Shanghai Fosun Pharma China Jinzhou Ahon Pharma China 242 6.2x N/A Aug-11 Shionogi Japan C&O Pharmaceutical Hong Kong 254 3.1x 11.3x May-11 Valeant Pharm Canada Sanitas Lithuania 509 3.6x 10.9x Apr-11 Amgen US Bergamo Brazil 215 2.7x N/A Apr-11 China Medical System China Tianjin Precede China 199 4.4x N/A Dec-10 Reckitt Benckiser UK Paras Pharmaceuticals India 720 8.4x 30.1x Nov-10 Nycomed Switzerland Techpool Bio Pharma China 417 5.5x N/A Oct-10 Pfizer US Teuto Brazil 595 3.5x N/A Oct-10 Sanofi-Aventis France BMP Sunstone China 512 3.1x 30.7x May-10 Abbott Laboratories US Piramal (Healthcare Solutions) India 3,822 8.6x 31.0x
75th Percentile $648 5.0x 26.1x
Mean 688 4.0x 17.8x Median 512 3.2x 13.8x
25th Percentile 248 2.8x 11.5x
Source: Thomson One Banker, Mergermarket, Bloomberg, Company filings
Note: N/A indicates that the data are not available; Where applicable, EV is adjusted for non-operating assets
20
LAZARD
P R O J E C T P R O M I S E
Appendix
LAZARD
P R O J E C T P R O M I S E
A Additional Promise Information
LAZARD
A A D D I T I O N A L P R O M I S E I N F O R M A T I O N
P R O J E C T P R O M I S E
Promise Volume at Various Prices
(US$ in million, except per share data; US$1 = RMB6.36)
Float (1) 19,298,842
From IPO on 9 Dec 2009 to Present Total Volume: 21,693,310
Shares Traded Volume-Weighted Average Price:
10,000,000 Last half-Year $4.82
Last 1-Year 4.48
8,000,000 Since IPO 5.45
6,000,000
4,000,000
2,000,000
0
$2.00-$3.00 $3.00-$4.00 $4.00-$5.00 $5.00-$6.00 $6.00-$7.00 $7.00-$8.00 $8.00-$9.00
% Traded 2% 17% 37% 12% 8% 8% 16%
% Cumulative 2% 19% 56% 68% 76% 84% 100%
From 1 Jan 2012 to Present
Total Volume: 3,949,907
Shares Traded Volume-Weighted Average Price:
2,000,000 Last 1-Month $4.75
Last 3-Month 4.93
1,500,000 Since 1 Jan 12 4.64
1,000,000
500,000
NIL NIL NIL
0
$2.00-$3.00 $3.00-$4.00 $4.00-$5.00 $5.00-$6.00 $6.00-$7.00 $7.00-$8.00 $8.00-$9.00
% Traded 9% 3% 55% 33% 0% 0% 0%
% Cumulative 9% 12% 67% 100% 100% 100% 100%
Source: Bloomberg. Market data as of 21Sep 2012
Note:
(1) Includes 153,030,734 ordinary shares plus 1,360,000 RSUs, outstanding as of 19 Sep 2012 (per records of the Company); 1 ADS = 8 ordinary shares
21
LAZARD
P R O J E C T P R O M I S E A A D D I T I O N A L P R O M I S E I N F O R M A T I O N
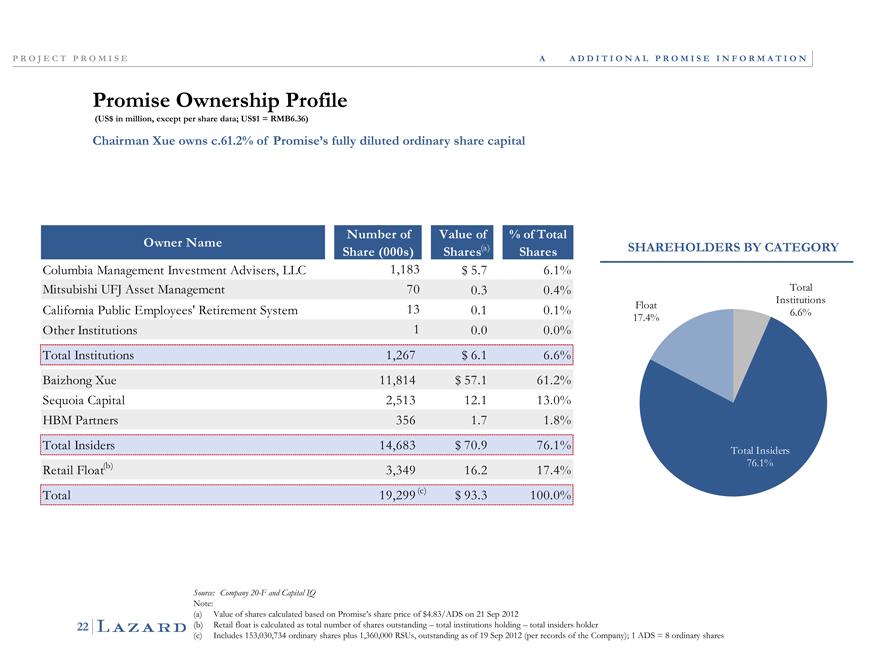
Promise Ownership Profile
(US$ in million, except per share data; US$1 = RMB6.36)
Chairman Xue owns c.61.2% of Promise’s fully diluted ordinary share capital
N umber of Value of % of Total
Owner N ame (a)
Share (000s) Shares Shares
Columbia Management Investment Advisers, LLC 1,183 $ 5.7 6.1%
Mitsubishi UFJ Asset Management 70 0.3 0.4%
California Public Employees’ Retirement System 13 0.1 0.1%
Other Institutions 1 0.0 0.0%
Total Institutions 1,267 $ 6.1 6.6%
Baizhong Xue 11,814 $ 57.1 61.2%
Sequoia Capital 2,513 12.1 13.0%
HBM Partners 356 1.7 1.8%
Total Insiders 14,683 $ 70.9 76.1%
Retail Float(b) 3,349 16.2 17.4%
Total 19,299 (c) $ 93.3 100.0%
SHAREHOLDERS BY CATEGORY
Float 17.4%
Total Institutions 6.6%
Total Insiders 76.1%
Source: Company 20-F and Capital IQ
Note:
(a) | | Value of shares calculated based on Promise’s share price of $4.83/ADS on 21 Sep 2012 |
(b) Retail float is calculated as total number of shares outstanding – total institutions holding – total insiders holder
(c) Includes 153,030,734 ordinary shares plus 1,360,000 RSUs, outstanding as of 19 Sep 2012 (per records of the Company); 1 ADS = 8 ordinary shares
22
LAZARD
P R O J E C T P R O M I S E
B WACC Analysis
LAZARD
P R O J E C T P R O M I S E B W A C C A N A L Y S I S
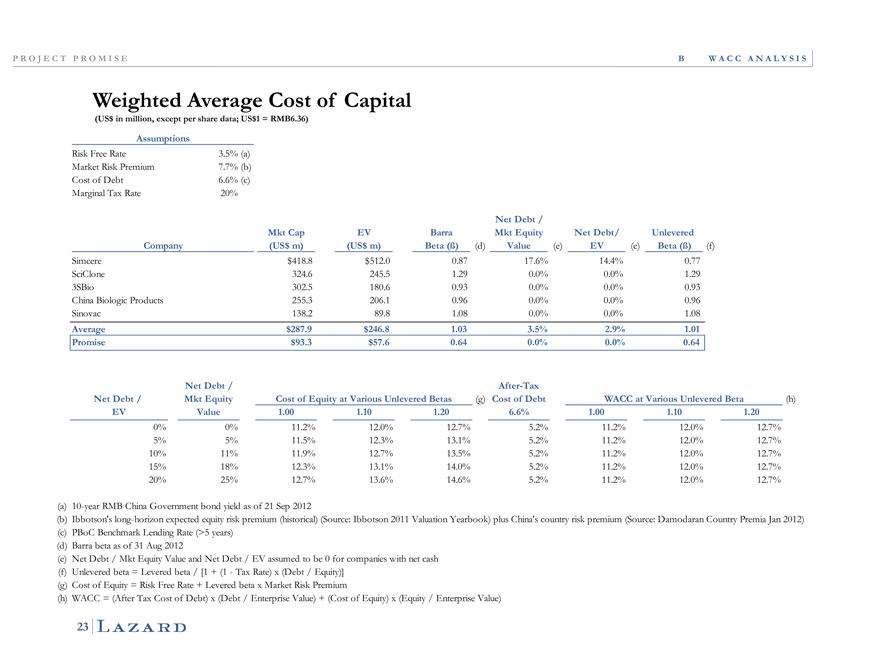
Weighted Average Cost of Capital
(US$ in million, except per share data; US$1 = RMB6.36)
Assumptions
Risk Free Rate 3.5% (a) Market Risk Premium 7.7% (b) Cost of Debt 6.6% (c) Marginal Tax Rate 20%
Percentage inc 0.5% Net Debt /
Mkt Cap EV Barra Mkt Equity N et Debt/ Unlevered Company (US$ m) (US$ m) Beta (ß) (d) Value (e) EV (e) Beta (ß) (f) Simcere $418.8 $512.0 0.87 17.6% 14.4% 0.77 SciClone 324.6 245.5 1.29 0.0% 0.0% 1.29 3SBio 302.5 180.6 0.93 0.0% 0.0% 0.93 China Biologic Products 255.3 206.1 0.96 0.0% 0.0% 0.96 Sinovac 138.2 89.8 1.08 0.0% 0.0% 1.08
Average $287.9 $246.8 1.03 3.5% 2.9% 1.01 Promise $93.3 $57.6 0.64 0.0% 0.0% 0.64
N et Debt / After-Tax
N et Debt / Mkt Equity Cost of Equity at Various Unlevered Betas (g) Cost of Debt WACC at Various Unlevered Beta (h) EV Value 1.00 1.10 1.20 6.6% 1.00 1.10 1.20
0% 0% 11.2% 12.0% 12.7% 5.2% 11.2% 12.0% 12.7%
5% 5% 11.5% 12.3% 13.1% 5.2% 11.2% 12.0% 12.7% 10% 11% 11.9% 12.7% 13.5% 5.2% 11.2% 12.0% 12.7% 15% 18% 12.3% 13.1% 14.0% 5.2% 11.2% 12.0% 12.7% 20% 25% 12.7% 13.6% 14.6% 5.2% 11.2% 12.0% 12.7%
(a) | | 10-year RMB China Government bond yield as of 21 Sep 2012 |
(b) Ibbotson’s long-horizon expected equity risk premium (historical) (Source: Ibbotson 2011 Valuation Yearbook) plus China’s country risk premium (Source: Damodaran Country Premia Jan 2012) (c) PBoC Benchmark Lending Rate (>5 years) (d) Barra beta as of 31 Aug 2012 (e) Net Debt / Mkt Equity Value and Net Debt / EV assumed to be 0 for companies with net cash (f) Unlevered beta = Levered beta / [1 + (1—Tax Rate) x (Debt / Equity)] (g) Cost of Equity = Risk Free Rate + Levered beta x Market Risk Premium (h) WACC = (After Tax Cost of Debt) x (Debt / Enterprise Value) + (Cost of Equity) x (Equity / Enterprise Value)
23
LAZARD
P R O J E C T P R O M I S E
C Premiums Paid Analysis
LAZARD
P R O J E C T P R O M I S E C P R E M I U M S P A I D A N A L Y S I S
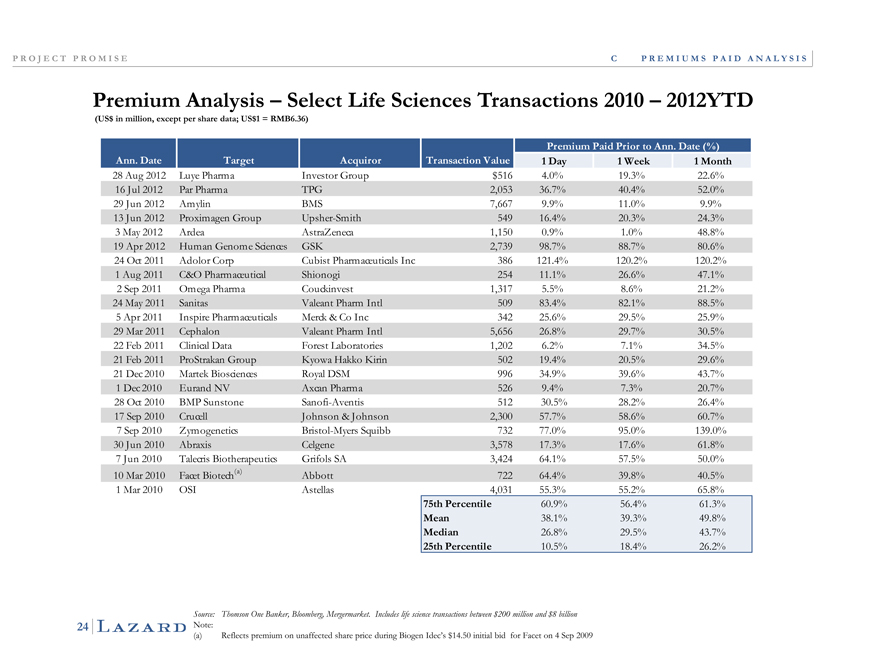
Premium Analysis – Select Life Sciences Transactions 2010 –2012YTD
Premium Paid Prior to Ann. Date (%) Ann. Date Target Acquiror Transaction Value 1Day 1Week 1Month
28 Aug 2012 Luye Pharma Investor Group $516 4.0% 19.3% 22.6%
16 Jul 2012 Par Pharma TPG 2,053 36.7% 40.4% 52.0%
29 Jun 2012 Amylin BMS 7,667 9.9% 11.0% 9.9%
13 Jun 2012 Proximagen Group Upsher-Smith 549 16.4% 20.3% 24.3%
3 | | May 2012 Ardea AstraZeneca 1,150 0.9% 1.0% 48.8% |
19 Apr 2012 Human Genome Sciences GSK 2,739 98.7% 88.7% 80.6%
24 Oct 2011 Adolor Corp Cubist Pharmaceuticals Inc 386 121.4% 120.2% 120.2%
1 | | Aug 2011 C&O Pharmaceutical Shionogi 254 11.1% 26.6% 47.1% |
2 | | Sep 2011 Omega Pharma Couckinvest 1,317 5.5% 8.6% 21.2% |
24 May 2011 Sanitas Valeant Pharm Intl 509 83.4% 82.1% 88.5%
5 | | Apr 2011 Inspire Pharmaceuticals Merck & Co Inc 342 25.6% 29.5% 25.9% |
29 Mar 2011 Cephalon Valeant Pharm Intl 5,656 26.8% 29.7% 30.5%
22 Feb 2011 Clinical Data Forest Laboratories 1,202 6.2% 7.1% 34.5%
21 Feb 2011 ProStrakan Group Kyowa Hakko Kirin 502 19.4% 20.5% 29.6%
21 Dec 2010 Martek Biosciences Royal DSM 996 34.9% 39.6% 43.7%
1 | | Dec 2010 Eurand NV Axcan Pharma 526 9.4% 7.3% 20.7% |
28 Oct 2010 BMP Sunstone Sanofi-Aventis 512 30.5% 28.2% 26.4%
17 Sep 2010 Crucell Johnson & Johnson 2,300 57.7% 58.6% 60.7%
7 | | Sep 2010 Zymogenetics Bristol-Myers Squibb 732 77.0% 95.0% 139.0% |
30 Jun 2010 Abraxis Celgene 3,578 17.3% 17.6% 61.8%
7 | | Jun 2010 Talecris Biotherapeutics Grifols SA 3,424 64.1% 57.5% 50.0% |
10 Mar 2010 Facet Biotech(a) Abbott 722 64.4% 39.8% 40.5%
1 Mar 2010 OSI Astellas 4,031 55.3% 55.2% 65.8% 75th Percentile 60.9% 56.4% 61.3% Mean 38.1% 39.3% 49.8% Median 26.8% 29.5% 43.7% 25th Percentile 10.5% 18.4% 26.2%
24
LAZARD
Source: Thomson One Banker, Bloomberg, Mergermarket. Includes life science transactions between $200 million and $8 billion
Note:
(a) | | Reflects premium on unaffected share price during Biogen Idec’s $14.50 initial bid for Facet on 4 Sep 2009 |
P R O J E C T P R O M I S E
D Chinese Market Developments
LAZARD
P R O J E C T P R O M I S E D C H I N E S E M A R K E T D E V E L O P M E N T S
Chinese Market Developments
KEY OBSERVATIONS
In 2Q2012, China’s economy decelerated to its weakest rate of growth in more than three years, expanding at only 7.6% y-y
?Growth eased from a year-on-year growth rate of 8.1% in 1Q2012. For 1H2012, the economy grew 7.8% y-y, compared to 9.6% y-y in the same period a year earlier
Premier Wen Jiabao cut China’s 2012 growth target to an eight-year low of 7.5% and made boosting consumer demand the RECENT MACRO year’s first priority as Beijing looks to wean the economy off its reliance on external demand and foreign capital ECONOMIC In July 2012, The People’s of China (‘P benchmark lending rate down ENVIRONMENT ??Bank BoC”) lowered its one-year by 31bps to 6% and the one-year benchmark deposit rates by 25bps to 3%
So far this year, PBoC has cut interest rates twice in response to economic concerns and tightened liquidity
PBoC also tried to spur growth by cutting the amount of money banks are required to hold in reserves, freeing up those funds in order to boost investment
Expenditures on healthcare have more than doubled, from US$156 billion in 2006 to US$357 billion in 2011, representing approximately 5% of China’s GDP. From pharmaceuticals to medical devices to traditional Chinese medicine (“TCM”), virtually every healthcare sector has benefited
Heathcare spending is projected to grow at a CAGR of 12% from US$357 billion in 2011 to US$1,000 billion in 2020
Growth in the healthcare sector is fueled by favorable demographic trends, continuing urbanization, increasing disease burdens, the healthy expansion of the overall economy, growth in incomes which allow greater awareness of and access to treatments, and the government’s focus on healthcare as a social priority HEALTHCARE During 2009-2011, INDUSTRY TRENDS as improvements in the healthcare system, the government has:
Increased coverage of basic medical care insurance programs to over 95% of China’s population
Completed construction of an additional 1,600+ hospitals and 5,500+ community health centers
Invested RMB63 billion (circa US$10 billion) in the construction/improvement of 33,000 grass-root hospitals and RMB451 billion (circa US$71 billion) in medical care services
Nonetheless, the healthcare sector is progressing with significant government intervention in areas such as pricing, intensifying competition from local and foreign companies and easing economic growth
Source: Broker and consultant reports
25