UNITED STATES
SECURITIES AND EXCHANGE COMMISSION
Washington, D.C. 20549
FORM N-CSR
CERTIFIED SHAREHOLDER REPORT OF REGISTERED MANAGEMENT
INVESTMENT COMPANIES
Investment Company Act file number: 811-22376
PIMCO Equity Series VIT
(Exact name of registrant as specified in charter)
650 Newport Center Drive, Newport Beach, CA 92660
(Address of principal executive office)
Trent W. Walker
Treasurer (Principal Financial & Accounting Officer)
PIMCO Equity Series VIT
650 Newport Center Drive
Newport Beach, CA 92660
(Name and address of agent for service)
Copies to:
Brendan C. Fox
Dechert LLP
1900 K Street, N.W.
Washington, D.C. 20006
Registrant’s telephone number, including area code: (888) 877-4626
Date of fiscal year end: December 31
Date of reporting period: June 30, 2016
Form N-CSR is to be used by management investment companies to file reports with the Commission not later than 10 days after the transmission to stockholders of any report that is required to be transmitted to stockholders under Rule 30e-1 under the Investment Company Act of 1940 (17 CFR 270.30e-1). The Commission may use the information provided on Form N-CSR in its regulatory, disclosure review, inspection, and policymaking roles.
A registrant is required to disclose the information specified by Form N-CSR, and the Commission will make this information public. A registrant is not required to respond to the collection of information contained in Form N-CSR unless the Form displays a currently valid Office of Management and Budget (“OMB”) control number. Please direct comments concerning the accuracy of the information collection burden estimate and any suggestions for reducing the burden to Secretary, Securities and Exchange Commission, 450 Fifth Street, NW, Washington, DC 20549-0609. The OMB has reviewed this collection of information under the clearance requirements of 44 U.S.C. § 3507.
| Item 1. | Reports to Shareholders. |
The following is a copy of the report transmitted to shareholders pursuant to Rule 30e-1 under the Investment Company Act of 1940, as amended (the “1940 Act”) (17 CFR 270.30e-1).
• PIMCO Equity Series VIT

PIMCO Equity Series VIT®
Semiannual Report
June 30, 2016

PIMCO StocksPLUS® Global Portfolio
Share Classes

Table of Contents
*Prior to June 16, 2016 the Portfolio’s name was PIMCO Global Dividend Portfolio
This material is authorized for use only when preceded or accompanied by the current PIMCO Equity Series VIT (the “Trust”) prospectus for the Portfolio. The variable product prospectus may be obtained by contacting your Investment Consultant.
Chairman’s Letter
Dear Shareholder,
Please find enclosed the Semiannual Report for the PIMCO Equity Series VIT covering the six-month reporting period ended June 30, 2016. The following pages contain specific details about the investment performance of the Portfolio and a discussion of the factors that most affected performance during the reporting period.
Outside of the reporting period, PIMCO announced on July 19, 2016 that the firm’s Managing Directors have selected Emmanuel (Manny) Roman as PIMCO’s next Chief Executive Officer. PIMCO’s current CEO Douglas Hodge will assume a new role as Managing Director and Senior Advisor when Mr. Roman joins PIMCO on November 1st.
The announcement of Mr. Roman as PIMCO’s CEO is the culmination of a process undertaken by the firm to hire a senior executive who would add leadership and strategic insights combined with a deep appreciation of PIMCO’s diversified global businesses, investment process and focus on superior investment performance and client-service. Mr. Roman’s appointment has the full support of the firm’s leadership including Mr. Hodge, PIMCO’s President Jay Jacobs, the firm’s Executive Committee and its Managing Directors. Mr. Roman has nearly 30 years of experience in the investment industry, with expertise in fixed income and proven executive leadership, most recently as CEO of Man Group PLC, one of the world’s largest publicly-traded alternative asset managers and a leader in liquid, high-alpha investment strategies.
Highlights of the financial markets during the six-month reporting period include:
| | n | | The first segment of the reporting period through mid-February 2016 was marked by ongoing concerns over the global impact of a slowdown in the Chinese economy, which drove commodity prices and inflation expectations generally lower. By March, a recovery in the price of oil and expectations of lower interest rates for longer supported a rally in risk assets. The Bank of Japan (“BOJ”) and the People’s Bank of China, for example, indicated their intent for further policy easing, with the BOJ resorting to a negative interest rate policy in February 2016. The European Central Bank (“ECB”) also resorted to unconventional monetary policy with additional easing measures and an expansion of its quantitative easing program by shifting its focus toward domestic credit, pushing government sovereign yields into negative territory. In June 2016, the ECB began purchasing corporate bonds to help invigorate economic growth and stimulate inflation in the region. |
| | n | | In the U.S., concerns regarding the global impact of tightening financial conditions and renewed U.S. dollar strength kept the Federal Reserve (“Fed”) on hold at their June 2016 meeting, after having slightly raised interest rates at their December 2015 meeting. In addition, the U.S. dollar appreciated against most European and emerging market currencies, while falling against the Japanese yen. The U.S. interest rate yield curve flattened as the ten-year U.S. Treasury yield rallied to all-time lows and short-term interest rates rose with the initial Fed rate hike in December 2015. Revised first quarter 2016 U.S. gross domestic product (“GDP”) data released in late June was marginally stronger as retail sales, housing and consumer sentiment data indicated an improving economy. |
| | n | | Market movements and news headlines at the end of the reporting period were dominated by the unexpected outcome of the U.K. referendum on June 23, 2016. Initial investor reaction to the Brexit vote was largely “risk-off” as various assets re-priced to the surprise outcome, with U.S. Treasuries, the Japanese yen and gold headlining a safe-haven rally. However, aside from the Pound Sterling and European and Japanese equities, most asset classes generally recovered in the ensuing week as investors reassessed the impact of the Brexit vote on global growth expectations. |
| | n | | Global developed market equities experienced weak performance amid a period marked by economic uncertainty, increased volatility and geopolitical concerns. U.S. equities, as represented by the S&P 500 Index, were a bright spot, returning 3.84% over the reporting period. International equity markets (developed ex-U.S.), as represented by the MSCI EAFE Net Dividend Index (USD Hedged), declined 6.94% over the reporting period and the MSCI EAFE Net Dividend Index (USD Unhedged) declined 4.42% over the reporting period. Japanese equities, as represented by |
| | | | | | | | |
| 2 | | PIMCO EQUITY SERIES VIT | | | | | | |
| | the Nikkei 225 Index in JPY, declined 17.51% over the reporting period and European equities, as represented by the MSCI Europe Index in EUR, declined 7.23% over the reporting period. During the first segment of the reporting period through mid-February, declining commodities prices and China’s economic deceleration drove concerns of slowing global growth, which weighed on equity returns. However, in the last few months of the reporting period, developed market equities began to rebound from February 2016 lows as global central banks resorted to increasingly unconventional monetary policy. However, late in the reporting period in June, global equities were pressured once again due to Britain’s decision to leave the European Union. |
| | n | | Emerging market (“EM”) equities, as represented by the MSCI Emerging Markets Index (Net Dividends in USD), returned 6.41% over the reporting period. Similar to the developed markets, emerging market equities experienced a strong rebound following February 2016 lows, with cyclicals and commodity-linked markets leading the rally. |
| | n | | U.S. Treasuries, as represented by the Barclays U.S. Treasury Index, returned 5.37% for the reporting period. Yields declined across the majority of the U.S. Treasury yield curve as a more dovish tone from the Fed coupled with the surprise result of the U.K. referendum pushed expectations for policy normalization further into the future. The benchmark ten-year U.S. Treasury note yielded 1.49% at the end of the reporting period, down from 2.27% on December 31, 2015. The Barclays U.S. Aggregate Index, a widely used index of U.S. investment-grade bonds, returned 5.31% for the reporting period. |
Thank you again for the trust you have placed in us. We value your commitment and will continue to work diligently to meet your broad investment and investment solution needs.
| | |
 | | Sincerely, 
Brent R. Harris Chairman of the Board, PIMCO Equity Series VIT August 22, 2016 |
Past performance is no guarantee of future results. Unless otherwise noted, index returns reflect the reinvestment of income dividends and capital gains, if any, but do not reflect fees, brokerage commissions or other expenses of investing. It is not possible to invest directly in an unmanaged index.
| | | | | | |
| | SEMIANNUAL REPORT | | JUNE 30, 2016 | | 3 |
Important Information About the PIMCO StocksPLUS® Global Portfolio
PIMCO Equity Series VIT (the “Trust”) is an open-end management investment company currently consisting of one investment portfolio, the PIMCO StocksPLUS® Global Portfolio (formerly known as the PIMCO Global Dividend Portfolio) (the “Portfolio”). The Portfolio is only available as a funding vehicle under variable life insurance policies or variable annuity contracts issued by insurance companies (“Variable Contracts”). Individuals may not purchase shares of the Portfolio directly. Shares of the Portfolio also may be sold to qualified pension and retirement plans outside of the separate account context.
In an environment where interest rates may trend upward, rising rates would negatively impact the performance of certain funds, and fixed-income securities and other instruments held by the Portfolio are likely to decrease in value. A wide variety of factors can cause interest rates to rise (e.g., central bank monetary policies, inflation rates, general economic conditions, etc.). In addition, changes in interest rates can be sudden and unpredictable, and there is no guarantee that Portfolio management will anticipate such movement accurately. The Portfolio may lose money as a result of movements in interest rates.
The values of equity securities, such as common stocks and preferred stocks, have historically risen and fallen in periodic cycles and may decline due to general market conditions, which are not specifically related to a particular company, such as real or perceived adverse economic conditions, changes in the general outlook for corporate earnings, changes in interest or currency rates or adverse investor sentiment generally. Equity securities may also decline due to factors that affect a particular industry or industries, such as labor shortages, increased production costs and competitive conditions within an industry. In addition, the value of an equity security may decline for a number of reasons that directly relate to the issuer, such as management performance, financial leverage and reduced demand for the issuer’s goods or services, as well as the historical and prospective earnings of the issuer and the value of its assets. Different types of equity securities may react differently to these developments and a change in the financial condition of a single issuer may affect securities markets as a whole.
During a general downturn in the securities markets, multiple asset classes, including equity securities, may decline in value simultaneously. The market price of equity securities owned by a Portfolio may go up or down, sometimes rapidly or unpredictably. Equity securities generally have greater price volatility than fixed income securities and common stocks generally have the greatest appreciation and depreciation potential of all equity securities.
As of the date of this report, interest rates in the U.S. and many parts of the world, including certain European countries, are near historically low levels. As such, bond funds may currently face an increased exposure to
the risks associated with a rising interest rate environment. This is especially true as the Fed ended its quantitative easing program and has begun, and may continue, to raise interest rates. Further, while bond markets have steadily grown over the past three decades, dealer inventories of corporate bonds are near historic lows in relation to market size. As a result, there has been a significant reduction in the ability of dealers to “make markets.”
Bond funds and individual bonds with a longer duration (a measure used to determine the sensitivity of a security’s price to changes in interest rates) tend to be more sensitive to changes in interest rates, usually making them more volatile than securities or funds with shorter durations. All of the factors mentioned above, individually or collectively, could lead to increased volatility and/or lower liquidity in the fixed income markets or negatively impact the Portfolio’s performance or cause the Portfolio to incur losses. As a result, the Portfolio may experience increased shareholder redemptions, which, among other things, could further reduce the net assets of the Portfolio.
The Portfolio may be subject to various risks as described in the Portfolio’s prospectus. Some of these risks may include, but are not limited to, the following: equity risk, mortgage-related and other asset-backed securities risk, foreign (non-U.S.) investment risk, emerging markets risk, sovereign debt risk, market risk, issuer risk, interest rate risk, call risk, credit risk, high yield risk, currency risk, liquidity risk, leveraging risk, management risk, derivatives risk and short sale risk. A complete description of these and other risks is contained in the Portfolio’s prospectus.
The Portfolio may use derivative instruments for hedging purposes or as part of an investment strategy. Use of these instruments may involve certain costs and risks such as liquidity risk, interest rate risk, market risk, credit risk, leverage risk, management risk and the risk that the Portfolio may not be able to close out a position when it would be most advantageous to do so. Certain derivative transactions may have a leveraging effect on the Portfolio. For example, a small investment in a derivative instrument may have a significant impact on the Portfolio’s exposure to interest rates, currency exchange rates or other investments. As a result, a relatively small price movement in an asset, investment or component of the index underlying a derivative instrument may cause an immediate and substantial loss or gain, which translates into heightened volatility for the Portfolio. The Portfolio may engage in such transactions regardless of whether the Portfolio owns the asset, instrument or components of the index underlying the derivative instrument. The Portfolio may invest a significant portion of its assets in these types of instruments. If it does, the Portfolio’s investment exposure could far exceed the value of its portfolio securities and its investment performance could be primarily dependent
| | | | | | | | |
| 4 | | PIMCO EQUITY SERIES VIT | | | | | | |
upon securities it does not own. The Portfolio’s investment in foreign (non-U.S.) securities may entail risk due to foreign (non-U.S.) economic and political developments; this risk may be increased when investing in emerging markets.
The value of an equity security of an issuer that has paid dividends in the past may decrease if the issuer reduces or eliminates future payments to its shareholders. If the dividends or distributions received by a Portfolio decrease, the Portfolio may have less income to distribute to the Portfolio’s shareholders. In addition, during certain market conditions, the equity securities of issuers that have paid regular dividends or distributions may not be widely available or may be highly concentrated in particular sectors of the market. A Portfolio may invest a significant portion of its assets in value stocks. Value stocks may perform differently from other types of stocks and the market as a whole. A value stock may decrease in price or may not increase in price as anticipated by PIMCO if it continues to be undervalued by the market or the factors that the portfolio manager believes will cause the stock price to increase do not occur.
High yield bonds typically have a lower credit rating than other bonds. Lower-rated bonds generally involve a greater risk to principal than higher-rated bonds. Further, markets for lower-rated bonds are typically less liquid than for higher-rated bonds, and public information is usually less abundant in markets for lower-rated bonds. Thus, high yield investments increase the chance that the Portfolio will lose money. The credit quality of a particular security or group of securities does not ensure the stability or safety of the overall portfolio. Mortgage-related
and asset-backed securities represent interests in “pools” of mortgages or other assets such as consumer loans or receivables. As a general matter, mortgage-related and asset-backed securities are subject to interest rate risk, extension risk, prepayment risk, and credit risk. These risks largely stem from the fact that returns on mortgage-related and asset-backed securities depend on the ability of the underlying assets to generate cash flow.
The geographical classification of foreign (non-U.S.) securities in this report are classified by the country of incorporation of a holding. In certain instances, a security’s country of incorporation may be different from its country of economic exposure.
On the Portfolio Summary page in this Shareholder Report, the Average Annual Total Return table and Cumulative Returns chart measure performance assuming that any dividend and capital gain distributions were reinvested. The Cumulative Returns chart reflects only Institutional Class performance. Performance for the Class M, Administrative Class and Advisor Class shares, if applicable, may be higher or lower based on each class’s expense ratios. The Portfolio’s total annual operating expense ratios on the Portfolio Summary page are as of the currently effective prospectus, as supplemented to date. The Portfolio measures its performance against a broad-based securities market index (benchmark index). The benchmark index does not take into account fees, expenses, or taxes. The Portfolio’s past performance, before and after taxes, is not necessarily an indication of how the Portfolio will perform in the future.
The following table discloses the inception dates of the Portfolio and its respective share classes along with the Portfolio’s diversification status as of period end:
| | | | | | | | | | | | | | | | | | | | | | | | | | | | |
| Portfolio Name | | | | | Portfolio Inception | | | Institutional Class | | | Class M | | | Administrative Class | | | Advisor Class | | | Diversification Status | |
PIMCO StocksPLUS® Global Portfolio | | | | | | | 04/14/10 | | | | 04/14/10 | | | | — | | | | — | | | | 04/14/10 | | | | Diversified | |
An investment in the Portfolio is not a bank deposit and is not guaranteed or insured by the Federal Deposit Insurance Corporation (“FDIC”) or any other government agency. It is possible to lose money on investments in the Portfolio.
The Trustees are responsible generally for overseeing the management of the Trust. The Trustees authorize the Trust to enter into service agreements with the Adviser, the Distributor, the Administrator and other service providers in order to provide, and in some cases authorize service providers to procure through other parties, necessary or desirable services on behalf of the Trust and the Portfolio. Shareholders are not parties to or third-party beneficiaries of such service agreements. Neither this Portfolio’s prospectus nor summary prospectus, the Trust’s Statement of Additional Information (“SAI”), any contracts filed as exhibits to the Trust’s registration statement, nor
any other communications, disclosure documents or regulatory filings (including this report) from or on behalf of the Trust or the Portfolio creates a contract between or among any shareholder of the Portfolio, on the one hand, and the Trust, the Portfolio, a service provider to the Trust or the Portfolio, and/or the Trustees or officers of the Trust, on the other hand. The Trustees (or the Trust and its officers, service providers or other delegates acting under authority of the Trustees) may amend the most recent prospectus or use a new prospectus, summary prospectus or SAI with respect to the Portfolio or the Trust, and/or amend, file and/or issue any other communications, disclosure documents or regulatory filings, and may amend or enter into any contracts to which the Trust or the Portfolio is a party, and interpret the investment objectives, policies, restrictions and contractual provisions applicable to the Portfolio, without shareholder input or approval,
| | | | | | |
| | SEMIANNUAL REPORT | | JUNE 30, 2016 | | 5 |
Important Information About the PIMCO StocksPLUS® Global Portfolio (Cont.)
except in circumstances in which shareholder approval is specifically required by law (such as changes to fundamental investment policies) or where a shareholder approval requirement is specifically disclosed in the Trust’s then-current prospectus or SAI.
PIMCO has adopted written proxy voting policies and procedures (“Proxy Policy”) as required by Rule 206(4)-6 under the Investment Advisers Act of 1940, as amended. The Proxy Policy has been adopted by the Trust as the policies and procedures that PIMCO will use when voting proxies on behalf of the Portfolio. A description of the policies and procedures that PIMCO uses to vote proxies relating to portfolio securities of the Portfolio, and information about how the Portfolio voted proxies relating to portfolio securities held during the most recent twelve-month period ended June 30, are available without charge, upon request, by calling the Trust at (888) 87-PIMCO, on the
Portfolio’s website at pvit.pimco-funds.com, and on the Securities and Exchange Commission’s (“SEC”) website at www.sec.gov.
The Portfolio files a complete schedule of the Portfolio’s holdings with the SEC for the first and third quarters of each fiscal year on Form N-Q. A copy of the Portfolio’s Form N-Q is available on the SEC’s website at www.sec.gov and may be reviewed and copied at the SEC’s Public Reference Room in Washington, D.C. The Portfolio’s Form N-Q will also be available without charge, upon request, by calling the Trust at (888) 87-PIMCO and on the Portfolio’s website at pvit.pimco-funds.com. Information on the operation of the Public Reference Room may be obtained by calling 1-800-SEC-0330.
PIMCO Equity Series VIT is distributed by PIMCO Investments LLC, 1633 Broadway, New York, New York 10019.
| | | | | | | | |
| 6 | | PIMCO EQUITY SERIES VIT | | | | | | |
(THIS PAGE INTENTIONALLY LEFT BLANK)
| | | | | | |
| | SEMIANNUAL REPORT | | JUNE 30, 2016 | | 7 |
PIMCO StocksPLUS® Global Portfolio
Cumulative Returns Through June 30, 2016
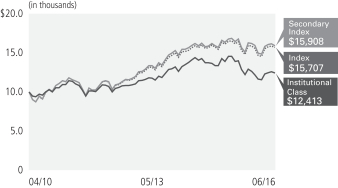
$10,000 invested at the end of the month when the Portfolio’s Institutional Class commenced operations.
Investment Objective and Strategy Overview
| | » | | PIMCO StocksPLUS® Global Portfolio (formerly, PIMCO Global Dividend Portfolio) (the “Portfolio”) seeks total return which exceeds that of its secondary benchmark consistent with prudent investment management. The Portfolio’s secondary objective is to seek to provide long-term capital appreciation. The Portfolio seeks to exceed the total return of its secondary benchmark index by investing under normal circumstances in S&P 500 Index derivatives and MSCI Europe Australasia Far East (“EAFE”) Net Dividend Index (USD Unhedged) derivatives, backed by a portfolio of Fixed Income Instruments. “Fixed Income Instruments” include bonds, debt securities and other similar instruments issued by various U.S. and non-U.S. public- or private-sector entities. The Portfolio may invest in common stocks, options, futures, options on futures and swaps. | |
| | | | | | | | | | | | | | | | | | |
| Average Annual Total Return for the period ended June 30, 2016 | |
| | | | | 6 Months* | | | 1 Year | | | 5 Year | | | Fund Inception
(04/14/2010) | |
 | | PIMCO StocksPLUS® Global Portfolio Institutional Class | | | 1.79% | | | | (10.77)% | | | | 2.37% | | | | 3.22% | |
| | PIMCO StocksPLUS® Global Portfolio Advisor Class | | | 1.56% | | | | (11.08)% | | | | 2.11% | | | | 2.96% | |
 | | MSCI World Index± | | | 0.66% | | | | (2.78)% | | | | 6.63% | | | | 6.98% | |
 | | 50% MSCI EAFE Net Dividend Index/50% S&P 500 Index±± | | | (0.33)% | | | | (3.29)% | | | | 6.85% | | | | 7.18% | |
| | | MSCI All Country World Index** | | | 1.23% | | | | (3.73)% | | | | 5.38% | | | | 6.02% | |
All Portfolio returns are net of fees and expenses.
* Cumulative return.
** Prior to June 16, 2016, the Fund’s primary benchmark was the MSCI All Country World Index.
± The MSCI World Index is a free float-adjusted market capitalization weighted index that is designed to measure the equity market performance of developed markets. The MSCI World Index consists of 23 developed market country indices.
±± The benchmark is a blend of 50% MSCI EAFE Net Dividend Index/50% S&P 500 Index. MSCI EAFE Net Dividend Index is an unmanaged index of issuers in countries of Europe, Australia, and the Far East represented in U.S. Dollars on a unhedged basis. It is not possible to invest directly in the index. S&P 500 Index is an unmanaged market index generally considered representative of the stock market as a whole. The Index focuses on the large-cap segment of the U.S. equities market.
It is not possible to invest directly in an unmanaged index.
Performance quoted represents past performance. Past performance is not a guarantee or a reliable indicator of future results. Current performance may be lower or higher than performance shown. Investment return and the principal value of an investment will fluctuate. Shares may be worth more or less than original cost when redeemed. The Portfolio’s performance does not reflect the deduction of additional charges and expenses imposed in connection with investing in Variable Contracts, which will reduce returns. For performance current to the most recent month-end, visit http://pvit.pimco-funds.com.
The Portfolio’s total annual operating expense ratio as stated in the Portfolio’s current prospectus, as supplemented to date, is 1.06% for Institutional Class shares, and 1.31% for Advisor Class shares.
| | | | | | | | |
| 8 | | PIMCO EQUITY SERIES VIT | | | | | | |
Top 10 Holdings as of 06/30/20161§
| | | | | | | | |
Realkredit Danmark A/S | | | | | | | 3.3% | |
AP Moeller — Maersk A/S | | | | | | | 0.8% | |
Societa Iniziative Autostradali e Servizi SpA | | | | | | | 0.6% | |
Imperial Tobacco Finance PLC | | | | | | | 0.5% | |
Time Warner Cable, Inc. | | | | | | | 0.5% | |
Koninklijke Philips NV | | | | | | | 0.4% | |
G8 Education Ltd. | | | | | | | 0.4% | |
Mariner CLO LLC | | | | | | | 0.4% | |
General Motors Financial Co., Inc. | | | | | | | 0.3% | |
Daimler Finance North America LLC | | | | | | | 0.3% | |
Geographic Breakdown as of 06/30/20161§
| | | | | | | | |
Denmark | | | | | | | 4.7% | |
United States | | | | | | | 2.0% | |
United Kingdom | | | | | | | 0.9% | |
Italy | | | | | | | 0.6% | |
Cayman Islands | | | | | | | 0.5% | |
Netherlands | | | | | | | 0.4% | |
Australia | | | | | | | 0.4% | |
1 % of Investments, at value.
§ Top 10 Holdings, Geographic Breakdown and % of Investments excludes securities sold short, financial derivative instruments and short-term instruments, if any.
Portfolio Insights
Following are key factors impacting the Portfolio’s performance during the reporting period:
| » | | Stock selection in the health care sector contributed to absolute returns, as the Portfolio’s holdings generally increased in price. |
| » | | Stock selection in the telecommunications sector contributed to absolute returns, as the Portfolio’s holdings generally increased in price. |
| » | | Stock selection in the energy sector contributed to absolute returns, as the Portfolio’s holdings generally increased in price. |
| » | | Stock selection in the consumer staples sector contributed to absolute returns, as the Portfolio’s holdings generally increased in price. |
| » | | Stock selection in the financials sector detracted from absolute returns, as the Portfolio’s holdings generally decreased in price. |
| | | | | | |
| | SEMIANNUAL REPORT | | JUNE 30, 2016 | | 9 |
Expense Example PIMCO StocksPLUS® Global Portfolio
Example
As a shareholder of the Portfolio, you incur two types of costs: (1) transaction costs and (2) ongoing costs, including management fees, distribution and/or service (12b-1) fees (if applicable), and other Portfolio expenses. The Example is intended to help you understand your ongoing costs (in dollars) of investing in the Portfolio and to compare these costs with the ongoing costs of investing in other mutual funds.
The Expense Example does not reflect any fees or other expenses imposed by the Variable Contracts. If it did, the expenses reflected in the Expense Example would be higher. The Example is based on an investment of $1,000 invested at the beginning of the period and held from January 1, 2016 to June 30, 2016 unless noted otherwise in the table and footnotes below.
Actual Expenses
The information in the table under the heading “Actual” provides information about actual account values and actual expenses. You may use the information in these rows, together with the amount you invested, to estimate the expenses that you paid over the period. Simply divide your account value by $1,000 (for example, an $8,600 account value divided by $1,000 = 8.60), then multiply the result by the number in the appropriate column for your share class, in the column titled “Expenses Paid During Period” to estimate the expenses you paid on your account during this period.
Hypothetical Example for Comparison Purposes
The information in the table under the heading “Hypothetical (5% return before expenses)” provides information about hypothetical account values and hypothetical expenses based on the Portfolio’s actual expense ratio and an assumed rate of return of 5% per year before expenses, which is not the Portfolio’s actual return. The hypothetical account values and expenses may not be used to estimate the actual ending account balance or expenses you paid for the period. You may use this information to compare the ongoing costs of investing in the Portfolio and other portfolios. To do so, compare this 5% hypothetical example with the 5% hypothetical examples that appear in the shareholder reports of the other portfolios.
Please note that the expenses shown in the table are meant to highlight your ongoing costs only and do not reflect any transactional costs. Therefore, the information under the heading “Hypothetical (5% return before expenses)” is useful in comparing ongoing costs only, and will not help you determine the relative total costs of owning different portfolios. In addition, if these transactional costs were included, your costs would have been higher.
Expense ratios may vary period to period because of various factors, such as an increase in expenses that are not covered by the management fees such as fees and expenses of the independent trustees and their counsel, extraordinary expenses and interest expense.
| | | | | | | | | | | | | | | | | | | | | | | | | | | | | | | | | | | | | | | | |
| | | | | | Actual | | | | | | Hypothetical (5% return before expenses) | | | | | | | |
| | | | | | Beginning
Account Value
(01/01/16) | | | Ending
Account Value
(06/30/16) | | | Expenses Paid
During Period* | | | | | | Beginning
Account Value
(01/01/16) | | | Ending
Account Value
(06/30/16) | | | Expenses
Paid During
Period* | | | | | | Net Annualized
Expense Ratio** | |
| Institutional Class | | | | | | $ | 1,000.00 | | | $ | 1,017.90 | | | $ | 4.34 | | | | | | | $ | 1,000.00 | | | $ | 1,020.15 | | | $ | 4.35 | | | | | | | | 0.88 | % |
| Advisor Class | | | | | | | 1,000.00 | | | | 1,015.60 | | | | 5.57 | | | | | | | | 1,000.00 | | | | 1,018.93 | | | | 5.58 | | | | | | | | 1.13 | |
* Expenses Paid During Period are equal to the net annualized expense ratio for the class, multiplied by the average account value over the period, multiplied by 179/366 (to reflect the one-half year period). Overall fees and expenses of investing in the Portfolio will be higher because the example does not reflect variable contract fees and expenses.
** Net Annualized Expense Ratio is reflective of any applicable contractual fee waivers and/or expense reimbursements or voluntary fee waivers. Details regarding fee waivers can be found in Note 8 in the Notes to Financial Statements.
| | | | | | | | |
| 10 | | PIMCO EQUITY SERIES VIT | | | | | | |
(THIS PAGE INTENTIONALLY LEFT BLANK)
| | | | | | |
| | SEMIANNUAL REPORT | | JUNE 30, 2016 | | 11 |
Financial Highlights PIMCO StocksPLUS® Global Portfolio
| | | | | | | | | | | | | | | | | | | | | | | | | | | | |
| Selected Per Share Data for the Year or Period Ended: | |
Net Asset Value
Beginning of
Year or
Period | | | Net Investment
Income(a) | | | Net Realized/
Unrealized
Gain (Loss) | | | Total from
Investment
Operations | | | Dividends
from Net
Investment
Income | | | Distributions
from Net
Realized
Capital Gains | | | Total
Distributions(b) | |
| Institutional Class | | | | | | | | | | | | | | | | | | | | | | | | | | | | |
01/01/2016 - 06/30/2016+ | | $ | 9.52 | | | $ | 0.19 | | | $ | (0.02 | ) | | $ | 0.17 | | | $ | (0.25 | ) | | $ | 0.00 | | | $ | (0.25 | ) |
12/31/2015(c) | | | 12.46 | | | | 0.34 | | | | (1.43 | ) | | | (1.09 | ) | | | (0.63 | ) | | | (1.22 | ) | | | (1.85 | ) |
12/31/2014(c) | | | 12.53 | | | | 0.29 | | | | (0.16 | ) | | | 0.13 | | | | 0.00 | | | | (0.20 | ) | | | (0.20 | ) |
12/31/2013(c) | | | 10.72 | | | | 0.27 | | | | 1.83 | | | | 2.10 | | | | (0.29 | ) | | | 0.00 | | | | (0.29 | ) |
12/31/2012(c) | | | 9.85 | | | | 0.21 | | | | 0.77 | | | | 0.98 | | | | (0.11 | ) | | | 0.00 | | | | (0.11 | ) |
12/31/2011(c) | | | 10.33 | | | | 0.11 | | | | (0.58 | ) | | | (0.47 | ) | | | (0.01 | ) | | | 0.00 | | | | (0.01 | ) |
| Advisor Class | | | | | | | | | | | | | | | | | | | | | | | | | | | | |
01/01/2016 - 06/30/2016+ | | | 9.44 | | | | 0.18 | | | | (0.03 | ) | | | 0.15 | | | | (0.24 | ) | | | 0.00 | | | | (0.24 | ) |
12/31/2015(c) | | | 12.39 | | | | 0.30 | | | | (1.42 | ) | | | (1.12 | ) | | | (0.61 | ) | | | (1.22 | ) | | | (1.83 | ) |
12/31/2014(c) | | | 12.48 | | | | 0.25 | | | | (0.14 | ) | | | 0.11 | | | | 0.00 | | | | (0.20 | ) | | | (0.20 | ) |
12/31/2013(c) | | | 10.69 | | | | 0.24 | | | | 1.81 | | | | 2.05 | | | | (0.26 | ) | | | 0.00 | | | | (0.26 | ) |
12/31/2012(c) | | | 9.82 | | | | 0.18 | | | | 0.78 | | | | 0.96 | | | | (0.09 | ) | | | 0.00 | | | | (0.09 | ) |
12/31/2011(c) | | | 10.31 | | | | 0.08 | | | | (0.57 | ) | | | (0.49 | ) | | | 0.00 | | | | 0.00 | | | | 0.00 | |
| (a) | Per share amounts based on average number of shares outstanding during the year or period. |
| (b) | The tax characterization of distributions is determined in accordance with federal income tax regulations. The actual tax characterization of distributions paid are determined at the end of the fiscal year. See Note 2(d) in the Notes to Financial Statements for more information. |
| (c) | Includes the consolidated accounts of the Portfolio’s subsidiary, PIMCO Cayman Commodity Portfolio III, Ltd., which was terminated on May 26, 2015. |
| (d) | Effective July 13, 2015, the Portfolio’s advisory fee was decreased by 0.06% to an annual rate of 0.69% |
| | | | | | | | |
| 12 | | PIMCO EQUITY SERIES VIT | | | | | See Accompanying Notes | |
| | | | | | | | | | | | | | | | | | | | | | | | | | | | | | | | | | |
Net Asset
Value End of
Year or
Period | | | Total Return | | | Net Assets
End of Year or
Period (000s) | | | Ratio of
Expenses to
Average
Net Assets | | | Ratio of
Expenses to
Average
Net Assets
Excluding Waivers | | | Ratio of
Expenses to
Average
Net Assets
Excluding Interest
Expense and
Dividends on
Securities
Sold Short | | | Ratio of
Expenses to
Average
Net Assets
Excluding Interest
Expense and
Dividends on
Securities
Sold Short
and Waivers | | | Ratio of Net
Investment
Income to
Average
Net Assets | | | Portfolio
Turnover
Rate | |
| | | | | | | | | | | | | | | | | | | | | | | | | | | | | | | | | | |
| $ | 9.44 | | | | 1.79 | % | | $ | 38,812 | | | | 0.88 | %* | | | 1.06 | %* | | | 0.88 | %* | | | 1.06 | %* | | | 4.15 | %* | | | 38 | % |
| | 9.52 | | | | (8.75 | ) | | | 40,582 | | | | 0.95 | (d) | | | 1.10 | (d) | | | 0.93 | (d) | | | 1.08 | (d) | | | 2.68 | | | | 152 | |
| | 12.46 | | | | 1.06 | | | | 52,234 | | | | 0.98 | | | | 1.12 | | | | 0.97 | | | | 1.11 | | | | 2.22 | | | | 31 | |
| | 12.53 | | | | 19.60 | | | | 57,768 | | | | 0.98 | | | | 1.15 | | | | 0.97 | | | | 1.14 | | | | 2.29 | | | | 29 | |
| | 10.72 | | | | 9.98 | | | | 58,740 | | | | 0.99 | | | | 1.15 | | | | 0.97 | | | | 1.13 | | | | 2.02 | | | | 26 | |
| | 9.85 | | | | (4.54 | ) | | | 66,439 | | | | 0.98 | | | | 1.18 | | | | 0.97 | | | | 1.17 | | | | 1.14 | | | | 238 | |
| | | | | | | | | | | | | | | | | | | | | | | | | | | | | | | | | | |
| | 9.35 | | | | 1.56 | | | | 265,417 | | | | 1.13 | * | | | 1.31 | * | | | 1.13 | * | | | 1.31 | * | | | 3.91 | * | | | 38 | |
| | 9.44 | | | | (8.98 | ) | | | 284,406 | | | | 1.20 | (d) | | | 1.35 | (d) | | | 1.18 | (d) | | | 1.33 | (d) | | | 2.43 | | | | 152 | |
| | 12.39 | | | | 0.90 | | | | 380,293 | | | | 1.23 | | | | 1.37 | | | | 1.22 | | | | 1.36 | | | | 1.98 | | | | 31 | |
| | 12.48 | | | | 19.19 | | | | 449,196 | | | | 1.23 | | | | 1.40 | | | | 1.22 | | | | 1.39 | | | | 2.05 | | | | 29 | |
| | 10.69 | | | | 9.77 | | | | 413,524 | | | | 1.24 | | | | 1.40 | | | | 1.22 | | | | 1.38 | | | | 1.77 | | | | 26 | |
| | 9.82 | | | | (4.72 | ) | | | 387,651 | | | | 1.23 | | | | 1.43 | | | | 1.22 | | | | 1.42 | | | | 0.83 | | | | 238 | |
| | | | | | |
| See Accompanying Notes | | SEMIANNUAL REPORT | | JUNE 30, 2016 | | 13 |
Statement of Assets and Liabilities PIMCO StocksPLUS® Global Portfolio
(Unaudited)
| | | | |
| (Amounts in thousands, except per share amounts) | | June 30, 2016 | |
| |
Assets: | | | | |
Investments, at value | | | | |
Investments in securities* | | $ | 207,854 | |
Investments in Affiliates | | | 43,575 | |
Financial Derivative Instruments | | | | |
Exchange-traded or centrally cleared | | | 3,846 | |
Over the counter | | | 1,333 | |
Deposits with counterparty | | | 15,156 | |
Foreign currency, at value | | | 372 | |
Receivable for investments sold | | | 14,690 | |
Receivable for investments in Affiliates sold | | | 45,000 | |
Receivable for Portfolio shares sold | | | 52 | |
Interest and/or dividends receivable | | | 984 | |
Dividends receivable from Affiliates | | | 17 | |
Reimbursement receivable from PIMCO | | | 101 | |
Total Assets | | | 332,980 | |
| |
Liabilities: | | | | |
Financial Derivative Instruments | | | | |
Over the counter | | $ | 1,285 | |
Payable for investments purchased | | | 26,747 | |
Payable for investments in Affiliates purchased | | | 17 | |
Deposits from counterparty | | | 330 | |
Payable for Portfolio shares redeemed | | | 3 | |
Accrued investment advisory fees | | | 133 | |
Accrued supervisory and administrative fees | | | 88 | |
Accrued distribution fees | | | 55 | |
Other liabilities | | | 93 | |
Total Liabilities | | | 28,751 | |
| |
Net Assets | | $ | 304,229 | |
| |
Net Assets Consist of: | | | | |
Paid in capital | | $ | 275,413 | |
Undistributed net investment income | | | 12,628 | |
Accumulated undistributed net realized gain | | | 19,342 | |
Net unrealized (depreciation) | | | (3,154 | ) |
| |
Net Assets | | $ | 304,229 | |
| |
Net Assets: | | | | |
Institutional Class | | $ | 38,812 | |
Advisor Class | | | 265,417 | |
| |
Shares Issued and Outstanding: | | | | |
Institutional Class | | | 4,112 | |
Advisor Class | | | 28,377 | |
| |
Net Asset Value Per Share Outstanding: | | | | |
Institutional Class | | $ | 9.44 | |
Advisor Class | | | 9.35 | |
| |
Cost of investments in securities | | $ | 208,173 | |
Cost of investments in Affiliates | | $ | 43,571 | |
Cost of foreign currency held | | $ | 371 | |
| |
* Includes repurchase agreements of: | | $ | 4,970 | |
| | | | | | | | |
| 14 | | PIMCO EQUITY SERIES VIT | | | | | See Accompanying Notes | |
Statement of Operations PIMCO StocksPLUS® Global Portfolio
| | | | |
| (Amounts in thousands) | | Six Months Ended
June 30, 2016
(Unaudited) | |
| |
Investment Income: | | | | |
Interest | | $ | 11 | |
Dividends, net of foreign taxes* | | | 7,466 | |
Dividends from Investments in Affiliates | | | 26 | |
Total Income | | | 7,503 | |
| |
Expenses: | | | | |
Investment advisory fees | | | 1,028 | |
Supervisory and administrative fees | | | 522 | |
Distribution and/or servicing fees - Advisor Class | | | 325 | |
Trustee fees | | | 12 | |
Interest expense | | | 2 | |
Miscellaneous expense | | | 8 | |
Total Expenses | | | 1,897 | |
Waiver and/or Reimbursement by PIMCO | | | (263 | ) |
Net Expenses | | | 1,634 | |
| |
Net Investment Income | | | 5,869 | |
| |
Net Realized Gain (Loss): | | | | |
Investments in securities | | | (32,394 | ) |
Investments in Affiliates | | | 7 | |
Over the counter financial derivative instruments | | | (587 | ) |
Foreign currency | | | (27 | ) |
| |
Net Realized (Loss) | | | (33,001 | ) |
| |
Net Change in Unrealized Appreciation (Depreciation): | | | | |
Investments in securities | | | 33,903 | |
Investments in Affiliates | | | 4 | |
Exchange-traded or centrally cleared financial derivative instruments | | | (2,884 | ) |
Over the counter financial derivative instruments | | | 360 | |
Foreign currency assets and liabilities | | | 12 | |
| |
Net Change in Unrealized Appreciation | | | 31,395 | |
| |
Net Increase in Net Assets Resulting from Operations | | $ | 4,263 | |
| |
* Foreign tax withholdings - Dividends | | $ | 314 | |
| | | | | | |
| See Accompanying Notes | | SEMIANNUAL REPORT | | JUNE 30, 2016 | | 15 |
Statements of Changes in Net Assets PIMCO StocksPLUS® Global Portfolio
| | | | | | | | |
| (Amounts in thousands†) | | Six Months Ended
June 30, 2016
(Unaudited) | | | Year Ended
December 31, 2015(a) | |
| | |
(Decrease) in Net Assets from: | | | | | | | | |
| | |
Operations: | | | | | | | | |
Net investment income | | $ | 5,869 | | | $ | 9,821 | |
Net realized gain (loss) | | | (33,001 | ) | | | 60,896 | |
Net change in unrealized appreciation (depreciation) | | | 31,395 | | | | (101,703 | ) |
| | |
Net Increase (Decrease) in Net Assets Resulting from Operations | | | 4,263 | | | | (30,986 | ) |
| | |
Distributions to Shareholders: | | | | | | | | |
From net investment income | | | | | | | | |
Institutional Class | | | (1,040 | ) | | | (2,489 | ) |
Advisor Class | | | (6,874 | ) | | | (17,274 | ) |
From net realized capital gains | | | | | | | | |
Institutional Class | | | 0 | | | | (4,384 | ) |
Advisor Class | | | 0 | | | | (30,972 | ) |
| | |
Total Distributions(b) | | | (7,914 | ) | | | (55,119 | ) |
| | |
Portfolio Share Transactions: | | | | | | | | |
Net (decrease) resulting from Portfolio share transactions** | | | (17,108 | ) | | | (21,434 | ) |
| | |
Total (Decrease) in Net Assets | | | (20,759 | ) | | | (107,539 | ) |
| | |
Net Assets: | | | | | | | | |
Beginning of period | | | 324,988 | | | | 432,527 | |
End of period* | | $ | 304,229 | | | $ | 324,988 | |
| | |
* Including undistributed net investment income of: | | $ | 12,628 | | | $ | 14,673 | |
| † | A zero balance may reflect actual amounts rounding to less than one thousand. |
| ** | See Note 12 in the Notes to Financial Statements. |
| (a) | Includes the consolidated accounts of the Portfolio’s subsidiary, PIMCO Cayman Commodity Portfolio III, Ltd., which was terminated on May 26, 2015. |
| (b) | The tax characterization of distributions is determined in accordance with federal income tax regulations. The actual tax characterization of distributions paid are determined at the end of the fiscal year. See Note 2(d) in the Notes to Financial Statements for more information. |
| | | | | | | | |
| 16 | | PIMCO EQUITY SERIES VIT | | | | | See Accompanying Notes | |
Schedule of Investments PIMCO StocksPLUS® Global Portfolio
June 30, 2016 (Unaudited)
| | | | | | | | | | | | |
| | | | | PRINCIPAL
AMOUNT
(000S) | | | | | MARKET
VALUE
(000S) | |
| INVESTMENTS IN SECURITIES 68.3% | |
| |
| ASSET-BACKED SECURITIES 0.4% | |
| |
| CAYMAN ISLANDS 0.4% | |
Mariner CLO LLC | |
2.221% due 07/23/2026 (a) | | $ | | | 900 | | | $ | | | 900 | |
Neuberger Berman CLO Ltd. | |
1.931% due 07/25/2023 (a) | | | | | 300 | | | | | | 300 | |
| | | | | | | | | | | | |
Total Asset-Backed Securities (Cost $1,200) | | | | | | 1,200 | |
| | | | | | | | | | | | |
| |
| | | | | SHARES | | | | | | |
| COMMON STOCKS 1.0% | |
| |
| AUSTRALIA 0.3% | |
| |
| CONSUMER DISCRETIONARY 0.3% | |
G8 Education Ltd. | | | | | 363,190 | | | | | | 1,035 | |
| | | | | | | | | | | | |
Total Australia | | | | | | | | | | | 1,035 | |
| | | | | | | | | | | | |
| |
| DENMARK 0.2% | |
| |
| CONSUMER STAPLES 0.2% | |
Scandinavian Tobacco Group A/S | | | 39,255 | | | | | | 641 | |
| | | | | | | | | | | | |
Total Denmark | | | | | | | | | | | 641 | |
| | | | | | | | | | | | |
| |
| ITALY 0.5% | |
| |
| INDUSTRIALS 0.5% | |
Societa Iniziative Autostradali e Servizi SpA | | | | | 168,677 | | | | | | 1,456 | |
| | | | | | | | | | | | |
Total Italy | | | | | | | | | | | 1,456 | |
| | | | | | | | | | | | |
| |
| KENYA 0.0% | |
| |
| TELECOMMUNICATION SERVICES 0.0% | |
Safaricom Ltd. | | | | | 284,900 | | | | | | 50 | |
| | | | | | | | | | | | |
Total Kenya | | | | | | | | | | | 50 | |
| | | | | | | | | | | | |
Total Common Stocks (Cost $3,439) | | | | | | | | | 3,182 | |
| | | | | | | | | | | | |
| |
| | | | | PRINCIPAL
AMOUNT
(000S) | | | | | | |
| CORPORATE BONDS & NOTES 6.0% | |
| |
| DENMARK 3.7% | |
| |
| BANKING & FINANCE 3.0% | |
Realkredit Danmark A/S | | | | | | | | | | | | |
2.000% due 04/01/2017 | | DKK | | | 55,100 | | | | | | 8,366 | |
1.000% due 04/01/2017 | | $ | | | 4,900 | | | | | | 738 | |
| | | | | | | | | | | | |
| | | | | | | | | | | 9,104 | |
| | | | | | | | | | | | |
| |
| | | | | | | | | | | | |
| | | | | PRINCIPAL
AMOUNT
(000S) | | | | | MARKET
VALUE
(000S) | |
| INDUSTRIALS 0.7% | |
AP Moeller - Maersk A/S | |
2.550% due 09/22/2019 | | $ | | | 2,000 | | | $ | | | 2,040 | |
| | | | | | | | | | | | |
Total Denmark | | | | | | | | | | | 11,144 | |
| | | | | | | | | | | | |
| |
| NETHERLANDS 0.4% | |
| |
| INDUSTRIALS 0.4% | |
Koninklijke Philips NV | |
5.750% due 03/11/2018 | | | | | 1,000 | | | | | | 1,070 | |
| | | | | | | | | | | | |
Total Netherlands | | | 1,070 | |
| | | | | | | | | | | | |
| |
| UNITED KINGDOM 0.5% | |
| |
| INDUSTRIALS 0.5% | |
BAT International Finance PLC | |
9.500% due 11/15/2018 | | | | | 200 | | | | | | 237 | |
Imperial Tobacco Finance PLC | |
2.950% due 07/21/2020 | | | | | 1,300 | | | | | | 1,340 | |
| | | | | | | | | | | | |
| | | | | | | | | | | 1,577 | |
| | | | | | | | | | | | |
Total United Kingdom | | | 1,577 | |
| | | | | | | | | | | | |
| |
| UNITED STATES 1.4% | |
| |
| BANKING & FINANCE 0.2% | |
General Motors Financial Co., Inc. | |
3.200% due 07/06/2021 (a) | | | | | 800 | | | | | | 803 | |
| | | | | | | | | | | | |
| |
| INDUSTRIALS 1.2% | |
Continental Airlines Pass-Through Trust | |
7.250% due 05/10/2021 | | | | | 692 | | | | | | 792 | |
Daimler Finance North America LLC | |
1.500% due 07/05/2019 (a) | | | | | 800 | | | | | | 799 | |
Harris Corp. | |
4.400% due 12/15/2020 | | | | | 500 | | | | | | 541 | |
Textron, Inc. | |
3.650% due 03/01/2021 | | | | | 100 | | | | | | 105 | |
Time Warner Cable, Inc. | |
8.250% due 04/01/2019 | | | | | 1,000 | | | | | | 1,162 | |
Viacom, Inc. | |
2.750% due 12/15/2019 | | | | | 200 | | | | | | 203 | |
| | | | | | | | | | | | |
| | | | | | | | | | | 3,602 | |
| | | | | | | | | | | | |
Total United States | | | 4,405 | |
| | | | | | | | | | | | |
Total Corporate Bonds & Notes (Cost $18,182) | | | 18,196 | |
| | | | | | | | | | | | |
| |
| NON-AGENCY MORTGAGE-BACKED SECURITIES 0.2% | |
| |
| UNITED KINGDOM 0.2% | |
Eurosail PLC | |
0.874% due 06/13/2045 | | GBP | | | 546 | | | | | | 722 | |
| | | | | | | | | | | | |
Total Non-Agency Mortgage-Backed Securities
(Cost $722) | | | 722 | |
| | | | | | | | | | | | |
| | | | | | | | | | | | |
| | | | | PRINCIPAL
AMOUNT
(000S) | | | | | MARKET
VALUE
(000S) | |
| U.S. GOVERNMENT AGENCIES 0.2% | |
| |
| UNITED STATES 0.2% | |
Fannie Mae | |
1.003% due 09/25/2041 | | $ | | | 516 | | | $ | | | 515 | |
| | | | | | | | | | | | |
Total U.S. Government Agencies (Cost $515) | | | 515 | |
| | | | | | | | | | | | |
| |
| SHORT-TERM INSTRUMENTS 60.5% | |
| |
| REPURCHASE AGREEMENTS (e) 1.6% | |
| | | | | | | | | | | 4,970 | |
| | | | | | | | | | | | |
| |
| SHORT-TERM NOTES 53.7% | |
Federal Home Loan Bank | |
0.304% due 08/15/2016 - 08/29/2016 (c)(d) | | | | | 107,700 | | | | | | 107,667 | |
0.325% due 09/01/2016 (c)(d) | | | | | 2,300 | | | | | | 2,299 | |
0.335% due 08/30/2016 (c)(d) | | | | | 53,500 | | | | | | 53,479 | |
| | | | | | | | | | | | |
| | | | | | | | | | | 163,445 | |
| | | | | | | | | | | | |
| |
| JAPAN TREASURY BILLS 4.7% | |
0.299% due 10/03/2016 (c)(d) | | JPY | | | 1,470,000 | | | | | | 14,246 | |
| | | | | | | | | | | | |
| |
| U.S. TREASURY BILLS 0.5% | |
0.274% due 07/21/2016 - 12/08/2016
(b)(c)(g)(i) | | $ | | | 1,379 | | | | | | 1,378 | |
| | | | | | | | | | | | |
Total Short-Term Instruments
(Cost $184,115) | | | | | | 184,039 | |
| | | | | | | | | | | | |
| | | | | | | | | | | | |
Total Investments in Securities
(Cost $208,173) | | | | | | 207,854 | |
| | | | | | | | | | | | |
| |
| | | | | SHARES | | | | | | |
| INVESTMENTS IN AFFILIATES 14.3% | |
| |
| SHORT-TERM INSTRUMENTS 14.3% | |
| |
| CENTRAL FUNDS USED FOR CASH MANAGEMENT PURPOSES 14.3% | |
PIMCO Short-Term Floating NAV Portfolio III | | | 4,408,648 | | | | | | 43,575 | |
| | | | | | | | | | | | |
Total Short-Term Instruments
(Cost $43,571) | | | | | | 43,575 | |
| | | | | | | | | | | | |
| |
Total Investments in Affiliates
(Cost $43,571) | | | | | | 43,575 | |
| | | | | | | | | | | | |
Total Investments 82.6%
(Cost $251,744) | | | $ | | | 251,429 | |
| |
Financial Derivative
Instruments (f)(h) 1.3% (Cost or Premiums, net $0) | | | 3,894 | |
| |
| Other Assets and Liabilities, net 16.1% | | | 48,906 | |
| | | | | | | | | | | | |
| Net Assets 100.0% | | | $ | | | 304,229 | |
| | | | | | | | | | | | |
NOTES TO SCHEDULE OF INVESTMENTS (AMOUNTS IN THOUSANDS*, EXCEPT NUMBER OF CONTRACTS):
| * | A zero balance may reflect actual amounts rounding to less than one thousand. |
| (b) | Coupon represents a weighted average yield to maturity. |
| (d) | Coupon represents a yield to maturity. |
| | | | | | |
| See Accompanying Notes | | SEMIANNUAL REPORT | | JUNE 30, 2016 | | 17 |
Schedule of Investments PIMCO StocksPLUS® Global Portfolio (Cont.)
BORROWINGS AND OTHER FINANCING TRANSACTIONS
(e) REPURCHASE AGREEMENTS:
| | | | | | | | | | | | | | | | | | | | | | | | | | | | | | |
| Counterparty | | Lending
Rate | | | Settlement
Date | | | Maturity
Date | | | Principal
Amount | | | Collateralized By | | Collateral
(Received) | | | Repurchase
Agreements,
at Value | | | Repurchase
Agreement
Proceeds
to be
Received (1) | |
| SSB | | | 0.010 | % | | | 06/30/2016 | | | | 07/01/2016 | | | $ | 4,970 | | | U.S. Treasury Notes 1.000% due 05/15/2018 | | $ | (5,072 | ) | | $ | 4,970 | | | $ | 4,970 | |
| | | | | | | | | | | | | | | | | | | | | | | | | | | | | | |
Total Repurchase Agreements | | | | | | | | | | | | | $ | (5,072 | ) | | $ | 4,970 | | | $ | 4,970 | |
| | | | | | | | | | | | | | | | | | | | | | | | | | | | | | |
| (1) | Includes accrued interest. |
BORROWINGS AND OTHER FINANCING TRANSACTIONS SUMMARY
The following is a summary by counterparty of the market value of Borrowings and Other Financing Transactions and collateral (received) as of June 30, 2016:
| | | | | | | | | | | | | | | | | | | | | | | | |
| Counterparty | | Repurchase
Agreement
Proceeds
to be
Received | | | Payable for
Reverse
Repurchase
Agreements | | | Payable for
Sale-Buyback
Transactions | | | Total
Borrowings and
Other Financing
Transactions | | | Collateral
(Received) | | | Net Exposure (2) | |
Global/Master Repurchase Agreement | | | | | | | | | | | | | | | | | | | | | | | | |
SSB | | $ | 4,970 | | | $ | 0 | | | $ | 0 | | | $ | 4,970 | | | $ | (5,072 | ) | | $ | (102 | ) |
| | | | | | |
Prime Brokerage Agreement | | | | | | | | | | | | | | | | | | | | | | | | |
MSC | | | 0 | | | | 0 | | | | 0 | | | | 0 | | | | 1,066 | | | | 1,066 | |
| | | | | | | | | | | | | | | | | | | | | | | | |
Total Borrowings and Other Financing Transactions | | $ | 4,970 | | | $ | 0 | | | $ | 0 | | | | | | | | | | | | | |
| | | | | | | | | | | | | | | | | | | | | | | | |
| (2) | Net Exposure represents the net receivable/(payable) that would be due from/to the counterparty in the event of default. Exposure from borrowings and other financing transactions can only be netted across transactions governed under the same master agreement with the same legal entity. See Note 7, Principal Risks, in the Notes to Financial Statements for more information regarding master netting arrangements. |
(f) FINANCIAL DERIVATIVE INSTRUMENTS: EXCHANGE-TRADED OR CENTRALLY CLEARED
FUTURES CONTRACTS:
| | | | | | | | | | | | | | | | | | | | | | | | |
| Description | | Type | | | Expiration
Month | | | # of
Contracts | | | Unrealized
Appreciation/
(Depreciation) | | | Variation Margin | |
| | | | | | Asset | | | Liability | |
E-mini S&P 500 Index September Futures | | | Long | | | | 09/2016 | | | | 1,437 | | | $ | 705 | | | $ | 1,681 | | | $ | 0 | |
Mini MSCI EAFE Index September Futures | | | Long | | | | 09/2016 | | | | 1,844 | | | | (3,589 | ) | | | 2,165 | | | | 0 | |
| | | | | | | | | | | | | | | | | | | | | | | | |
Total Futures Contracts | | | | | | | | | | | | | | $ | (2,884 | ) | | $ | 3,846 | | | $ | 0 | |
| | | | | | | | | | | | | | | | | | | | | | | | |
FINANCIAL DERIVATIVE INSTRUMENTS: EXCHANGE-TRADED OR CENTRALLY CLEARED SUMMARY
The following is a summary of the market value and variation margin of Exchange-Traded or Centrally Cleared Financial Derivative Instruments as of June 30, 2016:
| (g) | Securities with an aggregate market value of $1,066 have been pledged as collateral as of June 30, 2016 for equity short sales and equity options as governed by prime brokerage agreements and agreements governing listed equity option transactions. |
Cash of $15,156 has been pledged as collateral for exchange-traded and centrally cleared financial derivative instruments as of June 30, 2016. See Note 7, Principal Risks, in the Notes to Financial Statements for more information regarding master netting arrangements.
| | | | | | | | | | | | | | | | | | | | | | | | | | | | | | | | | | | | |
| | | Financial Derivative Assets | | | | | | Financial Derivative Liabilities | |
| | | Market Value | | | Variation Margin
Asset | | | Total | | | | | | Market Value | | | Variation Margin
Liability | | | Total | |
| | | Purchased
Options | | | Futures | | | Swap
Agreements | | | | | | | Written
Options | | | Futures | | | Swap
Agreements | | |
Total Exchange-Traded or Centrally Cleared | | $ | 0 | | | $ | 3,846 | | | $ | 0 | | | $ | 3,846 | | | | | | | $ | 0 | | | $ | 0 | | | $ | 0 | | | $ | 0 | |
| | | | | | | | | | | | | | | | | | | | | | | | | | | | | | | | | | | | |
| | | | | | | | |
| 18 | | PIMCO EQUITY SERIES VIT | | | | | See Accompanying Notes | |
June 30, 2016 (Unaudited)
(h) FINANCIAL DERIVATIVE INSTRUMENTS: OVER THE COUNTER
FORWARD FOREIGN CURRENCY CONTRACTS:
| | | | | | | | | | | | | | | | | | | | | | | | |
Counterparty | | Settlement
Month | | | Currency to
be Delivered | | | Currency to
be Received | | | Unrealized Appreciation/
(Depreciation) | |
| | | | | Asset | | | Liability | |
BOA | | | 07/2016 | | | GBP | | | 4,869 | | | $ | | | 7,139 | | | $ | 658 | | | $ | 0 | |
| | | 07/2016 | | | $ | | | 2,669 | | | GBP | | | 1,834 | | | | 0 | | | | (228 | ) |
| | | 08/2016 | | | CAD | | | 600 | | | $ | | | 464 | | | | 0 | | | | (1 | ) |
| | | 10/2016 | | | DKK | | | 2,890 | | | | | | 435 | | | | 2 | | | | 0 | |
BPS | | | 07/2016 | | | $ | | | 1,243 | | | CAD | | | 1,617 | | | | 8 | | | | 0 | |
| | | 07/2016 | | | | | | 4,429 | | | GBP | | | 3,021 | | | | 0 | | | | (407 | ) |
| | | 07/2016 | | | | | | 10,774 | | | JPY | | | 1,138,300 | | | | 249 | | | | 0 | |
CBK | | | 07/2016 | | | | | | 7,365 | | | CAD | | | 9,356 | | | | 0 | | | | (123 | ) |
| | | 08/2016 | | | | | | 616 | | | EUR | | | 552 | | | | 0 | | | | (3 | ) |
| | | 10/2016 | | | JPY | | | 1,470,000 | | | $ | | | 14,353 | | | | 72 | | | | 0 | |
GLM | | | 07/2016 | | | EUR | | | 16,257 | | | | | | 18,136 | | | | 95 | | | | 0 | |
| | | 07/2016 | | | JPY | | | 1,139,800 | | | | | | 10,927 | | | | 0 | | | | (111 | ) |
| | | 07/2016 | | | $ | | | 749 | | | CAD | | | 972 | | | | 3 | | | | 0 | |
| | | 08/2016 | | | HKD | | | 59,091 | | | $ | | | 7,621 | | | | 0 | | | | 0 | |
| | | 10/2016 | | | DKK | | | 54,725 | | | | | | 8,197 | | | | 4 | | | | 0 | |
HUS | | | 08/2016 | | | | | | 990 | | | | | | 148 | | | | 0 | | | | 0 | |
| | | 08/2016 | | | $ | | | 7,628 | | | HKD | | | 59,133 | | | | 0 | | | | (1 | ) |
JPM | | | 07/2016 | | | | | | 6,507 | | | EUR | | | 5,770 | | | | 0 | | | | (104 | ) |
| | | 08/2016 | | | AUD | | | 564 | | | $ | | | 420 | | | | 0 | | | | 0 | |
| | | 08/2016 | | | EUR | | | 271 | | | | | | 301 | | | | 0 | | | | 0 | |
| | | 08/2016 | | | $ | | | 1,085 | | | AUD | | | 1,457 | | | | 1 | | | | 0 | |
| | | 08/2016 | | | | | | 4,568 | | | ZAR | | | 70,100 | | | | 158 | | | | 0 | |
| | | 08/2016 | | | ZAR | | | 70,651 | | | $ | | | 4,750 | | | | 0 | | | | (12 | ) |
MSB | | | 07/2016 | | | CAD | | | 10,888 | | | | | | 8,493 | | | | 75 | | | | (9 | ) |
| | | 07/2016 | | | $ | | | 12,056 | | | EUR | | | 10,609 | | | | 0 | | | | (282 | ) |
| | | 08/2016 | | | DKK | | | 4,216 | | | $ | | | 630 | | | | 0 | | | | 0 | |
RBC | | | 07/2016 | | | CAD | | | 970 | | | | | | 758 | | | | 7 | | | | 0 | |
SOG | | | 08/2016 | | | AUD | | | 1,398 | | | | | | 1,038 | | | | 0 | | | | (4 | ) |
| | | 08/2016 | | | EUR | | | 562 | | | | | | 625 | | | | 0 | | | | 0 | |
UAG | | | 07/2016 | | | $ | | | 181 | | | EUR | | | 164 | | | | 1 | | | | 0 | |
| | | | | | | | | | | | | | | | | | | | | | | | |
Total Forward Foreign Currency Contracts | | | | | | | | | | | | $ | 1,333 | | | $ | (1,285 | ) |
| | | | | | | | | | | | | | | | | | | | | | | | |
FINANCIAL DERIVATIVE INSTRUMENTS: OVER THE COUNTER SUMMARY
The following is a summary by counterparty of the market value of OTC financial derivative instruments and collateral (received)/pledged as of June 30, 2016:
| (i) | Securities with an aggregate market value of $22 have been pledged as collateral for financial derivative instruments as governed by International Swaps and Derivatives Association, Inc. master agreements as of June 30, 2016. |
| | | | | | | | | | | | | | | | | | | | | | | | | | | | | | | | | | | | | | | | | | | | | | | | |
| | | Financial Derivative Assets | | | | | | Financial Derivative Liabilities | | | | | | | | | | |
| Counterparty | | Forward
Foreign
Currency
Contracts | | | Purchased
Options | | | Swap
Agreements | | | Total
Over the
Counter | | | | | | Forward
Foreign
Currency
Contracts | | | Written
Options | | | Swap
Agreements | | | Total
Over the
Counter | | | Net Market
Value of OTC
Derivatives | | | Collateral
(Received)/
Pledged | | | Net
Exposure (1) | |
BOA | | $ | 660 | | | $ | 0 | | | $ | 0 | | | $ | 660 | | | | | | | $ | (229 | ) | | $ | 0 | | | $ | 0 | | | $ | (229 | ) | | $ | 431 | | | $ | (330 | ) | | $ | 101 | |
BPS | | | 257 | | | | 0 | | | | 0 | | | | 257 | | | | | | | | (407 | ) | | | 0 | | | | 0 | | | | (407 | ) | | | (150 | ) | | | 0 | | | | (150 | ) |
CBK | | | 72 | | | | 0 | | | | 0 | | | | 72 | | | | | | | | (126 | ) | | | 0 | | | | 0 | | | | (126 | ) | | | (54 | ) | | | 0 | | | | (54 | ) |
GLM | | | 102 | | | | 0 | | | | 0 | | | | 102 | | | | | | | | (111 | ) | | | 0 | | | | 0 | | | | (111 | ) | | | (9 | ) | | | 22 | | | | 13 | |
HUS | | | 0 | | | | 0 | | | | 0 | | | | 0 | | | | | | | | (1 | ) | | | 0 | | | | 0 | | | | (1 | ) | | | (1 | ) | | | 0 | | | | (1 | ) |
JPM | | | 159 | | | | 0 | | | | 0 | | | | 159 | | | | | | | | (116 | ) | | | 0 | | | | 0 | | | | (116 | ) | | | 43 | | | | 0 | | | | 43 | |
MSB | | | 75 | | | | 0 | | | | 0 | | | | 75 | | | | | | | | (291 | ) | | | 0 | | | | 0 | | | | (291 | ) | | | (216 | ) | | | 0 | | | | (216 | ) |
RBC | | | 7 | | | | 0 | | | | 0 | | | | 7 | | | | | | | | 0 | | | | 0 | | | | 0 | | | | 0 | | | | 7 | | | | 0 | | | | 7 | |
SOG | | | 0 | | | | 0 | | | | 0 | | | | 0 | | | | | | | | (4 | ) | | | 0 | | | | 0 | | | | (4 | ) | | | (4 | ) | | | 0 | | | | (4 | ) |
UAG | | | 1 | | | | 0 | | | | 0 | | | | 1 | | | | | | | | 0 | | | | 0 | | | | 0 | | | | 0 | | | | 1 | | | | 0 | | | | 1 | |
| | | | | | | | | | | | | | | | | | | | | | | | | | | | | | | | | | | | | | | | | | | | | | | | |
Total Over the Counter | | $ | 1,333 | | | $ | 0 | | | $ | 0 | | | $ | 1,333 | | | | | | | $ | (1,285 | ) | | $ | 0 | | | $ | 0 | | | $ | (1,285 | ) | | | | | | | | | | | | |
| | | | | | | | | | | | | | | | | | | | | | | | | | | | | | | | | | | | | | | | | | | | | | | | |
| (1) | Net Exposure represents the net receivable/(payable) that would be due from/to the counterparty in the event of default. Exposure from OTC financial derivative instruments can only be netted across transactions governed under the same master agreement with the same legal entity. See Note 7, Principal Risks, in the Notes to Financial Statements for more information regarding master netting arrangements. |
| | | | | | |
| See Accompanying Notes | | SEMIANNUAL REPORT | | JUNE 30, 2016 | | 19 |
Schedule of Investments PIMCO StocksPLUS® Global Portfolio (Cont.)
FAIR VALUE OF FINANCIAL DERIVATIVE INSTRUMENTS
The following is a summary of the fair valuation of the Portfolio’s derivative instruments categorized by risk exposure. See Note 7, Principal Risks, in the Notes to Financial Statements on risks of the Portfolio.
Fair Values of Financial Derivative Instruments on the Statement of Assets and Liabilities as of June 30, 2016:
| | | | | | | | | | | | | | | | | | | | | | | | |
| | | Derivatives not accounted for as hedging instruments | |
| | | Commodity
Contracts | | | Credit
Contracts | | | Equity
Contracts | | | Foreign
Exchange
Contracts | | | Interest
Rate Contracts | | | Total | |
Financial Derivative Instruments - Assets | | | | | | | | | | | | | | | | | | | | | | | | |
Exchange-traded or centrally cleared | | | | | | | | | | | | | | | | | | | | | | | | |
Futures | | $ | 0 | | | $ | 0 | | | $ | 3,846 | | | $ | 0 | | | $ | 0 | | | $ | 3,846 | |
| | | | | | | | | | | | | | | | | | | | | | | | |
Over the counter | | | | | | | | | | | | | | | | | | | | | | | | |
Forward Foreign Currency Contracts | | $ | 0 | | | $ | 0 | | | $ | 0 | | | $ | 1,333 | | | $ | 0 | | | $ | 1,333 | |
| | | | | | | | | | | | | | | | | | | | | | | | |
| | $ | 0 | | | $ | 0 | | | $ | 3,846 | | | $ | 1,333 | | | $ | 0 | | | $ | 5,179 | |
| | | | | | | | | | | | | | | | | | | | | | | | |
Financial Derivative Instruments - Liabilities | | | | | | | | | | | | | | | | | | | | | | | | |
Over the counter | | | | | | | | | | | | | | | | | | | | | | | | |
Forward Foreign Currency Contracts | | $ | 0 | | | $ | 0 | | | $ | 0 | | | $ | 1,285 | | | $ | 0 | | | $ | 1,285 | |
| | | | | | | | | | | | | | | | | | | | | | | | |
The effect of Financial Derivative Instruments on the Statement of Operations for the period ended June 30, 2016:
| | | | | | | | | | | | | | | | | | | | | | | | |
| | | Derivatives not accounted for as hedging instruments | |
| | | Commodity
Contracts | | | Credit
Contracts | | | Equity
Contracts | | | Foreign
Exchange
Contracts | | | Interest
Rate Contracts | | | Total | |
Net Realized (Loss) on Financial Derivative Instruments | | | | | | | | | | | | | | | | | | | | | | | | |
Over the counter | | | | | | | | | | | | | | | | | | | | | | | | |
Forward Foreign Currency Contracts | | $ | 0 | | | $ | 0 | | | $ | 0 | | | $ | (587 | ) | | $ | 0 | | | $ | (587 | ) |
| | | | | | | | | | | | | | | | | | | | | | | | |
| | $ | 0 | | | $ | 0 | | | $ | 0 | | | $ | (587 | ) | | $ | 0 | | | $ | (587 | ) |
| | | | | | | | | | | | | | | | | | | | | | | | |
| | | |
Net Change in Unrealized Appreciation (Depreciation) on Financial Derivative Instruments | | | | | | | | | | | | | |
Exchange-traded or centrally cleared | | | | | | | | | | | | | | | | | | | | | | | | |
Futures | | $ | 0 | | | $ | 0 | | | $ | (2,884 | ) | | $ | 0 | | | $ | 0 | | | $ | (2,884 | ) |
| | | | | | | | | | | | | | | | | | | | | | | | |
Over the counter | | | | | | | | | | | | | | | | | | | | | | | | |
Forward Foreign Currency Contracts | | $ | 0 | | | $ | 0 | | | $ | 0 | | | $ | 360 | | | $ | 0 | | | $ | 360 | |
| | | | | | | | | | | | | | | | | | | | | | | | |
| | $ | 0 | | | $ | 0 | | | $ | (2,884 | ) | | $ | 360 | | | $ | 0 | | | $ | (2,524 | ) |
| | | | | | | | | | | | | | | | | | | | | | | | |
FAIR VALUE MEASUREMENTS
The following is a summary of the fair valuations according to the inputs used as of June 30, 2016 in valuing the Portfolio’s assets and liabilities:
| | | | | | | | | | | | | | | | |
| Category and Subcategory | | Level 1 | | | Level 2 | | | Level 3 | | | Fair
Value at
06/30/2016 | |
Investments in Securities, at Value | | | | | | | | | |
Asset-Backed Securities | | | | | | | | | | | | | | | | |
Cayman Islands | | $ | 1,200 | | | $ | 0 | | | $ | 0 | | | $ | 1,200 | |
Common Stocks | | | | | | | | | | | | | | | | |
Australia | | | | | | | | | | | | | | | | |
Consumer Discretionary | | | 0 | | | | 1,035 | | | | 0 | | | | 1,035 | |
Denmark | | | | | | | | | | | | | | | | |
Consumer Staples | | | 641 | | | | 0 | | | | 0 | | | | 641 | |
Italy | | | | | | | | | | | | | | | | |
Industrials | | | 0 | | | | 1,456 | | | | 0 | | | | 1,456 | |
Kenya | | | | | | | | | | | | | | | | |
Telecommunication Services | | | 0 | | | | 50 | | | | 0 | | | | 50 | |
Corporate Bonds & Notes | | | | | | | | | | | | | | | | |
Denmark | | | | | | | | | | | | | | | | |
Banking & Finance | | | 0 | | | | 9,104 | | | | 0 | | | | 9,104 | |
Industrials | | | 0 | | | | 2,040 | | | | 0 | | | | 2,040 | |
Netherlands | | | | | | | | | | | | | | | | |
Industrials | | | 0 | | | | 1,070 | | | | 0 | | | | 1,070 | |
United Kingdom | | | | | | | | | | | | | | | | |
Industrials | | | 0 | | | | 1,577 | | | | 0 | | | | 1,577 | |
| | | | | | | | | | | | | | | | |
| Category and Subcategory | | Level 1 | | | Level 2 | | | Level 3 | | | Fair
Value at
06/30/2016 | |
United States | | | | | | | | | | | | | | | | |
Banking & Finance | | $ | 0 | | | $ | 803 | | | $ | 0 | | | $ | 803 | |
Industrials | | | 1,543 | | | | 2,059 | | | | 0 | | | | 3,602 | |
Non-Agency Mortgage-Backed Securities | | | | | | | | | | | | | | | | |
United Kingdom | | | 0 | | | | 722 | | | | 0 | | | | 722 | |
U.S. Government Agencies | | | | | | | | | | | | | | | | |
United States | | | 0 | | | | 515 | | | | 0 | | | | 515 | |
Short-Term Instruments | | | | | | | | | | | | | | | | |
Repurchase Agreements | | | 0 | | | | 4,970 | | | | 0 | | | | 4,970 | |
Short-Term Notes | | | 0 | | | | 163,445 | | | | 0 | | | | 163,445 | |
Japan Treasury Bills | | | 0 | | | | 14,246 | | | | 0 | | | | 14,246 | |
U.S. Treasury Bills | | | 0 | | | | 1,378 | | | | 0 | | | | 1,378 | |
| | | | | | | | | | | | | | | | |
| | $ | 3,384 | | | $ | 204,470 | | | $ | 0 | | | $ | 207,854 | |
| | | | | | | | | | | | | | | | |
| | | |
Investments in Affiliates, at Value | | | | | | | | | | | | | |
Short-Term Instruments | | | | | | | | | | | | | | | | |
Central Funds Used for Cash Management Purposes | | $ | 43,575 | | | $ | 0 | | | $ | 0 | | | $ | 43,575 | |
| | | | | | | | | | | | | | | | |
| | | | |
Total Investments | | $ | 46,959 | | | $ | 204,470 | | | $ | 0 | | | $ | 251,429 | |
| | | | | | | | | | | | | | | | |
| | | | | | | | |
| 20 | | PIMCO EQUITY SERIES VIT | | | | | See Accompanying Notes | |
June 30, 2016 (Unaudited)
| | | | | | | | | | | | | | | | |
| Category and Subcategory | | Level 1 | | | Level 2 | | | Level 3 | | | Fair
Value at
06/30/2016 | |
Financial Derivative Instruments - Assets | | | | | |
Exchange-traded or centrally cleared | | $ | 3,846 | | | $ | 0 | | | $ | 0 | | | $ | 3,846 | |
Over the counter | | | 0 | | | | 1,333 | | | | 0 | | | | 1,333 | |
| | | | | | | | | | | | | | | | |
| | $ | 3,846 | | | $ | 1,333 | | | $ | 0 | | | $ | 5,179 | |
| | | | | | | | | | | | | | | | |
| | | | | | | | | | | | | | | | |
| Category and Subcategory | | Level 1 | | | Level 2 | | | Level 3 | | | Fair
Value at
06/30/2016 | |
Financial Derivative Instruments - Liabilities | |
Over the counter | | $ | 0 | | | $ | (1,285 | ) | | $ | 0 | | | $ | (1,285 | ) |
| | | | | | | | | | | | | | | | |
| | | | |
Totals | | $ | 50,805 | | | $ | 204,518 | | | $ | 0 | | | $ | 255,323 | |
| | | | | | | | | | | | | | | | |
There were no significant transfers between Levels 1, 2, or 3 during the period ended June 30, 2016.
| | | | | | |
| See Accompanying Notes | | SEMIANNUAL REPORT | | JUNE 30, 2016 | | 21 |
Notes to Financial Statements
1. ORGANIZATION
PIMCO Equity Series VIT® (the “Trust”) was established as a Delaware statutory trust on December 28, 2009. The Trust is registered under the Investment Company Act of 1940, as amended (the “Act”), as an open-end management investment company. The Trust is designed to be used as an investment vehicle by separate accounts of insurance companies that fund variable annuity contracts and variable life insurance policies and by qualified pension and retirement plans. Information presented in these financial statements pertains to the Institutional Class and Advisor Class shares of the PIMCO StocksPLUS® Global Portfolio (formerly PIMCO Global Dividend Portfolio) (the “Portfolio”) offered by the Trust. Pacific Investment Management Company LLC (“PIMCO”) serves as the investment adviser (the “Adviser”) for the Portfolio.
2. SIGNIFICANT ACCOUNTING POLICIES
The following is a summary of significant accounting policies consistently followed by the Portfolio in the preparation of its financial statements in conformity with accounting principles generally accepted in the United States of America (“U.S. GAAP”). The Portfolio is treated as an investment company under the reporting requirements of U.S. GAAP. The preparation of financial statements in accordance with U.S. GAAP requires management to make estimates and assumptions that affect the reported amounts of assets and liabilities and disclosure of contingent assets and liabilities at the date of the financial statements and the reported amounts of increases and decreases in net assets from operations during the reporting period. Actual results could differ from those estimates.
Prior to May 27, 2015, the Portfolio sought to gain exposure to the commodity markets, in whole or in part, through investments in PIMCO Cayman Commodity Portfolio III, Ltd. (the Subsidiary), a wholly-owned subsidiary of the Portfolio organized under the laws of the Cayman Islands with the same objective and investment policies and restrictions as the Portfolio. As of the close of business on May 26, 2015, the Portfolio fully redeemed its investment in the Subsidiary. Net assets of the Subsidiary at such date, consisting primarily of cash and securities, were transferred to the Portfolio with no gain or loss for financial reporting purposes. As of December 31, 2015, the Subsidiary had been dissolved with the Cayman Islands authorities. The previous year’s Financial Highlights and Statement of Changes in Net Assets include the accounts of the Subsidiary through May 26, 2015. Intercompany balances and transactions were eliminated in consolidation.
(a) Securities Transactions and Investment Income Securities transactions are recorded as of the trade date for financial reporting purposes. Securities purchased or sold on a when-issued or delayed-delivery basis may be settled 15 days or more after the trade date. Realized gains (losses) from securities sold are recorded on the identified
cost basis. Dividend income is recorded on the ex-dividend date, except certain dividends from foreign securities where the ex-dividend date may have passed, which are recorded as soon as the Portfolio is informed of the ex-dividend date. Interest income, adjusted for the accretion of discounts and amortization of premiums, is recorded on the accrual basis from settlement date, with the exception of securities with a forward starting effective date, where interest income is recorded on the accrual basis from effective date. For convertible securities, premiums attributable to the conversion feature are not amortized. Estimated tax liabilities on certain foreign securities are recorded on an accrual basis and are reflected as components of interest income or net change in unrealized appreciation (depreciation) on investments on the Statement of Operations, as appropriate. Tax liabilities realized as a result of such security sales are reflected as a component of net realized gain (loss) on investments on the Statement of Operations. Paydown gains (losses) on mortgage related and other asset-backed securities are recorded as components of interest income on the Statement of Operations. Income or short-term capital gain distributions received from registered investment companies are recorded as dividend income. Long-term capital gain distributions received from registered investment companies are recorded as realized gains.
Distributions received from investments such as real estate investment trust securities, may include a return of capital invested. Such distributions reduce the cost basis of the respective securities. Return of capital distributions, if any, in excess of the cost basis of the security are recognized as capital gain.
(b) Cash and Foreign Currency The functional and reporting currency for the Portfolio is the U.S. dollar. The market values of foreign securities, currency holdings and other assets and liabilities denominated in foreign currencies are translated into U.S. dollars based on the current exchange rates each business day. Purchases and sales of securities and income and expense items denominated in foreign currencies, if any, are translated into U.S. dollars at the exchange rate in effect on the transaction date. The Portfolio does not separately report the effects of changes in foreign exchange rates from changes in market prices on securities held. Such changes are included in net realized gain (loss) and net change in unrealized appreciation (depreciation) from investments on the Statement of Operations. The Portfolio may invest in foreign currency-denominated securities and may engage in foreign currency transactions either on a spot (cash) basis at the rate prevailing in the currency exchange market at the time or through a forward foreign currency contract (see Financial Derivative Instruments, if any). Realized foreign exchange gains (losses) arising from sales of spot foreign currencies, currency gains (losses) realized between the trade and settlement dates on securities transactions and the difference between the recorded amounts of dividends, interest, and foreign withholding
| | | | | | | | |
| 22 | | PIMCO EQUITY SERIES VIT | | | | | | |
June 30, 2016 (Unaudited)
taxes and the U.S. dollar equivalent of the amounts actually received or paid are included in net realized gain (loss) on foreign currency transactions on the Statement of Operations. Net unrealized foreign exchange gains (losses) arising from changes in foreign exchange rates on foreign denominated assets and liabilities other than investments in securities held at the end of the reporting period are included in net change in unrealized appreciation (depreciation) on foreign currency assets and liabilities on the Statement of Operations.
(c) Multiclass Operations Each class offered by the Trust has equal rights as to assets and voting privileges (except that shareholders of a class have exclusive voting rights regarding any matter relating solely to that class of shares). Income and non-class specific expenses are allocated daily to each class on the basis of the relative net assets. Realized and unrealized capital gains (losses) are allocated daily based on the relative net assets of each class of the Portfolio. Class specific expenses, where applicable, currently include supervisory and administrative and distribution and servicing fees. Under certain circumstances, the per share net asset value (“NAV”) of a class of the Portfolio’s shares may be different from the per share NAV of another class of shares as a result of the different daily expense accruals applicable to each class of shares.
(d) Dividends and Distributions to Shareholders Dividends from net investment income, if any, are declared and distributed to shareholders quarterly. Net realized capital gains earned by the Portfolio, if any, will be distributed no less frequently than once each year.
Income dividends and capital gain distributions are determined in accordance with income tax regulations which may differ from U.S. GAAP. Differences between tax regulations and U.S. GAAP may cause timing differences between income and capital gain recognition. Examples of events that give rise to timing differences include wash sales, straddles and capital loss carryforwards. Further, the character of investment income and capital gains may be different for certain transactions under the two methods of accounting. Examples of transactions that may cause character differences include the treatment of paydowns on mortgage-backed securities, swaps, foreign currency transactions and contingent debt instruments. As a result, income dividends and capital gain distributions declared during a fiscal period may differ significantly from the net investment income (loss) and realized gains (losses) reported on the Portfolio’s annual financial statements presented under U.S. GAAP.
Distributions classified as a tax basis return of capital, if any, are reflected on the Statements of Changes in Net Assets and have been recorded to paid in capital. In addition, other amounts have been reclassified between undistributed (overdistributed) net investment income (loss), accumulated undistributed (overdistributed) net realized
gain (loss) and/or paid in capital to more appropriately conform financial accounting to tax characterizations of dividend distributions.
(e) New Accounting Pronouncements In August 2014, the Financial Accounting Standards Board (“FASB”) issued an Accounting Standards Update (“ASU”), ASU 2014-15 requiring management to evaluate whether there are conditions or events, considered in the aggregate, that raise substantial doubt about the entity’s ability to continue as a going concern. The ASU is effective prospectively for annual periods ending after December 15, 2016, and interim periods thereafter. At this time, management is evaluating the implications of these changes on the financial statements.
In May 2015, the FASB issued ASU 2015-07 which removes the requirement to categorize within the fair value hierarchy all investments for which fair value is measured using the NAV per share practical expedient. The ASU also removes the requirement to make certain disclosures for all investments that are eligible to be measured at fair value using the NAV per share practical expedient. The ASU is effective for annual periods beginning after December 15, 2015 and interim periods within those annual periods. The ASU did not have an impact on the Portfolio’s financial statements.
3. INVESTMENT VALUATION AND FAIR VALUE MEASUREMENTS
(a) Investment Valuation Policies The price of the Portfolio’s shares is based on the Portfolio’s NAV. The NAV of the Portfolio, or each of its share classes, as applicable, is determined by dividing the total value of portfolio investments and other assets attributable to the Portfolio or class, less any liabilities, by the total number of shares outstanding of the Portfolio or class.
On each day that the New York Stock Exchange (“NYSE”) is open, Portfolio shares are ordinarily valued as of the close of regular trading (“NYSE Close”). Information that becomes known to the Portfolio or its agents after the time as of which NAV has been calculated on a particular day will not generally be used to retroactively adjust the price of a security or the NAV determined earlier that day. The Portfolio reserves the right to change the time its NAV is calculated if the Portfolio closes earlier, or as permitted by the SEC.
For purposes of calculating NAV, portfolio securities and other assets for which market quotes are readily available are valued at market value. Market value is generally determined on the basis of official closing prices or the last reported sales prices, or if no sales are reported, based on quotes obtained from established market makers or prices (including evaluated prices) supplied by the Portfolio’s approved pricing services, quotation reporting systems and other third-party sources (together, “Pricing Services”). The Portfolio will normally use
| | | | | | |
| | SEMIANNUAL REPORT | | JUNE 30, 2016 | | 23 |
Notes to Financial Statements (Cont.)
pricing data for domestic equity securities received shortly after the NYSE Close and does not normally take into account trading, clearances or settlements that take place after the NYSE Close. A foreign (non-U.S.) equity security traded on a foreign exchange or on more than one exchange is typically valued using pricing information from the exchange considered by the Adviser to be the primary exchange. A foreign (non-U.S.) equity security will be valued as of the close of trading on the foreign exchange, or the NYSE Close, if the NYSE Close occurs before the end of trading on the foreign exchange. Domestic and foreign (non-U.S.) fixed income securities, non-exchange traded derivatives, and equity options are normally valued on the basis of quotes obtained from brokers and dealers or Pricing Services using data reflecting the earlier closing of the principal markets for those securities. Prices obtained from Pricing Services may be based on, among other things, information provided by market makers or estimates of market values obtained from yield data relating to investments or securities with similar characteristics. Certain fixed income securities purchased on a delayed-delivery basis are marked to market daily until settlement at the forward settlement date. Exchange-traded options, except equity options, futures and options on futures are valued at the settlement price determined by the relevant exchange. Swap agreements are valued on the basis of bid quotes obtained from brokers and dealers or market-based prices supplied by Pricing Services or other pricing sources. With respect to any portion of the Portfolio’s assets that are invested in one or more open-end management investment companies (other than exchange-traded funds (“ETFs”)), the Portfolio’s NAV will be calculated based upon the NAVs of such investments.
If a foreign (non-U.S.) equity security’s value has materially changed after the close of the security’s primary exchange or principal market but before the NYSE Close, the security may be valued at fair value based on procedures established and approved by the Board of Trustees of the Trust (the “Board”). Foreign (non-U.S.) equity securities that do not trade when the NYSE is open are also valued at fair value. With respect to foreign (non-U.S.) equity securities, the Portfolio may determine the fair value of investments based on information provided by Pricing Services and other third-party vendors, which may recommend fair value or adjustments with reference to other securities, indices or assets. In considering whether fair valuation is required and in determining fair values, the Portfolio may, among other things, consider significant events (which may be considered to include changes in the value of U.S. securities or securities indices) that occur after the close of the relevant market and before the NYSE Close. The Portfolio may utilize modeling tools provided by third-party vendors to determine fair values of non-U.S. securities. Foreign (non-U.S.) exchanges may permit trading in foreign (non-U.S.) equity securities on days when the Trust is not open for business, which may result in the
Portfolio’s portfolio investments being affected when shareholders are unable to buy or sell shares.
Senior secured floating rate loans for which an active secondary market exists to a reliable degree will be valued at the mean of the last available bid/ask prices in the market for such loans, as provided by a Pricing Service. Senior secured floating rate loans for which an active secondary market does not exist to a reliable degree will be valued at fair value, which is intended to approximate market value. In valuing a senior secured floating rate loan at fair value, the factors considered may include, but are not limited to, the following: (a) the creditworthiness of the borrower and any intermediate participants, (b) the terms of the loan, (c) recent prices in the market for similar loans, if any, and (d) recent prices in the market for instruments of similar quality, rate, period until next interest rate reset and maturity.
Investments valued in currencies other than the U.S. dollar are converted to the U.S. dollar using exchange rates obtained from Pricing Services. As a result, the value of such investments and, in turn, the NAV of the Portfolio’s shares may be affected by changes in the value of currencies in relation to the U.S. dollar. The value of investments traded in markets outside the United States or denominated in currencies other than the U.S. dollar may be affected significantly on a day that the Trust is not open for business. As a result, to the extent that the Portfolio holds foreign (non-U.S.) investments, the value of those investments may change at times when shareholders are unable to buy or sell shares and the value of such investments will be reflected in the Portfolio’s next calculated NAV.
Investments for which market quotes or market based valuations are not readily available are valued at fair value as determined in good faith by the Board or persons acting at their direction. The Board has adopted methods for valuing securities and other assets in circumstances where market quotes are not readily available, and has delegated to the Adviser the responsibility for applying the fair valuation methods. In the event that market quotes or market based valuations are not readily available, and the security or asset cannot be valued pursuant to a Board approved valuation method, the value of the security or asset will be determined in good faith by the Valuation Oversight Committee of the Board (“Valuation Oversight Committee”), generally based on recommendations provided by the Adviser. Market quotes are considered not readily available in circumstances where there is an absence of current or reliable market-based data (e.g., trade information, bid/ask information, indicative market quotations (“Broker Quotes”), Pricing Services’ prices), including where events occur after the close of the relevant market, but prior to the NYSE Close, that materially affect the values of the Portfolio’s securities or assets. In addition, market quotes are considered not readily available when, due to extraordinary circumstances, the exchanges or markets on which the
| | | | | | | | |
| 24 | | PIMCO EQUITY SERIES VIT | | | | | | |
June 30, 2016 (Unaudited)
securities trade do not open for trading for the entire day and no other market prices are available. The Board has delegated to the Adviser the responsibility for monitoring significant events that may materially affect the values of the Portfolio’s securities or assets and for determining whether the value of the applicable securities or assets should be reevaluated in light of such significant events.
When a Portfolio uses fair valuation to determine the value of a portfolio security or other asset for purposes of calculating its NAV, such investments will not be priced on the basis of quotes from the primary market in which they are traded, but rather may be priced by another method that the Board or persons acting at their direction believe reflects fair value. Fair valuation may require subjective determinations about the value of a security. While the Trust’s policy is intended to result in a calculation of the Portfolio’s NAV that fairly reflects security values as of the time of pricing, the Trust cannot ensure that fair values determined by the Board or persons acting at their direction would accurately reflect the price that a Portfolio could obtain for a security if it were to dispose of that security as of the time of pricing (for instance, in a forced or distressed sale). The prices used by a Portfolio may differ from the value that would be realized if the securities were sold. The Portfolio’s use of fair valuation may also help to deter “stale price arbitrage” as discussed under the “Frequent or Excessive Purchases, Exchanges and Redemptions” section in the Portfolio’s prospectus.
(b) Fair Value Hierarchy U.S. GAAP describes fair value as the price that the Portfolio would receive to sell an asset or pay to transfer a liability in an orderly transaction between market participants at the measurement date. It establishes a fair value hierarchy that prioritizes inputs to valuation methods and requires disclosure of the fair value hierarchy, separately for each major category of assets and liabilities, that segregates fair value measurements into levels (Level 1, 2, or 3). The inputs or methodology used for valuing securities are not necessarily an indication of the risks associated with investing in those securities. Levels 1, 2, and 3 of the fair value hierarchy are defined as follows:
| n | | Level 1 — Inputs using (unadjusted) quoted prices in active markets or exchanges for identical assets and liabilities. |
| n | | Level 2 — Significant other observable inputs, which may include, but are not limited to, quoted prices for similar assets or liabilities in markets that are active, quoted prices for identical or similar assets or liabilities in markets that are not active, inputs other than quoted prices that are observable for the assets or liabilities (such as interest rates, yield curves, volatilities, prepayment speeds, loss severities, credit risks and default rates) or other market corroborated inputs. |
| n | | Level 3 — Significant unobservable inputs based on the best information available in the circumstances, to the extent observable |
| | | inputs are not available, which may include assumptions made by the Board or persons acting at their direction that are used in determining the fair value of investments. |
In accordance with the requirements of U.S. GAAP, the amounts of transfers between Levels 1 and 2 and transfers into and out of Level 3, if material, are disclosed in the Notes to Schedule of Investments for the Portfolio.
For fair valuations using significant unobservable inputs, U.S. GAAP requires a reconciliation of the beginning to ending balances for reported fair values that presents changes attributable to realized gain (loss), unrealized appreciation (depreciation), purchases and sales, accrued discounts (premiums), and transfers into and out of the Level 3 category during the period. The end of period timing recognition is used for the transfers between Levels of the Portfolio’s assets and liabilities. Additionally, U.S. GAAP requires quantitative information regarding the significant unobservable inputs used in the determination of fair value of assets or liabilities categorized as Level 3 in the fair value hierarchy. In accordance with the requirements of U.S. GAAP, a fair value hierarchy, and if material, a Level 3 reconciliation and details of significant unobservable inputs, have been included in the Notes to Schedule of Investments for the Portfolio.
(c) Valuation Techniques and the Fair Value Hierarchy Level 1 and Level 2 trading assets and trading liabilities, at fair value The valuation methods (or “techniques”) and significant inputs used in determining the fair values of portfolio securities or other assets and liabilities categorized as Level 1 and Level 2 of the fair value hierarchy are as follows:
Fixed income securities including corporate, convertible and municipal bonds and notes, U.S. government agencies, U.S. treasury obligations, sovereign issues, bank loans, convertible preferred securities and non-U.S. bonds are normally valued on the basis of quotes obtained from brokers and dealers or Pricing Services that use broker-dealer quotations, reported trades or valuation estimates from their internal pricing models. The Pricing Services’ internal models use inputs that are observable such as issuer details, interest rates, yield curves, prepayment speeds, credit risks/spreads, default rates and quoted prices for similar assets. Securities that use similar valuation techniques and inputs as described above are categorized as Level 2 of the fair value hierarchy.
Mortgage-related and asset-backed securities are usually issued as separate tranches, or classes, of securities within each deal. These securities are also normally valued by Pricing Services that use broker-dealer quotations, reported trades or valuation estimates from their internal pricing models. The pricing models for these securities usually consider tranche-level attributes, current market data, estimated cash
| | | | | | |
| | SEMIANNUAL REPORT | | JUNE 30, 2016 | | 25 |
Notes to Financial Statements (Cont.)
flows and market-based yield spreads for each tranche, and incorporate deal collateral performance, as available. Mortgage-related and asset-backed securities that use similar valuation techniques and inputs as described above are categorized as Level 2 of the fair value hierarchy.
Common stocks, ETFs, exchange-traded notes and financial derivative instruments, such as futures contracts, rights and warrants, or options on futures that are traded on a national securities exchange, are stated at the last reported sale or settlement price on the day of valuation. To the extent these securities are actively traded and valuation adjustments are not applied, they are categorized as Level 1 of the fair value hierarchy.
Valuation adjustments may be applied to certain securities that are solely traded on a foreign exchange to account for the market movement between the close of the foreign market and the NYSE Close. These securities are valued using Pricing Services that consider the correlation of the trading patterns of the foreign security to the intraday trading in the U.S. markets for investments. Securities using these valuation adjustments are categorized as Level 2 of the fair value hierarchy. Preferred securities and other equities traded on inactive markets or valued by reference to similar instruments are also categorized as Level 2 of the fair value hierarchy.
Investments in registered open-end investment companies (other than ETFs) will be valued based upon the NAVs of such investments and are categorized as Level 1 of the fair value hierarchy. Investments in unregistered open-end investment companies will be calculated based upon the NAVs of such investments and are considered Level 1 provided that the NAVs are observable, calculated daily and are the value at which both purchases and sales will be conducted. Investments in privately held investment funds with significant restrictions on redemption where the inputs to the NAVs are observable will be valued based upon the NAVs of such investments and are categorized as Level 2 of the fair value hierarchy.
Short-term debt instruments (such as commercial paper) having a remaining maturity of 60 days or less may be valued at amortized cost, so long as the amortized cost of such short-term debt instrument is approximately the same as the fair value of the instrument as determined without the use of amortized cost valuation. Prior to July 31, 2015, short-term debt investments having a maturity of 60 days or less and repurchase agreements were generally valued at
amortized cost which approximates fair value. Short-term debt instruments having a remaining maturity of 60 days or less are categorized as Level 2 of the fair value hierarchy.
Equity exchange-traded options and over the counter financial derivative instruments, such as foreign currency contracts, options contracts, or swap agreements, derive their value from underlying asset prices, indices, reference rates, and other inputs or a combination of these factors. Other than swap agreements, which are valued using a broker-dealer bid quotation or on market-based prices provided by Pricing Services or other pricing sources, these contracts are normally valued on the basis of quotes obtained from a quotation reporting system, established market makers or Pricing Services (normally determined as of the NYSE Close). Depending on the product and the terms of the transaction, financial derivative instruments can be valued by Pricing Services using a series of techniques, including simulation pricing models. The pricing models use inputs that are observed from actively quoted markets such as quoted prices, issuer details, indices, bid/ask spreads, interest rates, implied volatilities, yield curves, dividends and exchange rates. Financial derivative instruments that use similar valuation techniques and inputs as described above are categorized as Level 2 of the fair value hierarchy.
The validity of the fair value is reviewed by the Adviser on a periodic basis and may be amended in accordance with the Trust’s valuation procedures.
4. SECURITIES AND OTHER INVESTMENTS
(a) Investments in Affiliates
The Portfolio may invest in the PIMCO Short-Term Floating NAV Portfolio III (“Central Fund”) to the extent permitted by the Act and rules thereunder. The Central Fund is a registered investment company created for use solely by the series of the Trust and other series of registered investment companies advised by the Adviser, in connection with their cash management activities. The main investments of the Central Fund are money market and short maturity fixed income instruments. The Central Fund may incur expenses related to its investment activities, but does not pay Investment Advisory Fees or Supervisory and Administrative Fees to the Adviser. The Central Fund is considered to be affiliated with the Portfolio. The table below shows the Portfolio’s transactions in and earnings from investments in the affiliated Fund for the period ended June 30, 2016 (amounts in thousands†):
Investments in PIMCO Short-Term Floating NAV Portfolio III
| | | | | | | | | | | | | | | | | | | | | | | | | | | | | | |
Market Value
12/31/2015 | | | Purchases
at Cost | | | Proceeds
from Sales | | | Net
Realized
Gain (Loss) | | | Change in
Unrealized
Appreciation
(Depreciation) | | | Market Value
06/30/2016 | | | Dividend
Income (1) | | | Realized Net
Capital Gain
Distributions (1) | |
| $ | 5,659 | | | $ | 127,325 | | | $ | (89,420 | ) | | $ | 7 | | | $ | 4 | | | $ | 43,575 | | | $ | 26 | | | $ | 0 | |
| † | A zero balance may reflect actual amounts rounding to less than one thousand. |
| (1) | The tax characterization of distributions is determined in accordance with Federal income tax regulations. The actual tax characterization of distributions paid are determined at the end of the fiscal year. See Note 2(d) in the Notes to Financial Statements for more information. |
| | | | | | | | |
| 26 | | PIMCO EQUITY SERIES VIT | | | | | | |
June 30, 2016 (Unaudited)
(b) Investments in Securities
Mortgage-Related and Other Asset-Backed Securities The Portfolio may invest in mortgage-related and other asset-backed securities that directly or indirectly represent a participation in, or are secured by and payable from, loans on real property. Mortgage-related securities are created from pools of residential or commercial mortgage loans, including mortgage loans made by savings and loan institutions, mortgage bankers, commercial banks and others. These securities provide a monthly payment which consists of both interest and principal. Interest may be determined by fixed or adjustable rates. The rate of prepayments on underlying mortgages will affect the price and volatility of a mortgage-related security, and may have the effect of shortening or extending the effective duration of the security relative to what was anticipated at the time of purchase. The timely payment of principal and interest of certain mortgage-related securities is guaranteed with the full faith and credit of the U.S. Government. Pools created and guaranteed by non-governmental issuers, including government-sponsored corporations, may be supported by various forms of insurance or guarantees, but there can be no assurance that private insurers or guarantors can meet their obligations under the insurance policies or guarantee arrangements. Many of the risks of investing in mortgage-related securities secured by commercial mortgage loans reflect the effects of local and other economic conditions on real estate markets, the ability of tenants to make lease payments, and the ability of a property to attract and retain tenants. These securities may be less liquid and may exhibit greater price volatility than other types of mortgage-related or other asset-backed securities. Other asset-backed securities are created from many types of assets, including auto loans, credit card receivables, home equity loans, and student loans.
Collateralized Debt Obligations (“CDOs”) include Collateralized Bond Obligations (“CBOs”), Collateralized Loan Obligations (“CLOs”) and other similarly structured securities. CBOs and CLOs are types of asset-backed securities. A CBO is a trust which is backed by a diversified pool of high risk, below investment grade fixed income securities. A CLO is a trust typically collateralized by a pool of loans, which may include, among others, domestic and foreign senior secured loans, senior unsecured loans, and subordinate corporate loans, including loans that may be rated below investment grade or equivalent unrated loans. The risks of an investment in a CDO depend largely on the type of the collateral securities and the class of the CDO in which the Portfolio invests. In addition to the normal risks associated with fixed income securities discussed elsewhere in this report and the Portfolio’s prospectus and statement of additional information (e.g., prepayment risk, credit risk, liquidity risk, market risk, structural risk, legal risk and interest rate risk (which may be exacerbated if the interest rate payable on a structured financing changes based on multiples of changes in
interest rates or inversely to changes in interest rates)), CBOs, CLOs and other CDOs carry additional risks including, but not limited to, (i) the possibility that distributions from collateral securities will not be adequate to make interest or other payments, (ii) the quality of the collateral may decline in value or default, (iii) the Portfolio may invest in CBOs, CLOs, or other CDOs that are subordinate to other classes, and (iv) the complex structure of the security may not be fully understood at the time of investment and may produce disputes with the issuer or unexpected investment results.
Collateralized Mortgage Obligations (“CMOs”) are debt obligations of a legal entity that are collateralized by whole mortgage loans or private mortgage bonds and divided into classes. CMOs are structured into multiple classes, often referred to as “tranches,” with each class bearing a different stated maturity and entitled to a different schedule for payments of principal and interest, including prepayments. CMOs may be less liquid and may exhibit greater price volatility than other types of mortgage-related or asset-backed securities.
U.S. Government Agencies or Government-Sponsored Enterprises The Portfolio may invest in securities of U.S. Government agencies or government-sponsored enterprises. U.S. Government securities are obligations of and, in certain cases, guaranteed by, the U.S. Government, its agencies or instrumentalities. Some U.S. Government securities, such as Treasury bills, notes and bonds, and securities guaranteed by the Government National Mortgage Association (“GNMA” or “Ginnie Mae”), are supported by the full faith and credit of the U.S. Government; others, such as those of the Federal Home Loan Banks, are supported by the right of the issuer to borrow from the U.S. Department of the Treasury (the “U.S. Treasury”); and others, such as those of the Federal National Mortgage Association (“FNMA” or “Fannie Mae”), are supported by the discretionary authority of the U.S. Government to purchase the agency’s obligations. U.S. Government securities may include zero coupon securities. Zero coupon securities do not distribute interest on a current basis and tend to be subject to a greater risk than interest-paying securities.
Government-related guarantors (i.e., not backed by the full faith and credit of the U.S. Government) include FNMA and the Federal Home Loan Mortgage Corporation (“FHLMC” or “Freddie Mac”). FNMA is a government-sponsored corporation. FNMA purchases conventional (i.e., not insured or guaranteed by any government agency) residential mortgages from a list of approved seller/servicers which include state and federally chartered savings and loan associations, mutual savings banks, commercial banks and credit unions and mortgage bankers. Pass-through securities issued by FNMA are guaranteed as to timely payment of principal and interest by FNMA, but are not backed by the full faith and credit of the U.S. Government. FHLMC issues Participation Certificates (“PCs”), which are pass-through securities, each representing
| | | | | | |
| | SEMIANNUAL REPORT | | JUNE 30, 2016 | | 27 |
Notes to Financial Statements (Cont.)
an undivided interest in a pool of residential mortgages. FHLMC guarantees the timely payment of interest and ultimate collection of principal, but PCs are not backed by the full faith and credit of the U.S. Government.
When-Issued Transactions The Portfolio may purchase or sell securities on a when-issued basis. These transactions are made conditionally because a security, although authorized, has not yet been issued in the market. Transactions to purchase or sell securities on a when-issued basis involve a commitment by the Portfolio to purchase or sell these securities for a predetermined price or yield, with payment and delivery taking place beyond the customary settlement period. The Portfolio may sell when-issued securities before they are delivered, which may result in a realized gain (loss).
5. BORROWINGS AND OTHER FINANCING TRANSACTIONS
The following disclosures contain information on the Portfolio’s ability to lend or borrow cash or securities to the extent permitted under the Act, which may be viewed as borrowing or financing transactions by the Portfolio. The location of these instruments in the Portfolio’s financial statements is described below. For a detailed description of credit and counterparty risks that can be associated with borrowings and other financing transactions, please see Note 7, Principal Risks.
(a) Repurchase Agreements The Portfolio may engage in repurchase agreements. Under the terms of a typical repurchase agreement, the Portfolio purchases an underlying debt obligation (collateral) subject to an obligation of the seller to repurchase, and the Portfolio to resell, the obligation at an agreed-upon price and time. The underlying securities for all repurchase agreements are held by the Portfolio’s custodian or designated subcustodians under tri-party repurchase agreements. The market value of the collateral must be equal to or exceed the total amount of the repurchase obligations, including interest. Repurchase agreements, if any, including accrued interest, are included on the Statement of Assets and Liabilities. Interest earned is recorded as a component of interest income on the Statement of Operations. In periods of increased demand for collateral, the Portfolio may pay a fee for the receipt of collateral, which may result in interest expense to the Portfolio.
6. FINANCIAL DERIVATIVE INSTRUMENTS
The following disclosures contain information on how and why the Portfolio uses financial derivative instruments, and how financial derivative instruments affect the Portfolio’s financial position, results of operations and cash flows. The location and fair value amounts of these instruments on the Statement of Assets and Liabilities and the net realized gain (loss) and net change in unrealized appreciation (depreciation) on the Statement of Operations, each categorized by type of financial derivative contract and related risk exposure, are included in
a table in the Notes to Schedule of Investments. The financial derivative instruments outstanding as of period end and the amounts of net realized gain (loss) and net change in unrealized appreciation (depreciation) on financial derivative instruments during the period, as disclosed in the Notes to Schedule of Investments, serve as indicators of the volume of financial derivative activity for the Portfolio.
(a) Forward Foreign Currency Contracts The Portfolio may enter into forward foreign currency contracts in connection with settling planned purchases or sales of securities, to hedge the currency exposure associated with some or all of the Portfolio’s securities or as a part of an investment strategy. A forward foreign currency contract is an agreement between two parties to buy and sell a currency at a set price on a future date. The market value of a forward foreign currency contract fluctuates with changes in foreign currency exchange rates. Forward foreign currency contracts are marked to market daily, and the change in value is recorded by the Portfolio as an unrealized gain (loss). Realized gains (losses) are equal to the difference between the value of the contract at the time it was opened and the value at the time it was closed and are recorded upon delivery or receipt of the currency. These contracts may involve market risk in excess of the unrealized gain (loss) reflected on the Statement of Assets and Liabilities. In addition, the Portfolio could be exposed to risk if the counterparties are unable to meet the terms of the contracts or if the value of the currency changes unfavorably to the U.S. dollar. To mitigate such risk, cash or securities may be exchanged as collateral pursuant to the terms of the underlying contracts.
(b) Futures Contracts The Portfolio may enter into futures contracts. The Portfolio may use futures contracts to manage its exposure to the securities markets or to movements in interest rates and currency values. The primary risks associated with the use of futures contracts are the imperfect correlation between the change in market value of the securities held by the Portfolio and the prices of futures contracts and the possibility of an illiquid market. Futures contracts are valued based upon their quoted daily settlement prices. Upon entering into a futures contract, the Portfolio is required to deposit with its futures broker an amount of cash, U.S. Government and Agency Obligations, or select sovereign debt, in accordance with the initial margin requirements of the broker or exchange. Futures contracts are marked to market daily and based on such movements in the price of the contracts, an appropriate payable or receivable for the change in value may be posted or collected by the Portfolio (“Futures Variation Margin”). Gains (losses) are recognized but not considered realized until the contracts expire or close. Futures contracts involve, to varying degrees, risk of loss in excess of the Futures Variation Margin included within exchange traded or centrally cleared financial derivative instruments on the Statement of Assets and Liabilities.
| | | | | | | | |
| 28 | | PIMCO EQUITY SERIES VIT | | | | | | |
June 30, 2016 (Unaudited)
7. PRINCIPAL RISKS
In the normal course of business, the Portfolio trades financial instruments and enters into financial transactions where risk of potential loss exists due to such things as changes in the market (market risk) or failure or inability of the other party to a transaction to perform (credit and counterparty risk). See below for a detailed description of select principal risks. For a more comprehensive list of potential risks the Portfolio may be subject to, please see the Important Information About the Portfolio.
Market Risks The Portfolio’s investments in financial derivative instruments and other financial instruments expose the Portfolio to various risks such as, but not limited to, interest rate, foreign (non-U.S.) currency, equity and commodity risks.
The market values of equities, such as common stocks and preferred securities or equity related investments such as futures and options, have historically risen and fallen in periodic cycles and may decline due to general market conditions which are not specifically related to a particular company, such as real or perceived adverse economic conditions, changes in the general outlook for corporate earnings, changes in interest or currency rates or adverse investor sentiment generally. They may also decline due to factors which affect a particular industry or industries, such as labor shortages or increased production costs and competitive conditions within an industry. Different types of equity securities may react differently to these developments. Equity securities and equity related investments generally have greater market price volatility than fixed income securities.
Issuers that have paid regular dividends or distributions to shareholders may not continue to do so in the future. An issuer may reduce or eliminate future dividends or distributions at any time and for any reason. Moreover, the Portfolio may use a dividend capture strategy (i.e., purchasing an equity security shortly before the issuer pays a dividend and selling it shortly thereafter) which may expose the Portfolio to higher portfolio turnover, increased trading costs and the potential for capital loss or gain, particularly in the event of significant short-term price movements of stocks subject to dividend capture trading. Also, securities purchased to capture a dividend often decline in value at the time of sale (i.e., shortly following the dividend) and the resulting realized loss to the Portfolio may exceed the amount of the dividend received, thereby negatively impacting the Portfolio’s net asset value.
Interest rate risk is the risk that fixed income securities and other instruments held by the Portfolio will decline in value because of an increase in interest rates. As nominal interest rates rise, the value of certain fixed income securities held by the Portfolio is likely to decrease. A nominal interest rate can be described as the sum of a real interest rate and an expected inflation rate. Interest rate changes can be sudden and
unpredictable, and the Portfolio may lose money if these changes are not anticipated by the Portfolio’s management. The Portfolio may not be able to hedge against changes in interest rates or may choose not to do so for cost or other reasons. In addition, any hedges may not work as intended.
Duration is a measure used to determine the sensitivity of a security’s price to changes in interest rates that incorporates a security’s yield, coupon, final maturity and call features, among other characteristics. Convexity is an additional measure of interest rate sensitivity that measures the rate of change of duration in response to changes in interest rates. Fixed income securities with longer durations tend to be more sensitive to changes in interest rates, usually making them more volatile than securities with shorter durations. A wide variety of factors can cause interest rates to rise (e.g., central bank monetary policies, inflation rates, general economic conditions, etc.). At present, the U.S. and many parts of the world, including certain European countries, are experiencing near historically low interest rates. The Portfolio may be subject to heightened interest rate risk because the Fed has ended its quantitative easing program, and has begun, and may continue, to raise interest rates. Further, while bond markets have steadily grown over the past three decades, dealer “market making” ability has not kept pace and in some cases has decreased. Given the importance of intermediary “market making” in creating a robust and active market, fixed income securities are currently facing increased volatility and liquidity risks. All of these factors, collectively and/or individually, could cause the Portfolio to lose value. If the Portfolio lost enough value, the Portfolio could face increased shareholder redemptions, which could force the Fund to liquidate investments at disadvantageous times or prices, thereby adversely affecting the Fund.
If the Portfolio invests directly in foreign (non-U.S.) currencies or in securities that trade in, and receive revenues in, foreign (non-U.S.) currencies, or in financial derivative instruments that provide exposure to foreign (non-U.S.) currencies, it will be subject to the risk that those currencies will decline in value relative to the base currency of the Portfolio, or, in the case of hedging positions, that the Portfolio’s base currency will decline in value relative to the currency being hedged. Currency rates in foreign countries may fluctuate significantly over short periods of time for a number of reasons, including changes in interest rates, intervention (or the failure to intervene) by U.S. or foreign governments, central banks or supranational entities such as the International Monetary Fund, or by the imposition of currency controls or other political developments in the United States or abroad. As a result, the Portfolio’s investments in foreign currency-denominated securities may reduce the Portfolio’s returns.
Credit and Counterparty Risks The Portfolio will be exposed to credit risk to parties with whom it trades and will also bear the risk of settlement default. The Portfolio minimizes concentrations of credit risk
| | | | | | |
| | SEMIANNUAL REPORT | | JUNE 30, 2016 | | 29 |
Notes to Financial Statements (Cont.)
by undertaking transactions with a large number of customers and counterparties on recognized and reputable exchanges, where applicable. Over the counter (“OTC”) derivative transactions are subject to the risk that a counterparty to the transaction will not fulfill its contractual obligations to the other party, as many of the protections afforded to centrally cleared derivative transactions might not be available for OTC derivative transactions. For financial derivative instruments traded on exchanges or clearinghouses, the primary credit risk is the creditworthiness of the Portfolio’s clearing broker or the exchange or clearinghouse itself. The Portfolio could lose money if the issuer or guarantor of a fixed income security, or the counterparty to a financial derivative instruments contract, repurchase agreement or a loan of portfolio securities, is unable or unwilling to make timely principal and/or interest payments, or to otherwise honor its obligations. Securities and financial derivative instruments are subject to varying degrees of credit risk, which may be reflected in credit ratings.
Similar to credit risk, the Portfolio may be exposed to counterparty risk, or the risk that an institution or other entity with which the Portfolio has unsettled or open transactions will default. PIMCO, as the Adviser, minimizes counterparty risks to the Portfolio through a number of ways. Prior to entering into transactions with a new counterparty, the PIMCO Counterparty Risk Committee conducts an extensive credit review of such counterparty and must approve the use of such counterparty. Furthermore, pursuant to the terms of the underlying contract, to the extent that unpaid amounts owed to the Portfolio exceed a predetermined threshold, such counterparty shall advance collateral to the Portfolio in the form of cash or securities equal in value to the unpaid amount owed to the Portfolio. The Portfolio may invest such collateral in securities or other instruments and will typically pay interest to the counterparty on the collateral received. If the unpaid amount owed to the Portfolio subsequently decreases, the Portfolio would be required to return to the counterparty all or a portion of the collateral previously advanced. PIMCO’s attempts to minimize counterparty risk may, however, be unsuccessful.
All transactions in listed securities are settled/paid for upon delivery using approved counterparties. The risk of default is considered minimal, as delivery of securities sold is only made once the Portfolio has received payment. Payment is made on a purchase once the securities have been delivered by the counterparty. The trade will fail if either party fails to meet its obligation.
Master Netting Arrangements The Portfolio may be subject to various netting arrangements (“Master Agreements”) with select counterparties. Master Agreements govern the terms of certain transactions, and reduce the counterparty risk associated with relevant transactions by specifying credit protection mechanisms and providing
standardization that improves legal certainty. Each type of Master Agreement governs certain types of transactions. Different types of transactions may be traded out of different legal entities or affiliates of a particular organization, resulting in the need for multiple agreements with a single counterparty. As the Master Agreements are specific to unique operations of different asset types, they allow the Portfolio to close out and net its total exposure to a counterparty in the event of a default with respect to all the transactions governed under a single Master Agreement with a counterparty. For financial reporting purposes the Statement of Assets and Liabilities generally presents derivative assets and liabilities on a gross basis, which reflects the full risks and exposures prior to netting.
Master Agreements can also help limit counterparty risk by specifying collateral posting arrangements at pre-arranged exposure levels. Under most Master Agreements, collateral is routinely transferred if the total net exposure to certain transactions (net of existing collateral already in place) governed under the relevant Master Agreement with a counterparty in a given account exceeds a specified threshold, which typically ranges from zero to $250,000 depending on the counterparty and the type of Master Agreement. United States Treasury Bills and U.S. dollar cash are generally the preferred forms of collateral, although other forms of AAA rated paper or sovereign securities may be used depending on the terms outlined in the applicable Master Agreement. Securities and cash pledged as collateral are reflected as assets on the Statement of Assets and Liabilities as either a component of Investments at value (securities) or Deposits with counterparty. Cash collateral received is not typically held in a segregated account and as such is reflected as a liability on the Statement of Assets and Liabilities as Deposits from counterparty. The market value of any securities received as collateral is not reflected as a component of NAV. The Portfolio’s overall exposure to counterparty risk can change substantially within a short period, as it is affected by each transaction subject to the relevant Master Agreement.
Master Repurchase Agreements and Global Master Repurchase Agreements (individually and collectively “Master Repo Agreements”) govern repurchase, reverse repurchase, and sale-buyback transactions between the Portfolio and select counterparties. Master Repo Agreements maintain provisions for, among other things, initiation, income payments, events of default, and maintenance of collateral. The market value of transactions under the Master Repo Agreement, collateral pledged or received, and the net exposure by counterparty as of period end are disclosed in the Notes to Schedule of Investments.
Master Securities Forward Transaction Agreements (“Master Forward Agreements”) govern certain forward settling transactions, such as To-Be-Announced securities, delayed-delivery or sale-buyback transactions by and between the Portfolio and select counterparties. The Master
| | | | | | | | |
| 30 | | PIMCO EQUITY SERIES VIT | | | | | | |
June 30, 2016 (Unaudited)
Forward Agreements maintain provisions for, among other things, transaction initiation and confirmation, payment and transfer, events of default, termination, and maintenance of collateral. The market value of forward settling transactions, collateral pledged or received, and the net exposure by counterparty as of period end is disclosed in the Notes to Schedule of Investments.
Customer Account Agreements and related addenda govern cleared derivatives transactions such as futures, options on futures, and cleared OTC derivatives. Such transactions require posting of initial margin as determined by each relevant clearing agency which is segregated in an account at a futures commission merchant (“FCM”) registered with the Commodity Futures Trading Commission (“CFTC”). In the United States, counterparty risk may be reduced as creditors of an FCM cannot have a claim to Portfolio assets in the segregated account. Portability of exposure reduces risk to the Portfolio. Variation margin, or changes in market value, are exchanged daily, but may not be netted between futures and cleared OTC derivatives unless the parties have agreed to a separate arrangement in respect of portfolio margining. The market value or accumulated unrealized appreciation (depreciation), initial margin posted, and any unsettled variation margin as of period end is disclosed in the Notes to Schedule of Investments.
International Swaps and Derivatives Association, Inc. Master Agreements and Credit Support Annexes (“ISDA Master Agreements”) govern bilateral OTC derivative transactions entered into by the Portfolio with select counterparties. ISDA Master Agreements maintain provisions for general obligations, representations, agreements, collateral posting and events of default or termination. Events of termination include conditions that may entitle counterparties to elect to terminate early and cause settlement of all outstanding transactions under the applicable ISDA Master Agreement. Any election to terminate early could be material to the financial statements. In limited circumstances, the ISDA Master Agreement may contain additional provisions that add counterparty protection beyond coverage of existing daily exposure if the counterparty has a decline in credit quality below a predefined level. These amounts, if any, may be segregated with a third-party custodian. The market value of OTC financial derivative instruments, collateral received or pledged, and net exposure by counterparty as of period end are disclosed in the Notes to Schedule of Investments.
8. FEES AND EXPENSES
(a) Investment Advisory Fee PIMCO is a majority-owned subsidiary of Allianz Asset Management of America L.P. (“Allianz Asset Management”) and serves as the Adviser to the Trust, pursuant to an investment advisory contract. The Adviser receives a monthly fee from the Portfolio at an annual rate based on average daily net assets (the “Investment Advisory Fee”). The Investment Advisory Fee for all classes is charged at an annual rate of 0.69%.
(b) Supervisory and Administrative Fee PIMCO serves as administrator (the “Administrator”) and provides supervisory and administrative services to the Trust for which it receives a monthly supervisory and administrative fee based on each share class’s average daily net assets (the “Supervisory and Administrative Fee”). As the Administrator, PIMCO bears the costs of various third-party services, including audit, custodial, portfolio accounting, legal, transfer agency and printing costs.
The Supervisory and Administrative Fee for all classes, as applicable, is charged at the annual rate as noted in the following table:
| | | | | | | | |
| | | | | | Supervisory and Administrative Fee | |
Institutional Class | | | | | | | 0.35% | |
Advisor Class | | | | | | | 0.35% | |
(c) Distribution and Servicing Fees PIMCO Investments LLC (“PI”), a wholly-owned subsidiary of PIMCO, serves as the distributor (“Distributor”) of the Trust’s shares. The Trust has adopted a Distribution and Servicing Plan with respect to the Advisor Class shares of the Portfolio pursuant to Rule 12b-1 under the Act (the “Distribution and Servicing Plan”). The Distribution and Servicing Plan allows the Portfolio to compensate the Distributor for providing or procuring through financial intermediaries distribution, administrative, recordkeeping, shareholder and/or related services with respect to Advisor Class shares. The Distribution and Servicing Plan permits the Portfolio to make total payments at an annual rate of up to 0.25% of its average daily net assets attributable to its Advisor Class shares.
(d) Portfolio Expenses PIMCO provides or procures supervisory and administrative services for shareholders and also bears the costs of various third-party services required by the Portfolio, including audit, custodial, portfolio accounting, legal, transfer agency and printing costs. The Trust is responsible for the following expenses: (i) taxes and governmental fees; (ii) brokerage fees and commissions and other portfolio transaction expenses; (iii) the costs of borrowing money, including interest expense; (iv) fees and expenses of the Trustees who are not “interested persons” of PIMCO or the Trust, and any counsel retained exclusively for their benefit; (v) extraordinary expense, including costs of litigation and indemnification expenses; (vi) organizational expenses; and (vii) any expenses allocated or allocable to a specific class of shares (“class-specific expenses”). The ratio of expenses to average net assets per share class, as disclosed on the Financial Highlights, may differ from the annual portfolio operating expenses per share class.
Each Trustee, other than those affiliated with PIMCO or its affiliates, receives an annual retainer of $10,500, plus $1,875 for each Board meeting attended in person, $250 ($375 in the case of the audit committee chair with respect to audit committee meetings) for each
| | | | | | |
| | SEMIANNUAL REPORT | | JUNE 30, 2016 | | 31 |
Notes to Financial Statements (Cont.)
committee meeting attended and $375 for each Board meeting attended telephonically, plus reimbursement of related expenses. In addition, the audit committee chair receives an additional annual retainer of $2,400, the valuation oversight committee lead receives an additional annual retainer of $1,000 (to the extent there are co-leads of the valuation oversight committee, the annual retainer will be split evenly between the co-leads, so that each co-lead individually receives an additional retainer of $500) and the governance committee chair receives an additional annual retainer of $250.
These expenses are allocated on a pro rata basis to each Portfolio of the Trust according to its respective net assets. The Trust pays no compensation directly to any Trustee or any other officer who is affiliated with the Administrator, all of whom receive remuneration for their services to the Trust from the Administrator or its affiliates.
(e) Expense Limitation PIMCO has contractually agreed, through May 1, 2016, to reduce total annual operating expenses for each of the Portfolio’s separate classes of shares, by reducing the Portfolio’s Supervisory and Administrative fee or reimbursing the Portfolio, to the extent that organizational expenses and pro rata Trustees’ fees attributable to a class of shares of the Portfolio exceed 0.0049% of the Portfolio’s average net assets attributable to separate classes of shares. This Expense Limitation Agreement renews annually for a full year unless terminated by PIMCO upon at least 30 days prior notice to the end of the contract term.
PIMCO has contractually agreed, through May 1, 2017, to reduce its advisory fee by 0.16% of the average daily net assets of the Portfolio. Under the Fee Limitation Agreement, PIMCO is entitled to reimbursement by the Portfolio of any portion of the Supervisory and Administrative Fee and/or Investment Advisory Fee waived, reduced or reimbursed pursuant to the Fee Limitation Agreement (the “Reimbursement Amount”) during the previous three years, provided that such amount paid to PIMCO will not: 1) together with any recoupment of organizational expenses and pro rata Trustees’ fees pursuant to the Expense Limitation Agreement, exceed the Expense Limit; 2) exceed the total Reimbursement Amount; or 3) include any amounts previously reimbursed to PIMCO. This Fee Limitation Agreement renews annually unless terminated by PIMCO upon at least 30 days’ prior notice to the end of the contract term.
PIMCO had also contractually agreed, through September 16, 2013, to reduce total annual operating expenses for the Portfolio’s Institutional Class and Advisor Class shares, by reducing the Portfolio’s Investment Advisory or Supervisory and Administrative Fees or reimbursing the Portfolio to the extent that total annual portfolio operating expenses net of acquired fund fees and expenses, after taking into account other applicable fee waivers and reimbursements exceed 1.00% and 1.25% of the Portfolio’s average net assets attributable to the Institutional
Class and Advisor Class shares, respectively. PIMCO may recoup these waivers and reimbursements for a period not exceeding three years, provided that total expenses, including such recoupment, do not exceed the annual expense limit. As of June 30, 2016, the remaining recoverable amount to PIMCO was $1,940,736.
9. RELATED PARTY TRANSACTIONS
The Adviser, Administrator, and Distributor are related parties. Fees payable to these parties are disclosed in Note 8 and the accrued related party fee amounts are disclosed on the Statement of Assets and Liabilities.
10. GUARANTEES AND INDEMNIFICATIONS
Under the Trust’s organizational documents, each Trustee or officer of the Trust is indemnified and each employee or other agent of the Trust (including the Trust’s investment manager) is indemnified, to the extent permitted by the Act, against certain liabilities that may arise out of performance of their duties to the Portfolio. Additionally, in the normal course of business, the Portfolio enters into contracts that contain a variety of indemnification clauses. The Portfolio’s maximum exposure under these arrangements is unknown as this would involve future claims that may be made against the Portfolio that have not yet occurred. However, the Portfolio has not had prior claims or losses pursuant to these contracts.
11. PURCHASES AND SALES OF SECURITIES
The length of time the Portfolio has held a particular security is not generally a consideration in investment decisions. A change in the securities held by the Portfolio is known as “portfolio turnover.” The Portfolio may engage in frequent and active trading of portfolio securities to achieve its investment objective, particularly during periods of volatile market movements. High portfolio turnover may involve correspondingly greater transaction costs to the Portfolio, including brokerage commissions or dealer mark-ups and other transaction costs on the sale of securities and reinvestments in other securities. Such sales may also result in realization of taxable capital gains, including short-term capital gains (which are generally taxed at ordinary income tax rates). The transaction costs and tax effects associated with portfolio turnover may adversely affect the Portfolio’s performance. The portfolio turnover rates are reported in the Financial Highlights.
Purchases and sales of securities (excluding short-term investments) for the period ended June 30, 2016, were as follows (amounts in thousands†):
| | | | | | | | | | | | | | |
| U S Government/Agency | | | All Other | |
| Purchases | | | Sales | | | Purchases | | | Sales | |
| $ | 515 | | | $ | 0 | | | $ | 100,843 | | | $ | 407,354 | |
| | | | | | | | | | | | | | |
| † | A zero balance may reflect actual amounts rounding to less than one thousand. |
| | | | | | | | |
| 32 | | PIMCO EQUITY SERIES VIT | | | | | | |
June 30, 2016 (Unaudited)
12. SHARES OF BENEFICIAL INTEREST
The Portfolio may issue an unlimited number of shares of beneficial interest with a $0.001 par value. Changes in shares of beneficial interest were as follows (shares and amounts in thousands):
| | | | | | | | | | | | | | | | | | | | |
| | | | | | Six Months Ended
06/30/2016 | | | Year Ended
12/31/2015 | |
| | | | | | Shares | | | Amount | | | Shares | | | Amount | |
| | | | | |
Receipts for shares sold | | | | | | | | | | | | | | | | | | | | |
Institutional Class | | | | | | | 12 | | | $ | 110 | | | | 8 | | | $ | 99 | |
Advisor Class | | | | | | | 386 | | | | 3,483 | | | | 546 | | | | 6,678 | |
Issued as reinvestment of distributions | | | | | | | | | | | | | | | | | | | | |
Institutional Class | | | | | | | 110 | | | | 1,040 | | | | 697 | | | | 6,873 | |
Advisor Class | | | | | | | 734 | | | | 6,874 | | | | 4,936 | | | | 48,246 | |
Cost of shares redeemed | | | | | | | | | | | | | | | | | | | | |
Institutional Class | | | | | | | (271 | ) | | | (2,511 | ) | | | (635 | ) | | | (7,925 | ) |
Advisor Class | | | | | | | (2,879 | ) | | | (26,104 | ) | | | (6,049 | ) | | | (75,405 | ) |
Net increase (decrease) resulting from Portfolio
share transactions | | | | | | | (1,908 | ) | | $ | (17,108 | ) | | | (497 | ) | | $ | (21,434 | ) |
| | | | | | | | | | | | | | | | | | | | |
As of June 30, 2016, one shareholder owned 10% or more of the Portfolio’s total outstanding shares comprising 93% of the Portfolio, and the shareholder is a related party of the Portfolio. Related parties may include, but are not limited to, the investment manager and its affiliates, affiliated broker dealers, fund of funds and directors or employees of the Trust or Adviser.
13. REGULATORY AND LITIGATION MATTERS
The Portfolio is not named as a defendant in any material litigation or arbitration proceedings and is not aware of any material litigation or claim pending or threatened against it.
PIMCO has received a Wells Notice from the staff of the U.S. Securities and Exchange Commission (“SEC”) that relates to the PIMCO Total Return Active Exchange-Traded Fund (“BOND”), a series of PIMCO ETF Trust. The notice indicates the staff’s preliminary determination to recommend that the SEC commence a civil action against PIMCO stemming from a non-public investigation relating to BOND. A Wells Notice is neither a formal allegation of wrongdoing nor a finding that any law was violated.
This matter principally pertains to the valuation of smaller sized positions in non-agency mortgage-backed securities purchased by BOND between its inception on February 29, 2012 and June 30, 2012, BOND’s performance disclosures for that period, and PIMCO’s compliance policies and procedures related to these matters.
The Wells process provides PIMCO with the opportunity to demonstrate to the SEC staff why it believes its conduct was appropriate, in keeping with industry standards, and that no action should be taken. PIMCO believes that this matter is unlikely to have a material adverse effect on any Portfolio or on PIMCO’s ability to provide investment management services to any Portfolio.
The foregoing speaks only as of the date of this report.
14. FEDERAL INCOME TAX MATTERS
The Portfolio intends to qualify as a regulated investment company under Subchapter M of the Internal Revenue Code (the “Code”) and distribute all of its taxable income and net realized gains, if applicable, to shareholders. Accordingly, no provision for Federal income taxes has been made.
The Portfolio may be subject to local withholding taxes, including those imposed on realized capital gains. Any applicable foreign capital gains tax is accrued daily based upon net unrealized gains, and may be payable following the sale of any applicable investments.
In accordance with U.S. GAAP, the Adviser has reviewed the Portfolio’s tax positions for all open tax years. As of June 30, 2016, the Portfolio has recorded no liability for net unrecognized tax benefits relating to uncertain income tax positions it has taken or expects to take in future tax returns.
The Portfolio files U.S. tax returns. While the statute of limitations remains open to examine the Portfolio’s U.S. tax returns filed for the fiscal years ending in 2013-2015, no examinations are in progress or anticipated at this time. The Portfolio is not aware of any tax positions for which it is reasonably possible that the total amounts of unrecognized tax benefits will significantly change in the next twelve months.
Shares of the Portfolio currently are sold to segregated asset accounts (“Separate Accounts”) of insurance companies that fund variable annuity contracts and variable life insurance policies (“Variable Contracts”). Please refer to the prospectus for the Separate Account and Variable Contract for information regarding Federal income tax treatment of distributions to the Separate Account.
| | | | | | |
| | SEMIANNUAL REPORT | | JUNE 30, 2016 | | 33 |
Notes to Financial Statements (Cont.)
June 30, 2016 (Unaudited)
Under the Regulated Investment Company Act of 2010, a fund is permitted to carry forward any new capital losses for an unlimited period. Additionally, such capital losses that are carried forward will retain their character as either short-term or long-term capital losses rather than being considered all short-term under previous law.
As of June 30, 2016, the aggregate cost and the net unrealized appreciation (depreciation) of investments for federal income tax purposes are as follows (amounts in thousands):
| | | | | | | | | | | | | | |
Federal
Tax Cost | | | Aggregate
Gross
Unrealized
Appreciation | | | Aggregate
Gross
Unrealized
(Depreciation) | | | Net
Unrealized
Appreciation
(Depreciation) (1) | |
| $ | 251,792 | | | $ | 181 | | | $ | (544 | ) | | $ | (363 | ) |
| (1) | Primary differences, if any, between book and tax net unrealized appreciation (depreciation) are attributable to wash sale loss deferrals for federal income tax purposes. |
15. SUBSEQUENT EVENTS
In August 2016, the Board approved a change to the PIMCO StocksPLUS® Global Portfolio’s advisory fee from 0.69% to 0.30% (and corresponding termination of the current 0.16% contractual advisory fee waiver) and the supervisory and administrative fee from 0.35% to 0.31%. Such changes will be effective October 21, 2016.
| | | | | | | | |
| 34 | | PIMCO EQUITY SERIES VIT | | | | | | |
Glossary: (abbreviations that may be used in the preceding statements)
(Unaudited)
| | | | | | | | | | |
| | | | |
Counterparty Abbreviations: | | | | | | | | |
| BOA | | Bank of America N.A. | | HUS | | HSBC Bank USA N.A. | | SOG | | Societe Generale |
| BPS | | BNP Paribas S.A. | | JPM | | JPMorgan Chase Bank N.A. | | SSB | | State Street Bank and Trust Co. |
| CBK | | Citibank N.A. | | MSB | | Morgan Stanley Bank N.A. | | UAG | | UBS AG Stamford |
| GLM | | Goldman Sachs Bank USA | | RBC | | Royal Bank of Canada | | | | |
| | | | |
Currency Abbreviations: | | | | | | | | |
| AUD | | Australian Dollar | | EUR | | Euro | | JPY | | Japanese Yen |
| CAD | | Canadian Dollar | | GBP | | British Pound | | USD (or $) | | United States Dollar |
| DKK | | Danish Krone | | HKD | | Hong Kong Dollar | | ZAR | | South African Rand |
| | | | |
Index/Spread Abbreviations: | | | | | | | | |
| EAFE | | Europe, Australasia, and Far East Stock Index | | S&P 500 | | Standard & Poor’s 500 Index | | | | |
| | | | |
Other Abbreviations: | | | | | | | | |
| CLO | | Collateralized Loan Obligation | | MSCI | | Morgan Stanley Capital International | | | | |
| | | | | | |
| | SEMIANNUAL REPORT | | JUNE 30, 2016 | | 35 |
Results of Proxy Voting
(Unaudited)
A special meeting of shareholders of the series of the Trust was held on February 5, 2016. The special meeting was held for the purpose of electing two (2) Trustees to the Board. Shareholders of all series of the Trust voted together on the proposal, and elected two (2) Trustees at the special meeting. The results of the proxy solicitation on this matter are available in the Funds’ Annual Report to shareholders for the fiscal year ended December 31, 2015.
| | | | | | | | |
| 36 | | PIMCO EQUITY SERIES VIT | | | | | | |
General Information
Investment Adviser and Administrator
Pacific Investment Management Company LLC
650 Newport Center Drive
Newport Beach, CA 92660
Distributor
PIMCO Investments LLC
1633 Broadway
New York, NY 10019
Custodian
State Street Bank and Trust Company
801 Pennsylvania Avenue
Kansas City, MO 64105
Transfer Agent
Boston Financial Data Services
330 W. 9th Street, 5th Floor
Kansas City, MO 64105
Legal Counsel
Dechert LLP
1900 K Street, N.W.
Washington, D.C. 20006
Independent Registered Public Accounting Firm
PricewaterhouseCoopers LLP
1100 Walnut Street, Suite 1300
Kansas City, MO 64106
This report is submitted for the general information of the shareholders of the PIMCO Equity Series VIT.
pvit.pimco-funds.com

EVIT01SAR_063016
The information required by this Item 2 is only required in an annual report on this Form N-CSR.
| Item 3. | Audit Committee Financial Expert. |
The information required by this Item 3 is only required in an annual report on this Form N-CSR.
| Item 4. | Principal Accountant Fees and Services. |
The information required by this Item 4 is only required in an annual report on this Form N-CSR.
| Item 5. | Audit Committee of Listed Registrants. |
The information required by this Item 5 is only required in an annual report on this Form N-CSR.
| Item 6. | Schedule of Investments. |
The Schedule of Investments is included as part of the report to shareholders under Item 1.
| Item 7. | Disclosure of Proxy Voting Policies and Procedures for Closed-End Management Investment Companies. |
Not applicable.
| Item 8. | Portfolio Managers of Closed-End Management Investment Companies. |
Not applicable.
| Item 9. | Purchases of Equity Securities by Closed-End Management Investment Company and Affiliated Purchasers. |
Not applicable.
| Item 10. | Submission of Matters to a Vote of Security Holders. |
There have been no material changes to the procedures by which shareholders may recommend nominees to the Trust’s Board of Trustees since the Trust last provided disclosure in response to this item.
| Item 11. | Controls and Procedures. |
| | (a) | The principal executive officer and principal financial & accounting officer have concluded that the Registrant’s disclosure controls and procedures (as defined in Rule 30a-3(c) under the 1940 Act) provide reasonable assurances that material information relating to the Registrant is made known to them by the appropriate persons, based on their evaluation of these controls and procedures as of a date within 90 days of the filing of this report. |
| | (b) | There were no changes in the Registrant’s internal control over financial reporting (as defined in Rule 30a-3(d) under the 1940 Act) that occurred during the second fiscal quarter of the period covered by this report that have materially affected, or are reasonably likely to materially affect, the Registrant’s internal control over financial reporting. |
| | (a)(1) | Exhibit 99.CODE—Code of Ethics is not applicable for semiannual reports. |
| | (a)(2) | Exhibit 99.CERT—Certifications pursuant to Section 302 of the Sarbanes-Oxley Act of 2002. |
| | (b) | Exhibit 99.906CERT—Certifications pursuant to Section 906 of the Sarbanes-Oxley Act of 2002. |
Signatures
Pursuant to the requirements of the Securities Exchange Act of 1934 and the Investment Company Act of 1940, the registrant has duly caused this report to be signed on its behalf by the undersigned, thereunto duly authorized.
| | |
| PIMCO Equity Series VIT |
| |
| By: | | /s/ Peter G. Strelow |
| | |
| | Peter G. Strelow |
| | President (Principal Executive Officer) |
| |
| Date: | | August 26, 2016 |
Pursuant to the requirements of the Securities Exchange Act of 1934 and the Investment Company Act of 1940, this report has been signed below by the following persons on behalf of the registrant and in the capacities and on the dates indicated.
| | |
| By: | | /s/ Peter G. Strelow |
| | |
| | Peter G. Strelow |
| | President (Principal Executive Officer) |
| |
| Date: | | August 26, 2016 |
| |
| By: | | /s/ Trent W. Walker |
| | |
| | Trent W. Walker |
| | Treasurer (Principal Financial & Accounting Officer) |
| |
| Date: | | August 26, 2016 |